SENSATA TECHNOLOGIES HOLDING PLC
10-Ks and 10-Qs
|
|
|
|
|
|
|
|
|
|
|
|
|
|
|
|
|
|
|
|
|
|
|
|
|
|
|
|
|
|
|
|
|
|
|
|
|
|
|
|
|
|
|
|
|
|
|
|
|
|
|
|
|
|
|
|
UNITED STATES
SECURITIES AND EXCHANGE COMMISSION
Washington, D.C. 20549
__________________________________________
FORM 10-K
__________________________________________
|
x
|
ANNUAL REPORT PURSUANT TO SECTION 13 OR 15(d) OF THE SECURITIES EXCHANGE ACT OF 1934
|
For the fiscal year ended
December 31, 2017
OR
|
¨
|
TRANSITION REPORT PURSUANT TO SECTION 13 OR 15(d) OF THE SECURITIES EXCHANGE ACT OF 1934
|
Commission File Number 001-34652
__________________________________________
SENSATA TECHNOLOGIES HOLDING N.V.
(Exact Name of Registrant as Specified in Its Charter)
__________________________________________
|
THE NETHERLANDS
|
|
98-0641254
|
|
(State or other jurisdiction of
incorporation or organization)
|
|
(I.R.S. Employer
Identification No.)
|
|
Jan Tinbergenstraat 80, 7559 SP Hengelo
The Netherlands
|
|
31-74-357-8000
|
|
(Address of Principal Executive Offices, including Zip Code)
|
|
(Registrant’s Telephone Number, Including Area Code)
|
__________________________________________
Securities registered pursuant to Section 12(b) of the Act:
|
Title of each class
|
|
Name of each exchange on which registered
|
|
Ordinary Shares—nominal value €0.01 per share
|
|
New York Stock Exchange
|
Securities registered pursuant to Section 12(g) of the Act: None
__________________________________________
Indicate by check mark if the registrant is a well-known seasoned issuer, as defined in Rule 405 of the Securities Act. Yes
x
No
¨
Indicate by check mark if the registrant is not required to file reports pursuant to Section 13 or Section 15(d) of the Act. Yes
¨
No
x
Indicate by a check mark whether the registrant: (1) has filed all reports required to be filed by Section 13 or 15(d) of the Securities Exchange Act of 1934 during the preceding 12 months (or for such shorter period that the registrant was required to file such reports), and (2) has been subject to such filing requirements for the past 90 days. Yes
x
No
¨
Indicate by check mark whether the registrant has submitted electronically and posted on its corporate Web site, if any, every Interactive Data File required to be submitted and posted pursuant to Rule 405 of Regulation S-T (§232.405 of this chapter) during the preceding 12 months (or for such shorter period that the registrant was required to submit and post such files). Yes
x
No
¨
Indicate by check mark if disclosure of delinquent filers pursuant to Item 405 of Regulation S-K (§229.405 of this chapter) is not contained herein, and will not be contained, to the best of the registrant’s knowledge, in definitive proxy or information statements incorporated by reference in Part III of this Form 10-K or any amendment to this Form 10-K.
x
Indicate by check mark whether the registrant is a large accelerated filer, an accelerated filer, a non-accelerated filer, or a smaller reporting company. See the definitions of “large accelerated filer,” “accelerated filer,” and “small reporting company” in Rule 12b-2 of the Exchange Act.
|
Large accelerated filer
x
|
|
Accelerated filer
o
|
|
Non-accelerated filer
o
|
|
Smaller reporting company
o
|
|
(Do not check if a smaller reporting company)
|
|
Emerging growth company
o
|
If an emerging growth company, indicate by check mark if the registrant has elected not to use the extended transition period for complying with any new or revised financial accounting standards provided pursuant to Section 13(a) of the Exchange Act.
¨
Indicate by check mark whether the registrant is a shell company (as defined in Rule 12b-2 of the Exchange Act). Yes
¨
No
x
The aggregate market value of the registrant’s ordinary shares held by non-affiliates at
June 30, 2017
was approximately
$7.3 billion
based on the New York Stock Exchange closing price for such shares on that date.
As of
January 12, 2018
,
171,393,403
ordinary shares were outstanding.
DOCUMENTS INCORPORATED BY REFERENCE
Part III of this Report incorporates information from certain portions of the registrant’s Definitive Proxy Statement to be filed with the Securities and Exchange Commission within 120 days of the registrant's fiscal year ended
December 31, 2017
.
TABLE OF CONTENTS
Cautionary Statements Concerning Forward-Looking Statements
This Annual Report on Form 10-K, including any documents incorporated by reference herein, includes “forward-looking statements” within the meaning of the Private Securities Litigation Reform Act of 1995. These forward-looking statements relate to analyses and other information that are based on forecasts of future results and estimates of amounts not yet determinable. These forward-looking statements also relate to our future prospects, developments, and business strategies. These forward-looking statements may be identified by terminology such as “may,” “will,” “could,” “should,” “expect,” “anticipate,” “believe,” “estimate,” “predict,” “project,” “forecast,” “continue,” “intend,” “plan,” and similar terms or phrases, or the negative of such terminology, including references to assumptions. However, these terms are not the exclusive means of identifying such statements.
Forward-looking statements contained herein, or in other statements made by us, are made based on management’s expectations and beliefs concerning future events impacting us. These statements are subject to uncertainties and other important factors relating to our operations and business environment, all of which are difficult to predict, and many of which are beyond our control, that could cause our actual results to differ materially from those matters expressed or implied by forward-looking statements. Although we believe that our plans, intentions, and expectations reflected in, or suggested by, such forward-looking statements are reasonable, we can give no assurances that any of the events anticipated by these forward-looking statements will occur or, if any of them do, what impact they will have on our results of operations and financial condition.
We believe that the following important factors, among others (including those described in Item 1A, “Risk Factors,” included elsewhere in this Annual Report on Form 10-K), could affect our future performance and the liquidity and value of our securities and cause our actual results to differ materially from those expressed or implied by forward-looking statements made by us or on our behalf:
|
•
|
instability and changes in the global markets, including regulatory, political, economic, and military matters;
|
|
•
|
changes to current policies by the U.S. government;
|
|
•
|
adverse conditions in the automotive industry;
|
|
•
|
competition in our industry;
|
|
•
|
pressure from customers to reduce prices;
|
|
•
|
supplier interruption or non-performance limiting our access to manufactured components or raw materials;
|
|
•
|
business disruptions due to natural disasters or other disasters outside our control;
|
|
•
|
labor disruptions or increased labor costs;
|
|
•
|
difficulties or failures to integrate businesses we acquire;
|
|
•
|
disruptions from any future acquisitions and joint ventures or dispositions that require significant resources and/or result in significant unanticipated losses, costs, or liabilities;
|
|
•
|
market acceptance of new product introductions and product innovations;
|
|
•
|
changes in, or inability to comply with, various regulations, including tax laws, import/export regulations, anti-bribery laws, environmental and safety laws, and other governmental regulations;
|
|
•
|
foreign currency risks and changes in socio-economic conditions and/or monetary and fiscal policies, including as a result of the impending exit of the U.K. from the European Union;
|
|
•
|
losses and costs as a result of intellectual property, product liability, warranty, and recall claims that may be brought against us;
|
|
•
|
taxing authorities challenging our historical and future tax positions or our allocation of taxable income among our subsidiaries;
|
|
•
|
our level of indebtedness or inability to meet our debt service obligations or comply with the covenants contained in the credit agreements;
|
|
•
|
security breaches and other disruptions to our information technology infrastructure; and
|
|
•
|
other risks set forth in Item 1A, “Risk Factors,” included elsewhere in this Annual Report on Form 10-K.
|
All forward-looking statements attributable to us or persons acting on our behalf speak only as of the date of this Annual Report on Form 10-K and are expressly qualified in their entirety by the cautionary statements contained in this Annual Report on Form 10-K. We undertake no obligation to update or revise forward-looking statements that may be made to reflect events or circumstances that arise after the date made or to reflect the occurrence of unanticipated events. We urge readers to review carefully the risk factors described in this Annual Report on Form 10-K and in the other documents that we file with the U.S. Securities and Exchange Commission. You can read these documents at
www.sec.gov
or on our website at
www.sensata.com
.
3
|
ITEM 1.
|
BUSINESS
|
The Company
The reporting company is Sensata Technologies Holding N.V. (“Sensata N.V.”) and its wholly-owned subsidiaries, collectively referred to as the “Company,” “Sensata,” “we,” “our,” and “us.”
Sensata N.V. is incorporated under the laws of the Netherlands and conducts its operations through subsidiary companies that operate business and product development centers primarily in the United States (the "U.S."), the Netherlands, Belgium, Bulgaria, China, Germany, Japan, South Korea, and the United Kingdom (the "U.K."); and manufacturing operations primarily in China, Malaysia, Mexico, Bulgaria, France, Germany, the U.K., and the U.S. We organize our operations into two businesses, Performance Sensing and Sensing Solutions.
On September 28, 2017, the board of directors of Sensata N.V. unanimously approved a plan to change our parent company’s location of incorporation from the Netherlands to the U.K. To effect this change, the shareholders of Sensata N.V. are being asked to approve a cross-border merger between Sensata N.V. and Sensata Technologies Holding plc (“Sensata U.K.”), a newly formed, public limited company incorporated under the laws of England and Wales, with Sensata U.K. being the surviving entity (the “Merger”).
To this end, on January 19, 2018, Sensata N.V. filed a definitive proxy statement (DEFM14A) regarding the proposed cross-border merger, which details the proposed plan and risks to the Company and shareholders. An extraordinary general meeting will be held on February 16, 2018, at which shareholders of record as of January 19, 2018 will be asked to vote on the proposed Merger. If approved by our shareholders, we will seek review and approval of the transaction by the U.K. High Court of Justice and would expect to complete the Merger in March 2018. If the Merger is consummated, Sensata U.K. will become the publicly-traded parent of the subsidiary companies that are currently controlled by Sensata N.V.
Overview
Sensata, a global industrial technology company, engages in the development, manufacture, and sale of sensors and controls. We produce a wide range of sensors and controls for applications such as pressure, temperature, and speed and position sensors in automotive systems, thermal circuit breakers in aircraft, and bimetal current and temperature control devices in electric motors. We can trace our origins back to entities that have been engaged in the sensors and controls business since 1916.
Our sensors are customized devices that translate a physical phenomenon, such as pressure, temperature, or position, into electronic signals that microprocessors or computer-based control systems can act upon. Our controls are customized devices embedded within systems to protect them from excessive heat or current. Underlying these sensors and controls are core technology platforms—thermal and magnetic-hydraulic circuit protection, micro electromechanical systems, ceramic capacitance, Microfused Silicon Strain Gage, and wireless communication protocol—that we leverage across multiple products and applications, enabling us to optimize our research, development, and engineering investments and achieve economies of scale.
Our primary products include low-, medium-, and high-pressure sensors, speed and position sensors, bimetal electromechanical controls, temperature sensors, power conversion and control products, thermal and magnetic-hydraulic circuit breakers, pressure switches, and interconnection products. We develop customized, innovative solutions for specific customer requirements or applications across a variety of end markets, including automotive, heavy vehicle off-road ("HVOR"), appliance and heating, ventilation, and air conditioning (“HVAC”), industrial, and aerospace, among others.
Our Performance Sensing business supplies automotive and HVOR sensors, including pressure sensors, speed and position sensors, temperature sensors, and pressure switches. Our Sensing Solutions business supplies bimetal electromechanical controls, industrial and aerospace sensors, power conversion and control products, thermal and magnetic-hydraulic circuit breakers, and interconnection products.
We have long-standing relationships with a geographically diverse base of leading global original equipment manufacturers (“OEMs”) and other multinational companies.
We develop products that address increasingly complex engineering requirements by investing substantially in research, development, and application engineering. By locating our global engineering teams in close proximity to key customers in
4
regional business centers, we are exposed to many development opportunities at an early stage and work closely with our customers to deliver solutions that meet their needs. As a result of the long development lead times and embedded nature of our products, we collaborate closely with our customers throughout the design and development phase of their products. Systems development by our customers typically requires significant multi-year investment for certification and qualification, which are often government or customer mandated. We believe the capital commitment and time required for this process significantly increases the switching costs once a customer has designed and installed a particular sensor or control into a system.
We are a global business, with significant operations around the world. As of December 31, 2017,
39.6%
,
35.5%
, and
24.9%
of our fixed assets were located in the Americas, Asia, and Europe, respectively. We have a diverse revenue mix by geography, customer, and end market. We generated
41.3%
,
27.3%
, and
31.4%
of our net revenue in the Americas, Asia, and Europe, respectively, for the year ended
December 31, 2017
. Our largest customer accounted for approximately
8%
of our net revenue for the year ended
December 31, 2017
. Our net revenue for the year ended
December 31, 2017
was derived from the following end markets:
24.0%
from European automotive,
18.6%
from North American automotive,
19.1%
from Asia and rest of world automotive,
14.3%
from HVOR,
9.4%
from industrial,
6.3%
from appliance and HVAC,
4.6%
from aerospace, and
3.7%
from all other end markets. Within many of our end markets, we are a significant supplier to multiple OEMs, reducing our exposure to global fluctuations in market share within individual end markets.
Acquisition History
Since our inception in 2006, we have completed the following significant acquisitions:
|
Segment
|
||||||||||
|
Date
|
Acquired Entity
|
Performance Sensing
|
Sensing Solutions
|
Purchase Price
(in Millions)
|
||||||
|
December 19, 2006
|
First Technology Automotive and Special Products ("FTAS")
|
X
|
X
|
$
|
88.5
|
|
||||
|
July 27, 2007
|
Airpax Holdings, Inc. ("Airpax")
|
X
|
$
|
277.3
|
|
|||||
|
January 28, 2011
|
Automotive on Board ("MSP")
|
X
|
$
|
152.5
|
|
|||||
|
August 1, 2011
|
Sensor-NITE Group Companies ("HTS")
|
X
|
$
|
324.0
|
|
|||||
|
January 2, 2014
|
Wabash Worldwide Holding Corp. ("Wabash")
|
X
|
$
|
59.6
|
|
|||||
|
May 29, 2014
|
Magnum Energy Incorporated ("Magnum")
|
X
|
$
|
60.6
|
|
|||||
|
August 4, 2014
|
CoActive U.S. Holdings Inc. ("DeltaTech Controls")
|
X
|
$
|
177.8
|
|
|||||
|
October 14, 2014
|
August Cayman Company, Inc. ("Schrader")
|
X
|
$
|
1,004.7
|
|
|||||
|
December 1, 2015
|
Custom Sensors & Technologies ("CST")
(1)
|
X
|
X
|
$
|
1,000.8
|
|
||||
|
(1)
|
Included the acquisition of all of the outstanding shares of certain subsidiaries of Custom Sensors & Technologies Ltd. in the U.S., the U.K., and France, as well as certain assets in China.
|
Performance Sensing Business
Overview
Our Performance Sensing business accounted for approximately
74%
of our net revenue in fiscal year
2017
, and is a leading supplier of automotive and HVOR sensors, including pressure sensors, speed and position sensors, temperature sensors, and pressure switches. These products are used in a wide variety of automotive and HVOR applications, including air conditioning, braking, exhaust, fuel oil, tire, operator controls, and transmission. We believe that we are one of the largest suppliers of pressure and high temperature sensors in the majority of the key applications in which we compete.
Our customers consist primarily of leading global automotive and HVOR OEMs and their Tier 1 suppliers. Our products are ultimately used by the majority of global automotive OEMs, providing us with a balanced customer portfolio, which, we believe, helps to protect us against global shifts in market share between different OEMs.
Refer to Note 18, "Segment Reporting," of our audited consolidated financial statements included elsewhere in this Annual Report on Form 10-K for details of the Performance Sensing segment profit for the years ended
December 31, 2017
,
2016
, and
2015
and total assets as of
December 31, 2017
and
2016
.
5
Performance Sensing Business Markets
Sensors are customized devices that translate a physical phenomenon, such as pressure, temperature, or position, into electronic signals that microprocessors or computer-based control systems can act upon. The market is characterized by a broad range of products and applications across a diverse set of end markets. We believe large OEMs and other multinational companies are increasingly demanding a global presence to supply sensors for their key global platforms.
As automobiles and heavy vehicles evolve, we believe the need for cleaner, high-efficiency powertrains will help drive our growth for the foreseeable future. We expect this growth to include content growth in both pure gasoline and hybrid-electric powertrains. These vehicles require systems and sensors to drive high efficiency across the powertrain, managing better diagnostics, more efficient combustion, and reduced emissions.
As new alternative powertrain technologies develop, opportunities are emerging to make electrified powertrains more efficient, robust, cost effective, and safe, which we believe has the potential to positively impact our business in the future. Sensor content on vehicle climate control systems, where we enjoy high market share, is increasing as electrified vehicles require greater efficiency. Other new emerging opportunities to improve on-vehicle energy density and battery life could also provide the potential for additional content per vehicle.
With our increasing presence in China, we believe that our automotive and HVOR businesses are well positioned to grow. With sustained vehicle modernization in China, we expect our content per vehicle in China will mirror our global content in efficient powertrains and electrification, as well as content in tire pressure monitoring.
In addition, we are taking steps and making investments with the intent of positioning ourselves to capitalize on what we believe will be a large, attractive market for autonomous vehicles. We continue to engage with customers who are seeking enabling sensor technology for autonomous driving.
Moreover, we believe our broad customer base, global diversification, and evolving portfolio provide the foundation that will allow us to grow with these megatrends across a diverse set of end markets.
Automotive and HVOR sensors are included in the Performance Sensing business results, while industrial and aerospace sensors are included in the Sensing Solutions business results. Refer to the
Sensing Solutions Business Markets
section for discussion of industrial and aerospace sensors.
Automotive and HVOR Sensors
Net revenue growth from the global automotive and HVOR sensor end markets, which include applications in powertrain, tire, air conditioning, and chassis control, among others, is driven, we believe, by three principal trends. First, global production of light vehicles has consistently demonstrated annual growth since the global recession in 2008 and 2009 and are expected to continue to increase over the long-term due to population growth and increased usage of cars in emerging markets. Second, the number of sensors used per vehicle has expanded, driven by a combination of factors including government regulation of emissions, greater efficiency, and safety, consumer demand for new applications including electric and hybrid-electric vehicles as well as trends toward autonomous vehicles and productivity and enhanced user interfaces in HVOR applications. For example, fuel economy standards such as the Corporate Average Fuel Economy ("CAFE") requirements in the U.S. and emissions requirements such as "Euro 6d" in Europe and "China National 6" in China lead to sensor-rich automobile powertrain strategies. Finally, revenue growth has been augmented by a continuing shift away from legacy electromechanical products towards higher-value electronic solid-state sensors.
According to the fourth quarter
2017
LMC Automotive "Global Car & Truck Forecast," the production of global light vehicles in 2017 was approximately
95.2 million
units, an increase of
2.3%
from
2016
.
The automotive and HVOR sensor markets are characterized by high switching costs and barriers to entry, benefiting incumbent market leaders. Sensors are critical components that enable a wide variety of applications, many of which are essential to the proper functioning of the product in which they are incorporated. Sensor application-specific products require close engineering collaboration between the sensor supplier and the OEM or the Tier 1 supplier. As a result, OEMs and Tier 1 suppliers make significant investments in selecting, integrating, and testing sensors as part of their product development. Switching to a different sensor results in considerable additional work, both in terms of sensor customization and extensive platform/product retesting and certification. This results in high switching costs for automotive and HVOR manufacturers once a sensor is designed-in. We believe the foregoing is one of the reasons that sensors are rarely changed during a platform life-cycle, which in the case of the automotive end market typically lasts five to seven years. Given the importance of reliability and the fact that the sensors must be supported through the length of a product life, our experience has been that OEMs and Tier 1 suppliers tend to work with suppliers that have a long track record of quality and on-time delivery and the scale and resources
6
to meet their needs as the automobile platform evolves and grows. In addition, the automotive segment is one of the largest markets for sensors, giving participants with a presence in this end market significant scale advantages over those participating only in smaller, more niche industrial and medical markets.
According to an October 2017 report prepared by Strategy Analytics, Inc., the global automotive sensor market was
$22.4 billion
in 2017, compared to
$21.5 billion
in 2016. We believe the increase in the number of sensors per vehicle and the level of global vehicle sales are the primary drivers of the increase in the global automotive sensor market. We believe that the increasing installation in vehicles of emissions, efficiency, safety, and comfort-related features that depend on sensors for proper functioning, such as electronic stability control, tire pressure monitoring, advanced driver assistance, transmission, and advanced combustion and exhaust after-treatment, will continue to drive increased sensor usage and content growth.
Performance Sensing Products
We offer the following significant products in the Performance Sensing business:
|
Product Categories
|
Key Applications/Solutions
|
Key End-Markets
|
||
|
Pressure sensors
|
Air conditioning systems
Transmission
Engine oil
Suspension
Fuel rail
Braking
Tire pressure monitoring
Exhaust after-treatment
|
Automotive
HVOR
Motorcycle
|
||
|
Speed and position sensors
|
Transmission
Braking
Engine
|
Automotive
HVOR
|
||
|
Temperature sensors
|
Exhaust after-treatment
|
Automotive
HVOR
|
||
|
Pressure switches
|
Air conditioning systems
Power steering
Transmission
|
Automotive
HVOR
|
||
The table below sets forth the amount of net revenue we generated from each of these product categories in each of the last three fiscal years:
|
Product Category
|
For the year ended December 31,
|
||||||||||
|
(Amounts in thousands)
|
2017
|
2016
|
2015
|
||||||||
|
Pressure sensors
(1)
|
$
|
1,773,401
|
|
$
|
1,696,215
|
|
$
|
1,631,678
|
|
||
|
Speed and position sensors
|
309,135
|
|
305,287
|
|
328,102
|
|
|||||
|
Temperature sensors
|
186,793
|
|
185,289
|
|
191,369
|
|
|||||
|
Pressure switches
|
61,997
|
|
56,005
|
|
55,607
|
|
|||||
|
Other
|
129,274
|
|
142,584
|
|
139,470
|
|
|||||
|
Total
|
$
|
2,460,600
|
|
$
|
2,385,380
|
|
$
|
2,346,226
|
|
||
(1)
Certain products, totaling
$28.5 million
, that were categorized as pressure sensors in 2016 have been recast to other.
Sensing Solutions Business
Overview
Our Sensing Solutions business accounted for approximately
26%
of our net revenue in fiscal year
2017
, and is a leading provider of bimetal electromechanical controls, industrial and aerospace sensors, power conversion and control products, thermal and magnetic-hydraulic circuit breakers, and interconnection products. We market and manufacture a broad portfolio of application-specific products, including motor and compressor protectors, motor starters, temperature sensors and switches/thermostats, pressure sensors and switches, electronic HVAC sensors and controls, linear and rotary position sensors, charge controllers, solid state relays, circuit breakers, semiconductor burn-in test sockets, and power inverters. Our control products are sold into industrial, aerospace, military, commercial, medical device, and residential end markets. We derive most of our Sensing Solutions business revenue from sales of products that prevent damage from excess heat or electrical current in a variety of applications within these end markets, such as internal and external motor and compressor protectors, circuit
7
protection, motor starters, thermostats, switches, semiconductor testing, and light industrial systems. Our industrial and aerospace sensors, including pressure sensors, temperature sensors, and linear and rotary position sensors, provide real time information about the state of a specific system or subsystem, so control adjustments can be made to optimize system performance. We believe that we are one of the largest suppliers of controls in the majority of the key applications in which we compete.
Our Sensing Solutions business benefits from strong agency relationships. For example, a number of electrical standards for motor control products, including portions of the Underwriters’ Laboratories ("UL") Standards for Safety, have been written based on the performance and specifications of our control products. We also have U.S. and Canadian Component Recognitions from UL, a U.S.-based organization that issues safety standards for many electrical products in the U.S., for many of our control products, so that customers can use Klixon
®
and Airpax
®
products throughout North America. Where our component parts are detailed in our customers' certifications from UL, changes to their certifications may be necessary in order for them to incorporate competitors' motor protection offerings. Similarly, our aerospace products undergo exhaustive qualification procedures to customer or military performance standards; requiring a significant investment in a re-qualification effort to incorporate competitors’ offerings.
We continue to focus our efforts on expanding our presence in all global geographies, both emerging and mature. Our customers include established multinationals, as well as local producers in emerging markets such as China, India, Eastern Europe, and Turkey. China continues to remain a priority for us because of its export focus and domestic consumption of products that use our devices. In addition, we continue to focus on managing our costs and increasing our productivity in these lower-cost manufacturing regions.
Refer to Note 18, "Segment Reporting," of our audited consolidated financial statements included elsewhere in this Annual Report on Form 10-K for details of the Sensing Solutions segment profit for the years ended
December 31, 2017
,
2016
, and
2015
and total assets as of
December 31, 2017
and
2016
.
Sensing Solutions Business Markets
Sensing Solutions products include controls, which are customized devices that protect equipment and electrical architecture from excessive heat or current, and sensors, which measure specific fluid- or air-based system parameters, including pressure and temperature, as well as measure position. Our products help our customers' systems run safely and in an efficient and environmentally-friendly manner. Our product lines encompass bimetal electromechanical controls, industrial and aerospace sensors, power conversion and control products, thermal and magnetic-hydraulic circuit breakers, and interconnection products, each of which serves a highly diversified base of customers, end markets, applications, and geographies.
Bimetal Electromechanical Controls
Bimetal electromechanical controls include motor protectors, motor starters, thermostats, and switches, each of which helps prevent damage from excessive heat or current. Our bimetal electromechanical controls business serves a diverse group of end markets, including commercial and residential HVAC and refrigeration systems, lighting, industrial motors, household appliances, and commercial and military aircraft. The demand for many of these products tends to follow the general economic environment and is affected by the increasing significance of new electronically-controlled applications.
Industrial and Aerospace Sensors
Industrial and aerospace sensors employ similar technology to automotive and HVOR sensors discussed in the
Performance Sensing Business
section above, but often require different customization in terms of packaging, calibration, and electrical output. Applications in which these sensors are used include fluid- and air-based system measurement, motion control systems, pumps and storage tanks, where measurement of pressure and temperature is required for optimum performance, and commercial and military aircraft controls, where high reliability is required. End markets served by this business include: commercial and residential HVAC and refrigeration systems, where refrigerant, water, or air is the sensed media used to optimize performance of the heating and cooling application; discrete industrial equipment where fluid- or air-based subsystems are used (e.g., air compressors and hydraulic machinery such as molding and metal machining); and commercial and military aircraft.
Linear and rotary position sensors translate linear or angular mechanical position to an electrical signal, and are typically used in systems where high reliability is desired, such as commercial and military aircraft controls. The primary uses for our linear and rotary position sensors are in harsh environments in the aerospace and energy and infrastructure end markets.
We believe that sensor usage in industrial and commercial applications is driven by many of the same factors as in the
8
automotive sensor market: regulation of emissions, greater energy efficiency, and safety, as well as consumer demand for new features. For example, many HVAC/Refrigeration ("HVAC/R") and industrial systems are converting to more efficient variable speed control, which inherently requires more sensor feedback than traditional fixed speed control systems. Global trends towards environmentally friendly refrigerants also require more sensors to deliver the desired system performance.
Power Conversion and Control
Power conversion and control products include power inverters, charge controllers, and solid state relays.
Our power inverter products enable conversion of electric power from direct current ("DC") power to alternating current ("AC") power, or AC power to DC power. Power inverters are used mainly in applications where DC power, such as that stored in a battery, must be converted for use in an electrical device that runs on AC power, or in applications where AC power is converted to DC power to charge batteries or power DC loads. Typically, converting AC power to DC power also uses a charge controller.
Specific uses for power inverters and charge controllers include powering applications in utility/service trucks or recreational vehicles and providing power conversion and charge control for off-grid and grid-tie battery back-up systems. Demand for these products is driven by economic development, the need to meet new energy efficiency standards, electrification of auxiliary loads on work trucks, emerging opportunities for residential energy storage and off-grid power systems, and a growing interest in clean energy to replace generators, which increases demand for both mobile and stationary power.
Solid state relays are used where it is necessary to control a circuit by a low-power signal, or where several circuits must also be controlled by one signal. Solid state relays have certain advantages over mechanical relays, including long operation life, silent operation, low power, and low electrical interference. Applications for solid state relays primarily include those in the industrial and commercial equipment end markets.
Thermal and Magnetic-Hydraulic Circuit Breakers
Our circuit breaker portfolio includes thermal circuit breakers and customized magnetic-hydraulic circuit breakers, which help prevent damage from thermal or electrical overload. We provide thermal circuit breakers to the commercial and military aircraft markets as well as the industrial and agricultural markets. Our magnetic-hydraulic circuit breaker business serves a broad spectrum of OEMs and other multinational companies in the aerospace, telecommunication, industrial, recreational vehicle, HVAC, refrigeration, marine, medical, information processing, electronic power supply, power generation, over-the-road trucking, construction, agricultural, and alternative energy markets. Demand for these products tends to follow the general economic environment.
Interconnection
Our interconnection products consist of semiconductor burn-in test sockets used by semiconductor manufacturers to verify packaged semiconductor reliability. Demand in the semiconductor market is driven by consumer and business computational, entertainment, transportation, and communication needs. These needs are driven by the desire to have smaller, lighter, faster, more functional, and energy conscious devices that make users more productive and interconnected to society.
9
Sensing Solutions Products
We offer the following significant products in the Sensing Solutions business:
|
Product Categories
|
Key Applications/Solutions
|
Key End-Markets
|
||
|
Bimetal electromechanical controls
|
Motor and compressor protectors
Motor starters
Thermostats
Switches
|
HVAC/R
Small/large appliances
Lighting
Industrial and auxiliary DC motors
Commercial and military aircraft
Marine/industrial
|
||
|
Industrial and aerospace sensors
|
Fluid- or air-based system measurement
Motion control systems
Pumps and storage tanks
Linear and rotary position sensors
|
|
HVAC/R
Industrial equipment
Commercial and military aircraft
|
|
|
Power conversion and control
|
DC/AC inverters
Charge controllers
Solid state relays
|
Utility work vehicles
Recreational vehicles
Solar power
Industrial and commercial equipment
|
||
|
Thermal and magnetic-hydraulic circuit breakers
|
Thermal circuit breakers
Magnetic-hydraulic circuit breakers
|
Commercial and military aircraft
Data and telecommunications
Industrial/medical/alternative energy
Recreational/marine/industrial
HVAC/R
Power supply/generation
HVOR
|
||
|
Interconnection
|
Semiconductor testing
|
Semiconductor manufacturing
|
||
The table below sets forth the amount of net revenue we generated from each of these product categories in each of the last three fiscal years:
|
Product Category
|
For the year ended December 31,
|
||||||||||
|
(Amounts in thousands)
|
2017
|
2016
|
2015
|
||||||||
|
Bimetal electromechanical controls
|
$
|
333,907
|
|
$
|
321,202
|
|
$
|
318,721
|
|
||
|
Industrial and aerospace sensors
|
201,835
|
|
193,843
|
|
69,102
|
|
|||||
|
Power conversion and control
|
127,348
|
|
120,357
|
|
58,180
|
|
|||||
|
Thermal and magnetic-hydraulic circuit breakers
|
107,097
|
|
109,719
|
|
110,980
|
|
|||||
|
Interconnection
|
59,725
|
|
57,518
|
|
61,738
|
|
|||||
|
Other
|
16,221
|
|
14,269
|
|
10,014
|
|
|||||
|
Total
|
$
|
846,133
|
|
$
|
816,908
|
|
$
|
628,735
|
|
||
Technology and Intellectual Property
We rely primarily on patents and trade secret laws, confidentiality procedures, and licensing arrangements to protect our intellectual property rights. While we consider our patents to be valuable assets, we do not believe that our overall competitive position is dependent on patent protection or that our overall operations are dependent upon any single patent or group of related patents. Many of our patents protect specific functionality in our products, and others consist of processes or techniques that result in reduced manufacturing costs. Our patents generally relate to improvements on earlier filed Sensata, acquired, or competitor patents. As of
December 31, 2017
, we had approximately
315
U.S. and
370
non-U.S. patents and approximately
41
U.S. and
227
non-U.S. pending patent applications that were filed within the last five years. We do not know whether any of our pending patent applications will result in the issuance of patents or whether the examination process will require us to narrow our claims. Our patents have expiration dates ranging from 2018 to 2042. We incurred Research and Development expense of
$130.2 million
,
$126.7 million
, and
$123.7 million
for the years ended
December 31, 2017
,
2016
, and
2015
, respectively.
We use licensing arrangements with respect to certain technology provided in our sensor products and, to a lesser extent, our control products. In 2006, we entered into a perpetual, royalty-free cross-license agreement with our former owner, Texas Instruments Incorporated ("TI"), which permits each party to use specified technology owned by the other party in its business. No license may be terminated under the agreement, even in the event of a material breach.
10
We purchase sense element assemblies, which are components used primarily in our monosilicon strain gage pressure sensors, from Measurement Specialties, Inc. and its affiliates ("MEAS") and also manufacture them internally as a second source. In March 2013, we entered into an intellectual property licensing arrangement (the "License Agreement") with MEAS that provides for an indefinite duration license and is subject to royalties through 2019 and thereafter is royalty-free. Pursuant to the terms of the License Agreement, we are authorized to produce our entire need for these sense elements within the passenger vehicle and heavy duty truck fields of use. The License Agreement can be terminated by either party in the event of an uncured material breach. The sense element assemblies subject to the License Agreement accounted for
$413.2 million
,
$397.7 million
, and
$386.3 million
in net revenue for the years ended
December 31, 2017
, 2016, and 2015, of which
$64.8 million
, $150.6 million, and $206.7 million, respectively, was related to products that were manufactured by MEAS, and
$348.4 million
, $247.1 million, and $179.6 million, respectively, was related to products that were manufactured by us.
Seasonality
Because of the diverse global nature of the markets in which we operate, our revenue is only moderately impacted by seasonality. However, our Sensing Solutions business has some seasonal elements, specifically in its air conditioning and refrigeration products, which tend to peak in the first two quarters of the year as end market inventory is built up for spring and summer sales. In addition, our Performance Sensing business tends to be weaker in the third quarter of the year as automotive OEMs retool production lines for the coming model year.
Sales and Marketing
The sales and marketing function within our business is organized into regions—the Americas, Asia, and Europe—but also organizes globally across all geographies according to market segments, so as to facilitate knowledge sharing and coordinate activities involving our larger customers through global account managers.
Customers
Our customer base in the Performance Sensing business includes a wide range of OEMs and Tier 1 suppliers in the automotive and HVOR end markets. Our customers in the Sensing Solutions business include a wide range of industrial and commercial manufacturers and suppliers across multiple end markets, primarily OEMs in the climate control, appliance, semiconductor, medical, energy and infrastructure, data/telecom, and aerospace industries, as well as Tier 1 aerospace and motor and compressor suppliers. In geographic and product markets where we lack an established base of customers, we rely on third-party distributors to sell our sensor and control products. We have had relationships with our top ten customers for an average of
28
years. Our largest customer accounted for approximately
8%
of our net revenue for the year ended
December 31, 2017
.
Selected Geographic Information
Refer to Note 18, "Segment Reporting," of our audited consolidated financial statements included elsewhere in this Annual Report on Form 10-K for details of our net revenue by selected geographic areas for the years ended
December 31, 2017
,
2016
, and
2015
and PP&E, net by selected geographic area as of
December 31, 2017
and
2016
.
Competition
Within each of the principal product categories in our Performance Sensing business, we compete with a variety of independent suppliers as well as the in-house operations of Tier 1 systems suppliers. We believe that the key competitive factors in this market are product performance, quality, and reliability, the ability to produce customized solutions on a global basis, technical expertise and development capability, breadth and scale of product offerings, product service and responsiveness, and price.
Within each of the principal product categories in our Sensing Solutions business, we compete with divisions of large multinational industrial corporations and companies with smaller market share, which compete primarily in specific end markets or applications. We believe that the key competitive factors in these markets are product performance, quality, and reliability, although manufacturers in certain markets also compete based on price. Physical proximity to the facilities of the OEM/Tier 1 manufacturer customer has, in our experience, also increasingly become a basis for competition. We have additionally found that certain of the product categories have specific competitive factors. For example, for thermal circuit breaker, thermostat, and switch products, strength of technology, quality, and the ability to provide custom solutions are particularly important. With hydraulic-magnetic circuit breakers, as another example, we have encountered heightened competition on price and a greater emphasis on agency approvals, including approvals by UL and military agencies, and similar organizations outside of the U.S., such as Verband der Elektrotechnik, Elektronik und Informationstechnik, and TÜV Rheinland in Europe, China Compulsory Certification in China, and Canadian Standards Association in Canada.
11
Employees
As of
December 31, 2017
, we had approximately
22,100
employees, of whom approximately
8%
were located in the U.S. As of
December 31, 2017
, approximately
530
of our employees were covered by collective bargaining agreements. In addition, in various countries, local law requires our participation in works councils. We also engage contract workers in multiple locations, primarily to cost-effectively manage variations in manufacturing volume, but also to perform engineering and other general services. As of
December 31, 2017
, we had approximately
2,030
contract workers on a worldwide basis. We believe that our relations with our employees are good.
Environmental Matters and Governmental Regulation
Our operations and facilities are subject to U.S. and non-U.S. laws and regulations governing the protection of the environment and our employees, including those governing air emissions, water discharges, the management and disposal of hazardous substances and wastes, and the cleanup of contaminated sites. We are, however, not aware of any threatened or pending material environmental investigations, lawsuits, or claims involving us or our operations. As of
December 31, 2017
, compliance with federal, state, and local provisions that have been enacted or adopted regulating the discharge of materials into the environment, or otherwise relating to the protection of the environment, has not had a material effect on our capital expenditures, earnings, or competitive position. We have not budgeted any material capital expenditures for environmental control facilities during
2018
.
Our products are governed by material content restrictions and reporting requirements, examples of which include: European Union regulations, such as REACH (Registration, Evaluation, Authorization, and Restriction of Chemicals), RoHS (Restriction of Hazardous Substances), and ELV (End of Life Vehicles); U.S. regulations, such as the conflict minerals requirements of the Dodd-Frank Wall Street Reform and Consumer Protection Act; and similar regulations in other countries. Numerous customers, across all end markets, are requiring us to provide declarations of compliance or, in some cases, full material content disclosure as a requirement of doing business with them.
We are subject to compliance with laws and regulations controlling the export of goods and services. Certain of our products are subject to International Traffic in Arms Regulation (“ITAR”). The export of many such ITAR-controlled products requires an individual validated license from the U.S. State Department’s Directorate of Defense Trade Controls. The State Department makes licensing decisions based on type of product, destination of end use, end user, national security, and foreign policy. The length of time involved in the licensing process varies but currently averages approximately six to eight weeks. The license processing time could result in delays in the shipping of products. These laws and regulations are subject to change, and any such change may require us to change technology or incur expenditures to comply with such laws and regulations.
Available Information
We make available free of charge on our Internet website (
www.sensata.com
) our Annual Reports on Form 10-K, Quarterly Reports on Form 10-Q, Current Reports on Form 8-K, and amendments to those reports filed or furnished pursuant to Section 13 or 15(d) of the Securities Exchange Act of 1934 as soon as reasonably practicable after we electronically file such material with, or furnish it to, the U.S. Securities and Exchange Commission (the "SEC"). Our website and the information contained or incorporated therein are not intended to be incorporated into this Annual Report on Form 10-K.
The public may read and copy any materials filed by us with the SEC at the SEC's Public Reference Room at 100 F Street, NE., Room 1580, Washington, DC 20549. The public may obtain information on the operation of the Public Reference Room by calling the SEC at 1-202-551-8300. The SEC maintains an Internet site that contains reports, proxy, and information statements, and other information regarding issuers that file electronically with the SEC at
www.sec.gov
. The contents on, or accessible through, this website are not incorporated into this filing. Further, our references to the URLs for the SEC's website and our website are intended to be inactive textual references only.
12
|
ITEM 1A.
|
RISK FACTORS
|
Risks Related to our Industry and Business Operations
Our business is subject to numerous global risks, including regulatory, political, economic, and military concerns and instability.
Our business, including our employees, customers, and suppliers, are located throughout the world. As a result, we are exposed to numerous global and local risks that could decrease revenue and/or increase expenses and therefore, decrease our profitability, including, without limitation:
|
•
|
trade regulations, including customs, import, and export matters;
|
|
•
|
tariffs, trade barriers and disputes;
|
|
•
|
local employment costs, regulations, and conditions;
|
|
•
|
difficulties with, and costs for, protecting our intellectual property;
|
|
•
|
challenges in collecting accounts receivable;
|
|
•
|
tax law and regulatory changes, including examinations by taxing authorities, variations in tax laws from country to country, changes to the terms of income tax treaties, and difficulties in the tax-efficient repatriation of cash generated or held in a number of jurisdictions;
|
|
•
|
natural disasters;
|
|
•
|
instability in economic or political conditions, inflation, recession, actual or anticipated military or political conflicts, and potential impact due to the upcoming exit of the United Kingdom (the "U.K.") from the European Union (the "E.U."); and
|
|
•
|
impact of each of the foregoing on our outsourcing and procurement arrangements.
|
We have sizeable operations in China, including two principal manufacturing sites. In addition, approximately
15%
of our net revenue in fiscal year 2017 was derived from sales to customers in China. Economic conditions in China have been and may continue to be volatile and uncertain. In addition, the legal and regulatory system in China is still developing and subject to change. Accordingly, our operations and transactions with customers in China could be adversely affected by changes to market conditions, changes to the regulatory environment, or interpretation of Chinese law.
Adverse conditions in the industries upon which we are dependent, including the automotive industry, have had, and may in the future have, adverse effects on our business.
We are dependent on end market dynamics to sell our products, and our operating results could be adversely affected by cyclical and reduced demand in these markets. Periodic downturns in our customers’ industries could significantly reduce demand for certain of our products, which could have a material adverse effect on our results of operations, financial position, and cash flows.
Much of our business depends on, and is directly affected by, the global automobile industry. Sales in our automotive end markets accounted for approximately
62%
of our total net revenue in fiscal year
2017
. Adverse developments like those we have seen in past years in the automotive industry, including but not limited to declines in demand, customer bankruptcies, and increased demands on us for pricing decreases, could have adverse effects on our results of operations and could impact our liquidity and our ability to meet restrictive debt covenants. In addition, these same conditions could adversely impact certain of our vendors’ financial solvency, resulting in potential liabilities or additional costs to us to ensure uninterrupted supply to our customers.
Continued pricing and other pressures from our customers may adversely affect our business.
Many of our customers, including automotive manufacturers and other industrial and commercial original equipment manufacturers ("OEMs"), have policies that require annual price reductions. If we are not able to offset continued price reductions through improved operating efficiencies and reduced expenditures, the required price reductions will impact, and may have a material adverse effect on, our results of operations and cash flows. In addition, our customers occasionally require engineering, design, or production changes. In some circumstances, we may be unable to cover the costs of these changes with
13
price increases. Further, as our customers grow larger, they may increasingly require us to provide them with our products on an exclusive basis, which could limit sales, cause an increase in the number of products we must carry and, consequently, increase our inventory levels and working capital requirements. Certain of our customers, particularly in the automotive industry, are increasingly requiring their suppliers to agree to their standard purchasing terms without deviation as a condition to engage in future business transactions. As a result, we may find it difficult to enter into agreements with such customers on terms that are commercially reasonable to us.
We operate in markets that are highly competitive, and competitive pressures could require us to lower our prices or result in reduced demand for our products.
We operate in markets that are highly competitive, and we compete on the basis of product performance, quality, service, and/or price across the industries and markets we serve. A significant element of our competitive strategy is to manufacture high-quality products at best cost, particularly in markets where low-cost country-based suppliers, primarily in China with respect to the Sensing Solutions business, have entered the markets or increased their per-unit sales in these markets by delivering products at low costs to local OEMs. In addition, certain of our competitors in the automotive sensor market are influenced or controlled by major OEMs or suppliers, thereby limiting our access to these customers. Many of our customers also rely on us as their sole source of supply for many of the products that we have historically sold to them. These customers may choose to develop relationships with additional suppliers or elect to produce some or all of these products internally, primarily to reduce risk of delivery interruptions or as a means of extracting price reductions from us. Certain of our customers currently have, or may develop in the future, the capability to internally produce the products that we sell to them and may compete with us with respect to those and other products and with respect to other customers. Competitive pressures such as these, and others, could affect prices or customer demand for our products, negatively impacting our profit margins and/or resulting in a loss of market share.
Increasing costs for, or limitations on the supply of or access to, manufactured components and raw materials may adversely affect our business and results of operations.
We use a broad range of manufactured components, subassemblies, and raw materials in the manufacture of our products, including those containing silver, gold, platinum, palladium, copper, aluminum, nickel, zinc, resins, and certain rare earth metals, which may experience significant volatility in their price and availability. We have entered into hedge arrangements in an attempt to minimize commodity pricing volatility and may continue to do so from time to time in the future. Such hedges might not be economically successful. In addition, these hedges do not qualify as accounting hedges in accordance with United States ("U.S.") generally accepted accounting principles. Accordingly, the change in fair value of these hedges is recognized in earnings immediately, which could cause volatility in our results of operations from quarter to quarter. Refer to Note 16, "Derivative Instruments and Hedging Activities," of our audited consolidated financial statements, and Item 7A, "Quantitative and Qualitative Disclosures About Market Risk," each included elsewhere in this Annual Report on Form 10-K for further discussion of accounting for hedges of commodity prices, and an analysis of the sensitivity on pretax earnings of changes in the forward prices on these hedges, respectively.
The availability and price of raw materials and manufactured components may be subject to change due to, among other things, new laws or regulations, global economic or political events including strikes, suppliers' allocations to other purchasers, interruptions in production by suppliers, changes in exchange rates, and prevailing price levels. It is generally difficult to pass increased prices for manufactured components and raw materials through to our customers in the form of price increases. Therefore, a significant increase in the price or a decrease in the availability of these items could materially increase our operating costs and materially and adversely affect our business and results of operations.
Natural disasters or other disasters outside of our control could cause significant business interruptions resulting in harm to our business operations and financial condition.
Our operations and those of our suppliers and customers, and the supply chains that support their operations, may potentially suffer interruptions caused by natural disasters such as earthquakes, tsunamis, hurricanes, typhoons, or floods; or other disasters such as fires, explosions, disease, acts of terrorism or war that are outside of our control. If a business interruption occurs and we are unsuccessful in our continuing efforts to minimize the impact of these events, our business, results of operations, financial position, and/or cash flows could be materially adversely affected.
Labor disruptions or increased labor costs could adversely affect our business.
As of
December 31, 2017
, we had approximately
22,100
employees, of whom approximately
8%
were located in the U.S. As of
December 31, 2017
, approximately
530
of our employees were covered by collective bargaining agreements. In addition, in various countries, local law requires our participation in works councils.
14
A material labor disruption or work stoppage at one or more of our manufacturing facilities could have a material adverse effect on our business. In addition, work stoppages occur relatively frequently in the industries in which many of our customers operate, such as the automotive industry. If one or more of our larger customers were to experience a material work stoppage for any reason, that customer may halt or limit the purchase of our products. This could cause us to shut down production facilities relating to those products, which could have a material adverse effect on our business, results of operations, and/or financial condition.
We may not realize all of the revenue or achieve anticipated gross margins from products subject to existing purchase orders or for which we are currently engaged in development.
Our ability to generate revenue from products pending customer awards is subject to a number of important risks and uncertainties, many of which are beyond our control, including the number of products our customers will actually produce, as well as the timing of such production. Many of our customer agreements provide for supplying a certain share of the customer’s requirements for a particular application or platform, rather than for manufacturing a specific quantity of products. In some cases, we have no remedy if a customer chooses to purchase less than we expect. In cases where customers do make minimum volume commitments to us, our remedy for their failure to meet those minimum volumes is limited to increased pricing on those products that the customer does purchase from us or renegotiating other contract terms. There is no assurance that such price increases or new terms will offset a shortfall in expected revenue. In addition, some of our customers may have the right to discontinue a program or replace us with another supplier under certain circumstances. As a result, products for which we are currently incurring development expenses may not be manufactured by customers at all, or may be manufactured in smaller amounts than currently anticipated. Therefore, our anticipated future revenue from products relating to existing customer awards or product development relationships may not result in firm orders from customers for the originally contracted amount. We also incur capital expenditures and other costs, and price our products, based on estimated production volumes. If actual production volumes were significantly lower than estimated, our anticipated revenue and gross margin from those new products would be adversely affected. We cannot predict the ultimate demand for our customers’ products, nor can we predict the extent to which we would be able to pass through unanticipated per-unit cost increases to our customers.
We are dependent on market acceptance of our new product introductions and product innovations for future revenue.
Substantially all markets in which we operate are impacted by technological change or change in consumer tastes and preferences, which are rapid in certain end markets. Our operating results depend substantially upon our ability to continually design, develop, introduce, and sell new and innovative products; to modify existing products; and to customize products to meet customer requirements driven by such change. There are numerous risks inherent in these processes, including the risk that we will be unable to anticipate the direction of technological change or that we will be unable to develop and market profitable new products and applications before our competitors or in time to satisfy customer demands.
Security breaches and other disruptions to our information technology infrastructure could interfere with our operations, compromise confidential information, and expose us to liability which could materially adversely impact our business and reputation.
Security breaches and other disruptions to our information technology infrastructure could interfere with our operations; compromise information belonging to us, our employees, customers, and suppliers; and expose us to liability that could adversely impact our business and reputation. In the ordinary course of business, we rely on information technology networks and systems, some of which are managed by third parties, to process, transmit, and store electronic information, and to manage or support a variety of business processes and activities. Additionally, we collect and store certain data, including proprietary business information and customer and employee data, and may have access to confidential or personal information that is subject to privacy and security laws, regulations, and customer-imposed controls. We also face the challenge of supporting our older systems and implementing necessary upgrades. Despite our cybersecurity measures (including employee and third-party training, monitoring of networks and systems, and maintenance of backup and protective systems) that are continuously reviewed and upgraded, our information technology networks and infrastructure may still be vulnerable to damage, disruptions, or shutdowns due to attacks by hackers, breaches, employee error or malfeasance, power outages, computer viruses, telecommunication or utility failures, systems failures, natural disasters, or other catastrophic events. Any such events could result in legal claims or proceedings, liability or penalties under privacy laws, disruption in operations, and damage to our reputation, which could materially adversely affect our business. Further, to the extent that any disruption or security breach results in a loss of, or damage to, our data, or an inappropriate disclosure of confidential information, it could cause significant damage to our reputation, affect our relationships with our customers, lead to claims against the Company, and ultimately harm our business, financial condition, and/or results of operations.
15
Our level of indebtedness could adversely affect our financial condition and our ability to operate our business.
As of
December 31, 2017
, we had
$3,312.5 million
of gross outstanding indebtedness, including
$927.8 million
of indebtedness under the term loan (the "Term Loan") provided by the eighth amendment to the credit agreement dated as of May 12, 2011 (as amended, the "Credit Agreement"),
$500.0 million
aggregate principal amount of 4.875% senior notes due 2023 issued under an indenture dated as of April 17, 2013 (the "4.875% Senior Notes"),
$400.0 million
aggregate principal amount of 5.625% senior notes due 2024 issued under an indenture dated as of October 14, 2014 (the "5.625% Senior Notes"),
$700.0 million
aggregate principal amount of 5.0% senior notes due 2025 issued under an indenture dated as of March 26, 2015 (the "5.0% Senior Notes"),
$750.0 million
aggregate principal amount of 6.25% senior notes due 2026 issued under an indenture dated as of November 27, 2015 (the "6.25% Senior Notes", and together with the 4.875% Senior Notes, the 5.625% Senior Notes, and the 5.0% Senior Notes, the "Senior Notes"), and
$34.7 million
of capital lease and other financing obligations. We may incur additional indebtedness in the future. Our substantial indebtedness could have important consequences. For example, it could:
|
•
|
make it more difficult for us to satisfy our debt obligations;
|
|
•
|
restrict us from making strategic acquisitions;
|
|
•
|
limit our flexibility in planning for, or reacting to, changes in our business and future business opportunities, thereby placing us at a competitive disadvantage if our competitors are not as highly-leveraged;
|
|
•
|
increase our vulnerability to general adverse economic and industry conditions; or
|
|
•
|
require us to dedicate a substantial portion of our cash flows from operations to payments on our indebtedness if we do not maintain specified financial ratios or are not able to refinance our indebtedness as it comes due, thereby reducing the availability of our cash flows for other purposes.
|
In addition, the senior secured credit facilities provided for under the Credit Agreement (the "Senior Secured Credit Facilities"), permit us to incur additional indebtedness in the future, including borrowings under the Revolving Credit Facility and
$1.0 billion
in incremental facilities (the "Accordion") under which additional term loans may be issued or the capacity of the Revolving Credit Facility may be increased. As of
December 31, 2017
, we had
$415.3 million
available to us under the Revolving Credit Facility.
If we increase our indebtedness by borrowing under the Revolving Credit Facility or incur other new indebtedness under the Accordion, the risks described above would increase. Refer to Note 8, "Debt," of our audited consolidated financial statements included elsewhere in this Annual Report on Form 10-K for further discussion of our outstanding indebtedness.
Our business may not generate sufficient cash flows from operations, or future borrowings under the Senior Secured Credit Facilities or from other sources may not be available to us in an amount sufficient to enable us to service and/or repay our indebtedness when it becomes due, or to fund our other liquidity needs, including capital expenditures.
We cannot guarantee that we will be able to obtain enough capital to service our debt and fund our planned capital expenditures and business plan. If we complete additional acquisitions, our debt service requirements could also increase. If we cannot service our indebtedness, we may have to take actions such as selling assets, seeking additional equity investments, or reducing or delaying capital expenditures, strategic acquisitions, investments, and alliances, any of which could have a material adverse effect on our operations. Additionally, we may not be able to effect such actions, if necessary, on commercially reasonable terms, or at all.
Our failure to comply with the covenants contained in our credit arrangements, including non-compliance attributable to events beyond our control, could result in an event of default, which could materially and adversely affect our operating results and our financial condition.
The Revolving Credit Facility requires us to maintain a senior secured net leverage ratio not to exceed 5.0:1.0 at the conclusion of certain periods when outstanding loans and letters of credit that are not cash collateralized for the full face amount thereof exceed 10% of the commitments under the Revolving Credit Facility. In addition, Sensata Technologies B.V. and its Restricted Subsidiaries (as defined in the Credit Agreement) are required to satisfy this covenant, on a pro forma basis, in connection with any new borrowings (including any letter of credit issuances) under the Revolving Credit Facility as of the time of such borrowings. Additionally, the Revolving Credit Facility and the indentures governing the Senior Notes require us to comply with various operational and other covenants.
16
If we experienced an event of default under any of our debt instruments that was not cured or waived, the holders of the defaulted debt could cause all amounts outstanding with respect to the debt to become due and payable immediately, which, in turn, would result in cross defaults under our other debt instruments. Our assets and cash flows may not be sufficient to fully repay borrowings if accelerated upon an event of default.
If, when required, we are unable to repay, refinance, or restructure our indebtedness under, or amend the covenants contained in, the Credit Agreement, or if a default otherwise occurs, the lenders under the Senior Secured Credit Facilities could: elect to terminate their commitments thereunder; cease making further loans; declare all borrowings outstanding, together with accrued interest and other fees, to be immediately due and payable; institute foreclosure proceedings against those assets that secure the borrowings under the Senior Secured Credit Facilities; and prevent us from making payments on the Senior Notes. Any such actions could force us into bankruptcy or liquidation, and we might not be able to repay our obligations in such an event.
Risks Related to Prior and Future Acquisitions and Divestitures
Integration of acquired companies, and any future acquisitions, joint ventures, and/or dispositions, may require significant resources and/or result in significant unanticipated losses, costs, or liabilities, and we may not realize all of the anticipated operating synergies and cost savings from acquisitions.
We have grown, and in the future we intend to continue to grow, by making acquisitions or entering into joint ventures or similar arrangements. There can be no assurance that our acquisitions will perform as expected in the future. Any future acquisitions will depend on our ability to identify suitable acquisition candidates, to negotiate acceptable terms for their acquisition, and to finance those acquisitions. We also will face competition for suitable acquisition candidates, which may increase our costs. In addition, acquisitions or investments require significant managerial attention, which may be diverted from our other operations. Furthermore, acquisitions of businesses or facilities entail a number of additional risks, including:
•
problems with effective integration of operations;
•
the inability to maintain key pre-acquisition customer, supplier, and employee relationships;
•
increased operating costs; and
•
exposure to unanticipated liabilities.
Subject to the terms of our indebtedness, we may finance future acquisitions with cash from operations, additional indebtedness, and/or by issuing additional equity securities. In addition, we could face financial risks associated with incurring additional indebtedness such as reducing our liquidity, limiting our access to financing markets, and increasing the amount of service on our debt. The availability of debt to finance future acquisitions may be restricted, and our ability to make future acquisitions may be limited.
There can be no assurance that any anticipated synergies or cost savings generated through acquisitions will be achieved or that they will be achieved in our estimated time frame. We may not be able to successfully integrate and streamline overlapping functions from future acquisitions, and integration may be more costly to accomplish than we expect. In addition, we could encounter difficulties in managing our combined company due to its increased size and scope.
Restructuring our business or divesting some of our businesses or product lines in the future may have a material adverse effect on our results of operations, financial position, and cash flows.
We continue to evaluate the strategic fit of specific businesses and products that may result in additional divestitures. Any divestitures may result in significant write-offs, including those related to goodwill and other intangible assets, which could have a material adverse effect on our results of operations and financial position. Divestitures could involve additional risks, including difficulties in the separation of operations, services, products, and personnel; the diversion of management's attention from other business concerns; the disruption of our business; and the potential loss of key employees. There can be no assurance that we will be successful in addressing these or any other significant risks encountered.
We also may seek to restructure our business in the future by disposing of certain assets or by consolidating operations. There can be no assurance that any restructuring of our business will not adversely affect our financial position, leverage, or results of operations. In addition, any significant restructuring of our business will require significant managerial attention, which may be diverted from our other operations.
17
If the acquisitions of August Cayman Company, Inc. (“Schrader”) and the acquired assets and subsidiaries of Custom Sensors & Technologies Ltd. ("CST") do not achieve their intended results, our business, financial condition, and results of operations could be materially and adversely affected.
The integrations of Schrader and CST into our operations are significant undertakings and continue to require attention from our management team. Actual synergies and the expenses required to realize these synergies could differ materially from our expectations, and we cannot assure you that these synergies will not have other adverse effects on our business. Failure to achieve the anticipated benefits of these acquisitions could result in increased costs or decreased revenue and could materially adversely affect our business, financial condition, and/or results of operations.
Risks Related to Legal and Regulatory Matters
We are subject to risks associated with our non-U.S. operations, including changes in local government regulations and policies, exchange controls, and foreign exchange exposure, which could adversely impact the reported results of operations from our international businesses.
Our subsidiaries located outside of the U.S. generated approximately
65%
of our net revenue in fiscal year
2017
, and we expect sales from non-U.S. markets to continue to represent a significant portion of our total net revenue. International sales and operations are subject to changes in local government regulations and policies, including those related to tariffs and trade barriers, investments, taxation, exchange controls, and repatriation of earnings.
A portion of our net revenue, expenses, receivables, and payables are denominated in currencies other than the U.S. dollar ("USD"). We are, therefore, subject to foreign currency risks and foreign exchange exposure. Changes in the relative values of currencies occur from time to time and could affect our operating results. For financial reporting purposes, we, and each of our subsidiaries, operate under a USD functional currency because of the significant influence of USD on our operations. In certain instances, we enter into transactions that are denominated in a currency other than USD. At the date that such transaction is recognized, each asset, liability, revenue, expense, gain, or loss arising from the transaction is measured and recorded in USD using the exchange rate in effect at that date. At each balance sheet date, recorded monetary balances denominated in a currency other than USD are adjusted to USD using the exchange rate at the balance sheet date, with gains or losses recorded in Other, net in the consolidated statements of operations. During times of a weakening USD, our reported international sales and earnings may increase because the non-U.S. currency will translate into more USD. Conversely, during times of a strengthening USD, our reported international sales and earnings may decrease because the local currency will translate into fewer USD.
There are other risks that are inherent in our non-U.S. operations, including the potential for changes in socio-economic conditions and/or monetary and fiscal policies, intellectual property protection difficulties and disputes, the settlement of legal disputes through certain foreign legal systems, the collection of receivables, exposure to possible expropriation or other government actions, unsettled political conditions, and possible terrorist attacks. These and other factors may have a material adverse effect on our non-U.S. operations and, therefore, on our business and results of operations.
We could be adversely affected by violations of the U.S. Foreign Corrupt Practices Act (the "FCPA"), the United Kingdom's Bribery Act, and similar worldwide anti-bribery laws.
The U.S. FCPA, the United Kingdom's Bribery Act, and similar worldwide anti-bribery laws generally prohibit companies and their intermediaries from making improper payments to government officials for the purpose of obtaining or retaining business. Our policies mandate compliance with these anti-bribery laws. We operate in many parts of the world that have experienced governmental corruption to some degree, and in certain circumstances, strict compliance with anti-bribery laws may conflict with local customs and practices. Despite our training and compliance program, we cannot provide assurance that our internal control policies and procedures will protect us from reckless or criminal acts committed by our employees or agents. Violations of these laws, or allegations of such violations, could disrupt our business and result in a material adverse effect on our results of operations, financial position, and/or cash flows.
Export of our products is subject to various export control regulations and may require a license from either the U.S. Department of State, the U.S. Department of Commerce, or the U.S. Department of the Treasury. Any failure to comply with such regulations could result in governmental enforcement actions, fines, penalties, or other remedies, which could have a material adverse effect on our business, results of operations, and financial condition.
We must comply with the U.S. Export Administration Regulations, International Traffic in Arms Regulation ("ITAR"), and the sanctions, regulations, and embargoes administered by the Office of Foreign Assets Control (“OFAC”). Certain of our products that have military applications are on the munitions list of ITAR and require an individual validated license in order to be exported to certain jurisdictions. These restrictions also apply to technical data for design, development, production, use,
18
repair, and maintenance of such ITAR-controlled products. The export of ITAR-controlled products or technical data requires an individual validated license from the U.S. State Department’s Directorate of Defense Trade Controls. Any delays in obtaining, or our inability to obtain, such licenses could result in a material reduction in revenue.
We export products that are subject to other export regulations. Any changes in these export regulations may further restrict the export of our products, and we may cease to be able to procure export licenses for our products under existing regulations. This area remains fluid in terms of regulatory developments. Should we need an export license under existing regulations, the length of time required by the licensing process can vary, potentially delaying the shipment of products and the recognition of the corresponding revenue. We have no control over the time it takes to process an export license. Any restriction on the export of a significant product line or a significant amount of our products could cause a significant reduction in revenue.
We have discovered in the past, and may discover in the future, deficiencies in our OFAC and ITAR compliance programs. Although we continue to enhance these compliance programs, we cannot assure you that any such enhancements will ensure that we are in compliance with applicable laws and regulations at all times, or that applicable authorities will not raise compliance concerns or perform audits to confirm our compliance with applicable laws and regulations. Any failure by us to comply with applicable laws and regulations could result in governmental enforcement actions, fines or penalties, criminal and/or civil proceedings, or other remedies, any of which could have a material adverse effect on our business, results of operations, and/or financial condition.
Changes in existing environmental and/or safety laws, regulations, and programs could reduce demand for environmental and/or safety-related products, which could cause our revenue to decline.
A significant amount of our business is generated either directly or indirectly as a result of existing laws, regulations, and programs related to environmental protection, fuel economy, energy efficiency, and safety regulation. Accordingly, a relaxation or repeal of these laws and regulations, or changes in governmental policies regarding the funding, implementation, or enforcement of these programs, could result in a decline in demand for environmental and/or safety products, which may have a material adverse effect on our revenue.
Our operations expose us to the risk of material environmental liabilities, litigation, government enforcement actions, and reputational risk.
We are subject to numerous federal, state, and local environmental protection and health and safety laws and regulations in the various countries where we operate and where our products are sold. These laws and regulations govern, among other things:
•
the generation, storage, use, and transportation of hazardous materials;
•
emissions or discharges of substances into the environment;
•
investigation and remediation of hazardous substances or materials at various sites;
•
greenhouse gas emissions;
•
product hazardous material content; and
•
the health and safety of our employees.
We may not have been, or we may not always be, in compliance with all environmental and health and safety laws and regulations. If we violate these laws, we could be fined, criminally charged, or otherwise sanctioned by regulators. In addition, environmental and health and safety laws are becoming more stringent, resulting in increased costs and compliance burdens.
Certain environmental laws assess liability on current or previous owners or operators of real property for the costs of investigation, removal, and remediation of hazardous substances or materials at their properties or properties at which they have disposed of hazardous substances. Liability for investigation, removal, and remediation costs under certain federal and state laws is retroactive, strict, and joint and several. In addition to cleanup actions brought by governmental authorities, private parties could bring personal injury or other claims due to the presence of, or exposure to, hazardous substances.
We cannot provide assurance that our costs of complying with current or future environmental protection and health and safety laws, or our liabilities arising from past or future releases of, or exposures to, hazardous substances will not exceed our estimates or adversely affect our results of operations, financial position, and cash flows, or that we will not be subject to additional environmental claims for personal injury, property damage, and/or cleanup in the future based on our past, present, or future business activities.
19
We may be adversely affected by environmental, safety, and governmental regulations or concerns.
We are subject to the requirements of environmental and occupational safety and health laws and regulations in the U.S. and other countries, as well as product performance standards established by quasi-governmental and industrial standards organizations. We cannot assure you that we have been, and will continue to be, in compliance with all of these requirements on account of circumstances or events that have occurred or exist but that we are unaware of, or that we will not incur material costs or liabilities in connection with these requirements in excess of amounts we have accrued. In addition, these requirements are complex, change frequently, and have tended to become more stringent over time. These requirements may change in the future in a manner that could have a material adverse effect on our business, results of operations, and financial condition. We have made, and may be required in the future to make, capital and other expenditures to comply with environmental requirements. In addition, certain of our subsidiaries are subject to pending litigation raising various environmental and human health and safety claims. We cannot assure you that our costs to defend and/or settle these claims will not be material.
Our products are subject to various requirements related to chemical usage, hazardous material content, and recycling.
The E.U., China, and other jurisdictions in which our products are sold have enacted or are proposing to enact laws addressing environmental and other impacts from product disposal, use of hazardous materials in products, use of chemicals in manufacturing, recycling of products at the end of their useful life, and other related matters. These laws include but are not limited to the E.U. Restriction of Hazardous Substances ("RoHS"), End of Life Vehicle ("ELV"), and Waste Electrical and Electronic Equipment Directives; the E.U. Registration, Evaluation, Authorization, and Restriction of Chemicals ("REACH") regulation; and the China law on Management Methods for Controlling Pollution by Electronic Information Products. These laws prohibit the use of certain substances in the manufacture of our products and directly and indirectly impose a variety of requirements for modification of manufacturing processes, registration, chemical testing, labeling, and other matters. These laws continue to proliferate and expand in these and other jurisdictions to address other materials and other aspects of our product manufacturing and sale. These laws could make the manufacture or sale of our products more expensive or impossible, could limit our ability to sell our products in certain jurisdictions, and could result in liability for product recalls, penalties, or other claims.
Our ability to compete effectively depends, in part, on our ability to maintain the proprietary nature of our products and technology.
The electronics industry is characterized by litigation regarding patent and other intellectual property rights. Within this industry, companies have become more aggressive in asserting and defending patent claims against competitors. There can be no assurance that we will not be subject to future litigation alleging infringement or invalidity of certain of our intellectual property rights, or that we will not have to pursue litigation to protect our property rights. Depending on the importance of the technology, product, patent, trademark, or trade secret in question, an unfavorable outcome regarding one of these matters may have a material adverse effect on our results of operations, financial position, and/or cash flows.
We may be subject to claims that our products or processes infringe on the intellectual property rights of others, which may cause us to pay unexpected litigation costs or damages, modify our products or processes, or prevent us from selling our products.
Third parties may claim that our processes and products infringe on their intellectual property rights. Whether or not these claims have merit, we may be subject to costly and time consuming legal proceedings, and this could divert management’s attention from operating our business. If these claims are successfully asserted against us, we could be required to pay substantial damages, make future royalty payments, and/or could be prevented from selling some or all of our products. We also may be obligated to indemnify our business partners or customers in any such litigation. Furthermore, we may need to obtain licenses from these third parties or substantially re-engineer or rename our products in order to avoid infringement. In addition, we might not be able to obtain the necessary licenses on acceptable terms, or at all, or be able to re-engineer or rename our products successfully. If we are prevented from selling some or all of our products, our sales could be materially adversely affected.
We may incur material losses and costs as a result of product liability, warranty, and recall claims that may be brought against us.
We have been, and may continue to be, exposed to product liability and warranty claims in the event that our products actually or allegedly fail to perform as expected, or the use of our products results, or is alleged to result, in death, bodily injury, and/or property damage. Accordingly, we could experience material warranty or product liability losses in the future and incur significant costs to defend these claims. In addition, if any of our products are, or are alleged to be, defective, we may be required to participate in a recall of the underlying end product, particularly if the defect or the alleged defect relates to product
20
safety. Depending on the terms under which we supply products, an OEM may hold us responsible for some or all of the repair or replacement costs of these products under warranty when the product supplied did not perform as represented. In addition, a product recall could generate substantial negative publicity about our business and interfere with our manufacturing plans and product delivery obligations as we seek to repair affected products. Our costs associated with product liability, warranty, and recall claims could be material.
We are a defendant to a variety of litigation in the course of our business that could cause a material adverse effect on our results of operations, financial position, and/or cash flows.
In the normal course of business, we are, from time to time, a defendant in litigation, including litigation alleging the infringement of intellectual property rights, anti-competitive behavior, product liability, breach of contract, and employment-related claims. In certain circumstances, patent infringement and antitrust laws permit successful plaintiffs to recover treble damages. The defense of these lawsuits may divert our management's attention, and we may incur significant expenses in defending these lawsuits. In addition, we may be required to pay damage awards or settlements, or become subject to injunctions or other equitable remedies, that could cause a material adverse effect on our results of operations, financial position, and/or cash flows.
We have recorded a significant amount of goodwill and other identifiable intangible assets, and we may be required to recognize goodwill or intangible asset impairments, which would reduce our earnings.
We have recorded a significant amount of goodwill and other identifiable intangible assets. Goodwill and other intangible assets, net totaled approximately
$3.9 billion
as of
December 31, 2017
, or
59%
of our total assets. Goodwill, which represents the future economic benefits arising from other assets acquired in a business combination that are not individually identified and separately recognized, was approximately
$3.0 billion
as of
December 31, 2017
, or
45%
of our total assets. Goodwill and other identifiable intangible assets were recognized at fair value as of the corresponding acquisition date. Impairment of goodwill and other identifiable intangible assets may result from, among other things, deterioration in our performance, adverse market conditions, adverse changes in laws or regulations, significant unexpected or planned changes in the use of assets, and a variety of other factors. The amount of any quantified impairment must be expensed immediately as a charge that is included in operating income, which may impact our ability to raise capital. Although no impairment charges have been recorded during the past three fiscal years, should certain assumptions used in the development of the fair value of our reporting units change, we may be required to recognize goodwill or other intangible asset impairments. Refer to Note 5, "Goodwill and Other Intangible Assets," of our audited consolidated financial statements included elsewhere in this Annual Report on Form 10-K for more details on our goodwill and other identifiable intangible assets. Refer to
Critical Accounting Policies and Estimates
, included in Item 7, "Management's Discussion and Analysis of Financial Condition and Results of Operations," included elsewhere in this Annual Report on Form 10-K for further discussion of the assumptions used in the development of the fair value of our reporting units.
New legislation on tax reform could have a material impact on the Company's financial position and/or results of operations.
On December 22, 2017, President Donald Trump signed into U.S. law the Tax Cuts and Jobs Act of 2017 (“Tax Reform”). The exact ramifications of the legislation is subject to interpretation and could have a material impact on our financial position and/or results of operations. We continue to analyze the full impact of enacted legislation and additional guidance as provided. Refer to Note 9, "Income Taxes," of our audited consolidated financial statements included elsewhere in this Annual Report on Form 10-K for further discussion of the Tax Reform.
Taxing authorities could challenge our historical and future tax positions or our allocation of taxable income among our subsidiaries, or tax laws to which we are subject could change in a manner adverse to us.
Sensata Technologies Holding N.V. is a Dutch public limited liability company that operates through various subsidiaries in a number of countries throughout the world. Consequently, we are subject to tax laws, treaties, and regulations in the countries in which we operate, and these laws and treaties are subject to interpretation. We have taken, and will continue to take, tax positions based on our interpretation of such tax laws. There can be no assurance that a taxing authority will not have a different interpretation of applicable law and assess us with additional taxes. Should we be assessed with additional taxes, this may result in a material adverse effect on our results of operations, financial condition, and/or cash flows.
We conduct operations through manufacturing and distribution subsidiaries in numerous tax jurisdictions around the world. Our transfer pricing arrangements are not generally binding on applicable tax authorities. Our transfer pricing methodology is based on economic studies. The prices charged for products, services, and financing among our companies, or
21
the royalty rates and other amounts paid for intellectual property rights, could be challenged by the various tax authorities, resulting in additional tax liabilities, interest, and penalties.
Tax laws are subject to change in the various countries in which we operate. Such future changes could be unfavorable and result in an increased tax burden to us. Refer to Note 9, "Income Taxes," of our audited consolidated financial statements included elsewhere in this Annual Report on Form 10-K for further discussion related to income taxes.
Changes to current policies by the U.S. government could adversely affect our business.
Possible changes to current policies by the U.S. government could affect our business, including potentially through increased import tariffs and other influences on U.S. trade relations with other countries (e.g., Mexico and China). The imposition of tariffs or other trade barriers could increase our costs in certain markets, and may cause our customers to find alternative sourcing. In addition, other countries may change their own policies on business and foreign investment in companies in their respective countries. Additionally, it is possible that U.S. policy changes and uncertainty about such changes could increase market volatility and currency exchange rate fluctuations. Market volatility and currency exchange rate fluctuations could impact our results of operations and/or financial condition.
The vote by the United Kingdom to leave the European Union could adversely affect us.
The U.K. held a referendum on June 23, 2016 on its membership in the E.U., in which a majority of voters in the U.K. voted to exit the E.U. (commonly referred to as "Brexit"). The U.K.'s departure from the E.U. is currently scheduled to take place on Friday, March 29, 2019. The U.K. and the E.U. continue to have negotiations regarding various transition issues and are in the process of creating a plan for a two-year transition period following the scheduled exit. Brexit could lead to legal uncertainty and potentially divergent national laws and regulations as the U.K. determines which E.U. laws to replace or replicate. The referendum also has given rise to calls for the governments of other E.U. member states to consider withdrawal from the E.U.
The effects of Brexit will depend on the negotiations between the U.K. and the E.U. and any agreements the U.K. makes to retain access to E.U. markets either during a transitional period or more permanently. Brexit could adversely affect European or worldwide economic or market conditions and contribute to instability in global financial markets. We have substantial sales and operations in both the E.U. and the U.K. Any of these effects of Brexit, and others we cannot anticipate, could adversely affect our business, business opportunities, results of operations, and/or financial condition.
Risks Related to our Domicile in the Netherlands
We are a Dutch public limited liability company, and it may be difficult for shareholders to obtain or enforce judgments against us in the U.S.
Sensata Technologies Holding, N.V. is incorporated under the laws of the Netherlands, and a substantial portion of our assets are located outside of the U.S. As a result, although we have appointed an agent for service of process in the U.S., it may be difficult or impossible for U.S. investors to effect service of process upon us within the U.S. or to realize any judgment against us in the U.S., including for civil liabilities under U.S. securities laws. Therefore, any judgment obtained against us in any U.S. federal or state court may have to be enforced in the courts of the Netherlands, or such other foreign jurisdiction, as applicable. Because there is no treaty or other applicable convention between the U.S. and the Netherlands with respect to the recognition and enforcement of legal judgments regarding civil or commercial matters, a judgment rendered by any U.S. federal or state court will not be enforced by the courts of the Netherlands unless the underlying claim is relitigated before a Dutch court. Under current practice, however, a Dutch court will generally grant the same judgment without a review of the merits of the underlying claim (i) if that judgment resulted from legal proceedings compatible with Dutch notions of due process, (ii) if that judgment does not contravene public policy of the Netherlands, and (iii) if the jurisdiction of the U.S. federal or state court has been based on internationally accepted principles of private international law.
To date, we are aware of only limited published case law in which Dutch courts have considered whether such a judgment rendered by a U.S. federal or state court would be enforceable in the Netherlands. In all of these cases, Dutch lower courts applied the aforementioned criteria with respect to the U.S. judgment. If all three criteria noted above were satisfied, the Dutch courts granted the same judgment without a review of the merits of the underlying claim.
Investors should not assume, however, that the courts of the Netherlands, or such other foreign jurisdiction, would enforce judgments of U.S. courts obtained against us predicated upon the civil liability provisions of the U.S. securities laws, or that such courts would enforce, in original actions, liabilities against us predicated solely upon such laws.
22
Our shareholders’ rights and responsibilities are governed by Dutch law and differ in some respects from the rights and responsibilities of shareholders under U.S. law, and shareholder rights under Dutch law may not be as clearly established as shareholder rights are established under the laws of some U.S. jurisdictions.
Our corporate affairs are governed by our articles of association and by the laws governing companies incorporated in the Netherlands. The rights of our shareholders and the responsibilities of members of our Board of Directors under Dutch law may not be as clearly established as under the laws of some U.S. jurisdictions. In the performance of its duties, our Board of Directors is required by Dutch law to consider the interests of our company and our business, including our shareholders, our employees, and other stakeholders, in all cases with reasonableness and fairness. It is possible that some of these parties will have interests that are different from, or in addition to, the interests of our shareholders.
In addition, the rights of holders of ordinary shares, and many of the rights of shareholders as they relate to, for example, the exercise of shareholder rights, are governed by Dutch law and our articles of association and differ from the rights of shareholders under U.S. law. For example, Dutch law does not grant appraisal rights to a company’s shareholders who wish to challenge the consideration to be paid upon a merger or consolidation of the company.
The provisions of Dutch corporate law and our articles of association have the effect of concentrating control over certain corporate decisions and transactions in the hands of our Board of Directors. As a result, holders of our shares may have more difficulty in protecting their interests in the face of actions by members of our Board of Directors than if we were incorporated in the U.S.
|
ITEM 1B.
|
UNRESOLVED STAFF COMMENTS
|
None.
23
|
ITEM 2.
|
PROPERTIES
|
As of
December 31, 2017
, we occupied
19
principal manufacturing facilities and business centers totaling approximately
3,577 thousand
square feet, with the majority devoted to research, development, engineering, manufacturing, and assembly. We lease approximately
433 thousand
square feet for our United States headquarters in Attleboro, Massachusetts. Of our principal facilities, approximately
1,483 thousand
square feet are owned and approximately
2,094 thousand
square feet are leased. A significant portion of our owned properties and equipment is subject to a lien under the Senior Secured Credit Facilities. Refer to Note 8, "Debt," of our audited consolidated financial statements included elsewhere in this Annual Report on Form 10-K for additional information on the Senior Secured Credit Facilities. We consider our manufacturing facilities sufficient to meet our current operational requirements. The table below lists the location of our principal executive and operating facilities:
|
Operating Segment
|
||||||||||
|
Country
|
Location
|
Performance Sensing
|
Sensing Solutions
|
Owned or Leased
|
Approximate Square Footage
(in thousands)
|
|||||
|
Bulgaria
|
Botevgrad
|
X
|
Owned
|
137
|
||||||
|
Bulgaria
|
Plovdiv
|
X
|
Owned
|
125
|
||||||
|
Bulgaria
|
Sofia
|
X
|
Leased
|
108
|
||||||
|
China
|
Baoying
|
X
|
Owned
|
296
|
||||||
|
China
|
Baoying
|
X
|
X
|
Leased
|
385
|
|||||
|
China
|
Changzhou
|
X
|
X
|
Leased
|
488
|
|||||
|
France
|
Pontarlier
|
X
|
Owned
|
178
|
||||||
|
Germany
|
Berlin
|
X
|
Leased
|
33
|
||||||
|
Malaysia
|
Subang Jaya
|
X
|
Owned
|
123
|
||||||
|
Mexico
|
Aguascalientes
|
X
|
X
|
Owned
|
411
|
|||||
|
Mexico
|
Tijuana
(1)
|
X
|
X
|
Leased
|
287
|
|||||
|
Netherlands
|
Hengelo
|
X
|
X
|
Leased
|
94
|
|||||
|
United Kingdom
|
Antrim
|
X
|
Leased
|
117
|
||||||
|
United Kingdom
|
Carrickfergus
|
X
|
Owned
|
63
|
||||||
|
United Kingdom
|
Swindon
|
X
|
Leased
|
34
|
||||||
|
United States
|
Attleboro, MA
|
X
|
X
|
Leased
|
433
|
|||||
|
United States
|
Altavista, VA
|
X
|
Owned
|
150
|
||||||
|
United States
|
Thousand Oaks, CA
|
X
|
X
|
Leased
|
115
|
|||||
|
(1)
|
This location includes two principal manufacturing facilities.
|
Leases covering our currently occupied principal leased facilities expire at varying dates within the next
19
years. We do not anticipate difficulty in retaining occupancy through lease renewals, month-to-month occupancy, or by replacing the leased facilities with equivalent facilities. An increase in demand for our products may require us to expand our production capacity, which could require us to identify and acquire or lease additional manufacturing facilities. We believe that suitable additional or substitute facilities will be available as required; however, if we are unable to acquire, integrate, and move into production the facilities, equipment, and personnel necessary to meet such an increase in demand, our customer relationships, results of operations, and/or financial condition may suffer materially.
24
|
ITEM 3.
|
LEGAL PROCEEDINGS
|
We are regularly involved in a number of claims and litigation matters in the ordinary course of business. Most of our litigation matters are third-party claims related to patent infringement allegations or for property damage allegedly caused by our products, but some involve allegations of personal injury or wrongful death. From time to time, we are also involved in disagreements with vendors and customers. Although it is not feasible to predict the outcome of these matters, based upon our experience and current information known to us, we do not expect the outcome of these matters, either individually or in the aggregate, to have a material adverse effect on our result of operations, financial position, or cash flows.
The Internal Revenue Code requires that companies disclose in their Annual Report on Form 10-K whether they have been required to pay penalties to the Internal Revenue Service (“IRS”) for certain transactions that have been identified by the IRS as abusive or that have a significant tax avoidance purpose. We have not been required to pay any such penalties.
|
ITEM 4.
|
MINE SAFETY DISCLOSURES
|
Not applicable.
25
|
ITEM 5.
|
MARKET FOR REGISTRANT’S COMMON EQUITY, RELATED STOCKHOLDER MATTERS, AND ISSUER PURCHASES OF EQUITY SECURITIES
|
Market Information
Our ordinary shares trade on the New York Stock Exchange (“NYSE”) under the symbol “ST.” The following table sets forth the high and low intraday sales prices per share of our ordinary shares, as reported by the NYSE, for the periods indicated:
|
|
Price Range
|
||||||
|
|
High
|
Low
|
|||||
|
2016
|
|||||||
|
Quarter ended March 31, 2016
|
$
|
45.60
|
|
$
|
29.92
|
|
|
|
Quarter ended June 30, 2016
|
$
|
39.89
|
|
$
|
32.07
|
|
|
|
Quarter ended September 30, 2016
|
$
|
40.69
|
|
$
|
33.81
|
|
|
|
Quarter ended December 31, 2016
|
$
|
41.43
|
|
$
|
35.10
|
|
|
|
2017
|
|||||||
|
Quarter ended March 31, 2017
|
$
|
45.30
|
|
$
|
39.19
|
|
|
|
Quarter ended June 30, 2017
|
$
|
43.93
|
|
$
|
38.71
|
|
|
|
Quarter ended September 30, 2017
|
$
|
48.52
|
|
$
|
42.80
|
|
|
|
Quarter ended December 31, 2017
|
$
|
53.30
|
|
$
|
46.90
|
|
|
Performance Graph
The following graph compares the total shareholder return of our ordinary shares since December 31, 2012, to the total shareholder return since that date on the Standard & Poor’s ("S&P") 500 Stock Index and the S&P 500 Industrial Index. The graph assumes that the value of the investment in our ordinary shares and each index was $100.00 on December 31, 2012.
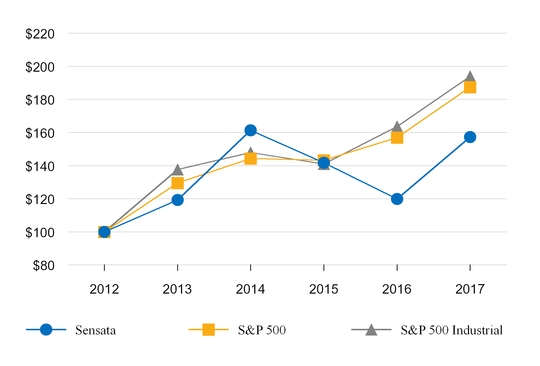
26
|
Total Shareholder Return of $100.00 Investment from December 31, 2012
|
||||||||||||||||||||||||
|
|
12/31/2012
|
12/31/2013
|
12/31/2014
|
12/31/2015
|
12/31/2016
|
12/31/2017
|
||||||||||||||||||
|
Sensata
|
$
|
100.00
|
|
$
|
119.37
|
|
$
|
161.36
|
|
$
|
141.81
|
|
$
|
119.92
|
|
$
|
157.36
|
|
||||||
|
S&P 500
|
$
|
100.00
|
|
$
|
129.60
|
|
$
|
144.36
|
|
$
|
143.31
|
|
$
|
156.98
|
|
$
|
187.47
|
|
||||||
|
S&P 500 Industrial
|
$
|
100.00
|
|
$
|
137.63
|
|
$
|
147.98
|
|
$
|
141.00
|
|
$
|
163.67
|
|
$
|
194.01
|
|
||||||
The information in the graph and table above is not “soliciting material,” is not deemed “filed” with the United States ("U.S.") Securities and Exchange Commission, and is not to be incorporated by reference in any of our filings under the Securities Act of 1933, as amended, or the Securities Exchange Act of 1934, as amended, whether made before or after the date of this Annual Report on Form 10-K, except to the extent that we specifically incorporate such information by reference. The total shareholder return shown on the graph represents past performance and should not be considered an indication of future price performance.
Stockholders
As of
January 12, 2018
, there was one primary holder of record of our ordinary shares, Cede & Co. (which acts as nominee shareholder for the Depository Trust Company), and approximately 43,900 beneficial owners, including beneficial owners whose shares are held in "street name" by banks, brokers, and other financial institutions.
Dividends
We have never declared or paid any dividends on our ordinary shares, and we currently do not plan to declare any such dividends in the foreseeable future. Because we are a holding company, our ability to pay cash dividends on our ordinary shares may be limited by restrictions on our ability to obtain sufficient funds through dividends from our subsidiaries, including restrictions under the terms of the agreements governing our indebtedness. In that regard, our indirect, wholly-owned subsidiary, Sensata Technologies B.V. ("STBV"), is limited in its ability to pay dividends or otherwise make distributions to its immediate parent company and, ultimately, to us. Refer to Note 8, "Debt," of our audited consolidated financial statements included elsewhere in this Annual Report on Form 10-K for additional information on our dividend restrictions.
In addition, under Dutch law, STBV, Sensata Technologies Intermediate Holding B.V., and certain of our other subsidiaries that are Dutch private limited liability companies may only pay dividends or make other distributions to the extent that the shareholders' equity of such subsidiary exceeds the reserves required to be maintained by law or under its articles of association.
Under Dutch law, we may only pay dividends out of profits as shown in our adopted annual accounts prepared in accordance with International Financial Reporting Standards. Should we wish to do so, we would only be able to declare and pay dividends to the extent our equity exceeds the sum of the paid and called up portion of our ordinary share capital and the reserves that must be maintained in accordance with the provisions of Dutch law and our articles of association. Subject to these limitations, the payment of cash dividends in the future, if any, will depend upon such factors as earnings levels, capital requirements, contractual restrictions, our overall financial condition, and any other factors deemed relevant by our shareholders and Board of Directors.
U.S. holders of our ordinary shares are generally not subject to any Dutch taxes on income or capital gains derived from ownership or disposal of such ordinary shares. However, we are generally required to withhold Dutch income tax (at a rate of 15%) on actual or deemed dividend distributions. There is no reciprocal tax treaty between the U.S. and the Netherlands regarding withholding.
27
Issuer Purchases of Equity Securities
|
Period
|
Total
Number
of Shares Purchased |
Weighted- Average
Price
Paid per Share |
Total Number of
Shares Purchased as Part of Publicly Announced Plan or Programs |
Approximate Dollar Value of Shares that
May Yet Be Purchased Under the Plan or Programs (in millions) |
||||||||||
|
October 1 through October 31, 2017
|
—
|
|
$
|
—
|
|
—
|
|
$
|
250.0
|
|
||||
|
November 1 through November 30, 2017
|
—
|
|
$
|
—
|
|
—
|
|
$
|
250.0
|
|
||||
|
December 1 through December 31, 2017
|
1,827
|
|
(1)
|
$
|
51.28
|
|
—
|
|
$
|
250.0
|
|
|||
|
Total
|
1,827
|
|
$
|
51.28
|
|
—
|
|
$
|
250.0
|
|
||||
__________________
(1)
Pursuant to the “withhold to cover” method for collecting and paying withholding taxes for our employees upon the vesting of restricted securities, we withheld from certain employees the ordinary shares noted in the table above to cover such tax withholdings. These transactions took place outside of a publicly-announced repurchase plan. The weighted-average price per ordinary share listed in the above table is the weighted-average of the fair market prices at which we calculated the number of ordinary shares withheld to cover tax for the employees.
28
|
ITEM 6.
|
SELECTED FINANCIAL DATA
|
We have derived the selected consolidated statement of operations and other financial data for the years ended
December 31, 2017
,
2016
, and
2015
, and the selected consolidated balance sheet data as of
December 31, 2017
and
2016
, from our audited consolidated financial statements included elsewhere in this Annual Report on Form 10-K. We have derived the selected consolidated statement of operations and other financial data for the years ended
December 31, 2014
and
2013
, and the selected consolidated balance sheet data as of
December 31, 2015
,
2014
, and
2013
, from audited consolidated financial statements not included in this Annual Report on Form 10-K.
You should read the following information in conjunction with Item 7, “Management’s Discussion and Analysis of Financial Condition and Results of Operations,” and our audited consolidated financial statements and accompanying notes thereto included elsewhere in this Annual Report on Form 10-K. Our historical results are not necessarily indicative of the results to be expected in any future period.
|
|
Sensata Technologies Holding N.V. (consolidated)
|
||||||||||||||||||
|
|
For the year ended December 31,
|
||||||||||||||||||
|
(Amounts in thousands, except per share data)
|
2017
|
2016
|
2015
|
2014
|
2013
|
||||||||||||||
|
Statement of Operations Data
(a)
:
|
|||||||||||||||||||
|
Net revenue
|
$
|
3,306,733
|
|
$
|
3,202,288
|
|
$
|
2,974,961
|
|
$
|
2,409,803
|
|
$
|
1,980,732
|
|
||||
|
Operating costs and expenses:
|
|||||||||||||||||||
|
Cost of revenue
|
2,141,308
|
|
2,084,261
|
|
1,977,799
|
|
1,567,334
|
|
1,256,249
|
|
|||||||||
|
Research and development
|
130,204
|
|
126,665
|
|
123,666
|
|
82,178
|
|
57,950
|
|
|||||||||
|
Selling, general and administrative
|
302,811
|
|
293,587
|
|
271,361
|
|
220,105
|
|
163,145
|
|
|||||||||
|
Amortization of intangible assets
|
161,050
|
|
201,498
|
|
186,632
|
|
146,704
|
|
134,387
|
|
|||||||||
|
Restructuring and special charges
|
18,975
|
|
4,113
|
|
21,919
|
|
21,893
|
|
5,520
|
|
|||||||||
|
Total operating costs and expenses
|
2,754,348
|
|
2,710,124
|
|
2,581,377
|
|
2,038,214
|
|
1,617,251
|
|
|||||||||
|
Profit from operations
|
552,385
|
|
492,164
|
|
393,584
|
|
371,589
|
|
363,481
|
|
|||||||||
|
Interest expense, net
|
(159,761
|
)
|
(165,818
|
)
|
(137,626
|
)
|
(106,104
|
)
|
(93,915
|
)
|
|||||||||
|
Other, net
(b)
|
9,817
|
|
(4,901
|
)
|
(50,329
|
)
|
(12,059
|
)
|
(35,629
|
)
|
|||||||||
|
Income before taxes
|
402,441
|
|
321,445
|
|
205,629
|
|
253,426
|
|
233,937
|
|
|||||||||
|
(Benefit from)/provision for income taxes
(c)
|
(5,916
|
)
|
59,011
|
|
(142,067
|
)
|
(30,323
|
)
|
45,812
|
|
|||||||||
|
Net income
|
$
|
408,357
|
|
$
|
262,434
|
|
$
|
347,696
|
|
$
|
283,749
|
|
$
|
188,125
|
|
||||
|
Basic net income per share
|
$
|
2.39
|
|
$
|
1.54
|
|
$
|
2.05
|
|
$
|
1.67
|
|
$
|
1.07
|
|
||||
|
Diluted net income per share
|
$
|
2.37
|
|
$
|
1.53
|
|
$
|
2.03
|
|
$
|
1.65
|
|
$
|
1.05
|
|
||||
|
Weighted-average ordinary shares outstanding—basic
|
171,165
|
|
170,709
|
|
169,977
|
|
170,113
|
|
176,091
|
|
|||||||||
|
Weighted-average ordinary shares outstanding—diluted
|
172,169
|
|
171,460
|
|
171,513
|
|
172,217
|
|
179,024
|
|
|||||||||
|
Other Financial Data
(a)
:
|
|||||||||||||||||||
|
Net cash provided by/(used in):
|
|||||||||||||||||||
|
Operating activities
|
$
|
557,646
|
|
$
|
521,525
|
|
$
|
533,131
|
|
$
|
382,568
|
|
$
|
395,838
|
|
||||
|
Investing activities
|
(140,722
|
)
|
(174,778
|
)
|
(1,166,369
|
)
|
(1,430,065
|
)
|
(87,650
|
)
|
|||||||||
|
Financing activities
|
(15,263
|
)
|
(337,582
|
)
|
764,172
|
|
940,930
|
|
(403,831
|
)
|
|||||||||
|
Capital expenditures
|
(144,584
|
)
|
(130,217
|
)
|
(177,196
|
)
|
(144,211
|
)
|
(82,784
|
)
|
|||||||||
29
|
2017
|
2016
|
2015
|
2014
|
2013
|
|||||||||||||||
|
Balance Sheet Data (as of December 31)
(a)
:
|
|||||||||||||||||||
|
Cash and cash equivalents
|
$
|
753,089
|
|
$
|
351,428
|
|
$
|
342,263
|
|
$
|
211,329
|
|
$
|
317,896
|
|
||||
|
Working capital
(d)
|
1,218,796
|
|
758,189
|
|
412,748
|
|
441,258
|
|
537,139
|
|
|||||||||
|
Total assets
|
6,641,525
|
|
6,240,976
|
|
6,298,910
|
|
5,087,507
|
|
3,479,692
|
|
|||||||||
|
Total debt, net including capital lease and other financing obligations
|
3,270,269
|
|
3,273,594
|
|
3,600,991
|
|
2,812,734
|
|
1,704,834
|
|
|||||||||
|
Total shareholders’ equity
|
2,345,626
|
|
1,942,007
|
|
1,668,576
|
|
1,302,892
|
|
1,141,588
|
|
|||||||||
__________________
|
(a)
|
Amounts shown reflect the acquisitions of Wabash Worldwide Holding Corp. ("Wabash"), Magnum Energy Incorporated ("Magnum"), CoActive US Holdings, Inc. ("DeltaTech Controls"), and August Cayman Company, Inc. ("Schrader") in 2014 and certain assets and subsidiaries of Custom Sensors & Technologies Ltd. ("CST") in 2015.
|
|
(b)
|
Other, net for the years ended
December 31, 2017
,
2016
,
2015
,
2014
, and
2013
primarily includes: (losses) recognized on debt financing transactions of
$(2.7) million
,
$0.0 million
,
$(25.5) million
,
$(1.9) million
, and
$(9.0) million
, respectively; gains/(losses) on commodity forward contracts of
$10.0 million
,
$7.4 million
,
$(18.5) million
,
$(9.0) million
, and
$(23.2) million
, respectively; and gains/(losses) related to foreign currency exchange rates (including gains and losses related to currency remeasurement of net monetary assets and gains and losses on foreign currency forward contracts) of
$2.4 million
,
$(12.5) million
,
$(6.0) million
,
$(1.4) million
, and
$(2.4) million
, respectively. Refer to Note 2, "Significant Accounting Policies," of our audited consolidated financial statements included elsewhere in this Annual Report on Form 10-K for further details of amounts included in Other, net.
|
|
(c)
|
For the year ended December 31, 2017, the benefit from income taxes includes a net benefit of approximately
$73.7 million
related to the enactment of U.S. tax legislation in the fourth quarter of 2017. For the year ended December 31, 2015, the benefit from income taxes includes a net benefit of approximately
$180.0 million
, primarily related to the release of a portion of our United States ("U.S.") valuation allowance in connection with the acquisition of CST. For the year ended December 31, 2014, the benefit from income taxes includes a net benefit of approximately
$71.1 million
related to the release of a portion of our U.S. valuation allowance in connection with certain 2014 acquisitions. Refer to Note 9, "Income Taxes," of our audited consolidated financial statements included elsewhere in this Annual Report on Form 10-K for additional information.
|
|
(d)
|
We define working capital as current assets less current liabilities. Working capital amounts for prior years have not been recast to include assets designated as held for sale in any year.
|
30
|
ITEM 7.
|
MANAGEMENT’S DISCUSSION AND ANALYSIS OF FINANCIAL CONDITION AND RESULTS OF OPERATIONS
|
The following discussion and analysis is intended to help the reader understand our business, financial condition, results of operations, liquidity, and capital resources. You should read the following discussion in conjunction with Item 1, "Business," Item 6, “Selected Financial Data,” and our audited consolidated financial statements and the accompanying notes thereto included elsewhere in this Annual Report on Form 10-K.
The statements in this discussion regarding industry outlook, our expectations regarding our future performance, liquidity and capital resources, and other non-historical statements are forward-looking statements. These forward-looking statements are subject to numerous risks and uncertainties, including, but not limited to, the risks and uncertainties described in Item 1A, “Risk Factors,” included elsewhere in this Annual Report on Form 10-K. Our actual results may differ materially from those contained in or implied by any forward-looking statements.
Overview
Sensata Technologies Holding N.V. ("Sensata N.V.") and its wholly-owned subsidiaries, collectively referred to as the "Company," "Sensata," "we," "our," and "us," is a global industrial technology company engaged in the development, manufacture, and sale of sensors and controls. We can trace our origins back to entities that have been engaged in the sensors and controls business since 1916.
We conduct our operations through subsidiary companies that operate business and product development centers primarily in the United States (the "U.S."), the Netherlands, Belgium, Bulgaria, China, Germany, Japan, South Korea, and the United Kingdom (the "U.K."); and manufacturing operations primarily in China, Malaysia, Mexico, Bulgaria, France, Germany, the U.K., and the U.S. We organize our operations into two businesses, Performance Sensing and Sensing Solutions.
We generated
41.3%
,
27.3%
, and
31.4%
of our net revenue in the Americas, Asia, and Europe, respectively, for the year ended
December 31, 2017
. Our largest customer accounted for approximately
8%
of our net revenue for the year ended
December 31, 2017
. Our net revenue for the year ended
December 31, 2017
was derived from the following end markets:
24.0%
from European automotive,
18.6%
from North American automotive,
19.1%
from Asia and rest of world automotive,
14.3%
from heavy vehicle off-road ("HVOR"),
9.4%
from industrial,
6.3%
from appliance and heating, ventilation, and air conditioning ("HVAC"),
4.6%
from aerospace, and
3.7%
from all other end markets. Within many of our end markets, we are a significant supplier to multiple original equipment manufacturers, reducing our exposure to global fluctuations in market share within individual end markets.
We produce a wide range of sensors and controls for applications such as pressure, temperature, and speed and position sensors in automotive systems, thermal circuit breakers in aircraft, and bimetal current and temperature control devices in electric motors. We compete in growing global market segments driven by demand for products that are safe, efficient, environmentally friendly, and also influenced by the emerging trends in electrification and autonomy. We have a long-standing position in emerging markets, including a presence in China for more than 20 years.
Refer to Item 1, "Business," included elsewhere in this Annual Report on Form 10-K for a more detailed discussion of our business, including our Performance Sensing and Sensing Solutions segments, and information about our acquisition history.
31
Selected Segment Information
We manage our Performance Sensing and Sensing Solutions businesses separately and report their results of operations as two segments. Set forth below is selected information for each of these segments for each of the periods presented. Amounts in the table below have been calculated based on unrounded numbers. Accordingly, certain amounts may not add due to the effect of rounding.
The following table presents net revenue by segment and as a percentage of total net revenue for the identified periods:
|
|
For the year ended December 31,
|
|||||||||||||||||||
|
|
2017
|
|
2016
|
|
2015
|
|||||||||||||||
|
(Dollars in millions)
|
Amount
|
Percent of
Net Revenue |
Amount
|
Percent of
Net Revenue |
Amount
|
Percent of
Net Revenue |
||||||||||||||
|
Net revenue
|
||||||||||||||||||||
|
Performance Sensing
|
$
|
2,460.6
|
|
74.4
|
%
|
$
|
2,385.4
|
|
74.5
|
%
|
$
|
2,346.2
|
|
78.9
|
%
|
|||||
|
Sensing Solutions
|
846.1
|
|
25.6
|
|
816.9
|
|
25.5
|
|
628.7
|
|
21.1
|
|
||||||||
|
Total
|
$
|
3,306.7
|
|
100.0
|
%
|
$
|
3,202.3
|
|
100.0
|
%
|
$
|
2,975.0
|
|
100.0
|
%
|
|||||
The following table presents segment profit and segment profit as a percentage of segment net revenue for the identified periods:
|
|
For the year ended December 31,
|
|||||||||||||||||||
|
|
2017
|
2016
|
2015
|
|||||||||||||||||
|
(Dollars in millions)
|
Amount
|
Percent of
Segment Net Revenue |
Amount
|
Percent of
Segment Net Revenue |
Amount
|
Percent of
Segment Net Revenue |
||||||||||||||
|
Segment profit
|
||||||||||||||||||||
|
Performance Sensing
|
$
|
664.2
|
|
27.0
|
%
|
$
|
615.5
|
|
25.8
|
%
|
$
|
598.5
|
|
25.5
|
%
|
|||||
|
Sensing Solutions
|
277.5
|
|
32.8
|
%
|
261.9
|
|
32.1
|
%
|
199.7
|
|
31.8
|
%
|
||||||||
|
Total
|
$
|
941.6
|
|
$
|
877.4
|
|
$
|
798.3
|
|
|||||||||||
For a reconciliation of total segment profit to profit from operations, refer to Note 18, "Segment Reporting," of our audited consolidated financial statements included elsewhere in this Annual Report on Form 10-K.
Factors Affecting Our Operating Results
The following discussion describes components of the consolidated statements of operations, as well as factors that impact those components. Refer to Note 2, "Significant Accounting Policies," of our audited consolidated financial statements included elsewhere in this Annual Report on Form 10-K, and
Critical Accounting Policies and Estimates
included elsewhere in this Management's Discussion and Analysis for further discussion of the accounting policies and estimates made related to these components.
Net revenue
We generate revenue from the sale of sensor and control products across all major geographic areas. We believe regulatory requirements for safer vehicles, higher fuel efficiency, and lower emissions, such as the Corporate Average Fuel Economy ("CAFE") requirements in the U.S., "Euro 6d" requirements in Europe, and "China National 6" requirements in China, as well as customer demand for operator productivity and convenience, drive the need for advancements in engine management, efficiency, safety features, and operator controls. These advancements lead to sensor growth rates that exceed underlying end market demand in many of our key markets that we expect will continue to offer us significant growth opportunities. The technology-driven, highly-customized, and integrated nature of our products requires customers to invest heavily in certification and qualification to ensure proper functioning of the system in which our products are embedded. We believe the capital commitment and time required for this process significantly increases the switching costs for customers once a particular sensor or control has been designed and installed in a system. As a result, our sensors and controls are rarely substituted during a product lifecycle, which in the case of the automotive end market typically lasts five to seven years. We focus on new applications that will help us secure new business and drive long-term growth. New applications for sensors typically provide an opportunity to define a leading application technology in collaboration with our customers.
Because we derive a significant portion of our net revenue from sales in our automotive end markets (
62%
in 2017),
32
demand for our products is driven in large part by conditions in this industry. However, outside of the automotive industry, we sell our products to end-users in a wide range of industries, end markets, and geographies. As a result, the drivers of demand for these products vary considerably and are influenced by the conditions in these industries, end markets, or geographic regions. Our overall net revenue is generally impacted by the following factors:
|
•
|
fluctuations in overall economic activity within the geographic regions in which we operate;
|
|
•
|
underlying growth in one or more of our core end markets, either worldwide or in particular geographies in which we operate;
|
|
•
|
the number of sensors and/or controls used within existing applications, or the development of new applications requiring sensors and/or controls, due to regulations or other factors;
|
|
•
|
the “mix” of products sold, including the proportion of new or upgraded products and their pricing relative to existing products;
|
|
•
|
changes in product sales prices (including quantity discounts, rebates, and cash discounts for prompt payment);
|
|
•
|
changes in the level of competition faced by our products, including the launch of new products by competitors;
|
|
•
|
our ability to successfully develop, launch, and sell new products and applications;
|
|
•
|
fluctuations in exchange rates; and
|
|
•
|
acquisitions.
|
While the factors described above impact net revenue in each of our operating segments, the impact of these factors on our operating segments can differ. For more information about revenue risks relating to our business, refer to Item 1A, “Risk Factors,” included elsewhere in this Annual Report on Form 10-K.
Cost of revenue
Our strategy of leveraging core technology platforms and focusing on high-volume applications enables us to provide our customers with highly-customized products at a relatively low cost, as compared to the costs of the systems in which our products are embedded. We have achieved our current cost position through a continuous process of migration to best-cost manufacturing locations, transformation of our supply chain to best-cost sourcing, product design improvements, and ongoing productivity-enhancing initiatives.
We manufacture the majority of our products and subcontract only a limited number of products to third parties. As such, our cost of revenue consists principally of the following:
|
•
|
Production Materials Costs.
We purchase much of the materials used in production on a global best-cost basis, but we are still impacted by global and local market conditions. A portion of our production materials contains resins and metals, such as copper, nickel, zinc, aluminum, gold, silver, platinum, and palladium, and the cost of these materials may vary with underlying commodities pricing. However, we enter into forward contracts to economically hedge a portion of our exposure to the potential change in prices associated with certain of these commodities. The terms of these contracts fix the price at a future date for various notional amounts associated with these commodities. Gains and losses recognized on these non-designated derivatives are included in Other, net.
|
|
•
|
Employee Costs.
Employee costs include wages and benefits for employees involved in our manufacturing operations. These costs generally fluctuate on an aggregate basis in direct correlation with changes in production volumes. As a percentage of revenue, these costs may decline as a result of economies of scale associated with higher production volumes, and conversely, may increase with lower production volumes. These costs also will fluctuate based on local market conditions. We rely on contract workers for direct labor in certain geographies. As of
December 31, 2017
, we had approximately
1,780
direct labor contract workers on a worldwide basis.
|
|
•
|
Sustaining Engineering Activity Costs.
These costs relate to modifications of existing products for use by new and existing customers in familiar applications.
|
|
•
|
Other.
Our remaining cost of revenue primarily consists of:
|
|
•
|
gains and losses on certain foreign currency forward contracts that are designated as cash flow hedges;
|
33
|
•
|
depreciation of fixed assets;
|
|
•
|
freight costs;
|
|
•
|
warehousing expenses;
|
|
•
|
maintenance and repair expenses;
|
|
•
|
operating supplies; and
|
|
•
|
other general manufacturing expenses, such as expenses for energy consumption and operating lease expense.
|
The main factors that influence our cost of revenue as a percent of net revenue include:
|
•
|
changes in the price of raw materials, including certain metals;
|
|
•
|
implementation of cost improvement measures aimed at increasing productivity, including reduction of fixed production costs, refinements in inventory management, design and process driven changes, and the coordination of procurement within each subsidiary and at the business level;
|
|
•
|
changes in production volumes - production costs are capitalized in inventory based on normal production volumes, as revenue increases, the fixed portion of these costs does not;
|
|
•
|
transfer of production to our lower cost manufacturing facilities;
|
|
•
|
product lifecycles, as we typically incur higher cost of revenue associated with excess manufacturing capacity during the initial stages of product launches and during the phase-out of discontinued products;
|
|
•
|
the increase in the carrying value of inventory that is adjusted to fair value as a result of the application of purchase accounting associated with acquisitions;
|
|
•
|
depreciation expense, including amounts arising from the adjustment of Property, Plant & Equipment ("PP&E") to fair value associated with acquisitions;
|
|
•
|
fluctuations in foreign currency exchange rates;
|
|
•
|
product mix; and
|
|
•
|
acquisitions, as acquired businesses may generate higher or lower cost of revenue as a percentage of revenue than our historical rates.
|
Research and development ("R&D") expense
We develop products that address increasingly complex engineering requirements. We believe that continued focused investment in R&D activities is critical to our future growth and maintaining our leadership position. Our R&D efforts are directly related to timely development of new and enhanced products that are central to our core business strategy. We develop our technologies to meet an evolving set of customer requirements and new product introductions.
R&D expense consists of costs related to direct product design, development, and process engineering. The level of R&D expense in any period is related to the number of products in development, the stage of the development process, the complexity of the underlying technology, the potential scale of the product upon successful commercialization, and the level of our exploratory research. We conduct such activities in areas that we believe will increase our longer-term net revenue growth. Our development expense is typically associated with engineering core technology platforms to specific applications and engineering major upgrades that improve the functionality or reduce the cost of existing products.
Costs related to modifications of existing products for use by new and existing customers in familiar applications are recorded in cost of revenue and not included in R&D expense.
34
Selling, general and administrative ("SG&A") expense
SG&A expense consists of all expenditures incurred in connection with the sale and marketing of our products, as well as administrative overhead costs, including:
|
•
|
salary and benefit costs for sales personnel and administrative staff, including cash and share-based incentive compensation expense (expenses relating to our sales personnel can fluctuate due to prolonged trends in sales volume, while expenses relating to administrative personnel generally do not increase or decrease directly with changes in sales volume);
|
|
•
|
charges related to the use and maintenance of administrative offices, including depreciation expense;
|
|
•
|
other administrative costs, including expenses relating to information systems, human resources, and legal and accounting services;
|
|
•
|
other selling and marketing related costs, such as expenses incurred in connection with travel and communications; and
|
|
•
|
transaction costs associated with acquisitions.
|
Changes in SG&A expense as a percent of net revenue have historically been impacted by a number of factors, including:
|
•
|
changes in sales volume, as higher volumes enable us to spread the fixed portion of our selling, marketing, and administrative expense over higher revenue;
|
|
•
|
changes in the mix of products we sell, as some products may require more customer support and sales effort than others;
|
|
•
|
changes in our customer base, as new customers may require different levels of sales and marketing attention;
|
|
•
|
new product launches in existing and new markets, as these launches typically involve a more intense sales and marketing activity before they are integrated into customer applications;
|
|
•
|
customer credit issues requiring increases to the allowance for doubtful accounts;
|
|
•
|
pricing changes;
|
|
•
|
volume and timing of acquisitions; and
|
|
•
|
fluctuations in exchange rates.
|
Depreciation expense
Depreciation expense includes depreciation of PP&E, amortization of leasehold improvements, and amortization of assets held under capital leases. Depreciation expense is included in either cost of revenue or SG&A expense depending on the use of the asset as a manufacturing or administrative asset.
Depreciation expense will change depending on the age of existing PP&E and the level of capital expenditures. Depreciation expense is computed using the straight-line method. Refer to Note 2, "Significant Accounting Policies," of our audited consolidated financial statements included elsewhere in this Annual Report on Form 10-K for additional details on methods for calculating depreciation expense.
Amortization expense
We have recognized a significant amount of identifiable definite-lived intangible assets, which are recorded at fair value on the date of the related acquisition. Definite-lived, acquisition-related intangible assets are amortized on an economic-benefit basis according to the useful lives of the assets or on a straight-line basis if a pattern of economic benefits cannot be reliably determined. The amount of amortization expense related to definite-lived intangible assets depends on the amount of intangible assets acquired and where previously acquired intangible assets are in their estimated life-cycle. In general, the economic benefit of an intangible asset is concentrated towards the beginning of that intangible asset's useful life.
35
Capitalized software and capitalized software licenses are presented on the consolidated balance sheets as intangible assets. Capitalized software licenses are amortized on a straight-line basis over the lesser of the term of the license or the estimated useful life of the software. Capitalized software is amortized on a straight-line basis over its estimated useful life.
Restructuring and special charges
Restructuring and special charges consist of severance, outplacement, other separation benefits, certain pension settlement and curtailment gains or losses, and facility exit and other costs. Restructuring charges may be incurred as part of an announced restructuring plan, or may be individual charges recorded related to acquired businesses or the termination of a limited number of employees that do not represent the initiation of a larger restructuring plan. Refer to Note 17, “Restructuring and Special Charges,” of our audited consolidated financial statements included elsewhere in this Annual Report on Form 10-K for discussion of our restructuring and special charges.
Interest expense
We are a highly leveraged company, and interest expense is a significant portion of our results of operations. As of
December 31, 2017
and
2016
, we had gross outstanding indebtedness of
$3,312.5 million
and
$3,324.9 million
, respectively. Refer to Note 8, "Debt," of our audited consolidated financial statements included elsewhere in this Annual Report on Form 10-K for details of this indebtedness.
The term loan (the "Term Loan") provided by the eighth amendment (the "Eighth Amendment") to the credit agreement dated as of May 12, 2011 (as amended, the "Credit Agreement") and the
$420.0 million
revolving credit facility (the "Revolving Credit Facility") accrue interest at variable interest rates. Refer to Item 7A, “Quantitative and Qualitative Disclosures About Market Risk—Interest Rate Risk,” included elsewhere in this Annual Report on Form 10-K for more information regarding our exposure to potential changes in variable interest rates.
Refer to
Debt Instruments
included elsewhere in this Management's Discussion and Analysis, and Note 8, "Debt," of our audited consolidated financial statements included elsewhere in this Annual Report on Form 10-K for more information regarding our debt transactions, including the Eighth Amendment.
Other, net
Other, net primarily includes gains and losses associated with the remeasurement of non-U.S. dollar denominated net monetary assets and liabilities into U.S. dollars, changes in the fair value of non-designated derivative financial instruments, and debt financing transactions.
We derive a significant portion of our net revenue from markets outside of the U.S. For financial reporting purposes, the functional currency of all our subsidiaries is the U.S. dollar ("USD") because of the significant influence of the USD on our operations. In certain instances, we enter into transactions that are denominated in a currency other than USD. At the date that such transaction is recognized, each asset, liability, revenue, expense, gain, or loss arising from the transaction is measured and recorded in USD using the exchange rate in effect at that date. At each balance sheet date, recorded monetary balances denominated in a currency other than USD are adjusted to USD using the exchange rate at the balance sheet date, with gains or losses recognized within Other, net in the consolidated statements of operations.
To mitigate the potential exposure to variability in cash flows and earnings related to changes in foreign currency exchange rates, we enter into foreign currency exchange rate forward contracts that may or may not be designated as cash flow hedges. The change in fair value of foreign currency forward contracts that are not designated for hedge accounting purposes is recognized in Other, net, and is driven by changes in the forward prices for the foreign exchange rates that we hedge. We cannot predict the future trends in foreign exchange rates, and there can be no assurance that gains or losses experienced in past periods will not recur in future periods.
We enter into forward contracts with third parties to offset a portion of our exposure to the potential change in prices associated with certain commodities, including silver, gold, platinum, palladium, copper, aluminum, and nickel, used in the manufacturing of our products. The terms of these forward contracts fix the price at a future date for various notional amounts associated with these commodities. These derivatives are not designated as accounting hedges. Changes in the fair value of these forward contracts are recognized within Other, net, and are driven by changes in the forward prices for the commodities that we hedge. We cannot predict the future trends in commodity prices, and there can be no assurance that commodity gains or losses experienced in past periods will not recur in future periods.
We periodically enter into debt financing transactions. In accounting for these transactions, costs may be recorded as a reduction of debt on the consolidated balance sheets, or they may be recorded in the consolidated statements of operations as
36
Other, net or Interest expense, net, depending on the type of transaction and the nature of the costs. Refer to Note 8, "Debt," of our audited consolidated financial statements included elsewhere in this Annual Report on Form 10-K for further discussion of our debt financing transactions.
Refer to Note 2, "Significant Accounting Policies," of our audited consolidated financial statements included elsewhere in this Annual Report on Form 10-K for further discussion of the amounts recorded in Other, net. Refer to Item 7A, "Quantitative and Qualitative Disclosures About Market Risk," included elsewhere in this Annual Report on Form 10-K for further discussion of the sensitivity of amounts recorded in Other, net to movements in commodity prices and foreign exchange rates.
Provision for income taxes
We are subject to income tax in the various jurisdictions in which we operate. We have a low effective cash tax rate due to the amortization of intangible assets and other tax benefits derived from our operating and capital structure, including tax incentives in both the U.K. and China and favorable tax status in Mexico. In addition, the Dutch participation exemption permits the payment of intercompany dividends without incurring taxable income in the Netherlands.
While the extent of our future tax liability is uncertain, the impact of purchase accounting for past and future acquisitions, changes to debt and equity capitalization of our subsidiaries, and the realignment of the functions performed and risks assumed by our various subsidiaries are among the factors that will determine the future book and taxable income of each respective subsidiary and Sensata as a whole.
Our effective tax rate will generally not equal the U.S. statutory rate due to various factors, the most significant of which are described below. As these factors fluctuate from year to year, our effective tax rate will change. The factors include, but are not limited to, the following:
|
•
|
changes in tax law, including the recently enacted U.S. Tax Cuts and Jobs Act;
|
|
•
|
establishing or releasing the valuation allowance related to our gross deferred tax assets;
|
|
•
|
because we operate in locations outside the U.S., including China, the Netherlands, South Korea, Malaysia, the U.K., and Bulgaria, that have statutory tax rates lower than the historical U.S. statutory rate, we generally have seen an effective rate benefit, which changes from year to year based upon the mix of earnings;
|
|
•
|
tax holidays and favorable tax regimes available to certain of our foreign subsidiaries;
|
|
•
|
as income tax audits related to our subsidiaries are closed, either as a result of negotiated settlements or final assessments, we may recognize a tax expense or benefit;
|
|
•
|
due to lapses of the applicable statute of limitations related to unrecognized tax benefits, we may recognize a tax benefit, including a benefit from the reversal of interest and penalties;
|
|
•
|
in certain jurisdictions, we record withholding and other taxes on intercompany payments, including dividends; and
|
|
•
|
losses incurred in certain jurisdictions, predominantly the U.S., are not currently benefited, as it is not more likely than not that the associated deferred tax asset will be realized in the foreseeable future.
|
Results of Operations
Our discussion and analysis of results of operations and financial condition are based upon our audited consolidated financial statements. These financial statements have been prepared in accordance with U.S. generally accepted accounting principles ("GAAP"). The preparation of these financial statements requires us to make estimates and judgments that affect the amounts reported in the financial statements. We base our estimates on historical experiences and assumptions believed to be reasonable under the circumstances, and we re-evaluate such estimates on an ongoing basis. These estimates form the basis for our judgments that affect the amounts reported in the financial statements. Actual results could differ from our estimates under different assumptions or conditions. Our significant accounting policies and estimates are more fully described in Note 2, "Significant Accounting Policies," of our audited consolidated financial statements included elsewhere in this Annual Report on Form 10-K, and
Critical Accounting Policies and Estimates
included elsewhere in this Management's Discussion and Analysis.
The table below presents our historical results of operations in millions of dollars and as a percentage of net revenue. We have derived these results of operations for the years ended
December 31, 2017
,
2016
, and
2015
from our audited consolidated financial statements included elsewhere in this Annual Report on Form 10-K. Amounts and percentages in the table and
37
discussion below have been calculated based on unrounded numbers. Accordingly, certain amounts may not add due to the effect of rounding.
|
|
For the year ended December 31,
|
|||||||||||||||||||
|
|
2017
|
2016
|
2015
|
|||||||||||||||||
|
(Dollars in millions)
|
Amount
|
Percent of
Net Revenue
|
Amount
|
Percent of
Net Revenue
|
Amount
|
Percent of
Net Revenue
|
||||||||||||||
|
Net revenue
|
|
|
|
|||||||||||||||||
|
Performance Sensing
|
$
|
2,460.6
|
|
|
74.4
|
%
|
$
|
2,385.4
|
|
74.5
|
%
|
$
|
2,346.2
|
|
78.9
|
%
|
||||
|
Sensing Solutions
|
846.1
|
|
|
25.6
|
|
816.9
|
|
25.5
|
|
628.7
|
|
21.1
|
|
|||||||
|
Net revenue
|
3,306.7
|
|
|
100.0
|
%
|
3,202.3
|
|
100.0
|
%
|
2,975.0
|
|
100.0
|
%
|
|||||||
|
Operating costs and expenses:
|
|
|
|
|||||||||||||||||
|
Cost of revenue
|
2,141.3
|
|
|
64.8
|
|
2,084.3
|
|
65.1
|
|
1,977.8
|
|
66.5
|
|
|||||||
|
Research and development
|
130.2
|
|
|
3.9
|
|
126.7
|
|
4.0
|
|
123.7
|
|
4.2
|
|
|||||||
|
Selling, general and administrative
|
302.8
|
|
|
9.2
|
|
293.6
|
|
9.2
|
|
271.4
|
|
9.1
|
|
|||||||
|
Amortization of intangible assets
|
161.1
|
|
|
4.9
|
|
201.5
|
|
6.3
|
|
186.6
|
|
6.3
|
|
|||||||
|
Restructuring and special charges
|
19.0
|
|
|
0.6
|
|
4.1
|
|
0.1
|
|
21.9
|
|
0.7
|
|
|||||||
|
Total operating costs and expenses
|
2,754.3
|
|
|
83.3
|
|
2,710.1
|
|
84.6
|
|
2,581.4
|
|
86.8
|
|
|||||||
|
Profit from operations
|
552.4
|
|
|
16.7
|
|
492.2
|
|
15.4
|
|
393.6
|
|
13.2
|
|
|||||||
|
Interest expense, net
|
(159.8
|
)
|
|
(4.8
|
)
|
(165.8
|
)
|
(5.2
|
)
|
(137.6
|
)
|
(4.6
|
)
|
|||||||
|
Other, net
|
9.8
|
|
|
0.3
|
|
(4.9
|
)
|
(0.2
|
)
|
(50.3
|
)
|
(1.7
|
)
|
|||||||
|
Income before taxes
|
402.4
|
|
|
12.2
|
|
321.4
|
|
10.0
|
|
205.6
|
|
6.9
|
|
|||||||
|
(Benefit from)/provision for income taxes
|
(5.9
|
)
|
|
(0.2
|
)
|
59.0
|
|
1.8
|
|
(142.1
|
)
|
(4.8
|
)
|
|||||||
|
Net income
|
$
|
408.4
|
|
|
12.3
|
%
|
$
|
262.4
|
|
8.2
|
%
|
$
|
347.7
|
|
11.7
|
%
|
||||
Net revenue - Overall
Net revenue for fiscal year
2017
increased
$104.4 million
, or
3.3%
, to
$3,306.7 million
from
$3,202.3 million
for fiscal year
2016
. The increase in net revenue was composed of a
3.2%
increase in Performance Sensing and a
3.6%
increase in Sensing Solutions. Excluding a
0.7%
decline due to changes in foreign currency exchange rates, particularly related to the Euro and Chinese Renminbi, organic revenue growth was
4.0%
when compared to fiscal year 2016. Organic revenue growth is a non-GAAP financial measure. Refer to the section entitled
Non-GAAP Financial Measures
for further information on our use of this measure.
Net revenue for fiscal year
2016
increased
$227.3 million
, or
7.6%
, to
$3,202.3 million
from
$2,975.0 million
for fiscal year 2015. The increase in net revenue was composed of a
1.7%
increase in Performance Sensing and a
29.9%
increase in Sensing Solutions. Excluding
7.9%
growth due to the net impact of an acquisition and exited businesses and a 1.9% decline due to changes in foreign currency rates, particularly the Euro to U.S. dollar, organic revenue growth was 1.6% when compared to fiscal year 2015.
Net revenue - Performance Sensing
Performance Sensing net revenue for fiscal year
2017
increased
$75.2 million
, or
3.2%
, to
$2,460.6 million
from
$2,385.4 million
for fiscal year
2016
. Excluding a
0.7%
decline due to changes in foreign currency exchange rates, particularly related to the Euro and Chinese Renminbi, organic revenue growth was
3.9%
when compared to fiscal year 2016. Organic revenue growth is a non-GAAP financial measure. Refer to the section entitled
Non-GAAP Financial Measures
for further information on our use of this measure.
Performance Sensing organic revenue growth in 2017 was driven primarily by our heavy vehicle off road ("HVOR") business, mainly as a result of the combination of stronger markets and content growth in the construction, agriculture, and on-road truck markets in North America, and content growth in our automotive business, primarily in China, partially offset by price reductions of
1.9%
, primarily related to automotive customers. In addition, we believe that the major markets within HVOR have been recovering, including the North American Class 8 truck market, which had been particularly weak in fiscal year 2016 and represents a significant part of our HVOR business. The price reductions referenced above were consistent with our expectations for future pricing pressures.
38
Performance Sensing net revenue for fiscal year
2016
increased
$39.2 million
, or
1.7%
, to
$2,385.4 million
from
$2,346.2 million
for fiscal year 2015. Excluding
1.9%
growth due to the net impact of an acquisition and exited businesses and a
2.1%
decline due to changes in foreign currency exchange rates, particularly the Euro to U.S. dollar, organic revenue growth was
1.9%
when compared to fiscal year 2015.
We acquired CST (as defined in Note 6, "Acquisitions," of our audited consolidated financial statements included elsewhere in this Annual Report on Form 10-K) in the fourth quarter of 2015. A portion of CST is being integrated into the Performance Sensing segment. The increase in revenue related to this acquisition in fiscal year 2016 was partially offset by the decrease in revenue related to the exit from unprofitable businesses during fiscal year 2016.
Performance Sensing organic revenue growth in 2016 was primarily driven by content and market growth, particularly in our automotive end markets in China and North America. This growth was partially offset by a decline in our HVOR business as a result of weakness in the North American Class 8 truck and global construction markets, which was partially offset by content growth in this business. In addition, price reductions of
1.8%
, primarily related to automotive customers, further reduced organic revenue growth.
Net revenue - Sensing Solutions
Sensing Solutions net revenue for fiscal year
2017
increased
$29.2 million
, or
3.6%
, to
$846.1 million
from
$816.9 million
for fiscal year
2016
. Excluding a
0.5%
decline due to changes in foreign currency exchange rates, particularly related to the Chinese Renminbi, organic revenue growth was
4.1%
when compared to fiscal year 2016. Organic revenue growth is a non-GAAP financial measure. Refer to the section entitled
Non-GAAP Financial Measures
for further information on our use of this measure. The organic revenue growth was primarily due to market strength across all of our key end markets, particularly in China, as well as content growth in our HVAC and industrial markets.
Sensing Solutions net revenue for fiscal year
2016
increased
$188.2 million
, or
29.9%
, to
$816.9 million
from
$628.7 million
for fiscal year 2015. Excluding
30.5%
growth due to the impact of the acquisition of CST in the fourth quarter of 2015 and a
1.2%
decline due to changes in foreign currency exchange rates, organic revenue growth was
0.6%
when compared to fiscal year 2015. After experiencing an organic revenue decline in the first half of 2016, Sensing Solutions organic revenue grew in the second half of 2016 primarily due to a stabilizing market in China and broadly stronger demand for our electromechanical control and pressure sensor products.
Cost of revenue
Cost of revenue for fiscal years
2017
,
2016
, and
2015
was
$2,141.3 million
(
64.8%
of net revenue),
$2,084.3 million
(
65.1%
of net revenue), and
$1,977.8 million
(
66.5%
of net revenue), respectively.
Cost of revenue decreased as a percentage of net revenue in fiscal year 2017 primarily due to improved operating efficiencies and synergies from the continued integration of acquired businesses, partially offset by the negative impact of price reductions.
We anticipate that cost of revenue as a percentage of net revenue will further decline as we continue to create new product designs and drive operational efficiencies and improvements in productivity, including lowering material costs, and as we integrate recently acquired businesses. We generally complete integration activities within 18 to 24 months after the related acquisition. However, the integrations of certain acquisitions, for example Schrader and CST, are anticipated to take three to four years due to their size and scope.
Cost of revenue decreased as a percentage of net revenue in fiscal year 2016 primarily due to lower material and logistics costs and improved operating efficiencies, partially offset by the negative effect of changes in foreign currency exchange rates and amounts accrued in 2016 related to the Automotive customer claim (as described in Note 14, "Commitments and Contingencies," of our audited consolidated financial statements included in our Annual Report on Form 10-K for the year ended December 31, 2016). In addition, there were certain charges recorded in cost of revenue in fiscal year 2015 that did not recur in fiscal year 2016, including a
$6.0 million
charge related to the settlement in the third quarter of 2015 of litigation brought by Bridgestone, a
$5.0 million
charge related to the write-down of certain assets associated with the announcement in the second quarter of 2015 of the shutdown of our Schrader Brazil manufacturing facility, and a
$4.0 million
charge taken in the second quarter of 2015 related to a warranty claim by a U.S. automaker.
Refer to Note 14, "Commitments and Contingencies," of the audited consolidated financial statements included in our Annual Report on Form 10-K for the year ended December 31, 2015 for discussion of the settlement of the Bridgestone litigation and the charge taken related to the U.S. automaker warranty claim. Refer to Note 17, "Restructuring and Special
39
Charges," of the audited consolidated financial statements included elsewhere in this Annual Report on Form 10-K for discussion of the charge related to the announcement of the shutdown of the Schrader Brazil manufacturing facility.
Research and development expense
R&D expense for fiscal years
2017
,
2016
, and
2015
was
$130.2 million
,
$126.7 million
, and
$123.7 million
, respectively.
R&D expense has increased over the last three years due to continued investment to support new platform and technology developments primarily related to new business wins, both in our recently acquired and existing businesses, in order to drive future revenue growth.
Selling, general and administrative expense
SG&A expense for fiscal years
2017
,
2016
, and
2015
was
$302.8 million
,
$293.6 million
, and
$271.4 million
, respectively.
SG&A expense increased in 2017 primarily due to
$6.6 million
in costs associated with the proposed cross-border merger between Sensata N.V. and Sensata Technologies Holding plc, as discussed in Note 1, "Business Description and Basis of Presentation," of our audited consolidated financial statements included elsewhere in this Annual Report on Form 10-K. SG&A expense was also impacted by higher variable compensation costs (including share-based compensation), partially offset by lower integration costs.
SG&A expense increased in 2016 primarily due to the acquisition of CST, which added
$35.6 million
in SG&A expense (excluding integration costs), and increased compensation costs, partially offset by lower acquisition related transaction costs, the impact of the write-off in 2015 of a
$5.0 million
tax indemnification asset related to a pre-acquisition tax liability that was favorably resolved, and the positive effect of changes in foreign currency exchange rates.
Amortization of intangible assets
Amortization expense associated with definite-lived intangible assets for fiscal years
2017
,
2016
, and
2015
was
$161.1 million
,
$201.5 million
, and
$186.6 million
, respectively.
Amortization expense has decreased in fiscal year 2017 as certain intangible assets, primarily related to the Sensors & Controls and High Temperature Sensing acquisitions in 2006 and 2011, respectively, are at, or are nearing, the end of their useful lives. We expect amortization expense to decrease to approximately
$137.7 million
in fiscal year 2018 for these same reasons.
Amortization expense increased in 2016 primarily due to amortization of intangible assets recognized as a result of acquisitions, partially offset by a difference in the pattern of economic benefits over which intangible assets were amortized (i.e. as intangible assets age, there is generally less economic benefit associated with them, and accordingly less amortization expense as compared to previous years).
Refer to Note 5, "Goodwill and Other Intangible Assets," of our audited consolidated financial statements included elsewhere in this Annual Report on Form 10-K for additional information regarding intangible assets and the related amortization.
Restructuring and special charges
Restructuring and special charges for fiscal years
2017
,
2016
, and
2015
were
$19.0 million
,
$4.1 million
, and
$21.9 million
, respectively.
Restructuring and special charges for fiscal year 2017 consisted primarily of severance charges of
$11.1 million
and facility exit costs of
$7.9 million
, each of which related primarily to the closing of our facility in Minden, Germany that was part of the acquisition of CST and the closing of our manufacturing facility in Bydgoszcz, Poland. Charges related to the closing of our facility in Minden, Germany for the year ended December 31, 2017 consisted of severance charges of
$8.4 million
and facility exit costs of
$3.2 million
. Charges related to the closing of our facility in Bydgoszcz, Poland for the year ended December 31, 2017 consisted of severance charges of
$0.8 million
and facility exit costs of
$2.3 million
.
Restructuring and special charges for fiscal year 2016 primarily included facility exit costs related to the relocation of manufacturing lines from our facility in the Dominican Republic to a manufacturing facility in Mexico and severance charges recorded in connection with acquired businesses and the termination of a limited number of employees in various locations
40
throughout the world. We completed the cessation of manufacturing in our Dominican Republic facility in the third quarter of 2016.
Restructuring and special charges for fiscal year 2015 included
$7.6 million
of severance charges incurred in order to integrate acquired businesses with ours,
$4.0 million
of severance charges incurred in the second quarter of 2015 related to the announced closing of our Schrader Brazil manufacturing facility, with the remainder primarily associated with the termination of a limited number of employees in various locations throughout the world.
Interest expense, net
Interest expense, net for fiscal years
2017
,
2016
, and
2015
was
$159.8 million
,
$165.8 million
, and
$137.6 million
, respectively.
Interest expense, net decreased in fiscal year 2017 primarily as a result of higher interest income due to increasing cash balances and rising interest rates.
Interest expense, net increased in fiscal year 2016 primarily as a result of the issuance of new debt related to the acquisition of CST in the fourth quarter of 2015, partially offset by lower interest rates due to the refinancing of certain debt instruments in 2015. In addition, 2015 included approximately
$8.8 million
in fees associated with bridge financing obtained for the acquisition of CST that was not ultimately utilized.
Refer to Note 8, "Debt," of our audited consolidated financial statements included elsewhere in this Annual Report on Form 10-K for more details on our financing transactions. Refer to Item 7A, "Quantitative and Qualitative Disclosures About Market Risk," included elsewhere in this Annual Report on Form 10-K for an analysis of the sensitivity of our interest expense to changes in interest rates.
Other, net
Other, net for fiscal years
2017
,
2016
, and
2015
consisted of net gains/(losses) of
$9.8 million
,
$(4.9) million
, and
$(50.3) million
, respectively.
The change in Other, net in fiscal year 2017 compared to fiscal year 2016 relates primarily to fluctuations in foreign currency exchange rates, net of any offsetting hedge gain or loss.
The change in Other, net in fiscal year 2016 compared to fiscal year 2015 relates primarily to commodity forward contracts and losses on debt financing transactions incurred during fiscal year 2015 that did not recur in fiscal year 2016.
Refer to Note 2, "Significant Accounting Policies," of our audited consolidated financial statements included elsewhere in this Annual Report on Form 10-K for more details on the gains and losses included within Other, net. Refer to Note 8, "Debt," and Note 16, "Derivative Instruments and Hedging Activities," of our audited consolidated financial statements included elsewhere in this Annual Report on Form 10-K for more details on losses related to our debt financing transactions and gains and losses related to commodity and foreign exchange forward contracts, respectively. Refer to Item 7A, "Quantitative and Qualitative Disclosures About Market Risk," included elsewhere in this Annual Report on Form 10-K for an analysis of the sensitivity of Other, net to changes in foreign currency exchange rates and commodity prices.
(Benefit from)/provision for income taxes
(Benefit from)/provision for income taxes for fiscal years
2017
,
2016
, and
2015
was
$(5.9) million
,
$59.0 million
, and
$(142.1) million
, respectively. The change in the (benefit from)/provision for income taxes in fiscal year 2017 is primarily due to the enactment of U.S. tax legislation during the fourth quarter of 2017, which required us to remeasure our U.S. deferred tax liabilities associated with indefinite lived intangible assets, including goodwill, from a rate of 35 percent to 21 percent.
(Benefit from)/provision for income taxes consists of current tax expense, which relates primarily to our profitable operations in non-U.S. tax jurisdictions and withholding taxes on interest and royalty income, and deferred tax expense (or benefit), which relates to adjustments in book-to-tax basis differences, mainly the step-up in fair value of fixed and intangible assets, including goodwill, acquired in connection with business combination transactions, utilization of net operating losses, prospective changes in U.S. tax rates due to newly enacted legislation, and adjustments to our U.S. valuation allowance in connection with acquisitions made by our U.S. subsidiaries.
Our income tax expense for fiscal years
2017
,
2016
, and
2015
was less than the amounts computed at the U.S. statutory rate by
$146.8 million
,
$53.5 million
, and
$214.0 million
, respectively. The most significant reconciling items are noted below.
41
Foreign tax rate differential.
We operate in locations outside the U.S., including China, the U.K., the Netherlands, South Korea, Malaysia, Bermuda, and Bulgaria, that have statutory tax rates lower than the historical U.S. statutory rate, resulting in an effective rate benefit. This benefit can change from year to year based upon the jurisdictional mix of earnings. In fiscal years 2017, 2016, and 2015, this benefit was
$112.0 million
,
$86.3 million
, and
$66.4 million
, respectively.
Certain of our subsidiaries are currently eligible, or have been eligible, for tax exemptions or holidays in their respective jurisdictions. From 2016 through 2018, a subsidiary in Changzhou, China was eligible for a reduced tax rate of
15%
. The impact of the tax holidays and exemptions on our effective rate is included in the foreign tax rate differential line in the reconciliation of the statutory rate to effective rate.
Certain income of our U.K. subsidiaries are eligible for lower tax rates under the “patent box” regime, resulting in certain of our intellectual property income being taxed at a rate lower than the U.K. statutory tax rate.
Release of valuation allowances.
During the years ended December 31, 2017, 2016, and 2015, we released a portion of our valuation allowance and recognized a deferred tax benefit of
$12.2 million
,
$1.9 million
, and
$180.0 million
, respectively. The deferred tax benefits in fiscal years 2016 and 2015 arose primarily in connection with the 2015 acquisition of CST and the 2014 acquisitions of Wabash, DeltaTech, and Schrader. For each of these acquisitions, deferred tax liabilities were established and related primarily to the step-up of intangible assets for book purposes.
Losses not tax benefited.
Losses incurred in certain jurisdictions, predominantly the U.S., are not currently benefited, as it is not more likely than not that the associated deferred tax asset will be realized in the foreseeable future. For the years ended December 31, 2017, 2016, and 2015, this resulted in a deferred tax expense of
$8.8 million
,
$32.5 million
, and
$56.8 million
, respectively.
Withholding taxes not creditable.
Withholding taxes may apply to intercompany interest, royalty, management fees, and certain payments to third parties. Such taxes are expensed if they cannot be credited against the recipient’s tax liability in its country of residence. Additional consideration also has been given to the withholding taxes associated with the remittance of presently unremitted earnings and the recipient's ability to obtain a tax credit for such taxes. Earnings are not considered to be indefinitely reinvested in the jurisdictions in which they were earned.
Refer to Note 9, “Income Taxes,” of our audited consolidated financial statements included elsewhere in this Annual Report on Form 10-K for more details on the tax rate reconciliation. We do not believe that there are any known trends related to the reconciling items noted above that are reasonably likely to result in our liquidity increasing or decreasing in any material way.
The valuation allowance as of December 31,
2017
and
2016
was
$277.3 million
and
$299.7 million
, respectively. It is more likely than not that the related net operating losses will not be utilized in the foreseeable future. However, any future release of all or a portion of this valuation allowance resulting from a change in this assessment will impact our future (benefit from)/provision for income taxes.
Non-GAAP Financial Measures
This section provides additional information regarding certain non-GAAP financial measures, including adjusted net income and organic revenue growth, which are used by our management, Board of Directors, and investors, as further discussed below. Adjusted net income and organic revenue growth should be considered as supplemental in nature and are not intended to be viewed in isolation or as a substitute for net income or net revenue growth prepared in accordance with U.S. GAAP. In addition, our measures of adjusted net income and organic revenue growth may not be the same as, or comparable to, similar non-GAAP financial measures presented by other companies.
Organic revenue growth
Organic revenue growth is defined as the reported percentage change in net revenue calculated in accordance with U.S. GAAP, excluding the impact of acquisitions, net of exited businesses that occurred within the previous 12 months, and the effect of changes in foreign currency exchange rates between the current year and prior year periods.
We believe that organic revenue growth provides investors with helpful information with respect to our operating performance, and we use organic revenue growth to evaluate our ongoing operations and for internal planning and forecasting purposes. We believe that organic revenue growth provides useful information in evaluating the results of our business because it excludes items that we believe are not indicative of ongoing performance, or that we believe impact comparability with the prior year period.
42
Adjusted net income
We define adjusted net income as follows: net income before certain restructuring and special charges, financing and other transaction costs, deferred (gain)/loss on other hedges, depreciation and amortization expense related to the step-up in fair value of fixed and intangible assets and inventory, deferred income tax and other tax (benefit)/expense, amortization of deferred financing costs, and other amounts as outlined in the reconciliation below.
Management uses adjusted net income as a measure of operating performance, for planning purposes (including the preparation of our annual operating budget), to allocate resources to enhance the financial performance of our business, to evaluate the effectiveness of our business strategies, and in communications with our Board of Directors and investors concerning our financial performance. We believe investors and securities analysts also use adjusted net income in their evaluation of our performance and the performance of other similar companies. Adjusted net income is not a measure of liquidity. The use of adjusted net income has limitations, and this performance measure should not be considered in isolation from, or as an alternative to, U.S. GAAP measures such as net income.
Our definition of adjusted net income excludes the deferred (benefit from)/provision for income taxes and other tax (benefit)/expense. Our deferred (benefit from)/provision for income taxes includes adjustments for book-to-tax basis differences primarily related to the step-up in fair value of fixed and intangible assets and goodwill, utilization of net operating losses, and adjustments to our U.S. valuation allowance in connection with certain acquisitions. Other tax (benefit)/expense includes certain adjustments to unrecognized tax positions. As we treat deferred income tax and other tax (benefit)/expense as an adjustment to compute adjusted net income, the deferred income tax effect associated with the reconciling items presented below would not change adjusted net income for any period presented. Refer to note (g) to the table below for the theoretical current income tax expense/(benefit) associated with the reconciling items indicated, which relate to jurisdictions where such items would provide tax expense/(benefit).
Many of these adjustments to net income relate to a series of strategic initiatives developed by our management aimed at better positioning us for future revenue growth and an improved cost structure. These initiatives have been modified from time to time to reflect changes in overall market conditions and the competitive environment facing our business. These initiatives include, among other items, acquisitions, divestitures, restructurings of certain operations, and various financing transactions. We describe these adjustments in more detail below.
The following unaudited table provides a reconciliation of adjusted net income to net income, the most directly comparable financial measure presented in accordance with U.S. GAAP:
|
|
For the year ended December 31,
|
||||||||||
|
(Amounts in thousands)
|
2017
|
2016
|
2015
|
||||||||
|
Net income
|
$
|
408,357
|
|
$
|
262,434
|
|
$
|
347,696
|
|
||
|
Non-GAAP adjustments
|
|||||||||||
|
Restructuring and special charges
(a)(g)
|
21,331
|
|
14,982
|
|
42,332
|
|
|||||
|
Financing and other transaction costs
(b)
|
9,267
|
|
1,508
|
|
43,850
|
|
|||||
|
Deferred (gain)/loss on other hedges
(c)
|
(7,365
|
)
|
(19,347
|
)
|
11,864
|
|
|||||
|
Depreciation and amortization expense related to the step-up in fair value of fixed and intangible assets and inventory
(d)(g)
|
165,040
|
|
210,847
|
|
193,370
|
|
|||||
|
Deferred income tax and other tax (benefit)/expense
(e)
|
(55,156
|
)
|
17,086
|
|
(173,550
|
)
|
|||||
|
Amortization of deferred financing costs
(f)
|
7,241
|
|
7,334
|
|
6,456
|
|
|||||
|
Total adjustments
|
140,358
|
|
232,410
|
|
124,322
|
|
|||||
|
Adjusted net income
|
$
|
548,715
|
|
$
|
494,844
|
|
$
|
472,018
|
|
||
43
|
(a)
|
The following unaudited table provides a detail of the components of our restructuring and special charges non-GAAP adjustment for fiscal years
2017
,
2016
, and
2015
as shown in the above table:
|
|
|
For the year ended December 31,
|
||||||||||
|
(Amounts in thousands)
|
2017
|
2016
|
2015
|
||||||||
|
Severance costs
(i)
|
$
|
3,026
|
|
$
|
21
|
|
$
|
15,560
|
|
||
|
Facility related costs
(ii)
|
13,962
|
|
10,945
|
|
11,353
|
|
|||||
|
Special charges and other
(iii)
|
4,343
|
|
4,016
|
|
15,419
|
|
|||||
|
Total restructuring and special charges
|
$
|
21,331
|
|
$
|
14,982
|
|
$
|
42,332
|
|
||
__________________
|
i.
|
Consists primarily of severance charges incurred and accounted for as part of ongoing benefit arrangements, excluding those costs recorded in connection with the integration of acquired businesses. Fiscal year 2015 also includes
$4.0 million
in severance charges associated with our decision to close our Schrader Brazil manufacturing facility and exit that business (refer also to Note 17, "Restructuring and Special Charges" of our audited consolidated financial statements included elsewhere in this Annual Report on Form 10-K).
|
|
ii.
|
Consists primarily of costs associated with line moves and the closing or relocation of various facilities throughout the world. In fiscal year 2017, these costs include
$6.0 million
related to transitioning certain of our distribution centers within Europe,
$3.7 million
of costs related to the closing of our facility in Bydgoszcz, Poland, and
$3.0 million
of costs associated with the closing of our Schrader Brazil manufacturing facility. In fiscal year 2016, these costs include
$3.7 million
of costs associated with the relocation of manufacturing lines from our facility in the Dominican Republic to a manufacturing facility in Mexico,
$1.1 million
in non-severance related costs associated with the closing of our Schrader Brazil manufacturing facility, and
$3.8 million
of costs associated with other exited product lines. In fiscal year 2015, these costs include non-severance related costs associated with our decision to close our Schrader Brazil manufacturing facility, including a
$5.0 million
charge to write-down certain assets (refer to Note 17, "Restructuring and Special Charges," of our audited consolidated financial statements included elsewhere in this Annual Report on Form 10-K for additional information).
|
|
iii.
|
Consists of other amounts that do not fall within one of the other specific categories, including, in fiscal year 2015, losses associated with the settlement of certain preacquisition loss contingencies, including the U.S. automaker warranty claim (
$4.0 million
) and the Bridgestone intellectual property litigation (
$6.0 million
). Refer to Note 14, "Commitments and Contingencies," of our audited consolidated financial statements included in the Annual Report on Form 10-K for the year ended December 31, 2015 for additional information.
|
|
(b)
|
Includes losses related to debt financing transactions, costs incurred in connection with secondary offering or other equity transactions, and costs associated with acquisition activity. Costs associated with debt financing transactions, which include losses of
$2.7 million
in fiscal year 2017 and
$34.3 million
in fiscal year 2015, are generally recorded in either Other, net or Interest expense, net. Costs associated with equity transactions, which include
$6.6 million
of expenses incurred in fiscal year 2017 in connection with the proposed cross-border merger, are generally recorded in SG&A expense. Costs associated with acquisition activity, which include
$9.4 million
in fiscal year 2015, are generally recorded in SG&A expense.
|
|
(c)
|
Reflects primarily unrealized and deferred losses/(gains), net on commodity and other hedges.
|
|
(d)
|
Represents depreciation and amortization expense related to the step-up in fair value of fixed and intangible assets and inventory related to acquisitions.
|
|
(e)
|
Represents deferred income tax and other tax expense/(benefit), including provisions for, and interest expense and penalties related to, certain unrecognized tax benefits (or benefits from their release). Our deferred income tax includes adjustments for measuring book-to-tax basis differences primarily related to the step-up in fair value of fixed and intangible assets and goodwill, utilization of net operating losses and adjustments to our U.S. valuation allowance in connection with certain acquisitions. Other tax expense/(benefit) includes certain adjustments to unrecognized tax positions. Fiscal year 2017 includes
$73.7 million
of income tax benefits related to the remeasurement of the deferred tax liabilities associated with indefinite-lived intangible assets due to the reduction of the U.S. corporate income tax rate from 35 percent to 21 percent in the Tax Cuts and Jobs Act of 2017. Fiscal years 2016 and 2015 include
$1.9 million
and
$180.0 million
, respectively, of deferred income tax benefits related to the release of portions of our U.S. valuation allowance in connection with our 2015 acquisition of CST and our 2014 acquisitions of Wabash, DeltaTech, and Schrader. For each of these acquisitions, deferred tax liabilities were established related primarily to the step-up of intangible assets for book purposes. Refer to Note 9, “Income Taxes,” of our audited consolidated financial statements included elsewhere in this Annual Report on Form 10-K for more details.
|
|
(f)
|
Represents amortization expense related to deferred financing costs and debt discounts.
|
44
|
(g)
|
The theoretical current income tax expense/(benefit) associated with the reconciling items presented above is shown below for each period presented. The theoretical current income tax (benefit)/expense was calculated by multiplying the reconciling items, which relate to jurisdictions where such items would provide current tax (benefit)/expense, by the applicable tax rates.
|
|
|
For the year ended December 31,
|
||||||||||
|
(Amounts in thousands)
|
2017
|
2016
|
2015
|
||||||||
|
Restructuring and special charges
|
$
|
(456
|
)
|
$
|
(1,001
|
)
|
$
|
(2,119
|
)
|
||
|
Depreciation and amortization expense related to the step-up in fair value of fixed and intangible assets and inventory
|
$
|
(22
|
)
|
$
|
(149
|
)
|
$
|
(595
|
)
|
||
Liquidity and Capital Resources
We held cash and cash equivalents of
$753.1 million
and
$351.4 million
at
December 31, 2017
and
2016
, respectively, of which
$260.9 million
and
$37.8 million
, respectively, was held in the Netherlands,
$9.0 million
and
$5.7 million
, respectively, was held by U.S. subsidiaries, and
$483.2 million
and
$307.9 million
, respectively, was held by other foreign subsidiaries. The amount of cash and cash equivalents held in the Netherlands and in our U.S. and other foreign subsidiaries fluctuates throughout the year due to a variety of factors, including the timing of cash receipts and disbursements in the normal course of business, and, if applicable, the timing of debt issuances and payments, repurchases of ordinary shares, and other financing transactions.
Cash Flows
The table below summarizes our primary sources and uses of cash for the years ended
December 31, 2017
,
2016
, and
2015
. We have derived these summarized statements of cash flows from our audited consolidated financial statements included elsewhere in this Annual Report on Form 10-K. Amounts in the table below have been calculated based on unrounded numbers. Accordingly, certain amounts may not add due to the effect of rounding.
|
|
For the year ended December 31,
|
||||||||||
|
(Amounts in millions)
|
2017
|
2016
|
2015
|
||||||||
|
Net cash provided by/(used in):
|
|||||||||||
|
Operating activities:
|
|||||||||||
|
Net income adjusted for non-cash items
|
$
|
652.5
|
|
$
|
615.5
|
|
$
|
508.7
|
|
||
|
Changes in operating assets and liabilities, net of effects of acquisitions
|
(94.8
|
)
|
(93.9
|
)
|
24.4
|
|
|||||
|
Operating activities
|
557.6
|
|
521.5
|
|
533.1
|
|
|||||
|
Investing activities
|
(140.7
|
)
|
(174.8
|
)
|
(1,166.4
|
)
|
|||||
|
Financing activities
|
(15.3
|
)
|
(337.6
|
)
|
764.2
|
|
|||||
|
Net change
|
$
|
401.7
|
|
$
|
9.2
|
|
$
|
130.9
|
|
||
Operating Activities
Net cash provided by operating activities during the years ended December 31,
2017
,
2016
, and
2015
was
$557.6 million
,
$521.5 million
, and
$533.1 million
, respectively.
The increase in cash provided by operating activities in fiscal year 2017 compared to fiscal year 2016 relates primarily to improved operating profitability, partially offset by a build up of inventory to support anticipated line moves, higher cash paid for interest, and higher cash paid related to severance obligations. The higher cash paid for interest relates to the
$750.0 million
aggregate principal amount of 6.25% senior notes due 2026 (the "6.25% Senior Notes"), for which interest payments are due semi-annually on February 15 and August 15 of each year. The payment made on February 15, 2016 did not represent payment for a full six-month period, as the 6.25% Senior Notes were issued on November 27, 2015.
The decrease in net cash provided by operating activities in fiscal year 2016 compared to fiscal year 2015 is primarily due to a build up of inventory to support anticipated line moves and timing of supplier payments and customer receipts, partially offset by higher net income (after adjusting for non-cash items).
45
Investing Activities
Net cash used in investing activities during the years ended December 31,
2017
,
2016
, and
2015
was
$140.7 million
,
$174.8 million
, and
$1,166.4 million
, respectively, which included
$144.6 million
,
$130.2 million
, and
$177.2 million
, respectively, in capital expenditures. Capital expenditures primarily relate to investments associated with increasing our manufacturing capacity. In fiscal year
2018
, we anticipate capital expenditures of approximately
$150.0 million
to
$160.0 million
, which we expect to be funded with cash flows from operations.
In addition, in 2016, net cash used in investing activities included an investment of
$50.0 million
in preferred stock of Quanergy Systems, Inc. Refer to Note 15, "Fair Value Measures," for further discussion of this investment.
In 2015, we used
$996.9 million
, net of cash received, to acquire CST.
Financing Activities
Net cash (used in)/provided by financing activities during the years ended December 31,
2017
,
2016
, and
2015
was
$(15.3) million
,
$(337.6) million
, and
$764.2 million
, respectively.
Net cash used in financing activities in fiscal year 2017 consisted primarily of
$943.6 million
in payments on debt, partially offset by $
927.8 million
of proceeds from the issuance of debt. These cash flows result from the repricing of the term loan provided pursuant to the sixth amendment (the “Sixth Amendment”) of the Credit Agreement, and the resulting issuance of the Term Loan pursuant to the Eighth Amendment. Refer to
Debt Instruments
below and Note 8, "Debt," of our audited consolidated financial statements included elsewhere in this Annual Report on Form 10-K for further discussion of the terms of these amendments.
Net cash used in financing activities in fiscal year 2016 consisted primarily of
$336.3 million
in payments on debt, including
$280.0 million
in payments on the Revolving Credit Facility and
$44.9 million
in payments on the term loan issued pursuant to the Sixth Amendment.
Net cash provided by financing activities in fiscal year 2015 consisted primarily of
$2,795.1 million
of proceeds from the issuance of debt, partially offset by
$2,000.3 million
in payments on debt. These issuances and payments include amounts related to certain debt instruments that were refinanced in 2015, including
$700.0
million aggregate principal amount of 6.5% senior notes due 2019 that were tendered and redeemed in March and April 2015 using the proceeds from the issuance and sale of 5.0% senior notes due 2025 (the "5.0% Senior Notes"), and
$990.1
million of previously existing term loans that were prepaid in May 2015 with the proceeds from the entry into the term loan issued pursuant to the Sixth Amendment.
In addition, proceeds from the issuance of debt in fiscal year 2015 include
$750.0 million
of proceeds from the issuance and sale of the 6.25% Senior Notes in November 2015, and
$355.0 million
in total aggregate borrowings on the Revolving Credit Facility in 2015. Cash payments on debt also include
$205.0 million
in total aggregate payments on the Revolving Credit Facility in 2015, and
$75.0 million
of payments on our then-existing term loan prior to its refinancing.
46
Our liquidity requirements are significant due to the highly leveraged nature of our company. The following table details our gross outstanding indebtedness as of
December 31, 2017
, and the associated interest expense for fiscal year
2017
:
|
Description
|
Balance at December 31, 2017
|
Interest expense, net for fiscal year 2017
|
|||||
|
(Amounts in thousands)
|
|
|
|||||
|
Term loan
|
$
|
927,794
|
|
$
|
30,692
|
|
|
|
4.875% Senior Notes
|
500,000
|
|
24,375
|
|
|||
|
5.625% Senior Notes
|
400,000
|
|
22,500
|
|
|||
|
5.0% Senior Notes
|
700,000
|
|
35,000
|
|
|||
|
6.25% Senior Notes
|
750,000
|
|
46,875
|
|
|||
|
Capital lease and other financing obligations
|
34,657
|
|
3,155
|
|
|||
|
Total
|
$
|
3,312,451
|
|
162,597
|
|
||
|
Other interest expense, net
(1)
|
(2,836
|
)
|
|||||
|
Total interest expense, net
|
|
|
$
|
159,761
|
|
||
(1)
Other interest expense, net includes interest income, amortization of deferred financing costs and discounts, and interest costs capitalized in accordance with ASC Subtopic 835-20,
Capitalization of Interest
.
Debt Instruments
Summarized information regarding our debt instruments is described below. Refer to Note 8, “Debt,” of our audited consolidated financial statements included elsewhere in this Annual Report on Form 10-K for further details of the terms of the $500 million 4.875% senior notes due 2023 (the "4.875% Senior Notes"), the $400 million 5.625% senior notes due 2024 (the "5.625% Senior Notes"), the 5.0% Senior Notes, and the 6.25% Senior Notes (collectively, the "Senior Notes"), the Senior Secured Credit Facilities (as defined below), and the term loans.
Senior Secured Credit Facilities
In May 2011, we completed a series of transactions designed to refinance our then existing indebtedness. These transactions included the execution of the Credit Agreement which provided for senior secured credit facilities (the "Senior Secured Credit Facilities") consisting of a
$1,100.0 million
term loan facility and the Revolving Credit Facility. The Senior Secured Credit Facilities also allowed for future additional borrowings under certain circumstances.
Term Loan
In May 2015, we entered into the Sixth Amendment, pursuant to which all term loans outstanding on that date were prepaid in full, and a new term loan was entered into in an aggregate principal amount of
$990.1 million
, equal to the sum of the outstanding balances of the term loans that were prepaid. The term loan was offered at
99.75%
of par with a maturity date of October 14, 2021. The principal amount of the term loan amortized in equal quarterly installments in an aggregate annual amount equal to
1.0%
of the original principal amount, with the balance due at maturity.
On November 7, 2017, we entered into the Eighth Amendment, which resulted in a newly issued term loan (the “Term Loan”) with interest rates that differed from those under the Sixth Amendment. Pursuant to the Eighth Amendment, the applicable margins for the Term Loan as of December 31, 2017 were
0.75%
and
1.75%
for Base Rate loans and Eurodollar Rate loans, respectively, (a decrease from
1.25%
and
2.25%
, respectively, pursuant to the Sixth Amendment) subject to floors of
1.00%
and
0.00%
for Base Rate loans and Eurodollar Rate loans, respectively (a decrease from
1.75%
and
0.75%
, respectively, pursuant to the Sixth Amendment).
As a result of the Eighth Amendment, a prepayment premium of
1.0%
was added with respect to any Term Loan repricing event that occurs within six months after the effective date of the Eighth Amendment. Refer to Note 8, “Debt,” of our audited consolidated financial statements included elsewhere in this Annual Report on Form 10-K for further details of the terms of the Eighth Amendment.
At December 31, 2017, the Term Loan accrued interest at a rate of
3.21%
.
47
4.875% Senior Notes
In April 2013, we completed the issuance and sale of the 4.875% Senior Notes, which were offered at par, and mature on October 15, 2023. Interest on the 4.875% Senior Notes is payable semi-annually on April 15 and October 15 of each year.
5.625% Senior Notes
In October 2014, we completed the issuance and sale of the 5.625% Senior Notes, which were offered at par, and mature on November 1, 2024. Interest on the 5.625% Senior Notes is payable semi-annually on May 1 and November 1 of each year.
5.0% Senior Notes
In March 2015, we completed the issuance and sale of the 5.0% Senior Notes, which were offered at par, and mature on October 1, 2025. Interest on the 5.0% Senior Notes is payable semi-annually on April 1 and October 1 of each year.
6.25% Senior Notes
In November 2015, we completed the issuance and sale of the 6.25% Senior Notes, which were offered at par, and mature on February 15, 2026. Interest on the 6.25% Senior Notes is payable semi-annually on February 15 and August 15 of each year.
Revolving Credit Facility
As of
December 31, 2017
, there was
$415.3 million
of availability under the Revolving Credit Facility (net of
$4.7 million
of letters of credit). Outstanding letters of credit are issued primarily for the benefit of certain operating activities. As of
December 31, 2017
, no amounts had been drawn against these outstanding letters of credit.
Capital Resources
Our sources of liquidity include cash on hand, cash flows from operations, and available capacity under the Revolving Credit Facility. In addition, the Senior Secured Credit Facilities provide for incremental facilities (the “Accordion”), under which additional term loans may be issued or the capacity of the Revolving Credit Facility may be increased. Pursuant to the Eighth Amendment, the Accordion was increased from
$230.0 million
to
$1,000.0 million
, all of which remained available for issuance as of
December 31, 2017
.
We believe, based on our current level of operations as reflected in our results of operations for the year ended
December 31, 2017
, and taking into consideration the restrictions and covenants discussed below, that these sources of liquidity will be sufficient to fund our operations, capital expenditures, ordinary share repurchases, and debt service for at least the next twelve months.
However, we cannot make assurances that our business will generate sufficient cash flows from operations or that future borrowings will be available to us in an amount sufficient to enable us to pay our indebtedness or to fund our other liquidity needs. Further, our highly leveraged nature may limit our ability to procure additional financing in the future.
The Credit Agreement stipulates certain events and conditions that may require us to use excess cash flow, as defined by the terms of the Credit Agreement, generated by operating, investing, or financing activities, to prepay some or all of the outstanding borrowings under the Senior Secured Credit Facilities. The Credit Agreement also requires mandatory prepayments of the outstanding borrowings under the Senior Secured Credit Facilities upon certain asset dispositions and casualty events, in each case subject to certain reinvestment rights, and the incurrence of certain indebtedness (excluding any permitted indebtedness). These provisions were not triggered during the year ended December 31, 2017.
Our ability to raise additional financing, and our borrowing costs, may be impacted by short-term and long-term debt ratings assigned by independent rating agencies, which are based, in significant part, on our performance as measured by certain credit metrics such as interest coverage and leverage ratios. As of
January 26, 2018
, Moody’s Investors Service’s corporate credit rating for STBV was Ba2 with a stable outlook and Standard & Poor’s corporate credit rating for STBV was BB+ with a stable outlook. Any future downgrades to STBV's credit ratings may increase our borrowing costs, but will not reduce availability under the Credit Agreement.
We have a
$250.0 million
share repurchase program in place. Under this program, we may repurchase ordinary shares from time to time, at such times and in amounts to be determined by our management, based on market conditions, legal requirements, and other corporate considerations, on the open market or in privately negotiated transactions. We expect that any future repurchases of ordinary shares will be funded by cash from operations. The share repurchase program may be modified
48
or terminated by our Board of Directors at any time. We did not repurchase any ordinary shares under this program in fiscal years 2017, 2016, or 2015. At
December 31, 2017
,
$250.0 million
remained available for share repurchase under this program.
The Credit Agreement and the indentures under which the Senior Notes were issued (the "Senior Notes Indentures") contain restrictions and covenants that limit the ability of STBV and its subsidiaries to, among other things, incur subsequent indebtedness, sell assets, make capital expenditures, pay dividends, and make other restricted payments. These restrictions and covenants, which are subject to important exceptions and qualifications set forth in the Credit Agreement and Senior Notes Indentures, and which are described in more detail below and in Note 8, "Debt," of our audited consolidated financial statements included elsewhere in this Annual Report on Form 10-K, were taken into consideration in establishing our share repurchase program, and are evaluated periodically with respect to future potential funding. We do not believe that these restrictions and covenants will prevent us from funding share repurchases under our share repurchase program with available cash and cash flows from operations, should we decide to do so.
STBV is limited in its ability to pay dividends or otherwise make distributions to its immediate parent company and, ultimately, to us, under the Credit Agreement and the Senior Notes Indentures. Specifically, the Credit Agreement prohibits STBV from paying dividends or making any distributions to its parent companies except for limited purposes, including, but not limited to: (i) customary and reasonable operating expenses, legal and accounting fees and expenses, and overhead of such parent companies incurred in the ordinary course of business in the aggregate not to exceed
$20.0 million
in any fiscal year, plus reasonable and customary indemnification claims made by our directors or officers attributable to the ownership of STBV and its subsidiaries; (ii) franchise taxes, certain advisory fees, and customary compensation of officers and employees of such parent companies to the extent such compensation is attributable to the ownership or operations of STBV and its subsidiaries; (iii) repurchase, retirement, or other acquisition of equity interest of the parent from certain present, future, and former employees, directors, managers, consultants of the parent companies, STBV, or its subsidiaries in an aggregate amount not to exceed
$20.0 million
in any fiscal year, plus the amount of cash proceeds from certain equity issuances to such persons, the amount of equity interests subject to a certain deferred compensation plan, and the amount of certain key-man life insurance proceeds; (iv) so long as no default or event of default exists and the senior secured net leverage ratio is less than
2.0
:
1.0
calculated on a pro forma basis, dividends and other distributions in an aggregate amount not to exceed
$100.0 million
, plus certain amounts, including the retained portion of excess cash flow; (v) dividends and other distributions in an aggregate amount not to exceed
$50.0 million
in any calendar year (subject to increase upon the achievement of certain ratios); and (vi) so long as no default or event of default exists, dividends and other distributions in an aggregate amount not to exceed
$150.0 million
.
As of
December 31, 2017
, we were in compliance with all the covenants and default provisions under the Credit Agreement. For more information on our indebtedness and related covenants and default provisions, refer to Note 8, "Debt," of our audited consolidated financial statements, and Item 1A, “Risk Factors,” each included elsewhere in this Annual Report on Form 10-K.
49
Contractual Obligations and Commercial Commitments
The table below reflects our contractual obligations as of
December 31, 2017
. Amounts we pay in future periods may vary from those reflected in the table. Amounts in the table below have been calculated based on unrounded numbers. Accordingly, certain amounts may not add due to the effect of rounding.
|
|
Payments Due by Period
|
||||||||||||||||||
|
(Amounts in millions)
|
Total
|
1 Year
or Less
|
1-3 Years
|
3-5 Years
|
More than
5 Years
|
||||||||||||||
|
Debt obligations principal
(1)
|
$
|
3,277.8
|
|
$
|
9.8
|
|
$
|
19.8
|
|
$
|
898.2
|
|
$
|
2,350.0
|
|
||||
|
Debt obligations interest
(2)
|
1,096.0
|
|
158.8
|
|
314.2
|
|
284.4
|
|
338.6
|
|
|||||||||
|
Capital lease obligations principal
(3)
|
29.3
|
|
3.1
|
|
6.8
|
|
6.5
|
|
12.9
|
|
|||||||||
|
Capital lease obligations interest
(3)
|
11.8
|
|
2.3
|
|
4.1
|
|
3.0
|
|
2.4
|
|
|||||||||
|
Other financing obligations principal
(4)
|
5.4
|
|
2.8
|
|
2.5
|
|
0.1
|
|
—
|
|
|||||||||
|
Other financing obligations interest
(4)
|
0.9
|
|
0.4
|
|
0.5
|
|
0.0
|
|
—
|
|
|||||||||
|
Operating lease obligations
(5)
|
68.6
|
|
12.9
|
|
15.8
|
|
9.4
|
|
30.6
|
|
|||||||||
|
Non-cancelable purchase obligations
(6)
|
44.9
|
|
17.3
|
|
19.4
|
|
8.1
|
|
0.1
|
|
|||||||||
|
Total
(7)(8)
|
$
|
4,534.7
|
|
$
|
207.4
|
|
$
|
383.1
|
|
$
|
1,209.7
|
|
$
|
2,734.6
|
|
||||
__________________
|
(1)
|
Represents the contractually required principal payments, in accordance with the required payment schedule, on our debt obligations in existence as of
December 31, 2017
.
|
|
(2)
|
Represents the contractually required interest payments, in accordance with the required payment schedule, on our debt obligations in existence as of
December 31, 2017
. Cash flows associated with the next interest payment to be made on our variable rate debt subsequent to
December 31, 2017
were calculated using the interest rates in effect as of the latest interest rate reset date prior to
December 31, 2017
, plus the applicable spread.
|
|
(3)
|
Represents the contractually required payments, in accordance with the required payment schedule, under our capital lease obligations in existence as of
December 31, 2017
. No assumptions were made with respect to renewing the lease term at its expiration date.
|
|
(4)
|
Represents the contractually required payments, in accordance with the required payment schedule, under our financing obligations in existence as of
December 31, 2017
. No assumptions were made with respect to renewing the financing arrangements at their expiration dates.
|
|
(5)
|
Represents the contractually required payments, in accordance with the required payment schedule, under our operating lease obligations in existence as of
December 31, 2017
. No assumptions were made with respect to renewing the lease obligations at the expiration date of their initial terms.
|
|
(6)
|
Represents the contractually required payments under our various purchase obligations in existence as of
December 31, 2017
. No assumptions were made with respect to renewing the purchase obligations at the expiration date of their initial terms, and no amounts were assumed to be prepaid.
|
|
(7)
|
Contractual obligations denominated in a foreign currency were calculated utilizing the U.S. dollar to local currency exchange rates in effect as of
December 31, 2017
.
|
|
(8)
|
This table does not include the contractual obligations associated with our defined benefit and other post-retirement benefit plans. As of
December 31, 2017
, we had recognized a net benefit liability of
$43.4 million
, representing the net unfunded benefit obligations of the defined benefit and retiree healthcare plans. Refer to Note 10, "Pension and Other Post-Retirement Benefits," of our audited consolidated financial statements included elsewhere in this Annual Report on Form 10-K for additional information on pension and other post-retirement benefits, including expected benefit payments for the next 10 years. This table also does not include
$5.4 million
of unrecognized tax benefits as of
December 31, 2017
, as we are unable to make reasonably reliable estimates of when cash settlement, if any, will occur with a tax authority, as the timing of the examination and the ultimate resolution of the examination is uncertain. Refer to Note 9, "Income Taxes," of our audited consolidated financial statements included elsewhere in this Annual Report on Form 10-K for additional information on income taxes.
|
Legal Proceedings
We account for litigation and claims losses in accordance with Accounting Standards Codification ("ASC") Topic 450,
Contingencies
(“ASC 450”). Under ASC 450, loss contingency provisions are recorded for probable and estimable losses at our best estimate of a loss or, when a best estimate cannot be made, at our estimate of the minimum loss. These estimates are often developed prior to knowing the amount of the ultimate loss, require the application of considerable judgment, and are refined
50
each accounting period as additional information becomes known. Accordingly, we are often initially unable to develop a best estimate of loss and therefore the minimum amount, which could be an immaterial amount, is recorded. As information becomes known, either the minimum loss amount is increased, or a best estimate can be made, generally resulting in additional loss provisions. A best estimate amount may be changed to a lower amount when events result in an expectation of a more favorable outcome than previously expected. There can be no assurances that our recorded provisions will be sufficient to cover the extent of our costs and potential liability.
Inflation
We do not believe that inflation has had a material effect on our financial condition or results of operations in recent years.
Seasonality
Because of the diverse global nature of the markets in which we operate, our revenue is only moderately impacted by seasonality. However, our Sensing Solutions business has some seasonal elements, specifically in its air conditioning and refrigeration products, which tend to peak in the first two quarters of the year as end market inventory is built up for spring and summer sales. In addition, our Performance Sensing business tends to be weaker in the third quarter of the year as automotive original equipment manufacturers retool production lines for the coming model year.
Critical Accounting Policies and Estimates
To prepare our financial statements in conformity with generally accepted accounting principles, we must make complex and subjective judgments in the selection and application of accounting policies. The accounting policies and estimates that we believe are most critical to the portrayal of our financial position and results of operations are listed below. We believe these policies require our most difficult, subjective, and complex judgments in estimating the effect of inherent uncertainties. This section should be read in conjunction with Note 2, "Significant Accounting Policies," of our audited consolidated financial statements included elsewhere in this Annual Report on Form 10-K, which includes other significant accounting policies.
Revenue Recognition
The following discussion of our revenue recognition accounting policies is based on the accounting principles that were used to prepare the fiscal year 2017 consolidated financial statements included in this Annual Report on Form 10-K. On January 1, 2018, we adopted ASC Topic 606,
Revenue from Contracts with Customers
("ASC 606"). This standard replaces existing revenue recognition rules with a comprehensive revenue measurement and recognition standard and expanded disclosure requirements. Refer to Note 2, "Significant Accounting Policies," of our audited consolidated financial statements included elsewhere in this Annual Report on Form 10-K for discussion of recently issued accounting standards.
We recognize revenue in accordance with ASC Topic 605,
Revenue Recognition
("ASC 605"). Revenue and related cost of revenue from product sales are recognized when the significant risks and rewards of ownership have been transferred, title to the product and risk of loss transfers to our customer, and collection of sales proceeds is reasonably assured. Based on these criteria, revenue is generally recognized when the product is shipped from our warehouse or, in limited instances, when it is received by the customer, depending on the specific terms of the arrangement. Product sales are recorded net of trade discounts (including volume and early payment incentives), sales returns, value-added tax, and similar taxes. Sales to customers generally include a right of return for defective or non-conforming product. Sales returns have not historically been significant in relation to our net revenue and have been within our estimates.
Goodwill, Intangible Assets, and Long-Lived Assets
Businesses acquired are recorded at their fair value on the date of acquisition, with the excess of the purchase price over the fair value of identifiable assets acquired and liabilities assumed recognized as goodwill. Assets acquired may include either definite-lived or indefinite-lived intangible assets, or both. As of
December 31, 2017
, goodwill and other intangible assets, net totaled
$3,005.5 million
and
$920.1 million
, respectively, or approximately
45%
and
14%
, respectively, of our total assets.
Identification of reporting units
Historically we identified five reporting units: Performance Sensing, Electrical Protection, Power Management, Industrial Sensing, and Interconnection. In connection with our 2017 review of these reporting units, and considering the continued integration of the CST acquisition, we determined that the portion of the Power Management reporting unit that serves the aerospace end market should be reallocated into a separate reporting unit. As a result, a new reporting unit, Aerospace, was identified.
51
These reporting units have been identified based on the definitions and guidance provided in ASC Topic 350,
Intangibles—Goodwill and Other
(“ASC 350”). Identification of reporting units includes an analysis of the components that comprise each of our operating segments, which considers, among other things, the manner in which we operate our business and the availability of discrete financial information. Components of an operating segment are aggregated to form one reporting unit if the components have similar economic characteristics. We periodically review these reporting units to ensure that they continue to reflect the manner in which the business is operated.
Assignment of assets, liabilities, and goodwill to reporting units
In the event we reorganize our business, we reassign the assets (including goodwill) and liabilities among the affected reporting units using a reasonable and supportable methodology. As businesses are acquired, we assign assets acquired (including goodwill) and liabilities assumed to an existing reporting unit or create a new reporting unit. Some assets and liabilities relate to the operations of multiple reporting units. We allocate these assets and liabilities to the reporting units based on methods that we believe are reasonable and supportable. We apply that allocation method on a consistent basis from year to year. We view some assets and liabilities, such as cash and cash equivalents, property, plant and equipment associated with our corporate offices, and debt, as being corporate in nature. Accordingly, we do not assign these assets and liabilities to our reporting units.
Evaluation of goodwill for impairment
In accordance with the requirements of ASC 350, goodwill and intangible assets determined to have an indefinite useful life are not amortized. Instead, these assets are evaluated for impairment on an annual basis and whenever events or business conditions change that could indicate that the asset is impaired. Our judgments regarding the existence of impairment indicators are based on several factors, including the performance of the end markets served by our customers, as well as the actual financial performance of our reporting units and their respective financial forecasts over the long-term. We evaluate goodwill and indefinite-lived intangible assets for impairment in the fourth quarter of each fiscal year, unless events occur which trigger the need for an earlier impairment review.
We have the option to first assess qualitative factors to determine whether it is more likely than not that the fair value of a reporting unit is less than its net book value. If we elect not to use this option, or we determine that it is more likely than not that the fair value of a reporting unit is less than its net book value, then we perform the two-step goodwill impairment test.
In the first step of the two-step goodwill impairment test, we compare the estimated fair values of our reporting units to their respective net book values, including goodwill, to determine whether there is an indicator of potential impairment. If the net book value of a reporting unit exceeds its estimated fair value, we conduct a second step in which we calculate the implied fair value of goodwill. If the carrying value of the reporting unit’s goodwill exceeds its calculated implied fair value, an impairment loss is recognized for that excess amount. The implied fair value of goodwill is determined in the same manner as the amount of goodwill recognized in a business combination. That is, the fair value of the reporting unit is allocated to all of its identifiable assets and liabilities (including any unrecognized intangible assets) as if the reporting unit had been acquired in a business combination at the date of assessment and the fair value of the reporting unit was the purchase price paid to acquire the reporting unit. The excess of the fair value of the reporting unit over the sum of the fair values of each of its identifiable assets and liabilities is the implied fair value of goodwill.
2017 assessment of goodwill.
We evaluated our goodwill for impairment as of October 1, 2017. In connection with this evaluation, we used the qualitative method of assessing goodwill for those reporting units that were not reorganized, and determined that it was not more likely than not that the fair values of each of our Performance Sensing, Electrical Protection, Industrial Sensing, and Interconnection reporting units were less than their net book values. In making this determination, we considered several factors, including the following:
|
•
|
the amount by which the fair values of the Performance Sensing, Electrical Protection, and Interconnection reporting units exceeded their carrying values (301%, 273%, and 328%, respectively) as of October 1, 2013, and the amount by which the Industrial Sensing reporting unit exceeded its carrying value (340%) as of December 1, 2014, indicating that there would need to be substantial negative developments in the markets in which these reporting units operate in order for there to be a potential impairment;
|
|
•
|
the carrying values of these reporting units as of October 1, 2017 compared to the previously calculated fair values as of October 1, 2013 (or December 1, 2014 in the case of Industrial Sensing);
|
|
•
|
public information from competitors and other industry information to determine if there were any significant adverse trends in our competitors' businesses, such as significant declines in market capitalization or significant
|
52
goodwill impairment charges that could be an indication that the goodwill of our reporting units was potentially impaired;
|
•
|
demand in the debt markets for our senior notes, the strength of which indicates a view by investors of our strength as a company;
|
|
•
|
changes in the value of major U.S. stock indices that could suggest declines in overall market stability that could impact the valuation of our reporting units;
|
|
•
|
changes in our market capitalization and overall enterprise valuation to determine if there were any significant decreases that could be an indication that the valuation of our reporting units had significantly decreased; and
|
|
•
|
whether there had been any significant increases to the weighted-average cost of capital ("WACC") rates for each reporting unit, which could materially lower our prior valuation conclusions under a discounted cash flow approach.
|
Changes to the factors considered above could affect the estimated fair value of one or more of our reporting units and could result in a goodwill impairment charge in a future period. We may be unaware of one or more significant factors that, if we had been aware of, would cause our conclusion that it is not more likely than not that the fair values of our reporting units are less than their carrying values to change, which could result in a goodwill impairment charge in a future period.
For the Power Management and Aerospace reporting units, which were reorganized in 2017, we estimated the fair values of these reporting units using the discounted cash flow method. For this method, we prepared detailed annual projections of future cash flows for each reporting unit for the subsequent five fiscal years (the “Discrete Projection Period”). We estimated the value of the cash flows beyond the fifth fiscal year (the “Terminal Year”), by applying a multiple to the projected Terminal Year net earnings before interest, taxes, depreciation, and amortization ("EBITDA"). The cash flows from the Discrete Projection Period and the Terminal Year were discounted at an estimated WACC appropriate for each reporting unit. The estimated WACC was derived, in part, from comparable companies appropriate to each reporting unit. We believe that our procedures for estimating discounted future cash flows, including the Terminal Year valuation, were reasonable and consistent with accepted valuation practices.
The preparation of forecasts of revenue growth and profitability for use in the long-range forecasts, the selection of the discount rates, and the estimation of the multiples used in valuing the Terminal Year involve significant judgments. Changes to these assumptions could affect the estimated fair value of one or more of our reporting units and could result in a goodwill impairment charge in a future period.
The estimated relative fair values of the Power Management and Aerospace reporting units, as identified in connection with our 2017 annual impairment analysis, exceeded their carrying values by 63% and 37%, respectively. The carrying value of goodwill associated with the Power Management reporting unit, prior to reorganization, was assigned to each of the reorganized reporting units based on their estimated relative fair values.
We did not prepare updated goodwill impairment analyses as of
December 31, 2017
for any reporting unit, as we did not become aware of any indicators after October 1, 2017 that would have required such analysis.
Assessment of fair value in prior years.
In 2013 (and in 2014 for Industrial Sensing), we estimated the fair value of our reporting units using the discounted cash flow method. For this method, we prepared detailed annual projections of future cash flows for each reporting unit for the Discrete Projection Period. We estimated the value of the cash flows beyond the Terminal Year, by applying a multiple to the projected Terminal Year EBITDA. The cash flows from the Discrete Projection Period and the Terminal Year were discounted at an estimated WACC appropriate for each reporting unit. The estimated WACC was derived, in part, from comparable companies appropriate to each reporting unit. We believe that our procedures for estimating discounted future cash flows, including the Terminal Year valuation, were reasonable and consistent with accepted valuation practices.
We also estimated the fair value of our reporting units using the guideline company method. Under this method, we performed an analysis to identify a group of publicly-traded companies that were comparable to each reporting unit. We calculated an implied EBITDA multiple (e.g., invested capital/EBITDA) for each of the guideline companies and selected either the high, low, or average multiple, depending on various facts and circumstances surrounding the reporting unit, and applied it to that reporting unit's trailing twelve month EBITDA. Although we estimated the fair value of our reporting units using the guideline method, we did so for corroborative purposes and placed primary weight on the discounted cash flow method.
Types of events that could result in a goodwill impairment.
As noted above, the assumptions used in the quantitative calculation of fair value of our reporting units in prior years, including the long-range forecasts, the selection of the discount
53
rates, and the estimation of the multiples or long-term growth rates used in valuing the Terminal Year involve significant judgments. Changes to these assumptions could affect the estimated fair values of our reporting units calculated in prior years and could result in a goodwill impairment charge in a future period. We believe that certain factors, such as a future recession, any material adverse conditions in the automotive industry and other industries in which we operate, and other factors identified in Item 1A, "Risk Factors," included elsewhere in this Annual Report on Form 10-K could require us to revise our long-term projections and could reduce the multiples used to determine Terminal Year value. Such revisions could result in a goodwill impairment charge in the future.
Evaluation of other intangible assets for impairment
2017 assessment of indefinite-lived intangible assets.
Similar to goodwill, we perform an annual impairment review of our indefinite-lived intangible assets in the fourth quarter of each fiscal year, unless events occur that trigger the need for an earlier impairment review. We have the option to first assess qualitative factors in determining whether it is more likely than not that an indefinite-lived intangible asset is impaired. If we elect not to use this option, or we determine that it is more likely than not that the asset is impaired, we perform a quantitative impairment review that requires us to estimate the fair value of the indefinite-lived intangible asset and compare that amount to its carrying value. We estimate the fair value by using the relief-from-royalty method, which requires us to make assumptions about future conditions impacting the value of the indefinite-lived intangible assets, including projected growth rates, cost of capital, effective tax rates, and royalty rates. Impairment, if any, is based on the excess of the carrying value over the fair value of these assets.
We evaluated our indefinite-lived intangible assets for impairment as of October 1, 2017 (using the quantitative method) and determined that the estimated fair values of these assets exceeded their carrying values at that date. Should certain assumptions used in the development of the fair values of our indefinite-lived intangible assets change, we may be required to recognize impairments of these intangible assets.
Impairment of definite-lived intangible assets.
Reviews are regularly performed to determine whether facts or circumstances exist that indicate that the carrying values of our definite-lived intangible assets to be held and used are impaired. If we determine such facts or circumstances exist, we estimate the recoverability of these assets by comparing the projected undiscounted net cash flows associated with these assets to their respective carrying values. If the sum of the projected undiscounted net cash flows is less than the carrying value of the asset, the impairment charge is measured as the excess of the carrying value over the fair value of that asset. We determine fair value by using the appropriate income approach valuation methodology depending on the nature of the intangible asset.
Evaluation of long-lived assets for impairment
We periodically re-evaluate the carrying values and estimated useful lives of long-lived assets whenever events or changes in circumstances indicate that the carrying values of these assets may not be recoverable. We use estimates of undiscounted cash flows from long-lived assets to determine whether the carrying values of such assets are recoverable over the assets’ remaining useful lives. These estimates include assumptions about our future performance and the performance of the markets we serve. If an asset is determined to be impaired, the impairment is the amount by which its carrying value exceeds its fair value. These evaluations are performed at a level where discrete cash flows may be attributed to either an individual asset or a group of assets.
Income Taxes
As part of the process of preparing our financial statements, we are required to estimate our provision for income taxes in each of the jurisdictions in which we operate. This involves estimating our actual current tax exposure, including assessing the risks associated with tax audits, together with assessing temporary differences resulting from the different treatment of items for tax and accounting purposes. These differences result in deferred tax assets and liabilities. We assess the likelihood that our deferred tax assets will be recovered from future taxable income and record a valuation allowance to reduce the deferred tax assets to an amount that, in our judgment, is more likely than not to be recovered.
Management judgment is required in determining our provision for income taxes, our deferred tax assets and liabilities, and any valuation allowance recorded against our deferred tax assets. The valuation allowance is based on our estimates of future taxable income and the period over which we expect the deferred tax assets to be recovered. Our assessment of future taxable income is based on historical experience and current and anticipated market and economic conditions and trends. In the event that actual results differ from these estimates, or we adjust our estimates in the future, we may need to adjust our valuation allowance, which could materially impact our consolidated financial position and results of operations.
54
Pension and Other Post-Retirement Benefit Plans
We sponsor various pension and other post-retirement benefit plans covering our current and former employees in several countries. The estimates of the obligations and related expense of these plans recorded in the financial statements are based on certain assumptions. The most significant assumptions relate to discount rate, expected return on plan assets, and rate of increase in healthcare costs. Other assumptions used include employee demographic factors such as compensation rate increases, retirement patterns, employee turnover rates, and mortality rates. We review these assumptions annually.
Our review of demographic assumptions includes analyzing historical patterns and/or referencing industry standard tables, combined with our expectations around future compensation and staffing strategies. The difference between these assumptions and our actual experience results in the recognition of an actuarial gain or loss. Actuarial gains and losses are recorded directly to other comprehensive loss. If the total net actuarial gain or loss included in accumulated other comprehensive loss exceeds a threshold of
10%
of the greater of the projected benefit obligation or the market related value of plan assets, it is subject to amortization and recorded as a component of net periodic pension cost over the average remaining service lives of the employees participating in the pension or post-retirement benefit plan.
The discount rate reflects the current rate at which the pension and other post-retirement liabilities could be effectively settled, considering the timing of expected payments for plan participants. It is used to discount the estimated future obligations of the plans to the present value of the liability reflected in the financial statements. In estimating this rate in countries that have a market of high-quality fixed-income investments, we consider rates of return on these investments included in various bond indices, adjusted to eliminate the effects of call provisions and differences in the timing and amounts of cash outflows related to the bonds. In other countries where a market of high-quality fixed-income investments does not exist, we estimate the discount rate using government bond yields or long-term inflation rates.
The expected return on plan assets reflects the average rate of earnings expected on the funds invested to provide for the benefits included in the projected benefit obligation. To determine the expected return on plan assets, we consider the historical returns earned by similarly invested assets, the rates of return expected on plan assets in the future, and our investment strategy and asset mix with respect to the plans’ funds.
The rate of increase of healthcare costs directly impacts the estimate of our future obligations in connection with our post-retirement medical benefits. Our estimate of healthcare cost trends is based on historical increases in healthcare costs under similarly designed plans, the level of increase in healthcare costs expected in the future, and the design features of the underlying plan.
We have adopted use of the Retirement Plan ("RP") 2014 mortality tables with the updated Mortality Projection ("MP") 2017 mortality improvement scale as issued by the Society of Actuaries in 2017 for our U.S. defined benefit plans. The updated MP 2017 mortality improvement scale reflects improvements in longevity as compared to the MP 2016 mortality improvement scale the Society of Actuaries issued in 2016, primarily because it includes actual Social Security mortality data through 2015. The MP projection scale is used to factor in projected mortality improvements over time, based on age and date of birth (i.e., two-dimension generational).
Future changes to assumptions, or differences between actual and expected outcomes, can significantly affect our future net periodic pension cost, projected benefit obligations, and accumulated other comprehensive loss.
Share-Based Compensation
ASC Topic 718,
Compensation—Stock Compensation
(“ASC 718”), requires that a company measure at fair value any new or modified share-based compensation arrangements with employees, such as stock options and restricted stock units, and recognize as compensation expense that fair value over the requisite service period.
We estimate the fair value of options on the date of grant using the Black-Scholes-Merton option-pricing model. Key assumptions used in estimating the grant-date fair value of these options are as follows: the fair value of the ordinary shares, expected term, expected volatility, risk-free interest rate, and expected dividend yield. Material changes to any of these assumptions may have a significant effect on our valuation of options, and, ultimately, the share-based compensation expense recorded in the consolidated statements of operations. Significant factors used in determining these assumptions are detailed below.
We use the closing price of our ordinary shares on the New York Stock Exchange (the "NYSE") on the date of the grant as the fair value of ordinary shares in the Black-Scholes-Merton option-pricing model.
55
The expected term, which is a key factor in measuring the fair value and related compensation cost of share-based payments, has been determined by comparing the terms of our options granted against those of publicly-traded companies within our industry.
We consider our own historical volatility, as well as the historical and implied volatilities of publicly-traded companies within our industry, in estimating expected volatility for options. Implied volatility provides a forward-looking indication and may offer insight into expected industry volatility.
The risk-free interest rate is based on the yield for a U.S. Treasury security having a maturity similar to the expected term of the related option grant.
The dividend yield of 0% is based on our history of having never declared or paid any dividends on our ordinary shares, and our current intention of not declaring any such dividends in the foreseeable future. See Item 5, "Market for Registrant's Common Equity, Related Stockholder Matters, and Issuer Purchases of Equity Securities," included elsewhere in this Annual Report on Form 10-K for further discussion of limitations on our ability to pay dividends.
Restricted securities are valued using the closing price of our ordinary shares on the NYSE on the date of the grant. Certain of our restricted securities include performance conditions that require us to estimate the probable outcome of the performance condition. This assessment is based on management's judgment using internally developed forecasts and is assessed at each reporting period. Compensation cost is recorded if it is probable that the performance condition will be achieved.
Under the fair value recognition provisions of ASC 718, we recognize share-based compensation net of estimated forfeitures and, therefore, only recognize compensation cost for those awards expected to vest over the requisite service period. The forfeiture rate is based on our estimate of forfeitures by plan participants after consideration of historical forfeiture rates. Compensation expense recognized for each award ultimately reflects the number of units that actually vest.
Off-Balance Sheet Arrangements
From time to time, we execute contracts that require us to indemnify the other parties to the contracts. These indemnification obligations generally arise in two contexts. First, in connection with certain transactions, such as the sale of a business or the issuance of debt or equity securities, the agreement typically contains standard provisions requiring us to indemnify the purchaser against breaches by us of representations and warranties contained in the agreement. These indemnities are generally subject to time and liability limitations. Second, we enter into agreements in the ordinary course of business, such as customer contracts, that might contain indemnification provisions relating to product quality, intellectual property infringement, governmental regulations and employment related matters, and other typical indemnities. In certain cases, indemnification obligations arise by law. We believe that our indemnification obligations are consistent with other companies in the markets in which we compete. Performance under any of these indemnification obligations would generally be triggered by a breach of the terms of the contract or by a third-party claim. Historically, we have experienced only immaterial and irregular losses associated with these indemnifications. Consequently, any future liabilities brought about by these indemnifications cannot reasonably be estimated or accrued. Refer to Note 14, "Commitments and Contingencies," of our audited consolidated financial statements included elsewhere in this Annual Report on Form 10-K for further discussion of specific indemnifications.
Recent Accounting Pronouncements
Recently issued accounting standards to be adopted in a future period:
In May 2014, the Financial Accounting Standards Board ("FASB") issued Accounting Standards Update ("ASU") No. 2014-09,
Revenue from Contracts with Customers (Topic 606)
, which modifies how all entities recognize revenue, and consolidates into one ASC Topic (ASC Topic 606,
Revenue from Contracts with Customers
) the current guidance found in ASC Topic 605 and various other revenue accounting standards for specialized transactions and industries. FASB ASU No. 2014-09 outlines a comprehensive five-step revenue recognition model based on the principle that an entity should recognize revenue to depict the transfer of promised goods or services to customers in an amount that reflects the consideration to which the entity expects to be entitled in exchange for those goods or services. FASB ASU No. 2014-09 may be applied using either a full retrospective approach, under which all years included in the financial statements will be presented under the revised guidance, or a modified retrospective approach, under which financial statements will be prepared under the revised guidance for the year of adoption, but not for prior years. Under the latter method, entities will recognize a cumulative catch-up adjustment to the opening balance of retained earnings at the effective date for contracts that still require performance by the entity.
In August 2015, the FASB issued ASU No. 2015-14,
Revenue from Contracts with Customers (Topic 606): Deferral of Effective Date
, which defers the effective date of FASB ASU No. 2014-09 by one year. FASB ASU No. 2014-09 is now
56
effective for annual reporting periods beginning after December 15, 2017, including interim periods within those annual reporting periods. We have developed an implementation plan to adopt this new guidance, which included an assessment of the impact of the new guidance on our financial position and results of operations. This implementation plan is substantially complete. We have determined that this standard will not have a material impact on our financial position or results of operations. We adopted FASB ASU No. 2014-09 on January 1, 2018 using the modified retrospective transition method.
In February 2016, the FASB issued ASU No. 2016-02,
Leases (Topic 842)
, which establishes new accounting and disclosure requirements for leases. FASB ASU No. 2016-02 requires lessees to classify most leases as either finance or operating leases and to initially recognize a lease liability and right-of-use asset. Entities may elect to account for certain short-term leases (with a term of 12 months or less) using a method similar to the current operating lease model. The statements of operations will include, for finance leases, separate recognition of interest on the lease liability and amortization of the right-of-use asset and for operating leases, a single lease cost, calculated so that the cost of the lease is allocated over the lease term on a straight-line basis. At December 31, 2017, we are contractually obligated to make future payments of
$68.6 million
under our operating lease obligations in existence as of that date, primarily related to long-term leases. While we are in the early stages of our implementation process for FASB ASU No. 2016-02, and have not yet determined its impact on our financial position or results of operations, these leases would potentially be required to be presented on the balance sheet in accordance with the requirements of FASB ASU No. 2016-02. FASB ASU No. 2016-02 is effective for annual reporting periods beginning after December 15, 2018, including interim periods within those annual reporting periods, with early adoption permitted. FASB ASU No. 2016-02 must be applied using a modified retrospective approach, which requires recognition and measurement of leases at the beginning of the earliest period presented, with certain practical expedients available.
In August 2017, the FASB issued ASU No. 2017-12,
Derivatives and Hedging (Topic 815)
, which changes both the designation and measurement guidance for qualifying hedging relationships and the presentation of hedge results, in order to better align an entity’s risk management activities and financial reporting for hedging relationships. The amendments expand and refine hedge accounting for both nonfinancial and financial risk components and align the recognition and presentation of the effects of the hedging instrument and the hedged item in the financial statements. FASB ASU No. 2017-12 is effective for annual reporting periods beginning after December 15, 2018, including interim periods within those annual reporting periods, with early adoption permitted. We are still evaluating the impact that this guidance will have on our financial position or results of operations, and we have not yet determined whether we will early adopt FASB ASU No. 2017-12.
57
|
ITEM 7A.
|
QUANTITATIVE AND QUALITATIVE DISCLOSURES ABOUT MARKET RISK
|
We are exposed to changes in interest rates and foreign currency exchange rates because we finance certain operations through fixed and variable rate debt instruments and transact in a variety of foreign currencies. We are also exposed to changes in the prices of certain commodities (primarily metals) that we use in production. Changes in these rates and commodity prices may have an impact on future cash flows and earnings. We generally manage these risks through the use of derivative financial instruments. We do not enter into derivative financial instruments for trading or speculative purposes.
By using derivative instruments, we are subject to credit and market risk. The fair market values of these derivative instruments are based upon valuation models whose inputs are derived using market observable inputs, including foreign currency exchange and commodity spot and forward rates, and reflect the asset and liability positions as of the end of each reporting period. When the fair value of a derivative contract is positive, the counterparty is liable to us, thus creating a receivable risk for us. We are exposed to counterparty credit (or repayment) risk in the event of non-performance by counterparties to our derivative agreements. We attempt to minimize this risk by entering into transactions with major financial institutions of investment grade credit rating.
Interest Rate Risk
Given the leveraged nature of our company, we have exposure to changes in interest rates. From time to time, we may execute a variety of interest rate derivative instruments to manage interest rate risk. For example, in the past, we have entered into interest rate collars and interest rate caps to reduce exposure to variability in cash flows relating to interest payments on our outstanding debt. These derivatives are accounted for in accordance with Accounting Standards Codification ("ASC") Topic 815,
Derivatives and Hedging
(“ASC 815”).
The significant components of our debt as of
December 31, 2017
and
2016
are shown in the following tables (definitions and descriptions of all components of our debt can be found in Note 8, "Debt," of our audited consolidated financial statements included elsewhere in this Annual Report on Form 10-K):
|
(Dollars in millions)
|
Maturity date
|
Interest rate as of December 31, 2017
|
Outstanding balance as of December 31, 2017
(1)
|
Fair value as of December 31, 2017
|
||||||||
|
Term Loan
(3)
|
October 14, 2021
|
3.21
|
%
|
$
|
927.8
|
|
$
|
930.1
|
|
|||
|
4.875% Senior Notes
|
October 15, 2023
|
4.875
|
%
|
500.0
|
|
521.9
|
|
|||||
|
5.625% Senior Notes
|
November 1, 2024
|
5.625
|
%
|
400.0
|
|
439.0
|
|
|||||
|
5.0% Senior Notes
|
October 1, 2025
|
5.00
|
%
|
700.0
|
|
741.1
|
|
|||||
|
6.25% Senior Notes
|
February 15, 2026
|
6.25
|
%
|
750.0
|
|
813.8
|
|
|||||
|
Total
(2)(4)
|
$
|
3,277.8
|
|
$
|
3,445.9
|
|
||||||
_________________
|
(1)
|
Outstanding balance is presented excluding discount and deferred financing costs.
|
|
(2)
|
Total outstanding balance excludes capital leases and other financing obligations of
$34.7 million
.
|
|
(3)
|
This component of our debt accrues interest at a variable rate calculated on the basis of a three hundred and sixty day year and actual days elapsed (which results in more interest, as applicable, being paid than if computed on the basis of a three hundred and sixty-five day year).
|
|
(4)
|
Total has been calculated based on unrounded amounts, and may not equal the sum of the rounded balances in this table.
|
58
|
(Dollars in millions)
|
Interest rate as of December 31, 2016
|
Outstanding balance as of December 31, 2016
(1)
|
Fair value as of December 31, 2016
|
|||||||
|
Term loan
(3)
|
3.02
|
%
|
$
|
937.8
|
|
$
|
942.5
|
|
||
|
4.875% Senior Notes
|
4.875
|
%
|
500.0
|
|
514.4
|
|
||||
|
5.625% Senior Notes
|
5.625
|
%
|
400.0
|
|
417.8
|
|
||||
|
5.0% Senior Notes
|
5.00
|
%
|
700.0
|
|
686.0
|
|
||||
|
6.25% Senior Notes
|
6.25
|
%
|
750.0
|
|
786.1
|
|
||||
|
Total
(2)(4)
|
$
|
3,287.8
|
|
$
|
3,346.7
|
|
||||
_________________
|
(1)
|
Outstanding balance is presented excluding discount and deferred financing costs.
|
|
(2)
|
Total outstanding balance excludes capital leases and other financing obligations of
$37.1 million
.
|
|
(3)
|
This component of our debt accrues interest at a variable rate.
|
|
(4)
|
Total has been calculated based on unrounded amounts, and may not equal the sum of the rounded balances in this table.
|
Sensitivity Analysis
As of
December 31, 2017
, we had total variable rate debt with an outstanding balance of
$927.8 million
issued under the term loan (the “Term Loan”) provided pursuant to the eighth amendment to the credit agreement dated as of May 12, 2011 (as amended, the "Credit Agreement"). An increase of 100 basis points in the applicable interest rate would result in additional annual interest expense of
$9.4 million
in 2018. The next 100 basis point increase in the applicable interest rate would result in incremental annual interest expense of
$9.4 million
in 2018.
As of
December 31, 2016
, we had total variable rate debt with an outstanding balance of
$937.8 million
issued under the term loan provided pursuant to the sixth amendment to the Credit Agreement. Considering the impact of our interest rate floor, an increase of 100 basis points in the applicable interest rate would have resulted in additional annual interest expense of
$9.3 million
. The next 100 basis point increase in the applicable interest rate would have resulted in incremental annual interest expense of
$9.3 million
.
Foreign Currency Risks
We are exposed to market risk from changes in foreign currency exchange rates, which could affect operating results as well as our financial position and cash flows. We monitor our exposures to these market risks and may employ derivative financial instruments, such as swaps, collars, forwards, options, or other instruments, to limit the volatility to earnings and cash flows generated by these exposures. We employ derivative contracts that may or may not be designated for hedge accounting treatment under ASC 815, which can result in volatility to earnings depending upon fluctuations in the underlying markets. Derivative financial instruments are executed solely as risk management tools and not for trading or speculative purposes.
Our significant foreign currency exposures include the Euro, Japanese yen, Mexican peso, Chinese renminbi, Korean won, Malaysian ringgit, British pound sterling, and Bulgarian lev.
Consistent with our risk management objective and strategy to reduce exposure to variability in cash flows and variability in earnings, we entered into foreign currency exchange rate derivatives during the year ended
December 31, 2017
that qualify as cash flow hedges, and that are intended to offset the effect of exchange rate fluctuations on forecasted sales and certain manufacturing costs. The effective portion of changes in the fair value of derivatives designated and qualifying as cash flow hedges is recorded in accumulated other comprehensive loss and is subsequently reclassified into earnings in the period in which the hedged forecasted transaction affects earnings. During
2017
we also entered into foreign currency forward contracts that were not designated for hedge accounting purposes. In accordance with ASC 815, we recognized the change in the fair value of these non-designated derivatives in the consolidated statement of operations.
59
The following foreign currency forward contracts were outstanding as of
December 31, 2017
:
|
Notional
(in millions) |
Effective Date
|
Maturity Date
|
Index
|
Weighted- Average Strike Rate
|
Cash Flow Hedge Designation
|
|||||
|
61.0 EUR
|
December 27, 2017
|
January 31, 2018
|
Euro to U.S. Dollar Exchange Rate
|
1.19 USD
|
Non-designated
|
|||||
|
443.0 EUR
|
Various from March 2016 to December 2017
|
Various from January 2018 to December 2019
|
Euro to U.S. Dollar Exchange Rate
|
1.15 USD
|
Designated
|
|||||
|
640.0 CNY
|
December 26, 2017
|
January 31, 2018
|
U.S. Dollar to Chinese Renminbi Exchange Rate
|
6.57 CNY
|
Non-designated
|
|||||
|
960.0 CNY
|
Various from October to December 2017
|
Various from January to December 2018
|
U.S. Dollar to Chinese Renminbi Exchange Rate
|
6.72 CNY
|
Designated
|
|||||
|
200.0 JPY
|
December 27, 2017
|
January 31, 2018
|
U.S. Dollar to Japanese Yen Exchange Rate
|
112.83 JPY
|
Non-designated
|
|||||
|
40,954.5 KRW
|
Various from March 2016 to December 2017
|
Various from January 2018 to November 2019
|
U.S. Dollar to Korean Won Exchange Rate
|
1,130.61 KRW
|
Designated
|
|||||
|
19.5 MYR
|
Various from March to November 2016
|
Various from January to October 2018
|
U.S. Dollar to Malaysian Ringgit Exchange Rate
|
4.21 MYR
|
Designated
|
|||||
|
215.0 MXN
|
December 27, 2017
|
January 31, 2018
|
U.S. Dollar to Mexican Peso Exchange Rate
|
19.83 MXN
|
Non-designated
|
|||||
|
2,541.0 MXN
|
Various from March 2016 to December 2017
|
Various from January 2018 to November 2019
|
U.S. Dollar to Mexican Peso Exchange Rate
|
20.25 MXN
|
Designated
|
|||||
|
35.5 GBP
|
Various from March 2016 to December 2017
|
Various from January 2018 to November 2019
|
British Pound Sterling to U.S. Dollar Exchange Rate
|
1.31 USD
|
Designated
|
|||||
60
The following foreign currency forward contracts were outstanding as of
December 31, 2016
:
|
Notional
(in millions) |
Effective Date
|
Maturity Date
|
Index
|
Weighted- Average Strike Rate
|
Cash Flow Hedge Designation
|
|||||
|
97.7 EUR
|
Various from February 2015 to December 2016
|
January 31, 2017
|
Euro to U.S. Dollar Exchange Rate
|
1.07 USD
|
Non-designated
|
|||||
|
444.9 EUR
|
Various from March 2015 to December 2016
|
Various from February 2017 to December 2018
|
Euro to U.S. Dollar Exchange Rate
|
1.13 USD
|
Designated
|
|||||
|
545.0 CNY
|
December 22, 2016
|
January 26, 2017
|
U.S. Dollar to Chinese Renminbi Exchange Rate
|
7.01 CNY
|
Non-designated
|
|||||
|
720.0 JPY
|
December 22, 2016
|
January 31, 2017
|
U.S. Dollar to Japanese Yen Exchange Rate
|
117.20 JPY
|
Non-designated
|
|||||
|
3,321.6 KRW
|
Various from February 2015 to August 2016
|
January 31, 2017
|
U.S. Dollar to Korean Won Exchange Rate
|
1,158.87 KRW
|
Non-designated
|
|||||
|
50,239.2 KRW
|
Various from March 2015 to December 2016
|
Various from February 2017 to November 2018
|
U.S. Dollar to Korean Won Exchange Rate
|
1,157.71 KRW
|
Designated
|
|||||
|
5.7 MYR
|
Various from February 2015 to April 2016
|
January 31, 2017
|
U.S. Dollar to Malaysian Ringgit Exchange Rate
|
4.02 MYR
|
Non-designated
|
|||||
|
81.8 MYR
|
Various from March 2015 to November 2016
|
Various from February 2017 to October 2018
|
U.S. Dollar to Malaysian Ringgit Exchange Rate
|
4.17 MYR
|
Designated
|
|||||
|
204.0 MXN
|
Various from February 2015 to December 2016
|
January 31, 2017
|
U.S. Dollar to Mexican Peso Exchange Rate
|
18.62 MXN
|
Non-designated
|
|||||
|
2,072.7 MXN
|
Various from March 2015 to December 2016
|
Various from February 2017 to December 2018
|
U.S. Dollar to Mexican Peso Exchange Rate
|
19.00 MXN
|
Designated
|
|||||
|
21.5 GBP
|
Various from February 2015 to December 2016
|
January 31, 2017
|
British Pound Sterling to U.S. Dollar Exchange Rate
|
1.27 USD
|
Non-designated
|
|||||
|
56.2 GBP
|
Various from March 2015 to December 2016
|
Various from February 2017 to December 2018
|
British Pound Sterling to U.S. Dollar Exchange Rate
|
1.40 USD
|
Designated
|
|||||
61
Sensitivity Analysis
The tables below present our foreign currency forward contracts as of
December 31, 2017
and
2016
and the estimated impact to future pre-tax earnings as a result of a 10% strengthening/weakening in the foreign currency exchange rate:
|
(Amounts in millions)
|
(Decrease)/increase to future pre-tax earnings due to:
|
|||||||||||
|
Net asset (liability) balance as of December 31, 2017
|
10% strengthening of the value of the
foreign currency relative to the U.S. dollar
|
10% weakening of the value of the
foreign currency relative to the U.S. dollar
|
||||||||||
|
Euro
|
$
|
(30.6
|
)
|
$
|
(61.5
|
)
|
$
|
61.5
|
|
|||
|
Chinese Renminbi
|
$
|
(3.6
|
)
|
$
|
(24.4
|
)
|
$
|
24.4
|
|
|||
|
British Pound Sterling
|
$
|
2.0
|
|
$
|
4.8
|
|
$
|
(4.8
|
)
|
|||
|
Japanese Yen
|
$
|
0.0
|
|
$
|
0.2
|
|
$
|
(0.2
|
)
|
|||
|
Korean Won
|
$
|
(2.3
|
)
|
$
|
(3.9
|
)
|
$
|
3.9
|
|
|||
|
Malaysian Ringgit
|
$
|
0.2
|
|
$
|
0.5
|
|
$
|
(0.5
|
)
|
|||
|
Mexican Peso
|
$
|
(2.6
|
)
|
$
|
13.4
|
|
$
|
(13.4
|
)
|
|||
|
(Amounts in millions)
|
(Decrease)/increase to future pre-tax earnings due to:
|
|||||||||||
|
Net asset (liability) balance as of December 31, 2016
|
10% strengthening of the value of the
foreign currency relative to the U.S. dollar
|
10% weakening of the value of the
foreign currency relative to the U.S. dollar
|
||||||||||
|
Euro
|
$
|
30.3
|
|
$
|
(57.6
|
)
|
$
|
57.6
|
|
|||
|
Chinese Renminbi
|
$
|
0.1
|
|
$
|
(7.8
|
)
|
$
|
7.8
|
|
|||
|
British Pound Sterling
|
$
|
(10.1
|
)
|
$
|
9.6
|
|
$
|
(9.6
|
)
|
|||
|
Japanese Yen
|
$
|
0.0
|
|
$
|
0.6
|
|
$
|
(0.6
|
)
|
|||
|
Korean Won
|
$
|
1.9
|
|
$
|
(4.4
|
)
|
$
|
4.4
|
|
|||
|
Malaysian Ringgit
|
$
|
(1.8
|
)
|
$
|
1.9
|
|
$
|
(1.9
|
)
|
|||
|
Mexican Peso
|
$
|
(14.8
|
)
|
$
|
10.6
|
|
$
|
(10.6
|
)
|
|||
Commodity Risk
We enter into forward contracts with third parties to offset a portion of our exposure to the potential change in prices associated with certain commodities, including silver, gold, platinum, palladium, copper, aluminum, and nickel, used in the manufacturing of our products. The terms of these forward contracts fix the price at a future date for various notional amounts associated with these commodities. These derivatives are not designated as accounting hedges. In accordance with ASC 815, we recognize the change in fair value of these derivatives in the consolidated statements of operations.
62
Sensitivity Analysis
The tables below present our commodity forward contracts as of
December 31, 2017
and
2016
and the estimated impact to pre-tax earnings associated with a 10% increase/(decrease) in the related forward price for each commodity:
|
(Amounts in millions, except price per unit and notional amounts)
|
Increase/(decrease)
to pre-tax earnings due to
|
|||||||||||||
|
Commodity
|
Net (liability)/asset balance as of December 31, 2017
|
Notional
|
Weighted-
Average Strike
Price Per Unit
|
Average Forward Price Per Unit as of December 31, 2017
|
Expiration
|
|||||||||
|
10% increase
in the forward price
|
10% decrease
in the forward price
|
|||||||||||||
|
Silver
|
$(0.6)
|
1,117,049 troy oz.
|
$17.75
|
$17.20
|
Various dates during 2018 and 2019
|
$1.9
|
$(1.9)
|
|||||||
|
Gold
|
$0.4
|
12,200 troy oz.
|
$1,288.85
|
$1,322.24
|
Various dates during 2018 and 2019
|
$1.6
|
$(1.6)
|
|||||||
|
Nickel
|
$0.3
|
275,490 pounds
|
$4.84
|
$5.83
|
Various dates during 2018 and 2019
|
$0.2
|
$(0.2)
|
|||||||
|
Aluminum
|
$0.9
|
5,592,797 pounds
|
$0.88
|
$1.04
|
Various dates during 2018 and 2019
|
$0.6
|
$(0.6)
|
|||||||
|
Copper
|
$4.4
|
7,413,661 pounds
|
$2.71
|
$3.30
|
Various dates during 2018 and 2019
|
$2.4
|
$(2.4)
|
|||||||
|
Platinum
|
$(0.3)
|
8,029 troy oz.
|
$987.12
|
$943.94
|
Various dates during 2018 and 2019
|
$0.8
|
$(0.8)
|
|||||||
|
Palladium
|
$0.4
|
1,935 troy oz.
|
$819.85
|
$1,022.19
|
Various dates during 2018 and 2019
|
$0.2
|
$(0.2)
|
|||||||
|
(Amounts in millions, except price per unit and notional amounts)
|
Increase/(decrease)
to pre-tax earnings due to
|
|||||||||||||
|
Commodity
|
Net (liability)/asset balance as of December 31, 2016
|
Notional
|
Weighted-
Average Strike Price Per Unit |
Average Forward Price Per Unit as of December 31, 2016
|
Expiration
|
|||||||||
|
10% increase
in the forward price
|
10% decrease
in the forward price
|
|||||||||||||
|
Silver
|
$(0.8)
|
1,069,914 troy oz.
|
$17.09
|
$16.32
|
Various dates during 2017 and 2018
|
$1.7
|
$(1.7)
|
|||||||
|
Gold
|
$(0.9)
|
14,113 troy oz.
|
$1,233.30
|
$1,167.90
|
Various dates during 2017 and 2018
|
$1.6
|
$(1.6)
|
|||||||
|
Nickel
|
$(0.1)
|
339,402 pounds
|
$4.98
|
$4.58
|
Various dates during 2017 and 2018
|
$0.2
|
$(0.2)
|
|||||||
|
Aluminum
|
$0.1
|
5,807,659 pounds
|
$0.76
|
$0.77
|
Various dates during 2017 and 2018
|
$0.4
|
$(0.4)
|
|||||||
|
Copper
|
$1.4
|
7,707,228 pounds
|
$2.32
|
$2.51
|
Various dates during 2017 and 2018
|
$1.9
|
$(1.9)
|
|||||||
|
Platinum
|
$(0.9)
|
8,719 troy oz.
|
$1,017.41
|
$911.87
|
Various dates during 2017 and 2018
|
$0.8
|
$(0.8)
|
|||||||
|
Palladium
|
$0.1
|
1,923 troy oz.
|
$641.43
|
$685.73
|
Various dates during 2017 and 2018
|
$0.1
|
$(0.1)
|
|||||||
63
|
ITEM 8.
|
FINANCIAL STATEMENTS AND SUPPLEMENTARY DATA
|
|
1.
|
Financial Statements
|
The following audited consolidated financial statements of Sensata Technologies Holding N.V. are included in this Annual Report on Form 10-K:
|
2.
|
Financial Statement Schedules
|
The following schedules are included elsewhere in this Annual Report on Form 10-K:
Schedule I — Condensed Financial Information of the Registrant
Schedule II — Valuation and Qualifying Accounts
Schedules other than those listed above have been omitted since the required information is not present, or not present in amounts sufficient to require submission of the schedule, or because the information required is included in the audited consolidated financial statements or the notes thereto.
64
REPORT OF INDEPENDENT REGISTERED PUBLIC ACCOUNTING FIRM
To the Shareholders and the Board of Directors of
Sensata Technologies Holding N.V.
Opinion on the Financial Statements
We have audited the accompanying consolidated balance sheets of Sensata Technologies Holding N.V. as of
December 31, 2017
and
2016
, and the related consolidated statements of operations, comprehensive income, cash flows and changes in shareholders’ equity for each of the three years in the period ended
December 31, 2017
, and the related notes and financial statement schedules listed in the Index at Item 15(a) (collectively referred to as the “financial statements”). In our opinion, the financial statements present fairly, in all material respects, the consolidated financial position of the Company at
December 31, 2017
and
2016
, and the consolidated results of its operations and its cash flows for each of the three years in the period ended December 31, 2017, in conformity with U.S. generally accepted accounting principles.
We also have audited, in accordance with the standards of the Public Company Accounting Oversight Board (United States) (PCAOB), the Company's internal control over financial reporting as of
December 31, 2017
, based on criteria established in Internal Control-Integrated Framework issued by the Committee of Sponsoring Organizations of the Treadway Commission (2013 framework), and our report dated
February 1, 2018
expressed an unqualified opinion thereon.
Basis for Opinion
These financial statements are the responsibility of the Company's management. Our responsibility is to express an opinion on the Company’s financial statements based on our audits. We are a public accounting firm registered with the PCAOB and are required to be independent with respect to the Company in accordance with the U.S. federal securities laws and the applicable rules and regulations of the Securities and Exchange Commission and the PCAOB.
We conducted our audits in accordance with the standards of the PCAOB. Those standards require that we plan and perform the audit to obtain reasonable assurance about whether the financial statements are free of material misstatement, whether due to error or fraud. Our audits included performing procedures to assess the risks of material misstatement of the financial statements, whether due to error or fraud, and performing procedures that respond to those risks. Such procedures included examining, on a test basis, evidence regarding the amounts and disclosures in the financial statements. Our audits also included evaluating the accounting principles used and significant estimates made by management, as well as evaluating the overall presentation of the financial statements. We believe that our audits provide a reasonable basis for our opinion.
|
/s/ ERNST & YOUNG LLP
|
|||
We have served as the Company's auditor since 2005
Boston, Massachusetts
February 1, 2018
65
SENSATA TECHNOLOGIES HOLDING N.V.
(In thousands, except per share amounts)
|
December 31, 2017
|
December 31, 2016
|
||||||
|
Assets
|
|||||||
|
Current assets:
|
|||||||
|
Cash and cash equivalents
|
$
|
753,089
|
|
$
|
351,428
|
|
|
|
Accounts receivable, net of allowances of $12,947 and $11,811 as of December 31, 2017 and 2016, respectively
|
556,541
|
|
500,211
|
|
|||
|
Inventories
|
446,129
|
|
389,844
|
|
|||
|
Prepaid expenses and other current assets
|
92,532
|
|
100,002
|
|
|||
|
Total current assets
|
1,848,291
|
|
1,341,485
|
|
|||
|
Property, plant and equipment, net
|
750,049
|
|
724,046
|
|
|||
|
Goodwill
|
3,005,464
|
|
3,005,464
|
|
|||
|
Other intangible assets, net
|
920,124
|
|
1,075,431
|
|
|||
|
Deferred income tax assets
|
33,003
|
|
20,695
|
|
|||
|
Other assets
|
84,594
|
|
73,855
|
|
|||
|
Total assets
|
$
|
6,641,525
|
|
$
|
6,240,976
|
|
|
|
Liabilities and shareholders’ equity
|
|||||||
|
Current liabilities:
|
|||||||
|
Current portion of long-term debt, capital lease and other financing obligations
|
$
|
15,720
|
|
$
|
14,643
|
|
|
|
Accounts payable
|
322,671
|
|
299,198
|
|
|||
|
Income taxes payable
|
31,544
|
|
23,889
|
|
|||
|
Accrued expenses and other current liabilities
|
259,560
|
|
245,566
|
|
|||
|
Total current liabilities
|
629,495
|
|
583,296
|
|
|||
|
Deferred income tax liabilities
|
338,228
|
|
392,628
|
|
|||
|
Pension and other post-retirement benefit obligations
|
40,055
|
|
34,878
|
|
|||
|
Capital lease and other financing obligations, less current portion
|
28,739
|
|
32,369
|
|
|||
|
Long-term debt, net
|
3,225,810
|
|
3,226,582
|
|
|||
|
Other long-term liabilities
|
33,572
|
|
29,216
|
|
|||
|
Total liabilities
|
4,295,899
|
|
4,298,969
|
|
|||
|
Commitments and contingencies (Note 14)
|
|
|
|||||
|
Shareholders’ equity:
|
|||||||
|
Ordinary shares, €0.01 nominal value per share, 400,000 shares authorized; 178,437 shares issued
|
2,289
|
|
2,289
|
|
|||
|
Treasury shares, at cost, 7,076 and 7,557 shares as of December 31, 2017 and 2016, respectively
|
(288,478
|
)
|
(306,505
|
)
|
|||
|
Additional paid-in capital
|
1,663,367
|
|
1,643,449
|
|
|||
|
Retained earnings
|
1,031,612
|
|
636,841
|
|
|||
|
Accumulated other comprehensive loss
|
(63,164
|
)
|
(34,067
|
)
|
|||
|
Total shareholders’ equity
|
2,345,626
|
|
1,942,007
|
|
|||
|
Total liabilities and shareholders’ equity
|
$
|
6,641,525
|
|
$
|
6,240,976
|
|
|
The accompanying notes are an integral part of these financial statements.
66
SENSATA TECHNOLOGIES HOLDING N.V.
(In thousands, except per share amounts)
|
|
For the year ended December 31,
|
||||||||||
|
|
2017
|
2016
|
2015
|
||||||||
|
Net revenue
|
$
|
3,306,733
|
|
$
|
3,202,288
|
|
$
|
2,974,961
|
|
||
|
Operating costs and expenses:
|
|||||||||||
|
Cost of revenue
|
2,141,308
|
|
2,084,261
|
|
1,977,799
|
|
|||||
|
Research and development
|
130,204
|
|
126,665
|
|
123,666
|
|
|||||
|
Selling, general and administrative
|
302,811
|
|
293,587
|
|
271,361
|
|
|||||
|
Amortization of intangible assets
|
161,050
|
|
201,498
|
|
186,632
|
|
|||||
|
Restructuring and special charges
|
18,975
|
|
4,113
|
|
21,919
|
|
|||||
|
Total operating costs and expenses
|
2,754,348
|
|
2,710,124
|
|
2,581,377
|
|
|||||
|
Profit from operations
|
552,385
|
|
492,164
|
|
393,584
|
|
|||||
|
Interest expense, net
|
(159,761
|
)
|
(165,818
|
)
|
(137,626
|
)
|
|||||
|
Other, net
|
9,817
|
|
(4,901
|
)
|
(50,329
|
)
|
|||||
|
Income before taxes
|
402,441
|
|
321,445
|
|
205,629
|
|
|||||
|
(Benefit from)/provision for income taxes
|
(5,916
|
)
|
59,011
|
|
(142,067
|
)
|
|||||
|
Net income
|
$
|
408,357
|
|
$
|
262,434
|
|
$
|
347,696
|
|
||
|
Basic net income per share
|
$
|
2.39
|
|
$
|
1.54
|
|
$
|
2.05
|
|
||
|
Diluted net income per share
|
$
|
2.37
|
|
$
|
1.53
|
|
$
|
2.03
|
|
||
The accompanying notes are an integral part of these financial statements.
67
SENSATA TECHNOLOGIES HOLDING N.V.
Consolidated Statements of Comprehensive Income
(In thousands)
|
|
For the year ended December 31,
|
||||||||||
|
|
2017
|
2016
|
2015
|
||||||||
|
Net income
|
$
|
408,357
|
|
$
|
262,434
|
|
$
|
347,696
|
|
||
|
Other comprehensive loss, net of tax:
|
|||||||||||
|
Deferred loss on derivative instruments, net of reclassifications
|
(28,202
|
)
|
(3,829
|
)
|
(13,726
|
)
|
|||||
|
Defined benefit and retiree healthcare plans
|
(895
|
)
|
(4,248
|
)
|
(516
|
)
|
|||||
|
Other comprehensive loss
|
(29,097
|
)
|
(8,077
|
)
|
(14,242
|
)
|
|||||
|
Comprehensive income
|
$
|
379,260
|
|
$
|
254,357
|
|
$
|
333,454
|
|
||
The accompanying notes are an integral part of these financial statements.
68
SENSATA TECHNOLOGIES HOLDING N.V.
(In thousands)
|
|
For the year ended December 31,
|
||||||||||
|
|
2017
|
2016
|
2015
|
||||||||
|
Cash flows from operating activities:
|
|||||||||||
|
Net income
|
$
|
408,357
|
|
$
|
262,434
|
|
$
|
347,696
|
|
||
|
Adjustments to reconcile net income to net cash provided by operating activities:
|
|||||||||||
|
Depreciation
|
109,321
|
|
106,903
|
|
96,051
|
|
|||||
|
Amortization of deferred financing costs and debt discounts
|
7,241
|
|
7,334
|
|
6,456
|
|
|||||
|
Gain on sale of assets
|
(1,180
|
)
|
—
|
|
—
|
|
|||||
|
Share-based compensation
|
19,819
|
|
17,425
|
|
15,326
|
|
|||||
|
Loss on debt financing
|
2,670
|
|
—
|
|
34,335
|
|
|||||
|
Amortization of inventory step-up to fair value
|
—
|
|
2,319
|
|
1,820
|
|
|||||
|
Amortization of intangible assets
|
161,050
|
|
201,498
|
|
186,632
|
|
|||||
|
Deferred income taxes
|
(56,757
|
)
|
8,344
|
|
(179,009
|
)
|
|||||
|
Unrealized loss/(gain) on hedges and other non-cash items
|
1,961
|
|
9,198
|
|
(590
|
)
|
|||||
|
Changes in operating assets and liabilities, net of effects of acquisitions:
|
|||||||||||
|
Accounts receivable, net
|
(56,330
|
)
|
(33,013
|
)
|
18,618
|
|
|||||
|
Inventories
|
(57,119
|
)
|
(37,500
|
)
|
40,526
|
|
|||||
|
Prepaid expenses and other current assets
|
(12,412
|
)
|
6,956
|
|
(9,857
|
)
|
|||||
|
Accounts payable and accrued expenses
|
23,841
|
|
(21,432
|
)
|
(38,034
|
)
|
|||||
|
Income taxes payable
|
7,655
|
|
(1,938
|
)
|
14,452
|
|
|||||
|
Other
|
(471
|
)
|
(7,003
|
)
|
(1,291
|
)
|
|||||
|
Net cash provided by operating activities
|
557,646
|
|
521,525
|
|
533,131
|
|
|||||
|
Cash flows from investing activities:
|
|||||||||||
|
Acquisition of CST, net of cash received
|
—
|
|
4,688
|
|
(996,871
|
)
|
|||||
|
Acquisition of Schrader, net of cash received
|
—
|
|
—
|
|
(958
|
)
|
|||||
|
Other acquisitions, net of cash received
|
—
|
|
—
|
|
3,881
|
|
|||||
|
Additions to property, plant and equipment and capitalized software
|
(144,584
|
)
|
(130,217
|
)
|
(177,196
|
)
|
|||||
|
Investment in equity securities
|
—
|
|
(50,000
|
)
|
—
|
|
|||||
|
Proceeds from sale of assets
|
8,862
|
|
751
|
|
4,775
|
|
|||||
|
Other
|
(5,000
|
)
|
—
|
|
—
|
|
|||||
|
Net cash used in investing activities
|
(140,722
|
)
|
(174,778
|
)
|
(1,166,369
|
)
|
|||||
|
Cash flows from financing activities:
|
|||||||||||
|
Proceeds from exercise of stock options and issuance of ordinary shares
|
7,450
|
|
3,944
|
|
19,411
|
|
|||||
|
Proceeds from issuance of debt
|
927,794
|
|
—
|
|
2,795,120
|
|
|||||
|
Payments on debt
|
(943,554
|
)
|
(336,256
|
)
|
(2,000,257
|
)
|
|||||
|
Payments to repurchase ordinary shares
|
(2,910
|
)
|
(4,752
|
)
|
(50
|
)
|
|||||
|
Payments of debt issuance cost
|
(919
|
)
|
(518
|
)
|
(50,052
|
)
|
|||||
|
Other
|
(3,124
|
)
|
—
|
|
—
|
|
|||||
|
Net cash (used in)/provided by financing activities
|
(15,263
|
)
|
(337,582
|
)
|
764,172
|
|
|||||
|
Net change in cash and cash equivalents
|
401,661
|
|
9,165
|
|
130,934
|
|
|||||
|
Cash and cash equivalents, beginning of year
|
351,428
|
|
342,263
|
|
211,329
|
|
|||||
|
Cash and cash equivalents, end of year
|
$
|
753,089
|
|
$
|
351,428
|
|
$
|
342,263
|
|
||
|
Supplemental cash flow items:
|
|||||||||||
|
Cash paid for interest
|
$
|
164,370
|
|
$
|
155,925
|
|
$
|
125,370
|
|
||
|
Cash paid for income taxes
|
$
|
48,482
|
|
$
|
43,152
|
|
$
|
41,301
|
|
||
The accompanying notes are an integral part of these financial statements.
69
SENSATA TECHNOLOGIES HOLDING N.V.
Consolidated Statements of Changes in Shareholders’ Equity
(In thousands)
|
|
Ordinary Shares
|
|
Treasury Shares
|
|
Additional
Paid-In Capital |
|
Retained Earnings
|
|
Accumulated
Other Comprehensive Loss |
|
Total
Share- holders’ Equity |
||||||||||||||||||
|
|
Number
|
|
Amount
|
|
Number
|
|
Amount
|
|
|||||||||||||||||||||
|
Balance as of December 31, 2014
|
178,437
|
|
$
|
2,289
|
|
(9,120
|
)
|
$
|
(365,272
|
)
|
$
|
1,610,390
|
|
$
|
67,233
|
|
$
|
(11,748
|
)
|
$
|
1,302,892
|
|
|||||||
|
Issuance of ordinary shares for employee stock plans
|
—
|
|
—
|
|
5
|
|
195
|
|
72
|
|
—
|
|
—
|
|
267
|
|
|||||||||||||
|
Surrender of shares for tax withholding
|
—
|
|
—
|
|
(54
|
)
|
(2,507
|
)
|
—
|
|
—
|
|
—
|
|
(2,507
|
)
|
|||||||||||||
|
Stock options exercised
|
—
|
|
—
|
|
1,016
|
|
38,199
|
|
236
|
|
(19,291
|
)
|
—
|
|
19,144
|
|
|||||||||||||
|
Vesting of restricted securities
|
—
|
|
—
|
|
115
|
|
4,391
|
|
—
|
|
(4,391
|
)
|
—
|
|
—
|
|
|||||||||||||
|
Share-based compensation
|
—
|
|
—
|
|
—
|
|
—
|
|
15,326
|
|
—
|
|
—
|
|
15,326
|
|
|||||||||||||
|
Net income
|
—
|
|
—
|
|
—
|
|
—
|
|
—
|
|
347,696
|
|
—
|
|
347,696
|
|
|||||||||||||
|
Other comprehensive loss
|
—
|
|
—
|
|
—
|
|
—
|
|
—
|
|
—
|
|
(14,242
|
)
|
(14,242
|
)
|
|||||||||||||
|
Balance as of December 31, 2015
|
178,437
|
|
$
|
2,289
|
|
(8,038
|
)
|
$
|
(324,994
|
)
|
|
$
|
1,626,024
|
|
$
|
391,247
|
|
$
|
(25,990
|
)
|
$
|
1,668,576
|
|
||||||
|
Surrender of shares for tax withholding
|
—
|
|
—
|
|
(62
|
)
|
(2,295
|
)
|
|
—
|
|
—
|
|
—
|
|
(2,295
|
)
|
||||||||||||
|
Stock options exercised
|
—
|
|
—
|
|
358
|
|
13,698
|
|
|
—
|
|
(9,754
|
)
|
—
|
|
3,944
|
|
||||||||||||
|
Vesting of restricted securities
|
—
|
|
—
|
|
185
|
|
7,086
|
|
|
—
|
|
(7,086
|
)
|
—
|
|
—
|
|
||||||||||||
|
Share-based compensation
|
—
|
|
—
|
|
—
|
|
—
|
|
17,425
|
|
—
|
|
—
|
|
17,425
|
|
|||||||||||||
|
Net income
|
—
|
|
—
|
|
—
|
|
—
|
|
|
—
|
|
262,434
|
|
—
|
|
262,434
|
|
||||||||||||
|
Other comprehensive loss
|
—
|
|
—
|
|
—
|
|
—
|
|
|
—
|
|
—
|
|
(8,077
|
)
|
(8,077
|
)
|
||||||||||||
|
Balance as of December 31, 2016
|
178,437
|
|
$
|
2,289
|
|
(7,557
|
)
|
$
|
(306,505
|
)
|
|
$
|
1,643,449
|
|
$
|
636,841
|
|
$
|
(34,067
|
)
|
$
|
1,942,007
|
|
||||||
|
Surrender of shares for tax withholding
|
—
|
|
—
|
|
(67
|
)
|
(2,910
|
)
|
—
|
|
—
|
|
—
|
|
(2,910
|
)
|
|||||||||||||
|
Stock options exercised
|
—
|
|
—
|
|
326
|
|
12,465
|
|
99
|
|
(5,114
|
)
|
—
|
|
7,450
|
|
|||||||||||||
|
Vesting of restricted securities
|
—
|
|
—
|
|
222
|
|
8,472
|
|
—
|
|
(8,472
|
)
|
—
|
|
—
|
|
|||||||||||||
|
Share-based compensation
|
—
|
|
—
|
|
—
|
|
—
|
|
19,819
|
|
—
|
|
—
|
|
19,819
|
|
|||||||||||||
|
Net income
|
—
|
|
—
|
|
—
|
|
—
|
|
—
|
|
408,357
|
|
—
|
|
408,357
|
|
|||||||||||||
|
Other comprehensive loss
|
—
|
|
—
|
|
—
|
|
—
|
|
—
|
|
—
|
|
(29,097
|
)
|
(29,097
|
)
|
|||||||||||||
|
Balance as of December 31, 2017
|
178,437
|
|
$
|
2,289
|
|
(7,076
|
)
|
$
|
(288,478
|
)
|
$
|
1,663,367
|
|
$
|
1,031,612
|
|
$
|
(63,164
|
)
|
$
|
2,345,626
|
|
|||||||
The accompanying notes are an integral part of these financial statements.
70
SENSATA TECHNOLOGIES HOLDING N.V.
NOTES TO CONSOLIDATED FINANCIAL STATEMENTS
(In thousands, except per share amounts, or unless otherwise noted)
1. Business Description and Basis of Presentation
Description of Business
The accompanying consolidated financial statements reflect the financial position, results of operations, comprehensive income, cash flows, and changes in shareholders' equity of Sensata Technologies Holding N.V. ("Sensata N.V.") and its wholly-owned subsidiaries, collectively referred to as the “Company,” “Sensata,” “we,” “our,” or “us.”
Sensata N.V. is incorporated under the laws of the Netherlands and conducts its operations through subsidiary companies that operate business and product development centers primarily in the United States (the "U.S."), the Netherlands, Belgium, Bulgaria, China, Germany, Japan, South Korea, and the United Kingdom (the "U.K."); and manufacturing operations primarily in China, Malaysia, Mexico, Bulgaria, France, Germany, the U.K., and the U.S. We organize our operations into
two
businesses, Performance Sensing and Sensing Solutions.
On September 28, 2017, the board of directors of Sensata N.V. unanimously approved a plan to change our parent company’s location of incorporation from the Netherlands to the U.K. To effect this change, the shareholders of Sensata N.V. are being asked to approve a cross-border merger between Sensata N.V. and Sensata Technologies Holding plc (“Sensata U.K.”), a newly formed, public limited company incorporated under the laws of England and Wales, with Sensata U.K. being the surviving entity (the “Merger”).
To this end, on January 19, 2018, Sensata N.V. filed a definitive proxy statement (DEFM14A) regarding the proposed cross-border merger, which details the proposed plan and risks to the Company and shareholders. An extraordinary general meeting will be held on February 16, 2018, at which shareholders of record as of January 19, 2018 will be asked to vote on the proposed Merger. If approved by our shareholders, we will seek review and approval of the transaction by the U.K. High Court of Justice and would expect to complete the Merger in March 2018. If the Merger is consummated, Sensata U.K. will become the publicly-traded parent of the subsidiary companies that are currently controlled by Sensata N.V.
Our Performance Sensing business is a manufacturer of pressure sensors, speed and position sensors, temperature sensors, and pressure switches used in subsystems of automobiles (e.g., powertrain, air conditioning, tire pressure monitoring, and ride stabilization) and heavy vehicle off-road ("HVOR"). These products help improve operating performance, for example, by making an automobile's heating and air conditioning systems work more efficiently, thereby improving gas mileage. These products are also used in systems that address environmental or safety concerns, for example, by reducing vehicle emissions or improving the stability control of the vehicle.
Our Sensing Solutions business is a manufacturer of various control products used in industrial, aerospace, military, commercial, medical device, and residential markets, and sensor products used in aerospace and industrial applications such as heating, ventilation, and air conditioning ("HVAC") systems and military and commercial aircraft. These products include motor and compressor protectors, motor starters, temperature sensors and switches/thermostats, pressure sensors and switches, electronic HVAC sensors and controls, charge controllers, solid state relays, linear and rotary position sensors, circuit breakers, and semiconductor burn-in test sockets. These products help prevent damage from overheating and fires in a wide variety of applications, including commercial HVAC systems, refrigerators, aircraft, lighting, and other industrial applications, and help optimize performance by using sensors which provide feedback to control systems. The Sensing Solutions business also manufactures direct current ("DC") to alternating current ("AC") power inverters, which enable the operation of electronic equipment when grid power is not available.
Basis of Presentation
The accompanying consolidated financial statements have been prepared in accordance with U.S. generally accepted accounting principles (“U.S. GAAP”). The accompanying consolidated financial statements present separately our financial position, results of operations, comprehensive income, cash flows, and changes in shareholders’ equity.
All intercompany balances and transactions have been eliminated.
All U.S. dollar and share amounts presented, except per share amounts, are stated in thousands, unless otherwise indicated.
71
Certain reclassifications have been made to prior periods to conform to current period presentation.
2. Significant Accounting Policies
Use of Estimates
The preparation of consolidated financial statements in accordance with U.S. GAAP requires us to exercise our judgment in the process of applying our accounting policies. It also requires that we make estimates and assumptions that affect the reported amounts of assets and liabilities and disclosures of contingencies at the date of the financial statements and the reported amounts of revenue and expense during the reporting periods.
Estimates are used when accounting for certain items such as allowances for doubtful accounts and sales returns, depreciation and amortization, inventory obsolescence, asset impairments (including goodwill and other intangible assets), contingencies, the value of share-based compensation, the determination of accrued expenses, certain asset valuations including deferred tax asset valuations, the useful lives of plant and equipment, post-retirement obligations, and the accounting for business combinations. The accounting estimates used in the preparation of the consolidated financial statements will change as new events occur, as more experience is acquired, as additional information is obtained, and/or as the operating environment changes. Actual results could differ from those estimates.
Cash and Cash Equivalents
Cash comprises cash on hand. Cash equivalents are short-term, highly liquid investments that are readily convertible to known amounts of cash, are subject to an insignificant risk of change in value, and have original maturities of three months or less.
Revenue Recognition
The following discussion of our revenue recognition accounting policies is based on the accounting principles that were used to prepare the fiscal year 2017 consolidated financial statements included in this Annual Report on Form 10-K. On January 1, 2018, we adopted ASC Topic 606,
Revenue from Contracts with Customers
("ASC 606"). This standard replaces existing revenue recognition rules with a comprehensive revenue measurement and recognition standard and expanded disclosure requirements.
We recognize revenue in accordance with Accounting Standards Codification ("ASC") Topic 605,
Revenue Recognition
("ASC 605"). Revenue and related cost of revenue from product sales are recognized when the significant risks and rewards of ownership have been transferred, title to the product and risk of loss transfers to our customer, and collection of sales proceeds is reasonably assured. Based on these criteria, revenue is generally recognized when the product is shipped from our warehouse or, in limited instances, when it is received by the customer, depending on the specific terms of the arrangement. Product sales are recorded net of trade discounts (including volume and early payment incentives), sales returns, value-added tax, and similar taxes. Amounts billed to our customers for shipping and handling are recorded in revenue. Shipping and handling costs are included in cost of revenue. Sales to customers generally include a right of return for defective or non-conforming product. Sales returns have not historically been significant in relation to our net revenue and have been within our estimates.
Many of our products are designed and engineered to meet customer specifications. These activities, and the testing of our products to determine compliance with those specifications, occur prior to any revenue being recognized. Products are then manufactured and sold to customers. Customer arrangements do not involve post-installation or post-sale testing and acceptance.
Share-Based Compensation
ASC Topic 718,
Compensation—Stock Compensation
(“ASC 718”), requires that a company measure at fair value any new or modified share-based compensation arrangements with employees, such as stock options and restricted stock units, and recognize as compensation expense that fair value over the requisite service period.
We estimate the fair value of options on the date of grant using the Black-Scholes-Merton option-pricing model. Key assumptions used in estimating the grant-date fair value of these options are as follows: the fair value of the ordinary shares, expected term, expected volatility, risk-free interest rate, and expected dividend yield. Significant factors used in determining these assumptions are detailed below.
We use the closing price of our ordinary shares on the New York Stock Exchange (the "NYSE") on the date of the grant as the fair value of ordinary shares in the Black-Scholes-Merton option-pricing model.
72
The expected term is determined by comparing the terms of our options granted against those of publicly-traded companies within our industry.
We consider our own historical volatility, as well as the historical and implied volatilities of publicly-traded companies within our industry, in estimating expected volatility for options. Implied volatility provides a forward-looking indication and may offer insight into expected industry volatility.
The risk-free interest rate is based on the yield for a U.S. Treasury security having a maturity similar to the expected term of the related option grant.
The dividend yield of
0%
is based on our history of having never declared or paid any dividends on our ordinary shares, and our current intention of not declaring any such dividends in the foreseeable future. See Item 5, "Market for Registrant's Common Equity, Related Stockholder Matters, and Issuer Purchases of Equity Securities," included elsewhere in this Annual Report on Form 10-K for further discussion of limitations on our ability to pay dividends.
Restricted securities are valued using the closing price of our ordinary shares on the NYSE on the date of the grant. Certain of our restricted securities include performance conditions that require us to estimate the probable outcome of the performance condition. This assessment is based on management's judgment using internally developed forecasts and is assessed at each reporting period. Compensation cost is recorded if it is probable that the performance condition will be achieved.
Under the fair value recognition provisions of ASC 718, we recognize share-based compensation net of estimated forfeitures and, therefore, only recognize compensation cost for those awards expected to vest over the requisite service period. Compensation expense recognized for each award ultimately reflects the number of units that actually vest.
Share-based compensation expense is generally recognized as a component of Selling, general and administrative (“SG&A”) expense, which is consistent with where the related employee costs are recorded. Refer to further discussion of share-based payments in Note 11, "Share-Based Payment Plans."
Financial Instruments
Derivative financial instruments:
We maintain derivative financial instruments with major financial institutions of investment grade credit rating and monitor the amount of credit exposure to any one issuer. We believe there are no significant concentrations of risk associated with our derivative financial instruments.
We account for our derivative financial instruments in accordance with ASC Topic 820,
Fair Value Measurements and Disclosures
(“ASC 820”) and with ASC Topic 815,
Derivatives and Hedging
(“ASC 815”). In accordance with ASC 815, we record all derivatives on the balance sheet at fair value. The accounting for the change in the fair value of derivatives depends on the intended use of the derivative, whether we have elected to designate a derivative as a hedging instrument for accounting purposes, and whether the hedging relationship has satisfied the criteria necessary to apply hedge accounting. In addition, ASC 815 provides that, for derivative instruments that qualify for hedge accounting, changes in the fair value are either (a) offset against the change in fair value of the hedged assets, liabilities, or firm commitments through earnings or (b) recognized in equity until the hedged item is recognized in earnings, depending on whether the derivative is being used to hedge changes in fair value or cash flows. The ineffective portion of a derivative’s change in fair value is immediately recognized in earnings. We do not use derivative financial instruments for trading or speculative purposes.
We are exposed to fluctuations in various foreign currencies against our functional currency, the U.S. dollar. We enter into forward contracts for certain foreign currencies, including the Euro, Japanese yen, Mexican peso, Chinese renminbi, Korean won, Malaysian ringgit, and British pound sterling. The fair value of foreign currency forward contracts is determined using widely accepted valuation techniques, including discounted cash flow analysis on the expected cash flows of each instrument. These analyses utilize observable market-based inputs, including foreign currency exchange rates, and reflect the contractual terms of these instruments, including the period to maturity. Certain of these contracts have not been designated as accounting hedges, and in accordance with ASC 815, we recognize the changes in the fair value of these contracts in the consolidated statements of operations. The specific contractual terms utilized as inputs in determining fair value, and a discussion of the nature of the risks being mitigated by these instruments, are detailed in Note 16, “Derivative Instruments and Hedging Activities,” under the caption
Hedges of Foreign Currency Risk.
We enter into forward contracts for certain commodities, including silver, gold, nickel, aluminum, copper, platinum, and palladium used in the manufacturing of our products. The terms of these forward contracts fix the price at a future date for various notional amounts associated with these commodities. The fair value of our commodity forward contracts is determined using widely accepted valuation techniques, including discounted cash flow analysis on the expected cash flows of each
73
instrument. These analyses utilize observable market-based inputs, including commodity forward curves, and reflect the contractual terms of these instruments, including the period to maturity. These contracts have not been designated as accounting hedges. In accordance with ASC 815, we recognize changes in the fair values of these contracts in the consolidated statements of operations. The specific contractual terms utilized as inputs in determining fair value, and a discussion of the nature of the risks being mitigated by these instruments, are detailed in Note 16, “Derivative Instruments and Hedging Activities,” under the caption
Hedges of Commodity Risk
.
We incorporate credit valuation adjustments to appropriately reflect both our own non-performance risk and the respective counterparty’s non-performance risk in the fair value measurements. In adjusting the fair value of our derivative contracts for the effect of non-performance risk, we have considered the impact of netting and any applicable credit enhancements, such as collateral postings, thresholds, mutual puts, and guarantees.
We report cash flows arising from our derivative financial instruments consistent with the classification of cash flows from the underlying hedged items.
Refer to Note 16, "Derivative Instruments and Hedging Activities," for further discussion on derivative instruments.
Trade accounts receivable:
Trade accounts receivable are recorded at invoiced amounts and do not bear interest. Trade accounts receivable are reduced by an allowance for losses on receivables, as described elsewhere in this Note. Concentrations of risk with respect to trade accounts receivable are generally limited due to the large number of customers in various industries and their dispersion across several geographic areas. Although we do not foresee that credit risk associated with these receivables will deviate from historical experience, repayment is dependent upon the financial stability of these individual customers. Our largest customer accounted for approximately
8%
of our Net revenue for the year ended
December 31, 2017
.
Goodwill and Other Intangible Assets
Businesses acquired are recorded at their fair value on the date of acquisition, with the excess of the purchase price over the fair value of identifiable assets acquired and liabilities assumed recognized as goodwill. In accordance with the requirements of ASC Topic 350,
Intangibles—Goodwill and Other
("ASC 350"), goodwill and intangible assets determined to have an indefinite useful life are not amortized. Instead these assets are evaluated for impairment on an annual basis, and whenever events or business conditions change that could indicate that the asset is impaired. We evaluate goodwill and indefinite-lived intangible assets for impairment in the fourth quarter of each fiscal year, unless events occur which trigger the need for an earlier impairment review.
Goodwill:
Historically, we had identified
five
reporting units. In connection with the 2017 review of those reporting units, we determined that the portion of the Power Management reporting unit that serves the aerospace end market should be reallocated into a separate reporting unit. As a result, we now have
six
reporting units: Performance Sensing, Electrical Protection, Aerospace, Power Management, Industrial Sensing, and Interconnection. These reporting units have been identified based on the definitions and guidance provided in ASC 350. We periodically review these reporting units to ensure that they continue to reflect the manner in which the business is operated. As businesses are acquired, we assign them to an existing reporting unit or create a new reporting unit. Goodwill is assigned to reporting units as of the date of the related acquisition. We view some assets and liabilities, such as cash and cash equivalents, property, plant and equipment associated with our corporate offices, and debt, as being corporate in nature. Accordingly, we do not assign these assets and liabilities to our reporting units.
We have the option to first assess qualitative factors to determine whether it is more likely than not that the fair value of a reporting unit is less than its net book value. If we elect not to use this option, or if we determine that it is more likely than not that the fair value of a reporting unit is less than its net book value, then we perform the two-step goodwill impairment test.
In the first step of the two-step goodwill impairment test, we compare the estimated fair values of our reporting units to their respective net book values, including goodwill, to determine whether there is an indicator of potential impairment. If the net book value of a reporting unit exceeds its estimated fair value, we conduct a second step in which we calculate the implied fair value of goodwill. If the carrying value of the reporting unit’s goodwill exceeds its calculated implied fair value, an impairment loss is recognized in an amount equal to that excess. The implied fair value of goodwill is determined in the same manner as the amount of goodwill recognized in a business combination. That is, the fair value of the reporting unit is allocated to all of its identifiable assets and liabilities (including any unrecognized intangible assets) as if the reporting unit had been acquired in a business combination at the date of assessment, and the fair value of the reporting unit was the purchase price. The excess of the fair value of the reporting unit over the sum of the fair values of each of its identifiable assets and liabilities is the implied fair value of goodwill. The calculation of the fair value of our reporting units is considered a level 3 fair value measurement.
74
We used a combination of the qualitative and quantitative methods to assess goodwill for impairment as of October 1, 2017.
Indefinite-lived intangible assets:
We perform an annual impairment review of our indefinite-lived intangible assets in the fourth quarter of each fiscal year, unless events occur that trigger the need for an earlier impairment review. We have the option to first assess qualitative factors in determining whether it is more likely than not that an indefinite-lived intangible asset is impaired. If we elect not to use this option, or we determine that it is more likely than not that the asset is impaired, we perform a quantitative impairment review that requires us to estimate the fair value of the indefinite-lived intangible asset and compare that amount to its carrying value. We estimate the fair value by using the relief-from-royalty method, which requires us to make assumptions about future conditions impacting the value of the indefinite-lived intangible assets, including projected growth rates, cost of capital, effective tax rates, and royalty rates. Impairment, if any, is based on the excess of the carrying value over the fair value of these assets.
Definite-lived intangible assets:
Definite-lived intangible assets are amortized over the estimated useful life of the asset, using a method of amortization that reflects the pattern in which the economic benefits of the intangible asset are consumed. If that pattern cannot be reliably determined, then we amortize the intangible asset using the straight-line method. Capitalized software is amortized on a straight-line basis over its estimated useful life. Capitalized software licenses are amortized on a straight-line basis over the lesser of the term of the license, or the estimated useful life of the software.
Reviews are regularly performed to determine whether facts or circumstances exist that indicate that the carrying values of our definite-lived intangible assets to be held and used are impaired. If we determine these facts or circumstances exist, we estimate the recoverability of these assets by comparing the projected undiscounted net cash flows associated with these assets to their respective carrying values. If the sum of the projected undiscounted net cash flows falls below the carrying value of the assets, the impairment charge is based on the excess of the carrying value over the fair value of those assets. We determine fair value by using the appropriate income approach valuation methodology, depending on the nature of the intangible asset.
Refer to Note 5, "Goodwill and Other Intangible Assets," for further details of our goodwill and other intangible assets.
Debt Instruments
A premium or discount on a debt instrument is recorded on the balance sheet as an adjustment to the carrying amount of the debt liability. In general, amounts paid to creditors are considered a reduction in the proceeds received from the issuance of the debt and are accounted for as a component of the premium or discount on the issuance, not as an issuance cost.
Direct and incremental costs associated with the issuance of debt instruments such as legal fees, printing costs, and underwriters' fees, among others, paid to parties other than creditors, are reported and presented as a reduction of debt on the consolidated balance sheets.
Debt issuance costs and premiums or discounts are amortized over the term of the respective financing arrangement using the effective interest method. Amortization of these amounts is included as a component of Interest expense, net in the consolidated statements of operations.
In accounting for debt refinancing transactions, we apply the provisions of ASC Subtopic 470-50,
Modifications and Extinguishments
(“ASC 470-50”). Our evaluation of the accounting under ASC 470-50 is done on a creditor by creditor basis in order to determine if the terms of the debt are substantially different and, as a result, whether to apply modification or extinguishment accounting. In the event that an individual holder of existing debt did not invest in new debt, we apply extinguishment accounting. Borrowings associated with individual holders of new debt that are not holders of existing debt are accounted for as new issuances.
Refer to Note 8, "Debt," for further details of our debt instruments and transactions.
Income Taxes
We provide for income taxes utilizing the asset and liability method. Under this method, deferred income taxes are recorded to reflect the tax consequences in future years of differences between the tax bases of assets and liabilities and their financial reporting amounts at each balance sheet date, based on enacted tax laws and statutory tax rates applicable to the periods in which the differences are expected to reverse or settle. If it is determined that it is more likely than not that future tax benefits associated with a deferred tax asset will not be realized, a valuation allowance is provided. The effect on deferred tax assets and liabilities of a change in statutory tax rates is recognized in the consolidated statements of operations as an adjustment to income tax expense in the period that includes the enactment date.
75
In accordance with ASC Topic 740,
Income Taxes
("ASC 740"), penalties and interest related to unrecognized tax benefits may be classified as either income taxes or another expense line item in the consolidated statements of operations. We classify interest and penalties related to unrecognized tax benefits within the (Benefit from)/provision for income taxes line of the consolidated statements of operations.
Refer to Note 9, "Income Taxes," for further details on our income taxes.
Pension and Other Post-Retirement Benefit Plans
We sponsor various pension and other post-retirement benefit plans covering our current and former employees in several countries. The estimates of the obligations and related expense of these plans recorded in the financial statements are based on certain assumptions. The most significant assumptions relate to discount rate, expected return on plan assets, and rate of increase in healthcare costs. Other assumptions used include employee demographic factors such as compensation rate increases, retirement patterns, employee turnover rates, and mortality rates. We review these assumptions annually.
Our review of demographic assumptions includes analyzing historical patterns and/or referencing industry standard tables, combined with our expectations around future compensation and staffing strategies. The difference between these assumptions and our actual experience results in the recognition of an actuarial gain or loss. Actuarial gains and losses are recorded directly to Other comprehensive loss. If the total net actuarial gain or loss included in Accumulated other comprehensive loss exceeds a threshold of
10%
of the greater of the projected benefit obligation or the market related value of plan assets, it is subject to amortization and recorded as a component of net periodic pension cost over the average remaining service lives of the employees participating in the pension or post-retirement benefit plan.
The discount rate reflects the current rate at which the pension and other post-retirement liabilities could be effectively settled, considering the timing of expected payments for plan participants. It is used to discount the estimated future obligations of the plans to the present value of the liability reflected in the financial statements. In estimating this rate in countries that have a market of high-quality, fixed-income investments, we consider rates of return on these investments included in various bond indices, adjusted to eliminate the effects of call provisions and differences in the timing and amounts of cash outflows related to the bonds. In other countries where a market of high-quality, fixed-income investments does not exist, we estimate the discount rate using government bond yields or long-term inflation rates.
To determine the expected return on plan assets, we consider the historical returns earned by similarly invested assets, the rates of return expected on plan assets in the future, and our investment strategy and asset mix with respect to the plans’ funds.
The rate of increase of healthcare costs directly impacts the estimate of our future obligations in connection with our post-retirement medical benefits. Our estimate of healthcare cost trends is based on historical increases in healthcare costs under similarly designed plans, the level of increase in healthcare costs expected in the future, and the design features of the underlying plan.
We have adopted use of the Retirement Plan ("RP") 2014 mortality tables with the updated Mortality Projection ("MP") 2017 mortality improvement scale as issued by the Society of Actuaries in 2017 for our U.S. defined benefit plans. The updated MP 2017 mortality improvement scale reflects improvements in longevity as compared to the MP 2016 mortality improvement scale the Society of Actuaries issued in 2016, primarily because it includes actual Social Security mortality data through 2015. The MP projection scale is used to factor in projected mortality improvements over time, based on age and date of birth (i.e., two-dimension generational).
Refer to Note 10, "Pension and Other Post-Retirement Benefits," for further information on our pension and other post-retirement benefit plans.
Allowance for Losses on Receivables
The allowance for losses on receivables is used to provide for potential impairment of receivables. The allowance represents an estimate of probable but unconfirmed losses in the receivable portfolio. We estimate the allowance on the basis of specifically identified receivables that are evaluated individually for impairment and a statistical analysis of the remaining receivables determined by reference to past default experience. Customers are generally not required to provide collateral for purchases. The allowance for losses on receivables also includes an allowance for sales returns.
Management judgments are used to determine when to charge off uncollectible trade accounts receivable. We base these judgments on the age of the receivable, credit quality of the customer, current economic conditions, and other factors that may affect a customer’s ability and intent to pay.
76
Losses on receivables have not historically been significant.
Inventories
Inventories are stated at the lower of cost or estimated net realizable value. Cost for raw materials, work-in-process, and finished goods is determined based on a first-in, first-out ("FIFO") basis and includes material, labor, and applicable manufacturing overhead. We conduct quarterly inventory reviews for salability and obsolescence, and inventory considered unlikely to be sold is adjusted to net realizable value. Refer to Note 4, "Inventories," for details of our inventory balances.
Property, Plant and Equipment ("PP&E") and Other Capitalized Costs
PP&E is stated at cost, and in the case of plant and equipment, is depreciated on a straight-line basis over its estimated economic useful life. The depreciable lives of plant and equipment are as follows:
|
Buildings and improvements
|
2 – 40 years
|
|
Machinery and equipment
|
2 – 15 years
|
Leasehold improvements are amortized using the straight-line method over the shorter of the remaining lease term or the estimated economic useful lives of the improvements.
Assets held under capital leases are recorded at the lower of the present value of the minimum lease payments or the fair value of the leased asset at the inception of the lease. Amortization expense associated with capital leases, which is included within depreciation expense, is computed using the straight-line method over the shorter of the estimated useful lives of the assets or the period of the related lease, unless ownership is transferred by the end of the lease or there is a bargain purchase option, in which case the asset is amortized, normally on a straight-line basis, over the useful life that would be assigned if the asset were owned.
Expenditures for maintenance and repairs are charged to expense as incurred, whereas major improvements that increase asset values and extend useful lives are capitalized.
Refer to Note 3, "Property, Plant and Equipment," for details of our PP&E balances.
Foreign Currency
For financial reporting purposes, the functional currency of all of our subsidiaries is the U.S. dollar because of the significant influence of the U.S. dollar on our operations. In certain instances, we enter into transactions that are denominated in a currency other than the U.S. dollar. At the date that such transaction is recognized, each asset, liability, revenue, expense, gain, or loss arising from the transaction is measured and recorded in U.S. dollars using the exchange rate in effect at that date. At each balance sheet date, recorded monetary balances denominated in a currency other than the U.S. dollar are adjusted to the U.S. dollar using the exchange rate at the balance sheet date, with gains or losses recognized in Other, net in the consolidated statements of operations.
Other, net
Other, net for the years ended
December 31, 2017
,
2016
, and
2015
consisted of the following:
|
|
For the year ended December 31,
|
||||||||||
|
|
2017
|
2016
|
2015
|
||||||||
|
Currency remeasurement gain/(loss) on net monetary assets
|
$
|
18,041
|
|
$
|
(10,621
|
)
|
$
|
(9,613
|
)
|
||
|
(Loss)/gain on foreign currency forward contracts
|
(15,618
|
)
|
(1,850
|
)
|
3,606
|
|
|||||
|
Gain/(loss) on commodity forward contracts
|
9,989
|
|
7,399
|
|
(18,468
|
)
|
|||||
|
Loss on debt financing
|
(2,670
|
)
|
—
|
|
(25,538
|
)
|
|||||
|
Other
|
75
|
|
171
|
|
(316
|
)
|
|||||
|
Total
|
$
|
9,817
|
|
$
|
(4,901
|
)
|
$
|
(50,329
|
)
|
||
Recently issued accounting standards to be adopted in a future period:
In May 2014, the Financial Accounting Standards Board ("FASB") issued Accounting Standards Update ("ASU") No. 2014-09,
Revenue from Contracts with Customers (Topic 606)
, which modifies how all entities recognize revenue, and
77
consolidates into one ASC Topic (ASC Topic 606,
Revenue from Contracts with Customers
) the current guidance found in ASC Topic 605 and various other revenue accounting standards for specialized transactions and industries. FASB ASU No. 2014-09 outlines a comprehensive five-step revenue recognition model based on the principle that an entity should recognize revenue to depict the transfer of promised goods or services to customers in an amount that reflects the consideration to which the entity expects to be entitled in exchange for those goods or services. FASB ASU No. 2014-09 may be applied using either a full retrospective approach, under which all years included in the financial statements will be presented under the revised guidance, or a modified retrospective approach, under which financial statements will be prepared under the revised guidance for the year of adoption, but not for prior years. Under the latter method, entities will recognize a cumulative catch-up adjustment to the opening balance of retained earnings at the effective date for contracts that still require performance by the entity.
In August 2015, the FASB issued ASU No. 2015-14,
Revenue from Contracts with Customers (Topic 606): Deferral of Effective Date
, which defers the effective date of FASB ASU No. 2014-09 by one year. FASB ASU No. 2014-09 is now effective for annual reporting periods beginning after December 15, 2017, including interim periods within those annual reporting periods. We have developed an implementation plan to adopt this new guidance, which included an assessment of the impact of the new guidance on our financial position and results of operations. This implementation plan is substantially complete. We have determined that this standard will not have a material impact on our financial position or results of operations. We adopted FASB ASU No. 2014-09 on January 1, 2018 using the modified retrospective transition method.
In February 2016, the FASB issued ASU No. 2016-02,
Leases (Topic 842)
, which establishes new accounting and disclosure requirements for leases. FASB ASU No. 2016-02 requires lessees to classify most leases as either finance or operating leases and to initially recognize a lease liability and right-of-use asset. Entities may elect to account for certain short-term leases (with a term of 12 months or less) using a method similar to the current operating lease model. The statements of operations will include, for finance leases, separate recognition of interest on the lease liability and amortization of the right-of-use asset and for operating leases, a single lease cost, calculated so that the cost of the lease is allocated over the lease term on a straight-line basis. At December 31, 2017, we are contractually obligated to make future payments of
$68.6 million
under our operating lease obligations in existence as of that date, primarily related to long-term leases. While we are in the early stages of our implementation process for FASB ASU No. 2016-02, and have not yet determined its impact on our consolidated financial position or results of operations, these leases would potentially be required to be presented on the balance sheet in accordance with the requirements of FASB ASU No. 2016-02. FASB ASU No. 2016-02 is effective for annual reporting periods beginning after December 15, 2018, including interim periods within those annual reporting periods, with early adoption permitted. FASB ASU No. 2016-02 must be applied using a modified retrospective approach, which requires recognition and measurement of leases at the beginning of the earliest period presented, with certain practical expedients available.
In August 2017, the FASB issued ASU No. 2017-12,
Derivatives and Hedging (Topic 815)
, which changes both the designation and measurement guidance for qualifying hedging relationships and the presentation of hedge results, in order to better align an entity’s risk management activities and financial reporting for hedging relationships. The amendments expand and refine hedge accounting for both nonfinancial and financial risk components and align the recognition and presentation of the effects of the hedging instrument and the hedged item in the financial statements. FASB ASU No. 2017-12 is effective for annual reporting periods beginning after December 15, 2018, including interim periods within those annual reporting periods, with early adoption permitted. We are still evaluating the impact that this guidance will have on our financial position and results of operations, and we have not yet determined whether we will early adopt FASB ASU No. 2017-12.
3. Property, Plant and Equipment
PP&E, net as of
December 31, 2017
and
2016
consisted of the following:
|
December 31,
2017 |
December 31,
2016 |
|||||||
|
Land
|
$
|
23,077
|
|
$
|
23,077
|
|
||
|
Buildings and improvements
|
250,475
|
|
234,846
|
|
||||
|
Machinery and equipment
|
1,132,461
|
|
1,025,900
|
|
||||
|
PP&E, gross
|
1,406,013
|
|
1,283,823
|
|
||||
|
Accumulated depreciation
|
(655,964
|
)
|
(559,777
|
)
|
||||
|
Total
|
$
|
750,049
|
|
$
|
724,046
|
|
||
Depreciation expense for PP&E, including amortization of leasehold improvements and assets under capital leases, totaled
$109.3 million
,
$106.9 million
, and
$96.1 million
for the years ended
December 31, 2017
,
2016
, and
2015
, respectively.
78
PP&E, net as of
December 31, 2017
and
2016
included the following assets under capital leases:
|
December 31,
2017 |
December 31,
2016 |
||||||
|
PP&E recognized under capital leases
|
$
|
45,249
|
|
$
|
44,637
|
|
|
|
Accumulated amortization
|
(20,631
|
)
|
(18,410
|
)
|
|||
|
Total
|
$
|
24,618
|
|
$
|
26,227
|
|
|
4. Inventories
The components of inventories as of
December 31, 2017
and
2016
were as follows:
|
December 31,
2017 |
December 31,
2016 |
||||||
|
Finished goods
|
$
|
195,089
|
|
$
|
169,304
|
|
|
|
Work-in-process
|
92,678
|
|
74,810
|
|
|||
|
Raw materials
|
158,362
|
|
145,730
|
|
|||
|
Total
|
$
|
446,129
|
|
$
|
389,844
|
|
|
As of
December 31, 2017
and
2016
, inventories totaling
$11.2 million
and
$10.3 million
, respectively, had been consigned to customers.
5. Goodwill and Other Intangible Assets
The following table outlines the changes in goodwill by segment for the year ended December 31, 2016. There were no acquisitions or other changes to goodwill during the year ended December 31, 2017.
|
|
Performance Sensing
|
|
Sensing Solutions
|
|
Total
|
||||||||||||||||||||||||||||||
|
|
Gross
Goodwill |
|
Accumulated
Impairment |
|
Net
Goodwill |
|
Gross
Goodwill |
|
Accumulated
Impairment |
|
Net
Goodwill |
|
Gross
Goodwill |
|
Accumulated
Impairment |
|
Net
Goodwill |
||||||||||||||||||
|
Balance as of December 31, 2015
|
$
|
2,149,627
|
|
|
$
|
—
|
|
|
$
|
2,149,627
|
|
|
$
|
888,582
|
|
|
$
|
(18,466
|
)
|
|
$
|
870,116
|
|
|
$
|
3,038,209
|
|
|
$
|
(18,466
|
)
|
|
$
|
3,019,743
|
|
|
CST - purchase accounting adjustment
|
(1,492
|
)
|
—
|
|
(1,492
|
)
|
(12,787
|
)
|
—
|
|
(12,787
|
)
|
(14,279
|
)
|
—
|
|
(14,279
|
)
|
|||||||||||||||||
|
Balance as of December 31, 2016 and 2017
|
$
|
2,148,135
|
|
$
|
—
|
|
$
|
2,148,135
|
|
$
|
875,795
|
|
$
|
(18,466
|
)
|
$
|
857,329
|
|
$
|
3,023,930
|
|
$
|
(18,466
|
)
|
$
|
3,005,464
|
|
||||||||
Goodwill attributed to acquisitions reflects our allocation of purchase price to the estimated fair value of certain assets acquired and liabilities assumed. The purchase accounting adjustments above generally reflect revisions in fair value estimates of liabilities assumed and tangible and intangible assets acquired as well as an adjustment to arrive at the final allocation of goodwill to our segments, which is based on a methodology that utilizes anticipated future earnings of the components of the business.
We evaluated our goodwill for impairment as of
October 1, 2017
using a combination of the qualitative and quantitative methods. Based on these analyses, we have determined that, for each of the reporting units subject to the qualitative method, it was more likely than not that their fair values were greater than their carrying values at that date, and for each of the reporting units subject to the quantitative method, that their fair values exceeded their carrying values at that date. We evaluated our other indefinite-lived intangible assets for impairment as of
October 1, 2017
using the quantitative method, and we determined that the fair values of these indefinite-lived intangible assets exceeded their carrying values on that date. Should certain assumptions change that were used in the qualitative and quantitative analyses of goodwill, or in the development of the fair value of our indefinite-lived intangible assets, we may be required to recognize goodwill or other intangible asset impairments.
79
The following table outlines the components of definite-lived intangible assets, excluding goodwill, as of
December 31, 2017
and
2016
:
|
|
Weighted-
Average Life (Years) |
December 31, 2017
|
December 31, 2016
|
||||||||||||||||||||||||||||||
|
Gross
Carrying Amount |
Accumulated
Amortization |
Accumulated
Impairment |
Net
Carrying Value |
Gross
Carrying Amount |
Accumulated
Amortization |
Accumulated
Impairment |
Net
Carrying Value |
||||||||||||||||||||||||||
|
Completed technologies
|
14
|
$
|
727,968
|
|
$
|
(418,987
|
)
|
$
|
(2,430
|
)
|
$
|
306,551
|
|
$
|
729,168
|
|
$
|
(358,500
|
)
|
$
|
(2,430
|
)
|
$
|
368,238
|
|
||||||||
|
Customer relationships
|
11
|
1,771,198
|
|
(1,287,581
|
)
|
(12,144
|
)
|
471,473
|
|
1,771,198
|
|
(1,196,961
|
)
|
(12,144
|
)
|
562,093
|
|
||||||||||||||||
|
Non-compete agreements
|
8
|
23,400
|
|
(23,400
|
)
|
—
|
|
—
|
|
23,400
|
|
(23,400
|
)
|
—
|
|
—
|
|
||||||||||||||||
|
Tradenames
|
22
|
50,754
|
|
(11,094
|
)
|
—
|
|
39,660
|
|
50,754
|
|
(8,672
|
)
|
—
|
|
42,082
|
|
||||||||||||||||
|
Capitalized software
(1)
|
7
|
59,909
|
|
(25,939
|
)
|
—
|
|
33,970
|
|
54,284
|
|
(19,736
|
)
|
—
|
|
34,548
|
|
||||||||||||||||
|
Total
|
12
|
$
|
2,633,229
|
|
$
|
(1,767,001
|
)
|
$
|
(14,574
|
)
|
$
|
851,654
|
|
$
|
2,628,804
|
|
$
|
(1,607,269
|
)
|
$
|
(14,574
|
)
|
$
|
1,006,961
|
|
||||||||
|
(1)
|
During the years ended December 31, 2017 and 2016, we wrote-off approximately
$1.1 million
and
$7.2 million
, respectively, of fully-amortized capitalized software that was not in use.
|
The following table outlines Amortization of intangible assets for the years ended
December 31, 2017
,
2016
, and
2015
:
|
December 31, 2017
|
December 31, 2016
|
December 31, 2015
|
|||||||||
|
Acquisition-related definite-lived intangible assets
|
$
|
153,729
|
|
$
|
194,208
|
|
$
|
179,785
|
|
||
|
Capitalized software
|
7,321
|
|
7,290
|
|
6,847
|
|
|||||
|
Total
|
$
|
161,050
|
|
$
|
201,498
|
|
$
|
186,632
|
|
||
The table below presents estimated Amortization of intangible assets for the following future periods:
|
2018
|
$
|
137,707
|
|
|
2019
|
$
|
128,594
|
|
|
2020
|
$
|
112,141
|
|
|
2021
|
$
|
95,960
|
|
|
2022
|
$
|
81,816
|
|
In addition to the above, we own the Klixon
®
and Airpax
®
tradenames, which are indefinite-lived intangible assets, as they have each been in continuous use for over
65 years
, and we have no plans to discontinue using them. We have recorded
$59.1 million
and
$9.4 million
, respectively, on the consolidated balance sheets related to these tradenames.
6. Acquisitions
CST
On December 1, 2015, we completed the acquisition of all of the outstanding shares of certain subsidiaries of Custom Sensors & Technologies Ltd. in the U.S., the U.K., and France, as well as certain assets in China (collectively, "CST"), for an aggregate purchase price of
$1,000.8 million
. The acquisition included the Kavlico, BEI, Crydom, and Newall product lines and brands, and encompassed sales, engineering, and manufacturing sites in the U.S., the U.K., Germany, France, and Mexico. We acquired CST to further extend our sensing content beyond automotive markets and build scale in pressure sensing. Portions of CST are being integrated into each of our segments. The allocation of the purchase price related to this acquisition was finalized in the fourth quarter of 2016.
80
7. Accrued Expenses and Other Current Liabilities
Accrued expenses and other current liabilities as of
December 31, 2017
and
2016
consisted of the following:
|
December 31,
2017 |
December 31,
2016 |
||||||
|
Accrued compensation and benefits
|
$
|
89,816
|
|
$
|
83,008
|
|
|
|
Accrued interest
|
36,919
|
|
36,805
|
|
|||
|
Foreign currency and commodity forward contracts
|
35,094
|
|
26,151
|
|
|||
|
Accrued severance
|
4,184
|
|
14,268
|
|
|||
|
Current portion of pension and post-retirement benefit obligations
|
3,342
|
|
2,750
|
|
|||
|
Other accrued expenses and current liabilities
|
90,205
|
|
82,584
|
|
|||
|
Total
|
$
|
259,560
|
|
$
|
245,566
|
|
|
8. Debt
Our long-term debt and capital lease and other financing obligations as of
December 31, 2017
and
2016
consisted of the following:
|
December 31, 2017
|
December 31, 2016
|
||||||
|
Term loans
|
$
|
927,794
|
|
$
|
937,794
|
|
|
|
4.875% Senior Notes
|
500,000
|
|
500,000
|
|
|||
|
5.625% Senior Notes
|
400,000
|
|
400,000
|
|
|||
|
5.0% Senior Notes
|
700,000
|
|
700,000
|
|
|||
|
6.25% Senior Notes
|
750,000
|
|
750,000
|
|
|||
|
Less: discount
|
(14,424
|
)
|
(17,655
|
)
|
|||
|
Less: deferred financing costs
|
(27,758
|
)
|
(33,656
|
)
|
|||
|
Less: current portion
|
(9,802
|
)
|
(9,901
|
)
|
|||
|
Long-term debt, net
|
$
|
3,225,810
|
|
$
|
3,226,582
|
|
|
|
Capital lease and other financing obligations
|
$
|
34,657
|
|
$
|
37,111
|
|
|
|
Less: current portion
|
(5,918
|
)
|
(4,742
|
)
|
|||
|
Capital lease and other financing obligations, less current portion
|
$
|
28,739
|
|
$
|
32,369
|
|
|
Senior Secured Credit Facilities
In May 2011, we entered into a series of financing transactions designed to refinance our then existing indebtedness. These transactions included the execution of a credit agreement (as amended, the “Credit Agreement”) providing for senior secured credit facilities (the “Senior Secured Credit Facilities”), consisting of a term loan facility, a revolving credit facility, and incremental availability under which additional secured credit facilities can be issued. Currently outstanding under the Senior Secured Credit Facilities are a term loan facility (the "Term Loan") provided under the eighth amendment (the "Eighth Amendment") of the Credit Agreement, a
$420.0 million
revolving credit facility (the “Revolving Credit Facility”), and
$1.0 billion
incremental facilities under which additional term loans may be issued or the capacity of the Revolving Credit Facility may be increased (the “Accordion”). The terms of the Eighth Amendment are described in more detail below.
All obligations under the Senior Secured Credit Facilities are unconditionally guaranteed by certain of our subsidiaries in the U.S., the Netherlands, Mexico, Japan, Belgium, Bulgaria, Malaysia, Bermuda, Luxembourg, France, Ireland, and the U.K. (collectively, the "Guarantors"). The collateral for such borrowings under the Senior Secured Credit Facilities consists of substantially all present and future property and assets of STBV, Sensata Technologies Finance Company, LLC, and the Guarantors.
The Credit Agreement stipulates certain events and conditions that may require us to use excess cash flow, as defined by the terms of the Credit Agreement, generated by operating, investing, or financing activities, to prepay some or all of the outstanding borrowings under the Senior Secured Credit Facilities. The Credit Agreement also requires mandatory prepayments
81
of the outstanding borrowings under the Senior Secured Credit Facilities upon certain asset dispositions and casualty events, in each case subject to certain reinvestment rights, and the incurrence of certain indebtedness (excluding any permitted indebtedness). These provisions were not triggered during the year ended December 31, 2017.
On November 7, 2017, we entered into the Eighth Amendment, which resulted in a “Repricing Transaction” per the terms of the Credit Agreement. As a result, the Term Loan replaced the term loan provided under the Sixth Amendment. Pursuant to the Eighth Amendment, changes from the previously issued term loan included the following: (i) the applicable interest rate margins were reduced to
0.75%
for Base Rate loans and
1.75%
for Eurodollar Rate loans, the Base Rate floor was reduced to
1.00%
, and the Eurodollar Rate floor was reduced to
0.00%
; (ii) a prepayment premium of
1.0%
was added with respect to any repricing event that occurs with respect to the Term Loan prior to the date that is six months after the effective date of the Eighth Amendment; (iii) the senior secured net leverage ratio threshold that triggers the excess cash flow mandatory prepayment requirement was increased; (iv) the Accordion was re-set to
$1.0 billion
as of the effective date of the Eighth Amendment; (v) various baskets, permissions and other provisions under certain of the affirmative and negative covenants were increased or otherwise amended for our benefit; and (vi) certain other changes were made to the Credit Agreement that are not considered material. The Term Loan retains all other provisions of the Sixth Amendment, including original principal amount and maturity, amongst others.
The terms presented herein reflect the current terms as a result of all Credit Agreement amendments.
Term Loan
The Term Loan may, at our option, be maintained from time to time as a Base Rate loan or a Eurodollar Rate loan (each as defined in the Credit Agreement), each with a different determination of interest rates. The principal amount of the Term Loan amortizes in equal quarterly installments in an aggregate annual amount equal to
1.0%
of the original principal amount of the term loan provided under the Sixth Amendment, with the balance due at maturity. The applicable margins for the Term Loan as of December 31, 2017 were
0.75%
and
1.75%
for Base Rate loans and Eurodollar Rate loans, respectively, (a decrease from
1.25%
and
2.25%
, respectively, pursuant to the Sixth Amendment) subject to floors of
1.00%
and
0.00%
for Base Rate loans and Eurodollar Rate loans, respectively (a decrease from
1.75%
and
0.75%
, respectively, pursuant to the Sixth Amendment).
As of December 31, 2017, we maintained the Term Loan as a Eurodollar Rate loan, which accrued interest at a rate of
3.21%
.
Revolving Credit Facility
At our option, the Revolving Credit Facility may be maintained from time to time as a Base Rate loan or a Eurodollar Rate loan (each as defined in the Credit Agreement), each with a different determination of interest rates. Interest rates and fees on the Revolving Credit Facility are as follows (each depending on the achievement of certain senior secured net leverage ratios) (i) the index rate spread for Eurodollar Rate loans is
1.75%
or
1.50%
; (ii) the index rate spread for Base Rate loans is
0.75%
or
0.50%
; and (iii) the letter of credit fees are
1.625%
or
1.375%
.
We are required to pay to our revolving credit lenders, on a quarterly basis, a commitment fee on the unused portion of the Revolving Credit Facility. The commitment fee is subject to a pricing grid based on our leverage ratio. The spreads on the commitment fee currently range from
0.25%
to
0.375%
.
As of
December 31, 2017
, there was
$415.3 million
of availability under the Revolving Credit Facility (net of
$4.7 million
in letters of credit). Outstanding letters of credit are issued primarily for the benefit of certain operating activities. As of
December 31, 2017
,
no
amounts had been drawn against these outstanding letters of credit.
Revolving loans may be borrowed, repaid, and re-borrowed to fund our working capital needs and for other general corporate purposes.
Senior Notes
At December 31, 2017, we had various tranches of senior notes outstanding, including the
4.875%
Senior Notes, the
5.625%
Senior Notes, the
5.0%
Senior Notes, and the
6.25%
Senior Notes (each as defined below, and collectively, the “Senior Notes”).
At any time, we may redeem the Senior Notes (with the exception of the
6.25%
Senior Notes, the redemption terms of which are discussed in more detail below), in whole or in part, at a redemption price equal to
100%
of the principal amount of the Senior Notes redeemed, plus accrued and unpaid interest, if any, to the date of redemption, plus the Applicable Premium (also known as the "make-whole premium") set forth in the indentures under which the Senior Notes were issued (the “Senior
82
Notes Indentures”). Upon the occurrence of certain change in control events, we will be required to make an offer to purchase the Senior Notes then outstanding at a purchase price equal to
101%
of their principal amount, plus accrued and unpaid interest, if any, to the date of repurchase. In addition, if certain changes in the law of any relevant taxing jurisdiction become effective that would impose withholding taxes or other deductions on the payments of the Senior Notes or the guarantees, we may redeem the Senior Notes in whole, but not in part, at any time, at a redemption price of
100%
of the principal amount, plus accrued and unpaid interest, if any, and additional amounts, if any, to the date of redemption.
The Senior Notes Indentures provide for events of default (subject in certain cases to customary grace and cure periods) that include, among others, nonpayment of principal or interest when due, breach of covenants or other agreements in the Senior Notes Indentures, defaults in payment of certain other indebtedness, certain events of bankruptcy or insolvency, failure to pay certain judgments, and when the guarantees of significant subsidiaries cease to be in full force and effect. Generally, if an event of default occurs, the trustee or the holders of at least
25%
in principal amount of the then outstanding Senior Notes may declare the principal of, and accrued but unpaid interest on, all of the Senior Notes to be due and payable immediately. All provisions regarding remedies in an event of default are subject to the Senior Notes Indentures.
4.875%
Senior Notes
In April 2013, we completed the issuance and sale of
$500.0 million
aggregate principal amount of
4.875%
senior notes due 2023 (the "
4.875%
Senior Notes"), which were issued under an indenture dated April 17, 2013 (the "
4.875%
Senior Notes Indenture") among STBV, as issuer, The Bank of New York Mellon, as trustee, and the Guarantors. The
4.875%
Senior Notes were offered at par. Interest on the
4.875%
Senior Notes is payable semi-annually on April 15 and October 15 of each year.
Our obligations under the
4.875%
Senior Notes are guaranteed by all of STBV’s existing and future wholly-owned subsidiaries that guarantee our obligations under the Senior Secured Credit Facilities. The
4.875%
Senior Notes and the related guarantees are the senior unsecured obligations of STBV and the Guarantors, respectively. The
4.875%
Senior Notes and the guarantees rank equally in right of payment to all existing and future senior unsecured indebtedness of STBV or the Guarantors.
5.625%
Senior Notes
In October 2014, we completed the issuance and sale of
$400.0 million
aggregate principal amount of
5.625%
senior notes due 2024 (the "
5.625%
Senior Notes"), which were issued under an indenture dated October 14, 2014 (the "
5.625%
Senior Notes Indenture") among STBV, as issuer, The Bank of New York Mellon, as trustee, and the Guarantors. The
5.625%
Senior Notes were offered at par. Interest on the
5.625%
Senior Notes is payable semi-annually on May 1 and November 1 of each year.
Our obligations under the
5.625%
Senior Notes are guaranteed by all of STBV’s existing and future wholly-owned subsidiaries that guarantee our obligations under the Senior Secured Credit Facilities. The
5.625%
Senior Notes and the related guarantees are the senior unsecured obligations of STBV and the Guarantors, respectively. The
5.625%
Senior Notes and the guarantees rank equally in right of payment to all existing and future senior unsecured indebtedness of STBV or the Guarantors.
5.0%
Senior Notes
In March 2015, we completed the issuance and sale of
$700.0 million
aggregate principal amount of
5.0%
senior notes due 2025 (the "
5.0%
Senior Notes"), which were issued under an indenture dated March 26, 2015 (the "
5.0%
Senior Notes Indenture") among STBV, as issuer, The Bank of New York Mellon, as trustee, and the Guarantors. The
5.0%
Senior Notes were offered at par. Interest on the
5.0%
Senior Notes is payable semi-annually on April 1 and October 1 of each year.
Our obligations under the
5.0%
Senior Notes are guaranteed by all of STBV’s existing and future wholly-owned subsidiaries that guarantee our obligations under the Senior Secured Credit Facilities. The
5.0%
Senior Notes and the related guarantees are the senior unsecured obligations of STBV and the Guarantors, respectively. The
5.0%
Senior Notes and the guarantees rank equally in right of payment to all existing and future senior unsecured indebtedness of STBV or the Guarantors.
6.25%
Senior Notes
In November 2015, we completed the issuance and sale of
$750.0 million
aggregate principal amount of
6.25%
senior notes due 2026 (the "
6.25%
Senior Notes"), which were issued by Sensata Technologies UK Financing Co. plc ("STUK") under an indenture dated November 27, 2015 (the "
6.25%
Senior Notes Indenture") among STUK, as issuer, The Bank of New York Mellon, as trustee, and the Guarantors. The
6.25%
Senior Notes were offered at par. Interest on the
6.25%
Senior Notes is payable semi-annually on February 15 and August 15 of each year.
83
We may redeem the
6.25%
Senior Notes, in whole or in part, at any time prior to February 15, 2021, at a redemption price equal to
100%
of the principal amount of the
6.25%
Senior Notes redeemed, plus accrued and unpaid interest, if any, to the date of redemption, plus the Applicable Premium (also known as the “make-whole” premium) set forth in the
6.25%
Senior Notes Indenture. Thereafter, we may redeem the
6.25%
Senior Notes, in whole or in part, at the following prices (plus accrued and unpaid interest, if any, to the date of redemption):
|
Period beginning February 15,
|
Price
|
|
2021
|
103.125%
|
|
2022
|
102.083%
|
|
2023
|
101.042%
|
|
2024 and thereafter
|
100.000%
|
In addition, at any time prior to November 15, 2018, we may redeem up to
40%
of the aggregate principal amount of the
6.25%
Senior Notes with the net cash proceeds from certain equity offerings at the redemption price of
106.25%
plus accrued and unpaid interest, if any, to the date of redemption, provided that at least
60%
of the aggregate principal amount of the
6.25%
Senior Notes remains outstanding immediately after each such redemption.
Our obligations under the
6.25%
Senior Notes are guaranteed by STBV and certain of STBV’s existing and future wholly-owned subsidiaries (other than STUK) that guarantee our obligations under the Senior Secured Credit Facilities. The
6.25%
Senior Notes and the related guarantees are the senior unsecured obligations of STUK and the Guarantors, respectively. The
6.25%
Senior Notes and the guarantees rank equally in right of payment to all existing and future senior unsecured indebtedness of STUK, STBV, or the Guarantors.
Restrictions
As of
December 31, 2017
, all of the subsidiaries of STBV were subject to certain restrictive covenants. Under certain circumstances, STBV will be permitted to designate a subsidiary as "unrestricted," in which case the restrictive covenants will not apply to that subsidiary. STBV has not designated any subsidiaries as unrestricted.
Under the Revolving Credit Facility, STBV and its subsidiaries are required to maintain a senior secured net leverage ratio not to exceed
5.0
:
1.0
at the conclusion of certain periods when outstanding loans and letters of credit that are not cash collateralized for the full face amount thereof exceed
10%
of the commitments under the Revolving Credit Facility. In addition, STBV and its subsidiaries are required to satisfy this covenant, on a pro forma basis, in connection with any new borrowings (including any letter of credit issuances) under the Revolving Credit Facility as of the time of such borrowings.
The Credit Agreement also contains non-financial covenants that limit our ability to incur subsequent indebtedness, incur liens, prepay subordinated debt, make loans and investments (including acquisitions), merge, consolidate, dissolve or liquidate, sell assets, enter into affiliate transactions, change our business, change our accounting policies, make capital expenditures, amend the terms of our subordinated debt and our organizational documents, pay dividends and make other restricted payments, and enter into certain burdensome contractual obligations. These covenants are subject to important exceptions and qualifications set forth in the Credit Agreement.
The Senior Notes Indentures contain restrictive covenants that limit the ability of STBV and its subsidiaries to, among other things: incur additional debt or issue preferred stock; create liens; create restrictions on STBV's subsidiaries' ability to make payments to STBV; pay dividends and make other distributions in respect of STBV's and its subsidiaries' capital stock; redeem or repurchase STBV's capital stock, our capital stock, or the capital stock of any other direct or indirect parent company of STBV or prepay subordinated indebtedness; make certain investments or certain other restricted payments; guarantee indebtedness; designate unrestricted subsidiaries; sell certain kinds of assets; enter into certain types of transactions with affiliates; and effect mergers or consolidations. These covenants are subject to important exceptions and qualifications set forth in the Senior Notes Indentures. Certain of these covenants will be suspended if the Senior Notes are assigned an investment grade rating by Standard & Poor's Rating Services or Moody's Investors Service, Inc. and no default has occurred and is continuing at such time. The suspended covenants will be reinstated if the Senior Notes are no longer rated investment grade by either rating agency and an event of default has occurred and is continuing at such time. As of December 31, 2017, the Senior Notes were not rated investment grade by either rating agency.
The Guarantors under the Credit Agreement and the Senior Notes Indentures are generally not restricted in their ability to pay dividends or otherwise distribute funds to STBV, except for restrictions imposed under applicable corporate law.
84
STBV, however, is limited in its ability to pay dividends or otherwise make distributions to its immediate parent company and, ultimately, to us, under the Credit Agreement and the Senior Notes Indentures. Specifically, the Credit Agreement prohibits STBV from paying dividends or making any distributions to its parent companies except for limited purposes, including, but not limited to: (i) customary and reasonable operating expenses, legal and accounting fees and expenses, and overhead of such parent companies incurred in the ordinary course of business in the aggregate not to exceed
$20.0 million
in any fiscal year, plus reasonable and customary indemnification claims made by our directors or officers attributable to the ownership of STBV and its subsidiaries; (ii) franchise taxes, certain advisory fees, and customary compensation of officers and employees of such parent companies to the extent such compensation is attributable to the ownership or operations of STBV and its subsidiaries; (iii) repurchase, retirement, or other acquisition of equity interest of the parent from certain present, future, and former employees, directors, managers, consultants of the parent companies, STBV, or its subsidiaries in an aggregate amount not to exceed
$20.0 million
in any fiscal year, plus the amount of cash proceeds from certain equity issuances to such persons, the amount of equity interests subject to a certain deferred compensation plan, and the amount of certain key-man life insurance proceeds; (iv) so long as no default or event of default exists and the senior secured net leverage ratio is less than
2.0
:
1.0
calculated on a pro forma basis, dividends and other distributions in an aggregate amount not to exceed
$100.0 million
, plus certain amounts, including the retained portion of excess cash flow; (v) dividends and other distributions in an aggregate amount not to exceed
$50.0 million
in any calendar year (subject to increase upon the achievement of certain ratios); and (vi) so long as no default or event of default exists, dividends and other distributions in an aggregate amount not to exceed
$150.0 million
.
The Senior Notes Indentures generally provide that STBV can pay dividends and make other distributions to its parent companies upon the achievement of certain conditions and in an amount as determined in accordance with the Senior Notes Indentures.
The net assets of STBV subject to these restrictions totaled
$2,258.6 million
at
December 31, 2017
.
Accounting for Debt Financing Transactions
Refer to Note 2, "Significant Accounting Policies," under the heading
Debt Instruments
for discussion of our accounting policies regarding debt financing transactions.
During the years ended December 31, 2017 and 2015, we recorded losses of
$2.7 million
and
$25.5 million
, respectively, in Other, net related to our debt financing transactions of which
$0.6 million
and
$19.2 million
, respectively, related to transaction costs. The remaining losses recorded to Other, net primarily relate to the write-off of unamortized deferred financing costs and debt discounts.
During the year ended December 31, 2017,
$0.2 million
was accounted for as debt issuance costs related to the Eighth Amendment and were recorded on the balance sheet as an adjustment to the carrying amount of the debt liability.
During the year ended December 31, 2015,
$12.5 million
was accounted for as as debt issuance costs related to the issuance and sale of the
6.25%
Senior Notes and were recorded on the balance sheet as an adjustment to the carrying amount of the debt liability. In addition,
$8.8 million
was recorded in Interest expense, net, which relates to fees associated with bridge financing that was not utilized.
During the year ended December 31, 2016 we did not enter into any debt financing transactions.
Leases
We occupy leased facilities with initial terms ranging up to
20 years
. The lease agreements frequently include options to renew for additional periods or to purchase the leased assets and generally require that we pay taxes, insurance, and maintenance costs. Depending on the specific terms of the leases, our obligations are in two forms: capital leases and operating leases. Rent expense for the years ended
December 31, 2017
,
2016
, and
2015
was
$19.7 million
,
$18.1 million
, and
$14.1 million
, respectively.
We have capital leases for facilities in Baoying, China and Attleboro, Massachusetts. As of
December 31, 2017
and
2016
, the combined capital lease obligations outstanding for these facilities were
$26.2 million
and
$27.8 million
, respectively.
Other Financing Obligations
In 2013, we entered into an agreement with one of our suppliers, Measurement Specialties, Inc., under which we acquired the rights to certain intellectual property in exchange for quarterly royalty payments through the fourth quarter of 2019. As
85
of
December 31, 2017
and
2016
, we had recognized a liability related to this agreement of
$3.5 million
and
$5.2 million
, respectively.
Debt Maturities
The final maturity of the Term Loan is October 14, 2021. The Term Loan must be repaid in full on or prior to this date. The
4.875%
Senior Notes, the
5.625%
Senior Notes, the
5.0%
Senior Notes, and the
6.25%
Senior Notes mature on October 15, 2023, November 1, 2024, October 1, 2025, and February 15, 2026, respectively. The final maturity of the Revolving Credit Facility is March 26, 2020. Loans made pursuant to the Revolving Credit Facility must be repaid in full on or prior to such date and are pre-payable at our option at par. All letters of credit issued thereunder will terminate at the final maturity of the Revolving Credit Facility unless cash collateralized prior to such time.
The following table presents the remaining mandatory principal repayments of long-term debt, excluding capital lease payments, other financing obligations, and discretionary repurchases of debt, in each of the years ended
December 31, 2018
through
2022
and thereafter.
|
For the year ended December 31,
|
Aggregate Maturities
|
|||
|
2018
|
$
|
9,802
|
|
|
|
2019
|
9,901
|
|
||
|
2020
|
9,901
|
|
||
|
2021
|
898,190
|
|
||
|
2022
|
—
|
|
||
|
Thereafter
|
2,350,000
|
|
||
|
Total long-term debt principal payments
|
$
|
3,277,794
|
|
|
Compliance with Financial and Non-Financial Covenants
As of, and for the year ended,
December 31, 2017
, we were in compliance with all of the covenants and default provisions associated with our indebtedness.
9. Income Taxes
Effective April 27, 2006 (inception), and concurrent with the completion of the acquisition of the Sensors & Controls business ("S&C") of Texas Instruments Incorporated ("TI") (the "2006 Acquisition"), we commenced filing tax returns in the Netherlands as a stand-alone entity. Several of our Dutch resident subsidiaries are taxable entities in the Netherlands and file tax returns under Dutch fiscal unity (i.e., consolidation). Prior to April 30, 2008, we filed
one
consolidated tax return in the U.S. On April 30, 2008, our U.S. subsidiaries executed a separation and distribution agreement that divided our U.S. businesses, resulting in
two
separate U.S. consolidated federal income tax returns. On January 1, 2016, our U.S. subsidiaries resumed filing
one
consolidated tax return. Our remaining subsidiaries will file income tax returns in the countries in which they are incorporated and/or operate, including the Netherlands, Japan, China, Germany, Belgium, Bulgaria, South Korea, Malaysia, the U.K., France, and Mexico. The 2006 Acquisition purchase accounting and the related debt and equity capitalization of the various subsidiaries of the consolidated company, and the realignment of the functions performed and risks assumed by the various subsidiaries, are of significant consequence to the determination of future book and taxable income of the respective subsidiaries and Sensata as a whole.
Effects of the Tax Cuts and Jobs Act
On December 22, 2017 President Donald Trump signed into U.S. law the Tax Cuts and Jobs Act of 2017 (“Tax Reform”). ASC Topic 740,
Accounting for Income Taxes
, requires companies to recognize the effect of tax law changes in the period of enactment even though the effective date for most provisions is for tax years beginning after December 31, 2017, or in the case of certain other provisions of the law, January 1, 2018.
Given the significance of the legislation, the U.S. Securities and Exchange Commission (the "SEC") staff issued Staff Accounting Bulletin ("SAB") No. 118 (SAB 118), which allows registrants to record provisional amounts during a one year “measurement period” similar to that used when accounting for business combinations. However, the measurement period is deemed to have ended earlier when the registrant has obtained, prepared, and analyzed the information necessary to finalize its accounting. During the measurement period, impacts of the law are expected to be recorded at the time a reasonable estimate for all or a portion of the effects can be made, and provisional amounts can be recognized and adjusted as information becomes available, prepared, or analyzed.
86
SAB 118 summarizes a three-step process to be applied at each reporting period to account for and qualitatively disclose: (1) the effects of the change in tax law for which accounting is complete; (2) provisional amounts (or adjustments to provisional amounts) for the effects of the tax law where accounting is not complete, but that a reasonable estimate has been determined; and (3) a reasonable estimate cannot yet be made and therefore taxes are reflected in accordance with law prior to the enactment of the Tax Cuts and Jobs Act.
Amounts recorded where we consider accounting to be complete for the year ended December 31, 2017 principally relate to the reduction in the U.S. corporate income tax rate to
21
percent, which resulted in the recording of an income tax benefit of
$73.7 million
to remeasure deferred taxes liabilities associated with indefinite-lived intangible assets that are deemed to reverse at the new
21
percent tax rate. Absent this deferred tax liability, we are in a net deferred tax asset position that is offset by a full valuation allowance.
The Tax Reform includes a one-time mandatory repatriation transition tax on the net accumulated earnings and profits of a U.S. taxpayer’s foreign subsidiaries. We have performed an earnings and profits analysis, and as a result of foreign tax credits available to fully offset the anticipated transition tax, there will be no income tax effect in the current period. Therefore, the preliminary accounting for this matter is generally complete.
However, several provisions, including the repatriation provisions, of the Tax Reform have significant impact on our U.S. tax attributes, generally consisting of credits, loss carry-forwards, and deferred interest deductions. Our tax attributes are generally subject to a full valuation allowance in the U.S. and thus, any adjustments to the attributes will not impact the tax provision. Although we have made a reasonable estimate of the gross amounts of the attributes disclosed, a final determination of the Tax Reform’s impact on the attributes and related valuation allowance requirements remain incomplete pending a full analysis of the provisions and their interpretations.
Other significant provisions that are not yet effective but may impact income taxes in future years include: an exemption from U.S. tax on dividends of future foreign earnings, limitation on the current deductibility of net interest expense in excess of
30
percent of adjusted taxable income, a limitation of net operating losses generated after fiscal 2018 to
80
percent of taxable income, an incremental tax (base erosion anti-abuse tax or “BEAT”) on excessive amounts paid to foreign related parties, and a minimum tax on certain foreign earnings in excess of
10
percent of the foreign subsidiaries tangible assets (i.e., global intangible low-taxed income or “GILTI”). We are still evaluating whether to make a policy election to treat the GILTI tax as a period expense or to provide U.S. deferred taxes on foreign temporary differences that are expected to generate GILTI income when they reverse in future years.
Income before taxes
Income/(loss) before taxes for the years ended
December 31, 2017
,
2016
, and
2015
was categorized by jurisdiction as follows:
|
U.S.
|
Non-U.S.
|
Total
|
|||||||||
|
For the year ended December 31,
|
|||||||||||
|
2017
|
$
|
(11,425
|
)
|
$
|
413,866
|
|
$
|
402,441
|
|
||
|
2016
|
$
|
(43,842
|
)
|
$
|
365,287
|
|
$
|
321,445
|
|
||
|
2015
|
$
|
(60,707
|
)
|
$
|
266,336
|
|
$
|
205,629
|
|
||
87
(Benefit from)/provision for income taxes
(Benefit from)/provision for income taxes for the years ended
December 31, 2017
,
2016
, and
2015
was categorized by jurisdiction as follows:
|
U.S. Federal
|
Non-U.S.
|
U.S. State
|
Total
|
||||||||||||
|
For the year ended December 31,
|
|||||||||||||||
|
2017
|
|||||||||||||||
|
Current
|
$
|
—
|
|
$
|
50,601
|
|
$
|
240
|
|
$
|
50,841
|
|
|||
|
Deferred
|
(56,956
|
)
|
(1,104
|
)
|
1,303
|
|
(56,757
|
)
|
|||||||
|
Total
|
$
|
(56,956
|
)
|
$
|
49,497
|
|
$
|
1,543
|
|
$
|
(5,916
|
)
|
|||
|
2016
|
|||||||||||||||
|
Current
|
$
|
464
|
|
$
|
49,977
|
|
$
|
226
|
|
$
|
50,667
|
|
|||
|
Deferred
|
10,036
|
|
2,010
|
|
(3,702
|
)
|
8,344
|
|
|||||||
|
Total
|
$
|
10,500
|
|
$
|
51,987
|
|
$
|
(3,476
|
)
|
$
|
59,011
|
|
|||
|
2015:
|
|||||||||||||||
|
Current
|
$
|
(8,187
|
)
|
$
|
45,326
|
|
$
|
(197
|
)
|
$
|
36,942
|
|
|||
|
Deferred
|
(168,855
|
)
|
(361
|
)
|
(9,793
|
)
|
(179,009
|
)
|
|||||||
|
Total
|
$
|
(177,042
|
)
|
$
|
44,965
|
|
$
|
(9,990
|
)
|
$
|
(142,067
|
)
|
|||
Effective tax rate reconciliation
The principal reconciling items from income tax computed at the U.S. statutory tax rate for the years ended
December 31, 2017
,
2016
, and
2015
were as follows:
|
|
For the year ended December 31,
|
||||||||||
|
|
2017
|
2016
|
2015
|
||||||||
|
Tax computed at statutory rate of 35%
|
$
|
140,854
|
|
$
|
112,506
|
|
$
|
71,970
|
|
||
|
Foreign tax rate differential
|
(111,990
|
)
|
(86,339
|
)
|
(66,367
|
)
|
|||||
|
U.S. Tax Reform Impact
|
(73,668
|
)
|
—
|
|
—
|
|
|||||
|
Reserve for tax exposure
|
38,013
|
|
11,227
|
|
(2,949
|
)
|
|||||
|
Release of valuation allowances
|
(12,209
|
)
|
(1,925
|
)
|
(180,001
|
)
|
|||||
|
Losses not tax benefited
|
8,841
|
|
32,490
|
|
56,778
|
|
|||||
|
Patent box
|
(5,922
|
)
|
(10,961
|
)
|
(3,714
|
)
|
|||||
|
Change in tax law or rates
|
3,912
|
|
2,542
|
|
(10,290
|
)
|
|||||
|
Withholding taxes not creditable
|
3,896
|
|
6,014
|
|
4,346
|
|
|||||
|
Unrealized foreign exchange (gains)/losses, net
|
830
|
|
3,829
|
|
(12,120
|
)
|
|||||
|
Other
|
1,527
|
|
(10,372
|
)
|
280
|
|
|||||
|
(Benefit from)/provision for income taxes
|
$
|
(5,916
|
)
|
$
|
59,011
|
|
$
|
(142,067
|
)
|
||
U.S. Tax Reform Impact
As a result of Tax Reform, the U.S. statutory tax rate was lowered from
35
percent to
21
percent, effective on January 1, 2018. We are required to remeasure our U.S. deferred tax assets and liabilities to the new tax rate. We recorded
$73.7 million
of income tax benefit for the remeasurement of the deferred tax liabilities associated with indefinite-lived intangible assets that will reverse at the new
21
percent rate. Absent this deferred tax liability, the U.S. operation is in a net deferred tax asset position, offset by a full valuation allowance. We reduced our net deferred tax assets excluding the indefinite-lived intangible assets and the corresponding valuation allowance by
$120.0 million
.
Foreign tax rate differential
We operate in locations outside the U.S., including China, the U.K., the Netherlands, South Korea, Malaysia, Bermuda, and Bulgaria, that have statutory tax rates lower than the historical U.S. statutory rate, resulting in an effective rate benefit. This
88
benefit can change from year to year based upon the jurisdictional mix of earnings. For the years ended December 31, 2017, 2016, and 2015, this benefit was
$112.0 million
,
$86.3 million
, and
$66.4 million
, respectively.
Certain of our subsidiaries are currently eligible, or have been eligible, for tax exemptions or holidays in their respective jurisdictions. From 2016 through 2018, a subsidiary in Changzhou, China was eligible for a reduced tax rate of
15%
. The impact of the tax holidays and exemptions on our effective rate is included in the foreign tax rate differential line in the reconciliation of the statutory rate to effective rate.
Patent box
Certain income of our U.K. subsidiaries is eligible for lower tax rates under the “patent box” regime, resulting in certain of our intellectual property income being taxed at a rate lower than the U.K. statutory tax rate. For the years ended December 31, 2017, 2016, and 2015, this benefit was
$5.9 million
,
$11.0 million
, and
$3.7 million
, respectively.
Release of valuation allowances
During the years ended December 31, 2017, 2016, and 2015, we released a portion of our valuation allowance and recognized a deferred tax benefit of
$12.2 million
,
$1.9 million
, and
$180.0 million
, respectively. The deferred tax benefits in fiscal years 2016 and 2015 arose primarily in connection with the 2015 acquisition of CST and the 2014 acquisitions of Wabash, DeltaTech, and Schrader. For each of these acquisitions, deferred tax liabilities were established and related primarily to the step-up of intangible assets for book purposes.
Losses not tax benefited
Losses incurred in certain jurisdictions, predominantly the U.S., are not currently benefited, as it is not more likely than not that the associated deferred tax asset will be realized in foreseeable future. For the years ended December 31, 2017, 2016, and 2015, this resulted in a deferred tax expense of
$8.8 million
,
$32.5 million
, and
$56.8 million
, respectively.
Withholding taxes not creditable
Withholding taxes may apply to intercompany interest, royalty, management fees, and certain payments to third parties. Such taxes are expensed if they cannot be credited against the recipient’s tax liability in its country of residence. Additional consideration also has been given to the withholding taxes associated with the remittance of presently unremitted earnings and the recipient's ability to obtain a tax credit for such taxes. Earnings are not considered to be indefinitely reinvested in the jurisdictions in which they were earned.
In certain jurisdictions we record withholding and other taxes on intercompany payments including dividends. During the years ended December 31, 2017, 2016, and 2015, this amount totaled
$3.9 million
,
$6.0 million
, and
$4.3 million
.
89
Deferred income tax assets and liabilities
The primary components of deferred income tax assets and liabilities as of
December 31, 2017
and
2016
were as follows:
|
December 31,
2017 |
December 31,
2016 |
||||||
|
Deferred tax assets:
|
|||||||
|
Inventories and related reserves
|
$
|
17,287
|
|
$
|
17,616
|
|
|
|
Accrued expenses
|
25,920
|
|
32,703
|
|
|||
|
Property, plant and equipment
|
13,396
|
|
11,297
|
|
|||
|
Intangible assets
|
22,050
|
|
32,282
|
|
|||
|
Unrealized Exchange Loss
|
12,265
|
|
—
|
|
|||
|
Net operating loss, interest expense, and other carryforwards
|
349,244
|
|
446,946
|
|
|||
|
Pension liability and other
|
8,880
|
|
10,545
|
|
|||
|
Share-based compensation
|
12,195
|
|
15,341
|
|
|||
|
Other
|
7,028
|
|
3,398
|
|
|||
|
Total deferred tax assets
|
468,265
|
|
570,128
|
|
|||
|
Valuation allowance
|
(277,315
|
)
|
(299,746
|
)
|
|||
|
Net deferred tax asset
|
190,950
|
|
270,382
|
|
|||
|
Deferred tax liabilities:
|
|||||||
|
Property, plant and equipment
|
(23,222
|
)
|
(25,195
|
)
|
|||
|
Intangible assets and goodwill
|
(428,028
|
)
|
(556,089
|
)
|
|||
|
Unrealized exchange gain
|
(6,031
|
)
|
(11,547
|
)
|
|||
|
Tax on undistributed earnings of subsidiaries
|
(38,894
|
)
|
(48,493
|
)
|
|||
|
Other
|
—
|
|
(991
|
)
|
|||
|
Total deferred tax liabilities
|
(496,175
|
)
|
(642,315
|
)
|
|||
|
Net deferred tax liability
|
$
|
(305,225
|
)
|
$
|
(371,933
|
)
|
|
Valuation allowance and net operating loss carryforwards
Since our inception, we have incurred tax losses in the U.S., resulting in allowable tax net operating loss carryforwards. In measuring the related deferred tax assets, we considered all available evidence, both positive and negative, to determine whether, based on the weight of that evidence, a valuation allowance is needed for all or some portion of the deferred tax assets. Judgment is required in considering the relative impact of negative and positive evidence. The weight given to the potential effect of negative and positive evidence is commensurate with the extent to which it can be objectively verified. The more negative evidence that exists, the more positive evidence is necessary, and the more difficult it is to support a conclusion that a valuation allowance is not needed. Additionally, we utilize the “more likely than not” criteria established in ASC 740 to determine whether the future benefit from the deferred tax assets should be recognized. As a result, we have established a full valuation allowance on the deferred tax assets in jurisdictions that have incurred net operating losses and in which it is more likely than not that such losses will not be utilized in the foreseeable future.
For tax purposes, certain goodwill and indefinite-lived intangible assets are generally amortizable over
6
to
20
years. For book purposes, goodwill and indefinite-lived intangible assets are not amortized, but are tested for impairment annually. The tax amortization of goodwill and indefinite-lived intangible assets will result in a taxable temporary difference, which will not reverse unless the related book goodwill or intangible asset is impaired or written off. This liability may not be used to support deductible temporary differences, such as net operating loss carryforwards, which may expire within a definite period.
The total valuation allowance for the years ended December 31, 2017 and 2016 (decreased)/increased
$(22.4) million
and
$2.8 million
, respectively. Subsequently reported tax benefits relating to the valuation allowance for deferred tax assets as of
December 31, 2017
will be allocated to income tax benefit recognized in the consolidated statements of operations.
As of
December 31, 2017
, we have U.S. federal net operating loss carryforwards of
$724.9 million
and interest expense carryforwards of
$472.0 million
. U.S. federal net operating loss carryforwards will expire from 2026 to 2037, state net operating loss carryforwards will expire from 2018 to 2037, and the interest carryovers have an unlimited life. It is more likely
90
than not that these net operating losses will not be utilized in the foreseeable future. We also have non-U.S. net operating loss carryforwards of
$262.6 million
, which will begin to expire in 2018.
We believe a change of ownership within the meaning of Section 382 of the Internal Revenue Code occurred in the fourth quarter of 2012. As a result, our U.S. federal net operating loss utilization will be limited to an amount equal to the market capitalization of our U.S. subsidiaries at the time of the ownership change multiplied by the federal long-term tax exempt rate. A change of ownership under Section 382 of the Internal Revenue Code is defined as a cumulative change of fifty percentage points or more in the ownership positions of certain stockholders owning five percent or more of our common stock over a three year rolling period. We do not believe the resulting limitation will prohibit the utilization of our U.S. federal net operating loss.
Unrecognized tax benefits
A reconciliation of the amount of unrecognized tax benefits is as follows:
|
Balance at December 31, 2014
|
$
|
22,774
|
|
|
Increases related to prior year tax positions
|
5,467
|
|
|
|
Increases related to current year tax positions
|
18,382
|
|
|
|
Decreases related to settlements with tax authorities
|
(8,566
|
)
|
|
|
Balance at December 31, 2015
|
38,057
|
|
|
|
Increases related to prior year tax positions
|
6,390
|
|
|
|
Increases related to current year tax positions
|
8,462
|
|
|
|
Decreases related to lapse of applicable statute of limitations
|
(256
|
)
|
|
|
Decreases related to settlements with tax authorities
|
(6,755
|
)
|
|
|
Balance at December 31, 2016
|
45,898
|
|
|
|
Increases related to prior year tax positions
|
7,968
|
|
|
|
Increases related to current year tax positions
|
14,585
|
|
|
|
Decreases related to lapse of applicable statute of limitations
|
(1,356
|
)
|
|
|
Decreases related to settlements with tax authorities
|
(7,211
|
)
|
|
|
Balance at December 31, 2017
|
$
|
59,884
|
|
During the year ended December 31, 2015, we established a reserve of
$16.0 million
in connection with a capital restructuring transaction executed during the year.
We record interest and penalties related to unrecognized tax benefits in the consolidated statements of operations and the consolidated balance sheets. The table that follows presents the (income)/expense related to such interest and penalties recognized in the consolidated statements of operations during the years ended
December 31, 2017
, 2016, and 2015, and the amount of interest and penalties recorded on the consolidated balance sheets as of December 31, 2017 and 2016:
|
Statements of Operations
|
Balance Sheets
|
|||||||||||||||||||
|
For the year ended December 31,
|
As of December 31,
|
|||||||||||||||||||
|
(in millions)
|
2017
|
2016
|
2015
|
2017
|
2016
|
|||||||||||||||
|
Interest
|
$
|
0.2
|
|
$
|
0.1
|
|
$
|
0.1
|
|
$
|
0.7
|
|
$
|
1.0
|
|
|||||
|
Penalties
|
$
|
(0.1
|
)
|
$
|
0.1
|
|
$
|
(0.3
|
)
|
$
|
0.5
|
|
$
|
1.1
|
|
|||||
The liability for unrecognized tax benefits generally relates to the allocation of taxable income to the various jurisdictions where we are subject to tax. At
December 31, 2017
, we anticipate that the liability for unrecognized tax benefits could decrease by up to
$0.2 million
within the next twelve months due to the expiration of certain statutes of limitation or the settlement of examinations or issues with tax authorities. The amount of unrecognized tax benefits as of
December 31, 2017
and 2016 that will impact our effective tax rate are
$5.4 million
and
$12.0 million
, respectively.
Our major tax jurisdictions include the Netherlands, the U.S., Japan, Germany, Mexico, China, South Korea, Belgium, Bulgaria, France, Malaysia, and the U.K. These jurisdictions generally remain open to examination by the relevant tax authority for the tax years 2006 through 2017.
91
Indemnifications
We have various indemnification provisions in place with Texas Instruments Incorporated ("TI"), Honeywell, William Blair, Tomkins Limited, and Custom Sensors & Technologies Ltd. These provisions provide for the reimbursement by TI, Honeywell, William Blair, Tomkins Limited, and Custom Sensors & Technologies Ltd of future tax liabilities paid by us that relate to the pre-acquisition periods of the acquired businesses including S&C, First Technology Automotive, Airpax, Schrader, and CST, respectively.
10. Pension and Other Post-Retirement Benefits
We provide various pension and other post-retirement plans for current and former employees, including defined benefit, defined contribution, and retiree healthcare benefit plans.
U.S. Benefit Plans
The principal retirement plans in the U.S. include a qualified defined benefit pension plan and a defined contribution plan. In addition, we provide post-retirement medical coverage and non-qualified benefits to certain employees.
Defined Benefit Pension Plans
The benefits under the qualified defined benefit pension plan are determined using a formula based upon years of service and the highest
five
consecutive years of compensation.
TI closed the qualified defined benefit pension plan to participants hired after November 1997. In addition, participants eligible to retire under the TI plan as of April 26, 2006 were given the option of continuing to participate in the qualified defined benefit pension plan or retiring under the qualified defined benefit pension plan and thereafter participating in an enhanced defined contribution plan.
We intend to contribute amounts to the qualified defined benefit pension plan in order to meet the minimum funding requirements of federal laws and regulations, plus such additional amounts as we deem appropriate. We do not expect to contribute to the qualified defined benefit pension plan during 2018.
We also sponsor a non-qualified defined benefit pension plan, which is closed to new participants and is unfunded.
Effective January 31, 2012, we froze the defined benefit pension plans and eliminated future benefit accruals.
Defined Contribution Plans
Prior to August 1, 2012, we offered
two
defined contribution plans. Both defined contribution plans offered an employer matching savings option that allowed employees to make pre-tax contributions to various investment choices.
Employees who elected not to remain in the qualified defined benefit pension plan, and new employees hired after November 1997, could participate in an enhanced defined contribution plan, where employer matching contributions were provided for up to
4%
of the employee’s annual eligible earnings. In addition, this plan provided for an additional fixed employer contribution of
2%
of the employee’s annual eligible earnings for employees who elected not to remain in the qualified defined benefit pension plan and employees hired between November 1997 and December 31, 2003. Effective in
2012
, we discontinued the additional fixed employer contribution of
2%
.
Employees who remained in the qualified defined benefit pension plan were permitted to participate in a defined contribution plan, where
50%
employer matching contributions were provided for up to
2%
of the employee’s annual eligible earnings. Effective in 2012, we increased the employer matching contribution to
100%
for up to
4%
of the employee's annual eligible earnings.
In 2012, we merged the two defined contribution plans into
one
plan. The combined plan provides for an employer matching contribution of up to
4%
of the employee's annual eligible earnings. Our matching of employees’ contributions under our defined contribution plan is discretionary and is based on our assessment of our financial performance.
The aggregate expense related to the defined contribution plans for U.S. employees was
$5.9 million
,
$5.8 million
, and
$4.7 million
for the years ended
December 31, 2017
,
2016
, and
2015
, respectively.
92
Retiree Healthcare Benefit Plan
We offer access to group medical coverage during retirement to some of our U.S. employees. We make contributions toward the cost of those retiree medical benefits for certain retirees. The contribution rates are based upon varying factors, the most important of which are an employee’s date of hire, date of retirement, years of service, and eligibility for Medicare benefits. The balance of the cost is borne by the participants in the plan. For the year ended
December 31, 2017
, we did not, and do not expect to, receive any amount of Medicare Part D Federal subsidy. Our projected benefit obligation as of
December 31, 2017
and
2016
did not include an assumption for a Federal subsidy.
In the fourth quarter of 2013, we amended the retiree healthcare benefit plan to eliminate supplemental medical coverage offered to Medicare eligible retirees, effective January 1, 2014. As a result of the amendment, we recognized a gain of
$7.2 million
that was recorded in Other comprehensive (loss)/income in the fourth quarter of 2013, which is being amortized as a component of net periodic benefit cost over a period of approximately
5
years from the date of recognition, which represents the remaining average service period to the full eligibility dates of the active plan participants.
Non-U.S. Benefit Plans
Retirement coverage for non-U.S. employees is provided through separate defined benefit and defined contribution plans. Retirement benefits are generally based on an employee’s years of service and compensation. Funding requirements are determined on an individual country and plan basis and are subject to local country practices and market circumstances. We expect to contribute approximately
$2.3 million
to non-U.S. defined benefit plans during 2018.
Impact on Financial Statements
The following table outlines the net periodic benefit cost of the defined benefit and retiree healthcare benefit plans for the years ended
December 31, 2017
,
2016
, and
2015
:
|
|
For the year ended December 31,
|
||||||||||||||||||||||||||||||||||
|
|
2017
|
2016
|
2015
|
||||||||||||||||||||||||||||||||
|
|
U.S. Plans
|
Non-U.S.
Plans
|
U.S. Plans
|
Non-U.S.
Plans
|
U.S. Plans
|
Non-U.S.
Plans
|
|||||||||||||||||||||||||||||
|
|
Defined
Benefit
|
Retiree
Healthcare
|
Defined
Benefit
|
Defined
Benefit
|
Retiree
Healthcare
|
Defined
Benefit
|
Defined
Benefit
|
Retiree
Healthcare
|
Defined
Benefit
|
||||||||||||||||||||||||||
|
Service cost
|
$
|
—
|
|
$
|
74
|
|
$
|
2,582
|
|
$
|
—
|
|
$
|
83
|
|
$
|
2,716
|
|
$
|
—
|
|
$
|
102
|
|
$
|
2,811
|
|
||||||||
|
Interest cost
|
1,604
|
|
325
|
|
1,053
|
|
1,461
|
|
364
|
|
1,179
|
|
1,564
|
|
272
|
|
1,075
|
|
|||||||||||||||||
|
Expected return on plan assets
|
(2,151
|
)
|
—
|
|
(905
|
)
|
(2,684
|
)
|
—
|
|
(952
|
)
|
(2,666
|
)
|
—
|
|
(892
|
)
|
|||||||||||||||||
|
Amortization of net loss
|
1,149
|
|
54
|
|
287
|
|
707
|
|
143
|
|
488
|
|
473
|
|
361
|
|
19
|
|
|||||||||||||||||
|
Amortization of net prior service credit
|
—
|
|
(1,335
|
)
|
(4
|
)
|
—
|
|
(1,335
|
)
|
(20
|
)
|
—
|
|
(1,335
|
)
|
(37
|
)
|
|||||||||||||||||
|
Loss on settlement
|
3,225
|
|
—
|
|
100
|
|
1,293
|
|
—
|
|
34
|
|
391
|
|
—
|
|
479
|
|
|||||||||||||||||
|
(Gain)/loss on curtailment
|
—
|
|
—
|
|
—
|
|
—
|
|
—
|
|
(486
|
)
|
—
|
|
—
|
|
1,901
|
|
|||||||||||||||||
|
Net periodic benefit cost/(credit)
|
$
|
3,827
|
|
$
|
(882
|
)
|
$
|
3,113
|
|
$
|
777
|
|
$
|
(745
|
)
|
$
|
2,959
|
|
$
|
(238
|
)
|
$
|
(600
|
)
|
$
|
5,356
|
|
||||||||
93
The following table outlines the rollforward of the benefit obligation and plan assets for the defined benefit and retiree healthcare benefit plans for the years ended
December 31, 2017
and
2016
:
|
|
For the year ended December 31,
|
||||||||||||||||||||||
|
|
2017
|
2016
|
|||||||||||||||||||||
|
|
U.S. Plans
|
Non-U.S.
Plans
|
U.S. Plans
|
Non-U.S.
Plans
|
|||||||||||||||||||
|
|
Defined
Benefit
|
Retiree
Healthcare
|
Defined
Benefit
|
Defined
Benefit
|
Retiree
Healthcare
|
Defined
Benefit
|
|||||||||||||||||
|
Change in Benefit Obligation
|
|||||||||||||||||||||||
|
Beginning balance
|
$
|
57,679
|
|
$
|
10,296
|
|
$
|
59,056
|
|
$
|
57,626
|
|
$
|
11,108
|
|
$
|
56,102
|
|
|||||
|
Service cost
|
—
|
|
74
|
|
2,582
|
|
—
|
|
83
|
|
2,716
|
|
|||||||||||
|
Interest cost
|
1,604
|
|
325
|
|
1,053
|
|
1,461
|
|
364
|
|
1,179
|
|
|||||||||||
|
Plan participants’ contributions
|
—
|
|
519
|
|
120
|
|
—
|
|
405
|
|
139
|
|
|||||||||||
|
Plan amendment
|
—
|
|
—
|
|
(6
|
)
|
—
|
|
—
|
|
(73
|
)
|
|||||||||||
|
Actuarial loss/(gain)
|
2,936
|
|
(197
|
)
|
2,692
|
|
4,946
|
|
(984
|
)
|
5,127
|
|
|||||||||||
|
Curtailments
|
—
|
|
—
|
|
—
|
|
—
|
|
—
|
|
(2,169
|
)
|
|||||||||||
|
Benefits paid
|
(13,604
|
)
|
(1,325
|
)
|
(2,572
|
)
|
(6,354
|
)
|
(962
|
)
|
(3,186
|
)
|
|||||||||||
|
Acquisitions
(1)
|
—
|
|
—
|
|
—
|
|
—
|
|
282
|
|
253
|
|
|||||||||||
|
Foreign currency exchange rate changes
|
—
|
|
—
|
|
4,488
|
|
—
|
|
—
|
|
(1,032
|
)
|
|||||||||||
|
Ending balance
|
$
|
48,615
|
|
$
|
9,692
|
|
$
|
67,413
|
|
$
|
57,679
|
|
$
|
10,296
|
|
$
|
59,056
|
|
|||||
|
Change in Plan Assets
|
|||||||||||||||||||||||
|
Beginning balance
|
$
|
52,042
|
|
$
|
—
|
|
$
|
37,361
|
|
$
|
55,867
|
|
$
|
—
|
|
$
|
33,961
|
|
|||||
|
Actual return on plan assets
|
2,319
|
|
—
|
|
1,241
|
|
2,262
|
|
—
|
|
2,469
|
|
|||||||||||
|
Employer contributions
|
344
|
|
1,325
|
|
2,586
|
|
267
|
|
962
|
|
3,552
|
|
|||||||||||
|
Plan participants’ contributions
|
—
|
|
—
|
|
120
|
|
—
|
|
—
|
|
139
|
|
|||||||||||
|
Benefits paid
|
(13,604
|
)
|
(1,325
|
)
|
(2,572
|
)
|
(6,354
|
)
|
(962
|
)
|
(3,186
|
)
|
|||||||||||
|
Foreign currency exchange rate changes
|
—
|
|
—
|
|
2,486
|
|
—
|
|
—
|
|
426
|
|
|||||||||||
|
Ending balance
|
$
|
41,101
|
|
$
|
—
|
|
$
|
41,222
|
|
$
|
52,042
|
|
$
|
—
|
|
$
|
37,361
|
|
|||||
|
Funded status at end of year
|
$
|
(7,514
|
)
|
$
|
(9,692
|
)
|
$
|
(26,191
|
)
|
$
|
(5,637
|
)
|
$
|
(10,296
|
)
|
$
|
(21,695
|
)
|
|||||
|
Accumulated benefit obligation at end of year
|
$
|
48,615
|
|
NA
|
|
$
|
60,588
|
|
$
|
57,679
|
|
NA
|
|
$
|
53,995
|
|
|||||||
(1) Relates to unfunded defined benefit plans assumed as part of the acquisition of CST.
The following table outlines the funded status amounts recognized in the consolidated balance sheets as of
December 31, 2017
and
2016
:
|
|
December 31, 2017
|
December 31, 2016
|
|||||||||||||||||||||
|
|
U.S. Plans
|
Non-U.S.
Plans
|
U.S. Plans
|
Non-U.S.
Plans
|
|||||||||||||||||||
|
|
Defined
Benefit
|
Retiree
Healthcare
|
Defined
Benefit
|
Defined
Benefit
|
Retiree
Healthcare
|
Defined
Benefit
|
|||||||||||||||||
|
Noncurrent assets
|
$
|
—
|
|
$
|
—
|
|
$
|
—
|
|
$
|
—
|
|
$
|
—
|
|
$
|
—
|
|
|||||
|
Current liabilities
|
(638
|
)
|
(1,210
|
)
|
(1,494
|
)
|
(651
|
)
|
(1,226
|
)
|
(873
|
)
|
|||||||||||
|
Noncurrent liabilities
|
(6,876
|
)
|
(8,482
|
)
|
(24,697
|
)
|
(4,986
|
)
|
(9,070
|
)
|
(20,822
|
)
|
|||||||||||
|
$
|
(7,514
|
)
|
$
|
(9,692
|
)
|
$
|
(26,191
|
)
|
$
|
(5,637
|
)
|
$
|
(10,296
|
)
|
$
|
(21,695
|
)
|
||||||
94
Balances recognized within Accumulated other comprehensive loss that have not been recognized as components of net periodic benefit cost, net of tax, as of
December 31, 2017
,
2016
, and
2015
are as follows:
|
|
2017
|
2016
|
2015
|
||||||||||||||||||||||||||||||||
|
|
U.S. Plans
|
Non-U.S. Plans
|
U.S. Plans
|
Non-U.S. Plans
|
U.S. Plans
|
Non-U.S. Plans
|
|||||||||||||||||||||||||||||
|
|
Defined
Benefit
|
Retiree
Healthcare
|
Defined
Benefit
|
Defined
Benefit
|
Retiree
Healthcare
|
Defined
Benefit
|
Defined
Benefit
|
Retiree
Healthcare
|
Defined
Benefit
|
||||||||||||||||||||||||||
|
Net prior service credit
|
$
|
—
|
|
$
|
823
|
|
$
|
(220
|
)
|
$
|
—
|
|
$
|
(512
|
)
|
$
|
(218
|
)
|
$
|
—
|
|
$
|
(1,847
|
)
|
$
|
(538
|
)
|
||||||||
|
Net loss
|
$
|
20,884
|
|
$
|
1,009
|
|
$
|
12,489
|
|
$
|
22,490
|
|
$
|
1,260
|
|
$
|
11,070
|
|
$
|
19,122
|
|
$
|
2,387
|
|
$
|
10,719
|
|
||||||||
We expect to amortize a loss of
$0.3 million
from Accumulated other comprehensive loss to net periodic benefit cost during 2018.
Information for plans with an accumulated benefit obligation in excess of plan assets as of
December 31, 2017
and
2016
is as follows:
|
|
December 31, 2017
|
December 31, 2016
|
|||||||||||||
|
|
U.S.
Plans
|
Non-U.S.
Plans
|
U.S.
Plans
|
Non-U.S.
Plans
|
|||||||||||
|
Projected benefit obligation
|
$
|
48,615
|
|
$
|
31,680
|
|
$
|
57,679
|
|
$
|
25,367
|
|
|||
|
Accumulated benefit obligation
|
$
|
48,615
|
|
$
|
26,609
|
|
$
|
57,679
|
|
$
|
22,285
|
|
|||
|
Plan assets
|
$
|
41,101
|
|
$
|
5,759
|
|
$
|
52,042
|
|
$
|
4,876
|
|
|||
Information for plans with a projected benefit obligation in excess of plan assets as of
December 31, 2017
and
2016
is as follows:
|
|
December 31, 2017
|
December 31, 2016
|
|||||||||||||
|
|
U.S.
Plans
|
Non-U.S.
Plans
|
U.S.
Plans
|
Non-U.S.
Plans
|
|||||||||||
|
Projected benefit obligation
|
$
|
58,307
|
|
$
|
63,153
|
|
$
|
67,975
|
|
$
|
54,849
|
|
|||
|
Plan assets
|
$
|
41,101
|
|
$
|
36,990
|
|
$
|
52,042
|
|
$
|
33,606
|
|
|||
Other changes in plan assets and benefit obligations, net of tax, recognized in Other comprehensive loss for the years ended
December 31, 2017
,
2016
, and
2015
are as follows:
|
|
For the year ended December 31,
|
||||||||||||||||||||||||||||||||||
|
|
2017
|
2016
|
2015
|
||||||||||||||||||||||||||||||||
|
|
U.S. Plans
|
Non-U.S.
Plans
|
U.S. Plans
|
Non-U.S.
Plans
|
U.S. Plans
|
Non-U.S.
Plans
|
|||||||||||||||||||||||||||||
|
|
Defined
Benefit
|
Retiree
Healthcare
|
Defined
Benefit
|
Defined
Benefit
|
Retiree
Healthcare
|
Defined
Benefit
|
Defined
Benefit
|
Retiree
Healthcare
|
Defined
Benefit
|
||||||||||||||||||||||||||
|
Net loss/(gain)
|
$
|
2,768
|
|
$
|
(197
|
)
|
$
|
1,618
|
|
$
|
5,368
|
|
$
|
(984
|
)
|
$
|
2,505
|
|
$
|
2,792
|
|
$
|
(949
|
)
|
$
|
(1,233
|
)
|
||||||||
|
Amortization of net (loss)/gain
|
(1,149
|
)
|
(54
|
)
|
(130
|
)
|
(707
|
)
|
(143
|
)
|
(436
|
)
|
(473
|
)
|
(361
|
)
|
70
|
|
|||||||||||||||||
|
Amortization of net prior service credit
|
—
|
|
1,335
|
|
3
|
|
—
|
|
1,335
|
|
15
|
|
—
|
|
1,335
|
|
32
|
|
|||||||||||||||||
|
Plan amendment
|
—
|
|
—
|
|
(5
|
)
|
—
|
|
—
|
|
(73
|
)
|
—
|
|
—
|
|
24
|
|
|||||||||||||||||
|
Settlement effect
|
(3,225
|
)
|
—
|
|
(69
|
)
|
(1,293
|
)
|
—
|
|
(67
|
)
|
(391
|
)
|
—
|
|
(330
|
)
|
|||||||||||||||||
|
Curtailment effect
|
—
|
|
—
|
|
—
|
|
—
|
|
—
|
|
(1,272
|
)
|
—
|
|
—
|
|
—
|
|
|||||||||||||||||
|
Total recognized in other comprehensive loss/(income)
|
$
|
(1,606
|
)
|
$
|
1,084
|
|
$
|
1,417
|
|
$
|
3,368
|
|
$
|
208
|
|
$
|
672
|
|
$
|
1,928
|
|
$
|
25
|
|
$
|
(1,437
|
)
|
||||||||
95
Assumptions and Investment Policies
Weighted-average assumptions used to calculate the projected benefit obligations of our defined benefit and retiree healthcare benefit plans as of
December 31, 2017
and
2016
are as follows:
|
|
December 31, 2017
|
|
December 31, 2016
|
|
|||||||||
|
|
Defined
Benefit
|
Retiree
Healthcare
|
|
Defined
Benefit
|
Retiree
Healthcare
|
|
|||||||
|
U.S. assumed discount rate
|
3.00
|
%
|
3.10
|
%
|
3.20
|
%
|
3.30
|
%
|
|||||
|
Non-U.S. assumed discount rate
|
2.07
|
%
|
NA
|
|
1.75
|
%
|
NA
|
|
|||||
|
Non-U.S. average long-term pay progression
|
2.66
|
%
|
NA
|
|
2.46
|
%
|
NA
|
|
|||||
Weighted-average assumptions used to calculate the net periodic benefit cost of our defined benefit and retiree healthcare benefit plans for the years ended
December 31, 2017
,
2016
, and
2015
are as follows:
|
|
For the year ended December 31,
|
||||||||||||||||
|
|
2017
|
|
2016
|
|
2015
|
||||||||||||
|
|
Defined
Benefit
|
Retiree
Healthcare
|
|
Defined
Benefit
|
Retiree
Healthcare
|
|
Defined
Benefit
|
Retiree
Healthcare
|
|||||||||
|
U.S. assumed discount rate
|
3.20
|
%
|
3.30
|
%
|
3.10
|
%
|
3.50
|
%
|
2.90
|
%
|
2.90
|
%
|
|||||
|
Non-U.S. assumed discount rate
|
3.90
|
%
|
NA
|
|
3.83
|
%
|
NA
|
|
4.19
|
%
|
NA
|
|
|||||
|
U.S. average long-term rate
of return on plan assets
|
4.50
|
%
|
NA
|
|
5.00
|
%
|
NA
|
|
5.00
|
%
|
NA
|
|
|||||
|
Non-U.S. average long-term rate of return on plan assets
|
2.29
|
%
|
NA
|
|
2.60
|
%
|
NA
|
|
2.51
|
%
|
NA
|
|
|||||
|
Non-U.S. average long-term pay progression
|
3.75
|
%
|
NA
|
|
3.78
|
%
|
NA
|
|
4.34
|
%
|
NA
|
|
|||||
Assumed healthcare cost trend rates for the U.S. retiree healthcare benefit plan as of
December 31, 2017
,
2016
, and
2015
are as follows:
|
|
Retiree Healthcare
|
|||||||
|
|
December 31, 2017
|
December 31, 2016
|
December 31, 2015
|
|||||
|
Assumed healthcare trend rate for next year:
|
||||||||
|
Attributed to less than age 65
|
6.90
|
%
|
7.10
|
%
|
7.30
|
%
|
||
|
Attributed to age 65 or greater
|
7.50
|
%
|
7.80
|
%
|
6.80
|
%
|
||
|
Ultimate trend rate
|
4.50
|
%
|
4.50
|
%
|
4.50
|
%
|
||
|
Year in which ultimate trend rate is reached:
|
|
|||||||
|
Attributed to less than age 65
|
2038
|
|
2038
|
|
2029
|
|
||
|
Attributed to age 65 or greater
|
2038
|
|
2038
|
|
2029
|
|
||
Assumed healthcare trend rates could have a significant effect on the amounts reported for retiree healthcare plans. A
one
percentage point change in the assumed healthcare trend rates for the year ended
December 31, 2017
would have the following effect:
|
1 percentage
point
increase
|
1 percentage
point
decrease
|
||||||
|
Effect on total service and interest cost components
|
$
|
8
|
|
$
|
(7
|
)
|
|
|
Effect on post-retirement benefit obligations
|
$
|
261
|
|
$
|
(227
|
)
|
|
96
The table below outlines the benefits expected to be paid to participants in each of the following years, taking into consideration expected future service, as appropriate. The majority of the payments will be paid from plan assets and not company assets.
|
Expected Benefit Payments
|
U.S.
Defined
Benefit
|
U.S.
Retiree
Healthcare
|
Non-U.S.
Defined
Benefit
|
||||||||
|
2018
|
$
|
6,211
|
|
$
|
1,210
|
|
$
|
2,848
|
|
||
|
2019
|
5,851
|
|
1,257
|
|
2,905
|
|
|||||
|
2020
|
5,341
|
|
1,219
|
|
3,178
|
|
|||||
|
2021
|
4,956
|
|
1,112
|
|
3,258
|
|
|||||
|
2022
|
4,001
|
|
1,022
|
|
3,937
|
|
|||||
|
2023 - 2027
|
12,185
|
|
3,273
|
|
20,474
|
|
|||||
Plan Assets
We hold assets for our defined benefit plans in the U.S., Japan, the Netherlands, and Belgium. Information about the assets for each of these plans is detailed below.
U.S. Plan Assets
Our target asset allocation for the U.S. defined benefit plan is
83%
fixed income and
17%
equity securities. To arrive at the targeted asset allocation, we and our investment adviser collaboratively reviewed market opportunities using historic and statistical data, as well as the actuarial valuation for the plan, to ensure that the levels of acceptable return and risk are well-defined and monitored. Currently, we believe that there are no significant concentrations of risk associated with the plan assets.
The following table presents information about the plan’s target asset allocation, as well as the actual allocation, as of
December 31, 2017
:
|
Asset Class
|
Target Allocation
|
Actual Allocation as of December 31, 2017
|
|||
|
U.S. large cap equity
|
8
|
%
|
8
|
%
|
|
|
U.S. small / mid cap equity
|
2
|
%
|
2
|
%
|
|
|
Globally managed volatility fund
|
3
|
%
|
3
|
%
|
|
|
International (non-U.S.) equity
|
4
|
%
|
4
|
%
|
|
|
Fixed income (U.S. investment and non-investment grade)
|
68
|
%
|
67
|
%
|
|
|
High-yield fixed income
|
2
|
%
|
2
|
%
|
|
|
International (non-U.S.) fixed income
|
1
|
%
|
1
|
%
|
|
|
Money market funds
|
12
|
%
|
12
|
%
|
|
The portfolio is monitored for automatic rebalancing on a monthly basis.
97
The following table presents information about the plan assets measured at fair value as of
December 31, 2017
and
2016
, aggregated by the level in the fair value hierarchy within which those measurements fall:
|
|
December 31, 2017
|
December 31, 2016
|
|||||||||||||||||||||||||||||
|
Asset Class
|
Quoted
Prices in
Active
Markets
for Identical
Assets
(Level 1)
|
Significant
Other
Observable
Inputs
(Level 2)
|
Significant
Unobservable
Inputs
(Level 3)
|
Total
|
Quoted
Prices in
Active
Markets
for Identical
Assets
(Level 1)
|
Significant
Other
Observable
Inputs
(Level 2)
|
Significant
Unobservable
Inputs
(Level 3)
|
Total
|
|||||||||||||||||||||||
|
U.S. large cap equity
|
$
|
3,288
|
|
$
|
—
|
|
$
|
—
|
|
$
|
3,288
|
|
$
|
3,786
|
|
$
|
—
|
|
$
|
—
|
|
$
|
3,786
|
|
|||||||
|
U.S. small / mid cap equity
|
942
|
|
—
|
|
—
|
|
942
|
|
2,109
|
|
—
|
|
—
|
|
2,109
|
|
|||||||||||||||
|
Global managed volatility fund
|
1,288
|
|
—
|
|
—
|
|
1,288
|
|
—
|
|
—
|
|
—
|
|
—
|
|
|||||||||||||||
|
International (non-U.S.) equity
|
1,788
|
|
—
|
|
—
|
|
1,788
|
|
2,867
|
|
—
|
|
—
|
|
2,867
|
|
|||||||||||||||
|
Total equity mutual funds
|
7,306
|
|
—
|
|
—
|
|
7,306
|
|
8,762
|
|
—
|
|
—
|
|
8,762
|
|
|||||||||||||||
|
Fixed income (U.S. investment grade)
|
27,507
|
|
—
|
|
—
|
|
27,507
|
|
42,053
|
|
—
|
|
—
|
|
42,053
|
|
|||||||||||||||
|
High-yield fixed income
|
821
|
|
—
|
|
—
|
|
821
|
|
788
|
|
—
|
|
—
|
|
788
|
|
|||||||||||||||
|
International (non-U.S.) fixed income
|
398
|
|
—
|
|
—
|
|
398
|
|
439
|
|
—
|
|
—
|
|
439
|
|
|||||||||||||||
|
Total fixed income mutual funds
|
28,726
|
|
—
|
|
—
|
|
28,726
|
|
43,280
|
|
—
|
|
—
|
|
43,280
|
|
|||||||||||||||
|
Money market funds
|
5,069
|
|
—
|
|
—
|
|
5,069
|
|
—
|
|
—
|
|
—
|
|
—
|
|
|||||||||||||||
|
Total
|
$
|
41,101
|
|
$
|
—
|
|
$
|
—
|
|
$
|
41,101
|
|
$
|
52,042
|
|
$
|
—
|
|
$
|
—
|
|
$
|
52,042
|
|
|||||||
Investments in mutual funds are based on the publicly-quoted final net asset values on the last business day of the year.
Permitted asset classes include U.S. and non-U.S. equity, U.S. and non-U.S. fixed income, and cash and cash equivalents. Fixed income includes both investment grade and non-investment grade. Permitted investment vehicles include mutual funds, individual securities, derivatives, and long-duration fixed income securities. While investment in individual securities, derivatives, long-duration fixed income, and cash and cash equivalents is permitted, the plan did not hold these types of investments as of
December 31, 2017
or
2016
.
Prohibited investments include direct investment in real estate, commodities, unregistered securities, uncovered options, currency exchange, and natural resources (such as timber, oil, and gas).
Japan Plan Assets
The target asset allocation of the Japan defined benefit plan is
50%
equity securities and
50%
fixed income securities and cash and cash equivalents, with allowance for a
40%
deviation in either direction. We, along with the trustee of the plan's assets, minimize investment risk by thoroughly assessing potential investments based on indicators of historical returns and current ratings. Additionally, investments are diversified by type and geography.
The following table presents information about the plan’s target asset allocation, as well as the actual allocation, as of
December 31, 2017
:
|
Asset Class
|
Target Allocation
|
Actual Allocation as of December 31, 2017
|
||
|
Equity securities
|
10%-90%
|
29
|
%
|
|
|
Fixed income securities and cash and cash equivalents
|
10%-90%
|
71
|
%
|
|
98
The following table presents information about the plan assets measured at fair value as of
December 31, 2017
and
2016
, aggregated by the level in the fair value hierarchy within which those measurements fall:
|
|
December 31, 2017
|
December 31, 2016
|
|||||||||||||||||||||||||||||
|
Asset Class
|
Quoted
Prices in
Active
Markets
for Identical
Assets
(Level 1)
|
Significant
Other
Observable
Inputs
(Level 2)
|
Significant
Unobservable
Inputs
(Level 3)
|
Total
|
Quoted
Prices in
Active
Markets
for Identical
Assets
(Level 1)
|
Significant
Other
Observable
Inputs
(Level 2)
|
Significant
Unobservable
Inputs
(Level 3)
|
Total
|
|||||||||||||||||||||||
|
U.S. equity
|
$
|
2,461
|
|
$
|
—
|
|
$
|
—
|
|
$
|
2,461
|
|
$
|
2,791
|
|
$
|
—
|
|
$
|
—
|
|
$
|
2,791
|
|
|||||||
|
International (non-U.S.) equity
|
6,567
|
|
—
|
|
—
|
|
6,567
|
|
5,581
|
|
—
|
|
—
|
|
5,581
|
|
|||||||||||||||
|
Total equity securities
|
9,028
|
|
—
|
|
—
|
|
9,028
|
|
8,372
|
|
—
|
|
—
|
|
8,372
|
|
|||||||||||||||
|
U.S. fixed income
|
2,968
|
|
268
|
|
—
|
|
3,236
|
|
2,894
|
|
249
|
|
—
|
|
3,143
|
|
|||||||||||||||
|
International (non-U.S.) fixed income
|
11,046
|
|
—
|
|
—
|
|
11,046
|
|
11,288
|
|
—
|
|
—
|
|
11,288
|
|
|||||||||||||||
|
Total fixed income securities
|
14,014
|
|
268
|
|
—
|
|
14,282
|
|
14,182
|
|
249
|
|
—
|
|
14,431
|
|
|||||||||||||||
|
Cash and cash equivalents
|
7,921
|
|
—
|
|
—
|
|
7,921
|
|
5,927
|
|
—
|
|
—
|
|
5,927
|
|
|||||||||||||||
|
Total
|
$
|
30,963
|
|
$
|
268
|
|
$
|
—
|
|
$
|
31,231
|
|
$
|
28,481
|
|
$
|
249
|
|
$
|
—
|
|
$
|
28,730
|
|
|||||||
The fair values of equity and fixed income securities are based on publicly-quoted closing stock and bond values on the last business day of the year.
Permitted asset classes include equity securities that are traded on the official stock exchange(s) of the respective countries, fixed income securities with certain credit ratings, and cash and cash equivalents.
The Netherlands Plan Assets
The assets of the Netherlands defined benefit plans are composed of insurance policies. The contributions (or premiums) we pay are used to purchase insurance policies that provide for specific benefit payments to our plan participants. The benefit formula is determined independently by us. On retirement of an individual plan participant, the insurance contracts purchased are converted to provide specific benefits for the participant. The contributions paid by us are commingled with contributions paid to the insurance provider by other employers for investment purposes and to reduce plan administration costs. However, these defined benefit plans are not considered multi-employer plans.
The following table presents information about the plans’ assets measured at fair value as of
December 31, 2017
and
2016
, aggregated by the level in the fair value hierarchy within which those measurements fall:
|
|
December 31, 2017
|
December 31, 2016
|
|||||||||||||||||||||||||||||
|
Asset Class
|
Quoted
Prices in
Active
Markets
for Identical
Assets
(Level 1)
|
Significant
Other
Observable
Inputs
(Level 2)
|
Significant
Unobservable
Inputs
(Level 3)
|
Total
|
Quoted
Prices in
Active
Markets
for Identical
Assets
(Level 1)
|
Significant
Other
Observable
Inputs
(Level 2)
|
Significant
Unobservable
Inputs
(Level 3)
|
Total
|
|||||||||||||||||||||||
|
Insurance policies
|
$
|
—
|
|
$
|
—
|
|
$
|
9,059
|
|
$
|
9,059
|
|
$
|
—
|
|
$
|
—
|
|
$
|
8,014
|
|
$
|
8,014
|
|
|||||||
|
Total
|
$
|
—
|
|
$
|
—
|
|
$
|
9,059
|
|
$
|
9,059
|
|
$
|
—
|
|
$
|
—
|
|
$
|
8,014
|
|
$
|
8,014
|
|
|||||||
99
The following table presents a rollforward of the Level 3 assets in our Netherlands' pension plans for the years ended
December 31, 2017
and
2016
:
|
|
Significant unobservable
inputs (Level 3)
|
||
|
Balance at December 31, 2015
|
$
|
5,757
|
|
|
Actual return on plan assets still held at reporting date
|
2,064
|
|
|
|
Purchases, sales, settlements, and exchange rate changes
|
193
|
|
|
|
Balance at December 31, 2016
|
8,014
|
|
|
|
Actual return on plan assets still held at reporting date
|
(597
|
)
|
|
|
Purchases, sales, settlements, and exchange rate changes
|
1,642
|
|
|
|
Balance at December 31, 2017
|
$
|
9,059
|
|
The fair values of the insurance contracts are measured based on the future benefit payments that would be made by the insurance company to vested plan participants if we were to switch to another insurance company without actually surrendering our policy. In this case, the insurance company would guarantee to pay the vested benefits at retirement accrued under the plan based on current salaries and service to date (i.e.,
no
allowance for future salary increases or pension increases). The cash flows of the future benefit payments are discounted using the same discount rate as is used to value the defined benefit plan liabilities.
Belgium Plan Assets
The assets of the Belgium defined benefit plan are composed of insurance policies. As of
December 31, 2017
and
2016
the fair value of these plan assets was
$0.9 million
and
$0.8 million
, respectively, which are considered to be Level 3 financial instruments.
11. Share-Based Payment Plans
In connection with the completion of our initial public offering ("IPO"), we adopted the Sensata Technologies Holding N.V. 2010 Equity Incentive Plan (the “2010 Equity Incentive Plan”). The purpose of the 2010 Equity Incentive Plan is to promote long-term growth and profitability by providing our present and future eligible directors, officers, and employees with incentives to contribute to, and participate in, our success. There are
10.0 million
ordinary shares authorized under the 2010 Equity Incentive Plan, of which
3.8 million
were available as of
December 31, 2017
.
Share-Based Compensation Awards
We grant share-based compensation awards under the 2010 Equity Incentive Plan for which vesting is subject only to continued employment and the passage of time (options and restricted stock units ("RSUs")), as well as those for which vesting also depends on the attainment of certain performance criteria (performance options and performance-based restricted stock units ("PRSUs")). RSUs and PRSUs are generally referred to in this Annual Report on Form 10-K as "restricted securities."
100
Options
A summary of stock option activity for the years ended
December 31, 2017
,
2016
, and
2015
is presented in the table below (amounts have been calculated based on unrounded shares):
|
Stock Options
|
Weighted-Average
Exercise Price Per Option
|
Weighted-Average
Remaining
Contractual Term
(in years)
|
Aggregate
Intrinsic Value
|
|||||||||
|
Balance at December 31, 2014
|
4,089
|
|
$
|
27.53
|
|
6.3
|
$
|
101,705
|
|
|||
|
Granted
|
353
|
|
$
|
56.60
|
|
|||||||
|
Forfeited and expired
|
(65
|
)
|
$
|
43.93
|
|
|||||||
|
Exercised
|
(1,016
|
)
|
$
|
18.85
|
|
$
|
34,835
|
|
||||
|
Balance at December 31, 2015
|
3,361
|
|
$
|
32.89
|
|
6.2
|
$
|
47,967
|
|
|||
|
Granted
(1)
|
654
|
|
$
|
37.89
|
|
|||||||
|
Forfeited and expired
|
(111
|
)
|
$
|
43.95
|
|
|||||||
|
Exercised
|
(358
|
)
|
$
|
11.05
|
|
$
|
9,501
|
|
||||
|
Balance at December 31, 2016
|
3,546
|
|
$
|
35.67
|
|
6.3
|
$
|
19,844
|
|
|||
|
Granted
|
387
|
|
$
|
43.67
|
|
|||||||
|
Forfeited and expired
|
(1
|
)
|
$
|
32.03
|
|
|||||||
|
Exercised
|
(326
|
)
|
$
|
22.86
|
|
$
|
7,175
|
|
||||
|
Balance at December 31, 2017
|
3,606
|
|
$
|
37.69
|
|
6.0
|
$
|
50,130
|
|
|||
|
Options vested and exercisable as of December 31, 2017
|
2,422
|
|
$
|
35.47
|
|
4.8
|
$
|
38,872
|
|
|||
|
Vested and expected to vest as of December 31, 2017
(2)
|
3,426
|
|
$
|
37.43
|
|
5.8
|
$
|
48,476
|
|
|||
__________________
|
(1)
|
Includes
257
performance-based options.
|
|
(2)
|
Consists of vested options and unvested options that are expected to vest. The expected to vest options are determined by applying the forfeiture rate assumption, adjusted for cumulative actual forfeitures, to total unvested options.
|
A summary of the status of our unvested options as of
December 31, 2017
, and of the changes during the year then ended, is presented in the table below (amounts have been calculated based on unrounded shares):
|
|
Stock Options
|
Weighted-Average Grant-Date Fair Value
|
||||
|
Unvested as of December 31, 2016
|
1,223
|
|
$
|
13.28
|
|
|
|
Granted during the year
|
387
|
|
$
|
14.50
|
|
|
|
Vested during the year
|
(425
|
)
|
$
|
13.16
|
|
|
|
Forfeited or expired during the year
|
(1
|
)
|
$
|
10.09
|
|
|
|
Unvested as of December 31, 2017
|
1,184
|
|
$
|
13.72
|
|
|
The fair value of stock options that vested during the years ended
December 31, 2017
,
2016
, and
2015
was
$5.6 million
,
$7.1 million
, and
$7.5 million
, respectively.
Non-performance-based options granted to employees under the 2010 Equity Incentive Plan generally vest
25%
per year over
four
years from the date of grant. Performance-based options granted to employees under the 2010 Equity Incentive Plan vest after
three
years, depending on the extent to which certain performance criteria are met. Options granted to directors under the 2010 Equity Incentive Plan vest after
one
year.
We recognize compensation expense for options on a straight-line basis over the requisite service period, which is generally the same as the vesting period. The options expire
ten
years from the date of grant. Except as otherwise provided in specific option award agreements, if a participant ceases to be employed by us, options not yet vested expire and are forfeited at
101
the termination date, and options that are fully vested expire
60
days after termination of the participant’s employment for any reason other than termination for cause (in which case the options expire on the participant’s termination date) or due to death or disability (in which case the options expire
6
months after the participant’s termination date).
The weighted-average grant-date fair value per option granted during the years ended December 31,
2017
,
2016
, and
2015
was
$14.50
,
$12.08
, and
$17.94
, respectively. The fair value of options was estimated on the date of grant using the Black-Scholes-Merton option-pricing model. See Note 2, "Significant Accounting Policies," for further discussion of how we estimate the fair value of options. The weighted-average key assumptions used in estimating the grant-date fair value of options are as follows:
|
|
For the year ended December 31,
|
||||||||||
|
|
2017
|
2016
|
2015
|
||||||||
|
Expected dividend yield
|
0.00
|
%
|
0.00
|
%
|
0.00
|
%
|
|||||
|
Expected volatility
|
30.00
|
%
|
30.00
|
%
|
30.00
|
%
|
|||||
|
Risk-free interest rate
|
2.08
|
%
|
1.48
|
%
|
1.52
|
%
|
|||||
|
Expected term (years)
|
6.0
|
|
6.0
|
|
5.9
|
|
|||||
|
Fair value per share of underlying ordinary shares
|
$
|
43.67
|
|
$
|
37.89
|
|
$
|
56.60
|
|
||
We did not grant options to our directors in 2017 or 2016. We granted
72
options to our directors under the 2010 Equity Incentive Plan in
2015
. These options vested after
one
year and were not subject to performance conditions. The weighted-average grant date fair value per option was
$17.05
.
Restricted Securities
We grant RSUs that cliff vest over various lengths of time ranging from
one
to
four
years, as well as those that vest
25%
per year over
four
years. We grant PRSUs that generally cliff vest
three
years after the grant date. The number of PRSUs that ultimately vest will depend on the extent to which certain performance criteria are met, as defined in the table below. See Note 2, "Significant Accounting Policies," for discussion of how we estimate the fair value of restricted securities.
A summary of restricted securities granted in the past three years is presented below:
|
Percentage Range of PRSUs Awarded That May Vest
(1)
|
|||||||||||||||||||||
|
0.0% to 172.5%
|
0.0% to 200.0%
|
||||||||||||||||||||
|
Year ended December 31,
|
RSUs Granted
|
Weighted-Average
Grant-Date Fair Value |
PRSUs Granted
|
Weighted-Average
Grant-Date
Fair Value
|
PRSUs Granted
|
Weighted-Average
Grant-Date
Fair Value
|
|||||||||||||||
|
2017
|
182
|
|
$
|
43.24
|
|
183
|
|
$
|
43.67
|
|
53
|
|
$
|
43.33
|
|
||||||
|
2016
|
319
|
|
$
|
38.33
|
|
180
|
|
$
|
38.96
|
|
—
|
|
$
|
—
|
|
||||||
|
2015
|
150
|
|
$
|
56.42
|
|
128
|
|
$
|
56.94
|
|
—
|
|
$
|
—
|
|
||||||
(1)
Represents the percentage range of PRSUs that may vest according to the terms of the awards, and does not reflect our current assessment of the probable outcome of vesting based on the achievement or expected achievement of performance conditions.
Compensation cost for the year ended
December 31, 2017
reflects our estimate of the probable outcome of the performance conditions associated with the PRSUs granted in 2017 and 2016.
102
A summary of activity related to outstanding restricted securities for
2017
,
2016
, and
2015
is presented in the table below (amounts have been calculated based on unrounded shares):
|
Restricted Securities
|
Weighted-Average
Grant-Date
Fair Value
|
|||||
|
Balance at December 31, 2014
|
656
|
|
$
|
36.06
|
|
|
|
Granted
|
278
|
|
$
|
56.66
|
|
|
|
Forfeited
|
(165
|
)
|
$
|
38.55
|
|
|
|
Vested
|
(115
|
)
|
$
|
26.72
|
|
|
|
Balance at December 31, 2015
|
654
|
|
$
|
45.87
|
|
|
|
Granted
|
499
|
|
$
|
38.56
|
|
|
|
Forfeited
|
(48
|
)
|
$
|
47.01
|
|
|
|
Vested
|
(185
|
)
|
$
|
33.41
|
|
|
|
Balance at December 31, 2016
|
920
|
|
$
|
44.35
|
|
|
|
Granted
|
418
|
|
$
|
43.44
|
|
|
|
Forfeited
|
(35
|
)
|
$
|
43.94
|
|
|
|
Vested
|
(222
|
)
|
$
|
42.24
|
|
|
|
Balance at December 31, 2017
|
1,081
|
|
$
|
44.43
|
|
|
Aggregate intrinsic value information for restricted securities as of
December 31, 2017
,
2016
, and
2015
is presented below:
|
December 31,
2017 |
December 31,
2016 |
December 31,
2015 |
|||||||||
|
Outstanding
|
$
|
55,271
|
|
$
|
35,845
|
|
$
|
30,115
|
|
||
|
Expected to vest
|
$
|
42,106
|
|
$
|
26,937
|
|
$
|
22,704
|
|
||
The weighted-average remaining periods over which the restrictions will lapse, expressed in years, as of
December 31, 2017
,
2016
, and
2015
are as follows:
|
December 31,
2017 |
December 31,
2016 |
December 31,
2015 |
|||
|
Outstanding
|
1.3
|
1.5
|
1.4
|
||
|
Expected to vest
|
1.4
|
1.5
|
1.4
|
||
The expected to vest restricted securities are calculated based on the application of a forfeiture rate assumption to all outstanding restricted securities as well as our assessment of the probability of meeting the required performance conditions that pertain to the PRSUs.
On April 25, 2016, our Board of Directors approved retroactive amendments to our RSUs and PRSUs to allow for accelerated vesting upon termination without cause within
24
months after a change in control, as defined in the 2010 Equity Incentive Plan. These changes were made in order to provide consistency across our equity awards, to better align management and shareholder interests, and to incorporate equity compensation best practices. There was no change to the terms of our option awards, as Section 4.3(b) of the 2010 Equity Incentive Plan specifically provides for accelerated vesting of options upon termination without cause within
24
months after a change in control.
103
Share-Based Compensation Expense
The table below presents non-cash compensation expense related to our equity awards:
|
|
For the year ended
|
||||||||||
|
|
December 31,
2017 |
December 31,
2016 |
December 31,
2015 |
||||||||
|
Options
|
$
|
6,046
|
|
$
|
7,094
|
|
$
|
7,176
|
|
||
|
Restricted securities
|
13,773
|
|
10,331
|
|
8,150
|
|
|||||
|
Total share-based compensation expense
|
$
|
19,819
|
|
$
|
17,425
|
|
$
|
15,326
|
|
||
This compensation expense is recorded within SG&A expense in the consolidated statements of operations during the identified periods. We did not recognize a tax benefit associated with these expenses.
The table below presents unrecognized compensation expense at
December 31, 2017
for each class of award, and the remaining expected term for this expense to be recognized:
|
Unrecognized
compensation expense
|
Expected
recognition (years)
|
||||
|
Options
|
$
|
9,924
|
|
2.1
|
|
|
Restricted securities
|
19,755
|
|
1.6
|
||
|
Total unrecognized compensation expense
|
$
|
29,679
|
|
||
12. Shareholders’ Equity
Our authorized share capital consists of
400.0 million
ordinary shares with a nominal value of
€0.01
per share, of which
178.4 million
ordinary shares were issued and
171.4 million
were outstanding as of
December 31, 2017
. Issued and outstanding shares exclude
1.1 million
outstanding restricted securities and
3.6 million
outstanding stock options. See Note 11, "Share-Based Payment Plans," for awards available for grant under our outstanding equity plan.
Treasury Shares
We have a
$250.0 million
share repurchase program in place. Under this program, we may repurchase ordinary shares from time to time, at such times and in amounts to be determined by our management, based on market conditions, legal requirements, and other corporate considerations, on the open market or in privately negotiated transactions. The share repurchase program may be modified or terminated by our Board of Directors at any time. We did
no
t repurchase any ordinary shares under this program during the years ended December 31, 2017, 2016, or 2015. At December 31, 2017,
$250.0 million
remained available for share repurchase under this program.
Ordinary shares repurchased by us are recorded at cost as treasury shares and result in a reduction of shareholders' equity. We reissue treasury shares as part of our share-based compensation programs. When shares are reissued, we determine the cost using the first-in, first-out method. During the years ended December 31,
2017
,
2016
, and
2015
, we reissued
0.5 million
,
0.5 million
, and
1.1 million
treasury shares, respectively. During the years ended December 31,
2017
and
2016
, in connection with our treasury share reissuances, we recognized reductions in Retained earnings of
$13.6 million
, and
$16.8 million
, respectively.
104
Accumulated Other Comprehensive Loss
The components of Accumulated other comprehensive loss were as follows:
|
Cash Flow Hedges
|
Defined Benefit and Retiree Healthcare Plans
|
Accumulated Other Comprehensive Loss
|
|||||||||
|
Balance at December 31, 2014
|
$
|
17,578
|
|
$
|
(29,326
|
)
|
$
|
(11,748
|
)
|
||
|
Pre-tax current period change
|
(18,301
|
)
|
359
|
|
(17,942
|
)
|
|||||
|
Income tax benefit/(expense)
|
4,575
|
|
(875
|
)
|
3,700
|
|
|||||
|
Balance at December 31, 2015
|
3,852
|
|
(29,842
|
)
|
(25,990
|
)
|
|||||
|
Pre-tax current period change
|
(5,106
|
)
|
(4,934
|
)
|
(10,040
|
)
|
|||||
|
Income tax benefit
|
1,277
|
|
686
|
|
1,963
|
|
|||||
|
Balance at December 31, 2016
|
23
|
|
(34,090
|
)
|
(34,067
|
)
|
|||||
|
Pre-tax current period change
|
(37,603
|
)
|
(1,445
|
)
|
(39,048
|
)
|
|||||
|
Income tax benefit
|
9,401
|
|
550
|
|
9,951
|
|
|||||
|
Balance at December 31, 2017
|
$
|
(28,179
|
)
|
$
|
(34,985
|
)
|
$
|
(63,164
|
)
|
||
The details of the components of Other comprehensive loss, net of tax, for the years ended
December 31, 2017
,
2016
, and
2015
are as follows:
|
Year Ended December 31, 2017
|
Year Ended December 31, 2016
|
Year Ended December 31, 2015
|
||||||||||||||||||||||||||||||||||
|
Cash Flow Hedges
|
Defined Benefit and Retiree Healthcare Plans
|
Total
|
Cash Flow Hedges
|
Defined Benefit and Retiree Healthcare Plans
|
Total
|
Cash Flow Hedges
|
Defined Benefit and Retiree Healthcare Plans
|
Total
|
||||||||||||||||||||||||||||
|
Other comprehensive (loss)/income before reclassifications
|
$
|
(39,387
|
)
|
$
|
(4,184
|
)
|
$
|
(43,571
|
)
|
$
|
(6,356
|
)
|
$
|
(6,816
|
)
|
$
|
(13,172
|
)
|
$
|
19,464
|
|
$
|
(634
|
)
|
$
|
18,830
|
|
|||||||||
|
Amounts reclassified from Accumulated other comprehensive loss
|
11,185
|
|
3,289
|
|
14,474
|
|
2,527
|
|
2,568
|
|
5,095
|
|
(33,190
|
)
|
118
|
|
(33,072
|
)
|
||||||||||||||||||
|
Net current period other comprehensive loss
|
$
|
(28,202
|
)
|
$
|
(895
|
)
|
$
|
(29,097
|
)
|
$
|
(3,829
|
)
|
$
|
(4,248
|
)
|
$
|
(8,077
|
)
|
$
|
(13,726
|
)
|
$
|
(516
|
)
|
$
|
(14,242
|
)
|
|||||||||
105
The details of the amounts reclassified from Accumulated other comprehensive loss for the years ended
December 31, 2017
,
2016
, and
2015
are as follows:
|
Amount of Loss/(Gain) Reclassified from Accumulated Other Comprehensive Loss
|
||||||||||||||
|
Component
|
Year Ended December 31, 2017
|
Year Ended December 31, 2016
|
Year Ended December 31, 2015
|
Affected Line in Consolidated Statements of Operations
|
||||||||||
|
Derivative instruments designated and qualifying as cash flow hedges
|
||||||||||||||
|
Foreign currency forward contracts
|
$
|
916
|
|
$
|
(17,720
|
)
|
$
|
(54,537
|
)
|
Net revenue
(1)
|
||||
|
Foreign currency forward contracts
|
13,997
|
|
21,089
|
|
10,284
|
|
Cost of revenue
(1)
|
|||||||
|
Total, before taxes
|
14,913
|
|
3,369
|
|
(44,253
|
)
|
Income before taxes
|
|||||||
|
Income tax effect
|
(3,728
|
)
|
(842
|
)
|
11,063
|
|
(Benefit from)/provision for income taxes
|
|||||||
|
Total, net of taxes
|
$
|
11,185
|
|
$
|
2,527
|
|
$
|
(33,190
|
)
|
Net income
|
||||
|
Defined benefit and retiree healthcare plans
|
$
|
3,476
|
|
$
|
2,975
|
|
$
|
351
|
|
Various
(2)
|
||||
|
Income tax effect
|
(187
|
)
|
(407
|
)
|
(233
|
)
|
(Benefit from)/provision for income taxes
|
|||||||
|
Total, net of taxes
|
$
|
3,289
|
|
$
|
2,568
|
|
$
|
118
|
|
Net income
|
||||
|
(1)
|
See Note 16, "Derivative Instruments and Hedging Activities," for additional details on amounts to be reclassified in the future from Accumulated other comprehensive loss.
|
|
(2)
|
Amounts related to defined benefit and retiree healthcare plans reclassified from Accumulated other comprehensive loss affect the Cost of revenue, Research and development, Restructuring and special charges, and SG&A line items in the consolidated statements of operations. The amounts reclassified are included in the computation of net periodic benefit cost. See Note 10, "Pension and Other Post-Retirement Benefits," for additional details of net periodic benefit cost.
|
13. Related Party Transactions
Texas Instruments
Cross License Agreement
We have entered into a perpetual, royalty-free cross license agreement with TI (the “Cross License Agreement”). Under the Cross License Agreement, the parties granted each other a license to use certain technology used in connection with the other party’s business.
106
14. Commitments and Contingencies
Future minimum payments for capital leases, other financing obligations, and non-cancelable operating leases in effect as of
December 31, 2017
are as follows:
|
|
Future Minimum Payments
|
||||||||||||||
|
|
Capital
Leases
|
Other Financing
Obligations
|
Operating
Leases
|
Total
|
|||||||||||
|
For the year ending December 31,
|
|||||||||||||||
|
2018
|
$
|
5,472
|
|
$
|
3,125
|
|
$
|
12,871
|
|
$
|
21,468
|
|
|||
|
2019
|
5,393
|
|
2,498
|
|
9,255
|
|
17,146
|
|
|||||||
|
2020
|
5,429
|
|
459
|
|
6,534
|
|
12,422
|
|
|||||||
|
2021
|
4,931
|
|
178
|
|
5,165
|
|
10,274
|
|
|||||||
|
2022
|
4,561
|
|
—
|
|
4,189
|
|
8,750
|
|
|||||||
|
2023 and thereafter
|
15,267
|
|
—
|
|
30,595
|
|
45,862
|
|
|||||||
|
Net minimum rentals
|
41,053
|
|
6,260
|
|
68,609
|
|
115,922
|
|
|||||||
|
Less: interest portion
|
(11,798
|
)
|
(858
|
)
|
—
|
|
(12,656
|
)
|
|||||||
|
Present value of future minimum rentals
|
$
|
29,255
|
|
$
|
5,402
|
|
$
|
68,609
|
|
$
|
103,266
|
|
|||
Non-cancelable purchase agreements exist with various suppliers, primarily for services such as information technology support. The terms of these agreements are fixed and determinable. As of
December 31, 2017
, we had the following purchase commitments:
|
|
Purchase
Commitments
|
||
|
For the year ending December 31,
|
|||
|
2018
|
$
|
17,310
|
|
|
2019
|
11,200
|
|
|
|
2020
|
8,153
|
|
|
|
2021
|
6,467
|
|
|
|
2022
|
1,682
|
|
|
|
2023 and thereafter
|
70
|
|
|
|
Total
|
$
|
44,882
|
|
Collaborative Arrangements
On March 4, 2016, we entered into a strategic partnership agreement (the "SPA") with Quanergy Systems, Inc. ("Quanergy") to jointly develop, manufacture, and sell solid state Light Detection and Ranging ("LiDAR") sensors. Under the terms of the SPA, we will be exclusive partners with Quanergy for component level solid state LiDAR sensors in the transportation market.
We are accounting for the SPA under the provisions of ASC Topic 808,
Collaborative Arrangements
, under which the accounting for certain transactions is determined using principal versus agent considerations. Using the guidance in ASC Subtopic 605-45,
Principal Agent Considerations
, we have determined that we are the principal with respect to the SPA.
During the year ended December 31, 2017, there were no material amounts recorded to earnings related to the SPA.
Off-Balance Sheet Commitments
From time to time, we execute contracts that require us to indemnify the other parties to the contracts. These indemnification obligations generally arise in two contexts. First, in connection with certain transactions, such as the sale of a business or the issuance of debt or equity securities, the agreement typically contains standard provisions requiring us to indemnify the purchaser against breaches by us of representations and warranties contained in the agreement. These indemnities are generally subject to time and liability limitations. Second, we enter into agreements in the ordinary course of business, such as customer contracts, that might contain indemnification provisions relating to product quality, intellectual property infringement, governmental regulations and employment related matters, and other typical indemnities. In certain cases,
107
indemnification obligations arise by law. Performance under any of these indemnification obligations would generally be triggered by a breach of the terms of the contract or by a third-party claim. Historically, we have experienced only immaterial and irregular losses associated with these indemnifications. Consequently, any future liabilities brought about by these indemnifications cannot reasonably be estimated or accrued.
Indemnifications Provided As Part of Contracts and Agreements
We are party to the following types of agreements pursuant to which we may be obligated to indemnify a third party with respect to certain matters.
Officers and Directors:
Our articles of association provide for indemnification of directors and officers by us to the fullest extent permitted by applicable law, as it now exists or may hereinafter be amended (but, in the case of an amendment, only to the extent such amendment permits broader indemnification rights than permitted prior thereto), against any and all liabilities, including all expenses (including attorneys’ fees), judgments, fines, and amounts paid in settlement actually and reasonably incurred by him or her in connection with such action, suit, or proceeding, provided he or she acted in good faith and in a manner he or she reasonably believed to be in, or not opposed to, our best interests, and, with respect to any criminal action or proceeding, had no reasonable cause to believe his or her conduct was unlawful or outside of his or her mandate. The articles do not provide a limit to the maximum future payments, if any, under the indemnification. No indemnification is provided for in respect of any claim, issue, or matter as to which such person has been adjudged to be liable for gross negligence or willful misconduct in the performance of his or her duty on our behalf.
In addition, we have a liability insurance policy that insures directors and officers against the cost of defense, settlement, or payment of claims and judgments under some circumstances. Certain indemnification payments may not be covered under our directors’ and officers’ insurance coverage.
Initial Purchasers of Senior Notes
: Pursuant to the terms of the purchase agreements entered into in connection with our private placement senior note offerings, we are obligated to indemnify the initial purchasers of the Senior Notes against certain liabilities caused by any untrue statement or alleged untrue statement of a material fact in various documents relied upon by such initial purchasers, or to contribute to payments the initial purchasers may be required to make in respect thereof. The purchase agreements do not provide a limit to the maximum future payments, if any, under these indemnifications.
Intellectual Property and Product Liability Indemnification:
We routinely sell products with a limited intellectual property and product liability indemnification included in the terms of sale. Historically, we have had only immaterial and irregular losses associated with these indemnifications. Consequently, any future liabilities resulting from these indemnifications cannot reasonably be estimated or accrued.
Product Warranty Liabilities
Our standard terms of sale provide our customers with a warranty against faulty workmanship and the use of defective materials, which, depending on the product, generally exists for a period of
twelve
to
eighteen
months after the date we ship the product to our customer or for a period of
twelve
months after the date the customer resells our product, whichever comes first. We do not offer separately priced extended warranty or product maintenance contracts. Our liability associated with this warranty is, at our option, to repair the product, replace the product, or provide the customer with a credit.
We also sell products to customers under negotiated agreements or where we have accepted the customer’s terms of purchase. In these instances, we may provide additional warranties for longer durations, consistent with differing end market practices, and where our liability is not limited. In addition, many sales take place in situations where commercial or civil codes, or other laws, would imply various warranties and restrict limitations on liability.
In the event a warranty claim based on defective materials exists, we may be able to recover some of the cost of the claim from the vendor from whom the materials were purchased. Our ability to recover some of the costs will depend on the terms and conditions to which we agreed when the materials were purchased. When a warranty claim is made, the only collateral available to us is the return of the inventory from the customer making the warranty claim. Historically, when customers make a warranty claim, we either replace the product or provide the customer with a credit. We generally do not rework the returned product.
Our policy is to accrue for warranty claims when a loss is both probable and estimable. This is accomplished by accruing for estimated returns and estimated costs to replace the product at the time the related revenue is recognized. Liabilities for warranty claims have historically not been material. In some instances, customers may make claims for costs they incurred or other damages related to a claim. Any potentially material liabilities associated with these claims are discussed in this Note under the heading
Legal Proceedings and Claims
.
108
Environmental Remediation Liabilities
Our operations and facilities are subject to U.S. and non-U.S. laws and regulations governing the protection of the environment and our employees, including those governing air emissions, water discharges, the management and disposal of hazardous substances and wastes, and the cleanup of contaminated sites. We could incur substantial costs, including cleanup costs, fines, civil or criminal sanctions, or third-party property damage or personal injury claims, in the event of violations or liabilities under these laws and regulations, or non-compliance with the environmental permits required at our facilities. Potentially significant expenditures could be required in order to comply with environmental laws that may be adopted or imposed in the future. We are, however, not aware of any threatened or pending material environmental investigations, lawsuits, or claims involving us or our operations.
Legal Proceedings and Claims
We account for litigation and claims losses in accordance with ASC Topic 450,
Contingencies
(“ASC 450”). Under ASC 450, loss contingency provisions are recorded for probable and estimable losses at our best estimate of a loss or, when a best estimate cannot be made, at our estimate of the minimum loss. These estimates are often developed prior to knowing the amount of the ultimate loss, require the application of considerable judgment, and are refined each accounting period as additional information becomes known. Accordingly, we are often initially unable to develop a best estimate of loss and therefore the minimum amount, which could be an immaterial amount, is recorded. As information becomes known, either the minimum loss amount is increased, or a best estimate can be made, generally resulting in additional loss provisions. A best estimate amount may be changed to a lower amount when events result in an expectation of a more favorable outcome than previously expected.
We are regularly involved in a number of claims and litigation matters in the ordinary course of business. Most of our litigation matters are third-party claims related to patent infringement allegations or for property damage allegedly caused by our products, but some involve allegations of personal injury or wrongful death. We believe that the ultimate resolution of the current litigation matters pending against us will not be material to our financial statements.
15. Fair Value Measures
Our assets and liabilities recorded at fair value have been categorized based upon a fair value hierarchy in accordance with ASC 820. The levels of the fair value hierarchy are described below:
|
•
|
Level 1 inputs utilize quoted prices (unadjusted) in active markets for identical assets and liabilities that we have the ability to access at the measurement date.
|
|
•
|
Level 2 inputs utilize inputs, other than quoted prices included in Level 1, that are observable for the asset or liability, either directly or indirectly. Level 2 inputs include quoted prices for similar assets and liabilities in active markets, quoted prices in markets that are not active, and inputs other than quoted prices that are observable for the asset or liability, such as interest rates and yield curves that are observable at commonly quoted intervals.
|
|
•
|
Level 3 inputs are unobservable inputs for the asset or liability, allowing for situations where there is little, if any, market activity for the asset or liability.
|
109
Measured on a Recurring Basis
The following table presents information about certain of our assets and liabilities measured at fair value on a recurring basis as of
December 31, 2017
and
2016
, aggregated by the level in the fair value hierarchy within which those measurements fell:
|
|
December 31, 2017
|
December 31, 2016
|
|||||||||||||||||||||||
|
|
Quoted Prices in
Active Markets
for
Identical Assets
(Level 1)
|
Significant
Other
Observable
Inputs
(Level 2)
|
Significant
Unobservable
Inputs
(Level 3)
|
Quoted Prices in
Active Markets
for
Identical Assets
(Level 1)
|
Significant
Other
Observable
Inputs
(Level 2)
|
Significant
Unobservable
Inputs
(Level 3)
|
|||||||||||||||||||
|
Assets
|
|||||||||||||||||||||||||
|
Foreign currency forward contracts
|
$
|
—
|
|
$
|
3,955
|
|
$
|
—
|
|
$
|
—
|
|
$
|
32,757
|
|
$
|
—
|
|
|||||||
|
Commodity forward contracts
|
|
|
6,458
|
|
—
|
|
—
|
|
2,639
|
|
—
|
|
|||||||||||||
|
Total
|
$
|
—
|
|
$
|
10,413
|
|
$
|
—
|
|
$
|
—
|
|
$
|
35,396
|
|
$
|
—
|
|
|||||||
|
Liabilities
|
|||||||||||||||||||||||||
|
Foreign currency forward contracts
|
$
|
—
|
|
$
|
40,969
|
|
$
|
—
|
|
$
|
—
|
|
$
|
27,201
|
|
$
|
—
|
|
|||||||
|
Commodity forward contracts
|
—
|
|
1,104
|
|
—
|
|
—
|
|
3,790
|
|
—
|
|
|||||||||||||
|
Total
|
$
|
—
|
|
$
|
42,073
|
|
$
|
—
|
|
$
|
—
|
|
$
|
30,991
|
|
$
|
—
|
|
|||||||
See Note 2, "Significant Accounting Policies," under the caption
Financial Instruments,
for discussion of how we estimate the fair value of our financial instruments. See Note 16, "Derivative Instruments and Hedging Activities," for specific contractual terms utilized as inputs in determining fair value and a discussion of the nature of the risks being mitigated by these instruments.
Although we have determined that the majority of the inputs used to value our derivatives fall within Level 2 of the fair value hierarchy, the credit valuation adjustments associated with our derivatives utilize Level 3 inputs, such as estimates of current credit spreads, to appropriately reflect both our own non-performance risk and the respective counterparties' non-performance risk in the fair value measurement. However, as of
December 31, 2017
and
2016
, we have assessed the significance of the impact of the credit valuation adjustments on the overall valuation of our derivative positions and have determined that the credit valuation adjustments are not significant to the overall valuation of our derivatives. As a result, we have determined that our derivatives in their entirety are classified in Level 2 in the fair value hierarchy.
Measured on a Nonrecurring Basis
We evaluate the recoverability of goodwill and other indefinite-lived intangible assets in the fourth quarter of each fiscal year, or more frequently if events or changes in circumstances indicate that goodwill or other intangible assets may be impaired. As of
October 1, 2017
, we evaluated our goodwill for impairment using a combination of the qualitative and quantitative methods. Refer to Note 2, "Significant Accounting Policies," for further discussion of this process. Based on these analyses, we determined that, for each of the reporting units subject to the qualitative method, it was more likely than not that their fair values were greater than their carrying values at that date, and for each of the reporting units subject to the quantitative method, that their fair values exceeded their carrying values at that date.
As of
October 1, 2017
, we evaluated our other indefinite-lived intangible assets for impairment (using the quantitative method) and determined that the fair values of those assets exceeded their carrying values on that date. The fair values of our other indefinite-lived intangible assets are considered Level 3 fair value measurements.
As of
December 31, 2017
, no events or changes in circumstances occurred that would have triggered the need for an additional impairment review of goodwill or other indefinite-lived intangible assets.
A long-lived asset, which includes PP&E, is considered held for sale when it meets certain criteria described in ASC Topic 360,
Property, Plant, and Equipment
. A long-lived asset classified as held for sale is initially measured at the lower of its carrying amount or fair value less cost to sell, and a loss is recognized for any initial adjustment of the asset's carrying amount to its fair value less cost to sell in the period the held for sale criteria are met. In the period that a long-lived asset is considered
110
held for sale it is presented within Prepaid expenses and other current assets on our balance sheet where it remains until it is either sold or no longer meets the held for sale criteria. For comparative purposes, the prior year carrying amount of a long-lived asset considered held for sale is presented within Other assets on our balance sheet.
In the first quarter of 2017, we determined that one of our facilities met the held for sale criteria and recorded it at its fair value less costs to sell of
$1.7 million
(which approximated its net carrying value at that time). In the third quarter of 2017, we sold the asset for an immaterial gain.
The fair value of assets held for sale is considered to be a Level 3 fair value measurement and is determined based on the use of appraisals, input from market participants, our experience selling similar assets, internally developed cash flow models, or a combination thereof.
Financial Instruments Not Recorded at Fair Value
The following table presents the carrying values and fair values of financial instruments not recorded at fair value in the consolidated balance sheets as of
December 31, 2017
and
2016
:
|
|
December 31, 2017
|
December 31, 2016
|
|||||||||||||||||||||||||||||
|
Carrying
Value
(1)
|
Fair Value
|
Carrying
Value
(1)
|
Fair Value
|
||||||||||||||||||||||||||||
|
|
Level 1
|
Level 2
|
Level 3
|
Level 1
|
Level 2
|
Level 3
|
|||||||||||||||||||||||||
|
Liabilities
|
|||||||||||||||||||||||||||||||
|
Term loans
|
$
|
927,794
|
|
$
|
—
|
|
$
|
930,114
|
|
$
|
—
|
|
$
|
937,794
|
|
$
|
—
|
|
$
|
942,483
|
|
$
|
—
|
|
|||||||
|
4.875% Senior Notes
|
$
|
500,000
|
|
$
|
—
|
|
$
|
521,875
|
|
$
|
—
|
|
$
|
500,000
|
|
$
|
—
|
|
$
|
514,375
|
|
$
|
—
|
|
|||||||
|
5.625% Senior Notes
|
$
|
400,000
|
|
$
|
—
|
|
$
|
439,000
|
|
$
|
—
|
|
$
|
400,000
|
|
$
|
—
|
|
$
|
417,752
|
|
$
|
—
|
|
|||||||
|
5.0% Senior Notes
|
$
|
700,000
|
|
$
|
—
|
|
$
|
741,125
|
|
$
|
—
|
|
$
|
700,000
|
|
$
|
—
|
|
$
|
686,000
|
|
$
|
—
|
|
|||||||
|
6.25% Senior Notes
|
$
|
750,000
|
|
$
|
—
|
|
$
|
813,750
|
|
$
|
—
|
|
$
|
750,000
|
|
$
|
—
|
|
$
|
786,098
|
|
$
|
—
|
|
|||||||
(1)
The carrying value excludes discounts and deferred financing costs.
The fair values of the term loans and the Senior Notes are determined using observable prices in markets where these instruments are generally not traded on a daily basis.
Cash and cash equivalents, accounts receivable, and accounts payable are carried at their cost, which approximates fair value because of their short-term nature.
In March 2016, we acquired Series B Preferred Stock of Quanergy for
$50.0 million
. In accordance with the guidance in ASC Topic 323,
Investments - Equity Method and Joint Ventures
, we have accounted for this investment as a cost method investment under ASC Subtopic 325-20,
Cost Method Investments
, as the Series B Preferred Stock is not "in substance" common stock and does not have a readily determinable fair value. We did not estimate the fair value of this cost method investment as of December 31, 2017 as there were no indicators of impairment, and because we determined it was not practicable to estimate its fair value due to the restricted marketability of the investment.
16. Derivative Instruments and Hedging Activities
In accordance with ASC 815 we recognize derivative instruments on our balance sheet, and we measure them at fair value. The accounting for changes in the fair value of derivatives depends on the intended use of the derivative, whether we have elected to designate the derivative as being in a hedging relationship, and whether the hedging relationship has satisfied the criteria necessary to apply hedge accounting. Derivative instruments that are designated, and qualify as hedges of the exposure to changes in the fair value of an asset, liability, commitment, and that are attributable to a particular risk, such as interest rate risk, are considered fair value hedges. Derivative instruments that are designated, and qualify as hedges of the exposure to variability in expected future cash flows are considered cash flow hedges. Derivative instruments may also be designated as hedges of the foreign currency exposure of a net investment in a foreign operation. We currently only utilize cash flow hedges.
Hedge accounting generally provides for the matching of the timing of gain or loss recognition on the hedging instrument with the recognition of the changes in the fair value of the hedged asset or liability that are attributable to the hedged risk in a fair value hedge, or the earnings effect of the hedged forecasted transactions in a cash flow hedge. We may enter into derivative contracts that are intended to economically hedge certain risks, even though we elect not to apply hedge accounting under ASC 815. Changes in the fair value of derivatives not designated in hedging relationships are recorded directly in the consolidated
111
statements of operations. Specific information about the valuations of derivatives is described in Note 2, "Significant Accounting Policies," and classification of derivatives in the fair value hierarchy is described in Note 15, “Fair Value Measures.”
The effective portion of changes in the fair value of derivatives designated and qualifying as cash flow hedges is recorded in Accumulated other comprehensive loss and is subsequently reclassified into earnings in the period in which the hedged forecasted transaction affects earnings. Refer to Note 12, "Shareholders' Equity," and elsewhere in this Note, for more details on the reclassification of amounts from Accumulated other comprehensive loss into earnings. The ineffective portion of changes in the fair value of derivatives designated and qualifying as cash flow hedges is recognized directly in earnings.
We do not offset the fair value amounts recognized for derivative instruments against fair value amounts recognized for the right to reclaim cash collateral or the obligation to return cash collateral. As of
December 31, 2017
and
2016
, we had posted
no
cash collateral.
Hedges of Foreign Currency Risk
We are exposed to fluctuations in various foreign currencies against our functional currency, the U.S. dollar. We use foreign currency forward agreements to manage this exposure. We currently have outstanding foreign currency forward contracts that qualify as cash flow hedges intended to offset the effect of exchange rate fluctuations on forecasted sales and certain manufacturing costs. We also have outstanding foreign currency forward contracts that are intended to preserve the economic value of foreign currency denominated monetary assets and liabilities; these instruments are not designated for hedge accounting treatment in accordance with ASC 815. Foreign currency forward contracts not designated as hedges are not speculative and are used to manage our exposure to foreign exchange movements.
For each of the years ended
December 31, 2017
,
2016
, and
2015
, the ineffective portion of the changes in the fair value of our foreign currency forward agreements that are designated as cash flow hedges was not material and
no
amounts were excluded from the assessment of effectiveness. As of
December 31, 2017
, we estimate that
$29.9 million
in net losses will be reclassified from Accumulated other comprehensive loss to earnings during the twelve months ending
December 31, 2018
.
As of
December 31, 2017
, we had the following outstanding foreign currency forward contracts:
|
|
||||||||||
|
Notional
(in millions) |
Effective Date
|
Maturity Date
|
Index
|
Weighted- Average Strike Rate
|
Cash Flow Hedge Designation
|
|||||
|
61.0 EUR
|
December 27, 2017
|
January 31, 2018
|
Euro to U.S. Dollar Exchange Rate
|
1.19 USD
|
Non-designated
|
|||||
|
443.0 EUR
|
Various from March 2016 to December 2017
|
Various from January 2018 to December 2019
|
Euro to U.S. Dollar Exchange Rate
|
1.15 USD
|
Designated
|
|||||
|
640.0 CNY
|
December 26, 2017
|
January 31, 2018
|
U.S. Dollar to Chinese Renminbi Exchange Rate
|
6.57 CNY
|
Non-designated
|
|||||
|
960.0 CNY
|
Various from October to December 2017
|
Various from January to December 2018
|
U.S. Dollar to Chinese Renminbi Exchange Rate
|
6.72 CNY
|
Designated
|
|||||
|
200.0 JPY
|
December 27, 2017
|
January 31, 2018
|
U.S. Dollar to Japanese Yen Exchange Rate
|
112.83 JPY
|
Non-designated
|
|||||
|
40,954.5 KRW
|
Various from March 2016 to December 2017
|
Various from January 2018 to November 2019
|
U.S. Dollar to Korean Won Exchange Rate
|
1,130.61 KRW
|
Designated
|
|||||
|
19.5 MYR
|
Various from March to November 2016
|
Various from January to October 2018
|
U.S. Dollar to Malaysian Ringgit Exchange Rate
|
4.21 MYR
|
Designated
|
|||||
|
215.0 MXN
|
December 27, 2017
|
January 31, 2018
|
U.S. Dollar to Mexican Peso Exchange Rate
|
19.83 MXN
|
Non-designated
|
|||||
|
2,541.0 MXN
|
Various from March 2016 to December 2017
|
Various from January 2018 to November 2019
|
U.S. Dollar to Mexican Peso Exchange Rate
|
20.25 MXN
|
Designated
|
|||||
|
35.5 GBP
|
Various from March 2016 to December 2017
|
Various from January 2018 to November 2019
|
British Pound Sterling to U.S. Dollar Exchange Rate
|
1.31 USD
|
Designated
|
|||||
The notional amounts above represent the total quantities we have outstanding over the remaining contracted periods.
112
Hedges of Commodity Risk
Our objective in using commodity forward contracts is to offset a portion of our exposure to the potential change in prices associated with certain commodities used in the manufacturing of our products, including silver, gold, nickel, aluminum, copper, platinum, and palladium. The terms of these forward contracts fix the price at a future date for various notional amounts associated with these commodities. These instruments are not designated for hedge accounting treatment in accordance with ASC 815. Commodity forward contracts not designated as hedges are not speculative and are used to manage our exposure to commodity price movements.
We had the following outstanding commodity forward contracts, none of which were designated as derivatives in qualifying hedging relationships, as of
December 31, 2017
:
|
Commodity
|
Notional
|
Remaining Contracted Periods
|
Weighted-
Average
Strike Price Per Unit
|
|||
|
Silver
|
1,117,049 troy oz.
|
January 2018 - November 2019
|
$17.75
|
|||
|
Gold
|
12,200 troy oz.
|
January 2018 - November 2019
|
$1,288.85
|
|||
|
Nickel
|
275,490 pounds
|
January 2018 - November 2019
|
$4.84
|
|||
|
Aluminum
|
5,592,797 pounds
|
January 2018 - November 2019
|
$0.88
|
|||
|
Copper
|
7,413,661 pounds
|
January 2018 - November 2019
|
$2.71
|
|||
|
Platinum
|
8,029 troy oz.
|
January 2018 - November 2019
|
$987.12
|
|||
|
Palladium
|
1,935 troy oz.
|
January 2018 - November 2019
|
$819.85
|
|||
The notional amounts above represent the total quantities we have outstanding over the remaining contracted periods.
Financial Instrument Presentation
The following table presents the fair values of our derivative financial instruments and their classification in the consolidated balance sheets as of
December 31, 2017
and
2016
:
|
|
Asset Derivatives
|
Liability Derivatives
|
|||||||||||||||||
|
|
|||||||||||||||||||
|
Fair Value
|
Fair Value
|
||||||||||||||||||
|
|
Balance Sheet
Location
|
December 31, 2017
|
December 31, 2016
|
Balance Sheet
Location
|
December 31, 2017
|
December 31, 2016
|
|||||||||||||
|
Derivatives designated as hedging instruments
|
|||||||||||||||||||
|
Foreign currency forward contracts
|
Prepaid expenses and other current assets
|
$
|
3,576
|
|
$
|
24,796
|
|
Accrued expenses and other current liabilities
|
$
|
32,806
|
|
$
|
20,990
|
|
|||||
|
Foreign currency forward contracts
|
Other assets
|
373
|
|
5,693
|
|
Other long-term liabilities
|
6,881
|
|
3,814
|
|
|||||||||
|
Total
|
$
|
3,949
|
|
$
|
30,489
|
|
$
|
39,687
|
|
$
|
24,804
|
|
|||||||
|
Derivatives not designated as hedging instruments
|
|||||||||||||||||||
|
Commodity forward contracts
|
Prepaid expenses and other current assets
|
$
|
5,403
|
|
$
|
2,097
|
|
Accrued expenses and other current liabilities
|
$
|
1,006
|
|
$
|
2,764
|
|
|||||
|
Commodity forward contracts
|
Other assets
|
1,055
|
|
542
|
|
Other long-term liabilities
|
98
|
|
1,026
|
|
|||||||||
|
Foreign currency forward contracts
|
Prepaid expenses and other current assets
|
6
|
|
2,268
|
|
Accrued expenses and other current liabilities
|
1,282
|
|
2,397
|
|
|||||||||
|
Total
|
$
|
6,464
|
|
$
|
4,907
|
|
$
|
2,386
|
|
$
|
6,187
|
|
|||||||
These fair value measurements are all categorized within Level 2 of the fair value hierarchy. Refer to Note 15, "Fair Value Measures," for more information on these measurements.
113
The following tables present the effect of our derivative financial instruments on the consolidated statements of operations for the years ended
December 31, 2017
and
2016
:
|
Derivatives designated as
hedging instruments
|
Amount of Deferred (Loss)/Gain Recognized in Other Comprehensive Loss
|
Location of Net (Loss)/Gain
Reclassified from
Accumulated
Other
Comprehensive
Loss into Net Income
|
Amount of Net (Loss)/Gain Reclassified from Accumulated Other Comprehensive Loss into Net Income
|
|||||||||||||||
|
|
2017
|
2016
|
|
2017
|
2016
|
|||||||||||||
|
Foreign currency forward contracts
|
$
|
(68,071
|
)
|
$
|
24,044
|
|
Net revenue
|
$
|
(916
|
)
|
$
|
17,720
|
|
|||||
|
Foreign currency forward contracts
|
$
|
15,555
|
|
$
|
(32,519
|
)
|
Cost of revenue
|
$
|
(13,997
|
)
|
$
|
(21,089
|
)
|
|||||
|
Derivatives not designated as
hedging instruments
|
Amount of Gain/(Loss) on Derivatives Recognized in Net Income
|
Location of Gain/(Loss) on Derivatives
Recognized in Net Income |
||||||||
|
|
2017
|
2016
|
|
|||||||
|
Commodity forward contracts
|
$
|
9,989
|
|
$
|
7,399
|
|
Other, net
|
|||
|
Foreign currency forward contracts
|
$
|
(15,618
|
)
|
$
|
(1,850
|
)
|
Other, net
|
|||
Credit risk related contingent features
We have agreements with certain of our derivative counterparties that contain a provision whereby if we default on our indebtedness, and where repayment of the indebtedness has been accelerated by the lender, then we could also be declared in default on our derivative obligations.
As of
December 31, 2017
, the termination value of outstanding derivatives in a liability position, excluding any adjustment for non-performance risk, was
$42.4 million
. As of
December 31, 2017
, we have
no
t posted any cash collateral related to these agreements. If we breach any of the default provisions on any of our indebtedness as described above, we could be required to settle our obligations under the derivative agreements at their termination values.
17. Restructuring and Special Charges
Restructuring and special charges for fiscal years 2017, 2016, and 2015 were
$19.0 million
,
$4.1 million
, and
$21.9 million
, respectively.
Restructuring and special charges recognized during the year ended December 31, 2017 consisted primarily of severance charges of
$11.1 million
and facility exist costs of
$7.9 million
, each of which related primarily to the closing of our facility in Minden, Germany that was part of the acquisition of CST and the closing of our manufacturing facility in Bydgoszcz, Poland. Charges related to the closing of our facility in Minden, Germany for the year ended December 31, 2017 consisted of severance charges of
$8.4 million
and facility exit costs of
$3.2 million
. Charges related to the closing of our facility in Bydgoszcz, Poland for the year ended December 31, 2017 consisted of severance charges of
$0.8 million
and facility exit costs of
$2.3 million
.
Restructuring and special charges recognized during the year ended December 31,
2016
primarily included facility exit costs related to the relocation of manufacturing lines from our facility in the Dominican Republic to a manufacturing facility in Mexico and severance charges recorded in connection with acquired businesses and the termination of a limited number of employees in various locations throughout the world. We completed the cessation of manufacturing in our Dominican Republic facility in the third quarter of 2016.
Restructuring and special charges recognized during the year ended
December 31, 2015
included
$7.6 million
of severance charges incurred in order to integrate acquired businesses with ours,
$4.0 million
of severance charges incurred in the second quarter of 2015 related to the announced closing of our Schrader Brazil manufacturing facility, with the remainder primarily associated with the termination of a limited number of employees in various locations throughout the world.
114
The following table outlines the changes to the restructuring liability during the years ended
December 31, 2017
and
2016
:
|
Severance
|
||||
|
Balance at December 31, 2015
|
$
|
24,574
|
|
|
|
Charges, net of reversals
|
813
|
|
||
|
Payments
|
(7,252
|
)
|
||
|
Impact of changes in foreign currency exchange rates
|
(785
|
)
|
||
|
Balance at December 31, 2016
|
17,350
|
|
||
|
Charges, net of reversals
|
11,125
|
|
||
|
Payments
|
(22,511
|
)
|
||
|
Impact of changes in foreign currency exchange rates
|
1,619
|
|
||
|
Balance at December 31, 2017
|
$
|
7,583
|
|
|
The following table outlines the current and long-term components of our restructuring liabilities recognized in the consolidated balance sheets as of
December 31, 2017
and
2016
.
|
December 31,
2017 |
December 31,
2016 |
|||||||
|
Accrued expenses and other current liabilities
|
$
|
4,184
|
|
$
|
14,268
|
|
||
|
Other long-term liabilities
|
3,399
|
|
3,082
|
|
||||
|
Total
|
$
|
7,583
|
|
$
|
17,350
|
|
||
Exit and Disposal Activities
In the second quarter of 2015, we closed our Schrader Brazil manufacturing facility. During the year ended December 31, 2015, in connection with this closing, and in addition to the
$4.0 million
of severance charges recorded in the Restructuring and special charges line of the consolidated statements of operations as discussed above, we incurred approximately
$5.0 million
of charges, primarily recorded in Cost of revenue, related to the write-down of certain assets, including PP&E and Inventory. These charges are not included in the restructuring and special charges table above.
18. Segment Reporting
We organize our business into
two
reportable segments, Performance Sensing and Sensing Solutions, each of which is also an operating segment. Our operating segments are businesses that we manage as components of an enterprise, for which separate financial information is evaluated regularly by our chief operating decision maker in deciding how to allocate resources and assess performance.
An operating segment’s performance is primarily evaluated based on segment profit, which excludes amortization of intangible assets, restructuring and special charges, and certain corporate costs/credits not associated with the operations of the segment, including share-based compensation expense and a portion of depreciation expense associated with assets recorded in connection with acquisitions. In addition, an operating segment’s performance excludes results from discontinued operations, if any. Corporate costs excluded from an operating segment’s performance are separately stated below and also include costs that are related to functional areas such as finance, information technology, legal, and human resources. We believe that segment profit, as defined above, is an appropriate measure for evaluating the operating performance of our segments. However, this measure should be considered in addition to, and not as a substitute for, or superior to, profit from operations or other measures of financial performance prepared in accordance with U.S. GAAP. The accounting policies of each of our
two
reportable segments are materially consistent with those described in Note 2, "Significant Accounting Policies."
The Performance Sensing segment is a manufacturer of pressure sensors, speed and position sensors, temperature sensors, and pressure switches used in subsystems of automobiles (e.g., powertrain, air conditioning, tire pressure monitoring, and ride stabilization) and HVOR. These products help improve operating performance, for example, by making an automobile’s heating and air conditioning systems work more efficiently, thereby improving gas mileage. These products are also used in systems that address environmental or safety concerns, for example, by reducing vehicle emissions or improving the stability control of the vehicle.
The Sensing Solutions segment is a manufacturer of various control products, which are used in industrial, aerospace, military, commercial, medical device, and residential markets, and sensors products, which are used in aerospace and industrial
115
applications such as HVAC systems and military and commercial aircraft. These products include motor and compressor protectors, motor starters, temperature sensors and switches/thermostats, pressure sensors and switches, electronic HVAC sensors and controls, charge controllers, solid state relays, linear and rotary position sensors, circuit breakers, and semiconductor burn-in test sockets. These products help prevent damage from overheating and fires in a wide variety of applications, including commercial HVAC systems, refrigerators, aircraft, lighting, and other industrial applications and help optimize performance by using sensors which provide feedback to control systems. The Sensing Solutions segment also manufactures DC to AC power inverters, which enable the operation of electronic equipment when grid power is not available.
The following table presents Net revenue and Segment profit for the reportable segments and other operating results not allocated to the reportable segments for the years ended
December 31, 2017
,
2016
, and
2015
:
|
|
For the year ended December 31,
|
||||||||||
|
|
2017
|
2016
|
2015
|
||||||||
|
Net revenue:
|
|||||||||||
|
Performance Sensing
|
$
|
2,460,600
|
|
$
|
2,385,380
|
|
$
|
2,346,226
|
|
||
|
Sensing Solutions
|
846,133
|
|
816,908
|
|
628,735
|
|
|||||
|
Total net revenue
|
$
|
3,306,733
|
|
$
|
3,202,288
|
|
$
|
2,974,961
|
|
||
|
Segment profit (as defined above):
|
|||||||||||
|
Performance Sensing
|
$
|
664,186
|
|
$
|
615,526
|
|
$
|
598,524
|
|
||
|
Sensing Solutions
|
277,450
|
|
261,914
|
|
199,744
|
|
|||||
|
Total segment profit
|
941,636
|
|
877,440
|
|
798,268
|
|
|||||
|
Corporate and other
|
(209,226
|
)
|
(179,665
|
)
|
(196,133
|
)
|
|||||
|
Amortization of intangible assets
|
(161,050
|
)
|
(201,498
|
)
|
(186,632
|
)
|
|||||
|
Restructuring and special charges
|
(18,975
|
)
|
(4,113
|
)
|
(21,919
|
)
|
|||||
|
Profit from operations
|
552,385
|
|
492,164
|
|
393,584
|
|
|||||
|
Interest expense, net
|
(159,761
|
)
|
(165,818
|
)
|
(137,626
|
)
|
|||||
|
Other, net
|
9,817
|
|
(4,901
|
)
|
(50,329
|
)
|
|||||
|
Income before taxes
|
$
|
402,441
|
|
$
|
321,445
|
|
$
|
205,629
|
|
||
No
customer exceeded
10%
of our Net revenue in any of the periods presented.
The following table presents Net revenue by product category for the years ended
December 31, 2017
,
2016
, and
2015
:
|
|
Performance Sensing
|
Sensing Solutions
|
For the year ended December 31,
|
||||||||||||
|
|
2017
|
2016
|
2015
|
||||||||||||
|
Net revenue:
|
|||||||||||||||
|
Pressure sensors
(1)
|
X
|
X
|
$
|
1,818,382
|
|
$
|
1,736,160
|
|
$
|
1,669,393
|
|
||||
|
Speed and position sensors
|
X
|
X
|
425,371
|
|
420,111
|
|
328,102
|
|
|||||||
|
Bimetal electromechanical controls
|
X
|
333,907
|
|
321,202
|
|
318,721
|
|
||||||||
|
Temperature sensors
|
X
|
X
|
193,322
|
|
191,463
|
|
191,369
|
|
|||||||
|
Power conversion and control
|
X
|
127,348
|
|
120,357
|
|
58,180
|
|
||||||||
|
Thermal and magnetic-hydraulic circuit breakers
|
X
|
107,097
|
|
109,719
|
|
110,980
|
|
||||||||
|
Pressure switches
|
X
|
X
|
96,086
|
|
88,905
|
|
86,994
|
|
|||||||
|
Interconnection
|
X
|
59,725
|
|
57,518
|
|
61,738
|
|
||||||||
|
Other
|
X
|
X
|
145,495
|
|
156,853
|
|
149,484
|
|
|||||||
|
$
|
3,306,733
|
|
$
|
3,202,288
|
|
$
|
2,974,961
|
|
|||||||
(1)
Certain products, totaling
$28.5 million
, that were categorized as pressure sensors in 2016 have been recast to other.
116
The following table presents depreciation and amortization expense for our reportable segments for the years ended
December 31, 2017
,
2016
and
2015
:
|
|
For the year ended December 31,
|
||||||||||
|
|
2017
|
2016
|
2015
|
||||||||
|
Total depreciation and amortization
|
|||||||||||
|
Performance Sensing
|
$
|
68,910
|
|
$
|
68,837
|
|
$
|
62,754
|
|
||
|
Sensing Solutions
|
17,179
|
|
14,095
|
|
10,643
|
|
|||||
|
Corporate and other
(1)
|
184,282
|
|
225,469
|
|
209,286
|
|
|||||
|
Total
|
$
|
270,371
|
|
$
|
308,401
|
|
$
|
282,683
|
|
||
__________________
|
(1)
|
Included within Corporate and other is depreciation and amortization expense associated with the fair value step-up recognized in prior acquisitions and accelerated depreciation recorded in connection with restructuring actions. We do not allocate the additional depreciation and amortization expense associated with the step-up in the fair value of the PP&E and intangible assets associated with these acquisitions or accelerated depreciation related to restructuring actions to our segments. This treatment is consistent with the financial information reviewed by our chief operating decision maker.
|
The following table presents total assets for our reportable segments as of
December 31, 2017
and
2016
:
|
December 31,
2017 |
December 31,
2016 |
||||||
|
Total assets
|
|||||||
|
Performance Sensing
|
$
|
1,396,565
|
|
$
|
1,295,381
|
|
|
|
Sensing Solutions
|
424,237
|
|
396,224
|
|
|||
|
Corporate and other
(1)
|
4,820,723
|
|
4,549,371
|
|
|||
|
Total
|
$
|
6,641,525
|
|
$
|
6,240,976
|
|
|
__________________
|
(1)
|
Included within Corporate and other as of
December 31, 2017
and
2016
is
$3,005.5 million
of Goodwill, as well as
$920.1 million
and
$1,075.4 million
, respectively, of Other intangible assets, net,
$753.1 million
and
$351.4 million
, respectively, of cash and cash equivalents, and
$36.1 million
and
$21.1 million
, respectively, of PP&E, net. This treatment is consistent with the financial information reviewed by our chief operating decision maker.
|
The following table presents capital expenditures for our reportable segments for the years ended
December 31, 2017
,
2016
, and
2015
:
|
|
For the year ended December 31,
|
||||||||||
|
|
2017
|
2016
|
2015
|
||||||||
|
Total capital expenditures
|
|||||||||||
|
Performance Sensing
|
$
|
106,520
|
|
$
|
99,299
|
|
$
|
125,376
|
|
||
|
Sensing Solutions
|
13,980
|
|
11,947
|
|
16,899
|
|
|||||
|
Corporate and other
|
24,084
|
|
18,971
|
|
34,921
|
|
|||||
|
Total
|
$
|
144,584
|
|
$
|
130,217
|
|
$
|
177,196
|
|
||
117
Geographic Area Information
The following tables present Net revenue by geographic area and by significant country for the years ended
December 31, 2017
,
2016
, and
2015
. In these tables, Net revenue is aggregated based on an internal methodology that considers both the location of our subsidiaries and the primary location of each subsidiary's customers.
|
|
Net Revenue
|
||||||||||
|
|
For the year ended December 31,
|
||||||||||
|
|
2017
|
2016
|
2015
|
||||||||
|
Americas
|
$
|
1,367,113
|
|
$
|
1,367,860
|
|
$
|
1,217,626
|
|
||
|
Asia
|
903,118
|
|
810,094
|
|
764,298
|
|
|||||
|
Europe
|
1,036,502
|
|
1,024,334
|
|
993,037
|
|
|||||
|
$
|
3,306,733
|
|
$
|
3,202,288
|
|
$
|
2,974,961
|
|
|||
|
|
Net Revenue
|
||||||||||
|
|
For the year ended December 31,
|
||||||||||
|
|
2017
|
2016
|
2015
|
||||||||
|
United States
|
$
|
1,276,304
|
|
$
|
1,322,206
|
|
$
|
1,084,757
|
|
||
|
The Netherlands
|
571,735
|
|
550,937
|
|
553,192
|
|
|||||
|
China
|
478,713
|
|
412,460
|
|
346,890
|
|
|||||
|
Korea
|
184,101
|
|
182,464
|
|
198,440
|
|
|||||
|
Japan
|
164,735
|
|
152,234
|
|
153,114
|
|
|||||
|
All other
|
631,145
|
|
581,987
|
|
638,568
|
|
|||||
|
$
|
3,306,733
|
|
$
|
3,202,288
|
|
$
|
2,974,961
|
|
|||
The following tables present PP&E, net, by geographic area and by significant country as of
December 31, 2017
and
2016
. In these tables, PP&E is aggregated based on the location of our subsidiaries.
|
|
PP&E, net
|
||||||
|
|
December 31,
2017 |
December 31,
2016 |
|||||
|
Americas
|
$
|
296,863
|
|
$
|
269,697
|
|
|
|
Asia
|
266,524
|
|
262,045
|
|
|||
|
Europe
|
186,662
|
|
192,304
|
|
|||
|
Total
|
$
|
750,049
|
|
$
|
724,046
|
|
|
|
|
PP&E, net
|
||||||
|
|
December 31,
2017 |
December 31,
2016 |
|||||
|
United States
|
$
|
95,603
|
|
$
|
109,600
|
|
|
|
China
|
211,566
|
|
208,821
|
|
|||
|
Mexico
|
196,813
|
|
155,607
|
|
|||
|
Bulgaria
|
97,562
|
|
81,719
|
|
|||
|
United Kingdom
|
63,310
|
|
75,495
|
|
|||
|
Malaysia
|
50,783
|
|
48,477
|
|
|||
|
The Netherlands
|
4,969
|
|
4,142
|
|
|||
|
All Other
|
29,443
|
|
40,185
|
|
|||
|
$
|
750,049
|
|
$
|
724,046
|
|
||
118
19. Net Income per Share
Basic and diluted net income per share are calculated by dividing Net income by the number of basic and diluted weighted-average ordinary shares outstanding during the period. For the years ended
December 31, 2017
,
2016
, and
2015
, the weighted-average ordinary shares outstanding for basic and diluted net income per share were as follows:
|
For the year ended
|
||||||||
|
|
December 31, 2017
|
December 31, 2016
|
December 31, 2015
|
|||||
|
Basic weighted-average ordinary shares outstanding
|
171,165
|
|
170,709
|
|
169,977
|
|
||
|
Dilutive effect of stock options
|
616
|
|
489
|
|
1,265
|
|
||
|
Dilutive effect of unvested restricted securities
|
388
|
|
262
|
|
271
|
|
||
|
Diluted weighted-average ordinary shares outstanding
|
172,169
|
|
171,460
|
|
171,513
|
|
||
Net income and net income per share are presented in the consolidated statements of operations.
Certain potential ordinary shares were excluded from our calculation of diluted weighted-average ordinary shares outstanding because they would have had an anti-dilutive effect on net income per share, or because they related to share-based awards that were contingently issuable, for which the contingency had not been satisfied. Refer to Note 11, "Share-Based Payment Plans," for further discussion of our share-based payment plans.
|
For the year ended
|
||||||||
|
|
December 31, 2017
|
December 31, 2016
|
December 31, 2015
|
|||||
|
Anti-dilutive shares excluded
|
1,410
|
|
1,401
|
|
747
|
|
||
|
Contingently issuable shares excluded
|
871
|
|
606
|
|
409
|
|
||
20. Unaudited Quarterly Data
A summary of the unaudited quarterly results of operations for the years ended
December 31, 2017
and
2016
is as follows:
|
|
December 31,
2017 |
September 30,
2017 |
June 30,
2017 |
March 31,
2017 |
|||||||||||
|
For the year ended December 31, 2017
|
|||||||||||||||
|
Net revenue
|
$
|
840,534
|
|
$
|
819,054
|
|
$
|
839,874
|
|
$
|
807,271
|
|
|||
|
Gross profit
|
$
|
300,416
|
|
$
|
291,622
|
|
$
|
298,842
|
|
$
|
274,545
|
|
|||
|
Net income
|
$
|
169,129
|
|
$
|
88,035
|
|
$
|
79,457
|
|
$
|
71,736
|
|
|||
|
Basic net income per share
(1)
|
$
|
0.99
|
|
$
|
0.51
|
|
$
|
0.46
|
|
$
|
0.42
|
|
|||
|
Diluted net income per share
|
$
|
0.98
|
|
$
|
0.51
|
|
$
|
0.46
|
|
$
|
0.42
|
|
|||
(1)
The sum of basic net income per share for the four quarters does not equal the full year basic net income per share due to rounding.
|
|
December 31,
2016 |
September 30,
2016 |
June 30,
2016 |
March 31,
2016 |
|||||||||||
|
For the year ended December 31, 2016
|
|||||||||||||||
|
Net revenue
|
$
|
788,396
|
|
$
|
789,798
|
|
$
|
827,545
|
|
$
|
796,549
|
|
|||
|
Gross profit
|
$
|
278,898
|
|
$
|
280,854
|
|
$
|
290,104
|
|
$
|
268,171
|
|
|||
|
Net income
|
$
|
66,527
|
|
$
|
69,785
|
|
$
|
65,510
|
|
$
|
60,612
|
|
|||
|
Basic net income per share
|
$
|
0.39
|
|
$
|
0.41
|
|
$
|
0.38
|
|
$
|
0.36
|
|
|||
|
Diluted net income per share
|
$
|
0.39
|
|
$
|
0.41
|
|
$
|
0.38
|
|
$
|
0.35
|
|
|||
119
Income taxes
In the fourth quarter of 2017, we recorded an income tax benefit of
$73.7 million
to remeasure deferred tax liabilities associated with indefinite-lived intangible assets that are deemed to reverse as a result of changes in applicable U.S. tax law set forth in the 2017 Tax Cuts and Jobs Act.
Refer to Note 9, "Income Taxes," for further discussion of tax related matters.
Commodity forward contracts
Gains and losses related to our commodity forward contracts, which are not designated for hedge accounting treatment in accordance with ASC 815, are recorded in Other, net in the consolidated statements of operations. During the first, second, third, and fourth quarters of 2017, we recognized gains/(losses) of
$5.4 million
,
$(2.0) million
,
$3.0 million
, and
$3.6 million
, respectively, related to these contracts. During the first, second, third, and fourth quarters of 2016, we recognized gains/(losses) of
$5.3 million
,
$5.4 million
,
$1.3 million
, and
$(4.7) million
, respectively.
Refer to Note 16, "Derivative Instruments and Hedging Activities," for further discussion of our commodity forward contracts, and Note 2, "Significant Accounting Policies," for a detail of Other, net for the years ended December 31, 2017 and 2016.
Restructuring and Special charges
In the first, second, third, and fourth quarters of 2017, we recorded Restructuring and special charges of
$11.1 million
,
$6.4 million
,
$1.3 million
, and
$0.2 million
, respectively. These charges consisted primarily of severance charges recorded in connection with the closing of our facility in Minden, Germany that was part of the acquisition of CST and the closing of our manufacturing facility in Bydgoszcz, Poland.
In the first, second, third, and fourth quarters of 2016, we recorded Restructuring and special charges of
$0.9 million
,
$1.5 million
,
$0.8 million
, and
$0.9 million
, respectively. These charges consisted primarily of facility exit costs related to the relocation of manufacturing lines from our facility in the Dominican Republic to a manufacturing facility in Mexico and severance charges recorded in connection with acquired businesses and the termination of a limited number of employees in various locations throughout the world.
Refer to Note 17, "Restructuring and Special Charges," for further discussion of our restructuring charges.
Charges related to the proposed cross-border merger
In the second, third, and fourth quarters of 2017, we incurred
$1.0 million
,
$3.5 million
, and
$2.1 million
, respectively, in charges related to our proposed cross border merger. Refer for Note 1, “Business Description and Basis of Presentation,” for further discussion of our proposed cross-border merger.
21. Subsequent Event
On September 28, 2017, the board of directors of Sensata N.V. unanimously approved a plan to change our parent company’s location of incorporation from the Netherlands to the U.K. To effect this change, the shareholders of Sensata N.V. are being asked to approve a cross-border merger between Sensata N.V. and Sensata Technologies Holding plc (“Sensata U.K.”), a newly formed, public limited company incorporated under the laws of England and Wales, with Sensata U.K. being the surviving entity (the “Merger”).
To this end, on January 19, 2018, Sensata N.V. filed a definitive proxy statement (DEFM14A) regarding the proposed cross-border merger, which details the proposed plan and risks to the Company and shareholders. An extraordinary general meeting will be held on February 16, 2018, at which shareholders of record as of January 19, 2018 will be asked to vote on the proposed Merger. If approved by our shareholders, we will seek review and approval of the transaction by the U.K. High Court of Justice and would expect to complete the Merger in March 2018. If the Merger is consummated, Sensata U.K. will become the publicly-traded parent of the subsidiary companies that are currently controlled by Sensata N.V.
120
SCHEDULE I—CONDENSED FINANCIAL INFORMATION OF THE REGISTRANT
SENSATA TECHNOLOGIES HOLDING N.V.
(Parent Company Only)
Balance Sheets
(In thousands)
|
December 31, 2017
|
December 31, 2016
|
||||||
|
Assets
|
|||||||
|
Current assets:
|
|||||||
|
Cash and cash equivalents
|
$
|
2,150
|
|
$
|
1,719
|
|
|
|
Intercompany receivables from subsidiaries
|
94,094
|
|
84,396
|
|
|||
|
Prepaid expenses and other current assets
|
643
|
|
683
|
|
|||
|
Total current assets
|
96,887
|
|
86,798
|
|
|||
|
Investment in subsidiaries
|
2,258,559
|
|
1,857,502
|
|
|||
|
Total assets
|
$
|
2,355,446
|
|
$
|
1,944,300
|
|
|
|
Liabilities and shareholders’ equity
|
|||||||
|
Current liabilities:
|
|||||||
|
Accounts payable
|
$
|
608
|
|
$
|
63
|
|
|
|
Intercompany payables to subsidiaries
|
7,465
|
|
175
|
|
|||
|
Accrued expenses and other current liabilities
|
1,219
|
|
1,580
|
|
|||
|
Total current liabilities
|
9,292
|
|
1,818
|
|
|||
|
Pension obligations
|
528
|
|
475
|
|
|||
|
Total liabilities
|
9,820
|
|
2,293
|
|
|||
|
Total shareholders’ equity
|
2,345,626
|
|
1,942,007
|
|
|||
|
Total liabilities and shareholders’ equity
|
$
|
2,355,446
|
|
$
|
1,944,300
|
|
|
The accompanying notes are an integral part of these condensed financial statements.
121
SENSATA TECHNOLOGIES HOLDING N.V.
(Parent Company Only)
Statements of Operations
(In thousands)
|
|
For the year ended
|
||||||||||
|
|
December 31, 2017
|
December 31, 2016
|
December 31, 2015
|
||||||||
|
Net revenue
|
$
|
—
|
|
$
|
—
|
|
$
|
—
|
|
||
|
Operating costs and expenses:
|
|||||||||||
|
Selling, general and administrative
|
6,894
|
|
104
|
|
618
|
|
|||||
|
Total operating expenses
|
6,894
|
|
104
|
|
618
|
|
|||||
|
Loss from operations
|
(6,894
|
)
|
(104
|
)
|
(618
|
)
|
|||||
|
Interest income, net
|
8
|
|
72
|
|
—
|
|
|||||
|
Other, net
|
(169
|
)
|
107
|
|
60
|
|
|||||
|
(Loss)/gain before income taxes and equity in net income of subsidiaries
|
(7,055
|
)
|
75
|
|
(558
|
)
|
|||||
|
Equity in net income of subsidiaries
|
415,412
|
|
262,359
|
|
348,254
|
|
|||||
|
Provision for income taxes
|
—
|
|
—
|
|
—
|
|
|||||
|
Net income
|
$
|
408,357
|
|
$
|
262,434
|
|
$
|
347,696
|
|
||
The accompanying notes are an integral part of these condensed financial statements.
122
SENSATA TECHNOLOGIES HOLDING N.V.
(Parent Company Only)
Statements of Comprehensive Income
(In thousands)
|
|
For the year ended
|
||||||||||
|
|
December 31, 2017
|
December 31, 2016
|
December 31, 2015
|
||||||||
|
Net income
|
$
|
408,357
|
|
$
|
262,434
|
|
$
|
347,696
|
|
||
|
Other comprehensive loss, net of tax:
|
|||||||||||
|
Defined benefit plan
|
77
|
|
515
|
|
(22
|
)
|
|||||
|
Subsidiaries' other comprehensive loss
|
(29,174
|
)
|
(8,592
|
)
|
(14,220
|
)
|
|||||
|
Other comprehensive loss
|
(29,097
|
)
|
(8,077
|
)
|
(14,242
|
)
|
|||||
|
Comprehensive income
|
$
|
379,260
|
|
$
|
254,357
|
|
$
|
333,454
|
|
||
The accompanying notes are an integral part of these condensed financial statements.
123
SENSATA TECHNOLOGIES HOLDING N.V.
(Parent Company Only)
Statements of Cash Flows
(In thousands)
|
|
For the year ended
|
||||||||||
|
|
December 31, 2017
|
December 31, 2016
|
December 31, 2015
|
||||||||
|
Net cash used in operating activities
|
$
|
(9,186
|
)
|
$
|
(4,756
|
)
|
$
|
(25,576
|
)
|
||
|
Cash flows from investing activities:
|
|||||||||||
|
Return of capital from subsidiaries
|
5,077
|
|
6,000
|
|
6,100
|
|
|||||
|
Net cash provided by investing activities
|
5,077
|
|
6,000
|
|
6,100
|
|
|||||
|
Cash flows from financing activities:
|
|||||||||||
|
Proceeds from exercise of stock options and issuance of ordinary shares
|
7,450
|
|
3,944
|
|
19,411
|
|
|||||
|
Payments to repurchase ordinary shares
|
(2,910
|
)
|
(4,752
|
)
|
(50
|
)
|
|||||
|
Net cash provided by/(used in) financing activities
|
4,540
|
|
(808
|
)
|
19,361
|
|
|||||
|
Net change in cash and cash equivalents
|
431
|
|
436
|
|
(115
|
)
|
|||||
|
Cash and cash equivalents, beginning of year
|
1,719
|
|
1,283
|
|
1,398
|
|
|||||
|
Cash and cash equivalents, end of year
|
$
|
2,150
|
|
$
|
1,719
|
|
$
|
1,283
|
|
||
The accompanying notes are an integral part of these condensed financial statements.
124
1. Basis of Presentation and Description of Business
Sensata Technologies Holding N.V. (Parent Company)—Schedule I—Condensed Financial Information of Sensata Technologies Holding N.V. (“Sensata N.V.”), included in this Annual Report on Form 10-K, provides all parent company information that is required to be presented in accordance with the U.S. Securities and Exchange Commission (“SEC”) rules and regulations for financial statement schedules. The accompanying condensed financial statements have been prepared in accordance with the reduced disclosure requirements permitted by the SEC. Sensata N.V. and subsidiaries' audited consolidated financial statements are included elsewhere in this Annual Report on Form 10-K.
Sensata N.V. conducts limited separate operations and acts primarily as a holding company. Sensata N.V. has no direct outstanding debt obligations. However, Sensata Technologies B.V, an indirect, wholly-owned subsidiary of Sensata N.V., is limited in its ability to pay dividends or otherwise make other distributions to its immediate parent company and, ultimately, to Sensata N.V., under its senior secured credit facilities and the indentures governing its senior notes. For a discussion of the debt obligations of the subsidiaries of Sensata N.V., see Note 8, "Debt," of the audited consolidated financial statements included elsewhere in this Annual Report on Form 10-K.
On September 28, 2017, the board of directors of Sensata N.V. unanimously approved a plan to change our parent company’s location of incorporation from the Netherlands to the U.K. To effect this change, the shareholders of Sensata N.V. are being asked to approve a cross-border merger between Sensata N.V. and Sensata Technologies Holding plc (“Sensata U.K.”), a newly formed, public limited company incorporated under the laws of England and Wales, with Sensata U.K. being the surviving entity (the “Merger”).
To this end, on January 19, 2018, Sensata N.V. filed a definitive proxy statement (DEFM14A) regarding the proposed cross-border merger, which details the proposed plan and risks to the Company and shareholders. An extraordinary general meeting will be held on February 16, 2018, at which shareholders of record as of January 19, 2018 will be asked to vote on the proposed Merger. If approved by our shareholders, we will seek review and approval of the transaction by the U.K. High Court of Justice and would expect to complete the Merger in March 2018. If the Merger is consummated, Sensata U.K. will become the publicly-traded parent of the subsidiary companies that are currently controlled by Sensata N.V.
All U.S. dollar amounts presented except per share amounts are stated in thousands, unless otherwise indicated.
2. Commitments and Contingencies
For a discussion of the commitments and contingencies of the subsidiaries of Sensata N.V., see Note 14, "Commitments and Contingencies," of the audited consolidated financial statements included elsewhere in this Annual Report on Form 10-K.
125
SCHEDULE II—VALUATION AND QUALIFYING ACCOUNTS
(In thousands)
|
|
Balance at the
beginning of
the period
|
Additions
|
Deductions
|
Balance at the end of
the period
|
|||||||||||
|
Charged, net of reversals,
to expenses/against revenue
|
|||||||||||||||
|
For the year ended December 31, 2017
|
|||||||||||||||
|
Accounts receivable allowances
|
$
|
11,811
|
|
$
|
2,205
|
|
$
|
(1,069
|
)
|
$
|
12,947
|
|
|||
|
For the year ended December 31, 2016
|
|||||||||||||||
|
Accounts receivable allowances
|
$
|
9,535
|
|
$
|
3,072
|
|
$
|
(796
|
)
|
$
|
11,811
|
|
|||
|
For the year ended December 31, 2015
|
|||||||||||||||
|
Accounts receivable allowances
|
$
|
10,364
|
|
$
|
2,424
|
|
$
|
(3,253
|
)
|
$
|
9,535
|
|
|||
126
|
ITEM 9.
|
CHANGES IN AND DISAGREEMENTS WITH ACCOUNTANTS ON ACCOUNTING AND FINANCIAL DISCLOSURE
|
None.
|
ITEM 9A.
|
CONTROLS AND PROCEDURES
|
The required certifications of our Chief Executive Officer and Chief Financial Officer are included as Exhibits 31.1 and 31.2 to this Annual Report on Form 10-K. The disclosures set forth in this Item 9A contain information concerning the evaluation of our disclosure controls and procedures, management's report on internal control over financial reporting, and changes in internal control over financial reporting referred to in these certifications. These certifications should be read in conjunction with this Item 9A for a more complete understanding of the matters covered by the certifications.
Evaluation of Disclosure Controls and Procedures
With the participation of our Chief Executive Officer and Chief Financial Officer, we have evaluated the effectiveness of our disclosure controls and procedures as of
December 31, 2017
. The term “disclosure controls and procedures,” as defined in Rules 13a-15(e) and 15d-15(e) under the Securities Exchange Act of 1934, as amended (the “Exchange Act”), means controls and other procedures of a company that are designed to ensure that information required to be disclosed by a company in the reports that it files or submits under the Exchange Act is recorded, processed, summarized, and reported within the time periods specified in the SEC's rules and forms. Disclosure controls and procedures include, without limitation, controls and procedures designed to ensure that information required to be disclosed by a company in the reports that it files or submits under the Exchange Act is accumulated and communicated to the company's management, including its principal executive and principal financial officers, as appropriate, to allow timely decisions regarding required disclosure. Management recognizes that any controls and procedures, no matter how well designed and operated, can provide only reasonable assurance of achieving their objectives, and management necessarily applies its judgment in evaluating the cost-benefit relationship of possible controls and procedures. Based on the evaluation of our disclosure controls and procedures as of
December 31, 2017
, our Chief Executive Officer and Chief Financial Officer concluded that, as of such date, our disclosure controls and procedures were effective at the reasonable assurance level.
Changes in Internal Control over Financial Reporting
No change in our internal control over financial reporting (as defined in Rules 13a-15(f) and 15d-15(f) under the Exchange Act) occurred during the fourth quarter of the year ended
December 31, 2017
that materially affected, or is reasonably likely to materially affect, our internal control over financial reporting.
127
Management’s Report on Internal Control over Financial Reporting
Management is responsible for establishing and maintaining adequate internal control over financial reporting as is defined in Exchange Act Rules 13a-15(f) and 15d-15(f). The Company’s internal control system was designed to provide reasonable assurance to the Company’s management, Board of Directors, and shareholders regarding the preparation and fair presentation of the Company’s published financial statements in accordance with generally accepted accounting principles. The Company’s internal control over financial reporting includes those policies and procedures that:
|
•
|
pertain to the maintenance of records that, in reasonable detail, accurately and fairly reflect the transactions and dispositions of the assets of the Company;
|
|
•
|
provide reasonable assurance that transactions are recorded as necessary to permit preparation of financial statements in accordance with generally accepted accounting principles, and that receipts and expenditures are being made only in accordance with authorizations of management of the Company; and
|
|
•
|
provide reasonable assurance regarding prevention or timely detection of unauthorized acquisition, use, or disposition of our assets that could have a material effect on the financial statements.
|
There are inherent limitations to the effectiveness of any system of internal control over financial reporting. Accordingly, even an effective system of internal control over financial reporting can only provide reasonable assurance with respect to financial statement preparation and presentation in accordance with accounting principles generally accepted in the United States of America. Our internal controls over financial reporting are subject to various inherent limitations, including cost limitations, judgments used in decision making, assumptions about the likelihood of future events, the soundness of our systems, the possibility of human error, and the risk of fraud. Moreover, projections of any evaluation of effectiveness to future periods are subject to the risk that controls may be inadequate because of changes in conditions and the risk that the degree of compliance with policies or procedures may deteriorate over time.
Management assessed the effectiveness of the Company’s internal control over financial reporting as of
December 31, 2017
. In making its assessment of internal control over financial reporting, management used the criteria issued by the Committee of Sponsoring Organizations ("COSO") of the Treadway Commission in May 2013.
Based on the results of this assessment, management, including our Chief Executive Officer and Chief Financial Officer, has concluded that, as of
December 31, 2017
, the Company’s internal control over financial reporting was effective.
The Company’s independent registered public accounting firm, Ernst & Young LLP, has also issued an audit report on the Company’s internal control over financial reporting, which is included elsewhere in this Annual Report on Form 10-K.
Hengelo, The Netherlands
February 1, 2018
128
Report of Independent Registered Public Accounting Firm
To the Shareholders and the Board of Directors of
Sensata Technologies Holding N.V.
Opinion on Internal Control over Financial Reporting
We have audited Sensata Technologies Holding N.V.’s internal control over financial reporting as of
December 31, 2017
, based on criteria established in Internal Control-Integrated Framework issued by the Committee of Sponsoring Organizations of the Treadway Commission (2013 framework) (the COSO criteria). In our opinion, Sensata Technologies Holding N.V. (the Company) maintained, in all material aspects, effective internal control over financial reporting as of
December 31, 2017
, based on the COSO criteria.
We also have audited, in accordance with the standards of the Public Company Accounting Oversight Board (United States) (PCAOB), the consolidated balance sheets of Sensata Technologies Holding N.V. as of
December 31, 2017
and
2016
, and the related consolidated statements of operations, comprehensive income, cash flows, and changes in shareholders’ equity for each of the three years in the period ended
December 31, 2017
of the Company and our report dated
February 1, 2018
expressed an unqualified opinion thereon.
Basis for Opinion
The Company’s management is responsible for maintaining effective internal control over financial reporting and for its assessment of the effectiveness of internal control over financial reporting included in the accompanying Management’s Report on Internal Control over Financial Reporting. Our responsibility is to express an opinion on the Company’s internal control over financial reporting based on our audit. We are a public accounting firm registered with the PCAOB and are required to be independent with respect to the Company in accordance with the U.S. federal securities laws and the applicable rules and regulations of the Securities and Exchange Commission and the PCAOB.
We conducted our audit in accordance with the standards of the PCAOB. Those standards require that we plan and perform the audit to obtain reasonable assurance about whether effective internal control over financial reporting was maintained in all material respects. Our audit included obtaining an understanding of internal control over financial reporting, assessing the risk that a material weakness exists, testing and evaluating the design and operating effectiveness of internal control based on the assessed risk, and performing such other procedures as we considered necessary in the circumstances. We believe that our audit provides a reasonable basis for our opinion.
Definition and Limitations of Internal Control Over Financial Reporting
A company’s internal control over financial reporting is a process designed to provide reasonable assurance regarding the reliability of financial reporting and the preparation of financial statements for external purposes in accordance with generally accepted accounting principles. A company’s internal control over financial reporting includes those policies and procedures that (1) pertain to the maintenance of records that, in reasonable detail, accurately and fairly reflect the transactions and dispositions of the assets of the company; (2) provide reasonable assurance that transactions are recorded as necessary to permit preparation of financial statements in accordance with generally accepted accounting principles, and that receipts and expenditures of the company are being made only in accordance with authorizations of management and directors of the company; and (3) provide reasonable assurance regarding prevention or timely detection of unauthorized acquisition, use, or disposition of the company’s assets that could have a material effect on the financial statements.
Because of its inherent limitations, internal control over financial reporting may not prevent or detect misstatements. Also, projections of any evaluation of effectiveness to future periods are subject to the risk that controls may become inadequate because of changes in conditions, or that the degree of compliance with the policies or procedures may deteriorate.
|
/s/ ERNST & YOUNG LLP
|
|||
Boston, Massachusetts
February 1, 2018
129
|
ITEM 9B.
|
OTHER INFORMATION
|
None.
|
ITEM 10.
|
DIRECTORS, EXECUTIVE OFFICERS, AND CORPORATE GOVERNANCE
|
The information required by this Item 10 is incorporated herein by reference from the Company's Definitive Proxy Statement, to be filed with the Securities and Exchange Commission within 120 days of the Company's fiscal year ended December 31, 2017.
|
ITEM 11.
|
EXECUTIVE COMPENSATION
|
The information required by this Item 11 is incorporated herein by reference from the Company's Definitive Proxy Statement, to be filed with the Securities and Exchange Commission within 120 days of the Company's fiscal year ended December 31, 2017.
|
ITEM 12.
|
SECURITY OWNERSHIP OF CERTAIN BENEFICIAL OWNERS AND MANAGEMENT AND RELATED STOCKHOLDER MATTERS
|
The information required by this Item 12 is incorporated herein by reference from the Company's Definitive Proxy Statement, to be filed with the Securities and Exchange Commission within 120 days of the Company's fiscal year ended December 31, 2017.
|
ITEM 13.
|
CERTAIN RELATIONSHIPS AND RELATED TRANSACTIONS, AND DIRECTOR INDEPENDENCE
|
The information required by this Item 13 is incorporated herein by reference from the Company's Definitive Proxy Statement, to be filed with the Securities and Exchange Commission within 120 days of the Company's fiscal year ended December 31, 2017.
|
ITEM 14.
|
PRINCIPAL ACCOUNTANT FEES AND SERVICES
|
The information required by this Item 14 is incorporated herein by reference from the Company's Definitive Proxy Statement, to be filed with the Securities and Exchange Commission within 120 days of the Company's fiscal year ended December 31, 2017.
130
|
ITEM 15.
|
EXHIBITS AND FINANCIAL STATEMENT SCHEDULES
|
(a)
|
1.
|
Financial Statements
— See “Financial Statements” under Item 8, "Financial Statements and Supplementary Data," of this Annual Report on Form 10-K.
|
|
2.
|
Financial Statement Schedules —
See “Financial Statement Schedules” under Item 8, "Financial Statements and Supplementary Data," of this Annual Report on Form 10-K.
|
|
3.
|
Exhibits
|
EXHIBIT INDEX
|
2.1
|
||
|
3.1
|
||
|
4.1
|
||
|
4.2
|
||
|
4.3
|
||
|
4.4
|
||
|
4.5
|
||
|
4.6
|
||
|
4.7
|
||
|
4.8
|
||
|
4.9
|
||
|
4.10
|
||
|
4.11
|
||
|
4.12
|
||
131
|
10.1
|
||
|
10.2
|
||
|
10.3
|
||
|
10.4
|
||
|
10.5
|
||
|
10.6
|
||
|
10.7
|
||
|
10.8
|
||
|
10.9
|
||
|
10.10
|
||
|
10.11
|
||
|
10.12
|
||
|
10.13
|
||
|
10.14
|
||
|
10.15
|
||
132
|
10.16
|
||
|
10.17
|
||
|
10.18
|
||
|
10.19
|
||
|
10.20
|
||
|
10.21
|
||
|
10.22
|
||
|
10.23
|
||
|
10.24
|
||
|
10.25
|
||
|
10.26
|
||
|
10.27
|
||
|
10.28
|
||
|
10.29
|
||
|
10.30
|
||
133
|
10.31
|
||
|
10.32
|
||
|
10.33
|
||
|
10.34
|
||
|
10.35
|
||
|
10.36
|
||
|
10.37
|
||
|
10.38
|
||
|
21.1
|
||
|
23.1
|
||
|
31.1
|
||
|
31.2
|
||
|
32.1
|
||
|
101
|
The following materials from Sensata's Annual Report on Form 10-K for the year ended December 31, 2017, formatted in XBRL (eXtensible Business Reporting Language); (i) Consolidated Statements of Operations for the years ended December 31, 2017, 2016, and 2015, (ii) Consolidated Statements of Comprehensive Income for the years ended December 31, 2017, 2016, and 2015, (iii) Consolidated Balance Sheets at December 31, 2017 and 2016, (iv) Consolidated Statements of Changes in Shareholders’ Equity for the years ended December 31, 2017, 2016, and 2015, (v) Consolidated Statements of Cash Flows for the years ended December 31, 2017, 2016, and 2015, (vi) the Notes to Consolidated Financial Statements, (vii) Schedule I — Condensed Financial Information of the Registrant and (viii) Schedule II — Valuation and Qualifying Accounts.
|
|
____________________
|
*
|
Filed herewith.
|
† Indicates management contract or compensatory plan, contract or arrangement.
‡ There have been non-material modifications to this contract since inception
134
SIGNATURES
Pursuant to the requirements of Section 13 or 15(d) of the Securities Exchange Act of 1934, the registrant has duly caused this report to be signed on its behalf by the undersigned, thereunto duly authorized.
|
SENSATA TECHNOLOGIES HOLDING N.V.
|
||
|
|
/s/ MARTHA SULLIVAN
|
|
|
By:
|
Martha Sullivan
|
|
|
Its:
|
President and Chief Executive Officer
|
|
Date:
February 1, 2018
Pursuant to the requirements of the Securities Exchange Act of 1934, this report has been signed below by the following persons on behalf of the registrant and in the capacities and on the dates indicated.
|
SIGNATURE
|
TITLE
|
|
DATE
|
|
|
/S/ MARTHA SULLIVAN
|
President, Chief Executive Officer, and Director (Principal Executive Officer)
|
|
February 1, 2018
|
|
|
Martha Sullivan
|
||||
|
/
S
/ PAUL VASINGTON
|
Executive Vice President and Chief Financial Officer (Principal Financial Officer and Principal Accounting Officer)
|
|
February 1, 2018
|
|
|
Paul Vasington
|
||||
|
/
S
/ PAUL EDGERLEY
|
Chairman of the Board of Directors
|
|
February 1, 2018
|
|
|
Paul Edgerley
|
||||
|
/
S
/ BEDA BOLZENIUS
|
Director
|
February 1, 2018
|
||
|
Beda Bolzenius
|
||||
|
/
S
/ JAMES HEPPELMANN
|
Director
|
|
February 1, 2018
|
|
|
James Heppelmann
|
||||
|
/
S
/ CHARLES PEFFER
|
Director
|
|
February 1, 2018
|
|
|
Charles Peffer
|
||||
|
/
S
/ KIRK POND
|
Director
|
|
February 1, 2018
|
|
|
Kirk Pond
|
||||
|
/
S
/ CONSTANCE SKIDMORE
|
Director
|
|
February 1, 2018
|
|
|
Constance Skidmore
|
||||
|
/
S
/ ANDREW TEICH
|
Director
|
|
February 1, 2018
|
|
|
Andrew Teich
|
||||
|
/
S
/ THOMAS WROE
|
Director
|
February 1, 2018
|
||
|
Thomas Wroe
|
||||
|
/
S
/ STEPHEN ZIDE
|
Director
|
February 1, 2018
|
||
|
Stephen Zide
|
||||
|
/
S
/ MARTHA SULLIVAN
|
Authorized Representative in the United States
|
|
February 1, 2018
|
|
|
Martha Sullivan
|
||||
135
TABLE OF CONTENTS
Part IItem 1. BusinessItem 1A. Risk FactorsItem 1B. Unresolved Staff CommentsItem 2. PropertiesItem 3. Legal ProceedingsItem 4. Mine Safety DisclosuresPart IIItem 5. Market For Registrant S Common Equity, Related Stockholder Matters, and Issuer Purchases Of Equity SecuritiesItem 6. Selected Financial DataItem 7. Management S Discussion and Analysis Of Financial Condition and Results Of OperationsItem 7A. Quantitative and Qualitative Disclosures About Market RiskItem 8. Financial Statements and Supplementary DataItem 9. Changes in and Disagreements with Accountants on Accounting and Financial DisclosureItem 9A. Controls and ProceduresItem 9B. Other InformationPart IIIItem 10. Directors, Executive Officers, and Corporate GovernanceItem 11. Executive CompensationItem 12. Security Ownership Of Certain Beneficial Owners and Management and Related Stockholder MattersItem 13. Certain Relationships and Related Transactions, and Director IndependenceItem 14. Principal Accountant Fees and ServicesPart IVItem 15. Exhibits and Financial Statement Schedules