STAG INDUSTRIAL, INC.
10-Ks and 10-Qs
|
|
|
|
|
|
|
|
|
|
|
|
|
|
|
|
|
|
|
|
|
|
|
|
|
|
|
|
|
|
|
|
|
|
|
|
|
|
|
|
|
|
|
|
|
|
|
|
|
|
UNITED STATES
SECURITIES AND EXCHANGE COMMISSION
Washington, D.C. 20549
FORM 10-K
|
x
|
ANNUAL REPORT PURSUANT TO SECTION 13 OR 15(d) OF THE SECURITIES EXCHANGE ACT OF 1934
|
For the fiscal year ended
December 31, 2016
OR
|
¨
|
TRANSITION REPORT PURSUANT TO SECTION 13 OR 15(d) OF THE SECURITIES EXCHANGE ACT OF 1934
|
For the transition period from to .
Commission file number 1-34907
STAG INDUSTRIAL, INC.
(Exact name of registrant as specified in its charter)
|
Maryland
(State or other jurisdiction
of incorporation or organization)
|
27-3099608
(IRS Employer
Identification No.)
|
|
One Federal Street, 23rd Floor
Boston, Massachusetts
(Address of principal executive offices)
|
02110
(Zip Code)
|
(617) 574-4777
(Registrant’s telephone number, including area code)
Not Applicable
(Former name, former address and former fiscal year, if changed since last report)
Securities registered pursuant to Section 12(b) of the Act:
|
Title of each class
|
|
Name of each exchange on which registered
|
|
Common Stock, $0.01 par value
|
|
New York Stock Exchange
|
|
6.625% Series B Cumulative Redeemable Preferred Stock, $0.01 par value
|
|
New York Stock Exchange
|
|
6.875% Series C Cumulative Redeemable Preferred Stock, $0.01 par value
|
|
New York Stock Exchange
|
Securities registered pursuant to Section 12(g) of the Act:
None
Indicate by check mark if the registrant is a well-known seasoned issuer, as defined in Rule 405 of the Securities Act. Yes
x
No
¨
Indicate by check mark if the registrant is not required to file reports pursuant to Section 13 or Section 15(d) of the Exchange Act. Yes
¨
No
x
Indicate by check mark whether the registrant (1) has filed all reports required to be filed by Section 13 or 15(d) of the Securities Exchange Act of 1934 during the preceding 12 months (or for such shorter period that the registrant was required to file such reports), and (2) has been subject to such filing requirements for the past 90 days. Yes
x
No
¨
Indicate by check mark whether the registrant has submitted electronically and posted on its corporate Web site, if any, every Interactive Data File required to be submitted and posted pursuant to Rule 405 of Regulation S-T (§232.405 of this chapter) during the preceding 12 months (or for such shorter period that the registrant was required to submit and post such files). Yes
x
No
¨
Indicate by check mark if disclosure of delinquent filers pursuant to Item 405 of Regulation S-K is not contained herein, and will not be contained, to the best of the registrant’s knowledge, in definitive proxy or information statements incorporated by reference in Part III of this Form 10-K or any amendment to this Form 10-K.
¨
Indicate by check mark whether the registrant is a large accelerated filer, an accelerated filer, a non‑accelerated filer or a smaller reporting company. See the definitions of “large accelerated filer,” “accelerated filer” and “smaller reporting company” in Rule 12b-2 of the Exchange Act. Check one:
|
Large accelerated filer
x
|
Accelerated filer
¨
|
Non-accelerated filer
¨
(Do not check if a
smaller reporting company)
|
Smaller reporting company
¨
|
Indicate by check mark whether the registrant is a shell company (as defined in Rule 12b-2 of the Exchange Act). Yes
¨
No
x
The aggregate market value of the voting and non-voting common equity held by non-affiliates of the registrant was approximately
$1,618 million
based on the closing price on the New York Stock Exchange as of June 30, 2016.
Number of shares of the registrant’s common stock outstanding as of
February 14, 2017
:
82,051,501
Number of shares of 6.625% Series B Cumulative Redeemable Preferred Stock as of
February 14, 2017
:
2,800,000
Number of shares of 6.875% Series C Cumulative Redeemable Preferred Stock as of
February 14, 2017
:
3,000,000
DOCUMENTS INCORPORATED BY REFERENCE
Portions of the registrant’s definitive Proxy Statement with respect to its
2017
Annual Meeting of Stockholders to be filed not later than 120 days after the end of the registrant’s fiscal year are incorporated by reference into Part II, Item 5 and Part III, Items 10, 11, 12, 13 and 14 hereof as noted therein.
STAG INDUSTRIAL, INC.
Table of Contents
|
|
|
|
|
|
|
|
|
|
|
|
|
|
|
|
2
PART I.
Introduction
As used herein, except where the context otherwise requires, “Company,” “we,” “our” and “us,” refer to STAG Industrial, Inc. and our consolidated subsidiaries and partnerships, including our operating partnership, STAG Industrial Operating Partnership, L.P. (“Operating Partnership”).
Revision of Previously Reported Consolidated Financial Statements
In connection with the preparation of our consolidated financial statements for the year ended December 31, 2016, we identified an error in the estimated useful life of a building acquired in the fourth quarter of 2014. As a result of the error, depreciation expense had been overstated and thereby rental property, net and equity were understated. We concluded that the amounts were not material to any of our previously issued consolidated financial statements. Accordingly, we revised these balances in our consolidated financial statements for the years ended December 31, 2015 and December 31, 2014. For more information on this revision, see Note 2 in the accompanying Notes to Consolidated Financial Statements, “Revision of Previously Reported Consolidated Financial Statements” included elsewhere in this Annual Report on Form 10-K.
Forward-Looking Statements
This report, including the information incorporated by reference, contains “forward-looking statements” within the meaning of the safe harbor from civil liability provided for such statements by the Private Securities Litigation Reform Act of 1995 (set forth in Section 27A of the Securities Act of 1933, as amended ("Securities Act"), and Section 21E of the Securities Exchange Act of 1934, as amended (the “Exchange Act”)). You can identify forward‑looking statements by the use of words such as “anticipates,” “believes,” “estimates,” “expects,” “intends,” “may,” “plans,” “projects,” “seeks,” “should,” “will,” and variations of such words or similar expressions. Forward‑looking statements in this report include, among others, statements about our future financial condition, results of operations, capitalization rates on future acquisitions, our business strategy and objectives, including our acquisition strategy, occupancy and leasing rates and trends, and expected liquidity needs and sources (including capital expenditures and the ability to obtain financing or raise capital). Our forward-looking statements reflect our current views about our plans, intentions, expectations, strategies and prospects, which are based on the information currently available to us and on assumptions we have made. Although we believe that our plans, intentions, expectations, strategies and prospects as reflected in or suggested by our forward-looking statements are reasonable, we can give no assurance that our plans, intentions, expectations, strategies or prospects will be attained or achieved and you should not place undue reliance on these forward‑looking statements. Furthermore, actual results may differ materially from those described in the forward‑looking statements and may be affected by a variety of risks and factors including, without limitation:
|
•
|
the factors included in this report, including those set forth under the headings “Business,” “Risk Factors,” and “Management’s Discussion and Analysis of Financial Condition and Results of Operations;”
|
|
•
|
our ability to raise equity capital on attractive terms;
|
|
•
|
the competitive environment in which we operate;
|
|
•
|
real estate risks, including fluctuations in real estate values and the general economic climate in local markets and competition for tenants in such markets;
|
|
•
|
decreased rental rates or increased vacancy rates;
|
|
•
|
potential defaults (including bankruptcies or insolvency) on or non-renewal of leases by tenants;
|
|
•
|
acquisition risks, including our ability to identify and complete accretive acquisitions and/or failure of such acquisitions to perform in accordance with projections;
|
|
•
|
the timing of acquisitions and dispositions;
|
|
•
|
potential natural disasters and other potentially catastrophic events such as acts of war and/or terrorism;
|
|
•
|
international, national, regional and local economic conditions;
|
3
|
•
|
the general level of interest rates and currencies;
|
|
•
|
potential changes in the law or governmental regulations and interpretations of those laws and regulations, including changes in real estate and zoning laws or real estate investment trust (“REIT”) or corporate income tax laws, and potential increases in real property tax rates;
|
|
•
|
financing risks, including the risks that our cash flows from operations may be insufficient to meet required payments of principal and interest and we may be unable to refinance our existing debt upon maturity or obtain new financing on attractive terms or at all;
|
|
•
|
credit risk in the event of non-performance by the counterparties to the interest rate swaps and revolving and unfunded debt;
|
|
•
|
lack of or insufficient amounts of insurance;
|
|
•
|
our ability to maintain our qualification as a REIT;
|
|
•
|
our ability to retain key personnel;
|
|
•
|
litigation, including costs associated with prosecuting or defending claims and any adverse outcomes; and
|
|
•
|
possible environmental liabilities, including costs, fines or penalties that may be incurred due to necessary remediation of contamination of properties presently owned or previously owned by us.
|
Any forward-looking statement speaks only as of the date on which it is made. New risks and uncertainties arise over time, and it is not possible for us to predict those events or how they may affect us. Except as required by law, we are not obligated to, and do not intend to, update or revise any forward-looking statements, whether as a result of new information, future events or otherwise.
Item 1. Business
As used herein “total annualized base rental revenue” refers to the contractual monthly base rent as of
December 31, 2016
(which differs from rent calculated in accordance with generally accepted accounting principles in the United States of America ("GAAP")) multiplied by 12. If a tenant is in a free rent period as of
December 31, 2016
, the annualized rent is calculated based on the first contractual monthly base rent amount multiplied by 12.
Overview
We are a REIT focused on the acquisition, ownership, and operation of single-tenant, industrial properties throughout the United States. We seek to (i) identify properties for acquisition that offer relative value across all locations, industrial property types, and tenants through the principled application of our proprietary risk assessment model, (ii) operate our properties in an efficient, cost-effective manner, and (iii) capitalize our business appropriately given the characteristics of our assets. We are a Maryland corporation and our common stock is publicly traded on the New York Stock Exchange (“NYSE”) under the symbol “STAG.”
We are organized and conduct our operations to qualify as a REIT under Sections 856 through 860 of the Internal Revenue Code of 1986, as amended (the “Code”), and generally are not subject to federal income tax to the extent we currently distribute our income to our stockholders and maintain our qualification as a REIT. We remain subject to state and local taxes on our income and property and to U.S. federal income and excise taxes on our undistributed income.
As of
December 31, 2016
, we owned
314
buildings in
37
states with approximately
60.9 million
rentable square feet, consisting of
243
warehouse/distribution buildings,
54
light manufacturing buildings,
16
flex/office buildings, and
one
building in redevelopment. As of
December 31, 2016
, our buildings were approximately
94.7%
leased to
275
tenants, with no single tenant accounting for more than approximately
3.1%
of our total annualized base rental revenue and no single industry accounting for more than approximately
13.6%
of our total annualized base rental revenue. We intend to maintain a diversified mix of tenants to limit our exposure to any single tenant.
The industrial property market in the United States is a large and fragmented market that we believe offers sustainable acquisition opportunities throughout all phases of the economic cycle. Based on this estimate, our current share of our target market is less than 1%. We have a fully-integrated acquisition, leasing and asset management platform, and our senior management team has a significant amount of single-tenant, industrial real estate experience.
4
Our mission is to continue to be a disciplined, relative value investor and a leading owner and operator of single-tenant, industrial properties in the United States. We seek to deliver attractive stockholder returns in all market environments by providing a covered dividend combined with accretive growth.
We are structured as an umbrella partnership REIT, also known as an UPREIT, and own all of our properties and conduct substantially all of our business through our Operating Partnership, which we control and manage. As of
December 31, 2016
, we owned approximately
95.7%
of the common equity of our Operating Partnership, and our current and former executive officers, directors, senior employees and their affiliates, and third parties who contributed properties to us in exchange for common equity in our Operating Partnership, owned the remaining
4.3%
. We completed our initial public offering of common stock (“IPO”) and related formation transactions, pursuant to which we succeeded to the business of our predecessor, on April 20, 2011.
Our Investment Thesis
We believe that our focus on owning and operating a portfolio of individually-acquired, single-tenant industrial properties throughout the United States will, when compared to other real estate portfolios, generate returns for our stockholders that are attractive in light of the associated risks for the following reasons:
|
•
|
Buyers tend to price an individual, single-tenant, industrial property according to the binary nature of its cash flows: with only one potential tenant, any one property is either generating revenue or not. Furthermore, tenants typically cover operating expenses at a property and when a property is not generating revenue, we, as owners, are responsible for paying these expenses. We believe the market prices these properties based upon a higher risk profile due to the single-tenant nature of these properties and therefore applies a lower value relative to a diversified cash flowing investment.
|
|
•
|
The acquisition and contribution of these single-tenant properties to an aggregated portfolio of these individual binary risk cash flows creates diversification, thereby lowering risk and creating value.
|
|
•
|
Industrial properties generally require less capital expenditure than other commercial property types and single-tenant properties generally require less expenditure for leasing, operating and capital costs per property than multi-tenant properties.
|
|
•
|
Other institutional, industrial real estate buyers tend to focus on larger properties and portfolios in a select few primary markets. In contrast, we focus on smaller, individual properties across many markets; as a result, our typical competitors are local investors who often do not have the same access to debt or equity capital as us. In our fragmented, predominantly non-institutional environment, a sophisticated, institutional platform with access to capital has execution and operational advantages.
|
While we invest in properties in all locations, our proprietary risk assessment model typically identifies the best relative value in primary and secondary markets.
We define our Operating Portfolio as including all warehouse and light manufacturing assets and excluding non-core flex/office assets and assets under redevelopment. Our Operating Portfolio also excludes billboard, parking lot and cell tower leases.
As of
December 31, 2016
, our Operating Portfolio investments in primary, secondary, and tertiary markets are summarized in the table below.
|
|
|
Square Footage
|
|
Total Annualized
Base Rental Revenue
|
|||||||||||||||
|
Operating Portfolio Market Type
|
Number of
Buildings
|
Amount
|
%
|
Occupancy
|
Amount
(in thousands)
|
%
|
|||||||||||||
|
Primary (greater than 200 million net rentable square feet)
|
68
|
|
14,445,533
|
|
24.2
|
%
|
95.4
|
%
|
$
|
58,532
|
|
26.1
|
%
|
||||||
|
Secondary (25 million to 200 million net rentable square feet)
|
184
|
|
38,126,550
|
|
64.0
|
%
|
96.1
|
%
|
141,730
|
|
63.2
|
%
|
|||||||
|
Tertiary (less than 25 million net rentable square feet)
|
45
|
|
7,028,220
|
|
11.8
|
%
|
93.7
|
%
|
24,066
|
|
10.7
|
%
|
|||||||
|
Total/weighted average
|
297
|
|
59,600,303
|
|
100.0
|
%
|
95.7
|
%
|
$
|
224,328
|
|
100.0
|
%
|
||||||
5
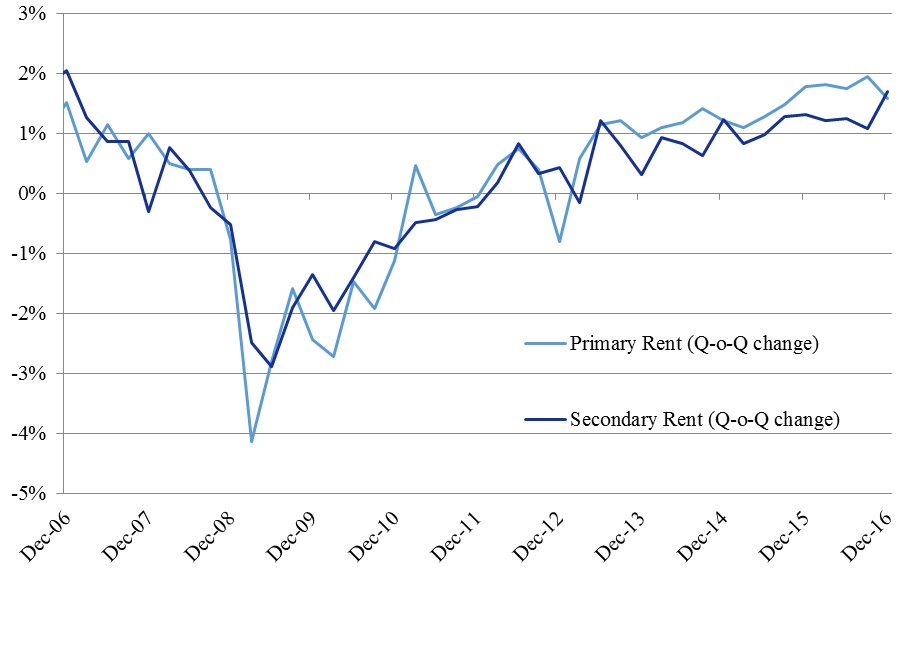
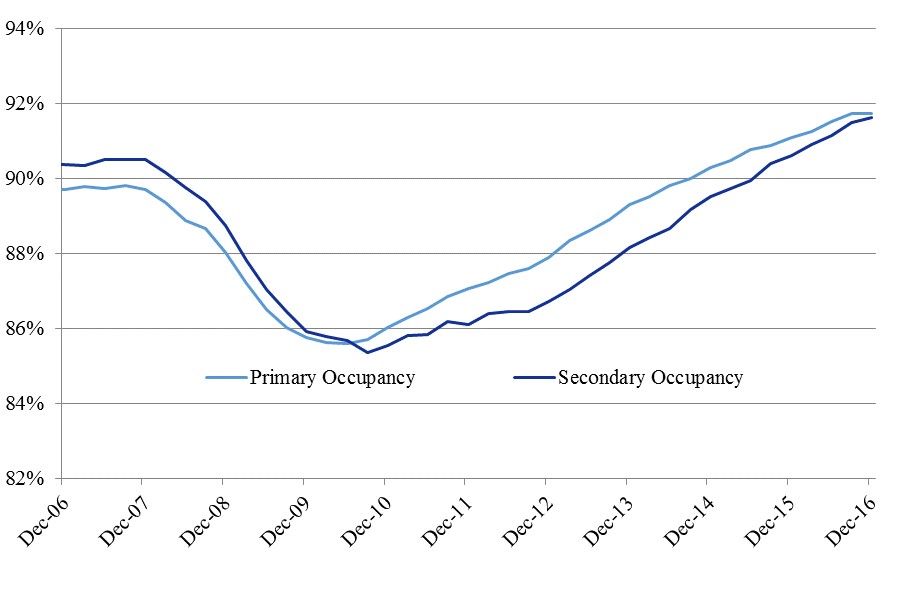
We have found, and the charts below indicate, that primary and secondary markets have similar occupancy and rent growth experiences. Furthermore, secondary industrial property markets generally provide similar rent volatility and equivalent occupancy, compared to primary industrial property markets. The charts below, based on data provided by CB Richard Ellis—Econometric Advisors (“CBRE-EA”), show the quarter-over-quarter (“Q-o-Q”) percentage changes in warehouse rent and occupancy for primary and secondary markets.
Our Strategies
Our primary business objectives are to own and operate a balanced and diversified portfolio of binary risk investments (individual single-tenant industrial properties) that maximize cash flows available for distribution to our stockholders, and to enhance stockholder value over time by achieving sustainable long-term growth in distributable cash flow from operations per share through the following strategies.
6
External Growth Strategy
We focus our acquisition activities (assuming our market opportunity remains attractive) on our core property types: warehouse/distribution facilities and light manufacturing facilities.
Underwriting Strategy
We blend fundamental real estate analysis with corporate credit analysis in our proprietary model to make a probabilistic assessment of future cash flows. We focus on quality real estate, long-term ownership, and the present value of estimated future cash flows.
Our underwriting strategy involves our asset management and leasing, credit, capital markets and legal departments. For each asset, our analysis focuses on the following and determines the inputs into our risk assessment model.
|
•
|
Asset Management and Leasing
. We evaluate the physical real estate within the context of the market (and submarket) in which it is located and the prospect for re-tenanting the building if it becomes vacant by estimating the following:
|
|
•
|
current and future market rent for this building in this location;
|
|
•
|
downtime to re-lease and related carrying costs;
|
|
•
|
cost (tenant improvements, leasing commissions and capital expenditures) to achieve the occupancy and the projected market rent within the projected downtime;
|
|
•
|
the fungibility of the property with other properties in the market and the flexibility of the property for other uses, including single-tenant or multi-tenant reuse; and
|
|
•
|
renewal probability, which we determine by the tenant’s use of the property and the degree to which the property is central to the tenant’s ongoing operations, the tenant’s potential cost to relocate, the supply/demand dynamic in the relevant submarket and the availability of suitable alternative properties.
|
|
•
|
Credit.
We apply fundamental credit analysis to evaluate the tenant’s credit profile by focusing on the tenant’s current and historical financial status, general business plan, operating risks, capital sources, industry trends, and earnings expectations. We also analyze Securities and Exchange Commission (“SEC”) filings, press releases, rating agency reports, macroeconomic variables, analyst reports, and market signals. In the case of a private, non‑rated firm, we will generally obtain financial information from the tenant, calculate common measures of credit strength and coverage ratios, evaluate qualitative factors including but not limited to competition and customer/supplier concentration, obtain third party references, and conduct tenant interviews. For publicly rated firms, we use our own internal underwriting model, as well as the credit information issued by Moody’s Investor Services, Standard & Poor’s, Fitch Ratings, and other ratings agencies. Using this data and publicly available bond default studies of comparable tenant credits, we estimate the probability of future rent loss due to tenant default, as well as the possibility of a reorganization or liquidation in the case of a tenant default or bankruptcy event.
|
|
•
|
Capital Markets.
We evaluate the leverage levels, credit spreads, and costs associated with the capital used to fund the proposed acquisition. In addition, we estimate future inflation rates and interest rates.
|
|
•
|
Legal.
We evaluate transaction documents, the tenant and landlord obligations contained within the existing or proposed leases, and other legal issues associated with the building, such as zoning, encroachments and environmental conditions.
|
For our portfolio as a whole, we use risk management guidelines to ensure diversification by tenant, industry, lease term and geography.
Real Estate Operation Strategy
We establish direct, long-term relationships with our tenants and use our in-house expertise in asset management and leasing to oversee all operational aspects of our portfolio. We also engage and actively manage high-quality third parties for localized leasing, property management, and construction services. Our asset management team utilizes our direct tenant relationships and leasing expertise to strive to achieve better than market levels of occupancy and rental rates. We utilize third party real estate brokers for the execution of new and renewal leases. The team also collaborates with our internal credit function to monitor the credit profile
7
of each of our tenants through financial statement review, tenant management calls, and press releases. The team’s efforts have resulted in our achieving an Operating Portfolio tenant retention rate of approximately
69.8%
for those tenants whose leases expired during the period from January 1,
2014
to
December 31, 2016
. As of
December 31, 2016
, our portfolio had approximately
5.3%
of our total rentable square feet available for lease, compared to 4.4% as of
December 31, 2015
.
Financing Strategy
Our main focus is to preserve a flexible capital structure and maintain a relatively low-leveraged balance sheet designed to allow us to capitalize on market opportunities throughout the economic cycle. We seek to
maintain a conservative balance sheet and we achieve this by capitalizing new acquisitions with approximately 60% equity and 40% debt, and by managing our consolidated leverage ratio, as defined in our respective loan agreements, to sub 45%. As of
December 31, 2016
, our ratio of net debt to real estate cost basis was approximately
41.0%
and our ratio of total long-term indebtedness to enterprise value was approximately
32.6%
. For purposes of these ratios, we define:
|
•
|
“net debt” as our total long-term indebtedness outstanding, less cash and cash equivalents on hand;
|
|
•
|
“long-term indebtedness” as the principal balance on our unsecured credit facility, unsecured term loans, unsecured notes and mortgage notes;
|
|
•
|
“real estate cost basis” as the book value of rental property and deferred leasing intangibles, exclusive of the related accumulated depreciation and amortization
;
and
|
|
•
|
“enterprise value” as the market value of our common stock (based on the period-end closing price on the NYSE multiplied by our common stock and units) plus the liquidation value of our preferred stock plus the amounts outstanding under our unsecured credit facility, unsecured term loans, unsecured notes, and mortgage notes.
|
We raise capital through equity offerings, including discrete marketed offerings and ongoing “at the market” (“ATM”) offerings, and through unsecured debt offerings such as bank borrowings and private placement issuances. We believe unsecured indebtedness is generally more efficient and less restrictive operationally than secured indebtedness. We continue to utilize our ATM program as our primary source of equity capital when required and available. As a supplement to the ATM activity, we have also executed marketed overnight equity offerings. From time to time, we issue common units of limited partnership interest in our Operating Partnership to acquire properties from owners who desire a tax-deferred transaction.
Regulation
General
Our properties are subject to various laws, ordinances and regulations, including regulations relating to common areas and fire and safety requirements. We believe that we and/or our tenants, as applicable, have the necessary permits and approvals to operate each of our properties.
Americans with Disabilities Act
Our properties must comply with Title III of the Americans with Disabilities Act of 1990, as amended (the “ADA”) to the extent that such properties are “public accommodations” as defined under the ADA. Under the ADA, all public accommodations must meet federal requirements related to access and use by disabled persons. The ADA may require removal of structural barriers to access by persons with disabilities in certain public areas of our properties where such removal is readily achievable. Although we believe that the properties in our portfolio in the aggregate substantially comply with current requirements of the ADA, and we have not received any notice for correction from any regulatory agency, we have not conducted a comprehensive audit or investigation of all of our properties to determine whether we are in compliance and therefore we may own properties that are not in compliance with the ADA.
ADA compliance is dependent upon the tenant’s specific use of the property, and as the use of a property changes or improvements to existing spaces are made, we will take steps to ensure compliance. Noncompliance with the ADA could result in additional costs to attain compliance, imposition of fines by the U.S. government or an award of damages or attorney’s fees to private litigants. The obligation to make readily achievable accommodations is an ongoing one, and we will continue to assess our properties and to make alterations to achieve compliance as necessary.
8
Environmental Matters
Our properties are subject to various federal, state and local environmental laws. Under these laws, courts and government agencies have the authority to require us, as owner of a contaminated property, to clean up the property, even if we did not know of or were not responsible for the contamination. These laws also apply to persons who owned a property at the time it became contaminated, and therefore it is possible we could incur these costs even after we sell some of our properties. In addition to the costs of cleanup, environmental contamination can affect the value of a property and, therefore, an owner’s ability to borrow using the property as collateral or to sell the property. Under applicable environmental laws, courts and government agencies also have the authority to require that a person who sent waste to a waste disposal facility, such as a landfill or an incinerator, pay for the clean-up of that facility if it becomes contaminated and threatens human health or the environment. We invest in properties historically used for industrial, light manufacturing and commercial purposes. Certain of our properties are on or are adjacent to or near other properties upon which others, including former owners or tenants of our properties have engaged, or may in the future engage, in activities that may generate or release petroleum products or other hazardous or toxic substances.
Environmental laws in the United States also require that owners or operators of buildings containing asbestos properly manage and maintain the asbestos, adequately inform or train those who may come into contact with asbestos and undertake special precautions, including removal or other abatement, in the event that asbestos is disturbed during building renovation or demolition. These laws may impose fines and penalties on building owners or operators who fail to comply with these requirements and may allow third parties to seek recovery from owners or operators for personal injury associated with exposure to asbestos. Some of our buildings are known to have asbestos containing materials, and others, due to the age of the building and observed conditions, are suspected of having asbestos containing materials. We do not believe these conditions will materially and adversely affect us. In most or all instances, no immediate action was recommended to address the conditions.
Furthermore, various court decisions have established that third parties may recover damages for injury caused by property contamination. For instance, a person exposed to asbestos at one of our properties may seek to recover damages if he or she suffers injury from the asbestos. Lastly, some of these environmental laws restrict the use of a property or place conditions on various activities. An example would be laws that require a business using chemicals to manage them carefully and to notify local officials that the chemicals are being used.
We could be responsible for any of the costs discussed above. The costs to clean up a contaminated property, to defend against a claim, or to comply with environmental laws could be material and could adversely affect the funds available for distribution to our stockholders. All of our properties were subject to a Phase I or similar environmental assessment by independent environmental consultants at the time of acquisition. We generally expect to continue to obtain a Phase I or similar environmental assessment by independent environmental consultants on each property prior to acquiring it. However, these environmental assessments may not reveal all environmental costs that might have a material adverse effect on our business, assets, results of operations or liquidity and may not identify all potential environmental liabilities.
At the time of acquisition, we add each property to our portfolio environmental insurance policy that provides coverage for potential environmental liabilities, subject to the policy’s coverage conditions and limitations.
We can make no assurances that future laws, ordinances or regulations will not impose material environmental liabilities on us, or the current environmental condition of our properties will not be affected by tenants, the condition of land or operations in the vicinity of our properties (such as releases from underground storage tanks), or by third parties unrelated to us.
Insurance
We carry comprehensive general liability, fire, extended coverage and rental loss insurance covering all of the properties in our portfolio under a blanket insurance policy. In addition, we maintain a portfolio environmental insurance policy that provides coverage for potential environmental liabilities, subject to the policy’s coverage conditions and limitations. Generally, we do not carry insurance for certain losses, including, but not limited to, losses caused by floods (unless the property is located in a flood plain), earthquakes, acts of war, acts of terrorism or riots. We carry employment practices liability insurance that covers us against claims by employees, former employees or potential employees for various employment related matters including wrongful termination, discrimination, sexual harassment in the workplace, hostile work environment, and retaliation, subject to the policy’s coverage conditions and limitations. We carry comprehensive cyber liability insurance coverage that covers us against claims related to certain first party and third party losses including data restoration costs, crisis management expenses, credit monitoring costs, failure to implement and maintain reasonable security procedures, invasion of customer’s privacy and negligence, subject to the policy’s coverage conditions and limitations. We also carry directors and officers insurance. We believe the policy specifications and insured limits are appropriate and adequate given the relative risk of loss, the cost of the coverage and standard industry practice; however, our insurance coverage may not be sufficient to cover all of our losses.
9
Competition
In acquiring our target properties, we compete primarily with local individuals or local operators due to the smaller, single asset (versus portfolio) focus of our acquisition strategy. From time to time we compete with other public industrial property sector REITs, single-tenant REITs, income oriented non-traded REITs, and private real estate funds. Local real estate investors historically have represented our predominant competition for deals and they typically do not have the same access to capital that we do as a publicly traded institution. We also face significant competition from owners and managers of competing properties in leasing our properties to prospective tenants and in re-leasing space to existing tenants.
Operating Segments
We manage our operations on an aggregated, single segment basis for purposes of assessing performance and making operating decisions, and accordingly, have only one reporting and operating segment. See Note 2 in the accompanying Notes to Consolidated Financial Statements under “Segment Reporting.”
Employees
As of
December 31, 2016
, we employed 68 full-time employees. None of our employees are represented by a labor union.
Our Corporate Structure
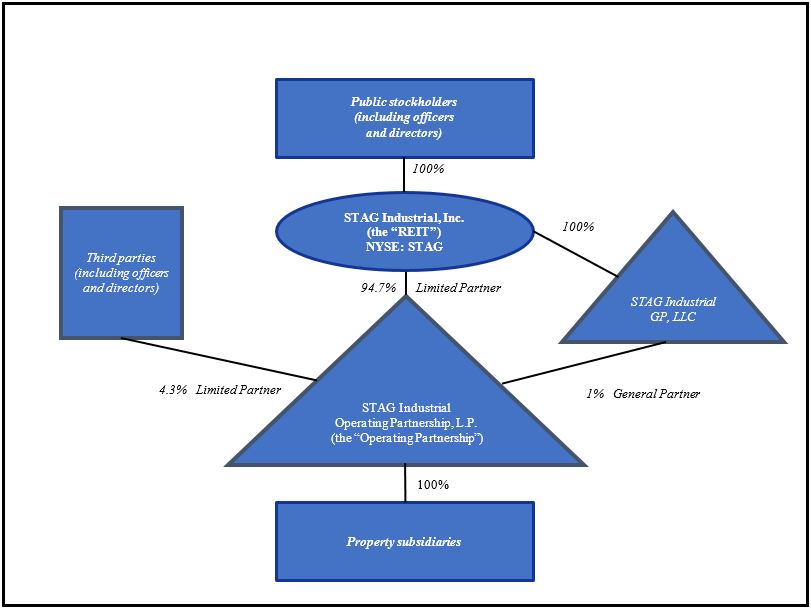
We were incorporated in Maryland on July 21, 2010, and our Operating Partnership was formed as a Delaware limited partnership on December 21, 2009.
We are structured as an UPREIT; our publicly-traded entity, STAG Industrial, Inc., is the REIT in the UPREIT structure, and our Operating Partnership is the umbrella partnership. We own a majority, but not all, of the Operating Partnership. We also wholly own the sole general partner (the manager) of the Operating Partnership. Substantially all of our assets are held in, and substantially all of our operations are conducted through, the Operating Partnership. Shares of our common stock are listed and traded on the NYSE. The limited partnership interests in the Operating Partnership, which we sometimes refer to as “units,” are not and cannot be publicly traded, although they may provide liquidity through an exchange feature described below. Our UPREIT structure allows us to acquire a property from an owner on a tax-deferred basis by issuing units in exchange for the property.
The common units of limited partnership interest in our Operating Partnership correlate on a one-for-one economic basis to the shares of common stock in the REIT. Each common unit receives the same distribution as a share of our common stock, the value of each common unit is tied to the value of a share of our common stock and each common unit, after one year, generally may be redeemed (that is, exchanged) for cash in an amount equivalent to the value of a share of common stock or, if we choose, for a share of common stock on a one-for-one basis.
10
The following is a simplified diagram of our UPREIT structure at
December 31, 2016
.
Additional Information
Our principal executive offices are located at One Federal Street, 23rd Floor, Boston, Massachusetts 02110. Our telephone number is (617) 574-4777.
Our website is www.stagindustrial.com. Our Annual Report on Form 10-K, our Quarterly Reports on Form 10-Q, our Current Reports on Form 8-K and any amendments to any of those reports that we file with the SEC are available free of charge as soon as reasonably practicable through our website at www.stagindustrial.com. Also posted on our website, and available in print upon request, are charters of each committee of the board of directors, our code of business conduct and ethics and our corporate governance guidelines. Within the time period required by the SEC, we will post on our website any amendment to the code of business conduct and ethics and any waiver applicable to any executive officer, director or senior financial officer. The information found on, or otherwise accessible through, our website is not incorporated into, and does not form a part of, this report or any other report or document we file with or furnish to the SEC.
All reports, proxy and information statements and other information we file with the SEC are also available free through the SEC's website at www.sec.gov. In addition, the public may read and copy materials we file with the SEC at the SEC’s public reference room located at 100 F Street, N.E., Washington, D.C. 20549. Information on the operation of the public reference room can be obtained by calling the SEC at 1-800-SEC-0330.
Item 1A. Risk Factors
The following risk factors and other information included in this Annual Report on Form 10-K should be carefully considered. The risks and uncertainties described below are not the only risks we face. Additional risks and uncertainties not presently known to us or that we may currently deem immaterial also may impair our business operations. If any of the following or other risks occur, our business, financial condition, operating results, cash flows, and distributions, as well as the market prices for our securities, could be materially adversely affected.
11
Risks Related to Our Business and Operations
Our investments are concentrated in the industrial real estate sector, and we would be adversely affected by an economic downturn in that sector.
As of
December 31, 2016
, most of our
314
buildings were industrial properties, including
243
warehouse/distribution facilities,
54
light manufacturing facilities,
16
flex/office facilities, and
one
building in redevelopment. This concentration may expose us to the risk of economic downturns in the industrial real estate sector to a greater extent than if our properties were more diversified across other sectors of the real estate industry.
Adverse economic conditions will harm our returns and profitability.
Our operating results may be affected by market and economic challenges and uncertainties, which may result from a continued or exacerbated general economic slowdown experienced by the nation as a whole or by the local economies where our properties may be located or our tenants may conduct business, or by the real estate industry, including the following:
|
•
|
poor economic conditions may result in tenant defaults under leases and extended vacancies at our properties;
|
|
•
|
re-leasing may require concessions or reduced rental rates under the new leases due to reduced demand;
|
|
•
|
adverse capital and credit market conditions may restrict our operating activities; and
|
|
•
|
constricted access to credit may result in tenant defaults, non-renewals under leases or inability of potential buyers to acquire properties held for sale.
|
Also, to the extent we purchase real estate in an unstable market, we are subject to the risk that if the real estate market ceases to attract the same level of capital investment in the future that it attracts at the time of our purchases, or the number of companies seeking to acquire properties decreases, the value of our investments may not appreciate or may decrease significantly below the amount we paid for these investments. The length and severity of any economic slowdown or downturn cannot be predicted. Our operations could be negatively affected to the extent that an economic slowdown or downturn is prolonged or becomes more severe.
Substantial international, national and local government deficits and the weakened financial condition of these governments may adversely affect us.
The values of, and the cash flows from, the properties we own may be affected by developments in global, national and local economies. As a result of the recent global economic crisis and the significant government interventions, federal, state and local governments have incurred record deficits and assumed or guaranteed liabilities of private financial institutions or other private entities. These increased budget deficits and the weakened financial condition of federal, state and local governments may lead to reduced governmental spending, tax increases, public sector job losses, increased interest rates, currency devaluations, defaults on debt obligations or other adverse economic events, which may directly or indirectly adversely affect our business, financial condition and results of operations.
There can be no assurance that the global market disruptions, including the increased cost of funding for certain governments and financial institutions, will improve, nor can there be any assurance that future assistance packages will be available or, even if provided, will be sufficient to stabilize the affected countries and markets. Risks and ongoing concerns about the global economic crisis could have a detrimental impact on economic recovery, financial markets and institutions and the availability of debt financing, which may directly or indirectly adversely affect us.
In addition, on June 23, 2016, the United Kingdom held a referendum in which a majority of voters voted to exit the European Union, known as Brexit. Negotiations will determine the future terms of the United Kingdom’s relationship with the European Union, including, among other things, the terms of trade between the United Kingdom and the European Union. The effects of Brexit will depend on any agreements the United Kingdom makes to retain access to European Union markets either during a transitional period or more permanently. Brexit could adversely affect European and global economic or market conditions and could contribute to instability in global financial markets. Any of these effects of Brexit, and others we cannot anticipate, may adversely affect us.
Events or occurrences that affect areas in which our properties are geographically concentrated may impact financial results.
In addition to general, regional, national and international economic conditions, our operating performance is impacted by the economic conditions of the specific markets in which we have concentrations of properties. We have holdings in the following states, which, as of
December 31, 2016
, were the three largest when accounting for the percentage of our total annualized base
12
rental revenue:
Illinois
(
8.2%
, spread over
2
CBSA's);
Ohio
(
7.5%
, spread over
9
CBSA's); and
South Carolina
(
7.4%
, spread over
6
CBSA's).
We define Core Based Statistical Area ("CBSA") as a U.S. geographic area defined by the Office of Management and Budget that consists of one or more counties (or equivalents) anchored by an urban center of at least 10,000 people plus adjacent counties that are socioeconomically tied to the urban center by commuting.
Our operating performance could be adversely affected if conditions become less favorable in any of the states or regions in which we have a concentration of properties.
We are subject to industry concentrations that make us susceptible to adverse events with respect to certain industries.
We are subject to certain industry concentrations with respect to our properties, including the following, which, as of
December 31, 2016
, were the three largest when accounting for the percentage of our total annualized base rental revenue:
Automotive
(
13.6%
);
Industrial Equipment, Component and Metals
(
11.3%
); and
Air Freight and Logistics
(
11.2%
). Such industries are subject to specific risks that could result in downturns within the industries. Any downturn in one or more of these industries, or in any other industry in which we may have a significant concentration now or in the future, could adversely affect our tenants who are involved in such industries. If any of these tenants is unable to withstand such downturn or is otherwise unable to compete effectively in its business, it may be forced to declare bankruptcy, fail to meet its rental obligations, seek rental concessions or be unable to enter into new leases, which could materially and adversely affect us.
Default by one or more of our tenants could materially and adversely affect us.
Any of our tenants may experience a downturn in its business at any time that may significantly weaken its financial condition or cause its failure. As a result, such a tenant may decline to extend or renew its lease upon expiration, fail to make rental payments when due or declare bankruptcy. The default, financial distress or bankruptcy of a tenant could cause interruptions in the receipt of rental revenue and/or result in a vacancy, which is, in the case of a single-tenant property, likely to result in the complete reduction in the operating cash flows generated by the property and may decrease the value of that property. In addition, a majority of our leases generally require the tenant to pay all or substantially all of the operating expenses normally associated with the ownership of the property, such as utilities, real estate taxes, insurance and routine maintenance. Following a vacancy at a single-tenant property, we will be responsible for all of the operating costs at such property until it can be re-let, if at all.
If our tenants are unable to obtain financing necessary to continue to operate their businesses and pay us rent, we could be materially and adversely affected.
Many of our tenants rely on external sources of financing to operate their businesses. The U.S. financial and credit markets may experience liquidity disruptions, resulting in the unavailability of financing for many businesses. If our tenants are unable to obtain financing necessary to continue to operate their businesses, they may be unable to meet their rent obligations to us or enter into new leases with us or be forced to declare bankruptcy and reject our leases, which could materially and adversely affect us.
We depend on key personnel; the loss of their full service could adversely affect us.
Our success depends to a significant degree upon the continued contributions of certain key personnel including, but not limited to, our executive officers, whose continued service is not guaranteed, and each of whom would be difficult to replace. While we have entered into employment contracts with our executive officers, they may nevertheless cease to provide services to us at any time. If any of our key personnel were to cease employment with us, our operating results could suffer. Our ability to retain our management group or to attract suitable replacements should any members of the management group leave is dependent on the competitive nature of the employment market. The loss of services from key members of the management group or a limitation in their availability could adversely impact our financial condition and cash flows. Further, such a loss could be negatively perceived in the capital markets. As of
December 31, 2016
, we have not obtained and do not expect to obtain key man life insurance on any of our key personnel.
We also believe that, as we expand, our future success depends, in large part, upon our ability to hire and retain highly skilled managerial, investment, financing, operational and marketing personnel. Competition for such personnel is intense, and we cannot assure you that we will be successful in attracting and retaining such skilled personnel.
Our growth will depend upon future acquisitions of properties, and we may be unable to consummate acquisitions on advantageous terms or acquisitions may not perform as we expect.
We acquire and intend to continue to acquire primarily warehouse/distribution properties and light manufacturing properties. The acquisition of properties entails various risks, including the risks that our investments may not perform as we expect. Further, we face competition for attractive investment opportunities from other well-capitalized real estate investors, including both publicly-traded REITs and private institutional investment funds, and these competitors may have greater financial resources than we and a greater ability to borrow funds to acquire properties. This competition will increase as investments in real estate become increasingly attractive relative to other forms of investment. As a result of competition, we may be unable to acquire additional
13
properties for the purchase price we desire. In addition, we expect to finance future acquisitions through a combination of secured and unsecured borrowings, proceeds from equity or debt offerings by us or our Operating Partnership or its subsidiaries and proceeds from property contributions and divestitures which may not be available and which could adversely affect our cash flows.
The cash available for distribution to stockholders may not be sufficient to pay dividends at expected levels, nor can we assure you of our ability to make distributions in the future.
Distributions will be authorized and determined by our board of directors in its sole discretion from time to time and will depend upon a number of factors, including:
|
•
|
cash available for distribution;
|
|
•
|
our results of operations;
|
|
•
|
our financial condition, especially in relation to the anticipated future capital needs of our properties;
|
|
•
|
the distribution requirements for REITs under the Code;
|
|
•
|
our operating expenses; and
|
|
•
|
other factors our board of directors deems relevant.
|
Consequently, we may not continue our current level of distributions to stockholders, and our distribution levels may fluctuate.
In addition, some of our distributions may include a return of capital. To the extent that we make distributions in excess of our current and accumulated earnings and profits, such distributions would generally be considered a return of capital for federal income tax purposes to the extent of the holder’s adjusted tax basis in its shares. A return of capital is not taxable, but it has the effect of reducing the holder’s adjusted tax basis in its investment. To the extent that distributions exceed the adjusted tax basis of a holder’s shares, they will be treated as gain from the sale or exchange of such stock. If we borrow to fund distributions, our future interest costs would increase, thereby reducing our earnings and cash available for distribution from what they otherwise would have been.
We have owned our properties for a limited time, and we may not be aware of characteristics or deficiencies involving any one or all of them.
The majority of our properties have been under management for less than five years. In addition, in the past five years, we have acquired
264
buildings totaling approximately
53.8 million
rentable square feet. These properties may have characteristics or deficiencies unknown to us that could affect their valuation or revenue potential and such properties may not ultimately perform up to our expectations. We cannot assure you that the operating performance of the properties will not decline under our management.
We face risks associated with security breaches through cyber attacks, cyber intrusions or otherwise, as well as other significant disruptions of our information technology (IT) networks and related systems.
We face risks associated with security breaches, whether through cyber attacks or cyber intrusions over the internet, malware, computer viruses, attachments to e-mails, persons inside our organization or persons with access to systems inside our organization, and other significant disruptions of our IT networks and related systems. The risk of a security breach or disruption, particularly through cyber attack or cyber intrusion, including by computer hackers, foreign governments and cyber terrorists, has generally increased as the number, intensity and sophistication of attempted attacks and intrusions from around the world have increased. Our IT networks and related systems are essential to the operation of our business and our ability to perform day-to-day operations and, in some cases, may be critical to the operations of certain of our tenants. Although we make efforts to maintain the security and integrity of these types of IT networks and related systems, and we have implemented various measures to manage the risk of a security breach or disruption, there can be no assurance that our security efforts and measures will be effective or that attempted security breaches or disruptions would not be successful or damaging. Even the most well protected information, networks, systems and facilities remain potentially vulnerable because the techniques used in such attempted security breaches evolve and generally are not recognized until launched against a target, and in some cases are designed to not be detected and, in fact, may not be detected. Accordingly, we may be unable to anticipate these techniques or to implement adequate security barriers or other preventative measures, and thus it is impossible for us to mitigate this risk entirely. A security breach or other significant disruption involving our IT networks and related systems could disrupt the proper functioning of our networks and systems; result in misstated financial reports, violations of loan covenants and/or missed reporting deadlines; result in our inability to monitor our compliance with the rules and regulations regarding our qualification as a REIT; result in the unauthorized access to, and destruction, loss, theft, misappropriation or release of proprietary, confidential, sensitive or otherwise valuable information of ours or others, which others could use to compete against us or for disruptive, destructive or otherwise harmful purposes and outcomes; require significant
14
management attention and resources to remedy any damages that result; subject us to claims for breach of contract, damages, credits, penalties or termination of leases or other agreements; or damage our reputation among our tenants and investors generally.
Risks Related to Our Organization and Structure
Our growth depends on external sources of capital, which are outside of our control and affect our ability to seize strategic opportunities, satisfy debt obligations and make distributions to our stockholders.
In order to maintain our qualification as a REIT, we are generally required under the Code to distribute annually at least 90% of our net taxable income, determined without regard to the dividends paid deduction and excluding any net capital gain. In addition, we will be subject to income tax at regular corporate rates to the extent that we distribute less than 100% of our net taxable income, including any net capital gains. Because of these distribution requirements, we may not be able to fund future capital needs, including any necessary acquisition financing, from operating cash flow. Consequently, we may rely on third-party sources to fund our capital needs. We may not be able to obtain financing on favorable terms or at all. Any additional debt we incur will increase our leverage. Our access to third-party sources of capital depends, in part, on:
|
•
|
general market conditions;
|
|
•
|
the market’s perception of our growth potential;
|
|
•
|
our current debt levels;
|
|
•
|
our current and expected future earnings;
|
|
•
|
our cash flow and cash dividends; and
|
|
•
|
the market price per share of our common stock.
|
If we cannot obtain capital from third-party sources, we may not be able to acquire properties when strategic opportunities exist, meet the capital and operating needs of our existing properties or satisfy our debt service obligations. Further, in order to meet the REIT distribution requirements and maintain our REIT status and to avoid the payment of income and excise taxes, we may need to borrow funds on a short-term basis even if the then-prevailing market conditions are not favorable for these borrowings. These short-term borrowing needs could result from differences in timing between the actual receipt of cash and inclusion of income for federal income tax purposes or the effect of non-deductible capital expenditures, the creation of reserves, certain restrictions on distributions under loan documents or required debt or amortization payments.
To the extent that capital is not available to acquire properties, profits may not be realized or their realization may be delayed, which could result in an earnings stream that is less predictable than some of our competitors and result in us not meeting our projected earnings and distributable cash flow levels in a particular reporting period. Failure to meet our projected earnings and distributable cash flow levels in a particular reporting period could have an adverse effect on our financial condition and on the market price of our stock.
We have experienced historical net losses and accumulated deficits after depreciation and amortization and we may experience future losses.
We had historical net losses attributable to common stockholders for the years ended
December 31, 2015
and
December 31, 2014
of approximately
$38.6 million
and
$14.9 million
, respectively. There can be no assurance that we will not incur net losses in the future after excluding the effects of depreciation and amortization, which could adversely affect our ability to service our indebtedness and our ability to make distributions, any of which could adversely affect the trading price of our stock.
Certain of our officers and the chairman of our board of directors have duties to Fund II, which may create conflicts of interest and may impede business decisions that could benefit our stockholders.
Certain of our executive officers and the chairman of our board of directors also serve as officers or on the board of managers of STAG Investments II, LLC (“Fund II”), a private equity real estate fund that continues to operate as a private, fully invested fund. Our officers and the chairman of our board of directors may have conflicting duties because they have a duty to both us and to Fund II, which retained ownership of certain of its properties. While Fund II is pursuing an orderly liquidation and will not be making any additional investments, some of its existing properties may be competitive with our properties. It is possible that the officers’ and the chairman of our board of directors' fiduciary duty to Fund II, including, without limitation, their interests in Fund II, will conflict with what will be in the best interests of our company.
15
Our fiduciary duties as sole member of the general partner of our Operating Partnership could create conflicts of interest, which may impede business decisions that could benefit our stockholders.
We, as the sole member of the general partner of our Operating Partnership, have fiduciary duties to the other limited partners in our Operating Partnership, the discharge of which may conflict with the interests of our stockholders. The limited partners of our Operating Partnership have agreed that, in the event of a conflict in the fiduciary duties owed by us to our stockholders and, in our capacity as indirect general partner of our Operating Partnership, to such limited partners, we are under no obligation to give priority to the interests of such limited partners. In addition, those persons holding common units will have the right to vote on certain amendments to the Operating Partnership agreement (which require approval by a majority interest of the limited partners, including us) and individually to approve certain amendments that would adversely affect their rights. These voting rights may be exercised in a manner that conflicts with the interests of our stockholders. For example, we are unable to modify the rights of limited partners to receive distributions as set forth in the Operating Partnership agreement in a manner that adversely affects their rights without their consent, even though such modification might be in the best interest of our stockholders.
In addition, conflicts may arise when the interests of our stockholders and the limited partners of our Operating Partnership diverge, particularly in circumstances in which there may be an adverse tax consequence to the limited partners. Tax consequences to holders of common units upon a sale or refinancing of our properties may cause the interests of our senior management to differ from your own. As a result of unrealized built-in gain attributable to contributed property at the time of contribution, some holders of common units, including our principals, may suffer different and more adverse tax consequences than holders of our securities upon the sale or refinancing of the properties owned by our Operating Partnership, including disproportionately greater allocations of items of taxable income and gain upon a realization event. As those holders will not receive a correspondingly greater distribution of cash proceeds, they may have different objectives regarding the appropriate pricing, timing and other material terms of any sale or refinancing of certain properties, or whether to sell or refinance such properties at all.
We may experience conflicts of interest with several members of our senior management team and board who have or may become limited partners in our Operating Partnership through the receipt of common units or long-term incentive plan units in our Operating Partnership (“LTIP units”) granted under our 2011 Equity Incentive Plan (the “2011 Plan”).
We are subject to financial reporting and other requirements for which our accounting, internal audit and other management systems and resources may not be adequately prepared and we may not be able to accurately report our financial results.
We are subject to reporting and other obligations under the Exchange Act, including the requirements of Section 404 of the Sarbanes-Oxley Act of 2002. Section 404 requires annual management assessments of the effectiveness of our internal controls over financial reporting and a report by our independent registered public accounting firm addressing these assessments. These reporting and other obligations place significant demands on our management, administrative, operational, internal audit and accounting resources and cause us to incur significant expenses. We may need to upgrade our systems or create new systems; implement additional financial and management controls, reporting systems and procedures; expand our internal audit function; and hire additional accounting, internal audit and finance staff. Any failure to maintain effective internal controls could have a material adverse effect on our business, operating results and price of our securities.
Our charter, the partnership agreement of our Operating Partnership and Maryland law contain provisions that may delay or prevent a change of control transaction.
Our charter contains 9.8% ownership limits.
Our charter, subject to certain exceptions, authorizes our directors to take such actions as are necessary and desirable to limit any person to actual or constructive ownership of no more than 9.8% in value or in number of shares, whichever is more restrictive, of the outstanding shares of our capital stock and no more than 9.8% in value or in number of shares, whichever is more restrictive, of the outstanding shares of our common stock. In addition, the articles supplementary for our 6.625% Series B Cumulative Redeemable Preferred Stock, par value $0.01 per share (the “Series B Preferred Stock”), and our 6.875% Series C Cumulative Redeemable Preferred Stock, par value $0.01 per share (the “Series C Preferred Stock”) provide that generally no person may own, or be deemed to own by virtue of the attribution provisions of the Code, either more than 9.8% in value or in number of shares, whichever is more restrictive, of our outstanding Series B Preferred Stock or Series C Preferred Stock. Our board of directors, in its sole discretion, may exempt a proposed transferee from the ownership limits. However, our board of directors may not grant an exemption from the ownership limits to any proposed transferee whose ownership, direct or indirect, of more than 9.8% of the value or number of our outstanding shares of our common stock, our Series B Preferred Stock or our Series C Preferred Stock could jeopardize our status as a REIT. The ownership limits contained in our charter and the restrictions on ownership of our common stock may delay or prevent a transaction or a change of control that might be in the best interest of our stockholders.
Our board of directors may create and issue a class or series of preferred stock without stockholder approval.
Subject to the
rights of holders of Series B Preferred Stock and Series C Preferred Stock to approve the classification or issuance of any class or series of stock ranking senior to the Series B Preferred Stock or Series C Preferred Stock, our board of directors is empowered
16
under our charter to amend our charter to increase or decrease the aggregate number of shares of our common stock or the number of shares of stock of any class or series that we have authority to issue, to designate and issue from time to time one or more classes or series of preferred stock and to classify or reclassify any unissued shares of our common stock or preferred stock without stockholder approval. Subject to the rights of holders of Series B Preferred Stock and Series C Preferred Stock discussed above, our board of directors may determine the relative rights, preferences and privileges of any class or series of preferred stock issued. The issuance of preferred stock could also have the effect of delaying or preventing a change of control transaction that might otherwise be in the best interests of our stockholders.
Certain provisions in the partnership agreement for our Operating Partnership may delay or prevent unsolicited acquisitions of us.
Provisions in the partnership agreement for our Operating Partnership could discourage third parties from making proposals involving an unsolicited acquisition of us or change of our control, although some stockholders might consider such proposals, if made, desirable. These provisions include, among others:
|
•
|
redemption rights of qualifying parties;
|
|
•
|
transfer restrictions on our common units;
|
|
•
|
the ability of the general partner in some cases to amend the partnership agreement without the consent of the limited partners; and
|
|
•
|
the right of the limited partners to consent to transfers of the general partnership interest and mergers under specified circumstances.
|
Any potential change of control transaction may be further limited as a result of provisions of the partnership unit designation for the LTIP units, which require us to preserve the rights of LTIP unit holders and may restrict us from amending the partnership agreement for our Operating Partnership in a manner that would have an adverse effect on the rights of LTIP unit holders.
Certain provisions of Maryland law could inhibit changes in control.
Certain provisions of the Maryland General Corporation Law (“MGCL”) may have the effect of inhibiting a third party from making a proposal to acquire us or impeding a change of control under circumstances that might be in the best interest of our stockholders, including:
|
•
|
“business combination” provisions that, subject to limitations, prohibit certain business combinations between us and an “interested stockholder” (defined generally as any person who beneficially owns 10% or more of the voting power of our shares or an affiliate thereof) for five years after the most recent date on which the stockholder becomes an interested stockholder, and thereafter impose special appraisal rights and special stockholder voting requirements on these combinations; and
|
|
•
|
“control share” provisions that provide that “control shares” of our company (defined as shares which, when aggregated with other shares controlled by the stockholder, entitle the stockholder to exercise one of three increasing ranges of voting power in electing directors) acquired in a “control share acquisition” (defined as the direct or indirect acquisition of ownership or control of “control shares”) have no voting rights except to the extent approved by our stockholders by the affirmative vote of at least two-thirds of all the votes entitled to be cast on the matter, excluding all interested shares.
|
We have elected to opt out of these provisions of the MGCL, in the case of the business combination provisions of the MGCL, by resolution of our board of directors, and in the case of the control share provisions of the MGCL, pursuant to a provision in our bylaws. Only upon the approval of our stockholders, our board of directors may repeal the foregoing opt-outs from the business combination provisions of the MGCL and opt in to the control share provisions of the MGCL in the future.
Additionally, Title 8, Subtitle 3 of the MGCL, permits our board of directors, without stockholder approval and regardless of what is currently provided in our charter or our bylaws, to implement takeover defenses, some of which (for example, a classified board) we do not currently have. These provisions may have the effect of inhibiting a third party from making an acquisition proposal for our company or of delaying, deferring or preventing a change in control of our company under circumstances that might be in the best interest of our stockholders.
Our charter, bylaws, the partnership agreement for our Operating Partnership and Maryland law also contain other provisions that may delay, defer or prevent a transaction or a change of control that might be in the best interest of our stockholders.
17
Under their employment agreements, our executive officers have the right to terminate their employment and, under certain conditions, receive severance, which may adversely affect us.
The employment agreements with our executive officers provide that each executive may terminate his or her employment and, under certain conditions, receive severance based on two or three times (depending on the officer) the annual total of salary and bonus and immediate vesting of equity-based awards. In the case of certain terminations, they would not be restricted from competing with us after their departure.
Compensation awards to our management may not be tied to or correspond with our improved financial results or the stock price, which may adversely affect us.
The compensation committee of our board of directors is responsible for overseeing our compensation and employee benefit plans and practices, including our executive compensation plans and our incentive compensation and equity-based compensation plans. Our compensation committee has significant discretion in structuring compensation packages and may make compensation decisions based on any number of factors. As a result, compensation awards may not be tied to or correspond with improved financial results at our company or the share price of our common stock.
Our board of directors can take many actions without stockholder approval.
Our board of directors has overall authority to oversee our operations and determine our major corporate policies. This authority includes significant flexibility. For example, our board of directors can do the following:
|
•
|
amend or revise at any time and from time to time our investment, financing, borrowing and dividend policies and our policies with respect to all other activities, including growth, debt, capitalization and operations;
|
|
•
|
amend our policies with respect to conflicts of interest provided that such changes are consistent with applicable legal requirements;
|
|
•
|
within the limits provided in our charter, prevent the ownership, transfer and/or accumulation of shares in order to protect our status as a REIT or for any other reason deemed to be in the best interests of us and our stockholders;
|
|
•
|
issue additional shares without obtaining stockholder approval, which could dilute the ownership of existing stockholders;
|
|
•
|
amend our charter to increase or decrease the aggregate number of shares of stock or the number of shares of stock of any class or series, without obtaining stockholder approval;
|
|
•
|
subject to the rights of holders of Series B Preferred Stock and of Series C Preferred Stock, classify or reclassify any unissued shares of our common stock or preferred stock, set the preferences, rights and other terms of such classified or reclassified shares, without obtaining stockholder approval;
|
|
•
|
make certain amendments to our equity incentive plan;
|
|
•
|
employ and compensate affiliates;
|
|
•
|
direct our resources toward investments that do not ultimately appreciate over time;
|
|
•
|
change creditworthiness standards with respect to third-party tenants; and
|
|
•
|
determine that it is no longer in our best interests to continue to qualify as a REIT.
|
Any of these actions could increase our operating expenses, impact our ability to make distributions or reduce the value of our assets without giving you, as a stockholder, the right to vote.
Our rights and the rights of our stockholders to take action against our directors and officers are limited.
Maryland law provides that a director or officer has no liability in that capacity if he or she performs his or her duties in good faith, in a manner he or she reasonably believes to be in our best interests and with the care that an ordinarily prudent person in a like position would use under similar circumstances. In addition, our charter eliminates our directors’ and officers’ liability to us and our stockholders for money damages except for liability resulting from actual receipt of an improper benefit or profit in money, property or services or active and deliberate dishonesty established by a final judgment and which is material to the cause of action. Our bylaws require us to indemnify our directors and officers to the maximum extent permitted by Maryland law for liability actually incurred in connection with any proceeding to which they may be made, or threatened to be made, a party, except to the
18
extent that the act or omission of the director or officer was material to the matter giving rise to the proceeding and was either committed in bad faith or was the result of active and deliberate dishonesty, the director or officer actually received an improper personal benefit in money, property or services, or, in the case of any criminal proceeding, the director or officer had reasonable cause to believe that the act or omission was unlawful. As a result, we and our stockholders may have more limited rights against our directors and officers than might otherwise exist under common law. In addition, we may be obligated to fund the defense costs incurred by our directors and officers.
The number of shares of our common stock available for future sale, including by our affiliates or investors in our Operating Partnership, could adversely affect the market price of our common stock, and future sales by us of shares of our common stock may be dilutive to existing stockholders.
Sales of substantial amounts of shares of our common stock in the public market, or upon exchange of common units or exercise of any options, or the perception that such sales might occur could adversely affect the market price of our common stock. The exchange of common units for common stock, the exercise of any stock options or the vesting of any restricted stock granted under our 2011 Plan, the issuance of our common stock or common units in connection with property, portfolio or business acquisitions and other issuances of our common stock or common units could have an adverse effect on the market price of the shares of our common stock. The existence of shares of our common stock reserved for issuance under our 2011 Plan or upon exchange of common units may adversely affect the terms upon which we may be able to obtain additional capital through the sale of equity securities. We also have filed a registration statement with the SEC allowing us to offer, from time to time, an indefinite amount of equity securities (including common or preferred stock) on an as-needed basis and subject to our ability to affect offerings on satisfactory terms based on prevailing conditions. In addition, our board of directors authorized us to issue shares of common stock in our “at-the-market” offering program. Our ability to execute our business strategy depends on our access to an appropriate blend of debt financing, including unsecured lines of credit and other forms of secured and unsecured debt, and equity financing, including issuances of common and preferred stock. No prediction can be made about the effect that future distributions or sales of our common stock will have on the market price of our common shares. In addition, future sales by us of our common stock may be dilutive to existing stockholders.
Future offerings of debt securities, which would be senior to our common stock upon liquidation, or equity securities, which would dilute our existing stockholders and may be senior to our common stock for the purposes of distributions, may adversely affect the market price of our securities.
Our common stock is ranked junior to our Series B Preferred Stock and Series C Preferred Stock. Our outstanding Series B Preferred Stock and Series C Preferred Stock also has or will have a preference upon our dissolution, liquidation or winding up in respect of assets available for distribution to our stockholders. Holders of our common stock are not entitled to preemptive rights or other protections against dilution. In the future, we may attempt to increase our capital resources by making additional offerings of debt or equity securities, including commercial paper, medium-term notes, senior or subordinated notes and classes of preferred or common stock. Upon liquidation, holders of our debt securities and shares of preferred stock and lenders with respect to other borrowings will receive a distribution of our available assets prior to the holders of our common stock. Additional equity offerings may dilute the holdings of our existing stockholders or reduce the market price of our securities or both. Because our decision to issue securities in any future offering will depend on market conditions and other factors beyond our control, we cannot predict or estimate the amount, timing or nature of our future offerings. Thus, our stockholders bear the risk of our future offerings reducing the market price of our securities and diluting their proportionate ownership.
The market price and trading volume of our common stock may be volatile.
The market price of our common stock may be volatile. In addition, the trading volume in our common stock may fluctuate and cause significant price variations to occur. If the market price of our common stock declines significantly, you may be unable to resell your shares at or above the price at which they traded when you acquired them. We cannot assure you that the market price of our common stock will not fluctuate or decline significantly in the future. Some of the factors that could negatively affect the market price of our common stock or result in fluctuations in the market price or trading volume of our common stock include:
|
•
|
actual or anticipated variations in our quarterly operating results;
|
|
•
|
changes in our operations or earnings estimates or publication of research reports about us or the industry;
|
|
•
|
changes in our dividend policy;
|
|
•
|
increases in market interest rates that lead purchasers of our shares to demand a higher yield;
|
|
•
|
changes in market valuations of similar companies;
|
|
•
|
adverse market reaction to any increased indebtedness we incur in the future;
|
19
|
•
|
our ability to comply with applicable financial covenants in our unsecured credit facility, unsecured term loans, unsecured notes, and other loan agreements;
|
|
•
|
additions or departures of key management personnel;
|
|
•
|
actions by institutional stockholders;
|
|
•
|
the realization of any of the other risk factors presented in this report;
|
|
•
|
speculation in the press or investment community; and
|
|
•
|
general U.S. and worldwide market and economic conditions.
|
General Real Estate Risks
Our performance and value are subject to general economic conditions and risks associated with our real estate assets.
The investment returns available from equity investments in real estate depend on the amount of income earned and capital appreciation generated by the properties, as well as the expenses incurred in connection with the properties. If our properties do not generate income sufficient to meet operating expenses, including debt service and capital expenditures, then our ability to pay distributions to our stockholders could be adversely affected. In addition, there are significant expenditures associated with an investment in real estate (such as mortgage payments, real estate taxes and maintenance costs) that generally do not decline when circumstances reduce the income from the property. Income from and the value of our properties may be adversely affected by:
|
•
|
changes in general or local economic climate;
|
|
•
|
the attractiveness of our properties to potential tenants;
|
|
•
|
changes in supply of or demand for similar or competing properties in an area;
|
|
•
|
bankruptcies, financial difficulties or lease defaults by our tenants;
|
|
•
|
changes in interest rates and availability of permanent mortgage funds that may render the sale of a property difficult or unattractive or otherwise reduce returns to stockholders;
|
|
•
|
changes in operating costs and expenses and our ability to control rents;
|
|
•
|
changes in or increased costs of compliance with governmental rules, regulations and fiscal policies, including changes in tax, real estate, environmental and zoning laws, and our potential liability thereunder;
|
|
•
|
our ability to provide adequate maintenance and insurance;
|
|
•
|
changes in the cost or availability of insurance, including coverage for mold or asbestos;
|
|
•
|
unanticipated changes in costs associated with known adverse environmental conditions or retained liabilities for such conditions;
|
|
•
|
periods of high interest rates and tight money supply;
|
|
•
|
tenant turnover;
|
|
•
|
general overbuilding or excess supply in the market; and
|
|
•
|
disruptions in the global supply chain caused by political, regulatory or other factors including terrorism.
|
In addition, periods of economic slowdown or recession, rising interest rates or declining demand for real estate, or public perception that any of these events may occur, would result in a general decrease in rents or an increased occurrence of defaults under existing leases, which would adversely affect our financial condition and results of operations. Future terrorist attacks may result in declining economic activity, which could reduce the demand for, and the value of, our properties. To the extent that future attacks impact our tenants, their businesses similarly could be adversely affected, including their ability to continue to honor their existing leases.
For these and other reasons, we cannot assure you that we will be profitable or that we will realize growth in the value of our real estate properties.
20
Actions by our competitors may decrease or prevent increases in the occupancy and rental rates of our properties.
We compete with other owners, operators and developers of real estate, some of which own properties similar to ours in the same markets and submarkets in which our properties are located. If our competitors offer space at rental rates below current market rates or below the rental rates we currently charge our tenants, we may lose potential tenants, and we may be pressured to reduce our rental rates below those we currently charge in order to retain tenants when our tenants’ leases expire.
A significant portion of our properties have leases that expire in the next three years and we may be unable to renew leases, lease vacant space or re-lease space as leases expire.
Our results of operations, cash flows, cash available for distribution, and the value of our securities would be adversely affected if we are unable to lease, on economically favorable terms, a significant amount of space in our operating properties. As of
December 31, 2016
, leases with respect to approximately
44.8%
(excluding month to month leases, which comprises an additional
0.4%
) of our total annualized base rental revenue will expire before December 31, 2019. We cannot assure you that expiring leases will be renewed or that our properties will be re-leased at base rental rates equal to or above the current market rental rates. In addition, the number of vacant or partially vacant industrial properties in a market or submarket could adversely affect our ability to re‑lease the space at attractive rental rates.
A property that incurs a vacancy could be difficult to sell or re-lease.
A property may incur a vacancy either by the continued default of a tenant under its lease or the expiration of one of our leases. In addition, certain of the properties we acquire may have some level of vacancy at the time of closing. Certain of our properties may be specifically suited to the particular needs of a tenant. We may have difficulty obtaining a new tenant for any vacant space we have in our properties. If the vacancy continues for a long period of time, we may suffer reduced revenue resulting in less cash available to be distributed to stockholders. In addition, the resale value of a property could be diminished because the market value of a particular property will depend principally upon the value of the leases of such property.
We may not have funding for future tenant improvements.
When a tenant at one of our properties does not renew its lease or otherwise vacates its space in one of our buildings, it is likely that, in order to attract one or more new tenants, we will be required to expend funds to construct new tenant improvements in the vacated space. Except with respect to our current reserves for capital expenditures, tenant improvements and leasing commissions, we cannot assure you that we will have adequate sources of funding available to us for such purposes in the future.
Bankruptcy laws will limit our remedies if a tenant becomes bankrupt and rejects the lease and we may be unable to collect balances due on our leases.
If a tenant becomes bankrupt or insolvent, that could diminish the income we receive from that tenant’s lease. Our tenants may experience downturns in their operating results due to adverse changes to their business or economic conditions, and those tenants that are highly leveraged may have a higher possibility of filing for bankruptcy or insolvency. We may not be able to evict a tenant solely because of its bankruptcy. On the other hand, a bankruptcy court might authorize the tenant to terminate its lease with us. If that happens, our claim against the bankrupt tenant for unpaid future rent would be an unsecured prepetition claim subject to statutory limitations, and therefore such amounts received in bankruptcy are likely to be substantially less than the remaining rent we otherwise were owed under the lease. In addition, any claim we have for unpaid past rent could be substantially less than the amount owed. If the lease for such a property is rejected in bankruptcy, our revenue would be reduced and could adversely impact our ability to pay distributions to stockholders.
Real estate investments are not as liquid as other types of investments.
Real estate investments are not as liquid as other types of investments, and this lack of liquidity may limit our ability to react promptly to changes in economic or other conditions. In addition, significant expenditures associated with real estate investments, such as mortgage payments, real estate taxes and maintenance costs, are generally not reduced when circumstances cause a reduction in income from the investments. In addition, we intend to comply with the safe harbor rules relating to the number of properties that can be disposed of in a year, the tax bases and the costs of improvements made to these properties, and other items that enable a REIT to avoid punitive taxation on the sale of assets. Thus, our ability at any time to sell assets or contribute assets to property funds or other entities in which we have an ownership interest may be restricted. This lack of liquidity may limit our ability to vary our portfolio promptly in response to changes in economic or other conditions.
21
Acquired properties may be located in new markets where we may face risks associated with investing in an unfamiliar market.
We have acquired, and may continue to acquire, properties in markets that are new to us. When we acquire properties located in these markets, we may face risks associated with a lack of market knowledge or understanding of the local economy, forging new business relationships in the area and unfamiliarity with local government and permitting procedures.
Uninsured losses relating to real property may adversely affect your returns.
We attempt to ensure that all of our properties are adequately insured to cover casualty losses. However, there are certain losses, including losses from floods, earthquakes, acts of war, acts of terrorism or riots, that are not generally insured against or that are not generally fully insured against because it is not deemed economically feasible or prudent to do so. In addition, changes in the cost or availability of insurance could expose us to uninsured casualty losses. In the event that any of our properties incurs a casualty loss that is not fully covered by insurance, the value of our assets will be reduced by the amount of any such uninsured loss, and we could experience a significant loss of capital invested and potential revenue in these properties and could potentially remain obligated under any recourse debt associated with the property. Moreover, we, as the indirect general partner of our Operating Partnership, generally will be liable for all of our Operating Partnership’s unsatisfied recourse obligations, including any obligations incurred by our Operating Partnership as the general partner of joint ventures. In addition, we may have no source of funding to repair or reconstruct the damaged property, and we cannot assure you that any such sources of funding will be available to us for such purposes in the future. We evaluate our insurance coverage annually in light of current industry practice through an analysis prepared by outside consultants.
Contingent or unknown liabilities could adversely affect our financial condition.
As part of the formation transactions related to our IPO, we assumed existing liabilities of contributed operating companies and liabilities in connection with contributed properties, some of which may be unknown or unquantifiable. Unknown liabilities might include liabilities for cleanup or remediation of undisclosed environmental conditions beyond the scope of our environmental insurance coverage, claims of tenants, vendors or other persons dealing with the entities prior to our IPO, tax liabilities, and accrued but unpaid liabilities whether incurred in the ordinary course of business or otherwise. In addition, we may in the future acquire properties, or may have previously owned properties, subject to liabilities and without any recourse, or with only limited recourse, with respect to unknown liabilities. As a result, if a liability were asserted against us based on ownership of any of these entities or properties, then we might have to pay substantial sums to settle it, which could adversely affect our cash flows.
Environmentally hazardous conditions may adversely affect our operating results.
Under various federal, state and local environmental laws, a current or previous owner or operator of real property may be liable for the cost of removing or remediating hazardous or toxic substances on such property. Such laws often impose liability whether or not the owner or operator knew of, or was responsible for, the presence of such hazardous or toxic substances. Even if more than one person may have been responsible for the contamination, each person covered by the environmental laws may be held responsible for all of the clean‑up costs incurred. In addition, third parties may sue the owner or operator of a site for damages based on personal injury, natural resources or property damage or other costs, including investigation and clean‑up costs, resulting from the environmental contamination. The presence of hazardous or toxic substances on one of our properties, or the failure to properly remediate a contaminated property, could give rise to a lien in favor of the government for costs it may incur to address the contamination, or otherwise adversely affect our ability to sell or lease the property or borrow using the property as collateral. Environmental laws also may impose restrictions on the manner in which property may be used or businesses may be operated. A property owner who violates environmental laws may be subject to sanctions which may be enforced by governmental agencies or, in certain circumstances, private parties. In connection with the acquisition and ownership of our properties, we may be exposed to such costs. The cost of defending against environmental claims, of compliance with environmental regulatory requirements or of remediating any contaminated property could materially adversely affect our business, assets or results of operations and, consequently, amounts available for distribution to our stockholders.
Environmental laws in the U.S. also require that owners or operators of buildings containing asbestos properly manage and maintain the asbestos, adequately inform or train those who may come into contact with asbestos and undertake special precautions, including removal or other abatement, in the event that asbestos is disturbed during building renovation or demolition. These laws may impose fines and penalties on building owners or operators who fail to comply with these requirements and may allow third parties to seek recovery from owners or operators for personal injury associated with exposure to asbestos. Some of our properties contain asbestos‑containing building materials.
We invest in properties historically used for industrial, light manufacturing and commercial purposes. Some of these properties contain, or may have contained, underground storage tanks for the storage of petroleum products and other hazardous or toxic substances. All of these operations create a potential for the release of petroleum products or other hazardous or toxic substances. Some of our properties are adjacent to or near other properties that have contained or currently contain underground storage tanks
22
used to store petroleum products or other hazardous or toxic substances. In addition, certain of our properties are on or are adjacent to or near other properties upon which others, including former owners or tenants of our properties, have engaged, or may in the future engage, in activities that may release petroleum products or other hazardous or toxic substances.
From time to time, we may acquire properties, or interests in properties, with known adverse environmental conditions where we believe that the environmental liabilities associated with these conditions are quantifiable and that the acquisition will yield a superior risk‑adjusted return. In such an instance, we underwrite the costs of environmental investigation, clean‑up and monitoring into the cost. Further, in connection with property dispositions, we may agree to remain responsible for, and to bear the cost of, remediating or monitoring certain environmental conditions on the properties.
Before acquiring a property, we typically obtain a preliminary assessment of environmental conditions at the property that meets certain specifications, often referred to as “Phase I environmental site assessment” or “Phase I environmental assessment.” It is intended to discover and evaluate information regarding the environmental condition of the surveyed property and surrounding properties. A Phase I environmental assessment generally includes an historical review, a public records review, an investigation of the surveyed site and surrounding properties, and preparation and issuance of a written report, but does not include soil sampling or subsurface investigations and typically does not include an asbestos survey. Material environmental conditions, liabilities or compliance concerns may arise after the environmental assessment has been completed. Moreover, there can be no assurance that:
|
•
|
future laws, ordinances or regulations will not impose any material environmental liability; or
|
|
•
|
the current environmental condition of our properties will not be affected by tenants, by the condition of land or operations in the vicinity of our properties (such as releases from underground storage tanks), or by third parties unrelated to us.
|
Compliance or failure to comply with the Americans with Disabilities Act and other similar regulations could result in substantial costs.
Under the ADA, places of public accommodation must meet certain federal requirements related to access and use by disabled persons. Noncompliance could result in the imposition of fines by the federal government or the award of damages to private litigants. If we are required to make unanticipated expenditures to comply with the ADA, including removing access barriers, then our cash flows and the amounts available for distributions to our stockholders may be adversely affected. While we believe that our properties are currently in material compliance with these regulatory requirements, the requirements may change or new requirements may be imposed that could require significant unanticipated expenditures.
Some of our properties are subject to a ground lease that exposes us to the loss of such property upon breach or termination of the ground lease and may limit our ability to sell the property.
We own some properties through leasehold interests in the land underlying the building and we may acquire additional buildings in the future that are subject to similar ground leases. As lessee under a ground lease, we are exposed to the possibility of losing the property upon expiration, or an earlier breach by us, of the ground lease.
In the future, our ground leases may contain certain provisions that may limit our ability to sell certain of our properties. In addition, in the future, in order to assign or transfer our rights and obligations under certain of our ground leases, we may be required to obtain the consent of the landlord which, in turn, could adversely impact the price realized from any such sale.
We also own properties that benefit from payment in lieu of tax (“PILOT”) programs or similar programs and to facilitate such tax treatment our ownership in this property is structured as a leasehold interest with the relevant municipality serving as lessor. With respect to such arrangements, we have the right to purchase the fee interest in the property for a nominal purchase price, so the risk factors set forth above for traditional ground leases are mitigated by our ability to convert such leasehold interests to fee interests. In the event of such a conversion of our ownership interests, however, any preferential tax treatment offered by the PILOT programs will be lost.
We may be unable to sell a property if or when we decide to do so, including as a result of uncertain market conditions.
We expect to hold the various real properties in which we invest until such time as we decide that a sale or other disposition is appropriate given our investment objectives. Our ability to dispose of properties on advantageous terms depends on factors beyond our control, including competition from other sellers and the availability of attractive financing for potential buyers of our properties. We cannot predict the various market conditions affecting real estate investments which will exist at any particular time in the future. Due to the uncertainty of market conditions which may affect the future disposition of our properties, we cannot assure you that we will be able to sell our properties at a profit in the future. Accordingly, the extent to which you will receive cash distributions and realize potential appreciation on our real estate investments will be dependent upon fluctuating market conditions.
23
Furthermore, we may be required to expend funds to correct defects or to make improvements before a property can be sold. We cannot assure you that we will have funds available to correct such defects or to make such improvements.
If we sell properties and provide financing to purchasers, defaults by the purchasers would adversely affect our cash flows.
If we decide to sell any of our properties, we presently intend to use our best efforts to sell them for cash. However, in some instances we may sell our properties by providing financing to purchasers. If we provide financing to purchasers, we will bear the risk that the purchaser may default, which could negatively impact our cash distributions to stockholders and result in litigation and related expenses. Even in the absence of a purchaser default, the distribution of the proceeds of sales to our stockholders, or their reinvestment in other assets, will be delayed until the promissory notes or other property we may accept upon a sale are actually paid, sold, refinanced or otherwise disposed of.
Our operating results and financial condition could be adversely affected if we are unable to make required payments on our debt.
Our charter and bylaws do not limit the amount or percentage of indebtedness that we may incur, and we are subject to risks normally associated with debt financing, including the risk that our cash flows will be insufficient to meet required payments of principal and interest. There can be no assurance that we will be able to refinance any maturing indebtedness, that such refinancing would be on terms as favorable as the terms of the maturing indebtedness or that we will be able to otherwise obtain funds by selling assets or raising equity to make required payments on maturing indebtedness.
In particular, loans obtained to fund property acquisitions may be secured by first mortgages on such properties. If we are unable to make our debt service payments as required, a lender could foreclose on the property or properties securing its debt. This could cause us to lose part or all of our investment. Certain of our existing secured indebtedness is, and future secured indebtedness may be, cross-collateralized and, consequently, a default on this indebtedness could cause us to lose part or all of our investment in multiple properties.
Increases in interest rates could increase the amount of our debt payments and adversely affect our ability to make distributions to our stockholders.
As of
December 31, 2016
, we had total outstanding debt of approximately
$1.0 billion
, including
$28.0 million
of debt subject to variable interest rates (excluding amounts that were hedged to fix rates), and we expect that we will incur additional indebtedness in the future. Interest we pay reduces our cash available for distributions. Since we have incurred and may continue to incur variable rate debt, increases in interest rates raise our interest costs, which reduces our cash flows and our ability to make distributions to you. If we are unable to refinance our indebtedness at maturity or meet our payment obligations, the amount of our distributable cash flows and our financial condition would be adversely affected, and we may lose the property securing such indebtedness. In addition, if we need to repay existing debt during periods of rising interest rates, we could be required to sell one or more of our properties at times which may not permit realization of the maximum return on such investments.
Covenants in our unsecured credit facility, unsecured term loans, unsecured notes and mortgage notes and any future debt instruments could limit our flexibility, prevent us from paying distributions, and adversely affect our financial condition or our status as a REIT.
The terms of certain of our mortgage notes require us to comply with loan-to-collateral-value ratios, debt service coverage ratios and, in the case of an event of default, limitations on the ability of our subsidiaries that are borrowers under our mortgage notes to make distributions to us or our other subsidiaries. In addition, our unsecured credit facility, unsecured term loans and unsecured notes require us to comply with loan-to-collateral-value ratios, debt service coverage ratios, leverage ratios, recourse indebtedness thresholds, fixed charge coverage ratios and tangible net worth thresholds and limits. Our existing loan covenants may reduce flexibility in our operations, and breaches of these covenants could result in defaults under the instruments governing the applicable indebtedness even if we have satisfied our payment obligations. In addition, upon a default, our unsecured credit facility, unsecured term loans and unsecured notes, will limit, among other things, our ability to pay dividends, even if we are otherwise in compliance with our financial covenants. Other indebtedness that we may incur in the future may contain financial or other covenants more restrictive than those in our unsecured credit facility, unsecured term loans, unsecured notes and mortgage notes.
In addition, as of
December 31, 2016
, we had certain secured loans that are cross-collateralized by multiple properties. If we default on any of these loans we may then be required to repay such indebtedness, together with applicable prepayment charges, to avoid foreclosure on all cross-collateralized properties within the applicable pool. Moreover, our unsecured credit facility, unsecured term loans and unsecured notes contain, and future borrowing facilities may contain, certain cross-default provisions which are triggered in the event that our other material indebtedness is in default. These cross-default provisions may require us
24
to repay or restructure the facilities in addition to any mortgage or other debt that is in default. If our properties were foreclosed upon, or if we are unable to refinance our indebtedness at maturity or meet our payment obligations, we would be adversely affected.
We are a holding company and conduct all of our operations through our Operating Partnership. We do not have, apart from our ownership of our Operating Partnership, any independent operations. As a result, we will rely on distributions from our Operating Partnership to pay any dividends we might declare on our securities. We will also rely on distributions from our Operating Partnership to meet our debt service and other obligations, including our obligations to make distributions required to maintain our REIT status. The ability of subsidiaries of our Operating Partnership to make distributions to our Operating Partnership, and the ability of our Operating Partnership to make distributions to us in turn, will depend on their operating results and on the terms of any loans that encumber the properties owned by them. Such loans may contain lockbox arrangements, reserve requirements, financial covenants and other provisions that restrict the distribution of funds. In the event of a default under these loans, the defaulting subsidiary would be prohibited from distributing cash. For example, our subsidiaries are party to mortgage notes that prohibit, in the event of default, their distribution of any cash to a related party, including our Operating Partnership. As a result, a default under any of these loans by the borrower subsidiaries could cause us to have insufficient cash to make the distributions required to maintain our REIT status.
Financing arrangements involving balloon payment obligations may adversely affect us.
Most of our financing arrangements require us to make a lump-sum or “balloon” payment at maturity. Our ability to make a balloon payment at maturity is uncertain and, in the event that we do not have sufficient funds to repay the debt at maturity of these loans, we will need to refinance this debt. If the credit environment is constrained at the time the balloon payment is due, we may not be able to refinance the existing financing on acceptable terms and may be forced to choose from a number of unfavorable options. These options include agreeing to otherwise unfavorable financing terms on one or more of our unencumbered assets, selling one or more properties on disadvantageous terms or defaulting on the loan and permitting the lender to foreclose. The effect of a refinancing or sale could affect the rate of return to stockholders and the projected time of disposition of our assets. In addition, payments of principal and interest made to service our debts may leave us with insufficient cash to pay the distributions that we are required to pay to maintain our qualification as a REIT.
If mortgage debt or unsecured debt is unavailable at reasonable rates, we may not be able to finance or refinance our properties.
If mortgage debt or unsecured debt is unavailable at reasonable rates, we may not be able to finance the purchase of properties. In addition, we run the risk of being unable to refinance mortgage debt or unsecured debt when the loans come due or of being unable to refinance such debt on favorable terms. If interest rates are higher when we refinance such debt, our net income could be reduced. We may be unable to refinance such debt at appropriate times, which may require us to sell properties on terms that are not advantageous to us or could result in the foreclosure of any mortgaged properties. In addition, we locked in our fixed-rate debt at a point in time when we were able to obtain favorable interest rates, principal amortization and other terms. When we refinance our debt, prevailing interest rates and other factors may result in paying a greater amount of debt service, which will adversely affect our cash flow, and, consequently, our cash available for distribution to our stockholders.
Our hedging strategies may not be successful in mitigating our risks associated with interest rates and could reduce the overall returns on your investment.
We use various derivative financial instruments to provide a level of protection against interest rate risks, but no hedging strategy can protect us completely. These instruments involve risks, such as the risk that the counterparties may fail to honor their obligations under these arrangements, that these arrangements may not be effective in reducing our exposure to interest rate changes and that a court could rule that such agreements are not legally enforceable. These instruments may also generate income that may not be treated as qualifying REIT income for purposes of the 75% or 95% REIT income tests. In addition, the nature and timing of hedging transactions may influence the effectiveness of our hedging strategies. Poorly designed strategies or improperly executed transactions could actually increase our risk and losses. Moreover, hedging strategies involve transaction and other costs. We cannot assure you that our hedging strategy and the derivatives that we use will adequately offset the risk of interest rate volatility or that our hedging transactions will not result in losses that may reduce the overall return on your investment.
25
U.S. Federal Income Tax Risks
Failure to qualify as a REIT would reduce our net earnings available for investment or distribution.
Our qualification as a REIT will depend upon our ability to meet requirements regarding our organization and ownership, distributions of our income, the nature and diversification of our income and assets and other tests imposed by the Code. If we fail to qualify as a REIT for any taxable year after electing REIT status, we will be subject to federal income tax on our taxable income at regular corporate rates. In addition, we would generally be disqualified from treatment as a REIT for the four taxable years following the year in which we failed to qualify as a REIT. Losing our REIT status would reduce our net earnings available for investment or distribution to stockholders because of the additional tax liability. In addition, dividends to stockholders would no longer qualify for the dividends‑paid deduction and we would no longer be required to make distributions. If this occurs, we might be required to borrow funds or liquidate some investments in order to pay the applicable tax.
Even if we qualify as a REIT for federal income tax purposes, we may be subject to other tax liabilities that reduce our cash flow and our ability to make distributions to our stockholders.
Even if we qualify as a REIT for federal income tax purposes, we may be subject to some federal, state and local taxes on our income or property. For example:
|
•
|
To qualify as a REIT, we must distribute annually at least 90% of our REIT taxable income to our stockholders (which is determined without regard to the dividends-paid deduction or net capital gain). To the extent that we satisfy the distribution requirement but distribute less than 100% of our REIT taxable income, we will be subject to federal corporate income tax on the undistributed income.
|
|
•
|
We will be subject to a 4% nondeductible excise tax on the amount, if any, by which distributions we pay in any calendar year are less than the sum of 85% of our ordinary income, 95% of our capital gain net income and 100% of our undistributed income from prior years.
|
|
•
|
If we have net income from the sale of foreclosure property that we hold primarily for sale to customers in the ordinary course of business or other non‑qualifying income from foreclosure property, we must pay a tax on that income at the highest corporate income tax rate.
|
|
•
|
If we sell an asset, other than foreclosure property, that we hold primarily for sale to customers in the ordinary course of business, our gain would be subject to the 100% “prohibited transaction” tax unless such sale were made by our taxable REIT subsidiary (“TRS”) or if we qualify for a safe harbor from tax.
|
We intend to make distributions to our stockholders to comply with the REIT requirements of the Code.
REIT distribution requirements could adversely affect our ability to execute our business plan.
From time to time, we may generate taxable income greater than our income for financial reporting purposes, or our taxable income may be greater than our cash flow available for distribution to stockholders. If we do not have other funds available in these situations, we could be required to borrow funds, sell investments at disadvantageous prices, make taxable distributions of our stock or debt securities or find another alternative source of funds to make distributions sufficient to enable us to pay out enough of our taxable income to satisfy the REIT distribution requirement and to avoid corporate income tax and the 4% excise tax in a particular year. These alternatives could increase our costs or reduce the value of our equity. Thus, compliance with the REIT requirements may hinder our ability to operate solely on the basis of maximizing profits.
To maintain our REIT status, we may be forced to forego otherwise attractive opportunities, which may delay or hinder our ability to meet our investment objectives and reduce our stockholders’ overall return.
To qualify as a REIT, we must satisfy certain tests on an ongoing basis concerning, among other things, the sources of our income, nature of our assets and the amounts we distribute to our stockholders. We may be required to make distributions to stockholders at times when it would be more advantageous to reinvest cash in our business or when we do not have funds readily available for distribution. Compliance with the REIT requirements may hinder our ability to operate solely on the basis of maximizing profits and the value of our stockholders’ investment.
Recharacterization of sale‑leaseback transactions may cause us to lose our REIT status.
In certain circumstances, we expect to purchase real properties and lease them back to the sellers of such properties. While we intend to structure any such sale‑leaseback transaction such that the lease will be characterized as a “true lease” for tax purposes, thereby allowing us to be treated as the owner of the property for federal income tax purposes, we cannot assure you that the
26
Internal Revenue Service (“IRS”) will not challenge such characterization. In the event that any such sale‑leaseback transaction is challenged and recharacterized as a financing transaction or loan for federal income tax purposes, deductions for depreciation and cost recovery relating to such property would be disallowed. If a sale‑leaseback transaction were so recharacterized, we might fail to satisfy the REIT qualification “asset tests” or “income tests” and, consequently, lose our REIT status effective with the year of recharacterization. Alternatively, the amount of our REIT taxable income could be recalculated which might also cause us to fail to meet the distribution requirement for a taxable year.
We may be subject to adverse legislative or regulatory tax changes.
The rules dealing with federal income taxation are constantly under review by persons involved in the legislative process and by the IRS and the U.S. Department of the Treasury. Changes to the tax laws, with or without retroactive application, could adversely affect our stockholders or us. We cannot predict how changes in the tax laws might affect our stockholders or us. New legislation, Treasury Regulations, administrative interpretations or court decisions could significantly and negatively affect our ability to qualify as a REIT or the federal income tax consequences of such qualification, or may reduce the relative attractiveness of an investment in a REIT compared to a corporation not qualified as a REIT.
Item 1B. Unresolved
Staff Comments
None.
Item 2. Properties
Our target properties fit into two general categories:
|
•
|
Warehouse/Distribution—properties generally 200,000 to 1,000,000 square feet in size with ceiling heights between 22 feet and 36 feet and used to store and ship various materials and products.
|
|
•
|
Light Manufacturing—properties generally 75,000 to 250,000 square feet in size with ceiling heights between 16 feet and 22 feet and used to manufacture all types of goods and products.
|
During the year ended
December 31, 2016
, we acquired
47
buildings consisting of approximately
10.3 million
square feet for approximately
$471.8 million
. These acquisitions had a weighted average remaining lease term of approximately
6.5
years as of the acquisition date, weighted by square footage.
27
As of
December 31, 2016
, we owned the properties listed below.
|
State
|
City
|
Number of
Buildings
|
Asset Type
(1)
|
CBSA
(2)
|
Total Rentable
Square Feet
|
|||||||
|
Alabama
|
||||||||||||
|
Montgomery
|
1
|
Warehouse / Distribution
|
Montgomery, AL
|
332,000
|
|
|||||||
|
Phenix City
|
1
|
Warehouse / Distribution
|
Columbus, GA-AL
|
117,568
|
|
|||||||
|
Arkansas
|
||||||||||||
|
Rogers
|
1
|
Warehouse / Distribution
|
Fayetteville-Springdale-Rogers, AR-MO
|
400,000
|
|
|||||||
|
Arizona
|
||||||||||||
|
Phoenix
|
1
|
Warehouse / Distribution
|
Phoenix-Mesa-Scottsdale, AZ
|
102,747
|
|
|||||||
|
California
|
||||||||||||
|
Camarillo
|
2
|
Warehouse / Distribution
|
Oxnard-Thousand Oaks-Ventura, CA
|
732,606
|
|
|||||||
|
Visalia
|
1
|
Warehouse / Distribution
|
Visalia-Porterville, CA
|
635,281
|
|
|||||||
|
Colorado
|
||||||||||||
|
Golden
|
1
|
Warehouse / Distribution
|
Denver-Aurora-Lakewood, CO
|
227,500
|
|
|||||||
|
Grand Junction
|
1
|
Warehouse / Distribution
|
Grand Junction, CO
|
82,800
|
|
|||||||
|
Longmont
|
1
|
Warehouse / Distribution
|
Boulder, CO
|
159,611
|
|
|||||||
|
Connecticut
|
||||||||||||
|
Avon
|
1
|
Light Manufacturing
|
Hartford-West Hartford-East Hartford, CT
|
78,400
|
|
|||||||
|
East Windsor
|
2
|
Warehouse / Distribution
|
Hartford-West Hartford-East Hartford, CT
|
271,111
|
|
|||||||
|
North Haven
|
3
|
Warehouse / Distribution
|
New Haven-Milford, CT
|
824,727
|
|
|||||||
|
Delaware
|
||||||||||||
|
Newark
|
2
|
Flex / Office
|
Philadelphia-Camden-Wilmington, PA-NJ-DE-MD
|
52,665
|
|
|||||||
|
New Castle
|
1
|
Warehouse / Distribution
|
Philadelphia-Camden-Wilmington, PA-NJ-DE-MD
|
485,987
|
|
|||||||
|
Florida
|
||||||||||||
|
Daytona Beach
|
1
|
Light Manufacturing
|
Deltona-Daytona Beach-Ormond Beach, FL
|
142,857
|
|
|||||||
|
Ocala
|
1
|
Warehouse / Distribution
|
Orlando-Kissimmee-Sanford, FL
|
619,466
|
|
|||||||
|
Orlando
|
1
|
Light Manufacturing
|
Orlando-Kissimmee-Sanford, FL
|
215,900
|
|
|||||||
|
Orlando
|
1
|
Warehouse / Distribution
|
Orlando-Kissimmee-Sanford, FL
|
155,000
|
|
|||||||
|
Pensacola
|
1
|
Flex / Office
|
Pensacola-Ferry Pass-Brent, FL
|
30,620
|
|
|||||||
|
Georgia
|
||||||||||||
|
Calhoun
|
1
|
Warehouse / Distribution
|
Calhoun, GA
|
151,200
|
|
|||||||
|
Dallas
|
1
|
Warehouse / Distribution
|
Atlanta-Sandy Springs-Roswell, GA
|
92,807
|
|
|||||||
|
Forest Park
|
2
|
Warehouse / Distribution
|
Atlanta-Sandy Springs-Roswell, GA
|
799,200
|
|
|||||||
|
LaGrange
|
1
|
Warehouse / Distribution
|
LaGrange, GA
|
219,891
|
|
|||||||
|
Norcross
|
1
|
Warehouse / Distribution
|
Atlanta-Sandy Springs-Roswell, GA
|
152,036
|
|
|||||||
|
Savannah
|
1
|
Warehouse / Distribution
|
Savannah, GA
|
504,200
|
|
|||||||
|
Shannon
|
1
|
Warehouse / Distribution
|
Rome, GA
|
568,516
|
|
|||||||
|
Smyrna
|
1
|
Warehouse / Distribution
|
Atlanta-Sandy Springs-Roswell, GA
|
102,000
|
|
|||||||
|
Statham
|
1
|
Warehouse / Distribution
|
Atlanta-Sandy Springs-Roswell, GA
|
225,680
|
|
|||||||
|
Idaho
|
||||||||||||
|
Idaho Falls
|
1
|
Warehouse / Distribution
|
Idaho Falls, ID
|
90,300
|
|
|||||||
|
Pocatello
|
1
|
Flex / Office
|
Pocatello, ID
|
43,353
|
|
|||||||
|
Illinois
|
||||||||||||
|
Belvidere
|
9
|
Warehouse / Distribution
|
Rockford, IL
|
1,133,018
|
|
|||||||
|
DeKalb
|
1
|
Warehouse / Distribution
|
Chicago-Naperville-Elgin, IL-IN-WI
|
146,740
|
|
|||||||
|
Gurnee
|
2
|
Warehouse / Distribution
|
Chicago-Naperville-Elgin, IL-IN-WI
|
562,500
|
|
|||||||
|
Harvard
|
1
|
Light Manufacturing
|
Chicago-Naperville-Elgin, IL-IN-WI
|
126,304
|
|
|||||||
|
Itasca
|
1
|
Warehouse / Distribution
|
Chicago-Naperville-Elgin, IL-IN-WI
|
202,000
|
|
|||||||
|
Libertyville
|
1
|
Warehouse / Distribution
|
Chicago-Naperville-Elgin, IL-IN-WI
|
251,961
|
|
|||||||
|
Libertyville
|
1
|
Flex / Office
|
Chicago-Naperville-Elgin, IL-IN-WI
|
35,141
|
|
|||||||
|
Machesney Park
|
1
|
Warehouse / Distribution
|
Rockford, IL
|
80,000
|
|
|||||||
28
|
State
|
City
|
Number of
Buildings
|
Asset Type
(1)
|
CBSA
(2)
|
Total Rentable
Square Feet
|
|||||||
|
Montgomery
|
1
|
Warehouse / Distribution
|
Chicago-Naperville-Elgin, IL-IN-WI
|
584,301
|
|
|||||||
|
Sauk Village
|
1
|
Warehouse / Distribution
|
Chicago-Naperville-Elgin, IL-IN-WI
|
375,785
|
|
|||||||
|
South Holland
|
1
|
Warehouse / Distribution
|
Chicago-Naperville-Elgin, IL-IN-WI
|
202,902
|
|
|||||||
|
West Chicago
|
1
|
Warehouse / Distribution
|
Chicago-Naperville-Elgin, IL-IN-WI
|
249,470
|
|
|||||||
|
West Chicago
|
5
|
Light Manufacturing
|
Chicago-Naperville-Elgin, IL-IN-WI
|
305,874
|
|
|||||||
|
Wood Dale
|
1
|
Light Manufacturing
|
Chicago-Naperville-Elgin, IL-IN-WI
|
137,607
|
|
|||||||
|
Woodstock
|
1
|
Light Manufacturing
|
Chicago-Naperville-Elgin, IL-IN-WI
|
129,803
|
|
|||||||
|
Indiana
|
||||||||||||
|
Albion
|
7
|
Light Manufacturing
|
Kendallville, IN
|
261,013
|
|
|||||||
|
Elkhart
|
2
|
Warehouse / Distribution
|
Elkhart-Goshen, IN
|
170,100
|
|
|||||||
|
Kendallville
|
1
|
Light Manufacturing
|
Kendallville, IN
|
58,500
|
|
|||||||
|
Fort Wayne
|
1
|
Warehouse / Distribution
|
Fort Wayne, IN
|
108,800
|
|
|||||||
|
Franklin
|
1
|
Warehouse / Distribution
|
Indianapolis-Carmel-Anderson, IN
|
703,496
|
|
|||||||
|
Goshen
|
1
|
Warehouse / Distribution
|
Elkhart-Goshen, IN
|
366,000
|
|
|||||||
|
Lafayette
|
3
|
Warehouse / Distribution
|
Lafayette-West Lafayette, IN
|
466,400
|
|
|||||||
|
Marion
|
1
|
Warehouse / Distribution
|
Marion, IN
|
249,600
|
|
|||||||
|
Portage
|
1
|
Warehouse / Distribution
|
Chicago-Naperville-Elgin, IL-IN-WI
|
212,000
|
|
|||||||
|
South Bend
|
1
|
Warehouse / Distribution
|
South Bend-Mishawaka, IN-MI
|
225,000
|
|
|||||||
|
Iowa
|
||||||||||||
|
Marion
|
1
|
Warehouse / Distribution
|
Cedar Rapids, IA
|
95,500
|
|
|||||||
|
Sergeant Bluff
|
1
|
Flex / Office
|
Sioux City, IA-NE-SD
|
148,131
|
|
|||||||
|
Kansas
|
||||||||||||
|
Lenexa
|
2
|
Warehouse / Distribution
|
Kansas City, MO-KS
|
276,219
|
|
|||||||
|
Olathe
|
1
|
Warehouse / Distribution
|
Kansas City, MO-KS
|
496,373
|
|
|||||||
|
Wichita
|
3
|
Warehouse / Distribution
|
Wichita, KS
|
248,550
|
|
|||||||
|
Kentucky
|
||||||||||||
|
Bardstown
|
1
|
Warehouse / Distribution
|
Louisville/Jefferson County, KY-IN
|
102,318
|
|
|||||||
|
Danville
|
1
|
Warehouse / Distribution
|
Danville, KY
|
757,047
|
|
|||||||
|
Erlanger
|
1
|
Warehouse / Distribution
|
Cincinnati, OH-KY-IN
|
108,620
|
|
|||||||
|
Hebron
|
1
|
Warehouse / Distribution
|
Cincinnati, OH-KY-IN
|
109,000
|
|
|||||||
|
Louisville
|
2
|
Warehouse / Distribution
|
Louisville/Jefferson County, KY-IN
|
497,820
|
|
|||||||
|
Louisiana
|
||||||||||||
|
Shreveport
|
1
|
Warehouse / Distribution
|
Shreveport-Bossier City, LA
|
420,259
|
|
|||||||
|
Maine
|
||||||||||||
|
Belfast
|
5
|
Flex / Office
|
—
|
318,979
|
|
(3)
|
||||||
|
Biddeford
|
2
|
Warehouse / Distribution
|
Portland-South Portland, ME
|
265,126
|
|
|||||||
|
Gardiner
|
1
|
Warehouse / Distribution
|
Augusta-Waterville, ME
|
265,000
|
|
|||||||
|
Lewiston
|
1
|
Flex / Office
|
Lewiston-Auburn, ME
|
60,000
|
|
|||||||
|
Portland
|
1
|
Warehouse / Distribution
|
Portland-South Portland, ME
|
100,600
|
|
|||||||
|
Maryland
|
||||||||||||
|
Hampstead
|
1
|
Warehouse / Distribution
|
Baltimore-Columbia-Towson, MD
|
1,035,249
|
|
|||||||
|
Sparks
|
2
|
Flex / Office
|
Baltimore-Columbia-Towson, MD
|
34,800
|
|
|||||||
|
Massachusetts
|
||||||||||||
|
Chicopee
|
1
|
Warehouse / Distribution
|
Springfield, MA
|
217,000
|
|
|||||||
|
Malden
|
2
|
Light Manufacturing
|
Boston-Cambridge-Newton, MA-NH
|
109,943
|
|
|||||||
|
Norton
|
1
|
Warehouse / Distribution
|
Providence-Warwick, RI-MA
|
200,000
|
|
|||||||
|
Stoughton
|
2
|
Warehouse / Distribution
|
Boston-Cambridge-Newton, MA-NH
|
258,213
|
|
|||||||
|
Westborough
|
1
|
Warehouse / Distribution
|
Worcester, MA-CT
|
121,700
|
|
|||||||
|
Michigan
|
||||||||||||
|
Chesterfield
|
4
|
Warehouse / Distribution
|
Detroit-Warren-Dearborn, MI
|
478,803
|
|
|||||||
|
Grand Rapids
|
1
|
Warehouse / Distribution
|
Grand Rapids-Wyoming, MI
|
301,317
|
|
|||||||
29
|
State
|
City
|
Number of
Buildings
|
Asset Type
(1)
|
CBSA
(2)
|
Total Rentable
Square Feet
|
|||||||
|
Holland
|
1
|
Warehouse / Distribution
|
Grand Rapids-Wyoming, MI
|
195,000
|
|
|||||||
|
Holland
|
1
|
Light Manufacturing
|
Holland, MI
|
177,062
|
|
|||||||
|
Kentwood
|
1
|
Light Manufacturing
|
Grand Rapids-Wyoming, MI
|
85,157
|
|
|||||||
|
Lansing
|
4
|
Warehouse / Distribution
|
Lansing-East Lansing, MI
|
770,425
|
|
|||||||
|
Marshall
|
1
|
Light Manufacturing
|
Battle Creek, MI
|
57,025
|
|
|||||||
|
Novi
|
2
|
Warehouse / Distribution
|
Detroit-Warren-Dearborn, MI
|
245,860
|
|
|||||||
|
Plymouth
|
1
|
Warehouse / Distribution
|
Detroit-Warren-Dearborn, MI
|
125,214
|
|
|||||||
|
Sterling Heights
|
1
|
Warehouse / Distribution
|
Detroit-Warren-Dearborn, MI
|
108,000
|
|
|||||||
|
Walker
|
1
|
Warehouse / Distribution
|
Grand Rapids-Wyoming, MI
|
210,000
|
|
|||||||
|
Warren
|
1
|
Warehouse / Distribution
|
Detroit-Warren-Dearborn, MI
|
268,000
|
|
|||||||
|
Minnesota
|
||||||||||||
|
Brooklyn Park
|
1
|
Warehouse / Distribution
|
Minneapolis-St. Paul-Bloomington, MN-WI
|
200,720
|
|
|||||||
|
Carlos
|
1
|
Light Manufacturing
|
Alexandria, MN
|
196,270
|
|
|||||||
|
New Hope
|
1
|
Light Manufacturing
|
Minneapolis-St. Paul-Bloomington, MN-WI
|
107,348
|
|
|||||||
|
Rogers
|
1
|
Warehouse / Distribution
|
Minneapolis-St. Paul-Bloomington, MN-WI
|
386,724
|
|
|||||||
|
Savage
|
1
|
Warehouse / Distribution
|
Minneapolis-St. Paul-Bloomington, MN-WI
|
244,050
|
|
|||||||
|
Missouri
|
||||||||||||
|
Earth City
|
1
|
Warehouse / Distribution
|
St. Louis, MO-IL
|
116,783
|
|
|||||||
|
Hazlewood
|
1
|
Warehouse / Distribution
|
St. Louis, MO-IL
|
305,550
|
|
|||||||
|
Kansas City
|
1
|
Warehouse / Distribution
|
Kansas City, MO-KS
|
226,576
|
|
|||||||
|
O'Fallon
|
1
|
Warehouse / Distribution
|
St. Louis, MO-IL
|
77,000
|
|
|||||||
|
Nevada
|
||||||||||||
|
Reno
|
1
|
Light Manufacturing
|
Reno, NV
|
87,264
|
|
|||||||
|
New Hampshire
|
||||||||||||
|
Londonderry
|
1
|
Warehouse / Distribution
|
Boston-Cambridge-Newton, MA-NH
|
125,060
|
|
|||||||
|
Nashua
|
1
|
Warehouse / Distribution
|
Manchester-Nashua, NH
|
337,391
|
|
|||||||
|
New Jersey
|
||||||||||||
|
Burlington
|
2
|
Warehouse / Distribution
|
Philadelphia-Camden-Wilmington, PA-NJ-DE-MD
|
1,552,121
|
|
|||||||
|
Lopatcong
|
1
|
Warehouse / Distribution
|
Allentown-Bethlehem-Easton, PA-NJ
|
87,500
|
|
|||||||
|
Piscataway
|
1
|
Warehouse / Distribution
|
New York-Newark-Jersey City, NY-NJ-PA
|
228,000
|
|
|||||||
|
New York
|
||||||||||||
|
Buffalo
|
1
|
Warehouse / Distribution
|
Buffalo-Cheektowaga-Niagara Falls, NY
|
117,000
|
|
|||||||
|
Cheektowaga
|
1
|
Warehouse / Distribution
|
Buffalo-Cheektowaga-Niagara Falls, NY
|
121,760
|
|
|||||||
|
Farmington
|
1
|
Warehouse / Distribution
|
Rochester, NY
|
149,657
|
|
|||||||
|
Gloversville
|
3
|
Warehouse / Distribution
|
Gloversville, NY
|
211,554
|
|
|||||||
|
Johnstown
|
3
|
Warehouse / Distribution
|
Gloversville, NY
|
169,602
|
|
|||||||
|
Johnstown
|
1
|
Light Manufacturing
|
Gloversville, NY
|
42,325
|
|
|||||||
|
North Carolina
|
||||||||||||
|
Charlotte
|
4
|
Warehouse / Distribution
|
Charlotte-Concord-Gastonia, NC-SC
|
884,276
|
|
|||||||
|
Charlotte
|
1
|
Light Manufacturing
|
Charlotte-Concord-Gastonia, NC-SC
|
104,852
|
|
|||||||
|
Durham
|
1
|
Warehouse / Distribution
|
Durham-Chapel Hill, NC
|
80,600
|
|
|||||||
|
Huntersville
|
1
|
Warehouse / Distribution
|
Charlotte-Concord-Gastonia, NC-SC
|
185,570
|
|
|||||||
|
Lexington
|
1
|
Warehouse / Distribution
|
Winston-Salem, NC
|
201,800
|
|
|||||||
|
Mebane
|
2
|
Warehouse / Distribution
|
Burlington, NC
|
606,840
|
|
|||||||
|
Mebane
|
1
|
Light Manufacturing
|
Burlington, NC
|
202,691
|
|
|||||||
|
Mooresville
|
1
|
Warehouse / Distribution
|
Charlotte-Concord-Gastonia, NC-SC
|
300,000
|
|
|||||||
|
Mountain Home
|
1
|
Warehouse / Distribution
|
Asheville, NC
|
146,014
|
|
|||||||
|
Newton
|
1
|
Warehouse / Distribution
|
Hickory-Lenoir-Morganton, NC
|
187,200
|
|
|||||||
|
Pineville
|
1
|
Light Manufacturing
|
Charlotte-Concord-Gastonia, NC-SC
|
75,400
|
|
|||||||
|
Rural Hall
|
1
|
Warehouse / Distribution
|
Winston-Salem, NC
|
250,000
|
|
|||||||
30
|
State
|
City
|
Number of
Buildings
|
Asset Type
(1)
|
CBSA
(2)
|
Total Rentable
Square Feet
|
|||||||
|
Smithfield
|
1
|
Warehouse / Distribution
|
Raleigh, NC
|
191,450
|
|
|||||||
|
Winston-Salem
|
1
|
Warehouse / Distribution
|
Winston-Salem, NC
|
385,000
|
|
|||||||
|
Ohio
|
||||||||||||
|
Boardman
|
1
|
Warehouse / Distribution
|
Youngstown-Warren-Boardman, OH-PA
|
175,900
|
|
|||||||
|
Boardman
|
1
|
Light Manufacturing
|
Youngstown-Warren-Boardman, OH-PA
|
95,000
|
|
|||||||
|
Cincinnati
|
1
|
Flex / Office
|
Cincinnati, OH-KY-IN
|
114,532
|
|
|||||||
|
Columbus
|
1
|
Warehouse / Distribution
|
Columbus, OH
|
186,000
|
|
|||||||
|
Dayton
|
1
|
Warehouse / Distribution
|
Dayton, OH
|
205,761
|
|
|||||||
|
Fairborn
|
1
|
Warehouse / Distribution
|
Dayton, OH
|
258,680
|
|
|||||||
|
Fairfield
|
1
|
Warehouse / Distribution
|
Cincinnati, OH-KY-IN
|
206,448
|
|
|||||||
|
Gahanna
|
1
|
Warehouse / Distribution
|
Columbus, OH
|
383,000
|
|
|||||||
|
Grove City
|
1
|
Warehouse / Distribution
|
Columbus, OH
|
175,512
|
|
|||||||
|
Hamilton
|
1
|
Warehouse / Distribution
|
Cincinnati, OH-KY-IN
|
245,000
|
|
|||||||
|
Macedonia
|
1
|
Warehouse / Distribution
|
Akron, OH
|
201,519
|
|
|||||||
|
Mason
|
1
|
Light Manufacturing
|
Cincinnati, OH-KY-IN
|
116,200
|
|
|||||||
|
North Jackson
|
1
|
Warehouse / Distribution
|
Youngstown-Warren-Boardman, OH-PA
|
209,835
|
|
|||||||
|
North Jackson
|
1
|
Redevelopment
|
Youngstown-Warren-Boardman, OH-PA
|
307,315
|
|
|||||||
|
Oakwood Village
|
1
|
Warehouse / Distribution
|
Cleveland-Elyria, OH
|
75,000
|
|
|||||||
|
Salem
|
1
|
Light Manufacturing
|
Salem, OH
|
271,000
|
|
|||||||
|
Seville
|
2
|
Warehouse / Distribution
|
Cleveland-Elyria, OH
|
345,000
|
|
|||||||
|
Springfield
|
1
|
Warehouse / Distribution
|
Springfield, OH
|
350,500
|
|
|||||||
|
Streetsboro
|
1
|
Warehouse / Distribution
|
Akron, OH
|
343,416
|
|
|||||||
|
Strongsville
|
1
|
Warehouse / Distribution
|
Cleveland-Elyria, OH
|
161,984
|
|
|||||||
|
Toledo
|
1
|
Warehouse / Distribution
|
Toledo, OH
|
177,500
|
|
|||||||
|
Twinsburg
|
1
|
Warehouse / Distribution
|
Akron, OH
|
150,974
|
|
|||||||
|
West Chester
|
1
|
Warehouse / Distribution
|
Cincinnati, OH-KY-IN
|
269,868
|
|
|||||||
|
Oklahoma
|
||||||||||||
|
Oklahoma City
|
2
|
Warehouse / Distribution
|
Oklahoma City, OK
|
303,740
|
|
|||||||
|
Catoosa
|
1
|
Light Manufacturing
|
Tulsa, OK
|
100,100
|
|
|||||||
|
Tulsa
|
1
|
Warehouse / Distribution
|
Tulsa, OK
|
175,000
|
|
|||||||
|
Oregon
|
||||||||||||
|
Salem
|
2
|
Light Manufacturing
|
Salem, OR
|
155,900
|
|
|||||||
|
Pennsylvania
|
||||||||||||
|
Allentown
|
1
|
Warehouse / Distribution
|
Allentown-Bethlehem-Easton, PA-NJ
|
289,900
|
|
|||||||
|
Elizabethtown
|
1
|
Warehouse / Distribution
|
Lancaster, PA
|
206,236
|
|
|||||||
|
Lancaster
|
1
|
Warehouse / Distribution
|
Lancaster, PA
|
240,529
|
|
|||||||
|
Langhorne
|
1
|
Warehouse / Distribution
|
Philadelphia-Camden-Wilmington, PA-NJ-DE-MD
|
102,000
|
|
|||||||
|
Langhorne
|
2
|
Light Manufacturing
|
Philadelphia-Camden-Wilmington, PA-NJ-DE-MD
|
287,647
|
|
|||||||
|
Mechanicsburg
|
3
|
Warehouse / Distribution
|
Harrisburg-Carlisle, PA
|
747,054
|
|
|||||||
|
Muhlenberg Townsh
|
1
|
Warehouse / Distribution
|
Reading, PA
|
394,289
|
|
|||||||
|
New Kingston
|
1
|
Warehouse / Distribution
|
Harrisburg-Carlisle, PA
|
330,000
|
|
|||||||
|
O'Hara Township
|
1
|
Warehouse / Distribution
|
Pittsburgh, PA
|
887,084
|
|
|||||||
|
Reading
|
1
|
Warehouse / Distribution
|
Reading, PA
|
248,000
|
|
|||||||
|
Williamsport
|
1
|
Warehouse / Distribution
|
Williamsport, PA
|
250,000
|
|
|||||||
|
South Carolina
|
||||||||||||
|
Columbia
|
1
|
Light Manufacturing
|
Columbia, SC
|
185,600
|
|
|||||||
|
Duncan
|
2
|
Warehouse / Distribution
|
Spartanburg, SC
|
787,380
|
|
|||||||
|
Edgefield
|
1
|
Light Manufacturing
|
Augusta-Richmond County, GA-SC
|
126,190
|
|
|||||||
|
Fountain Inn
|
1
|
Warehouse / Distribution
|
Greenville-Anderson-Mauldin, SC
|
168,087
|
|
|||||||
31
|
State
|
City
|
Number of
Buildings
|
Asset Type
(1)
|
CBSA
(2)
|
Total Rentable
Square Feet
|
|||||||
|
Graniteville
|
1
|
Warehouse / Distribution
|
Augusta-Richmond County, GA-SC
|
450,000
|
|
|||||||
|
Greenville
|
1
|
Warehouse / Distribution
|
Greenville-Anderson-Mauldin, SC
|
157,500
|
|
|||||||
|
Greenwood
|
2
|
Light Manufacturing
|
Greenwood, SC
|
175,055
|
|
|||||||
|
Greer
|
4
|
Warehouse / Distribution
|
Greenville-Anderson-Mauldin, SC
|
290,000
|
|
|||||||
|
Laurens
|
1
|
Warehouse / Distribution
|
Greenville-Anderson-Mauldin, SC
|
125,000
|
|
|||||||
|
Piedmont
|
3
|
Warehouse / Distribution
|
Greenville-Anderson-Mauldin, SC
|
400,000
|
|
|||||||
|
Rock Hill
|
1
|
Warehouse / Distribution
|
Charlotte-Concord-Gastonia, NC-SC
|
315,520
|
|
|||||||
|
Simpsonville
|
2
|
Warehouse / Distribution
|
Greenville-Anderson-Mauldin, SC
|
411,994
|
|
|||||||
|
Spartanburg
|
6
|
Warehouse / Distribution
|
Spartanburg, SC
|
1,209,260
|
|
|||||||
|
Ware Shoals
|
1
|
Light Manufacturing
|
Greenwood, SC
|
20,514
|
|
|||||||
|
West Columbia
|
3
|
Warehouse / Distribution
|
Columbia, SC
|
569,532
|
|
|||||||
|
South Dakota
|
||||||||||||
|
Rapid City
|
1
|
Flex / Office
|
Rapid City, SD
|
132,365
|
|
|||||||
|
Tennessee
|
||||||||||||
|
Chattanooga
|
3
|
Warehouse / Distribution
|
Chattanooga, TN-GA
|
646,200
|
|
|||||||
|
Cleveland
|
1
|
Warehouse / Distribution
|
Cleveland, TN
|
151,704
|
|
|||||||
|
Clinton
|
1
|
Warehouse / Distribution
|
Knoxville, TN
|
166,000
|
|
|||||||
|
Jackson
|
1
|
Warehouse / Distribution
|
Jackson, TN
|
235,855
|
|
|||||||
|
Jefferson City
|
1
|
Warehouse / Distribution
|
Morristown, TN
|
486,109
|
|
|||||||
|
Knoxville
|
1
|
Warehouse / Distribution
|
Knoxville, TN
|
108,400
|
|
|||||||
|
Loudon
|
1
|
Warehouse / Distribution
|
Knoxville, TN
|
104,000
|
|
|||||||
|
Madison
|
1
|
Warehouse / Distribution
|
Nashville-Davidson--Murfreesboro--Franklin, TN
|
418,406
|
|
|||||||
|
Mascot
|
1
|
Warehouse / Distribution
|
Knoxville, TN
|
130,560
|
|
|||||||
|
Mascot
|
1
|
Light Manufacturing
|
Knoxville, TN
|
130,560
|
|
|||||||
|
Murfreesboro
|
1
|
Warehouse / Distribution
|
Nashville-Davidson--Murfreesboro--Franklin, TN
|
102,505
|
|
|||||||
|
Nashville
|
1
|
Warehouse / Distribution
|
Nashville-Davidson--Murfreesboro--Franklin, TN
|
150,000
|
|
|||||||
|
Portland
|
1
|
Warehouse / Distribution
|
Nashville-Davidson--Murfreesboro--Franklin, TN
|
414,043
|
|
|||||||
|
Vonore
|
1
|
Warehouse / Distribution
|
Knoxville, TN
|
342,700
|
|
|||||||
|
Texas
|
||||||||||||
|
Arlington
|
2
|
Warehouse / Distribution
|
Dallas-Fort Worth-Arlington, TX
|
290,132
|
|
|||||||
|
Cedar Hill
|
1
|
Warehouse / Distribution
|
Dallas-Fort Worth-Arlington, TX
|
420,000
|
|
|||||||
|
El Paso
|
6
|
Warehouse / Distribution
|
El Paso, TX
|
1,404,198
|
|
|||||||
|
Fort Worth
|
1
|
Warehouse / Distribution
|
Dallas-Fort Worth-Arlington, TX
|
101,500
|
|
|||||||
|
Garland
|
1
|
Light Manufacturing
|
Dallas-Fort Worth-Arlington, TX
|
253,900
|
|
|||||||
|
Garland
|
1
|
Warehouse / Distribution
|
Dallas-Fort Worth-Arlington, TX
|
164,914
|
|
|||||||
|
Houston
|
2
|
Warehouse / Distribution
|
Houston-The Woodlands-Sugar Land, TX
|
352,834
|
|
|||||||
|
Houston
|
2
|
Light Manufacturing
|
Houston-The Woodlands-Sugar Land, TX
|
408,599
|
|
|||||||
|
San Antonio
|
1
|
Warehouse / Distribution
|
San Antonio-New Braunfels, TX
|
247,861
|
|
|||||||
|
Waco
|
1
|
Warehouse / Distribution
|
Waco, TX
|
66,400
|
|
|||||||
|
Virginia
|
||||||||||||
|
Buena Vista
|
1
|
Light Manufacturing
|
—
|
172,759
|
|
(3)
|
||||||
|
Chester
|
1
|
Warehouse / Distribution
|
Richmond, VA
|
100,000
|
|
|||||||
|
Harrisonburg
|
1
|
Warehouse / Distribution
|
Harrisonburg, VA
|
357,673
|
|
|||||||
|
Independence
|
1
|
Warehouse / Distribution
|
—
|
120,000
|
|
(3)
|
||||||
|
Wisconsin
|
||||||||||||
|
Appleton
|
1
|
Light Manufacturing
|
Appleton, WI
|
113,379
|
|
|||||||
|
Chippewa Falls
|
2
|
Light Manufacturing
|
Eau Claire, WI
|
97,400
|
|
|||||||
|
De Pere
|
1
|
Warehouse / Distribution
|
Green Bay, WI
|
200,000
|
|
|||||||
|
DeForest
|
1
|
Warehouse / Distribution
|
Madison, WI
|
254,431
|
|
|||||||
|
East Troy
|
1
|
Warehouse / Distribution
|
Whitewater-Elkhorn, WI
|
149,624
|
|
|||||||
|
Germantown
|
1
|
Warehouse / Distribution
|
Milwaukee-Waukesha-West Allis, WI
|
202,500
|
|
|||||||
32
|
State
|
City
|
Number of
Buildings
|
Asset Type
(1)
|
CBSA
(2)
|
Total Rentable
Square Feet
|
|||||||
|
Hartland
|
1
|
Warehouse / Distribution
|
Milwaukee-Waukesha-West Allis, WI
|
121,050
|
|
|||||||
|
Janesville
|
1
|
Warehouse / Distribution
|
Janesville-Beloit, WI
|
700,000
|
|
|||||||
|
Kenosha
|
1
|
Light Manufacturing
|
Chicago-Naperville-Elgin, IL-IN-WI
|
175,052
|
|
|||||||
|
Mayville
|
1
|
Light Manufacturing
|
Beaver Dam, WI
|
339,179
|
|
|||||||
|
Milwaukee
|
2
|
Warehouse / Distribution
|
Milwaukee-Waukesha-West Allis, WI
|
117,564
|
|
|||||||
|
New Berlin
|
1
|
Warehouse / Distribution
|
Milwaukee-Waukesha-West Allis, WI
|
205,063
|
|
|||||||
|
Sun Prairie
|
1
|
Warehouse / Distribution
|
Madison, WI
|
427,000
|
|
|||||||
|
West Allis
|
4
|
Warehouse / Distribution
|
Milwaukee-Waukesha-West Allis, WI
|
241,977
|
|
|||||||
|
Yorkville
|
1
|
Warehouse / Distribution
|
Racine, WI
|
98,151
|
|
|||||||
|
Total
|
314
|
60,878,204
|
|
|||||||||
|
(1)
|
Flex / Office are properties that are generally 50,000 to 200,000 square feet in size and used for office space, light manufacturing, research and development and warehousing.
|
|
(2)
|
We define Core Based Statistical Area ("CBSA") as a U.S. geographic area defined by the Office of Management and Budget that consists of one or more counties (or equivalents) anchored by an urban center of at least 10,000 people plus adjacent counties that are socioeconomically tied to the urban center by commuting.
|
|
(3)
|
These properties do not have a CBSA.
|
As of
December 31, 2016
,
46
of our
314
buildings were encumbered by mortgage indebtedness totaling
$164.3 million
(excluding unamortized deferred financing fees, debt issuance costs, and fair market value premiums). See Note 4 in the accompanying Notes to the Consolidated Financial Statements and the accompanying Schedule III for additional information.
Property Diversification
The following table sets forth information relating to diversification by building type in our portfolio as of
December 31, 2016
.
|
Square Footage
|
Total Annualized Base Rental Revenue
|
||||||||||||||||||
|
Building Type
|
Number of Buildings
|
Square Feet
|
%
|
Occupancy Rate
(1)
|
Amount
(in thousands)
|
%
|
|||||||||||||
|
Warehouse/Distribution
|
243
|
|
53,674,674
|
|
88.2
|
%
|
95.6
|
%
|
$
|
201,208
|
|
87.0
|
%
|
||||||
|
Light Manufacturing
|
54
|
|
5,925,629
|
|
9.7
|
%
|
96.3
|
%
|
23,120
|
|
10.0
|
%
|
|||||||
|
Total Operating Portfolio
|
297
|
|
59,600,303
|
|
97.9
|
%
|
95.7
|
%
|
$
|
224,328
|
|
97.0
|
%
|
||||||
|
Redevelopment
|
1
|
|
307,315
|
|
0.5
|
%
|
—
|
|
—
|
|
—
|
|
|||||||
|
Flex/Office
|
16
|
|
970,586
|
|
1.6
|
%
|
62.6
|
%
|
6,994
|
|
3.0
|
%
|
|||||||
|
Total/weighted average
|
314
|
|
60,878,204
|
|
100.0
|
%
|
94.7
|
%
|
$
|
231,322
|
|
100.0
|
%
|
||||||
|
(1)
|
We define Occupancy Rate as the percentage of total leasable square footage for which the lease term has commenced as of the close of the reporting period.
|
Geographic Diversification
The following table sets forth information about the ten largest states in our portfolio based on total annualized base rental revenue as of
December 31, 2016
.
|
Top Ten States
|
Number of CBSA's
|
% of Total Annualized Base Rental Revenue
|
||||
|
Illinois
|
2
|
|
8.2
|
%
|
||
|
Ohio
|
9
|
|
7.5
|
%
|
||
|
South Carolina
|
6
|
|
7.4
|
%
|
||
|
Pennsylvania
|
7
|
|
6.9
|
%
|
||
|
Texas
|
5
|
|
6.0
|
%
|
||
|
North Carolina
|
7
|
|
5.8
|
%
|
||
|
Michigan
|
5
|
|
5.4
|
%
|
||
|
Wisconsin
|
10
|
|
5.3
|
%
|
||
|
New Jersey
|
3
|
|
4.9
|
%
|
||
|
Tennessee
|
6
|
|
4.9
|
%
|
||
|
Total
|
60
|
|
62.3
|
%
|
||
33
Industry Diversification
The following table sets forth information about the ten largest tenant industries in our portfolio based on total annualized base rental revenue as of
December 31, 2016
.
|
Top Ten Tenant Industries
|
% of Total
Annualized Base Rental Revenue
|
||
|
Automotive
|
13.6
|
%
|
|
|
Ind Equip, Component & Metals
|
11.3
|
%
|
|
|
Air Freight & Logistics
|
11.2
|
%
|
|
|
Containers & Packaging
|
9.6
|
%
|
|
|
Food & Beverages
|
8.7
|
%
|
|
|
Retail
|
7.2
|
%
|
|
|
Personal Products
|
6.6
|
%
|
|
|
Household Durables
|
5.3
|
%
|
|
|
Business Services
|
5.2
|
%
|
|
|
Non-Profit/Government
|
3.6
|
%
|
|
|
Total
|
82.3
|
%
|
|
Tenant Diversification
As of
December 31, 2016
, our buildings were leased to
275
tenants. The following table sets forth information about the ten largest tenants in our portfolio based on total annualized base rental revenue as of
December 31, 2016
.
|
Top Ten Tenants
|
Number of
Leases
|
% of Total
Annualized Base
Rental Revenue
|
|||
|
General Service Administration
|
1
|
3.1
|
%
|
||
|
XPO Logistics Supply Chain Inc.
|
4
|
2.2
|
%
|
||
|
Deckers Outdoor Corporation
|
2
|
1.8
|
%
|
||
|
Solo Cup Company
|
1
|
1.7
|
%
|
||
|
Generation Brands, LLC
|
1
|
1.1
|
%
|
||
|
Exel Logistics
|
3
|
1.1
|
%
|
||
|
Perrigo Holland
|
2
|
1.0
|
%
|
||
|
American Tire Distributors Inc.
|
4
|
1.0
|
%
|
||
|
Spencer Gifts
, LLC
|
1
|
1.0
|
%
|
||
|
Armacell, LLC
|
3
|
0.9
|
%
|
||
|
Total
|
22
|
14.9
|
%
|
||
Lease Diversification
The following table sets forth information about the ten largest leases in our portfolio based on total annualized base rental revenue as of
December 31, 2016
.
|
Top Ten Leases
|
% of Total
Annualized Base
Rental Revenue
|
||
|
General Service Administration
|
3.1
|
%
|
|
|
Solo Cup Company
|
1.7
|
%
|
|
|
XPO Logistics Supply Chain Inc.
|
1.2
|
%
|
|
|
Generation Brands, LLC
|
1.1
|
%
|
|
|
Deckers Outdoor Corporation
|
1.1
|
%
|
|
|
Spencer Gifts, LLC
|
1.0
|
%
|
|
|
Closetmaid Corporation
|
0.9
|
%
|
|
|
Jo-Ann Stores, LLC
|
0.9
|
%
|
|
|
Archway Marketing Serv., Inc.
|
0.8
|
%
|
|
|
CareFusion 213, LLC
|
0.8
|
%
|
|
|
Total
|
12.6
|
%
|
|
34
Scheduled Lease Expirations
As of
December 31, 2016
, our weighted average in place remaining lease term was approximately
4.2 years
. For the year ended
December 31, 2016
, we have achieved approximately a
69.5%
tenant retention rate for those tenants whose leases were scheduled to expire in
2016
. The following table sets forth a summary of lease expirations for leases in place as of
December 31, 2016
, plus available space, for each of the ten calendar years beginning with 2017 and thereafter in our portfolio. The information in the table assumes that tenants exercise no renewal options, purchase options, or early termination rights.
|
Lease Expiration Year
|
Number of
Leases
Expiring
|
Total Rentable
Square Feet
|
% of Total
Occupied
Square Feet
|
Total Annualized
Base Rental Revenue
(in thousands)
|
% of Total Annualized
Base Rental Revenue
|
||||||||||
|
Available
|
—
|
3,254,516
|
|
—
|
|
—
|
|
—
|
|
||||||
|
Month-to-month leases
|
7
|
281,824
|
|
0.5
|
%
|
$
|
885
|
|
0.4
|
%
|
|||||
|
2017
|
45
|
5,393,284
|
|
9.4
|
%
|
22,956
|
|
9.9
|
%
|
||||||
|
2018
|
65
|
11,038,428
|
|
19.2
|
%
|
43,394
|
|
18.8
|
%
|
||||||
|
2019
|
52
|
9,642,460
|
|
16.7
|
%
|
37,175
|
|
16.1
|
%
|
||||||
|
2020
|
34
|
7,931,114
|
|
13.8
|
%
|
33,024
|
|
14.3
|
%
|
||||||
|
2021
|
39
|
6,468,139
|
|
11.2
|
%
|
27,361
|
|
11.8
|
%
|
||||||
|
2022
|
24
|
3,331,130
|
|
5.8
|
%
|
13,737
|
|
5.9
|
%
|
||||||
|
2023
|
12
|
2,537,340
|
|
4.4
|
%
|
9,005
|
|
3.9
|
%
|
||||||
|
2024
|
9
|
2,152,791
|
|
3.7
|
%
|
7,709
|
|
3.3
|
%
|
||||||
|
2025
|
11
|
1,788,742
|
|
3.1
|
%
|
7,550
|
|
3.3
|
%
|
||||||
|
2026
|
13
|
2,930,441
|
|
5.1
|
%
|
10,728
|
|
4.6
|
%
|
||||||
|
Thereafter
|
19
|
4,127,995
|
|
7.1
|
%
|
17,798
|
|
7.7
|
%
|
||||||
|
Total/weighted average
|
330
|
60,878,204
|
|
100.0
|
%
|
$
|
231,322
|
|
100.0
|
%
|
|||||
Item 3. Legal Proceedings
From time to time, we are a party to various lawsuits, claims and other legal proceedings that arise in the ordinary course of our business. We are not currently a party, as plaintiff or defendant, to any legal proceedings that, individually or in the aggregate, would be expected to have a material effect on our business, financial condition or results of operations if determined adversely to our company.
Item 4. Mine Safety
Disclosures
Not applicable.
35
PART II.
Item 5. Market for Registrant’s Common Equity, Related Stockholder Matters and Issuer Purchases of Equity Securities
Information about our equity compensation plans and other related stockholder matters is incorporated by reference to our definitive Proxy Statement for our
2017
Annual Meeting of Stockholders.
Market Information
Our common stock has been listed on the NYSE since April 15, 2011, and is traded under the symbol “STAG.” The closing share price for our common stock on
February 14, 2017
, as reported by the NYSE, was $23.94. For the year ended
December 31, 2016
, our total stockholder return was 38.0%, assuming an investment in our common stock on
December 31, 2015
and that all dividends were reinvested. The following table sets forth, for the periods indicated, the high and low sale prices in dollars on the NYSE for our common stock as well as the dividends declared per share of common stock.
|
Quarter ended
|
High
|
Low
|
Dividends Per
Common Share
(1)
|
|||||||||
|
December 31, 2016
|
$
|
24.41
|
|
$
|
21.21
|
|
$
|
0.347499
|
|
|||
|
September 30, 2016
|
$
|
25.51
|
|
$
|
22.68
|
|
$
|
0.347499
|
|
|||
|
June 30, 2016
|
$
|
23.83
|
|
$
|
19.42
|
|
$
|
0.347499
|
|
|||
|
March 31, 2016
|
$
|
20.54
|
|
$
|
14.97
|
|
$
|
0.347499
|
|
|||
|
December 31, 2015
|
$
|
21.13
|
|
$
|
18.01
|
|
$
|
0.345000
|
|
|||
|
September 30, 2015
|
$
|
21.29
|
|
$
|
16.66
|
|
$
|
0.345000
|
|
|||
|
June 30, 2015
|
$
|
23.81
|
|
$
|
19.89
|
|
$
|
0.337500
|
|
|||
|
March 31, 2015
|
$
|
27.61
|
|
$
|
22.28
|
|
$
|
0.337500
|
|
|||
|
(1)
|
On
November 2, 2016
, our board of directors declared the common stock dividend for the months ending
January 31, 2017
,
February 28, 2017
and
March 31, 2017
at a monthly rate of
$0.116667
per share of common stock. On
February 15, 2017
, our board of directors declared the common stock dividend for the months ending
April 30, 2017
,
May 31, 2017
, and
June 30, 2017
, at a monthly rate of
$0.116667
per share of common stock.
|
Holders of Our Common Stock
As of
February 14, 2017
, we had approximately 65 stockholders of record. This figure does not reflect the beneficial ownership of shares held in the nominee name.
Dividends
To maintain our qualification as a REIT, we must make annual distributions to our stockholders of at least 90% of our taxable net income (not including net capital gains). Dividends are declared at the discretion of our board of directors and depend on actual and anticipated cash from operations, our financial condition, capital requirements, the annual distribution requirements under the REIT provisions of the Code and other factors our board of directors may consider relevant.
Common Units and Recent Sales of Unregistered Securities
None.
36
Performance Graph
The following graph provides a comparison of the cumulative total return on our common stock with the cumulative total return on the Standard & Poor’s 500 Index and the MSCI US REIT Index. The MSCI US REIT Index represents performance of publicly-traded REITs. Returns over the indicated period are based on historical data and should not be considered indicative of future returns. The graph covers the period from December 31, 2011 to
December 31, 2016
and assumes that $100 was invested in our common stock and in each index on December 31, 2011 and that all dividends were reinvested.
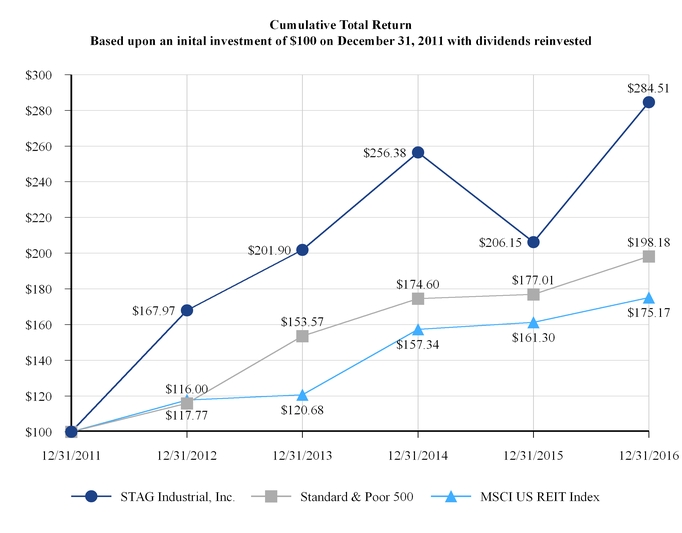
This performance graph shall not be deemed “filed” for purposes of Section 18 of the Securities Exchange Act, or incorporated by reference into any filing by us under the Securities Act, except as shall be expressly set forth by specific reference in such filing.
37
Item 6. Selected Financial Data
The following sets forth selected financial and operating data for our company on a historical consolidated basis. The following data should be read in conjunction with the Consolidated Financial Statements and Notes thereto and “Management’s Discussion and Analysis of Financial Condition and Results of Operations” included elsewhere in this Annual Report on Form 10-K. Our selected historical Consolidated Balance Sheet information as of
December 31, 2016
,
December 31, 2015
,
December 31, 2014
,
December 31, 2013
and December 31, 2012, and our selected historical Consolidated Statement of Operations data for the years ended
December 31, 2016
,
December 31, 2015
,
December 31, 2014
,
December 31, 2013
and December 31, 2012, have been derived from the audited financial statements of STAG Industrial, Inc. Certain prior year amounts have been reclassified to conform to the current year presentation. The results of operations for all periods presented have been adjusted to reflect discontinued operations.
|
Year Ended December 31,
|
||||||||||||||||||||
|
|
2016
|
2015
(1)
|
2014
(1)
|
2013
|
2012
|
|||||||||||||||
|
Statements of Operations Data:
|
|
|
|
|
||||||||||||||||
|
Revenue
|
|
|
|
|
||||||||||||||||
|
Total revenue
|
$
|
250,243
|
|
$
|
218,633
|
|
$
|
173,816
|
|
$
|
133,893
|
|
$
|
84,052
|
|
|||||
|
Expenses
|
|
|
|
|
|
|||||||||||||||
|
Property
|
48,904
|
|
42,627
|
|
33,388
|
|
24,010
|
|
12,841
|
|
||||||||||
|
General and administrative
|
33,395
|
|
28,750
|
|
26,396
|
|
17,867
|
|
14,617
|
|
||||||||||
|
Property acquisition costs
|
4,567
|
|
4,757
|
|
4,390
|
|
3,427
|
|
4,218
|
|
||||||||||
|
Depreciation and amortization
|
125,444
|
|
110,421
|
|
87,703
|
|
67,556
|
|
42,427
|
|
||||||||||
|
Loss on impairments
|
16,845
|
|
29,272
|
|
2,840
|
|
—
|
|
622
|
|
||||||||||
|
Other expenses
|
1,149
|
|
1,048
|
|
803
|
|
621
|
|
339
|
|
||||||||||
|
Total expenses
|
230,304
|
|
216,875
|
|
155,520
|
|
113,481
|
|
75,064
|
|
||||||||||
|
Other income (expense)
|
|
|
|
|
|
|||||||||||||||
|
Interest income
|
10
|
|
9
|
|
15
|
|
13
|
|
19
|
|
||||||||||
|
Interest expense
|
(42,923
|
)
|
(36,098
|
)
|
(25,109
|
)
|
(20,319
|
)
|
(16,110
|
)
|
||||||||||
|
Gain on interest rate swaps
|
—
|
|
—
|
|
—
|
|
—
|
|
215
|
|
||||||||||
|
Loss on extinguishment of debt
|
(3,261
|
)
|
—
|
|
(686
|
)
|
—
|
|
(929
|
)
|
||||||||||
|
Gain on the sales of rental property, net
|
61,823
|
|
4,986
|
|
2,799
|
|
—
|
|
—
|
|
||||||||||
|
Total other income (expense)
|
15,649
|
|
(31,103
|
)
|
(22,981
|
)
|
(20,306
|
)
|
(16,805
|
)
|
||||||||||
|
Net income (loss) from continuing operations
|
$
|
35,588
|
|
$
|
(29,345
|
)
|
$
|
(4,685
|
)
|
$
|
106
|
|
$
|
(7,817
|
)
|
|||||
|
Total income (loss) attributable to discontinued operations
|
—
|
|
—
|
|
—
|
|
4,796
|
|
(2,382
|
)
|
||||||||||
|
Net income (loss)
|
$
|
35,588
|
|
$
|
(29,345
|
)
|
$
|
(4,685
|
)
|
$
|
4,902
|
|
$
|
(10,199
|
)
|
|||||
|
Less: income (loss) attributable to noncontrolling interest after preferred stock dividends
|
1,069
|
|
(1,962
|
)
|
(992
|
)
|
(620
|
)
|
(3,720
|
)
|
||||||||||
|
Less: preferred stock dividends
|
13,897
|
|
10,848
|
|
10,848
|
|
9,495
|
|
6,210
|
|
||||||||||
|
Less: amount allocated to participating securities
|
384
|
|
385
|
|
345
|
|
262
|
|
122
|
|
||||||||||
|
Net income (loss) attributable to common stockholders
|
$
|
20,238
|
|
$
|
(38,616
|
)
|
$
|
(14,886
|
)
|
$
|
(4,235
|
)
|
$
|
(12,811
|
)
|
|||||
|
Net income (loss) per share from continuing operations attributable to the common stockholders — basic and diluted
|
$
|
0.29
|
|
$
|
(0.58
|
)
|
$
|
(0.28
|
)
|
$
|
(0.20
|
)
|
$
|
(0.44
|
)
|
|||||
|
Income (loss) per share from discontinued operation attributable to common stockholders — basic and diluted
|
—
|
|
—
|
|
—
|
|
0.10
|
|
(0.07
|
)
|
||||||||||
|
Net income (loss) per share attributable to common stockholders — basic and diluted
|
$
|
0.29
|
|
$
|
(0.58
|
)
|
$
|
(0.28
|
)
|
$
|
(0.10
|
)
|
$
|
(0.51
|
)
|
|||||
|
Balance Sheets Data (December 31):
|
|
|
|
|
|
|||||||||||||||
|
Rental property, before accumulated depreciation and amortization
|
$
|
2,541,705
|
|
$
|
2,188,642
|
|
$
|
1,809,895
|
|
$
|
1,389,214
|
|
$
|
1,059,715
|
|
|||||
|
Rental property, after accumulated depreciation and amortization
|
$
|
2,116,836
|
|
$
|
1,839,967
|
|
$
|
1,558,434
|
|
$
|
1,222,360
|
|
$
|
957,607
|
|
|||||
|
Total assets
|
$
|
2,186,156
|
|
$
|
1,901,782
|
|
$
|
1,623,802
|
|
$
|
1,266,460
|
|
$
|
1,003,342
|
|
|||||
|
Total debt
|
$
|
1,036,139
|
|
$
|
980,248
|
|
$
|
680,478
|
|
$
|
552,270
|
|
$
|
477,433
|
|
|||||
|
Total liabilities
|
$
|
1,119,230
|
|
$
|
1,043,925
|
|
$
|
731,924
|
|
$
|
591,896
|
|
$
|
513,882
|
|
|||||
|
Total equity
|
$
|
1,066,926
|
|
$
|
857,857
|
|
$
|
891,878
|
|
$
|
674,564
|
|
$
|
489,460
|
|
|||||
|
Other Data:
|
|
|
|
|
|
|||||||||||||||
|
Dividend declared per common share
|
$
|
1.389996
|
|
$
|
1.365
|
|
$
|
1.29
|
|
$
|
1.20
|
|
$
|
1.07
|
|
|||||
|
Cash flow provided by operating activities
|
$
|
135,423
|
|
$
|
121,707
|
|
$
|
96,676
|
|
$
|
82,687
|
|
$
|
48,011
|
|
|||||
|
Cash flow used in investing activities
|
$
|
(347,112
|
)
|
$
|
(372,038
|
)
|
$
|
(421,713
|
)
|
$
|
(325,231
|
)
|
$
|
(417,203
|
)
|
|||||
|
Cash flow provided by financing activities
|
$
|
211,870
|
|
$
|
238,464
|
|
$
|
342,225
|
|
$
|
230,228
|
|
$
|
371,700
|
|
|||||
|
(1)
|
These amounts are revised as shown in Note 2 to the Consolidated Financial Statements.
|
38
Item 7. Management’s Discussion and Analysis
of Financial Condition and Results of Operations
The following discussion of our financial condition and results of operations should be read in conjunction with our consolidated financial statements and related notes included elsewhere in this report.
Overview
We are a REIT focused on the acquisition, ownership, and operation of single-tenant, industrial properties throughout the U.S. We seek to (i) identify properties that offer relative value across all locations, industrial property types, and tenants through the principled application of our proprietary risk assessment model, (ii) operate our properties in an efficient, cost-effective manner, and (iii) capitalize our business appropriately given the characteristics of our assets. We are a Maryland corporation and our common stock is publicly traded on the NYSE under the symbol “STAG.”
We are organized and conduct our operations to qualify as a REIT under Sections 856 through 860 of the Code, and generally are not subject to federal income tax to the extent we currently distribute our income to our stockholders and maintain our qualification as a REIT. We remain subject to state and local taxes on our income and property and to U.S. federal income and excise taxes on our undistributed income.
Our qualification and taxation as a REIT depends upon our ability to meet on a continuing basis, through actual annual operating results, qualification tests in the federal income tax laws. Those tests involve the percentage of income that we earn from specified sources, the percentage of our assets that falls within specified categories, the diversity of our capital stock ownership and the percentage of our earnings that we distribute.
As of
December 31, 2016
, we owned
314
buildings in
37
states with approximately
60.9 million
rentable square feet, consisting of
243
warehouse/distribution buildings,
54
light manufacturing buildings,
16
flex/office buildings, and
one
building in redevelopment. As of
December 31, 2016
, our buildings were approximately
94.7%
leased to
275
tenants, with no single tenant accounting for more than approximately
3.1%
of our total annualized base rental revenue and no single industry accounting for more than approximately
13.6%
of our total annualized base rental revenue.
We own our interests in all of our properties and conduct substantially all of our business through our Operating Partnership. We are the sole member of the sole general partner of the Operating Partnership. As of
December 31, 2016
, we owned approximately
95.7%
of the common equity of our Operating Partnership, and our current and former executive officers, directors, senior employees and their affiliates, and third parties who contributed properties to us in exchange for common equity in our Operating Partnership, owned the remaining
4.3%
. We completed our IPO and related formation transactions, pursuant to which we succeeded to the business of our predecessor, on April 20, 2011.
Factors That May Influence Future Results of Operations
Our ability to increase revenues or cash flow will depend in part on our (i) external growth, specifically acquisition activity and (ii) internal growth, specifically occupancy and rental rates on our portfolio. A variety of other factors, including those noted below, also affect our future results of operations.
Outlook
The outlook for our business remains positive, albeit on a moderated basis in light of continued slow economic growth, some uncertainty regarding the new U.S. presidential administration and its policy initiatives, and continued asset appreciation. The federal funds target rate was raised 25 basis points in December; however, the target rate remains very low, in a range of 0.50% to 0.75%. This range aligns with the Central Bank’s consistent commentary that future rate hikes would be gradual and rates will likely remain historically low for an extended period of time. At the same time, its most recent commentary suggests increasing comfort with hiking rates again in the near future. If interest rates were to rise further as a result of Federal Reserve policy action (short-term interest rates) or changes in market expectations and capital flows (long-term interest rates), we believe strengthening economic conditions are likely to accompany these changes. This strengthening of economic conditions combined with the currently favorable industrial supply/demand environment should translate to a net positive result for our business. Specifically, our existing portfolio should benefit from rising rental rates and our acquisition activity should benefit from higher yields. Furthermore, we believe certain characteristics of our business should position us well in a rising interest rate environment, including the fact that we have minimal floating rate debt exposure (taking into account our hedging activities) and that many of our competitors for the assets we purchase tend to be smaller local investors who are likely to be more heavily impacted by interest rate increases.
39
The results of the U.S. presidential election was largely unanticipated by the media, and it remains unclear what impact new policies will have on the economy. The positive capital market moves since the election appear to indicate net favorable expectations on key areas, including corporate tax, healthcare, regulation, infrastructure, and trade. Other notable items with economic impacts include the continued relative strength of the U.S. dollar versus competing currencies (including the euro and pound), the continuation of relatively low oil prices, and Brexit. A strong U.S. dollar can harm U.S. exporters and U.S. multi-nationals; however, it can also benefit foreign multi-nationals positively, which support U.S. subsidiaries and operate U.S. industrial properties. Oil price declines over the past two years and the lack of a sustained rebound in price have put significant pressure on oil and gas exploration and production companies, resulting in many oil and gas sector bankruptcies, while simultaneously benefiting many industries (e.g. automotive, freight) and consumers’ disposable incomes. In June, the passing of the U.K.’s referendum to separate itself from the European Union, known as Brexit, was a major surprise to the markets. The process to renegotiate financial and economic relationships and the resulting outcomes will take many years to unfold. Right now, the decline in value of the pound is a short-term benefit to U.K. exporters. The long-term impacts on the U.S. and global economy are unclear. We believe our direct exposure to the U.K. market is limited. Of our tenants that do have direct exposure to the U.K., we believe they are well-diversified businesses. We will continue to monitor these trends for short-term and long-term impacts to us.
Several economic indicators and other factors provide insight into the U.S. economic environment and industrial demand. Presently, we believe the key factors include gross domestic product ("GDP") growth rate, unemployment rate, non-farm payrolls, Conference Board consumer confidence index, manufacturing-purchasing manager index (“ISM”), the 10-year Treasury yield, U.S. total vehicle sales, and durable goods new orders. Below are recent trends in each of these factors.
|
Economic Indicators
(1)
|
December 31, 2016
|
September 31, 2016
|
June 30, 2016
|
March 31, 2016
|
December 31, 2015
|
|
GDP Growth Rate
|
—
(2)
|
3.5%
|
1.4%
|
0.8%
|
0.9%
|
|
Unemployment Rate
|
4.7%
|
4.9%
|
4.9%
|
5.0%
|
5.0%
|
|
Change in Non-Farm Employment (in thousands)
|
156.0
|
208.0
|
271.0
|
186.0
|
271.0
|
|
Consumer Confidence Index
|
113.3
|
104.1
|
97.4
|
96.1
|
96.3
|
|
ISM
(3)
|
54.7%
|
51.5%
|
53.2%
|
51.8%
|
48.0%
|
|
10-year Treasury Yield
|
2.45%
|
1.60%
|
1.49%
|
1.78%
|
2.27%
|
|
Seasonally Adjusted Annualized Rate US Total Vehicle Sales (in thousands)
|
18,680
|
18,059
|
17,161
|
17,032
|
17,830
|
|
Manufacturing New Orders: Durable Goods (in millions)
|
227,108
|
228,204
|
219,055
|
228,499
|
223,402
|
|
(1)
|
Sources: Bureau of Economic Analysis, Bureau of Labor Statistics, Conference Board, Board of Governors of the Federal Reserve System, U.S. Census Bureau, and Institute for Supply Management. Each statistic is the latest revision available at the time of publishing this report.
|
|
(2)
|
This statistic was not available at the time of publishing this report.
|
|
(3)
|
ISM is a composite index based on a survey of over 300 purchasing and supply executives from across the country who respond to a monthly questionnaire about changes in production, new orders, new export orders, imports, employment, inventories, prices, lead-times, and timelines of supplier deliveries in their companies. When the index is over 50, it indicates expansion, while a reading below 50 signals contraction.
|
Currently, the GDP growth rate, growing non-farm employment, strong U.S. total vehicle sales, ISM level, consumer confidence, and low interest rates are positive fundamental signs for industrial demand. Expanding job count and the ongoing low unemployment rate suggests consumers will be spending more money on goods in the foreseeable future. The strengthening U.S. dollar means that U.S. consumers may be purchasing a relatively larger amount of imported goods and that U.S. companies are likely to lower their rate of exports. This is likely to be a net positive for industrial real estate demand as imports tend to lead to greater net absorption than do exports. At the end of December 2016, the consumer confidence index reached a 13-year high and the ISM level reached its highest level in two years. On the negative side, the 2016 speculative grade corporate default rate surpassed its long-term average and reached 5.1%, significantly driven by oil and gas and mining industry defaults. We expect default rates to be stable in the coming year behind positive economic growth. However, we believe improving commodity markets and capital markets stability will be important in supporting this outlook. We also note that while automotive sales closed the year strong, they have moderated their growth in recent months and we are seeing many large multinational companies experience weak organic growth, commonly due to negative currency effects and commodity price deflation. We believe the combination of these observations signal some caution in underlying economic strength; however, we still expect an increase in industrial activity and more demand for industrial space in the foreseeable future given the job growth, low-interest rate environment, and GDP growth.
40
Several industrial specific trends contribute to the expected demand increase, including:
|
•
|
an increasing attractiveness of the U.S. as a manufacturing and distribution location because of the size of the U.S. consumer market, an increase in overseas labor costs and the overall cost of supplying and shipping goods (i.e. the shortening and fattening of the supply chain);
|
|
•
|
the overall quality of the transportation infrastructure in the U.S.; and
|
|
•
|
the rise of e-commerce (as compared to the traditional retail store distribution model) and the concomitant demand by e-commerce industry participants for well-located, functional distribution space.
|
Furthermore, the lack of material speculative development in most of our markets and the broader failure of supply to keep pace with demand in many of our markets may improve occupancy levels and rental rates in our portfolio. We believe, however, that industrial supply, more so than other real estate property types, has historically had a short lead time and can appear quickly. We have started to see a notable pick-up in development activity in a growing number of the more active industrial markets, but this has yet to take firm hold on a broader scale. We will continue to monitor the supply and demand fundamentals for industrial real estate and assess its impact on our business.
Conditions in Our Markets
The buildings in our portfolio are located in markets throughout the United States. Positive or negative changes in economic or other conditions, new supply, adverse weather conditions and natural disasters and other factors in these markets may affect our overall performance.
Rental Income
We receive income primarily in the form of rental income from the tenants who occupy our buildings. The amount of rental income generated by the buildings in our portfolio depends principally on occupancy and rental rates. As of
December 31, 2016
, our Operating Portfolio was approximately
95.7%
leased and our lease rates as defined by GAAP on new and renewal leases together grew approximately
7.3%
and
7.2%
during the years ended
December 31, 2016
and
December 31, 2015
, respectively. Future economic downturns or regional downturns affecting our submarkets that impair our ability to renew or re-lease space and the ability of our tenants to fulfill their lease commitments, as in the case of tenant bankruptcies, could adversely affect our ability to maintain or increase rental rates at our buildings. Our ability to lease our properties and the attendant rental rate is dependent upon, among other things, (i) the overall economy, (ii) the supply/demand dynamic in our markets, (iii) the quality of our properties, including age, clear height, and configuration, and (iv) our tenants’ ability to meet their contractual obligations to us.
41
The following table provides a summary of our Operating Portfolio leases executed during the years ended
December 31, 2016
and
December 31, 2015
. Certain leases contain rental concessions; any such rental concessions are accounted for on a straight-line basis over the term of the lease.
|
Operating Portfolio
|
Square Feet
|
Cash
Basis Rent Per Square Foot (1) |
GAAP Basis Rent Per
Square Foot (2) |
Total Turnover Costs Per
Square Foot (3) |
Cash
Rent Change (1) |
GAAP Rent Change
(2)
|
Weighted Average Lease
Term (4) (years) |
Rental Concessions per Square Foot
(5)
|
||||||||||||||||||||
|
Year ended December 31, 2016
|
||||||||||||||||||||||||||||
|
New Leases
(6)
|
749,275
|
|
$
|
3.90
|
|
$
|
4.16
|
|
$
|
2.25
|
|
(0.5
|
)%
|
4.0
|
%
|
8.2
|
|
$
|
0.42
|
|
||||||||
|
Renewal Leases
(7)
|
4,817,462
|
|
4.02
|
|
4.14
|
|
0.56
|
|
1.4
|
%
|
7.4
|
%
|
4.8
|
|
0.15
|
|
||||||||||||
|
Total/weighted average
|
5,566,737
|
|
$
|
4.00
|
|
$
|
4.14
|
|
$
|
0.79
|
|
1.3
|
%
|
7.3
|
%
|
5.3
|
|
$
|
0.18
|
|
||||||||
|
Temporary Leases
(8)
|
1,329,245
|
|
||||||||||||||||||||||||||
|
Total leasing activity
|
6,895,982
|
|
||||||||||||||||||||||||||
|
Year ended December 31, 2015
|
||||||||||||||||||||||||||||
|
New Leases
(6)
|
1,393,810
|
|
$
|
3.40
|
|
$
|
3.28
|
|
$
|
1.85
|
|
10.8
|
%
|
18.3
|
%
|
7.9
|
|
$
|
0.44
|
|
||||||||
|
Renewal Leases
(7)
|
2,921,673
|
|
3.89
|
|
4.04
|
|
0.60
|
|
(0.8
|
)%
|
4.7
|
%
|
4.1
|
|
0.06
|
|
||||||||||||
|
Total/weighted average
|
4,315,483
|
|
$
|
3.73
|
|
$
|
3.87
|
|
$
|
1.01
|
|
1.4
|
%
|
7.2
|
%
|
5.4
|
|
$
|
0.18
|
|
||||||||
|
Temporary Leases
(8)
|
1,234,600
|
|
||||||||||||||||||||||||||
|
Total leasing activity
|
5,550,083
|
|
||||||||||||||||||||||||||
|
(1)
|
We define Cash Basis Rent Change as the percentage change in base rent (excluding straight-line rent adjustments and above/below market lease amortization as required by GAAP) of the Comparable Lease.
We define a Comparable Lease as a lease with a similar lease structure as compared to the previous in-place lease, excluding new leases for space that was not occupied under our ownership, leases on space with downtime in excess of two years, leases with materially different lease structures,
leases associated with known vacates at the time of acquisition, and leases with credit-related modifications
.
|
|
(2)
|
We define GAAP Rent Change as the percentage change in the average base rent over the contractual lease term (excluding above/below market lease amortization) of the Comparable Lease.
|
|
(3)
|
We define Turnover Costs as the costs for improvements of vacant and renewal spaces, as well as the commissions for leasing transactions. Turnover Costs per square foot represent the total turnover costs expected to be incurred on the leases signed during the period and do not reflect actual expenditures for the period.
|
|
(4)
|
We define Weighted Average Lease Term as the contractual lease term in years as of the lease start date weighted by square footage.
|
|
(5)
|
Represents the total concession (free rent) for the entire lease term.
|
|
(6)
|
We define a New Lease as any lease that is signed for an initial term equal to or greater than twelve months for any vacant space; this includes a new tenant or an existing tenant that is expanding into new (additional) space.
|
|
(7)
|
We define a Renewal Lease as a lease signed by an existing tenant to extend the term for twelve months or more, including (i) a renewal of the same space as the current lease at lease expiration, (ii) a renewal of only a portion of the current space at lease expiration and (iii) an early renewal or workout, which ultimately does extend the original term for twelve months or more.
|
|
(8)
|
We define a Temporary Lease or a License Agreement as any lease that is signed for an initial term of less than twelve months; this includes short-term new leases and short-term renewal leases.
|
Property Operating Expenses
Our property operating expenses generally consist of utilities, real estate taxes, management fees, insurance and site repair and maintenance costs. For the majority of our tenants, our property operating expenses are controlled, in part, by the triple net provisions in tenant leases. In our triple net leases, the tenant is responsible for all aspects of and costs related to the building and its operation during the lease term, including utilities, taxes, insurance and maintenance costs. However, we also have modified gross leases and gross leases in our building portfolio. The terms of those leases vary and on some occasions we may absorb building related expenses of our tenants. In our modified gross leases, we are responsible for some building related expenses during the lease term, but the cost of most of the expenses is passed through to the tenant for reimbursement to us. In our gross leases, we are responsible for all costs related to the building and its operation during the lease term. Our overall performance will be affected by the extent to which we are able to pass-through property operating expenses to our tenants.
Scheduled Lease Expirations
Our ability to re-lease space subject to expiring leases will impact our results of operations and is affected by economic and competitive conditions in our markets and by the desirability of our individual buildings. Leases that comprise approximately
9.9%
of our total annualized base rental revenue will expire during the period from
January 1, 2017
to
December 31, 2017
, excluding month to month leases. We assume, based upon internal renewal probability estimates that some of our tenants will renew and others will vacate and the associated space will be re-let subject to downtime assumptions. Assuming we do not dispose of any of these buildings, we expect that the rental rates on the respective new leases will generally be lower than the rates under existing leases expiring during the period
January 1, 2017
to
December 31, 2017
, thereby resulting in lower revenue from the same space.
As of
December 31, 2016
, we had approximately
3.3 million
square feet of currently available space in our buildings. Of the approximately
5.2 million
square feet of leases that expired during the year ended
December 31, 2016
, we have renewed
42
approximately
3.6 million
square feet subject to leases, resulting in a
69.5%
Operating Portfolio tenant retention rate for the year ended
December 31, 2016
. As of
December 31, 2016
, for the period
January 1, 2017
to
December 31, 2017
, none of our top ten leases, based on
December 31, 2016
total annualized base rental revenue, will be expiring.
Tenant Retention
The following table provides a summary of our Operating Portfolio tenant retention for the years ended
December 31, 2016
,
December 31, 2015
, and
December 31, 2014
.
|
Operating Portfolio Tenant Retention
|
Retention %
(1)
|
Weighted Average Lease Term (years)
|
Expiring Square Feet
|
Renewal Square Feet
(2)
|
Cash Rent Change
|
GAAP Rent Change
|
||||||||||||
|
Year ended December 31, 2016
|
69.5
|
%
|
4.7
|
|
5,210,736
|
|
3,620,369
|
|
3.0
|
%
|
8.2
|
%
|
||||||
|
Year ended December 31, 2015
|
69.5
|
%
|
2.8
|
|
4,895,033
|
|
3,401,317
|
|
4.5
|
%
|
8.9
|
%
|
||||||
|
Year ended December 31, 2014
|
70.8
|
%
|
3.5
|
|
3,295,096
|
|
2,331,698
|
|
5.8
|
%
|
8.5
|
%
|
||||||
|
Total/weighted average
|
69.8
|
%
|
3.7
|
|
13,400,865
|
|
9,353,384
|
|
4.2
|
%
|
8.5
|
%
|
||||||
|
(1)
|
We define Retention as the percentage determined by taking Renewal Lease square footage commencing in the period divided by square footage of leases expiring in the period. Neither the Renewal Leases nor leases expiring include Temporary Leases or License Agreements. Retention excludes leases associated with known vacates at the time of acquisition, leases with credit-related modifications, and early terminations.
|
|
(2)
|
We define Renewal Square Feet as the square footage of renewal leases commencing during the period, irrespective of the date signed.
|
Critical Accounting Policies
The preparation of financial statements in conformity with GAAP requires management to use judgment in the application of accounting policies, including making estimates and assumptions. We base our estimates on historical experience and on various other assumptions believed to be reasonable under the circumstances. These judgments affect the reported amounts of assets and liabilities and disclosure of contingent assets and liabilities at the dates of the financial statements and the reported amounts of revenue and expenses during the reporting periods. If our judgment or interpretation of the facts and circumstances relating to various transactions had been different, it is possible that different accounting policies would have been applied resulting in a different presentation of our financial statements. From time to time, we evaluate our estimates and assumptions. In the event estimates or assumptions prove to be different from actual results, adjustments are made in subsequent periods to reflect more current information. Below is a discussion of accounting policies that we consider critical in that they may require complex judgment in their application or require estimates about matters that are inherently uncertain.
Rental Property and Deferred Leasing Intangibles
Rental property is carried at cost less accumulated depreciation and amortization. Expenditures for maintenance and repairs are expensed as incurred. Significant renovations and betterments that extend the economic useful lives of assets are capitalized.
We capitalize costs directly related to the development, pre-development, redevelopment or improvement of rental property. Real estate taxes, compensation costs of development personnel, insurance, interest, and other directly related costs during construction periods are capitalized as incurred and depreciated commencing with the date the property is substantially completed. Such costs begin to be capitalized to the development projects from the point we are undergoing the necessary activities to get the development project ready for its intended use and cease when the development projects are substantially completed and held available for occupancy. Interest is capitalized based on actual capital expenditures from the period when development or redevelopment commences until the asset is ready for its intended use, at the weighted average borrowing rate of our unsecured indebtedness during the period.
For properties classified as held for sale, we cease depreciating and amortizing the rental property and value the rental property at the lower of depreciated and amortized cost or fair value, less costs to dispose. We present those properties classified as held for sale with any qualifying assets and liabilities associated with those properties as held for sale in the accompanying Consolidated Balance Sheets.
We allocate the purchase price of business combinations of properties based upon the fair value of the assets and liabilities acquired, which generally consist of land, buildings, tenant improvements, mortgage debt assumed, and deferred leasing intangibles, which includes in-place leases, above market and below market leases, and tenant relationships. The portion of the purchase price that is allocated to above and below market leases is valued based on the present value of the difference between prevailing market rates and the in-place rates measured over a period equal to the remaining term of the lease term plus the term of any bargain renewal options. The above and below market lease values are amortized into rental income over the remaining term plus the terms of bargain renewal options or assumed exercise of early termination options of the respective leases. The purchase price is further allocated to in-place lease values and tenant relationships based on our evaluation of the specific characteristics of each tenant’s lease and its overall relationship with the respective tenant. The value of in-place lease intangibles and tenant relationships,
43
which are included as components of deferred leasing intangibles, are amortized over the remaining lease term (and expected renewal periods of the respective lease for tenant relationships or assumed exercise of early termination options for in-place lease intangibles) as increases to depreciation and amortization expense. If a tenant terminates its lease, the unamortized portion of above and below market leases is accelerated into rental income and the in-place lease value and tenant relationships are accelerated into depreciation or amortization expense over the shortened lease term.
The purchase price allocated to deferred leasing intangible assets are included in rental property on our Consolidated Balance Sheets and the purchase price allocated to deferred leasing intangible liabilities are included in deferred leasing intangibles on our Consolidated Balance Sheets under the liabilities section.
In determining the fair value of the debt assumed, we discount the spread between the future contractual interest payments and hypothetical future interest payments on mortgage debt based on a current market rate. The associated fair market value debt adjustment is amortized through interest expense over the life of the debt on a basis which approximates the effective interest method.
Using information available at the time of acquisition, we allocate the total consideration to tangible assets and liabilities and identified intangible assets and liabilities, as discussed above. We may adjust the preliminary purchase price allocations after obtaining more information about asset valuations and liabilities assumed.
We evaluate the carrying value of all tangible and intangible real estate assets held for use for possible impairment when an event or change in circumstance has occurred that indicates their carrying value may not be recoverable. The evaluation includes estimating and reviewing anticipated future undiscounted cash flows to be derived from the asset and the ultimate sale of the asset. If such cash flows are less than the asset’s carrying value, an impairment charge is recognized to the extent by which the asset’s carrying value exceeds the estimated fair value. Estimating future cash flows is highly subjective and such estimates could differ from actual results.
Depreciation and amortization expense is computed using the straight-line method based on the following lives.
|
Building
|
40 Years
|
|
Building and land improvements
|
Up to 20 years
|
|
Tenant improvements
|
Shorter of useful life or terms of related lease
|
|
Above and below market leases and other deferred leasing intangibles
|
Terms of the related lease plus terms of bargain renewal options or assumed exercise of early termination options
|
|
Tenant relationships
|
Terms of the related lease plus estimated renewal period
|
|
Assumed debt fair value premium/discount
|
Terms of the related loan
|
Goodwill
The excess of the cost of an acquired business over the net of the amounts assigned to assets acquired (including identified intangible assets) and liabilities assumed is recorded as goodwill. Our goodwill of
$4.9 million
represents amounts allocated to the assembled workforce from the acquired management company, and is presented in prepaid expenses and other assets on the accompanying Consolidated Balance Sheets. Goodwill has an indeterminate life and is not amortized, but is tested for impairment on an annual basis at December 31, or more frequently if events or changes in circumstances indicate that the asset might be impaired. We take a qualitative approach to consider whether an impairment of goodwill exists prior to quantitatively determining the fair value of the reporting unit in step one of the impairment test. We have not recorded any impairments to goodwill through
December 31, 2016
.
44
Use of Derivative Financial Instruments
We record all derivatives on the accompanying Consolidated Balance Sheets at fair value. The accounting for changes in the fair value of derivatives depends on the intended use of the derivative, whether we have elected to designate a derivative in a hedging relationship and apply hedge accounting, and whether the hedging relationship has satisfied the criteria necessary to apply hedge accounting. Derivatives designated and qualifying as a hedge of the exposure to changes in the fair value of an asset, liability, or firm commitment attributable to a particular risk, such as interest rate risk, are considered fair value hedges. Derivatives designated and qualifying as a hedge of the exposure to variability in expected future cash flows, or other types of forecasted transactions, are considered cash flow hedges. Hedge accounting generally provides for the matching of the timing of gain or loss recognition on the hedging instrument with the recognition of the changes in the fair value of the hedged asset or liability that are attributable to the hedged risk in a fair value hedge or the earnings effect of the hedged forecasted transactions in a cash flow hedge. We may enter into derivative contracts that are intended to economically hedge certain of its risks, even though hedge accounting does not apply or we elect not to apply hedge accounting.
In accordance with fair value measurement guidance, we made an accounting policy election to measure the credit risk of our derivative financial instruments that are subject to master netting arrangements on a net basis by counterparty portfolio. Credit risk is the risk of failure of the counterparty to perform under the terms of the contract. We minimize the credit risk in the interest rate swaps by entering into transactions with various high-quality counterparties. Our exposure to credit risk at any point is generally limited to amounts recorded as assets on the accompanying Consolidated Balance Sheets.
Fair Value of Financial Instruments
Financial instruments include cash and cash equivalents, restricted cash, tenant accounts receivable, interest rate swaps, accounts payable, accrued expenses, unsecured credit facility, unsecured term loans, unsecured notes and mortgage notes. The fair values of the cash and cash equivalents, restricted cash, tenant accounts receivable, accounts payable and accrued expenses approximate their carrying or contract values because of the short term maturity of these instruments. See Note 4 in the accompanying Notes to Consolidated Financial Statements for the fair values of our debt. See Note 5 in the accompanying Notes to Consolidated Financial Statements for the fair values of our interest rate swaps.
We adopted fair value measurement provisions for our financial instruments recorded at fair value. The guidance establishes a three-tier value hierarchy, which prioritizes the inputs used in measuring fair value. These tiers include: Level 1, defined as observable inputs such as quoted prices in active markets; Level 2, defined as inputs other than quoted prices in active markets that are either directly or indirectly observable; and Level 3, defined as unobservable inputs in which little or no market data exists, therefore requiring an entity to develop its own assumptions.
Incentive and Equity-Based Employee Compensation Plans
We grant equity-based compensation awards to our employees and directors in the form of restricted shares of common stock, LTIP units, outperformance programs, and performance units. See Notes 6, 7 and 8 in the accompanying Notes to Consolidated Financial Statements for further discussion of restricted shares of common stock, LTIP units, and the outperformance programs and performance units, respectively. We measure equity-based compensation expense based on the fair value of the awards on the grant date and recognize the expense ratably over the vesting period, and forfeitures are recognized in the period in which they occur.
Revenue Recognition
All current leases are classified as operating leases and rental revenue is recognized on a straight-line basis over the term of the lease (and expected bargain renewal terms or assumed exercise of early termination options) when collectability is reasonably assured. Differences between rental revenue earned and amounts due under the lease are charged or credited, as applicable, to accrued rental revenue. Additional rents from expense reimbursements for insurance, real estate taxes and certain other expenses are recognized in the period in which the related expenses are incurred.
Early lease termination fees are recorded in rental income on a straight-line basis from the notification date of such termination to the then remaining (not the original) lease term, if any, or upon collection if collection is not reasonably assured.
We earn revenue from asset management fees, which are included in our Consolidated Statements of Operations in other income. We recognize revenue from asset management fees when the related fees are earned and are realized or realizable.
45
By the terms of their leases, certain tenants are obligated to pay directly the costs of their properties’ insurance, real estate taxes and certain other expenses and these costs are not reflected in our Consolidated Financial Statements. To the extent any tenant responsible for these costs under its respective lease defaults on its lease or it is deemed probable that the tenant will fail to pay for such costs, we would record a liability for such obligation. We do not recognize recovery revenue related to leases where the tenant will pay expenses directly for real estate taxes, insurance, ground lease payments, and certain other expenses.
Results of Operations
Our results of operations are largely driven by our levels of occupancy as well as the rental rates we receive from tenants. From a rental rate standpoint, we have historically achieved overall rental increases in our tenant rollovers on a cash basis and GAAP basis.
The following discussion of our results of our same store net operating income (“NOI”) should be read in conjunction with our Consolidated Financial Statements. For a detailed discussion of NOI, including the reasons management believes NOI is useful to investors, see “Non-GAAP Financial Measures” below. We consider our same store portfolio to consist of only those industrial buildings owned and operated at the beginning and at the end of both of the applicable periods presented. Same store results are considered to be useful to investors in evaluating our performance because they provide information relating to changes in property level operating performance without taking into account the effects of acquisitions or dispositions. However, because we have generally acquired 100% occupied properties and have grown the portfolio significantly every year since our initial public offering, our same store results do not represent a market portfolio with market occupancy. Because we have above market same store occupancy, our same store results may look unfavorable at times as we trend to market levels. We encourage the reader to not only look at our same store results, but also our total portfolio results, due to historic and future growth.
Comparison of the year ended
December 31, 2016
to the year ended
December 31, 2015
Our results of operations are affected by the acquisition and disposition activity during the
2016
and
2015
periods as described below. The following discussion of our same store portfolio excludes flex/office buildings, redevelopment buildings, and those classified as held for sale on the accompanying Consolidated Balance Sheets. On
December 31, 2016
we owned
204
industrial buildings consisting of
40,957,663
square feet, which represents approximately
67.3%
of our total portfolio, that are considered our same store portfolio in the analysis below. Same store occupancy decreased approximately
1.1%
to
95.3%
as of
December 31, 2016
compared to
96.4%
as of
December 31, 2015
.
The following table summarizes selected operating information for our same store portfolio and our total portfolio for the years ended
December 31, 2016
and
December 31, 2015
(dollars in thousands). This table includes a reconciliation from our same store portfolio to our total portfolio by also providing information for the years ended
December 31, 2016
and
December 31, 2015
with respect to the buildings acquired and disposed of after
January 1, 2015
and our flex/office buildings, redevelopment buildings, and those classified as held for sale.
46
|
|
Same Store Portfolio
|
Acquisitions/Dispositions
|
Other
(1)
|
Total Portfolio
|
|||||||||||||||||||||||||||||||||||||||||
|
|
Year ended December 31,
|
Change
|
Year ended December 31,
|
Year ended December 31,
|
Year ended December 31,
|
Change
|
|||||||||||||||||||||||||||||||||||||||
|
|
2016
|
2015
|
$
|
%
|
2016
|
2015
|
2016
|
2015
|
2016
|
2015
|
$
|
%
|
|||||||||||||||||||||||||||||||||
|
Revenue
|
|
|
|
|
|
|
|
|
|
|
|||||||||||||||||||||||||||||||||||
|
Operating revenue
|
|
|
|
|
|
|
|
|
|
|
|||||||||||||||||||||||||||||||||||
|
Rental income
|
$
|
148,670
|
|
$
|
147,322
|
|
$
|
1,348
|
|
0.9
|
%
|
$
|
56,743
|
|
$
|
29,746
|
|
$
|
7,328
|
|
$
|
9,395
|
|
$
|
212,741
|
|
$
|
186,463
|
|
$
|
26,278
|
|
14.1
|
%
|
|||||||||||
|
Tenant recoveries
|
24,317
|
|
23,317
|
|
1,000
|
|
4.3
|
%
|
10,282
|
|
5,754
|
|
2,508
|
|
2,595
|
|
37,107
|
|
31,666
|
|
5,441
|
|
17.2
|
%
|
|||||||||||||||||||||
|
Other income
|
102
|
|
84
|
|
18
|
|
21.4
|
%
|
71
|
|
25
|
|
222
|
|
395
|
|
395
|
|
504
|
|
(109
|
)
|
(21.6
|
)%
|
|||||||||||||||||||||
|
Total operating revenue
|
173,089
|
|
170,723
|
|
2,366
|
|
1.4
|
%
|
67,096
|
|
35,525
|
|
10,058
|
|
12,385
|
|
250,243
|
|
218,633
|
|
31,610
|
|
14.5
|
%
|
|||||||||||||||||||||
|
Expenses
|
|
|
|
|
|
|
|
|
|
|
|||||||||||||||||||||||||||||||||||
|
Property
|
30,036
|
|
30,280
|
|
(244
|
)
|
(0.8
|
)%
|
13,920
|
|
8,235
|
|
4,948
|
|
4,112
|
|
48,904
|
|
42,627
|
|
6,277
|
|
14.7
|
%
|
|||||||||||||||||||||
|
Net operating income
(2)
|
$
|
143,053
|
|
$
|
140,443
|
|
$
|
2,610
|
|
1.9
|
%
|
$
|
53,176
|
|
$
|
27,290
|
|
$
|
5,110
|
|
$
|
8,273
|
|
201,339
|
|
176,006
|
|
25,333
|
|
14.4
|
%
|
||||||||||||||
|
Other expenses
|
|
|
|
|
|
|
|
|
|
|
|||||||||||||||||||||||||||||||||||
|
General and administrative
|
|
|
|
|
|
33,395
|
|
28,750
|
|
4,645
|
|
16.2
|
%
|
||||||||||||||||||||||||||||||||
|
Property acquisition costs
|
|
|
|
|
|
4,567
|
|
4,757
|
|
(190
|
)
|
(4.0
|
)%
|
||||||||||||||||||||||||||||||||
|
Depreciation and amortization
|
|
|
|
|
|
125,444
|
|
110,421
|
|
15,023
|
|
13.6
|
%
|
||||||||||||||||||||||||||||||||
|
Loss on impairments
|
16,845
|
|
29,272
|
|
(12,427
|
)
|
(42.5
|
)%
|
|||||||||||||||||||||||||||||||||||||
|
Other expenses
|
|
|
|
|
|
1,149
|
|
1,048
|
|
101
|
|
9.6
|
%
|
||||||||||||||||||||||||||||||||
|
Total other expenses
|
|
|
|
|
|
181,400
|
|
174,248
|
|
7,152
|
|
4.1
|
%
|
||||||||||||||||||||||||||||||||
|
Total expenses
|
|
|
|
|
|
230,304
|
|
216,875
|
|
13,429
|
|
6.2
|
%
|
||||||||||||||||||||||||||||||||
|
Other income (expense)
|
|
|
|
|
|
|
|
|
|
|
|||||||||||||||||||||||||||||||||||
|
Interest income
|
|
|
|
|
|
|
10
|
|
9
|
|
1
|
|
11.1
|
%
|
|||||||||||||||||||||||||||||||
|
Interest expense
|
|
|
|
|
|
|
(42,923
|
)
|
(36,098
|
)
|
(6,825
|
)
|
18.9
|
%
|
|||||||||||||||||||||||||||||||
|
Loss on extinguishment of debt
|
(3,261
|
)
|
—
|
|
(3,261
|
)
|
100.0
|
%
|
|||||||||||||||||||||||||||||||||||||
|
Gain on the sales of rental property, net
|
|
|
|
|
|
61,823
|
|
4,986
|
|
56,837
|
|
1,139.9
|
%
|
||||||||||||||||||||||||||||||||
|
Total other income (expense)
|
|
|
|
|
|
15,649
|
|
(31,103
|
)
|
46,752
|
|
150.3
|
%
|
||||||||||||||||||||||||||||||||
|
Net income (loss)
|
|
|
|
|
|
|
$
|
35,588
|
|
$
|
(29,345
|
)
|
$
|
64,933
|
|
221.3
|
%
|
||||||||||||||||||||||||||||
|
(1)
|
Includes flex/office buildings, and redevelopment buildings, and buildings classified as held for sale, which are excluded from the same store portfolio. Also includes corporate sublease rental income and asset management fee income, which are separated for purposes of calculating NOI.
|
|
(2)
|
Excluding corporate sublease rental income and asset management fee income, NOI for the total portfolio for the years ended
December 31, 2016
and
December 31, 2015
was
$201.1 million
and
$175.4 million
, respectively. Corporate sublease rental income and asset management fee income are included in rental income and other income, respectively, in the table above. For a detailed discussion of NOI, including the reasons management believes NOI is useful to investors, see “Non-GAAP Financial Measures” below.
|
47
Net income (loss)
for our total portfolio
increased
by
$64.9 million
or
221.3%
to a net income position of
$35.6 million
for the year ended
December 31, 2016
, compared to a net loss position of
$29.3 million
for the year ended
December 31, 2015
. For a detailed reconciliation of our same store portfolio to net income (loss), see the table on the previous page.
Same Store Total Operating Revenue
Same store operating revenue consists primarily of (i) rental income consisting of base rent, termination income, straight-line rent and above and below market lease amortization from our properties, and (ii) tenant reimbursements for insurance, real estate taxes and certain other expenses (“tenant recoveries”).
For a detailed reconciliation of our same store portfolio to net income (loss), see the table on the previous page.
Same store rental income
increased
by
$1.3 million
or
0.9%
to
$148.7 million
for the year ended
December 31, 2016
, compared to
$147.3 million
for the year ended
December 31, 2015
. Approximately $3.7 million of the increase was attributable to rental increases due to new leases and renewals of existing tenants. Same store rental income also increased approximately $0.4 million due to a net decrease in the amortization of net above market leases and approximately $0.1 million due to the recognition of a straight-line termination fee at our Golden, CO property, as discussed in Note 2 of the accompanying Notes to Consolidated Financial Statements. These increases were partially offset by an approximately $3.0 million decrease due to a reduction of base rent due to tenants downsizing their spaces and vacancies.
Same store tenant recoveries
increased
by
$1.0 million
or
4.3%
to
$24.3 million
for the year ended
December 31, 2016
, compared to
$23.3 million
for the year ended
December 31, 2015
. This increase is primarily related to an increase of approximately $2.1 million related to increases of real estate taxes levied by the related taxing authority, occupancy in previously vacant buildings, as well as changes to lease terms where we began paying the real estate taxes and operating expenses on behalf of tenants that had previously paid its taxes and operating expenses directly to respective vendors. These increases were partially offset by a decrease of approximately $1.1 million related to decreases of real estate taxes levied by the related taxing authority and vacancies.
Same Store Operating Expenses
Same store operating expenses consist primarily of property operating expenses and real estate taxes and insurance.
For a detailed reconciliation of our same store portfolio to net income (loss), see the table on the previous page.
Total same store expenses
decreased
by
$0.2 million
or
0.8%
to
$30.0 million
for the year ended
December 31, 2016
, compared to
$30.3 million
for the year ended
December 31, 2015
. This decrease is primarily related to a decrease of approximately $0.1 million in snow removal expenses attributable to a more mild winter in 2016 as compared to 2015, as well as a decrease of approximately $0.3 million in general repairs and maintenance expenses. These decreases were partially offset by an increase of approximately $0.2 million related to increases of real estate taxes levied by the related taxing authority and changes to lease terms where we began paying the real estate taxes on behalf of tenants that had previously paid its taxes directly to the taxing authority.
Acquisitions
and Dispositions
Net Operating Income
For a detailed reconciliation of our acquisitions and dispositions portfolio to net income (loss), see the table on the previous page.
Subsequent to
January 1, 2015
, we acquired
96
buildings consisting of approximately
19.0 million
square feet, and sold
30
buildings consisting of approximately
5.0 million
square feet. For the years ended
December 31, 2016
and
December 31, 2015
, the buildings acquired after
January 1, 2015
contributed approximately
$46.4 million
and
$14.6 million
to NOI, respectively. For the years ended
December 31, 2016
and
December 31, 2015
, the buildings sold after
January 1, 2015
contributed approximately
$6.8 million
and
$12.7 million
to NOI, respectively. Refer to Note 3 in the accompanying Notes to Consolidated Financial Statements for additional discussion regarding buildings acquired or sold.
Other Net Operating Income
Our other assets include our flex/office buildings, redevelopment buildings, and buildings classified as held for sale. It also includes corporate sublease rental income and asset management fee income, which are separated for purposes of calculating NOI for the total portfolio.
For a detailed reconciliation of our flex/office buildings, redevelopment buildings, and buildings classified as held for sale to net income (loss), see the table on the previous page.
48
At
December 31, 2016
we owned 15 flex/office buildings consisting of approximately 0.9 million square feet and
one
redevelopment building consisting of approximately
0.3 million
square feet that are not included in our same store or acquisitions and dispositions portfolios. These building contributed approximately $4.9 million and $7.7 million to NOI for the years ended
December 31, 2016
and
December 31, 2015
, respectively. Additionally, we earned
$0
,
$0.2 million
,
$0.2 million
, and
$0.4 million
in corporate sublease rental income and asset management fee income for the years ended
December 31, 2016
and
December 31, 2015
, respectively.
Total Other Expenses
Total other expenses consist of general and administrative expense, property acquisition costs, depreciation and amortization, loss on impairments, and other expenses.
Total other expenses
increased
$7.2 million
or
4.1%
for the year ended
December 31, 2016
to
$181.4 million
compared to
$174.2 million
for the year ended
December 31, 2015
. The increase was primarily related to an increase of
$15.0 million
in depreciation and amortization as a result of buildings acquired, net of buildings disposed, which increased the depreciable asset base. Approximately
$4.6 million
of the increase relates to an increase in general and administrative expenses, primarily related to compensation expense of approximately $3.1 million related to the severance costs of a former executive officer during the year ended
December 31, 2016
, as well as the
2016
equity grants for employees and independent directors. These increases are partially offset by a decrease of approximately
$12.4 million
in loss on impairments recorded due to the impairment of 12 buildings for the year ended
December 31, 2016
compared to the impairment of 14 buildings for the year ended
December 31, 2015
.
Total Other Income (Expense)
Total other income (expense) consists of interest income, interest expense, loss on extinguishment of debt, and gain on the sales of rental property. Interest expense includes interest incurred during the period as well as adjustments related to amortization of financing fees and debt issuance costs and amortization of fair market value adjustments associated with the assumption of debt.
Total other income (expense) increased
$46.8 million
or
150.3%
to a net other income of
$15.6 million
for the year ended
December 31, 2016
compared to a net other expense of
$31.1 million
for the year ended
December 31, 2015
. This increase is primarily the result of an increase in the gain on the sales of rental property of approximately
$56.8 million
due to the sales of
24
buildings, whereas there were
six
buildings sold during the year ended
December 31, 2015
. This was partially offset by a loss on extinguishment of debt of approximately
$3.3 million
for the year ended
December 31, 2016
, whereas there was no loss on extinguishment of debt during the year ended
December 31, 2015
. This was also partially offset by an increase in interest expense of approximately
$6.8 million
related to the increase in total average debt outstanding for the year ended
December 31, 2016
compared to the year ended
December 31, 2015
.
Comparison of year ended
December 31, 2015
to the year ended
December 31, 2014
Our results of operations are affected by the acquisition and disposition activity during the
2015
and
2014
periods as described below. The following discussion of our same store portfolio excludes flex/office buildings, redevelopment buildings, and those classified as held for sale on the accompanying Consolidated Balance Sheets. On
December 31, 2015
we owned
179
industrial buildings consisting of
35,600,752
square feet, which represented approximately
65.1%
of our total portfolio, that are considered our same store portfolio in the analysis below. Same store occupancy remained flat at
95.2%
as of
December 31, 2015
compared to
95.2%
as of
December 31, 2014
.
The following table summarizes selected operating information for our same store portfolio and our total portfolio for the years ended
December 31, 2015
and
December 31, 2014
(dollars in thousands). This table includes a reconciliation from our same store portfolio to our total portfolio by also providing information for the years ended
December 31, 2015
and
December 31, 2014
with respect to the buildings acquired and disposed of after January 1, 2014 and our flex/office buildings.
49
|
|
Same Store Portfolio
|
Acquisitions/Dispositions
|
Other
(1)
|
Total Portfolio
|
|||||||||||||||||||||||||||||||||||||||||
|
|
Year ended December 31,
|
Change
|
Year ended December 31,
|
Year ended December 31,
|
Year ended December 31,
|
Change
|
|||||||||||||||||||||||||||||||||||||||
|
|
2015
|
2014
|
$
|
%
|
2015
|
2014
|
2015
|
2014
|
2015
|
2014
|
$
|
%
|
|||||||||||||||||||||||||||||||||
|
Revenue
|
|
|
|
|
|
|
|
|
|
|
|||||||||||||||||||||||||||||||||||
|
Operating revenue
|
|
|
|
|
|
|
|
|
|
|
|
|
|
|
|
|
|
|
|
||||||||||||||||||||||||||
|
Rental income
|
$
|
123,257
|
|
$
|
122,439
|
|
$
|
818
|
|
0.7
|
%
|
$
|
54,048
|
|
$
|
18,121
|
|
$
|
9,158
|
|
$
|
8,910
|
|
$
|
186,463
|
|
$
|
149,470
|
|
$
|
36,993
|
|
24.7
|
%
|
|||||||||||
|
Tenant recoveries
|
17,948
|
|
18,493
|
|
(545
|
)
|
(2.9
|
)%
|
11,133
|
|
2,919
|
|
2,585
|
|
2,195
|
|
31,666
|
|
23,607
|
|
8,059
|
|
34.1
|
%
|
|||||||||||||||||||||
|
Other income
|
92
|
|
104
|
|
(12
|
)
|
(11.5
|
)%
|
27
|
|
32
|
|
385
|
|
603
|
|
504
|
|
$
|
739
|
|
(235
|
)
|
(31.8
|
)%
|
||||||||||||||||||||
|
Total operating revenue
|
141,297
|
|
141,036
|
|
261
|
|
0.2
|
%
|
65,208
|
|
21,072
|
|
12,128
|
|
11,708
|
|
218,633
|
|
173,816
|
|
44,817
|
|
25.8
|
%
|
|||||||||||||||||||||
|
Expenses
|
|
|
|
|
|
|
|
|
|
||||||||||||||||||||||||||||||||||||
|
Property
|
25,942
|
|
25,734
|
|
208
|
|
0.8
|
%
|
11,968
|
|
3,681
|
|
4,717
|
|
3,973
|
|
42,627
|
|
33,388
|
|
9,239
|
|
27.7
|
%
|
|||||||||||||||||||||
|
Net operating income
(2)
|
$
|
115,355
|
|
$
|
115,302
|
|
$
|
53
|
|
—
|
%
|
$
|
53,240
|
|
$
|
17,391
|
|
$
|
7,411
|
|
$
|
7,735
|
|
$
|
176,006
|
|
$
|
140,428
|
|
$
|
35,578
|
|
25.3
|
%
|
|||||||||||
|
Other expenses (income)
|
|
|
|
|
|
|
|
|
|
|
|
|
|
|
|
|
|
||||||||||||||||||||||||||||
|
General and administrative
|
|
|
|
|
|
|
|
|
|
|
|
|
28,750
|
|
26,396
|
|
2,354
|
|
8.9
|
%
|
|||||||||||||||||||||||||
|
Property acquisition costs
|
|
|
|
|
|
|
|
|
|
|
|
|
4,757
|
|
4,390
|
|
367
|
|
8.4
|
%
|
|||||||||||||||||||||||||
|
Depreciation and amortization
|
|
|
|
|
|
|
|
|
|
|
110,421
|
|
87,703
|
|
22,718
|
|
25.9
|
%
|
|||||||||||||||||||||||||||
|
Loss on impairments
|
|
|
|
|
|
|
|
|
|
|
|
|
29,272
|
|
2,840
|
|
26,432
|
|
930.7
|
%
|
|||||||||||||||||||||||||
|
Other expenses
|
|
|
|
|
|
|
|
|
|
|
|
|
1,048
|
|
803
|
|
245
|
|
30.5
|
%
|
|||||||||||||||||||||||||
|
Total other expenses
|
|
|
|
|
|
|
|
|
|
|
|
|
174,248
|
|
122,132
|
|
52,116
|
|
42.7
|
%
|
|||||||||||||||||||||||||
|
Total expenses
|
|
|
|
|
|
|
|
|
|
|
|
|
216,875
|
|
155,520
|
|
61,355
|
|
39.5
|
%
|
|||||||||||||||||||||||||
|
Other income (expense)
|
|
|
|
|
|
|
|
|
|
|
|
|
|
|
|
|
|||||||||||||||||||||||||||||
|
Interest income
|
|
|
|
|
|
|
|
|
|
|
|
|
9
|
|
15
|
|
(6
|
)
|
(40.0
|
)%
|
|||||||||||||||||||||||||
|
Interest expense
|
|
|
|
|
|
|
|
|
|
|
|
|
(36,098
|
)
|
(25,109
|
)
|
(10,989
|
)
|
43.8
|
%
|
|||||||||||||||||||||||||
|
Loss on extinguishment of debt
|
|
|
|
|
|
|
|
|
|
|
—
|
|
(686
|
)
|
686
|
|
(100.0
|
)%
|
|||||||||||||||||||||||||||
|
Gain on the sales of rental property, net
|
|
|
|
|
|
|
|
|
|
|
4,986
|
|
2,799
|
|
2,187
|
|
78.1
|
%
|
|||||||||||||||||||||||||||
|
Total other income (expense)
|
|
|
|
|
|
|
|
|
|
|
(31,103
|
)
|
(22,981
|
)
|
(8,122
|
)
|
35.3
|
%
|
|||||||||||||||||||||||||||
|
Net loss
|
|
|
|
|
|
|
|
|
|
|
|
|
$
|
(29,345
|
)
|
$
|
(4,685
|
)
|
$
|
(24,660
|
)
|
526.4
|
%
|
||||||||||||||||||||||
|
(1)
|
Includes flex/office buildings, redevelopment buildings, and buildings classified as held for sale, which are excluded from the same store portfolio. Also includes corporate sublease rental income and asset management fee income, which are separated for purposes of calculating NOI.
|
|
(2)
|
Excluding corporate sublease rental income and asset management fee income, NOI for the total portfolio for the years ended
December 31, 2015
and
December 31, 2014
was
$175.4 million
and
$139.8 million
, respectively. Corporate sublease rental income and asset management fee income are included in rental income and other income, respectively, in the table above. For a detailed discussion of NOI, including the reasons management believes NOI is useful to investors, see “Non-GAAP Financial Measures” below.
|
50
Net loss
for our total portfolio
increased
by
$24.7 million
or
526.4%
to net loss of
$29.3 million
for the year ended
December 31, 2015
, compared to a net loss of
$4.7 million
for the year ended
December 31, 2014
. For a detailed reconciliation of our same store portfolio to net loss, see the table on the previous page.
Same Store Total Operating Revenue
Same store operating revenue consists primarily of (i) rental income consisting of base rent, termination income, straight-line rent and above and below market lease amortization from our properties, and (ii) tenant reimbursements for insurance, real estate taxes and certain other expenses (“tenant recoveries”).
For a detailed reconciliation of our same store portfolio to net loss, see the table on the previous page.
Same store rental income
increased
by
$0.8 million
or
0.7%
to
$123.3 million
for the year ended
December 31, 2015
, compared to
$122.4 million
for the year ended
December 31, 2014
. Approximately $3.0 million of the increase was attributable to rental increases due to new leases, and renewals and expansions of existing tenants. These increases were partially offset by an approximately $1.9 million decrease due to a reduction of base rent due to tenants downsizing their spaces and vacancies. Same store rental income also decreased approximately $0.3 million related to an increase in amortization of net above market leases.
Same store tenant recoveries
decreased
by
$0.5 million
or
2.9%
to
$17.9 million
for the year ended
December 31, 2015
, compared to
$18.5 million
for the year ended
December 31, 2014
. The decrease was primarily attributable to one building where during the year ended
December 31, 2014
, the tenant’s lease terms changed and we began paying real estate taxes for the tenant who had previously been paying the expense to the taxing authority directly. The real estate taxes were payable in arrears, and as such the expense and related recovery recorded for the year ended
December 31, 2014
include 24 months of real estate taxes, which attributes to approximately $0.6 million of the decrease in recoveries during the year ended
December 31, 2015
, in which 12 months of real estate tax recoveries are recorded. Approximately $0.3 million of the decrease is attributable to vacancies, where the tenants had previously been reimbursing us for the related expenses. Approximately $0.4 million of the decrease related to a property where the tenant reimbursed us for deferred repair and maintenance that was necessary upon vacating the space at lease expiration for the year ended
December 31, 2014
, which did not recur during the year ended
December 31, 2015
. These decreases were partially offset due to increases in occupancies resulting in an increase in recoveries of $0.4 million, as well as a $0.4 million increase in tenant recoveries related to increases of real estate taxes levied by the related taxing authority.
Same Store Operating Expenses
Same store operating expenses consist primarily of property operating expenses and real estate taxes and insurance.
For a detailed reconciliation of our same store portfolio to net loss, see the table on the previous page.
Total same store expenses
increased
by
$0.2 million
or
0.8%
to
$25.9 million
for the year ended
December 31, 2015
, compared to
$25.7 million
for the year ended
December 31, 2014
. The increase is primarily due to an increase of approximately $0.7 million due to increased occupancy and increased utility usage and other repairs and maintenance costs at multiple properties, and $0.6 million due to an increase of real estate taxes levied by the related taxing authority. Same store expenses increased approximately $0.3 million in real estate taxes due to vacancies or to changes in lease terms where we began paying the real estate taxes on behalf of a tenant that previously paid its taxes directly. Same store expenses also increased by approximately $0.1 million for bad debt expense recognized for one of our tenants. These increases were partially offset by a decrease of $0.6 million that is primarily attributable to one building where during the year ended
December 31, 2014
, the tenant’s lease terms changed and we began paying real estate taxes for the tenant who had previously been paying the expense to taxing authority directly. The real estate taxes were payable in arrears, and as such the expense recorded by us for the year ended
December 31, 2014
include 24 months of real estate taxes, as compared to the year ended
December 31, 2015
, in which 12 months of real estate taxes are recorded. As discussed in "Same Store Total Operating Revenue" above, we received reimbursement from the tenant for the full $0.6 million. Approximately $0.3 million of the decrease in tenant recoverable expenses related to changes in lease terms where tenants began paying expenses directly to third parties; therefore, the expenses and related recoveries are no longer recognized by us. Approximately $0.4 million of the decrease related to a property where we performed deferred repair and maintenance for a tenant that was necessary upon vacating the space at lease expiration for the year ended
December 31, 2014
, which did not recur during the year ended
December 31, 2015
. Same store expenses also decreased by $0.2 million due to real estate taxes that were reduced or abated by the taxing authority.
Acquisitions
and Dispositions
Net Operating Income
For a detailed reconciliation of our acquisitions and dispositions portfolio to net loss, see the table on the previous page.
51
Subsequent to January 1, 2014, we acquired 92 buildings consisting of approximately 18.0 million square feet, and sold 10 buildings consisting of approximately 1.2 million square feet. For the year ended
December 31, 2015
and
December 31, 2014
, the buildings acquired after January 1, 2014 contributed approximately $51.1 million and $12.7 million to NOI, respectively. For the year ended
December 31, 2015
and
December 31, 2014
, the buildings sold after January 1, 2014 contributed approximately $2.1 million and $4.7 million to NOI, respectively. Refer to Note 3 in the accompanying Notes to Consolidated Financial Statements for additional discussion regarding buildings acquired or sold.
Other Net Operating Income
Our other assets include our flex/office buildings, redevelopment buildings, and buildings classified as held for sale. It also includes corporate sublease rental income and asset management fee income, which are separated for purposes of calculating NOI for the total portfolio.
For a detailed reconciliation of our flex/office buildings, redevelopment buildings, and buildings classified as held for sale to net loss, see the table on the previous page.
At
December 31, 2015
we owned 20 flex/office buildings consisting of approximately 1.1 million square feet that are not included in our same store or acquisitions and dispositions portfolios. These buildings contributed approximately $6.8 million and $7.1 million to NOI for year ended
December 31, 2015
and
December 31, 2014
, respectively. Additionally, we earned $0.2 million, $17,000, $0.4 million, and $0.6 million in corporate sublease rental income and asset management fee income for the year ended
December 31, 2015
and
December 31, 2014
, respectively.
Total Other Expenses
Total other expenses consist of general and administrative expense, property acquisition costs, depreciation and amortization, and loss on impairments and other expenses.
Total other expenses
increased
$52.1 million
or
42.7%
for the year ended
December 31, 2015
to
$174.2 million
compared to
$122.1 million
for the year ended
December 31, 2014
. The increase was primarily related to an increase of
$22.7 million
in depreciation and amortization as a result of the buildings acquired, net of buildings disposed, which increased the depreciable asset base. The increase was also attributable to an increase of
$26.4 million
in loss on impairments recorded due to the impairment of 14 buildings for the year ended
December 31, 2015
compared to the impairment of one building for the year ended
December 31, 2014
(as discussed in Note 3 in the accompanying Notes to Consolidated Financial Statements). Approximately
$2.4 million
of the increase relates to an increase in general and administrative expenses, primarily related to non-cash compensation expense related to the
2015
equity grants for employees and independent directors, and other costs attributable to an increased number of employees (54 employees at
December 31, 2014
compared to
68
employees at
December 31, 2015
), primarily salaries and payroll taxes, of approximately $6.3 million. This increase is offset by $3.9 million of severance costs that occurred in 2014 that did not occur in
2015
related to two executives (as discussed in Note 7 in the accompanying Notes to Consolidated Financial Statements). Property acquisition costs also increased by approximately
$0.4 million
due to six more acquisitions for the year ended
December 31, 2015
as compared to the year ended
December 31, 2014
, and other expenses increased by approximately
$0.2 million
due to increased state income taxes due to additional properties acquired during the year ended
December 31, 2015
.
Total Other Income (Expense)
Total other income (expense) consists of interest income, interest expense, loss on extinguishment of debt, and gain on the sales of rental property. Interest expense includes interest incurred during the period as well as adjustments related to amortization of financing fees and debt issuance costs and amortization of fair market value adjustments associated with the assumption of debt.
Total other expense
increased
$8.1 million
or
35.3%
to
$31.1 million
for the year ended
December 31, 2015
compared to
$23.0 million
for the year ended
December 31, 2014
. The increase was primarily attributable to an
$11.0 million
increase in interest expense related to an overall increase in the weighted average interest rate and an increase in total average debt outstanding for the year ended
December 31, 2015
compared to the year ended
December 31, 2014
. The increases were a result of the issuance of unsecured notes and unsecured term loans during
2015
; refer to Note 4 in the accompanying Notes to Consolidated Financial Statements for details.
52
Non-GAAP Financial Measures
In this report, we disclose and discuss funds from operations (“FFO”) and NOI, which meet the definition of “non-GAAP financial measures” as set forth in Item 10(e) of Regulation S-K promulgated by the SEC. As a result, we are required to include in this report a statement of why management believes that presentation of these measures provides useful information to investors.
Funds From Operations
FFO should not be considered as an alternative to net income (determined in accordance with GAAP) as an indication of our performance, and we believe that to understand our performance further, FFO should be compared with our reported net income or net loss in accordance with GAAP, as presented in our consolidated financial statements included in this report.
We calculate FFO in accordance with the standards established by the National Association of Real Estate Investment Trusts (“NAREIT”). FFO represents GAAP net income (loss), excluding gains (or losses) from sales of depreciable operating buildings, impairment write-downs of depreciable real estate, real estate related depreciation and amortization (excluding amortization of deferred financing costs and fair market value of debt adjustment) and after adjustments for unconsolidated partnerships and joint ventures.
Management uses FFO as a supplemental performance measure because it is a widely recognized measure of the performance of REITs. FFO may be used by investors as a basis to compare our operating performance with that of other REITs.
However, because FFO excludes depreciation and amortization and captures neither the changes in the value of our buildings that result from use or market conditions nor the level of capital expenditures and leasing commissions necessary to maintain the operating performance of our buildings, all of which have real economic effects and could materially impact our results from operations, the utility of FFO as a measure of our performance is limited. In addition, other REITs may not calculate FFO in accordance with the NAREIT definition as we do, and, accordingly, our FFO may not be comparable to such other REITs’ FFO. FFO should not be used as a measure of our liquidity, and is not indicative of funds available for our cash needs, including our ability to pay dividends.
The following table sets forth a reconciliation of our FFO attributable to common stockholders and unit holders for the periods presented to net income (loss), the nearest GAAP equivalent.
|
Year ended December 31,
|
||||||||||||
|
Reconciliation of Net Income (Loss) to FFO (in thousands)
|
2016
|
2015
|
2014
|
|||||||||
|
Net income (loss)
|
$
|
35,588
|
|
$
|
(29,345
|
)
|
$
|
(4,685
|
)
|
|||
|
Rental property depreciation and amortization
|
125,182
|
|
110,241
|
|
87,502
|
|
||||||
|
Loss on impairments
|
16,845
|
|
29,272
|
|
2,840
|
|
||||||
|
Gain on the sales of rental property, net
|
(61,823
|
)
|
(4,986
|
)
|
(2,799
|
)
|
||||||
|
FFO
|
$
|
115,792
|
|
$
|
105,182
|
|
$
|
82,858
|
|
|||
|
Preferred stock dividends
|
(13,897
|
)
|
(10,848
|
)
|
(10,848
|
)
|
||||||
|
Amount allocated to participating securities
|
(384
|
)
|
(385
|
)
|
(345
|
)
|
||||||
|
FFO attributable to common stockholders and unit holders
|
$
|
101,511
|
|
$
|
93,949
|
|
$
|
71,665
|
|
|||
Net Operating Income
We consider NOI to be an appropriate supplemental performance measure to net income because we believe it helps investors and management understand the core operations of our buildings. NOI is defined as rental revenue, including reimbursements, less property expenses and real estate taxes and insurance. NOI should not be viewed as an alternative measure of our financial performance since it excludes expenses which could materially impact our results of operations. Further, our NOI may not be comparable to that of other real estate companies, as they may use different methodologies for calculating NOI.
53
The following table sets forth a reconciliation of our NOI for the periods presented to net income (loss), the nearest GAAP equivalent.
|
Year ended December 31,
|
||||||||||||
|
Reconciliation of Net Income (Loss) to NOI (in thousands)
|
2016
|
2015
|
2014
|
|||||||||
|
Net income (loss)
|
$
|
35,588
|
|
$
|
(29,345
|
)
|
$
|
(4,685
|
)
|
|||
|
Asset management fee income
|
(210
|
)
|
(379
|
)
|
(598
|
)
|
||||||
|
General and administrative
|
33,395
|
|
28,750
|
|
26,396
|
|
||||||
|
Property acquisition costs
|
4,567
|
|
4,757
|
|
4,390
|
|
||||||
|
Depreciation and amortization
|
125,444
|
|
110,421
|
|
87,703
|
|
||||||
|
Interest income
|
(10
|
)
|
(9
|
)
|
(15
|
)
|
||||||
|
Interest expense
|
42,923
|
|
36,098
|
|
25,109
|
|
||||||
|
Loss on impairments
|
16,845
|
|
29,272
|
|
2,840
|
|
||||||
|
Loss on extinguishment of debt
|
3,261
|
|
—
|
|
686
|
|
||||||
|
Other expenses
|
1,149
|
|
1,048
|
|
803
|
|
||||||
|
Gain on the sales of rental property, net
|
(61,823
|
)
|
(4,986
|
)
|
(2,799
|
)
|
||||||
|
Corporate sublease rental income
|
—
|
|
(187
|
)
|
(17
|
)
|
||||||
|
Net operating income
|
$
|
201,129
|
|
$
|
175,440
|
|
$
|
139,813
|
|
|||
Cash Flows
Comparison of the year ended
December 31, 2016
to the year ended
December 31, 2015
The following table summarizes our cash flows for the year ended
December 31, 2016
compared to the year ended
December 31, 2015
.
|
|
Year ended December 31,
|
Change
|
|||||||||||||
|
Cash Flows (dollars in thousands)
|
2016
|
2015
|
$
|
%
|
|||||||||||
|
Net cash provided by operating activities
|
$
|
135,423
|
|
$
|
121,707
|
|
$
|
13,716
|
|
11.3
|
%
|
||||
|
Net cash used in investing activities
|
$
|
347,112
|
|
$
|
372,038
|
|
$
|
(24,926
|
)
|
(6.7
|
)%
|
||||
|
Net cash provided by financing activities
|
$
|
211,870
|
|
$
|
238,464
|
|
$
|
(26,594
|
)
|
(11.2
|
)%
|
||||
Net cash provided by operating activities
increased
$13.7 million
to
$135.4 million
for the year ended
December 31, 2016
, compared to
$121.7 million
for the year ended
December 31, 2015
. The increase was primarily attributable to incremental operating cash flows from property acquisitions completed after
December 31, 2015
, and operating performance at existing properties. These increases were partially offset by the loss of cash flows from property dispositions that occurred during the years ended December 31, 2016 and December 31, 2015, fluctuations in working capital due to timing of payments and rental receipts, and a higher cash interest paid due to an increase in our total average indebtedness outstanding.
Net cash used in investing activities
decreased
by
$24.9 million
to
$347.1 million
for the year ended
December 31, 2016
, compared to
$372.0 million
for the year ended
December 31, 2015
. The change was primarily related to the sale of
24
buildings during the year ended
December 31, 2016
for net proceeds of approximately
$152.1 million
, compared to the year ended
December 31, 2015
where we sold
six
buildings for net proceeds of approximately
$22.2 million
. This was partially offset by an increase in cash paid for the acquisition of
47
buildings during the year ended
December 31, 2016
of approximately
$467.3 million
, compared to the acquisition of
49
buildings during the year ended
December 31, 2015
of approximately
$377.8 million
. Additionally, we had a an increase in cash paid for additions of land and building improvements of approximately
$14.2 million
, primarily due to a tenant improvements project and the expansion of a building.
Net cash provided by financing activities
decreased
$26.6 million
to
$211.9 million
for the year ended
December 31, 2016
, compared to
$238.5 million
for the year ended
December 31, 2015
. The change is primarily due to a decrease in cash inflow from our unsecured notes of
$220.0 million
from the issuance of unsecured notes on February 20, 2015 and December 15, 2015. The change is also attributable to an increase of repayment of mortgage notes of
$49.9 million
, an increase of
$5.7 million
in offering costs related to the issuance of the Series C Preferred Stock on March 17, 2016 and new at-the-market common stock offering programs on May 13, 2016 and November 8, 2016, the redemption of the 9.0% Series A Cumulative Redeemable Preferred Stock, par value $0.01 per share (the “Series A Preferred Stock”) on November 2, 2016 of $69.0 million, and an increase in dividends and distributions paid of
$11.5 million
as a result of the increased number of shares and units outstanding as well as a
$0.029163
increase in the dividend paid per share during the year ended
December 31, 2016
compared to the year ended
December 31, 2015
. These decreases were offset by the issuance of the Series C Preferred Stock for proceeds of
$75.0 million
, an increase of net cash inflow of
$47.0 million
from our unsecured credit facility, and an increase in proceeds from sales of common stock of
$207.8 million
during the year ended
December 31, 2016
compared to the year ended
December 31, 2015
.
54
Comparison of the year ended
December 31, 2015
to the year ended
December 31, 2014
The following table summarizes our cash flows for the year ended
December 31, 2015
compared to the year ended
December 31, 2014
.
|
|
Year ended December 31,
|
Change
|
|||||||||||||
|
Cash Flows (dollars in thousands)
|
2015
|
2014
|
$
|
%
|
|||||||||||
|
Net cash provided by operating activities
|
$
|
121,707
|
|
$
|
96,676
|
|
$
|
25,031
|
|
25.9
|
%
|
||||
|
Net cash used in investing activities
|
$
|
372,038
|
|
$
|
421,713
|
|
$
|
(49,675
|
)
|
(11.8
|
)%
|
||||
|
Net cash provided by financing activities
|
$
|
238,464
|
|
$
|
342,225
|
|
$
|
(103,761
|
)
|
(30.3
|
)%
|
||||
Net cash provided by operating activities increased $25.0 million to $121.7 million for the year ended December 31, 2015, compared to $96.7 million for the year ended December 31, 2014. The increase was primarily attributable to incremental operating cash flows from property acquisitions completed after December 31, 2014, and operating performance at existing properties. These increases were partially offset by the loss of cash flows from property dispositions that occurred during the years ended December 31, 2015 and December 31, 2014, fluctuations in working capital due to timing of payments and rental receipts, and a higher cash interest paid due to an increase in the our total average indebtedness outstanding and an overall increase in our weighted average interest rate.
Net cash used in investing activities decreased by $49.7 million to $372.0 million for the year ended December 31, 2015, compared to $421.7 million for the year ended December 31, 2014. The change is primarily attributable to the acquisition of 49 buildings for a total cash consideration of $377.8 million during the year ended December 31, 2015 compared to the acquisition of 43 buildings for a total cash consideration of $420.8 million during the year ended December 31, 2014. The decreased cash consideration for the 2015 acquisitions is due to $26.3 million of the acquisition consideration being in the form of assumed mortgages notes, $22.9 million in the form of issuances of common units of limited partnership, and $0.3 million of contingent consideration.
Net cash provided by financing activities decreased $103.8 million to $238.5 million for the year ended December 31, 2015, compared to $342.2 million for the year ended December 31, 2014. This is primarily due to a decrease in net cash inflow from our unsecured credit facility of $125.5 million, a decrease in proceeds of sale of common stock of $241.8 million, and an increase in dividends and distributions paid of $21.3 million as a result of the increased number of shares and units outstanding as well as an $0.08 increase in the dividend paid per share during the year ended December 31, 2015 compared to the year ended December 31, 2014. Additionally, repayments of mortgage notes increased by $16.1 million primarily as a result of the immediate repayment of the mortgage notes that were assumed in connection with the acquisition of the Burlington, NJ and Laurens, SC properties. These decreases were offset by an increase of proceeds of $40.0 million from our unsecured notes as a result of the issuance of the $100 million 4.32% Series D 10-year unsecured notes and the $20 million 4.42% Series E 12-year unsecured notes on February 20, 2015 and the $100 million 3.98% Series F 7-year unsecured notes on December 15, 2015. Additionally, we had an increase of net cash inflow of $250.0 million from our unsecured term loans for the year ended December 31, 2015 compared to the year ended December 31, 2014.
Liquidity and Capital Resources
We believe that our liquidity needs will be satisfied through cash flows generated by operations, disposition proceeds, and financing activities. Operating cash flow is primarily rental income, expense recoveries from tenants, and other income from operations and is our principal source of funds that we use to pay operating expenses, debt service, recurring capital expenditures and the distributions required to maintain our REIT qualification. We look to the capital markets (common equity, preferred equity, and debt) to primarily fund our acquisition activity. We seek to increase cash flows from our properties by maintaining quality standards for our buildings that promote high occupancy rates and permit increases in rental rates while reducing tenant turnover and controlling operating expenses. We believe that our revenue, together with proceeds from building sales and debt and equity financings, will continue to provide funds for our short-term and medium-term liquidity needs.
Our short-term liquidity requirements consist primarily of funds to pay for operating expenses and other expenditures directly associated with our buildings, including interest expense, interest rate swap payments, scheduled principal payments on outstanding indebtedness, funding of property acquisitions under contract, general and administrative expenses, and capital expenditures for tenant improvements and leasing commissions.
Our long-term liquidity needs, in addition to recurring short-term liquidity needs as discussed above, consist primarily of funds necessary to pay for acquisitions, non-recurring capital expenditures, and scheduled debt maturities. We intend to satisfy our long-term liquidity needs through cash flow from operations, the issuance of equity or debt securities, other borrowings, property
55
dispositions, or, in connection with acquisitions of certain additional buildings, the issuance of common units in the Operating Partnership.
As of
December 31, 2016
, we had total immediate liquidity of approximately
$430.7 million
, comprised of
$12.2 million
of cash and cash equivalents and
$418.5 million
of immediate availability on our unsecured credit facility and unsecured term loans.
In addition, we require funds for future dividends to be paid to our common and preferred stockholders and common unit holders in our Operating Partnership. The table below sets forth the dividends attributable to our common stock that were declared or paid during the year ended
December 31, 2016
. These distributions on our common stock are voluntary (at the discretion of our board of directors), to the extent in excess of distribution requirements in order to maintain our REIT status for federal income tax purposes, and the excess portion may be reduced or stopped if needed to fund other liquidity requirements or for other reasons.
|
Month Ended 2016
|
Declaration Date
|
Record Date
|
Per Share
|
Payment Date
|
||||||
|
December 31
|
August 1, 2016
|
December 30, 2016
|
$
|
0.115833
|
|
January 17, 2017
|
||||
|
November 30
|
August 1, 2016
|
November 30, 2016
|
0.115833
|
|
December 15, 2016
|
|||||
|
October 31
|
August 1, 2016
|
October 31, 2016
|
0.115833
|
|
November 15, 2016
|
|||||
|
September 30
|
May 2, 2016
|
September 30, 2016
|
0.115833
|
|
October 17, 2016
|
|||||
|
August 31
|
May 2, 2016
|
August 31, 2016
|
0.115833
|
|
September 15, 2016
|
|||||
|
July 31
|
May 2, 2016
|
July 29, 2016
|
0.115833
|
|
August 15, 2016
|
|||||
|
June 30
|
February 22, 2016
|
June 30, 2016
|
0.115833
|
|
July 15, 2016
|
|||||
|
May 31
|
February 22, 2016
|
May 31, 2016
|
0.115833
|
|
June 15, 2016
|
|||||
|
April 30
|
February 22, 2016
|
April 29, 2016
|
0.115833
|
|
May 16, 2016
|
|||||
|
March 31
|
October 22, 2015
|
March 31, 2016
|
0.115833
|
|
April 15, 2016
|
|||||
|
February 29
|
October 22, 2015
|
February 29, 2016
|
0.115833
|
|
March 15, 2016
|
|||||
|
January 31
|
October 22, 2015
|
January 29, 2016
|
0.115833
|
|
February 16, 2016
|
|||||
|
Total
|
|
$
|
1.389996
|
|
|
|||||
On
November 2, 2016
, our board of directors declared the common stock dividend for the months ending
January 31, 2017
,
February 28, 2017
and
March 31, 2017
at a monthly rate of
$0.116667
per share of common stock. On
February 15, 2017
, our board of directors declared the common stock dividend for the months ending
April 30, 2017
,
May 31, 2017
and
June 30, 2017
at a monthly rate of
$0.116667
per share of common stock.
We paid quarterly cumulative dividends on the Series A Preferred Stock, Series B Preferred Stock, and the Series C Preferred Stock (collectively, the "Preferred Stock Issuances") at a rate equivalent to the fixed annual rate of $2.25, $1.65625, and $1.71875 per share, respectively. The table below sets forth the dividends on the Preferred Stock Issuances during the year ended
December 31, 2016
.
|
Quarter Ended 2016
|
Declaration Date
|
Series A
Preferred Stock Per Share |
Series B
Preferred Stock Per Share |
Series C
Preferred Stock Per Share |
Payment Date
|
|||||||||||
|
December 31
|
November 2, 2016
|
(1)
|
$
|
0.19375
|
|
(1)
|
$
|
0.4140625
|
|
$
|
0.4296875
|
|
December 30, 2016
|
|||
|
September 30
|
August 1, 2016
|
0.56250
|
|
0.4140625
|
|
0.4296875
|
|
September 30, 2016
|
||||||||
|
June 30
|
May 2, 2016
|
0.56250
|
|
0.4140625
|
|
0.4965300
|
|
(2)
|
June 30, 2016
|
|||||||
|
March 31
|
February 22, 2016
|
0.56250
|
|
0.4140625
|
|
—
|
|
March 31, 2016
|
||||||||
|
Total
|
|
$
|
1.88125
|
|
$
|
1.6562500
|
|
$
|
1.3559050
|
|
|
|||||
|
(1)
|
On September 26, 2016 our board of directors approved the redemption of the Series A Preferred Stock. On
November 2, 2016, we redeemed all of the Series A Preferred Stock, at a cash redemption price of
$25.00
per share, plus accrued and unpaid dividends to but excluding the redemption date, without interest.
|
|
(2)
|
Dividends on the
Series C Preferred Stock were accrued and cumulative from and including the issuance date of March 17, 2016 to the first payment date on June 30, 2016.
|
On
February 15, 2017
, our board of directors declared the Series B Preferred Stock and the Series C Preferred Stock dividend for the quarter ending March 31, 2017 at a quarterly rate of
$0.4140625
per share and
$0.4296875
per share, respectively.
56
Indebtedness Outstanding
The following table sets forth certain information with respect to the indebtedness outstanding as of
December 31, 2016
.
|
Loan
|
Principal outstanding as of December 31, 2016 (in thousands)
|
|
Interest
Rate (1) |
|
Current Maturity
|
Prepayment Terms
(2)
|
|||||
|
Unsecured credit facility:
|
|||||||||||
|
Unsecured Credit Facility
(3)
|
$
|
28,000
|
|
|
L + 1.15%
|
|
|
Dec-18-2019
|
i
|
||
|
Total unsecured credit facility
|
28,000
|
|
|
|
|
|
|
|
|||
|
|
|||||||||||
|
Unsecured term loans:
|
|
|
|
|
|
|
|
|
|||
|
Unsecured Term Loan C
|
150,000
|
|
L + 1.30%
|
|
Sep-29-2020
|
i
|
|||||
|
Unsecured Term Loan B
|
150,000
|
|
|
L + 1.30%
|
|
|
Mar-21-2021
|
i
|
|||
|
Unsecured Term Loan A
|
150,000
|
|
|
L + 1.30%
|
|
|
Mar-31-2022
|
i
|
|||
|
Total unsecured term loans
|
450,000
|
|
|||||||||
|
Less: Total unamortized deferred financing fees and debt issuance costs
|
(3,392
|
)
|
|||||||||
|
Total carrying value unsecured term loans
|
446,608
|
|
|
|
|
|
|
|
|||
|
|
|||||||||||
|
Unsecured notes:
|
|
|
|
|
|
|
|
|
|||
|
Series F Unsecured Notes
|
100,000
|
|
3.98
|
%
|
Jan-05-2023
|
ii
|
|||||
|
Series A Unsecured Notes
|
50,000
|
|
|
4.98
|
%
|
Oct-1-2024
|
ii
|
||||
|
Series D Unsecured Notes
|
100,000
|
|
|
4.32
|
%
|
Feb-20-2025
|
ii
|
||||
|
Series B Unsecured Notes
|
50,000
|
|
|
4.98
|
%
|
Jul-1-2026
|
ii
|
||||
|
Series C Unsecured Notes
|
80,000
|
|
|
4.42
|
%
|
Dec-30-2026
|
ii
|
||||
|
Series E Unsecured Notes
|
20,000
|
|
|
4.42
|
%
|
Feb-20-2027
|
ii
|
||||
|
Total unsecured notes
|
400,000
|
|
|||||||||
|
Less: Total unamortized deferred financing fees and debt issuance costs
|
(2,034
|
)
|
|||||||||
|
Total carrying value unsecured notes
|
397,966
|
|
|
|
|
|
|
||||
|
Mortgage notes (secured debt):
|
|
|
|
|
|
|
|||||
|
Union Fidelity Life Insurance Co.
|
5,384
|
|
5.81
|
%
|
Apr-30-2017
|
iv
|
|||||
|
Webster Bank, National Association
|
2,853
|
|
3.66
|
%
|
|
May-29-2017
|
iii
|
||||
|
Webster Bank, National Association
|
3,073
|
|
3.64
|
%
|
|
May-31-2017
|
iii
|
||||
|
Wells Fargo, National Association
|
4,043
|
|
5.90
|
%
|
|
Aug-1-2017
|
v
|
||||
|
Connecticut General Life Insurance Company -1 Facility
|
35,320
|
|
6.50
|
%
|
|
Feb-1-2018
|
vi
|
||||
|
Connecticut General Life Insurance Company -2 Facility
|
36,892
|
|
|
5.75
|
%
|
Feb-1-2018
|
vi
|
||||
|
Connecticut General Life Insurance Company -3 Facility
|
16,141
|
|
|
5.88
|
%
|
Feb-1-2018
|
vi
|
||||
|
Wells Fargo, National Association CMBS Loan
|
56,608
|
|
|
4.31
|
%
|
Dec-1-2022
|
vii
|
||||
|
Thrivent Financial for Lutherans
|
4,012
|
|
4.78
|
%
|
Dec-15-2023
|
iii
|
|||||
|
Total mortgage notes
|
164,326
|
|
|
|
|
||||||
|
Total unamortized fair market value premiums
|
112
|
|
|
|
|||||||
|
Less: Total unamortized deferred financing fees and debt issuance costs
|
(873
|
)
|
|||||||||
|
Total carrying value mortgage notes
|
163,565
|
|
|
|
|
||||||
|
Total / weighted average interest rate
(4)
|
$
|
1,036,139
|
|
|
3.75
|
%
|
|||||
|
(1)
|
Current interest rate as of
December 31, 2016
. At
December 31, 2016
, the one-month LIBOR (“L”) was
0.77167%
. The current interest rate is not adjusted to include the amortization of deferred financing fees incurred in obtaining debt or the unamortized fair market value premiums.
|
|
(2)
|
Prepayment terms consist of (i) pre-payable with no penalty; (ii) pre-payable with penalty; (iii) pre-payable without penalty
three
months prior to the maturity date; (iv) pre-payable without penalty
two
months prior to the maturity date; (v) pre-payable without penalty
three
months prior to the maturity date; however, can be defeased; (vi) pre-payable without penalty
six
months prior to the maturity date; and (vii) pre-payable without penalty
three
months prior to the maturity date; however, can be defeased beginning January 1, 2016.
|
|
(3)
|
The capacity of the unsecured credit facility is currently
$450.0 million
.
|
|
(4)
|
The weighted average interest rate was calculated using the fixed interest rate swapped on the current notional amount of
$450.0 million
of debt, and is not adjusted to include the amortization of deferred financing fees or debt issuance costs incurred in obtaining debt or any unamortized fair market value premiums.
|
The aggregate undrawn nominal commitments on the
unsecured credit facility
as of
December 31, 2016
was approximately
$418.5 million
, including issued letters of credit. Our actual borrowing capacity at any given point in time may be less and is restricted to a maximum amount based on the our debt covenant compliance.
The Connecticut General Life Insurance Company (“CIGNA”) 1 facility, CIGNA 2 facility and CIGNA 3 facility contain provisions that cross default the loans and cross collateralize the
17
properties held as collateral under each loan. In addition, each of the CIGNA 1 facility, CIGNA 2 facility and CIGNA 3 facility require a 62.5% loan to value (including all acquisition costs) and a debt service coverage ratio of 1.5x, each measured at acquisition, but not as continuing covenants.
57
The Wells Fargo, National Association CMBS loan agreement is a commercial mortgage backed security that provides for a secured loan. There are 24 properties that are collateral for the CMBS loan. Wells Fargo, National Association had the right to securitize any portion or the entire CMBS loan in a single asset securitization or a pooled loan securitization, which it completed on December 19, 2012. The Operating Partnership guarantees the obligations under the CMBS loan.
The chart below details our debt capital structure as of
December 31, 2016
.
|
Debt Capital Structure
|
December 31, 2016
|
|||
|
Total principal outstanding (in thousands)
|
$
|
1,042,326
|
|
|
|
Weighted average duration (years)
|
5.6
|
|
||
|
% Secured debt
|
15.8
|
%
|
||
|
% Debt maturing next 12 months
|
1.5
|
%
|
||
|
Net Debt to Real Estate Cost Basis
(1)
|
41.0
|
%
|
||
|
(1)
|
We define Net Debt as our amounts outstanding under our unsecured credit facility, unsecured term loans, unsecured notes, and mortgage notes, less cash and cash equivalents.
We define Real Estate Cost Basis as the book value of rental property and deferred leasing intangibles, exclusive of the related accumulated depreciation and amortization.
|
We regularly pursue new financing opportunities to ensure an appropriate balance sheet position. As a result of these dedicated efforts, we are confident in our ability to meet future debt maturities and building acquisition funding needs. We believe that our current balance sheet is in an adequate position at the date of this filing, despite possible volatility in the credit markets.
Our interest rate exposure as it relates to interest expense payments on our floating rate debt is managed through our use of interest rate swaps, which fix the rate of our long term floating rate debt. For a detailed discussion on our use of interest rate swaps, see “Interest Rate Risk” below.
Unsecured Credit Facility, Unsecured Term Loans and Unsecured Notes
The unsecured credit facility provides for a facility fee payable by us to the lenders at a rate per annum of 0.2% to 0.35%, depending on our leverage levels, of the aggregate commitments (currently $450.0 million). The facility fee is due and payable quarterly.
Covenants:
Our ability to borrow, maintain borrowings and avoid default under the unsecured credit facility, the unsecured term loans, and unsecured notes is subject to our ongoing compliance with a number of financial covenants, including:
|
•
|
a maximum consolidated leverage ratio of not greater than 0.60:1.00;
|
|
•
|
a maximum secured leverage ratio of not greater than 0.40:1.00;
|
|
•
|
a maximum unencumbered leverage ratio of not greater than 0.60:1.00;
|
|
•
|
a maximum secured recourse debt level of not greater than 0.075:1.00;
|
|
•
|
a minimum fixed charge ratio of not less than 1.50:1.00;
|
|
•
|
a minimum unsecured interest coverage ratio of not less than 1.75:1.00; and
|
|
•
|
a minimum tangible net worth covenant test.
|
The respective note purchase agreements additionally contain a financial covenant that requires us to maintain a minimum interest coverage ratio of 1.50:1.00.
Pursuant to the terms of our unsecured debt agreements, we may not pay distributions that exceed the minimum amount required for us to qualify and maintain our status as a REIT if a default or event of default occurs and is continuing.
Our unsecured credit facility, unsecured term loans, unsecured notes, and mortgage notes are subject to ongoing compliance with a number of financial and other covenants. As of
December 31, 2016
, we were in compliance with the financial covenants in the credit agreement and loan agreements.
Events of Default:
Our unsecured credit facility and unsecured term loans contain customary events of default, including but not limited to non-payment of principal, interest, fees or other amounts, defaults in the compliance with the covenants contained in the documents evidencing the unsecured credit facility and the unsecured term loans, cross-defaults to other material debt and bankruptcy or other insolvency events.
58
Borrower and Guarantors:
The Operating Partnership is the borrower under the unsecured credit facility, the unsecured term loans and is the issuer of the unsecured notes. STAG Industrial, Inc. and certain of its subsidiaries guarantee the obligations under our unsecured debt agreements.
Contractual Obligations
The following table reflects our contractual obligations as of
December 31, 2016
, specifically our obligations under long‑term debt agreements and ground lease agreements.
|
|
Payments by Period
|
|||||||||||||||||||
|
Contractual Obligations (in thousands)
(1)(2)
|
Total
|
2017
|
2018-2019
|
2020-2021
|
Thereafter
|
|||||||||||||||
|
Principal payments
(3)
|
$
|
1,042,326
|
|
$
|
18,737
|
|
$
|
118,504
|
|
$
|
304,109
|
|
$
|
600,976
|
|
|||||
|
Interest payments—Fixed rate debt
(4)
|
166,940
|
|
25,984
|
|
40,858
|
|
40,080
|
|
60,018
|
|
||||||||||
|
Interest payments —Variable rate debt
(4)(5)
|
62,739
|
|
13,098
|
|
28,193
|
|
20,075
|
|
1,373
|
|
||||||||||
|
Property lease
(4)
|
4,945
|
|
1,064
|
|
2,368
|
|
1,513
|
|
—
|
|
||||||||||
|
Ground leases
(4)
|
8,203
|
|
363
|
|
748
|
|
756
|
|
6,336
|
|
||||||||||
|
Other
(4)(6)
|
75
|
|
75
|
|
—
|
|
—
|
|
—
|
|
||||||||||
|
Total
|
$
|
1,285,228
|
|
$
|
59,321
|
|
$
|
190,671
|
|
$
|
366,533
|
|
$
|
668,703
|
|
|||||
|
(1)
|
From time to time in the normal course of our business, we enter into various contracts with third parties that may obligate us to make payments, such as maintenance agreements at our buildings. Such contracts, in the aggregate, do not represent material obligations, are typically short-term and cancellable within 90 days and are not included in the table above.
|
|
(2)
|
The terms of the loan agreements for each of the CIGNA facilities also stipulate that general reserve escrows be funded monthly in an amount equal to eight basis points of the principal of the loans outstanding at the time. Additionally, the Wells Fargo, National Association CMBS loan calls for a monthly leasing escrow payment of approximately $0.1 million and the balance of the reserve is capped at $2.1 million. The cap was met at
December 31, 2016
and the balance at
December 31, 2016
was approximately $2.2 million. The funding of these reserves is not included in the table above.
|
|
(3)
|
The total payments do not include unamortized deferred financing fees, debt issuance costs, or fair market value premiums associated with certain loans.
|
|
(4)
|
This is not included in our Consolidated Balance Sheets included in this report.
|
|
(5)
|
Amounts include interest rate payments on the
$450.0 million
current notional amount of our interest rate swaps, as discussed below.
|
|
(6)
|
Amounts relate to a credit monitoring fee paid to the affiliates of Columbus Nova Real Estate Acquisition Group, Inc.
|
Equity
Preferred Stock
On March 17, 2016, we completed an underwritten public offering of
3,000,000
shares of the
6.875%
Series C Preferred Stock,
$0.01
par value per share, at a price to the public of
$25.00
per share. On
November 2, 2016, we redeemed all of the Series A Preferred Stock. The table below sets forth our outstanding preferred stock issuances as of
December 31, 2016
.
|
Preferred Stock Issuances
|
Issuance Date
|
Number of Shares
|
Price and Liquidation Value Per Share
|
Interest Rate
|
||||||||
|
Series B Cumulative Redeemable Preferred Stock
|
April 16, 2013
|
2,800,000
|
|
$
|
25.00
|
|
6.625
|
%
|
||||
|
Series C Cumulative Redeemable Preferred Stock
|
March 17, 2016
|
3,000,000
|
|
$
|
25.00
|
|
6.875
|
%
|
||||
The Preferred Stock Issuances rank on parity with each other and rank senior to our common stock with respect to dividend rights and
rights upon the liquidation, dissolution or winding up of the Company. The Preferred Stock Issuances have no stated maturity date and are not subject to mandatory redemption or any sinking fund. Generally, we are not permitted to redeem the Series B Preferred Stock and Series C Preferred Stock prior to April 16, 2018 and March 17, 2021, respectively, except in limited circumstances relating to our ability to qualify as a REIT and in certain other circumstances related to a change of control.
Common Stock
The following sets forth our ATM common stock offering program as of
December 31, 2016
. We may from time to time sell common stock through sales agents under the program.
|
ATM Stock Offering Program (in thousands)
|
Date
|
Maximum Aggregate Offering Price
(in thousands) |
Aggregate Common Stock Available as of December 31, 2016 (in thousands)
|
|||||||
|
2016 $228 million ATM
|
November 8, 2016
|
$
|
228,218
|
|
$
|
117,331
|
|
|||
59
The table below sets forth the activity for the ATM common stock offering programs during the three months and year ended
December 31, 2016
(in thousands, except share data).
|
|
Three months ended December 31, 2016
|
||||||||||||||||||
|
ATM Stock Offering Program
|
Shares
Sold |
Weighted Average Price Per Share
|
Gross
Proceeds |
Sales
Agents’ Fee |
Net
Proceeds |
||||||||||||||
|
2016 $228 million ATM
|
4,763,838
|
|
$
|
23.28
|
|
$
|
110,887
|
|
$
|
1,550
|
|
$
|
109,337
|
|
|||||
|
2016 $200 million ATM
(1)
|
3,124,700
|
|
$
|
22.74
|
|
71,069
|
|
918
|
|
70,151
|
|
||||||||
|
Total/weighted average
|
7,888,538
|
|
$
|
23.07
|
|
$
|
181,956
|
|
$
|
2,468
|
|
$
|
179,488
|
|
|||||
|
(1)
|
This program ended before
December 31, 2016
.
|
|
|
Year ended December 31, 2016
|
||||||||||||||||||
|
ATM Stock Offering Program
|
Shares
Sold |
Weighted Average Price Per Share
|
Gross
Proceeds |
Sales
Agents’ Fee |
Net
Proceeds |
||||||||||||||
|
2016 $228 million ATM
|
4,763,838
|
|
$
|
23.28
|
|
$
|
110,887
|
|
$
|
1,550
|
|
$
|
109,337
|
|
|||||
|
2016 $200 million ATM
(1)
|
7,326,200
|
|
$
|
23.45
|
|
171,782
|
|
2,429
|
|
169,353
|
|
||||||||
|
Total/weighted average
|
12,090,038
|
|
$
|
23.38
|
|
$
|
282,669
|
|
$
|
3,979
|
|
$
|
278,690
|
|
|||||
|
(1)
|
This program ended before
December 31, 2016
.
|
Noncontrolling Interest
We own our interests in all of our properties and conduct substantially all of our business through our Operating Partnership. We are the sole member of the sole general partner of the Operating Partnership. As of
December 31, 2016
, we owned approximately
95.7%
of the common units of our Operating Partnership, and our current and former executive officers, directors, senior employees and their affiliates, and third parties who contributed properties to us in exchange for common units in our Operating Partnership, owned the remaining
4.3%
.
Non-cash Compensation Expense
We recorded approximately
$7.8 million
in general and administrative expenses in the accompanying Consolidated Statements of Operations for the year ended
December 31, 2016
for the amortization of our equity incentive plan, excluding severance costs and board of directors' compensation. The following table summarizes the expected amortization of our unrecognized compensation expense over the next five years related to all existing equity awards as of
December 31, 2016
.
|
Year
|
Future Amortization of Non-cash Compensation Expense (in thousands)
|
|||
|
2017
|
$
|
6,902
|
|
|
|
2018
|
$
|
3,215
|
|
|
|
2019
|
$
|
1,646
|
|
|
|
2020
|
$
|
340
|
|
|
|
2021
|
$
|
113
|
|
|
Interest Rate Risk
We use interest rate swaps to fix the rate of our variable rate debt. As of
December 31, 2016
, all of our outstanding variable rate debt, with the exception of our unsecured credit facility, was fixed with interest rate swaps.
We recognize all derivatives on the balance sheet at fair value. If the derivative is designated as a hedge, depending on the nature of the hedge, changes in the fair value of derivatives are either offset against the change in fair value of the hedged assets, liabilities, or firm commitments through earnings or recognized in other comprehensive income (loss), which is a component of equity. The ineffective portion of a derivative’s change in fair value is immediately recognized in earnings. Derivatives that are not designated as hedges must be adjusted to fair value and the changes in fair value must be reflected as income or expense.
We have established criteria for suitable counterparties in relation to various specific types of risk. We only use counterparties that have a credit rating of no lower than investment grade at swap inception from Moody’s Investor Services, Standard & Poor’s, or Fitch Ratings or other nationally recognized rating agencies.
60
The following table details our outstanding interest rate swaps as of
December 31, 2016
.
|
Interest Rate
Derivative Counterparty |
Trade Date
|
Effective Date
|
Notional Amount
(in thousands) |
Fair Value
(in thousands) |
Pay Fixed Interest Rate
|
Receive Variable Interest Rate
|
Maturity Date
|
||||||||||||
|
PNC Bank, N.A.
|
Sep-14-2012
|
Oct-10-2012
|
$
|
10,000
|
|
$
|
6
|
|
0.7945
|
%
|
One-month L
|
Sep-10-2017
|
|||||||
|
Bank of America, N.A.
|
Sep-14-2012
|
Oct-10-2012
|
$
|
10,000
|
|
$
|
6
|
|
0.7945
|
%
|
One-month L
|
Sep-10-2017
|
|||||||
|
UBS AG
|
Sep-14-2012
|
Oct-10-2012
|
$
|
10,000
|
|
$
|
6
|
|
0.7945
|
%
|
One-month L
|
Sep-10-2017
|
|||||||
|
Royal Bank of Canada
|
Sep-14-2012
|
Oct-10-2012
|
$
|
10,000
|
|
$
|
6
|
|
0.7945
|
%
|
One-month L
|
Sep-10-2017
|
|||||||
|
RJ Capital Services, Inc.
|
Sep-14-2012
|
Oct-10-2012
|
$
|
10,000
|
|
$
|
5
|
|
0.7975
|
%
|
One-month L
|
Sep-10-2017
|
|||||||
|
Bank of America, N.A.
|
Sep-20-2012
|
Oct-10-2012
|
$
|
25,000
|
|
$
|
21
|
|
0.7525
|
%
|
One-month L
|
Sep-10-2017
|
|||||||
|
RJ Capital Services, Inc.
|
Sep-24-2012
|
Oct-10-2012
|
$
|
25,000
|
|
$
|
26
|
|
0.7270
|
%
|
One-month L
|
Sep-10-2017
|
|||||||
|
Regions Bank
|
Mar-01-2013
|
Mar-01-2013
|
$
|
25,000
|
|
$
|
131
|
|
1.3300
|
%
|
One-month L
|
Feb-14-2020
|
|||||||
|
Capital One, N.A.
|
Jun-13-2013
|
Jul-01-2013
|
$
|
50,000
|
|
$
|
(274
|
)
|
1.6810
|
%
|
One-month L
|
Feb-14-2020
|
|||||||
|
Capital One, N.A.
|
Jun-13-2013
|
Aug-01-2013
|
$
|
25,000
|
|
$
|
(154
|
)
|
1.7030
|
%
|
One-month L
|
Feb-14-2020
|
|||||||
|
Regions Bank
|
Sep-30-2013
|
Feb-03-2014
|
$
|
25,000
|
|
$
|
(378
|
)
|
1.9925
|
%
|
One-month L
|
Feb-14-2020
|
|||||||
|
The Toronto-Dominion Bank
|
Oct-14-2015
|
Sep-29-2016
|
$
|
25,000
|
|
$
|
217
|
|
1.3830
|
%
|
One-month L
|
Sep-29-2020
|
|||||||
|
PNC Bank, N.A.
|
Oct-14-2015
|
Sep-29-2016
|
$
|
50,000
|
|
$
|
421
|
|
1.3906
|
%
|
One-month L
|
Sep-29-2020
|
|||||||
|
Regions Bank
|
Oct-14-2015
|
Sep-29-2016
|
$
|
35,000
|
|
$
|
292
|
|
1.3858
|
%
|
One-month L
|
Sep-29-2020
|
|||||||
|
U.S. Bank, N.A.
|
Oct-14-2015
|
Sep-29-2016
|
$
|
25,000
|
|
$
|
207
|
|
1.3950
|
%
|
One-month L
|
Sep-29-2020
|
|||||||
|
Capital One, N.A.
|
Oct-14-2015
|
Sep-29-2016
|
$
|
15,000
|
|
$
|
123
|
|
1.3950
|
%
|
One-month L
|
Sep-29-2020
|
|||||||
|
Royal Bank of Canada
|
Jan-08-2015
|
Mar-20-2015
|
$
|
25,000
|
|
$
|
(16
|
)
|
1.7090
|
%
|
One-month L
|
Mar-21-2021
|
|||||||
|
The Toronto-Dominion Bank
|
Jan-08-2015
|
Mar-20-2015
|
$
|
25,000
|
|
$
|
(18
|
)
|
1.7105
|
%
|
One-month L
|
Mar-21-2021
|
|||||||
|
The Toronto-Dominion Bank
|
Jan-08-2015
|
Sep-10-2017
|
$
|
100,000
|
|
$
|
(1,240
|
)
|
2.2255
|
%
|
One-month L
|
Mar-21-2021
|
|||||||
|
Wells Fargo, N.A.
|
Jan-08-2015
|
Mar-20-2015
|
$
|
25,000
|
|
$
|
4
|
|
1.8280
|
%
|
One-month L
|
Mar-31-2022
|
|||||||
|
The Toronto-Dominion Bank
|
Jan-08-2015
|
Feb-14-2020
|
$
|
25,000
|
|
$
|
(50
|
)
|
2.4535
|
%
|
One-month L
|
Mar-31-2022
|
|||||||
|
Regions Bank
|
Jan-08-2015
|
Feb-14-2020
|
$
|
50,000
|
|
$
|
(133
|
)
|
2.4750
|
%
|
One-month L
|
Mar-31-2022
|
|||||||
|
Capital One, N.A.
|
Jan-08-2015
|
Feb-14-2020
|
$
|
50,000
|
|
$
|
(175
|
)
|
2.5300
|
%
|
One-month L
|
Mar-31-2022
|
|||||||
The swaps outlined in the above table were all designated as cash flow hedges of interest rate risk, and all are valued as Level 2 financial instruments. As of
December 31, 2016
, the fair values of
13
of the
23
of our interest rate swaps were in an asset position of approximately
$1.5 million
and
10
interest rate swaps were in a liability position of approximately
$2.5 million
, excluding any adjustment for nonperformance risk related to these agreements.
As of
December 31, 2016
, we had
$478.0 million
of variable rate debt. As of
December 31, 2016
, all of our outstanding variable rate debt, with exception of our unsecured credit facility, was fixed with interest rate swaps. To the extent interest rates increase, interest costs on our floating rate debt not fixed with interest rate swaps will increase, which could adversely affect our cash flow and our ability to pay principal and interest on our debt and our ability to make distributions to our security holders. From time to time, we may enter into interest rate swap agreements and other interest rate hedging contracts, including swaps, caps and floors. In addition, an increase in interest rates could decrease the amounts third parties are willing to pay for our assets, thereby limiting our ability to change our portfolio promptly in response to changes in economic or other conditions.
Inflation
Our business could be impacted in multiple ways due to inflation. We believe, however, that we are well positioned to be able to manage our business in an inflationary environment. Specifically, our weighted average lease term is approximately
4.2 years
and, on average, approximately 10-20% of our leases will roll annually over the next few years. We expect that this lease roll will allows us to capture inflationary increases in rent on a relatively efficient basis. In addition, we have long term liabilities averaging approximately 5.6 years when excluding our unsecured credit facility. Our variable rate debt has been fully swapped to fixed rates through maturity with the exception of the unsecured credit facility. Therefore, as rents rise and increase our operating cash flow, this positive impact will flow more directly to the bottom line without the offset of higher in place debt costs. Lastly, while inflation will likely lead to increases in the operating costs of our portfolio, such as real estate taxes, utility expenses, and other operating expenses, the majority of our leases are either triple net leases or otherwise provide for tenant reimbursement for costs related to these expenses. Therefore, the increased costs in an inflationary environment would generally be passed through to our tenant.
Off-balance Sheet Arrangements
As of
December 31, 2016
, we had no material off-balance sheet arrangements. See the table under “Liquidity and Capital Resources—Contractual Obligations” above for information regarding certain off-balance sheet arrangements.
61
Item 7A. Quantitative
and Qualitative Disclosures about Market Risk
Our future income, cash flows and fair values relevant to financial instruments are dependent upon prevailing market interest rates. Market risk refers to the risk of loss from adverse changes in market prices and interest rates. The primary market risk we are exposed to is interest rate risk. We have used derivative financial instruments to manage, or hedge, interest rate risks related to our borrowings, primarily through interest rate swaps.
As of
December 31, 2016
, we had
$478.0 million
of outstanding variable rate debt, all of which, with the exception of
$28.0 million
of our unsecured credit facility, was fixed with interest rate swaps. To the extent we undertake additional variable rate indebtedness, if interest rates increase, then so will the interest costs on our unhedged variable rate debt, which could adversely affect our cash flow and our ability to pay principal and interest on our debt and our ability to make distributions to our security holders. Further, rising interest rates could limit our ability to refinance existing debt when it matures or significantly increase our future interest expense. From time to time, we enter into interest rate swap agreements and other interest rate hedging contracts, including swaps, caps and floors. While these agreements are intended to lessen the impact of rising interest rates on us, they also expose us to the risk that the other parties to the agreements will not perform, we could incur significant costs associated with the settlement of the agreements, the agreements will be unenforceable and the underlying transactions will fail to qualify as highly-effective cash flow hedges under GAAP. In addition, an increase in interest rates could decrease the amounts third parties are willing to pay for our assets, thereby limiting our ability to change our portfolio promptly in response to changes in economic or other conditions. If interest rates increased by 100 basis
points and assuming we had an outstanding balance of
$28.0 million
on the unsecured credit facility (the portion outstanding at
December 31, 2016
not fixed by interest rate swaps) for the year ended
December 31, 2016
, our interest expense would have increased by approximately
$0.3 million
for the year ended
December 31, 2016
.
As of
December 31, 2016
, approximately
$564.3 million
of our consolidated borrowings bore interest at fixed rates (excluding
$450.0 million
of swapped interest rates), as shown in the future principal debt payment table below (dollars in thousands):
|
Debt
|
2017
|
2018
|
2019
|
2020
|
2021
|
Thereafter
|
Total
|
Fair Value
|
|||||||||||||||||||||||
|
Fixed rate
|
$
|
18,737
|
|
$
|
88,578
|
|
$
|
1,926
|
|
$
|
2,006
|
|
$
|
2,103
|
|
$
|
450,976
|
|
$
|
564,326
|
|
$
|
565,190
|
|
|||||||
|
Average interest rate on fixed rate debt
|
5.03
|
%
|
6.04
|
%
|
4.34
|
%
|
4.34
|
%
|
4.34
|
%
|
4.42
|
%
|
4.69
|
%
|
—
|
|
|||||||||||||||
|
Variable rate
(1)
|
—
|
|
—
|
|
28,000
|
|
150,000
|
|
150,000
|
|
150,000
|
|
478,000
|
|
478,000
|
|
|||||||||||||||
|
Total debt
|
$
|
18,737
|
|
$
|
88,578
|
|
|
$
|
29,926
|
|
$
|
152,006
|
|
$
|
152,103
|
|
$
|
600,976
|
|
$
|
1,042,326
|
|
$
|
1,043,190
|
|
||||||
|
(1)
|
Variable interest rate debt includes the
$450.0 million
variable rate debt that has been swapped to a fixed rate.
|
62
Item 8. Financial Statements
and Supplementary Data
The required response under this Item is submitted in a separate section of this report. See Index to Consolidated Financial Statements on page F-1.
In connection with the preparation of our consolidated financial statements for the year ended December 31, 2016, we identified an error in the estimated useful life of a building acquired in the fourth quarter of 2014. As a result of the error, depreciation expense had been overstated and thereby rental property, net and equity were understated. We concluded that the amounts were not material to any of our previously issued consolidated financial statements. Accordingly, we revised these balances in the Consolidated Financial Statements submitted in a separate section of this report as of and for the years ended December 31, 2015 and December 31, 2014. Other periods that have been revised, including the three and nine months ended September 30, 2016, three and six months ended June 30, 2016 and the three months ended March 31, 2016 will appear in future filings and are included below (unaudited, in thousands, except for per share data). Additionally, the tables below reflect our selected quarterly information for the three months ended December 31, 2015, September 30, 2015, June 30, 2015, and March 31, 2015, and the effects of this revision on those periods (unaudited, in thousands, except for per share data). Selected quarterly information for the three months ended December 31, 2016 is also presented (unaudited, in thousands, except for per share data).
|
Selected Interim Financial Information
|
Three months ended December 31, 2016
|
|||
|
Total revenue
|
$
|
66,534
|
|
|
|
Net income
|
$
|
33,067
|
|
|
|
Net income attributable to common stockholders
|
$
|
28,608
|
|
|
|
Net income per share attributable to common stockholders — basic and diluted
|
$
|
0.38
|
|
|
|
Effect of Revision As of and For the Three and Nine Months Ended September 30, 2016
|
As Previously Reported
|
Adjustment
|
As Revised
|
|||||||||
|
Consolidated Balance Sheet, September 30, 2016
|
||||||||||||
|
Total equity
|
$
|
933,942
|
|
$
|
4,071
|
|
$
|
938,013
|
|
|||
|
Consolidated Statement of Operations, Three Months Ended September 30, 2016
|
||||||||||||
|
Total revenue
|
$
|
62,595
|
|
$
|
—
|
|
$
|
62,595
|
|
|||
|
Depreciation and amortization
|
$
|
32,020
|
|
$
|
(531
|
)
|
$
|
31,489
|
|
|||
|
Total expenses
|
$
|
53,138
|
|
$
|
(531
|
)
|
$
|
52,607
|
|
|||
|
Net income (loss)
|
$
|
(401
|
)
|
$
|
531
|
|
$
|
130
|
|
|||
|
Net income (loss) attributable to STAG Industrial, Inc.
|
$
|
(185
|
)
|
$
|
505
|
|
$
|
320
|
|
|||
|
Net loss attributable to common stockholders
|
$
|
(4,281
|
)
|
$
|
505
|
|
$
|
(3,776
|
)
|
|||
|
Net loss per share attributable to common stockholders — basic and diluted
|
$
|
(0.06
|
)
|
$
|
0.01
|
|
$
|
(0.05
|
)
|
|||
|
Consolidated Statement of Operations, Nine Months Ended September 30, 2016
|
||||||||||||
|
Total revenue
|
$
|
183,709
|
|
$
|
—
|
|
$
|
183,709
|
|
|||
|
Depreciation and amortization
|
$
|
93,318
|
|
$
|
(1,593
|
)
|
$
|
91,725
|
|
|||
|
Total expenses
|
$
|
170,564
|
|
$
|
(1,593
|
)
|
$
|
168,971
|
|
|||
|
Net income
|
$
|
928
|
|
$
|
1,593
|
|
$
|
2,521
|
|
|||
|
Net income attributable to STAG Industrial, Inc.
|
$
|
1,433
|
|
$
|
1,512
|
|
$
|
2,945
|
|
|||
|
Net loss attributable to common stockholders
|
$
|
(9,770
|
)
|
$
|
1,512
|
|
$
|
(8,258
|
)
|
|||
|
Net loss per share attributable to common stockholders — basic and diluted
|
$
|
(0.14
|
)
|
$
|
0.02
|
|
$
|
(0.12
|
)
|
|||
|
Consolidated Statement of Comprehensive Income (Loss), Three Months Ended September 30, 2016
|
||||||||||||
|
Comprehensive income
|
$
|
2,462
|
|
$
|
531
|
|
$
|
2,993
|
|
|||
|
Consolidated Statement of Comprehensive Income (Loss), Nine Months Ended September 30, 2016
|
||||||||||||
|
Comprehensive loss
|
$
|
(13,100
|
)
|
$
|
1,593
|
|
$
|
(11,507
|
)
|
|||
63
|
Effect of Revision As of and For the Three and Six Months Ended June 30, 2016
|
As Previously Reported
|
Adjustment
|
As Revised
|
|||||||||
|
Consolidated Balance Sheet, June 30, 2016
|
||||||||||||
|
Total equity
|
$
|
860,398
|
|
$
|
3,540
|
|
$
|
863,938
|
|
|||
|
Consolidated Statement of Operations, Three Months Ended June 30, 2016
|
||||||||||||
|
Total revenue
|
$
|
60,242
|
|
$
|
—
|
|
$
|
60,242
|
|
|||
|
Depreciation and amortization
|
$
|
31,018
|
|
$
|
(531
|
)
|
$
|
30,487
|
|
|||
|
Total expenses
|
$
|
62,660
|
|
$
|
(531
|
)
|
$
|
62,129
|
|
|||
|
Net loss
|
$
|
(10,472
|
)
|
$
|
531
|
|
$
|
(9,941
|
)
|
|||
|
Net loss attributable to STAG Industrial, Inc.
|
$
|
(9,727
|
)
|
$
|
504
|
|
$
|
(9,223
|
)
|
|||
|
Net loss attributable to common stockholders
|
$
|
(13,823
|
)
|
$
|
504
|
|
$
|
(13,319
|
)
|
|||
|
Net loss per share attributable to common stockholders — basic and diluted
|
$
|
(0.20
|
)
|
$
|
—
|
|
$
|
(0.20
|
)
|
|||
|
Consolidated Statement of Operations, Six Months Ended June 30, 2016
|
||||||||||||
|
Total revenue
|
$
|
121,114
|
|
$
|
—
|
|
$
|
121,114
|
|
|||
|
Depreciation and amortization
|
$
|
61,298
|
|
$
|
(1,062
|
)
|
$
|
60,236
|
|
|||
|
Total expenses
|
$
|
117,426
|
|
$
|
(1,062
|
)
|
$
|
116,364
|
|
|||
|
Net income
|
$
|
1,329
|
|
$
|
1,062
|
|
$
|
2,391
|
|
|||
|
Net income attributable to STAG Industrial, Inc.
|
$
|
1,616
|
|
$
|
1,007
|
|
$
|
2,623
|
|
|||
|
Net loss attributable to common stockholders
|
$
|
(5,492
|
)
|
$
|
1,007
|
|
$
|
(4,485
|
)
|
|||
|
Net loss per share attributable to common stockholders — basic and diluted
|
$
|
(0.08
|
)
|
$
|
0.01
|
|
$
|
(0.07
|
)
|
|||
|
Consolidated Statement of Comprehensive Income (Loss), Three Months Ended June 30, 2016
|
||||||||||||
|
Comprehensive loss
|
$
|
(15,540
|
)
|
$
|
531
|
|
$
|
(15,009
|
)
|
|||
|
Consolidated Statement of Comprehensive Income (Loss), Six Months Ended June 30, 2016
|
||||||||||||
|
Comprehensive loss
|
$
|
(15,562
|
)
|
$
|
1,062
|
|
$
|
(14,500
|
)
|
|||
|
Effect of Revision As of and For the Three Months Ended March 31, 2016
|
As Previously Reported
|
Adjustment
|
As Revised
|
|||||||||
|
Consolidated Balance Sheet, March 31, 2016
|
||||||||||||
|
Total equity
|
$
|
903,510
|
|
$
|
3,009
|
|
$
|
906,519
|
|
|||
|
Consolidated Statement of Operations, Three Months Ended March 31, 2016
|
||||||||||||
|
Total revenue
|
$
|
60,872
|
|
$
|
—
|
|
$
|
60,872
|
|
|||
|
Depreciation and amortization
|
$
|
30,280
|
|
$
|
(531
|
)
|
$
|
29,749
|
|
|||
|
Total expenses
|
$
|
54,766
|
|
$
|
(531
|
)
|
$
|
54,235
|
|
|||
|
Net income
|
$
|
11,801
|
|
$
|
531
|
|
$
|
12,332
|
|
|||
|
Net income attributable to STAG Industrial, Inc.
|
$
|
11,346
|
|
$
|
504
|
|
$
|
11,850
|
|
|||
|
Net income attributable to common stockholders
|
$
|
8,334
|
|
$
|
504
|
|
$
|
8,838
|
|
|||
|
Net income per share attributable to common stockholders — basic and diluted
|
$
|
0.12
|
|
$
|
0.01
|
|
$
|
0.13
|
|
|||
|
Consolidated Statement of Comprehensive Income (Loss), Three Months Ended March 31, 2016
|
||||||||||||
|
Comprehensive income (loss)
|
$
|
(22
|
)
|
$
|
531
|
|
$
|
509
|
|
|||
|
Effect of Revision For the Three Months Ended December 31, 2015
|
As Previously Reported
|
Adjustment
|
As Revised
|
|||||||||
|
Total revenue
|
$
|
58,887
|
|
$
|
—
|
|
$
|
58,887
|
|
|||
|
Net loss
|
$
|
(20,134
|
)
|
$
|
531
|
|
$
|
(19,603
|
)
|
|||
|
Net loss attributable to common stockholders
|
$
|
(21,827
|
)
|
$
|
505
|
|
$
|
(21,322
|
)
|
|||
|
Net loss per share attributable to common stockholders — basic and diluted
|
$
|
(0.32
|
)
|
$
|
0.01
|
|
$
|
(0.31
|
)
|
|||
|
Effect of Revision For the Three Months Ended September 30, 2015
|
As Previously Reported
|
Adjustment
|
As Revised
|
|||||||||
|
Total revenue
|
$
|
55,921
|
|
$
|
—
|
|
$
|
55,921
|
|
|||
|
Net loss
|
$
|
(4,680
|
)
|
$
|
531
|
|
$
|
(4,149
|
)
|
|||
|
Net loss attributable to common stockholders
|
$
|
(7,128
|
)
|
$
|
505
|
|
$
|
(6,623
|
)
|
|||
|
Net loss per share attributable to common stockholders — basic and diluted
|
$
|
(0.11
|
)
|
$
|
0.01
|
|
$
|
(0.10
|
)
|
|||
64
|
Effect of Revision For the Three Months Ended June 30, 2015
|
As Previously Reported
|
Adjustment
|
As Revised
|
|||||||||
|
Total revenue
|
$
|
52,836
|
|
$
|
—
|
|
$
|
52,836
|
|
|||
|
Net loss
|
$
|
(5,228
|
)
|
$
|
531
|
|
$
|
(4,697
|
)
|
|||
|
Net loss attributable to common stockholders
|
$
|
(7,638
|
)
|
$
|
505
|
|
$
|
(7,133
|
)
|
|||
|
Net loss per share attributable to common stockholders — basic and diluted
|
$
|
(0.12
|
)
|
$
|
0.01
|
|
$
|
(0.11
|
)
|
|||
|
Effect of Revision For the Three Months Ended March 31, 2015
|
As Previously Reported
|
Adjustment
|
As Revised
|
|||||||||
|
Total revenue
|
$
|
50,989
|
|
$
|
—
|
|
$
|
50,989
|
|
|||
|
Net loss
|
$
|
(1,427
|
)
|
$
|
531
|
|
$
|
(896
|
)
|
|||
|
Net loss attributable to common stockholders
|
$
|
(4,042
|
)
|
$
|
506
|
|
$
|
(3,536
|
)
|
|||
|
Net loss per share attributable to common stockholders — basic and diluted
|
$
|
(0.06
|
)
|
$
|
—
|
|
$
|
(0.06
|
)
|
|||
Item 9. Changes in and Disagreements
with Accountants on Accounting and Financial Disclosure
None.
Item 9A. Controls and Procedures
Evaluation of Disclosure Controls and Procedures
As required by SEC Rule 13a-15(b), we have evaluated, under the supervision of and with the participation of management, including our Chief Executive Officer and Chief Financial Officer, the effectiveness of the design and operation of our disclosure controls and procedures, as defined in Rules 13a-15(e) and 15d-15(e) of the Exchange Act, as of
December 31, 2016
. Based on the foregoing, our Chief Executive Officer and Chief Financial Officer concluded that our disclosure controls and procedures for the periods covered by this report were effective to provide reasonable assurance that information required to be disclosed by our Company in reports that we file or submit under the Exchange Act is recorded, processed, summarized and reported within the time periods specified in SEC rules and forms and is accumulated and communicated to our management, including our Chief Executive Officer and Chief Financial Officer, as appropriate to allow timely decisions regarding required disclosure.
Management’s Report on Internal Control Over Financial Reporting
Our management is responsible for establishing and maintaining adequate internal control over financial reporting, as such term is defined in Rules 13a-15(f) and 15d-15(f) of the Exchange Act. Under the supervision and with the participation of our management, including our Chief Executive Officer and Chief Financial Officer, we conducted an evaluation of the effectiveness of our internal control over financial reporting based on the framework in
Internal Control—Integrated Framework (2013)
issued by the Committee of Sponsoring Organizations of the Treadway Commission. Based on our evaluation under the framework in
Internal Control—Integrated Framework (2013)
, our management concluded that our internal control over financial reporting was effective as of
December 31, 2016
.
The effectiveness of our internal control over financial reporting as of
December 31, 2016
has been audited by PricewaterhouseCoopers LLP, an independent registered public accounting firm, as stated in their report, which appears on page F-2 of this Annual Report on Form 10‑K.
Changes in Internal Controls
There was no change to our internal control over financial reporting during the fourth quarter ended
December 31, 2016
that has materially affected, or is reasonably likely to materially affect, our internal control over financial reporting.
Item 9B. Other Information
None.
PART III.
Item 10. Directors, Executive Officers and Corporate Governance
The information required by Item 10 will be included in the Proxy Statement to be filed relating to our
2017
Annual Meeting of Stockholders and is incorporated herein by reference.
65
Item 11. Executive Compensation
The information required by Item 11 will be included in the Proxy Statement to be filed relating to our
2017
Annual Meeting of Stockholders and is incorporated herein by reference.
Item 12. Security Ownership
of Certain Beneficial Owners and Management and Related Stockholder Matters
The information required by Item 12 will be included in the Proxy Statement to be filed relating to our
2017
Annual Meeting of Stockholders and is incorporated herein by reference.
Item 13. Certain Relationships
and Related Transactions, and Director Independence
The information required by Item 13 will be included in the Proxy Statement to be filed relating to our
2017
Annual Meeting of Stockholders and is incorporated herein by reference.
Item 14. Principal Accountant
Fees and Services
The information required by Item 14 will be included in the Proxy Statement to be filed relating to our
2017
Annual Meeting of Stockholders and is incorporated herein by reference.
PART IV.
Item 15. Exhibits and Financial Statement Schedules
|
1.
|
Consolidated Financial Statements
|
The financial statements listed in the accompanying Index to Consolidated Financial Statements on page F-1 are filed as a part of this report.
|
2.
|
Financial Statement Schedules
|
The financial statement schedules required by this Item are filed with this report and listed in the accompanying Index to Consolidated Financial Statements on page F-1. All other financial statement schedules are not applicable.
|
3.
|
Exhibits
|
The following exhibits are filed as part of this report:
|
Exhibit Number
|
|
Description of Document
|
|
|
3.1
|
|
|
Articles of Amendment and Restatement of STAG Industrial, Inc. (including all articles of amendment and articles supplementary) (1)
|
|
3.2
|
|
|
Amended and Restated Bylaws of STAG Industrial, Inc. (2)
|
|
4.1
|
|
|
Form of Common Stock Certificate of STAG Industrial, Inc. (3)
|
|
4.2
|
|
|
Form of Certificate for the 6.625% Series B Cumulative Redeemable Preferred Stock of STAG Industrial, Inc. (4)
|
|
4.3
|
|
|
Form of Certificate for the 6.875% Series C Cumulative Redeemable Preferred Stock of STAG Industrial, Inc. (5)
|
|
10.1
|
|
|
Amended and Restated Agreement of Limited Partnership of STAG Industrial Operating Partnership, L.P. (6)
|
|
10.2
|
|
|
First Amendment to the Amended and Restated Agreement of Limited Partnership of STAG Industrial Operating Partnership, L.P. (7)
|
|
10.3
|
|
|
Second Amendment to the Amended and Restated Agreement of Limited Partnership of STAG Industrial Operating Partnership, L.P. (8)
|
|
10.4
|
|
Third Amendment to the Amended and Restated Agreement of Limited Partnership of STAG Industrial Operating Partnership, L.P. (9)
|
|
|
10.5
|
|
|
2011 Equity Incentive Plan (10)*
|
|
10.6
|
|
|
Amendment to the 2011 Equity Incentive Plan, dated as of May 6, 2013 (11)*
|
|
10.7
|
|
|
Second Amendment to the 2011 Equity Incentive Plan, dated as of February 20, 2015 (12)*
|
|
10.8
|
|
|
2015 Outperformance Program (13)*
|
|
10.9
|
|
|
Form of LTIP Unit Agreement (10)*
|
66
|
Exhibit Number
|
|
Description of Document
|
|
|
10.10
|
|
Form of Performance Award Agreement (1)*
|
|
|
10.11
|
|
|
Amended and Restated Executive Employment Agreement with Benjamin S. Butcher, dated May 4, 2015 (14)*
|
|
10.12
|
|
|
Executive Employment Agreement with William R. Crooker, dated February 25, 2016 (11)*
|
|
10.13
|
|
|
Executive Employment Agreement with Stephen C. Mecke, dated April 20, 2011 (6)*
|
|
10.14
|
|
|
Executive Employment Agreement with Jeffrey M. Sullivan, dated October 27, 2014 (6)*
|
|
10.15
|
|
|
Executive Employment Agreement with David G. King, dated April 20, 2011 (6)*
|
|
10.16
|
|
Executive Employment Agreement with Peter S. Fearey, dated February 25, 2016 (1)*
|
|
|
10.17
|
|
|
Form of Indemnification Agreement between STAG Industrial, Inc. and its directors and officers (17)*
|
|
10.18
|
|
|
Registration Rights Agreement, dated April 20, 2011, by and among STAG Industrial, Inc., STAG Industrial Operating Partnership, L.P. and the persons named therein (6)
|
|
10.19
|
|
|
Services Agreement between STAG Industrial Management, LLC and STAG Manager II, LLC, as amended (18)
|
|
10.20
|
|
|
Credit Agreement, dated as of December 18, 2014, among STAG Industrial Operating Partnership, L.P., STAG Industrial, Inc., Wells Fargo Bank, National Association, and the other lenders party thereto (19)
|
|
10.21
|
|
|
First Amendment to Credit Agreement, dated as of September 29, 2015, among STAG Industrial Operating Partnership, L.P., STAG Industrial, Inc., Wells Fargo Bank, National Association, and the other lenders party thereto (20)
|
|
10.22
|
|
|
Second Amended and Restated Term Loan Agreement, dated as of December 20, 2016, by and among STAG Industrial Operating Partnership, L.P., STAG Industrial, Inc., Wells Fargo Bank, National Association, and the other lenders party thereto (21)
|
|
10.23
|
|
|
Amended and Restated Term Loan Agreement, dated as of December 20, 2016, by and among STAG Industrial Operating Partnership, L.P., STAG Industrial, Inc., Wells Fargo Bank, National Association, and the other lenders party thereto (21)
|
|
10.24
|
|
|
Term Loan Agreement, dated as of September 29, 2015, by and among STAG Industrial Operating Partnership, L.P., STAG Industrial, Inc., Wells Fargo Bank, National Association, and the other lenders party thereto (20)
|
|
10.25
|
|
|
Note Purchase Agreement, dated as of April 16, 2014, by and among STAG Industrial Operating Partnership, L.P., STAG Industrial, Inc. and the purchasers named therein (22)
|
|
10.26
|
|
|
First Amendment to Note Purchase Agreement, dated as of December 18, 2014, among STAG Industrial Operating Partnership, L.P., STAG Industrial, Inc. and the noteholders named therein (19)
|
|
10.27
|
|
|
Second Amendment to Note Purchase Agreement, dated as of December 1, 2015, among STAG Industrial Operating Partnership, L.P., STAG Industrial, Inc. and the noteholders named therein (23)
|
|
10.28
|
|
|
Note Purchase Agreement, dated as of December 18, 2014, among STAG Industrial Operating Partnership, L.P., STAG Industrial, Inc. and the purchasers named therein (19)
|
|
10.29
|
|
|
First Amendment to Note Purchase Agreement, dated as of December 1, 2015, among STAG Industrial Operating Partnership, L.P., STAG Industrial, Inc. and the noteholders named therein (23)
|
|
10.30
|
|
|
Note Purchase Agreement, dated as of December 1, 2015, among STAG Industrial Operating Partnership, L.P., STAG Industrial, Inc. and the purchasers named therein (23)
|
|
12.1
|
|
|
Computation of ratios of earnings to fixed charges and earnings to fixed charges and preferred stock dividends
|
|
21.1
|
|
|
Subsidiaries of STAG Industrial, Inc.
|
|
23.1
|
|
|
Consent of PricewaterhouseCoopers LLP
|
|
24.1
|
|
|
Power of Attorney (included on signature page)
|
|
31.1
|
|
|
Certification of Chief Executive Officer Pursuant to Section 302 of the Sarbanes-Oxley Act of 2002
|
|
31.2
|
|
|
Certification of Chief Financial Officer Pursuant to Section 302 of the Sarbanes-Oxley Act of 2002
|
|
32.1
|
|
|
Certification of Chief Executive Officer and Chief Financial Officer Pursuant to 18 U.S.C. Section 1350, as Adopted Pursuant to Section 906 of the Sarbanes-Oxley Act of 2002
|
|
101
|
|
|
The following materials from STAG Industrial, Inc.'s Annual Report on Form 10-K for the year ended December 31, 2016 formatted in XBRL (eXtensible Business Reporting Language): (i) the Consolidated Balance Sheets, (ii) the Consolidated Statements of Operations, (iii) the Consolidated Statements of Comprehensive Income (Loss), (vi) the Consolidated Statements of Equity, (v) the Consolidated Statements of Cash Flows, and (vi) related notes to these consolidated financial statements.
|
|
*
|
Represents management contract or compensatory plan or arrangement.
|
|
(1)
|
Incorporated by reference to STAG Industrial, Inc.'s Quarterly Report on Form 10-Q filed with the SEC on May 3, 2016.
|
67
|
(2)
|
Incorporated by reference to STAG Industrial, Inc.'s Registration Statement on Form S-11/A (File No. 333-168368) filed with the SEC on April 8, 2011.
|
|
(3)
|
Incorporated by reference to STAG Industrial, Inc.'s Registration Statement on Form S-11/A (File No. 333-168368) filed with the SEC on September 24, 2010.
|
|
(4)
|
Incorporated by reference to STAG Industrial, Inc.'s Registration Statement on Form 8-A filed with the SEC on April 11, 2013.
|
|
(5)
|
Incorporated by reference to STAG Industrial, Inc.'s Registration Statement on Form 8-A filed with the SEC on March 10, 2016.
|
|
(6)
|
Incorporated by reference to STAG Industrial, Inc.'s Current Report on Form 8-K filed with the SEC on April 21, 2011.
|
|
(7)
|
Incorporated by reference to STAG Industrial, Inc.'s Current Report on Form 8-K filed with the SEC on November 2, 2011.
|
|
(8)
|
Incorporated by reference to STAG Industrial, Inc.'s Current Report on Form 8-K filed with the SEC on April 16, 2013.
|
|
(9)
|
Incorporated by reference to STAG Industrial, Inc.'s Current Report on Form 8-K filed with the SEC on March 18, 2016.
|
|
(10)
|
Incorporated by reference to STAG Industrial, Inc.'s Registration Statement on Form S-11/A (File No. 333-168368) filed with the SEC on April 5, 2011.
|
|
(11)
|
Incorporated by reference to STAG Industrial, Inc.'s Current Report on Form 8-K filed with the SEC on May 6, 2013.
|
|
(12)
|
Incorporated by reference to STAG Industrial, Inc.'s Annual Report on Form 10-K filed with the SEC on February 23, 2015.
|
|
(13)
|
Incorporated by reference to STAG Industrial, Inc.'s Current Report on Form 8-K filed with the SEC on January 15, 2015.
|
|
(14)
|
Incorporated by reference to STAG Industrial, Inc.'s Quarterly Report on Form 10-Q filed with the SEC on July 23, 2015.
|
|
(15)
|
Incorporated by reference to STAG Industrial, Inc.'s Current Report on Form 8-K filed with the SEC on May 16, 2014.
|
|
(16)
|
Incorporated by reference to STAG Industrial, Inc.'s Quarterly Report on Form 10-Q filed with the SEC on October 31, 2014.
|
|
(17)
|
Incorporated by reference to STAG Industrial, Inc.'s Registration Statement on Form S-11/A (File No. 333-168368) filed with the SEC on February 16, 2011.
|
|
(18)
|
Incorporated by reference to STAG Industrial, Inc.'s Annual Report on Form 10-K filed with the SEC on February 26, 2014.
|
|
(19)
|
Incorporated by reference to STAG Industrial, Inc.'s Current Report on Form 8-K filed with the SEC on December 19, 2014.
|
|
(20)
|
Incorporated by reference to STAG Industrial, Inc.'s Current Report on Form 8-K filed with the SEC on October 1, 2015.
|
|
(21)
|
Incorporated by reference to STAG Industrial, Inc.'s Current Report on Form 8-K filed with the SEC on December 27, 2016.
|
|
(22)
|
Incorporated by reference to STAG Industrial, Inc.'s Current Report on Form 8-K filed with the SEC on April 22, 2014.
|
|
(23)
|
Incorporated by reference to STAG Industrial, Inc.'s Current Report on Form 8-K filed with the SEC on December 4, 2015.
|
Item 16. Form 10-K Summary
None.
68
SIGNATURES
Pursuant to the requirements of Section 13 or 15(d) of the Securities Exchange Act of 1934, the registrant has duly caused this report to be signed on its behalf by the undersigned, thereunto duly authorized.
|
|
STAG INDUSTRIAL, INC.
|
||
|
Dated: February 16, 2017
|
|
|
|
|
|
|
/s/ Benjamin S. Butcher
|
|
|
|
By:
|
Benjamin S. Butcher
Chairman, Chief Executive Officer and President
|
|
KNOW ALL MEN BY THESE PRESENTS, that we, the undersigned officers and directors of STAG Industrial, Inc., hereby severally constitute Benjamin S. Butcher and William R. Crooker, and each of them singly, our true and lawful attorneys with full power to them, and each of them singly, to sign for us and in our names in the capacities indicated below, the Form 10-K filed herewith and any and all amendments to said Form 10-K, and generally to do all such things in our names and in our capacities as officers and directors to enable STAG Industrial, Inc. to comply with the provisions of the Securities Exchange Act of 1934, as amended, and all requirements of the Securities and Exchange Commission, hereby ratifying and confirming our signatures as they may be signed by our said attorneys, or any of them, to said Form 10-K and any and all amendments thereto.
Pursuant to the requirements of the Securities Exchange Act of 1934, this report has been signed below by the following persons on behalf of the registrant and in the capacities and dates indicated.
|
Date
|
Signature
|
Title
|
|
|
|
|
|
February 16, 2017
|
/s/ Benjamin S. Butcher
|
Chairman, Chief Executive Officer
(principal executive officer) and President
|
|
Benjamin S. Butcher
|
||
|
February 16, 2017
|
/s/ Virgis W. Colbert
|
Director
|
|
Virgis W. Colbert
|
||
|
February 16, 2017
|
/s/ Jeffrey D. Furber
|
Director
|
|
Jeffrey D. Furber
|
||
|
February 16, 2017
|
/s/ Larry T. Guillemette
|
Director
|
|
Larry T. Guillemette
|
||
|
February 16, 2017
|
/s/ Francis X. Jacoby III
|
Director
|
|
Francis X. Jacoby III
|
||
|
February 16, 2017
|
/s/ Christopher P. Marr
|
Director
|
|
Christopher P. Marr
|
||
|
February 16, 2017
|
/s/ Hans S. Weger
|
Director
|
|
Hans S. Weger
|
||
|
February 16, 2017
|
/s/ William R. Crooker
|
Chief Financial Officer, Executive Vice President and Treasurer (principal financial and accounting officer)
|
|
William R. Crooker
|
||
69
INDEX TO CONSOLIDATED FINANCIAL STATEMENTS
F-1
Report of Independent Registered Public Accounting Firm
To
the Board of Directors and Stockholders of STAG Industrial, Inc.:
In our opinion, the accompanying consolidated balance sheets and the related consolidated statements of operations, comprehensive income (loss), equity and cash flows present fairly, in all material respects, the financial position of STAG Industrial, Inc. and its subsidiaries at December 31, 2016 and 2015, and the results of their operations and their cash flows for each of the three years in the period ended December 31, 2016 in conformity with accounting principles generally accepted in the United States of America. In addition, in our opinion, the financial statement schedules listed in the accompanying index present fairly, in all material respects, the information set forth therein when read in conjunction with the related consolidated financial statements. Also in our opinion, the Company maintained, in all material respects, effective internal control over financial reporting as of December 31, 2016, based on criteria established in
Internal Control - Integrated Framework
(2013)
issued by the Committee of Sponsoring Organizations of the Treadway Commission (COSO). The Company's management is responsible for these financial statements and financial statement schedules, for maintaining effective internal control over financial reporting and for its assessment of the effectiveness of internal control over financial reporting, included in Management's Report on Internal Control over Financial Reporting appearing under Item 9A. Our responsibility is to express opinions on these financial statements, on the financial statement schedules, and on the Company's internal control over financial reporting based on our integrated audits. We conducted our audits in accordance with the standards of the Public Company Accounting Oversight Board (United States). Those standards require that we plan and perform the audits to obtain reasonable assurance about whether the financial statements are free of material misstatement and whether effective internal control over financial reporting was maintained in all material respects. Our audits of the financial statements included examining, on a test basis, evidence supporting the amounts and disclosures in the financial statements, assessing the accounting principles used and significant estimates made by management, and evaluating the overall financial statement presentation. Our audit of internal control over financial reporting included obtaining an understanding of internal control over financial reporting, assessing the risk that a material weakness exists, and testing and evaluating the design and operating effectiveness of internal control based on the assessed risk. Our audits also included performing such other procedures as we considered necessary in the circumstances. We believe that our audits provide a reasonable basis for our opinions.
A company’s internal control over financial reporting is a process designed to provide reasonable assurance regarding the reliability of financial reporting and the preparation of financial statements for external purposes in accordance with generally accepted accounting principles. A company’s internal control over financial reporting includes those policies and procedures that (i) pertain to the maintenance of records that, in reasonable detail, accurately and fairly reflect the transactions and dispositions of the assets of the company; (ii) provide reasonable assurance that transactions are recorded as necessary to permit preparation of financial statements in accordance with generally accepted accounting principles, and that receipts and expenditures of the company are being made only in accordance with authorizations of management and directors of the company; and (iii) provide reasonable assurance regarding prevention or timely detection of unauthorized acquisition, use, or disposition of the company’s assets that could have a material effect on the financial statements.
Because of its inherent limitations, internal control over financial reporting may not prevent or detect misstatements. Also, projections of any evaluation of effectiveness to future periods are subject to the risk that controls may become inadequate because of changes in conditions, or that the degree of compliance with the policies or procedures may deteriorate.
/s/ PricewaterhouseCoopers LLP
Boston, Massachusetts
February 16, 2017
F-2
STAG Industrial, Inc.
(in thousands, except share data)
|
|
December 31, 2016
|
|
December 31, 2015
|
||||
|
Assets
|
|
|
|
||||
|
Rental Property:
|
|
|
|
||||
|
Land
|
$
|
272,162
|
|
|
$
|
228,919
|
|
|
Buildings and improvements, net of accumulated depreciation of $187,413 and $147,917, respectively
|
1,550,141
|
|
|
1,334,776
|
|
||
|
Deferred leasing intangibles, net of accumulated amortization of $237,456 and $200,758, respectively
|
294,533
|
|
|
276,272
|
|
||
|
Total rental property, net
|
2,116,836
|
|
|
1,839,967
|
|
||
|
Cash and cash equivalents
|
12,192
|
|
|
12,011
|
|
||
|
Restricted cash
|
9,613
|
|
|
8,395
|
|
||
|
Tenant accounts receivable, net
|
25,223
|
|
|
21,478
|
|
||
|
Prepaid expenses and other assets
|
20,821
|
|
|
18,064
|
|
||
|
Interest rate swaps
|
1,471
|
|
|
1,867
|
|
||
|
Total assets
|
$
|
2,186,156
|
|
|
$
|
1,901,782
|
|
|
Liabilities and Equity
|
|
|
|||||
|
Liabilities:
|
|
|
|||||
|
Unsecured credit facility
|
$
|
28,000
|
|
|
$
|
56,000
|
|
|
Unsecured term loans, net
|
446,608
|
|
|
296,618
|
|
||
|
Unsecured notes, net
|
397,966
|
|
|
397,720
|
|
||
|
Mortgage notes, net
|
163,565
|
|
|
229,910
|
|
||
|
Accounts payable, accrued expenses and other liabilities
|
35,389
|
|
|
25,662
|
|
||
|
Interest rate swaps
|
2,438
|
|
|
3,766
|
|
||
|
Tenant prepaid rent and security deposits
|
15,195
|
|
|
14,628
|
|
||
|
Dividends and distributions payable
|
9,728
|
|
|
8,234
|
|
||
|
Deferred leasing intangibles, net of accumulated amortization of $10,450 and $8,536, respectivel
y
|
20,341
|
|
|
11,387
|
|
||
|
Total liabilities
|
1,119,230
|
|
|
1,043,925
|
|
||
|
Commitments and contingencies (Note 11)
|
|
|
|
||||
|
Equity:
|
|
|
|
||||
|
Preferred stock, par value $0.01 per share, 15,000,000 shares authorized,
|
|
|
|
||||
|
Series A, no shares issued and outstanding at December 31, 2016 and 2,760,000 shares (liquidation preference of $25.00 per share) issued and outstanding at December 31, 2015
|
—
|
|
|
69,000
|
|
||
|
Series B, 2,800,000 shares (liquidation preference of $25.00 per share) issued and outstanding at December 31, 2016 and December 31, 2015
|
70,000
|
|
|
70,000
|
|
||
|
Series C, 3,000,000 shares (liquidation preference of $25.00 per share) issued and outstanding at December 31, 2016 and no shares issued and outstanding at December 31, 2015
|
75,000
|
|
—
|
|
|||
|
Common stock, par value $0.01 per share, 150,000,000 shares authorized, 80,352,304 and 68,077,333 shares issued and outstanding at December 31, 2016 and December 31, 2015, respectively
|
804
|
|
681
|
|
|||
|
Additional paid-in capital
|
1,293,706
|
|
|
1,017,397
|
|
||
|
Common stock dividends in excess of earnings
|
(410,978
|
)
|
|
(332,271
|
)
|
||
|
Accumulated other comprehensive loss
|
(1,496
|
)
|
|
(2,350
|
)
|
||
|
Total stockholders’ equity
|
1,027,036
|
|
|
822,457
|
|
||
|
Noncontrolling interest
|
39,890
|
|
|
35,400
|
|
||
|
Total equity
|
1,066,926
|
|
|
857,857
|
|
||
|
Total liabilities and equity
|
$
|
2,186,156
|
|
|
$
|
1,901,782
|
|
The accompanying notes are an integral part of these financial statements.
F-3
STAG Industrial, Inc.
(in thousands, except share data)
|
|
Year ended December 31,
|
||||||||||
|
|
2016
|
2015
|
2014
|
||||||||
|
Revenue
|
|
|
|
|
|
|
|||||
|
Rental income
|
$
|
212,741
|
|
|
$
|
186,463
|
|
$
|
149,470
|
|
|
|
Tenant recoveries
|
37,107
|
|
|
31,666
|
|
23,607
|
|
||||
|
Other income
|
395
|
|
|
504
|
|
739
|
|
||||
|
Total revenue
|
250,243
|
|
218,633
|
|
173,816
|
|
|||||
|
Expenses
|
|
|
|
|
|
|
|
||||
|
Property
|
48,904
|
|
|
42,627
|
|
33,388
|
|
||||
|
General and administrative
|
33,395
|
|
|
28,750
|
|
26,396
|
|
||||
|
Property acquisition costs
|
4,567
|
|
|
4,757
|
|
4,390
|
|
||||
|
Depreciation and amortization
|
125,444
|
|
|
110,421
|
|
87,703
|
|
||||
|
Loss on impairments
|
16,845
|
|
|
29,272
|
|
2,840
|
|
||||
|
Other expenses
|
1,149
|
|
|
1,048
|
|
803
|
|
||||
|
Total expenses
|
230,304
|
|
216,875
|
|
155,520
|
|
|||||
|
Other income (expense)
|
|
|
|
|
|
|
|
||||
|
Interest income
|
10
|
|
|
9
|
|
15
|
|
||||
|
Interest expense
|
(42,923
|
)
|
|
(36,098
|
)
|
(25,109
|
)
|
||||
|
Loss on extinguishment of debt
|
(3,261
|
)
|
|
—
|
|
(686
|
)
|
||||
|
Gain on the sales of rental property, net
|
61,823
|
|
|
4,986
|
|
2,799
|
|
||||
|
Total other income (expense)
|
15,649
|
|
(31,103
|
)
|
(22,981
|
)
|
|||||
|
Net income (loss)
|
$
|
35,588
|
|
$
|
(29,345
|
)
|
$
|
(4,685
|
)
|
||
|
Less: income (loss) attributable to noncontrolling interest after preferred stock dividends
|
1,069
|
|
|
(1,962
|
)
|
(992
|
)
|
||||
|
Net income (loss) attributable to STAG Industrial, Inc.
|
$
|
34,519
|
|
$
|
(27,383
|
)
|
$
|
(3,693
|
)
|
||
|
Less: preferred stock dividends
|
13,897
|
|
|
10,848
|
|
10,848
|
|
||||
|
Less: amount allocated to participating securities
|
384
|
|
|
385
|
|
345
|
|
||||
|
Net income (loss) attributable to common stockholders
|
$
|
20,238
|
|
$
|
(38,616
|
)
|
$
|
(14,886
|
)
|
||
|
Weighted average common shares outstanding — basic
|
70,637,185
|
|
|
66,307,972
|
|
54,086,345
|
|
||||
|
Weighted average common shares outstanding — diluted
|
70,852,548
|
|
66,307,972
|
|
54,086,345
|
|
|||||
|
Net income (loss) per share — basic and diluted
|
|
|
|
|
|
|
|
||||
|
Net income (loss) per share attributable to common stockholders — basic
|
$
|
0.29
|
|
|
$
|
(0.58
|
)
|
$
|
(0.28
|
)
|
|
|
Net income (loss) per share attributable to common stockholders — diluted
|
$
|
0.29
|
|
$
|
(0.58
|
)
|
$
|
(0.28
|
)
|
||
The accompanying notes are an integral part of these financial statements.
F-4
STAG Industrial, Inc.
Consolidated Statements of Comprehensive Income (Loss)
(in thousands)
|
|
Year ended December 31,
|
||||||||||
|
|
2016
|
2015
|
2014
|
||||||||
|
Net income (loss)
|
$
|
35,588
|
|
$
|
(29,345
|
)
|
$
|
(4,685
|
)
|
||
|
Other comprehensive income (loss):
|
|
|
|
||||||||
|
Income (loss) on interest rate swaps
|
898
|
|
(1,956
|
)
|
(4,197
|
)
|
|||||
|
Other comprehensive income (loss)
|
898
|
|
(1,956
|
)
|
(4,197
|
)
|
|||||
|
Comprehensive income (loss)
|
36,486
|
|
(31,301
|
)
|
(8,882
|
)
|
|||||
|
Net (income) loss attributable to noncontrolling interest after preferred stock dividends
|
(1,069
|
)
|
1,962
|
|
992
|
|
|||||
|
Other comprehensive (income) loss attributable to noncontrolling interest
|
(44
|
)
|
95
|
|
268
|
|
|||||
|
Comprehensive income (loss) attributable to STAG Industrial, Inc.
|
$
|
35,373
|
|
$
|
(29,244
|
)
|
$
|
(7,622
|
)
|
||
The accompanying notes are an integral part of these financial statements.
F-5
STAG Industrial, Inc.
Consolidated
Statements of Equity
(in thousands, except share data)
|
|
Preferred Stock
|
Common Stock
|
Additional Paid-in Capital
|
Common Stock Dividends in excess of Earnings
|
Accumulated Other Comprehensive income (loss)
|
Total Stockholders' Equity
|
Noncontrolling Interest - Unit holders in Operating Partnership
|
Total Equity
|
||||||||||||||||||||||||||
|
|
Shares
|
Amount
|
||||||||||||||||||||||||||||||||
|
Balance, December 31, 2013
|
$
|
139,000
|
|
44,764,377
|
|
$
|
447
|
|
$
|
577,039
|
|
$
|
(116,877
|
)
|
$
|
3,440
|
|
$
|
603,049
|
|
$
|
71,515
|
|
$
|
674,564
|
|
||||||||
|
Proceeds from sales of common stock
|
—
|
|
14,406,376
|
|
144
|
|
316,548
|
|
—
|
|
—
|
|
316,692
|
|
—
|
|
316,692
|
|
||||||||||||||||
|
Offering costs
|
—
|
|
—
|
|
—
|
|
(8,899
|
)
|
—
|
|
—
|
|
(8,899
|
)
|
—
|
|
(8,899
|
)
|
||||||||||||||||
|
Issuance of restricted stock, net
|
—
|
|
101,412
|
|
1
|
|
(1
|
)
|
—
|
|
—
|
|
—
|
|
—
|
|
—
|
|
||||||||||||||||
|
Issuance of common stock
|
—
|
|
13,446
|
|
—
|
|
—
|
|
—
|
|
—
|
|
—
|
|
—
|
|
—
|
|
||||||||||||||||
|
Issuance of equity pursuant to outperformance program
|
—
|
|
43,657
|
|
1
|
|
(1,491
|
)
|
—
|
|
—
|
|
(1,490
|
)
|
1,015
|
|
(475
|
)
|
||||||||||||||||
|
Dividends and distributions, net
|
(10,848
|
)
|
—
|
|
—
|
|
—
|
|
(71,491
|
)
|
—
|
|
(82,339
|
)
|
(4,361
|
)
|
(86,700
|
)
|
||||||||||||||||
|
Non-cash compensation
|
—
|
|
—
|
|
—
|
|
1,924
|
|
—
|
|
—
|
|
1,924
|
|
5,355
|
|
7,279
|
|
||||||||||||||||
|
Redemption of common units to common stock
|
—
|
|
5,105,584
|
|
51
|
|
54,681
|
|
—
|
|
—
|
|
54,732
|
|
(54,732
|
)
|
—
|
|
||||||||||||||||
|
Redemption of common units for cash
|
—
|
|
—
|
|
—
|
|
—
|
|
—
|
|
—
|
|
—
|
|
(1,701
|
)
|
(1,701
|
)
|
||||||||||||||||
|
Rebalancing of noncontrolling interest
|
—
|
|
—
|
|
—
|
|
(11,550
|
)
|
—
|
|
—
|
|
(11,550
|
)
|
11,550
|
|
—
|
|
||||||||||||||||
|
Other comprehensive loss
|
—
|
|
—
|
|
—
|
|
—
|
|
—
|
|
(3,929
|
)
|
(3,929
|
)
|
(268
|
)
|
(4,197
|
)
|
||||||||||||||||
|
Net loss
|
10,848
|
|
—
|
|
—
|
|
—
|
|
(14,541
|
)
|
—
|
|
(3,693
|
)
|
(992
|
)
|
(4,685
|
)
|
||||||||||||||||
|
Balance, December 31, 2014
|
$
|
139,000
|
|
64,434,852
|
|
$
|
644
|
|
$
|
928,251
|
|
$
|
(202,909
|
)
|
$
|
(489
|
)
|
$
|
864,497
|
|
$
|
27,381
|
|
$
|
891,878
|
|
||||||||
|
Proceeds from sales of common stock
|
—
|
|
3,456,403
|
|
35
|
|
74,857
|
|
—
|
|
—
|
|
74,892
|
|
—
|
|
74,892
|
|
||||||||||||||||
|
Offering costs
|
—
|
|
—
|
|
—
|
|
(1,229
|
)
|
—
|
|
—
|
|
(1,229
|
)
|
—
|
|
(1,229
|
)
|
||||||||||||||||
|
Issuance of restricted stock, net
|
—
|
|
79,384
|
|
1
|
|
(1
|
)
|
—
|
|
—
|
|
—
|
|
—
|
|
—
|
|
||||||||||||||||
|
Issuance of common stock
|
—
|
|
15,870
|
|
—
|
|
—
|
|
—
|
|
—
|
|
—
|
|
—
|
|
—
|
|
||||||||||||||||
|
Dividends and distributions, net
|
(10,848
|
)
|
—
|
|
—
|
|
—
|
|
(91,131
|
)
|
—
|
|
(101,979
|
)
|
(4,772
|
)
|
(106,751
|
)
|
||||||||||||||||
|
Non-cash compensation
|
—
|
|
—
|
|
—
|
|
2,805
|
|
—
|
|
—
|
|
2,805
|
|
4,774
|
|
7,579
|
|
||||||||||||||||
|
Redemption of common units to common stock
|
—
|
|
90,824
|
|
1
|
|
1,002
|
|
—
|
|
—
|
|
1,003
|
|
(1,003
|
)
|
—
|
|
||||||||||||||||
|
Redemption of common units for cash
|
—
|
|
—
|
|
—
|
|
—
|
|
—
|
|
—
|
|
—
|
|
(64
|
)
|
(64
|
)
|
||||||||||||||||
|
Issuance of units
|
—
|
|
—
|
|
—
|
|
—
|
|
—
|
|
—
|
|
—
|
|
22,853
|
|
22,853
|
|
||||||||||||||||
|
Rebalancing of noncontrolling interest
|
—
|
|
—
|
|
—
|
|
11,712
|
|
—
|
|
—
|
|
11,712
|
|
(11,712
|
)
|
—
|
|
||||||||||||||||
|
Other comprehensive loss
|
—
|
|
—
|
|
—
|
|
—
|
|
—
|
|
(1,861
|
)
|
(1,861
|
)
|
(95
|
)
|
(1,956
|
)
|
||||||||||||||||
|
Net loss
|
10,848
|
|
—
|
|
—
|
|
—
|
|
(38,231
|
)
|
—
|
|
(27,383
|
)
|
(1,962
|
)
|
(29,345
|
)
|
||||||||||||||||
|
Balance, December 31, 2015
|
$
|
139,000
|
|
68,077,333
|
|
$
|
681
|
|
$
|
1,017,397
|
|
$
|
(332,271
|
)
|
$
|
(2,350
|
)
|
$
|
822,457
|
|
$
|
35,400
|
|
$
|
857,857
|
|
||||||||
|
Proceeds from sales of common stock
|
—
|
|
12,090,038
|
|
121
|
|
282,548
|
|
—
|
|
—
|
|
282,669
|
|
—
|
|
282,669
|
|
||||||||||||||||
|
Issuance of series C preferred stock
|
75,000
|
|
—
|
|
—
|
|
—
|
|
—
|
|
—
|
|
75,000
|
|
—
|
|
75,000
|
|
||||||||||||||||
|
Offering costs
|
—
|
|
—
|
|
—
|
|
(6,928
|
)
|
—
|
|
—
|
|
(6,928
|
)
|
—
|
|
(6,928
|
)
|
||||||||||||||||
|
Issuance of restricted stock, net
|
—
|
|
99,968
|
|
1
|
|
(1
|
)
|
—
|
|
—
|
|
—
|
|
—
|
|
—
|
|
||||||||||||||||
|
Issuance of common stock
|
—
|
|
16,473
|
|
—
|
|
—
|
|
—
|
|
—
|
|
—
|
|
—
|
|
—
|
|
||||||||||||||||
|
Dividends and distributions, net
|
(13,897
|
)
|
—
|
|
—
|
|
—
|
|
(99,329
|
)
|
—
|
|
(113,226
|
)
|
(5,707
|
)
|
(118,933
|
)
|
||||||||||||||||
|
Non-cash compensation
|
—
|
|
—
|
|
—
|
|
3,691
|
|
—
|
|
—
|
|
3,691
|
|
6,084
|
|
9,775
|
|
||||||||||||||||
|
Redemption of series A preferred stock
|
(69,000
|
)
|
—
|
|
—
|
|
—
|
|
—
|
|
—
|
|
(69,000
|
)
|
—
|
|
(69,000
|
)
|
||||||||||||||||
|
Redemption of common units to common stock
|
—
|
|
68,492
|
|
1
|
|
616
|
|
—
|
|
—
|
|
617
|
|
(617
|
)
|
—
|
|
||||||||||||||||
|
Rebalancing of noncontrolling interest
|
—
|
|
—
|
|
—
|
|
(3,617
|
)
|
—
|
|
—
|
|
(3,617
|
)
|
3,617
|
|
—
|
|
||||||||||||||||
|
Other comprehensive income
|
—
|
|
—
|
|
—
|
|
—
|
|
—
|
|
854
|
|
854
|
|
44
|
|
898
|
|
||||||||||||||||
|
Net income
|
13,897
|
|
—
|
|
—
|
|
—
|
|
20,622
|
|
—
|
|
34,519
|
|
1,069
|
|
35,588
|
|
||||||||||||||||
|
Balance, December 31, 2016
|
$
|
145,000
|
|
80,352,304
|
|
$
|
804
|
|
$
|
1,293,706
|
|
$
|
(410,978
|
)
|
$
|
(1,496
|
)
|
$
|
1,027,036
|
|
$
|
39,890
|
|
$
|
1,066,926
|
|
||||||||
The accompanying notes are an integral part of these financial statements.
F-6
STAG Industrial, Inc
.
(in thousands)
|
|
Year ended December 31,
|
||||||||||
|
|
2016
|
2015
|
2014
|
||||||||
|
Cash flows from operating activities:
|
|
|
|
||||||||
|
Net income (loss)
|
$
|
35,588
|
|
$
|
(29,345
|
)
|
$
|
(4,685
|
)
|
||
|
Adjustment to reconcile net income (loss) to net cash provided by operating activities:
|
|
|
|
||||||||
|
Depreciation and amortization
|
125,444
|
|
110,421
|
|
87,703
|
|
|||||
|
Loss on impairments
|
16,845
|
|
29,272
|
|
2,840
|
|
|||||
|
Non-cash portion of interest expense
|
1,632
|
|
1,262
|
|
1,337
|
|
|||||
|
Intangible amortization in rental income, net
|
6,213
|
|
8,526
|
|
6,253
|
|
|||||
|
Straight-line rent adjustments, net
|
(1,817
|
)
|
(3,134
|
)
|
(3,347
|
)
|
|||||
|
Dividends on forfeited equity compensation
|
3
|
|
25
|
|
128
|
|
|||||
|
Loss on extinguishment of debt
|
3,261
|
|
—
|
|
686
|
|
|||||
|
Gain on the sales of rental property, net
|
(61,823
|
)
|
(4,986
|
)
|
(2,799
|
)
|
|||||
|
Non-cash compensation expense
|
9,729
|
|
7,578
|
|
7,314
|
|
|||||
|
Change in assets and liabilities:
|
|
|
|
||||||||
|
Tenant accounts receivable, net
|
(1,435
|
)
|
(1,334
|
)
|
435
|
|
|||||
|
Restricted cash
|
(365
|
)
|
(40
|
)
|
(127
|
)
|
|||||
|
Prepaid expenses and other assets
|
(4,580
|
)
|
(3,155
|
)
|
(2,588
|
)
|
|||||
|
Accounts payable, accrued expenses and other liabilities
|
6,161
|
|
3,469
|
|
1,018
|
|
|||||
|
Tenant prepaid rent and security deposits
|
567
|
|
3,148
|
|
2,508
|
|
|||||
|
Total adjustments
|
99,835
|
|
151,052
|
|
101,361
|
|
|||||
|
Net cash provided by operating activities
|
135,423
|
|
121,707
|
|
96,676
|
|
|||||
|
Cash flows from investing activities:
|
|
|
|
||||||||
|
Acquisitions of land and buildings and improvements
|
(377,559
|
)
|
(291,949
|
)
|
(333,983
|
)
|
|||||
|
Additions of land and building and improvements
|
(30,485
|
)
|
(16,329
|
)
|
(11,891
|
)
|
|||||
|
Acquisitions of other assets
|
(158
|
)
|
(565
|
)
|
—
|
|
|||||
|
Proceeds from sales of rental property, net
|
152,079
|
|
22,163
|
|
12,980
|
|
|||||
|
Restricted cash
|
(853
|
)
|
(1,449
|
)
|
27
|
|
|||||
|
Acquisition deposits, net
|
(560
|
)
|
1,420
|
|
(2,020
|
)
|
|||||
|
Acquisitions of deferred leasing intangibles
|
(89,576
|
)
|
(85,329
|
)
|
(86,826
|
)
|
|||||
|
Net cash used in investing activities
|
(347,112
|
)
|
(372,038
|
)
|
(421,713
|
)
|
|||||
|
Cash flows from financing activities:
|
|
|
|
||||||||
|
Proceeds from sale of series C preferred stock
|
75,000
|
|
—
|
|
—
|
|
|||||
|
Redemption of series A preferred stock
|
(69,000
|
)
|
—
|
|
—
|
|
|||||
|
Redemption of common units for cash
|
—
|
|
(64
|
)
|
(1,701
|
)
|
|||||
|
Proceeds from unsecured credit facility
|
513,000
|
|
300,750
|
|
426,500
|
|
|||||
|
Repayment of unsecured credit facility
|
(541,000
|
)
|
(375,750
|
)
|
(376,000
|
)
|
|||||
|
Proceeds from unsecured term loans
|
150,000
|
|
150,000
|
|
200,000
|
|
|||||
|
Repayment of unsecured term loans
|
—
|
|
—
|
|
(300,000
|
)
|
|||||
|
Proceeds from unsecured notes
|
—
|
|
220,000
|
|
180,000
|
|
|||||
|
Repayment of mortgage notes
|
(70,444
|
)
|
(20,571
|
)
|
(4,463
|
)
|
|||||
|
Settlement of forward swap contracts
|
—
|
|
—
|
|
(358
|
)
|
|||||
|
Payment of loan fees and costs
|
(715
|
)
|
(3,672
|
)
|
(4,431
|
)
|
|||||
|
Payment of loan prepayment fees and costs
|
(3,278
|
)
|
—
|
|
—
|
|
|||||
|
Dividends and distributions
|
(117,441
|
)
|
(105,892
|
)
|
(84,640
|
)
|
|||||
|
Proceeds from sales of common stock
|
282,669
|
|
74,892
|
|
316,692
|
|
|||||
|
Offering costs
|
(6,921
|
)
|
(1,229
|
)
|
(8,899
|
)
|
|||||
|
Withholding taxes for settlement of outperformance program
|
—
|
|
—
|
|
(475
|
)
|
|||||
|
Net cash provided by financing activities
|
211,870
|
|
238,464
|
|
342,225
|
|
|||||
|
Increase (decrease) in cash and cash equivalents
|
181
|
|
(11,867
|
)
|
17,188
|
|
|||||
|
Cash and cash equivalents—beginning of period
|
12,011
|
|
23,878
|
|
6,690
|
|
|||||
|
Cash and cash equivalents—end of period
|
$
|
12,192
|
|
|
$
|
12,011
|
|
$
|
23,878
|
|
|
|
Supplemental disclosure:
|
|
|
|
||||||||
|
Cash paid for interest, net of capitalized interest
|
$
|
39,367
|
|
$
|
32,440
|
|
$
|
22,675
|
|
||
|
Supplemental schedule of non-cash investing and financing activities
|
|
|
|
||||||||
|
Issuance of units for acquisitions of land and building and improvements and deferred lease intangibles
|
$
|
—
|
|
$
|
22,853
|
|
$
|
—
|
|
||
|
Contingent consideration for acquisition of land and building and improvements
|
$
|
—
|
|
$
|
(216
|
)
|
$
|
—
|
|
||
|
Contingent consideration for acquisition of deferred leasing intangibles
|
$
|
—
|
|
$
|
(84
|
)
|
$
|
—
|
|
||
|
Contingent consideration liability acquired
|
$
|
—
|
|
$
|
300
|
|
$
|
—
|
|
||
|
Additions to building and other capital improvements
|
$
|
(1,175
|
)
|
$
|
(565
|
)
|
$
|
—
|
|
||
|
Transfer of other assets to building and other capital improvements
|
$
|
—
|
|
$
|
565
|
|
$
|
—
|
|
||
|
Acquisitions of land and buildings and improvements
|
$
|
(3,572
|
)
|
$
|
(38,339
|
)
|
$
|
(3,743
|
)
|
||
|
Acquisitions of deferred leasing intangibles
|
$
|
(1,008
|
)
|
$
|
(11,199
|
)
|
$
|
(593
|
)
|
||
|
Partial disposal of building due to involuntary conversion of building
|
$
|
779
|
|
$
|
—
|
|
$
|
—
|
|
||
|
Investing other receivables due to involuntary conversion of building
|
$
|
(779
|
)
|
$
|
—
|
|
$
|
—
|
|
||
|
Change in additions of land, building, and improvements included in accounts payable, accrued expenses, and other liabilities
|
$
|
(1,455
|
)
|
$
|
(182
|
)
|
$
|
(1,716
|
)
|
||
|
Additions to building and other capital improvements from non-cash compensation
|
$
|
(18
|
)
|
$
|
—
|
|
$
|
—
|
|
||
|
Assumption of mortgage notes
|
$
|
4,037
|
|
$
|
26,267
|
|
$
|
4,198
|
|
||
|
Fair market value adjustment to mortgage notes acquired
|
$
|
75
|
|
$
|
418
|
|
$
|
138
|
|
||
|
Change in loan fees, costs, and offering costs included in accounts payable, accrued expenses, and other liabilities
|
$
|
26
|
|
$
|
24
|
|
$
|
(84
|
)
|
||
|
Dividends and distributions declared but not paid
|
$
|
9,728
|
|
$
|
8,234
|
|
$
|
7,355
|
|
||
The accompanying notes are an integral part of these financial statements.
F-7
STAG Industrial, Inc.
Notes to Consolidated Financial Statements
1. Organization
and
Description of Business
STAG Industrial, Inc. (the “Company”) is an industrial real estate operating company focused on the acquisition and operation of single-tenant, industrial properties throughout the United States. The Company was formed as a Maryland corporation and has elected to be treated and intends to continue to qualify as a real estate investment trust (“REIT”) under Sections 856 through 860 of the Internal Revenue Code of 1986, as amended (the “Code”). The Company is structured as an umbrella partnership REIT, commonly called an UPREIT, and owns substantially all of its assets and conducts substantially all of its business through its operating partnership, STAG Industrial Operating Partnership, L.P., a Delaware limited partnership (the “Operating Partnership”). As of
December 31, 2016
and
December 31, 2015
, the Company owned a
95.7%
and
95.1%
, respectively, common equity interest in the Operating Partnership. The Company, through its wholly owned subsidiary, is the sole general partner of the Operating Partnership. As used herein, the “Company” refers to STAG Industrial, Inc. and its consolidated subsidiaries and partnerships, including the Operating Partnership, except where context otherwise requires.
As of
December 31, 2016
, the Company owned
314
buildings in
37
states with approximately
60.9 million
rentable square feet (square feet unaudited herein and throughout Notes), consisting of
243
warehouse/distribution buildings,
54
light manufacturing buildings,
16
flex/office buildings, and
one
building in redevelopment. The Company’s buildings were approximately
94.7%
leased to
275
tenants as of
December 31, 2016
.
2. Summary of Significant Accounting Policies
Basis of Presentation
The Company’s consolidated financial statements include the accounts of the Company, the Operating Partnership and their subsidiaries. Interests in the Operating Partnership not owned by the Company are referred to as “Noncontrolling Common Units.” These Noncontrolling Common Units are held by other limited partners in the form of common units ("Other Common Units") and long term incentive plan units (“LTIP units”) issued pursuant to the STAG Industrial, Inc. 2011 Equity Incentive Plan, as amended (the “2011 Plan”). All significant intercompany balances and transactions have been eliminated in the consolidation of entities. The financial statements of the Company are presented on a consolidated basis for all periods presented.
F-8
Revision of Previously Reported Consolidated Financial Statements
In connection with the preparation of the Company's consolidated financial statements for the year ended December 31, 2016, the Company identified an error in the estimated useful life of a building acquired in the fourth quarter of 2014. As a result of the error, depreciation expense had been overstated and thereby rental property, net and equity were understated. The Company concluded that the amounts were not material to any of its previously issued consolidated financial statements. Accordingly, the Company revised these balances in the accompanying consolidated financial statements as of and for the years ended December 31, 2015 and December 31, 2014 as outlined below. These adjustments do not impact the Company’s cash balances for any of the reporting periods. The effects of this revision to the consolidated financial statements are as follows (in thousands, except for per share data).
|
Effect of Revision As of and For the Year Ended December 31, 2015
|
As Previously Reported
|
Adjustment
|
As Revised
|
|||||||||
|
Consolidated Balance Sheet, December 31, 2015
|
||||||||||||
|
Building and improvements, net of accumulated depreciation
|
$
|
1,332,298
|
|
$
|
2,478
|
|
$
|
1,334,776
|
|
|||
|
Total assets
(1)
|
$
|
1,899,304
|
|
$
|
2,478
|
|
$
|
1,901,782
|
|
|||
|
Total equity
|
$
|
855,379
|
|
$
|
2,478
|
|
$
|
857,857
|
|
|||
|
Consolidated Statement of Operations, Year Ended December 31, 2015
|
||||||||||||
|
Depreciation and amortization
|
$
|
112,545
|
|
$
|
(2,124
|
)
|
$
|
110,421
|
|
|||
|
Total expenses
|
$
|
218,999
|
|
$
|
(2,124
|
)
|
$
|
216,875
|
|
|||
|
Net loss
|
$
|
(31,469
|
)
|
$
|
2,124
|
|
$
|
(29,345
|
)
|
|||
|
Net loss attributable to STAG Industrial, Inc.
|
$
|
(29,403
|
)
|
$
|
2,020
|
|
$
|
(27,383
|
)
|
|||
|
Net loss attributable to common stockholders
|
$
|
(40,636
|
)
|
$
|
2,020
|
|
$
|
(38,616
|
)
|
|||
|
Loss per share attributable to common stockholders — basic and diluted
|
$
|
(0.61
|
)
|
$
|
0.03
|
|
$
|
(0.58
|
)
|
|||
|
Consolidated Statement of Comprehensive Income (Loss), Year Ended December 31, 2015
|
||||||||||||
|
Comprehensive loss
|
$
|
(33,425
|
)
|
$
|
2,124
|
|
$
|
(31,301
|
)
|
|||
|
(1)
|
The as previously reported balance for total assets has been retrospectively adjusted to include the effect of the change in accounting principle for the adoption of ASU 2015-03, as discussed in "New Accounting Pronouncements" below.
|
|
Effect of Revision As of and For the Year Ended December 31, 2014
|
As Previously Reported
|
Adjustment
|
As Revised
|
|||||||||
|
Consolidated Balance Sheet, December 31, 2014
|
||||||||||||
|
Total assets
(1)
|
$
|
1,623,448
|
|
$
|
354
|
|
$
|
1,623,802
|
|
|||
|
Total equity
|
$
|
891,524
|
|
$
|
354
|
|
$
|
891,878
|
|
|||
|
Consolidated Statement of Operations, Year Ended December 31, 2014
|
||||||||||||
|
Depreciation and amortization
|
$
|
88,057
|
|
$
|
(354
|
)
|
$
|
87,703
|
|
|||
|
Total expenses
|
$
|
155,874
|
|
$
|
(354
|
)
|
$
|
155,520
|
|
|||
|
Net loss
|
$
|
(5,039
|
)
|
$
|
354
|
|
$
|
(4,685
|
)
|
|||
|
Net loss attributable to STAG Industrial, Inc.
|
$
|
(4,025
|
)
|
$
|
332
|
|
$
|
(3,693
|
)
|
|||
|
Net loss attributable to common stockholders
|
$
|
(15,218
|
)
|
$
|
332
|
|
$
|
(14,886
|
)
|
|||
|
Loss per share attributable to common stockholders — basic and diluted
|
$
|
(0.28
|
)
|
$
|
—
|
|
$
|
(0.28
|
)
|
|||
|
Consolidated Statement of Comprehensive Income (Loss), Year Ended December 31, 2014
|
||||||||||||
|
Comprehensive loss
|
$
|
(9,236
|
)
|
$
|
354
|
|
$
|
(8,882
|
)
|
|||
|
(1)
|
The as previously reported balance for total assets has been retrospectively adjusted to include the effect of the change in accounting principle for the adoption of ASU 2015-03, as discussed in "New Accounting Pronouncements" below.
|
New Accounting Pronouncements
In January of 2017, the Financial Accounting Standards Board ("FASB") issued Accounting Standards Update (“ASU”) 2017-04,
Intangibles - Goodwill and Other (Topic 350): Simplifying the Test for Goodwill Impairment
. The new standard removes Step 2 of the goodwill impairment test, which requires a hypothetical purchase price allocation. A goodwill impairment will now be the amount by which a reporting unit’s carrying value exceeds its fair value, not to exceed the carrying amount of goodwill. This standard is effective for annual or any interim goodwill impairment tests in fiscal years beginning after December 15, 2019, with early adoption permitted for interim or goodwill impairment tests performed on testing dates after January 1, 2017. The adoption of ASU 2017-04 is not expected to materially impact the Company’s consolidated financial statements.
F-9
In January of 2017, the FASB issued ASU 2017-01,
Business Combinations (Topic 805): Clarifying the Definition of a Business
. The new standard provides a screen to determine when a set of assets and activities is not a business. The screen requires that when substantially all of the fair value of the gross assets acquired or disposed of is concentrated in a single identifiable asset or a group of similar identifiable assets, the set is not a business. This standard is effective for annual periods beginning after December 15, 2017 and interim periods within those periods, with early adoption permitted, and should be applied prospectively on or after the effective date. Upon the adoption of ASU 2017-01, it is expected that the majority of the Company's acquisitions will be accounted for as asset acquisitions, whereas under the current guidance the majority of the Company's acquisitions have been accounted for as business combinations. The most significant difference between the two accounting models that will impact the Company's consolidated financial statements is that in an asset acquisition, property acquisition costs are generally a component of the consideration transferred to acquire a group of assets and are capitalized as a component of the cost of the assets, whereas in a business combination, property acquisition costs are expensed and not included as part of the consideration transferred. The Company plans to adopt this standard effective January 1, 2018.
In November of 2016, the FASB issued ASU 2016-18,
Statement of Cash Flows (Topic 230): Restricted Cash
.
The new standard requires that the statement of cash flows explain the changes during the period in the total of cash, cash equivalents, and amounts generally described as restricted cash or restricted cash equivalents. This standard is effective for fiscal years beginning after December 15, 2017 and interim periods within those years, with early adoption permitted, and should be applied using a retrospective transition method to each period presented. Upon the adoption of ASU 2016-18, the Company will reconcile both cash and cash equivalents and restricted cash in the accompanying Statements of Cash Flows, whereas under the current guidance the Company explains the changes during the period for cash and cash equivalents only.
In August of 2016, the FASB issued ASU 2016-15,
Statement of Cash Flows (Topic 230): Classification of Certain Cash Receipts and Cash Payments
, which provides clarified guidance on the presentation and classification of certain cash receipts and cash payments in the statement of cash flows. This standard is effective for fiscal years beginning after December 15, 2017, and interim periods within those years, with early adoption permitted. The Company has elected to early adopt this standard effective July 1, 2016, and the effects of this standard were applied retrospectively to all prior periods presented. The effect of the change in accounting principle was an increase in net cash provided by operating activities of approximately
$2.0 million
for the six months ended June 30, 2016 and a corresponding increase in net cash used in financing activities for the six months ended June 30, 2016 related to the payment of loan prepayment fees and costs.
In March of 2016, the FASB issued ASU 2016-09,
Stock Compensation (Topic 718)
, which addresses certain aspects of the accounting for share-based payment transactions, including the income tax consequences, classification of awards as either equity or liabilities, forfeitures, and classification on the statement of cash flows. This standard is effective for fiscal years beginning after December 15, 2016, and interim periods within those years, with early adoption permitted. The Company has elected to early adopt this standard effective January 1, 2016. As a result, the Company's policy is to recognize forfeitures in the period which they occur, whereas the former guidance required the Company to estimate expected forfeitures. The adoption of this standard did not have a material effect on the consolidated financial statements.
In February of 2016, the FASB issued ASU 2016-02,
Leases (Topic 842)
, which sets out the principles for the recognition, measurement, presentation and disclosure of leases for both parties to a contract (i.e. lessees and lessors). Topic 842 supersedes the previous leases standard, Topic 840,
Leases
. The new standard requires lessees to apply a dual approach, classifying leases as either finance or operating leases based on the principle of whether or not the lease is effectively a financed purchase by the lessee. This classification will determine whether lease expense is recognized based on an effective interest method or on a straight line basis over the term of the lease, respectively. A lessee is also required to record a right-of-use asset and a lease liability for all leases with a term of greater than 12 months regardless of their classification. Leases with a term of 12 months or less will be accounted for similar to existing guidance for operating leases today. The new standard requires lessors to account for leases using an approach that is substantially equivalent to existing guidance for sales-type leases, direct financing leases and operating leases. ASU 2016-02 is expected to impact the Company’s consolidated financial statements as the Company has certain operating and land lease arrangements for which it is the lessee, which will result in the recording of a right of use asset and the related lease liability. The standard is effective for fiscal years beginning after December 15, 2018, including interim periods within those fiscal years, with early adoption permitted. The new standard must be adopted using a modified retrospective transition and will require application of the new guidance at the beginning of the earliest comparative period. The Company is currently in the process of evaluating the impact the adoption of ASU 2016-02 will have on the Company’s financial position or results of operations, and expects to adopt the standard effective January 1, 2019.
F-10
In January of 2016, the FASB issued ASU 2016-01,
Recognition and Measurement of Financial Assets and Financial Liabilities (Subtopic 825-10)
. The amendments in ASU 2016-01 address certain aspects of recognition, measurement, presentation, and disclosure of financial instruments. The standard primarily affects the accounting for equity investments, financial liabilities under the fair value option, and the presentation and disclosure requirements for financial instruments. ASU 2016-01 is effective for the annual periods beginning after December 31, 2017 and for annual periods and interim periods within those years. Early adoption is permitted for all financial statements of fiscal years and interim periods that have not yet been issued. The adoption of ASU 2016-01 is not expected to materially impact the Company’s consolidated financial statements.
In April of 2015, the FASB issued ASU 2015-03,
Simplifying the Presentation of Debt Issuance Costs (Subtopic 835-30)
. ASU 2015-03 requires debt issuance costs related to a recognized debt liability to be presented in the balance sheet as a direct deduction from the carrying amount of the debt liability. In August of 2015, the FASB issued ASU 2015-15,
Presentation and Subsequent Measurement of Debt Issuance Costs Associated with Line-of-Credit Arrangements (Subtopic 835-30)
, which clarified that debt issuance costs related to line-of-credit arrangements may be presented as an asset and amortized over the term of the line-of-credit arrangement regardless of whether there are any outstanding borrowings on the line-of-credit arrangement. The Company adopted this standard effective January 1, 2016. As a result, debt issuance costs related to the debt liabilities that are not line-of-credit arrangements are included as a direct deduction from the related debt liability and those related to line-of-credit arrangements continue to be included as an asset within prepaid expenses and other assets on the accompanying Consolidated Balance Sheets. The effects of this standard were applied retrospectively to all prior periods presented. The effect of the change in accounting principle was the reduction of unsecured term loans by approximately
$3.4 million
, unsecured notes by approximately
$2.3 million
, and mortgage notes by approximately
$1.3 million
and a corresponding reduction of prepaid expenses and other assets by approximately
$6.9 million
as of December 31, 2015.
In February of 2015, the FASB issued ASU 2015-02,
Amendments to Consolidation Analysis (Topic 810)
, which amends the current consolidation model. On January 1, 2016, the Company adopted this standard, modifying the analysis it must perform to determine whether it should consolidate certain types of legal entities. The guidance does not amend the existing disclosure requirements for variable interest entities or voting interest model entities. The guidance, however, modified the requirements to qualify under the voting interest model. Under the revised guidance, the Operating Partnership will be a variable interest entity of the Company. As the Operating Partnership is already consolidated in the financial statements of the Company, the identification of this entity as a variable interest entity had no impact on the consolidated financial statements of the Company. There were no other legal entities qualifying under the scope of the revised guidance that were consolidated as a result of the adoption. In addition, there were no voting interest entities under prior existing guidance determined to be variable interest entities under the revised guidance.
In August of 2014, the FASB issued ASU 2014-15,
Presentation of Financial Statements-Going Concern (Subtopic 205-40): Disclosure of Uncertainties about an Entity’s Ability to Continue as a Going Concern
. ASU 2014-15 requires management to evaluate whether there are conditions or events that raise substantial doubt about the entity’s ability to continue as a going concern, and to provide certain disclosures when it is probable that the entity will be unable to meet its obligations as they become due within one year after the date that the financial statements are issued. ASU 2014-15 is effective for the annual period ending December 31, 2016 and for annual periods and interim periods thereafter with early adoption permitted. The Company adopted this standard effective for the annual period ended December 31, 2016 and this standard did not have a material effect on the consolidated financial statements.
In May of 2014, the FASB issued ASU 2014-09,
Revenue from Contracts with Customers
(Topic 606)
. ASU 2014-09 is a comprehensive new revenue recognition model requiring a company to recognize revenue to depict the transfer of goods or services to a customer at an amount reflecting the consideration it expects to receive in exchange for those goods or services. While lease contracts with customers, which constitute a vast majority of the Company's revenues, are a specific scope exception, certain of the Company's revenue streams may be impacted by the new guidance. Once the new guidance setting forth principles for the recognition, measurement, presentation and disclosure of leases (ASU 2016-02, as discussed above) goes into effect, the new revenue standard may apply to executory costs and other components of revenue due under leases that are deemed to be non-lease components (such as common area maintenance and provision of utilities), even when the revenue for such activities is not separately stipulated in the lease. In that case, revenue from these items previously recognized on a straight-line basis under current lease guidance would be recognized under the new revenue guidance as the related services are delivered. As a result, while the total revenue recognized over time would not differ under the new guidance, the recognition pattern would be different. The Company is in the process of evaluating the significance of the difference in the recognition pattern that would result from this change. In adopting ASU 2014-09, companies may use either a full retrospective or a modified retrospective approach. The Company has not decided which method of adoption it will use. Additionally, this guidance requires improved disclosures regarding the nature, amount, timing and uncertainty of revenue and cash flows arising from contracts with customers. ASU 2014-09 is effective for
F-11
the first interim period within annual reporting periods beginning after December 15, 2017. Early adoption is permitted for the first interim period within annual reporting periods beginning after December 15, 2016. The Company is currently in the process of evaluating the impact the adoption of ASU 2014-09 will have on the Company’s financial position or results of operations, and expects that it will adopt the standard effective January 1, 2018.
Use of Estimates
The preparation of financial statements in conformity with generally accepted accounting principles (“GAAP”) requires management to make estimates and assumptions that affect the reported amounts of assets and liabilities and disclosure of contingent assets and liabilities at the date of the financial statements and the reported amounts of revenue and expenses during the reporting period. Actual results could differ from those estimates.
Rental Property and Deferred Leasing Intangibles
Rental property is carried at cost less accumulated depreciation and amortization. Expenditures for maintenance and repairs are expensed as incurred. Significant renovations and betterments that extend the economic useful lives of assets are capitalized.
The Company capitalizes costs directly and indirectly related to the development, pre-development, redevelopment, or improvement of rental property. Real estate taxes, compensation costs of development personnel, insurance, interest, and other directly related costs during construction periods are capitalized as incurred and depreciated commencing with the date the property is substantially completed. Such costs begin to be capitalized to the development projects from the point the Company is undergoing the necessary activities to get the development project ready for its intended use and cease when the development projects are substantially completed and held available for occupancy. Interest is capitalized based on actual capital expenditures from the period when development or redevelopment commences until the asset is ready for its intended use, at the weighted average borrowing rate of the Company's unsecured indebtedness during the period.
For properties classified as held for sale, the Company ceases depreciating and amortizing the rental property and values the rental property at the lower of depreciated and amortized cost or fair value, less costs to dispose. The Company presents those properties classified as held for sale with any qualifying assets and liabilities associated with those properties as held for sale in the accompanying Consolidated Balance Sheets.
The Company allocates the purchase price of business combinations of properties based upon the fair value of the assets and liabilities acquired, which generally consist of land, buildings, tenant improvements, mortgage debt assumed, and deferred leasing intangibles, which includes in-place leases, above market and below market leases, and tenant relationships. The portion of the purchase price that is allocated to above and below market leases is valued based on the present value of the difference between prevailing market rates and the in-place rates measured over a period equal to the remaining term of the lease term plus the term of any bargain renewal options. The above and below market lease values are amortized into rental income over the remaining term plus the terms of bargain renewal options or assumed exercise of early termination options of the respective leases. The purchase price is further allocated to in-place lease values and tenant relationships based on the Company's evaluation of the specific characteristics of each tenant’s lease and its overall relationship with the respective tenant. The value of in-place lease intangibles and tenant relationships, which are included as components of deferred leasing intangibles, are amortized over the remaining lease term (and expected renewal periods of the respective lease for tenant relationships or assumed exercise of early termination options for in-place lease intangibles) as increases or decreases to depreciation and amortization expense. If a tenant terminates its lease, the unamortized portion of above and below market leases is accelerated into rental income and the in-place lease value and tenant relationships are accelerated into depreciation or amortization expense over the shortened lease term.
The purchase price allocated to deferred leasing intangible assets are included in rental property on the accompanying Consolidated Balance Sheets and the purchase price allocated to deferred leasing intangible liabilities are included in deferred leasing intangibles on the accompanying Consolidated Balance Sheets under the liabilities section.
In determining the fair value of the debt assumed, the Company discounts the spread between the future contractual interest payments and hypothetical future interest payments on mortgage debt based on a current market rate. The associated fair market value debt adjustment is amortized through interest expense over the life of the debt on a basis which approximates the effective interest method.
F-12
Using information available at the time of acquisition, the Company allocates the total consideration to tangible assets and liabilities and identified intangible assets and liabilities. The Company may adjust the preliminary purchase price allocations after obtaining more information about asset valuations and liabilities assumed.
The Company evaluates the carrying value of all tangible and intangible rental property assets held for use for possible impairment when an event or change in circumstance has occurred that indicates their carrying value may not be recoverable. The evaluation includes estimating and reviewing anticipated future undiscounted cash flows to be derived from the asset and the ultimate sale of the asset. If such cash flows are less than the asset’s carrying value, an impairment charge is recognized to the extent by which the asset’s carrying value exceeds the estimated fair value. Estimating future cash flows is highly subjective and such estimates could differ from actual results.
Depreciation and amortization expense is computed using the straight-line method based on the following lives.
|
Building
|
40 Years
|
|
Building and land improvements
|
Up to 20 years
|
|
Tenant improvements
|
Shorter of useful life or terms of related lease
|
|
Above and below market leases and other deferred leasing intangibles
|
Terms of the related lease plus terms of bargain renewal options or assumed exercise of early termination options
|
|
Tenant relationships
|
Terms of the related lease plus estimated renewal period
|
|
Assumed debt fair value premium/discount
|
Terms of the related loan
|
Fully depreciated or amortized assets or liabilities and the associated accumulated depreciation or amortization are written-off. The Company wrote-off tenant improvements, deferred leasing intangible assets, and deferred leasing intangible liabilities of
$2.6 million
,
$17.9 million
,
$0
, respectively, for the year ended
December 31, 2016
and
$1.2 million
,
$10.3 million
,
$0.8 million
, respectively, for the year ended
December 31, 2015
.
Cash and Cash Equivalents
Cash and cash equivalents consist of cash and highly liquid short-term investments with original maturities of three months or less. The Company maintains cash and cash equivalents in United States banking institutions that may exceed amounts insured by the Federal Deposit Insurance Corporation. While the Company monitors the cash balances in its operating accounts, these cash balances could be impacted if the underlying financial institutions fail or are subject to other adverse conditions in the financial markets. To date, the Company has experienced no loss or lack of access to cash in its operating accounts, and mitigates this risk by using nationally recognized banking institutions.
Restricted Cash
Restricted cash may include tenant security deposits and cash held in escrow for real estate taxes and capital improvements as required in various mortgage loan agreements. Restricted cash also may include amounts held by the Company’s transfer agent for preferred stock dividends that are distributed subsequent to period end.
Tenant Accounts Receivable, net
Tenant accounts receivable, net on the accompanying Consolidated Balance Sheets includes both tenant accounts receivable, net and accrued rental income, net. The Company provides an allowance for doubtful accounts against the portion of tenant accounts receivable that is estimated to be uncollectible. As of
December 31, 2016
and
December 31, 2015
, the Company had an allowance for doubtful accounts of approximately
$0.2 million
and
$0.1 million
, respectively.
The Company accrues rental income earned, but not yet receivable, in accordance with GAAP. As of
December 31, 2016
and
December 31, 2015
, the Company had accrued rental income of approximately
$18.4 million
and
$16.1 million
, respectively. The Company maintains an allowance for estimated losses that may result from those revenues. As of
December 31, 2016
and
December 31, 2015
, the Company had an allowance on accrued rental income of
$0
and
$0
, respectively.
As of
December 31, 2016
and
December 31, 2015
, the Company had approximately
$9.0 million
and
$6.1 million
, respectively, of total lease security deposits available in the form of existing letters of credit, which are not reflected on the accompanying Consolidated Balance Sheets. As of
December 31, 2016
and
December 31, 2015
, the Company had approximately
$5.4 million
and
$4.1 million
, respectively, of lease security deposits available in cash, which are included in cash and cash equivalents on the
F-13
accompanying Consolidated Balance Sheets, and approximately
$0.4 million
and
$0.4 million
, respectively, of lease security deposits available in cash, which are included in restricted cash on the accompanying Consolidated Balance Sheets. These funds may be used to settle tenant accounts receivables in the event of a default under the related lease. As of
December 31, 2016
and
December 31, 2015
, the Company's total liability associated with these lease security deposits was approximately
$5.8 million
and
$4.5 million
, respectively, which is included in tenant prepaid rent and security deposits on the accompanying Consolidated Balance Sheets.
Deferred Costs
Deferred financing fees and debt issuance costs include costs incurred in obtaining debt that are capitalized and are presented as a direct deduction from the carry amount of the associated debt liability that is not a line-of-credit arrangement on the accompanying Consolidated Balance Sheets. Deferred financing fees and debt issuance costs related to line-of-credit arrangements are presented as an asset in prepaid expenses and other assets on the accompanying Consolidated Balance Sheets. The deferred financing fees and debt issuance costs are amortized through interest expense over the life of the respective loans on a basis which approximates the effective interest method. Any unamortized amounts upon early repayment of debt are written off in the period of repayment as a loss on extinguishment of debt. Fully amortized deferred financing fees and debt issuance costs are removed from the books upon maturity of the underlying debt.
Leasing commissions include commissions, compensation costs of leasing personnel, and other direct and incremental costs incurred to obtain new tenant leases as well as to renew existing tenant leases, and are presented in prepaid expenses and other assets on the accompanying Consolidated Balance Sheets. Leasing commission are capitalized and amortized over the terms of the related leases (and bargain renewal terms or assumed exercise of early termination options) using the straight-line method. If a lease terminates prior to the expiration of its initial term, any unamortized costs related to the lease are accelerated into amortization expense. Changes in leasing commissions are presented in the cash flows from operating activities section of the accompanying Consolidated Statements of Cash Flows.
Goodwill
The excess of the cost of an acquired business over the net of the amounts assigned to assets acquired (including identified intangible assets) and liabilities assumed is recorded as goodwill. Goodwill of the Company of
$4.9 million
represents amounts allocated to the assembled workforce from the acquired management company, and is presented in prepaid expenses and other assets on the accompanying Consolidated Balance Sheets. The Company’s goodwill has an indeterminate life and is not amortized, but is tested for impairment on an annual basis at December 31, or more frequently if events or changes in circumstances indicate that the asset might be impaired. The Company takes a qualitative approach to consider whether an impairment of goodwill exists prior to quantitatively determining the fair value of the reporting unit in step one of the impairment test. The Company has recorded
no
impairments to goodwill through
December 31, 2016
.
Use of Derivative Financial Instruments
The Company records all derivatives on the accompanying Consolidated Balance Sheets at fair value. The accounting for changes in the fair value of derivatives depends on the intended use of the derivative, whether the Company has elected to designate a derivative in a hedging relationship and apply hedge accounting, and whether the hedging relationship has satisfied the criteria necessary to apply hedge accounting. Derivatives designated and qualifying as a hedge of the exposure to changes in the fair value of an asset, liability, or firm commitment attributable to a particular risk, such as interest rate risk, are considered fair value hedges. Derivatives designated and qualifying as a hedge of the exposure to variability in expected future cash flows, or other types of forecasted transactions, are considered cash flow hedges. Hedge accounting generally provides for the matching of the timing of gain or loss recognition on the hedging instrument with the recognition of the changes in the fair value of the hedged asset or liability that are attributable to the hedged risk in a fair value hedge or the earnings effect of the hedged forecasted transactions in a cash flow hedge. The Company may enter into derivative contracts that are intended to economically hedge certain of its risks, even though hedge accounting does not apply or the Company elects not to apply hedge accounting.
In accordance with fair value measurement guidance, the Company made an accounting policy election to measure the credit risk of its derivative financial instruments that are subject to master netting arrangements on a net basis by counterparty portfolio. Credit risk is the risk of failure of the counterparty to perform under the terms of the contract. The Company minimizes the credit risk in the interest rate swaps by entering into transactions with various high-quality counterparties. The Company’s exposure to credit risk at any point is generally limited to amounts recorded as assets on the accompanying Consolidated Balance Sheets.
F-14
Fair Value of Financial Instruments
Financial instruments include cash and cash equivalents, restricted cash, tenant accounts receivable, interest rate swaps, accounts payable, accrued expenses, unsecured credit facility, unsecured term loans, unsecured notes and mortgage notes. The fair values of the cash and cash equivalents, restricted cash, tenant accounts receivable, accounts payable and accrued expenses approximate their carrying or contract values because of the short term maturity of these instruments. See Note 4 for the fair values of the Company’s debt. See Note 5 for the fair values of the Company’s interest rate swaps.
The Company adopted fair value measurement provisions for its financial instruments recorded at fair value. The guidance establishes a three-tier value hierarchy, which prioritizes the inputs used in measuring fair value. These tiers include: Level 1, defined as observable inputs such as quoted prices in active markets; Level 2, defined as inputs other than quoted prices in active markets that are either directly or indirectly observable; and Level 3, defined as unobservable inputs in which little or no market data exists, therefore requiring an entity to develop its own assumptions.
Offering Costs
Underwriting commissions and direct offering costs have been reflected as a reduction of additional paid-in capital. Indirect costs associated with equity offerings are expensed as incurred and included in general and administrative expenses on the accompanying Consolidated Statements of Operations.
Dividends
Earnings and profits, which determine the taxability of dividends to stockholders, will differ from income reported for financial reporting purposes due to the differences for federal income tax purposes in the treatment of gains on the sale of real property, revenue and expense recognition, and in the estimated useful lives and basis used to compute depreciation. In addition, the Company's distributions include a return of capital. To the extent that the Company makes distributions in excess of its current and accumulated earnings and profits, such distributions would generally be considered a return of capital for federal income tax purposes to the extent of the holder’s adjusted tax basis in its shares. A return of capital is not taxable, but it has the effect of reducing the holder’s adjusted tax basis in its investment.
The Company paid approximately
$5.2 million
(
$1.88125
per share),
$6.2 million
(
$2.25
per share) and
$6.2 million
(
$2.25
per share) of the
9.0%
Series A
Cumulative Redeemable
Preferred Stock ("Series A Preferred Stock")
dividends for the years ended
December 31, 2016
,
December 31, 2015
, and
December 31, 2014
, respectively, that were treated as ordinary income for tax purposes.
The Company paid approximately
$4.6 million
(
$1.65625
per share),
$4.6 million
(
$1.65625
per share) and
$4.6 million
(
$1.65625
per share) of the
6.625%
Series B
Cumulative Redeemable
Preferred Stock ("Series B Preferred Stock")
dividends for the years ended
December 31, 2016
and
December 31, 2015
, and
December 31, 2014
, respectively, that were treated as ordinary income for tax purposes.
The Company paid approximately
$4.1 million
(
$1.355905
per share) of the
6.875%
Series C Cumulative Redeemable Preferred Stock ("Series C Preferred Stock") dividends for the year ended
December 31, 2016
that were treated as ordinary income for tax purposes
The tax treatment of common dividends per share for federal income tax purposes is as follows.
|
|
Year ended December 31,
|
|||||||||||||||||||
|
|
2016
|
2015
|
2014
|
|||||||||||||||||
|
|
Per Share
|
%
|
Per Share
|
%
|
Per Share
|
%
|
||||||||||||||
|
Ordinary income
|
$
|
0.944038
|
|
68.0
|
%
|
$
|
0.777244
|
|
57.2
|
%
|
$
|
0.843245
|
|
65.9
|
%
|
|||||
|
Return of capital
|
0.445125
|
|
32.0
|
%
|
0.582756
|
|
42.8
|
%
|
0.436755
|
|
34.1
|
%
|
||||||||
|
Total
(1)
|
$
|
1.389163
|
|
100.0
|
%
|
$
|
1.36000
|
|
100.0
|
%
|
$
|
1.280000
|
|
100.0
|
%
|
|||||
|
(1)
|
The December 2014 monthly common stock dividend of
$0.11
per share was included in the stockholder’s 2015 tax year. The December 2015 monthly common stock dividend of
$0.115
per share was included in the stockholder’s 2016 tax year. The December 2016 monthly common stock dividend of
$0.115833
per share will be included in the stockholder’s 2017 tax year.
|
F-15
Revenue Recognition
All current leases are classified as operating leases and rental income is recognized on a straight-line basis over the term of the lease (and expected bargain renewal terms or assumed exercise of early termination options) when collectability is reasonably assured. Differences between rental income earned and amounts due under the lease are charged or credited, as applicable, to accrued rental income. Additional rents from expense reimbursements for insurance, real estate taxes and certain other expenses are recognized in the period in which the related expenses are incurred.
The Company earns revenue from asset management fees, which are included on the accompanying Consolidated Statements of Operations in other income. The Company recognizes revenue from asset management fees when the related fees are earned and are realized or realizable.
Tenant Recoveries
By the terms of their leases, certain tenants are obligated to pay directly the costs of their properties’ insurance, real estate taxes, ground lease payments, and certain other expenses, and these costs are not reflected on the Company’s consolidated financial statements. The Company does not recognize recovery revenue related to leases where the tenant has assumed the cost for real estate taxes, insurance, ground lease payments and certain other expenses. To the extent any tenant is responsible for these costs under its respective lease defaults on its lease or it is deemed probable that the tenant will fail to pay for such costs, the Company will record a liability for such obligation. The Company estimates that real estate taxes, which are the responsibility of these certain tenants, were approximately
$10.9 million
for the year ended
December 31, 2016
,
$10.2 million
for the year ended
December 31, 2015
, and
$10.2 million
for the year ended
December 31, 2014
. These amounts would have been the maximum real estate tax expense of the Company, excluding any penalties or interest, had the tenants not met their contractual obligations for these periods.
Termination Income
Early lease termination fees are recorded in rental income on a straight-line basis from the notification date of such termination to the then remaining (not the original) lease term, if any, or upon collection if collection is not reasonably assured.
On December 21, 2016, the tenant at the Golden, CO property exercised its early lease termination option per the terms of the lease agreement. The option provided that the tenant's lease terminate effective December 31, 2017 and required the tenant to pay a termination fee of approximately
$0.9 million
. The termination fee is being recognized on a straight-line basis from December 21, 2016 through the relinquishment of the space on December 31, 2017. The termination fee income of approximately
$0.1 million
is included in rental income on the accompanying Consolidated Statements of Operations for the year ended
December 31, 2016
.
On October 20, 2015, the tenant at the Dayton, OH property exercised its early lease termination option per the terms of the lease agreement. The option provided that the tenant's lease terminate effective October 31, 2016 and required the tenant to pay a termination fee of approximately
$0.2 million
. The termination fee was being recognized on a straight-line basis from October 20, 2015 through the relinquishment of the space on October 31, 2016. On August 29, 2016, the Company sold the Dayton, OH property to an unaffiliated third party and recognized the remaining unamortized termination fee. The termination fee income of approximately
$0.2 million
and
$0.1 million
is included in rental income on the accompanying Consolidated Statements of Operations for the years ended
December 31, 2016
and
December 31, 2015
, respectively.
On October 19, 2015, the Company entered into a lease termination agreement with the tenant located at the Southfield, MI building. The agreement provided that the tenant’s lease terminated effective October 19, 2015 and required the tenant to pay a termination fee of approximately
$0.9 million
. The full termination fee is included in rental income on the accompanying Consolidated Statements of Operations for the year ended December 31, 2015.
On December 17, 2014, the Company entered into the first amendment to the lease with the tenant located at the Belfast, ME buildings. The terms of the amendment renewed
90,051
square feet of the premise and early terminated the remaining
228,928
square feet effective November 30, 2015. The tenant was required to pay a termination fee for the returned premise on or before October 31, 2015 in the amount of approximately
$2.1 million
, and the Company received the termination fee payment in full on September 23, 2015. This termination fee along with the reimbursement of certain miscellaneous costs per the lease amendment was being recorded on a straight-line basis from December 17, 2014 through the relinquishment of the space on November 30, 2015. On May 18, 2015, the Company entered into a second lease amendment with the tenant. The terms of the second lease amendment accelerated the termination of
35,295
square feet of the previously terminated square feet to April 30, 2015. The
F-16
Company recognized the termination fee associated with the
35,295
square feet through the shortened lease life of April 30, 2015. The Company recognized the remaining termination fee over the shortened lease life of the remaining
193,633
square feet through November 30, 2015. The termination fee of approximately
$2.0 million
and
$0.1 million
are included in rental income on the accompanying Consolidated Statements of Operations for the years ended
December 31, 2015
and
December 31, 2014
, respectively.
On October 29, 2014, the Company entered into a lease termination agreement with the tenant located at the Tavares, FL building. The agreement provided that the tenant’s lease terminated effective December 30, 2014 and required the tenant to pay a termination fee of approximately
$2.4 million
including reimbursement of costs related to the sale of the property, which is included in rental income on the accompanying Consolidated Statements of Operations for the year ended
December 31, 2014
.
Gain on the Sales of Rental Property, net
The timing of the recognition of gain on the sales of rental property, net is measured against various criteria related to the terms of the transaction and continuing involvement in the form of management or financial assistance associated with the properties. If the sales criteria for the full accrual method are not met, the Company defers some or all of the gain recognition and accounts for the continued operations of the property by applying the finance, leasing, profit sharing, deposit, installment or cost recovery methods, as appropriate, until the sales criteria are met.
Incentive and Equity-Based Employee Compensation Plans
The Company grants equity-based compensation awards to its employees and directors in the form of restricted shares of common stock, LTIP units, outperformance programs, and performance units. See Notes 6, 7 and 8 for further discussion of restricted shares of common stock, LTIP units, and the outperformance programs and performance units, respectively. The Company measures equity-based compensation expense based on the fair value of the awards on the grant date and recognizes the expense ratably over the vesting period, and forfeitures are recognized in the period in which they occur.
Taxes
Federal Income Taxes
The Company elected to be taxed as a REIT under the Code commencing with its taxable year ended December 31, 2011 and intends to continue to qualify as a REIT. The Company is generally not subject to corporate level income tax on the earnings distributed currently to its stockholders that it derives from its REIT qualifying activities. As a REIT, the Company is required to distribute at least 90% of its REIT taxable income to its stockholders and meet the various other requirements imposed by the Code relating to such matters as operating results, asset holdings, distribution levels and diversity of stock ownership.
The Company will not be required to make distributions with respect to income derived from the activities conducted through subsidiaries that the Company elects to treat as taxable REIT subsidiaries (“TRS”) for federal income tax purposes, nor will it have to comply with income, assets, or ownership restrictions inside of the TRS. Certain activities that the Company undertakes must or should be conducted by a TRS, such as performing non-customary services for its tenants and holding assets that it cannot hold directly. A TRS is subject to federal and state income taxes. On June 24, 2016, the Operating Partnership, through its wholly owned subsidiary, transferred a vacant land parcel located in Burlington, NJ to the Company's TRS. On August 25, 2015, the Company's TRS acquired
two
vacant land parcels in connection with the Libertyville, IL acquisition. The Company's TRS recognized a net loss of approximately
$0.1 million
and
$25,000
, for the years ended
December 31, 2016
and
December 31, 2015
, respectively, which has been included on the accompanying Consolidated Statements of Operations. The TRS did not have any activity during the year ended
December 31, 2014
.
F-17
The following table reconciles net income (loss) to taxable income for the years ended
December 31, 2016
,
December 31, 2015
and
December 31, 2014
.
|
Year ended December 31,
|
|||||||||||
|
Reconciliation of Net Income (Loss) to Taxable Income (in thousands)
|
2016
|
2015
|
2014
|
||||||||
|
Net income (loss)
|
$
|
35,588
|
|
$
|
(29,345
|
)
|
$
|
(4,685
|
)
|
||
|
Book/tax differences from depreciation and amortization
|
66,763
|
|
60,959
|
|
49,672
|
|
|||||
|
Above/below market lease amortization
|
6,213
|
|
8,526
|
|
6,253
|
|
|||||
|
Loss on impairments
|
16,845
|
|
29,272
|
|
2,840
|
|
|||||
|
Book/tax difference on termination income
|
678
|
|
(1,815
|
)
|
1,994
|
|
|||||
|
Book/tax difference on property acquisition costs
|
4,498
|
|
4,400
|
|
4,279
|
|
|||||
|
Loss on extinguishment of debt
|
(17
|
)
|
—
|
|
686
|
|
|||||
|
Book/tax difference on accrued bonus payment
|
1,170
|
|
(337
|
)
|
941
|
|
|||||
|
Book/tax difference on bad debt expense
|
83
|
|
2
|
|
104
|
|
|||||
|
Book/tax difference on non-cash compensation
|
7,188
|
|
4,662
|
|
4,706
|
|
|||||
|
Book/tax difference on gain on the sales of rental property, net
|
(53,580
|
)
|
(10,653
|
)
|
(4,695
|
)
|
|||||
|
Straight-line rent adjustments, net
|
(2,495
|
)
|
(3,405
|
)
|
(3,255
|
)
|
|||||
|
Book/tax difference on non-cash portion of interest expense
|
1,631
|
|
1,266
|
|
979
|
|
|||||
|
Book/tax difference on prepaid rent of Sec. 467 leases
|
(274
|
)
|
1,887
|
|
—
|
|
|||||
|
Other book/tax differences, net
|
284
|
|
180
|
|
78
|
|
|||||
|
Loss attributable to noncontrolling interest
|
(4,069
|
)
|
(3,011
|
)
|
(3,414
|
)
|
|||||
|
Taxable income subject to distribution requirement
(1)
|
$
|
80,506
|
|
$
|
62,588
|
|
$
|
56,483
|
|
||
|
(1)
|
The Company distributed in excess of
100%
of its taxable income to its stockholders during the years ended
December 31, 2016
,
December 31, 2015
and
December 31, 2014
, respectively.
|
State and Local Income, Excise, and Franchise Tax
The Company and certain of its subsidiaries are subject to certain state and local income, excise and franchise taxes. Taxes in the amount of
$1.0 million
,
$0.9 million
and
$0.6 million
have been recorded in other expenses on the accompanying Consolidated Statements of Operations for the years ended
December 31, 2016
,
December 31, 2015
and
December 31, 2014
, respectively.
Uncertain Tax Positions
Tax benefits of uncertain tax positions are recognized only if it is more likely than not that the tax position will be sustained based solely on its technical merits, with the taxing authority having full knowledge of all relevant information. The measurement of a tax benefit for an uncertain tax position that meets the “more likely than not” threshold is based on a cumulative probability model under which the largest amount of tax benefit recognized is the amount with a greater than 50% likelihood of being realized upon ultimate settlement with the taxing authority having full knowledge of all the relevant information. As of
December 31, 2016
,
December 31, 2015
and
December 31, 2014
, there were
no
liabilities for uncertain tax positions.
Earnings Per Share
The Company uses the two-class method of computing earnings per common share, which is an earnings allocation formula that determines earnings per share for common stock and any participating securities according to dividends declared (whether paid or unpaid) and participation rights in undistributed earnings. Under the two-class method, basic earnings per common share are computed by dividing the sum of distributed earnings to common stockholders and undistributed earnings allocated to common stockholders by the weighted average number of common shares outstanding for the period. Diluted earnings per share reflect the potential dilution that could occur from shares issuable in connection with awards under incentive and equity-based compensation plans.
Segment Reporting
The Company manages its operations on an aggregated, single segment basis for purposes of assessing performance and making operating decisions and, accordingly, has only
one
reporting and operating segment.
F-18
Concentrations of Credit Risk
Concentrations of credit risk relevant to the Company may arise when a number of financing arrangements, including revolving credit facilities or derivatives, are entered into with the same lenders or counterparties, and have similar economic features that would cause their inability to meet contractual obligations. The Company mitigates the concentration of credit risk as it relates to financing arrangements by entering into loan syndications with multiple, reputable financial institutions and diversifying its debt counterparties. The Company also reduces exposure by diversifying its derivatives across multiple counterparties who meet established credit and capital guidelines.
Concentration of credit risk may also arise when the Company enters into leases with multiple tenants concentrated in the same industry, or into a significant lease or multiple leases with a single tenant, or tenants are located in the same geographic region, or have similar economic features that would cause their inability to meet contractual obligations, including those to the Company, to be similarly affected. The Company regularly monitors its tenant base to assess potential concentrations of credit risk through financial statement review, tenant management calls, and press releases. Management believes the current credit risk portfolio is reasonably well diversified and does not contain any unusual concentration of credit risk.
3. Rental Property
The following table summarizes the components of rental property, net as of
December 31, 2016
and
December 31, 2015
.
|
Rental Property, net (in thousands)
|
December 31, 2016
|
December 31, 2015
|
||||||
|
Land
|
$
|
272,162
|
|
|
$
|
228,919
|
|
|
|
Buildings, net of accumulated depreciation of $125,971 and $101,819, respectivel
y
|
1,408,406
|
|
|
1,234,838
|
|
|||
|
Tenant improvements, net of accumulated depreciation of $28,388 and $26,283, respectively
|
24,974
|
|
|
23,586
|
|
|||
|
Building and land improvements, net of accumulated depreciation of $33,054 and $19,815, respectivel
y
|
107,463
|
|
|
74,694
|
|
|||
|
Construction in progress
|
9,298
|
|
1,658
|
|
||||
|
Deferred leasing intangibles, net of accumulated amortization of $237,456 and $200,758, respectively
|
294,533
|
|
|
276,272
|
|
|||
|
Total rental property, net
|
$
|
2,116,836
|
|
|
$
|
1,839,967
|
|
|
F-19
Acquisitions
The following tables summarize the acquisitions of the Company during the years ended
December 31, 2016
and
December 31, 2015
.
|
Year ended December 31, 2016
|
||||||||||
|
Location of Property
|
Square Feet
|
Buildings
|
Purchase Price
(in thousands)
|
|||||||
|
Biddeford, ME
|
265,126
|
|
2
|
|
$
|
12,452
|
|
|||
|
Fairfield, OH
|
206,448
|
|
1
|
|
5,330
|
|
||||
|
Mascot, TN
|
130,560
|
|
1
|
|
4,500
|
|
||||
|
Erlanger, KY
|
108,620
|
|
1
|
|
5,600
|
|
||||
|
Three months ended March 31, 2016
|
710,754
|
|
5
|
|
27,882
|
|
||||
|
West Chicago, IL
|
249,470
|
|
1
|
|
8,663
|
|
||||
|
Visalia, CA
|
635,281
|
|
1
|
|
27,921
|
|
||||
|
Norcross, GA
|
152,036
|
|
1
|
|
5,508
|
|
||||
|
Reading, PA
|
248,000
|
|
1
|
|
9,594
|
|
||||
|
Charlotte, NC
|
104,852
|
|
1
|
|
6,517
|
|
||||
|
Three months ended June 30, 2016
|
1,389,639
|
|
5
|
|
58,203
|
|
||||
|
Columbia, SC
|
185,600
|
|
1
|
|
7,300
|
|
||||
|
Graniteville, SC
|
450,000
|
|
1
|
|
15,675
|
|
||||
|
Fountain Inn, SC
|
168,087
|
|
1
|
|
7,025
|
|
||||
|
Langhorne, PA
|
217,000
|
|
2
|
|
11,250
|
|
||||
|
Warren, MI
|
268,000
|
|
1
|
|
18,700
|
|
||||
|
New Castle, DE
|
485,987
|
|
1
|
|
27,500
|
|
||||
|
Westborough, MA
|
121,700
|
|
1
|
|
7,885
|
|
||||
|
Cedar Hill, TX
|
420,000
|
|
1
|
|
19,100
|
|
||||
|
Forest Park, GA
|
799,200
|
|
2
|
|
24,915
|
|
||||
|
Rock Hill, SC
|
315,520
|
|
1
|
|
9,850
|
|
||||
|
Gardiner, ME
|
265,000
|
|
1
|
|
16,800
|
|
||||
|
Three months ended September 30, 2016
|
3,696,094
|
|
13
|
|
166,000
|
|
||||
|
Langhorne, PA
|
172,647
|
|
1
|
|
9,500
|
|
||||
|
Grove City, OH
|
175,512
|
|
1
|
|
5,400
|
|
||||
|
Olathe, KS
|
496,373
|
|
1
|
|
23,194
|
|
||||
|
Houston, TX
|
223,599
|
|
1
|
|
13,444
|
|
||||
|
Itasca, IL
|
202,000
|
|
1
|
|
20,641
|
|
||||
|
Kenosha, WI
|
175,052
|
|
1
|
|
5,975
|
|
||||
|
Oklahoma City, OK
|
80,400
|
|
1
|
|
3,400
|
|
||||
|
San Antonio, TX
|
247,861
|
|
1
|
|
12,050
|
|
||||
|
Wood Dale, IL
|
137,607
|
|
1
|
|
8,565
|
|
||||
|
Hartland, WI
|
121,050
|
|
1
|
|
7,400
|
|
||||
|
Earth City, MO
|
116,783
|
|
1
|
|
5,450
|
|
||||
|
Spartanburg, SC
|
572,038
|
|
1
|
|
20,762
|
|
||||
|
West Columbia, SC
|
119,852
|
|
1
|
|
5,725
|
|
||||
|
West Chicago, IL
|
305,874
|
|
5
|
|
10,400
|
|
||||
|
DeForest, WI
|
254,431
|
|
1
|
|
7,800
|
|
||||
|
Montgomery, AL
|
332,000
|
|
1
|
|
8,750
|
|
||||
|
West Chester, OH
|
269,868
|
|
1
|
|
11,150
|
|
||||
|
West Columbia, SC
|
176,400
|
|
1
|
|
11,850
|
|
||||
|
Brooklyn Park, MN
|
200,720
|
|
1
|
|
20,532
|
|
||||
|
East Windsor, CT
|
126,111
|
|
1
|
|
7,725
|
|
||||
|
Three months ended December 31, 2016
|
4,506,178
|
|
24
|
|
219,713
|
|
||||
|
Year ended December 31, 2016
|
10,302,665
|
|
47
|
|
$
|
471,798
|
|
|||
F-20
|
Year ended December 31, 2015
|
||||||||||
|
Location of Property
|
Square Feet
|
Buildings
|
Purchase Price
(in thousands)
|
|||||||
|
Burlington, NJ
|
503,490
|
|
1
|
|
$
|
34,883
|
|
|||
|
Greenville, SC
|
157,500
|
|
1
|
|
4,800
|
|
||||
|
North Haven, CT
|
824,727
|
|
3
|
|
57,400
|
|
||||
|
Three months ended March 31, 2015
|
1,485,717
|
|
5
|
|
97,083
|
|
||||
|
Plymouth, MI
|
125,214
|
|
1
|
|
6,000
|
|
||||
|
Oakwood Village, OH
|
75,000
|
|
1
|
|
4,398
|
|
||||
|
Stoughton, MA
|
250,213
|
|
2
|
|
10,675
|
|
||||
|
Oklahoma City, OK
|
223,340
|
|
1
|
|
12,135
|
|
||||
|
Clinton, TN
|
166,000
|
|
1
|
|
5,000
|
|
||||
|
Knoxville, TN
|
108,400
|
|
1
|
|
4,750
|
|
||||
|
Fairborn, OH
|
258,680
|
|
1
|
|
9,100
|
|
||||
|
El Paso, TX
|
126,456
|
|
1
|
|
9,700
|
|
||||
|
Phoenix, AZ
|
102,747
|
|
1
|
|
9,500
|
|
||||
|
Charlotte, NC
|
123,333
|
|
1
|
|
7,500
|
|
||||
|
Machesney Park, IL
|
80,000
|
|
1
|
|
5,050
|
|
||||
|
Three months ended June 30, 2015
|
1,639,383
|
|
12
|
|
83,808
|
|
||||
|
Macedonia, OH
|
201,519
|
|
1
|
|
12,192
|
|
||||
|
Novi, MI
|
125,060
|
|
1
|
|
8,716
|
|
||||
|
Grand Junction, CO
|
82,800
|
|
1
|
|
5,254
|
|
||||
|
Tulsa, OK
|
175,000
|
|
1
|
|
13,000
|
|
||||
|
Chattanooga, TN
|
646,200
|
|
3
|
|
21,160
|
|
||||
|
Libertyville, IL
|
287,102
|
|
2
|
|
11,121
|
|
||||
|
Greer, SC
|
290,000
|
|
4
|
|
9,025
|
|
||||
|
Piedmont, SC
|
400,000
|
|
3
|
|
12,000
|
|
||||
|
Belvidere, IL
|
100,000
|
|
1
|
|
5,938
|
|
||||
|
Conyers, GA
|
201,403
|
|
1
|
|
9,880
|
|
||||
|
Three months ended September 30, 2015
|
2,509,084
|
|
18
|
|
108,286
|
|
||||
|
Durham, NC
|
80,600
|
|
1
|
|
4,200
|
|
||||
|
Charlotte, NC
|
124,680
|
|
1
|
|
5,423
|
|
||||
|
Shreveport, LA
|
420,259
|
|
1
|
|
11,000
|
|
||||
|
Dayton, OH
|
205,761
|
|
1
|
|
8,803
|
|
||||
|
West Allis, WI
|
241,977
|
|
4
|
|
9,900
|
|
||||
|
Loudon, TN
|
104,000
|
|
1
|
|
5,375
|
|
||||
|
Garland, TX
|
164,914
|
|
1
|
|
7,600
|
|
||||
|
Laurens, SC
|
125,000
|
|
1
|
|
5,535
|
|
||||
|
Lancaster, PA
|
240,529
|
|
1
|
|
9,350
|
|
||||
|
Grand Rapids, MI
|
301,317
|
|
1
|
|
9,400
|
|
||||
|
Burlington, NJ
|
1,048,631
|
|
1
|
|
61,500
|
|
||||
|
Three months ended December 31, 2015
|
3,057,668
|
|
14
|
|
138,086
|
|
||||
|
Year ended December 31, 2015
|
8,691,852
|
|
49
|
|
$
|
427,263
|
|
|||
F-21
The following table summarizes the allocation of the consideration paid at the date of acquisition during the years ended
December 31, 2016
and
December 31, 2015
, respectively, for the acquired assets and liabilities in connection with the acquisitions identified in the tables above.
|
Year ended December 31, 2016
|
Year ended December 31, 2015
|
|||||||||||
|
Acquired Assets and Liabilities
|
Purchase price (in thousands)
|
Weighted average amortization period (years) of intangibles at acquisition
|
Purchase price (in thousands)
|
Weighted average amortization period (years) of intangibles at acquisition
|
||||||||
|
Land
|
$
|
59,630
|
|
N/A
|
$
|
45,117
|
|
N/A
|
||||
|
Buildings
|
283,758
|
|
N/A
|
256,970
|
|
N/A
|
||||||
|
Tenant improvements
|
8,670
|
|
N/A
|
7,705
|
|
N/A
|
||||||
|
Building and land improvements
|
29,073
|
|
N/A
|
20,712
|
|
N/A
|
||||||
|
Deferred leasing intangibles - In-place leases
|
62,533
|
|
8.2
|
58,109
|
|
5.6
|
||||||
|
Deferred leasing intangibles - Tenant relationships
|
30,446
|
|
10.4
|
31,390
|
|
8.0
|
||||||
|
Deferred leasing intangibles - Above market leases
|
10,576
|
|
9.2
|
11,135
|
|
7.3
|
||||||
|
Deferred leasing intangibles - Below market leases
|
(12,971
|
)
|
8.5
|
(4,022
|
)
|
5.2
|
||||||
|
Above market assumed debt adjustment
|
(75
|
)
|
7.2
|
(418
|
)
|
1.4
|
||||||
|
Other assets
|
158
|
|
N/A
|
565
|
|
N/A
|
||||||
|
Total purchase price
|
471,798
|
|
|
427,263
|
|
|
||||||
|
Less: Mortgage notes assumed
|
(4,037
|
)
|
(26,267
|
)
|
||||||||
|
Less: Contingent consideration
|
—
|
|
(300
|
)
|
(1)
|
|||||||
|
Net assets acquired
|
$
|
467,761
|
|
$
|
400,696
|
|
||||||
|
(1)
|
In connection with the acquisition of the property located in West Allis, WI, the Company withheld
$0.3 million
that was otherwise due and payable to the seller. Under the terms of the purchase and sale agreement, the Company will pay the full amount to the seller by December 4, 2020, subject to the performance of the tenant under the in-place lease agreement.
|
On September 29, 2016, the Company assumed a mortgage note of approximately
$4.0 million
in connection with the acquisition of the property located in Rock Hill, SC. On September 29, 2015, the Company assumed a mortgage note of approximately
$5.7 million
in connection with the acquisition of the property located in Conyers, GA. On June 25, 2015, the Company assumed a mortgage note of approximately
$4.9 million
in connection with the acquisition of the property located in Charlotte, NC. For a discussion of the method used to determine the fair value of the mortgage notes, see Note 4.
On January 22, 2015, the Company acquired a property located in Burlington, NJ for approximately
$34.9 million
. As consideration for the property acquired, the Company (i) granted
812,676
Other Common Units with a fair value of approximately
$21.9 million
, (ii) paid approximately
$1.2 million
in cash, (iii) and assumed an approximately
$11.8 million
mortgage note. The mortgage note was paid in full immediately subsequent to the acquisition. On December 11, 2015, the Company acquired a property located in Laurens, SC for approximately
$5.5 million
. As consideration for the property acquired, the Company (i) granted
51,607
Other Common Units with a fair value of approximately
$1.0 million
, (ii) paid approximately
$0.6 million
in cash, (iii) and assumed an approximately
$3.9 million
mortgage note. The mortgage note was paid in full immediately subsequent to the acquisition. For a discussion of the method used to determine the fair value of the Other Common Units issued, see Note 7.
The table below sets forth the results of operations for the years ended
December 31, 2016
and
December 31, 2015
for the properties acquired during the years ended
December 31, 2016
and
December 31, 2015
, respectively, included in the Company’s Consolidated Statements of Operations from the date of acquisition.
|
Results of Operations (in thousands)
|
Year ended December 31, 2016
|
Year ended December 31, 2015
|
||||||
|
Revenue
|
$
|
13,105
|
|
$
|
17,879
|
|
||
|
Property acquisition costs
|
$
|
4,386
|
|
$
|
4,382
|
|
||
|
Net loss
|
$
|
3,560
|
|
$
|
3,052
|
|
||
F-22
The following tables set forth pro forma information for the years ended
December 31, 2016
and
December 31, 2015
. The below pro forma information does not purport to represent what the actual results of operations of the Company would have been had the acquisitions outlined above occurred on the first day of the applicable reporting period, nor do they purport to predict the results of operations of future periods. The pro forma information has not been adjusted for property sales.
|
Pro Forma (in thousands)
(1)
|
Year ended December 31, 2016
|
||||
|
Total revenue
|
$
|
277,811
|
|
||
|
Net income
|
$
|
46,139
|
|
(2)
|
|
|
Net income attributable to common stockholders
|
$
|
30,269
|
|
||
|
Pro Forma (in thousands)
(3)
|
Year ended December 31, 2015
|
||||
|
Total revenue
|
$
|
282,235
|
|
||
|
Net loss
|
$
|
42,617
|
|
(2)
|
|
|
Net loss attributable to common stockholders
|
$
|
53,850
|
|
||
|
(1)
|
The unaudited pro forma information for the year ended
December 31, 2016
is presented as if the properties acquired during the year ended
December 31, 2016
had occurred at
January 1, 2015
, the beginning of the reporting period prior to acquisition.
|
|
(2)
|
The net loss for the year ended
December 31, 2016
excludes approximately
$4.4 million
of property acquisition costs related to the acquisition of buildings that closed during the year ended
December 31, 2016
, and the net loss for the year ended
December 31, 2015
was adjusted to include these acquisition costs. Net loss for the year ended
December 31, 2015
excludes approximately
$4.4 million
of property acquisition costs related to the acquisition of buildings that closed during the year ended
December 31, 2015
.
|
|
(3)
|
The unaudited pro forma information for the year ended
December 31, 2015
is presented as if the properties acquired during the year ended
December 31, 2016
and the properties acquired during the year ended
December 31, 2015
had occurred at
January 1, 2015
and
January 1, 2014
, respectively, the beginning of the reporting period prior to acquisition.
|
Dispositions
During the year ended
December 31, 2016
, the Company sold
24
buildings comprised of approximately
4.2 million
square feet with a net book value of approximately
$90.3 million
to third parties. These buildings contributed approximately
$11.2 million
to revenue (exclusive of termination income and acceleration of straight line rent) and approximately
$1.3 million
to net income (exclusive of termination income, acceleration of straight line rent, loss on impairments, loss on extinguishment of debt, and gain on the sales of rental property, net) for the year ended
December 31, 2016
. Net proceeds from the sales of rental property were approximately
$152.1 million
and the Company recognized a gain on the sales of rental property, net of approximately
$61.8 million
for the year ended
December 31, 2016
. All of the dispositions were accounted for under the full accrual method.
During the year ended
December 31, 2015
, the Company sold
six
buildings comprised of approximately
0.8 million
square feet with a net book value of approximately
$17.2 million
to third parties. These buildings contributed approximately
$2.0 million
to revenue (exclusive of termination income and acceleration of straight line rent and above market rent) and approximately
$0.8 million
to net income (exclusive of loss on impairments, gain on the sales of rental property, net, termination income, and acceleration of straight line rent and lease intangibles) for the year ended
December 31, 2015
. Net proceeds from the sales of rental property were approximately
$22.2 million
and the Company recognized a gain on the sales of rental property, net of approximately
$5.0 million
for the year ended
December 31, 2015
. All of the dispositions were accounted for under the full accrual method.
During the year ended
December 31, 2014
, the Company sold
four
buildings comprised of approximately
0.4 million
square feet with a net book value of approximately
$10.2 million
to third parties. These buildings contributed approximately
$1.2 million
to revenue (exclusive of termination income and acceleration of straight line rent and above market rent) and approximately
$0.2 million
to net income (exclusive of gain on the sales of rental property, net, loss on impairments, termination income and acceleration of straight line rent and above market rent) for the year ended
December 31, 2014
. Net proceeds from the sales of rental property were approximately
$13.0 million
and the Company recognized a gain on the sales of rental property, net of approximately
$2.8 million
for the year ended
December 31, 2014
. All of the dispositions were accounted for under the full accrual method.
F-23
Loss on Impairments
The Company regularly reviews its portfolio and identifies properties for potential disposition. The Company reviews its current properties for disposition to realize value created in the portfolio and enhance the quality of the portfolio by disposing of underperforming assets. As a result of this regular review, several properties were tested for impairment due to the change in the Company's estimated hold period of those properties.
The following table summarizes the Company's loss on impairments for assets held and used during the year ended
December 31, 2016
.
|
Property Location
|
Buildings
|
Event or Change in Circumstance Leading to Impairment Evaluation
(1)
|
Valuation technique utilized to estimate fair value
|
Fair Value
(2)
|
Loss on Impairments
|
|||||||||
|
(in thousands)
|
||||||||||||||
|
Fairfield, VA
|
1
|
Change in estimated hold period
|
(3)
|
Executed purchase and sale agreement
|
|
|
|
|
||||||
|
Jackson, MS
|
1
|
Change in estimated hold period
|
(3)
|
Executed purchase and sale agreement
|
|
|
|
|
||||||
|
Jackson, MS
|
1
|
Change in estimated hold period
|
(3)
|
Executed purchase and sale agreement
|
|
|
|
|
||||||
|
Mishawaka, IN
|
1
|
Market leasing conditions
|
(3)
|
Discounted cash flows
|
(4)
|
|
|
|
|
|||||
|
Newark, DE
|
1
|
Market leasing conditions
|
Discounted cash flows
|
(4)
|
|
|
|
|
||||||
|
Seville, OH
|
2
|
Market leasing conditions
|
Discounted cash flows
|
(4)
|
|
|
|
|
||||||
|
Sparks, MD
|
2
|
Change in estimated hold period
|
Discounted cash flows
|
(4)
|
|
|
|
|
||||||
|
Three months ended June 30, 2016
|
$
|
10,598
|
|
$
|
11,231
|
|
||||||||
|
Boardman, OH
|
1
|
Change in estimated hold period
|
Discounted cash flows
|
(5)
|
|
|
|
|
||||||
|
Holland, MI
|
1
|
Change in estimated hold period
|
(3)
|
Discounted cash flows
|
(5)
|
|
|
|
|
|||||
|
Pensacola, FL
|
1
|
Change in estimated hold period
|
(3)
|
Discounted cash flows
|
(5)
|
|
|
|
|
|||||
|
Three months ended December 31, 2016
|
$
|
4,360
|
|
$
|
5,614
|
|
||||||||
|
Year ended December 31, 2016
|
$
|
14,958
|
|
$
|
16,845
|
|
||||||||
|
(1)
|
The Company tested the asset group for impairment utilizing a probability weighted recovery analysis of certain scenarios, and it was determined that the carrying value of the property and intangibles were not recoverable from the estimated future undiscounted cash flows.
|
|
(2)
|
The estimated fair value of the property is based on Level 3 inputs and is a non-recurring fair value measurement.
|
|
(3)
|
This property was sold during the year ended December 31, 2016.
|
|
(4)
|
Level 3 inputs used to determine fair value for the properties impaired for the three months ended June 30, 2016: discount rates ranged from
8.5%
to
13.0%
and exit capitalization rates ranged from
8.5%
to
12.0%
.
|
|
(5)
|
Level 3 inputs used to determine fair value for the properties impaired for the three months ended
December 31, 2016
: discount rate of
12.0%
and exit capitalization rates ranging from
10.0%
to
12.0%
.
|
F-24
The following table summarizes the Company's loss on impairments for assets held and used during the year ended
December 31, 2015
.
|
Property Location
|
Buildings
|
Event or Change in Circumstance Leading to Impairment Evaluation
(1)
|
Valuation technique utilized to estimate fair value
|
Fair Value
(2)
|
Loss on Impairments
|
|||||||||
|
(in thousands)
|
||||||||||||||
|
Hazelwood, MO
|
1
|
Change in estimated hold period
|
(3)
|
Executed purchase and sale agreement
|
|
|
|
|
||||||
|
Three months ended June 30, 2015
|
$
|
4,400
|
|
$
|
2,645
|
|
||||||||
|
Canton, OH
|
1
|
Change in estimated hold period
|
(4)
|
Discounted cash flows
|
(5)
|
|
|
|
|
|||||
|
Jefferson, NC
|
1
|
Change in estimated hold period
|
(3)
|
Market transactions for comparable properties
|
|
|
|
|
||||||
|
Milwaukee, WI
|
1
|
Change in estimated hold period
|
(3)
|
Market transactions for comparable properties
|
|
|
|
|
||||||
|
Three months ended September 30, 2015
|
6,515
|
|
5,733
|
|
||||||||||
|
Canton, OH
|
1
|
Change in estimated hold period
|
(6)
|
Market transactions for comparable properties
|
(7)
|
|
|
|
|
|||||
|
Cincinnati, OH
|
1
|
Change in estimated hold period
|
Discounted cash flows
|
(8)
|
|
|
|
|
||||||
|
Dayton, OH
|
1
|
Change in estimated hold period
|
(6)
|
Discounted cash flows
|
(8)
|
|
|
|
|
|||||
|
Gloversville, NY
|
1
|
Change in estimated hold period
|
(6)
|
Discounted cash flows
|
(8)
|
|
|
|
|
|||||
|
Jackson, MS
|
1
|
Change in estimated hold period
|
(6)
|
Discounted cash flows
|
(8)
|
|
|
|
|
|||||
|
Jackson, MS
|
1
|
Change in estimated hold period
|
(6)
|
Discounted cash flows
|
(8)
|
|
|
|
|
|||||
|
Rapid City, SD
|
1
|
Change in estimated hold period
|
Discounted cash flows
|
(8)
|
|
|
|
|
||||||
|
Sergeant Bluff, IA
|
1
|
Change in estimated hold period
|
Discounted cash flows
|
(8)
|
|
|
|
|
||||||
|
Sparks, MD
|
2
|
Change in estimated hold period
|
Discounted cash flows
|
(8)
|
|
|
|
|
||||||
|
Three months ended December 31, 2015
|
22,238
|
|
20,894
|
|
||||||||||
|
Year ended December 31, 2015
|
$
|
33,153
|
|
$
|
29,272
|
|
||||||||
|
(1)
|
The Company tested the asset group for impairment utilizing a probability weighted recovery analysis of certain scenarios, and it was determined that the carrying value of the property and intangibles were not recoverable from the estimated future undiscounted cash flows.
|
|
(2)
|
The estimated fair value of the property is based on Level 3 inputs and is a non-recurring fair value measurement.
|
|
(3)
|
This property was sold during the year ended December 31, 2015.
|
|
(4)
|
The letter of intent for the property included various contingencies, and was terminated subsequent to September 30, 2015.
|
|
(5)
|
Level 3 inputs used to determine fair value: discount rate of
9.0%
and exit capitalization rate of
12.0%
|
|
(6)
|
This property was sold during the year ended December 31, 2016.
|
|
(7)
|
The future cash flows of the existing building were not estimated to generate a net positive cash flow. Accordingly, the property was valued at its highest and best use as a vacant/developable land parcel. Market transactions for comparable properties were utilized to estimate a land value. Estimated fair market value of the property represents the land value, less estimated expense of demolition of the building, plus estimated salvage value.
|
|
(8)
|
Level 3 inputs used to determine fair value for the properties impaired for the three months ended December 31, 2015: discount rates ranged from
8.5%
to
16.0%
and exit capitalization rates ranged from
8.0%
to
14.0%
.
|
On October 29, 2014, the Company entered into a lease termination agreement with the tenant located at the Tavares, FL property. The agreement provided that the tenant’s lease termination was contingent upon the sale of the property and required the tenant to pay a termination fee of approximately
$2.4 million
, including reimbursement of costs related to the sale of the property. The tenant’s termination, which was effective December 30, 2014, triggered the Company to test the property for impairment. The Company tested the asset group for impairment utilizing a probability weighted recovery analysis of certain scenarios, and it was determined that the carrying value of the property and intangibles were not recoverable from the estimated future undiscounted cash flows. Accordingly, the property was written down to its estimated fair value of approximately
$2.5 million
based on pricing obtained from third party market participants and the Company recorded an impairment loss of approximately
$2.8 million
. This loss was recorded in loss on impairments on the accompanying Consolidated Statements of Operations for the three months ended December 31, 2014. The fair value of the property is based on Level 3 inputs and this is a non-recurring fair value measurement.
F-25
Involuntary Conversion
On September 1, 2016 the Company had an involuntary conversion event, and the Company recorded an estimated loss on involuntary conversion of approximately
$2.8 million
for the year ended December 31, 2016. The Company's insurance policy provides coverage for these losses, and accordingly the loss on involuntary conversion was fully offset by the expected insurance proceeds. As of December 31, 2016, the remaining proceeds receivable from the insurance company are estimated to be approximately
$1.4 million
, which are included in prepaid expenses and other assets on the accompanying Consolidated Balance Sheets.
Deferred Leasing Intangibles
The following table summarizes the deferred leasing intangibles on the accompanying Consolidated Balance Sheets as of
December 31, 2016
and
December 31, 2015
.
|
December 31, 2016
|
December 31, 2015
|
|||||||||||||||||||||||
|
Deferred Leasing Intangibles (in thousands)
|
Gross
|
Accumulated Amortization
|
Net
|
Gross
|
Accumulated Amortization
|
Net
|
||||||||||||||||||
|
Above market leases
|
$
|
70,668
|
|
$
|
(32,868
|
)
|
$
|
37,800
|
|
$
|
69,815
|
|
$
|
(31,554
|
)
|
$
|
38,261
|
|
||||||
|
Other intangible lease assets
|
461,321
|
|
(204,588
|
)
|
256,733
|
|
407,215
|
|
(169,204
|
)
|
238,011
|
|
||||||||||||
|
Total deferred leasing intangible assets
|
$
|
531,989
|
|
$
|
(237,456
|
)
|
$
|
294,533
|
|
$
|
477,030
|
|
$
|
(200,758
|
)
|
$
|
276,272
|
|
||||||
|
Below market leases
|
$
|
30,791
|
|
$
|
(10,450
|
)
|
$
|
20,341
|
|
$
|
19,923
|
|
$
|
(8,536
|
)
|
$
|
11,387
|
|
||||||
|
Total deferred leasing intangible liabilities
|
$
|
30,791
|
|
$
|
(10,450
|
)
|
$
|
20,341
|
|
$
|
19,923
|
|
$
|
(8,536
|
)
|
$
|
11,387
|
|
||||||
The following table sets forth the amortization expense and the net decrease to rental income for the amortization of deferred leasing intangibles during the years ended
December 31, 2016
,
December 31, 2015
and
December 31, 2014
.
|
|
Year ended December 31,
|
|||||||||||
|
Deferred Leasing Intangibles Amortization (in thousands)
|
2016
|
2015
|
2014
|
|||||||||
|
Net decrease to rental income related to above and below market lease amortization
|
$
|
6,213
|
|
$
|
8,526
|
|
$
|
6,254
|
|
|||
|
Amortization expense related to other intangible lease assets
|
$
|
66,291
|
|
$
|
60,834
|
|
$
|
50,319
|
|
|||
The following table sets forth the amortization of deferred leasing intangibles over the next five years as of
December 31, 2016
.
|
Year
|
Amortization Expense Related to Other Intangible Lease Assets (in thousands)
|
Net Decrease to Rental Income Related to Above and Below Market Lease Amortization (in thousands)
|
||||||
|
2017
|
$
|
63,474
|
|
$
|
4,514
|
|
||
|
2018
|
$
|
50,375
|
|
$
|
3,383
|
|
||
|
2019
|
$
|
38,258
|
|
$
|
2,813
|
|
||
|
2020
|
$
|
29,681
|
|
$
|
2,402
|
|
||
|
2021
|
$
|
20,915
|
|
$
|
1,288
|
|
||
F-26
4. Debt
The following table sets forth a summary of the Company’s outstanding indebtedness, including borrowings under the Company’s unsecured credit facility, unsecured term loans, unsecured notes and mortgage notes as of
December 31, 2016
and
December 31, 2015
.
|
Loan
|
Principal outstanding as of December 31, 2016 (in thousands)
|
|
Principal outstanding as of December 31, 2015 (in thousands)
|
Interest
Rate (1) |
|
Current Maturity
|
Prepayment Terms
(2)
|
||||||||
|
Unsecured credit facility:
|
|||||||||||||||
|
Unsecured Credit Facility
(3)
|
$
|
28,000
|
|
|
$
|
56,000
|
|
|
L + 1.15%
|
|
|
Dec-18-2019
|
i
|
||
|
Total unsecured credit facility
|
28,000
|
|
|
56,000
|
|
|
|
|
|
|
|
||||
|
|
|
||||||||||||||
|
Unsecured term loans:
|
|
|
|
|
|
|
|
|
|
||||||
|
Unsecured Term Loan C
|
150,000
|
|
—
|
|
|
L + 1.30%
|
|
Sep-29-2020
|
i
|
||||||
|
Unsecured Term Loan B
|
150,000
|
|
|
150,000
|
|
|
L + 1.30%
|
|
|
Mar-21-2021
|
i
|
||||
|
Unsecured Term Loan A
|
150,000
|
|
|
150,000
|
|
L + 1.30%
|
|
|
Mar-31-2022
|
i
|
|||||
|
Total unsecured term loans
|
450,000
|
|
300,000
|
|
|||||||||||
|
Less: Total unamortized deferred financing fees and debt issuance costs
|
(3,392
|
)
|
(3,382
|
)
|
|||||||||||
|
Total carrying value unsecured term loans
|
446,608
|
|
|
296,618
|
|
|
|
|
|
|
|
||||
|
|
|
||||||||||||||
|
Unsecured notes:
|
|
|
|
|
|
|
|
|
|
||||||
|
Series F Unsecured Notes
|
100,000
|
|
100,000
|
|
3.98
|
%
|
Jan-05-2023
|
ii
|
|||||||
|
Series A Unsecured Notes
|
50,000
|
|
|
50,000
|
|
|
4.98
|
%
|
Oct-1-2024
|
ii
|
|||||
|
Series D Unsecured Notes
|
100,000
|
|
|
100,000
|
|
|
4.32
|
%
|
Feb-20-2025
|
ii
|
|||||
|
Series B Unsecured Notes
|
50,000
|
|
|
50,000
|
|
|
4.98
|
%
|
Jul-1-2026
|
ii
|
|||||
|
Series C Unsecured Notes
|
80,000
|
|
|
80,000
|
|
|
4.42
|
%
|
Dec-30-2026
|
ii
|
|||||
|
Series E Unsecured Notes
|
20,000
|
|
|
20,000
|
|
|
4.42
|
%
|
Feb-20-2027
|
ii
|
|||||
|
Total unsecured notes
|
400,000
|
|
400,000
|
|
|||||||||||
|
Less: Total unamortized deferred financing fees and debt issuance costs
|
(2,034
|
)
|
(2,280
|
)
|
|||||||||||
|
Total carrying value unsecured notes
|
397,966
|
|
|
397,720
|
|
|
|
|
|
|
|||||
|
|
|||||||||||||||
|
Mortgage notes (secured debt):
|
|
|
|
|
|
|
|||||||||
|
Sun Life Assurance Company of Canada (U.S.)
|
—
|
|
3,229
|
|
6.05
|
%
|
Jun-1-2016
|
iii
|
|||||||
|
Webster Bank, National Association
|
—
|
|
5,513
|
|
4.22
|
%
|
Aug-4-2016
|
iii
|
|||||||
|
National Life Insurance Company
|
—
|
|
4,775
|
|
5.75
|
%
|
Aug-10-2016
|
iii
|
|||||||
|
Union Fidelity Life Insurance Co.
|
5,384
|
|
5,754
|
|
5.81
|
%
|
Apr-30-2017
|
iv
|
|||||||
|
Principal Life Insurance Company
|
—
|
|
5,676
|
|
5.73
|
%
|
|
May-05-2017
|
iii
|
||||||
|
Webster Bank, National Association
|
2,853
|
|
2,945
|
|
3.66
|
%
|
|
May-29-2017
|
iii
|
||||||
|
Webster Bank, National Association
|
3,073
|
|
3,172
|
|
3.64
|
%
|
|
May-31-2017
|
iii
|
||||||
|
Wells Fargo, National Association
|
4,043
|
|
4,115
|
|
5.90
|
%
|
|
Aug-1-2017
|
v
|
||||||
|
Connecticut General Life Insurance Company -1 Facility
|
35,320
|
|
57,171
|
|
6.50
|
%
|
|
Feb-1-2018
|
vi
|
||||||
|
Connecticut General Life Insurance Company -2 Facility
|
36,892
|
|
|
58,085
|
|
|
5.75
|
%
|
Feb-1-2018
|
vi
|
|||||
|
Connecticut General Life Insurance Company -3 Facility
|
16,141
|
|
|
16,401
|
|
|
5.88
|
%
|
Feb-1-2018
|
vi
|
|||||
|
Wells Fargo, National Association CMBS Loan
|
56,608
|
|
|
63,897
|
|
|
4.31
|
%
|
Dec-1-2022
|
vii
|
|||||
|
Thrivent Financial for Lutherans
|
4,012
|
|
—
|
|
4.78
|
%
|
Dec-15-2023
|
iii
|
|||||||
|
Total mortgage notes
|
164,326
|
|
|
230,733
|
|
|
|
|
|||||||
|
Total unamortized fair market value premiums
|
112
|
|
447
|
|
|
|
|||||||||
|
Less: Total unamortized deferred financing fees and debt issuance costs
|
(873
|
)
|
(1,270
|
)
|
|||||||||||
|
Total carrying value mortgage notes
|
163,565
|
|
|
229,910
|
|
|
|
||||||||
|
Total / weighted average interest rate
(4)
|
$
|
1,036,139
|
|
|
$
|
980,248
|
|
3.75
|
%
|
||||||
|
(1)
|
Current interest rate as of
December 31, 2016
. At
December 31, 2016
and
December 31, 2015
, the one-month LIBOR (“L”) was
0.77167%
and
0.42950%
, respectively. The current interest rate is not adjusted to include the amortization of deferred financing fees or debt issuance costs incurred in obtaining debt or any unamortized fair market value premiums.
|
|
(2)
|
Prepayment terms consist of (i) pre-payable with no penalty; (ii) pre-payable with penalty; (iii) pre-payable without penalty
three
months prior to the maturity date; (iv) pre-payable without penalty
two
months prior to the maturity date; (v) pre-payable without penalty
three
months prior to the maturity date; however, can be defeased; (vi) pre-payable without penalty
six
months prior to the maturity date; and (vii) pre-payable without penalty
three
months prior to the maturity date; however, can be defeased beginning January 1, 2016.
|
|
(3)
|
The capacity of the unsecured credit facility is currently
$450.0 million
.
|
|
(4)
|
The weighted average interest rate was calculated using the fixed interest rate swapped on the current notional amount of
$450.0 million
of debt, and is not adjusted to include the amortization of deferred financing fees or debt issuance costs incurred in obtaining debt or any unamortized fair market value premiums.
|
The aggregate undrawn nominal commitments on the
unsecured credit facility
as of
December 31, 2016
was approximately
$418.5 million
, including issued letters of credit. The Company's actual borrowing capacity at any given point in time may be less and is
F-27
restricted to a maximum amount based on the Company's debt covenant compliance. Total accrued interest for the Company's indebtedness was approximately
$5.7 million
and
$3.8 million
as of
December 31, 2016
and
December 31, 2015
, respectively, and is included in accounts payable, accrued expenses and other liabilities on the accompanying Consolidated Balance Sheets.
Deferred financing fees and debt issuance costs, net of accumulated amortization included in prepaid expenses and other assets on the accompanying Consolidated Balance Sheets were approximately
$2.3 million
and
$3.0 million
as of
December 31, 2016
and
December 31, 2015
, respectively. Deferred financing fees and debt issuance costs, net of accumulated amortization included as a direct deduction from the related debt liability on the accompanying Consolidated Balance Sheets were approximately
$6.3 million
and
$6.9 million
as of
December 31, 2016
and
December 31, 2015
, respectively. For the years ended
December 31, 2016
,
December 31, 2015
, and
December 31, 2014
, amortization of deferred financing fees and debt issuance costs included in interest expense in the accompanying Consolidated Statements of Operations was approximately
$1.9 million
,
$1.5 million
and
$1.3 million
, respectively. Also included in interest expense is approximately
$1.0 million
,
$0.7 million
, and
$0.1 million
of facility fees related to the Company's unsecured credit facility for the years ended
December 31, 2016
,
December 31, 2015
, and
December 31, 2014
, respectively.
2016 Debt Activity
On December 29, 2016, the Company drew the unsecured term loan with Wells Fargo, National Association and other lenders ("Unsecured Term Loan C") in the amount of
$150.0 million
. The Company incurred approximately
$0.3 million
and
$26,000
in unused fees related to the Unsecured Term Loan C for the years ended December 31, 2016 and December 31, 2015, respectively.
On December 20, 2016, the Company amended and restated the unsecured term loans with Wells Fargo, National Association and other lenders ("Unsecured Term Loan A" and "Unsecured Term Loan B"). The transaction reduced the spread over the applicable rate, which is based on the Company's consolidated leverage ratio, as defined in the loan agreement, with no changes to maturity dates or other material terms of the loan. The spread over the LIBOR for the Unsecured Term Loan A was reduced from 1.65% to 1.30%, and the spread over the LIBOR for the Unsecured Term Loan B was reduced from 1.70% to 1.30%, assuming the most recently reported consolidated leverage ratios.
On December 8, 2016, the mortgage note held with Connecticut General Life Insurance Company (Facility 2) was partially paid in the amount of approximately
$3.6 million
in connection with the sale of the Georgetown, KY property, which had served as partial collateral for the mortgage note. The prepayment fees and associated unamortized deferred financing fees and debt issuance costs of approximately
$0.1 million
were written off to loss on extinguishment of debt in the accompanying Consolidated Statements of Operations during the year ended
December 31, 2016
.
On November 14, 2016, the mortgage note held with Connecticut General Life Insurance Company (Facility 2) was partially paid in the amount of approximately
$6.2 million
in connection with the sale of the Conyers, GA property, which had served as partial collateral for the mortgage note. The prepayment fees and associated unamortized deferred financing fees and debt issuance costs of approximately
$0.2 million
were written off to loss on extinguishment of debt in the accompanying Consolidated Statements of Operations during the year ended
December 31, 2016
.
On November 14, 2016, the mortgage note held with Connecticut General Life Insurance Company (Facility 1) was partially paid in the amount of approximately
$21.0 million
in connection with the sale of the Charlotte, NC property, which had served as partial collateral for the mortgage note. The prepayment fees and associated unamortized deferred financing fees and debt issuance costs of approximately
$0.9 million
were written off to loss on extinguishment of debt in the accompanying Consolidated Statements of Operations during the year ended
December 31, 2016
.
On November 14, 2016, the mortgage note held with Principal Life Insurance Company, for which the property located in Conyers, GA served as collateral for the mortgage note, was paid in full. The prepayment fees and associated unamortized deferred financing fees and debt issuance costs of approximately
$0.1 million
were written off to loss on extinguishment of debt in the accompanying Consolidated Statements of Operations during the year ended
December 31, 2016
.
On September 29, 2016, the Company assumed a mortgage note held with Thrivent Financial for Lutherans of approximately
$4.0 million
in connection with the acquisition of the property located in Rock Hill, SC, which serves as collateral for the debt. The debt matures on December 15, 2023 and bears interest at
4.78%
per annum. The assumed debt was recorded at fair value and a fair value premium of approximately
$0.1 million
was recorded. The fair value of debt was determined by discounting the future
F-28
cash flows using the then current rate of approximately
4.45%
at which loans would be made to borrowers with similar credit ratings for loans with similar remaining maturities, similar terms, and similar loan-to-value ratios. The fair value of the debt is based on Level 3 inputs and is a nonrecurring fair value measurement.
On June 22, 2016, the mortgage note held with Wells Fargo, National Association (CMBS loan) was partially defeased in the amount of approximately
$1.5 million
in connection with the sale of the Gloversville, NY property, which had served as partial collateral for the mortgage note. The associated defeasance fees and unamortized deferred financing fees and debt issuance costs of approximately
$0.3 million
were written off to loss on extinguishment of debt in the accompanying Consolidated Statement of Operations for the year ended
December 31, 2016
.
On May 18, 2016, the mortgage note held with National Life Insurance Company, for which the property located in Charlotte, NC served as collateral, was paid in full.
On May 5, 2016, the mortgage note held with Webster Bank, National Association, for which the property located in Norton, MA served as collateral, was paid in full.
On April 26, 2016, the mortgage note held with Wells Fargo, National Association (CMBS loan) was partially defeased in the
amount of approximately
$1.7 million
in connection with the sale of the Parsons, KS property, which had served as partial collateral for the mortgage note. The associated defeasance fees and unamortized deferred financing fees and debt issuance costs of approximately
$0.2 million
were written off to loss on extinguishment of debt in the accompanying Consolidated Statement of Operations for the year ended
December 31, 2016
.
On April 26, 2016, the mortgage note held with Wells Fargo, National Association (CMBS loan) was partially defeased in the
amount of approximately
$1.8 million
in connection with the sale of the Kansas City, KS property, which had served as partial collateral for the mortgage note. The associated defeasance fees and unamortized deferred financing fees and debt issuance costs of approximately
$0.3 million
were written off to loss on extinguishment of debt in the accompanying Consolidated Statement of Operations for the year ended
December 31, 2016
.
On March 17, 2016, the mortgage note held with Connecticut General Life Insurance Company (Facility 2) was partially paid in the amount of approximately
$10.5 million
in connection with the sale of the Gresham, OR property, which had served as partial collateral for the mortgage note. The prepayment fees and associated unamortized deferred financing fees and debt issuance costs of approximately
$0.9 million
were written off to loss on extinguishment of debt in the accompanying Consolidated Statement of Operations during the year ended
December 31, 2016
.
On March 3, 2016, the mortgage note held with Wells Fargo, National Association (CMBS loan) was partially defeased in the amount of approximately
$1.2 million
in connection with the sale of the Wichita, KS property, which had served as partial collateral for the mortgage note. The associated defeasance fees and unamortized deferred financing fees and debt issuance costs of approximately
$0.2 million
were written off to loss on extinguishment of debt in the accompanying Consolidated Statement of Operations during the year ended
December 31, 2016
.
On March 1, 2016 the mortgage note held with Sun Life Assurance Company of Canada (U.S.), for which the property located in Gahanna, OH served as collateral, was paid in full.
2015 Debt Activity
On January 22, 2015, the Company assumed a mortgage note of approximately
$11.8 million
in connection with the acquisition of the Burlington, NJ property. The mortgage note was paid in full immediately subsequent to the acquisition.
On February 20, 2015, the Company issued
$100 million
of its
4.32%
Series D
10
-year unsecured notes ("Series D Unsecured Notes") and
$20 million
of its
4.42%
Series E
12
-year unsecured notes ("Series E Unsecured Notes").
On June 25, 2015, the Company assumed a mortgage note with National Life Insurance Company of approximately
$4.9 million
in connection with the acquisition of the property located in Charlotte, NC, which serves as collateral for the debt. The debt matures on August 10, 2016 and bears interest at
5.75%
per annum. The assumed debt was recorded at fair value and a fair value premium of approximately
$0.1 million
was recorded. The fair value of debt was determined by discounting the future cash flows using the then current rate of approximately
3.05%
at which loans would be made to borrowers with similar credit ratings for loans with
F-29
similar remaining maturities, similar terms, and similar loan-to-value ratios. The fair value of the debt is based on Level 3 inputs and is a non-recurring fair value measurement.
On September 29, 2015, the Company assumed a mortgage note with Principal Life Insurance Company of approximately
$5.7 million
in connection with the acquisition of the property located in Conyers, GA, which serves as collateral for the debt. The debt matures on May 5, 2017 and bears interest at
5.73%
per annum. The assumed debt was recorded at fair value and a fair value premium of approximately
$0.3 million
was recorded. The fair value of debt was determined by discounting the future cash flows using the then current rate of approximately
2.64%
at which loans would be made to borrowers with similar credit ratings for loans with similar remaining maturities, similar terms, and similar loan-to-value ratios. The fair value of the debt is based on Level 3 inputs and is a non-recurring fair value measurement.
On September 29, 2015, the Company entered into an amendment to the current unsecured credit facility with Wells Fargo, N.A. ("Unsecured Credit Facility") to increase the capacity thereunder to
$450.0 million
. Additionally, the accordion feature that allows the Company to request an increase in the aggregate commitments (subject to satisfaction of conditions and lender consent) was increased, such that if the accordion were exercised in full, total capacity would be
$800.0 million
. The material terms of the agreement, including the financial covenants, were unchanged. The Company incurred approximately
$1.0 million
in deferred financing fees, which are amortized over the remaining term of the Unsecured Credit Facility.
On September 29, 2015, the Company closed the
$150.0 million
Unsecured Term Loan C with the following terms.
|
Applicable Terms
|
Unsecured Term Loan C
|
|
|
Maturity Date:
|
Sep-29-2020
|
|
|
Eurodollar Rate
(1)
:
|
L + 130.0 bps - 190.0 bps
|
|
|
Base Rate
(1)
:
|
Base rate + 30.0 bps - 90.0 bps
|
|
|
Unused Fees
(2)
:
|
17.5 bps
|
|
|
Annual Fee:
|
$50,000
|
|
|
(1)
|
The spread over the applicable rate is currently based on the Company's consolidated leverage ratio, as defined in the loan agreement.
|
|
(2)
|
The unused fees began to accrue on November 29, 2015 and were due and payable monthly until all commitments were drawn.
|
The Unsecured Term Loan C has an accordion feature that allows the Company to increase its borrowing capacity to
$250.0 million
, subject to the satisfaction of certain conditions and lender consents. The Company incurred
$1.0 million
in deferred financing fees associated with the closing of the Unsecured Term Loan C, which are amortized over its
five
year term. The agreement includes a delayed draw feature that allowed the Company to draw up to
six
advances of at least
$25.0 million
each. As noted above, the Company drew the full $150.0 million of the Unsecured Term Loan C on December 29, 2016. The Company and certain wholly owned subsidiaries of the Operating Partnership are guarantors of the Unsecured Term Loan C. The agreement also contains financial covenants substantially similar to the financial covenants in the Unsecured Credit Facility.
On December 1, 2015, the Company entered into a Note Purchase Agreement (“NPA”) for a
$100.0 million
private placement by the Operating Partnership of
$100.0 million
senior unsecured notes (“Series F Unsecured Notes”). Pursuant to the NPA, borrowings under the Series F Unsecured Notes bear interest at a fixed rate of
3.98%
. The Series F Unsecured Notes were issued on December 15, 2015. Upon all the funds being drawn, the Company paid a placement fee equal to
0.50%
of the principal amount of the securities purchased by investors. The Company and certain wholly owned subsidiaries of the Operating Partnership are guarantors of the Series F Unsecured Note and the obligations under the Series F Unsecured Notes rank pari passu to the Company’s unsecured senior indebtedness, which includes the Wells Fargo Unsecured Credit Facility and unsecured term loans. The Company incurred approximately
$0.6 million
in deferred financing fees associated with the Series F Unsecured Notes, which are amortized over the
seven
year term.
On December 1, 2015, the Company amended the terms of the NPAs entered into on April 16, 2014 and December 18, 2014. The second amendment to the April 16, 2014 NPA and the first amendment to the December 18, 2014 NPA amended certain provisions to conform them to the provisions in the NPA entered into on December 1, 2015.
On December 11, 2015, the Company assumed a mortgage note of approximately
$3.9 million
in connection with the acquisition of the Laurens, SC property. The mortgage note was paid in full immediately subsequent to the acquisition.
On December 16, 2015, the Company drew the Unsecured Term Loan B in the amount of
$150.0 million
.
F-30
Financial Covenant Considerations
The Company’s ability to borrow under the unsecured credit facility, unsecured term loans, and unsecured notes are subject to its ongoing compliance with a number of customary financial covenants, including:
|
•
|
a maximum consolidated leverage ratio of not greater than
0.60
:1.00;
|
|
•
|
a maximum secured leverage ratio of not greater than
0.40
:1.00;
|
|
•
|
a maximum unencumbered leverage ratio of not greater than
0.60
:1.00;
|
|
•
|
a maximum secured recourse debt level of not greater than
0.075
:1.00;
|
|
•
|
a minimum fixed charge ratio of not less than
1.50
:1.00;
|
|
•
|
a minimum unsecured interest coverage ratio of not less than
1.75
:1.00; and
|
|
•
|
a minimum tangible net worth covenant test.
|
The unsecured notes are also subject to a minimum interest coverage ratio of not less than
1.50
:1.00. The Company was in compliance with all such applicable restrictions and financial covenants as of
December 31, 2016
and
December 31, 2015
. In the event of a default under the unsecured credit facility or the unsecured term loans, the Company’s dividend distributions are limited to the minimum amount necessary for the Company to maintain its status as a REIT.
Each of the Company’s mortgage notes has specific properties and assignments of rents and leases that are collateral for these loans. These debt facilities contain certain financial and other covenants. The Company was in compliance with all such applicable restrictions and financial covenants as of
December 31, 2016
and
December 31, 2015
. The real estate net book value of the properties that are collateral for the Company’s mortgage notes was approximately
$229.9 million
and
$268.8 million
at
December 31, 2016
and
December 31, 2015
, respectively, and is limited to senior, property-level secured debt financing arrangements. The
17
properties held as collateral for the facilities with Connecticut General Life Insurance Company are cross-defaulted and cross-collateralized among the respective facilities.
Fair Value of Debt
The fair value of the Company’s debt is determined by discounting the future cash flows using the current rates at which loans would be made to borrowers with similar credit ratings for loans with similar remaining maturities, similar terms, and similar loan-to-value ratios. The discount rates ranged from approximately
1.92%
to
4.85%
and
1.58%
to
4.82%
at
December 31, 2016
and
December 31, 2015
, respectively, and were applied to each individual debt instrument. The applicable fair value guidance establishes a three tier value hierarchy, which prioritizes the inputs used in measuring fair value. The fair value of the Company’s debt is based on Level 3 inputs. The following table presents the aggregate principal outstanding of the Company’s debt and the corresponding estimate of fair value as of
December 31, 2016
and
December 31, 2015
(in thousands).
|
|
December 31, 2016
|
December 31, 2015
|
||||||||||||||
|
|
Principal Outstanding
|
Fair Value
|
Principal Outstanding
|
Fair Value
|
||||||||||||
|
Unsecured credit facility
|
$
|
28,000
|
|
$
|
28,000
|
|
$
|
56,000
|
|
$
|
56,000
|
|
||||
|
Unsecured term loans
|
450,000
|
|
450,000
|
|
300,000
|
|
303,457
|
|
||||||||
|
Unsecured notes
|
400,000
|
|
399,091
|
|
400,000
|
|
392,054
|
|
||||||||
|
Mortgage notes
|
164,326
|
|
166,099
|
|
230,733
|
|
237,327
|
|
||||||||
|
Total principal amount
|
1,042,326
|
|
$
|
1,043,190
|
|
986,733
|
|
$
|
988,838
|
|
||||||
|
Add: Total unamortized fair market value premiums
|
112
|
|
447
|
|
||||||||||||
|
Less: Total unamortized deferred financing fees and debt issuance costs
|
(6,299
|
)
|
(6,932
|
)
|
||||||||||||
|
Total carrying value
|
$
|
1,036,139
|
|
$
|
980,248
|
|
||||||||||
F-31
Future Principal Payments of Debt
The following table reflects the Company’s aggregate future principal payments of the Company’s debt at
December 31, 2016
.
|
Year
|
Future Principal Payments of Debt
(in thousands)
|
|||
|
2017
|
$
|
18,737
|
|
|
|
2018
|
88,578
|
|
||
|
2019
|
29,926
|
|
||
|
2020
|
152,006
|
|
||
|
2021
|
152,103
|
|
||
|
Thereafter
|
600,976
|
|
||
|
Total aggregate principal payments
|
1,042,326
|
|
||
|
Total unamortized fair market value premiums
|
112
|
|
||
|
Less: Total unamortized deferred financing fees and debt issuance costs
|
(6,299
|
)
|
||
|
Total carrying value
|
$
|
1,036,139
|
|
|
5. Use of Derivative Financial Instruments
Risk Management Objective of Using Derivatives
The Company’s use of derivative instruments is limited to the utilization of interest rate swaps to manage interest rate risk exposure on existing and future liabilities and not for speculative purposes. The principal objective of such arrangements is to minimize the risks and related costs associated with the Company’s operating and financial structure.
The following table details the Company’s outstanding interest rate swaps as of
December 31, 2016
.
|
Interest Rate
Derivative Counterparty |
Trade Date
|
Effective Date
|
Notional Amount
(in thousands) |
Fair Value
(in thousands) |
Pay Fixed Interest Rate
|
Receive Variable Interest Rate
|
Maturity Date
|
||||||||||||
|
PNC Bank, N.A.
|
Sep-14-2012
|
Oct-10-2012
|
$
|
10,000
|
|
$
|
6
|
|
0.7945
|
%
|
One-month L
|
Sep-10-2017
|
|||||||
|
Bank of America, N.A.
|
Sep-14-2012
|
Oct-10-2012
|
$
|
10,000
|
|
$
|
6
|
|
0.7945
|
%
|
One-month L
|
Sep-10-2017
|
|||||||
|
UBS AG
|
Sep-14-2012
|
Oct-10-2012
|
$
|
10,000
|
|
$
|
6
|
|
0.7945
|
%
|
One-month L
|
Sep-10-2017
|
|||||||
|
Royal Bank of Canada
|
Sep-14-2012
|
Oct-10-2012
|
$
|
10,000
|
|
$
|
6
|
|
0.7945
|
%
|
One-month L
|
Sep-10-2017
|
|||||||
|
RJ Capital Services, Inc.
|
Sep-14-2012
|
Oct-10-2012
|
$
|
10,000
|
|
$
|
5
|
|
0.7975
|
%
|
One-month L
|
Sep-10-2017
|
|||||||
|
Bank of America, N.A.
|
Sep-20-2012
|
Oct-10-2012
|
$
|
25,000
|
|
$
|
21
|
|
0.7525
|
%
|
One-month L
|
Sep-10-2017
|
|||||||
|
RJ Capital Services, Inc.
|
Sep-24-2012
|
Oct-10-2012
|
$
|
25,000
|
|
$
|
26
|
|
0.7270
|
%
|
One-month L
|
Sep-10-2017
|
|||||||
|
Regions Bank
|
Mar-01-2013
|
Mar-01-2013
|
$
|
25,000
|
|
$
|
131
|
|
1.3300
|
%
|
One-month L
|
Feb-14-2020
|
|||||||
|
Capital One, N.A.
|
Jun-13-2013
|
Jul-01-2013
|
$
|
50,000
|
|
$
|
(274
|
)
|
1.6810
|
%
|
One-month L
|
Feb-14-2020
|
|||||||
|
Capital One, N.A.
|
Jun-13-2013
|
Aug-01-2013
|
$
|
25,000
|
|
$
|
(154
|
)
|
1.7030
|
%
|
One-month L
|
Feb-14-2020
|
|||||||
|
Regions Bank
|
Sep-30-2013
|
Feb-03-2014
|
$
|
25,000
|
|
$
|
(378
|
)
|
1.9925
|
%
|
One-month L
|
Feb-14-2020
|
|||||||
|
The Toronto-Dominion Bank
|
Oct-14-2015
|
Sep-29-2016
|
$
|
25,000
|
|
$
|
217
|
|
1.3830
|
%
|
One-month L
|
Sep-29-2020
|
|||||||
|
PNC Bank, N.A.
|
Oct-14-2015
|
Sep-29-2016
|
$
|
50,000
|
|
$
|
421
|
|
1.3906
|
%
|
One-month L
|
Sep-29-2020
|
|||||||
|
Regions Bank
|
Oct-14-2015
|
Sep-29-2016
|
$
|
35,000
|
|
$
|
292
|
|
1.3858
|
%
|
One-month L
|
Sep-29-2020
|
|||||||
|
U.S. Bank, N.A.
|
Oct-14-2015
|
Sep-29-2016
|
$
|
25,000
|
|
$
|
207
|
|
1.3950
|
%
|
One-month L
|
Sep-29-2020
|
|||||||
|
Capital One, N.A.
|
Oct-14-2015
|
Sep-29-2016
|
$
|
15,000
|
|
$
|
123
|
|
1.3950
|
%
|
One-month L
|
Sep-29-2020
|
|||||||
|
Royal Bank of Canada
|
Jan-08-2015
|
Mar-20-2015
|
$
|
25,000
|
|
$
|
(16
|
)
|
1.7090
|
%
|
One-month L
|
Mar-21-2021
|
|||||||
|
The Toronto-Dominion Bank
|
Jan-08-2015
|
Mar-20-2015
|
$
|
25,000
|
|
$
|
(18
|
)
|
1.7105
|
%
|
One-month L
|
Mar-21-2021
|
|||||||
|
The Toronto-Dominion Bank
|
Jan-08-2015
|
Sep-10-2017
|
$
|
100,000
|
|
$
|
(1,240
|
)
|
2.2255
|
%
|
One-month L
|
Mar-21-2021
|
|||||||
|
Wells Fargo, N.A.
|
Jan-08-2015
|
Mar-20-2015
|
$
|
25,000
|
|
$
|
4
|
|
1.8280
|
%
|
One-month L
|
Mar-31-2022
|
|||||||
|
The Toronto-Dominion Bank
|
Jan-08-2015
|
Feb-14-2020
|
$
|
25,000
|
|
$
|
(50
|
)
|
2.4535
|
%
|
One-month L
|
Mar-31-2022
|
|||||||
|
Regions Bank
|
Jan-08-2015
|
Feb-14-2020
|
$
|
50,000
|
|
$
|
(133
|
)
|
2.4750
|
%
|
One-month L
|
Mar-31-2022
|
|||||||
|
Capital One, N.A.
|
Jan-08-2015
|
Feb-14-2020
|
$
|
50,000
|
|
$
|
(175
|
)
|
2.5300
|
%
|
One-month L
|
Mar-31-2022
|
|||||||
On October 24, 2014, the Company entered into
two
forward starting interest rate swap agreements for a total notional amount of
$170.0 million
to hedge the risk of changes in the interest-related cash flows associated with the potential issuance of long-term debt. The forward starting swaps were designated as cash flow hedges of interest rate risk and were terminated on November 21, 2014. The Company paid a termination payment of approximately
$0.4 million
to the
two
counterparties. The forward starting
F-32
interest rate swaps effectively removed the exposure to the variability in future cash flows of the Series D Unsecured Notes, and the
$80 million
series C
12
-year unsecured notes ("Series C Unsecured Notes") and Series E Unsecured Notes at
2.452%
and
2.615%
, respectively. The settlement value of approximately
$0.4 million
was recorded in accumulated other comprehensive loss in the Consolidated Balance Sheets and will be amortized through interest expense over the life of the respective unsecured notes. The Series C Unsecured Notes were issued on December 30, 2014 and the Series D Unsecured Notes and the Series E Unsecured Notes were issued on February 20, 2015 (refer to Note 4 for further details).
The fair value of the interest rate swaps outstanding as of
December 31, 2016
and
December 31, 2015
was as follows.
|
Balance Sheet Line Item (in thousands)
|
Notional Amount December 31, 2016
|
Fair Value December 31, 2016
|
Notional Amount December 31, 2015
|
Fair Value December 31, 2015
|
||||||||||||
|
Interest rate swaps-Asset
|
$
|
300,000
|
|
$
|
1,471
|
|
$
|
275,000
|
|
$
|
1,867
|
|
||||
|
Interest rate swaps-Liability
|
$
|
375,000
|
|
$
|
(2,438
|
)
|
$
|
400,000
|
|
$
|
(3,766
|
)
|
||||
Cash Flow Hedges of Interest Rate Risk
The Company’s objectives in using interest rate swaps are to add stability to interest expense and to manage its exposure to interest rate movements. The Company uses interest rate swaps to fix the rate of its long term variable rate debt. Interest rate swaps designated as cash flow hedges involve the receipt of variable amounts from a counterparty in exchange for the Company making fixed-rate payments over the life of the agreements without exchange of the underlying notional amount.
The effective portion of changes in the fair value of derivatives designated and qualified as cash flow hedges is recorded in accumulated other comprehensive loss and will be reclassified to interest expense in the period that the hedged forecasted transaction affects earnings on the Company’s variable rate debt. The ineffective portion of the change in fair value of the derivatives is recognized directly in earnings into interest expense. For the year ended
December 31, 2016
, the Company recorded a gain of
$0.1 million
of hedge ineffectiveness in interest expense due to short-term, partial mismatches in notional amounts. For the years ended
December 31, 2015
and
December 31, 2014
, the Company did not record any hedge ineffectiveness related to the hedged derivatives.
The Company estimates that approximately
$2.4 million
will be reclassified from accumulated other comprehensive loss as an increase to interest expense over the next 12 months.
The table below details the location in the financial statements of the gain or loss recognized on interest rate swaps designated as cash flow hedges for the years ended
December 31, 2016
,
December 31, 2015
, and
December 31, 2014
, (in thousands).
|
|
Year ended December 31,
|
|||||||||||
|
|
2016
|
2015
|
2014
|
|||||||||
|
Amount of loss recognized in accumulated other comprehensive loss on interest rate swaps (effective portion)
|
$
|
2,244
|
|
$
|
5,387
|
|
$
|
6,705
|
|
|||
|
Amount of loss reclassified from accumulated other comprehensive loss into income (loss) as interest expense (effective portion)
|
$
|
3,142
|
|
$
|
3,431
|
|
$
|
2,508
|
|
|||
|
Amount of gain recognized in interest expense (ineffective portion and amount excluded from effectiveness testing)
|
$
|
66
|
|
$
|
—
|
|
$
|
—
|
|
|||
Credit-risk-related Contingent Features
The Company has agreements with each of its derivative counterparties that contain a provision where the Company could be declared in default on its derivative obligations if repayment of the underlying indebtedness is accelerated by the lender due to the Company's default on the indebtedness.
As of
December 31, 2016
, the fair values of
13
of the
23
of the Company’s interest rate swaps were in an asset position of approximately
$1.5 million
and
10
interest rate swaps were in a liability position of approximately
$2.5 million
, excluding any adjustment for nonperformance risk related to these agreements. The adjustment for nonperformance risk included in the fair value of the Company’s net asset position and net liability position was approximately
$13,000
and
$0.1 million
, respectively, as of
December 31, 2016
. Accrued interest expense for the Company's interest rate swaps was approximately
$40,000
as of
December 31, 2016
and is included in accounts payable, accrued expenses and other liabilities on the accompanying Consolidated Balance Sheets. As of
December 31, 2016
, the Company has not posted any collateral related to these agreements. If the Company
F-33
had breached any of its provisions at
December 31, 2016
, it could have been required to settle its obligations under the agreement of the interest rate swaps in a liability position plus accrued interest for approximately
$2.6 million
.
Fair Value of Interest Rate Swaps
The Company’s valuation of the interest rate swaps is determined using widely accepted valuation techniques including discounted cash flow analysis on the expected cash flows of each derivative. This analysis reflects the contractual terms of the derivatives, including the period to maturity, and uses observable market-based inputs including interest rate curves. The fair values of interest rate swaps are determined by using the market standard methodology of netting the discounted future fixed cash payments and the discounted expected variable cash receipts. The variable cash receipts are based on an expectation of future interest rates (forward curves) derived from observable market interest rate curves.
The Company incorporates credit valuation adjustments to appropriately reflect both its own nonperformance risk and the respective counterparty’s nonperformance risk in the fair value measurements. In adjusting the fair value of its derivative contracts for the effect of nonperformance risk, the Company has considered the impact of netting and any applicable credit enhancements, such as collateral postings, thresholds, mutual puts, and guarantees.
Although the Company has determined that the majority of the inputs used to value its derivatives fall within Level 2 of the fair value hierarchy, the credit valuation adjustments associated with its derivatives utilize Level 3 inputs, such as estimates of current credit spreads to evaluate the likelihood of default by itself and its counterparties. However, as of
December 31, 2016
and
December 31, 2015
, the Company has assessed the significance of the impact of the credit valuation adjustments on the overall valuation of its derivative positions and has determined that the credit valuation adjustments are not significant to the overall valuation of its derivatives. As a result, the Company has determined that its derivative valuations in their entirety are classified in Level 2 of the fair value hierarchy.
The following sets forth the Company’s financial instruments that are accounted for at fair value on a recurring basis as of
December 31, 2016
and
December 31, 2015
.
|
|
|
Fair Value Measurements as of
December 31, 2016 Using |
||||||||||||||
|
Balance Sheet Line Item (in thousands)
|
Fair Value December 31, 2016
|
Level 1
|
Level 2
|
Level 3
|
||||||||||||
|
Interest rate swaps-Asset
|
$
|
1,471
|
|
$
|
—
|
|
$
|
1,471
|
|
$
|
—
|
|
||||
|
Interest rate swaps-Liability
|
$
|
(2,438
|
)
|
$
|
—
|
|
$
|
(2,438
|
)
|
$
|
—
|
|
||||
|
|
|
Fair Value Measurements as of
December 31, 2015 Using |
||||||||||||||
|
Balance Sheet Line Item (in thousands)
|
Fair Value December 31, 2015
|
Level 1
|
Level 2
|
Level 3
|
||||||||||||
|
Interest rate swaps-Asset
|
$
|
1,867
|
|
$
|
—
|
|
$
|
1,867
|
|
$
|
—
|
|
||||
|
Interest rate swaps-Liability
|
$
|
(3,766
|
)
|
$
|
—
|
|
$
|
(3,766
|
)
|
$
|
—
|
|
||||
F-34
6. Equity
Preferred Stock
Pursuant to its charter, the Company is authorized to issue
15,000,000
shares of preferred stock, par value
$0.01
per share.
On March 17, 2016, the Company completed an underwritten public offering of
3,000,000
shares of the Series C Preferred Stock,
$0.01
par value per share, at a price to the public of
$25.00
per share. On
November 2, 2016, the Company redeemed all of the Series A Preferred Stock. The table below sets forth the Company’s outstanding preferred stock issuances as of
December 31, 2016
.
|
Preferred Stock Issuances
|
Issuance Date
|
Number of Shares
|
Price and Liquidation Value Per Share
|
Interest Rate
|
||||||||
|
Series B Cumulative Redeemable Preferred Stock
|
April 16, 2013
|
2,800,000
|
|
$
|
25.00
|
|
6.625
|
%
|
||||
|
Series C Cumulative Redeemable Preferred Stock
|
March 17, 2016
|
3,000,000
|
|
$
|
25.00
|
|
6.875
|
%
|
||||
Dividends on the Series A Preferred Stock, Series B Preferred Stock, and Series C
Preferred Stock (collectively, the "Preferred Stock Issuances") are payable quarterly in arrears on or about the last day of March, June, September, and December of each year.
The Preferred Stock Issuances rank on parity with each other and rank senior to the Company’s common stock with respect to dividend rights and
rights upon the liquidation, dissolution or winding up of the Company. The Preferred Stock Issuances have no stated maturity date and are not subject to mandatory redemption or any sinking fund. Generally, the Company is not permitted to redeem the Series B Preferred Stock or the Series C Preferred Stock prior to April 16, 2018 and March 17, 2021, respectively, except in limited circumstances relating to the Company’s ability to qualify as a REIT and in certain other circumstances related to a change of control.
The tables below set forth the dividends attributable to the Preferred Stock Issuances during the years ended
December 31, 2016
and
December 31, 2015
.
|
Quarter Ended 2016
|
Declaration Date
|
Series A
Preferred Stock Per Share |
Series B
Preferred Stock Per Share |
Series C
Preferred Stock Per Share |
Payment Date
|
|||||||||||
|
December 31
|
November 2, 2016
|
(1)
|
$
|
0.19375
|
|
(1)
|
$
|
0.4140625
|
|
$
|
0.4296875
|
|
December 30, 2016
|
|||
|
September 30
|
August 1, 2016
|
0.56250
|
|
0.4140625
|
|
0.4296875
|
|
September 30, 2016
|
||||||||
|
June 30
|
May 2, 2016
|
0.56250
|
|
0.4140625
|
|
0.4965300
|
|
(2)
|
June 30, 2016
|
|||||||
|
March 31
|
February 22, 2016
|
0.56250
|
|
0.4140625
|
|
—
|
|
March 31, 2016
|
||||||||
|
Total
|
|
$
|
1.88125
|
|
$
|
1.6562500
|
|
$
|
1.3559050
|
|
|
|||||
|
(1)
|
On September 26, 2016 the board of directors approved the redemption of the Series A Preferred Stock. On November 2, 2016 the Company redeemed all of the Series A Preferred Stock, at a cash redemption price of
$25.00
per share, plus accrued and unpaid dividends to but excluding the redemption date, without interest.
|
|
(2)
|
Dividends for the Series C Preferred Stock were accrued and cumulative from and including March 17, 2016 to the first payment date on June 30, 2016.
|
|
Quarter Ended 2015
|
Declaration Date
|
Series A
Preferred Stock Per Share |
Series B
Preferred Stock Per Share |
Payment Date
|
||||||||
|
December 31
|
October 22, 2015
|
$
|
0.5625
|
|
$
|
0.4140625
|
|
|
December 31, 2015
|
|||
|
September 30
|
July 21, 2015
|
0.5625
|
|
0.4140625
|
|
September 30, 2015
|
||||||
|
June 30
|
May 4, 2015
|
0.5625
|
|
0.4140625
|
|
June 30, 2015
|
||||||
|
March 31
|
February 20, 2015
|
0.5625
|
|
0.4140625
|
|
|
March 31, 2015
|
|||||
|
Total
|
|
$
|
2.2500
|
|
$
|
1.6562500
|
|
|
|
|||
On
February 15, 2017
, the Company’s board of directors declared the Series B Preferred Stock and the Series C Preferred Stock dividend for the quarter ending March 31, 2017 at a quarterly rate of
$0.4140625
per share and
$0.4296875
per share, respectively.
F-35
Common Stock
The following sets forth the Company’s at-the market ("ATM") common stock offering programs as of
December 31, 2016
.
|
ATM Stock Offering Program (in thousands)
|
Date
|
Maximum Aggregate Offering Price
(in thousands) |
Aggregate Common Stock Available as of December 31, 2016 (in thousands)
|
|||||||
|
2016 $228 million ATM
|
November 8, 2016
|
$
|
228,218
|
|
$
|
117,331
|
|
|||
The tables below set forth the activity for the ATM common stock offering programs during the years ended
December 31, 2016
and
December 31, 2015
(in thousands, except share data).
|
|
Year ended December 31, 2016
|
||||||||||||||||||
|
ATM Stock Offering Program
|
Shares
Sold |
Weighted Average Price Per Share
|
Gross
Proceeds |
Sales
Agents’ Fee |
Net
Proceeds |
||||||||||||||
|
2016 $228 million ATM
|
4,763,838
|
|
$
|
23.28
|
|
$
|
110,887
|
|
$
|
1,550
|
|
$
|
109,337
|
|
|||||
|
2016 $200 million ATM
(1)
|
7,326,200
|
|
$
|
23.45
|
|
171,782
|
|
2,429
|
|
169,353
|
|
||||||||
|
Total/weighted average
|
12,090,038
|
|
$
|
23.38
|
|
$
|
282,669
|
|
$
|
3,979
|
|
$
|
278,690
|
|
|||||
|
(1)
|
This program ended before
December 31, 2016
.
|
|
|
Year ended December 31, 2015
|
||||||||||||||||||
|
ATM Stock Offering Program
|
Shares
Sold |
Weighted Average Price Per Share
|
Gross
Proceeds |
Sales
Agents’ Fee |
Net
Proceeds |
||||||||||||||
|
2014 $200 million ATM
(1)
|
2,661,403
|
|
$
|
21.63
|
|
$
|
57,571
|
|
$
|
864
|
|
$
|
56,707
|
|
|||||
|
2014 $150 million ATM
(1)
|
795,000
|
|
$
|
21.79
|
|
17,321
|
|
260
|
|
17,061
|
|
||||||||
|
Total/weighted average
|
3,456,403
|
|
$
|
21.67
|
|
$
|
74,892
|
|
$
|
1,124
|
|
$
|
73,768
|
|
|||||
|
(1)
|
This program ended before
December 31, 2016
.
|
F-36
Dividends
The tables below set forth the dividends attributable to the common stock that were declared or paid during the years ended
December 31, 2016
and
December 31, 2015
, respectively.
|
Month Ended 2016
|
Declaration Date
|
Record Date
|
Per Share
|
Payment Date
|
||||||
|
December 31
|
August 1, 2016
|
December 30, 2016
|
$
|
0.115833
|
|
January 17, 2017
|
||||
|
November 30
|
August 1, 2016
|
November 30, 2016
|
0.115833
|
|
December 15, 2016
|
|||||
|
October 31
|
August 1, 2016
|
October 31, 2016
|
0.115833
|
|
November 15, 2016
|
|||||
|
September 30
|
May 2, 2016
|
September 30, 2016
|
0.115833
|
|
October 17, 2016
|
|||||
|
August 31
|
May 2, 2016
|
August 31, 2016
|
0.115833
|
|
September 15, 2016
|
|||||
|
July 31
|
May 2, 2016
|
July 29, 2016
|
0.115833
|
|
August 15, 2016
|
|||||
|
June 30
|
February 22, 2016
|
June 30, 2016
|
0.115833
|
|
July 15, 2016
|
|||||
|
May 31
|
February 22, 2016
|
May 31, 2016
|
0.115833
|
|
June 15, 2016
|
|||||
|
April 30
|
February 22, 2016
|
April 29, 2016
|
0.115833
|
|
May 16, 2016
|
|||||
|
March 31
|
October 22, 2015
|
March 31, 2016
|
0.115833
|
|
April 15, 2016
|
|||||
|
February 29
|
October 22, 2015
|
February 29, 2016
|
0.115833
|
|
March 15, 2016
|
|||||
|
January 31
|
October 22, 2015
|
January 29, 2016
|
0.115833
|
|
February 16, 2016
|
|||||
|
Total
|
|
$
|
1.389996
|
|
|
|||||
|
Month Ended 2015
|
Declaration Date
|
Record Date
|
Per Share
|
Payment Date
|
||||||
|
December 31
|
July 21, 2015
|
December 31, 2015
|
$
|
0.1150
|
|
January 15, 2016
|
||||
|
November 30
|
July 21, 2015
|
November 30, 2015
|
0.1150
|
|
December 15, 2015
|
|||||
|
October 31
|
July 21, 2015
|
October 30, 2015
|
0.1150
|
|
November 16, 2015
|
|||||
|
September 30
|
May 4, 2015
|
September 30, 2015
|
0.1150
|
|
October 15, 2015
|
|||||
|
August 31
|
May 4, 2015
|
August 31, 2015
|
0.1150
|
|
September 15, 2015
|
|||||
|
July 31
|
May 4, 2015
|
July 31, 2015
|
0.1150
|
|
August 17, 2015
|
|||||
|
June 30
|
February 20, 2015
|
June 30, 2015
|
0.1125
|
|
July 15, 2015
|
|||||
|
May 31
|
February 20, 2015
|
May 29, 2015
|
0.1125
|
|
June 15, 2015
|
|||||
|
April 30
|
February 20, 2015
|
April 30, 2015
|
0.1125
|
|
May 15, 2015
|
|||||
|
March 31
|
October 30, 2014
|
March 31, 2015
|
0.1125
|
|
April 15, 2015
|
|||||
|
February 28
|
October 30, 2014
|
February 27, 2015
|
0.1125
|
|
March 16, 2015
|
|||||
|
January 31
|
October 30, 2014
|
January 31, 2015
|
0.1125
|
|
February 17, 2015
|
|||||
|
Total
|
|
$
|
1.3650
|
|
|
|||||
On
November 2, 2016
, the Company’s board of directors declared the common stock dividend for the months ending
January 31, 2017
,
February 28, 2017
and
March 31, 2017
at a monthly rate of
$0.116667
per share of common stock. On
February 15, 2017
, the Company’s board of directors declared the common stock dividend for the months ending
April 30, 2017
,
May 31, 2017
and
June 30, 2017
at a monthly rate of
$0.116667
per share of common stock.
F-37
Restricted Stock-Based Compensation
Pursuant to the 2011 Plan, the Company grants restricted shares of common stock to certain employees of the Company. The restricted shares of common stock are subject to time-based vesting. Restricted shares of common stock granted on January 8, 2016, subject to the recipient’s continued employment, will vest in
four
equal installments on January 1 of each year beginning in 2017. Refer to Note 14 for details on restricted shares of common stock granted on January 6, 2017. Holders of restricted shares of common stock have voting rights and rights to receive dividends. Restricted shares of common stock may not be sold, assigned, transferred, pledged or otherwise disposed of and are subject to a risk of forfeiture prior to the expiration of the applicable vesting period. The following table summarizes activity related to the Company’s unvested restricted shares of common stock for the years ended
December 31, 2016
and
December 31, 2015
.
|
Unvested Restricted Shares of Common Stock
|
Shares
|
|
||
|
Balance at December 31, 2014
|
263,916
|
|
|
|
|
Granted
|
94,290
|
|
(1)
|
|
|
Vested
|
(72,185
|
)
|
|
|
|
Forfeited
|
(14,906
|
)
|
|
|
|
Balance at December 31, 2015
|
271,115
|
|
|
|
|
Granted
|
101,289
|
|
(2)
|
|
|
Vested
|
(98,746
|
)
|
|
|
|
Forfeited
|
(1,321
|
)
|
|
|
|
Balance at December 31, 2016
|
272,337
|
|
|
|
|
(1)
|
The grant date fair value per share was
$26.17
.
|
|
(2)
|
The grant date fair value per share was
$17.98
.
|
The unrecognized compensation expense associated with the Company’s restricted shares of common stock at
December 31, 2016
was approximately
$3.3 million
and is expected to be recognized over a weighted average period of approximately
2.1 years
.
The following table summarizes the fair value at vesting date for the restricted shares of common stock vested during the years ended
December 31, 2016
,
December 31, 2015
and
December 31, 2014
.
|
|
Year ended December 31,
|
|||||||||||
|
|
2016
|
2015
|
2014
|
|||||||||
|
Vested restricted shares of common stock
|
98,746
|
|
72,185
|
|
51,885
|
|
||||||
|
Fair value of vested restricted shares of common stock (in thousands)
|
$
|
1,813
|
|
$
|
1,751
|
|
$
|
1,123
|
|
|||
7. Noncontrolling Interest
The Company is structured as an UPREIT, and owns substantially all of its assets and conducts substantially all of its business through its Operating Partnership. The Company’s consolidated financial statements include the accounts of the Company, the Operating Partnership and their subsidiaries. The table below summarizes the activity for noncontrolling interest in the Company for the years ended
December 31, 2016
and
December 31, 2015
.
|
|
LTIP Units
|
Other
Common Units
|
Total
Noncontrolling Common Units
|
Noncontrolling Interest
|
|||||||
|
Balance at December 31, 2014
|
1,307,036
|
|
1,124,813
|
|
2,431,849
|
|
3.6
|
%
|
|||
|
Granted/Issued
|
323,069
|
|
864,283
|
|
1,187,352
|
|
N/A
|
|
|||
|
Forfeitures
|
—
|
|
—
|
|
—
|
|
N/A
|
|
|||
|
Conversions from LTIP units to Other Common Units
|
(20,000
|
)
|
20,000
|
|
—
|
|
N/A
|
|
|||
|
Redemptions from Other Common Units to common stock
|
—
|
|
(90,824
|
)
|
(90,824
|
)
|
N/A
|
|
|||
|
Redemption of Other Common Units for cash
|
—
|
|
(2,400
|
)
|
(2,400
|
)
|
N/A
|
|
|||
|
Balance at December 31, 2015
|
1,610,105
|
|
1,915,872
|
|
3,525,977
|
|
4.9
|
%
|
|||
|
Granted/Issued
|
176,396
|
|
—
|
|
176,396
|
|
N/A
|
|
|||
|
Forfeitures
|
—
|
|
—
|
|
—
|
|
N/A
|
|
|||
|
Conversions from LTIP units to Other Common Units
|
(209,985
|
)
|
209,985
|
|
—
|
|
N/A
|
|
|||
|
Redemptions from Other Common Units to common stock
|
—
|
|
(68,492
|
)
|
(68,492
|
)
|
N/A
|
|
|||
|
Balance at December 31, 2016
|
1,576,516
|
|
2,057,365
|
|
3,633,881
|
|
4.3
|
%
|
|||
The Company adjusts the carrying value of noncontrolling interest to reflect its share of the book value of the Operating Partnership when there has been a change in the Company’s ownership of the Operating Partnership. Such adjustments are recorded to additional paid-in capital as a rebalancing of noncontrolling interest on the accompanying Consolidated Statements of Equity.
F-38
LTIP Units
LTIP units are granted to certain executive officers and senior employees of the Company as part of their compensation, and to independent directors for their service. LTIP units are valued by reference to the value of the Company’s common stock and are subject to such conditions and restrictions as the compensation committee of the board of directors may determine, including continued employment or service. LTIP units granted on January 6, 2016 to independent directors, subject to the recipient’s continued service, will vest on January 1, 2017. LTIP units granted on January 8, 2016 to certain senior executive officers and senior employees, subject to the recipient’s continued employment, will vest quarterly over
four
years, with the first vesting date being March 31, 2016. LTIP units granted on February 22, 2016 to certain senior executive officers, subject to the recipient’s continued employment, will vest quarterly over
four
years, with the first vesting date being March 31, 2016. Refer to Note 14 for details on the LTIP units granted on January 6, 2017.Vested LTIP units can be converted to Other Common Units on a
one-for-one
basis once a material equity transaction has occurred that results in the accretion of the member’s capital account to the economic equivalent of an Other Common Unit. All LTIP units, whether vested or not, will receive the same monthly per unit distributions as Other Common Units, which equal per share dividends on common stock.
On January 25, 2016, the Company and Geoffrey G. Jervis, the Company’s Chief Financial Officer, Executive Vice President and Treasurer, agreed that Mr. Jervis’s employment with the Company would terminate effective February 25, 2016. Pursuant to the terms and conditions of the executive employment agreement and LTIP unit agreements between the Company and Mr. Jervis, and the Company’s 2015 Outperformance Program ("OPP"), Mr. Jervis received a lump sum cash payment, the continuation of certain insurance benefits, immediate vesting of outstanding LTIP units, and eligibility to receive a pro-rated award payment under the OPP. Accordingly, the Company accelerated the expense recognition of Mr. Jervis's unvested LTIP units in the amount of approximately
$1.6 million
, which is included in general and administrative expenses for the year ended
December 31, 2016
on the accompanying Consolidated Statements of Operations. Additionally, the unrecognized compensation expense associated with Mr. Jervis's participation in the OPP after February 25, 2016 will not be recognized. The Company also incurred approximately
$1.5 million
related to the lump sum cash payment and continuation of certain insurance benefits, which is included in general and administrative expenses during the year ended
December 31, 2016
on the accompanying Consolidated Statements of Operations.
On May 4, 2015, the Company and the Operating Partnership and Benjamin S. Butcher, the Company’s Chief Executive Officer, President and Chairman of the Board, entered into an amended and restated employment agreement. The amended and restated agreement is for an initial term of
three years
. The agreement automatically extends for successive
one year
terms unless, not fewer than
60
days before the term’s end, either party provides a notice of non-renewal to the other party. In connection with the amended and restated agreement, the compensation committee of the board of directors granted Mr. Butcher a retention award of
100,000
LTIP units that vest one-half on the third anniversary of the grant and one-sixth on the fourth, fifth and sixth anniversaries.
On September 8, 2014, the Company executed an employment agreement, effective October 27, 2014, with Jeffrey M. Sullivan to serve as the Company’s Executive Vice President, General Counsel, and Secretary for a term of
three
years commencing on January 1, 2015. During the period October 27, 2014 to December 31, 2014, Mr. Sullivan acted as a special legal advisor to the Company. On October 27, 2014, pursuant to the 2011 Plan, the Company awarded an initial LTIP unit grant equal in value to approximately
$0.1 million
, which equated to
4,006
LTIP units that will vest over
five
years in equal installments on a quarterly basis beginning on
December 31, 2014
. Additionally on October 27, 2014, pursuant to the 2011 Plan, Mr. Sullivan was granted LTIP units equal in value to
$0.6 million
, which equated to
26,596
LTIP units, which will vest at the end of the initial term of the employment agreement on December 31, 2017.
On September 8, 2014, Kathryn Arnone, Executive Vice President, General Counsel and Secretary of the Company, informed the board of directors of her decision to resign from the Company effective
December 31, 2014
. On December 15, 2014, Ms. Arnone informed the board of directors that she was resigning immediately. In connection with her resignation, and pursuant to the terms of the LTIP unit agreements (which terms provide for acceleration of vesting in the case of employment termination due to illness), her outstanding unvested LTIP units vested immediately upon her resignation. The Company accelerated the expense recognition of Ms. Arnone’s unvested LTIP units in the amount of approximately
$0.9 million
, which is included in general and administrative expenses for the year ended
December 31, 2014
on the accompanying Consolidated Statements of Operations.
On May 12, 2014, the Company executed an employment agreement with Geoffrey G. Jervis to serve as the Company’s Chief Financial Officer, Executive Vice President and Treasurer for a term of
three
years. On July 1, 2014, pursuant to the 2011 Plan, the Company awarded an initial LTIP unit grant equal in value to approximately
$0.3 million
, which equated to
14,850
LTIP units that will vest over
five
years in equal installments on a quarterly basis beginning on September 30, 2014. Additionally on July 1,
F-39
2014, pursuant to the 2011 Plan, Mr. Jervis was granted LTIP units equal in value to
$1.2 million
, which equated to
52,106
LTIP units, which will vest at the end of a
three
years term, running concurrently with the initial term of the employment agreement, which ends on June 30, 2017. Subsequent to December 31, 2015, the Company and Mr. Jervis agreed that Mr. Jervis’s employment with the Company would terminate effective February 25, 2016; as discussed above.
On February 7, 2014, Gregory W. Sullivan, the Company’s former Chief Financial Officer, Executive Vice President and Treasurer, notified the Company of his intention not to renew his contract at its expiration on April 20, 2014 and he tendered his resignation from his position on April 21, 2014. On April 21, 2014, Mr. Sullivan and the Company executed a consulting agreement, which had an effective date of April 29, 2014, pursuant to which Mr. Sullivan would act as a senior financial advisor to the Company for
one year
. The consulting agreement modified the vesting terms of Mr. Sullivan’s LTIP units previously granted to him as well as the vesting provisions of his share of the Company’s 2011 Outperformance Program (“2011 OPP”) (refer to Note 12 for further details on the 2011 OPP) that was measured on September 19, 2014. At the time of Mr. Sullivan’s contract expiration, he had
82,804
unvested LTIP units and a
14%
allocation of the 2011 OPP. The modification to the terms of Mr. Sullivan’s LTIP units and his share of the previously unrecognized compensation expense associated with the 2011 OPP were considered a Type III modification, with non-substantive services, in accordance with GAAP. Accordingly, his unvested LTIP units and his share of the previously unrecognized compensation expense associated with 2011 OPP were valued on the effective date of the consulting agreement for approximately
$2.0 million
and
$0.2 million
, respectively, and these amounts were expensed upon the effective date of the consulting agreement and included in general and administrative expenses during the year ended December 31, 2014 on the accompanying Consolidated Statements of Operations. The Company expensed dividends in the amount of approximately
$0.1 million
previously paid to Mr. Sullivan on the unvested LTIP units and this amount is also included in general and administrative expenses during the year ended
December 31, 2014
on the accompanying Consolidated Statements of Operations. Additionally the Company incurred approximately
$0.7 million
of general and administrative expenses during the year ended
December 31, 2014
related to his salary, bonus and other benefits that will be received over the term of the consulting agreement.
The LTIP units issued under the 2011 Plan were valued using the Monte Carlo lattice binomial option-pricing model at the grant date. The fair value of the LTIP units are based on Level 3 inputs and are non-recurring fair value measurements. The table below sets forth the assumptions used in valuing such LTIP units for the years ended
December 31, 2016
and
December 31, 2015
.
|
LTIP Units
|
Assumptions
|
|||||||||||||||||||||||||||||||
|
Grant date
|
February 22, 2016
|
January 8, 2016
|
January 6, 2016
|
May 4, 2015
|
January 12, 2015
|
October 27, 2014
|
July 1, 2014
|
January 2, 2014
|
||||||||||||||||||||||||
|
Expected term (years)
|
10
|
|
10
|
|
10
|
|
10
|
|
10
|
|
10
|
|
10
|
|
10
|
|
||||||||||||||||
|
Expected volatility
|
22.0
|
%
|
22.0
|
%
|
22.0
|
%
|
20.0
|
%
|
20.0
|
%
|
20
|
%
|
40
|
%
|
40
|
%
|
||||||||||||||||
|
Expected dividend yield
|
6.0
|
%
|
6.0
|
%
|
6.0
|
%
|
6.0
|
%
|
6.0
|
%
|
6.0
|
%
|
6.0
|
%
|
6.0
|
%
|
||||||||||||||||
|
Risk-free interest rate
|
1.01
|
%
|
1.28
|
%
|
1.36
|
%
|
0.66
|
%
|
0.62
|
%
|
0.48
|
%
|
0.79
|
%
|
0.79
|
%
|
||||||||||||||||
|
Fair value of LTIP units at issuance (in thousands)
|
$
|
277
|
|
$
|
2,254
|
|
$
|
390
|
|
$
|
2,038
|
|
$
|
5,450
|
|
$
|
690
|
|
$
|
1,542
|
|
$
|
4,329
|
|
||||||||
|
LTIP units at issuance
|
18,386
|
|
135,546
|
|
22,464
|
|
100,000
|
|
223,069
|
|
30,602
|
|
66,956
|
|
224,424
|
|
||||||||||||||||
|
Fair value unit price per LTIP unit at issuance
|
$
|
15.07
|
|
$
|
16.63
|
|
$
|
17.36
|
|
$
|
20.38
|
|
$
|
24.43
|
|
$
|
22.56
|
|
$
|
23.03
|
|
$
|
19.29
|
|
||||||||
The following table summarizes activity related to the Company’s unvested LTIP units for the years ended
December 31, 2016
and
December 31, 2015
.
|
Unvested LTIP Units
|
LTIP Units
|
||
|
Balance at December 31, 2014
|
448,887
|
|
|
|
Granted
|
323,069
|
|
|
|
Vested
|
(237,046
|
)
|
|
|
Forfeited
|
—
|
|
|
|
Balance at December 31, 2015
|
534,910
|
|
|
|
Granted
|
176,396
|
|
|
|
Vested
|
(307,883
|
)
|
|
|
Forfeited
|
—
|
|
|
|
Balance at December 31, 2016
|
403,423
|
|
|
The unrecognized compensation expense associated with the Company’s LTIP units at
December 31, 2016
was approximately
$6.6 million
and is expected to be recognized over a weighted average period of approximately
2.5 years
.
F-40
The following table summarizes the fair value at vesting date for the LTIP units vested during years ended
December 31, 2016
,
December 31, 2015
, and
December 31, 2014
.
|
|
Year ended December 31,
|
||||||||||
|
|
2016
|
2015
|
2014
|
||||||||
|
Vested LTIP units
|
307,883
|
|
237,046
|
|
639,445
|
|
|||||
|
Fair value of vested LTIP units (in thousands)
|
$
|
6,393
|
|
$
|
4,853
|
|
$
|
14,063
|
|
||
Other Common Units
Other Common Units and shares of the Company’s common stock have essentially the same economic characteristics in that Other Common Units directly, and shares of the Company’s common stock indirectly, through the Company’s interest in the Operating Partnership, share equally in the total net income or loss distributions of the Operating Partnership. Subject to certain restrictions, investors who own Other Common Units have the right to cause the Operating Partnership to redeem any or all of their Other Common Units for cash equal to the then-current value of
one
share of the Company’s common stock, or, at the Company’s election, shares of common stock on a
one-for-one
basis. The value of a share of common stock is calculated as the average common stock closing price on the NYSE for the
10
trading days immediately preceding the redemption notice date. Each Other Common Unit will receive the same monthly distribution as a share of common stock.
As partial consideration for a property acquired on January 22, 2015, the Company granted
812,676
Other Common Units with a fair value of approximately
$21.9 million
based on the Company’s NYSE closing stock price on January 22, 2015. As partial consideration for another property acquired on December 11, 2015, the Company granted
51,607
Other Common Units with a fair value of approximately
$1.0 million
based on the Company’s NYSE closing stock price on December 11, 2015. The number of Other Common Units granted was calculated based on the trailing
10
-day average common stock closing price ending on the business day that immediately preceded the grant date. The fair value of the shares of the Other Common Units granted was calculated based on the closing stock price per the NYSE on the grant date multiplied by the number of Other Common Units granted. The issuance of the Other Common Units was effected in reliance upon an exemption from registration provided by Section 4(2) under the Securities Act of 1933, as amended. The Company relied on the exemption based on representations given by the holders of the Other Common Units.
8. Equity Incentive Plan
On April 1, 2011, the Company adopted, and the Company’s stockholders approved, the 2011 Plan. The 2011 Plan provides for the issuance of equity-based awards, including stock options, stock appreciation rights, restricted stock, restricted stock units, unrestricted stock awards and other awards based on shares of the Company’s common stock, such as LTIP units in the Operating Partnership, that may be made by the Company directly to the executive officers, directors, employees and other individuals providing bona fide services to or for the Company.
Subject to certain adjustments identified within the 2011 Plan, the aggregate number of shares of the Company’s common stock that may be awarded under the 2011 Plan is
3,642,461
shares. Under the 2011 Plan, each LTIP unit awarded will be equivalent to an award of
one
share of common stock reserved under the 2011 Plan, thereby reducing the number of shares of common stock available for other equity awards on a
one-for-one
basis.
The 2011 Plan may be terminated, amended, modified or suspended at any time by the board of directors, subject to stockholder approval as required by law or stock exchange rules. The 2011 Plan expires on March 31, 2021.
On September 20, 2011, the compensation committee of the Company’s board of directors approved the 2011 OPP under the 2011 Plan to provide key employees of the Company or its affiliates with incentives to contribute to the growth and financial success of the Company. On September 19, 2014, the Company’s
three
year measurement period pursuant to the 2011 OPP concluded. It was determined that the Company’s total stockholder return exceeded the threshold percentage and return hurdle and the maximum pool amount of
$10.0 million
was awarded to the participants. The compensation committee of the Company’s board of directors approved the issuance of
397,590
vested LTIP units and
43,657
vested shares of common stock to participants of the 2011 OPP.
On March 8, 2016, the Company granted performance units, approved by the compensation committee of the board of directors, under the 2011 Plan to provide certain key employees of the Company with incentives designed to align those key employees' interests more closely with those of the stockholders.
F-41
The ultimate value of the performance units depends on the Company’s total stockholder return ("TSR") over a
three
-year period commencing January 1, 2016 and ending on December 31, 2018 (the "measuring period"). At the end of the measuring period, the performance units convert into shares of common stock, or, at the Company's election and with the award recipient's consent, LTIP units or other securities, at a rate depending on the Company’s TSR over the measuring period as compared to
three
different benchmarks and on the absolute amount of the Company’s TSR. A recipient of performance units may receive as few as
zero
shares or as many as
250%
of the number of target units, plus deemed dividends. The target amount of the performance units is nominally allocated as: (i)
25%
to the Company’s TSR compared to the TSR of an industry peer group; (ii)
25%
to the Company’s TSR compared to the TSR of a size-based peer group; and (iii)
50%
to the Company’s TSR compared to the TSR of the companies in the MSCI US REIT index.
No dividends are paid to the recipient during the measuring period. At the end of the measuring period, if the Company’s TSR is such that the recipient earns shares of common stock or, at the Company's election and with the award recipient's consent, LTIP units or other securities (“Award Shares”), the recipient will receive additional Award Shares relating to dividends deemed to have been paid and reinvested on the Award Shares. The Company, in the discretion of the compensation committee of the board of directors, may pay the cash value of the deemed dividends instead of issuing additional Award Shares. The number of Award Shares is determined at the end of the measuring period, and
one-half
of the Award Shares and all dividend shares vest immediately. The other
one-half
of the Award Shares will be restricted (subject to forfeiture) and vest
one
year after the end of the measuring period.
The fair value of the performance units at the date of grant was approximately
$2.6 million
, as determined by a lattice-binomial option-pricing model based on a Monte Carlo simulation using a weighted average volatility factor of
23.0%
, a weighted average risk-free interest rate of
1.0849%
, and a weighted average expected dividend yield of
6.0%
. The performance unit equity compensation expense is recognized into earnings ratably from the grant date over the respective vesting periods. Refer to Note 14 for details on performance units granted on January 6, 2017.
On January 12, 2015, the compensation committee of the board of directors of the Company approved the 2015 Outperformance Program (the “2015 OPP”) under the 2011 Plan, to provide certain key employees of the Company or its affiliates with incentives to contribute to the growth and financial success of the Company and its affiliates.
Recipients of awards under the 2015 OPP will share in an outperformance pool if the Company’s total stockholder return, including both share appreciation and dividends, exceeds an absolute hurdle over a
three
year measurement period from January 1, 2015 to January 1, 2018 (the “measurement period”), based on a beginning value of
$24.49
per share of the Company’s common stock, as well as a relative hurdle based on the MSCI US REIT Index. Provided the Company’s increase in cumulative absolute total stockholder return over the measurement period equals or exceeds
25%
(the “threshold percentage”), the outperformance pool consists of
10%
of the excess total stockholder return above an absolute total stockholder return hurdle. The hurdle is equal to the total return of the MSCI US REIT Index plus
five
percentage points over the measurement period.
The aggregate reward for all recipients collectively is capped at the lesser of (i)
0.24%
of the product of the total number of shares of common stock and Noncontrolling Common Units outstanding on January 1, 2018 and the average common stock price of the Company for the
20
trading days ending immediately prior to January 1, 2018, and (ii)
$15.4 million
.
Each participant’s award under the 2015 OPP is designated as a specified percentage of the aggregate outperformance pool. If the threshold percentage and return hurdle were achieved at the end of the measurement period, the outperformance pool will be calculated and then allocated to the award recipients. The 2015 OPP provides that awards will be paid in the form of fully vested shares of the Company’s common stock, or, at the Company's election and with the award recipient’s consent, other securities or cash.
The 2015 OPP awards were valued at approximately
$1.6 million
utilizing a Monte Carlo simulation to estimate the probability of the conditions being satisfied. The Monte Carlo simulation used a statistical formula underlying the Black-Scholes and binomial formulas and such simulation was run approximately
500,000
times. For each simulation, the payoff is calculated at the settlement date, which is then discounted to the award date at a risk-free interest rate. The average of the values over all simulations is the expected value of the award on the award date. Assumptions used in the valuations included (i) factors associated with the underlying performance of the Company’s stock price and total stockholder return over the term of the awards including total stock return volatility and risk-free interest and (ii) factors associated with the relative performance of the Company’s stock price and total stockholder return when compared to the MSCI US REIT Index. The valuation was performed in a risk-neutral framework, so no assumption was made with respect to an equity risk premium. The fair value of the 2015 OPP awards was estimated on the date of grant using the following assumptions in the Monte Carlo valuation: expected price volatility for the Company and the MSCI
F-42
US REIT Index of
20%
and
13.6%
, respectively, and a risk free rate of
0.9814%
. The expense associated with the value of the 2015 OPP awards will be amortized ratably over the measurement period.
The unrecognized compensation expense associated with the 2015 OPP and the performance units at
December 31, 2016
was approximately
$0.5 million
and
$1.9 million
, respectively, and is expected to be recognized over a weighted average period of approximately
1.0
year and
2.4 years
, respectively.
Equity Non-cash Compensation Expense
The following table summarizes the amount recorded in general and administrative expenses in the accompanying Consolidated Statement of Operations for the amortization of restricted shares of common stock, LTIP units, the 2015 OPP, the 2011 OPP, performance units, and the Company’s board of directors’ compensation.
|
|
Year ended December 31,
|
||||||||||||
|
Non-cash compensation expense (in thousands)
|
2016
|
|
2015
|
2014
|
|||||||||
|
Restricted stock
|
$
|
2,157
|
|
|
$
|
1,932
|
|
$
|
1,164
|
|
|||
|
LTIP units
|
6,089
|
|
(1)
|
4,774
|
|
5,353
|
|
(2)
|
|||||
|
Outperformance programs
|
465
|
|
523
|
|
456
|
|
(3)
|
||||||
|
Performance units
|
672
|
|
—
|
|
—
|
|
|||||||
|
Board of directors compensation
(4)
|
346
|
|
349
|
|
341
|
|
|||||||
|
Total non-cash compensation expense
|
$
|
9,729
|
|
|
$
|
7,578
|
|
$
|
7,314
|
|
|||
|
(1)
|
Inclusive of approximately
$1.6 million
of non-cash compensation expense during the year ended
December 31, 2016
associated with the severance cost of an executive officer as discussed Note 7.
|
|
(2)
|
Inclusive of approximately
$2.0 million
of non-cash compensation during the year ended December 31, 2014 associated with the accounting for a consulting agreement with a former executive officer discussed in Note 7. Inclusive of approximately
$0.9 million
of non-cash compensation during the year ended December 31, 2014 associated with the accounting for a former executive officer's acceleration of LTIP units discussed in Note 7.
|
|
(3)
|
Inclusive of approximately
$0.2 million
of non-cash compensation during the year ended December 31, 2014 associated with the accounting for a consulting agreement with a former executive officer discussed in Note 7.
|
|
(4)
|
All of the Company’s independent directors elected to receive shares of common stock in lieu of cash for their service during the years ended
December 31, 2016
,
December 31, 2015
, and
December 31, 2014
. The number of shares of common stock granted is calculated based on the trailing
10 days
average common stock price ending on the third business day preceding the grant date.
|
At
December 31, 2016
and
December 31, 2015
, the number of shares available for issuance under the 2011 Plan were
1,156,578
and
1,449,415
, respectively. The number of shares available for issuance under the 2011 Plan do not include an allocation for the performance units or the 2015 OPP as the awards were not determinable as of
December 31, 2016
or
December 31, 2015
.
9. Earnings Per Share
The Company uses the two-class method of computing earnings per common share, which is an earnings allocation formula that determines earnings per share for common stock and any participating securities according to dividends declared (whether paid or unpaid) and participation rights in undistributed earnings. Unvested restricted stock awards are considered participating securities as these stock-based awards contain non-forfeitable rights to dividends, unless and until a forfeiture occurs, and these awards must be included in the computation of earnings per share pursuant to the two-class method. During the years ended
December 31, 2016
,
December 31, 2015
and
December 31, 2014
, there were
276,367
;
280,839
; and
268,894
, respectively, unvested shares of restricted stock on a weighted average basis that were considered participating securities. During the year ended
December 31, 2016
, there were
92,251
and
123,112
of unvested shares of restricted stock and performance units, respectively, on a weighted average basis that were dilutive. There were
no
dilutive shares during the years ended
December 31, 2015
and
December 31, 2014
. During the years ended
December 31, 2015
and
December 31, 2014
, there were
70,149
and
110,048
shares of unvested restricted common stock on a weighted average basis, respectively, that could potentially dilute basic EPS in the future that were not included in the computation of diluted EPS because to do so would have been antidilutive for those periods.
F-43
The following table sets forth the computation of basic and diluted earnings per common share for the years ended
December 31, 2016
,
December 31, 2015
and
December 31, 2014
.
|
Year ended December 31,
|
||||||||||||
|
Earnings Per Share (in thousands, except share data)
|
2016
|
2015
|
2014
|
|||||||||
|
Numerator
|
|
|||||||||||
|
Net income (loss)
|
$
|
35,588
|
|
$
|
(29,345
|
)
|
$
|
(4,685
|
)
|
|||
|
Less: preferred stock dividends
|
13,897
|
|
10,848
|
|
10,848
|
|
||||||
|
Less: amount allocated to participating securities
|
384
|
|
385
|
|
345
|
|
||||||
|
Less: income (loss) attributable to noncontrolling interest after preferred stock dividends
|
1,069
|
|
(1,962
|
)
|
(992
|
)
|
||||||
|
Net income (loss) attributable to common stockholders
|
$
|
20,238
|
|
$
|
(38,616
|
)
|
$
|
(14,886
|
)
|
|||
|
Denominator
|
|
|
||||||||||
|
Weighted average common shares outstanding — basic
|
70,637,185
|
|
66,307,972
|
|
54,086,345
|
|
||||||
|
Weighted average common shares outstanding — diluted
|
70,852,548
|
|
66,307,972
|
|
54,086,345
|
|
||||||
|
Net income (loss) per share — basic and diluted
|
||||||||||||
|
Net income (loss) per share attributable to common stockholders — basic
|
$
|
0.29
|
|
$
|
(0.58
|
)
|
$
|
(0.28
|
)
|
|||
|
Net income (loss) per share attributable to common stockholders — diluted
|
$
|
0.29
|
|
$
|
(0.58
|
)
|
$
|
(0.28
|
)
|
|||
10. Future Minimum Rents
The Company’s properties are leased to tenants under triple net, modified, and gross leases. Minimum contractual lease payments receivable, excluding tenant reimbursement of expenses, under non-cancelable operating leases in effect as of
December 31, 2016
are approximately as follows.
|
Year
|
Future Minimum Rents (in thousands)
|
|||
|
2017
|
$
|
223,309
|
|
|
|
2018
|
$
|
187,615
|
|
|
|
2019
|
$
|
149,273
|
|
|
|
2020
|
$
|
120,461
|
|
|
|
2021
|
$
|
87,797
|
|
|
|
Thereafter
|
$
|
301,177
|
|
|
11. Commitments and Contingencies
The Company is subject to various legal proceedings and claims that arise in the ordinary course of business. These matters are generally covered by insurance subject to deductible requirements. Management believes that the ultimate settlement of these actions will not have a material adverse effect on the Company’s financial position, results of operations or cash flows.
On April 18, 2012, the Company entered into an agreement with affiliates of Columbus Nova Real Estate Acquisition Group, Inc. ("Columbus Nova") to source sale leaseback transactions for potential acquisitions by the Company. The agreement called for various fees to be paid to Columbus Nova for its services including acquisition fees, credit monitoring fees, and a one-time incentive fee if certain performance thresholds are met. As of
December 31, 2016
and
December 31, 2015
, respectively, the fair value of the incentive fee was
zero
. The fair value was calculated using the following key Level 3 inputs: discount rate of
8.0%
to
12.0%
and
9.5%
as of
December 31, 2016
and
December 31, 2015
, respectively, and exit capitalization rate of
7.0%
to
12.0%
and
9.8%
as of
December 31, 2016
and
December 31, 2015
, respectively.
The Company has letters of credit of approximately
$3.5 million
related to development projects and its corporate office lease as of
December 31, 2016
.
F-44
Ground and Operating Lease Agreements
Future minimum rental payments under the terms of the fixed non-cancelable ground leases and operating leases, including any bargain renewal terms, under which the Company is the lessee as of
December 31, 2016
are as follows.
|
Year
|
Future Minimum Rental Payments
(1)
(in thousands)
|
|||
|
2017
|
$
|
1,427
|
|
|
|
2018
|
$
|
1,539
|
|
|
|
2019
|
$
|
1,577
|
|
|
|
2020
|
$
|
1,588
|
|
|
|
2021
|
$
|
681
|
|
|
|
Thereafter
|
$
|
6,336
|
|
|
|
(1)
|
Future minimum rental payments do not include estimates of CPI rent changes required by certain lease agreements. Therefore, actual minimum rental payments may differ than those presented.
|
12. Employee Benefit Plans
Effective April 20, 2011, the Company adopted a 401(k) Defined Contribution Savings Plan (the “Plan”) for its employees. Under the Plan, as amended, employees, as defined, are eligible to participate in the Plan after they have completed
three months
of service. The Company provides a discretionary match of
50%
of the employee’s contributions annually up to
6.0%
of the employee’s annual compensation, subject to a cap imposed by federal tax law. The Company’s aggregate matching contribution for the years ended
December 31, 2016
,
December 31, 2015
and
December 31, 2014
was approximately
$0.4 million
,
$0.2 million
and
$0.2 million
, respectively. The Company’s contribution is subject to a
three
year vesting schedule, such that employees who have been with the Company for three years are fully vested in past and future contributions.
13. Related-Party Transactions
The Company’s initial public offering (“IPO”) on April 20, 2011, represented the roll-up of the substantial majority of the assets of several private, externally-advised real estate funds investing in single-tenant industrial real estate in the United States, including the fund identified below as Fund III. The roll-up included the affiliated management companies that advised the funds and excluded the assets of another affiliated real estate fund that also invested in industrial real estate; including the fund identified below as Fund II. In connection with the IPO, a wholly owned subsidiary of the Company, STAG Industrial Management, LLC (the “Manager”), entered into service agreements with the funds that participated in the IPO and remained in existence and the fund that did not participate in the IPO.
The Manager is performing certain asset management services for STAG Investments II, LLC (“Fund II”), a private, fully-invested fund that is an affiliate of the Company and owned
seven
buildings with approximately
2.2 million
rentable square feet as of
December 31, 2016
. The Manager is paid an annual asset management fee based on the equity investment in the Fund II assets, which is
1.25%
of the equity investment. In June 2013, Fund II and the Company amended the service agreement to exclude disposition services from the asset management services to be performed by the Company and results in a concomitant reduction in the asset management fee. The Company recognized asset management fee income of approximately
$0.2 million
,
$0.4 million
and
$0.6 million
for the years ended
December 31, 2016
,
December 31, 2015
and
December 31, 2014
, respectively, which is included in other income on the accompanying Consolidated Statements of Operations. As of
December 31, 2016
and
December 31, 2015
, the Company had a receivable in the amount of approximately
$48,000
and
$0.1 million
, respectively, related to the asset management fee income included within prepaid expenses and other assets on the accompanying Consolidated Balance Sheets.
The Company’s “predecessor” for accounting purposes is STAG Predecessor Group, which is not a legal entity, but a collection of real estate entities that were owned by STAG Investments III, LLC (“Fund III”) prior to the Company’s IPO. At the time of the formation transactions in connection with the IPO,
three
vacant properties owned by Fund III were not contributed to the Company (the “Option Properties”). The Manager had entered into a services agreement with Fund III pursuant to which it would manage the Option Properties for an annual fee of
$30,000
per property, and would provide the limited administrative services (including preparation of reports for the Fund III lender and investors, bookkeeping, tax and accounting services) that Fund III will require, for an annual fee of
$20,000
. As the last remaining Option Property was sold in 2013, the Manager only received the annual fee of
$20,000
until Fund III’s liquidation. Fund III ceased operations and was liquidated on
December 31, 2014
and, as a result, the Manager no longer receives an annual fee.
F-45
14. Subsequent Events
GAAP requires an entity to disclose certain events that occur after the balance sheet date but before financial statements are issued or are available to be issued (“subsequent events”). There are two types of subsequent events. The first type consists of events or transactions that provide additional evidence about conditions that existed at the date of the balance sheet, including the estimates inherent in the process of preparing financial statements (“recognized subsequent events”). No significant recognized subsequent events were noted.
The second type consists of events that provide evidence about conditions that did not exist at the date of the balance sheet but arose subsequent to that date (“non-recognized subsequent events”). The following non-recognized subsequent events are noted.
On January 6, 2017, the Company granted
75,001
restricted shares of common stock to certain employees of the Company pursuant to the 2011 Plan. The restricted shares of common stock granted will vest in
four
equal installments on January 1 of each year beginning in 2018. The fair value of the restricted shares of common stock at the date of grant was
$24.41
per share.
On January 6, 2017, the Company granted
16,836
LTIP units to non-employee, independent directors, and
109,403
LTIP units to certain executive officers and senior employees pursuant to the 2011 Plan. The LTIP units granted to non-employee, independent directors will vest on January 1, 2018. The LTIP units granted to certain executive officers and senior employees will vest quarterly over
four years
, with the first vesting date being March 31, 2017. The fair value of the LTIP units at the date of grant was approximately
$2.9 million
, as determined by a lattice-binomial option-pricing model based on a Monte Carlo simulation using an expected term of
ten
years, a weighted average volatility factor of
23.0%
, a weighted average expected dividend yield of
6.0%
, and a weighted average risk-free interest rate of
1.61%
. The fair value of the LTIP units are based on Level 3 inputs and are non-recurring fair value measurements.
On January 6, 2017, the Company granted performance units to certain executive officers and senior employees pursuant to the 2011 Plan. The terms of the January 6, 2017 performance units grant is substantially the same as the March 8, 2016 performance units grant as discussed in Note 8, except that the measuring period commences on January 1, 2017 and ends on December 31, 2019. The fair value of the performance units at the date of grant was approximately
$2.9 million
, as determined by a lattice-binomial option-pricing model based on a Monte Carlo simulation using a weighted average volatility factor of
23.0%
, a weighted average expected dividend yield of
6.0%
, and a weighted average risk-free interest rate of
1.61%
. The fair value of the performance units are based on Level 3 inputs and are non-recurring fair value measurements.
F-46
STAG Industrial, Inc.
Schedule II—Valuation and Qualifying Accounts
December 31, 2016
(in thousands)
Allowance for Doubtful Receivables and Accrued Rent Reserves
|
|
STAG Industrial, Inc.
|
||||||||||||||
|
|
Beginning of Period
|
Costs and Expenses
|
Amounts Written Off
|
Balance at End of Period
|
|||||||||||
|
December 31, 2016
|
$
|
106
|
|
$
|
125
|
|
$
|
(43
|
)
|
$
|
188
|
|
|||
|
December 31, 2015
|
$
|
104
|
|
$
|
190
|
|
$
|
(188
|
)
|
$
|
106
|
|
|||
|
December 31, 2014
|
$
|
19
|
|
$
|
104
|
|
$
|
(19
|
)
|
$
|
104
|
|
|||
F-47
STAG Industrial, Inc.
Schedule III—Real Estate and Accumulated Depreciation
December 31, 2016
(in thousands)
|
Initial Cost to STAG Industrial, Inc.
|
Gross Amounts at Which Carried at December 31, 2016
|
|||||||||||||||||||||||||||||||||
|
City/State
|
Encumbrances
(1)
|
Building & Improvements
(2)
|
Land
|
Costs Capitalized Subsequent to Acquisition and Valuation Provision
|
Building & Improvements
|
Land
|
Total
|
Accumulated Depreciation
(3)
|
Acq Date
|
|||||||||||||||||||||||||
|
Albion, IN
|
$
|
—
|
|
93
|
|
67
|
|
$
|
—
|
|
$
|
93
|
|
$
|
67
|
|
$
|
160
|
|
$
|
(24
|
)
|
2006
|
|||||||||||
|
Albion, IN
|
—
|
|
932
|
|
103
|
|
—
|
|
932
|
|
$
|
103
|
|
$
|
1,035
|
|
(246
|
)
|
2006
|
|||||||||||||||
|
Albion, IN
|
—
|
|
1,107
|
|
55
|
|
—
|
|
1,107
|
|
$
|
55
|
|
$
|
1,162
|
|
(292
|
)
|
2006
|
|||||||||||||||
|
Albion, IN
|
—
|
|
970
|
|
332
|
|
—
|
|
970
|
|
$
|
332
|
|
$
|
1,302
|
|
(256
|
)
|
2006
|
|||||||||||||||
|
Albion, IN
|
—
|
|
1,397
|
|
52
|
|
—
|
|
1,397
|
|
$
|
52
|
|
$
|
1,449
|
|
(368
|
)
|
2006
|
|||||||||||||||
|
Albion, IN
|
—
|
|
1,528
|
|
126
|
|
—
|
|
1,528
|
|
$
|
126
|
|
$
|
1,654
|
|
(403
|
)
|
2006
|
|||||||||||||||
|
Kendallville, IN
|
—
|
|
1,510
|
|
142
|
|
—
|
|
1,510
|
|
$
|
142
|
|
$
|
1,652
|
|
(398
|
)
|
2006
|
|||||||||||||||
|
Albion, IN
|
—
|
|
710
|
|
187
|
|
—
|
|
710
|
|
$
|
187
|
|
$
|
897
|
|
(187
|
)
|
2006
|
|||||||||||||||
|
Alexandria, MN
|
—
|
|
5,855
|
|
960
|
|
151
|
|
6,006
|
|
$
|
960
|
|
$
|
6,966
|
|
(900
|
)
|
2011
|
|||||||||||||||
|
Allentown, PA
|
—
|
|
7,336
|
|
1,962
|
|
783
|
|
8,119
|
|
$
|
1,962
|
|
$
|
10,081
|
|
(865
|
)
|
2014
|
|||||||||||||||
|
Appleton, WI
|
—
|
|
3,765
|
|
495
|
|
360
|
|
4,125
|
|
$
|
495
|
|
$
|
4,620
|
|
(1,030
|
)
|
2007
|
|||||||||||||||
|
Arlington, TX
|
—
|
|
2,374
|
|
413
|
|
304
|
|
2,678
|
|
$
|
413
|
|
$
|
3,091
|
|
(589
|
)
|
2007
|
|||||||||||||||
|
Arlington, TX
|
—
|
|
6,151
|
|
1,246
|
|
—
|
|
6,151
|
|
$
|
1,246
|
|
$
|
7,397
|
|
(837
|
)
|
2012
|
|||||||||||||||
|
Avon, CT
|
—
|
|
2,750
|
|
336
|
|
—
|
|
2,750
|
|
$
|
336
|
|
$
|
3,086
|
|
(369
|
)
|
2012
|
|||||||||||||||
|
Belfast, ME
|
—
|
|
10,331
|
|
1,883
|
|
487
|
|
10,818
|
|
$
|
1,883
|
|
$
|
12,701
|
|
(1,641
|
)
|
2011
|
|||||||||||||||
|
Belvidere, IL
|
—
|
|
4,176
|
|
442
|
|
—
|
|
4,176
|
|
$
|
442
|
|
$
|
4,618
|
|
(224
|
)
|
2015
|
|||||||||||||||
|
Belvidere, IL
|
—
|
|
3,956
|
|
733
|
|
—
|
|
3,956
|
|
$
|
733
|
|
$
|
4,689
|
|
(428
|
)
|
2013
|
|||||||||||||||
|
Belvidere, IL
|
—
|
|
3,436
|
|
1,310
|
|
—
|
|
3,436
|
|
$
|
1,310
|
|
$
|
4,746
|
|
(514
|
)
|
2013
|
|||||||||||||||
|
Belvidere, IL
|
—
|
|
3,517
|
|
538
|
|
114
|
|
3,631
|
|
$
|
538
|
|
$
|
4,169
|
|
(325
|
)
|
2013
|
|||||||||||||||
|
Belvidere, IL
|
—
|
|
6,899
|
|
670
|
|
—
|
|
6,899
|
|
$
|
670
|
|
$
|
7,569
|
|
(690
|
)
|
2013
|
|||||||||||||||
|
Belvidere, IL
|
—
|
|
4,321
|
|
668
|
|
—
|
|
4,321
|
|
$
|
668
|
|
$
|
4,989
|
|
(493
|
)
|
2013
|
|||||||||||||||
|
Belvidere, IL
|
—
|
|
3,730
|
|
866
|
|
—
|
|
3,730
|
|
$
|
866
|
|
$
|
4,596
|
|
(450
|
)
|
2013
|
|||||||||||||||
|
Belvidere, IL
|
—
|
|
2,808
|
|
586
|
|
22
|
|
2,830
|
|
$
|
586
|
|
$
|
3,416
|
|
(375
|
)
|
2013
|
|||||||||||||||
|
Belvidere, IL
|
—
|
|
8,340
|
|
1,542
|
|
552
|
|
8,892
|
|
$
|
1,542
|
|
$
|
10,434
|
|
(1,043
|
)
|
2013
|
|||||||||||||||
|
Belvidere, IL
|
—
|
|
71
|
|
216
|
|
—
|
|
71
|
|
$
|
216
|
|
$
|
287
|
|
(71
|
)
|
2013
|
|||||||||||||||
|
Biddeford, ME
|
—
|
|
8,164
|
|
1,369
|
|
3,916
|
|
12,080
|
|
$
|
1,369
|
|
$
|
13,449
|
|
(179
|
)
|
2016
|
|||||||||||||||
|
Boardman, OH
|
—
|
|
3,473
|
|
282
|
|
773
|
|
4,246
|
|
$
|
282
|
|
$
|
4,528
|
|
(1,033
|
)
|
2007
|
|||||||||||||||
|
Boardman, OH
|
—
|
|
841
|
|
49
|
|
149
|
|
990
|
|
$
|
49
|
|
$
|
1,039
|
|
(531
|
)
|
2007
|
|||||||||||||||
|
Brooklyn Park, MN
|
—
|
|
11,988
|
|
1,926
|
|
—
|
|
11,988
|
|
$
|
1,926
|
|
$
|
13,914
|
|
(33
|
)
|
2016
|
|||||||||||||||
|
Buena Vista, VA
|
—
|
|
2,500
|
|
534
|
|
635
|
|
3,135
|
|
$
|
534
|
|
$
|
3,669
|
|
(417
|
)
|
2012
|
|||||||||||||||
|
Buffalo, NY
|
—
|
|
2,924
|
|
146
|
|
—
|
|
2,924
|
|
$
|
146
|
|
$
|
3,070
|
|
(373
|
)
|
2012
|
|||||||||||||||
|
Burlington, NJ
|
—
|
|
42,652
|
|
5,135
|
|
55
|
|
42,707
|
|
$
|
5,135
|
|
$
|
47,842
|
|
(1,980
|
)
|
2015
|
|||||||||||||||
|
Burlington, NJ
|
—
|
|
19,577
|
|
4,030
|
|
1,231
|
|
20,808
|
|
$
|
4,030
|
|
$
|
24,838
|
|
(1,268
|
)
|
2015
|
|||||||||||||||
|
Calhoun, GA
|
—
|
|
2,764
|
|
388
|
|
—
|
|
2,764
|
|
$
|
388
|
|
$
|
3,152
|
|
(216
|
)
|
2014
|
|||||||||||||||
|
Camarillo, CA
|
—
|
|
10,785
|
|
7,242
|
|
237
|
|
11,022
|
|
$
|
7,242
|
|
$
|
18,264
|
|
(943
|
)
|
2014
|
|||||||||||||||
|
Camarillo, CA
|
—
|
|
19,857
|
|
7,989
|
|
25
|
|
19,882
|
|
$
|
7,989
|
|
$
|
27,871
|
|
(1,589
|
)
|
2014
|
|||||||||||||||
|
Catoosa, OK
|
—
|
|
3,937
|
|
—
|
|
—
|
|
3,937
|
|
$
|
—
|
|
$
|
3,937
|
|
(450
|
)
|
2013
|
|||||||||||||||
|
Cedar Hill, TX
|
—
|
|
11,971
|
|
4,066
|
|
—
|
|
11,971
|
|
$
|
4,066
|
|
$
|
16,037
|
|
(222
|
)
|
2016
|
|||||||||||||||
|
Charlotte, NC
|
(10,291
|
)
|
9,461
|
|
3,535
|
|
1,197
|
|
10,658
|
|
$
|
3,535
|
|
$
|
14,193
|
|
(2,199
|
)
|
2011
|
|||||||||||||||
|
Charlotte, NC
|
—
|
|
2,443
|
|
805
|
|
4
|
|
2,447
|
|
$
|
805
|
|
$
|
3,252
|
|
(244
|
)
|
2014
|
|||||||||||||||
|
Charlotte, NC
|
—
|
|
3,554
|
|
386
|
|
19
|
|
3,573
|
|
$
|
386
|
|
$
|
3,959
|
|
(341
|
)
|
2014
|
|||||||||||||||
|
Charlotte, NC
|
—
|
|
3,961
|
|
515
|
|
—
|
|
3,961
|
|
$
|
515
|
|
$
|
4,476
|
|
(157
|
)
|
2015
|
|||||||||||||||
|
Charlotte, NC
|
—
|
|
4,445
|
|
678
|
|
—
|
|
4,445
|
|
$
|
678
|
|
$
|
5,123
|
|
(112
|
)
|
2016
|
|||||||||||||||
|
Chattanooga, TN
|
—
|
|
2,321
|
|
187
|
|
—
|
|
2,321
|
|
$
|
187
|
|
$
|
2,508
|
|
(155
|
)
|
2015
|
|||||||||||||||
|
Chattanooga, TN
|
—
|
|
4,730
|
|
380
|
|
13
|
|
4,743
|
|
$
|
380
|
|
$
|
5,123
|
|
(316
|
)
|
2015
|
|||||||||||||||
|
Chattanooga, TN
|
—
|
|
8,459
|
|
424
|
|
—
|
|
8,459
|
|
$
|
424
|
|
$
|
8,883
|
|
(645
|
)
|
2015
|
|||||||||||||||
|
Cheektowaga, NY
|
—
|
|
2,757
|
|
216
|
|
793
|
|
3,550
|
|
$
|
216
|
|
$
|
3,766
|
|
(599
|
)
|
2011
|
|||||||||||||||
|
Chesterfield, MI
|
—
|
|
1,169
|
|
207
|
|
62
|
|
1,231
|
|
$
|
207
|
|
$
|
1,438
|
|
(390
|
)
|
2007
|
|||||||||||||||
|
Chesterfield, MI
|
—
|
|
798
|
|
150
|
|
89
|
|
887
|
|
$
|
150
|
|
$
|
1,037
|
|
(206
|
)
|
2007
|
|||||||||||||||
|
Chesterfield, MI
|
—
|
|
802
|
|
151
|
|
224
|
|
1,026
|
|
$
|
151
|
|
$
|
1,177
|
|
(261
|
)
|
2007
|
|||||||||||||||
|
Chesterfield, MI
|
—
|
|
5,304
|
|
942
|
|
1,952
|
|
7,256
|
|
$
|
942
|
|
$
|
8,198
|
|
(1,821
|
)
|
2007
|
|||||||||||||||
|
Chester, VA
|
—
|
|
3,402
|
|
775
|
|
—
|
|
3,402
|
|
$
|
775
|
|
$
|
4,177
|
|
(448
|
)
|
2014
|
|||||||||||||||
|
Chicopee, MA
|
—
|
|
5,867
|
|
504
|
|
—
|
|
5,867
|
|
$
|
504
|
|
$
|
6,371
|
|
(825
|
)
|
2012
|
|||||||||||||||
F-48
|
Initial Cost to STAG Industrial, Inc.
|
Gross Amounts at Which Carried at December 31, 2016
|
|||||||||||||||||||||||||||||||||
|
City/State
|
Encumbrances
(1)
|
Building & Improvements
(2)
|
Land
|
Costs Capitalized Subsequent to Acquisition and Valuation Provision
|
Building & Improvements
|
Land
|
Total
|
Accumulated Depreciation
(3)
|
Acq Date
|
|||||||||||||||||||||||||
|
Chippewa Falls, WI
|
—
|
|
2,303
|
|
133
|
|
—
|
|
2,303
|
|
$
|
133
|
|
$
|
2,436
|
|
(347
|
)
|
2011
|
|||||||||||||||
|
Chippewa Falls, WI
|
—
|
|
544
|
|
44
|
|
—
|
|
544
|
|
44
|
|
588
|
|
(80
|
)
|
2011
|
|||||||||||||||||
|
Cincinnati, OH
|
—
|
|
3,637
|
|
238
|
|
1,412
|
|
5,049
|
|
238
|
|
5,287
|
|
(1,785
|
)
|
2007
|
|||||||||||||||||
|
Cleveland, TN
|
(2,464
|
)
|
3,161
|
|
554
|
|
84
|
|
3,245
|
|
554
|
|
3,799
|
|
(543
|
)
|
2011
|
|||||||||||||||||
|
Clinton, TN
|
—
|
|
3,302
|
|
403
|
|
—
|
|
3,302
|
|
403
|
|
3,705
|
|
(307
|
)
|
2015
|
|||||||||||||||||
|
Columbus, OH
|
—
|
|
3,123
|
|
489
|
|
167
|
|
3,290
|
|
489
|
|
3,779
|
|
(433
|
)
|
2014
|
|||||||||||||||||
|
Columbia, SC
|
—
|
|
5,171
|
|
783
|
|
—
|
|
5,171
|
|
783
|
|
5,954
|
|
(122
|
)
|
2016
|
|||||||||||||||||
|
West Columbia, SC
|
—
|
|
6,988
|
|
715
|
|
401
|
|
7,389
|
|
715
|
|
8,104
|
|
(792
|
)
|
2013
|
|||||||||||||||||
|
Dallas, GA
|
—
|
|
1,712
|
|
475
|
|
—
|
|
1,712
|
|
475
|
|
2,187
|
|
(252
|
)
|
2012
|
|||||||||||||||||
|
LaGrange, GA
|
—
|
|
3,175
|
|
240
|
|
331
|
|
3,506
|
|
240
|
|
3,746
|
|
(619
|
)
|
2011
|
|||||||||||||||||
|
Danville, KY
|
—
|
|
11,814
|
|
965
|
|
3,644
|
|
15,458
|
|
965
|
|
16,423
|
|
(2,273
|
)
|
2011
|
|||||||||||||||||
|
Daytona Beach, FL
|
—
|
|
875
|
|
1,237
|
|
1,704
|
|
2,579
|
|
1,237
|
|
3,816
|
|
(630
|
)
|
2007
|
|||||||||||||||||
|
Dayton, OH
|
—
|
|
5,896
|
|
331
|
|
375
|
|
6,271
|
|
331
|
|
6,602
|
|
(319
|
)
|
2015
|
|||||||||||||||||
|
DeForest, WI
|
—
|
|
5,402
|
|
1,131
|
|
—
|
|
5,402
|
|
1,131
|
|
6,533
|
|
(20
|
)
|
2016
|
|||||||||||||||||
|
DeKalb, IL
|
—
|
|
4,568
|
|
489
|
|
—
|
|
4,568
|
|
489
|
|
5,057
|
|
(530
|
)
|
2013
|
|||||||||||||||||
|
De Pere, WI
|
—
|
|
6,144
|
|
525
|
|
—
|
|
6,144
|
|
525
|
|
6,669
|
|
(861
|
)
|
2012
|
|||||||||||||||||
|
Duncan, SC
|
—
|
|
11,258
|
|
1,002
|
|
726
|
|
11,984
|
|
1,002
|
|
12,986
|
|
(1,635
|
)
|
2012
|
|||||||||||||||||
|
Duncan, SC
|
—
|
|
6,739
|
|
709
|
|
71
|
|
6,810
|
|
709
|
|
7,519
|
|
(833
|
)
|
2012
|
|||||||||||||||||
|
Durham, SC
|
—
|
|
2,700
|
|
753
|
|
31
|
|
2,731
|
|
753
|
|
3,484
|
|
(161
|
)
|
2015
|
|||||||||||||||||
|
Earth City, MO
|
—
|
|
2,806
|
|
1,123
|
|
—
|
|
2,806
|
|
1,123
|
|
3,929
|
|
(25
|
)
|
2016
|
|||||||||||||||||
|
Edgefield, SC
|
—
|
|
938
|
|
220
|
|
750
|
|
1,688
|
|
220
|
|
1,908
|
|
(255
|
)
|
2012
|
|||||||||||||||||
|
Elizabethtown, PA
|
—
|
|
5,363
|
|
1,000
|
|
—
|
|
5,363
|
|
1,000
|
|
6,363
|
|
(414
|
)
|
2014
|
|||||||||||||||||
|
Elkhart, IN
|
—
|
|
210
|
|
25
|
|
143
|
|
353
|
|
25
|
|
378
|
|
(58
|
)
|
2007
|
|||||||||||||||||
|
Elkhart, IN
|
—
|
|
3,567
|
|
422
|
|
452
|
|
4,019
|
|
422
|
|
4,441
|
|
(931
|
)
|
2007
|
|||||||||||||||||
|
El Paso, TX
|
—
|
|
9,099
|
|
1,248
|
|
—
|
|
9,099
|
|
1,248
|
|
10,347
|
|
(733
|
)
|
2014
|
|||||||||||||||||
|
El Paso, TX
|
—
|
|
7,905
|
|
1,124
|
|
—
|
|
7,905
|
|
1,124
|
|
9,029
|
|
(767
|
)
|
2014
|
|||||||||||||||||
|
El Paso, TX
|
—
|
|
14,159
|
|
1,854
|
|
91
|
|
14,250
|
|
1,854
|
|
16,104
|
|
(1,205
|
)
|
2014
|
|||||||||||||||||
|
El Paso, TX
|
—
|
|
9,897
|
|
1,581
|
|
—
|
|
9,897
|
|
1,581
|
|
11,478
|
|
(767
|
)
|
2014
|
|||||||||||||||||
|
El Paso, TX
|
—
|
|
5,893
|
|
1,136
|
|
—
|
|
5,893
|
|
1,136
|
|
7,029
|
|
(340
|
)
|
2015
|
|||||||||||||||||
|
El Paso, TX
|
—
|
|
3,096
|
|
—
|
|
1,006
|
|
4,102
|
|
—
|
|
4,102
|
|
(567
|
)
|
2012
|
|||||||||||||||||
|
Erlanger, KY
|
—
|
|
3,826
|
|
635
|
|
6
|
|
3,832
|
|
635
|
|
4,467
|
|
(132
|
)
|
2016
|
|||||||||||||||||
|
East Troy, WI
|
—
|
|
4,962
|
|
304
|
|
—
|
|
4,962
|
|
304
|
|
5,266
|
|
(382
|
)
|
2014
|
|||||||||||||||||
|
East Windsor, CT
|
—
|
|
5,711
|
|
400
|
|
—
|
|
5,711
|
|
400
|
|
6,111
|
|
(22
|
)
|
2016
|
|||||||||||||||||
|
East Windsor, CT
|
(3,073
|
)
|
4,713
|
|
348
|
|
528
|
|
5,241
|
|
348
|
|
5,589
|
|
(1,088
|
)
|
2012
|
|||||||||||||||||
|
Fairborn, OH
|
—
|
|
5,650
|
|
867
|
|
—
|
|
5,650
|
|
867
|
|
6,517
|
|
(477
|
)
|
2015
|
|||||||||||||||||
|
Fairfield, OH
|
—
|
|
2,842
|
|
948
|
|
—
|
|
2,842
|
|
948
|
|
3,790
|
|
(142
|
)
|
2016
|
|||||||||||||||||
|
Farmington, NY
|
—
|
|
5,342
|
|
410
|
|
20
|
|
5,362
|
|
410
|
|
5,772
|
|
(1,312
|
)
|
2007
|
|||||||||||||||||
|
Forest Park, GA
|
—
|
|
9,527
|
|
1,733
|
|
35
|
|
9,562
|
|
1,733
|
|
11,295
|
|
(142
|
)
|
2016
|
|||||||||||||||||
|
Forest Park, GA
|
—
|
|
8,189
|
|
1,715
|
|
—
|
|
8,189
|
|
1,715
|
|
9,904
|
|
(106
|
)
|
2016
|
|||||||||||||||||
|
Fort Wayne, IN
|
—
|
|
3,142
|
|
112
|
|
—
|
|
3,142
|
|
112
|
|
3,254
|
|
(245
|
)
|
2014
|
|||||||||||||||||
|
Franklin, IN
|
—
|
|
12,042
|
|
2,479
|
|
13
|
|
12,055
|
|
2,479
|
|
14,534
|
|
(1,940
|
)
|
2012
|
|||||||||||||||||
|
Fort Worth, TX
|
(1,889
|
)
|
2,965
|
|
389
|
|
709
|
|
3,674
|
|
389
|
|
4,063
|
|
(563
|
)
|
2011
|
|||||||||||||||||
|
Gahanna, OH
|
—
|
|
4,191
|
|
1,265
|
|
1,258
|
|
5,449
|
|
1,265
|
|
6,714
|
|
(1,055
|
)
|
2011
|
|||||||||||||||||
|
Gardiner, ME
|
—
|
|
8,983
|
|
948
|
|
—
|
|
8,983
|
|
948
|
|
9,931
|
|
(141
|
)
|
2016
|
|||||||||||||||||
|
Garland, TX
|
—
|
|
5,425
|
|
1,344
|
|
294
|
|
5,719
|
|
1,344
|
|
7,063
|
|
(644
|
)
|
2014
|
|||||||||||||||||
|
Garland, TX
|
—
|
|
6,058
|
|
1,542
|
|
536
|
|
6,594
|
|
1,542
|
|
8,136
|
|
(296
|
)
|
2015
|
|||||||||||||||||
|
Germantown, WI
|
—
|
|
6,035
|
|
1,186
|
|
—
|
|
6,035
|
|
1,186
|
|
7,221
|
|
(660
|
)
|
2014
|
|||||||||||||||||
|
Gloversville, NY
|
(736
|
)
|
1,299
|
|
117
|
|
—
|
|
1,299
|
|
117
|
|
1,416
|
|
(169
|
)
|
2012
|
|||||||||||||||||
|
Gloversville, NY
|
(1,189
|
)
|
2,613
|
|
151
|
|
—
|
|
2,613
|
|
151
|
|
2,764
|
|
(359
|
)
|
2012
|
|||||||||||||||||
|
Gloversville, NY
|
(849
|
)
|
1,514
|
|
154
|
|
13
|
|
1,527
|
|
154
|
|
1,681
|
|
(220
|
)
|
2012
|
|||||||||||||||||
|
Golden, CO
|
—
|
|
6,164
|
|
742
|
|
67
|
|
6,231
|
|
742
|
|
6,973
|
|
(669
|
)
|
2013
|
|||||||||||||||||
|
Goshen, IN
|
(5,224
|
)
|
6,509
|
|
1,442
|
|
415
|
|
6,924
|
|
1,442
|
|
8,366
|
|
(1,186
|
)
|
2011
|
|||||||||||||||||
|
Grand Junction, CO
|
—
|
|
4,002
|
|
314
|
|
—
|
|
4,002
|
|
314
|
|
4,316
|
|
(196
|
)
|
2015
|
|||||||||||||||||
|
Grand Rapids, MI
|
—
|
|
7,532
|
|
169
|
|
5
|
|
7,537
|
|
169
|
|
7,706
|
|
(383
|
)
|
2015
|
|||||||||||||||||
|
Graniteville, SC
|
—
|
|
8,389
|
|
1,629
|
|
—
|
|
8,389
|
|
1,629
|
|
10,018
|
|
(228
|
)
|
2016
|
|||||||||||||||||
|
Greenwood, SC
|
(1,529
|
)
|
1,848
|
|
166
|
|
—
|
|
1,848
|
|
166
|
|
2,014
|
|
(236
|
)
|
2012
|
|||||||||||||||||
|
Greenwood, SC
|
(1,302
|
)
|
1,232
|
|
169
|
|
4
|
|
1,236
|
|
169
|
|
1,405
|
|
(198
|
)
|
2012
|
|||||||||||||||||
|
Greenville, SC
|
—
|
|
3,379
|
|
309
|
|
—
|
|
3,379
|
|
309
|
|
3,688
|
|
(220
|
)
|
2015
|
|||||||||||||||||
|
Greer, SC
|
—
|
|
1,434
|
|
129
|
|
144
|
|
1,578
|
|
129
|
|
1,707
|
|
(78
|
)
|
2015
|
|||||||||||||||||
F-49
|
Initial Cost to STAG Industrial, Inc.
|
Gross Amounts at Which Carried at December 31, 2016
|
|||||||||||||||||||||||||||||||||
|
City/State
|
Encumbrances
(1)
|
Building & Improvements
(2)
|
Land
|
Costs Capitalized Subsequent to Acquisition and Valuation Provision
|
Building & Improvements
|
Land
|
Total
|
Accumulated Depreciation
(3)
|
Acq Date
|
|||||||||||||||||||||||||
|
Greer, SC
|
—
|
|
1,748
|
|
128
|
|
39
|
|
1,787
|
|
128
|
|
1,915
|
|
(95
|
)
|
2015
|
|||||||||||||||||
|
Greer, SC
|
—
|
|
471
|
|
153
|
|
10
|
|
481
|
|
153
|
|
634
|
|
(31
|
)
|
2015
|
|||||||||||||||||
|
Greer, SC
|
—
|
|
3,016
|
|
306
|
|
99
|
|
3,115
|
|
306
|
|
3,421
|
|
(180
|
)
|
2015
|
|||||||||||||||||
|
Fountain Inn, SC
|
—
|
|
4,438
|
|
719
|
|
—
|
|
4,438
|
|
719
|
|
5,157
|
|
(152
|
)
|
2016
|
|||||||||||||||||
|
Grove City, OH
|
—
|
|
3,974
|
|
730
|
|
—
|
|
3,974
|
|
730
|
|
4,704
|
|
(60
|
)
|
2016
|
|||||||||||||||||
|
Gurnee, IL
|
—
|
|
11,380
|
|
1,716
|
|
19
|
|
11,399
|
|
1,716
|
|
13,115
|
|
(845
|
)
|
2014
|
|||||||||||||||||
|
Gurnee, IL
|
—
|
|
4,902
|
|
1,337
|
|
468
|
|
5,370
|
|
1,337
|
|
6,707
|
|
(935
|
)
|
2012
|
|||||||||||||||||
|
Hampstead, MD
|
—
|
|
34,969
|
|
780
|
|
—
|
|
34,969
|
|
780
|
|
35,749
|
|
(3,588
|
)
|
2013
|
|||||||||||||||||
|
Harrisonburg, VA
|
—
|
|
11,179
|
|
1,455
|
|
144
|
|
11,323
|
|
1,455
|
|
12,778
|
|
(1,285
|
)
|
2012
|
|||||||||||||||||
|
Hartland, WI
|
—
|
|
4,634
|
|
1,526
|
|
—
|
|
4,634
|
|
1,526
|
|
6,160
|
|
(36
|
)
|
2016
|
|||||||||||||||||
|
Harvard, IL
|
—
|
|
2,980
|
|
1,157
|
|
—
|
|
2,980
|
|
1,157
|
|
4,137
|
|
(637
|
)
|
2013
|
|||||||||||||||||
|
Hazelwood, MO
|
(5,384
|
)
|
5,815
|
|
1,382
|
|
1,207
|
|
7,022
|
|
1,382
|
|
8,404
|
|
(1,292
|
)
|
2011
|
|||||||||||||||||
|
Hebron, KY
|
—
|
|
4,601
|
|
370
|
|
—
|
|
4,601
|
|
370
|
|
4,971
|
|
(446
|
)
|
2014
|
|||||||||||||||||
|
Holland, MI
|
(3,159
|
)
|
3,475
|
|
279
|
|
60
|
|
3,535
|
|
279
|
|
3,814
|
|
(580
|
)
|
2012
|
|||||||||||||||||
|
Holland, MI
|
—
|
|
2,176
|
|
224
|
|
229
|
|
2,405
|
|
224
|
|
2,629
|
|
(925
|
)
|
2007
|
|||||||||||||||||
|
Houston, TX
|
—
|
|
7,790
|
|
2,255
|
|
9
|
|
7,799
|
|
2,255
|
|
10,054
|
|
(886
|
)
|
2013
|
|||||||||||||||||
|
Houston, TX
|
—
|
|
4,906
|
|
1,428
|
|
17
|
|
4,923
|
|
1,428
|
|
6,351
|
|
(594
|
)
|
2014
|
|||||||||||||||||
|
Houston, TX
|
—
|
|
5,019
|
|
565
|
|
750
|
|
5,769
|
|
565
|
|
6,334
|
|
(671
|
)
|
2014
|
|||||||||||||||||
|
Houston, TX
|
—
|
|
8,448
|
|
2,546
|
|
—
|
|
8,448
|
|
2,546
|
|
10,994
|
|
(53
|
)
|
2016
|
|||||||||||||||||
|
Huntersville, NC
|
—
|
|
3,123
|
|
1,061
|
|
39
|
|
3,162
|
|
1,061
|
|
4,223
|
|
(390
|
)
|
2012
|
|||||||||||||||||
|
Idaho Falls, ID
|
—
|
|
2,735
|
|
356
|
|
—
|
|
2,735
|
|
356
|
|
3,091
|
|
(380
|
)
|
2013
|
|||||||||||||||||
|
Independence, VA
|
(1,421
|
)
|
2,212
|
|
226
|
|
83
|
|
2,295
|
|
226
|
|
2,521
|
|
(415
|
)
|
2012
|
|||||||||||||||||
|
Itasca, IL
|
—
|
|
12,216
|
|
2,428
|
|
—
|
|
12,216
|
|
2,428
|
|
14,644
|
|
(95
|
)
|
2016
|
|||||||||||||||||
|
Jackson, TN
|
—
|
|
2,374
|
|
230
|
|
213
|
|
2,587
|
|
230
|
|
2,817
|
|
(374
|
)
|
2012
|
|||||||||||||||||
|
Janesville, WI
|
—
|
|
17,477
|
|
828
|
|
245
|
|
17,722
|
|
828
|
|
18,550
|
|
(2,115
|
)
|
2013
|
|||||||||||||||||
|
Jefferson City, TN
|
—
|
|
8,494
|
|
1,350
|
|
—
|
|
8,494
|
|
1,350
|
|
9,844
|
|
(1,365
|
)
|
2014
|
|||||||||||||||||
|
Johnstown, NY
|
(736
|
)
|
1,304
|
|
178
|
|
—
|
|
1,304
|
|
178
|
|
1,482
|
|
(184
|
)
|
2012
|
|||||||||||||||||
|
Johnstown, NY
|
(1,076
|
)
|
1,592
|
|
216
|
|
—
|
|
1,592
|
|
216
|
|
1,808
|
|
(185
|
)
|
2012
|
|||||||||||||||||
|
Johnstown, NY
|
(878
|
)
|
978
|
|
151
|
|
—
|
|
978
|
|
151
|
|
1,129
|
|
(171
|
)
|
2012
|
|||||||||||||||||
|
Johnstown, NY
|
(1,642
|
)
|
1,467
|
|
140
|
|
—
|
|
1,467
|
|
140
|
|
1,607
|
|
(208
|
)
|
2012
|
|||||||||||||||||
|
Kansas City, MO
|
—
|
|
5,539
|
|
703
|
|
92
|
|
5,631
|
|
703
|
|
6,334
|
|
(584
|
)
|
2012
|
|||||||||||||||||
|
Kenosha, WI
|
—
|
|
3,991
|
|
797
|
|
—
|
|
3,991
|
|
797
|
|
4,788
|
|
(36
|
)
|
2016
|
|||||||||||||||||
|
Kentwood, MI
|
—
|
|
2,478
|
|
407
|
|
—
|
|
2,478
|
|
407
|
|
2,885
|
|
(309
|
)
|
2013
|
|||||||||||||||||
|
Knoxville, TN
|
—
|
|
3,201
|
|
447
|
|
—
|
|
3,201
|
|
447
|
|
3,648
|
|
(263
|
)
|
2015
|
|||||||||||||||||
|
Lafayette, IN
|
(1,217
|
)
|
2,205
|
|
295
|
|
36
|
|
2,241
|
|
295
|
|
2,536
|
|
(267
|
)
|
2012
|
|||||||||||||||||
|
Lafayette, IN
|
(2,067
|
)
|
3,554
|
|
410
|
|
38
|
|
3,592
|
|
410
|
|
4,002
|
|
(540
|
)
|
2012
|
|||||||||||||||||
|
Lafayette, IN
|
(4,246
|
)
|
8,135
|
|
906
|
|
252
|
|
8,387
|
|
906
|
|
9,293
|
|
(1,182
|
)
|
2012
|
|||||||||||||||||
|
Lancaster, PA
|
—
|
|
5,480
|
|
1,520
|
|
—
|
|
5,480
|
|
1,520
|
|
7,000
|
|
(527
|
)
|
2015
|
|||||||||||||||||
|
Langhorne, PA
|
—
|
|
3,868
|
|
1,370
|
|
—
|
|
3,868
|
|
1,370
|
|
5,238
|
|
(86
|
)
|
2016
|
|||||||||||||||||
|
Langhorne, PA
|
—
|
|
3,105
|
|
1,308
|
|
—
|
|
3,105
|
|
1,308
|
|
4,413
|
|
(84
|
)
|
2016
|
|||||||||||||||||
|
Langhorne, PA
|
—
|
|
6,372
|
|
1,884
|
|
—
|
|
6,372
|
|
1,884
|
|
8,256
|
|
(61
|
)
|
2016
|
|||||||||||||||||
|
Lansing, MI
|
(7,263
|
)
|
8,164
|
|
501
|
|
—
|
|
8,164
|
|
501
|
|
8,665
|
|
(1,353
|
)
|
2011
|
|||||||||||||||||
|
Lansing, MI
|
—
|
|
4,077
|
|
580
|
|
—
|
|
4,077
|
|
580
|
|
4,657
|
|
(564
|
)
|
2012
|
|||||||||||||||||
|
Lansing, MI
|
(5,662
|
)
|
7,162
|
|
429
|
|
—
|
|
7,162
|
|
429
|
|
7,591
|
|
(936
|
)
|
2012
|
|||||||||||||||||
|
Lansing, MI
|
—
|
|
5,209
|
|
907
|
|
—
|
|
5,209
|
|
907
|
|
6,116
|
|
(619
|
)
|
2013
|
|||||||||||||||||
|
Laurens, SC
|
—
|
|
4,254
|
|
151
|
|
—
|
|
4,254
|
|
151
|
|
4,405
|
|
(181
|
)
|
2015
|
|||||||||||||||||
|
Lenexa, KS
|
—
|
|
7,610
|
|
2,368
|
|
—
|
|
7,610
|
|
2,368
|
|
9,978
|
|
(938
|
)
|
2014
|
|||||||||||||||||
|
Lewiston, ME
|
—
|
|
5,515
|
|
173
|
|
1,318
|
|
6,833
|
|
173
|
|
7,006
|
|
(1,769
|
)
|
2007
|
|||||||||||||||||
|
Lexington, NC
|
—
|
|
3,968
|
|
232
|
|
633
|
|
4,601
|
|
232
|
|
4,833
|
|
(717
|
)
|
2011
|
|||||||||||||||||
|
Libertyville, IL
|
—
|
|
6,455
|
|
421
|
|
80
|
|
6,535
|
|
421
|
|
6,956
|
|
(377
|
)
|
2015
|
|||||||||||||||||
|
Libertyville, IL
|
—
|
|
770
|
|
143
|
|
9
|
|
779
|
|
143
|
|
922
|
|
(155
|
)
|
2015
|
|||||||||||||||||
|
Londonderry, NH
|
—
|
|
6,683
|
|
730
|
|
—
|
|
6,683
|
|
730
|
|
7,413
|
|
(767
|
)
|
2013
|
|||||||||||||||||
|
Longmont, CO
|
—
|
|
9,647
|
|
1,529
|
|
350
|
|
9,997
|
|
1,529
|
|
11,526
|
|
(859
|
)
|
2014
|
|||||||||||||||||
|
Loudon, TN
|
—
|
|
3,751
|
|
170
|
|
—
|
|
3,751
|
|
170
|
|
3,921
|
|
(181
|
)
|
2015
|
|||||||||||||||||
|
Louisville, KY
|
(3,354
|
)
|
3,875
|
|
386
|
|
520
|
|
4,395
|
|
386
|
|
4,781
|
|
(866
|
)
|
2011
|
|||||||||||||||||
|
Louisville, KY
|
(5,351
|
)
|
6,182
|
|
616
|
|
632
|
|
6,814
|
|
616
|
|
7,430
|
|
(1,336
|
)
|
2011
|
|||||||||||||||||
|
Macedonia, OH
|
—
|
|
8,195
|
|
1,690
|
|
10
|
|
8,205
|
|
1,690
|
|
9,895
|
|
(487
|
)
|
2015
|
|||||||||||||||||
|
Machesney Park, IL
|
—
|
|
3,742
|
|
300
|
|
—
|
|
3,742
|
|
300
|
|
4,042
|
|
(261
|
)
|
2015
|
|||||||||||||||||
|
Madison, TN
|
(5,688
|
)
|
6,159
|
|
1,655
|
|
1,681
|
|
7,840
|
|
1,655
|
|
9,495
|
|
(1,488
|
)
|
2011
|
|||||||||||||||||
F-50
|
Initial Cost to STAG Industrial, Inc.
|
Gross Amounts at Which Carried at December 31, 2016
|
|||||||||||||||||||||||||||||||||
|
City/State
|
Encumbrances
(1)
|
Building & Improvements
(2)
|
Land
|
Costs Capitalized Subsequent to Acquisition and Valuation Provision
|
Building & Improvements
|
Land
|
Total
|
Accumulated Depreciation
(3)
|
Acq Date
|
|||||||||||||||||||||||||
|
Malden, MA
|
—
|
|
2,817
|
|
366
|
|
—
|
|
2,817
|
|
366
|
|
3,183
|
|
(691
|
)
|
2007
|
|||||||||||||||||
|
Malden, MA
|
—
|
|
3,961
|
|
507
|
|
—
|
|
3,961
|
|
507
|
|
4,468
|
|
(972
|
)
|
2007
|
|||||||||||||||||
|
Marion, IA
|
—
|
|
2,257
|
|
691
|
|
49
|
|
2,306
|
|
691
|
|
2,997
|
|
(338
|
)
|
2013
|
|||||||||||||||||
|
Marion, IN
|
(2,887
|
)
|
2,934
|
|
243
|
|
563
|
|
3,497
|
|
243
|
|
3,740
|
|
(391
|
)
|
2012
|
|||||||||||||||||
|
Marshall, MI
|
—
|
|
1,051
|
|
199
|
|
—
|
|
1,051
|
|
199
|
|
1,250
|
|
(181
|
)
|
2013
|
|||||||||||||||||
|
Mascot, TN
|
—
|
|
3,228
|
|
284
|
|
—
|
|
3,228
|
|
284
|
|
3,512
|
|
(178
|
)
|
2016
|
|||||||||||||||||
|
Mascot, TN
|
—
|
|
3,452
|
|
385
|
|
65
|
|
3,517
|
|
385
|
|
3,902
|
|
(525
|
)
|
2013
|
|||||||||||||||||
|
Salem, OH
|
—
|
|
7,674
|
|
858
|
|
252
|
|
7,926
|
|
858
|
|
8,784
|
|
(1,761
|
)
|
2006
|
|||||||||||||||||
|
Mason, OH
|
—
|
|
4,730
|
|
673
|
|
—
|
|
4,730
|
|
673
|
|
5,403
|
|
(476
|
)
|
2014
|
|||||||||||||||||
|
Mayville, WI
|
—
|
|
4,118
|
|
547
|
|
330
|
|
4,448
|
|
547
|
|
4,995
|
|
(1,142
|
)
|
2007
|
|||||||||||||||||
|
Mebane, NC
|
—
|
|
4,570
|
|
481
|
|
457
|
|
5,027
|
|
481
|
|
5,508
|
|
(596
|
)
|
2012
|
|||||||||||||||||
|
Mebane, NC
|
—
|
|
4,148
|
|
443
|
|
—
|
|
4,148
|
|
443
|
|
4,591
|
|
(548
|
)
|
2012
|
|||||||||||||||||
|
Mebane, NC
|
—
|
|
4,999
|
|
358
|
|
—
|
|
4,999
|
|
358
|
|
5,357
|
|
(577
|
)
|
2013
|
|||||||||||||||||
|
Mechanicsburg, PA
|
—
|
|
5,172
|
|
1,482
|
|
635
|
|
5,807
|
|
1,482
|
|
7,289
|
|
(648
|
)
|
2014
|
|||||||||||||||||
|
Mechanicsburg, PA
|
—
|
|
7,144
|
|
1,800
|
|
—
|
|
7,144
|
|
1,800
|
|
8,944
|
|
(654
|
)
|
2014
|
|||||||||||||||||
|
New Kingston, PA
|
—
|
|
8,687
|
|
2,041
|
|
—
|
|
8,687
|
|
2,041
|
|
10,728
|
|
(786
|
)
|
2014
|
|||||||||||||||||
|
Mechanicsburg, PA
|
—
|
|
8,008
|
|
1,452
|
|
—
|
|
8,008
|
|
1,452
|
|
9,460
|
|
(719
|
)
|
2014
|
|||||||||||||||||
|
Milwaukee, WI
|
—
|
|
4,090
|
|
456
|
|
46
|
|
4,136
|
|
456
|
|
4,592
|
|
(978
|
)
|
2007
|
|||||||||||||||||
|
Montgomery, AL
|
—
|
|
7,523
|
|
418
|
|
—
|
|
7,523
|
|
418
|
|
7,941
|
|
(25
|
)
|
2016
|
|||||||||||||||||
|
Montgomery, IL
|
—
|
|
12,485
|
|
2,190
|
|
1,755
|
|
14,240
|
|
2,190
|
|
16,430
|
|
(1,573
|
)
|
2012
|
|||||||||||||||||
|
Mooresville, NC
|
(5,888
|
)
|
7,411
|
|
701
|
|
216
|
|
7,627
|
|
701
|
|
8,328
|
|
(1,312
|
)
|
2011
|
|||||||||||||||||
|
Mountain Home, NC
|
—
|
|
2,472
|
|
523
|
|
—
|
|
2,472
|
|
523
|
|
2,995
|
|
(230
|
)
|
2014
|
|||||||||||||||||
|
Murfreesboro, TN
|
—
|
|
2,863
|
|
722
|
|
—
|
|
2,863
|
|
722
|
|
3,585
|
|
(338
|
)
|
2014
|
|||||||||||||||||
|
Nashua, NH
|
—
|
|
8,682
|
|
1,431
|
|
—
|
|
8,682
|
|
1,431
|
|
10,113
|
|
(942
|
)
|
2014
|
|||||||||||||||||
|
Nashville, TN
|
—
|
|
3,601
|
|
547
|
|
—
|
|
3,601
|
|
547
|
|
4,148
|
|
(391
|
)
|
2013
|
|||||||||||||||||
|
Newark, DE
|
—
|
|
1,478
|
|
197
|
|
392
|
|
1,870
|
|
197
|
|
2,067
|
|
(480
|
)
|
2007
|
|||||||||||||||||
|
Newark, DE
|
—
|
|
1,891
|
|
232
|
|
194
|
|
2,085
|
|
232
|
|
2,317
|
|
(612
|
)
|
2007
|
|||||||||||||||||
|
New Berlin, WI
|
—
|
|
6,500
|
|
1,068
|
|
141
|
|
6,641
|
|
1,068
|
|
7,709
|
|
(886
|
)
|
2013
|
|||||||||||||||||
|
New Castle, DE
|
—
|
|
17,767
|
|
2,616
|
|
—
|
|
17,767
|
|
2,616
|
|
20,383
|
|
(338
|
)
|
2016
|
|||||||||||||||||
|
New Hope, MN
|
—
|
|
1,970
|
|
1,919
|
|
—
|
|
1,970
|
|
1,919
|
|
3,889
|
|
(345
|
)
|
2013
|
|||||||||||||||||
|
Lopatcong, NJ
|
—
|
|
9,154
|
|
1,554
|
|
193
|
|
9,347
|
|
1,554
|
|
10,901
|
|
(476
|
)
|
2011
|
|||||||||||||||||
|
Piscataway, NJ
|
—
|
|
5,655
|
|
640
|
|
620
|
|
6,275
|
|
640
|
|
6,915
|
|
(1,480
|
)
|
2011
|
|||||||||||||||||
|
Newton, NC
|
—
|
|
3,814
|
|
732
|
|
86
|
|
3,900
|
|
732
|
|
4,632
|
|
(573
|
)
|
2011
|
|||||||||||||||||
|
North Haven, CT
|
—
|
|
39,911
|
|
4,086
|
|
1,384
|
|
41,295
|
|
4,086
|
|
45,381
|
|
(3,132
|
)
|
2015
|
|||||||||||||||||
|
North Jackson, OH
|
—
|
|
4,427
|
|
1,528
|
|
—
|
|
4,427
|
|
1,528
|
|
5,955
|
|
(469
|
)
|
2013
|
|||||||||||||||||
|
North Jackson, OH
|
(7,435
|
)
|
5,795
|
|
486
|
|
170
|
|
5,965
|
|
486
|
|
6,451
|
|
(734
|
)
|
2011
|
|||||||||||||||||
|
Norcorss, GA
|
—
|
|
2,586
|
|
1,589
|
|
—
|
|
2,586
|
|
1,589
|
|
4,175
|
|
(132
|
)
|
2016
|
|||||||||||||||||
|
Norton, MA
|
—
|
|
6,740
|
|
2,839
|
|
—
|
|
6,740
|
|
2,839
|
|
9,579
|
|
(1,192
|
)
|
2011
|
|||||||||||||||||
|
Novi, MI
|
(2,774
|
)
|
3,879
|
|
252
|
|
—
|
|
3,879
|
|
252
|
|
4,131
|
|
(659
|
)
|
2012
|
|||||||||||||||||
|
Novi, MI
|
—
|
|
6,035
|
|
626
|
|
—
|
|
6,035
|
|
626
|
|
6,661
|
|
(310
|
)
|
2015
|
|||||||||||||||||
|
Oakwood Village, OH
|
—
|
|
3,091
|
|
343
|
|
—
|
|
3,091
|
|
343
|
|
3,434
|
|
(254
|
)
|
2015
|
|||||||||||||||||
|
Ocala, FL
|
—
|
|
13,296
|
|
731
|
|
952
|
|
14,248
|
|
731
|
|
14,979
|
|
(1,409
|
)
|
2013
|
|||||||||||||||||
|
O'Fallon, MO
|
(2,634
|
)
|
2,676
|
|
1,242
|
|
266
|
|
2,942
|
|
1,242
|
|
4,184
|
|
(500
|
)
|
2011
|
|||||||||||||||||
|
O'Hara, PA
|
(15,909
|
)
|
18,875
|
|
1,435
|
|
4,999
|
|
23,874
|
|
1,435
|
|
25,309
|
|
(3,036
|
)
|
2012
|
|||||||||||||||||
|
Oklahoma City, OK
|
—
|
|
2,211
|
|
746
|
|
—
|
|
2,211
|
|
746
|
|
2,957
|
|
(23
|
)
|
2016
|
|||||||||||||||||
|
Oklahoma City, OK
|
—
|
|
9,199
|
|
1,614
|
|
1,354
|
|
10,553
|
|
1,614
|
|
12,167
|
|
(488
|
)
|
2015
|
|||||||||||||||||
|
Olathe, KS
|
—
|
|
20,763
|
|
2,431
|
|
—
|
|
20,763
|
|
2,431
|
|
23,194
|
|
(195
|
)
|
2016
|
|||||||||||||||||
|
Orlando, FL
|
—
|
|
4,839
|
|
1,339
|
|
—
|
|
4,839
|
|
1,339
|
|
6,178
|
|
(588
|
)
|
2013
|
|||||||||||||||||
|
Orlando, FL
|
—
|
|
1,996
|
|
721
|
|
—
|
|
1,996
|
|
721
|
|
2,717
|
|
(292
|
)
|
2012
|
|||||||||||||||||
|
Pensacola, FL
|
—
|
|
2,989
|
|
145
|
|
111
|
|
3,100
|
|
145
|
|
3,245
|
|
(1,215
|
)
|
2007
|
|||||||||||||||||
|
Phenix City, AL
|
(1,585
|
)
|
1,493
|
|
276
|
|
140
|
|
1,633
|
|
276
|
|
1,909
|
|
(249
|
)
|
2012
|
|||||||||||||||||
|
Phoenix, AZ
|
—
|
|
5,770
|
|
1,653
|
|
—
|
|
5,770
|
|
1,653
|
|
7,423
|
|
(340
|
)
|
2015
|
|||||||||||||||||
|
Piedmont, SC
|
—
|
|
4,152
|
|
231
|
|
—
|
|
4,152
|
|
231
|
|
4,383
|
|
(216
|
)
|
2015
|
|||||||||||||||||
|
Piedmont, SC
|
—
|
|
2,127
|
|
158
|
|
—
|
|
2,127
|
|
158
|
|
2,285
|
|
(115
|
)
|
2015
|
|||||||||||||||||
|
Piedmont, SC
|
—
|
|
2,302
|
|
204
|
|
—
|
|
2,302
|
|
204
|
|
2,506
|
|
(195
|
)
|
2015
|
|||||||||||||||||
|
Pineville, NC
|
—
|
|
1,380
|
|
392
|
|
—
|
|
1,380
|
|
392
|
|
1,772
|
|
(227
|
)
|
2012
|
|||||||||||||||||
|
Plymouth, MI
|
—
|
|
4,670
|
|
365
|
|
—
|
|
4,670
|
|
365
|
|
5,035
|
|
(339
|
)
|
2015
|
|||||||||||||||||
|
Pocatello, ID
|
—
|
|
3,472
|
|
399
|
|
135
|
|
3,607
|
|
399
|
|
4,006
|
|
(1,064
|
)
|
2007
|
|||||||||||||||||
|
Portage, IN
|
—
|
|
5,416
|
|
—
|
|
—
|
|
5,416
|
|
—
|
|
5,416
|
|
(613
|
)
|
2012
|
|||||||||||||||||
F-51
|
Initial Cost to STAG Industrial, Inc.
|
Gross Amounts at Which Carried at December 31, 2016
|
|||||||||||||||||||||||||||||||||
|
City/State
|
Encumbrances
(1)
|
Building & Improvements
(2)
|
Land
|
Costs Capitalized Subsequent to Acquisition and Valuation Provision
|
Building & Improvements
|
Land
|
Total
|
Accumulated Depreciation
(3)
|
Acq Date
|
|||||||||||||||||||||||||
|
Portland, TN
|
—
|
|
8,353
|
|
1,662
|
|
66
|
|
8,419
|
|
1,662
|
|
10,081
|
|
(1,387
|
)
|
2012
|
|||||||||||||||||
|
Portland, ME
|
(2,853
|
)
|
3,727
|
|
891
|
|
—
|
|
3,727
|
|
891
|
|
4,618
|
|
(507
|
)
|
2012
|
|||||||||||||||||
|
Rapid City, SD
|
—
|
|
10,662
|
|
2,071
|
|
836
|
|
11,498
|
|
2,071
|
|
13,569
|
|
(3,477
|
)
|
2007
|
|||||||||||||||||
|
Reading, PA
|
—
|
|
5,401
|
|
1,708
|
|
67
|
|
5,468
|
|
1,708
|
|
7,176
|
|
(176
|
)
|
2016
|
|||||||||||||||||
|
Muhlenberg TWP, PA
|
—
|
|
14,064
|
|
843
|
|
132
|
|
14,196
|
|
843
|
|
15,039
|
|
(1,982
|
)
|
2012
|
|||||||||||||||||
|
Reno, NV
|
—
|
|
3,461
|
|
1,372
|
|
—
|
|
3,461
|
|
1,372
|
|
4,833
|
|
(357
|
)
|
2014
|
|||||||||||||||||
|
Rock Hill, SC
|
(4,012
|
)
|
6,297
|
|
1,411
|
|
—
|
|
6,297
|
|
1,411
|
|
7,708
|
|
(114
|
)
|
2016
|
|||||||||||||||||
|
Rogers, MN
|
(10,014
|
)
|
11,787
|
|
1,671
|
|
238
|
|
12,025
|
|
1,671
|
|
13,696
|
|
(2,925
|
)
|
2011
|
|||||||||||||||||
|
Rogers, AR
|
—
|
|
8,280
|
|
1,072
|
|
99
|
|
8,379
|
|
1,072
|
|
9,451
|
|
(1,391
|
)
|
2011
|
|||||||||||||||||
|
Rural Hall, NC
|
—
|
|
5,664
|
|
439
|
|
147
|
|
5,811
|
|
439
|
|
6,250
|
|
(1,103
|
)
|
2011
|
|||||||||||||||||
|
Salem, OR
|
(2,741
|
)
|
3,150
|
|
599
|
|
640
|
|
3,790
|
|
599
|
|
4,389
|
|
(603
|
)
|
2011
|
|||||||||||||||||
|
Salem, OR
|
(1,231
|
)
|
1,452
|
|
266
|
|
433
|
|
1,885
|
|
266
|
|
2,151
|
|
(340
|
)
|
2011
|
|||||||||||||||||
|
San Antonio, TX
|
—
|
|
10,395
|
|
1,568
|
|
—
|
|
10,395
|
|
1,568
|
|
11,963
|
|
(61
|
)
|
2016
|
|||||||||||||||||
|
Sauk Village, IL
|
—
|
|
5,405
|
|
877
|
|
64
|
|
5,469
|
|
877
|
|
6,346
|
|
(621
|
)
|
2013
|
|||||||||||||||||
|
Savage, MN
|
—
|
|
3,996
|
|
3,194
|
|
493
|
|
4,489
|
|
3,194
|
|
7,683
|
|
(662
|
)
|
2014
|
|||||||||||||||||
|
Savannah, GA
|
—
|
|
13,219
|
|
439
|
|
—
|
|
13,219
|
|
439
|
|
13,658
|
|
(1,193
|
)
|
2014
|
|||||||||||||||||
|
Sergeant Bluff, IA
|
—
|
|
6,188
|
|
247
|
|
273
|
|
6,461
|
|
247
|
|
6,708
|
|
(3,667
|
)
|
2007
|
|||||||||||||||||
|
Seville, OH
|
—
|
|
4,536
|
|
766
|
|
171
|
|
4,707
|
|
766
|
|
5,473
|
|
(949
|
)
|
2011
|
|||||||||||||||||
|
Shannon, GA
|
—
|
|
12,969
|
|
393
|
|
—
|
|
12,969
|
|
393
|
|
13,362
|
|
(1,150
|
)
|
2013
|
|||||||||||||||||
|
South Holland, IL
|
—
|
|
3,900
|
|
714
|
|
—
|
|
3,900
|
|
714
|
|
4,614
|
|
(652
|
)
|
2013
|
|||||||||||||||||
|
Shreveport, LA
|
—
|
|
6,265
|
|
1,804
|
|
136
|
|
6,401
|
|
1,804
|
|
8,205
|
|
(460
|
)
|
2015
|
|||||||||||||||||
|
Simpsonville, SC
|
—
|
|
2,960
|
|
957
|
|
117
|
|
3,077
|
|
957
|
|
4,034
|
|
(442
|
)
|
2012
|
|||||||||||||||||
|
Simpsonville, SC
|
—
|
|
3,418
|
|
470
|
|
127
|
|
3,545
|
|
470
|
|
4,015
|
|
(462
|
)
|
2012
|
|||||||||||||||||
|
Smithfield, NC
|
—
|
|
4,694
|
|
613
|
|
12
|
|
4,706
|
|
613
|
|
5,319
|
|
(706
|
)
|
2011
|
|||||||||||||||||
|
Smyrna, GA
|
—
|
|
3,286
|
|
264
|
|
—
|
|
3,286
|
|
264
|
|
3,550
|
|
(485
|
)
|
2012
|
|||||||||||||||||
|
South Bend, IN
|
—
|
|
4,834
|
|
411
|
|
—
|
|
4,834
|
|
411
|
|
5,245
|
|
(666
|
)
|
2012
|
|||||||||||||||||
|
Sparks, MD
|
—
|
|
1,945
|
|
358
|
|
65
|
|
2,010
|
|
358
|
|
2,368
|
|
(751
|
)
|
2007
|
|||||||||||||||||
|
Spartanburg, SC
|
—
|
|
15,100
|
|
1,867
|
|
—
|
|
15,100
|
|
1,867
|
|
16,967
|
|
(122
|
)
|
2016
|
|||||||||||||||||
|
Spartanburg, SC
|
—
|
|
3,694
|
|
342
|
|
—
|
|
3,694
|
|
342
|
|
4,036
|
|
(370
|
)
|
2014
|
|||||||||||||||||
|
Spartanburg, SC
|
—
|
|
5,797
|
|
493
|
|
294
|
|
6,091
|
|
493
|
|
6,584
|
|
(728
|
)
|
2012
|
|||||||||||||||||
|
Springfield, OH
|
—
|
|
6,432
|
|
574
|
|
—
|
|
6,432
|
|
574
|
|
7,006
|
|
(745
|
)
|
2013
|
|||||||||||||||||
|
Statham, GA
|
—
|
|
6,130
|
|
588
|
|
200
|
|
6,330
|
|
588
|
|
6,918
|
|
(747
|
)
|
2012
|
|||||||||||||||||
|
Sterling Heights, MI
|
(1,529
|
)
|
4,197
|
|
513
|
|
415
|
|
4,612
|
|
513
|
|
5,125
|
|
(548
|
)
|
2012
|
|||||||||||||||||
|
Stoughton, MA
|
—
|
|
2,613
|
|
2,256
|
|
824
|
|
3,437
|
|
2,256
|
|
5,693
|
|
(606
|
)
|
2015
|
|||||||||||||||||
|
Stoughton, MA
|
—
|
|
1,216
|
|
538
|
|
—
|
|
1,216
|
|
538
|
|
1,754
|
|
(174
|
)
|
2015
|
|||||||||||||||||
|
Streetsboro, OH
|
(5,493
|
)
|
5,481
|
|
2,161
|
|
214
|
|
5,695
|
|
2,161
|
|
7,856
|
|
(1,340
|
)
|
2011
|
|||||||||||||||||
|
Strongsville, OH
|
—
|
|
5,853
|
|
491
|
|
23
|
|
5,876
|
|
491
|
|
6,367
|
|
(573
|
)
|
2014
|
|||||||||||||||||
|
Sun Prairie, WI
|
—
|
|
5,809
|
|
2,360
|
|
2,377
|
|
8,186
|
|
2,360
|
|
10,546
|
|
(1,176
|
)
|
2011
|
|||||||||||||||||
|
Toledo, OH
|
—
|
|
6,831
|
|
213
|
|
—
|
|
6,831
|
|
213
|
|
7,044
|
|
(976
|
)
|
2012
|
|||||||||||||||||
|
Burlington, NJ
|
—
|
|
—
|
|
3,267
|
|
167
|
|
167
|
|
3,267
|
|
3,434
|
|
—
|
|
2015
|
|||||||||||||||||
|
Libertyville, IL
|
—
|
|
—
|
|
369
|
|
2
|
|
2
|
|
369
|
|
371
|
|
—
|
|
2015
|
|||||||||||||||||
|
Libertyville, IL
|
—
|
|
—
|
|
397
|
|
2
|
|
2
|
|
397
|
|
399
|
|
—
|
|
2015
|
|||||||||||||||||
|
Tulsa, OK
|
—
|
|
8,242
|
|
966
|
|
—
|
|
8,242
|
|
966
|
|
9,208
|
|
(405
|
)
|
2015
|
|||||||||||||||||
|
Twinsburg, OH
|
—
|
|
8,027
|
|
590
|
|
—
|
|
8,027
|
|
590
|
|
8,617
|
|
(1,590
|
)
|
2007
|
|||||||||||||||||
|
Visalia, CA
|
—
|
|
21,839
|
|
4,346
|
|
—
|
|
21,839
|
|
4,346
|
|
26,185
|
|
(646
|
)
|
2016
|
|||||||||||||||||
|
Vonore, TN
|
(7,707
|
)
|
8,243
|
|
2,355
|
|
85
|
|
8,328
|
|
2,355
|
|
10,683
|
|
(1,571
|
)
|
2011
|
|||||||||||||||||
|
Waco, TX
|
—
|
|
1,394
|
|
—
|
|
274
|
|
1,668
|
|
—
|
|
1,668
|
|
(244
|
)
|
2011
|
|||||||||||||||||
|
West Allis, WI
|
—
|
|
1,905
|
|
462
|
|
—
|
|
1,905
|
|
462
|
|
2,367
|
|
(97
|
)
|
2015
|
|||||||||||||||||
|
West Allis, WI
|
—
|
|
1,860
|
|
444
|
|
—
|
|
1,860
|
|
444
|
|
2,304
|
|
(91
|
)
|
2015
|
|||||||||||||||||
|
West Allis, WI
|
—
|
|
929
|
|
252
|
|
—
|
|
929
|
|
252
|
|
1,181
|
|
(48
|
)
|
2015
|
|||||||||||||||||
|
West Allis, WI
|
—
|
|
1,039
|
|
251
|
|
—
|
|
1,039
|
|
251
|
|
1,290
|
|
(51
|
)
|
2015
|
|||||||||||||||||
|
Walker, MI
|
(3,685
|
)
|
4,872
|
|
855
|
|
118
|
|
4,990
|
|
855
|
|
5,845
|
|
(949
|
)
|
2011
|
|||||||||||||||||
|
Ware Shoals, SC
|
(251
|
)
|
197
|
|
133
|
|
—
|
|
197
|
|
133
|
|
330
|
|
(29
|
)
|
2012
|
|||||||||||||||||
|
Warren, MI
|
—
|
|
14,473
|
|
1,290
|
|
—
|
|
14,473
|
|
1,290
|
|
15,763
|
|
(234
|
)
|
2016
|
|||||||||||||||||
|
West Chester, OH
|
—
|
|
8,868
|
|
936
|
|
—
|
|
8,868
|
|
936
|
|
9,804
|
|
(27
|
)
|
2016
|
|||||||||||||||||
|
West Chicago, IL
|
—
|
|
2,036
|
|
768
|
|
—
|
|
2,036
|
|
768
|
|
2,804
|
|
(8
|
)
|
2016
|
|||||||||||||||||
|
West Chicago, IL
|
—
|
|
674
|
|
382
|
|
—
|
|
674
|
|
382
|
|
1,056
|
|
(6
|
)
|
2016
|
|||||||||||||||||
|
West Chicago, IL
|
—
|
|
768
|
|
450
|
|
—
|
|
768
|
|
450
|
|
1,218
|
|
(5
|
)
|
2016
|
|||||||||||||||||
|
West Chicago, IL
|
—
|
|
895
|
|
369
|
|
—
|
|
895
|
|
369
|
|
1,264
|
|
(6
|
)
|
2016
|
|||||||||||||||||
F-52
|
Initial Cost to STAG Industrial, Inc.
|
Gross Amounts at Which Carried at December 31, 2016
|
|||||||||||||||||||||||||||||||||
|
City/State
|
Encumbrances
(1)
|
Building & Improvements
(2)
|
Land
|
Costs Capitalized Subsequent to Acquisition and Valuation Provision
|
Building & Improvements
|
Land
|
Total
|
Accumulated Depreciation
(3)
|
Acq Date
|
|||||||||||||||||||||||||
|
West Chicago, IL
|
—
|
|
904
|
|
216
|
|
—
|
|
904
|
|
216
|
|
1,120
|
|
(4
|
)
|
2016
|
|||||||||||||||||
|
West Chicago, IL
|
—
|
|
6,247
|
|
915
|
|
59
|
|
6,306
|
|
915
|
|
7,221
|
|
(225
|
)
|
2016
|
|||||||||||||||||
|
West Columbia, SC
|
—
|
|
9,570
|
|
488
|
|
—
|
|
9,570
|
|
488
|
|
10,058
|
|
(29
|
)
|
2016
|
|||||||||||||||||
|
West Columbia, SC
|
—
|
|
4,646
|
|
551
|
|
—
|
|
4,646
|
|
551
|
|
5,197
|
|
(33
|
)
|
2016
|
|||||||||||||||||
|
Westborough, MA
|
—
|
|
5,808
|
|
661
|
|
—
|
|
5,808
|
|
661
|
|
6,469
|
|
(68
|
)
|
2016
|
|||||||||||||||||
|
Hamilton, OH
|
—
|
|
8,585
|
|
1,046
|
|
—
|
|
8,585
|
|
1,046
|
|
9,631
|
|
(1,290
|
)
|
2014
|
|||||||||||||||||
|
Wichita, KS
|
(1,529
|
)
|
1,815
|
|
88
|
|
11
|
|
1,826
|
|
88
|
|
1,914
|
|
(214
|
)
|
2012
|
|||||||||||||||||
|
Wichita, KS
|
(1,671
|
)
|
1,839
|
|
107
|
|
57
|
|
1,896
|
|
107
|
|
2,003
|
|
(257
|
)
|
2012
|
|||||||||||||||||
|
Wichita, KS
|
(764
|
)
|
833
|
|
76
|
|
131
|
|
964
|
|
76
|
|
1,040
|
|
(109
|
)
|
2012
|
|||||||||||||||||
|
Williamsport, PA
|
—
|
|
9,059
|
|
688
|
|
—
|
|
9,059
|
|
688
|
|
9,747
|
|
(1,150
|
)
|
2013
|
|||||||||||||||||
|
Winston-Salem, NC
|
—
|
|
11,054
|
|
610
|
|
16
|
|
11,070
|
|
610
|
|
11,680
|
|
(949
|
)
|
2014
|
|||||||||||||||||
|
Wood Dale, IL
|
—
|
|
5,042
|
|
1,226
|
|
—
|
|
5,042
|
|
1,226
|
|
6,268
|
|
(30
|
)
|
2016
|
|||||||||||||||||
|
Woodstock, IL
|
—
|
|
3,796
|
|
496
|
|
—
|
|
3,796
|
|
496
|
|
4,292
|
|
(520
|
)
|
2012
|
|||||||||||||||||
|
Yorkville, WI
|
(4,044
|
)
|
4,915
|
|
416
|
|
—
|
|
4,915
|
|
416
|
|
5,331
|
|
(339
|
)
|
2014
|
|||||||||||||||||
|
Bardstown, KY
|
—
|
|
2,398
|
|
379
|
|
—
|
|
2,398
|
|
379
|
|
2,777
|
|
(617
|
)
|
2007
|
|||||||||||||||||
|
Total
|
$
|
(164,326
|
)
|
$
|
1,673,800
|
|
$
|
272,162
|
|
$
|
63,754
|
|
$
|
1,737,554
|
|
$
|
272,162
|
|
$
|
2,009,716
|
|
$
|
(187,413
|
)
|
||||||||||
|
(1)
|
Balance excludes the unamortized balance of fair market value premiums of approximately
$0.1 million
and unamortized deferred financing fees and debt issuance costs of approximately
$6.3 million
.
|
|
(2)
|
The initial costs of building and improvements is the acquisition costs less asset impairment write-downs and disposals of building and tenant improvements.
|
|
(3)
|
Depreciation expense is computed using the straight-line method based on the following lives:
|
|
Building
|
40 Years
|
|
|
Building and land improvements
|
Up to 20 years
|
|
|
Tenant improvements
|
Shorter of useful life or terms of related lease
|
|
As of
December 31, 2016
, the aggregate cost for federal income tax purposes of investments in real estate was approximately
$2.6 billion
.
|
Year ended December 31,
|
||||||||||||
|
|
2016
|
2015
|
2014
|
|||||||||
|
Real Estate:
|
|
|
|
|
|
|
||||||
|
Balance at beginning of period
|
$
|
1,711,612
|
|
$
|
1,415,965
|
|
$
|
1,079,046
|
|
|||
|
Additions during period
|
|
|
|
|
|
|
||||||
|
Other acquisitions
|
381,131
|
|
330,504
|
|
337,726
|
|
||||||
|
Improvements, etc.
|
33,133
|
|
16,851
|
|
13,608
|
|
||||||
|
Other additions
|
—
|
|
—
|
|
—
|
|
||||||
|
Deductions during period
|
|
|
|
|
|
|
||||||
|
Cost of real estate sold
|
(97,342
|
)
|
(21,443
|
)
|
(10,539
|
)
|
||||||
|
Write-off of tenant improvements
|
(2,585
|
)
|
(1,205
|
)
|
(1,036
|
)
|
||||||
|
Asset impairments and involuntary conversion
|
(16,233
|
)
|
(29,060
|
)
|
(2,840
|
)
|
||||||
|
Balance at the end of the period
|
$
|
2,009,716
|
|
$
|
1,711,612
|
|
$
|
1,415,965
|
|
|||
|
Accumulated Depreciation:
|
|
|
|
|
|
|
||||||
|
Balance at beginning of period
|
$
|
147,917
|
|
$
|
105,435
|
|
$
|
71,653
|
|
|||
|
Additions during period
|
|
|
|
|
|
|
||||||
|
Depreciation and amortization expense
|
57,391
|
|
48,186
|
|
36,356
|
|
||||||
|
Other additions
|
—
|
|
—
|
|
—
|
|
||||||
|
Deductions during period
|
|
|
|
|
|
|
||||||
|
Disposals
|
(17,895
|
)
|
(5,704
|
)
|
(2,574
|
)
|
||||||
|
Balance at the end of the period
|
$
|
187,413
|
|
$
|
147,917
|
|
$
|
105,435
|
|
|||
F-53
EXHIBIT INDEX
|
Exhibit Number
|
Description of Document
|
||
|
3.1
|
|
Articles of Amendment and Restatement of STAG Industrial, Inc. (including all articles of amendment and articles supplementary) (1)
|
|
|
3.2
|
|
Amended and Restated Bylaws of STAG Industrial, Inc. (2)
|
|
|
4.1
|
|
Form of Common Stock Certificate of STAG Industrial, Inc. (3)
|
|
|
4.2
|
|
Form of Certificate for the 6.625% Series B Cumulative Redeemable Preferred Stock of STAG Industrial, Inc. (4)
|
|
|
4.3
|
|
Form of Certificate for the 6.875% Series C Cumulative Redeemable Preferred Stock of STAG Industrial, Inc. (5)
|
|
|
10.1
|
|
Amended and Restated Agreement of Limited Partnership of STAG Industrial Operating Partnership, L.P. (6)
|
|
|
10.2
|
|
First Amendment to the Amended and Restated Agreement of Limited Partnership of STAG Industrial Operating Partnership, L.P. (7)
|
|
|
10.3
|
|
Second Amendment to the Amended and Restated Agreement of Limited Partnership of STAG Industrial Operating Partnership, L.P. (8)
|
|
|
10.4
|
|
Third Amendment to the Amended and Restated Agreement of Limited Partnership of STAG Industrial Operating Partnership, L.P. (9)
|
|
|
10.5
|
|
2011 Equity Incentive Plan (10)*
|
|
|
10.6
|
|
Amendment to the 2011 Equity Incentive Plan, dated as of May 6, 2013 (11)*
|
|
|
10.7
|
|
Second Amendment to the 2011 Equity Incentive Plan, dated as of February 20, 2015 (12)*
|
|
|
10.8
|
|
2015 Outperformance Program (13)*
|
|
|
10.9
|
|
Form of LTIP Unit Agreement (10)*
|
|
|
10.10
|
|
Form of Performance Award Agreement (1)*
|
|
|
10.11
|
|
Amended and Restated Executive Employment Agreement with Benjamin S. Butcher, dated May 4, 2015 (14)*
|
|
|
10.12
|
|
Executive Employment Agreement with William R. Crooker, dated February 25, 2016 (11)*
|
|
|
10.13
|
|
Executive Employment Agreement with Stephen C. Mecke, dated April 20, 2011 (6)*
|
|
|
10.14
|
|
Executive Employment Agreement with Jeffrey M. Sullivan, dated October 27, 2014 (6)*
|
|
|
10.15
|
|
Executive Employment Agreement with David G. King, dated April 20, 2011 (6)*
|
|
|
10.16
|
|
Executive Employment Agreement with Peter S. Fearey, dated February 25, 2016 (1)*
|
|
|
10.17
|
|
Form of Indemnification Agreement between STAG Industrial, Inc. and its directors and officers (17)*
|
|
|
10.18
|
|
Registration Rights Agreement, dated April 20, 2011, by and among STAG Industrial, Inc., STAG Industrial Operating Partnership, L.P. and the persons named therein (6)
|
|
|
10.19
|
|
Services Agreement between STAG Industrial Management, LLC and STAG Manager II, LLC, as amended (18)
|
|
|
10.20
|
|
Credit Agreement, dated as of December 18, 2014, among STAG Industrial Operating Partnership, L.P., STAG Industrial, Inc., Wells Fargo Bank, National Association, and the other lenders party thereto (19)
|
|
|
10.21
|
|
First Amendment to Credit Agreement, dated as of September 29, 2015, among STAG Industrial Operating Partnership, L.P., STAG Industrial, Inc., Wells Fargo Bank, National Association, and the other lenders party thereto (20)
|
|
|
10.22
|
|
Second Amended and Restated Term Loan Agreement, dated as of December 20, 2016, by and among STAG Industrial Operating Partnership, L.P., STAG Industrial, Inc., Wells Fargo Bank, National Association, and the other lenders party thereto (21)
|
|
|
10.23
|
|
Amended and Restated Term Loan Agreement, dated as of December 20, 2016, by and among STAG Industrial Operating Partnership, L.P., STAG Industrial, Inc., Wells Fargo Bank, National Association, and the other lenders party thereto (21)
|
|
|
10.24
|
|
Term Loan Agreement, dated as of September 29, 2015, by and among STAG Industrial Operating Partnership, L.P., STAG Industrial, Inc., Wells Fargo Bank, National Association, and the other lenders party thereto (20)
|
|
|
10.25
|
|
Note Purchase Agreement, dated as of April 16, 2014, by and among STAG Industrial Operating Partnership, L.P., STAG Industrial, Inc. and the purchasers named therein (22)
|
|
|
10.26
|
|
First Amendment to Note Purchase Agreement, dated as of December 18, 2014, among STAG Industrial Operating Partnership, L.P., STAG Industrial, Inc. and the noteholders named therein (19)
|
|
|
Exhibit Number
|
Description of Document
|
||
|
10.27
|
|
Second Amendment to Note Purchase Agreement, dated as of December 1, 2015, among STAG Industrial Operating Partnership, L.P., STAG Industrial, Inc. and the noteholders named therein (23)
|
|
|
10.28
|
|
Note Purchase Agreement, dated as of December 18, 2014, among STAG Industrial Operating Partnership, L.P., STAG Industrial, Inc. and the purchasers named therein (19)
|
|
|
10.29
|
|
First Amendment to Note Purchase Agreement, dated as of December 1, 2015, among STAG Industrial Operating Partnership, L.P., STAG Industrial, Inc. and the noteholders named therein (23)
|
|
|
10.30
|
|
Note Purchase Agreement, dated as of December 1, 2015, among STAG Industrial Operating Partnership, L.P., STAG Industrial, Inc. and the purchasers named therein (23)
|
|
|
12.10
|
|
Computation of ratios of earnings to fixed charges and earnings to fixed charges and preferred stock dividends
|
|
|
21.10
|
|
Subsidiaries of STAG Industrial, Inc.
|
|
|
23.10
|
|
Consent of PricewaterhouseCoopers LLP
|
|
|
24.10
|
|
Power of Attorney (included on signature page)
|
|
|
31.10
|
|
Certification of Chief Executive Officer Pursuant to Section 302 of the Sarbanes-Oxley Act of 2002
|
|
|
31.2
|
|
Certification of Chief Financial Officer Pursuant to Section 302 of the Sarbanes-Oxley Act of 2002
|
|
|
32.1
|
|
Certification of Chief Executive Officer and Chief Financial Officer Pursuant to 18 U.S.C. Section 1350, as Adopted Pursuant to Section 906 of the Sarbanes-Oxley Act of 2002
|
|
|
101.0
|
|
The following materials from STAG Industrial, Inc.'s Annual Report on Form 10-K for the year ended December 31, 2016 formatted in XBRL (eXtensible Business Reporting Language): (i) the Consolidated Balance Sheets, (ii) the Consolidated Statements of Operations, (iii) the Consolidated Statements of Comprehensive Income (Loss), (vi) the Consolidated Statements of Equity, (v) the Consolidated Statements of Cash Flows, and (vi) related notes to these consolidated financial statements.
|
|
|
*
|
Represents management contract or compensatory plan or arrangement.
|
|
(1)
|
Incorporated by reference to STAG Industrial, Inc.'s Quarterly Report on Form 10-Q filed with the SEC on May 3, 2016.
|
|
(2)
|
Incorporated by reference to STAG Industrial, Inc.'s Registration Statement on Form S-11/A (File No. 333-168368) filed with the SEC on April 8, 2011.
|
|
(3)
|
Incorporated by reference to STAG Industrial, Inc.'s Registration Statement on Form S-11/A (File No. 333-168368) filed with the SEC on September 24, 2010.
|
|
(4)
|
Incorporated by reference to STAG Industrial, Inc.'s Registration Statement on Form 8-A filed with the SEC on April 11, 2013.
|
|
(5)
|
Incorporated by reference to STAG Industrial, Inc.'s Registration Statement on Form 8-A filed with the SEC on March 10, 2016.
|
|
(6)
|
Incorporated by reference to STAG Industrial, Inc.'s Current Report on Form 8-K filed with the SEC on April 21, 2011.
|
|
(7)
|
Incorporated by reference to STAG Industrial, Inc.'s Current Report on Form 8-K filed with the SEC on November 2, 2011.
|
|
(8)
|
Incorporated by reference to STAG Industrial, Inc.'s Current Report on Form 8-K filed with the SEC on April 16, 2013.
|
|
(9)
|
Incorporated by reference to STAG Industrial, Inc.'s Current Report on Form 8-K filed with the SEC on March 18, 2016.
|
|
(10)
|
Incorporated by reference to STAG Industrial, Inc.'s Registration Statement on Form S-11/A (File No. 333-168368) filed with the SEC on April 5, 2011.
|
|
(11)
|
Incorporated by reference to STAG Industrial, Inc.'s Current Report on Form 8-K filed with the SEC on May 6, 2013.
|
|
(12)
|
Incorporated by reference to STAG Industrial, Inc.'s Annual Report on Form 10-K filed with the SEC on February 23, 2015.
|
|
(13)
|
Incorporated by reference to STAG Industrial, Inc.'s Current Report on Form 8-K filed with the SEC on January 15, 2015.
|
|
(14)
|
Incorporated by reference to STAG Industrial, Inc.'s Quarterly Report on Form 10-Q filed with the SEC on July 23, 2015.
|
|
(15)
|
Incorporated by reference to STAG Industrial, Inc.'s Current Report on Form 8-K filed with the SEC on May 16, 2014.
|
|
(16)
|
Incorporated by reference to STAG Industrial, Inc.'s Quarterly Report on Form 10-Q filed with the SEC on October 31, 2014.
|
|
(17)
|
Incorporated by reference to STAG Industrial, Inc.'s Registration Statement on Form S-11/A (File No. 333-168368) filed with the SEC on February 16, 2011.
|
|
(18)
|
Incorporated by reference to STAG Industrial, Inc.'s Annual Report on Form 10-K filed with the SEC on February 26, 2014.
|
|
(19)
|
Incorporated by reference to STAG Industrial, Inc.'s Current Report on Form 8-K filed with the SEC on December 19, 2014.
|
|
(20)
|
Incorporated by reference to STAG Industrial, Inc.'s Current Report on Form 8-K filed with the SEC on October 1, 2015.
|
|
(21)
|
Incorporated by reference to STAG Industrial, Inc.'s Current Report on Form 8-K filed with the SEC on December 27, 2016.
|
|
(22)
|
Incorporated by reference to STAG Industrial, Inc.'s Current Report on Form 8-K filed with the SEC on April 22, 2014.
|
|
(23)
|
Incorporated by reference to STAG Industrial, Inc.'s Current Report on Form 8-K filed with the SEC on December 4, 2015.
|
TABLE OF CONTENTS