|
|
|
|
|
|
|
|
|
|
|
|
|
|
|
|
|
|
|
|
|
|
|
|
|
|
|
|
|
|
|
|
|
|
|
|
|
|
|
|
|
|
|
|
|
|
|
|
|
|
|
|
|
|
|
|
Table of Contents
UNITED STATES
SECURITIES AND EXCHANGE COMMISSION
Washington, D.C. 20549
Form 10-K
x ANNUAL REPORT PURSUANT TO SECTION 13 OR 15(D) OF THE SECURITIES EXCHANGE ACT OF 1934.
For the fiscal year ended December 31, 2011
or
¨ TRANSITION REPORT PURSUANT TO SECTION 13 OR 15(D) OF THE SECURITIES EXCHANGE ACT OF 1934.
For the transition period from to
Commission file number 0-12508
S&T BANCORP, INC.
(Exact name of registrant as specified in its charter)
| Pennsylvania | 25-1434426 | |
| (State or other jurisdiction of incorporation of organization) | (I.R.S. Employer Identification No.) | |
| 800 Philadelphia Street, Indiana, PA | 15701 | |
| (Address of principal executive offices) | (Zip Code) | |
Registrant’s telephone number, including area code (800) 325-2265
Securities registered pursuant to Section 12(b) of the Act:
| Title of each class | Name of each exchange on which registered | |
| Common Stock, par value $2.50 per share |
The NASDAQ Stock Market LLC
(NASDAQ Global Select Market) |
Securities registered pursuant to Section 12(g) of the Act: None
(Title of class)
Indicate by check mark if the registrant is a well-known seasoned issuer, as defined in Rule 405 of the Securities Act.
Yes ¨ No x
Indicate by check mark if the registrant is not required to file reports pursuant to Section 13 or Section 15(d) of the Act.
Yes ¨ No x
Indicate by check mark whether the registrant (1) has filed all reports required to be filed by Section 13 or 15(d) of the Securities Exchange Act of 1934 during the preceding 12 months (or for such shorter period that the registrant was required to file such reports) and (2) has been subject to such filing requirements for the past 90 days.
Yes x No ¨
Indicate by check mark if disclosure of delinquent filers pursuant to Item 405 of Regulation S-K (229.405 of this chapter) is not contained herein and will not be contained, to the best of registrant’s knowledge, in definitive proxy or information statements incorporated by reference in Part III of this form 10-K or any amendment to this form 10-K. ¨
Indicate by check mark whether the registrant has submitted electronically and posted on its corporate Web site, if any, every Interactive Data File required to be submitted and posted pursuant to Rule 405 of Regulation S-T (§ 232.405 of this chapter) during the preceding 12 months (or for such shorter period that the registrant was required to submit and post such files).
Yes x No ¨
Indicate by check mark whether the registrant is a large accelerated filer, an accelerated filer, a non-accelerated filer, or smaller reporting company. See the definitions of “large accelerated filer,” “accelerated filer” and “smaller reporting company” in Rule 12b-2 of the Exchange Act.
| Large accelerated filer ¨ | Accelerated filer x | |
| Non-accelerated filer ¨ (Do not check if a smaller reporting company) | Smaller reporting company ¨ |
Indicate by check mark whether the registrant is a shell company (as defined in Rule 12b-2 of the Act).
Yes ¨ No x
The aggregate estimated fair value of the voting and non-voting common equity held by non-affiliates of the registrant as of June 30, 2011:
Common Stock, $2.50 par value – $505,369,206
The number of shares outstanding of the issuer’s classes of common stock as of January 31, 2012:
Common Stock, $2.50 par value – 28,133,371 shares
DOCUMENTS INCORPORATED BY REFERENCE
Portions of the proxy statement to be filed with the Securities and Exchange Commission for the annual shareholders meeting to be held April 23, 2012 are incorporated by reference into Part III.
Table of Contents
PAGE 2
Table of Contents
General
S&T Bancorp, Inc., or S&T, references to “we”, “us” or “our” refers to S&T, including on a consolidated basis with our subsidiaries where appropriate, was incorporated on March 17, 1983 under the laws of the Commonwealth of Pennsylvania as a bank holding company and has three wholly owned subsidiaries, S&T Bank, 9th Street Holdings, Inc. and STBA Capital Trust I. We also own a one-half interest in Commonwealth Trust Credit Life Insurance Company, or CTCLIC. We are registered as a financial holding company with the Board of Governors of the Federal Reserve System, or the Federal Reserve Board under the Bank Holding Company Act of 1956, as amended, or the BHCA. As of December 31, 2011, we had approximately $4.1 billion in assets, $3.1 billion in loans, $3.3 billion in deposits and $490.5 million in shareholder’s equity.
S&T Bank is a full service bank with its Main Office at 800 Philadelphia Street, Indiana, Pennsylvania, providing services to its customers through offices located in Allegheny, Armstrong, Blair, Butler, Cambria, Clarion, Clearfield, Indiana, Jefferson and Westmoreland counties of Pennsylvania. S&T Bank deposits are insured by the Federal Deposit Insurance Corporation, or FDIC, to the maximum extent provided by law.
S&T Bank has four wholly owned subsidiaries: S&T Insurance Group, LLC, S&T Professional Resources Group, LLC, S&T Bancholdings, Inc. and Stewart Capital Advisors, LLC. S&T Insurance Group, LLC, through its subsidiaries, offers a variety of insurance products. S&T Professional Resources Group, LLC markets software developed by S&T Bank. S&T Bancholdings, Inc. is an investment company. Stewart Capital Advisors, LLC, is a registered investment advisor that manages private investment accounts for individuals and institutions and advises the Stewart Capital Mid Cap Fund.
We operate three reportable operating segments including Community Banking, Wealth Management and Insurance. Our Community Banking segment offers services which include accepting time and demand deposit accounts, originating commercial and consumer loans, and providing letters of credit and credit card services. We believe that we have a relatively stable deposit base and no material amount of deposits is obtained from a single depositor or group of depositors (including federal, state and local governments). Our core deposit base remained strong in 2011.
The Wealth Management segment offers discount brokerage services, services as executor and trustee under wills and deeds, guardian and custodian of employee benefits and other trust and brokerage services, as well as a registered investment advisor that manages private investment accounts for individuals and institutions. Total Wealth Management assets under management and administration were approximately $1.5 billion at December 31, 2011.
The Insurance segment includes a full-service insurance agency offering commercial property and casualty insurance, group life and health coverage, employee benefit solutions and personal insurance lines.
Recent Developments
On September 14, 2011, we announced the signing of a definitive merger agreement to acquire Mainline Bancorp, Inc., or Mainline, a bank holding company based in Ebensburg, Pennsylvania. Mainline, with approximately $236 million in assets, maintains eight offices in Cambria and Blair counties in Pennsylvania. The transaction, valued at approximately $21 million, is expected to be completed in the first quarter of 2012 pending the approval of the shareholders of Mainline and satisfaction of other customary closing conditions.
On December 7, 2011, we announced that we redeemed all of the preferred stock that we sold to the U.S. Department of the Treasury in January of 2009 as part of the Capital Purchase Program, or the CPP. The redemption of the preferred stock was approved without any conditions from regulators.
PAGE 3
Table of Contents
Item 1. BUSINESS — continued
We used available cash to fund the repurchase of the outstanding preferred stock for $108.7 million and the payment of the final dividend of $0.3 million. Refer to “Capital Purchase Program” later in this section for further information.
Employees
As of December 31, 2011, we had 909 full-time equivalent employees.
Access to United States Securities and Exchange Commission Filings
All of our reports filed electronically with the United States Securities and Exchange Commission, or the SEC, including this Annual Report on Form 10-K for the fiscal year ended December 31, 2011, or the Report, our prior annual reports on Form 10-K, quarterly reports on Form 10-Q, current reports on Form 8-K and our annual proxy statements, as well as any amendments to those reports are accessible at no cost on our website at www.stbancorp.com under Financial Information, SEC Filings. These filings are also accessible on the SEC’s website at www.sec.gov. You may read and copy any material we file with the SEC at the SEC’s Public Reference Room at 100 F Street, NE, Washington, D.C. 20549. You may obtain information on the operation of the Public Reference Room by calling the SEC at 1-800-SEC-0330. Our charters of the Audit Committee, the Compensation and Benefits Committee, the Nominating and Corporate Governance Committee, the Wealth Management Oversight Committee, Complaints Regarding Accounting Internal Accounting Controls or Auditing Matters, or the Whistleblower Policy, the Code of Conduct for the CEO and CFO, the General Code of Conduct, the Shareholder Communications Policy, and S&T Excessive and Luxury Expenditure Policy are also available at www.stbancorp.com under Corporate Governance.
Supervision and Regulation
General
S&T and S&T Bank are each extensively regulated under federal and state law. The following describes certain aspects of that regulation and does not purport to be a complete description of all regulations that affect S&T and S&T Bank or all aspects of those regulations.
To the extent statutory or regulatory provisions are described, the description is qualified in its entirety by reference to the particular statutory or regulatory provisions. Proposals to change the laws and regulations governing the banking industry are frequently raised in Congress, in state legislatures and before the various bank regulatory agencies. The likelihood and timing of any changes and the impact such changes might have on S&T or S&T Bank is impossible to determine with any certainty.
Any change in applicable laws or regulations, or in the way such laws or regulations are interpreted by regulatory agencies or courts, may have a material impact on our business, operations and earnings.
S&T
We are a bank holding company subject to regulation under the BHCA and the examination and reporting requirements of the Federal Reserve Board. Under the BHCA, a bank holding company may not directly or indirectly acquire ownership or control of more than five percent of the voting shares or substantially all of the assets of any additional bank, or merge or consolidate with another bank holding company, without the prior approval of the Federal Reserve Board. We have received approval from the Federal Reserve Board for a passive ownership position in Allegheny Valley Bancorp, Inc. (14.5 percent).
As a bank holding company, we are expected under statutory and regulatory provisions to serve as a source of financial and managerial strength to our subsidiary bank. A bank holding company is also expected to commit resources, including capital and other funds, to support its subsidiary bank.
PAGE 4
Table of Contents
Item 1. BUSINESS — continued
We elected to become a financial holding company under the BHCA in 2001 and thereby engage in a broader range of financial and other activities than are permissible for traditional bank holding companies. In order to qualify and maintain our status as a financial holding company, the depository institutions controlled by us must remain “well-capitalized,” “well-managed” (as defined in federal law) and have at least a “satisfactory” Community Reinvestment Act, or CRA rating. Refer to Item 8, Note 21 Regulatory Matters, of this Report for information concerning the current capital ratios of S&T and S&T Bank. No prior regulatory approval is required for a financial holding company to acquire a company, other than a bank or savings association, engaged in activities that are financial in nature or incidental to activities that are financial in nature, as determined by the Federal Reserve Board. The BHCA identifies several activities as “financial in nature” including, among others, securities underwriting, dealing and market making; sponsoring mutual funds and investment companies; insurance underwriting and sales agency; investment advisory activities; merchant banking activities; and activities that the Federal Reserve Board has determined to be closely related to banking or a proper incident thereto. Banks may also engage, subject to limitations on investment, in activities that are financial in nature, other than insurance underwriting, insurance company portfolio investment, real estate development and real estate investment, through a financial subsidiary of the bank, if the bank is “well-capitalized,” “well-managed” and has at least a “satisfactory” CRA rating. On July 21, 2010, the President signed the Dodd-Frank Wall Street Reform and Consumer Protection Act, or the Dodd-Frank Act into law, which required that we also remain “well-capitalized” and “well-managed” in order to maintain our status as a financial holding company as of July 21, 2011, which is the Designated Transfer Date. Additionally, the Dodd-Frank Act requires a financial holding company to obtain prior regulatory approval to acquire any company with consolidated assets that exceed $10.0 billion.
If S&T and S&T Bank cease to be “well-capitalized” or “well-managed,” we will not be in compliance with the requirements of the BHCA regarding financial holding companies. If a financial holding company is notified by the Federal Reserve Board of such a change in the ratings of any of its subsidiary banks, it must take certain corrective actions within specified time frames. Furthermore, if S&T Bank were to receive a CRA rating of less than “satisfactory,” then we would be prohibited from engaging in new activities or acquiring companies until the rating is raised to “satisfactory” or better.
We are presently engaged in nonbanking activities through the following six entities:
| • |
9th Street Holdings, Inc. was formed in June 1988 to hold and manage a group of investments previously owned by S&T Bank and to give us additional latitude to purchase other investments. |
| • |
S&T Bancholdings, Inc. was formed in August 2002 to hold and manage a group of investments previously owned by S&T Bank and to give us additional latitude to purchase other investments. |
| • |
CTCLIC is a joint venture with another financial institution, acting as a reinsurer of credit life, accident and health insurance policies sold by S&T Bank and the other institution. |
| • |
S&T Insurance Group, LLC distributes life insurance and long-term disability income insurance products. During 2001, S&T Insurance Group, LLC and Attorneys Abstract Company, Inc. entered into an agreement to form S&T Settlement Services, LLC or STSS, with respective ownership interests of 55 percent and 45 percent. STSS is a title insurance agency servicing commercial customers. During 2002, S&T Insurance Group, LLC expanded into the property and casualty insurance business with the acquisition of S&T-Evergreen Insurance LLC. |
| • |
S&T Professional Resources Group LLC markets software developed by S&T Bank. |
| • |
Stewart Capital Advisors, LLC was formed in August 2005 and is a registered investment advisor that manages private investment accounts for individuals and institutions and advises the Stewart Capital Mid Cap Fund. |
PAGE 5
Table of Contents
Item 1. BUSINESS — continued
S&T Bank
As a state-chartered, commercial bank, the deposits of S&T Bank are insured by the FDIC, S&T Bank is subject to the supervision and regulation of the Pennsylvania Department of Banking, or PADB and the FDIC. We are also subject to various requirements and restrictions under federal and state law, including requirements to maintain reserves against deposits, restrictions on the types, amount and terms and conditions of loans that may be granted and limits on the type of other activities in which S&T Bank may engage and the investments it may make.
In addition, S&T Bank is subject to affiliate transaction rules in Sections 23A and 23B of the Federal Reserve Act that limit the amount of transactions between itself and S&T or S&T’s nonbank subsidiaries. Under these provisions, transactions between a bank and its parent company or any single nonbank affiliate generally are limited to 10 percent of the bank subsidiary’s capital and surplus, and with respect to all transactions with affiliates, are limited to 20 percent of the bank subsidiary’s capital and surplus. Further, loans and extensions of credit from a bank to an affiliate generally are required to be secured by eligible collateral in specified amounts. The Dodd-Frank Act expands the affiliate transaction rules to broaden the definition of affiliate and to apply to securities lending, repurchase agreement and derivatives activities that we may have with an affiliate, as well as to strengthen collateral requirements and limit Federal Reserve exemptive authority. Also, the definition of “extension of credit” for transactions with executive officers, directors and principal shareholders is being expanded to include credit exposure arising from a derivative transaction, a repurchase or reverse repurchase agreement and a securities lending or borrowing transaction. These expansions will be effective one year after the Designated Transfer Date, July 21, 2012. At this time, we do not anticipate that these provisions will have a material effect on S&T or S&T Bank.
Insurance of Accounts; Depositor Preference
The deposits of S&T Bank are insured up to applicable limits per insured depositor by the FDIC. The Dodd-Frank Act codified FDIC deposit insurance coverage per separately insured depositor for all account types at $250,000. The Dodd-Frank Act also maintains federal deposit insurance coverage for noninterest-bearing transaction accounts at an unlimited amount from December 31, 2010 until December 31, 2012. Interest on Lawyer Trust Accounts will be considered “noninterest-bearing transaction accounts” for purposes of temporary unlimited deposit insurance coverage.
As an FDIC-insured bank, S&T Bank is also subject to FDIC insurance assessments, which are imposed based upon the risk the institution poses to the Deposit Insurance Fund, or DIF. Under this assessment system, risk is defined and measured using an institution’s supervisory ratings with other risk measures, including financial ratios. The annual total base assessment rates for institutions in 2011 ranged from 2.5 basis points for “well-capitalized,” “well-managed” banks, with the highest ratings, to 45 basis points for institutions posing the most risk to the DIF. The FDIC may raise or lower these assessment rates on a quarterly basis based on various factors to achieve a reserve ratio, which the Dodd-Frank Act has mandated to be no less than 1.35 percent of insured deposits.
Due to recent bank failures and contingent loss reserves established by the FDIC against potential future bank failures, the reserve ratio is currently significantly below its target balance. Thus, on November 12, 2009, the FDIC Board of Directors adopted a final rule that required insured depository institutions to prepay, on December 30, 2009, their estimated quarterly risk-based assessments for the fourth quarter of 2009 and for all of 2010, 2011 and 2012, along with their quarterly risk-based assessment for the third quarter of 2009. The continued decline in the DIF balance may convince the FDIC to impose additional special emergency assessments in the future, which could have an impact on S&T Bank’s earnings and capital levels. The prepayment for our quarterly assessments amounted to $21.1 million and will be recognized as expense over a three year period. As of December 31, 2011, $11.6 million remains prepaid for quarterly FDIC assessments.
PAGE 6
Table of Contents
Item 1. BUSINESS — continued
On October 19, 2010, the Board of Directors of the FDIC adopted a new Restoration Plan to ensure that the DIF reserve ratio reaches 1.35 percent by September 30, 2020, as required by the Federal Deposit Insurance Reform Act of 2005, or the Reform Act. Among other things, the Restoration Plan provided that the FDIC would forego the uniform three basis point increase in initial assessment rates that was previously scheduled to take effect on January 1, 2011 and would maintain the current assessment rate schedule for all insured depository institutions until the reserve ratio reaches 1.15 percent. In February 2011, the FDIC Board of Directors adopted a final rule, Deposit Insurance Assessment Base, Assessment Rate Adjustments, Dividends, Assessment Rates and Large Bank Pricing Methodology, to redefine the deposit insurance assessment base as required by the Dodd-Frank Act, alter assessment rates, implement the Dodd-Frank Act’s DIF dividend provisions and revise the risk-based assessment system for all large insured depository institutions (those with at least $10.0 billion in total assets). Many of the changes were made as a result of provisions of the Dodd-Frank Act that were intended to shift more of the cost of raising the reserve ratio from institutions with less than $10.0 billion in assets (such as S&T Bank) to the larger banks. Except for the future assessment rate schedules, all changes went into effect April 1, 2011 and did not have a material effect upon our consolidated operating results. In addition to DIF assessments, the FDIC assesses all insured deposits a special assessment to fund the repayment of debt obligations of the Financing Corporation, or FICO. FICO is a government-sponsored entity that was formed to borrow the money necessary to carry out the closing and ultimate disposition of failed thrift institutions by the Resolution Trust Corporation in the 1990s. As of January 1, 2012, the annualized rate established by the FDIC for the FICO assessment was 0.66 basis points per $100 of insured deposits.
Under federal law, deposits and certain claims for administrative expenses and employee compensation against insured depository institutions are afforded a priority over other general unsecured claims against such an institution, including federal funds and letters of credit, in the liquidation or other resolution of such an institution by a receiver. Such priority creditors would include the FDIC.
Capital
The Federal Reserve Board and FDIC have issued substantially similar risk-based and leverage capital guidelines applicable to banking organizations they supervise. Under current capital guidelines, both S&T and S&T Bank are required to maintain certain capital standards based on ratios of capital to assets and capital to risk weighted assets. The guidelines define a bank’s total qualifying capital as having two components. Tier 1 capital, which must be at least 50 percent of total qualifying capital, is mainly comprised of common equity, retained earnings and qualifying preferred stock, less certain intangibles. Tier 2 capital may include the allowance for loan losses, or ALL, model loss up to a maximum of 1.25 percent of risk weighted assets, qualifying subordinated debt, qualifying preferred stock, hybrid capital instruments and up to 45 percent of net unrealized gains on available-for-sale equity securities. The guideline also defines the weights assigned to assets and off-balance sheet items to determine the risk weighted asset component of the risk-based capital ratios.
The Federal Reserve Board and FDIC have established minimum and well-capitalized standards for banks. The minimum capital standards are defined as a Tier 1 ratio of at least 4.00 percent, a Total capital ratio of at least 8.00 percent and a Leverage ratio of at least 3.00 percent. The Leverage ratio of 3.00 percent is for those bank and bank holding companies that meet certain specified criteria, including having received the highest regulatory rating and are not experiencing significant growth or expansion. All other banks and bank holding companies generally are required to maintain a leverage ratio of at least 100 to 200 basis points above the stated minimum. S&T and S&T Bank maintain capital levels to meet the well-capitalized regulatory standards, which are defined as a Tier 1 ratio of at least 6.00 percent, Total capital ratio of at least 10.00 percent and a Leverage ratio of at least 5.00 percent. At December 31, 2011 S&T’s Tier 1 capital, Total capital and Leverage ratios were 11.63
PAGE 7
Table of Contents
Item 1. BUSINESS — continued
percent, 15.20 percent and 9.17 percent, respectively. At December 31, 2011 S&T Bank’s Tier 1, Total capital and Leverage ratios were 10.55 percent, 14.11 percent, and 8.30 percent, respectively.
Both the Federal Reserve Board and the FDIC’s risk-based capital standards explicitly identify concentrations of credit risk and the risk arising from non-traditional activities, as well as an institution’s ability to manage these risks, as important factors to be taken into account by the agency in assessing an institution’s overall capital adequacy. The capital guidelines also provide that an institution’s exposure to a decline in the economic value of its capital due to changes in interest rates be considered by the agency as a factor in evaluating a bank’s capital adequacy. The Federal Reserve Board has also issued additional capital guidelines for certain bank holding companies that engage in trading activities. We do not believe that consideration of these additional factors will affect the regulators’ assessment of S&T or S&T Bank’s capital position. The Dodd-Frank Act contains a number of provisions intended to strengthen capital, including requiring minimum leverage and risk-based capital that are at least as stringent as those currently in effect. The regulations implementing these rules were finalized by the FDIC in June, 2011. Most of the finalized rules pertain to those institutions with more than $50 billion in assets. Also, upon the Designated Transfer Date, the Dodd-Frank Act requires the Federal Reserve Board to implement capital regulations that are countercyclical so that the amount of capital required to be maintained by us would increase in times of economic expansion and decrease in times of economic contraction, consistent with the safety and soundness of the company. Comments on the Federal Reserve Board’s proposal are due by March, 2012. In addition to the Dodd-Frank Act, the international oversight body of the Basel Committee on Banking Supervision, or Basel III, reached agreements in July, 2010 to increase the minimum common equity capital requirement for banks from 2.00 percent to 4.00 percent, along with a capital conservation buffer of 2.50 percent to bring total common equity capital requirements to 7.00 percent. The Basel III requirements will be phased in beginning January 1, 2013. Federal regulators periodically propose amendments to the risk-based capital guidelines and the related regulatory framework and consider changes to the capital standards that could significantly increase the amount of capital needed to meet applicable standards. The timing of adoption, ultimate form and effect of any such proposed amendments cannot be predicted.
Capital Purchase Program
On December 7, 2011, we redeemed all of the preferred stock that we sold to the federal government as part of the CPP. As a participant in the CPP, we completed the $108.7 million capital raise on January 16, 2009.
In connection with the issuance of the preferred stock to the U.S. Treasury in 2009, we also issued the U.S. Treasury a warrant to purchase 517,012 shares of our common stock at an initial per share exercise price of $31.53, with an estimated fair value of $4.0 million on the date of issuance. The warrant remains outstanding as of the date of the filing of this Annual Report on Form 10-K. The warrant provides for the adjustment of the exercise price and the number of shares of our common stock issuable upon exercise pursuant to customary anti-dilution provisions. The U.S. Treasury agreed not to exercise voting power with respect to any shares of common stock issued upon exercise of the warrant. We did not repurchase the warrant concurrently with the redemption of the preferred stock. Unless we repurchase the warrant, it will remain outstanding and will expire 10 years from the issuance date.
Under changes made to the CPP by the American Recovery and Reinvestment Act of 2009, we were able to redeem the Series A Preferred Stock, plus any accrued and unpaid dividends, at any time, subject to approval by banking regulatory agencies. The redemption of the preferred stock eliminates certain restrictions imposed on us by our participation in the CPP, including limitations on executive compensation and certain increases to our dividend payments. We used available cash to fund the repurchase of the preferred stock of $108.7 million and payment of the final dividend of $0.3 million.
PAGE 8
Table of Contents
Item 1. BUSINESS — continued
Payment of Dividends
S&T is a legal entity separate and distinct from its banking and other subsidiaries. A substantial portion of our revenues consist of dividend payments we receive from S&T Bank. S&T Bank, in turn, is subject to state laws and regulations that limit the amount of dividends it can pay to S&T. In addition, both S&T and S&T Bank are subject to various general regulatory policies relating to the payment of dividends, including requirements to maintain adequate capital above regulatory minimums. The Federal Reserve Board has indicated that banking organizations should generally pay dividends only if (i) the organization’s net income available to common shareholders over the past year has been sufficient to fully fund the dividends and (ii) the prospective rate of earnings retention appears consistent with the organization’s capital needs, asset quality and overall financial condition. Thus, under certain circumstances based upon our financial condition, our ability to declare and pay quarterly dividends may require consultation with the Federal Reserve Board and may be prohibited by applicable Federal Reserve Board regulations. If we were to pay a dividend in contravention of Federal Reserve regulations, the Federal Reserve could raise supervisory concerns. During the year ended December 31, 2011, S&T Bank paid $16.8 million in cash dividends to us for dividends paid to common shareholders.
Other Safety and Soundness Regulations
There are a number of obligations and restrictions imposed on bank holding companies such as us and our depository institution subsidiary by federal law and regulatory policy. These obligations and restrictions are designed to reduce potential loss exposure to the depositors of such depository institutions and to the FDIC insurance fund in the event the depository institution becomes in danger of default or is in default. Under current federal law for example, the federal banking agencies possess broad powers to take prompt corrective action to resolve problems of insured depository institutions. The extent of these powers depends upon whether the institution in question is “well-capitalized,” “adequately capitalized,” “undercapitalized,” “significantly undercapitalized” or “critically undercapitalized,” as defined by the law. Under regulations established by the federal banking agencies, a “well-capitalized” institution must have a Tier 1 capital ratio of at least 6.00 percent, a Total capital ratio of at least 10.00 percent and a leverage ratio of at least 5.00 percent and must not be subject to a capital directive or order. An “adequately capitalized” institution must have a Tier 1 capital ratio of at least 4.00 percent, a Total capital ratio of at least 8.00 percent and a leverage ratio of at least 4.00 percent. The most highly-rated financial institutions minimum requirement for the leverage ratio is 3.00 percent. As of December 31, 2011, S&T and S&T Bank were classified as “well-capitalized.” The classification of depository institutions is primarily for the purpose of applying the federal banking agencies’ prompt corrective action provisions and is not intended to be and should not be interpreted as a representation of overall financial condition or prospects of any financial institution.
The federal banking agencies’ prompt corrective action powers (which increase depending upon the degree to which an institution is undercapitalized) can include, among other things, requiring an insured depository institution to adopt a capital restoration plan which cannot be approved unless guaranteed by the institution’s parent company; placing limits on asset growth and restrictions on activities, including restrictions on transactions with affiliates; restricting the interest rates the institution may pay on deposits; prohibiting the payment of principal or interest on subordinated debt; prohibiting the holding company from making capital distributions without prior regulatory approval; and, ultimately, appointing a receiver for the institution. For example, only a “well-capitalized” depository institution may accept brokered deposits without prior regulatory approval.
The federal banking agencies have also adopted guidelines prescribing safety and soundness standards relating to internal controls and information systems, internal audit systems, loan documentation, credit underwriting, interest rate exposure, asset growth and compensation, fees and benefits. In general, the guidelines require appropriate systems and practices to identify and manage
PAGE 9
Table of Contents
Item 1. BUSINESS — continued
specified risks and exposures. The guidelines prohibit excessive compensation as an unsafe and unsound practice and characterize compensation as excessive when the amounts paid are unreasonable or disproportionate to the services performed by an executive officer, employee, director or principal shareholder. In addition, the agencies have adopted regulations that authorize, but do not require an agency to order an institution that has been given notice by an agency that it is not in compliance with any of such safety and soundness standards to submit a compliance plan. If, after being so notified, an institution fails to submit an acceptable compliance plan, the agency must issue an order directing action to correct the deficiency and may issue an order directing other actions of the types to which an “undercapitalized” institution is subject under the prompt corrective action provisions described above.
Regulatory Enforcement Authority
The enforcement powers available to federal banking agencies are substantial and include, among other things and in addition to, other powers described herein, the ability to assess civil money penalties, to issue cease-and-desist or removal orders and to initiate injunctive actions against banks and bank holding companies and “institution affiliated parties,” as defined in the Federal Deposit Insurance Act, or FDIA. In general, these enforcement actions may be initiated for violations of laws and regulations, as well as engagement in unsafe or unsound practices. Other actions or inactions may provide the basis for enforcement action, including misleading or untimely reports filed with regulatory authorities.
At the state level, the PADB also has broad enforcement powers over S&T Bank, including the power to impose fines and other civil and criminal penalties and to appoint a conservator or receiver.
Interstate Banking and Branching
The BHCA currently permits bank holding companies from any state to acquire banks and bank holding companies located in any other state, subject to certain conditions, including certain nationwide and state-imposed deposit concentration limits. In addition, because of changes to law made by the Dodd-Frank Act, S&T Bank may now establish de novo interstate branches in any state to the same extent that a bank chartered in that state could establish a branch.
Community Reinvestment and Consumer Protection Laws
In connection with its lending activities, S&T Bank is subject to a number of federal laws designed to protect borrowers and promote lending to various sectors of the economy and population. These include, among other laws, the Equal Credit Opportunity Act, the Truth-in-Lending Act, the Home Mortgage Disclosure Act, the Real Estate Settlement Procedures Act, the Fair Credit Reporting Act and the CRA. In addition, rules developed by the federal banking agencies pursuant to federal law require disclosure of privacy policies to consumers and in some circumstances, allow consumers to prevent the disclosure of certain personal information to nonaffiliated third parties.
The CRA requires the appropriate federal banking agency, in connection with its examination of a bank, to assess the bank’s record in meeting the credit needs of the communities served by the bank, including low and moderate-income neighborhoods. Furthermore, such assessment also is required of any bank that has applied, among other things, to merge or consolidate with or acquire the assets or assume the liabilities of an insured depository institution, or to open or relocate a branch office. In the case of a bank holding company (including a financial holding company) applying for approval to acquire a bank or bank holding company, the Federal Reserve Board will assess the record of each subsidiary bank of the applicant bank holding company in considering the application. Under the CRA, institutions are assigned a rating of “outstanding,” “satisfactory,” “needs to improve” or “unsatisfactory.” S&T Bank was rated “satisfactory” in its most recent CRA evaluation.
PAGE 10
Table of Contents
Item 1. BUSINESS — continued
Anti-Money Laundering Rules
S&T Bank is subject to the Bank Secrecy Act, its implementing regulations and other anti-money laundering laws and regulations, including the USA Patriot Act of 2001. Among other things, these laws and regulations require S&T Bank to take steps to prevent the use of S&T Bank to facilitate the flow of illegal or illicit money, to report large currency transactions and to file suspicious activity reports. S&T Bank is also required to develop and implement a comprehensive anti-money laundering compliance program. Banks must also have in place appropriate “know your customer” policies and procedures. Violations of these requirements can result in substantial civil and criminal sanctions. In addition, provisions of the USA Patriot Act of 2001 require the federal financial institution regulatory agencies to consider the effectiveness of a financial institution’s anti-money laundering activities when reviewing bank mergers and bank holding company acquisitions.
Government Actions and Legislation
The Dodd-Frank Act will significantly change the current bank regulatory structure and affect the lending, deposit, investment, trading and operating activities of financial institutions and their holding companies, including S&T and S&T Bank. The Dodd-Frank Act contains a number of provisions intended to strengthen capital. Refer to Capital within Item 1 for additional information. For example, the federal banking agencies are directed to establish minimum leverage and risk-based capital that are at least as stringent as those currently in effect.
The Dodd-Frank Act requires various federal agencies to adopt a broad range of new rules and regulations, and to prepare numerous studies and reports for Congress. The federal agencies are given significant discretion in drafting the implementing rules and regulations, and consequently, many of the details and much of the impact of the Act may not be known for many months or years. The Dodd-Frank Act also contains provisions that expand the insurance assessment base and increase the scope of deposit insurance coverage.
Among other provisions, the SEC has enacted rules, required by the Dodd-Frank Act, giving stockholders a non-binding vote on executive compensation and so-called “golden parachute” payments. The Dodd-Frank Act also authorizes the SEC to promulgate rules that would allow stockholders to nominate their own candidates for election as directors using a company’s proxy materials. The legislation also directs the federal financial institution regulatory agencies to promulgate rules prohibiting excessive compensation being paid to financial institution executives.
The Dodd-Frank Act also created the Consumer Financial Protection Bureau, or CFPB that took over responsibility on July 21, 2011 of the principal federal consumer protection laws, such as the Truth in Lending Act, the Equal Credit Opportunity Act, the Real Estate Settlement Procedures Act and the Truth in Saving Act, among others. Institutions that have assets of $10.0 billion or less, such as S&T, will continue to be supervised in this area by their state and primary federal regulators (in the case of S&T Bank, the FDIC). The Act also gives the CFPB expanded data collection powers for fair lending purposes for both small business and mortgage loans, as well as expanded authority to prevent unfair, deceptive and abusive practices. The consumer complaint function also will be consolidated into the CFPB. The CFPB established an Office for Community Banks and Credit Unions, with a mission to ensure that the CFPB incorporates the perspectives of small depository institutions into the policy-making process, communicate relevant policy initiatives to community banks and credit unions and work with community banks and credit unions to identify potential areas for regulatory simplification. In addition, the Dodd-Frank Act required the Federal Reserve Board to adopt a rule addressing interchange fees applicable to debit card transactions. This rule, Regulation II, effective October 1, 2011, does not apply to banks with less than $10.0 billion in assets. Since the rule has been in effect for only three months as of the date of this report, it is not yet known if the rule may have the practical effect of reducing fees that smaller banks (like S&T Bank) may charge.
PAGE 11
Table of Contents
Item 1. BUSINESS — continued
There have been delays in the rulemaking processes of the various federal agencies responsible for enacting the provisions of the Dodd-Frank Act. As of December 31, 2011, less than 22 percent of the rulemaking requirements have been finalized, with only another 38.8 percent proposed. Not all of the Dodd-Frank Act provisions remaining to be finalized apply to banks the size of S&T Bank and, as a result, we cannot predict the ultimate impact of the Act on S&T or S&T Bank at this time, including the extent to which it could increase costs or limit our ability to pursue business opportunities in an efficient manner, or otherwise adversely affect our business, financial condition and results of operations. Nor can we predict the impact or substance of other future legislation or regulation. However, it is expected that they, at a minimum, will increase our operating and compliance costs.
Federal and state regulatory agencies consistently propose and adopt changes to their regulations or change the manner in which existing regulations are applied. We cannot predict the substance or impact of pending or future legislation or regulation, or the application thereof, although enactment of the proposed legislation could affect how S&T and S&T Bank operate and could significantly increase costs, impede the efficiency of internal business processes, or limit our ability to pursue business opportunities in an efficient manner, any of which could materially and adversely affect our business, financial condition and results of operations.
Competition
S&T Bank competes with other local, regional and national financial service providers, such as other financial holding companies, commercial banks, savings associations, credit unions, finance companies and brokerage and insurance firms. Some of our competitors are not subject to the same level of regulation and oversight that is required of banks and bank holding companies, and are thus able to operate under lower cost structures.
Changes in bank regulation, such as changes in the products and services banks can offer and involvement in non-banking activities by bank holding companies, as well as bank mergers and acquisitions, can affect our ability to compete successfully. Legislation and regulations have also expanded the activities in which depository institutions may engage. Our ability to compete successfully will depend upon how successfully we can respond to the evolving competitive, regulatory, technological and demographic developments affecting our operations.
We face significant competition in both originating loans and attracting deposits. The western Pennsylvania area has a high density of financial institutions, some of which are significantly larger institutions with greater financial resources than us, and many of which are our competitors to varying degrees. Our competition for loans comes principally from commercial banks, savings associations, mortgage banking companies, credit unions, brokerage and insurance companies and other financial service companies. Our most direct competition for deposits has historically come from commercial banks, savings banks and credit unions. We face additional competition for deposits from non-depository competitors such as the mutual fund industry, securities and brokerage firms and insurance companies. Because larger competitors have advantages in attracting business from larger corporations, we do not generally compete for that business. Instead, we concentrate our efforts on attracting the business of individuals and small and medium-size businesses. We generally compete on the basis of customer service and responsiveness to customer needs, the convenience of banking offices and hours, and the availability and pricing of our products and services. We emphasize personalized banking and the advantage of local decision-making in our banking business and this strategy appears to have been well received in our market area.
The financial service industry is likely to become more competitive as further technological advances enable more companies to provide financial services on a more efficient and convenient basis. Technological innovations have lowered traditional barriers of entry and enabled many of these companies to compete in financial services markets. Many customers now expect a choice of banking options for the delivery of services, including traditional banking offices, telephone, mail, internet,
PAGE 12
Table of Contents
mobile banking, ATMs, self-service branches, and/or in-store branches. These products are offered by traditional banks and savings associations, as well as credit unions, brokerage firms, asset management groups, finance and insurance companies, internet-based companies, and mortgage banking firms. We believe that our current market area, consisting primarily of western Pennsylvania, provides long-term opportunity for growth in deposits and commercial lending. Commercial and residential real estate values in our market appear to have stabilized. The national and local economies still remain fragile with high unemployment rates. Business conditions remain subdued and that uncertainty is serving to limit both consumer and corporate spending in our area.
Investments in our common stock involve risk. The following discussion highlights the risks that we believe are material to our company, but does not necessarily include all risks that we may face.
The market price of our common stock may fluctuate significantly in response to a number of factors.
Our quarterly and annual operating results have varied significantly in the past and could vary significantly in the future, which makes it difficult for us to predict our future operating results. Our operating results may fluctuate due to a variety of factors, many of which are outside of our control, including the changing and recently volatile U.S. economic environment and changes in the commercial and residential real estate market, any of which may cause our stock price to fluctuate. If our operating results fall below the expectations of investors or securities analysts, the price of our common stock could decline substantially. Our stock price can fluctuate significantly in response to a variety of factors including, among other things:
| • |
volatility of stock market prices and volumes in general; |
| • |
changes in market valuations of similar companies; |
| • |
changes in conditions in credit markets; |
| • |
changes in accounting policies or procedures as required by the Financial Accounting Standards Board, or FASB, or other regulatory agencies; |
| • |
legislative and regulatory actions (including the impact of the Dodd-Frank Act and related regulations) subject us to additional regulatory oversight which may result in increased compliance costs and/or require us to change our business model; |
| • |
government intervention in the U.S. financial system and the effects of and changes in trade and monetary and fiscal policies and laws, including the interest rate policies of the Federal Reserve Board; |
| • |
additions or departures of key members of management; |
| • |
fluctuations in our quarterly or annual operating results; and |
| • |
changes in analysts’ estimates of our financial performance. |
Risks Related to Credit
Our ability to assess the credit worthiness of our customers may diminish, which may adversely affect our results of operations.
We take credit risk by virtue of making loans and extending loan commitments and letters of credit. Our exposure to credit risk is managed through the use of consistent underwriting standards that emphasize “in-market” lending while avoiding highly leveraged transactions as well as excessive industry and other concentrations. Our credit administration function employs risk management techniques to ensure that loans adhere to corporate policy and problem loans are promptly identified. There can be no assurance that such measures will be effective in avoiding undue credit risk. If the models and approaches we use to select, manage and underwrite our consumer and commercial
PAGE 13
Table of Contents
Item 1A. RISK FACTORS — continued
customers become less predictive of future charge-offs (due, for example, to rapid changes in the economy, including the unemployment rate), our credit losses may increase.
The value of the collateral used to secure our loans may not be sufficient to compensate for the amount of an unpaid loan and we may be unsuccessful in recovering the remaining balance from our customers.
Decreases in real estate values, particularly with respect to our commercial lending and mortgage activities, could adversely affect the value of property used as collateral for our loans and our customers’ ability to repay these loans, which in turn could impact our profitability. Repayment of our commercial loans is often dependent on the cash flow of the borrower, which may become unpredictable in the current economy. If the value of the assets, such as real estate, serving as collateral for the loan portfolio were to decline materially, a significant part of the loan portfolio could become under-collateralized. If the loans that are secured by real estate become troubled when real estate market conditions are declining or have declined, in the event of foreclosure, we may not be able to realize the amount of collateral that was anticipated at the time of originating the loan. This could result in higher charges which could have a material adverse effect on our operating results and financial condition.
Changes in the overall credit quality of our portfolio can have a significant impact on our earnings.
Like other lenders, we face the risk that our customers will not repay their loans. We reserve for losses in our loan portfolio based on our assessment of inherent credit losses. This process, which is critical to our financial results and condition, requires complex judgments, including our assessment of economic conditions, which are difficult to predict. Through a periodic review of the loan portfolio, management determines the amount of the ALL by considering historical losses combined with qualitative factors including general and regional economic conditions, asset quality trends, loan policy and underwriting and changes in loan concentrations and collateral values. The amount of future losses is susceptible to changes in economic, operating and other conditions, including changes in interest rates, which may be beyond our control. We may underestimate our inherent losses and fail to hold an ALL sufficient to account for these losses. Incorrect assumptions could lead to material underestimates of inherent losses and inadequate ALL. As our assessment of inherent losses changes, we may need to increase or decrease our ALL, which could adversely impact our financial results and profitability.
Our loan portfolio is concentrated in western Pennsylvania, and our lack of geographic diversification increases our risk profile.
The regional economic conditions in western Pennsylvania affects the demand for our products and services as well as the ability of our customers to repay their loans and the value of the collateral securing these loans. We are less able than a larger institution to spread the risks of unfavorable local economic conditions across a large number of diversified economies. A significant decline in the regional economy caused by inflation, recession, unemployment or other factors could adversely affect our customers, the quality of our loan portfolio and the demand for our products and services. Any sustained period of increased payment delinquencies, foreclosures or losses caused by adverse market or economic conditions in our market area could adversely affect the value of our assets, revenues, results of operations and financial condition. Moreover, we cannot give any assurance we will benefit from any market growth or favorable economic conditions in our primary market area.
PAGE 14
Table of Contents
Item 1A. RISK FACTORS — continued
A significant portion of our loan portfolio includes commercial real estate loans that have higher risks, and we may experience higher credit losses.
The majority of our loans are to commercial borrowers. The commercial real estate segment of our loan portfolio has been more adversely impacted by the continuing economic downturn. Commercial real estate lending typically involves higher loan principal amounts, and the repayment of these loans generally are dependent, in large part, on sufficient income from the properties securing the loans to cover operating expenses and debt service. Because payments on loans secured by commercial real estate often depend upon the successful operating and management of the properties, repayment of these loans may be affected by factors outside the borrower’s control, including adverse conditions in the real estate market or the economy. Additionally, we have a number of significant loans to commercial borrowers, and while the majority of these borrowers have numerous projects that make up the total aggregate exposure, if one or more of these borrowers defaults or has financial difficulties, we could experience higher credit losses, which could adversely impact our results of operations.
Risks Related to Interest Rates and Investments
Our net interest income could be negatively affected by interest rate changes or by significant loan prepayments, which may adversely affect our financial condition.
Our results of operations are largely dependent on net interest income, which is the difference between the interest and fees earned on interest-earning assets and the interest paid on interest-bearing liabilities. We may have mismatches between the maturity and repricing of our assets and liabilities that could cause the net interest rate spread to compress, depending on the level and type of changes in the interest rate environment. Interest rates are highly sensitive to many factors that are beyond our control, including general economic conditions and the policies of various governmental agencies. In addition, our customers often have the ability to prepay loans or redeem deposits with either no penalties, or penalties that are insufficient to compensate us for the lost income. If customers continue to prepay loans at a higher rate, we may not be able to recover the lost revenues, which may affect our results of operations. A significant reduction in our net interest income will adversely affect our business and results of operations. If we are unable to manage interest rate risk effectively, our business, financial condition and results of operations could be materially harmed.
Declines in the value of investment securities held by us could require write-downs, which would reduce our earnings.
In order to diversify earnings and enhance liquidity, we own both debt and equity instruments of government agencies, municipalities and other companies. We may be required to record impairment charges on our investment securities if they suffer a decline in value that is considered other-than-temporary. Additionally, the value of these investments may fluctuate depending on the interest rate environment, general economic conditions and circumstances specific to the issuer. Volatile market conditions may detrimentally affect the value of these securities, such as through reduced valuations due to the perception of heightened credit or liquidity risks. Changes in the value of these instruments may result in a reduction to earnings and/or capital, which may adversely affect our results of operations.
PAGE 15
Table of Contents
Item 1A. RISK FACTORS — continued
The crisis in both the United States and international banking markets has adversely affected our industry, including our business, and may continue to have an adverse effect on our business and reputation in the future.
This economic turmoil and tightening of credit have led to an increased level of commercial and consumer delinquencies, lack of consumer confidence, increased market volatility and widespread reduction of business activity generally. The resulting economic pressure on consumers and the lack of confidence in the financial markets have adversely affected our business, financial condition and results of operations. Market developments may affect consumer confidence levels and may cause adverse changes in payment patterns, causing increases in delinquencies and default rates, which may impact our charge-offs and provision for credit losses. A worsening of these conditions may increase the adverse effects of these difficult market conditions on us, and may harm the reputation of banks in general and our reputation with our customers and investors.
Risks Related to Liquidity
We rely on a stable core deposit base and high quality unpledged liquid assets as our primary sources of liquidity.
We are dependent for our funding on a stable base of core deposits and high quality unpledged assets including cash held on deposit at the Federal Reserve. Our ability to maintain a stable core deposit base is a function of our financial performance, our reputation and the security provided by FDIC insurance, which combined, gives customers confidence in us. If any of these items are damaged or come into question, the stability of our core deposits could be harmed. If these investments lose value or can not be sold in an orderly fashion, it could harm our ability to meet our obligations.
Our ability to meet contingency funding needs, in the event of a crisis that causes a disruption to our core deposit base, is dependent on access to wholesale markets, including funds provided by the FHLB of Pittsburgh.
We own common stock of the FHLB in order to qualify for membership in the FHLB system, which enables us to borrow funds under the FHLB advance program. Changes or disruptions to the FHLB or the FHLB system in general may materially impair our ability to meet short and long-term liquidity needs or meet growth plans. In the event of a system-wide shock or a deterioration in our financial condition, the stability of our core deposit base could deteriorate, our access to funding from the FHLB could be restricted, or both. Without access to adequate funding we will have difficulty operating day to day, which could ultimately impact our ability to continue operations.
If our FHLB line of credit is restricted, our ability to meet our obligations to our customers could be materially affected.
We have a line of credit with the FHLB that is secured by a blanket lien on our loan portfolio. Access to this line of credit is critical if a funding need arises. However, we cannot be assured that the FHLB will be able to provide funding to us when needed, nor can we be certain that the FHLB will provide funds specifically to us, should our financial condition and/or our regulators prevent that access. The inability to access these sources of funds could have a materially adverse effect on our ability to meet our customer’s needs. Our financial flexibility could be severely constrained if we were unable to maintain our access to funding or if adequate financing is not available at acceptable interest rates. The failure of the FHLB or the FHLB system in general, may materially impair our ability to meet short and long term liquidity needs or to meet growth plans.
PAGE 16
Table of Contents
Item 1A. RISK FACTORS — continued
Risks Related to Our Operations
An interruption or breach in security of our information systems may result in financial losses or in a loss of customers.
We depend upon data processing, communication and information exchange on a variety of computing platforms and networks, including the internet. We cannot be certain that all of our systems are entirely free from vulnerability to attack, despite safeguards we have instituted. The occurrence of any failures, interruptions or security breaches of our information systems could result in a material adverse impact to our business, financial condition and results of operations through damage to our reputation, loss of customer business, additional regulatory scrutiny or exposure to civil litigation and possible financial liability. Losses arising from such a breach could materially exceed the amount of insurance coverage we have, which could adversely affect our results of operation.
We rely on third-party providers and other suppliers for a number of services that are important to our business. An interruption or cessation of an important service by any third party could have a material adverse effect on our business.
We are dependent for the majority of our technology, including our core operating system, on third party providers. If these companies were to discontinue providing services to us, we may experience significant disruption to our business. If any of our third party service providers experience financial, operational or technological difficulties, or if there is any other disruption in our relationships with them, we may be required to locate alternative sources of such services. Assurance cannot be provided that we could negotiate terms with alternative service sources that are as favorable or could obtain services with similar functionality as found in existing systems without the need to expend substantial resources, if at all, thereby resulting in a material adverse impact on our business and results of operations.
Risks Related to Regulatory Compliance and Legal Matters
Recent legislation enacted in response to market and economic conditions may significantly affect our operations, financial condition and earnings.
Disruptions in the financial system during the past three years have resulted in significantly reduced business activity throughout the global and U.S. economies, which have the potential to significantly affect financial institutions. The Dodd-Frank Act was enacted as a major reformatory response to this financial crisis. The Dodd-Frank Act increases regulation and oversight of the financial services industry, and imposes restrictions on the ability of institutions within the industry to conduct business consistent with historical practices, including aspects such as capital requirements, affiliate transactions, compensation, consumer protection regulations and mortgage regulation, among others. It is not clear what impact the Dodd-Frank Act and the numerous implementing regulations will have on the financial markets or on the U.S. banking and financial services industries and the broader U.S. and global economies. They may increase our costs of regulatory compliance and of doing business and otherwise affect our operations, and will likely result in additional costs and a diversion of management’s time from other business activities, any of which may adversely impact our results of operations, liquidity or financial condition. They also may significantly affect the markets in which we do business, the markets for and value of our investments and our ongoing operations, costs and profitability.
PAGE 17
Table of Contents
Item 1A. RISK FACTORS — continued
Our deposit insurance premiums have decreased but may increase in the future, which could have a material adverse impact on our future earnings and financial condition.
The FDIC insures deposits at FDIC-insured financial institutions, including S&T Bank. The FDIC charges insured financial institutions premiums to maintain the DIF at a specific level. The Bank’s FDIC insurance premiums recently decreased after substantial increases beginning in 2009, but we may pay significantly higher premiums in the future. Current economic conditions have increased bank failures and additional failures are expected, all of which decrease the DIF. The Dodd-Frank Act increased the minimum target DIF ratio from 1.15 percent of estimated insured deposits to 1.35 percent of estimated insured deposits. The FDIC must seek to achieve the 1.35 percent ratio by September 30, 2020. Insured institutions with assets of $10 billion or more are supposed to fund the increase. The FDIC has issued regulations to implement these provisions of the Dodd-Frank Act. It has, in addition, established a higher reserve ratio of 2 percent as a long-term goal beyond what is required by statute. There is no implementation deadline for the 2 percent ratio. The FDIC may increase the assessment rates or impose additional special assessments in the future to keep the DIF at the statutory target level. Any increase in our FDIC premiums could have an adverse effect on the Bank’s profits and financial condition. Refer to Supervision and Regulation within Item 1 of this Report for additional information.
Future governmental regulation and legislation could limit our growth.
We are subject to extensive state and federal regulation, supervision and legislation that govern nearly every aspect of our operations. The regulations are primarily intended to protect depositors, customers and the banking system as a whole, not shareholders. Failure to comply with applicable regulations could lead to penalties and damage to our reputation. Furthermore, as shown through the Dodd-Frank Act, the regulatory environment is constantly undergoing change and the impact of changes to laws, the rapid implementation of regulations, the interpretation of such laws or regulations or other actions by existing or new regulatory agencies could make regulatory compliance more difficult or expensive, and thus could affect our ability to deliver or expand services, or it could diminish the value of our business. The ramifications and uncertainties of the recent increase in government intervention in the U.S. financial system could also adversely affect us. Refer to Supervision and Regulation within Item 1 of this report for additional information.
Negative public opinion could damage our reputation and adversely impact our earnings and liquidity.
Reputational risk, or the risk to our business, earnings, liquidity and capital from negative public opinion, could result from our actual or alleged conduct in a variety of areas, including legal and regulatory compliance, lending practices, corporate governance, litigation, ethical issues or inadequate protection of customer information. We expend significant resources to comply with regulatory requirements, and the failure to comply with such regulations could result in reputational harm or significant legal or remedial costs. Damage to our reputation could adversely affect our ability to retain and attract new customers and adversely impact our earnings and liquidity
We may be a defendant from time to time in a variety of litigation and other actions, which could have a material adverse effect on our financial condition and results of operations.
From time to time, customers and others make claims and take legal action pertaining to the performance of our responsibilities. Additionally, the current economic downturn has resulted in higher customer defaults and a resultant increase in litigation. Whether customer claims and legal action related to the performance of our responsibilities are founded or unfounded, or if such claims and legal actions are not resolved in a manner favorable to us, they may result in significant expenses,
PAGE 18
Table of Contents
Item 1A. RISK FACTORS — continued
attention from management and financial liability. Any financial liability or reputational damage could have a material adverse effect on our business, which, in turn, could have a material adverse effect on our financial condition and results of operations.
Risks Related to Our Business Strategy
Our strategy includes growth plans through organic growth and acquisitions. Our financial condition and results of operations could be negatively affected if we fail to grow or fail to manage our growth effectively.
We intend to continue pursuing a growth strategy, which may include organic growth, expansion or acquisitions. We cannot assure you that we will be able to expand our market presence in our existing markets or successfully enter new markets or that any such expansion will not adversely affect our results of operations. Failure to manage our growth effectively could have a material adverse effect on our business, future prospects, financial condition or results of operations and could adversely affect our ability to successfully implement our business strategy. Our organic growth strategy includes an internal reorganization of our business structure to a market-based approach from a product-based approach. There is no assurance that this internal reorganization will be successful, and if not executed as planned, it may adversely affect our results of operations.
Our failure to find suitable acquisition candidates, or successfully bid against other competitors for acquisitions, could adversely affect our ability to successfully implement our business strategy. If we are successful in acquiring other entities, the process of integrating such entities will divert significant management time and resources. We may not be able to integrate successfully or operate profitably any financial institutions we may acquire. We may experience disruption and incur unexpected expenses in integrating acquisitions. These failures could adversely impact our future prospects and results of operation.
We are subject to competition from both banks and non-banking companies.
The financial services industry is highly competitive, and we encounter strong competition for deposits, loans and other financial services in our market area. Our principal competitors include commercial banks of all types, finance companies, credit unions, mortgage brokers, insurance agencies, trust companies and various sellers of investments and investment advice. Many of our non-bank competitors are not subject to the same degree of regulation as we are and have advantages over us in providing certain services. Additionally, many of our competitors are significantly larger than we are and have greater access to capital and other resources. Failure to compete effectively for deposit, loan and other banking customers in our markets could cause us to lose market share, slow our growth rate and may have an adverse effect on our financial condition and results of operations.
We may be required to raise capital in the future, but that capital may not be available or may not be on acceptable terms when it is needed.
We are required by federal regulatory authorities to maintain adequate capital levels to support operations. Our ability to raise additional capital is dependent on capital market conditions at that time and on our financial performance and outlook. Pending regulatory changes, such as the Dodd-Frank Act, may require us to have more capital than was previously required. If we cannot raise additional capital when needed, we may not be able to meet these requirements, and our ability to further expand our operations through organic growth or through acquisitions may be adversely affected.
PAGE 19
Table of Contents
The Warrant we issued to the U.S. Treasury may be dilutive to holders of our common stock.
The ownership interest of the existing holders of our common stock may be diluted to the extent the warrant we issued to the U.S. Treasury in connection with the sale to the U.S. Treasury of the Series A Preferred Stock is exercised. Although we redeemed all of the outstanding preferred stock previously issued to the U.S. Treasury, we did not repurchase the outstanding warrant and it will remain outstanding until 2019 or until we repurchase it. The shares of common stock underlying the warrant represent approximately 1.80 percent of the shares of our common stock outstanding as of January 31, 2012 (including the shares issuable upon exercise of the warrant in total shares outstanding). Although the U.S. Treasury has agreed not to vote any of the shares of common stock it receives upon exercise of the warrant, a transferee of any portion of the warrant or of any shares of common stock acquired upon exercise of the warrant is not bound by this restriction.
Our ability to pay dividends on our common stock may be limited.
Holders of our common stock will be entitled to receive only such dividends as our Board of Directors may declare out of funds legally available for such payments. Although we have historically declared cash dividends on our common stock, we are not required to do so and our Board of Directors could reduce, suspend or eliminate our dividend at any time. Any decrease or elimination to the dividends on our common stock could adversely affect the market price of our common stock.
We may fail to realize all of the anticipated benefits of the acquisition of Mainline Bancorp, Inc.
The success of the merger with Mainline will depend, in part, on our ability to realize the anticipated benefits and cost savings from combining the businesses of S&T and Mainline. However, to realize these anticipated benefits and cost savings, we must successfully combine our business and the businesses of Mainline. If we are not able to achieve these objectives, the anticipated benefits and cost savings of the merger may not be realized fully or at all, or may take longer to realize than expected.
There are no unresolved SEC staff comments.
We own a four-story building in Indiana, Pennsylvania, located at 800 Philadelphia Street, which serves as our headquarters, executive and administrative offices. Our Community Banking, Wealth Management and the executive office of the Insurance segment are also located at our headquarters. Additionally, we lease a building in Indiana, Pennsylvania that serves as our data processing and technology center and own a two-story building directly behind it that serves as additional administrative offices.
Community Banking has 49 branches located in nine counties in Pennsylvania, of which 32 are owned and 17 are leased. Community Banking also leases one office to Insurance. Wealth Management leases one office, located in Allegheny County, Pennsylvania. Wealth Management also has several staff located within the Community Banking offices to provide their services to retail customers. Insurance leases three offices located in three counties in Pennsylvania. Insurance also has three staff located within the Community Banking offices in Jefferson and Blair counties. The operating and capital leases for Community Banking, Wealth Management and Insurance expire at various dates through the year 2054 and generally include options to renew. For additional information regarding the lease commitments, refer to Note 9 Premises and Equipment in the Notes to Consolidated Financial Statements, which is included in Item 8 of this Report.
PAGE 20
Table of Contents
The nature of our business generates a certain amount of litigation involving matters arising in the ordinary course of business. However, in management’s opinion, there are no proceedings pending to which we are a party or to which our property is subject, which, if determined adversely to us, would be material in relation to our shareholders’ equity or financial condition. In addition, no material proceedings are pending nor are known to be threatened or contemplated against us by governmental authorities or other parties.
Not applicable.
PAGE 21
Table of Contents
Stock Prices and Dividend Information
Our common stock is listed on the NASDAQ Global Select Market System or NASDAQ under the symbol STBA. The range of sale prices for the years 2011 and 2010 is set forth in the table below and is based upon information obtained from NASDAQ. As of the close of business on January 31, 2012, we had 2,990 shareholders of record. Dividends paid by S&T are primarily provided from S&T Bank’s dividends to S&T. The payment of dividends by S&T Bank to S&T is subject to the restrictions described in Item 8, Note 5, Dividend and Loan Restrictions of this Report. The cash dividends declared per share are shown below.
|
Price Range of
Common Stock |
Cash
Dividends Declared |
|||||||||||
| 2011 | Low | High | ||||||||||
|
Fourth quarter |
$ | 15.21 | $ | 20.67 | $ | 0.15 | ||||||
|
Third quarter |
15.21 | 19.46 | 0.15 | |||||||||
|
Second quarter |
16.65 | 22.23 | 0.15 | |||||||||
|
First quarter |
20.90 | 23.86 | 0.15 | |||||||||
| 2010 | ||||||||||||
|
Fourth quarter |
$ | 17.00 | $ | 23.91 | $ | 0.15 | ||||||
|
Third quarter |
16.64 | 22.29 | 0.15 | |||||||||
|
Second quarter |
19.52 | 25.84 | 0.15 | |||||||||
|
First quarter |
15.75 | 22.22 | 0.15 | |||||||||
PAGE 22
Table of Contents
Five-Year Cumulative Total Return
The following chart compares the cumulative total shareholder return on our common stock with the cumulative total shareholder return of the NASDAQ Composite Index and NASDAQ Bank Index (1) assuming a $100 investment in each on December 31, 2006.
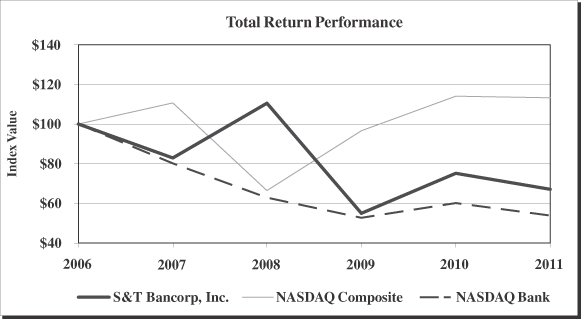
| Period Ending | ||||||||||||||||||||||||||
| Index | 12/31/06 | 12/31/07 | 12/31/08 | 12/31/09 | 12/31/10 | 12/31/11 | ||||||||||||||||||||
|
S&T Bancorp, Inc. |
$ | 100.00 | $ | 82.81 | $ | 110.45 | $ | 54.95 | $ | 75.15 | $ | 67.03 | ||||||||||||||
|
NASDAQ Composite |
100.00 | 110.66 | 66.42 | 96.54 | 114.06 | 113.16 | ||||||||||||||||||||
|
NASDAQ Bank |
100.00 | 80.09 | 62.84 | 52.60 | 60.04 | 53.74 | ||||||||||||||||||||
| (1) |
The NASDAQ Bank Index contains securities of NASDAQ-listed companies classified according to the Industry Classification Benchmark as Banks. These companies include banks providing a broad range of financial services, including retail banking, loans and money transmissions. |
PAGE 23
Table of Contents
The tables below summarize selected consolidated financial data as of the dates or for the periods indicated and should be read in conjunction with Management’s Discussion and Analysis of Financial Condition and Results of Operations in Item 7 and the Consolidated Financial Statements and Notes in Item 8 of this Report.
| December 31 | 2011 | 2010 | 2009 | 2008 | 2007 | |||||||||||||||
| (in thousands) | ||||||||||||||||||||
|
Total assets |
$ | 4,119,994 | $ | 4,114,339 | $ | 4,170,475 | $ | 4,438,368 | $ | 3,407,621 | ||||||||||
|
Securities available-for-sale |
357,596 | 288,025 | 354,860 | 452,713 | 358,822 | |||||||||||||||
|
Goodwill |
165,273 | 165,273 | 165,167 | 163,546 | 50,087 | |||||||||||||||
|
Net loans |
3,083,768 | 3,312,540 | 3,344,827 | 3,526,027 | 2,762,594 | |||||||||||||||
|
Total deposits |
3,335,859 | 3,317,524 | 3,304,541 | 3,228,416 | 2,621,825 | |||||||||||||||
|
Securities sold under repurchase agreements and federal funds purchased |
30,370 | 40,653 | 44,935 | 113,419 | 100,258 | |||||||||||||||
|
Short-term borrowings |
75,000 | — | 51,300 | 308,475 | 80,000 | |||||||||||||||
|
Long-term borrowings |
31,874 | 29,365 | 85,894 | 180,331 | 201,021 | |||||||||||||||
|
Junior subordinated debt securities |
90,619 | 90,619 | 90,619 | 90,619 | 25,000 | |||||||||||||||
|
Preferred stock, series A |
— | 106,137 | 105,370 | — | — | |||||||||||||||
|
Total shareholders’ equity |
490,526 | 578,665 | 553,318 | 448,694 | 337,560 | |||||||||||||||
| Years Ended December 31 | 2011 | 2010 | 2009 | 2008 | 2007 | |||||||||||||||
| (in thousands, except per share data) | ||||||||||||||||||||
|
Interest income |
$ | 165,079 | $ | 180,419 | $ | 195,087 | $ | 216,118 | $ | 215,605 | ||||||||||
|
Interest expense |
27,733 | 34,573 | 49,105 | 72,171 | 99,167 | |||||||||||||||
|
Provision for loan losses |
15,609 | 29,511 | 72,354 | 12,878 | 5,812 | |||||||||||||||
|
Net Interest Income After Provision for Loan Losses |
121,737 | 116,335 | 73,628 | 131,069 | 110,626 | |||||||||||||||
|
Noninterest income |
44,057 | 47,210 | 38,580 | 37,452 | 40,605 | |||||||||||||||
|
Noninterest expense |
103,908 | 105,633 | 108,126 | 83,801 | 73,460 | |||||||||||||||
|
Income Before Taxes |
61,886 | 57,912 | 4,082 | 84,720 | 77,771 | |||||||||||||||
|
Provision (benefit) for income taxes |
14,622 | 14,432 | (3,869 | ) | 24,517 | 21,627 | ||||||||||||||
|
Net Income |
47,264 | 43,480 | 7,951 | 60,203 | 56,144 | |||||||||||||||
|
Preferred stock dividends and discount amortization |
7,611 | 6,201 | 5,913 | — | — | |||||||||||||||
|
Net Income Available to Common Shareholders |
$ | 39,653 | $ | 37,279 | $ | 2,038 | $ | 60,203 | $ | 56,144 | ||||||||||
|
Per Share Data |
||||||||||||||||||||
|
Earnings per common share—basic |
$ | 1.41 | $ | 1.34 | $ | 0.07 | $ | 2.30 | $ | 2.27 | ||||||||||
|
Earnings per common share—diluted |
1.41 | 1.34 | 0.07 | 2.28 | 2.26 | |||||||||||||||
|
Dividends declared per common share |
0.60 | 0.60 | 0.61 | 1.24 | 1.21 | |||||||||||||||
|
Common book value |
17.44 | 16.91 | 16.14 | 16.24 | 13.75 | |||||||||||||||
PAGE 24
Table of Contents
This section reviews our financial condition and results of operations for each of the past three years. Certain reclassifications have been made to prior periods to place them on a basis comparable with the current period presentation. Some tables may include additional time periods to illustrate trends within our financial statements. The results of operations reported in the accompanying Consolidated Financial Statements are not necessarily indicative of results to be expected in future periods.
Important Note Regarding Forward-Looking Statements
This Report on Form 10-K contains or incorporates statements that we believe are “forward-looking statements” within the meaning of the Private Securities Litigation Reform Act of 1995. These statements generally relate to our financial condition, results of operations, plans, objectives, future performance or business. They usually can be identified by the use of forward-looking language such as “will likely result,” “may,” “are expected to,” “is anticipated,” “estimate,” “forecast,” “projected,” “intends to” or other similar words. You should not place undue reliance on these statements, as they are subject to risks and uncertainties, including but not limited to, those identified under Risk Factors in Item 1A of this Report, the documents incorporated by reference or other important factors disclosed in this report and from time to time in our other filings with the Securities and Exchange Commission, or SEC. When considering these forward-looking statements, you should keep in mind these risks and uncertainties, as well as any cautionary statements we may make. Moreover, you should treat these statements as speaking only as of the date they are made and based only on information actually known to us at that time. We undertake no obligation to update publicly any forward-looking statements, whether as a result of new information, future events or otherwise.
These forward-looking statements are based on current expectations, estimates and projections about our business, management’s beliefs and assumptions made by management. These Future Factors, are not guarantees of our future performance and involve certain risks, uncertainties and assumptions, which are difficult to predict. Therefore, actual outcomes and results may differ materially from what is expressed or forecasted in these forward-looking statements.
Future Factors include:
| • |
changes in interest rates, spreads on interest-earning assets and interest-bearing liabilities, the shape of the yield curve and interest rate sensitivity; |
| • |
a prolonged period of low interest rates; |
| • |
credit losses; |
| • |
access to capital in the amounts, at the times and on the terms required to support our future businesses; |
| • |
legislation affecting the financial services industry as a whole, and/or S&T Bancorp, Inc., or S&T, in particular, including the effects of the Dodd-Frank Act; |
| • |
regulatory supervision and oversight, including required capital levels, and public policy changes, including environmental regulations; |
| • |
increasing price and product/service competition, including new entrants; |
| • |
rapid technological developments and changes; |
| • |
the ability to continue to introduce competitive new products and services on a timely, cost-effective basis; |
| • |
continued deterioration of the housing market and reduced demand for mortgages; |
| • |
containing costs and expenses; |
| • |
reliance on large customers; |
| • |
the outcome of pending and future litigation and governmental proceedings; |
| • |
managing our internal growth and acquisitions; |
| • |
the possibility that the anticipated benefits from our proposed acquisition of Mainline cannot be fully realized in a timely manner or at all, or that integrating the acquired operations will be more difficult, disruptive or costly than anticipated; |
PAGE 25
Table of Contents
Item 7. MANAGEMENT’S DISCUSSION AND ANALYSIS OF FINANCIAL CONDITION AND RESULTS OF OPERATIONS — continued
| • |
general economic or business conditions, either nationally or regionally in western Pennsylvania, may be less favorable than expected, resulting in among other things, a reduced demand for credit and other services; |
| • |
a decline in market capitalization to common book value, which could warrant further analysis of the carrying value of goodwill and could result in an adjustment to its carrying value resulting in a non-cash charge to net income; and |
| • |
a continuation of recent turbulence in significant portions of the global financial and real estate markets could impact our performance, both directly, by affecting our revenues and the value of our assets and liabilities and indirectly, by affecting the economy generally. |
These are representative of the Future Factors that could affect the outcome of the forward-looking statements. In addition, such statements could be affected by general industry and market conditions and growth rates, general economic conditions, including interest rate and currency exchange rate fluctuations and other Future Factors.
Critical Accounting Policies and Estimates
Our financial statements are prepared in accordance with U.S. generally accepted accounting principles, or GAAP. Application of these principles requires management to make estimates, assumptions and judgments that affect the amounts reported in the Consolidated Financial Statements and accompanying notes. These estimates, assumptions and judgments are based on information available as of the date of the Consolidated Financial Statements; accordingly, as this information changes, the Consolidated Financial Statements could reflect different estimates, assumptions and judgments. Certain policies inherently are based to a greater extent on estimates, assumptions and judgments of management and, as such, have a greater possibility of producing results that could be materially different than originally reported.
Our most significant accounting policies are presented in Note 1 Summary of Significant Accounting Policies in the Notes to Consolidated Financial Statements, which are included in Item 8 of this Report. These policies, along with the disclosures presented in the Notes to Consolidated Financial Statements, provide information on how significant assets and liabilities are valued in the Consolidated Financial Statements and how those values are determined.
We view critical accounting policies to be those which are highly dependent on subjective or complex estimates, assumptions and judgments and where changes in those estimates and assumptions could have a significant impact on the Consolidated Financial Statements. We currently view the determination of the allowance for loan losses, or ALL, income taxes, securities valuation and goodwill and other intangible assets to be critical accounting policies.
Allowance for Loan Losses
Our loan portfolio is our largest category of assets on our Consolidated Balance Sheets. Accordingly, we have designed a systematic ALL methodology which is used to determine our provision for loan losses and ALL on a quarterly basis. The ALL represents management’s estimate of probable losses inherent in the loan portfolio at the balance sheet date and is presented as a reserve against loans in the Consolidated Balance Sheets. The ALL is increased by a provision charged to expense and reduced by charge-offs, net of recoveries. Determination of an adequate ALL is inherently subjective, as it requires estimations of the occurrence of future events, as well as the timing of such events. The ALL may be subject to significant changes from period to period.
The methodology for determining the ALL has two main components: evaluation and impairment tests of individual loans and evaluation and impairment tests of certain groups of homogeneous loans with similar risk characteristics.
PAGE 26
Table of Contents
Item 7. MANAGEMENT’S DISCUSSION AND ANALYSIS OF FINANCIAL CONDITION AND RESULTS OF OPERATIONS — continued
We individually evaluate all substandard and nonaccrual commercial loans greater than $0.5 million for impairment. A loan is impaired when, based on current information and events, it is probable that a creditor will be unable to collect all amounts due according to the contractual terms of the loan agreement. For all troubled debt restructurings, or TDRs, regardless of size, as well as all other impaired loans, we conduct further analysis to determine the probable loss and assign a specific reserve to the loan if deemed appropriate. Specific reserves are established based upon the following three impairment methods: 1) the present value of expected future cash flows discounted at the loan’s effective interest rate, 2) the loan’s observable market price or 3) the estimated fair value of the collateral if the loan is collateral dependent. These analyses involve a high degree of judgment in estimating the amount of loss associated with specific impaired loans, including estimating the amount and timing of future cash flows, current estimated fair value of the loan and collateral values. Our impairment evaluations consist primarily of the fair value of collateral method since most loans are collateral dependents.
The ALL methodology for groups of homogeneous loans, known as the general reserve, is comprised of both a quantitative and qualitative analysis. We first apply historical loss rates to pools of loans with similar risk characteristics. The historical loss rates are calculated by historical charge-offs that have occurred within each pool of loans over the loss emergence period. We estimate the loss emergence period to be two years for commercial real estate loans and one year for all other loan portfolio segments. After consideration of the loss calculations, management applies additional qualitative adjustments so that the ALL is reflective of the inherent losses that exist in the loan portfolio at the balance sheet date. Qualitative adjustments are made based upon changes in economic conditions, loan portfolio and asset quality data and credit process changes, such as credit policies or underwriting standards. The evaluation of the various components of the ALL requires considerable judgment in order to estimate inherent loss exposures.
We enhanced our ALL model in the fourth quarter of 2010 to better align it with the regulatory guidance. The calculation of the base historical loss utilizing an average method over the prior five years was shortened to include a one to two year loss emergence period depending on the loan category over a rolling four quarter average. Loss emergence refers to the length of time between a loss event and a charge-off of the loan. With the volatility in the credit cycle at that time, the shorter time horizon was more responsive to the loss emergence periods we were experiencing in our portfolio. We believe this shorter time horizon provides a better indication of inherent losses in the loan portfolio given the recent economic downturn. We also refined the qualitative factors beginning in the fourth quarter of 2010 to better align with the regulatory guidance. Qualitative factors became a basis point adjustment applied to the historical base loss. The combination of the enhancements to the average method and the qualitative factors did not materially change the ALL at December 31, 2010, resulting in an increase in the ALL of less than $0.5 million. Since December 31, 2010, there have been no further enhancements to the ALL methodology.
At December 31, 2011, approximately 92 percent of the ALL related to the commercial loan portfolio. Commercial loans represent 73 percent of total portfolio loans. Commercial loans have been more impacted by the economic slowdown in our markets. The ability of customers to repay commercial loans is more dependent upon the success of their business, continuing income and general economic conditions. Accordingly, the risk of loss is higher on such loans compared to consumer loans, which have incurred lower losses in our market.
There are many factors affecting the ALL; some are quantitative, while others require qualitative judgment. Although we believe our process for determining the ALL adequately considers all of the factors that would likely result in credit losses, the process includes subjective elements and may be susceptible to significant change. To the extent actual outcomes differ from management estimates, additional provisions for loan losses could be required and could adversely affect our earnings or financial position in future periods.
PAGE 27
Table of Contents
Item 7. MANAGEMENT’S DISCUSSION AND ANALYSIS OF FINANCIAL CONDITION AND RESULTS OF OPERATIONS — continued
Income Taxes
We estimate income tax expense based on amounts expected to be owed to the tax jurisdictions where we conduct business. The laws are complex and subject to different interpretations by the taxpayer and various taxing authorities. On a quarterly basis, we assess the reasonableness of our effective tax rate based upon our current estimate of the amount and components of net income, tax credits and the applicable statutory tax rates expected for the full year.
Deferred income tax assets and liabilities are determined using the asset and liability method and are reported in other assets or other liabilities, as appropriate, in the Consolidated Balance Sheets. Under this method, the net deferred tax asset or liability is based on the tax effects of the differences between the book and tax bases of assets and liabilities and recognizes enacted changes in tax rate and laws. When deferred tax assets are recognized, they are subject to a valuation allowance based on Management’s judgment as to whether realization is more likely than not.
Accrued taxes represent the net estimated amount due to taxing jurisdictions and are reported in other assets or other liabilities, as appropriate, in the Consolidated Balance Sheets. We evaluate and assess the relative risks and appropriate tax treatment of transactions and filing positions after considering statutes, regulations, judicial precedent and other information and maintain tax accruals consistent with the evaluation of these relative risks and merits. Changes to the estimate of accrued taxes occur periodically due to changes in tax rates, interpretations of tax laws, the status of examinations being conducted by taxing authorities and changes to statutory, judicial and regulatory guidance. These changes, when they occur, can affect deferred taxes and accrued taxes, as well as the current period’s income tax expense and can be significant to our operating results.
Tax positions are recognized as a benefit only if it is “more likely than not” that the tax position would be sustained in a tax examination, with a tax examination being presumed to occur. The amount recognized is the largest amount of tax benefit that is greater than 50 percent likely of being realized on examination. For tax positions not meeting the “more likely than not” test, no tax benefit is recorded.
Securities Valuation
We determine the appropriate classification of securities at the time of purchase. All securities, including both debt and equity securities, are classified as available-for-sale. These securities are carried at fair value with net unrealized gains and losses deemed to be temporary reported separately as a component of other comprehensive income, net of tax. Realized gains and losses on the sale of available-for-sale securities and other-than-temporary impairment, or OTTI, charges are recorded within noninterest income in the Consolidated Statements of Income. Realized gains and losses on the sale of securities are determined using the specific-identification method.
We perform a quarterly review of our securities to identify those that may indicate an OTTI. Our policy for OTTI within the marketable equity securities portfolio generally requires an impairment charge when the security is in a loss position for 12 consecutive months, unless facts and circumstances would suggest the need for an OTTI prior to that time. Our policy for OTTI within the debt securities portfolio is based upon a number of factors, including but not limited to, the length of time and extent to which the estimated fair value has been less than cost, the financial condition of the underlying issuer, the ability of the issuer to meet contractual obligations, the likelihood of the security’s ability to recover any decline in its estimated fair value and whether we intend to sell the investment security or if it is more likely than not that we will be required to sell the security prior to the security’s recovery. If the financial markets experience deterioration, charges to income could occur in future periods.
PAGE 28
Table of Contents
Item 7. MANAGEMENT’S DISCUSSION AND ANALYSIS OF FINANCIAL CONDITION AND RESULTS OF OPERATIONS — continued
Goodwill and Other Intangible Assets
As a result of acquisitions, we have recorded goodwill and identifiable intangible assets on our balance sheet. Goodwill represents the excess of the purchase price over the fair value of net assets purchased.
Goodwill relates to value inherent in the Community Banking and Insurance reporting units and the value is dependent upon our ability to provide quality, cost-effective services in the face of competition from other market participants. This ability relies upon continuing investments in processing systems, the development of value-added service features and the ease of use of our services. As such, goodwill value is supported ultimately by revenue that is driven by the volume of business transacted. A decline in earnings as a result of a lack of growth or the inability to deliver cost-effective services over sustained periods can lead to impairment of goodwill, which could adversely impact earnings in future periods.
We have three reporting units including: Community Banking, Wealth Management and Insurance. The carrying value of goodwill is tested annually for impairment each October 1 or more frequently if indicators of impairment are present. The evaluation for impairment involves comparing the current estimated fair value of each reporting unit to its carrying value, including goodwill. If the current estimated fair value of a reporting unit exceeds its carrying value, no additional testing is required and impairment loss is not recorded. If the estimated fair value of a reporting unit is less than the carrying value, further valuation procedures are performed and could result in impairment of goodwill being recorded. Further valuation procedures would include allocating the estimated fair value to all assets and liabilities of the reporting unit to determine an implied goodwill value. If the implied value of goodwill of a reporting unit is less than the carrying amount of that goodwill, an impairment loss is recognized in an amount equal to that excess. We completed the annual goodwill impairment assessment as required in 2011, 2010 and 2009; the results indicated that the fair value of each reporting unit exceeded their carrying value.
During the third quarter of 2011, our stock traded below common book value for an extended period of time. As a result, we engaged a third party to provide current market data for recent bank merger and acquisition transactions. The market data included transactions from January 2010 to August 2011 and indicated that transactions were occurring in excess of common book value of 70.3 percent (median). This data supported our conclusion that the fair value exceeds the carrying value and no further valuation procedures were completed. At December 31, 2011, our stock was trading in excess of 10 percent above common book value.
We determine the amount of identifiable intangible assets based upon independent core deposit and insurance contract analyses at the time of acquisition. Intangible assets with finite useful lives, consisting primarily of core deposit and customer list intangibles, are amortized using straight-line or accelerated methods over their estimated weighted average useful lives, ranging from 10 to 16 years. Intangible assets with finite useful lives are evaluated for impairment whenever events or changes in circumstances indicate that their carrying amount may not be recoverable. No events or changes in circumstances occurred during the years ended December 31, 2011, 2010 and 2009.
The financial services industry and securities markets continue to be adversely affected by declining values of nearly all asset classes. If current economic conditions continue to result in a prolonged period of economic weakness, our business segments, including the Community Banking segment, may be adversely affected. This may result in impairment of goodwill and other intangible assets in the future. Any resulting impairment loss could have a material adverse impact on our financial condition and its results of operations.
In the event that we determine that either our goodwill or finite lived intangible assets are impaired, recognition of an impairment charge could have a significant adverse impact on our financial position or results of operations in the period in which the impairment occurred.
PAGE 29
Table of Contents
Item 7. MANAGEMENT’S DISCUSSION AND ANALYSIS OF FINANCIAL CONDITION AND RESULTS OF OPERATIONS — continued
Recent Accounting Pronouncements and Developments
Note 1 Summary of Significant Accounting Policies, Recently Adopted Accounting Standards Updates and Recently Issued Accounting Standards Updates in the Notes to the Consolidated Financial Statements, which is included in Item 8 of this Report, discusses new accounting pronouncements that we adopted and the expected impact of accounting pronouncements recently issued or proposed, but not yet required to be adopted.
Executive Overview
We are a bank holding company headquartered in Indiana, Pennsylvania with assets of $4.1 billion at December 31, 2011. We provide a full range of financial services through offices located in Allegheny, Armstrong, Blair, Butler, Cambria, Clarion, Clearfield, Indiana, Jefferson and Westmoreland counties of Pennsylvania. We provide full service retail and commercial banking products as well as cash management services, insurance, estate planning and administration, employee benefit plan investment management and administration, corporate services and other fiduciary services. Our common stock trades on the Nasdaq Global Select Market under the symbol “STBA.”
We earn revenue primarily from interest on loans, securities investments and fees charged for financial services provided to our customers. Offsetting these revenues are the cost of deposits and other funding sources, provision for loan losses and other operating costs such as: salaries and employee benefits, occupancy, data processing expenses and tax expense.
Our mission is to become the financial services provider of choice in western Pennsylvania by delivering exceptional service and value, one customer at a time. Our strategic plan is market based and focuses on satisfying the needs of our customers, including: transaction, credit, investment and insurance needs. Transaction needs include the traditional banking needs for both individuals and businesses. Credit needs are solutions for customers with the need to borrow for personal assets, business growth and expansion, or capital leverage. Investments needs are a customer’s needs as it relates to deriving growth and return including our investment services through S&T Wealth Management Services and Stewart Capital Advisors. Insurance needs include S&T–Evergreen Insurance LLC and S&T Insurance Group, LLC, which provides a host of insurance products and services for both individuals and businesses. Our strategic plan includes a collaborative model that focuses on achieving each customer’s individual financial objectives through each of our delivery channels.
We continued to make progress throughout 2011 and are pleased to report positive trends in all of our operations. Our major accomplishments included:
| • |
On December 7, 2011 we redeemed all of the $108.7 million of Series A Preferred Stock issued on January 16, 2009 in conjunction with our participation in the U.S. Treasury Capital Purchase Program, or CPP. Our strong capital position allowed us to repurchase the preferred stock without raising additional capital. Upon redemption, a one-time non-cash reduction to net income available to common shareholders of $1.8 million, or $0.06 per common share, was recorded for the remaining unamortized discount of the preferred stock. The repayment of the CPP funds will save us $6.2 million in preferred dividends and amortization, or approximately $0.22 per common diluted share, on an annual basis beginning in 2012. |
| • |
We are expanding our community banking network through a definitive agreement to acquire Mainline, a community bank based in Ebensburg, Pennsylvania with approximately $236 million in assets. We believe this acquisition fits strategically with our operations, culture and geographic perspective. Mainline operates seven branches in Cambria County, where our presence has been very limited, and one branch in Altoona, which will enhance our position in the Blair county marketplace. We expect the transaction to be completed in the first quarter of |
PAGE 30
Table of Contents
Item 7. MANAGEMENT’S DISCUSSION AND ANALYSIS OF FINANCIAL CONDITION AND RESULTS OF OPERATIONS — continued
|
2012 pending the approval of the shareholders of Mainline and satisfaction of other customary closing conditions. We believe the merger will be accretive to earnings per share in the first year of operations, excluding one-time costs. Our first quarter of 2012 earnings will be negatively impacted by one-time merger related costs. |
| • |
Efficiency continues to be our priority and we had several initiatives throughout the year. As regulatory costs increased, we increased our focus on the cost benefit of electronic banking products and delivery channels, now utilized by approximately 60 percent of our customer base. We not only launched new online and mobile banking products, but we also made a concerted effort to shift our customers from paper to electronic statements. As a result, about 47 percent are now receiving e-statements and the savings for us are significant. We also implemented a fee for paper statements in August of 2011. Further, based on our activity levels within our community banking network, we consolidated two branch offices during 2011. |
Our earnings increased 6 percent to $39.7 million or $1.41 per share in 2011 compared to $37.3 million or $1.34 per share in the previous year. The primary driver of our improved performance was stabilizing asset quality. Net charge-offs and nonperforming assets decreased in 2011, resulting in a decline in the provision for loan losses of $13.9 million from the prior year. Nonperforming assets totaled $60.1 million, or 1.92 percent of total loans plus other real estate owned, or OREO, at December 31, 2011, as compared to $69.7 million or 2.07 percent at December 31, 2010. The improvement in asset quality was mainly due to a stabilizing economy, proactive efforts to address problem credits and disciplined underwriting standards that resulted in a stronger loan portfolio. We did experience a decline in our net interest income of $8.5 million compared to the prior year. The decline was due to an unfavorable shift in asset mix as we experienced significant loan pay downs throughout 2011 which have been invested in lower yielding assets. Our noninterest income declined $3.2 million from the prior year, due to regulatory changes which significantly impacted our service charges. We did experience a slight decline in expenses of $1.7 million, primarily due lower Federal Deposit Insurance Corporation, or FDIC, assessments compared to the prior year.
Our total assets remained relatively unchanged from the prior year; however, we had significant loan pay downs as evidenced by a decline in our loan balances of $231.3 million from the prior year. These excess funds as a result of loan pay downs are primarily being held as excess cash at the Federal Reserve. We did experience some relief in the pace of loan pay downs in the latter half of 2011. Our deposit base remains strong and we did have an improvement in our mix of deposits compared to the prior year. Our capital ratios did decline due to the redemption of the CPP, but still remain significantly above the “well capitalized” thresholds of federal bank regulatory agencies with a leverage ratio of 9.17 percent, tier 1 risk-based capital ratio of 11.63 percent and total risk based capital ratio of 15.20 percent.
In 2012, our performance will again be heavily influenced by asset quality. If the economy continues to stabilize and improve, we should expect to see continued progress in reducing net charge-offs, nonperforming loans and provision for loan losses. However, a continuation of the economic slowdown, regionally or nationally, could cause deterioration in our asset quality. We recognize that our shift to a greater dependence on commercial loans in recent years exposes us to larger credit risks and greater swings in nonperforming loans and loan charge-offs when problems do occur. We will focus on mitigating this risk through our disciplined credit risk management practices, such as the review of such loans by our Criticized Asset Committee and continued sound underwriting practices. Because the majority of our revenue comes from net interest income, net loan and deposit growth, combined with the relative pricing and mix of that growth are major factors that affect our operations and financial condition. Our net interest margin will be a challenge as we move into 2012, especially if we continue to experience significant loan paydowns and we expect to see further compression in our net interest margin.
PAGE 31
Table of Contents
Item 7. MANAGEMENT’S DISCUSSION AND ANALYSIS OF FINANCIAL CONDITION AND RESULTS OF OPERATIONS — continued
Results of Operations
Year Ended December 31, 2011
Net Income
Net income available to common shareholders for 2011 was $39.7 million as compared to $37.3 million in 2010, resulting in diluted earnings per common share of $1.41 compared to $1.34 diluted earnings per common share in 2010. The increase in net income was primarily a result of a reduction of $13.9 million in the provision for loan losses partially offset with decreases of $8.5 million in net interest income and $3.2 million in noninterest income.
Return on Equity and Assets
The table below presents our consolidated profitability and capital ratios for each of the last three years:
| Years Ended December 31 | 2011 | 2010 | 2009 | |||||||||
|
Common return on average assets |
0.97 | % | 0.90 | % | 0.05 | % | ||||||
|
Common return on average equity |
6.78 | % | 6.58 | % | 0.37 | % | ||||||
|
Dividend payout ratio |
42.44 | % | 44.75 | % | 1247.64 | % | ||||||
|
Common equity to asset ratio |
11.91 | % | 11.48 | % | 10.74 | % | ||||||
Net Interest Income
Our principal source of revenue is net interest income. Net interest income represents the difference between the interest and fees earned on interest-earning assets and the interest paid on interest-bearing liabilities. Net interest income is affected by changes in the average balance of interest-earning assets and interest-bearing liabilities and changes in interest rates and spreads. Maintaining consistent spreads between interest-earning assets and interest-bearing liabilities is significant to our financial performance because net interest income comprised 76 percent of operating revenue (net interest income plus noninterest income, excluding security gains/losses) in both 2011 and 2010. Refer to page 58 Explanation of Use of Non-GAAP Financial Measures for a discussion of operating revenue as a non-GAAP financial measure. The level and mix of interest-earning assets and interest-bearing liabilities are continually monitored by our Asset and Liability Committee, or ALCO, in order to mitigate interest rate and liquidity risks of the balance sheet. A variety of ALCO strategies were successfully added and implemented, within prescribed ALCO risk parameters, to maintain an acceptable net yield on interest-earning assets (net interest margin) given the challenges of the current interest rate environment.
The interest income on interest-earning assets and the net interest margin are presented on a fully taxable-equivalent basis. The fully taxable-equivalent basis adjusts for the tax benefit of income on certain tax-exempt loans and investments using the federal statutory tax rate of 35 percent for each period. We believe this measure to be the preferred industry measurement of net interest income that provides a relevant comparison between taxable and non-taxable amounts.
PAGE 32
Table of Contents
Item 7. MANAGEMENT’S DISCUSSION AND ANALYSIS OF FINANCIAL CONDITION AND RESULTS OF OPERATIONS — continued
The following table reconciles interest income per the Consolidated Statements of Income to net interest income adjusted to a fully taxable-equivalent basis:
| Years Ended December 31 | 2011 | 2010 | 2009 | |||||||||
| (in thousands) | ||||||||||||
|
Interest income per Consolidated Statements of Income |
$ | 165,079 | $ | 180,419 | $ | 195,087 | ||||||
|
Adjustment to fully taxable-equivalent basis |
4,154 | 4,627 | 5,202 | |||||||||
|
Interest income adjusted to fully taxable-equivalent basis |
169,233 | 185,046 | 200,289 | |||||||||
|
Interest expense per Consolidated Statements of Income |
27,733 | 34,573 | 49,105 | |||||||||
|
Net Interest Income Adjusted to Fully Taxable-equivalent Basis (non-GAAP) |
$ | 141,500 | $ | 150,473 | $ | 151,184 | ||||||
PAGE 33
Table of Contents
Item 7. MANAGEMENT’S DISCUSSION AND ANALYSIS OF FINANCIAL CONDITION AND RESULTS OF OPERATIONS — continued
Average Balance Sheet and Net Interest Income Analysis
The following table provides information regarding the average balances, interest and yields earned on interest-earning assets and the average balances, interest and rates paid on interest-bearing liabilities:
|
December 31 |
2011 | 2010 | 2009 | |||||||||||||||||||||||||||||||||
|
Average
Balance |
Interest |
Yield/
Rate |
Average
Balance |
Interest |
Yield/
Rate |
Average
Balance |
Interest |
Yield/
Rate |
||||||||||||||||||||||||||||
| (in thousands) | ||||||||||||||||||||||||||||||||||||
|
ASSETS |
||||||||||||||||||||||||||||||||||||
|
Loans (1)(2) |
$ | 3,216,856 | $ | 156,845 | 4.88 | % | $ | 3,386,103 | $ | 172,319 | 5.09 | % | $ | 3,473,169 | $ | 182,767 | 5.26 | % | ||||||||||||||||||
|
Taxable investment securities |
273,320 | 8,475 | 3.10 | % | 226,714 | 8,373 | 3.69 | % | 286,295 | 11,897 | 4.16 | % | ||||||||||||||||||||||||
|
Tax-exempt investment securities (2) |
62,607 | 3,611 | 5.77 | % | 76,707 | 4,354 | 5.68 | % | 103,832 | 5,624 | 5.42 | % | ||||||||||||||||||||||||
|
Federal Home Loan Bank stock |
20,091 | — | — | % | 23,336 | — | — | % | 23,542 | — | — | % | ||||||||||||||||||||||||
|
Interest-bearing balance with banks |
123,714 | 302 | 0.24 | % | 49 | — | 0.34 | % | 54 | — | 0.17 | % | ||||||||||||||||||||||||
|
Federal funds sold |
— | — | — | % | — | — | — | % | 258 | 1 | 0.25 | % | ||||||||||||||||||||||||
|
Total Interest-earning Assets |
3,696,588 | 169,233 | 4.58 | % | 3,712,909 | 185,046 | 4.98 | % | 3,887,150 | 200,289 | 5.15 | % | ||||||||||||||||||||||||
|
Noninterest-earning assets: |
||||||||||||||||||||||||||||||||||||
|
Cash and due from banks |
50,458 | 90,462 | 67,405 | |||||||||||||||||||||||||||||||||
|
Premises and equipment, net |
38,425 | 39,142 | 41,915 | |||||||||||||||||||||||||||||||||
|
Other assets |
344,378 | 340,234 | 320,803 | |||||||||||||||||||||||||||||||||
|
Less allowance for loan losses |
(57,241 | ) | (59,292 | ) | (57,985 | ) | ||||||||||||||||||||||||||||||
|
Total Assets |
$ | 4,072,608 | $ | 4,123,455 | $ | 4,259,288 | ||||||||||||||||||||||||||||||
|
LIABILITIES AND SHAREHOLDERS’ EQUITY |
|
|||||||||||||||||||||||||||||||||||
|
Interest-bearing liabilities: |
||||||||||||||||||||||||||||||||||||
|
Interest-bearing demand and money market |
$ | 536,085 | $ | 739 | 0.14 | % | $ | 518,383 | $ | 1,220 | 0.24 | % | $ | 485,742 | $ | 1,616 | 0.33 | % | ||||||||||||||||||
|
Savings |
761,274 | 1,267 | 0.17 | % | 749,325 | 2,127 | 0.28 | % | 758,216 | 3,465 | 0.46 | % | ||||||||||||||||||||||||
|
Certificates of deposit |
1,181,823 | 20,946 | 1.77 | % | 1,300,803 | 25,370 | 1.95 | % | 1,367,372 | 33,358 | 2.44 | % | ||||||||||||||||||||||||
|
Federal funds purchased |
— | — | — | % | — | — | — | % | 115 | 1 | 0.79 | % | ||||||||||||||||||||||||
|
Securities sold under repurchase agreements |
41,584 | 53 | 0.13 | % | 46,490 | 64 | 0.14 | % | 86,616 | 140 | 0.16 | % | ||||||||||||||||||||||||
|
Short-term borrowings |
551 | 2 | 0.32 | % | 32,473 | 146 | 0.45 | % | 104,217 | 544 | 0.52 | % | ||||||||||||||||||||||||
|
Long-term borrowings |
31,651 | 1,091 | 3.45 | % | 42,920 | 1,643 | 3.83 | % | 127,045 | 5,568 | 4.38 | % | ||||||||||||||||||||||||
|
Junior subordinated debt securities |
90,619 | 3,635 | 4.01 | % | 90,619 | 4,003 | 4.42 | % | 90,619 | 4,413 | 4.87 | % | ||||||||||||||||||||||||
|
Total Interest-bearing Liabilities |
2,643,587 | 27,733 | 1.05 | % | 2,781,013 | 34,573 | 1.24 | % | 3,019,942 | 49,105 | 1.63 | % | ||||||||||||||||||||||||
|
Noninterest-bearing liabilities: |
||||||||||||||||||||||||||||||||||||
|
Noninterest-bearing demand |
792,911 | 728,708 | 637,434 | |||||||||||||||||||||||||||||||||
|
Other liabilities |
50,924 | 47,064 | 57,377 | |||||||||||||||||||||||||||||||||
|
Shareholders’ equity |
585,186 | 566,670 | 544,535 | |||||||||||||||||||||||||||||||||
|
Total Liabilities and Shareholders’ Equity |
$ | 4,072,608 | $ | 4,123,455 | $ | 4,259,288 | ||||||||||||||||||||||||||||||
|
Net Interest Income |
$ | 141,500 | $ | 150,473 | $ | 151,184 | ||||||||||||||||||||||||||||||
|
Net Yield on Interest-earning Assets |
3.83 | % | 4.05 | % | 3.89 | % | ||||||||||||||||||||||||||||||
| (1) |
For the purpose of these computations, nonaccruing loans are included in the daily average loan amounts outstanding. |
| (2) |
Tax-exempt income is on a fully taxable-equivalent basis, including the dividend-received deduction for equity securities, using the statutory federal corporate income tax rate of 35 percent for 2011, 2010 and 2009. |
PAGE 34
Table of Contents
Item 7. MANAGEMENT’S DISCUSSION AND ANALYSIS OF FINANCIAL CONDITION AND RESULTS OF OPERATIONS — continued
The following table presents a summary of the changes in interest earned and interest paid resulting from changes in average balances and changes in rates:
|
2011 Compared to 2010
Increase (Decrease) Due to (1) |
2010 Compared to 2009
Increase (Decrease) Due to (1) |
|||||||||||||||||||||||
| Volume | Rate | Net | Volume | Rate | Net | |||||||||||||||||||
| (in thousands) | ||||||||||||||||||||||||
|
Interest earned on: |
||||||||||||||||||||||||
|
Loans (2) |
$ | (8,613 | ) | $ | (6,861 | ) | $ | (15,474 | ) | $ | (4,581 | ) | $ | (5,867 | ) | $ | (10,448 | ) | ||||||
|
Taxable investment securities |
1,722 | (1,620 | ) | 102 | (2,476 | ) | (1,048 | ) | (3,524 | ) | ||||||||||||||
|
Tax-exempt investment securities (2) |
(800 | ) | 57 | (743 | ) | (1,469 | ) | 199 | (1,270 | ) | ||||||||||||||
|
Interest-bearing balance with bank |
419 | (117 | ) | 302 | — | — | — | |||||||||||||||||
|
Federal funds sold |
— | — | — | (1 | ) | — | (1 | ) | ||||||||||||||||
|
Total Interest-earning Assets |
(7,272 | ) | (8,541 | ) | (15,813 | ) | (8,527 | ) | (6,716 | ) | (15,243 | ) | ||||||||||||
|
Interest paid on: |
||||||||||||||||||||||||
|
Interest-bearing demand and money market |
$ | 42 | $ | (523 | ) | $ | (481 | ) | $ | 109 | $ | (505 | ) | $ | (396 | ) | ||||||||
|
Savings |
34 | (894 | ) | (860 | ) | (41 | ) | (1,297 | ) | (1,338 | ) | |||||||||||||
|
Certificates of deposit |
(2,321 | ) | (2,103 | ) | (4,424 | ) | (1,624 | ) | (6,364 | ) | (7,988 | ) | ||||||||||||
|
Federal funds purchased |
— | — | — | (1 | ) | — | (1 | ) | ||||||||||||||||
|
Securities sold under repurchase agreements |
(7 | ) | (4 | ) | (11 | ) | (65 | ) | (11 | ) | (76 | ) | ||||||||||||
|
Short-term borrowings |
(143 | ) | (1 | ) | (144 | ) | (374 | ) | (24 | ) | (398 | ) | ||||||||||||
|
Long-term borrowings |
(431 | ) | (121 | ) | (552 | ) | (3,687 | ) | (238 | ) | (3,925 | ) | ||||||||||||
|
Junior subordinated debt securities |
— | (368 | ) | (368 | ) | — | (410 | ) | (410 | ) | ||||||||||||||
|
Total Interest-bearing Liabilities |
(2,826 | ) | (4,014 | ) | (6,840 | ) | (5,683 | ) | (8,849 | ) | (14,532 | ) | ||||||||||||
|
Change in Net Interest Income |
$ | (4,446 | ) | $ | (4,527 | ) | $ | (8,973 | ) | $ | (2,844 | ) | $ | 2,133 | $ | (711 | ) | |||||||
| (1) |
The change in interest due to both volume and rate has been allocated to volume and rate changes in proportion to the relationship of the absolute dollar amounts of the change in each. |
| (2) |
Tax-exempt income is on a fully taxable-equivalent basis, including the dividend-received deduction for equity securities, using the statutory federal corporate income tax rate of 35 percent for 2011, 2010 and 2009. |
Net interest income and net interest margin on a fully taxable-equivalent basis have decreased in 2011 as compared to 2010. The decline in the net interest margin is a result of loan repricing and replacement volume at lower rates and an unfavorable shift in asset mix, offset in part by lower rates paid on deposits and a better funding mix between deposits, including noninterest-bearing demand deposits and borrowings.
The shift in asset mix during 2011 is primarily reflected by the $169.2 million decrease in average loans and an increase in average interest-bearing balance with banks of $123.7 million. The interest-bearing balance with banks is primarily funds held at the Federal Reserve and has increased during 2011 as a result of loan pay downs and weak demand for new loans. The yield on average loans and taxable investment securities decreased 21 basis points and 59 basis points, respectively. Overall, the fully taxable-equivalent yield on total interest-earning assets decreased 40 basis points to 4.58 percent in 2011 as compared to 4.98 percent in 2010.
For 2011, average interest-bearing deposits decreased by $89.3 million to $2.5 billion as compared to $2.6 billion 2010. The decrease in average interest-bearing deposits is attributed to a $119.0 million average balance decrease in certificates of deposits or, CDs, primarily in brokered CDs. The cost of deposits totaled 0.93 percent, a decrease of 19 basis points from 2010 due to lower rates paid on deposits. The cost of securities sold under repurchase agreements, or REPOs, and other short-term borrowed funds decreased 14 basis points to 0.13 percent as a result of lower short-term rates as compared to 2010. Overall, the yield on interest-bearing liabilities decreased 19 basis points to 1.05 percent for 2011 as compared to 2010.
PAGE 35
Table of Contents
Item 7. MANAGEMENT’S DISCUSSION AND ANALYSIS OF FINANCIAL CONDITION AND RESULTS OF OPERATIONS — continued
Positively affecting net interest income was a $121.2 million increase in average net free funds during 2011, as compared to 2010. Average net free funds are the excess of noninterest-bearing demand deposits, other noninterest-bearing liabilities and shareholders’ equity over noninterest-earning assets. The largest driver of the increase in net free funds was an increase in noninterest-bearing demand deposit average balances, which is a result of limited investment options available to our customers in this current low rate environment.
Provision for Loan Losses
The provision for loan losses is the amount to be added to the ALL after adjusting for charge-offs and recoveries to bring the ALL to a level considered appropriate to absorb probable losses inherent in the loan portfolio. The provision for loan losses decreased to $15.6 million for 2011 compared to $29.5 million for 2010. The substantial decrease in provision for loan losses is a result of the overall improving economic conditions from the prior year and a significant decrease in net charge-offs. Net charge-offs decreased to $18.2 million, 0.56 percent of average loans in 2011 from $37.7 million or 1.11 percent of average loans in 2010 as overall asset quality improved during 2011. Refer to the Allowance for Loan Losses section of this Management’s Discussion and Analysis of Financial Condition and Results of Operations, or MD&A, for further details.
Noninterest Income
| Years Ended December 31 | 2011 | 2010 | $ Change | |||||||||
| (in thousands) | ||||||||||||
|
Security (losses) gains, net |
$ | (124 | ) | $ | 274 | $ | (398 | ) | ||||
|
Debit and credit card fees |
10,889 | 9,954 | 935 | |||||||||
|
Service charges on deposit accounts |
9,978 | 11,178 | (1,200 | ) | ||||||||
|
Insurance fees |
8,314 | 8,312 | 2 | |||||||||
|
Wealth management fees |
8,180 | 7,808 | 372 | |||||||||
|
Mortgage banking |
1,199 | 3,403 | (2,204 | ) | ||||||||
|
Other |
5,621 | 6,281 | (660 | ) | ||||||||
|
Total Noninterest Income |
$ | 44,057 | $ | 47,210 | $ | (3,153 | ) | |||||
We experienced a decline of $3.2 million in our noninterest income in 2011 primarily as a result of regulatory changes and declining volumes in our mortgage banking area.
Service charges on deposit accounts decreased $1.2 million primarily relating to the impacts of Regulation E, which requires customers with existing accounts to opt in for overdraft coverage of certain types of electronic banking activities. Regulation E caused service charge income to decrease by $1.8 million in 2011, which we offset in part by the introduction of a new paper statement fee in August of 2011. Paper statement fees generated $0.5 million in revenue in 2011. We expect customers to continue to elect to receive electronic bank statements; therefore it is expected that paper statement fee income will decline in future periods.
Mortgage banking includes fee income related to loans sold in the secondary market, mortgage servicing income and fair value adjustments associated with valuing mortgage derivatives. Although interest rates continue to be low, the volume of loan sales in the secondary market have decreased resulting in a $2.2 million decrease in mortgage banking income. During 2011, we sold $67.9 million of 1-4 family mortgage loans to Fannie Mae compared to $109.3 million in 2010 which resulted in a fee reduction of $0.9 million. In the second quarter of 2011, we began to retain within the loan portfolio 10 and 15 year mortgages which had previously been priced and underwritten using secondary market terms and guidelines. Additionally, we recorded higher impairment charges on our
PAGE 36
Table of Contents
Item 7. MANAGEMENT’S DISCUSSION AND ANALYSIS OF FINANCIAL CONDITION AND RESULTS OF OPERATIONS — continued
mortgage servicing asset in 2011 compared to 2010. This impairment charge reflects a decline in the value of the remaining mortgage servicing rights due to increased prepayment speeds resulting from decreases in interest rates.
We recognized $0.1 million in security losses in 2011 related to OTTI on two equity securities compared to realized gains of $0.3 million in the prior year. In the prior year, OTTI was not significant and we experienced gains as we sold several of our equity positions.
The decreases in noninterest income are partially offset by increases of $0.9 million in debit and credit card fees and $0.4 million in wealth management fees. Debit and credit card fees have increased $0.9 million in 2011 as a result of increased volume and successful marketing campaigns around signature based debit card transactions throughout 2011. Our wealth management fees increased $0.4 million from the prior year. We experienced increased fee income of $0.2 million as our customers moved to fixed annuities in this low interest rate environment. Additionally, wealth management fees were positively impacted by improving market conditions in 2011.
Noninterest Expense
| Years Ended December 31 | 2011 | 2010 | $ Change | |||||||||
| (in thousands) | ||||||||||||
|
Salaries and employee benefits |
$ | 51,078 | $ | 48,715 | $ | 2,363 | ||||||
|
Net occupancy |
6,943 | 6,928 | 15 | |||||||||
|
Data processing |
6,853 | 6,145 | 708 | |||||||||
|
Professional services and legal |
5,437 | 6,889 | (1,452 | ) | ||||||||
|
Furniture and equipment |
4,941 | 5,054 | (113 | ) | ||||||||
|
FDIC assessment |
3,570 | 5,426 | (1,856 | ) | ||||||||
|
Other taxes |
3,381 | 3,432 | (51 | ) | ||||||||
|
Joint venture amortization |
3,302 | 2,573 | 729 | |||||||||
|
Marketing |
3,019 | 2,795 | 224 | |||||||||
|
Other expenses: |
||||||||||||
|
Amortization of intangibles |
1,737 | 1,943 | (206 | ) | ||||||||
|
Other real estate owned |
1,518 | 1,921 | (403 | ) | ||||||||
|
Loan collection fees |
624 | 1,770 | (1,146 | ) | ||||||||
|
Unfunded loan commitments |
(1,474 | ) | (1,555 | ) | 81 | |||||||
|
Other |
12,979 | 13,597 | (618 | ) | ||||||||
|
Total Noninterest Expense |
$ | 103,908 | $ | 105,633 | $ | (1,725 | ) | |||||
We had a slight decline in noninterest expense of $1.7 million during 2011. This was primarily a result of certain one-time expenses in 2010 and a significant decrease in our FDIC assessment in 2011.
The decrease in professional services and legal expense is due to $2.3 million of legal settlement costs that occurred in the first and second quarters of 2010. The decrease in the FDIC assessment of $1.9 million is the result of the FDIC changing the methodology used to calculate the assessment as of April 1, 2011 and the expiration of the FDIC’s Transaction Account Guarantee Program on December 31, 2010. Asset quality improved throughout 2011 resulting in $1.1 million less in loan collection fees. While these expenses have declined from the prior year, we expect to continue to experience elevated costs in this area as our criticized and classified loans remain above historic averages. For the year ended December 31, 2011, $1.5 million of unfunded loan commitments was reversed compared to $1.6 million for the year ended December 31, 2010. The reversal of the reserve is primarily attributable to the decline in available commitments. Additionally, approximately
PAGE 37
Table of Contents
Item 7. MANAGEMENT’S DISCUSSION AND ANALYSIS OF FINANCIAL CONDITION AND RESULTS OF OPERATIONS — continued
$0.8 million of the reserve reversal in 2011 related to an expense recognized in 2008 for a letter of credit that we were contractually obligated to fulfill. During the third quarter of 2011, the letter of credit was drawn upon and funded and a corresponding loan charge-off was recorded. Other noninterest expense decreased $0.6 million primarily related to a $1.2 million write-off of an uncollectible receivable in the third quarter of 2010. The receivable related to expenses for a mutual fund advised by an affiliate.
We had a $2.4 million increase in salaries and employee benefits primarily due to the full year impact of our annual merit increase resulting in additional salary expense of $1.0 million for 2011. Additionally, restricted stock expense increased $0.7 million related to the 2010 incentive plan and a newly implemented long-term incentive plan. Incentive plans were re-instituted in 2010 which impacted the 2011 expense. Deferred loan origination costs are down by $0.9 million from 2010, which increases salaries and employee benefits in the current period since we are deferring less costs. These increases were offset by a decrease in the pension plan expense of $0.3 million due to a change in the number of participants in the plan. We do not expect to see a similar decrease in pension expense in 2012 as a result of a significant increase in our pension liability due to a decline in the discount rate of 100 basis points to 4.75%.
The $0.7 million in additional data processing costs relate to one-time charges for the implementation of mobile banking and other system conversion fees. The increase of $0.7 million in joint venture amortization reflects the addition of two low income housing projects that were completed in 2011.
Our efficiency ratio, which measures noninterest expense as a percent of noninterest income plus net interest income, on a fully taxable-equivalent basis, excluding security gains/losses, was 56 percent for 2011 and 54 percent for 2010. Refer to page 58 Explanation of Use of Non-GAAP Financial Measures for a discussion of this non-GAAP financial measure.
Federal Income Taxes
We recorded a federal income tax provision of $14.6 million in 2011 compared to $14.4 million in 2010. The effective tax rate, which is the provision for income taxes as a percentage of pretax income was 23.6 percent compared to 25.0 percent in 2010. We ordinarily generate an annual effective tax rate that is less than the statutory rate of 35 percent due to benefits resulting from tax-exempt interest, excludable dividend income, tax-exempt interest on bank owned life insurance, or BOLI and tax benefits associated with Low Income Housing Tax Credit, or LIHTC, and Federal Historic Tax Credit Projects, which are relatively consistent regardless of the level of pretax income.
Results of Operations
Year Ended December 31, 2010
Net Income
Net income available to common shareholders for 2010 was $37.3 million resulting in diluted earnings per common share of $1.34 compared to $2.0 million or $0.07 diluted earnings per common share in 2009. The substantial increase in net income was primarily a result of a reduction of $42.8 million in provision for loan losses, improving market conditions resulting in minimal OTTI charges compared to $5.3 million in 2009 and a decrease in FDIC insurance assessments of $3.0 million.
PAGE 38
Table of Contents
Item 7. MANAGEMENT’S DISCUSSION AND ANALYSIS OF FINANCIAL CONDITION AND RESULTS OF OPERATIONS — continued
Return on Equity and Assets
The table below presents our consolidated profitability and capital ratios for each of the last three years:
| Years Ended December 31 | 2010 | 2009 | 2008 | |||||||||
|
Common return on average assets |
0.90% | 0.05% | 1.52% | |||||||||
|
Common return on average equity |
6.58% | 0.37% | 14.77% | |||||||||
|
Dividend payout ratio |
44.75% | 1247.64% | 53.66% | |||||||||
|
Common equity to asset ratio |
11.48% | 10.74% | 10.11% | |||||||||
Net Interest Income
The interest income on interest-earning assets and the net interest margin are presented on a fully taxable-equivalent basis. The fully taxable-equivalent basis adjusts for the tax benefit of income on certain tax-exempt loans and investments using the federal statutory tax rate of 35 percent for each period. We believe this measure to be the preferred industry measurement of net interest income that provides a relevant comparison between taxable and non-taxable amounts.
The following table reconciles interest income per the Consolidated Statements of Income to net interest income adjusted to a fully taxable-equivalent basis:
| Years Ended December 31 | 2010 | 2009 | 2008 | |||||||||
| (in thousands) | ||||||||||||
|
Interest income per Consolidated Statements of Income |
$ | 180,419 | $ | 195,087 | $ | 216,118 | ||||||
|
Adjustment to fully taxable-equivalent basis |
4,627 | 5,202 | 5,147 | |||||||||
|
Interest income adjusted to fully taxable-equivalent basis |
185,046 | 200,289 | 221,265 | |||||||||
|
Interest expense per Consolidated Statements of Income |
34,573 | 49,105 | 72,171 | |||||||||
|
Net Interest Income Adjusted to Fully Taxable-equivalent Basis (non-GAAP) |
$ | 150,473 | $ | 151,184 | $ | 149,094 | ||||||
PAGE 39
Table of Contents
Item 7. MANAGEMENT’S DISCUSSION AND ANALYSIS OF FINANCIAL CONDITION AND RESULTS OF OPERATIONS — continued
Average Balance Sheet and Net Interest Income Analysis
The following table provides information regarding the average balances, interest and yields earned on interest-earning assets and the average balances, interest and rates paid on interest-bearing liabilities:
| December 31 | 2010 | 2009 | 2008 | |||||||||||||||||||||||||||||||||
|
Average
Balance |
Interest |
Yield/
Rate |
Average
Balance |
Interest |
Yield/
Rate |
Average
Balance |
Interest |
Yield/
Rate |
||||||||||||||||||||||||||||
| (in thousands) | ||||||||||||||||||||||||||||||||||||
|
ASSETS |
||||||||||||||||||||||||||||||||||||
|
Loans (1)(2) |
$ | 3,386,103 | $ | 172,319 | 5.09 | % | $ | 3,473,169 | $ | 182,767 | 5.26 | % | $ | 3,230,791 | $ | 201,547 | 6.24% | |||||||||||||||||||
|
Taxable investment securities |
226,714 | 8,373 | 3.69 | % | 286,295 | 11,897 | 4.16 | % | 303,442 | 13,651 | 4.50% | |||||||||||||||||||||||||
|
Tax-exempt investment securities (2) |
76,707 | 4,354 | 5.68 | % | 103,832 | 5,624 | 5.42 | % | 105,781 | 5,429 | 5.13% | |||||||||||||||||||||||||
|
Federal Home Loan Bank stock |
23,336 | — | — | % | 23,542 | — | — | % | 20,733 | 636 | 3.07% | |||||||||||||||||||||||||
|
Interest-bearing balance with banks |
49 | — | 0.34 | % | 54 | — | 0.17 | % | 84 | 2 | 2.14% | |||||||||||||||||||||||||
|
Federal funds sold |
— | — | — | % | 258 | 1 | 0.25 | % | 124 | 2 | 1.90% | |||||||||||||||||||||||||
|
Total Interest-earning Assets |
3,712,909 | 185,046 | 4.98 | % | 3,887,150 | 200,289 | 5.15 | % | 3,660,955 | 221,265 | 6.04% | |||||||||||||||||||||||||
|
Noninterest-earning assets: |
||||||||||||||||||||||||||||||||||||
|
Cash and due from banks |
90,462 | 67,405 | 60,636 | |||||||||||||||||||||||||||||||||
|
Premises and equipment, net |
39,142 | 41,915 | 41,702 | |||||||||||||||||||||||||||||||||
|
Other assets |
340,234 | 320,803 | 246,811 | |||||||||||||||||||||||||||||||||
|
Less allowance for loan losses |
(59,292 | ) | (57,985 | ) | (39,102 | ) | ||||||||||||||||||||||||||||||
|
Total Assets |
$ | 4,123,455 | $ | 4,259,288 | $ | 3,971,002 | ||||||||||||||||||||||||||||||
|
LIABILITIES AND SHAREHOLDERS’ EQUITY |
|
|||||||||||||||||||||||||||||||||||
|
Interest-bearing liabilities: |
||||||||||||||||||||||||||||||||||||
|
Interest-bearing demand and money market |
$ | 518,383 | $ | 1,220 | 0.24 | % | $ | 485,742 | $ | 1,616 | 0.33 | % | $ | 395,629 | $ | 3,022 | 0.76% | |||||||||||||||||||
|
Savings |
749,325 | 2,127 | 0.28 | % | 758,216 | 3,465 | 0.46 | % | 865,839 | 11,692 | 1.35% | |||||||||||||||||||||||||
|
Certificates of deposit |
1,300,803 | 25,370 | 1.95 | % | 1,367,372 | 33,358 | 2.44 | % | 1,102,717 | 37,650 | 3.41% | |||||||||||||||||||||||||
|
Federal funds purchased |
— | — | — | % | 115 | 1 | 0.79 | % | 4,886 | 122 | 2.52% | |||||||||||||||||||||||||
|
Securities sold under repurchase agreements |
46,490 | 64 | 0.14 | % | 86,616 | 140 | 0.16 | % | 124,005 | 1,627 | 1.31% | |||||||||||||||||||||||||
|
Short-term borrowings |
32,473 | 146 | 0.45 | % | 104,217 | 544 | 0.52 | % | 227,918 | 4,263 | 1.87% | |||||||||||||||||||||||||
|
Long-term borrowings |
42,920 | 1,643 | 3.83 | % | 127,045 | 5,568 | 4.38 | % | 196,901 | 9,416 | 4.78% | |||||||||||||||||||||||||
|
Junior subordinated debt securities |
90,619 | 4,003 | 4.42 | % | 90,619 | 4,413 | 4.87 | % | 69,872 | 4,379 | 6.27% | |||||||||||||||||||||||||
|
Total Interest-bearing Liabilities |
2,781,013 | 34,573 | 1.24 | % | 3,019,942 | 49,105 | 1.63 | % | 2,987,767 | 72,171 | 2.42% | |||||||||||||||||||||||||
|
Noninterest-bearing liabilities: |
||||||||||||||||||||||||||||||||||||
|
Noninterest-bearing demand |
728,708 | 637,434 | 533,096 | |||||||||||||||||||||||||||||||||
|
Other liabilities |
47,064 | 57,377 | 42,478 | |||||||||||||||||||||||||||||||||
|
Shareholders’ equity |
566,670 | 544,535 | 407,661 | |||||||||||||||||||||||||||||||||
|
Total Liabilities and Shareholders’ Equity |
$ | 4,123,455 | $ | 4,259,288 | $ | 3,971,002 | ||||||||||||||||||||||||||||||
|
Net Interest Income |
$ | 150,473 | $ | 151,184 | $ | 149,094 | ||||||||||||||||||||||||||||||
|
Net Yield on Interest-earning Assets |
4.05 | % | 3.89 | % | 4.07% | |||||||||||||||||||||||||||||||
| (1) |
For the purpose of these computations, nonaccruing loans are included in the daily average loan amounts outstanding. |
| (2) |
Tax-exempt income is on a fully taxable-equivalent basis, including the dividend-received deduction for equity securities, using the statutory federal corporate income tax rate of 35 percent for 2010, 2009 and 2008. |
PAGE 40
Table of Contents
Item 7. MANAGEMENT’S DISCUSSION AND ANALYSIS OF FINANCIAL CONDITION AND RESULTS OF OPERATIONS — continued
The following table presents a summary of the changes in interest earned and interest paid resulting from changes in average balance and changes in rates:
|
2010 Compared to 2009
Increase (Decrease) Due to (1) |
2009 Compared to 2008
Increase (Decrease) Due to (1) |
|||||||||||||||||||||||
| Volume | Rate | Net | Volume | Rate | Net | |||||||||||||||||||
| (in thousands) | ||||||||||||||||||||||||
|
Interest earned on: |
||||||||||||||||||||||||
|
Loans (2) |
$ | (4,581 | ) | $ | (5,867 | ) | $ | (10,448 | ) | $ | 15,120 | $ | (33,900 | ) | $ | (18,780 | ) | |||||||
|
Taxable investment securities |
(2,476 | ) | (1,048 | ) | (3,524 | ) | (771 | ) | (983 | ) | (1,754 | ) | ||||||||||||
|
Tax-exempt investment securities (2) |
(1,469 | ) | 199 | (1,270 | ) | (100 | ) | 295 | 195 | |||||||||||||||
|
Interest bearing balance with bank |
— | — | — | — | — | — | ||||||||||||||||||
|
Other investments |
— | — | — | 86 | (722 | ) | (636 | ) | ||||||||||||||||
|
Federal funds sold |
(1 | ) | — | (1 | ) | 3 | (4 | ) | (1 | ) | ||||||||||||||
|
Total Interest-earning Assets |
(8,527 | ) | (6,716 | ) | (15,243 | ) | 14,338 | (35,314 | ) | (20,976 | ) | |||||||||||||
|
Interest paid on: |
||||||||||||||||||||||||
|
Interest-bearing demand and money market |
$ | 109 | $ | (505 | ) | $ | (396 | ) | $ | 688 | $ | (2,094 | ) | $ | (1,406 | ) | ||||||||
|
Savings deposits |
(41 | ) | (1,297 | ) | (1,338 | ) | (1,453 | ) | (6,774 | ) | (8,227 | ) | ||||||||||||
|
Certificates of deposit |
(1,624 | ) | (6,364 | ) | (7,988 | ) | 9,036 | (13,328 | ) | (4,292 | ) | |||||||||||||
|
Federal funds purchased |
(1 | ) | — | (1 | ) | (119 | ) | (2 | ) | (121 | ) | |||||||||||||
|
Securities sold under repurchase agreements |
(65 | ) | (11 | ) | (76 | ) | (491 | ) | (996 | ) | (1,487 | ) | ||||||||||||
|
Short-term borrowings |
(374 | ) | (24 | ) | (398 | ) | (2,314 | ) | (1,405 | ) | (3,719 | ) | ||||||||||||
|
Long-term borrowings |
(3,687 | ) | (238 | ) | (3,925 | ) | (3,341 | ) | (507 | ) | (3,848 | ) | ||||||||||||
|
Junior subordinated debt securities |
— | (410 | ) | (410 | ) | 1,300 | (1,266 | ) | 34 | |||||||||||||||
|
Total Interest-bearing Liabilities |
(5,683 | ) | (8,849 | ) | (14,532 | ) | 3,306 | (26,372 | ) | (23,066 | ) | |||||||||||||
|
Change in Net Interest Income |
$ | (2,844 | ) | $ | 2,133 | $ | (711 | ) | $ | 11,032 | $ | (8,942 | ) | $ | 2,090 | |||||||||
| (1) |
The change in interest due to both volume and rate has been allocated to volume and rate changes in proportion to the relationship of the absolute dollar amounts of the change in each. |
| (2) |
Tax-exempt income is on a fully taxable-equivalent basis, including the dividend-received deduction for equity securities, using the statutory federal corporate income tax rate of 35 percent for 2010, 2009 and 2008. |
On a fully taxable-equivalent basis, net interest income decreased by only $0.7 million in 2010 compared to 2009 despite a $174.2 million decrease in average interest-earning assets. Net interest margin on a fully taxable-equivalent basis was 4.05 percent in 2010 as compared to 3.89 percent in 2009. The improvement in the net interest margin is mainly a result of interest-bearing liabilities repricing faster than interest-earning assets, and a better funding mix between deposits, including noninterest-bearing demand deposits, and borrowings. The net interest margin improvement was also due to an increase in payments collected on nonperforming loans in 2010 compared to 2009.
For 2010, average loans decreased $87.1 million and average securities and federal funds sold decreased $87.2 million as compared to 2009. The yield on average loans decreased 17 basis points and the yield on average securities decreased 34 basis points from 2009. Overall, the fully tax-equivalent yield on total interest-earning assets decreased 17 basis points to 4.98 percent in 2010 as compared to 5.15 percent in 2009.
For 2010, average interest-bearing deposits decreased by $42.8 million as compared to 2009. The decrease in average interest-bearing deposits is mainly attributed to a $38.5 million average balance decrease in brokered CD’s. The cost of deposits totaled 1.12 percent, a decrease of 35 basis points from 2009 due to lower rates paid on deposits. The cost of REPOs and other short-term borrowed funds decreased nine basis points to 0.27 percent as a result of lower short-term rates as compared to 2009. Overall, the yield on interest-bearing liabilities decreased 39 basis points to 1.24 percent for 2010 as compared to 2009.
PAGE 41
Table of Contents
Item 7. MANAGEMENT’S DISCUSSION AND ANALYSIS OF FINANCIAL CONDITION AND RESULTS OF OPERATIONS — continued
Also positively affecting net interest income was a $64.7 million increase in average net free funds during 2010 as compared to 2009. Average net free funds are the excess of noninterest-bearing demand deposits, other noninterest-bearing liabilities and shareholders’ equity over noninterest-earning assets. The largest driver of the increase in net free funds was noninterest-bearing demand deposit average balances. The increase in demand deposit average balance is due to the low interest rate environment, our marketing efforts for new demand accounts, corporate cash management services and participation in the Transaction Account Guarantee, or TAG Program.
Provision for Loan Losses
The provision for loan losses is determined based upon management’s estimates of the appropriate level of ALL needed to absorb probable inherent losses that exist in our loan portfolio. The provision for loan losses was $29.5 million for 2010 compared to $72.4 million for 2009. The substantial decrease in provision for loan losses is a result of the overall improving economic conditions from the prior year and a significant decrease in net charge-offs. Net charge-offs decreased to $37.7 million in 2010 from $55.5 million in 2009 as overall asset quality improved during 2010. Refer to the Allowance for Loan Losses section of this MD&A for further details.
Noninterest Income
| Years Ended December 31 | 2010 | 2009 | $ Change | |||||||||
| (in thousands) | ||||||||||||
|
Security gains (losses), net |
$ | 274 | $ | (5,088 | ) | $ | 5,362 | |||||
|
Service charges on deposit accounts |
11,178 | 12,344 | (1,166 | ) | ||||||||
|
Debit and credit card fees |
9,954 | 6,921 | 3,033 | |||||||||
|
Insurance fees |
8,312 | 7,751 | 561 | |||||||||
|
Wealth management fees |
7,808 | 7,500 | 308 | |||||||||
|
Mortgage banking |
3,403 | 2,727 | 676 | |||||||||
|
Other income: |
||||||||||||
|
Rabbi trust |
200 | 643 | (443 | ) | ||||||||
|
Derivative fee income |
136 | 406 | (270 | ) | ||||||||
|
Commercial loan rate swap valuation |
96 | (616 | ) | 712 | ||||||||
|
Other |
5,849 | 5,992 | (143 | ) | ||||||||
|
Total Noninterest Income |
$ | 47,210 | $ | 38,580 | $ | 8,630 | ||||||
We recognized net gains of $0.3 million on available-for-sale equity securities for the year ended December 31, 2010 as compared to $5.1 million of net losses in 2009. In 2009, we recognized $5.3 million in OTTI charges on 17 bank equity holdings. During 2010, overall market conditions improved substantially resulting in minimal OTTI charges.
Noninterest income increased $8.6 million to $47.2 million in 2010 as compared to 2009. The increase of $0.6 million in insurance fees is due to higher annual bonus commission income received in the first quarter of 2010 based upon positive trends in loss rates. Mortgage banking activities increased $0.7 million due to improved loan pricing despite a decrease of mortgages sold in the secondary market of $109.3 million compared to 2009. Debit and credit card fees increased $3.0 million primarily due to a reclass out of other noninterest income and a change in accounting from a net method of recognizing ATM interchange fees and costs in 2009 to recognizing the gross fees and gross costs individually in 2010, which accounted for $2.3 million of the increase. In addition, the increase in the volume of transactions and the conversion to an exclusive provider
PAGE 42
Table of Contents
Item 7. MANAGEMENT’S DISCUSSION AND ANALYSIS OF FINANCIAL CONDITION AND RESULTS OF OPERATIONS — continued
accounted for $0.5 million of the increase. The change of $0.7 million in commercial loan rate swap valuation relates to a $0.6 million charge for an additional credit exposure on an exited commercial loan swap asset that was recorded in 2009. These increases were partially offset by a decrease of $1.2 million in service charges on deposit accounts, primarily customer overdraft fees, due to the implementation of Regulation E on August 15, 2010. Regulation E requires customers with existing accounts to opt in for overdraft coverage of certain types of electronic banking activities. Many customers did not opt to continue the coverage resulting in a decrease in customer overdraft fees collected.
Noninterest Expense
| Years Ended December 31 | 2010 | 2009 | $ Change | |||||||||
| (in thousands) | ||||||||||||
|
Salaries and employee benefits |
$ | 48,715 | $ | 48,848 | $ | (133 | ) | |||||
|
Net Occupancy |
6,928 | 6,819 | 109 | |||||||||
|
Professional services and legal |
6,889 | 4,220 | 2,669 | |||||||||
|
Data processing |
6,145 | 6,048 | 97 | |||||||||
|
FDIC assessment |
5,426 | 8,388 | (2,962 | ) | ||||||||
|
Furniture and equipment |
5,054 | 4,991 | 63 | |||||||||
|
Other taxes |
3,432 | 3,733 | (301 | ) | ||||||||
|
Marketing |
2,794 | 2,751 | 43 | |||||||||
|
Joint venture amortization |
2,573 | 4,393 | (1,820 | ) | ||||||||
|
Other expenses: |
||||||||||||
|
Other real estate owned |
1,921 | 759 | 1,162 | |||||||||
|
Loan collection fees |
1,770 | 1,325 | 445 | |||||||||
|
Unfunded loan commitments |
(1,555 | ) | 2,888 | (4,443 | ) | |||||||
|
Other |
15,541 | 12,963 | 2,578 | |||||||||
|
Total Noninterest Expense |
$ | 105,633 | $ | 108,126 | $ | (2,493 | ) | |||||
Noninterest expense decreased by $2.5 million during 2010 compared to 2009. Decreases included $1.8 million in joint venture impairment and amortization expense that related to an impairment adjustment on a LIHTC project of $2.0 million in 2009. No significant impairment was recorded in 2010. The FDIC assessment decreased $3.0 million primarily due to a special assessment charged to all banks in the second quarter of 2009. The decrease of $4.4 million in unfunded loan commitments relates to a reduction in the reserve.
Offsetting the above mentioned decreases were increases of $2.7 million in professional services and legal expenses related to a $2.3 million one-time legal settlement cost that occurred in the first and second quarters of 2010. A $1.2 million increase in OREO expense relates to higher costs due to an increase in OREO properties in 2010. Additionally, the increase of $2.6 million in other noninterest expense relates primarily to the previously mentioned $2.3 million reclassification of ATM interchange income, as well as a $0.9 million increase in the write-off of an uncollectible receivable relating to excess expenses for a mutual fund advised by an affiliate.
Our efficiency ratio, which measures noninterest expense as a percent of noninterest income plus net interest income on a fully taxable-equivalent basis, excluding security gains/losses, was 54 percent for 2010 and 55 percent for 2009. Refer to page 58 Explanation of Use of Non-GAAP Financial Measures for a discussion of this non-GAAP financial measure.
PAGE 43
Table of Contents
Item 7. MANAGEMENT’S DISCUSSION AND ANALYSIS OF FINANCIAL CONDITION AND RESULTS OF OPERATIONS — continued
Federal Income Taxes
A federal income tax provision of $14.4 million was recognized in 2010 attributable to pretax income of $57.9 million for the year, compared to a tax benefit of $3.9 million on pretax income of $4.1 million for 2009.
The effective tax rate for 2010 was 24.9 percent and negative 94.7 percent in 2009. We ordinarily generate an annual effective tax rate that is less than the statutory rate of 35 percent due to benefits resulting from tax-exempt interest, excludable dividend income, tax-exempt interest in BOLI and tax benefits associated with LIHTC and Federal Historic Tax Credit Projects, which are relatively consistent regardless of the level of pretax income.
The consistent level of tax benefits that reduce our tax rate below the 35 percent statutory rate, coupled with relatively low level of annual pretax income, produced a negative annual effective tax rate for 2009.
Financial Condition
December 31, 2011
Our total assets of $4.1 million remain relatively unchanged since December 31, 2010. Loan growth continues to be our biggest challenge as borrowers continue to be uncertain about the state of the economy. Total gross loans decreased $225.8 million to $3.1 billion at December 31, 2011 compared to $3.4 billion at December 31, 2010. Our commercial loan portfolio has experienced the most significant decrease due to soft demand, loan pay downs and planned run-off of certain loans to reduce our overall risk. Given the lack of loan growth and substantial loan pay downs that we have been experiencing during 2011, we have increased our securities by $69.6 million and excess cash held at the Federal Reserve by $148.8 million. Our strong capital position allowed us to fully redeem the preferred stock held by the U.S. Treasury as part of the CPP, without having to raise additional equity. Our core deposit base remains strong and total deposits were $3.3 billion at both December 31, 2011 and December 31, 2010. We did experience an improvement in our mix of deposits throughout 2011. Our overall borrowings increased $67.2 million to $227.9 million at December 31, 2011 compared to $160.6 million at December 31, 2010. We utilized available cash to redeem the preferred stock and increased borrowings subsequent to the pay-off to maintain our overall liquidity position.
Securities Activity
| December 31 | 2011 | 2010 | 2009 | |||||||||
| (in thousands) | ||||||||||||
|
Obligations of U.S. government corporations and agencies |
$ | 142,786 | $ | 125,675 | $ | 127,971 | ||||||
|
Collateralized mortgage obligations of U.S. government corporations and agencies |
65,395 | 41,491 | 60,229 | |||||||||
|
Mortgage-backed securities of U.S. government corporations and agencies |
48,752 | 43,991 | 61,521 | |||||||||
|
Obligations of states and political subdivisions |
88,805 | 65,772 | 92,928 | |||||||||
|
Marketable equity securities |
11,858 | 11,096 | 12,211 | |||||||||
|
Total Securities Available-for-Sale |
$ | 357,596 | $ | 288,025 | $ | 354,860 | ||||||
We invest in various securities in order to provide a source of liquidity, to satisfy various pledging requirements, increase net interest income and as a tool of the ALCO to reposition the balance sheet for interest rate risk purposes. Securities are subject to market risks that could negatively affect the
PAGE 44
Table of Contents
Item 7. MANAGEMENT’S DISCUSSION AND ANALYSIS OF FINANCIAL CONDITION AND RESULTS OF OPERATIONS — continued
level of liquidity available to us. Risks associated with various securities portfolios are managed and monitored by investment policies annually approved by our Board of Directors and administered through ALCO and our treasury function.
The increase in securities of $69.6 million from the prior year relates to $134.5 million in debt securities purchased offset by maturities, calls and normal pay downs. The purchases were part of the ALCO strategy to reinvest excess proceeds from loan pay downs and to replace security investments as they mature to maintain sufficient asset liquidity.
During 2011, we recorded minimal OTTI of $0.1 million related to bank equity holdings with a balance of $0.8 million that had been in a loss position for 12 months or more. This is in comparison to 2010 when we recorded less than $0.1 million in OTTI charges on 3 bank equity holdings totaling $2.1 million. The performance of the debt and equity securities markets could generate impairment in future periods requiring realized losses to be reported.
At December 31, 2011, net unrealized gains on securities classified as available-for-sale were approximately $14.9 million as compared to $8.1 million at December 31, 2010. Net unrealized gains related to our debt securities portfolio totaled $13.2 million at December 31, 2011 and $7.3 million at December 31, 2010. The increase in unrealized gains related to debt securities is due to a decrease in interest rates from the prior year. The marketable equity securities portfolio had net unrealized gains of $1.7 million at December 31, 2011 compared to net unrealized gains of $0.8 million at December 31, 2010. We do not intend to sell and it is not likely that we will be required to sell any of the securities in an unrealized loss position before recovery of its amortized cost.
We are a member of the Federal Home Loan Bank, or FHLB, of Pittsburgh. The FHLB requires members to purchase and hold a specified level of FHLB stock based upon their level and availability of borrowings and participation in other programs offered. Stock in the FHLB is non-marketable and is redeemable at the discretion of the FHLB. Members do not purchase stock in the FHLB for the same reasons that traditional equity investors acquire stock in an investor-owned enterprise. Rather, members purchase stock to obtain access to the low-cost products and services offered by the FHLB. Unlike equity securities of traditional for-profit enterprises, the stock of the FHLB does not provide its holders with an opportunity for capital appreciation because, by regulation, FHLB stock can only be purchased, redeemed and transferred at par value.
At December 31, 2011 and 2010, FHLB stock totaled $18.2 million and $22.4 million, respectively. This investment is carried at cost and evaluated for impairment based on the ultimate recoverability of the par value. We reviewed and evaluated the FHLB capital stock for OTTI at December 31, 2011 through review of their most recent Form 10-Q for the period ended September 30, 2011. Based upon our review of their current financial position and redemptions of $4.1 million that we received in 2011, we do not believe OTTI exists at December 31, 2011. Subsequent to December 31, 2011, we received from the FHLB a redemption of $0.9 million of capital stock and a nominal dividend.
PAGE 45
Table of Contents
Item 7. MANAGEMENT’S DISCUSSION AND ANALYSIS OF FINANCIAL CONDITION AND RESULTS OF OPERATIONS — continued
The following table sets forth the maturities of securities at December 31, 2011 and the weighted average yields of such securities. Taxable-equivalent adjustments (using a 35 percent federal income tax rate) for 2011 have been made in calculating yields on obligations of state and political subdivisions.
| Maturing | ||||||||||||||||||||||||||||||||||||
|
Within
One Year |
After
One But Within Five Years |
After
Five But Within Ten Years |
After
Ten Years |
No Fixed
Maturity |
||||||||||||||||||||||||||||||||
| Amount | Yield | Amount | Yield | Amount | Yield | Amount | Yield | Amount | ||||||||||||||||||||||||||||
| (in thousands) | ||||||||||||||||||||||||||||||||||||
|
Available-for-Sale |
||||||||||||||||||||||||||||||||||||
|
Obligations of U.S. government corporations and agencies |
— | — | % | 131,665 | 1.92 | % | 11,121 | 3.25 | % | — | — | % | — | |||||||||||||||||||||||
|
Collateralized mortgage obligations of U.S. government corporations and agencies |
— | — | % | 9,022 | 4.46 | % | — | — | % | 56,373 | 3.49 | % | — | |||||||||||||||||||||||
|
Mortgage-backed securities of U.S. government corporations and agencies |
— | — | % | 375 | 3.98 | % | 11,312 | 4.40 | % | 37,065 | 4.38 | % | — | |||||||||||||||||||||||
|
Obligations of states and political subdivisions |
8,721 | 4.22 | % | 15,901 | 5.39 | % | 8,360 | 6.23 | % | 55,823 | 5.09 | % | — | |||||||||||||||||||||||
|
Marketable equity securities |
$ | — | — | % | $ | — | — | % | $ | — | — | % | $ | — | — | % | $ | 11,858 | ||||||||||||||||||
| Total | $ | 8,721 | $ | 156,963 | $ | 30,793 | $ | 149,261 | $ | 11,858 | ||||||||||||||||||||||||||
|
Weighted Average Rate |
4.22 | % | 2.42 | % | 4.48 | % | 4.31 | % | ||||||||||||||||||||||||||||
PAGE 46
Table of Contents
Item 7. MANAGEMENT’S DISCUSSION AND ANALYSIS OF FINANCIAL CONDITION AND RESULTS OF OPERATIONS — continued
Lending Activity
The following table summarizes our loan distribution at the end of each of the last five years:
| 2011 | 2010 | 2009 | 2008 | 2007 | ||||||||||||||||||||||||||||||||||||
| December 31 | Amount |
% of
Total |
Amount |
% of
Total |
Amount |
% of
Total |
Amount |
% of
Total |
Amount |
% of
Total |
||||||||||||||||||||||||||||||
| (in thousands) | ||||||||||||||||||||||||||||||||||||||||
|
Consumer |
||||||||||||||||||||||||||||||||||||||||
|
Home equity |
$ | 411,404 | 13.14 | % | $ | 441,096 | 13.15 | % | $ | 458,643 | 13.49 | % | $ | 438,380 | 12.28 | % | $ | 294,413 | 10.53 | % | ||||||||||||||||||||
|
Residential mortgage |
358,846 | 11.47 | % | 359,536 | 10.71 | % | 357,393 | 10.52 | % | 408,603 | 11.45 | % | 318,067 | 11.37 | % | |||||||||||||||||||||||||
|
Installment and other consumer |
67,131 | 2.14 | % | 74,780 | 2.23 | % | 81,141 | 2.39 | % | 84,065 | 2.36 | % | 74,839 | 2.67 | % | |||||||||||||||||||||||||
|
Consumer construction |
2,440 | 0.08 | % | 4,019 | 0.12 | % | 11,836 | 0.35 | % | 13,014 | 0.36 | % | 6,157 | 0.22 | % | |||||||||||||||||||||||||
|
Total Consumer Loans |
839,821 | 26.83 | % | 879,431 | 26.21 | % | 909,013 | 26.75 | % | 944,062 | 26.45 | % | 693,476 | 24.79 | % | |||||||||||||||||||||||||
|
Commercial |
||||||||||||||||||||||||||||||||||||||||
|
Commercial real estate |
1,415,333 | 45.22 | % | 1,494,202 | 44.53 | % | 1,428,329 | 42.03 | % | 1,440,200 | 40.36 | % | 964,439 | 34.48 | % | |||||||||||||||||||||||||
|
Commercial and industrial |
685,753 | 21.91 | % | 722,359 | 21.52 | % | 701,650 | 20.65 | % | 822,543 | 23.05 | % | 815,306 | 29.15 | % | |||||||||||||||||||||||||
|
Commercial construction |
188,852 | 6.04 | % | 259,598 | 7.74 | % | 359,342 | 10.57 | % | 361,910 | 10.14 | % | 323,718 | 11.58 | % | |||||||||||||||||||||||||
|
Total Commercial Loans |
2,289,938 | 73.17 | % | 2,476,159 | 73.79 | % | 2,489,321 | 73.25 | % | 2,624,653 | 73.55 | % | 2,103,463 | 75.21 | % | |||||||||||||||||||||||||
|
Total Portfolio Loans |
$ | 3,129,759 | 100 | % | $ | 3,355,590 | 100 | % | $ | 3,398,334 | 100 | % | $ | 3,568,715 | 100 | % | $ | 2,796,939 | 100 | % | ||||||||||||||||||||
The loan portfolio represents the most significant source of interest income for us. The risk that borrowers will be unable to pay such obligations is inherent in the loan portfolio. Other conditions such as the overall economic climate can significantly impact the borrower’s ability to pay.
Total loans for the year ended December 31, 2011 were $3.1 billion, a $225.8 million decrease from the year ended December 31, 2010. Declines occurred in both the consumer and commercial loan portfolios due to less demand in our market area resulting from the current economic climate. The largest declines were in the commercial loan portfolio since commercial loans have been more impacted by the economic slowdown in our markets. We did experience some relief in the pace of loan pay downs in the latter half of 2011.
Commercial loans, including commercial real estate, or CRE, commercial and industrial, or C&I, and commercial construction, comprised 73 percent and 74 percent of total portfolio loans at December 31, 2011 and 2010, respectively. Although commercial loans can have a relatively higher risk profile, management believes these risks are mitigated through active portfolio management, conservative underwriting standards and continuous portfolio review. The loan-to-value policy guidelines for CRE loans are generally 65-85 percent. At December 31, 2011, variable rate commercial loans were 79 percent of the commercial loan portfolio as compared to 80 percent at December 31, 2010.
Home equity and residential mortgage loans comprised 25 percent of the loan portfolio in 2011 and 24 percent in 2010. Residential mortgage lending continues to be a strategic focus through a centralized mortgage origination department, ongoing product redesign, secondary market activities
PAGE 47
Table of Contents
Item 7. MANAGEMENT’S DISCUSSION AND ANALYSIS OF FINANCIAL CONDITION AND RESULTS OF OPERATIONS — continued
and the utilization of commission compensated originators. The loan-to-value policy guideline is 80 percent for residential first lien mortgages. Higher loan-to-value loans may be approved with the appropriate private mortgage insurance coverage. Second lien positions are assumed with home equity loans, but normally only to the extent that the combined credit exposure for both the first and second liens does not exceed 100 percent of the fair value of the property.
Management believes the downturn in the local residential real estate market and the impact of declining values on the real estate loan portfolio will be mitigated by our conservative mortgage lending policies for portfolio loans, which only permit a maximum term of 20 years. Balloon payment mortgages are also offered in the portfolio. The maximum balloon term is 15 years with a maximum amortization term of 30 years. Balloon mortgages with terms of 10 years or less may have a maximum amortization term for up to 40 years. Combo mortgage loans consisting of our residential first mortgage and home equity second mortgage are also available to credit worthy borrowers.
We also originate and price loans for sale into the secondary market, primarily to Federal National Mortgage Association, or FNMA. The rationale for these sales is to mitigate interest-rate risk associated with holding lower rate, long-term residential mortgages in the loan portfolio, generate fee revenue from sales and servicing and maintain the primary customer relationship. During the second quarter of 2011, we began to retain within the loan portfolio 10 and 15 year mortgages that had been priced and underwritten using secondary market terms and guidelines. During 2011 and 2010, we sold $67.9 million and $109.3 million, respectively, of 1–4 family mortgages to FNMA and currently service $332.6 million of secondary market mortgage loans at December 31, 2011 compared to $318.2 million at December 2010. Loans sold to FNMA decreased from the prior year due to both the change in strategy to sell only longer term mortgages as well as reduced refinance activity as many customers refinanced earlier in the cycle when rates first declined. We intend to continue to sell longer-term loans to FNMA in the future, especially during periods of lower interest rates.
We offer a variety of unsecured and secured consumer loan and credit card products. Loan-to-value policy guidelines for direct loans are 90–100 percent of invoice for new automobiles and 80–90 percent of National Automobile Dealer Association, or NADA, value for used automobiles.
Loan underwriting standards are established by a formal policy and are subject to periodic review and approval by the Board of Directors. During 2011, we implemented or enhanced various new policies and procedures to strengthen loan underwriting standards, including increased monitoring, improved risk ratings, stress testing and compliance in the area of commercial lending.
The following table presents the maturity of consumer and commercial loans outstanding as of December 31, 2011.
| Maturing | ||||||||||||||||
|
Within One
Year |
After One But
Within Five Years |
After Five
Years |
Total | |||||||||||||
| (in thousands) | ||||||||||||||||
|
Fixed interest rates |
$ | 62,909 | $ | 222,893 | $ | 285,172 | $ | 570,975 | ||||||||
|
Variable interest rates |
201,056 | 20,618 | 47,172 | 268,846 | ||||||||||||
|
Total Consumer Loans |
$ | 263,965 | $ | 243,511 | $ | 332,344 | $ | 839,821 | ||||||||
|
Fixed interest rates |
149,984 | 217,407 | 104,914 | 472,305 | ||||||||||||
|
Variable interest rates |
518,078 | 582,988 | 716,567 | 1,817,633 | ||||||||||||
|
Total Commercial Loans |
$ | 668,062 | $ | 800,395 | $ | 821,481 | $ | 2,289,938 | ||||||||
|
Total Portfolio Loans |
$ | 932,027 | $ | 1,043,907 | $ | 1,153,825 | $ | 3,129,759 | ||||||||
PAGE 48
Table of Contents
Item 7. MANAGEMENT’S DISCUSSION AND ANALYSIS OF FINANCIAL CONDITION AND RESULTS OF OPERATIONS — continued
Credit Quality
We monitor various credit quality indicators to mitigate the risk of adversely classified assets. We have a Criticized Asset Committee that meets quarterly and monitors all special mention loans greater than $1.0 million and substandard loans greater than $0.5 million. Additional credit risk management practices include periodic review and updates to lending policies and procedures surrounding sound underwriting practices and portfolio management expectations; a portfolio and loan stress testing initiative; and an independent loan review program developed to review underwriting decisions and adherence to policy, proper risk rating methodology and a review of all of our credit related business units. There can be no assurance that we will be successful in eliminating the risk with these loans and consequently they could result in losses for us.
We determine loans to be impaired when based upon current information and events it is probable that we will be unable to collect all principal and interest payments due according to the original contractual terms of the loan agreement. All of our TDRs are also classified as impaired, regardless of their size. Impaired loans are continually monitored by our Managed Assets Division.
Nonperforming assets consist of nonaccrual loans, TDRs and OREO. The following represents nonperforming assets for the periods presented:
| 2011 | 2010 | 2009 | 2008 | 2007 | ||||||||||||||||
| (in thousands) | ||||||||||||||||||||
|
Nonaccrual Loans |
||||||||||||||||||||
|
Commercial real estate |
$ | 20,777 | $ | 14,674 | $ | 52,380 | $ | 19,386 | $ | 7,359 | ||||||||||
|
Commercial and industrial |
7,570 | 2,567 | 7,489 | 3,341 | 6,119 | |||||||||||||||
|
Commercial construction |
3,604 | 5,844 | 21,674 | 13,848 | — | |||||||||||||||
|
Home equity |
2,936 | 1,433 | 2,252 | 174 | 71 | |||||||||||||||
|
Residential mortgage |
2,859 | 5,996 | 5,583 | 5,624 | 3,183 | |||||||||||||||
|
Installment and other consumer |
4 | 65 | 20 | 73 | 65 | |||||||||||||||
|
Consumer construction |
181 | 525 | — | — | — | |||||||||||||||
|
Total Nonaccrual Loans |
37,931 | 31,104 | 89,398 | 42,446 | 16,797 | |||||||||||||||
|
Nonaccrual Troubled Debt Restructurings |
||||||||||||||||||||
|
Commercial real estate |
10,871 | 29,636 | 1,409 | — | — | |||||||||||||||
|
Commercial and industrial |
— | 1,000 | — | — | — | |||||||||||||||
|
Commercial construction |
2,943 | 2,143 | — | — | — | |||||||||||||||
|
Residential mortgage |
4,370 | — | — | — | — | |||||||||||||||
|
Total Nonaccrual Troubled Debt Restructurings |
18,184 | 32,779 | 1,409 | — | — | |||||||||||||||
|
Total Nonperforming Loans |
56,115 | 63,883 | 90,807 | 42,446 | 16,797 | |||||||||||||||
|
OREO |
3,967 | 5,820 | 4,607 | 851 | 488 | |||||||||||||||
|
Total Nonperforming Assets |
$ | 60,082 | $ | 69,703 | $ | 95,414 | $ | 43,297 | $ | 17,285 | ||||||||||
|
Nonperforming loans as a percent of total loans |
1.79% | 1.90% | 2.67% | 1.19% | 0.60% | |||||||||||||||
|
Nonperforming assets as a percent of total loans plus OREO |
1.92% | 2.07% | 2.80% | 1.21% | 0.62% | |||||||||||||||
PAGE 49
Table of Contents
Item 7. MANAGEMENT’S DISCUSSION AND ANALYSIS OF FINANCIAL CONDITION AND RESULTS OF OPERATIONS — continued
Nonperforming assets decreased 13.8 percent from the prior year as a result of resolution of several credits either through the foreclosure process and subsequent sale of the property or ultimate charge-off of the loan. We had several relationships where we were able to work directly with the borrower to restructure the loan and after a period of performance, these loans have been placed back on accruing status. Overall, our nonperforming loan formation slowed significantly compared to the prior year. Our commercial real estate portfolio continues to represent a significant amount of our nonperforming loans. There are no loans 90 days or more past due and still accruing.
TDRs are loans where we, for economic or legal reasons related to a borrower’s financial difficulties, grant a concession to the borrower that we would not otherwise consider. Modifications to loans classified as TDR generally include reductions in contractual interest rates, principal deferment and extensions of maturity dates at a stated interest rate lower than the current market rate for a new loan with similar risk characteristics. Generally these concessions are for a period of at least six months. While unusual, there may be instances of loan principal forgiveness.
TDRs can be returned to accruing status if the following criteria are met: 1) the ultimate collectability of all contractual amounts due, according to the restructured agreement, is not in doubt and 2) there is a period of a minimum of six months of satisfactory payment performance by the borrower either immediately before or after the restructuring.
All TDRs are considered to be impaired loans and will be reported as impaired loans for their remaining lives, unless the restructuring agreement specifies an interest rate equal to or greater than the rate that would be accepted at the time of the restructuring for a new loan with comparable risk and we fully expected that the remaining principal and interest will be collected according to the restructured agreement. All impaired loans are reported as nonaccrual loans unless the loan is a TDR that has met the requirements noted above to be returned to accruing status. As an example, consider a substandard commercial real estate loan that is currently 30 days past due. The loan is restructured to reduce the interest rate of the loan, but all other terms remain in place according to the original loan agreement. The interest rate reduction results in a below market interest rate. This loan will be considered a TDR as the borrower is experiencing financial difficulty and a concession has been granted. At the time of the modification, the loan will be placed on nonaccrual status and reported as an impaired loan and a TDR. In addition, the loan will be charged down to the fair value of the collateral if the loan is collateral dependent. If the loan subsequently performs, by means of making on-time principal and interest payments according to the newly restructured terms for a period of six months, and it is expected that all remaining principal and interest will be collected according to the terms of the restructured agreement, the loan will be returned to accrual status and reported as an accruing TDR. The loan will remain an impaired loan for the remaining life of the loan since the interest rate was reduced to a below market rate.
As of December 31, 2011, we had $67.9 million in TDRs of which $49.7 million were accruing and $18.2 were in nonaccrual status. During 2011, many of these TDRs met the above requirements for being placed back into accrual status, reducing the nonaccrual TDRs by $17.1 million.
During the year ended December 31, 2011, we modified $6.9 million of commercial and industrial loans, $6.6 million of commercial real estate loans, $4.5 million of commercial construction loans and $2.1 million of residential real estate for financially troubled borrowers that were not considered to be TDRs. These borrowers received modifications that represented insignificant delays in the timing of payments that were not considered to be concessions. TDRs increased significantly during 2011 as we are working closely with our customers during these challenging times to establish terms that will allow the customer to continue to pay and ultimately increase our likelihood of full repayment of these loans.
OREO and other repossessed assets are comprised of properties acquired through foreclosure proceedings or acceptance of a deed in lieu of a foreclosure. At December 31, 2011, OREO consists of
PAGE 50
Table of Contents
Item 7. MANAGEMENT’S DISCUSSION AND ANALYSIS OF FINANCIAL CONDITION AND RESULTS OF OPERATIONS — continued
18 properties with one property comprising $1.5 million or 37 percent of the entire OREO balance. All properties have current appraisals. It is our policy to obtain appraisals annually or sooner if indications of impairment exist. Foreclosures increased to 41 in 2011 compared to 37 in 2010.
The following represents delinquency for the periods presented:
| 2011 | 2010 | 2009 | 2008 | 2007 | ||||||||||||||||||||||||||||||||||||
| December 31 | Amount |
% of
Loans |
Amount |
% of
Loans |
Amount |
% of
Loans |
Amount |
% of
Loans |
Amount |
% of
Loans |
||||||||||||||||||||||||||||||
| (in thousands) | ||||||||||||||||||||||||||||||||||||||||
|
90 days or more: |
||||||||||||||||||||||||||||||||||||||||
|
Commercial real estate |
$ | 31,648 | 2.24 | % | $ | 44,310 | 2.97 | % | $ | 53,789 | 3.77 | % | $ | 19,386 | 1.35 | % | $ | 7,359 | 0.76% | |||||||||||||||||||||
|
Commercial and industrial |
7,570 | 1.10 | % | 3,567 | 0.49 | % | 7,489 | 1.07 | % | 3,341 | 0.41 | % | 6,119 | 0.75% | ||||||||||||||||||||||||||
|
Commercial construction |
6,547 | 3.47 | % | 7,987 | 3.08 | % | 21,674 | 6.03 | % | 13,848 | 3.83 | % | — | —% | ||||||||||||||||||||||||||
|
Home equity |
2,936 | 0.71 | % | 1,433 | 0.32 | % | 2,252 | 0.49 | % | 174 | 0.04 | % | 71 | 0.02% | ||||||||||||||||||||||||||
|
Residential mortgage |
7,229 | 2.01 | % | 5,996 | 1.67 | % | 5,583 | 1.56 | % | 5,624 | 1.38 | % | 3,183 | 1.00% | ||||||||||||||||||||||||||
|
Installment and other consumer |
4 | 0.01 | % | 65 | 0.09 | % | 20 | 0.02 | % | 73 | 0.09 | % | 65 | 0.09% | ||||||||||||||||||||||||||
|
Consumer construction |
181 | 7.42 | % | 525 | 13.06 | % | — | — | % | — | — | % | — | —% | ||||||||||||||||||||||||||
|
Total Loans |
$ | 56,115 | 1.79 | % | $ | 63,883 | 1.90 | % | $ | 90,807 | 2.67 | % | $ | 42,446 | 1.19 | % | $ | 16,797 | 0.60% | |||||||||||||||||||||
|
30 to 89 days: |
||||||||||||||||||||||||||||||||||||||||
|
Commercial real estate |
$ | 9,105 | 0.64 | % | $ | 4,371 | 0.29 | % | $ | 22,923 | 1.60 | % | $ | 9,603 | 0.67 | % | $ | 17,063 | 1.77% | |||||||||||||||||||||
|
Commercial and industrial |
5,284 | 0.77 | % | 1,714 | 0.24 | % | 1,241 | 0.18 | % | 3,689 | 0.45 | % | 3,770 | 0.46% | ||||||||||||||||||||||||||
|
Commercial construction |
— | — | % | 835 | 0.32 | % | 899 | 0.25 | % | 10,446 | 2.89 | % | 65 | 0.02% | ||||||||||||||||||||||||||
|
Home equity |
2,890 | 0.70 | % | 2,451 | 0.56 | % | 2,106 | 0.46 | % | 356 | 0.08 | % | 137 | 0.05% | ||||||||||||||||||||||||||
|
Residential mortgage |
2,403 | 0.67 | % | 1,346 | 0.37 | % | 5,151 | 1.44 | % | 5,093 | 1.25 | % | 3,396 | 1.07% | ||||||||||||||||||||||||||
|
Installment and other consumer |
452 | 0.67 | % | 342 | 0.46 | % | 852 | 1.05 | % | 449 | 0.53 | % | 426 | 0.57% | ||||||||||||||||||||||||||
|
Consumer construction |
— | — | % | — | — | % | — | — | % | — | — | % | — | —% | ||||||||||||||||||||||||||
|
Total Loans |
$ | 20,134 | 0.64 | % | $ | 11,059 | 0.33 | % | $ | 33,172 | 0.98 | % | $ | 29,636 | 0.83 | % | $ | 24,857 | 0.89% | |||||||||||||||||||||
Closed-end installment loans, amortizing loans secured by real estate and any other loans with payments scheduled monthly are reported past due when the borrower is in arrears two or more monthly payments. Other multi-payment obligations with payments scheduled other than monthly are reported past due when one scheduled payment is due and unpaid for 30 days or more. We monitor delinquency on a monthly basis, including early stage delinquencies in the 30 to 89 days past due for early identification of potential problem loans.
Allowance for Loan Losses
We maintain an ALL at a level determined to be adequate to absorb estimated probable credit losses inherent within the loan portfolio as of the balance sheet date. Determination of an adequate ALL is inherently subjective, as it requires estimations of the occurrence of future events, as well as the timing of such events, and it may be subject to significant changes from period to period. The methodology for determining the All has two main components: evaluation and impairment tests of individual loans and impairment tests of certain groups of homogeneous loans with similar risk characteristics.
PAGE 51
Table of Contents
Item 7. MANAGEMENT’S DISCUSSION AND ANALYSIS OF FINANCIAL CONDITION AND RESULTS OF OPERATIONS — continued
We enhanced our ALL model in the fourth quarter of 2010 to better align it with the regulatory guidance. The calculation of the base historical loss utilizing an average method over the prior five years was shortened to include a one to two year loss emergence period depending on the loan category over a rolling four quarter average. Loss emergence refers to the length of time between a loss event and a charge-off of the loan. With the volatility in the credit cycle at that time, the shorter time horizon was more responsive to the loss emergence periods we were experiencing in our portfolio. We believe this shorter time horizon provides a better indication of inherent losses in the loan portfolio given the recent economic downturn. We also refined the qualitative factors beginning in the fourth quarter of 2010 to better align with the regulatory guidance. Qualitative factors became a basis point adjustment applied to the historical base loss. The combination of the enhancements to the average method and the qualitative factors did not materially change the ALL at December 31, 2010, resulting in an increase in the ALL of less than $0.5 million. Since December 31, 2010, there have been no further enhancements to the ALL methodology.
We develop and document a systematic ALL methodology based on the following portfolio segments: 1) CRE, 2) C&I, 3) Commercial Construction, 4) Consumer Real Estate and 5) Other Consumer. The following is the ALL for the past 5 years by portfolio segment:
| 2011 | 2010 | 2009 | 2008 | 2007 | ||||||||||||||||||||||||||||||||||||
| December 31 | Amount |
% of
Total |
Amount |
% of
Total |
Amount |
% of
Total |
Amount |
% of
Total |
Amount |
% of
Total |
||||||||||||||||||||||||||||||
| (in thousands) | ||||||||||||||||||||||||||||||||||||||||
|
Commercial real estate |
$ | 29,804 | 61 | % | $ | 30,424 | 59 | % | $ | 27,322 | 46 | % | $ | 18,781 | 44% | $ | 8,014 | 23% | ||||||||||||||||||||||
|
Commercial and industrial |
11,274 | 23 | % | 9,777 | 19 | % | 21,393 | 36 | % | 20,170 | 47% | 23,260 | 68% | |||||||||||||||||||||||||||
|
Commercial construction |
3,703 | 8 | % | 5,905 | 11 | % | 8,008 | 13 | % | 73 | —% | 51 | —% | |||||||||||||||||||||||||||
|
Consumer real estate |
3,166 | 6 | % | 3,962 | 8 | % | 2,143 | 4 | % | 2,750 | 7% | 2,266 | 7% | |||||||||||||||||||||||||||
|
Other consumer |
894 | 2 | % | 1,319 | 3 | % | 714 | 1 | % | 915 | 2% | 754 | 2% | |||||||||||||||||||||||||||
|
Total |
$ | 48,841 | 100 | % | $ | 51,387 | 100 | % | $ | 59,580 | 100 | % | $ | 42,689 | 100% | $ | 34,345 | 100% | ||||||||||||||||||||||
An inherent risk to the loan portfolio as a whole is the condition of the local economy. In addition, each loan segment carries with it risks specific to the segment.
CRE loans are secured by commercial purpose real estate, including both owner occupied properties and investment properties for various purposes such as hotels, strip malls and apartments. Individual project cash flows, as well as global cash flows, are generally the sources of repayment for these loans. Besides cash flow risks, CRE loans have collateral risk and risks based upon the business prospects of the lessee, if the project is not owner occupied.
C&I loans are made to operating companies or manufacturers for the purpose of production, operating capacity, accounts receivable, inventory or equipment financing. Collateral for these types of loans often do not have sufficient value in a distressed or liquidation scenario to satisfy the outstanding debt. Cash flow from the operations of the company is the primary source of repayment for these loans and the cash flow depends not only on the economy as a whole, but also on the health of the company’s industry.
Commercial construction loans are made to finance construction of buildings or other structures, as well as to finance the acquisition and development of raw land for various purposes. While the risk is generally confined to the construction period, if there are problems, the project may not be completed, and as such, may not provide sufficient cash flow on its own to service the debt or have sufficient value in a liquidation to cover the outstanding principal. There are also various risks depending on the type of project and the experience and resources of the developer.
Consumer real estate loans are secured by 1-4 family residences, including purchase money mortgages, first and second lien home equity loans and home equity lines of credit. The primary
PAGE 52
Table of Contents
Item 7. MANAGEMENT’S DISCUSSION AND ANALYSIS OF FINANCIAL CONDITION AND RESULTS OF OPERATIONS — continued
source of repayment for these loans is the income and assets of the borrower. The unemployment rate, as well as the state of the local housing market have a significant impact on the risk determination, since low demand and/or declining home values can limit the ability of borrowers to sell a property and satisfy the debt.
Other consumer loans are made to individuals and may be secured by assets other than 1-4 family residences, or may be unsecured. This class of loans includes auto loans, unsecured lines and credit cards. The primary source of repayment for these loans is the income and assets of the borrower so the local unemployment rate is an important indicator of risk. The value of the collateral, if there is any, is less likely to be a source of repayment due to less certain collateral values.
Significant to the ALL is a higher mix of commercial loans. At December 31, 2011, approximately 92 percent of the ALL related to the commercial loan portfolio, while commercial loans comprise 73 percent of our loan portfolio. Commercial loans have been more impacted by the economic slowdown in our markets and more specifically our commercial real estate loan portfolio. The ability of customers to repay commercial loans is more dependent upon the success of their business, continuing income and general economic conditions. Accordingly, the risk of loss is higher on such loans compared to consumer loans, which have incurred lower losses in our market.
The following table summarizes the ALL for each of the last five years as indicated:
| December 31 | 2011 | 2010 | 2009 | 2008 | 2007 | |||||||||||||||
| (in thousands) | ||||||||||||||||||||
|
General reserves |
$ | 43,296 | $ | 47,756 | $ | 42,577 | $ | 35,574 | $ | 31,426 | ||||||||||
|
Specific reserves |
5,545 | 3,631 | 17,003 | 7,115 | 2,919 | |||||||||||||||
|
Total Allowance for Loan Losses |
$ | 48,841 | $ | 51,387 | $ | 59,580 | $ | 42,689 | $ | 34,345 | ||||||||||
The balance in the ALL decreased to $48.8 million or 1.56 percent of total loans at December 31, 2011 as compared to $51.4 million or 1.53 percent of total loans at December 31, 2010. The ALL includes $5.5 million that was specifically allocated for impaired loans of $94.0 million at December 31, 2011, compared to $3.6 million that was allocated for impaired loans of $50.7 million at December 31, 2010. At December 31, 2011, the ALL was 87 percent of nonperforming loans compared to 80 percent at December 31, 2010. The slight decline in the reserve is a result of the overall improving economic conditions. More specifically the decline in the general reserve is impacted by lower loss rates that we experienced in 2011. Net charge-offs declined $19.5 million from the prior year with total net charge-offs of $18.2 million in 2011 compared to $37.7 million in 2010. The increase in the specific reserves was prompted by the increase in impaired loans during the year. Impaired loans increased $43.3 million to $94.0 million compared to $50.7 million at December 31, 2010. The increase is driven by $37.7 million of new TDRs during 2011 as we worked with our customers who are impacted by the current economic climate.
Consumer unsecured loans and secured loans that are not real estate secured are evaluated for charge-off after the loan becomes 90 days past due. At that time, unsecured loans are fully charged-off and secured loans are charged-off to the estimated fair value of the collateral less the cost to sell. Consumer loans secured by real estate are evaluated for charge-off after the loan balance becomes 90 days past due and are charged down to the estimated fair value of the collateral less cost to sell.
Our charge-off policy for commercial loans requires that loans and other obligations that are not collectible be promptly charged-off when a confirmed loss exists, regardless of the delinquency status of the loan. We may elect to recognize a partial charge-off when management has determined that the value of collateral is less than the remaining investment in the loan. A loan or obligation does not need to be charged-off, regardless of delinquency status, if (i) management has determined there exists sufficient collateral to protect the remaining loan balance and (ii) there exists a strategy to
PAGE 53
Table of Contents
Item 7. MANAGEMENT’S DISCUSSION AND ANALYSIS OF FINANCIAL CONDITION AND RESULTS OF OPERATIONS — continued
liquidate the collateral. Management may also consider a number of other factors to determine when a charge-off is appropriate. These factors may include, but are not limited to:
| • |
The status of a bankruptcy proceeding; |
| • |
The value of collateral and probability of successful liquidation; and/or |
| • |
The status of adverse proceedings or litigation that may result in collection. |
The following summarizes our loan loss experience for each of the five years presented below:
| Years Ended December 31 | 2011 | 2010 | 2009 | 2008 | 2007 | |||||||||||||||
| (in thousands) | ||||||||||||||||||||
|
ALL Balance at Beginning of Year: |
$ | 51,387 | $ | 59,580 | $ | 42,689 | $ | 34,345 | $ | 33,220 | ||||||||||
|
Charge-offs: |
||||||||||||||||||||
|
Commercial real estate |
(8,824 | ) | (23,925 | ) | (8,795 | ) | (828 | ) | (273 | ) | ||||||||||
|
Commercial and industrial |
(8,971 | ) | (7,277 | ) | (29,350 | ) | (4,681 | ) | (4,921 | ) | ||||||||||
|
Commercial construction |
(1,720 | ) | (6,353 | ) | (12,397 | ) | (1,869 | ) | (118 | ) | ||||||||||
|
Consumer real estate |
(2,617 | ) | (2,210 | ) | (4,558 | ) | (3,217 | ) | (515 | ) | ||||||||||
|
Other consumer |
(1,013 | ) | (1,262 | ) | (1,762 | ) | (1,575 | ) | (1,253 | ) | ||||||||||
|
Total |
(23,145 | ) | (41,027 | ) | (56,862 | ) | (12,170 | ) | (7,080 | ) | ||||||||||
|
Recoveries: |
||||||||||||||||||||
|
Commercial real estate |
780 | 576 | 70 | 523 | 18 | |||||||||||||||
|
Commercial and industrial |
357 | 328 | 532 | 1,035 | 1,452 | |||||||||||||||
|
Commercial construction |
2,463 | 1,748 | — | — | — | |||||||||||||||
|
Consumer real estate |
1,030 | 202 | 276 | 157 | 256 | |||||||||||||||
|
Other consumer |
360 | 469 | 521 | 501 | 667 | |||||||||||||||
|
Total |
4,990 | 3,323 | 1,399 | 2,216 | 2,393 | |||||||||||||||
|
Net Charge-offs |
(18,155 | ) | (37,704 | ) | (55,463 | ) | (9,954 | ) | (4,687 | ) | ||||||||||
|
Provision for loan losses |
15,609 | 29,511 | 72,354 | 12,878 | 5,812 | |||||||||||||||
|
Acquired loan loss reserve |
— | — | — | 5,420 | — | |||||||||||||||
|
ALL Balance at End of Year: |
$ | 48,841 | $ | 51,387 | $ | 59,580 | $ | 42,689 | $ | 34,345 | ||||||||||
Net loan charge-offs decreased $19.5 million to $18.2 million or 0.56 percent of average loans for 2011 as compared to $37.7 million or 1.11 percent of average loans for 2010. The significant decrease is a result of improving economic conditions in 2011.
The following table summarizes net charge-offs as a percentage of average loans and other ratios:
| December 31 | 2011 | 2010 | 2009 | 2008 | 2007 | |||||||||||||||
|
Commercial real estate |
0.55 | % | 1.42 | % | 3.42 | % | 0.52 | % | 0.04 | % | ||||||||||
|
Commercial and industrial |
1.24 | % | 1.62 | % | 0.62 | % | 0.03 | % | 0.03 | % | ||||||||||
|
Commercial construction |
(0.34 | )% | 0.96 | % | 3.74 | % | 0.43 | % | 0.46 | % | ||||||||||
|
Consumer real estate |
0.20 | % | 0.24 | % | 0.50 | % | 0.40 | % | 0.04 | % | ||||||||||
|
Other consumer |
0.94 | % | 1.04 | % | 1.52 | % | 1.35 | % | 0.78 | % | ||||||||||
|
Ratio of net charge-offs to average loans outstanding |
0.56 | % | 1.11 | % | 1.60 | % | 0.31 | % | 0.17 | % | ||||||||||
|
Allowance for loan losses as a percentage of total loans |
1.56 | % | 1.53 | % | 1.75 | % | 1.20 | % | 1.23 | % | ||||||||||
|
Allowance for loan losses to total nonperforming loans |
87 | % | 80 | % | 66 | % | 101 | % | 204 | % | ||||||||||
|
Provision for loan losses as a percentage of net loan charge-offs |
86 | % | 78 | % | 130 | % | 184 | % | 124 | % | ||||||||||
PAGE 54
Table of Contents
Item 7. MANAGEMENT’S DISCUSSION AND ANALYSIS OF FINANCIAL CONDITION AND RESULTS OF OPERATIONS — continued
Deposits
The following table presents the composition of deposits at December 31:
| December 31 | 2011 | 2010 | $ Change | |||||||||
| (in thousands) | ||||||||||||
|
Noninterest-bearing demand |
$ | 818,686 | $ | 765,812 | $ | 52,874 | ||||||
|
Interest-bearing demand |
283,611 | 295,246 | (11,635 | ) | ||||||||
|
Money market |
278,092 | 262,683 | 15,409 | |||||||||
|
Savings |
802,942 | 753,813 | 49,129 | |||||||||
|
Certificates of deposit |
1,152,528 | 1,239,970 | (87,442 | ) | ||||||||
|
Total |
$ | 3,335,859 | $ | 3,317,524 | $ | 18,335 | ||||||
Deposits are the primary source of funds for us. We believe that our deposit base is stable and that we have the ability to attract new deposits, mitigating a funding dependency on other more volatile sources. During 2011, noninterest-bearing demand deposit accounts increased $52.9 million primarily related to the low interest rate environment, our marketing efforts for new demand accounts and corporate cash management services. The low interest rate environment also had an impact on our overall deposit mix as customer certificate of deposit maturities shifted to savings and money market products.
Certificates of deposit of $100,000 and over were 11 percent of total deposits at December 31, 2011 and 12 percent of total deposits at December 31, 2010, and primarily represent deposit relationships with local customers in our market area. Maturities of certificates of deposit of $100,000 or more outstanding at December 31 are summarized as follows:
| December 31 | 2011 | |||
| (in thousands) | ||||
|
Three months or less |
$ | 159,557 | ||
|
Over three through six months |
98,607 | |||
|
Over six through twelve months |
50,745 | |||
|
Over twelve months |
118,157 | |||
|
Total |
$ | 427,066 | ||
Through the Promontory Interfinancial Network, LLC, we participate in the Certificate of Deposit Account Registry Services, or CDARS, reciprocal and One-Way Buy programs. We have been a member of Promontory and have utilized CDARS since 2009. Reciprocal deposits provide a stable and cost-effective source of funds with rates generally lower than traditional brokered deposits. Although reciprocal deposits are considered “brokered” under existing law, they tend to act more like core deposits. Reciprocal deposits are customer funds exchanged among insured depository institutions that are member of the CDARS deposit placement service. Through the exchange, we benefit from large, local customer deposits, while providing our customers with access to FDIC insurance protection beyond the maximum deposit insurance amount. Reciprocal deposits address the need to attract and retain valuable customer relationships. As of December 31, 2011 there was $15.0 million in CDARS reciprocal deposits. We also participate in the CDARS One-Way Buy program which allows us to obtain large blocks of wholesale funding, while maintaining control over pricing. Through the One-Way Buy program, funding is effectively purchased from insured depository institutions that are
PAGE 55
Table of Contents
Item 7. MANAGEMENT’S DISCUSSION AND ANALYSIS OF FINANCIAL CONDITION AND RESULTS OF OPERATIONS — continued
member of the CDARS deposit placement service. As of December 31, 2011 we had $55.8 million in the CDARS One-Way Buy program.
The daily average amount of deposits and rates paid on such deposits are summarized for the periods indicated in the following table:
| 2011 | 2010 | 2009 | ||||||||||||||||||||||
| Years Ended December 31 | Amount | Rate | Amount | Rate | Amount | Rate | ||||||||||||||||||
| (in thousands) | ||||||||||||||||||||||||
|
Noninterest-bearing demand |
$ | 792,911 | $ | 728,708 | $ | 637,434 | ||||||||||||||||||
|
Interest-bearing demand |
286,588 | 0.13 | % | 267,291 | 0.21 | % | 241,123 | 0.23 | % | |||||||||||||||
|
Money market |
249,497 | 0.15 | % | 251,092 | 0.26 | % | 244,619 | 0.44 | % | |||||||||||||||
|
Savings |
761,274 | 0.17 | % | 749,325 | 0.28 | % | 758,216 | 0.46 | % | |||||||||||||||
|
Certificates of deposit |
1,181,822 | 1.77 | % | 1,300,803 | 1.95 | % | 1,367,372 | 2.44 | % | |||||||||||||||
|
Total |
$ | 3,272,092 | 0.70 | % | $ | 3,297,219 | 0.87 | % | $ | 3,248,764 | 1.18 | % | ||||||||||||
Borrowings
The following table represents the composition of borrowings at December 31:
| Years Ended December 31 | 2011 | 2010 | $ Change | |||||||||
| (in thousands) | ||||||||||||
|
Securities sold under repurchase agreements, retail |
$ | 30,370 | $ | 40,653 | $ | (10,283 | ) | |||||
|
Short-term borrowings |
75,000 | — | 75,000 | |||||||||
|
Long-term borrowings |
31,874 | 29,365 | 2,509 | |||||||||
|
Junior subordinated debt securities |
90,619 | 90,619 | — | |||||||||
| Total Borrowings | $ | 227,863 | $ | 160,637 | $ | 67,226 | ||||||
Borrowings are an additional source of funding for us. Short-term borrowings are for terms under one year and were comprised of REPO, federal funds purchased, term auction facility, or TAF, borrowings and FHLB advances. We define repurchase agreements with our local retail customers as retail REPO. Securities pledged as collateral under these REPO financing arrangements cannot be sold or repledged by the secured party and are therefore accounted for as a secured borrowing. Federal funds purchased are unsecured overnight borrowings with other financial institutions. TAF borrowings are collateral backed short-term loans with the Federal Reserve. FHLB advances are for various terms secured by a blanket lien on residential mortgages and other real estate secured loans. The purpose of long-term borrowings is to match-fund selected new loan originations, to mitigate interest rate sensitivity risks and to take advantage of discounted borrowing rates through the FHLB for community investment projects. The increase in borrowings of $67.2 million is primarily within our short-term borrowings and was done to maintain our liquidity position after the redemption of the preferred stock in December of 2011.
During 2011, long-term borrowings increased $2.5 million as compared to December 31, 2010. At December 31, 2011, we had long-term borrowings of $28.8 million outstanding at a fixed rate and $3.1 million at a variable rate.
During the third quarter of 2006, we issued $25.0 million of junior subordinated debentures through a pooled transaction at an initial fixed rate of 6.78 percent. Beginning September 15, 2011 and quarterly thereafter, we have the option to redeem the subordinated debt, subject to a 30 day written notice and prior approval by the FDIC. We chose not to exercise the option for early
PAGE 56
Table of Contents
Item 7. MANAGEMENT’S DISCUSSION AND ANALYSIS OF FINANCIAL CONDITION AND RESULTS OF OPERATIONS — continued
redemption on September 15, 2011 and the subordinated debt converted to a variable rate of 3-month LIBOR plus 160 basis points. The subordinated debt qualifies as Tier 2 capital under regulatory guidelines and will mature on December 15, 2036.
During the first quarter of 2008, we completed a private placement to a financial institution of $20.0 million of floating rate trust preferred securities. The trust preferred securities mature in March 2038, are callable at our option after five years, bear interest initially at a rate of 6.44 percent per annum and quarterly adjust with the three-month LIBOR plus 350 basis points. We began making interest payments to the trustee on June 15, 2008 and quarterly thereafter. The trust preferred securities qualify as Tier 1 capital under regulatory guidelines. To issue these trust preferred securities, we formed STBA Capital Trust I, or the Trust, with $0.6 million of equity, which is owned 100 percent by us. The proceeds from the sale of the trust preferred securities and the issuance of common equity were invested in junior subordinated debt, which is the sole asset of the Trust. The Trust pays dividends on the trust preferred securities at the same rate as the distribution we paid on the junior subordinate debt held by the Trust. Since the third-party investors are the primary beneficiaries, the Trust qualifies as a variable interest entity, or VIE, but is not consolidated in our financial statements.
During the second quarter of 2008, we issued $20.0 million of junior subordinated debt through a private placement with three financial institutions at an initial rate of 6.40 percent that floats quarterly with 3-month LIBOR plus 350 basis points. If all or any portion of the subordinated debt ceases to be deemed Tier 2 Capital due to a change in applicable capital regulations, we will have the right to redeem, on any interest payment date, subject to a 30 day written notice and prior approval by the FDIC, the subordinated debt at the applicable redemption rate, which starts at a high of 102.82 percent at June 15, 2009 and decreases yearly to 100 percent on June 15, 2013 and thereafter and can be called after five years. The subordinated debt qualifies as Tier 2 capital under regulatory guidelines and will mature on June 15, 2018.
Also during the second quarter of 2008, we issued $25.0 million of junior subordinated debt through a private placement with a financial institution at an initial rate of 5.15 percent that floats quarterly with 3-month LIBOR plus 250 basis points. At any time after May 30, 2013, we will have the right to redeem all or a portion of the subordinated debt, subject to a 30-day written notice and prior approval by the FDIC. The subordinated debt qualifies as Tier 2 capital under regulatory guidelines and will mature on May 30, 2018.
Information pertaining to REPO, federal funds purchased and TAF borrowings is summarized in the table below:
| 2011 | 2010 | 2009 | ||||||||||
| (in thousands) | ||||||||||||
|
Balance at December 31 |
$ | 30,370 | $ | 40,653 | $ | 44,935 | ||||||
|
Average balance during the year |
41,584 | 46,489 | 94,019 | |||||||||
|
Average interest rate during the year |
0.13 | % | 0.14 | % | 0.17 | % | ||||||
|
Maximum month-end balance during the year |
$ | 42,409 | $ | 52,046 | $ | 129,835 | ||||||
|
Average interest rate at December 31 |
0.11 | % | 0.07 | % | 0.14 | % | ||||||
PAGE 57
Table of Contents
Item 7. MANAGEMENT’S DISCUSSION AND ANALYSIS OF FINANCIAL CONDITION AND RESULTS OF OPERATIONS — continued
Information pertaining to FHLB advances is summarized in the table below:
| 2011 | 2010 | 2009 | ||||||||||
| (in thousands) | ||||||||||||
|
Balance at December 31 |
$ | 75,000 | $ | — | $ | 51,300 | ||||||
|
Average balance during the year |
551 | 32,473 | 96,929 | |||||||||
|
Average interest rate during the year |
0.32 | % | 0.45 | % | 0.54 | % | ||||||
|
Maximum month-end balance during the year |
$ | 75,000 | $ | 141,800 | $ | 195,150 | ||||||
|
Average interest rate at December 31 |
0.18 | % | — | 0.62 | % | |||||||
Wealth Management Assets
As of December 31, 2011, the fair value of the S&T Bank wealth management assets under management and administration, which are not accounted for as part of our assets, increased to $1.5 billion from $1.4 billion in the prior year. Assets under management and administration of $1.5 billion consist of $1.1 billion in S&T Trust and $0.4 billion in S&T Financial Services. The increase in 2011 is primarily attributable to the improved performance of the U.S. and global capital markets.
Explanation of Use of Non-GAAP Financial Measures
In addition to the results of operations presented in accordance with GAAP, our management uses and this Annual Report contains or references, certain non-GAAP financial measures, such as net interest income on a fully taxable-equivalent basis, operating revenue and the efficiency ratio. We believe these non-GAAP financial measures provide information useful to investors in understanding our underlying operational performance and our business and performance trends as they facilitate comparisons with the performance of others in the financial services industry. Although we believe that these non-GAAP financial measures enhance investors’ understanding of our business and performance, these non-GAAP financial measures should not be considered an alternative to GAAP or considered to be more important than financial results determined in accordance with GAAP, nor is it necessarily comparable with non-GAAP measures which may be presented by other companies.
We believe the presentation of net interest income on a fully taxable-equivalent basis ensures comparability of net interest income arising from both taxable and tax-exempt sources and is consistent with industry practice. Interest income per the Consolidated Statements of Income is reconciled to net interest income adjusted to a fully taxable-equivalent basis on pages 33 and 39.
Operating revenue is the sum of net interest income and noninterest income less security gains/losses. In order to understand the significance of net interest income to our business and operating results, we believe it is appropriate to evaluate the significance of net interest income as a component of operating revenue.
The efficiency ratio is recurring noninterest expense divided by recurring noninterest income plus net interest income, on a fully taxable-equivalent basis, which ensures comparability of net interest income arising from both taxable and tax-exempt sources and is consistent with industry practice.
Capital Resources
Shareholders’ equity decreased $88.2 million to $490.5 million at December 31, 2011 compared to $578.7 million at December 31, 2010. The significant decrease in shareholders’ equity is due to the redemption of the preferred stock of $108.7 million that we issued on January 16, 2009 in conjunction with our participation in the CPP. Further decreasing equity was $5.1 million of dividends related to the preferred stock. Included in other comprehensive income/loss was a decline
PAGE 58
Table of Contents
Item 7. MANAGEMENT’S DISCUSSION AND ANALYSIS OF FINANCIAL CONDITION AND RESULTS OF OPERATIONS — continued
of $12.2 million in the funded status of our employee benefit plans as a result of a significant decline in the discount rate used to calculate our liability. We paid dividends to our common shareholders of $16.9 million during 2011 and had net income available to common shareholders of $39.7.
We continue to maintain a strong capital position with a leverage ratio of 9.17 percent as compared to the regulatory guideline of 5.00 percent to be well capitalized. Our risk-based capital Tier 1 and Total ratios were 11.63 percent and 15.20 percent, respectively, at December 31, 2011, which places us significantly above the Federal Reserve Board’s “well capitalized” guidelines of 6.00 percent and 10.00 percent for Tier 1 and Total capital. We believe that we have sufficient cash flow, including cash and cash equivalents, and borrowing capacity to fund all outstanding commitments and letters of credit, while maintaining proper levels of liquidity. We believe that we have the ability to raise additional capital, if necessary.
In August 2009, we filed a shelf registration statement on Form S-3 under the Securities Act of 1933 as amended, with the SEC for the issuance of up to $300.0 million of a variety of securities including, debt and capital securities, preferred and common stock and warrants. We may use the proceeds from the sale of any securities for general corporate purposes, which could include investments at the holding company level, investing in, or extending credit to, our subsidiaries, possible acquisitions and stock repurchases. As of December 31, 2011, we had not issued any securities pursuant to the shelf registration statement.
Contractual Obligations
Contractual obligations represent future cash commitments and liabilities under agreements with third parties and exclude contingent contractual liabilities for which we cannot reasonably predict future payments. We have various financial obligations, including contractual obligations and commitments that may require future cash payments.
The following table presents as of December 31, 2011, significant fixed and determinable contractual obligations to third parties by payment date:
| Payments Due In | ||||||||||||||||||||
| 2012 | 2013-2014 | 2015-2016 | Later Years | Total | ||||||||||||||||
| (in thousands) | ||||||||||||||||||||
|
Deposits without a stated maturity (1) |
$ | 2,183,331 | $ | — | $ | — | $ | — | $ | 2,183,331 | ||||||||||
|
Certificates of deposit (1) |
706,140 | 306,058 | 129,823 | 10,507 | 1,152,528 | |||||||||||||||
|
Securities sold under repurchase agreements (1) |
30,370 | — | — | — | 30,370 | |||||||||||||||
|
Short-term borrowings (1) |
75,000 | — | — | — | 75,000 | |||||||||||||||
|
Long-term borrowings (1) |
1,818 | 13,841 | 3,886 | 12,329 | 31,874 | |||||||||||||||
|
Junior subordinated debt securities (1) |
— | — | — | 90,619 | 90,619 | |||||||||||||||
|
Operating and capital leases |
1,624 | 3,297 | 3,270 | 33,450 | 41,641 | |||||||||||||||
|
Purchase obligations |
9,124 | 12,862 | 12,988 | — | 34,974 | |||||||||||||||
|
Total |
$ | 3,007,407 | $ | 336,058 | $ | 149,967 | $ | 146,905 | $ | 3,640,337 | ||||||||||
| (1) |
Excludes interest |
PAGE 59
Table of Contents
Item 7. MANAGEMENT’S DISCUSSION AND ANALYSIS OF FINANCIAL CONDITION AND RESULTS OF OPERATIONS — continued
Operating lease obligations represent short and long-term lease arrangements as described in Item 8, Note 9 Premises and Equipment, in the Consolidated Financial Statements. Purchase obligations primarily represent obligations under agreement with our third party data processing servicer and communications charges as described in Note 16 Commitments and Contingencies.
Off-Balance Sheet Arrangements
In the normal course of business, we offer off-balance sheet credit arrangements to enable our customers to meet their financing objectives. These instruments involve, to varying degrees, elements of credit and interest rate risk in excess of the amount recognized in the financial statements. Our exposure to credit loss, in the event the customer does not satisfy the terms of the agreement, equals the contractual amount of the obligation less the value of any collateral. We apply the same credit policies in making commitments and standby letters of credit that are used for the underwriting of loans to customers. Commitments generally have fixed expiration dates, annual renewals or other termination clauses and may require payment of a fee. Since many of the commitments are expected to expire without being drawn upon, the total commitment amounts do not necessarily represent future cash requirements. The allowance for unfunded commitments is included in other liabilities in the Consolidated Balance Sheets.
The following table sets forth the commitments and letters of credit for the periods stated:
| December 31 | 2011 | 2010 | ||||||
| (in thousands) | ||||||||
|
Commitments to extend credit |
$ | 816,160 | $ | 836,042 | ||||
|
Standby letters of credit |
119,576 | 135,489 | ||||||
|
Total |
$ | 935,736 | $ | 971,531 | ||||
Estimates of the fair value of these off-balance sheet items were not made because of the short-term nature of these arrangements and the credit standing of the counterparties.
Our allowance for unfunded commitments is determined using a methodology similar to that used to determine the ALL. Amounts are added to the allowance for unfunded commitments through a charge to current earnings in noninterest expense. The balance in the allowance for unfunded commitments decreased slightly to $1.2 million at December 31, 2011 as compared to $2.7 million at December 31, 2010 due to a decrease in the volume of commitments in 2011.
Liquidity
Liquidity is defined as a financial institution’s ability to meet its cash and collateral obligations at a reasonable cost. This includes the ability to satisfy the financial needs of depositors who want to withdraw funds or of borrowers needing to access funds to meet their credit needs. Liquidity risk management involves monitoring and maintaining sufficient levels of a diverse set of funding sources that are available for normal operations and for unanticipated stress events. In order to manage liquidity risk our Board of Directors has delegated authority to the ALCO for formulation, implementation and oversight of liquidity risk management. ALCO’s goal is to maintain adequate levels of liquidity to meet our funding needs in both a normal operating environment and for potential liquidity stress events.
Our primary funding and liquidity source is a stable deposit base. We believe that the bank has the ability to retain existing and attract new deposits, mitigating a funding dependency on other more volatile sources. Although deposits are the primary source of funds, we have identified various funding sources that can be used as part of our normal funding program when either a structure or cost
PAGE 60
Table of Contents
efficiency has been identified. These funding sources include a cushion of highly liquid assets, borrowing availability at the FHLB, Federal Funds lines with other financial institutions and access to the brokered certificates of deposit market including CDARs.
Since the beginning of the financial industry crisis in 2008, monitoring and maintaining appropriate liquidity levels has become a focus of regulators, bankers and investors. ALCO has enhanced the measurement, monitoring and reporting systems for liquidity risk management for potential liquidity stress events. Specific focus has been on maintaining an adequate level of asset liquidity, performing short-term and long-term stress tests and developing a more detailed contingency funding plan. We also work to ensure access to various wholesale funding sources is available, even in a stress event.
ALCO uses a variety of ratios and reports to monitor our liquidity position. ALCO monitors an asset liquidity ratio, which is defined as the sum of interest-bearing deposits with banks, unpledged securities and loans held for sale to total assets. During 2011, our asset liquidity has improved as loans decreased and deposits remained relatively stable. In addition to the asset liquidity ratio, ALCO reviews cash flow projections, a liquidity coverage ratio and various balance sheet liquidity ratios. ALCO policy guidelines are in place for each ratio that defines graduated risk tolerance levels. If a ratio moves to high risk, specific actions are defined, such as increased monitoring or the development of an action plan to reduce the risk position.
Inflation
Management is aware of the significant effect inflation has on interest rates and can have on financial performance. Our ability to cope with this is best determined by analyzing our capability to respond to changing interest rates and our ability to manage noninterest income and expense. We monitor the mix of interest-rate sensitive assets and liabilities through ALCO in order to reduce the impact of inflation on net interest income. We also control the effects of inflation by reviewing the prices of our products and services, by introducing new products and services and by controlling overhead expenses.
ALCO monitors and manages interest rate sensitivity through gap, rate shock analyses, simulations and economic value of equity, or EVE, in order to avoid unacceptable earnings fluctuations due to interest rate changes. Our gap model includes certain management assumptions based upon past experience and the expected behavior of customers. The assumptions include principal prepayments for fixed rate loans, collateralized mortgage obligations and mortgage-backed securities and classifying the demand, money market and savings balances by degree of interest rate sensitivity.
PAGE 61
Table of Contents
Item 7A. QUANTITATIVE AND QUALITATIVE DISCLOSURES ABOUT MARKET RISK — continued
The gap and cumulative gap represent the net position of assets and liabilities subject to repricing in specific time periods, as measured by a ratio of rate sensitive assets to rate sensitive liabilities. The table below shows the amount and timing of repricing assets and liabilities as of December 31, 2011.
| GAP | ||||||||||||||||
| 1-6 Months | 7-12 Months | 13-24 Months | >2 Years | |||||||||||||
| (in thousands) | ||||||||||||||||
|
Repricing Assets: |
||||||||||||||||
|
Cash and due from banks including interest-bearing deposits |
$ | 208,854 | $ | — | $ | — | $ | 61,672 | ||||||||
|
Securities available-for-sale |
51,109 | 42,260 | 60,195 | 204,032 | ||||||||||||
|
Loans, net |
1,511,960 | 274,896 | 444,113 | 852,799 | ||||||||||||
|
Federal Home Loan Bank stock, at cost |
— | — | — | 18,216 | ||||||||||||
|
Other assets |
— | — | — | 389,888 | ||||||||||||
|
Total Assets |
$ | 1,771,923 | $ | 317,156 | $ | 504,308 | $ | 1,526,607 | ||||||||
|
Repricing Liabilities: |
||||||||||||||||
|
Noninterest-bearing demand |
$ | — | $ | — | $ | — | $ | 818,686 | ||||||||
|
Interest-bearing demand |
35,451 | 35,451 | 70,903 | 141,806 | ||||||||||||
|
Money market |
278,092 | — | — | — | ||||||||||||
|
Savings |
540,131 | 37,544 | 75,089 | 150,178 | ||||||||||||
|
Certificates of deposit |
531,783 | 174,349 | 218,077 | 228,319 | ||||||||||||
|
Securities sold under repurchase agreements and short-term borrowings |
80,370 | 25,000 | — | — | ||||||||||||
|
Long-term borrowings and junior subordinated debt securities |
94,620 | 917 | 11,885 | 15,071 | ||||||||||||
|
Other liabilities and shareholders’ equity |
— | — | — | 556,272 | ||||||||||||
|
Total Liabilities and Shareholders’ Equity |
1,560,447 | 273,261 | 375,954 | 1,910,332 | ||||||||||||
|
GAP |
211,476 | 43,895 | 128,354 | (383,725 | ) | |||||||||||
|
Cumulative GAP |
$ | 211,476 | $ | 255,371 | $ | 383,725 | $ | — | ||||||||
| Rate Sensitive Assets / Rate Sensitive Liabilities | December 31, 2011 | December 31, 2010 | ||||||
|
Cumulative 6 Months |
1.14 | 1.25 | ||||||
|
Cumulative 12 Months |
1.14 | 1.18 | ||||||
Our one-year repricing gap at December 31, 2011 indicates an asset sensitive position. This means that more assets than liabilities will reprice during the measured time frames. The implications of an asset sensitive position will differ depending upon the change in market interest rates. For example, with an asset sensitive position in a declining interest rate environment, more assets than liabilities will decrease in rate. This situation could result in a decrease in interest rate spreads, net interest income and operating income. Conversely, with an asset sensitive position in a rising interest rate environment, more assets than liabilities will increase in rate. This situation could result in an increase in interest rate spreads, net interest income and operating income.
PAGE 62
Table of Contents
In addition to the gap analysis, we perform rate shock analyses on a static balance sheet to estimate the effect that specific interest rate changes would have on 12 months of pretax net interest income. Rate shock analyses assume an immediate parallel shift of +/-300 basis points in market interest rates. We have modified assumptions in the -300 basis point rate shock analysis due to the very low level of interest rates. Rate shock analyses also incorporate management assumptions regarding the level of interest rate changes on non-maturity deposit products (noninterest-bearing demand, interest-bearing demand, money market and savings) and changes in the prepayment behavior of fixed rate loans and securities with optionality. Inclusion of these assumptions makes rate shock analyses more useful than gap analysis alone. Our policy guidelines limit the change in pretax net interest income over a one-year horizon using rate shocks up to +/- 300 basis points. Policy guidelines define the percent change in pretax net interest income by graduated risk tolerance levels.
The table below shows the percent change to pretax net interest income with a rate shock of +/- 300 basis points.
| +300 bps | -300 bps | |||||||
|
December 31, 2011 |
11.34% | (8.85)% | ||||||
|
December 31, 2010 |
11.67% | (10.76)% | ||||||
The impact to pretax net interest income in the +/-300 basis point rate shocks for December 31, 2011 is consistent with having an asset sensitive balance sheet. The +300 basis point rate shock results are relatively unchanged when comparing December 31, 2011 to December 31, 2010. The -300 basis point rate shock results have improved because a flattened yield curve has caused more loans to reprice to their floors, mitigating any further downward repricing.
In order to monitor interest rate risk beyond the one-year time horizon of shocks, we also perform EVE analysis. EVE represents the present value of all asset cash flows minus the present value of all liability cash flows. As with rate shock analysis, EVE incorporates management assumptions regarding prepayment behavior of fixed rate loans and securities with optionality and core deposit behavior and value. We measure the change in EVE using shocks up to +/- 300 basis points. Policy guidelines define the percent change in EVE by graduated risk tolerance levels. The December 31, 2011 results reflect a 20.86 percent increase and 15.11 percent decrease to EVE given a +300 and –300 basis point change in interest rates, respectively.
PAGE 63
Table of Contents
Consolidated Financial Statements
| 65 | ||||
| 66 | ||||
| 67 | ||||
| 68 | ||||
| 69 | ||||
| 124 | ||||
| 125 | ||||
PAGE 64
Table of Contents
S&T Bancorp, Inc. and Subsidiaries
| December 31 | 2011 | 2010 | ||||||
| (in thousands, except share and per share data) | ||||||||
|
ASSETS |
||||||||
|
Cash and due from banks, including interest-bearing deposits of $208,854 and $61,260 in 2011 and 2010, respectively |
$ | 270,526 | $ | 108,196 | ||||
|
Securities available-for-sale, at fair value |
357,596 | 288,025 | ||||||
|
Loans held for sale |
2,850 | 8,337 | ||||||
|
Portfolio loans, net of unearned income of $715 and $973 |
3,129,759 | 3,355,590 | ||||||
|
Allowance for loan losses |
(48,841 | ) | (51,387 | ) | ||||
|
Portfolio loans, net |
3,080,918 | 3,304,203 | ||||||
|
Bank owned life insurance |
56,755 | 54,924 | ||||||
|
Premises and equipment, net |
37,755 | 39,954 | ||||||
|
Federal Home Loan Bank stock, at cost |
18,216 | 22,365 | ||||||
|
Goodwill |
165,273 | 165,273 | ||||||
|
Other intangibles, net |
5,728 | 7,465 | ||||||
|
Other assets |
124,377 | 115,597 | ||||||
|
Total Assets |
$ | 4,119,994 | $ | 4,114,339 | ||||
|
LIABILITIES |
||||||||
|
Deposits: |
||||||||
|
Noninterest-bearing demand |
$ | 818,686 | $ | 765,812 | ||||
|
Interest-bearing demand |
283,611 | 295,246 | ||||||
|
Money market |
278,092 | 262,683 | ||||||
|
Savings |
802,942 | 753,813 | ||||||
|
Certificates of deposit |
1,152,528 | 1,239,970 | ||||||
|
Total Deposits |
3,335,859 | 3,317,524 | ||||||
|
Securities sold under repurchase agreements |
30,370 | 40,653 | ||||||
|
Short-term borrowings |
75,000 | — | ||||||
|
Long-term borrowings |
31,874 | 29,365 | ||||||
|
Junior subordinated debt securities |
90,619 | 90,619 | ||||||
|
Other liabilities |
65,746 | 57,513 | ||||||
|
Total Liabilities |
3,629,468 | 3,535,674 | ||||||
|
SHAREHOLDERS’ EQUITY |
||||||||
|
Fixed rate cumulative perpetual preferred stock, series A, no par value, $1,000 per share liquidation preference Preferred stock authorized—10,000,000 shares Issued and outstanding—0 shares and 108,676 shares |
— | 106,137 | ||||||
|
Common stock ($2.50 par value) Authorized—50,000,000 shares Issued—29,714,038 shares Outstanding—28,131,249 shares and 27,951,689 shares |
74,285 | 74,285 | ||||||
|
Additional paid-in capital |
52,637 | 51,570 | ||||||
|
Retained earnings |
421,468 | 401,734 | ||||||
|
Accumulated other comprehensive loss |
(14,108 | ) | (6,334 | ) | ||||
|
Treasury stock (1,582,789 shares and 1,762,349 shares, at cost) |
(43,756 | ) | (48,727 | ) | ||||
|
Total Shareholders’ Equity |
490,526 | 578,665 | ||||||
|
Total Liabilities and Shareholders’ Equity |
$ | 4,119,994 | $ | 4,114,339 | ||||
See Notes to Consolidated Financial Statements
PAGE 65
Table of Contents
CONSOLIDATED STATEMENTS OF INCOME
S&T Bancorp, Inc. and Subsidiaries
| Years Ended December 31 | 2011 | 2010 | 2009 | |||||||||
| (in thousands, except per share data) | ||||||||||||
|
INTEREST INCOME |
||||||||||||
|
Loans, including fees |
$ | 154,121 | $ | 169,404 | $ | 179,774 | ||||||
|
Investment Securities: |
||||||||||||
|
Taxable |
8,169 | 7,685 | 11,020 | |||||||||
|
Tax-exempt |
2,347 | 2,830 | 3,655 | |||||||||
|
Dividends |
442 | 500 | 638 | |||||||||
|
Total Interest Income |
165,079 | 180,419 | 195,087 | |||||||||
|
INTEREST EXPENSE |
||||||||||||
|
Deposits |
22,952 | 28,717 | 38,438 | |||||||||
|
Short-term borrowings |
55 | 210 | 686 | |||||||||
|
Long-term borrowings and junior subordinated debt securities |
4,726 | 5,646 | 9,981 | |||||||||
|
Total Interest Expense |
27,733 | 34,573 | 49,105 | |||||||||
|
NET INTEREST INCOME |
137,346 | 145,846 | 145,982 | |||||||||
|
Provision for loan losses |
15,609 | 29,511 | 72,354 | |||||||||
|
Net Interest Income After Provision for Loan Losses |
121,737 | 116,335 | 73,628 | |||||||||
|
NONINTEREST INCOME |
||||||||||||
|
Security (losses) gains, net |
(124 | ) | 274 | (5,088 | ) | |||||||
|
Debit and credit card fees |
10,889 | 9,954 | 6,921 | |||||||||
|
Service charges on deposit accounts |
9,978 | 11,178 | 12,344 | |||||||||
|
Insurance fees |
8,314 | 8,312 | 7,751 | |||||||||
|
Wealth management fees |
8,180 | 7,808 | 7,500 | |||||||||
|
Mortgage banking |
1,199 | 3,403 | 2,727 | |||||||||
|
Other |
5,621 | 6,281 | 6,425 | |||||||||
|
Total Noninterest Income |
44,057 | 47,210 | 38,580 | |||||||||
|
NONINTEREST EXPENSE |
||||||||||||
|
Salaries and employee benefits |
51,078 | 48,715 | 48,848 | |||||||||
|
Net occupancy |
6,943 | 6,928 | 6,819 | |||||||||
|
Data processing |
6,853 | 6,145 | 6,048 | |||||||||
|
Professional services and legal |
5,437 | 6,889 | 4,220 | |||||||||
|
Furniture and equipment |
4,941 | 5,054 | 4,991 | |||||||||
|
FDIC assessment |
3,570 | 5,426 | 8,388 | |||||||||
|
Other taxes |
3,381 | 3,432 | 3,733 | |||||||||
|
Joint venture amortization |
3,302 | 2,573 | 4,393 | |||||||||
|
Marketing |
3,019 | 2,795 | 2,751 | |||||||||
|
Other |
15,384 | 17,676 | 17,935 | |||||||||
|
Total Noninterest Expense |
103,908 | 105,633 | 108,126 | |||||||||
|
Income Before Taxes |
61,886 | 57,912 | 4,082 | |||||||||
|
Provision (benefit) for income taxes |
14,622 | 14,432 | (3,869 | ) | ||||||||
|
Net Income |
47,264 | 43,480 | 7,951 | |||||||||
|
Preferred stock dividends and discount amortization |
7,611 | 6,201 | 5,913 | |||||||||
|
Net Income Available to Common Shareholders |
$ | 39,653 | $ | 37,279 | $ | 2,038 | ||||||
|
Earnings per common share—basic |
$ | 1.41 | $ | 1.34 | $ | 0.07 | ||||||
|
Earnings per common share—diluted |
1.41 | 1.34 | 0.07 | |||||||||
|
Dividends declared per common share |
0.60 | 0.60 | 0.61 | |||||||||
See Notes to Consolidated Financial Statements
PAGE 66
Table of Contents
CONSOLIDATED STATEMENTS OF CHANGES IN SHAREHOLDERS’ EQUITY
S&T Bancorp, Inc. and Subsidiaries
|
Comprehensive
Income |
Preferred
Stock |
Common
Stock |
Additional
Paid-in Capital |
Retained
Earnings |
Accumulated
Other Comprehensive Income (Loss) |
Treasury
Stock |
Total | |||||||||||||||||||||||||
| (in thousands, except share and per share data) | ||||||||||||||||||||||||||||||||
|
Balance at December 31, 2008 |
$ | — | $ | 74,285 | $ | 43,327 | $ | 402,608 | $ | (13,986 | ) | $ | (57,540 | ) | $ | 448,694 | ||||||||||||||||
|
Net income for 2009 |
$ | 7,951 | 7,951 | 7,951 | ||||||||||||||||||||||||||||
|
Other Comprehensive Income Change in unrealized losses on securities available-for-sale, net of tax of ($267) |
(496 | ) | (496 | ) | (496 | ) | ||||||||||||||||||||||||||
|
Reclassification adjustment for net gains/losses on securities available-for-sale included in net income, net of tax of $1,782 |
3,306 | 3,306 | 3,306 | |||||||||||||||||||||||||||||
|
Adjustment to funded status of employee benefit plans, net of tax of ($2,672) |
4,962 | 4,962 | 4,962 | |||||||||||||||||||||||||||||
|
Total Comprehensive Income |
$ | 15,723 | ||||||||||||||||||||||||||||||
|
Preferred stock dividends and discount amortization |
706 | (5,913 | ) | (5,207 | ) | |||||||||||||||||||||||||||
|
Cash dividends declared ($0.61 per share) |
(16,869 | ) | (16,869 | ) | ||||||||||||||||||||||||||||
|
Treasury stock issued (113,626 shares) |
2,867 | (4,659 | ) | 3,141 | 1,349 | |||||||||||||||||||||||||||
|
Recognition of restricted stock compensation expense |
465 | 465 | ||||||||||||||||||||||||||||||
|
Tax benefit from stock-based compensation |
4 | 4 | ||||||||||||||||||||||||||||||
|
Recognition of nonstatutory stock option compensation expense |
483 | 483 | ||||||||||||||||||||||||||||||
|
Issuance of preferred stock (1) |
104,664 | 104,664 | ||||||||||||||||||||||||||||||
|
Warrant for common stock issuance (1) |
4,012 | 4,012 | ||||||||||||||||||||||||||||||
|
Balance at December 31, 2009 |
$ | 105,370 | $ | 74,285 | $ | 51,158 | $ | 383,118 | $ | (6,214 | ) | $ | (54,399 | ) | $ | 553,318 | ||||||||||||||||
|
Net income for 2010 |
$ | 43,480 | 43,480 | 43,480 | ||||||||||||||||||||||||||||
|
Other Comprehensive Income |
||||||||||||||||||||||||||||||||
|
Change in unrealized gains on securities available-for-sale, net of tax of $243 |
452 | 452 | 452 | |||||||||||||||||||||||||||||
|
Reclassification adjustment for net gains/losses on securities available-for-sale included in net income, net of tax of ($96) |
(178 | ) | (178 | ) | (178 | ) | ||||||||||||||||||||||||||
|
Adjustment to funded status of employee benefit plans, net of tax of $212 |
(394 | ) | (394 | ) | (394 | ) | ||||||||||||||||||||||||||
|
Total Comprehensive Income |
$ | 43,360 | ||||||||||||||||||||||||||||||
|
Preferred stock dividends and discount amortization |
767 | (6,201 | ) | (5,434 | ) | |||||||||||||||||||||||||||
|
Cash dividends declared ($0.60 per share) |
(16,683 | ) | (16,683 | ) | ||||||||||||||||||||||||||||
|
Treasury stock issued (205,135 shares) |
(1,980 | ) | 5,672 | 3,692 | ||||||||||||||||||||||||||||
|
Recognition of restricted stock compensation expense |
470 | 470 | ||||||||||||||||||||||||||||||
|
Tax benefit from stock-based compensation |
46 | 46 | ||||||||||||||||||||||||||||||
|
Forfeitures of nonstatutory stock options
|
(104 | ) | (104 | ) | ||||||||||||||||||||||||||||
|
Balance at December 31, 2010 |
$ | 106,137 | $ | 74,285 | $ | 51,570 | $ | 401,734 | $ | (6,334 | ) | $ | (48,727 | ) | $ | 578,665 | ||||||||||||||||
|
Net income for 2011 |
$ | 47,264 | 47,264 | 47,264 | ||||||||||||||||||||||||||||
|
Other Comprehensive Income |
||||||||||||||||||||||||||||||||
|
Change in unrealized gains on securities available-for-sale, net of tax of $2,346 |
4,356 | 4,356 | 4,356 | |||||||||||||||||||||||||||||
|
Reclassification adjustment for net gains/losses on securities available-for-sale included in net income, net of tax of $43 |
81 | 81 | 81 | |||||||||||||||||||||||||||||
|
Adjustment to funded status of employee benefit plans, net of tax of $6,576 |
(12,211 | ) | (12,211 | ) | (12,211 | ) | ||||||||||||||||||||||||||
|
Total Comprehensive Income |
$ | 39,490 | ||||||||||||||||||||||||||||||
|
Redemption of preferred stock |
(108,676 | ) | (108,676 | ) | ||||||||||||||||||||||||||||
|
Preferred stock dividends and discount amortization |
2,539 | (7,611 | ) | (5,072 | ) | |||||||||||||||||||||||||||
|
Cash dividends declared ($0.60 per share) |
(16,830 | ) | (16,830 | ) | ||||||||||||||||||||||||||||
|
Treasury stock issued (182,507 shares) |
(11 | ) | (3,089 | ) | 5,046 | 1,946 | ||||||||||||||||||||||||||
|
Recognition of restricted stock compensation expense |
1,133 | 1,133 | ||||||||||||||||||||||||||||||
|
Tax expense from stock-based compensation |
(66 | ) | (66 | ) | ||||||||||||||||||||||||||||
|
Forfeitures of restricted stock (2,947 shares) |
11 | (75 | ) | (64 | ) | |||||||||||||||||||||||||||
|
Balance at December 31, 2011 |
$ | — | $ | 74,285 | $ | 52,637 | $ | 421,468 | $ | (14,108 | ) | $ | (43,756 | ) | $ | 490,526 | ||||||||||||||||
| (1) |
The preferred stock issued to the U.S. Treasury in the amount of $108,676 is presented net of a discount of $4,012. |
See Notes to Consolidated Financial Statements
PAGE 67
Table of Contents
S&T Bancorp, Inc. and Subsidiaries
| Years Ended December 31 | 2011 | 2010 | 2009 | |||||||||
| (in thousands) | ||||||||||||
|
OPERATING ACTIVITIES |
||||||||||||
|
Net Income |
$ | 47,264 | $ | 43,480 | $ | 7,951 | ||||||
|
Adjustments to reconcile net income to net cash provided by operating activities: |
||||||||||||
|
Provision for loan losses |
15,609 | 29,511 | 72,354 | |||||||||
|
Provision for unfunded loan commitments |
(1,474 | ) | (1,555 | ) | 2,888 | |||||||
|
Depreciation and amortization |
6,323 | 6,587 | 7,044 | |||||||||
|
Net amortization of discounts and premiums |
1,191 | 881 | 948 | |||||||||
|
Stock-based compensation expense |
960 | 513 | 321 | |||||||||
|
Security losses (gains), net |
124 | (274 | ) | 5,088 | ||||||||
|
Deferred income taxes |
2,448 | (4,537 | ) | (7,465 | ) | |||||||
|
Tax expense (benefit) from stock-based compensation |
66 | (46 | ) | (4 | ) | |||||||
|
Mortgage loans originated for sale |
(68,261 | ) | (121,883 | ) | (144,852 | ) | ||||||
|
Proceeds from the sale of loans |
74,780 | 119,617 | 139,556 | |||||||||
|
Gain on the sale of loans, net |
(875 | ) | (1,809 | ) | (510 | ) | ||||||
|
Net decrease in interest receivable |
589 | 2,752 | 4,470 | |||||||||
|
Net decrease in interest payable |
(443 | ) | (1,678 | ) | (2,582 | ) | ||||||
|
Net decrease (increase) in other assets |
4,132 | (2,745 | ) | (17,917 | ) | |||||||
|
Net (decrease) increase in other liabilities |
(8,531 | ) | 20,170 | (12,723 | ) | |||||||
|
Net Cash Provided by Operating Activities |
73,902 | 88,984 | 54,567 | |||||||||
|
INVESTING ACTIVITIES |
||||||||||||
|
Proceeds from maturities, prepayments and calls of securities available-for-sale |
71,318 | 146,960 | 177,443 | |||||||||
|
Proceeds from sales of securities available-for-sale |
70 | 2,579 | 4,833 | |||||||||
|
Purchases of securities available-for-sale |
(135,447 | ) | (82,890 | ) | (86,135 | ) | ||||||
|
Proceeds from the redemption of Federal Home Loan Bank stock |
4,149 | 1,177 | — | |||||||||
|
Net decrease in loans |
185,182 | 3,236 | 113,064 | |||||||||
|
Proceeds from the sale of loans not originated for resale |
8,595 | — | — | |||||||||
|
Purchases of premises and equipment |
(2,531 | ) | (3,469 | ) | (1,577 | ) | ||||||
|
Proceeds from the sale of premises and equipment |
404 | 60 | 1,314 | |||||||||
|
Net Cash Provided by Investing Activities |
131,740 | 67,653 | 208,942 | |||||||||
|
FINANCING ACTIVITIES |
||||||||||||
|
Net increase in core deposits |
105,776 | 63,383 | 79,565 | |||||||||
|
Net decrease in certificates of deposit |
(87,553 | ) | (50,536 | ) | (3,694 | ) | ||||||
|
Net increase (decrease) in short-term borrowings |
75,000 | (51,300 | ) | (257,175 | ) | |||||||
|
Net decrease in securities sold under repurchase agreements and federal funds purchased |
(10,283 | ) | (4,281 | ) | (68,484 | ) | ||||||
|
Proceeds from long-term borrowings |
4,192 | 9,241 | — | |||||||||
|
Repayments of long-term borrowings |
(1,682 | ) | (65,770 | ) | (94,437 | ) | ||||||
|
Proceeds from issuance of preferred stock and common stock warrant |
— | — | 108,676 | |||||||||
|
Redemption of preferred stock |
(108,676 | ) | — | — | ||||||||
|
Purchase of treasury shares |
(64 | ) | — | — | ||||||||
|
Sale of treasury shares |
1,946 | 3,692 | 1,349 | |||||||||
|
Preferred stock dividends |
(5,072 | ) | (5,434 | ) | (4,513 | ) | ||||||
|
Cash dividends paid to common shareholders |
(16,830 | ) | (16,683 | ) | (25,427 | ) | ||||||
|
Tax (expense) benefit from stock-based compensation |
(66 | ) | 46 | 4 | ||||||||
|
Net Cash Used in Financing Activities |
(43,312 | ) | (117,642 | ) | (264,136 | ) | ||||||
|
Net increase (decrease) in cash and cash equivalents |
162,330 | 38,995 | (627 | ) | ||||||||
|
Cash and cash equivalents at beginning of year |
108,196 | 69,201 | 69,828 | |||||||||
|
Cash and Cash Equivalents at End of Year |
$ | 270,526 | $ | 108,196 | $ | 69,201 | ||||||
|
Supplemental Disclosures |
||||||||||||
|
Interest paid |
$ | 27,733 | $ | 36,251 | $ | 41,082 | ||||||
|
Income taxes paid |
15,100 | 14,818 | 5,338 | |||||||||
|
Loans transferred to held for sale |
8,753 | — | — | |||||||||
|
Transfers to other real estate owned and other repossessed assets |
8,472 | 11,308 | 4,081 | |||||||||
See Notes to Consolidated Financial Statements
PAGE 68
Table of Contents
NOTES TO CONSOLIDATED FINANCIAL STATEMENTS
S&T Bancorp, Inc. and Subsidiaries
Nature of Operations
S&T Bancorp, Inc., or S&T, was incorporated on March 17, 1983 under the laws of the Commonwealth of Pennsylvania as a bank holding company and has three wholly owned subsidiaries, S&T Bank, 9th Street Holdings, Inc. and STBA Capital Trust I. We own a one-half interest in Commonwealth Trust Credit Life Insurance Company, or CTCLIC.
We are presently engaged in nonbanking activities through the following six entities: 9th Street Holdings, Inc.; S&T Bancholdings, Inc.; CTCLIC; S&T Insurance Group, LLC; S&T Professional Resources Group, LLC and Stewart Capital Advisors, LLC. 9th Street Holdings, Inc. and S&T Bancholdings, Inc. are investment holding companies. CTCLIC, which is a joint venture with another financial institution, acts as a reinsurer of credit life, accident and health insurance policies sold by S&T Bank and the other institution. S&T Insurance Group, LLC, through its subsidiaries, offers a variety of insurance products. S&T Professional Resources Group, LLC markets software developed by S&T Bank. Stewart Capital Advisors, LLC is a registered investment advisor that manages private investment accounts for individuals and institutions and advises the Stewart Capital Mid Cap Fund.
On September 14, 2011, we announced the signing of a definitive merger agreement to acquire Mainline Bancorp, Inc., or Mainline, a bank holding company based in Ebensburg, Pennsylvania. Mainline, with approximately $236 million in assets maintains eight offices in Cambria and Blair counties in Pennsylvania. The transaction, valued at approximately $21 million, is expected to be completed in the first quarter of 2012 pending the approval of the shareholders of Mainline and satisfaction of other customary closing conditions.
Accounting Policies
Our financial statements have been prepared in accordance with U. S. generally accepted accounting principles, or GAAP. In preparing the financial statements, management is required to make estimates and assumptions that affect the reported amounts of assets and liabilities as of the dates of the balance sheets and revenues and expenses for the periods then ended. Actual results could differ from those estimates. Our significant accounting policies are described below.
Principals of Consolidation
The Consolidated Financial Statements include the accounts of S&T and its wholly owned subsidiaries. All significant intercompany transactions have been eliminated in consolidation. Investments of 20 percent to 50 percent of the outstanding common stock of investees are accounted for using the equity method of accounting.
Reclassification
Certain amounts in prior years’ financial statements have been reclassified to conform to the current year’s presentation. The reclassifications had no significant effect on our financial condition or results of operations.
Business Combinations
We account for business combinations using the acquisition method of accounting. Under this method of accounting, the acquired company’s net assets are recorded at fair value at the date of acquisition, and the results of operations of the acquired company are combined with our results from that date forward. Acquisition costs are expenses when incurred. The difference between the purchase price and the fair value of the net assets acquired (including identified intangibles) is recorded as goodwill.
PAGE 69
Table of Contents
NOTE 1. SUMMARY OF SIGNIFICANT ACCOUNTING POLICIES — continued
Fair Value Measurements
We use fair value measurements when recording and disclosing certain financial assets and liabilities. Securities available-for-sale, trading assets and derivatives are recorded at fair value on a recurring basis. Additionally, from time to time, we may be required to record other assets at fair value on a nonrecurring basis, such as loans held for sale, impaired loans, other real estate owned, or OREO, mortgage servicing rights, or MSRs, and certain other assets.
Fair value is the price that would be received to sell an asset or paid to transfer a liability in the principal or most advantageous market in an orderly transaction between market participants at the measurement date. An orderly transaction is a transaction that assumes exposure to the market for a period prior to the measurement date to allow for marketing activities that are usual and customary for transactions involving such assets or liabilities; it is not a forced transaction. In determining fair value, we use various valuation approaches, including market, income and cost approaches. The fair value standard establishes a hierarchy for inputs used in measuring fair value that maximizes the use of observable inputs and minimizes the use of unobservable inputs by requiring that observable inputs be used when available. Observable inputs are inputs that market participants would use in pricing an asset or liability, which are developed, based on market data we have obtained from independent sources. Unobservable inputs reflect our estimate of assumptions that market participants would use in pricing an asset or liability, which are developed based on the best information available in the circumstances.
The fair value hierarchy gives the highest priority to unadjusted quoted market prices in active markets for identical assets or liabilities (Level 1 measurement) and the lowest priority to unobservable inputs (Level 3 measurement). The fair value hierarchy is broken down into three levels based on the reliability of inputs as follows:
Level 1: valuation is based upon unadjusted quoted market prices for identical instruments traded in active markets.
Level 2: valuation is based upon quoted market prices for similar instruments traded in active markets, quoted market prices for identical or similar instruments traded in markets that are not active and model-based valuation techniques for which all significant assumptions are observable in the market or can be corroborated by market data.
Level 3: valuation is derived from other valuation methodologies including discounted cash flow models and similar techniques that use significant assumptions not observable in the market. These unobservable assumptions reflect estimates of assumptions that market participants would use in determining fair value.
A financial instrument’s level within the fair value hierarchy is based on the lowest level of input that is significant to the fair value measurement. Our policy is to recognize transfers between any of the fair value hierarchy levels at the end of the reporting period in which the transfer occurred.
The following are descriptions of the valuation methodologies that we use for financial instruments recorded at fair value on either a recurring or nonrecurring basis.
Recurring Basis
Securities Available-for-Sale
Securities available-for-sale include both debt and equity securities.
We obtain estimated fair values for debt securities from a third-party pricing service, which utilizes several sources for valuing fixed-income securities. The market evaluation sources for debt securities include observable inputs rather than significant unobservable inputs and are classified as Level 2. The service provider utilizes pricing models that vary by asset class and include available trade, bid and other market information. Generally, the methodologies include broker quotes, proprietary models, vast descriptive terms and conditions databases, as well as extensive quality control programs.
PAGE 70
Table of Contents
NOTE 1. SUMMARY OF SIGNIFICANT ACCOUNTING POLICIES — continued
Marketable equity securities that have an active, quotable market are classified in Level 1. Marketable equity securities that are quotable, but are thinly traded or inactive, are classified as Level 2 and securities that are not readily traded and do not have a quotable market are classified as Level 3.
Trading Assets
We use quoted market prices to determine the fair value of our trading assets. Our trading assets are held in a Rabbi Trust under a deferred compensation plan and are invested in two readily quoted mutual funds. Accordingly, these assets are classified as Level 1. Trading assets are recorded in other assets in the Consolidated Balance Sheets.
Derivative Financial Instruments
We use derivative instruments including interest rate swaps for commercial loans with our customers and we sell mortgage loans in the secondary market and enter into interest rate lock commitments. We calculate the fair value for derivatives using widely accepted valuation techniques including discounted cash flow analysis on the expected cash flows of each derivative. Each valuation considers the contractual terms of the derivative, including the period to maturity and uses observable market based inputs, such as interest rate curves and implied volatilities. Accordingly, derivatives are classified as Level 2.
We incorporate credit valuation adjustments into the valuation models to appropriately reflect both its own nonperformance risk and the respective counterparty’s nonperformance risk in calculating fair value measurements. In adjusting the fair value of our derivative contracts for the effect of nonperformance risk, we have considered the impact of netting and any applicable credit enhancements and collateral postings.
Nonrecurring Basis
Loans Held for Sale
Loans held for sale consist of 1-4 family residential loans originated for sale in the secondary market and from time to time, certain loans transferred from the loan portfolio to loans held for sale, all of which are carried at the lower of cost or fair value. The fair value of 1-4 family residential loans is based on the principal or most advantageous market currently offered for similar loans using observable market data. The fair value of the loans transferred from the loan portfolio is based on the amounts offered for these loans in currently pending sales transactions. Loans held for sale carried at fair value are classified as Level 2.
Impaired Loans
Impaired loans are carried at the lower of carrying value or fair value. Fair value is determined as the recorded investment balance less any specific reserve. We establish a specific reserve based on the following three impairment methods: 1) the present value of expected future cash flows discounted at the loan’s original effective interest rate, 2) the loan’s observable market price or 3) the fair value of the collateral less estimated selling costs when the loan is collateral dependent and we expect to liquidate. However, if repayment is expected to come from the operation of the collateral, rather than liquidation, then we do not consider estimated selling costs in determining the fair value of the collateral. Collateral values are generally based upon appraisals by approved, independent state certified appraisers.
Appraisals may be discounted based on our historical knowledge, changes in market conditions from the time of valuation or our knowledge of the borrower and the borrower’s business. Prior to December 31, 2011, we classified impaired loans as Level 2 assets when the fair value was based on
PAGE 71
Table of Contents
NOTE 1. SUMMARY OF SIGNIFICANT ACCOUNTING POLICIES — continued
current independent appraisals received within the past 12 months. Appraisals in excess of 12 months were classified as Level 3. Due to the subjective nature factored into the appraisal process, including various assumptions and expectations on cash flows, we no longer believe that these appraisals meet the Level 2 reporting for fair value. At December 31, 2011, we transferred our impaired loans from Level 2 of the fair value hierarchy into Level 3. The transfer between Levels had no impact on our consolidated financial statements.
OREO and Other Repossessed Assets
OREO and other repossessed assets obtained in partial or total satisfaction of a loan are recorded at the lower of recorded investment in the loan or fair value less cost to sell. Subsequent to foreclosure, these assets are carried at the lower of the amount recorded at acquisition date or fair value less cost to sell. Accordingly, it may be necessary to record nonrecurring fair value adjustments. Fair value, when recorded, is generally based upon appraisals by approved, independent state certified appraisers. Like impaired loans, appraisals on OREO may be discounted based on our historical knowledge, changes in market conditions from the time of valuation or other information available to us. Prior to December 31, 2011, we classified OREO as Level 2 assets when the fair value was based on current independent appraisals received within the past 12 months. Appraisals in excess of 12 months were classified as Level 3. As discussed above, due to the subjective nature factored into the appraisal process, including various assumptions and expectations on cash flows, we no longer believe that these appraisals meet the Level 2 reporting for fair value. At December 31, 2011, we transferred OREO from Level 2 of the fair value hierarchy into Level 3.
Mortgage Servicing Rights
The fair value of MSRs are determined by calculating the present value of estimated future net servicing cash flows, considering expected mortgage loan prepayment rates, discount rates, servicing costs and other economic factors, which are determined based on current market conditions. The expected rate of mortgage loan prepayments is the most significant factor driving the value of MSRs. If the carrying value of MSRs exceeds fair value, they are considered impaired. As the valuation model includes significant unobservable inputs, MSRs are classified as Level 3 within the fair value hierarchy.
Other Assets
In accordance with GAAP, we measure certain other assets at fair value on a nonrecurring basis. Fair value is based on the application of lower of cost or fair value accounting, or write downs of individual assets. Valuation methodologies used to measure fair value are consistent with overall principles of fair value accounting and consistent with those described above.
Financial Instruments
In addition to financial instruments recorded at fair value in our financial statements, fair value accounting guidance requires disclosure of the fair value of all of an entity’s assets and liabilities that are considered financial instruments. The majority of our assets and liabilities are considered financial instruments as defined in the guidance. Many of these instruments lack an available trading market as characterized by a willing buyer and willing seller engaged in an exchange transaction. Also, it is our general practice and intent to hold our financial instruments to maturity and to not engage in trading or sales activities. For fair value disclosure purposes, we substantially utilized the fair value measurement criteria as required and explained above. In cases where quoted fair values are not available, we use present value methods to determine the fair value of our financial instruments.
PAGE 72
Table of Contents
NOTE 1. SUMMARY OF SIGNIFICANT ACCOUNTING POLICIES — continued
Cash and Cash Equivalents and Other Short-Term Assets
The carrying amounts reported in the Consolidated Balance Sheets for cash and due from banks, including interest-bearing deposits approximate fair value.
Loans Held for Sale
Loans held for sale are carried at the lower of cost or fair value.
Loans
The fair value of variable rate performing loans is based on carrying values adjusted for credit risk. The fair value of fixed rate performing loans is estimated using discounted cash flow analyses, utilizing interest rates currently being offered for loans with similar terms, adjusted for credit risk. The fair value of nonperforming loans is based on their carrying values less any specific reserve. The carrying amount of accrued interest approximates fair value.
Bank Owned Life Insurance
Fair value approximates net cash surrender value.
Deposits
The fair values disclosed for deposits without defined maturities (e.g., noninterest and interest-bearing demand, money market and savings accounts) are by definition equal to the amounts payable on demand. The carrying amounts for variable rate, fixed-term time deposits approximate their fair values. Estimated fair values for fixed rate and other time deposits are based on discounted cash flow analysis, using interest rates currently offered for time deposits with similar terms. The carrying amount of accrued interest approximates fair value.
Short-Term Borrowings
The carrying amounts of securities sold under repurchase agreements, federal funds purchased, and other short-term borrowings approximate their fair values.
Long-Term Borrowings
The fair values disclosed for fixed rate long-term borrowings are determined by discounting their contractual cash flows using current interest rates for long-term borrowings of similar remaining maturities. The carrying amounts of variable rate long-term borrowings approximate their fair values.
Junior Subordinated Debt Securities
The variable rate junior subordinated debt securities reprice quarterly and fair values are based on carrying values.
Loan Commitments and Standby Letters of Credit
Off-balance sheet financial instruments consist of commitments to extend credit and letters of credit. Except for interest rate lock commitments, estimates of the fair value of these off-balance sheet items are not made because of the short-term nature of these arrangements and the credit standing of the counterparties.
Other
Estimates of fair value are not made for items that are not defined as financial instruments, including such items as our core deposit intangibles and the value of our trust operation.
PAGE 73
Table of Contents
NOTE 1. SUMMARY OF SIGNIFICANT ACCOUNTING POLICIES — continued
Cash and Cash Equivalents
We consider cash and due from banks, interest-bearing deposits with banks and federal funds sold as cash and cash equivalents.
Securities
We determine the appropriate classification of securities at the time of purchase. All securities, including both debt and equity securities, are classified as available-for-sale. These are securities that we intend to hold for an indefinite period of time, but that may be sold in response to changes in interest rates, prepayment risk, liquidity needs or other factors. Such securities are carried at fair value with net unrealized gains and losses deemed to be temporary, reported as a component of other comprehensive income, net of tax. Realized gains and losses on the sale of available-for-sale securities and other-than-temporary impairment, or OTTI, charges are recorded within noninterest income in the Consolidated Statements of Income. Realized gains and losses on the sale of securities are determined using the specific-identification method. Bond premiums are amortized to the call date and bond discounts are accreted to the maturity date, both on a level yield basis.
We perform a quarterly review of our securities to identify those that may indicate an OTTI. Our policy for OTTI within the marketable equity securities portfolio generally requires an impairment charge when the security is in a loss position for 12 consecutive months, unless facts and circumstances would suggest the need for an OTTI prior to that time. Our policy for OTTI within the debt securities portfolio is based upon a number of factors, including but not limited to, the length of time and extent to which the estimated fair value has been less than cost, the financial condition of the underlying issuer, the ability of the issuer to meet contractual obligations, the likelihood of the security’s ability to recover any decline in its estimated fair value and whether management intends to sell the security or if it is more likely than not that management will be required to sell the investment security prior to the security’s recovery.
Restricted Investment in Bank Stock
We are a member of the Federal Home Loan Bank, or FHLB, of Pittsburgh. The FHLB requires members to purchase and hold a specified level of FHLB stock based upon their level and availability of borrowings and participation in other programs. Members do not purchase stock in the FHLB for the same reasons that traditional equity investors acquire stock in an investor-owned enterprise. Rather, members purchase stock to obtain access to the low-cost products and services offered by the FHLB. Unlike equity securities of traditional for-profit enterprises, the stock of the FHLB does not provide its holders with an opportunity for capital appreciation because, by regulation, FHLB stock can only be purchased, redeemed and transferred at par value. Stock in the FHLB is non-marketable and is redeemable at the discretion of the FHLB. Both cash and stock dividends are reported as income in taxable investment securities in the Consolidated Statements of Income.
At December 31, 2011 and 2010, FHLB stock totaled $18.2 million and $22.4 million, respectively. This investment is carried at cost and evaluated for impairment based on the ultimate recoverability of the par value. We reviewed and evaluated the FHLB capital stock for OTTI at December 31, 2011. We considered the suspension of dividends and the repurchase of excess capital stock by the FHLB’s Board of Directors in a letter to member banks dated December 23, 2008. We reviewed the FHLB’s Form 10-Q for the period ended September 30, 2011 filed with the SEC on November 08, 2011 to support our conclusion around OTTI of the FHLB stock. We believe our holdings in the stock are ultimately recoverable at par value as of December 31, 2011 and, therefore, determined that the FHLB stock was not OTTI. Further, we received a total of $4.1 million from the FHLB to redeem a total of 41,488 shares of capital stock in 2011.
PAGE 74
Table of Contents
NOTE 1. SUMMARY OF SIGNIFICANT ACCOUNTING POLICIES — continued
Loans Held for Sale
Loans held for sale consist of 1-4 family residential loans originated for sale in the secondary market and from time to time, certain loans transferred from the loan portfolio to loans held for sale, all of which are carried at the lower of cost or fair value. If a loan is transferred from the loan portfolio to the held-for-sale category, any write-down in the carrying amount of the loan at the date of transfer is recorded as a charge-off against the allowance for loan loss, or ALL. Subsequent declines in fair value are recognized as a charge to noninterest income. When a loan is placed in the held-for-sale category, we stop amortizing the related deferred fees and costs. The remaining unamortized fees and costs are recognized as part of the cost basis of the loan at the time it is sold. Gains and losses on sales of loans held for sale are included in other noninterest income in the Consolidated Statements of Income.
Loans
Loans are reported at the principal amount outstanding net of unearned income, unamortized premiums or discounts and deferred origination fees and costs. We defer certain nonrefundable loan origination and commitment fees. Accretion of discounts and amortization of premiums on loans are included in interest income in the Consolidated Statements of Income. Loan origination fees and direct loan origination costs are deferred and amortized as an adjustment of loan yield over the respective lives of the loans without consideration of anticipated prepayments. If a loan is paid off, the remaining unaccreted or unamortized net origination fees and costs are immediately recognized into income or expense.
Closed-end installment loans, amortizing loans secured by real estate and any other loans with payments scheduled monthly are reported past due when the borrower is in arrears two or more monthly payments. Other multi-payment obligations with payments scheduled other than monthly are reported past due when one scheduled payment is due and unpaid for 30 days or more.
Generally, consumer loans are charged off against the ALL upon the loan reaching 90 days past due. Commercial loans are charged off as management becomes aware of facts and circumstances that raise doubt as to the collectability of all or a portion of the principal and when we believe a confirmed loss exists.
Impaired and Other Nonaccrual Loans
We stop accruing interest on a loan (nonaccrual loan) when the borrower’s payment is 90 days past due. Loans are also placed on nonaccrual status when payment is not past due, but we have doubt about the borrower’s ability to comply with existing repayment terms. When the interest accrual is discontinued, all unpaid accrued interest is reversed against interest income. Interest income is recognized on nonaccrual loans on a cash basis if recovery of the remaining principal is reasonably assured. Loans may be returned to accruing status when the borrower has resumed paying the full amount of the scheduled contractual obligation for a sustained period of time, generally at least six months, and we are reasonably assured of collecting the remaining contractual principal and interest.
Allowance for Loan Losses
The ALL reflects our estimates of probable losses inherent in the loan portfolio at the balance sheet date. The methodology for determining the ALL has two main components: evaluation and impairment tests of individual loans and evaluation and impairment tests of certain groups of homogeneous loans with similar risk characteristics.
A loan is considered impaired when it is probable that we will be unable to collect all principal and interest payments due according to the original contractual terms of the loan agreement. We individually evaluate all substandard and nonaccrual commercial loans greater than $0.5 million for impairment. All troubled debt restructurings, or TDRs, are considered to be impaired loans and will
PAGE 75
Table of Contents
NOTE 1. SUMMARY OF SIGNIFICANT ACCOUNTING POLICIES — continued
be reported as an impaired loan for the remaining life of the loan, unless the restructuring agreement specifies an interest rate equal to or greater than the rate that would be accepted at the time of the restructuring for a new loan with comparable risk and it is fully expected that the remaining principal and interest will be collected according to the restructured agreement. For all TDRs, regardless of size, as well as all other impaired loans, we conduct further analysis to determine the probable loss and assign a specific reserve to the loan if deemed appropriate. Specific reserves are established based upon the following three impairment methods: 1) the present value of expected future cash flows discounted at the loan’s original effective interest rate, 2) the loan’s observable market price or 3) the estimated fair value of the collateral if the loan is collateral dependent. Our impairment evaluations consist primarily of the fair value of collateral method since most loans are collateral dependent. Collateral values are discounted to consider disposition costs when appropriate. A specific reserve is established if the fair value of the impaired loan is less than the recorded investment in the loan balance.
The ALL for homogeneous loans is calculated using a systematic methodology that is applied on a quarterly basis. The ALL model is comprised of five distinct portfolio segments: 1) Commercial Real Estate, or CRE, 2) Commercial and Industrial, or C&I, 3) Commercial Construction, 4) Consumer Real Estate and 5) Other Consumer. Each segment has a distinct set of risk characteristics monitored by management. We further assess and monitor risk and performance at a more disaggregated level which includes our internal risk rating system for the commercial segments and collateral position and loan-to-value, or LTV, for the consumer segments.
Historical loss calculations are performed whereby losses from each pool of loans are aggregated over the respective loss emergence period. The loss emergence period is defined as the average time between the occurrence of a credit event (deterioration in the borrower’s financial condition) and the confirmation of a loss. Currently, we have estimated the loss emergence period to be two years for commercial real estate loans and one year for all other loan classes. These historic loss calculations are then aggregated and applied to each loan segment to determine the component of the ALL based upon historic losses. Since the losses captured in the historical loss analysis may not accurately represent the losses inherent in the loan portfolio at the balance sheet date, qualitative adjustments are then applied to loan segments to determine the total ALL. Qualitative adjustments are aggregated into five categories, including process, economic conditions, loan portfolio, asset quality and other external factors.
Within the five aforementioned categories, the following qualitative factors are considered:
| 1) | Changes in our lending policies and procedures, including underwriting standards, collection, charge-off and recovery practices not considered elsewhere in estimating credit losses; |
| 2) | Changes in national, regional, and local economic and business conditions and developments that affect the collectability of the portfolio, including the condition of various market segments; |
| 3) | Changes in the nature and volume of our loan portfolio and terms of loans; |
| 4) | Changes in the experience, ability and depth of our lending management and staff; |
| 5) | Changes in the volume and severity of past due loans, the volume of non accrual loans, and the volume and severity of adversely classified or graded loans; |
| 6) | Changes in the quality of our loan review system; |
| 7) | Changes in the value of the underlying collateral for collateral-dependent loans; |
| 8) | The existence and effect of any concentrations of credit and changes in the level of such concentrations; and |
| 9) | The effect of external factors such as competition and legal and regulatory requirements on the level of estimated credit losses in our current loan portfolio. |
PAGE 76
Table of Contents
NOTE 1. SUMMARY OF SIGNIFICANT ACCOUNTING POLICIES — continued
Premises and Equipment
Premises and equipment, including leasehold improvements, are stated at cost less accumulated depreciation. Maintenance and repairs are charged to expense as incurred, while improvements that extend an asset’s useful life are capitalized and depreciated over the estimated remaining life of the asset. Depreciation expense is computed generally by the straight-line method for financial reporting purposes and accelerated methods for income tax purposes. Leasehold improvements are amortized over the shorter of the asset’s useful life or the remaining lease term, including renewal periods when reasonably assured.
Joint Ventures
We have made investments directly in Low Income Housing Tax Credit, or LIHTC, partnerships formed with third parties. As a limited partner in these operating partnerships, we receive tax credits and tax deductions for losses incurred by the underlying properties. These investments are amortized over a maximum of 10 years, which represents the period that the tax credits will be utilized. We have determined that we are not the primary beneficiary of these investments because the general partners have the power to direct the activities that most significantly impact the economic performance of the partnership and have the obligation to absorb expected losses and the right to receive benefits.
OREO and Other Repossessed Assets
OREO and other repossessed assets are included in other assets in the Consolidated Balance Sheets and are comprised of properties acquired through foreclosure proceedings or acceptance of a deed in lieu of a foreclosure. At the time of foreclosure, these properties are recorded at the lower of the recorded investment in the loan or fair value less cost to sell. Loan losses arising from the acquisition of such property initially are charged against the ALL. Subsequently, these assets are carried at the lower of carrying value or current fair value less cost to sell. Gains or losses realized subsequent to acquisition are recorded in other expenses in the Consolidated Statements of Income.
Goodwill and Other Intangible Assets
We have three reporting units including: Community Banking, Wealth Management and Insurance. At December 31, 2011, we had goodwill of $165.3 million, including $161.1 million in Community Banking, representing 97 percent of total goodwill and $4.2 million in Insurance, representing three percent of total goodwill. The carrying value of goodwill is tested annually for impairment each October 1 or more frequently if indicators of impairment are present. The evaluation for impairment involves comparing the current estimated fair value of each reporting unit to its carrying value, including goodwill. If the current estimated fair value of a reporting unit exceeds its carrying value, no additional testing is required and an impairment loss is not recorded. If the estimated fair value of a reporting unit is less than the carrying value, further valuation procedures are performed and could result in an impairment of goodwill being recorded. Further valuation procedures would include allocating the estimated fair value to all assets and liabilities of the reporting unit to determine an implied goodwill value. If the implied goodwill value of a reporting unit is less than the carrying amount of that goodwill, an impairment loss is recognized in an amount equal to that excess.
We have core deposit and other intangible assets resulting from acquisitions which are subject to amortization. We determine the amount of identifiable intangible assets based upon independent core deposit and insurance contract analyses at the time of the acquisition. Intangible assets with finite useful lives are evaluated for impairment whenever events or changes in circumstances indicate that their carrying amount may not be recoverable. No events or changes in circumstances occurred during the years ended December 31, 2011, 2010 and 2009.
PAGE 77
Table of Contents
NOTE 1. SUMMARY OF SIGNIFICANT ACCOUNTING POLICIES — continued
Mortgage Servicing Rights
MSRs are recognized as separate assets when commitments to fund a loan to be sold are made. Upon commitment, the MSR is established, which represents the then current estimated fair value of future net cash flows expected to be realized for performing the servicing activities. The estimated fair value of the MSRs are estimated by calculating the present value of estimated future net servicing cash flows, considering expected mortgage loan prepayment rates, discount rates, servicing costs and other economic factors, which are determined based on current market conditions. The expected rate of mortgage loan prepayments is the most significant factor driving the value of MSRs. Increases in mortgage loan prepayments reduce estimated future net servicing cash flows because the life of the underlying loan is reduced. In determining the estimated fair value of MSRs, mortgage interest rates, which are used to determine prepayment rates, are held constant over the estimated life of the portfolio. MSRs are reported in other assets in the Consolidated Balance Sheets and are amortized into noninterest income in the Consolidated Statements of Income in proportion to, and over the period of, the estimated future net servicing income of the underlying mortgage loans.
MSRs are regularly evaluated for impairment based on the estimated fair value of those rights. The MSRs are stratified by certain risk characteristics, primarily loan term and note rate. If temporary impairment exists within a risk stratification tranche, a valuation allowance is established through a charge to income equal to the amount by which the carrying value exceeds the estimated fair value. If it is later determined all or a portion of the temporary impairment no longer exists for a particular tranche, the valuation allowance is reduced.
MSRs are also reviewed for OTTI. OTTI exists when the recoverability of a recorded valuation allowance is determined to be remote, taking into consideration historical and projected interest rates and loan pay-off activity. When this situation occurs, the unrecoverable portion of the valuation allowance is applied as a direct write-down to the carrying value of the MSR. Unlike a valuation allowance, a direct write-down permanently reduces the carrying value of the MSR and the valuation allowance, precluding subsequent recoveries.
Bank Owned Life Insurance
We have purchased life insurance policies on certain executive officers and employees. We receive the cash surrender value of each policy upon its termination or benefits are payable upon the death of the insured. Changes in net cash surrender value are recognized in noninterest income or expense in the Consolidated Statements of Income.
Derivative Financial Instruments
Interest Rate Swaps
In accordance with applicable accounting guidance for derivatives and hedging, all derivatives are recognized as either assets or liabilities on the balance sheet at fair value. Interest rate swaps are contracts in which a series of interest rate flows (fixed and variable) are exchanged over a prescribed period. The notional amounts on which the interest payments are based are not exchanged. We utilize interest rate swaps for commercial loans. These derivative positions relate to transactions in which we enter into an interest rate swap with a customer while at the same time entering into an offsetting interest rate swap with another financial institution. In connection with each transaction, we agree to pay interest to the customer on a notional amount at a variable interest rate and receive interest from the customer on a same notional amount at a fixed rate. At the same time, we agree to pay another financial institution the same fixed interest rate on the same notional amount and receive the same variable interest rate on the same notional amount. The transaction allows our customer to effectively convert a variable rate loan to a fixed rate loan with us receiving a variable yield. These agreements could have floors or caps on the contracted interest rates.
PAGE 78
Table of Contents
NOTE 1. SUMMARY OF SIGNIFICANT ACCOUNTING POLICIES — continued
Pursuant to our agreements with various financial institutions, we may receive collateral or may be required to post collateral based upon mark-to-market positions. Beyond unsecured threshold levels, collateral in the form of cash or securities may be made available to counterparties of interest rate swap transactions. Based upon our current positions and related future collateral requirements relating to them, we believe any affect on our cash flow or liquidity position to be immaterial. Derivatives contain an element of credit risk, the possibility that we will incur a loss because a counterparty, which may be a financial institution or a customer, fails to meet its contractual obligations. All derivative contracts with financial institutions may be executed only with counterparties approved by our Asset and Liability Committee, or ALCO, and derivatives with customers may only be executed with customers within credit exposure limits approved by our Senior Loan Committee. Interest rate swaps are considered derivatives, but are not accounted for using hedge accounting. As such, changes in the estimated fair value of the derivatives are recorded in current earnings and included in other noninterest income in the Consolidated Statements of Income.
Interest Rate Lock Commitments and Forward Sale Contracts
In the normal course of business, we sell originated mortgage loans into the secondary mortgage loan market. We also offer interest rate lock commitments to potential borrowers. The commitments are generally for 60 days and guarantee a specified interest rate for a loan if underwriting standards are met, but the commitment does not obligate the potential borrower to close on the loan. Accordingly, some commitments expire prior to becoming loans. We can encounter pricing risks if interest rates increase significantly before the loan can be closed and sold. We may utilize forward sale contracts in order to mitigate this pricing risk. Whenever a customer desires these products, a mortgage originator quotes a secondary market rate guaranteed for that day by the investor. The rate lock is executed between the mortgagee and us and in turn a forward sale contract may be executed between us and the investor. Both the rate lock commitment and the corresponding forward sale contract for each customer are considered derivatives, but are not accounted for using hedge accounting. As such, changes in the estimated fair value of the derivatives during the commitment period are recorded in current earnings and included in mortgage banking in the Consolidated Statements of Income.
Allowance for Unfunded Commitments
In the normal course of business, we offer off-balance sheet credit arrangements to enable our customers to meet their financing objectives. These instruments involve, to varying degrees, elements of credit and interest rate risk in excess of the amount recognized in the financial statements. Our exposure to credit loss, in the event the customer does not satisfy the terms of the agreement, equals the contractual amount of the obligation less the value of any collateral. We apply the same credit policies in making commitments and standby letters of credit that are used for the underwriting of loans to customers. Commitments generally have fixed expiration dates, annual renewals or other termination clauses and may require payment of a fee. Since many of the commitments are expected to expire without being drawn upon, the total commitment amounts do not necessarily represent future cash requirements. The allowance for unfunded commitments is included in other liabilities in the Consolidated Balance Sheets. The allowance for unfunded commitments is determined using a similar methodology as our ALL. The reserve is calculated by applying historical loss rates from our ALL model to the estimated future utilization of our unfunded commitments.
Treasury Stock
The repurchase of our common stock is recorded at cost. At the time of reissuance, the treasury stock account is reduced using the average cost method. Gains and losses on the reissuance of common
PAGE 79
Table of Contents
NOTE 1. SUMMARY OF SIGNIFICANT ACCOUNTING POLICIES — continued
stock are recorded in additional paid-in capital, to the extent additional paid-in capital from previous treasury share transactions exists. Any deficiency is charged to retained earnings.
Wealth Management Fees
Assets held in a fiduciary capacity by the subsidiary bank, S&T Bank, are not our assets and are therefore not included in our Consolidated Financial Statements. Wealth management fee income is reported in the Consolidated Statements of Income on the accrual basis.
Stock-Based Compensation
Stock-based compensation may include stock options and restricted stock which are measured using the fair value method of accounting. The grant date fair value is recognized over the period during which the recipient is required to provide service in exchange for the award. Stock option expense is determined utilizing the Black-Scholes model. Restricted stock expense is determined using the grant date fair value. We estimate expected forfeitures when stock-based awards are granted and record compensation expense only for awards that are expected to vest.
Pensions
Pension expense for S&T Bank’s defined benefit pension plan is actuarially determined using the projected unit credit actuarial cost method. The funding policy for the plan is to contribute amounts to the plan sufficient to meet the minimum funding requirements of the Employee Retirement Income Security Act of 1974, or ERISA, plus such additional amounts as may be appropriate, subject to federal income tax limitation.
Marketing Costs
We expense all marketing-related costs, including advertising costs, as incurred.
Income Taxes
We estimate income tax expense based on amounts expected to be owed to the tax jurisdictions where we conduct business. On a quarterly basis, management assesses the reasonableness of our effective tax rate based upon our current estimate of the amount and components of net income, tax credits and the applicable statutory tax rates expected for the full year.
Deferred income tax assets and liabilities are determined using the asset and liability method and are reported in other assets or other liabilities, as appropriate, in the Consolidated Balance Sheets. Under this method, the net deferred tax asset or liability is based on the tax effects of the differences between the book and tax basis of assets and liabilities and recognizes enacted changes in tax rate and laws. When deferred tax assets are recognized, they are subject to a valuation allowance based on management’s judgment as to whether realization is more likely than not.
Accrued taxes represent the net estimated amount due to taxing jurisdictions and are reported in other assets or other liabilities, as appropriate, in the Consolidated Balance Sheets. We evaluate and assess the relative risks and appropriate tax treatment of transactions and filing positions after considering statutes, regulations, judicial precedent and other information and maintain tax accruals consistent with the evaluation of these relative risks and merits. Changes to the estimate of accrued taxes occur periodically due to changes in tax rates, interpretations of tax laws, the status of examinations being conducted by taxing authorities and changes to statutory, judicial and regulatory guidance. These changes, when they occur, can affect deferred taxes and accrued taxes, as well as the current period’s income tax expense and can be significant to our operating results.
Tax positions are recognized as a benefit only if it is “more likely than not” that the tax position would be sustained in a tax examination, with a tax examination being presumed to occur. The
PAGE 80
Table of Contents
NOTE 1. SUMMARY OF SIGNIFICANT ACCOUNTING POLICIES — continued
amount recognized is the largest amount of tax benefit that is greater than 50 percent likely of being realized on examination. For tax positions not meeting the “more likely than not” test, no tax benefit is recorded.
Earnings Per Share
Basic earnings per share, or EPS, is calculated using the two-class method to determine income allocated to common shareholders. Unvested share-based payment awards that contain nonforfeitable rights to dividends are considered participating securities under the two-class method. Income allocated to common shareholders is then divided by the weighted average number of common shares outstanding during the period. Potentially dilutive securities are excluded from the basic EPS calculation.
Diluted earnings per share is calculated under the more dilutive of either the treasury stock method or the two-class method. Under the treasury stock method, weighted average number of common shares outstanding is increased by the potentially dilutive common shares. For the two-class method, diluted earnings per share is calculated for each class of shareholders using the weighted average number of shares attributed to each class. Potentially dilutive common shares are common stock equivalents relating to our outstanding warrants, stock options and restricted stock.
Recently Adopted Accounting Standards Updates
A Creditor’s Determination of Whether a Restructuring Is a Troubled Debt Restructuring
In April 2011, the Financial Accounting Standards Board, or FASB, issued accounting standards update, or ASU No. 2011-02, which amends the guidance for evaluating whether the restructuring of a receivable by a creditor is a troubled debt restructuring, or TDR. In evaluating whether a restructuring constitutes a TDR both for purposes of recording an impairment loss and for disclosure purposes, a creditor must separately conclude that both of the following exist: (a) the restructuring constitutes a concession; and (b) the debtor is experiencing financial difficulties. The new guidance was effective July 1, 2011, and applies retrospectively to restructurings occurring on or after January 1, 2011. We are also required to disclose the activity based information that was previously deferred by ASU No. 2011-01. The adoption of this ASU did not have a material impact on our results of operations or financial position.
Disclosure of Supplementary Pro Forma Information for Business Combinations
In December 2010, the FASB issued ASU No. 2010-29, which amends the disclosure requirements under the Accounting Standards Codification, or ASC, Topic 805, Business Combinations. The amendments specify that if a public entity presents comparative financial statements, the entity should disclose revenue and earnings of the combined entity as though the business combination that occurred during the current year had occurred as of the beginning of the comparable prior annual reporting period only. The amendments also expand the supplemental pro forma disclosures to include a description of the nature and amount of material, nonrecurring pro forma adjustments directly attributable to the business combination included in the reported pro forma revenue and earnings. The new guidance was effective for public companies prospectively for business combinations for which the acquisition date is on or after the beginning of the first annual reporting period beginning on or after December 15, 2010. The adoption of this ASU impacted only disclosure requirements and did not have a material impact on our results of operations or financial position.
When to Perform Step 2 of the Goodwill Impairment Test for Reporting Units with Zero or Negative Carrying Amounts
In December 2010, the FASB issued ASU No. 2010-28, which reflects the decision reached in Emerging Issues Task Force, or EITF Issue No. 10-A. This ASU modifies Step 1 of the goodwill impairment test for
PAGE 81
Table of Contents
NOTE 1. SUMMARY OF SIGNIFICANT ACCOUNTING POLICIES — continued
reporting units with zero or negative carrying amounts. For those reporting units, an entity is required to perform Step 2 of the goodwill impairment test if it is more likely than not that a goodwill impairment exists. In determining whether it is more likely than not that goodwill impairment exists, an entity should consider whether there are any adverse qualitative factors indicating that impairment may exist. The qualitative factors are consistent with the existing guidance and examples, which require that goodwill of a reporting unit be tested for impairment between annual tests if an event occurs or circumstances change that would more likely than not reduce the fair value of a reporting unit below its carrying amount. For public entities, this ASU was effective for fiscal years, and interim periods within those years, beginning after December 15, 2010. The adoption of this ASU did not have a material impact on our results of operations or financial position.
Disclosures about Credit Quality and the Allowance for Credit Losses
In July 2010, the FASB issued an ASU that significantly increases disclosures about the credit quality of financing receivables and the allowance for credit losses and requires additional information, such as aging information and credit quality indicators disaggregated by portfolio segment and class. The disaggregated information is based on how a company develops its allowance for credit losses and how it manages its credit exposure. Required disclosures as of the end of a reporting period are effective for periods ending on or after December 15, 2010, while required disclosures about activity that occurs during a reporting period are effective for periods beginning on or after December 15, 2010. Required disclosures specifically related to troubled debt restructurings were deferred in an ASU issued in January 2011. The effect of this update is included in the notes to the consolidated financial statements. The adoption of this ASU did not have a material impact on S&T’s consolidated financial statements.
Fair Value Measurements
In January 2010, the FASB issued an ASU requiring new disclosures on transfers into and out of Level 1 and 2 fair value measurements of the fair value hierarchy and requiring separate disclosures about purchases, sales, issuances and settlements relating to Level 3 measurements. It also clarifies existing fair value disclosures relating to the level of disaggregation and inputs and valuation techniques used to measure fair value. It was effective for the first reporting period (including interim periods) beginning after December 15, 2009, except for the requirement to provide the Level 3 activity of purchases, sales, issuances and settlements on a gross basis, which was effective for fiscal years beginning after December 15, 2010. The additional Level 3 disclosures that are now required have been included in the notes to the consolidated financial statements. The adoption of this ASU did not have a material impact on S&T’s consolidated financial statements.
Recently Issued Accounting Standards Updates
Presentation of Comprehensive Income
In December 2011, the FASB issued ASU No. 2011-12, which supersedes certain pending paragraphs in ASU No. 2011-05. It effectively defers changes that relate to the presentation of reclassification adjustments out of accumulated other comprehensive income. The amendments will be temporary to allow the FASB time to redeliberate the presentation requirements for reclassifications out of accumulated other comprehensive income for annual and interim financial statements. This amendment is effective at the same time as the amendments in ASU No. 2011-05. It should be applied retrospectively and is effective for public companies for fiscal years, and interim periods within those years, beginning after December 15, 2011. The adoption of this ASU will only impact our presentation of comprehensive income and is not expected to have an impact on our results of operations or financial position.
PAGE 82
Table of Contents
NOTE 1. SUMMARY OF SIGNIFICANT ACCOUNTING POLICIES — continued
Disclosures about Offsetting Assets and Liabilities
In December 2011, the FASB issued ASU No. 2011-11 in conjunction with the International Accounting Standards Board’s, or IASB’s, issuance of amendments to Disclosures—Offsetting Financial Assets and Financial Liabilities (Amendments to International Financial Reporting Standards, or IFRS 7). While the FASB and IASB retained the existing offsetting models under U.S. GAAP and IFRS, the new standards require disclosures to allow investors to better compare financial statements prepared under U.S. GAAP with financial statements prepared under IFRS. The new standards are effective for annual periods beginning January 1, 2013, and interim periods within those annual periods. Retrospective application is required. The adoption of this ASU is not expected to have a material impact on our results of operations or financial position.
Testing Goodwill for Impairment
In September 2011, the FASB issued ASU No. 2011-08, which permits an entity to make a qualitative assessment of whether it is more likely than not that a reporting unit’s fair value is less than its carrying amount before applying the two-step goodwill impairment test. If an entity concludes it is not more likely than not, it need not perform the two-step impairment test. This ASU is effective for annual and interim goodwill impairment tests performed for fiscal years beginning after December 15, 2011. Early adoption is permitted. The adoption of this ASU is not expected to have a material impact on our results of operations or financial position.
Presentation of Comprehensive Income
In June 2011, the FASB issued ASU No. 2011-05, the provisions of which allow an entity the option to present the total of comprehensive income, the components of net income and the components of other comprehensive income either in a single continuous statement of comprehensive income or in two separate but consecutive statements. Under both options, an entity is required to present each component of net income along with total net income, each component of other comprehensive income along with a total for other comprehensive income and a total amount for comprehensive income. ASU 2011-05 eliminates the option to present the components of other comprehensive income as part of the statement of changes in stockholders’ equity. ASU 2011-05 does not change the items that must be reported in other comprehensive income or when an item of other comprehensive income must be reclassified to net income. ASU 2011-05 should be applied retrospectively and is effective for public companies for fiscal years, and interim periods within those years, beginning after December 15, 2011. The adoption of this ASU will only impact our presentation of comprehensive income and is not expected to have an impact on our results of operations or financial position.
Amendments to Achieve Common Fair Value Measurement and Disclosure Requirements in U.S. GAAP and IFRS
In May 2011, the FASB issued ASU No. 2011-04, which represents the convergence of the FASB’s and the IASB’s guidance on fair value measurement. ASU 2011-04 reflects the common requirements under U.S. GAAP and IFRS for measuring fair value and for disclosing information about fair value measurements, including a consistent meaning for the term “fair value.” The new guidance does not extend the use of fair value but, rather, provides guidance about how fair value should be applied where it is already required or permitted under U.S. GAAP or IFRS. For U.S. GAAP, most of the changes are clarifications of existing guidance or wording changes to align with IFRS 13 Fair Value Measurement. A public company is required to apply the ASU prospectively for interim and annual periods beginning after December 15, 2011. Early adoption is not permitted for a public company. The adoption of this ASU is not expected to have a material impact on our results of operations or financial position.
PAGE 83
Table of Contents
Reconsideration of Effective Control for Repurchase Agreements
In April 2011, the FASB issued ASU No. 2011-03, which is intended to improve financial reporting of repurchase agreements, or repos, and other agreements that both entitle and obligate a transferor to repurchase or redeem financial assets before their maturity. When an entity enters into a typical repo arrangement, it transfers financial assets to a counterparty in exchange for cash with an agreement for the counterparty to return the same or equivalent financial assets for a fixed price in the future. Current guidance prescribes when an entity may or may not recognize a sale upon the transfer of financial assets subject to a repo agreement. That determination is based, in part, on whether the entity has maintained effective control over the transferred financial assets. This ASU improves the accounting for these transactions by removing from the assessment of effective control the criterion requiring the transferor to have the ability to repurchase or redeem the financial assets and focuses the assessment on the transferor’s contractual rights. This guidance is effective for the first interim or annual period beginning on or after December 15, 2011. The guidance should be applied prospectively to transactions or modifications of existing transactions that occur on or after the effective date. Early adoption is not permitted. The adoption of this ASU is not expected to have a material impact on our results of operations or financial position.
The following table reconciles the numerators and denominators of basic earnings per share with that of diluted earnings per share:
| 2011 | 2010 | 2009 | ||||||||||
| (in thousands, except share and per share data) | ||||||||||||
|
Numerator for Earnings per Common Share—Basic: |
||||||||||||
|
Net income |
$ | 47,264 | $ | 43,480 | $ | 7,951 | ||||||
|
Less: Preferred stock dividends and discount amortization |
7,611 | 6,201 | 5,913 | |||||||||
|
Less: Income allocated to participating shares |
130 | 42 | 3 | |||||||||
|
Net Income Allocated to Common Shareholders |
$ | 39,523 | $ | 37,237 | $ | 2,035 | ||||||
|
Numerator for Earnings per Common Share—Diluted: |
||||||||||||
|
Net income |
$ | 47,264 | $ | 43,480 | $ | 7,951 | ||||||
|
Less: Preferred stock dividends and discount amortization |
7,611 | 6,201 | 5,913 | |||||||||
|
Net Income Available to Common Shareholders |
$ | 39,653 | $ | 37,279 | $ | 2,038 | ||||||
|
Denominators: |
||||||||||||
|
Weighted Average Common Shares Outstanding—Basic |
27,966,981 | 27,791,145 | 27,626,223 | |||||||||
|
Add: Potentially dilutive common shares |
23,169 | 22,261 | 32,638 | |||||||||
|
Denominator for Treasury Stock Method—Diluted |
27,990,150 | 27,813,406 | 27,658,861 | |||||||||
|
Weighted Average Common Shares Outstanding—Basic |
27,966,981 | 27,791,145 | 27,626,223 | |||||||||
|
Add: Average participating shares outstanding |
92,212 | 33,899 | 55,484 | |||||||||
|
Denominator for Two-Class Method—Diluted |
28,059,193 | 27,825,044 | 27,681,707 | |||||||||
|
Earnings per common share—basic |
$ | 1.41 | $ | 1.34 | $ | 0.07 | ||||||
|
Earnings per common share—diluted |
$ | 1.41 | $ | 1.34 | $ | 0.07 | ||||||
|
Warrants considered anti-dilutive excluded from potentially dilutive common shares |
517,012 | 517,012 | 517,012 | |||||||||
|
Stock options considered anti-dilutive excluded from potentially dilutive common shares |
757,580 | 930,969 | 1,173,660 | |||||||||
|
Restricted stock considered anti-dilutive excluded from potentially dilutive common shares |
69,043 | 11,638 | 22,246 | |||||||||
PAGE 84
Table of Contents
Refer to Note 1 Summary of Significant Accounting Policies under Fair Value Measurements for our accounting policy including details of the valuation methods used to determine the fair values of our assets and liabilities. The following tables present our assets and liabilities that are measured at fair value on a recurring basis by fair value hierarchy level at December 31, 2011 and 2010. There were no transfers between Level 1 and Level 2 for items measured at fair value on a recurring basis during the periods presented.
| December 31, 2011 | Level 1 | Level 2 | Level 3 | Total | ||||||||||||
| (in thousands) | ||||||||||||||||
|
ASSETS |
||||||||||||||||
|
Securities available-for-sale: |
||||||||||||||||
|
Obligations of U.S. government corporations and agencies |
$ | — | $ | 142,786 | $ | — | $ | 142,786 | ||||||||
|
Collateralized mortgage obligations of U.S. government corporations and agencies |
— | 65,395 | — | 65,395 | ||||||||||||
|
Mortgage-backed securities of U.S. government corporations and agencies |
— | 48,752 | — | 48,752 | ||||||||||||
|
Obligations of states and political subdivisions |
— | 88,805 | — | 88,805 | ||||||||||||
|
Marketable equity securities |
2,855 | 7,316 | 1,687 | 11,858 | ||||||||||||
|
Total securities available-for-sale |
2,855 | 353,054 | 1,687 | 357,596 | ||||||||||||
|
Trading securities held in a Rabbi Trust |
1,949 | — | — | 1,949 | ||||||||||||
|
Total securities |
4,804 | 353,054 | 1,687 | 359,545 | ||||||||||||
|
Derivative financial assets: |
||||||||||||||||
|
Interest rate swaps |
— | 23,764 | — | 23,764 | ||||||||||||
|
Interest rate lock commitments |
— | 244 | — | 244 | ||||||||||||
|
Total Assets |
$ | 4,804 | $ | 377,062 | $ | 1,687 | $ | 383,553 | ||||||||
|
LIABILITIES |
||||||||||||||||
|
Derivative financial liabilities: |
||||||||||||||||
|
Interest rate swaps |
$ | — | $ | 23,639 | $ | — | $ | 23,639 | ||||||||
|
Forward sale contracts |
— | 95 | — | 95 | ||||||||||||
|
Total Liabilities |
$ | — | $ | 23,734 | $ | — | $ | 23,734 | ||||||||
PAGE 85
Table of Contents
NOTE 3. FAIR VALUE MEASUREMENTS — continued
| December 31, 2010 | Level 1 | Level 2 | Level 3 | Total | ||||||||||||
| (in thousands) | ||||||||||||||||
|
ASSETS |
||||||||||||||||
|
Securities available-for-sale: |
||||||||||||||||
|
Obligations of U.S. government corporations and agencies |
$ | — | $ | 125,675 | $ | — | $ | 125,675 | ||||||||
|
Collateralized mortgage obligations of U.S. government corporations and agencies |
— | 41,491 | — | 41,491 | ||||||||||||
|
Mortgage-backed securities of U.S. government corporations and agencies |
— | 43,991 | — | 43,991 | ||||||||||||
|
Obligations of states and political subdivisions |
— | 65,772 | — | 65,772 | ||||||||||||
|
Marketable equity securities |
1,528 | 7,980 | 1,588 | 11,096 | ||||||||||||
|
Total securities available-for-sale |
1,528 | 284,909 | 1,588 | 288,025 | ||||||||||||
|
Trading securities held in a Rabbi Trust |
2,089 | — | — | 2,089 | ||||||||||||
|
Total securities |
3,617 | 284,909 | 1,588 | 290,114 | ||||||||||||
|
Derivative financial assets: |
||||||||||||||||
|
Interest rate swaps |
— | 17,518 | — | 17,518 | ||||||||||||
|
Interest rate lock commitments |
— | 217 | — | 217 | ||||||||||||
|
Forward sale contracts |
— | 412 | — | 412 | ||||||||||||
|
Total Assets |
$ | 3,617 | $ | 303,056 | $ | 1,588 | $ | 308,261 | ||||||||
|
LIABILITIES |
||||||||||||||||
|
Derivative financial liabilities: |
||||||||||||||||
|
Interest rate swaps |
$ | — | $ | 17,355 | $ | — | $ | 17,355 | ||||||||
|
Total Liabilities |
$ | — | $ | 17,355 | $ | — | $ | 17,355 | ||||||||
We classify financial instruments in Level 3 when valuation models are used because significant inputs are not observable in the market. The following tables present the changes in assets measured at fair value on a recurring basis for which we have utilized Level 3 inputs to determine the fair value:
|
Marketable
Equity
Securities (1) |
||||
| (in thousands) | ||||
|
Balance at beginning of year |
$ | 1,588 | ||
|
Total gains (losses) included in other comprehensive income/loss |
99 | |||
|
Ending Balance at December 31, 2011 |
$ | 1,687 | ||
| (1) |
Changes in estimated fair value of available-for-sale investments are recorded in accumulated other comprehensive income/loss, while gains and losses from sales are recorded in security gains (losses), net in the Consolidated Statements of Income. |
|
Marketable Equity
Securities (1) |
||||
| (in thousands) | ||||
|
Balance at beginning of year |
$ | 1,138 | ||
|
Total gains (losses) included in other comprehensive income/loss |
(40 | ) | ||
|
Transfers into Level 3 |
490 | |||
|
Ending Balance at December 31, 2010 |
$ | 1,588 | ||
| (1) |
Changes in estimated fair value of available-for-sale investments are recorded in accumulated other comprehensive income/loss, while gains and losses from sales are recorded in security gains (losses), net in the Consolidated Statements of Income. |
PAGE 86
Table of Contents
NOTE 3. FAIR VALUE MEASUREMENTS — continued
We may be required to measure certain assets and liabilities on a nonrecurring basis. The following tables present our assets that are measured at estimated fair value on a nonrecurring basis by the fair value hierarchy level at December 31, 2011 and 2010. There were no liabilities measured at estimated fair value on a nonrecurring basis during these periods. Loans held for sale are recorded at the lower of cost or fair value. At December 31, 2011, we had no loans held for sale that were recorded at fair value. Prior to December 31, 2011, we classified impaired loans and OREO as Level 2 assets when their fair value was based on current independent appraisal received within the past 12 months. Appraisals in excess of 12 months were classified as Level 3. Due to the subjective nature factored into the appraisal process, including various assumptions and expectations on cash flows, we no longer believe that these appraisals meet the Level 2 reporting for fair value. At December 31, 2011, we transferred our impaired loans and OREO from Level 2 of the fair value hierarchy into Level 3.
| December 31, 2011 | Level 1 | Level 2 | Level 3 | Total | ||||||||||||
| (in thousands) | ||||||||||||||||
|
ASSETS |
||||||||||||||||
|
Impaired Loans |
$ | — | $ | — | $ | 36,500 | $ | 36,500 | ||||||||
|
Other real estate owned |
— | — | 3,739 | 3,739 | ||||||||||||
|
Mortgage servicing rights |
— | — | 2,153 | 2,153 | ||||||||||||
|
Total Assets |
$ | — | $ | — | $ | 42,392 | $ | 42,392 | ||||||||
| December 31, 2010 | Level 1 | Level 2 | Level 3 | Total | ||||||||||||
| (in thousands) | ||||||||||||||||
|
ASSETS |
||||||||||||||||
|
Loans held for sale |
$ | — | $ | 3,185 | $ | — | $ | 3,185 | ||||||||
|
Impaired loans |
— | 10,968 | 1,478 | 12,446 | ||||||||||||
|
Other real estate owned |
— | 5,820 | — | 5,820 | ||||||||||||
|
Mortgage servicing rights |
— | — | 2,510 | 2,510 | ||||||||||||
|
Total Assets |
$ | — | $ | 19,973 | $ | 3,988 | $ | 23,961 | ||||||||
PAGE 87
Table of Contents
The carrying amount and fair value of our financial instruments at December 31, 2011 and 2010 are shown in the following table:
| 2011 | 2010 | |||||||||||||||
| December 31 | Fair Value |
Carrying
Value (1) |
Fair Value |
Carrying
Value (1) |
||||||||||||
| (in thousands) | ||||||||||||||||
|
ASSETS |
||||||||||||||||
|
Cash and due from banks, including interest-bearing deposits |
$ | 270,526 | $ | 270,526 | $ | 108,196 | $ | 108,196 | ||||||||
|
Securities available-for-sale |
357,596 | 357,596 | 288,025 | 288,025 | ||||||||||||
|
Loans held for sale |
2,850 | 2,850 | 8,337 | 8,337 | ||||||||||||
|
Portfolio loans |
3,120,352 | 3,129,759 | 3,328,084 | 3,355,590 | ||||||||||||
|
Bank owned life insurance |
56,755 | 56,755 | 54,924 | 54,924 | ||||||||||||
|
Federal Home Loan Bank stock, at cost |
18,216 | 18,216 | 22,365 | 22,365 | ||||||||||||
|
Trading securities held in a Rabbi Trust |
1,949 | 1,949 | 2,089 | 2,089 | ||||||||||||
|
Mortgage servicing rights |
2,153 | 2,153 | 2,510 | 2,467 | ||||||||||||
|
Interest rate swaps |
23,764 | 23,764 | 17,518 | 17,518 | ||||||||||||
|
Interest rate lock commitments |
244 | 244 | 217 | 217 | ||||||||||||
|
Forward sale contracts |
— | — | 412 | 412 | ||||||||||||
|
LIABILITIES |
||||||||||||||||
|
Deposits |
$ | 3,343,889 | $ | 3,335,859 | $ | 3,328,864 | $ | 3,317,524 | ||||||||
|
Securities sold under repurchase agreements |
30,370 | 30,370 | 40,653 | 40,653 | ||||||||||||
|
Short-term borrowings |
75,000 | 75,000 | — | — | ||||||||||||
|
Long-term borrowings |
34,171 | 31,874 | 31,345 | 29,365 | ||||||||||||
|
Junior subordinated debt securities |
90,619 | 90,619 | 91,460 | 90,619 | ||||||||||||
|
Interest rate swaps |
23,639 | 23,639 | 17,355 | 17,355 | ||||||||||||
|
Forward sale contracts |
95 | 95 | — | — | ||||||||||||
| (1) |
As reported in the Consolidated Balance Sheets |
The Board of Governors of the Federal Reserve System, or the Federal Reserve, imposes certain reserve requirements on all depository institutions. These reserves are maintained in the form of vault cash or as an interest-bearing balance with the Federal Reserve. During the years ended 2011, 2010 and 2009 the required reserves averaged $36.6 million, $32.5 million and $27.2 million, respectively.
S&T is a legal entity separate and distinct from its banking and other subsidiaries. A substantial portion of S&T’s revenues consist of dividend payments it receives from S&T Bank. S&T Bank, in turn, is subject to state laws and regulations that limit the amount of dividends it can pay to S&T. In addition, both S&T and S&T Bank are subject to various general regulatory policies relating to the payment of dividends, including requirements to maintain adequate capital above regulatory minimums. The Federal Reserve Board has indicated that banking organizations should generally pay dividends only if (i) the organization’s net income available to common shareholders over the past year has been sufficient to fully fund the dividends and (ii) the prospective rate of earnings retention appears consistent with the organization’s capital needs, asset quality and overall financial condition. Thus, under certain circumstances based upon S&T’s financial condition, our ability to declare and pay quarterly dividends may require consultation with the Federal Reserve and may be prohibited by
PAGE 88
Table of Contents
applicable Federal Reserve regulations. If we were to pay a dividend in contravention of Federal Reserve regulations, the Federal Reserve could raise supervisory concerns. We redeemed our Series A Preferred Stock on December 7, 2011, and therefore we are no longer subject to the dividend restriction imposed by participation in the Capital Purchase Program, or CPP.
Federal law prohibits S&T from borrowing from S&T Bank unless such loans are collateralized by specific obligations. Further, such loans are limited to 10 percent of S&T Bank’s capital and additional paid-in capital, as defined. S&T currently has a $5.0 million line of credit with S&T Bank secured by investments of another subsidiary of S&T.
The following tables indicate the composition of the securities portfolio at December 31:
| Available-for-Sale | ||||||||||||||||
| 2011 |
Amortized
Cost |
Gross
Unrealized Gains |
Gross
Unrealized Losses |
Fair Value | ||||||||||||
| (in thousands) | ||||||||||||||||
|
Obligations of U.S. government corporations and agencies |
$ | 138,386 | $ | 4,400 | $ | — | $ | 142,786 | ||||||||
|
Collateralized mortgage obligations of U.S. government corporations and agencies |
63,202 | 2,193 | — | 65,395 | ||||||||||||
|
Mortgage-backed securities of U.S. government corporations and agencies |
45,289 | 3,463 | — | 48,752 | ||||||||||||
|
Obligations of states and political subdivisions |
85,689 | 3,128 | (12 | ) | 88,805 | |||||||||||
|
Debt Securities |
332,566 | 13,184 | (12 | ) | 345,738 | |||||||||||
|
Marketable equity securities |
10,152 | 2,179 | (473 | ) | 11,858 | |||||||||||
|
Total |
$ | 342,718 | $ | 15,363 | $ | (485 | ) | $ | 357,596 | |||||||
| Available-for-Sale | ||||||||||||||||
| 2010 |
Amortized
Cost |
Gross
Unrealized Gains |
Gross
Unrealized Losses |
Fair Value | ||||||||||||
| (in thousands) | ||||||||||||||||
|
Obligations of U.S. government corporations and agencies |
$ | 123,812 | $ | 2,078 | $ | (215 | ) | $ | 125,675 | |||||||
|
Collateralized mortgage obligations of U.S. government corporations and agencies |
39,790 | 1,701 | — | 41,491 | ||||||||||||
|
Mortgage-backed securities of U.S. government corporations and agencies |
41,373 | 2,618 | — | 43,991 | ||||||||||||
|
Obligations of states and political subdivisions |
64,651 | 1,357 | (236 | ) | 65,772 | |||||||||||
|
Debt Securities |
269,626 | 7,754 | (451 | ) | 276,929 | |||||||||||
|
Marketable equity securities |
10,347 | 1,010 | (261 | ) | 11,096 | |||||||||||
|
Total |
$ | 279,973 | $ | 8,764 | $ | (712 | ) | $ | 288,025 | |||||||
PAGE 89
Table of Contents
NOTE 6. SECURITIES AVAILABLE-FOR-SALE — continued
During 2011, there were minimal gross realized gains. During 2010 and 2009, there were $0.4 million and $0.2 million in gross realized gains, respectively. There were $0.1 million in gross realized losses in 2011 and 2010 and $5.3 million in 2009, relating to securities available-for-sale.
The following tables present the fair value and the age of gross unrealized losses by investment category:
| Less Than 12 Months | 12 Months or More | Total | ||||||||||||||||||||||
| 2011 | Fair Value |
Unrealized
Losses |
Fair Value |
Unrealized
Losses |
Fair Value |
Unrealized
Losses |
||||||||||||||||||
| (in thousands) | ||||||||||||||||||||||||
|
Obligations of U.S. government corporations and agencies |
$ | — | $ | — | $ | — | $ | — | $ | — | $ | — | ||||||||||||
|
Collateralized mortgage obligations of U.S. government corporations and agencies |
— | — | — | — | — | — | ||||||||||||||||||
|
Mortgage-backed securities of U.S. government corporations and agencies |
— | — | — | — | — | — | ||||||||||||||||||
|
Obligations of states and political subdivisions |
502 | (8 | ) | 414 | (4 | ) | 916 | (12 | ) | |||||||||||||||
|
Debt Securities |
502 | (8 | ) | 414 | (4 | ) | 916 | (12 | ) | |||||||||||||||
|
Marketable equity securities |
5,143 | (473 | ) | — | — | 5,143 | (473 | ) | ||||||||||||||||
|
Total Temporarily Impaired Securities |
$ | 5,645 | $ | (481 | ) | $ | 414 | $ | (4 | ) | $ | 6,059 | $ | (485 | ) | |||||||||
| Less Than 12 Months | 12 Months or More | Total | ||||||||||||||||||||||
| 2010 | Fair Value |
Unrealized
Losses |
Fair Value |
Unrealized
Losses |
Fair Value |
Unrealized
Losses |
||||||||||||||||||
| (in thousands) | ||||||||||||||||||||||||
|
Obligations of U.S. government corporations and agencies |
$ | 20,558 | $ | (215 | ) | $ | — | $ | — | $ | 20,558 | $ | (215 | ) | ||||||||||
|
Collateralized mortgage obligations of U.S. government corporations and agencies |
— | — | — | — | — | — | ||||||||||||||||||
|
Mortgage-backed securities of U.S. government corporations and agencies |
— | — | — | — | — | — | ||||||||||||||||||
|
Obligations of states and political subdivisions |
13,167 | (194 | ) | 917 | (42 | ) | 14,084 | (236 | ) | |||||||||||||||
|
Debt Securities |
33,725 | (409 | ) | 917 | (42 | ) | 34,642 | (451 | ) | |||||||||||||||
|
Marketable equity securities |
2,068 | (261 | ) | — | — | 2,068 | (261 | ) | ||||||||||||||||
|
Total Temporarily Impaired Securities |
$ | 35,793 | $ | (670 | ) | $ | 917 | $ | (42 | ) | $ | 36,710 | $ | (712 | ) | |||||||||
PAGE 90
Table of Contents
We do not believe any individual unrealized loss as of December 31, 2011 represents an OTTI. Refer to Note 1 Summary of Significant Accounting Policies for our accounting policy surrounding securities and OTTI.
As of December 31, 2011, the unrealized losses on two debt securities were primarily attributable to changes in interest rates. The unrealized losses on four marketable equity securities as of December 31, 2011 were attributable to temporary declines in the market value of these stocks. We do not intend to sell and it is not likely that we will be required to sell any of the securities, referenced in the table above, in an unrealized loss position before recovery of their amortized cost.
Net unrealized gains of $9.7 million and $5.2 million were included in accumulated other comprehensive loss, net of tax, at December 31, 2011 and 2010, respectively. Gross unrealized gains of $10.0 million and $5.7 million were netted against gross unrealized losses of $0.3 million and $0.5 million, respectively, for these same periods. During 2011 unrealized gains reclassified out of accumulated other comprehensive loss into earnings were minimal, while $0.1 million of unrealized losses were reclassified into earnings to record OTTI. During 2010, approximately $0.4 million of unrealized gains were reclassified out of accumulated other comprehensive loss into earnings, while $0.1 million of unrealized losses were reclassified into earnings to record OTTI.
The amortized cost and fair value of securities available-for-sale at December 31, 2011, by contractual maturity, are included in the table below. Actual maturities may differ from contractual maturities because borrowers may have the right to call or prepay obligations with or without call or prepayment penalties.
| Available-for-Sale |
Amortized
Cost |
Fair Value | ||||||
| (in thousands) | ||||||||
|
Due in one year or less |
$ | 8,616 | $ | 8,722 | ||||
|
Due after one year through five years |
143,558 | 147,565 | ||||||
|
Due after five years through ten years |
18,051 | 19,481 | ||||||
|
Due after ten years |
53,850 | 55,823 | ||||||
| 224,075 | 231,591 | |||||||
|
Collateralized mortgage obligations of U.S. government corporations and agencies |
63,202 | 65,395 | ||||||
|
Mortgage-backed securities of U.S. government corporations and agencies |
45,289 | 48,752 | ||||||
|
Debt Securities |
332,566 | 345,738 | ||||||
|
Marketable equity securities |
10,152 | 11,858 | ||||||
|
Total |
$ | 342,718 | $ | 357,596 | ||||
At December 31, 2011 and 2010, securities with carrying values of $233.9 million and $209.3 million, respectively, were pledged to secure repurchase agreements, public funds, trust fund deposits and as collateral for our interest rate swaps.
PAGE 91
Table of Contents
The following table presents the composition of the loans at December 31:
| 2011 | 2010 | |||||||
| (in thousands) | ||||||||
|
Consumer |
||||||||
|
Home equity |
$ | 411,404 | $ | 441,096 | ||||
|
Residential mortgage |
358,846 | 359,536 | ||||||
|
Installment and other consumer |
67,131 | 74,780 | ||||||
|
Consumer construction |
2,440 | 4,019 | ||||||
|
Total Consumer Loans |
839,821 | 879,431 | ||||||
|
Commercial |
||||||||
|
Commercial real estate |
1,415,333 | 1,494,202 | ||||||
|
Commercial and industrial |
685,753 | 722,359 | ||||||
|
Commercial construction |
188,852 | 259,598 | ||||||
|
Total Commercial Loans |
2,289,938 | 2,476,159 | ||||||
|
Total Portfolio Loans |
3,129,759 | 3,355,590 | ||||||
|
Allowance for loan losses |
(48,841 | ) | (51,387 | ) | ||||
|
Total Portfolio Loans, net |
3,080,918 | 3,304,203 | ||||||
|
Loans held for sale |
2,850 | 8,337 | ||||||
|
Total Loans, Net |
$ | 3,083,768 | $ | 3,312,540 | ||||
We attempt to limit our exposure to credit risk by diversifying our loan portfolio and actively managing concentrations. When concentrations exist in certain segments, we mitigate this risk by monitoring the relevant economic indicators and internal risk rating trends and through stress testing of the loans in these classes. Commercial loans represent 73 percent and 74 percent of total portfolio loans at December 31, 2011 and 2010, respectively. Within the commercial portfolio, the CRE and commercial construction portfolios combined comprise 70 percent of commercial loans and 51 percent of total loans at December 31, 2011 and 71 percent of commercial loans and 52 percent of total loans at December 31, 2010. Further segmentation of the CRE and commercial construction portfolios by industry and collateral type reveal no concentration in excess of nine percent of total loans.
The vast majority of both commercial and consumer loans are made to businesses and individuals in our western Pennsylvania market, resulting in a geographic concentration. The conditions of the local and regional economies are monitored closely through publicly available data as well as information supplied by our customers. Only the CRE and commercial construction portfolios combined have any significant out-of-state exposure, with 19 percent of the combined portfolio and 10 percent of total loans being out-of-state loans at December 31, 2011 and 21 percent of the combined portfolio and 11 percent of total loans being out-of-state loans at December 31, 2010. Management believes underwriting guidelines and ongoing review by credit administration mitigates the concentration risk present in the loan portfolio.
PAGE 92
Table of Contents
NOTE 7. LOANS AND LOANS HELD FOR SALE — continued
The following table presents a summary of nonperforming assets for the periods stated:
| 2011 | 2010 | |||||||
| (in thousands) | ||||||||
|
Nonperforming Assets |
||||||||
|
Nonaccrual loans |
$ | 37,931 | $ | 31,104 | ||||
|
Nonaccrual TDRs |
18,184 | 32,779 | ||||||
|
Total nonperforming loans |
$ | 56,115 | $ | 63,883 | ||||
|
OREO |
3,967 | 5,820 | ||||||
|
Total Nonperforming Assets |
$ | 60,082 | $ | 69,703 | ||||
OREO which is included in other assets in the Consolidated Balance Sheets consists of 18 properties with one property comprising $1.5 million or 37 percent of the balance. It is our policy to obtain OREO appraisals on an annual basis. All OREO properties at December 31, 2011 had current appraisals.
In situations where, for economic or legal reasons related to a borrower’s financial difficulties, we may grant a concession for other than an insignificant period of time to the borrower that would not otherwise be considered, the related loan is classified as a TDR. We strive to identify borrowers in financial difficulty early and work with them to modify to more affordable terms before their loan reaches nonaccrual status. These modified terms generally include reductions in contractual interest rates, principal deferment and extensions of maturity dates at a stated interest rate lower than the current market rate for a new loan with similar risk characteristics. These modifications are generally for longer term periods that would not be considered insignificant. While unusual, there may be instances of loan principal forgiveness. We individually evaluate all substandard commercial loans that experienced a forbearance or change in terms, as well as all substandard consumer and residential mortgage loans that entered into an agreement to modify their existing loan.
All TDRs are considered to be impaired loans and will be reported as impaired loans for the remaining life of the loan, unless the restructuring agreement specifies an interest rate equal to or greater than the rate that would be accepted at the time of the restructuring for a new loan with comparable risk and it is fully expected that the remaining principal and interest will be collected according to the restructured agreement. Further, all impaired loans are reported as nonaccrual loans unless the loan is a TDR that has met the requirements to be returned to accruing status. TDRs can be returned to accruing status, if the ultimate collectability of all contractual amounts due, according to the restructured agreement, is not in doubt and there is a period of a minimum of six months of satisfactory payment performance by the borrower either immediately before or after the restructuring. During 2011, we returned $17.1 million of TDRs to accruing status.
Defaulted TDRs are defined as loans having a payment default of 90 days or more after the restructuring takes place. During 2011, we had two commercial real estate loans totaling $0.9 million default. No other TDRs that existed at December 31, 2011 have defaulted.
During the year ended December 31, 2011, we modified $6.9 million of commercial and industrial loans, $6.6 million of commercial real estate loans, $4.5 million of commercial construction loans and $2.1 million of residential real estate for financially troubled borrowers that were not considered to be TDRs. These borrowers received modifications that represented insignificant delays in the timing of payments that were not considered to be concessions. TDRs increased significantly during 2011 as we are working closely with our customers during these challenging economic times.
PAGE 93
Table of Contents
The following table presents the restructured loans for the periods stated:
| 2011 | 2010 | |||||||||||||||||||||||
|
Performing
TDRs |
Nonperforming
TDRs |
Total
TDRs |
Performing
TDRs |
Nonperforming
TDRs |
Total
TDRs |
|||||||||||||||||||
| (in thousands) | ||||||||||||||||||||||||
|
Commercial real estate |
$ | 22,284 | $ | 10,871 | $ | 33,155 | $ | 1,194 | $ | 29,636 | $ | 30,830 | ||||||||||||
|
Commercial and industrial |
6,180 | — | 6,180 | 37 | 1,000 | 1,037 | ||||||||||||||||||
|
Commercial construction |
19,682 | 2,943 | 22,625 | — | 2,143 | 2,143 | ||||||||||||||||||
|
Residential mortgage |
1,570 | 4,370 | 5,940 | 908 | — | 908 | ||||||||||||||||||
|
Total |
$ | 49,716 | $ | 18,184 | $ | 67,900 | $ | 2,139 | $ | 32,779 | $ | 34,918 | ||||||||||||
The following table include the number of TDRs, as well as both the pre-modification and post-modification recorded investments, by loan class, of those loans restructured identified during the year ended December 31:
| 2011 | ||||||||||||||||
|
Number of
Loans |
Pre-Modification
Outstanding Recorded Investment (1) |
Post-Modification
Outstanding Recorded Investment (1) |
Total Difference
in Recorded Investment |
|||||||||||||
| (in thousands) | ||||||||||||||||
|
Commercial real estate |
8 | $ | 6,077 | $ | 5,329 | $ | (748 | ) | ||||||||
|
Commercial and industrial |
6 | 6,364 | 6,180 | (184 | ) | |||||||||||
|
Commercial construction |
12 | 21,029 | 20,979 | (50 | ) | |||||||||||
|
Residential mortgage |
9 | 5,612 | 5,173 | (439 | ) | |||||||||||
|
Total |
35 | $ | 39,082 | $ | 37,661 | $ | (1,421 | ) | ||||||||
| (1) |
Excludes loans that were paid off or charged-off by period end. The pre-modification balance represents the balance outstanding prior to modification. The post-modification balance represents the outstanding balance at period end. |
We have granted loans to certain officers and directors of S&T as well as to certain affiliates of the officers and directors in the ordinary course of business. These loans were made on substantially the same terms, including interest rates and collateral, as those prevailing at the time for comparable transactions with unrelated persons and did not involve more than normal risk of collectability.
The following table presents a summary of the aggregate amount of loans to any such persons as of December 31:
| 2011 | 2010 | |||||||
| (in thousands) | ||||||||
|
Balance at beginning of year |
$ | 34,373 | $ | 34,136 | ||||
|
New loans |
23,751 | 20,594 | ||||||
|
Repayments |
(26,303 | ) | (20,357 | ) | ||||
|
Balance at End of Year |
$ | 31,821 | $ | 34,373 | ||||
We maintain an ALL at a level determined to be adequate to absorb estimated probable credit losses inherent in the loan portfolio as of the balance sheet date. Refer to Note 1 Summary of Significant Accounting Policies for details of our ALL policy. During the fourth quarter of 2010, we implemented various enhancements to the ALL methodology to better align the calculation with the inherent risk
PAGE 94
Table of Contents
NOTE 8. ALLOWANCE FOR LOAN LOSSES — continued
identified within the loan portfolio and align it with the regulatory guidance. Changes included consideration of additional loan risk characteristics such as internal risk rating, collateral, and loan-to-value, enhancing the base loss calculation to consider the estimated loss emergence period of each loan segment and expanding the qualitative adjustments to consider additional factors. The enhancements made to the ALL methodology did not materially change the ALL at December 31, 2010.
We develop and document a systematic ALL methodology based the following portfolio segments: 1) CRE, 2) C&I, 3) Commercial Construction, 4) Consumer Real Estate and 5) Other Consumer. The following are key risks within each portfolio segment:
CRE —Loans secured by commercial purpose real estate, including both owner occupied properties and investment properties for various purposes such as hotels, strip malls and apartments. Operation of the individual projects as well as global cash flows of the debtors are the primary sources of repayment for these loans. The condition of the local economy is an important indicator of risk, but there are also more specific risks depending on the collateral type as well as the business prospects of the lessee, if the project is not owner occupied.
C&I —Loans made to operating companies or manufacturers for the purpose of production, operating capacity, accounts receivable, inventory or equipment financing. Cash flow from the operations of the company is the primary source of repayment for these loans. The condition of the local economy is an important indicator of risk, but there are also more specific risks depending on the industry of the company. Collateral for these types of loans often do not have sufficient value in a distressed or liquidation scenario to satisfy the outstanding debt.
Commercial Construction —Loans made to finance construction of buildings or other structures, as well as to finance the acquisition and development of raw land for various purposes. While the risk of these loans is generally confined to the construction period, if there are problems, the project may not be complete, and as such, may not provide sufficient cash flow on its own to service the debt or have sufficient value in a liquidation to cover the outstanding principal. The condition of the local economy is an important indicator of risk, but there are also more specific risks depending on the type of project and the experience and resources of the developer.
Consumer Real Estate —Loans secured by first and second liens such as home equity loans, home equity lines of credit and 1-4 family residences, including purchase money mortgages. The primary source of repayment for these loans is the income and assets of the borrower. The condition of the local economy, in particular the unemployment rate, is an important indicator of risk for this segment. The state of the local housing market can also have a significant impact on this portfolio because low demand and/or declining home values can limit the ability of borrowers to sell a property and satisfy the debt.
Other Consumer —Loans made to individuals that may be secured by assets other than 1-4 family residences, as well as unsecured loans. This segment includes auto loans, unsecured lines and credit cards. The primary source of repayment for these loans is the income and assets of the borrower. The condition of the local economy, in particular the unemployment rate, is an important indicator of risk for this segment. The value of the collateral, if there is any, is less likely to be a source of repayment due to less certain collateral values.
We further assess risk within each portfolio segment by pooling loans with similar risk characteristics. For the commercial loan classes, the most important indicator of risk is the internally assigned risk rating, including pass, special mention and substandard. Consumer loans are pooled by type of collateral and first or second lien positions for consumer real estate loans. Historical loss rates are applied to these loan pools to determine the general reserve component of the ALL. Management monitors various credit quality indicators for both the commercial and consumer loan portfolios,
PAGE 95
Table of Contents
NOTE 8. ALLOWANCE FOR LOAN LOSSES — continued
including delinquency, nonperforming status and changes in risk ratings on a monthly basis. Refer to Note 1 Summary of Significant Accounting Policies for our policy for determining past due status of loans.
The following tables present the age analysis of past due loans segregated by class of loans at December 31:
| 2011 | Current |
30-59 Days
Past Due |
60-89 Days
Past Due |
Non- performing |
Total
Past Due Loans |
Total Loans | ||||||||||||||||||
| (in thousands) | ||||||||||||||||||||||||
|
Commercial real estate |
$ | 1,374,580 | $ | 7,657 | $ | 1,448 | $ | 31,648 | $ | 40,753 | $ | 1,415,333 | ||||||||||||
|
Commercial and industrial |
672,899 | 3,583 | 1,701 | 7,570 | 12,854 | 685,753 | ||||||||||||||||||
|
Commercial construction |
182,305 | — | — | 6,547 | 6,547 | 188,852 | ||||||||||||||||||
|
Home equity |
405,578 | 2,199 | 691 | 2,936 | 5,826 | 411,404 | ||||||||||||||||||
|
Residential mortgage |
349,214 | 1,240 | 1,163 | 7,229 | 9,632 | 358,846 | ||||||||||||||||||
|
Installment and other consumer |
66,675 | 382 | 70 | 4 | 456 | 67,131 | ||||||||||||||||||
|
Consumer construction |
2,259 | — | — | 181 | 181 | 2,440 | ||||||||||||||||||
|
Total |
$ | 3,053,510 | $ | 15,061 | $ | 5,073 | $ | 56,115 | $ | 76,249 | $ | 3,129,759 | ||||||||||||
| 2010 | Current |
30-59 Days
Past Due |
60-89 Days
Past Due |
Non- performing |
Total
Past Due Loans |
Total Loans | ||||||||||||||||||
| (in thousands) | ||||||||||||||||||||||||
|
Commercial real estate |
$ | 1,445,521 | $ | 3,135 | $ | 1,236 | $ | 44,310 | $ | 48,681 | $ | 1,494,202 | ||||||||||||
|
Commercial and industrial |
717,078 | 975 | 739 | 3,567 | 5,281 | 722,359 | ||||||||||||||||||
|
Commercial construction |
250,776 | 99 | 736 | 7,987 | 8,822 | 259,598 | ||||||||||||||||||
|
Home equity |
437,212 | 1,744 | 707 | 1,433 | 3,884 | 441,096 | ||||||||||||||||||
|
Residential mortgage |
352,194 | 930 | 416 | 5,996 | 7,342 | 359,536 | ||||||||||||||||||
|
Installment and other consumer |
74,373 | 275 | 67 | 65 | 407 | 74,780 | ||||||||||||||||||
|
Consumer construction |
3,494 | — | — | 525 | 525 | 4,019 | ||||||||||||||||||
|
Total |
$ | 3,280,648 | $ | 7,158 | $ | 3,901 | $ | 63,883 | $ | 74,942 | $ | 3,355,590 | ||||||||||||
We continually monitor the commercial loan portfolio through an internal risk rating system. Loan risk ratings are assigned based upon the creditworthiness of the borrower and are reviewed on an ongoing basis according to our internal policies. Loans within the pass rating generally have a lower risk of loss than loans risk rated as special mention and substandard, which generally have an increasing risk of loss.
Our risk ratings are consistent with regulatory guidance and are as follows:
Pass —The loan is currently performing and is of high quality.
Special Mention —A special mention loan has potential weaknesses that warrant management’s close attention. If left uncorrected, these potential weaknesses may result in deterioration of the repayment prospects or in the strength of our credit position at some future date. Economic and market conditions, beyond the borrower’s control, may in the future necessitate this classification.
PAGE 96
Table of Contents
NOTE 8. ALLOWANCE FOR LOAN LOSSES — continued
Substandard —A substandard loan is not adequately protected by the net worth and/or paying capacity of the borrower or by the collateral pledged, if any. Substandard loans have a well-defined weakness, or weaknesses that jeopardize the liquidation of the debt. These loans are characterized by the distinct possibility that we will sustain some loss if the deficiencies are not corrected.
The following tables present the recorded investment in commercial loan classes by internally assigned risk ratings at December 31:
| 2011 |
Commercial
Real Estate |
Commercial
and Industrial |
Commercial
Construction |
Total | ||||||||||||
| (in thousands) | ||||||||||||||||
|
Pass |
$ | 1,229,005 | $ | 600,895 | $ | 136,270 | $ | 1,966,170 | ||||||||
|
Special mention |
84,400 | 33,135 | 17,106 | 134,641 | ||||||||||||
|
Substandard |
101,928 | 51,723 | 35,476 | 189,127 | ||||||||||||
|
Total |
$ | 1,415,333 | $ | 685,753 | $ | 188,852 | $ | 2,289,938 | ||||||||
| 2010 |
Commercial
Real Estate |
Commercial
and Industrial |
Commercial
Construction |
Total | ||||||||||||
| (in thousands) | ||||||||||||||||
|
Pass |
$ | 1,297,242 | $ | 619,011 | $ | 221,492 | $ | 2,137,745 | ||||||||
|
Special mention |
86,653 | 76,158 | 16,308 | 179,119 | ||||||||||||
|
Substandard |
110,307 | 27,190 | 21,798 | 159,295 | ||||||||||||
|
Total |
$ | 1,494,202 | $ | 722,359 | $ | 259,598 | $ | 2,476,159 | ||||||||
We monitor the delinquent status of the consumer portfolio on a monthly basis. The risk of loss is generally highest for nonperforming loans.
The following tables present the recorded investment in consumer loan classes by performing and nonperforming status at December 31:
| 2011 |
Home
Equity |
Residential
Mortgage |
Installment
and other consumer |
Consumer
Construction |
Total | |||||||||||||||
| (in thousands) | ||||||||||||||||||||
|
Performing |
$ | 408,468 | $ | 351,617 | $ | 67,127 | $ | 2,259 | $ | 829,471 | ||||||||||
|
Nonperforming |
2,936 | 7,229 | 4 | 181 | 10,350 | |||||||||||||||
|
Total |
$ | 411,404 | $ | 358,846 | $ | 67,131 | $ | 2,440 | $ | 839,821 | ||||||||||
| 2010 |
Home
Equity |
Residential
Mortgage |
Installment
and other consumer |
Consumer
Construction |
Total | |||||||||||||||
| (in thousands) | ||||||||||||||||||||
|
Performing |
$ | 439,663 | $ | 353,540 | $ | 74,715 | $ | 3,494 | $ | 871,412 | ||||||||||
|
Nonperforming |
1,433 | 5,996 | 65 | 525 | 8,019 | |||||||||||||||
|
Total |
$ | 441,096 | $ | 359,536 | $ | 74,780 | $ | 4,019 | $ | 879,431 | ||||||||||
PAGE 97
Table of Contents
NOTE 8. ALLOWANCE FOR LOAN LOSSES — continued
We individually evaluate all substandard and nonaccrual commercial loans greater than $0.5 million for impairment. Loans are considered to be impaired when based upon current information and events it is probable that we will be unable to collect all principal and interest payments due according to the original contractual terms of the loan agreement. All TDRs are considered to be impaired loans and will be reported as an impaired loan for the remaining life of the loan, unless the restructuring agreement specifies an interest rate equal to or greater than the rate that would be accepted at the time of the restructuring for a new loan with comparable risk and it is fully expected that the remaining principal and interest will be collected according to the restructured agreement. For all TDRs, regardless of size, as well as all other impaired loans, we conduct further analysis to determine the probable loss and assign a specific reserve to the loan if deemed appropriate.
The following tables present investments in loans considered to be impaired and related information on those impaired loans for the years ended December 31:
| December 31, 2011 | Year Ended December 31, 2011 | |||||||||||||||||||
|
Recorded
Investment |
Unpaid
Principal Balance |
Related
Allowance |
Average
Recorded Investment |
Interest
Income Recognized |
||||||||||||||||
| (in thousands) | ||||||||||||||||||||
|
With a related allowance recorded: |
||||||||||||||||||||
|
Commercial real estate |
$ | 9,049 | $ | 9,276 | $ | 3,487 | $ | 12,045 | $ | 320 | ||||||||||
|
Commercial and industrial |
4,207 | 4,207 | 1,116 | 3,497 | 77 | |||||||||||||||
|
Commercial construction |
1,975 | 1,975 | 942 | 3,326 | 4 | |||||||||||||||
|
Consumer real estate |
— | — | — | 173 | — | |||||||||||||||
|
Total with a Related Allowance Recorded |
15,231 | 15,458 | 5,545 | 19,041 | 401 | |||||||||||||||
|
Without a related allowance recorded: |
||||||||||||||||||||
|
Commercial real estate |
41,058 | 47,874 | — | 34,965 | 1,415 | |||||||||||||||
|
Commercial and industrial |
7,784 | 7,784 | — | 4,128 | 132 | |||||||||||||||
|
Commercial construction |
24,024 | 24,375 | — | 8,856 | 496 | |||||||||||||||
|
Consumer real estate |
5,939 | 6,545 | — | 2,617 | 195 | |||||||||||||||
|
Total without a Related Allowance Recorded |
78,805 | 86,578 | — | 50,566 | 2,238 | |||||||||||||||
|
Total: |
||||||||||||||||||||
|
Commercial real estate |
50,107 | 57,150 | 3,487 | 47,010 | 1,735 | |||||||||||||||
|
Commercial and industrial |
11,991 | 11,991 | 1,116 | 7,625 | 209 | |||||||||||||||
|
Commercial construction |
25,999 | 26,350 | 942 | 12,182 | 500 | |||||||||||||||
|
Consumer real estate |
5,939 | 6,545 | — | 2,790 | 195 | |||||||||||||||
|
Total |
$ | 94,036 | $ | 102,036 | $ | 5,545 | $ | 69,607 | $ | 2,639 | ||||||||||
PAGE 98
Table of Contents
NOTE 8. ALLOWANCE FOR LOAN LOSSES — continued
As of December 31, 2011, commercial real estate loans of $50.1 million comprised 53 percent of the total impaired loans of $94.0 million. These impaired loans are collateralized primarily by commercial real estate properties such as retail or strip malls, office buildings, hotels and various other types of commercial purpose properties. These loans are generally considered collateral dependent and charge-offs are recorded when a confirmed loss exists. Approximately $11.2 million of charge-offs have been recorded relating to these commercial real estate loans over the life of these loans. It is our policy to order appraisals on an annual basis on impaired loans or sooner if facts and circumstances warrant otherwise. As of December 31, 2011, updated appraisals completed within the last 12 months exist for these loans and aggregate an estimated fair value less cost to sell of approximately $61.3 million.
| December 31, 2010 | Year Ended December 31, 2010 | |||||||||||||||||||
|
Recorded
Investment |
Unpaid
Principal Balance |
Related
Allowance |
Average
Recorded Investment |
Interest
Income Recognized |
||||||||||||||||
| (in thousands) | ||||||||||||||||||||
|
With a related allowance recorded: |
||||||||||||||||||||
|
Commercial real estate |
$ | 10,152 | $ | 11,466 | $ | 1,992 | $ | 21,023 | $ | 489 | ||||||||||
|
Commercial and industrial |
1,263 | 1,263 | 337 | 1,623 | 22 | |||||||||||||||
|
Commercial construction |
4,662 | 4,662 | 1,302 | 7,165 | — | |||||||||||||||
|
Total with a Related Allowance
|
16,077 | 17,391 | 3,631 | 29,811 | 511 | |||||||||||||||
|
Without a related allowance recorded: |
||||||||||||||||||||
|
Commercial real estate |
29,788 | 37,567 | — | 28,074 | 442 | |||||||||||||||
|
Commercial and industrial |
1,491 | 3,280 | — | 1,370 | — | |||||||||||||||
|
Commercial construction |
3,325 | 4,853 | — | 7,202 | 20 | |||||||||||||||
|
Total without a Related Allowance Recorded |
34,604 | 45,700 | — | 36,646 | 462 | |||||||||||||||
|
Total: |
||||||||||||||||||||
|
Commercial real estate |
39,940 | 49,033 | 1,992 | 49,097 | 931 | |||||||||||||||
|
Commercial and industrial |
2,754 | 4,543 | 337 | 2,993 | 22 | |||||||||||||||
|
Commercial construction |
7,987 | 9,515 | 1,302 | 14,367 | 20 | |||||||||||||||
|
Total |
$ | 50,681 | $ | 63,091 | $ | 3,631 | $ | 66,457 | $ | 973 | ||||||||||
The following tables detail activity in the ALL for the years ended December 31:
| 2011 | ||||||||||||||||||||||||
|
Commercial
Real Estate |
Commercial and
Industrial |
Commercial
Construction |
Consumer
Real Estate |
Other
Consumer |
Total Loans | |||||||||||||||||||
| (in thousands) | ||||||||||||||||||||||||
|
Balance at beginning of year |
$ | 30,425 | $ | 9,777 | $ | 5,904 | $ | 3,962 | $ | 1,319 | $ | 51,387 | ||||||||||||
|
Charge-offs |
(8,824 | ) | (8,971 | ) | (1,720 | ) | (2,617 | ) | (1,013 | ) | (23,145 | ) | ||||||||||||
|
Recoveries |
780 | 357 | 2,463 | 1,030 | 360 | 4,990 | ||||||||||||||||||
|
Net (Charge-offs)/ Recoveries |
(8,044 | ) | (8,614 | ) | 743 | (1,587 | ) | (653 | ) | (18,155 | ) | |||||||||||||
|
Provision for loan losses |
7,423 | 10,111 | (2,944 | ) | 791 | 228 | 15,609 | |||||||||||||||||
|
Balance at End of Year |
$ | 29,804 | $ | 11,274 | $ | 3,703 | $ | 3,166 | $ | 894 | $ | 48,841 | ||||||||||||
PAGE 99
Table of Contents
| 2010 | 2009 | |||||||||||||||||||||||||||||
|
Commercial
Real Estate |
Commercial and
Industrial |
Commercial
Construction |
Consumer
Real Estate |
Other
Consumer |
Total Loans | Total Loans | ||||||||||||||||||||||||
| (in thousands) | ||||||||||||||||||||||||||||||
|
Balance at beginning of year |
$ | 27,322 | $ | 21,393 | $ | 8,008 | $ | 501 | $ | 2,356 | $ | 59,580 | $ | 42,689 | ||||||||||||||||
|
Charge-offs |
(23,925 | ) | (7,277 | ) | (6,354 | ) | (2,210 | ) | (1,261 | ) | (41,027 | ) | (56,862 | ) | ||||||||||||||||
|
Recoveries |
575 | 329 | 1,749 | 201 | 469 | 3,323 | 1,399 | |||||||||||||||||||||||
|
Net (Charge-offs)/ Recoveries |
(23,350 | ) | (6,948 | ) | (4,605 | ) | (2,009 | ) | (792 | ) | (37,704 | ) | (55,463 | ) | ||||||||||||||||
|
Provision for loan losses |
26,453 | (4,668 | ) | 2,501 | 5,470 | (245 | ) | 29,511 | 72,354 | |||||||||||||||||||||
|
Balance at End of Year |
$ | 30,425 | $ | 9,777 | $ | 5,904 | $ | 3,962 | $ | 1,319 | $ | 51,387 | $ | 59,580 | ||||||||||||||||
The following tables present the ALL and recorded investments in loans by category as of December 31:
| Allowance for Loan Losses | Portfolio Loans | |||||||||||||||||||||||
| 2011 |
Individually
Evaluated for Impairment |
Collectively
Evaluated for Impairment |
Total |
Individually
Evaluated for Impairment |
Collectively
Evaluated for Impairment |
Total | ||||||||||||||||||
| (in thousands) | ||||||||||||||||||||||||
|
Commercial real estate |
$ | 3,487 | $ | 26,317 | $ | 29,804 | $ | 50,107 | $ | 1,365,226 | $ | 1,415,333 | ||||||||||||
|
Commercial and industrial |
1,116 | 10,158 | 11,274 | 11,991 | 673,762 | 685,753 | ||||||||||||||||||
|
Commercial construction |
942 | 2,761 | 3,703 | 25,999 | 162,853 | 188,852 | ||||||||||||||||||
|
Consumer real estate |
— | 3,166 | 3,166 | 5,939 | 766,751 | 772,690 | ||||||||||||||||||
|
Other consumer |
— | 894 | 894 | — | 67,131 | 67,131 | ||||||||||||||||||
|
Total |
$ | 5,545 | $ | 43,296 | $ | 48,841 | $ | 94,036 | $ | 3,035,723 | $ | 3,129,759 | ||||||||||||
| Allowance for Loan Losses | Portfolio Loans | |||||||||||||||||||||||
| 2010 |
Individually
Evaluated for Impairment |
Collectively
Evaluated for Impairment |
Total |
Individually
Evaluated for Impairment |
Collectively
Evaluated for Impairment |
Total | ||||||||||||||||||
| (in thousands) | ||||||||||||||||||||||||
|
Commercial real estate |
$ | 1,992 | $ | 28,432 | $ | 30,424 | $ | 39,940 | $ | 1,454,262 | $ | 1,494,202 | ||||||||||||
|
Commercial and industrial |
337 | 9,440 | 9,777 | 2,754 | 719,605 | 722,359 | ||||||||||||||||||
|
Commercial construction |
1,302 | 4,603 | 5,905 | 7,987 | 251,611 | 259,598 | ||||||||||||||||||
|
Consumer real estate |
— | 3,962 | 3,962 | — | 804,651 | 804,651 | ||||||||||||||||||
|
Other consumer |
— | 1,319 | 1,319 | — | 74,780 | 74,780 | ||||||||||||||||||
|
Total |
$ | 3,631 | $ | 47,756 | $ | 51,387 | $ | 50,681 | $ | 3,304,909 | $ | 3,355,590 | ||||||||||||
PAGE 100
Table of Contents
The following table is a summary of premises and equipment at December 31:
| 2011 | 2010 | |||||||
| (in thousands) | ||||||||
|
Land |
$ | 6,316 | $ | 6,384 | ||||
|
Premises |
41,608 | 41,470 | ||||||
|
Furniture and equipment |
22,941 | 22,552 | ||||||
|
Leasehold improvements |
4,899 | 4,781 | ||||||
| 75,764 | 75,187 | |||||||
|
Accumulated depreciation |
(38,009 | ) | (35,233 | ) | ||||
|
Total |
$ | 37,755 | $ | 39,954 | ||||
Depreciation expense related to premises and equipment was $4.3 million for each of the years 2011, 2010 and 2009.
Certain banking facilities are leased under lease arrangements expiring at various dates until the year 2054. Those which contain escalation clauses, where the rent increases over the term of the lease, are accounted for on a straight-line basis. All leases are accounted for as operating leases, except for one capital lease. Rental expense for premises amounted to $1.9 million, $1.7 million and $1.9 million in 2011, 2010 and 2009, respectively. Included in the rental expense for premises are leases entered into with two directors, which totaled $0.2 million for each of the years ended 2011, 2010 and 2009.
Minimum annual rental and renewal option payments for each of the following five years and thereafter are approximately:
| Operating | Capital | Total | ||||||||||
| (in thousands) | ||||||||||||
|
2012 |
$ | 1,548 | $ | 76 | $ | 1,624 | ||||||
|
2013 |
1,564 | 76 | 1,640 | |||||||||
|
2014 |
1,581 | 76 | 1,657 | |||||||||
|
2015 |
1,583 | 76 | 1,659 | |||||||||
|
2016 |
1,535 | 76 | 1,611 | |||||||||
|
Thereafter |
32,534 | 916 | 33,450 | |||||||||
|
Total |
$ | 40,345 | $ | 1,296 | $ | 41,641 | ||||||
The following table represents a roll forward of goodwill:
| 2011 | 2010 | |||||||
| (in thousands) | ||||||||
|
Balance at beginning of year |
$ | 165,273 | $ | 165,167 | ||||
|
Additions |
— | 106 | ||||||
|
Balance at End of Year |
$ | 165,273 | $ | 165,273 | ||||
PAGE 101
Table of Contents
Goodwill represents the excess of the purchase price over the fair value of net assets purchased. Goodwill is reviewed for impairment annually with an interim analysis performed when necessary.
During the third quarter of 2011, our stock traded below common book value for an extended period of time. As a result, we engaged a third party to provide current market data for recent bank merger and acquisition transactions. The market data included transactions from January 2010 to August 2011 and indicated that transactions were occurring in excess of common book value of 70.3 percent (median). This data supported our conclusion that the fair value exceeds the carrying value and no further valuation procedures were completed. At December 31, 2011, our stock was trading in excess of 10 percent above common book value.
We completed the annual goodwill impairment assessment as required in 2011 and 2010; the results indicated that the fair value of each reporting unit exceeded the carrying value. We determined that goodwill is not impaired.
The following table shows a summary of intangible assets:
| 2011 | 2010 | |||||||
| (in thousands) | ||||||||
|
Gross carrying amount at beginning of year |
$ | 15,070 | $ | 15,070 | ||||
|
Accumulated amortization |
(9,342 | ) | (7,605 | ) | ||||
|
Balance at End of Year |
$ | 5,728 | $ | 7,465 | ||||
Intangible assets as of December 31, 2011 consisted of $4.9 million for the acquisition of core deposits, $0.2 million for the acquisition of wealth management relationships and $0.6 million for the acquisition of insurance contract relationships. We determined the amount of identifiable intangible assets based upon independent core deposit and insurance contract analyses. We did not record any intangible assets in 2011 or 2010. Other intangible assets are evaluated for recoverability annually and more frequently if triggering events and changes in circumstances occur. We completed this review in 2011 and 2010 and determined that other intangible assets are not impaired.
Amortization expense on finite-lived intangible assets totaled $1.7 million, $1.9 million and $2.3 million for 2011, 2010 and 2009, respectively. The following is a summary of the expected amortization expense for finite-lived intangibles assets, assuming no new additions, for each of the five years following December 31, 2011:
| Amount | ||||
| (in thousands) | ||||
|
2012 |
$ | 1,542 | ||
|
2013 |
1,337 | |||
|
2014 |
911 | |||
|
2015 |
716 | |||
|
2016 |
520 | |||
|
Total |
$ | 5,026 | ||
In the normal course of business, we use derivative instruments and hedging activities as discussed under Derivative Financial Instruments in Note 1 Summary of Significant Accounting Policies.
PAGE 102
Table of Contents
The following table indicates the amount representing the value of derivative assets and derivative liabilities at December 31:
|
Derivatives (included in
Other Assets) |
Derivatives (included
in Other Liabilities) |
|||||||||||||||
| 2011 | 2010 | 2011 | 2010 | |||||||||||||
| (in thousands) | ||||||||||||||||
|
Derivatives not Designated as Hedging Instruments |
||||||||||||||||
|
Interest Rate Swaps—Commercial Loans |
||||||||||||||||
|
Fair value |
$ | 23,764 | $ | 17,518 | $ | 23,639 | $ | 17,355 | ||||||||
|
Notional amount |
189,868 | 211,078 | 189,868 | 211,078 | ||||||||||||
|
Collateral posted |
— | — | 20,273 | 13,928 | ||||||||||||
|
Interest Rate Lock Commitments—Mortgage Loans |
||||||||||||||||
|
Fair value |
244 | 217 | — | — | ||||||||||||
|
Notional amount |
7,093 | 17,033 | — | — | ||||||||||||
|
Forward Sale Contracts—Mortgage Loans |
||||||||||||||||
|
Fair value |
— | 412 | 95 | — | ||||||||||||
|
Notional amount |
— | 21,785 | 7,729 | — | ||||||||||||
The following table indicates the gain or loss recognized in income on derivatives for the year ended December 31:
| 2011 | 2010 | 2009 | ||||||||||
| (in thousands) | ||||||||||||
|
Derivatives not Designated as Hedging Instruments |
||||||||||||
|
Interest rate swaps—commercial loans |
$ | (38 | ) | $ | 96 | $ | (616 | ) | ||||
|
Interest rate lock commitments—mortgage loans |
27 | 62 | 6 | |||||||||
|
Forward sale contracts—mortgage loans |
(507 | ) | 220 | 242 | ||||||||
|
Total Derivative (Loss) Gain |
$ | (518 | ) | $ | 378 | $ | (368 | ) | ||||
For the years ended December 31, 2011, 2010 and 2009, the 1-4 family mortgage loans that were sold to Federal National Mortgage Association, or FNMA, amounted to $67.9 million, $109.3 million and $133.5 million respectively. At December 31, 2011, 2010 and 2009 our servicing portfolio totaled $332.6 million, $318.2 million and $255.9 million, respectively.
The following table indicates mortgage servicing rights and the net carrying values:
|
Servicing
Rights |
Valuation
Allowance |
Net Carrying
Value |
||||||||||
| (in thousands) | ||||||||||||
|
Balance at December 31, 2009 |
$ | 2,692 | $ | 592 | $ | 2,100 | ||||||
|
Additions |
1,006 | 233 | 773 | |||||||||
|
Amortization |
(406 | ) | — | (406 | ) | |||||||
|
Balance at December 31, 2010 |
$ | 3,292 | $ | 825 | $ | 2,467 | ||||||
|
Additions |
621 | 342 | 279 | |||||||||
|
Amortization |
(593 | ) | — | (593 | ) | |||||||
|
Balance at December 31, 2011 |
$ | 3,320 | $ | 1,167 | $ | 2,153 | ||||||
PAGE 103
Table of Contents
The following table presents the composition of deposits at December 31 and interest expense for the years ended December 31:
| 2011 | 2010 | 2009 | ||||||||||||||||||||||
| Balance |
Interest
Expense |
Balance |
Interest
Expense |
Balance |
Interest
Expense |
|||||||||||||||||||
| (in thousands) | ||||||||||||||||||||||||
|
Noninterest-bearing demand |
$ | 818,686 | $ | — | $ | 765,812 | $ | — | $ | 712,120 | $ | — | ||||||||||||
|
Interest-bearing demand |
283,611 | 47 | 295,246 | 54 | 260,554 | 59 | ||||||||||||||||||
|
Money market |
278,092 | 691 | 262,683 | 1,166 | 289,367 | 1,557 | ||||||||||||||||||
|
Savings |
802,942 | 1,267 | 753,813 | 2,127 | 752,130 | 3,464 | ||||||||||||||||||
|
Certificates of deposit |
1,152,528 | 20,947 | 1,239,970 | 25,370 | 1,290,370 | 33,358 | ||||||||||||||||||
|
Total |
$ | 3,335,859 | $ | 22,952 | $ | 3,317,524 | $ | 28,717 | $ | 3,304,541 | $ | 38,438 | ||||||||||||
The aggregate of all certificates of deposit over $100,000 amounted to $357.7 million and $451.6 million at December 31, 2011 and 2010, respectively.
The following table indicates the scheduled maturities of certificates of deposit at December 31, 2011:
| Amount | ||||
| (in thousands) | ||||
|
2012 |
$ | 706,140 | ||
|
2013 |
218,088 | |||
|
2014 |
87,970 | |||
|
2015 |
84,167 | |||
|
2016 |
45,656 | |||
|
Thereafter |
10,507 | |||
|
Total |
$ | 1,152,528 | ||
PAGE 104
Table of Contents
Short-term borrowings are for terms under one year and were comprised of retail repurchase agreements , or REPOs, federal funds purchased, term auction facility, or TAF borrowings and FHLB advances. We define repurchase agreements with our local retail customers as retail REPOs. Securities pledged as collateral under these REPO financing arrangements cannot be sold or repledged by the secured party and are therefore accounted for as a secured borrowing. Federal funds purchased are unsecured overnight borrowings with other financial institutions. TAF borrowings are collateral backed short-term loans with the Federal Reserve. FHLB advances are for various terms secured by a blanket lien on residential mortgages and other real estate secured loans. The following table represents the composition of short-term borrowings at December 31 and interest expense for the years ended December 31:
| 2011 | 2010 | 2009 | ||||||||||||||||||||||
| Balance |
Interest
Expense |
Balance |
Interest
Expense |
Balance |
Interest
Expense |
|||||||||||||||||||
| (in thousands) | ||||||||||||||||||||||||
|
Securities sold under repurchase agreements, retail |
$ | 30,370 | $ | 53 | $ | 40,653 | $ | 64 | $ | 44,935 | $ | 141 | ||||||||||||
|
Federal funds purchased |
— | — | — | — | — | 1 | ||||||||||||||||||
|
Term auction facility |
— | — | — | — | — | 18 | ||||||||||||||||||
|
Federal Home Loan Bank advances |
75,000 | 2 | — | 146 | 51,300 | 526 | ||||||||||||||||||
|
Total |
$ | 105,370 | $ | 55 | $ | 40,653 | $ | 210 | $ | 96,235 | $ | 686 | ||||||||||||
In addition, we currently have a $5.0 million line of credit with S&T Bank secured by investments of another subsidiary of S&T. The line of credit has a variable rate based upon prime and is payable on demand. There were no funds drawn from this line of credit in 2011, 2010 or 2009.
Information pertaining to REPOs, federal funds purchased and TAF advances are summarized in the table below:
| 2011 | 2010 | 2009 | ||||||||||
| (in thousands) | ||||||||||||
|
Balance at December 31 |
$ | 30,370 | $ | 40,653 | $ | 44,935 | ||||||
|
Average balance during the year |
41,584 | 46,489 | 94,019 | |||||||||
|
Average interest rate during the year |
0.13% | 0.14% | 0.17% | |||||||||
|
Maximum month-end balance during the year |
$ | 42,409 | $ | 52,046 | $ | 129,835 | ||||||
|
Average interest rate at December 31 |
0.11% | 0.07% | 0.14% | |||||||||
Information pertaining to FHLB advances is summarized in the table below:
| 2011 | 2010 | 2009 | ||||||||||
| (in thousands) | ||||||||||||
|
Balance at December 31 |
$ | 75,000 | $ | — | $ | 51,300 | ||||||
|
Average balance during the year |
551 | 32,473 | 96,929 | |||||||||
|
Average interest rate during the year |
0.32% | 0.45% | 0.54% | |||||||||
|
Maximum month-end balance during the year |
$ | 75,000 | $ | 141,800 | $ | 195,150 | ||||||
|
Average interest rate at December 31 |
0.18% | — | 0.62% | |||||||||
PAGE 105
Table of Contents
We had total borrowings as of December 31, 2011 and 2010 at the Pittsburgh FHLB of $106.6 million and $29.1 million, respectively. Total borrowings for 2011 consisted of $75.0 million in short-term borrowings and $31.6 million in long-term borrowings. The total borrowings of $29.1 million in 2010 were long-term. FHLB borrowings are collateralized by a blanket lien on residential mortgages and other real estate secured loans. Total loans pledged as collateral at the FHLB were $2.0 billion at year end. We were eligible to borrow up to an additional $714.1 million based on qualifying collateral and up to $277.1 million more provided that additional collateral is pledged.
Interest expense of $1.1 million, $1.6 million and $5.6 million was recognized on long-term borrowings for 2011, 2010 and 2009, respectively. Scheduled annual maturities and average interest rate for all of the long-term debt, including a capital lease of $0.3 million, for each of the five years and thereafter subsequent to December 31, 2011 are as follows:
| Balance | Average Rate | |||||||
| (in thousands) | ||||||||
|
2012 |
$ | 1,818 | 3.63% | |||||
|
2013 |
11,885 | 3.52% | ||||||
|
2014 |
1,956 | 3.73% | ||||||
|
2015 |
1,981 | 3.79% | ||||||
|
2016 |
1,905 | 3.84% | ||||||
|
Thereafter |
12,329 | 3.07% | ||||||
|
Total |
$ | 31,874 | 3.40% | |||||
The following table represents the composition of junior subordinated debt securities at December 31 and the interest expense for the years ended December 31:
| 2011 | 2010 | 2009 | ||||||||||||||||||||||
| Balance |
Interest
Expense |
Balance |
Interest
Expense |
Balance |
Interest
Expense |
|||||||||||||||||||
| (in thousands) | ||||||||||||||||||||||||
|
2006 Junior subordinated debt |
$ | 25,000 | $ | 1,344 | $ | 25,000 | $ | 1,695 | $ | 25,000 | $ | 1,695 | ||||||||||||
|
2008 Junior subordinated debt—trust preferred securities |
20,619 | 777 | 20,619 | 782 | 20,619 | 912 | ||||||||||||||||||
|
2008 Junior subordinated debt |
20,000 | 786 | 20,000 | 791 | 20,000 | 919 | ||||||||||||||||||
|
2008 Junior subordinated debt |
25,000 | 728 | 25,000 | 735 | 25,000 | 887 | ||||||||||||||||||
|
Total |
$ | 90,619 | $ | 3,635 | $ | 90,619 | $ | 4,003 | $ | 90,619 | $ | 4,413 | ||||||||||||
PAGE 106
Table of Contents
The following table summarizes the key terms of our junior subordinated debt securities:
|
2006 Junior Subordinated Debt |
2008 Trust Preferred Securities |
2008 Junior Subordinated Debt |
2008 Junior Subordinated Debt |
|||||
| (in thousands) | ||||||||
|
Junior Subordinated Debt |
$25,000 | — | $20,000 | $25,000 | ||||
|
Trust Preferred Securities |
— | $20,000 | — | — | ||||
|
Stated Maturity Date |
12/15/2036 | 3/15/2038 | 6/15/2018 | 5/30/2018 | ||||
|
First optional redemption date at par |
9/15/2011 | 3/15/2013 | 6/15/2013 | 5/30/2013 | ||||
|
Regulatory Capital |
Tier 2 | Tier 1 | Tier 2 | Tier 2 | ||||
|
Interest Rate |
3 month LIBOR*
plus 160 bps |
3 month LIBOR
plus 350 bps |
3 month LIBOR
plus 350 bps |
3 month LIBOR
plus 250 bps |
||||
|
Interest Rate at December 31, 2011 |
2.15% | 4.05% | 4.05% | 3.02% | ||||
We completed a private placement of the trust preferred securities to a financial institution during the first quarter of 2008. As a result, we own 100 percent of the common equity within STBA Capital Trust I. The trust was formed to issue mandatorily redeemable capital securities to third-party investors. The proceeds from the sale of the securities and the issuance of the common equity by STBA Capital Trust I were invested in junior subordinated debt securities issued by us. The third party investors are considered the primary beneficiaries; therefore, the trust qualifies as a variable interest entity, or VIE, but are not consolidated into our financial statements. STBA Capital Trust I pays dividends on the securities at the same rate as the distributions paid by us on the junior subordinated debt held by STBA Capital Trust I.
Commitments
The following table sets forth the commitments and letters of credit at December 31:
| 2011 | 2010 | |||||||
| (in thousands) | ||||||||
|
Commitments to extend credit |
$ | 816,160 | $ | 836,042 | ||||
|
Standby letters of credit |
119,576 | 135,489 | ||||||
|
Total |
$ | 935,736 | $ | 971,531 | ||||
Estimates of the fair value of these off-balance sheet items were not made because of the short-term nature of these arrangements and the credit standing of the counterparties.
Our allowance for unfunded commitments totaled $1.2 million at December 31, 2011 and $2.7 million at December 31, 2010. Refer to Note 1 Summary of Significant Accounting Policies, Allowance for Unfunded Commitments for the methodology used to calculate the allowance for unfunded commitments.
We have future commitments with third party vendors for data processing and communication charges. Data processing and communication charges related to these commitments resulted in expense of $7.4 million, $6.8 million and $6.7 million in 2011, 2010 and 2009, respectively.
PAGE 107
Table of Contents
The following table sets forth the future estimated payments related to data processing and communication charges for the periods stated:
| Total | ||||
| (in thousands) | ||||
|
2012 |
$ | 9,124 | ||
|
2013 |
6,339 | |||
|
2014 |
6,523 | |||
|
2015 |
6,671 | |||
|
2016 |
6,317 | |||
|
Total |
$ | 34,974 | ||
The commitments in the above table show a decrease in 2013 due to the expiration of a contract with both a third party data processor and a communication vendor. We will be negotiating new contracts during 2012 with these vendors. Additionally, the 2012 commitments include $2.0 million in data processing costs associated with our upcoming acquisition of Mainline.
Litigation
In the normal course of business, we are subject to various legal and administrative proceedings and claims. While any type of litigation contains a level of uncertainty, we believe that the outcome of such proceedings or claims pending will not have a material adverse effect on our consolidated financial position.
Income tax expense (benefit) for the years ended December 31 are comprised of:
| 2011 | 2010 | 2009 | ||||||||||
| (in thousands) | ||||||||||||
|
Current |
$ | 12,174 | $ | 18,969 | $ | 3,596 | ||||||
|
Deferred |
2,448 | (4,537 | ) | (7,465 | ) | |||||||
|
Total |
$ | 14,622 | $ | 14,432 | $ | (3,869 | ) | |||||
The provision for income taxes differs from the amount computed by applying the statutory federal income tax rate to income before income taxes. We ordinarily generate an annual effective tax rate that is less that the statutory rate of 35 percent primarily due to benefits resulting from tax-exempt interest, excludable dividend income, tax-exempt interest on BOLI and tax benefits associated with LIHTC from certain partnership investments.
The statutory to effective tax rate reconciliation for the years ended December 31 is as follows:
| 2011 | 2010 | 2009 | ||||||||||
|
Statutory tax rate |
35.0 % | 35.0 % | 35.0 % | |||||||||
|
Low income housing and federal historic tax credits |
(5.5)% | (3.9)% | (36.5)% | |||||||||
|
Tax-exempt interest |
(4.1)% | (4.8)% | (74.2)% | |||||||||
|
Bank owned life insurance |
(1.2)% | (1.3)% | (15.6)% | |||||||||
|
Dividend exclusion |
(0.6)% | (0.7)% | (14.4)% | |||||||||
|
Adjustment of deferred balances |
— | — | 6.3 % | |||||||||
|
Other |
— | 0.6 % | 4.7 % | |||||||||
|
Effective Tax Rate |
23.6 % | 24.9 % | (94.7)% | |||||||||
PAGE 108
Table of Contents
NOTE 17. INCOME TAXES — continued
Income taxes applicable to security gains (losses) insignificant in 2011, $0.1 million in 2010 and $(1.8) million in 2009.
Significant components of our temporary differences were as follows at December 31:
| 2011 | 2010 | |||||||
| (in thousands) | ||||||||
|
Deferred Tax Liabilities: |
||||||||
|
Net unrealized holding gains on securities available-for-sale |
$ | 5,208 | $ | 2,818 | ||||
|
Prepaid pension |
5,007 | 3,930 | ||||||
|
Deferred loan income |
736 | 599 | ||||||
|
Purchase accounting adjustments |
3,160 | 3,959 | ||||||
|
Depreciation on premises and equipment |
1,882 | 2,001 | ||||||
|
Other |
701 | 649 | ||||||
|
Total Deferred Tax liabilities |
16,694 | 13,956 | ||||||
|
Deferred Tax Assets: |
||||||||
|
Allowance for loan losses |
15,593 | 17,644 | ||||||
|
Loan fees |
250 | 341 | ||||||
|
Other employee benefits |
2,148 | 2,024 | ||||||
|
Low income housing partnerships |
2,608 | 2,281 | ||||||
|
Net adjustment to funded status of pension |
12,804 | 6,228 | ||||||
|
Impairment of securities |
2,119 | 2,130 | ||||||
|
Delinquent interest on nonaccrual loans |
1,187 | 1,939 | ||||||
|
State net operating loss carryforwards |
1,232 | 971 | ||||||
|
Other |
3,309 | 2,955 | ||||||
|
Gross Deferred Tax Assets |
41,250 | 36,513 | ||||||
|
Less: Valuation allowance for Pennsylvania net operating loss carryforwards |
(1,232 | ) | (971 | ) | ||||
|
Total Deferred Tax Assets |
40,018 | 35,542 | ||||||
|
Net Deferred Tax Asset |
$ | 23,324 | $ | 21,586 | ||||
We establish a valuation allowance when it is more likely than not that we will not be able to realize the benefit of the deferred tax assets. Except for Pennsylvania net operating loss, or NOL, carryforwards, we have determined that a valuation allowance is unnecessary for the deferred tax assets because it is more likely than not that these assets will be realized through future reversals of existing temporary differences and through future taxable income. Periodically, the valuation allowance is reviewed and adjusted based on management’s assessments of realizable deferred tax assets. Gross deferred tax assets were reduced by a valuation allowance related to Pennsylvania income tax net operating losses generated by the bank holding company, as utilization of these losses is not likely. These operating loss carryforwards total $12.3 million and will expire in the years 2021-2031.
PAGE 109
Table of Contents
The period change in deferred taxes on our balance sheet is comprised of the following at December 31:
| 2011 | 2010 | |||||||
| (in thousands) | ||||||||
|
Deferred tax changes reflected in other comprehensive gain/loss |
$ | (4,186 | ) | $ | (65 | ) | ||
|
Deferred tax changes reflected in federal income tax expense (benefit) |
2,448 | (4,537 | ) | |||||
Unrecognized Tax Benefits
A reconciliation of the change in Federal and State gross unrecognized tax benefits, or UTB, for the years ended December 31:
| 2011 | 2010 | 2009 | ||||||||||
| (in thousands) | ||||||||||||
|
Balance at beginning of year |
$ | 242 | $ | 286 | $ | 195 | ||||||
|
Prior period tax positions |
||||||||||||
|
Increase |
— | — | — | |||||||||
|
Decrease |
— | (67 | ) | (79 | ) | |||||||
|
Current period tax positions |
(42 | ) | 23 | 170 | ||||||||
|
Reductions for statute of limitations expirations |
— | — | — | |||||||||
|
Balance at End of Year |
$ | 200 | $ | 242 | $ | 286 | ||||||
|
Amount That Would Affect the Effective Tax Rate if Recognized |
$ | 197 | $ | 239 | $ | 249 | ||||||
We classify interest and penalties as an element of tax expense. The amount of tax-related interest and penalties recognized in the Consolidated Statements of Income for years 2011, 2010 and 2009 and the total of such amounts accrued in the Consolidated Balance Sheets at December 31, 2011 and 2010 were not material.
We monitor changes in tax statutes and regulations to determine if significant changes will occur over the next 12 months. As of December 31, 2011 no significant changes to UTB are projected, however, tax audit examinations are possible.
We maintain a defined benefit pension plan, or Plan, covering substantially all employees hired prior to January 1, 2008. The benefits are based on years of service and the employee’s compensation for the highest five consecutive years in the last ten years. Contributions are intended to provide for benefits attributed to employee service to date and for those benefits expected to be earned in the future.
PAGE 110
Table of Contents
NOTE 18. EMPLOYEE BENEFITS — continued
The following table summarizes the activity in the benefit obligation and Plan assets deriving the funded status, which is recorded in other liabilities in the Consolidated Balance Sheets:
| 2011 | 2010 | |||||||
| (in thousands) | ||||||||
|
Change in Projected Benefit Obligation |
||||||||
|
Projected benefit obligation at beginning of year |
$ | 74,118 | $ | 65,183 | ||||
|
Service cost |
2,371 | 2,245 | ||||||
|
Interest cost |
4,162 | 4,017 | ||||||
|
Plan participants’ contributions |
3,964 | 162 | ||||||
|
Plan amendments |
(1,513 | ) | — | |||||
|
Actuarial loss |
15,199 | 5,373 | ||||||
|
Benefits paid |
(5,268 | ) | (2,862 | ) | ||||
|
Projected Benefit Obligation at End of Year |
$ | 93,033 | $ | 74,118 | ||||
|
Change in Plan Assets |
||||||||
|
Fair value of plan assets at beginning of year |
$ | 68,774 | $ | 62,480 | ||||
|
Actual return on plan assets |
156 | 8,994 | ||||||
|
Employer contributions |
5,000 | — | ||||||
|
Plan participants’ contributions |
3,964 | 162 | ||||||
|
Benefits paid |
(5,268 | ) | (2,862 | ) | ||||
|
Fair Value of Plan Assets at End of Year |
$ | 72,626 | $ | 68,774 | ||||
|
Funded Status |
$ | (20,407 | ) | $ | (5,344 | ) | ||
The following table sets forth the amounts recognized in accumulated other comprehensive gain/loss at December 31:
| 2011 | 2010 | |||||||
| (in thousands) | ||||||||
|
Prior service credit |
$ | (1,579 | ) | $ | (73 | ) | ||
|
Net actuarial loss |
36,294 | 16,645 | ||||||
|
Total (Before Tax Effects) |
$ | 34,715 | $ | 16,572 | ||||
Below are the actuarial weighted average assumptions used in determining the benefit obligation:
| 2011 | 2010 | |||||||
|
Discount rate |
4.75 | % | 5.75 | % | ||||
|
Rate of compensation increase |
4.00 | % | 4.00 | % | ||||
PAGE 111
Table of Contents
NOTE 18. EMPLOYEE BENEFITS — continued
The following table summarizes the components of net periodic pension cost and other changes in plan assets and benefit obligation recognized in other comprehensive gain/loss for the years ended December 31:
| 2011 | 2010 | 2009 | ||||||||||
| (in thousands) | ||||||||||||
|
Components of Net Periodic Pension Cost |
||||||||||||
|
Service cost—benefits earned during the period |
$ | 2,371 | $ | 2,245 | $ | 2,311 | ||||||
|
Interest cost on projected benefit obligation |
4,162 | 4,017 | 3,797 | |||||||||
|
Expected return on plan assets |
(5,378 | ) | (4,882 | ) | (4,288 | ) | ||||||
|
Amortization of prior service credit |
(7 | ) | (7 | ) | (7 | ) | ||||||
|
Recognized net actuarial loss |
773 | 824 | 1,297 | |||||||||
|
Net Periodic Pension Cost |
$ | 1,921 | $ | 2,197 | $ | 3,110 | ||||||
|
Other Changes in Plan Assets and Benefit Obligation Recognized in Other Comprehensive Loss |
||||||||||||
|
Net actuarial loss (gain) |
$ | 20,422 | $ | 1,261 | $ | (6,211 | ) | |||||
|
Recognized net actuarial loss |
(773 | ) | (824 | ) | (1,297 | ) | ||||||
|
Prior service credit |
(1,513 | ) | — | — | ||||||||
|
Recognized prior service credit |
7 | 7 | 7 | |||||||||
|
Total (Before Tax Effects) |
$ | 18,143 | $ | 444 | $ | (7,501 | ) | |||||
|
Total Recognized in Net Benefit Cost and Other Comprehensive Gain/Loss (Before Tax Effects) |
$ | 20,064 | $ | 2,641 | $ | (4,391 | ) | |||||
The following table summarizes the actuarial weighted average assumptions used in determining net periodic pension cost:
| 2011 | 2010 | 2009 | ||||||||||
|
Discount rate |
5.75% | 6.25% | 6.25% | |||||||||
|
Rate of compensation increase |
4.00% | 4.00% | 4.00% | |||||||||
|
Expected return on assets |
8.00% | 8.00% | 8.00% | |||||||||
The net actuarial loss included in accumulated other comprehensive gain/loss expected to be recognized in net periodic pension cost during the year ended December 31, 2012 is $2.3 million. The prior service cost expected to be recognized during the same period is not significant.
The accumulated benefit obligation for the Plan was $82.0 million at December 31, 2011 and $65.7 million at December 31, 2010.
We consider many factors when setting the assumed rate of return on Plan assets. As a general guideline the assumed rate of return is equal to the weighted average of the expected returns for each asset category and is estimated based on historical returns as well as expected future returns. The weighted average discount rate is derived from corporate yield curves.
S&T Bank’s Retirement Plan Committee determines the investment policy for the Plan. In general, the targeted asset allocation is 50 percent to 70 percent equities and 30 percent to 50 percent fixed income. A strategic allocation within each asset class is employed based on the Plan’s time horizon, risk tolerances, performance expectations and asset class preferences. Investment managers have discretion to invest in any equity or fixed-income asset class, subject to the securities guidelines of the Plan’s Investment Policy Statement.
PAGE 112
Table of Contents
NOTE 18. EMPLOYEE BENEFITS — continued
At this time, the Bank is not required to make a cash contribution to the Plan in 2012; however, the Bank contributed $5.0 million to the Plan in December 2011.
The following table provides information regarding estimated future benefit payments to be paid in each of the next five years and in the aggregate for the five years thereafter:
| Amount | ||||
| (in thousands) | ||||
|
2012 |
$ | 4,905 | ||
|
2013 |
5,324 | |||
|
2014 |
5,346 | |||
|
2015 |
6,681 | |||
|
2016 |
5,749 | |||
|
2017—2021 |
32,761 | |||
We also have supplemental executive retirement plans, or SERPs, for certain key employees. The SERPs are unfunded. The projected benefit obligations related to the SERPs were $3.1 million and $2.3 million at December 31, 2011 and 2010, respectively. These amounts also represent the net amount recognized in the statement of financial position for the SERPs. Net periodic benefit costs for the SERPs were $0.3 million for each of the years ended December 31, 2011, 2010 and 2009, respectively. Additionally, $1.9 million and $1.3 million before tax were reflected in accumulated other comprehensive gain/loss at December 31, 2011 and 2010, respectively, in relation to the SERPs. The actuarial assumptions used for the SERPs are the same as those used for the Plan.
We maintain a Thrift Plan, a qualified defined contribution plan, in which substantially all employees are eligible to participate. We make matching contributions to the Thrift Plan up to 3.5 percent of participants’ eligible compensation and may make additional profit-sharing contributions as provided by the Thrift Plan. Expense related to these contributions amounted to $1.1 million in both 2011 and 2010 and $1.4 million in 2009.
Fair Value Measurements
The following tables present our pension plan assets measured at fair value on a recurring basis by fair value hierarchy level at December 31, 2011 and 2010. There were no transfers between Level 1 and Level 2 for items of a recurring basis during the periods presented.
| December 31, 2011 | ||||||||||||||||
| Asset Class (1) | Level 1 | Level 2 | Level 3 | Total | ||||||||||||
| (in thousands) | ||||||||||||||||
|
Cash and cash equivalents (2) |
$ | — | $ | 7,440 | $ | — | $ | 7,440 | ||||||||
|
Fixed Income (3) |
21,539 | — | 1,333 | 22,872 | ||||||||||||
|
Equities: |
||||||||||||||||
|
Equity index mutual funds—domestic (4) |
1,580 | — | — | 1,580 | ||||||||||||
|
Equity index mutual funds—international (5) |
3,437 | — | — | 3,437 | ||||||||||||
|
Domestic Individual Equities (6) |
34,600 | — | — | 34,600 | ||||||||||||
|
International Individual Equities (7) |
1,437 | — | — | 1,437 | ||||||||||||
|
Equity—Partnerships (8) |
— | — | 1,260 | 1,260 | ||||||||||||
| Total Assets at Fair Value | $ | 62,593 | $ | 7,440 | $ | 2,593 | $ | 72,626 | ||||||||
| (1) |
Refer to Note 1 Summary of Significant Accounting Policies, Fair Value Measurements for a description of levels within the fair value hierarchy. |
| (2) |
This asset class includes FDIC insured money market instruments. |
PAGE 113
Table of Contents
| (3) |
This asset class includes a variety of fixed income mutual funds and a partnership which primarily invests in investment grade rated securities. Investment managers have discretion to invest in fixed income related securities including futures, options and other derivatives. Investments may be made in currencies other than the U.S. dollar. |
| (4) |
The sole investment within this asset class is S&P 600 index iShares. |
| (5) |
The sole investment within this asset class is MSCI EAFE Index iShares. |
| (6) |
This asset class includes individual domestic equities invested in an active all-cap strategy. It may also include convertible bonds. |
| (7) |
This asset class includes American Depository Receipts, or ADR. |
| (8) |
This asset class includes a Partnership priced by the investment manager which invests in equities and T-Bills. |
| December 31, 2010 | ||||||||||||||||
| Asset Class (1) | Level 1 | Level 2 | Level 3 | Total | ||||||||||||
| (in thousands) | ||||||||||||||||
|
Cash and cash equivalents (2) |
$ | — | $ | 3,196 | $ | — | $ | 3,196 | ||||||||
|
Fixed Income (3) |
24,302 | — | — | 24,302 | ||||||||||||
|
Equities: |
||||||||||||||||
|
Equity index mutual funds—domestic (4) |
1,477 | — | — | 1,477 | ||||||||||||
|
Equity index mutual funds—international (5) |
3,643 | — | — | 3,643 | ||||||||||||
|
Domestic Individual Equities (6) |
34,621 | — | — | 34,621 | ||||||||||||
|
International Individual Equities (7) |
1,535 | — | — | 1,535 | ||||||||||||
| Total Assets at Fair Value | $ | 65,578 | $ | 3,196 | $ | — | $ | 68,774 | ||||||||
| (1) |
Refer to Note 1 Summary of Significant Accounting Policies, Fair Value Measurements for a description of levels within the fair value hierarchy. |
| (2) |
This asset class includes FDIC insured money market instruments. |
| (3) |
This asset class includes a variety of fixed income mutual funds which primarily invests in investment grade rated securities. Investment managers have discretion to invest in fixed income related securities including futures, options and other derivatives. Investments may be made in currencies other than the U.S. dollar. |
| (4) |
The sole investment within this asset class is S&P 600 index iShares. |
| (5) |
The sole investment within this asset class is MSCI EAFE Index iShares. |
| (6) |
This asset class includes individual domestic equities invested in an active all-cap strategy. It may also include convertible bonds. |
| (7) |
This asset class includes American Depository Receipts, or ADR. |
We adopted an Incentive Stock Plan in 1992 that provided for granting incentive stock options, nonstatutory stock options, restricted stock and appreciation rights. On October 17, 1994, the 1992 Stock Plan was amended to include outside directors. The 1992 Stock Plan had a maximum of 3,200,000 shares of our common stock and expired ten years from the date of board approval. At December 31, 2002, 3,180,822 nonstatutory stock options and restricted stock had been granted under the 1992 Stock Plan. No further awards will be made under the 1992 Stock Plan.
We adopted an incentive Stock Plan in 2003 that provides for granting incentive stock options, nonstatutory stock options, restricted stock and appreciation rights. The 2003 Stock Plan has a maximum of 1,500,000 shares of our common stock and expires ten years from the date of board approval. The 2003 Stock Plan is similar to the 1992 Stock Plan, which the 2003 Stock Plan replaced.
Stock Options
As of December 31, 2011, 757,050 nonstatutory stock options are outstanding under the 2003 Stock Plan. Nonstatutory stock options granted in 2006 and 2005 are fully vested and have a ten-year life. Our policy is to issue shares from treasury upon exercise of stock options. We did not recognize compensation expense for stock options in 2011 or 2010. We recognized $0.5 million, net of tax was $0.3 million, for year ending December 31, 2009.
PAGE 114
Table of Contents
NOTE 19. INCENTIVE AND RESTRICTED STOCK PLAN AND DIVIDEND REINVESTMENT PLAN — continued
The fair value of option awards under the nonstatutory stock option plan is estimated on the date of grant using the Black-Scholes valuation model, which is dependent upon certain assumptions. We use the simplified method in developing the estimated life of the option, whereby the expected life is presumed to be the mid point between the vesting date and the end of the contractual term. There were no nonstatutory stock options granted in 2011, 2010 or 2009.
The following table summarizes activity for nonstatutory stock options for the years ending December 31:
| 2011 | 2010 | 2009 | ||||||||||||||||||||||||||||||||||
|
Number
of Shares |
Weighted
Average Exercise Price |
Weighted
Average Remaining Contractual Term |
Number of
Shares |
Weighted
Average Exercise Price |
Weighted
Average Remaining Contractual Term |
Number of
Shares |
Weighted
Average Exercise Price |
Weighted
Average Remaining Contractual Term |
||||||||||||||||||||||||||||
|
Outstanding at Beginning of Year |
930,700 | $ | 32.80 | 1,100,550 | $ | 31.85 | 1,199,650 | $ | 31.14 | |||||||||||||||||||||||||||
|
Granted |
— | — | — | — | — | — | ||||||||||||||||||||||||||||||
|
Exercised |
— | — | (82,100 | ) | 19.81 | (1,150 | ) | 23.80 | ||||||||||||||||||||||||||||
|
Forfeited |
(173,650 | ) | 26.11 | (87,750 | ) | 33.04 | (97,950 | ) | 23.28 | |||||||||||||||||||||||||||
|
Outstanding at End of Year |
757,050 | $ | 34.33 | 2.8 years | 930,700 | $ | 32.80 | 3.3 years | 1,100,550 | $ | 31.85 | 4.1 years | ||||||||||||||||||||||||
|
Exercisable at End of Year |
757,050 | $ | 34.33 | 2.8 years | 930,700 | $ | 32.80 | 3.3 years | 1,048,925 | $ | 31.55 | 4.0 years | ||||||||||||||||||||||||
The aggregate intrinsic value of options outstanding and exercisable was zero as of December 31, 2011, 2010 and 2009. The aggregate intrinsic value represents the total pretax intrinsic value (the difference between our closing stock price on the last trading day of the fourth quarter and the exercise price, multiplied by the number of in-the-money options) that would have been received by the option holders had all option holders exercised their options on December 31, 2011.
The following table provides information about non-vested options for the years ended December 31:
|
Non-Vested
Options |
Weighted Average
Grant Date Fair Value |
|||||||
|
Non-vested at December 31, 2008 |
103,250 | $ | 9.48 | |||||
|
Granted |
— | — | ||||||
|
Vested |
51,625 | 9.48 | ||||||
|
Forfeited |
— | — | ||||||
|
Non-vested at December 31, 2009 |
51,625 | $ | 9.48 | |||||
|
Granted |
— | — | ||||||
|
Vested |
30,625 | 9.48 | ||||||
|
Forfeited |
21,000 | 9.48 | ||||||
|
Non-vested at December 31, 2010 |
— | $ | — | |||||
|
Granted |
— | — | ||||||
|
Vested |
— | — | ||||||
|
Forfeited |
— | — | ||||||
|
Non-vested at December 31, 2011 |
— | $ | — | |||||
PAGE 115
Table of Contents
NOTE 19. INCENTIVE AND RESTRICTED STOCK PLAN AND DIVIDEND REINVESTMENT PLAN — continued
The following table presents information about stock options exercised for the years ended December 31:
| 2011 | 2010 | 2009 | ||||||||||
| (in thousands, except share data) | ||||||||||||
|
Number of options exercised |
— | 82,100 | 1,150 | |||||||||
|
Total intrinsic value of options exercised |
$ | — | $ | 131 | $ | 13 | ||||||
|
Cash received from options exercised |
— | 1,758 | 40 | |||||||||
|
Tax deduction realized from options exercised |
$ | — | $ | 46 | $ | 4 | ||||||
Restricted Stock
We periodically issue restricted stock to employees and directors, pursuant to the 2003 Stock Plan. As of December 31, 2011, 170,114 restricted shares have been granted under this plan.
During 2011, 2010 and 2009, we granted 19,890, 14,208 and 17,200 restricted shares of common stock, respectively, to outside directors. The grants are part of the compensation arrangement approved by the Compensation and Benefits Committee whereas the directors receive compensation in both the form of cash and restricted shares of common stock. These shares fully vest one year after the date of grant.
Also during 2011 and 2010, we granted 60,157 and 4,688 restricted shares of common stock, respectively, to senior management. No restricted shares were granted in 2009. The awards to senior management were granted in accordance with performance levels set by the Compensation and Benefits Committee. The restricted shares granted during 2011 occurred on three occasions and have different vesting periods. The first grant, or 16,497 restricted shares, vests fully on the second anniversary of the grant date. The second grant, or 11,104 restricted shares, vests fully on January 1, 2012. The third grant, or 32,556 restricted shares, was granted under our Long Term Incentive Plan and consists of both time and performance-based awards. Vesting for the time-based awards is 50 percent after two years and the remaining 50 percent at the end of the third year. The performance-based awards vest fully at the end of the three year period. Of the 4,688 restricted shares granted in 2010, 1,881 shares fully vested one year after the date of grant. The remaining 2,807 shares granted vest 50 percent on each of the one and two year anniversaries from the date of grant. The shares granted prior to 2009 vest 25 percent per year over a four year vesting period beginning on January 1 one year after the shares were granted.
During the vesting period, the recipient receives dividends and has the right to vote on the unvested shares granted. If the recipient leaves S&T before the end of the vesting period, shares will be forfeited except in the case of retirement, disability or death where accelerated vesting provision are defined within the plan agreement.
Compensation expense for time-based restricted stock is recognized ratably over the period of service, generally the entire vesting period, based on fair value on the date of grant. For grants made to directors, the fair value is determined by the closing price of the stock on the date of grant. The average of the high and low prices of the stock on the grant date is used for senior management. Compensation expense for performance-based restricted stock is recognized ratably over the remaining vesting period once the likelihood of meeting the performance measure is probable. During 2011, 2010 and 2009, we recognized compensation expense of $1.1 million, $0.5 million and $0.5 million and realized a tax benefit of $0.4 million, $0.3 million and $0.2 million, respectively.
PAGE 116
Table of Contents
The following table provides information about restricted stock for the years ended December 31:
|
Restricted
Stock |
Weighted Average
Grant Date Fair Value |
|||||||
|
Non-vested at December 31, 2008 |
38,891 | $ | 29.88 | |||||
|
Granted |
17,200 | 18.61 | ||||||
|
Vested |
14,749 | 31.13 | ||||||
|
Forfeited |
— | — | ||||||
|
Non-vested at December 31, 2009 |
41,342 | $ | 24.75 | |||||
|
Granted |
18,896 | 21.44 | ||||||
|
Vested |
25,006 | 21.86 | ||||||
|
Forfeited |
3,562 | 29.15 | ||||||
|
Non-vested at December 31, 2010 |
31,670 | $ | 24.56 | |||||
|
Granted |
80,047 | 21.39 | ||||||
|
Vested |
23,915 | 23.69 | ||||||
|
Forfeited |
1,652 | 23.64 | ||||||
|
Non-vested at December 31, 2011 |
86,150 | $ | 21.88 | |||||
As of December 31, 2011, there was $0.8 million of total unrecognized compensation cost related to restricted stock that will be recognized as compensation expense over a weighted average period of one year.
Cash Appreciation Rights
We also sponsor a Cash Appreciation Rights, or CARs, plan which is accounted for as a liability instrument and required to be marked to market each reporting period. The CARs are settled in cash. There were no CARs granted for the years 2011, 2010 or 2009. 206,900 CARs were granted in 2005 at an exercise price of $37.86 with a four-year vesting period and a ten-year life. During 2011, 6,600 CARs were forfeited. During 2011, 2010 and 2009, we recognized compensation expense of $(0.2) million, $0.1 million and $(0.6) million pretax and $(0.1) million, $0.1 million and $(0.4) million net of tax, respectively. The Black-Scholes option pricing model is used to determine the fair value of the CARs as of each reporting date. The assumptions used to value the CARs for the years ended December 31 were as follows:
| 2011 | 2010 | 2009 | ||||||||||
|
Risk-free interest rate |
0.33% | 1.14% | 2.12% | |||||||||
|
Volatility of stock |
29% | 33% | 31% | |||||||||
|
Expected dividend yield |
3.11% | 3.00% | 3.40% | |||||||||
|
Expected life of options |
2.74 years | 3.23 years | 3.73 years | |||||||||
Dividend Reinvestment Plan
We also sponsor a Dividend Reinvestment and Stock Purchase Plan, or Dividend Plan, whereby shareholders may purchase shares of S&T common stock at the average fair value with reinvested dividends and voluntary cash contributions. The plan administrator and transfer agent, may purchase shares directly from us from shares held in treasury or purchase shares in the open market to fulfill the Dividend Plan’s needs.
PAGE 117
Table of Contents
The following condensed financial statements summarize the financial position of S&T Bancorp, Inc. as of December 31, 2011 and 2010 and the results of its operations and cash flows for each of the three years ended December 31, 2011, 2010 and 2009.
BALANCE SHEETS
| December 31 | 2011 | 2010 | ||||||
| (in thousands) | ||||||||
|
ASSETS |
||||||||
|
Cash |
$ | 13,684 | $ | 110,889 | ||||
|
Investments in: |
||||||||
|
Bank subsidiary |
474,661 | 456,468 | ||||||
|
Nonbank subsidiaries |
20,008 | 17,947 | ||||||
|
Other assets |
2,937 | 15,010 | ||||||
|
Total Assets |
$ | 511,290 | $ | 600,314 | ||||
|
LIABILITIES |
||||||||
|
Long-term debt |
$ | 20,619 | $ | 20,619 | ||||
|
Dividends payable |
— | 694 | ||||||
|
Other liabilities |
145 | 336 | ||||||
|
Total Liabilities |
20,764 | 21,649 | ||||||
|
Total Shareholders’ Equity |
490,526 | 578,665 | ||||||
|
Total Liabilities and Shareholders’ Equity |
$ | 511,290 | $ | 600,314 | ||||
|
STATEMENTS OF INCOME |
||||||||||||
| Years Ended December 31 | 2011 | 2010 | 2009 | |||||||||
| (in thousands) | ||||||||||||
|
Dividends from subsidiaries |
$ | 23,029 | $ | 22,634 | $ | 29,477 | ||||||
|
Investment income |
121 | 86 | 520 | |||||||||
|
Interest expense on long-term debt |
777 | 782 | 912 | |||||||||
|
Other expenses |
1,091 | 1,648 | 1,630 | |||||||||
|
Income before Equity in Undistributed Net Income of Subsidiaries |
21,282 | 20,290 | 27,455 | |||||||||
|
Equity in undistributed net income (distribution in excess of net income) of: Bank subsidiary |
25,590 | 23,158 | (15,206 | ) | ||||||||
|
Nonbank subsidiaries |
392 | 32 | (4,298 | ) | ||||||||
|
Net Income |
$ | 47,264 | $ | 43,480 | $ | 7,951 | ||||||
PAGE 118
Table of Contents
|
STATEMENTS OF CASH FLOWS |
||||||||||||
| Years Ended December 31 | 2011 | 2010 | 2009 | |||||||||
| (in thousands) | ||||||||||||
|
OPERATING ACTIVITIES |
||||||||||||
|
Net Income |
$ | 47,264 | $ | 43,480 | $ | 7,951 | ||||||
|
Equity in (undistributed net income) distribution in excess of net income of subsidiaries |
(25,982 | ) | (23,190 | ) | 19,504 | |||||||
|
Tax expense (benefit) from stock-based compensation |
66 | (46 | ) | (4 | ) | |||||||
|
Other |
10,145 | 470 | 968 | |||||||||
|
Net Cash Provided by Operating Activities |
31,493 | 20,714 | 28,419 | |||||||||
|
INVESTING ACTIVITIES |
||||||||||||
|
Net investments in subsidiaries |
— | — | — | |||||||||
|
Acquisitions |
— | — | — | |||||||||
|
Net Cash Used In Investing Activities |
— | — | — | |||||||||
|
FINANCING ACTIVITIES |
||||||||||||
|
Proceeds from issuance of preferred stock and common stock warrant |
— | — | 108,676 | |||||||||
|
Redemption of preferred stock |
(108,676 | ) | — | — | ||||||||
|
Sale of treasury shares |
1,946 | 3,692 | 1,349 | |||||||||
|
Preferred stock dividends |
(5,072 | ) | (5,434 | ) | (4,513 | ) | ||||||
|
Cash dividends paid to common shareholders |
(16,830 | ) | (16,683 | ) | (25,427 | ) | ||||||
|
Tax (expense) benefit from stock-based compensation |
(66 | ) | 46 | 4 | ||||||||
|
Net Cash (Used in) Provided by Financing Activities |
(128,698 | ) | (18,379 | ) | 80,089 | |||||||
|
Net (decrease) increase in cash |
(97,205 | ) | 2,335 | 108,508 | ||||||||
|
Cash at beginning of year |
110,889 | 108,554 | 46 | |||||||||
|
Cash at End of Year |
$ | 13,684 | $ | 110,889 | $ | 108,554 | ||||||
We are subject to various regulatory capital requirements administered by the federal banking agencies. Failure to meet the minimum capital requirements can initiate certain mandatory and possibly additional discretionary actions by regulators that, if undertaken, could have a direct material effect on our financial statements. Under capital guidelines and the regulatory framework for prompt corrective action, we must meet specific capital guidelines that involve quantitative measures of our assets, liabilities and certain off-balance sheet items as calculated under regulatory accounting practices. Our capital amounts and classification are also subject to qualitative judgments by the regulators about risk weightings and other factors.
The most recent notifications from the Federal Reserve Board and the FDIC categorized S&T and S&T Bank as well capitalized under the regulatory framework for corrective action. There have been no conditions or events that we believe have changed S&T or S&T Bank’s status during 2011 and 2010.
Tier 1 capital consists principally of shareholders’ equity including preferred stock; excluding items recorded in accumulated other comprehensive gain/loss, less, goodwill and other intangibles. Total capital consists of Tier 1 capital plus junior subordinated debt and the ALL subject to limitation. We currently have $70.0 million in junior subordinated debt which is included in Tier 2 capital in accordance with current regulatory reporting requirements. For regulatory purposes, trust preferred
PAGE 119
Table of Contents
securities totaling $20.0 million, issued by an unconsolidated trust subsidiary of S&T underlying such junior subordinated debt, are included in Tier 1 capital.
During 2011, we redeemed all of the Series A Preferred Stock. Refer to Note 22 Capital Purchase Program for additional disclosures. At December 31, 2010, Tier 1 capital included $106.1 million, representing Series A Preferred Stock of $108.7 million net of the unamortized discount of $2.6 million in accordance with the terms of the CPP and regulatory requirements.
Quantitative measures established by regulation to ensure capital adequacy require us to maintain minimum amounts and ratios of Total and Tier 1 capital to risk-weighted assets and Tier 1 capital to average assets. As of December 31, 2011 and 2010, we met all capital adequacy requirements to which we are subject.
The following table summarizes risk-based capital amounts and ratios for S&T and S&T Bank.
| Actual |
For Capital Adequacy
Purposes |
To be
Well Capitalized Under Prompt Corrective Action Provisions |
||||||||||||||||||||||
| Amount | Ratio | Amount | Ratio | Amount | Ratio | |||||||||||||||||||
| (in thousands) | ||||||||||||||||||||||||
|
As of December 31, 2011 |
||||||||||||||||||||||||
| Total Capital (to Risk-Weighted Assets) | ||||||||||||||||||||||||
|
S&T |
$ | 465,702 | 15.20 | % | $ | 245,154 | 8.00 | % | $ | 306,443 | 10.00 | % | ||||||||||||
|
S&T Bank |
429,837 | 14.11 | % | 243,699 | 8.00 | % | 304,623 | 10.00 | % | |||||||||||||||
| Tier 1 Capital (to Risk-Weighted Assets) | ||||||||||||||||||||||||
|
S&T |
356,484 | 11.63 | % | 122,577 | 4.00 | % | 183,866 | 6.00 | % | |||||||||||||||
|
S&T Bank |
321,352 | 10.55 | % | 121,849 | 4.00 | % | 182,774 | 6.00 | % | |||||||||||||||
| Leverage Ratio (1) | ||||||||||||||||||||||||
|
S&T |
356,484 | 9.17 | % | 155,526 | 4.00 | % | 194,408 | 5.00 | % | |||||||||||||||
|
S&T Bank |
321,352 | 8.30 | % | 154,789 | 4.00 | % | 193,486 | 5.00 | % | |||||||||||||||
|
As of December 31, 2010 |
||||||||||||||||||||||||
| Total Capital (to Risk-Weighted Assets) | ||||||||||||||||||||||||
|
S&T |
$ | 547,336 | 16.68 | % | $ | 262,498 | 8.00 | % | $ | 328,123 | 10.00 | % | ||||||||||||
|
S&T Bank |
405,049 | 12.42 | % | 260,944 | 8.00 | % | 326,180 | 10.00 | % | |||||||||||||||
| Tier 1 Capital (to Risk-Weighted Assets) | ||||||||||||||||||||||||
|
S&T |
435,823 | 13.28 | % | 131,249 | 4.00 | % | 196,874 | 6.00 | % | |||||||||||||||
|
S&T Bank |
294,113 | 9.02 | % | 130,472 | 4.00 | % | 195,708 | 6.00 | % | |||||||||||||||
| Leverage Ratio (1) | ||||||||||||||||||||||||
|
S&T |
435,823 | 11.07 | % | 157,513 | 4.00 | % | 196,891 | 5.00 | % | |||||||||||||||
|
S&T Bank |
294,113 | 7.50 | % | 156,799 | 4.00 | % | 195,999 | 5.00 | % | |||||||||||||||
| (1) |
Minimum requirement is 3.00 percent for the most highly-rated financial institutions. |
On December 7, 2011 we redeemed all of the $108.7 million, or 108,676 shares, of Series A Preferred Stock issued on January 16, 2009 in conjunction with our participation in the CPP. Upon redemption, a one-time non-cash reduction to net income available to common shareholders of $1.8 million, or $0.06 per common share, was recorded for the remaining unamortized discount of the preferred stock. Refer to Note 21 Regulatory Matters for additional disclosures regarding capital requirements.
As part of its original purchase of the Series A Preferred Stock, the U.S. Treasury received a warrant to purchase 517,012 shares of our common stock at an initial per share exercise price of $31.53. The warrant provides for the adjustment of the exercise price and the number of shares of our common stock issuable upon exercise pursuant to customary anti-dilution provisions, such as upon
PAGE 120
Table of Contents
stock splits or distributions of securities or other assets to holders of our common stock and upon certain issuances of our common stock at or below a specified price relative to the initial exercise price. A binomial pricing model was used to calculate the fair value of the common stock warrant we issued on January 16, 2009 resulting in a fair value of $4.0 million.
The assumptions used to calculate the fair value of the warrant are summarized below:
| Assumption | Value | |||
|
Contractual term |
10 years | |||
|
Exercise price |
$ | 31.53 | ||
|
Estimated fair value of company stock |
$ | 29.14 | ||
|
Expected life |
10 years | |||
|
Risk-free rate over expected life of the warrant |
2.36 | % | ||
|
Expected volatility |
28.40 | % | ||
|
Expected dividend yield |
3.85 | % | ||
We utilized the average of daily and monthly historical volatility for purposes of this valuation. In addition, the U.S. Treasury has agreed not to exercise voting power with respect to any shares of common stock issued upon exercise of the warrant. We did not repurchase the warrant at the time of the Series A Preferred Stock redemption and it will remain outstanding until January 2019 or until we repurchase it from the U.S. Treasury.
We operate three reportable operating segments including Community Banking, Wealth Management and Insurance.
| • |
Our Community Banking segment offers services which include accepting time and demand accounts, originating commercial and consumer loans and providing letters of credit and credit card services. |
| • |
Our Wealth Management segment offers discount brokerage services, services as executor and trustee under wills and deeds, guardian and custodian of employee benefits and other trust and brokerage services, as well as a registered investment advisor that manages private investment accounts for individuals and institutions. |
| • |
Our Insurance segment includes a full-service insurance agency offering commercial property and casualty insurance, group life and health coverage, employee benefit solutions and personal insurance lines. |
The following represents total assets by reportable operating segment as of December 31:
| 2011 | 2010 | |||||||
| (in thousands) | ||||||||
|
Community Banking |
$ | 4,110,462 | $ | 4,103,898 | ||||
|
Insurance |
8,192 | 8,461 | ||||||
|
Wealth Management |
1,340 | 1,980 | ||||||
|
Total Assets |
$ | 4,119,994 | $ | 4,114,339 | ||||
PAGE 121
Table of Contents
The following tables provide financial information for our three segments. The financial results of the business segments include allocations for shared services based on an internal analysis that supports line of business and branch performance measurement. Shared services include expenses such as employee benefits, occupancy expense, computer support and other corporate overhead. Even with these allocations, the financial results are not necessarily indicative of the business segments’ financial condition and results of operations as if they existed as independent entities. The information provided under the caption “Eliminations” represents operations not considered to be reportable segments and/or general operating expenses and eliminations and adjustments, which are necessary for purposes of reconciling to the Consolidated Financial Statements.
| For the Year Ended December 31, 2011 | ||||||||||||||||||||
|
Community
Banking |
Wealth
Management |
Insurance | Eliminations | Consolidated | ||||||||||||||||
| (in thousands) | ||||||||||||||||||||
|
Interest income |
$ | 164,738 | $ | 307 | $ | 1 | $ | 33 | $ | 165,079 | ||||||||||
|
Interest expense |
27,692 | — | 291 | (250 | ) | 27,733 | ||||||||||||||
|
Net interest income (expense) |
137,046 | 307 | (290 | ) | 283 | 137,346 | ||||||||||||||
|
Provision for loan losses |
15,609 | — | — | — | 15,609 | |||||||||||||||
|
Noninterest income |
30,195 | 8,328 | 5,236 | 298 | 44,057 | |||||||||||||||
|
Noninterest expense |
81,180 | 7,302 | 5,199 | 4,236 | 97,917 | |||||||||||||||
|
Depreciation expense |
4,165 | 32 | 57 | — | 4,254 | |||||||||||||||
|
Intangible amortization |
1,619 | 66 | 52 | — | 1,737 | |||||||||||||||
|
Income tax expense (benefit) |
17,911 | 493 | (127 | ) | (3,655 | ) | 14,622 | |||||||||||||
|
Net Income (Loss) |
$ | 46,757 | $ | 742 | $ | (235 | ) | $ | — | $ | 47,264 | |||||||||
| For the Year Ended December 31, 2010 | ||||||||||||||||||||
|
Community
Banking |
Wealth
Management |
Insurance | Eliminations | Consolidated | ||||||||||||||||
| (in thousands) | ||||||||||||||||||||
|
Interest income |
$ | 180,319 | $ | 471 | $ | 2 | $ | (373 | ) | $ | 180,419 | |||||||||
|
Interest expense |
34,692 | — | 293 | (412 | ) | 34,573 | ||||||||||||||
|
Net interest income (expense) |
145,627 | 471 | (291 | ) | 39 | 145,846 | ||||||||||||||
|
Provision for loan losses |
29,511 | — | — | — | 29,511 | |||||||||||||||
|
Noninterest income |
32,959 | 7,950 | 4,968 | 1,333 | 47,210 | |||||||||||||||
|
Noninterest expense |
82,872 | 7,525 | 4,850 | 4,181 | 99,428 | |||||||||||||||
|
Depreciation expense |
4,163 | 34 | 62 | — | 4,259 | |||||||||||||||
|
Intangible amortization |
1,815 | 75 | 56 | — | 1,946 | |||||||||||||||
|
Income tax expense (benefit) |
17,019 | 324 | (102 | ) | (2,809 | ) | 14,432 | |||||||||||||
|
Net Income (Loss) |
$ | 43,206 | $ | 463 | $ | (189 | ) | $ | — | $ | 43,480 | |||||||||
| For the Year Ended December 31, 2009 | ||||||||||||||||||||
|
Community
Banking |
Wealth
Management |
Insurance | Eliminations | Consolidated | ||||||||||||||||
| (in thousands) | ||||||||||||||||||||
|
Interest income |
$ | 194,978 | $ | 530 | $ | 1 | $ | (422 | ) | $ | 195,087 | |||||||||
|
Interest expense |
49,283 | — | 291 | (469 | ) | 49,105 | ||||||||||||||
|
Net interest income (expense) |
145,695 | 530 | (290 | ) | 47 | 145,982 | ||||||||||||||
|
Provision for loan losses |
72,354 | — | — | — | 72,354 | |||||||||||||||
|
Noninterest income |
25,905 | 7,557 | 4,580 | 538 | 38,580 | |||||||||||||||
|
Noninterest expense |
86,638 | 6,378 | 4,700 | 3,806 | 101,522 | |||||||||||||||
|
Depreciation expense |
4,199 | 37 | 60 | — | 4,296 | |||||||||||||||
|
Intangible amortization |
2,162 | 84 | 62 | — | 2,308 | |||||||||||||||
|
Income tax (benefit) expense |
(1,076 | ) | 615 | (187 | ) | (3,221 | ) | (3,869 | ) | |||||||||||
|
Net Income (Loss) |
$ | 7,323 | $ | 973 | $ | (345 | ) | $ | — | $ | 7,951 | |||||||||
PAGE 122
Table of Contents
The following table presents selected financial data for the most recent eight quarters:
(unaudited)
| 2011 | 2010 | |||||||||||||||||||||||||||||||
|
Fourth
Quarter |
Third
Quarter |
Second
Quarter |
First
Quarter |
Fourth
Quarter |
Third
Quarter |
Second
Quarter |
First
Quarter |
|||||||||||||||||||||||||
| (in thousands, except per share data) | ||||||||||||||||||||||||||||||||
|
SUMMARY OF OPERATIONS |
|
|||||||||||||||||||||||||||||||
|
Interest income |
$ | 40,259 | $ | 40,845 | $ | 41,783 | $ | 42,192 | $ | 44,210 | $ | 45,325 | $ | 45,561 | $ | 45,324 | ||||||||||||||||
|
Interest expense |
6,192 | 6,976 | 7,245 | 7,320 | 7,876 | 8,352 | 8,936 | 9,410 | ||||||||||||||||||||||||
|
Provision for loan losses |
2,337 | 1,535 | 1,097 | 10,640 | 7,676 | 8,278 | 9,127 | 4,430 | ||||||||||||||||||||||||
|
Net interest income after provision for loan losses |
31,730 | 32,334 | 33,441 | 24,232 | 28,658 | 28,695 | 27,498 | 31,484 | ||||||||||||||||||||||||
|
Security gains (losses), net |
— | (81 | ) | (56 | ) | 13 | 11 | 6 | 103 | 153 | ||||||||||||||||||||||
|
Noninterest income |
11,574 | 10,424 | 11,170 | 11,013 | 11,991 | 12,329 | 11,426 | 11,190 | ||||||||||||||||||||||||
|
Noninterest expense |
26,672 | 24,193 | 25,594 | 27,449 | 27,018 | 24,948 | 25,735 | 27,930 | ||||||||||||||||||||||||
|
Income before taxes |
16,632 | 18,484 | 18,961 | 7,809 | 13,642 | 16,082 | 13,292 | 14,897 | ||||||||||||||||||||||||
|
Provision for income taxes |
4,376 | 4,681 | 4,051 | 1,514 | 3,352 | 3,600 | 3,888 | 3,593 | ||||||||||||||||||||||||
|
Net income |
12,256 | 13,803 | 14,910 | 6,295 | 10,290 | 12,482 | 9,404 | 11,304 | ||||||||||||||||||||||||
|
Preferred stock dividends and discount amortization |
2,939 | 1,559 | 1,558 | 1,555 | 1,553 | 1,551 | 1,549 | 1,547 | ||||||||||||||||||||||||
|
Net Income Available to Common Shareholders |
$ | 9,317 | $ | 12,244 | $ | 13,352 | $ | 4,740 | $ | 8,737 | $ | 10,931 | $ | 7,855 | $ | 9,757 | ||||||||||||||||
|
Per Share Data |
||||||||||||||||||||||||||||||||
|
Common earnings per share — diluted |
$ | 0.33 | $ | 0.44 | $ | 0.48 | $ | 0.17 | $ | 0.31 | $ | 0.39 | $ | 0.28 | $ | 0.35 | ||||||||||||||||
|
Dividends declared per common share |
0.15 | 0.15 | 0.15 | 0.15 | 0.15 | 0.15 | 0.15 | 0.15 | ||||||||||||||||||||||||
|
Common book value |
17.44 | 17.68 | 17.31 | 16.90 | 16.91 | 16.83 | 16.55 | 16.39 | ||||||||||||||||||||||||
On December 7, 2011 we redeemed all of the $108.7 million, or 108,676 shares, of Series A Preferred Stock issued on January 16, 2009 in conjunction with our participation in the CPP. Upon redemption, a one-time non-cash reduction to net income available to common shareholders of $1.8 million, or $0.06 per common share, was recorded for the remaining unamortized discount of the preferred stock.
PAGE 123
Table of Contents
REPORT OF INDEPENDENT REGISTERED PUBLIC ACCOUNTING FIRM
The Board of Directors and Shareholders
S&T Bancorp, Inc. and subsidiaries:
We have audited S&T Bancorp, Inc. and subsidiaries (the Company) internal control over financial reporting as of December 31, 2011, based on criteria established in Internal Control—Integrated Framework issued by the Committee of Sponsoring Organizations of the Treadway Commission (COSO). The Company’s management is responsible for maintaining effective internal control over financial reporting and for its assessment of the effectiveness of internal control over financial reporting, included in the accompanying Management’s Report on Internal Control Over Financial Reporting. Our responsibility is to express an opinion on the Company’s internal control over financial reporting based on our audit.
We conducted our audit in accordance with the standards of the Public Company Accounting Oversight Board (United States). Those standards require that we plan and perform the audit to obtain reasonable assurance about whether effective internal control over financial reporting was maintained in all material respects. Our audit included obtaining an understanding of internal control over financial reporting, assessing the risk that a material weakness exists, and testing and evaluating the design and operating effectiveness of internal control based on the assessed risk. Our audit also included performing such other procedures as we considered necessary in the circumstances. We believe that our audit provides a reasonable basis for our opinion.
A company’s internal control over financial reporting is a process designed to provide reasonable assurance regarding the reliability of financial reporting and the preparation of financial statements for external purposes in accordance with generally accepted accounting principles. A company’s internal control over financial reporting includes those policies and procedures that (1) pertain to the maintenance of records that, in reasonable detail, accurately and fairly reflect the transactions and dispositions of the assets of the company; (2) provide reasonable assurance that transactions are recorded as necessary to permit preparation of financial statements in accordance with generally accepted accounting principles, and that receipts and expenditures of the company are being made only in accordance with authorizations of management and directors of the company; and (3) provide reasonable assurance regarding prevention or timely detection of unauthorized acquisition, use, or disposition of the company’s assets that could have a material effect on the financial statements.
Because of its inherent limitations, internal control over financial reporting may not prevent or detect misstatements. Also, projections of any evaluation of effectiveness to future periods are subject to the risk that controls may become inadequate because of changes in conditions, or that the degree of compliance with the policies or procedures may deteriorate.
In our opinion, the Company maintained, in all material respects, effective internal control over financial reporting as of December 31, 2011, based on criteria established in Internal Control—Integrated Framework issued by the Committee of Sponsoring Organizations of the Treadway Commission.
We also have audited, in accordance with the standards of the Public Company Accounting Oversight Board (United States), the consolidated balance sheets of the Company as of December 31, 2011 and 2010, and the related consolidated statements of income, changes in shareholders’ equity and cash flows for each of the years in the three-year period ended December 31, 2011, and our report dated February 28, 2012 expressed an unqualified opinion on those consolidated financial statements.
/s/ KPMG LLP
Pittsburgh, Pennsylvania
February 28, 2012
PAGE 124
Table of Contents
REPORT OF INDEPENDENT REGISTERED PUBLIC ACCOUNTING FIRM
The Board of Directors and Shareholders
S&T Bancorp, Inc. and subsidiaries:
We have audited the accompanying consolidated balance sheets of S&T Bancorp, Inc. and subsidiaries (the Company) as of December 31, 2011 and 2010, and the related consolidated statements of income, changes in shareholders’ equity and cash flows for each of the years in the three-year period ended December 31, 2011. These consolidated financial statements are the responsibility of the Company’s management. Our responsibility is to express an opinion on these consolidated financial statements based on our audits.
We conducted our audits in accordance with the standards of the Public Company Accounting Oversight Board (United States). Those standards require that we plan and perform the audit to obtain reasonable assurance about whether the financial statements are free of material misstatement. An audit includes examining, on a test basis, evidence supporting the amounts and disclosures in the financial statements. An audit also includes assessing the accounting principles used and significant estimates made by management, as well as evaluating the overall financial statement presentation. We believe that our audits provide a reasonable basis for our opinion.
In our opinion, the consolidated financial statements referred to above present fairly, in all material respects, the financial position of S&T Bancorp, Inc. and subsidiaries as of December 31, 2011 and 2010, and the results of its operations and its cash flows for each of the years in the three-year period ended December 31, 2011, in conformity with U.S. generally accepted accounting principles.
We also have audited, in accordance with the standards of the Public Company Accounting Oversight Board (United States), the Company’s internal control over financial reporting as of December 31, 2011, based on criteria established in Internal Control—Integrated Framework issued by the Committee of Sponsoring Organizations of the Treadway Commission (COSO), and our report dated February 28, 2012 expressed an unqualified opinion on the effectiveness of the Company’s internal control over financial reporting.
/s/ KPMG LLP
Pittsburgh, Pennsylvania
February 28, 2012
PAGE 125
Table of Contents
None
a) Evaluation of Disclosure Controls and Procedures
Under the supervision and with the participation of S&T’s Chief Executive Officer, or CEO, and Chief Financial Officer, or CFO, (its principal executive officer and principal financial officer, respectively) management has evaluated the effectiveness of the design and operation of S&T’s disclosure controls and procedures as of December 31, 2011. In designing and evaluating the disclosure controls and procedures, management recognizes that any controls and procedures, no matter how well designed and operated, can provide only reasonable assurance of achieving the desired control objectives.
We maintain disclosure controls and procedures that are designed to ensure that information required to be disclosed by us in the reports that we file or submit under the Securities Exchange Act of 1934, as amended, is recorded, processed, summarized and reported within the time periods required by the Securities and Exchange Commission, or the SEC, and that such information is accumulated and communicated to the Company’s management, including our CEO and CFO as appropriate, to allow timely decisions regarding required disclosure.
Based on and as of the date of such evaluation, our CEO and CFO concluded that the design and operation of our disclosure controls and procedures were effective in all material respects, as of the end of the period covered by this report.
b) Management’s Report on Internal Control over Financial Reporting
Our management is responsible for establishing and maintaining adequate internal control over financial reporting, as such term is defined in Exchange Act Rule 13a-15(f). Management assessed the corporation’s system of internal control over financial reporting as of December 31, 2011, in relation to criteria for effective internal control over financial reporting as described in “Internal Control—Integrated Framework,” issued by the Committee of Sponsoring Organizations of the Treadway Commission. Based on this assessment, management concludes that, as of December 31, 2011, its system of internal control over financial reporting is effective and meets the criteria of the “Internal Control—Integrated Framework.”
KPMG LLP, independent registered public accounting firm, has issued a report on the effectiveness of S&T’s internal control over financial reporting as of December 31, 2011, which is included herein.
c) Changes in Internal Control Over Financial Reporting
No changes were made to S&T’s internal control over financial reporting (as defined in Rule 13a-15(f) under the Exchange Act) during the last fiscal quarter that materially affected, or are reasonably likely to materially affect, S&T’s internal control over financial reporting.
Not applicable
PAGE 126
Table of Contents
The information required by Item 10 of Form 10-K is incorporated herein from the sections entitled “Section 16(a) Beneficial Ownership Reporting Compliance”, “Election of Directors”, “Executive Officers of the Registrant” and “Corporate Governance and Board and Committee Meetings” in our proxy statement relating to our April 23, 2012 annual meeting of shareholders.
This information required by Item 11 of Form 10-K is incorporated herein from the sections entitled “Compensation Discussion and Analysis;” “Executive Compensation;” “Director Compensation;” “Compensation Committee Interlocks and Insider Participation”; and “Compensation Committee Report” in our proxy statement relating to our April 23, 2012 annual meeting of shareholders.
Except as set forth below, the information required by Item 12 of Form 10-K is incorporated from the sections entitled “Principal Beneficial Owners of S&T Common Stock” and “Beneficial Ownership of S&T Common Stock by Directors and Officers” in our proxy statement relating to our April 23, 2012 annual meeting of shareholders.
EQUITY COMPENSATION PLAN INFORMATION UPDATE
The following table provides information as of December 31, 2011 related to the equity compensation plans in effect at that time.
| (a) | (b) | (c) | ||||||||||
| Plan category |
Number of securities to
be issued upon exercise of outstanding options, warrants and rights |
Weighted average
exercise price of outstanding options, warrants and rights |
Number of securities
reflected in column (a)) |
|||||||||
|
Equity compensation plan approved by shareholders (1) |
757,050 | $ | 34.33 | 392,386 | ||||||||
|
Equity compensation plans not approved by shareholders |
— | — | — | |||||||||
|
Total |
757,050 | $ | 34.33 | 392,386 | ||||||||
| (1) |
Awards granted under the S&T Bancorp, Inc. Amended and Restated 1992 Incentive Stock Plan and the 2003 Incentive Stock Plan. The 1992 Plan expired in 2002 and no further awards may be granted thereunder. |
The information required by Item 13 of Form 10-K is incorporated herein from the sections entitled “Related Person Transactions” and “Director Independence” in our proxy statement relating to our April 23, 2012 annual meeting of shareholders.
PAGE 127
Table of Contents
The information required by Item 14 of Form 10-K is incorporated herein from the section entitled “Independent Registered Public Accounting Firm” in our proxy statement relating to our April 23, 2012 annual meeting of shareholders.
PAGE 128
Table of Contents
| (a) | The following documents are filed as part of this report. |
Consolidated Financial Statements: The following consolidated financial statements are included in Part II, Item 8 of this report. No financial statement schedules are being filed since the required information is inapplicable or is presented in the Consolidated Financial Statements or related notes.
|
Consolidated Balance Sheets |
65 | |||
|
Consolidated Statements of Income |
66 | |||
|
Consolidated Statements of Changes in Shareholders’ Equity |
67 | |||
|
Consolidated Statements of Cash Flows |
68 | |||
|
Notes to Consolidated Financial Statements |
69 | |||
| Report of KPMG LLP, Independent Registered Public Accounting Firm on Effectiveness of Internal Control Over Financial Reporting | 124 | |||
| Report of KPMG LLP, Independent Registered Public Accounting Firm on Consolidated Financial Statements | 125 | |||
PAGE 129
Table of Contents
|
(b) Exhibits |
||||
| 2.1 | Agreement and Plan of Merger, dated as of September 14, 2011, between S&T Bancorp, Inc. and Mainline Bancorp, Inc. Filed as Exhibit 2.1 to S&T Bancorp, Inc. Current Report on Form 8-K filed on September 16, 2011 and incorporated herein by reference. | |||
| 2.2 | Amendment No. 1 to the Agreement and Plan of Merger, dated as of January 27, 2012, between S&T Bancorp, Inc. and Mainline Bancorp, Inc., dated September 14, 2011. Filed as Exhibit A to Form S-4 Registration Statement (No. 333-178424) dated January 30, 2012 and incorporated herein by reference. | |||
| 3.1 | Articles of Incorporation of S&T Bancorp, Inc. Filed as Exhibit B to Registration Statement (No. 2-83565) on Form S-4 of S&T Bancorp, Inc., dated May 5, 1983, and incorporated herein by reference. | |||
| 3.2 | Amendment to Articles of Incorporation of S&T Bancorp, Inc. Filed as Exhibit 3.2 to Form S-4 Registration Statement (No. 33-02600) dated January 15, 1986, and incorporated herein by reference. | |||
| 3.3 | Amendment to Articles of Incorporation of S&T Bancorp, Inc. effective May 8, 1989, incorporated herein by reference. Filed as exhibit 3.3 to S&T Bancorp, Inc. Annual Report on Form 10-K for year ending December 31, 1998 and incorporated herein by reference. | |||
| 3.4 | Amendment to Articles of Incorporation of S&T Bancorp, Inc. effective July 21, 1995. Filed as exhibit 3.4 to S&T Bancorp, Inc. Annual Report on Form 10-K for year ending December 31, 1998 and incorporated here by reference. | |||
| 3.5 | Amendment to Articles of Incorporation of S&T Bancorp, Inc. effective June 18, 1998. Filed as exhibit 3.5 to S&T Bancorp, Inc. Annual Report on Form 10-K for year ending December 31, 1998 and incorporated herein by reference. | |||
| 3.6 | Amendment to Articles of Incorporation of S&T Bancorp, Inc. effective April 21, 2008. Filed as Exhibit 3.1 to S&T Bancorp, Inc. Quarterly Report on Form 10-Q filed on August 7, 2008 and incorporated herein by reference. | |||
| 3.7 | Certificate of Designations for the Series A Preferred Stock. Filed as Exhibit 3.1 to S&T Bancorp, Inc. Current Report on Form 8-K filed on January 15, 2009 and incorporated herein by reference. | |||
| 3.8 | By-laws of S&T Bancorp, Inc., as amended, April 21, 2008. Filed as Exhibit 3.2 to S&T Bancorp, Inc. Quarterly Report on Form 10-Q filed on August 7, 2008 and incorporated herein by reference. | |||
| 10.1 | S&T Bancorp, Inc. Amended and Restated 1992 Incentive Stock Plan. Filed as Exhibit 4.2 to Form S-8 Registration Statement (No. 333-48549) dated March 24, 1998 and incorporated herein by reference.* | |||
| 10.2 | S&T Bancorp, Inc. 2003 Incentive Stock Plan. Filed as Exhibit 4.2 to Form S-8 Registration Statement (No. 333-111557) dated December 24, 2003 and incorporated herein by reference.* | |||
| 10.3 | Agreement and Plan of Merger, dated as of December 16, 2007, between S&T Bancorp, Inc. and IBT Bancorp, Inc. Filed as exhibit 2.1 to S&T Bancorp, Inc. Current Report on Form 8-K filed on December 17, 2007 and incorporated herein by reference. | |||
PAGE 130
Table of Contents
|
(b) Exhibits |
||||
| 10.4 | S&T Bancorp, Inc. Thrift Plan for Employees of S&T Bank, as amended and restated. Filed as Exhibit 4.2 to Form S-8 Registration Statement (No. 333-156541) dated December 31, 2008 and incorporated herein by reference.* | |||
| 10.5 | Dividend Reinvestment and Stock Purchase Plan of S&T Bancorp, Inc. Filed as Exhibit 4.2 to Form S-3 Registration Statement (No. 333-156555) dated January 2, 2009 and incorporated herein by reference. Filed as Exhibit 4.2 to S&T Bancorp, Inc. on Form S-8 filed on January 2, 2009 and incorporated herein by reference.* | |||
| 10.6 | Severance Agreement, by and between Todd D. Brice and S&T Bancorp, Inc., dated December 31, 2008. Filed as Exhibit 10.1 to S&T Bancorp, Inc. Current Report on Form 8-K filed on January 2, 2009 and incorporated herein by reference.* | |||
| 10.7 |
Severance Agreement, by and between Edward C. Hauck and S&T Bancorp, Inc., dated December 31, 2008. Filed as Exhibit 10.3 to S&T Bancorp, Inc. Current Report on Form 8-K filed on January 2, 2009 and incorporated herein by reference.* |
|||
| 10.8 | Severance Agreement, by and between David G. Antolik and S&T Bancorp, Inc. dated December 31, 2008. Filed as Exhibit 10.4 to S&T Bancorp, Inc. Current Report on Form 8-K filed on January 2, 2009 and incorporated herein by reference.* | |||
| 10.9 | Severance Agreement, by and between Gregor T. Young IV and S&T Bancorp, Inc. dated December 31, 2008. Filed as Exhibit 10.5 to S&T Bancorp, Inc. Current Report on Form 8-K filed on January 2, 2009 and incorporated herein by reference.* | |||
| 10.10 | Severance Agreement, by and between Mark Kochvar and S&T Bancorp, Inc. dated as of January 1, 2009. Filed as Exhibit 10.1 to S&T Bancorp, Inc. Current Report on Form 8-K filed on February 26, 2010 and incorporated herein by reference.* | |||
| 21 | Subsidiaries of the Registrant. | |||
| 23 | Consent of KPMG LLP, Independent Registered Public Accounting Firm. | |||
| 24 | Power of Attorney. | |||
| 31.1 | Rule 13a-14(a) Certification of the Chief Executive Officer. | |||
| 31.2 | Rule 13a-14(a) Certification of the Principal Financial Officer. | |||
| 32 | Rule 13a-14(b) Certification of the Chief Executive Officer and Principal Financial Officer. | |||
| 99.1 | Certification of Chief Executive Officer Pursuant to 31 C.F.R. 30.15. | |||
| 99.2 | Certification of Principal Financial Officer Pursuant to 31 C.F.R. 30.15. | |||
| 101** | The following financial information from the Registrant’s Annual Report on Form 10-K for the year ended December 31, 2011 is formatted in eXtensible Business Reporting Language (XBRL): (i) Consolidated Balance Sheets, (ii) Consolidated Statements of Income, (iii) Consolidated Statements of Changes in Shareholders’ Equity and (iv) Consolidated Statements of Cash Flows and (iv) Notes to Consolidated Financial Statements (tagged as blocks of text). | |||
| * | Management Contract or Compensatory Plan or Arrangement |
| ** | This exhibit is furnished and will not be deemed “filed” for purposes of Section 18 of the Securities Exchange Act of 1934 (15 U.S.C.. 78r), or otherwise subject to the liability of that section. Such exhibit will not be deemed to be incorporated by reference into any filing under the Securities Act or of Securities Exchange Act, except to the extent that the Registrant specifically incorporates it by reference. |
PAGE 131
Table of Contents
Pursuant to the requirements of Section 13 or 15(d) of the Securities Exchange Act of 1934, the registrant has duly caused this report to be signed on its behalf by the undersigned, thereunto duly authorized.
|
S&T BANCORP, INC. (Registrant) |
||
|
|
02/28/12 | |
|
Todd D. Brice President and Chief Executive Officer (Principal Executive Officer) |
Date | |
|
|
02/28/12 | |
|
Mark Kochvar Senior Executive Vice President, Chief Financial Officer (Principal Financial Officer) |
Date | |


Pursuant to the requirements of the Securities Exchange Act of 1934, this report has been signed below by the following persons on behalf of the registrant and in the capacities and on the dates indicated.
| SIGNATURE | TITLE | DATE | ||
|
Todd D. Brice |
President and Chief Executive Officer (Principal Executive Officer) | 02/28/12 | ||
|
Mark Kochvar |
Senior Executive Vice President and Chief Financial Officer (Principal Financial Officer) | 02/28/12 | ||
|
/s/ Melanie Hubler Melanie Hubler |
Senior Vice President, Controller |
02/28/12 | ||
|
* Todd D. Brice |
Chief Executive Officer and Director (Principal Executive Officer) | 02/28/12 | ||
|
* John N. Brenzia |
Director | 02/28/12 | ||
|
John J. Delaney |
Director |
02/28/12 | ||
|
* Michael J. Donnelly |
Director | 02/28/12 | ||
PAGE 132
Table of Contents
| SIGNATURE | TITLE | DATE | ||
|
* William J. Gatti |
Director | 02/28/12 | ||
|
* Jeffrey D. Grube |
Director | 02/28/12 | ||
|
Frank W. Jones |
Director | 02/28/12 | ||
|
Joseph A. Kirk |
Director | 02/28/12 | ||
|
* David L. Krieger |
Director | 02/28/12 | ||
|
* James C. Miller |
Chairman of the Board and Director | 02/28/12 | ||
|
* Alan Papernick |
Director | 02/28/12 | ||
|
Robert Rebich, Jr. |
Director | 02/28/12 | ||
|
* Charles A. Spadafora |
Director | 02/28/12 | ||
|
Christine J. Toretti |
Director | 02/28/12 | ||
|
* Charles G. Urtin |
Director | 02/28/12 | ||
|
*By: /s/ James V. Milano James V. Milano Attorney-in-fact |
Director | 02/28/12 | ||
PAGE 133