UNITED STATES
SECURITIES AND EXCHANGE COMMISSION
Washington, D.C. 20549
FORM 20-F
|
o
|
REGISTRATION STATEMENT PURSUANT TO SECTIONS 12(b) OR 12(g) OF THE SECURITIES EXCHANGE ACT OF 1934
|
OR
|
x
|
ANNUAL REPORT PURSUANT TO SECTION 13 OR 15(d) OF THE SECURITIES EXCHANGE ACT OF 1934
|
For the Fiscal Year Ended December 31, 2015
OR
|
o
|
TRANSITION REPORT PURSUANT TO SECTION 13 OR 15(d) OF THE SECURITIES EXCHANGE ACT OF 1934
|
OR
|
o
|
SHELL COMPANY REPORT PURSUANT TO SECTION 13 OR 15(d) OF THE SECURITIES EXCHANGE ACT OF 1934
|
Commission File Number 001-36085
Fiat Chrysler Automobiles N.V.
(Exact Name of Registrant as Specified in Its Charter)
|
The Netherlands
|
|
(Jurisdiction of Incorporation or Organization)
|
25 St. James's Street
London SW1A 1HA
United Kingdom
Tel. No.: +44 (0) 20 7766 0311
(Address, Including Zip Code, and Telephone Number, Including Area Code, of Registrant’s Principal Executive Offices)
Richard K. Palmer
25 St. James's Street
London SW1A 1HA
United Kingdom
Tel. No.: +44 (0) 20 7766 0311
(Name, Address, Including Zip Code, and Telephone Number, Including Area Code, of Company Contact Person)
Securities registered pursuant to Section 12(b) of the Act:
|
Title of Each Class
|
Name of Each Exchange on which Registered
|
|
|
Common Shares, par value €0.01
|
New York Stock Exchange
|
|
|
Mandatory Convertible Securities due 2016
|
New York Stock Exchange
|
|
Securities registered pursuant to Section 12(g) of the Act: None
Securities for which there is a reporting obligation pursuant to Section 15(d) of the Act: None
Indicate the number of outstanding shares of each of the issuer’s classes of capital or common stock as of the close of the period covered by the annual report: 1,288,956,011 common shares, par value €0.01 per share, and 408,941,767 special voting shares, par value €0.01 per share.
Indicate by check mark if the registrant is a well-known seasoned issuer, as defined in Rule 405 of the Securities Act. Yes
þ
No
o
If this report is an annual or transition report, indicate by check mark if the registrant is not required to file reports pursuant to Section 13 or 15(d) of the Securities Act of 1934. Yes
o
No
þ
Indicate by check mark whether the registrant: (1) has filed all reports required to be filed by Section 13 or 15(d) of the Securities Exchange Act of 1934 during the preceding 12 months (or for such shorter period that the registrant was required to file such reports), and (2) has been subject to such filing requirements for the past 90 days. Yes
þ
No
o
Indicate by check mark whether the registrant has submitted electronically and posted on its corporate Web site, if any, every Interactive Data File required to be submitted and posted pursuant to Rule 405 of Regulation S-T (§232.405 of this chapter) during the preceding 12 months (or for such shorter period that the registrant was required to submit and post such files). N/A
Indicate by check mark whether the registrant is a large accelerated filer, an accelerated filer, or a non-accelerated filer. See definition of “accelerated filer and large accelerated filer” in Rule 12b-2 of the Exchange Act. (Check one):
|
Large accelerated filer
þ
|
Accelerated filer
o
|
Non-accelerated filer
o
|
||
Indicate by check mark which basis of accounting the registrant has used to prepare the financial statements included in this filing:
U.S. GAAP
o
International Financial Reporting Standards as issued by the International Accounting Standards Board
þ
Other
o
If “Other” has been checked in response to the previous question indicate by check mark which financial statement item the registrant has elected to follow: Item 17
o
or Item 18
o
.
If this is an annual report, indicate by check mark whether the registrant is a shell company (as defined in Rule 12b-2 of the Exchange Act).
Yes
o
No
þ
(APPLICABLE ONLY TO ISSUERS INVOLVED IN BANKRUPTCY PROCEEDINGS DURING THE PAST FIVE YEARS)
Indicate by check mark whether the registrant has filed all documents and reports required to be filed by Sections 12, 13 or 15(d) of the Securities Exchange Act of 1934 subsequent to the distribution of securities under a plan confirmed by a court. Yes
o
No
o
TABLE OF CONTENTS
|
Page
|
||
|
Item 1.
|
||
|
Item 2.
|
||
|
Item 3.
|
||
|
A.
|
||
|
B.
|
||
|
C.
|
||
|
D.
|
||
|
Item 4.
|
||
|
A.
|
||
|
B.
|
||
|
C.
|
||
|
D.
|
||
|
Item 4A.
|
||
|
Item 5.
|
||
|
A.
|
||
|
B.
|
||
|
C.
|
||
|
D.
|
||
|
E.
|
||
|
F.
|
||
|
G.
|
||
|
Item 6.
|
||
|
A.
|
||
|
B.
|
||
|
C.
|
||
|
D.
|
||
|
E.
|
||
|
Item 7.
|
||
|
A.
|
||
|
B.
|
||
|
C.
|
||
i
|
Page
|
||
|
Item 8.
|
||
|
A.
|
||
|
B.
|
||
|
Item 9.
|
||
|
A.
|
||
|
B.
|
||
|
C.
|
||
|
D.
|
||
|
E.
|
||
|
F.
|
||
|
Item 10.
|
||
|
A.
|
||
|
B.
|
||
|
C.
|
||
|
D.
|
||
|
E.
|
||
|
F.
|
||
|
G.
|
||
|
H.
|
||
|
I.
|
||
|
Item 11.
|
||
|
Item 12.
|
||
|
A.
|
||
|
B.
|
||
|
C.
|
||
|
D.
|
||
|
Item 13.
|
||
|
Item 14.
|
||
|
Item 15.
|
||
|
Item 16A.
|
||
|
Item 16B.
|
||
|
Item 16C.
|
||
|
Item 16D.
|
||
|
Item 16E.
|
||
|
Item 16F.
|
||
|
Item 16G.
|
||
|
Item 16H.
|
||
|
Item 17.
|
||
|
Item 18.
|
||
|
Item 19.
|
||
ii
Certain Defined Terms
In this report, unless otherwise specified, the terms “we,” “our,” “us,” the “Group,” “Fiat Group,” the “Company” and “FCA” refer to Fiat Chrysler Automobiles N.V., together with its subsidiaries and its predecessor prior to the completion of the merger of Fiat S.p.A. with and into Fiat Investments N.V. on October 12, 2014 (at which time Fiat Investments N.V. was renamed Fiat Chrysler Automobiles N.V. , or FCA NV), the “Merger” or any one or more of them, as the context may require. References to “Fiat” refer solely to Fiat S.p.A., the predecessor of FCA NV prior to the Merger. References to “FCA US” refers to FCA US LLC, together with its direct and indirect subsidiaries.
See “
Presentation of Financial and Other Data
” below for additional information regarding the financial presentation.
Presentation of Financial and Other Data
This report includes the consolidated financial statements of the Group for the years ended
December 31, 2015
,
2014
and
2013
prepared in accordance with International Financial Reporting Standards (“IFRS”) as issued by the International Accounting Standards Board (“IASB”). We refer to the consolidated financial statements and the notes to the consolidated financial statements collectively as the “Consolidated Financial Statements.”
All references in this report to “Euro” and “€” refer to the currency introduced at the start of the third stage of European Economic and Monetary Union pursuant to the Treaty on the Functioning of the European Union, as amended. The Group’s financial information is presented in Euro except that, in some instances, information in U.S. $ is provided in the Consolidated Financial Statements and information included elsewhere in this report. All references to “U.S. Dollars,” “U.S. Dollar”, “U.S.$” and “$” refer to the currency of the United States of America (or “U.S.”).
The language of the document is English. Certain legislative references and technical terms have been cited in their original language in order that the correct technical meaning may be ascribed to them under applicable law.
Certain totals in the tables included in this report may not add due to rounding.
Forward-Looking Statements
Statements contained in this report, particularly those regarding possible or assumed future performance, competitive strengths, costs, dividends, reserves and growth of FCA, industry growth and other trends and projections and estimated company earnings are “forward-looking statements” that contain risks and uncertainties. In some cases, words such as “may,” “will,” “expect,” “could,” “should,” “intend,” “estimate,” “anticipate,” “believe,” “outlook,” “continue,” “remain,” “on track,” “target,” “objective,” “goal,” “plan” and similar expressions are used to identify forward-looking statements. These forward-looking statements reflect the respective current views of the Group with respect to future events and involve significant risks and uncertainties that could cause actual results to differ materially. These factors include, without limitation:
|
•
|
our ability to reach certain minimum vehicle sales volumes;
|
|
•
|
changes in the general economic environment and changes in demand for automotive products, which is subject to cyclicality, in particular;
|
|
•
|
our ability to expand certain of our brands internationally;
|
|
•
|
various types of claims, lawsuits and other contingent obligations against us, including product liability, warranty and environmental claims and lawsuits;
|
|
•
|
material operating expenditures in relation to compliance with environmental, health and safety regulations;
|
|
•
|
our ability to enrich our product portfolio and offer innovative products;
|
|
•
|
the high level of competition in the automotive industry, which may increase due to consolidation;
|
|
•
|
exposure to shortfalls in the Group’s defined benefit pension plans, particularly those of FCA US;
|
iii
|
•
|
the ability of our dealers and retail customer to obtain adequate access to financing, and associated risks associated with financial services companies;
|
|
•
|
our ability to access funding to execute our business plan and improve our business, financial condition and results of operations;
|
|
•
|
changes in our credit ratings;
|
|
•
|
our ability to realize anticipated benefits from any acquisitions, joint venture arrangements and other strategic alliances;
|
|
•
|
disruptions arising from political, social and economic instability;
|
|
•
|
risks associated with our relationships with employees, dealers and suppliers;
|
|
•
|
increases in costs, disruptions of supply or shortages of raw materials;
|
|
•
|
developments in our labor and industrial relations and developments in applicable labor laws;
|
|
•
|
exchange rate fluctuations, interest rate changes, credit risk and other market risks; and
|
|
•
|
other factors discussed elsewhere in this report.
|
Furthermore, in light of ongoing difficult macroeconomic conditions, both globally and in the industries in which we operate, it is particularly difficult to forecast results, and any estimates or forecasts of particular periods that are provided in this report are uncertain. We expressly disclaim and do not assume any liability in connection with any inaccuracies in any of the forward-looking statements in this report or in connection with any use by any third party of such forward-looking statements. Actual results could differ materially from those anticipated in such forward-looking statements. We do not undertake an obligation to update or revise publicly any forward-looking statements.
Additional factors which could cause actual results and developments to differ from those expressed or implied by the forward-looking statements are included in the section
—Risk Factors
of this report.
iv
Not applicable.
Not Applicable.
A. Selected Financial Data
The following tables set forth selected historical consolidated financial and other data of FCA and has been derived, in part, from:
|
•
|
the Consolidated Financial Statements of FCA for the years ended
December 31, 2015
,
2014
and
2013
, included elsewhere in this report; and
|
|
•
|
the Consolidated Financial Statements of FCA for the year ended December 31, 2012 and the Fiat Group for the year ended December 31, 2011, which are not included in this report.
|
This data should be read in conjunction with “
Presentation of Financial and Other Data
,”
Item 3D. Risk Factors
,
Item 5. Operating and Financial Review
and the Consolidated Financial Statements and related notes included elsewhere in this report.
On May 24, 2011, the Group acquired an additional 16 percent (on a fully-diluted basis) of FCA US, increasing its interest to 46 percent (on a fully-diluted basis). As a result of the potential voting rights associated with options that became exercisable on that date, the Group was deemed to have obtained control of FCA US for purposes of consolidation. The operating activities from this acquisition date through May 31, 2011 were not material to the Group. As such, FCA US was consolidated on a line-by-line basis by FCA with effect from June 1, 2011. Therefore the results of operations and cash flows for the years ended December 31, 2015, 2014, 2013 and 2012 are not directly comparable with those for the year ended December 31, 2011.
The retrospective application of the amendments to IAS 19 revised and IFRS 11, which were adopted by the Group from January 1, 2013, were not applied to the Consolidated Income Statements, Consolidated Statement of Comprehensive Income/(Loss), Consolidated Statement of Cash Flows and Consolidated Statement of Changes in Equity for the year ended December 31, 2011. Accordingly, the Statements for the year ended December 31, 2011 are not directly comparable with those for the years ended December 31, 2015, 2014, 2013, and 2012.
1
|
2015
(1)
|
2014
(1)
|
2013
(1)
|
2012
(1)
|
2011
(1), (4)
|
||||||||||
|
(€ million)
|
||||||||||||||
|
Net revenues
|
110,595
|
|
93,640
|
|
84,530
|
|
81,665
|
|
57,605
|
|
||||
|
EBIT
|
2,625
|
|
2,834
|
|
2,638
|
|
3,099
|
|
2,993
|
|
||||
|
Profit before taxes
|
259
|
|
783
|
|
649
|
|
1,190
|
|
1,631
|
|
||||
|
Profit from continuing operations
|
93
|
|
359
|
|
1,708
|
|
661
|
|
1,203
|
|
||||
|
Profit from discontinued operations
|
284
|
|
273
|
|
243
|
|
235
|
|
195
|
|
||||
|
Net profit
|
377
|
|
632
|
|
1,951
|
|
896
|
|
1,398
|
|
||||
|
Attributable to:
|
||||||||||||||
|
Owners of the parent
|
334
|
|
568
|
|
904
|
|
44
|
|
1,199
|
|
||||
|
Non-controlling interest
|
43
|
|
64
|
|
1,047
|
|
852
|
|
199
|
|
||||
|
Earnings per share from continuing operations (in Euro)
|
||||||||||||||
|
Basic per ordinary share
|
0.055
|
|
0.268
|
|
0.568
|
|
(0.132
|
)
|
0.827
|
|
||||
|
Diluted per ordinary share
|
0.055
|
|
0.265
|
|
0.562
|
|
(0.130
|
)
|
0.821
|
|
||||
|
Basic per preference share
|
—
|
|
—
|
|
—
|
|
—
|
|
0.827
|
|
||||
|
Diluted per preference share
|
—
|
|
—
|
|
—
|
|
—
|
|
0.821
|
|
||||
|
Basic per savings share
|
—
|
|
—
|
|
—
|
|
—
|
|
0.935
|
|
||||
|
Diluted per savings share
|
—
|
|
—
|
|
—
|
|
—
|
|
0.929
|
|
||||
|
Earnings per share from discontinued operations (in Euro)
|
||||||||||||||
|
Basic per ordinary share
|
0.166
|
|
0.197
|
|
0.176
|
|
0.168
|
|
0.135
|
|
||||
|
Diluted per ordinary share
|
0.166
|
|
0.195
|
|
0.174
|
|
0.166
|
|
0.134
|
|
||||
|
Basic per preference share
|
—
|
|
—
|
|
—
|
|
—
|
|
0.135
|
|
||||
|
Diluted per preference share
|
—
|
|
—
|
|
—
|
|
—
|
|
0.134
|
|
||||
|
Basic per savings share
|
—
|
|
—
|
|
—
|
|
—
|
|
0.136
|
|
||||
|
Diluted per savings share
|
—
|
|
—
|
|
—
|
|
—
|
|
0.134
|
|
||||
|
Earnings per share (in Euro) from continuing and discontinued operations
|
|
|
||||||||||||
|
Basic per ordinary share
|
0.221
|
|
0.465
|
|
0.744
|
|
0.036
|
|
0.962
|
|
||||
|
Diluted per ordinary share
|
0.221
|
|
0.460
|
|
0.736
|
|
0.036
|
|
0.955
|
|
||||
|
Basic per preference share
|
—
|
|
—
|
|
—
|
|
—
|
|
0.962
|
|
||||
|
Diluted per preference share
|
—
|
|
—
|
|
—
|
|
—
|
|
0.955
|
|
||||
|
Basic per savings share
|
—
|
|
—
|
|
—
|
|
—
|
|
1.071
|
|
||||
|
Diluted per savings share
|
—
|
|
—
|
|
—
|
|
—
|
|
1.063
|
|
||||
|
Dividends paid per share (in Euro)
(2)
|
||||||||||||||
|
Ordinary share
|
—
|
|
—
|
|
—
|
|
—
|
|
0.090
|
|
||||
|
Preference share
(3)
|
—
|
|
—
|
|
—
|
|
0.217
|
|
0.310
|
|
||||
|
Savings share
(3)
|
—
|
|
—
|
|
—
|
|
0.217
|
|
0.310
|
|
||||
|
Other Statistical Information (unaudited):
|
||||||||||||||
|
Shipments (in thousands of units)
|
4,602
|
|
4,601
|
|
4,345
|
|
4,223
|
|
3,175
|
|
||||
|
Number of employees at period end
|
238,162
|
|
232,165
|
|
229,053
|
|
218,311
|
|
197,021
|
|
||||
_________________________
(1) The operating results of FCA for the years ended December 31, 2014, 2013, 2012 and 2011 have been re-presented following the classification of Ferrari as a discontinued operation for the year ended December 31, 2015; Ferrari operating results were excluded from the Group's continuing operations and are presented as a single line item within the Consolidated Income Statements for each of the years presented.
(2) Dividends paid represent cash payments in the applicable year that generally relates to earnings of the previous year.
(3) In accordance with the resolution adopted by the shareholders’ meeting on April 4, 2012, Fiat’s preference and savings shares were mandatorily converted into ordinary shares.
(4) Numbers from Form F-1 filed with U.S. Securities Exchange Commission (“SEC”) on December 4, 2014.
2
|
At December 31,
|
||||||||||||||
|
2015
(1)
|
2014
|
2013
|
2012
|
2011
(2)
|
||||||||||
|
(€ million)
|
||||||||||||||
|
Cash and cash equivalents
|
20,662
|
|
22,840
|
|
19,455
|
|
17,666
|
|
17,526
|
|
||||
|
Total assets
|
105,040
|
|
100,510
|
|
87,214
|
|
82,633
|
|
80,379
|
|
||||
|
Debt
|
27,786
|
|
33,724
|
|
30,283
|
|
28,303
|
|
27,093
|
|
||||
|
Total equity
|
16,255
|
|
13,738
|
|
12,584
|
|
8,369
|
|
9,711
|
|
||||
|
Equity attributable to owners of the parent
|
16,092
|
|
13,425
|
|
8,326
|
|
6,187
|
|
7,358
|
|
||||
|
Non-controlling interests
|
163
|
|
313
|
|
4,258
|
|
2,182
|
|
2,353
|
|
||||
|
Share capital
|
17
|
|
17
|
|
4,477
|
|
4,476
|
|
4,466
|
|
||||
|
Shares issued (in thousands of shares):
|
||||||||||||||
|
Fiat S.p.A
|
||||||||||||||
|
Ordinary
|
—
|
|
—
|
|
1,250,688
|
|
1,250,403
|
|
1,092,681
|
|
||||
|
Preference
(4)
|
—
|
|
—
|
|
—
|
|
—
|
|
103,292
|
|
||||
|
Savings
(4)
|
—
|
|
—
|
|
—
|
|
—
|
|
79,913
|
|
||||
|
FCA
|
||||||||||||||
|
Common
(3)
|
1,288,956
|
|
1,284,919
|
|
||||||||||
|
Special Voting
|
408,942
|
|
408,942
|
|
||||||||||
_________________________
(1) The assets and liabilities of Ferrari have been classified as Assets held for distribution and Liabilities held for distribution within the Consolidated Statement of Financial Position at December 31, 2015, while the assets and liabilities of Ferrari have not been classified as such within the comparative Consolidated Statement of Financial Position for any of the periods presented.
(2) The amounts at December 31, 2011 include the consolidation of FCA US.
(3) Book value per common share at
December 31, 2015
amounted to €12.48.
(4) In accordance with the resolution adopted by the shareholders’ meeting on April 4, 2012, Fiat’s preference and savings shares were mandatorily converted into ordinary shares.
3
Exchange rates
These exchange rates are included for informational purposes only and may differ from the exchange rates used in preparation of the Consolidated Financial Statements prepared in accordance with IFRS. For a description of the exchange rates used in the preparation of our Consolidated Financial Statements, please refer to the section
—
Significant Accounting Policies
within our Consolidated Financial Statements included elsewhere in this report.
The table below shows the high, low, average and period end noon buying rates in The City of New York for cable transfers in foreign currencies as certified for customs purposes by the Federal Reserve Bank of New York for U.S.$ per €1.00. The average is computed using the noon buying rate on the last business day of each month during the period indicated.
|
Period
|
Low
|
High
|
Average
|
Period End
|
||||||||
|
Year Ended December 31, 2011
|
1.2926
|
|
1.4875
|
|
1.3931
|
|
1.2973
|
|
||||
|
Year Ended December 31, 2012
|
1.2062
|
|
1.3463
|
|
1.2859
|
|
1.3186
|
|
||||
|
Year Ended December 31, 2013
|
1.2774
|
|
1.3816
|
|
1.3281
|
|
1.3779
|
|
||||
|
Year Ended December 31, 2014
|
1.2101
|
|
1.3927
|
|
1.3210
|
|
1.2101
|
|
||||
|
Year Ended December 31, 2015
|
1.0524
|
|
1.2015
|
|
1.1032
|
|
1.0859
|
|
||||
The table below shows the high and low noon buying rates for Euro for each month during the six months prior to the date of this report.
|
Period
|
Low
|
High
|
||||
|
August 2015
|
1.0868
|
|
1.1580
|
|
||
|
September 2015
|
1.1104
|
|
1.1358
|
|
||
|
October 2015
|
1.0963
|
|
1.1437
|
|
||
|
November 2015
|
1.0562
|
|
1.1026
|
|
||
|
December 2015
|
1.0573
|
|
1.1025
|
|
||
|
January 2016
|
1.0743
|
|
1.0964
|
|
||
On February 19, 2016, the noon buying rate for U.S.$ was €1.00 = U.S.$1.1127.
4
Not applicable.
C. Reason for the Offer and Use of Proceeds
Not applicable.
D. Risk Factors
We face a variety of risks in our business. The risks and uncertainties described below are not the only ones facing us. Additional risks and uncertainties that we are unaware of or that we currently believe to be immaterial, may also become important factors that affect us.
Risks Related to Our Business, Strategy and Operations
Our profitability depends on reaching certain minimum vehicle sales volumes. If our vehicle sales deteriorate, particularly sales of our pickup trucks, larger utility vehicles and minivans, our results of operations and financial condition will suffer.
Our success requires us to achieve certain minimum vehicle sales volumes. As is typical for an automotive manufacturer, we have significant fixed costs and, therefore, changes in vehicle sales volume can have a disproportionately large effect on our profitability. For example, assuming constant pricing, mix and cost of sales per vehicle, that all results of operations were attributable to vehicle shipments and that all other variables remain constant, a ten percent decrease in our
2015
vehicle shipments would reduce our Adjusted Earnings Before Interest and Taxes (“Adjusted EBIT”) by approximately 29 percent for
2015
, without considering actions and cost containment measures we may take in response to decreased vehicle sales.
In addition, our profitability in the U.S., Canada, Mexico and Caribbean islands (“NAFTA”), a region which contributed a majority of our profit in 2015, is particularly dependent on demand for our pickup trucks, larger utility vehicles and minivans. A shift in demand away from these vehicles within the NAFTA region, and towards compact and mid-size passenger cars, whether in response to higher fuel prices or other factors, could adversely affect our profitability. Our pickup trucks, larger utility vehicles and minivans accounted for approximately 41 percent of our total U.S. retail vehicle sales in
2015
and the profitability of this portion of our portfolio is approximately 39 percent higher than that of our overall U.S. retail portfolio on a weighted average basis. A shift in demand such that U.S. industry market share for pickup trucks, larger utility vehicles and minivans deteriorated by 10 percentage points, whether in response to higher fuel prices or other factors, holding other variables constant, including overall industry sales and our market share of each vehicle segment, would have reduced the Group’s Adjusted EBIT by approximately 10 percent for
2015
. This estimate does not take into account any other changes in market conditions or actions that the Group may take in response to shifting consumer preferences, including production and pricing changes.
Our dependence within the NAFTA region on pickup trucks, larger utility vehicles and minivans is expected to increase further as we intend to shift production in that region away from compact and mid-size passenger cars. For additional information on factors affecting vehicle profitability, see
Item 5. Operating and Financial Review—Trends, Uncertainties and Opportunities
.
Moreover, we tend to operate with negative working capital as we generally receive payments from vehicle sales to dealers within a few days of shipment, whereas there is a lag between the time when parts and materials are received from suppliers and when we pay for such parts and materials; therefore, if vehicle sales decline we will suffer a significant negative impact on cash flow and liquidity as we continue to pay suppliers during a period in which we receive reduced proceeds from vehicle sales. If vehicle sales decline, or if they were to fall short of our assumptions, due to financial crisis, renewed recessionary conditions, changes in consumer confidence, geopolitical events, inability to produce sufficient quantities of certain vehicles, limited access to financing or other factors, our financial condition and results of operations would be materially adversely affected.
5
Our businesses are affected by global financial markets and general economic and other conditions over which we have little or no control.
Our results of operations and financial position may be influenced by various macroeconomic factors—including changes in gross domestic product, the level of consumer and business confidence, changes in interest rates for or availability of consumer and business credit, fuel prices, the cost of commodities or other raw materials, the rate of unemployment and foreign currency exchange rates—within the various countries in which we operate.
In general, the automotive sector has historically been subject to highly cyclical demand and tends to reflect the overall performance of the economy, often amplifying the effects of economic trends. Given the difficulty in predicting the magnitude and duration of economic cycles, there can be no assurances as to future trends in the demand for products sold by us in any of the markets in which we operate.
In addition to slow economic growth or recession, other economic circumstances—such as increases in energy prices and fluctuations in prices of raw materials or contractions in infrastructure spending—could have negative consequences for the industry in which we operate and, together with the other factors referred to previously, could have a material adverse effect on our financial condition and results of operations.
We may be unsuccessful in efforts to expand the international reach of some of our brands that we believe have global appeal and reach.
The growth strategies reflected in our 2014-2018 Business Plan announced in May 2014 and updated in January 2016 (our
“
Business Plan
”
) require us to make significant investments, including the expansion of several brands that we believe to have global appeal into new markets. Most notably, these strategies include expanding global sales of the Jeep brand through localized production in Asia and Latin America. Additionally, our plans include the launch of new large utility vehicle models in North America, the reintroduction in North America, and expansion in Europe and Asia, of our Alfa Romeo brand, and the further development of our Maserati brand portfolio to include the all-new Levante sport utility vehicle. These strategies require significant investments in our production facilities and distribution networks. If we are unable to introduce vehicles that appeal to consumers in these markets and achieve our brand expansion strategies, we may be unable to earn a sufficient return on these investments and this could have a material adverse effect on our financial condition and results of operations.
Product recalls and warranty obligations may result in direct costs, and any resulting loss of vehicle sales could have material adverse effects on our business.
We, and the U.S. automotive industry in general, have recently experienced a significant increase in recall activity to address performance, compliance or safety-related issues. Our recent costs to recall vehicles have been significant and typically include the cost of replacement parts and labor to remove and replace parts. These costs substantially depend on the nature of the remedy and the number of vehicles affected, and may arise many years after a vehicle's sale. Product recalls may also harm our reputation, force us to halt the sale of certain vehicles and may cause consumers to question the safety or reliability of our products. Given recent increases in both the cost and frequency of recall campaigns and increased regulatory activity across the automotive industry in the U.S. and Canada, ongoing compliance may become even more costly.
Any costs incurred, or lost vehicle sales, resulting from product recalls could materially adversely affect our financial condition and results of operations. Moreover, if we face consumer complaints, or we receive information from vehicle rating services that calls into question the safety or reliability of one of our vehicles and we do not issue a recall, or if we do not do so on a timely basis, our reputation may also be harmed and we may lose future vehicle sales. We are also obligated under the terms of our warranty agreements to make repairs or replace parts in our vehicles at our expense for a specified period of time. Therefore, any failure rate that exceeds our assumptions may result in unanticipated losses.
In addition, compliance with U.S. regulatory requirements for product recalls has received heightened scrutiny recently. In connection with the failure in three specified campaigns to provide an effective remedy, and noncompliance with various reporting requirements under the National Traffic and Motor Vehicle Safety Act of 1966 and the Transportation Recall Enhancement, Accountability and Documentation (TREAD) Act, FCA US has recently agreed to pay substantial civil penalties, become subject to supervision and in certain instances been required to buy back vehicles as an additional alternative to a repair remedy. There can be no assurance that we will not be subject to additional regulatory inquiries and consequences in the future.
6
Our future performance depends on our ability to expand into new markets as well as enrich our product portfolio and offer innovative products in existing markets.
Our success depends, among other things, on our ability to maintain or increase our share in existing markets and/or to expand into new markets through the development of innovative, high-quality products that are attractive to customers and provide adequate profitability.
It generally takes two years or more to design and develop a new vehicle, and a number of factors may lengthen that schedule. Because of this product development cycle and the various elements that may contribute to consumers’ acceptance of new vehicle designs, including competitors’ product introductions, fuel prices, general economic conditions and changes in styling preferences, an initial product concept or design that we believe will be attractive may not result in a vehicle that will generate sales in sufficient quantities and at high enough prices to be profitable. A failure to develop and offer innovative products that compare favorably to those of our principal competitors, in terms of price, quality, functionality and features, with particular regard to the upper-end of the product range, or delays in bringing strategic new models to the market, could impair our strategy, which would have a material adverse effect on our financial condition and results of operations. Additionally, our high proportion of fixed costs, both due to our significant investment in property, plant and equipment as well as the requirements of our collective bargaining agreements, which limit our flexibility to adjust personnel costs to changes in demand for our products, may further exacerbate the risks associated with incorrectly assessing demand for our vehicles.
Further, if we determine that a safety or emissions defect, a mechanical defect or a non-compliance with regulation exists with respect to a vehicle model prior to the retail launch, the launch of such vehicle could be delayed until we remedy the defect or non-compliance. The costs associated with any protracted delay in new model launches necessary to remedy such defect, and the cost of providing a free remedy for such defects or non-compliance in vehicles that have been sold, could be substantial.
The automotive industry is highly competitive and cyclical and we may suffer from those factors more than some of our competitors.
Substantially all of our revenues are generated in the automotive industry, which is highly competitive, encompassing the production and distribution of passenger cars, light commercial vehicles and components and production systems. We face competition from other international passenger car and light commercial vehicle manufacturers and distributors and components suppliers in Europe, North America, Latin America and the Asia Pacific region. These markets are all highly competitive in terms of product quality, innovation, pricing, fuel economy, reliability, safety, customer service and financial services offered, and many of our competitors are better capitalized with larger market shares.
In addition, global vehicle production capacity significantly exceeds current demand and this overcapacity has intensified and may further intensify pricing pressures. Our competitors may respond to these conditions by attempting to make their vehicles more attractive or less expensive to customers by adding vehicle enhancements, providing subsidized financing or leasing programs, or by reducing vehicle prices whether directly or by offering option package discounts, price rebates or other sales incentives in certain markets. In addition, manufacturers in countries that have lower production costs may choose to export lower-cost automobiles to more established markets. These actions have had, and may continue to have, a negative impact on our vehicle pricing, market share, and results of operations.
In the automotive business, sales to end-customers are cyclical and subject to changes in the general condition of the economy, the readiness of end-customers to buy and their ability to obtain financing, as well as the possible introduction of measures by governments to stimulate demand. The automotive industry is also subject to the constant renewal of product offerings through frequent launches of new models. A negative trend in the automotive industry or our inability to adapt effectively to external market conditions coupled with more limited capital than many of our principal competitors could have a material adverse impact on our financial condition and results of operations.
Laws, regulations and governmental policies, including those regarding increased fuel economy requirements and reduced greenhouse gas emissions, may have a significant effect on how we do business and may adversely affect our results of operations.
In order to comply with government regulations related to fuel economy and emissions standards, we must devote significant financial and management resources, as well as vehicle engineering and design attention, to these legal requirements. We expect the number and scope of these regulatory requirements, along with the costs associated with compliance, to increase significantly in the future, and these costs could be difficult to pass through to customers. As a result,
7
we may face limitations on the types of vehicles we produce and sell, and where we can sell them, which could have a material adverse impact on our financial condition and results of operations. For a discussion of these regulations, see
Item 4B. Business Overview—Industry Overview—Environmental and Other Regulatory Matters
.
Government scrutiny has also increased industry-wide, and is expected to remain high, in connection with a recent significant EPA action involving the tailpipe emissions of a competitor's diesel vehicles. As a result, original equipment manufacturers (“OEMs”) will likely experience additional regulation, increased enforcement and a more lengthy regulatory approval process.
In many cases, technological and cost barriers limit the mass-market potential of sustainable natural gas and electric vehicles. In certain other cases, the technologies that we plan to employ are not yet commercially practical and depend on significant future technological advances by us and by suppliers. There can be no assurance that these advances will occur in a timely or feasible manner, that the funds we have budgeted or expended for these purposes will be adequate, or that we will be able to obtain rights to use these technologies. Further, our competitors and others are pursuing similar technologies and other competing technologies, and there can be no assurance that they will not acquire and implement similar or superior technologies sooner than we will or on an exclusive basis or at a significant price advantage.
Our success largely depends on the ability of our current management team to operate and manage effectively.
Our success largely depends on the ability of our senior executives and other members of management to effectively manage the Group and individual areas of the business. In particular, our Chief Executive Officer, Sergio Marchionne, is critical to the execution of our strategic direction and implementation of our Business Plan. Although Mr. Marchionne has indicated his intention to remain as our Chief Executive Officer through the period of our Business Plan, if we were to lose his services or those of any of our other senior executives or key employees it could have a material adverse effect on our business prospects, earnings and financial position. We have developed succession plans that we believe are appropriate in the circumstances, although it is difficult to predict with any certainty that we will replace these individuals with persons of equivalent experience and capabilities. If we are unable to find adequate replacements or to attract, retain and incentivize senior executives, other key employees or new qualified personnel our business, financial condition and results of operations may suffer.
We may be subject to more intensive competition if other manufacturers pursue consolidations.
We have advocated
consolidation in our industry due to our view that the automotive industry is characterized by significant duplication in product development costs, much of which does not drive value as perceived by consumers. We believe that sharing product development costs among manufacturers, preferably through consolidation, will enable automakers to improve their return on capital employed for product development and manufacturing and enhance utilization of tooling, machinery and equipment. While we continue to implement our Business Plan, and we believe that our business will continue to grow and our operating margins will continue to improve, if our competitors are able to successfully integrate with one another and we are not successful with our own efforts to enhance collaboration or adapt effectively to increased competition, our competitors’ integration could have a material adverse impact on our financial condition and results of operations.
We may be exposed to shortfalls in our pension plans.
Certain of our defined benefit pension plans are currently underfunded. As of
December 31, 2015
, our defined benefit pension plans were underfunded by approximately €5.1 billion (€4.9 billion of which relates to FCA US's defined benefit pension plans). Our pension funding obligations may increase significantly if the investment performance of plan assets does not keep pace with benefit payment obligations. Mandatory funding obligations may increase because of lower than anticipated returns on plan assets, whether as a result of overall weak market performance or particular investment decisions, changes in the level of interest rates used to determine required funding levels, changes in the level of benefits provided for by the plans, or any changes in applicable law related to funding requirements. Our defined benefit plans currently hold significant investments in equity and fixed income securities, as well as investments in less liquid instruments such as private equity, real estate and certain hedge funds. Due to the complexity and magnitude of certain investments, additional risks may exist, including significant changes in investment policy, insufficient market capacity to complete a particular investment strategy and an inherent divergence in objectives between the ability to manage risk in the short term and the ability to quickly rebalance illiquid and long-term investments.
To determine the appropriate level of funding and contributions to our defined benefit plans, as well as the investment strategy for the plans, we are required to make various assumptions, including an expected rate of return on plan assets and a
8
discount rate used to measure the obligations under defined benefit pension plans. Interest rate increases generally will result in a decline in the value of investments in fixed income securities and the present value of the obligations. Conversely, interest rate decreases will generally increase the value of investments in fixed income securities and the present value of the obligations. See
Item 5. Operating and Financial Review—Critical Accounting Estimates—Pension Plans.
Any reduction in the discount rate or the value of plan assets, or any increase in the present value of obligations, may increase our pension expenses and required contributions and, as a result, could constrain liquidity and materially adversely affect our financial condition and results of operations. If we fail to make required minimum funding contributions, we could be subject to reportable event disclosure to the U.S. Pension Benefit Guaranty Corporation, as well as interest and excise taxes calculated based upon the amount of any funding deficiency. As a result of our 100 percent indirect ownership of FCA US, we may be subject to certain U.S. legal requirements making us secondarily responsible for a funding shortfall in certain of FCA US's pension plans in the event these pension plans were terminated and FCA US were to become insolvent.
Our lack of a captive finance company in certain key markets could place us at a competitive disadvantage to other automakers that may be able to offer consumers and dealers financing and leasing on better terms than our customers and dealers are able to obtain.
Our dealers enter into wholesale financing arrangements to purchase vehicles from us to hold in inventory and facilitate retail sales, and retail customers use a variety of finance and lease programs to acquire vehicles.
Unlike many of our competitors, we do not own and operate a controlled finance company dedicated solely to our mass-market vehicle operations in the U.S. and certain key markets in Europe. Instead we have elected to partner with specialized financial services providers through joint ventures and commercial agreements. Our lack of a controlled finance company in these key markets may increase the risk that our dealers and retail customers will not have access to sufficient financing on acceptable terms which may adversely affect our vehicle sales in the future. Furthermore, many of our competitors are better able to implement financing programs designed to maximize vehicle sales in a manner that optimizes profitability for them and their finance companies on an aggregate basis. Since our ability to compete depends on access to appropriate sources of financing for dealers and retail customers, our lack of a controlled finance company in those markets could adversely affect our results of operations.
In other markets, we rely on controlled finance companies, joint ventures and commercial relationships with third parties, including third party financial institutions, to provide financing to our dealers and retail customers. The ability of a finance company to provide financing services at competitive rates is subject to various factors, including:
|
•
|
the performance of loans and leases in their portfolio, which could be materially affected by delinquencies, defaults or prepayments;
|
|
•
|
wholesale auction values of used vehicles;
|
|
•
|
higher than expected vehicle return rates and the residual value performance of vehicles they lease; and
|
|
•
|
fluctuations in interest rates and currency exchange rates.
|
Any financial services provider, including our joint ventures and controlled finance companies, will also face other demands on its capital, including the need or desire to satisfy funding requirements for dealers or customers of our competitors as well as liquidity issues relating to other investments. Furthermore, they may be subject to regulatory changes that may increase their costs, which may impair their ability to provide competitive financing products to our dealers and retail customers.
To the extent that a financial services provider is unable or unwilling to provide sufficient financing at competitive rates to our dealers and retail customers, such dealers and retail customers may not have sufficient access to financing to purchase or lease our vehicles. As a result, our vehicle sales and market share may suffer, which would adversely affect our financial condition and results of operations.
Vehicle sales depend heavily on affordable interest rates for vehicle financing.
In certain regions, including NAFTA, financing for new vehicle sales has been available at relatively low interest rates for several years due to, among other things, expansive government monetary policies. As interest rates rise generally, market rates for new vehicle financing are expected to rise as well, which may make our vehicles less affordable to retail
9
customers or steer consumers to less expensive vehicles that tend to be less profitable for us, adversely affecting our financial condition and results of operations. Additionally, if consumer interest rates increase substantially or if financial service providers tighten lending standards or restrict their lending to certain classes of credit, our retail customers may not desire to or be able to obtain financing to purchase or lease our vehicles. Furthermore, because our customers may be relatively more sensitive to changes in the availability and adequacy of financing and macroeconomic conditions, our vehicle sales may be disproportionately affected by changes in financing conditions relative to the vehicle sales of our competitors.
Limitations on our liquidity and access to funding may limit our ability to execute our Business Plan and improve our financial condition and results of operations.
Our future performance will depend on, among other things, our ability to finance debt repayment obligations and planned investments from operating cash flow, available liquidity, the renewal or refinancing of existing bank loans and/or facilities and possible access to capital markets or other sources of financing. Although we have measures in place that are designed to ensure that adequate levels of working capital and liquidity are maintained, declines in sales volumes could have a negative impact on the cash-generating capacity of our operating activities. For a discussion of these factors, see
Item 5B. Liquidity and Capital Resources.
We could, therefore, find ourselves in the position of having to seek additional financing and/or having to refinance existing debt, including in unfavorable market conditions, with limited availability of funding and a general increase in funding costs. Any limitations on our liquidity, due to decreases in vehicle sales, the amount of or restrictions in our existing indebtedness, conditions in the credit markets, general economic conditions or otherwise, may adversely impact our ability to execute our Business Plan and impair our financial condition and results of operations. In addition, any actual or perceived limitations of our liquidity may limit the ability or willingness of counterparties, including dealers, customers, suppliers, lenders and financial service providers, to do business with us, which may adversely affect our financial condition and results of operations.
Our current credit rating is below investment grade and any further deterioration may significantly affect our funding and prospects.
Our ability to access the capital markets or other forms of financing and the related costs depend, among other things, on our credit ratings and we are currently rated below investment grade. The rating agencies review our ratings regularly and, accordingly, new ratings may be assigned to us in the future. It is not currently possible to predict the timing or outcome of any ratings review.
Any downgrade may increase our cost of capital and potentially limit our access to sources of financing, which may cause a material adverse effect on our business prospects, earnings and financial position.
Since the rating agencies may separately review and rate FCA US on a stand-alone basis, it is possible that our credit ratings may not benefit from any improvements in FCA US's credit ratings or that a deterioration in FCA US's credit ratings could result in a negative rating review of us. See
Item 5B. Liquidity and Capital Resources
for more information on our financing arrangements.
Our ability to achieve cost reductions and to realize production efficiencies is critical to maintaining our competitiveness and long-term profitability.
While some productivity improvements are within our control, others depend on external factors, such as commodity prices, supply capacity limitations, or trade regulation. These external factors may make it more difficult to reduce costs as planned, and we may sustain larger than expected production expenses, materially affecting our business and results of operations. Furthermore, reducing costs may prove difficult due to the need to introduce new and improved products in order to meet consumer expectations and government regulations.
Our business operations may be impacted by various types of claims, lawsuits, and other contingent obligations.
We are involved in various product liability, warranty, product performance, asbestos, personal injury, dealer and supplier disputes, environmental claims and lawsuits, antitrust, intellectual property, tax and other legal proceedings including those that arise in the ordinary course of our business. We estimate such potential claims and contingent liabilities and, where appropriate, record provisions to address these contingent liabilities. The ultimate outcome of the legal matters pending against us is uncertain, and although such claims, lawsuits and other legal matters are not expected individually to have a material adverse effect on our financial condition or results of operations, such matters could have, in the aggregate, a material adverse effect on our financial condition or results of operations. Furthermore, we could, in the future, be subject to judgments or enter into settlements of lawsuits and claims that could have a material adverse effect on our results of operations in any
10
particular period. While we maintain insurance coverage with respect to certain claims, we may not be able to obtain such insurance on acceptable terms in the future, if at all, and any such insurance may not provide adequate coverage against any such claims. See also Notes
22
and
28
of the Consolidated Financial Statements included elsewhere in this report for additional information.
A significant malfunction, disruption or security breach compromising the electronic control systems contained in our vehicles could damage our reputation, disrupt our business and adversely impact our ability to compete.
Our vehicles, as well as vehicles manufactured by other OEMs, contain interconnected and increasingly complex systems that control various vehicle processes including engine, transmission, safety, steering, brakes, window and door lock functions. Such internal and vehicle systems are susceptible to malfunctions and interruptions due to equipment damage, power outages, and a range of other hardware, software and network problems. These systems are also susceptible to cybercrime, or threats of intentional disruption, which are increasing in terms of sophistication and frequency. A significant malfunction, disruption or security breach compromising the electronic control systems contained in our vehicles could damage our reputation, expose us to significant liability and have a material adverse effect on our results of operations.
We may not be able to realize anticipated benefits from acquisitions that we may undertake, and challenges associated with strategic alliances may have an adverse impact on our results of operations.
We may engage in acquisitions or enter into, expand or exit from strategic alliances which could involve risks that may prevent us from realizing the expected benefits of the transactions or achieving our strategic objectives. Such risks could include:
|
•
|
technological and product synergies, economies of scale and cost reductions not occurring as expected;
|
|
•
|
unexpected liabilities;
|
|
•
|
incompatibility in processes or systems;
|
|
•
|
unexpected changes in laws or regulations;
|
|
•
|
inability to retain key employees;
|
|
•
|
inability to source certain products;
|
|
•
|
increased financing costs and inability to fund such costs;
|
|
•
|
significant costs associated with terminating or modifying alliances; and
|
|
•
|
problems in retaining customers and integrating operations, services, personnel, and customer bases.
|
If problems or issues were to arise among the parties to one or more strategic alliances for managerial, financial or other reasons, or if such strategic alliances or other relationships were terminated, our product lines, businesses, financial position and results of operations could be adversely affected.
There can be no assurance that we will be able to offset the earnings power lost as a result of the Ferrari separation.
In January 2016, we completed the previously announced separation of Ferrari N.V., which was intended to, among other things, strengthen our capital base. The separation consisted primarily of the October 2015 initial public offering of 10 percent of the common shares of Ferrari N.V. and the January 2016 transaction in which holders of our common shares and mandatory convertible securities received our remaining 80 percent interest in Ferrari N.V. The initial public offering and spin-off will in the aggregate ultimately have a positive €1.5 billion impact on our Net industrial debt. However, Ferrari N.V. contributed approximately €
2.6 billion
in revenue and €
444 million
in EBIT in 2015, and is now accounted for as a discontinued operation. If the improvement in our capital position resulting from the separation of Ferrari N.V. is not sufficient to offset the related loss of revenue and EBIT, we could experience a material adverse impact on our results of operations and financial condition.
11
Failure to maintain adequate financial and management processes and controls could lead to errors in our financial reporting, which could harm our business reputation and cause a default under certain covenants in our credit agreements and other debt.
We continuously monitor and evaluate changes in our internal controls over financial reporting. In support of our drive toward common global systems, we have extended our finance, procurement, and capital project and investment management systems to new areas of operations. As appropriate, we continue to modify the design and documentation of internal control processes and procedures relating to the new systems to simplify and automate many of our previous processes. Our management believes that the implementation of these systems will continue to improve and enhance internal controls over financial reporting. If we fail to maintain adequate financial and management processes and controls, however, it could lead to errors in our financial reporting, which could harm our business reputation and cause a default under certain covenants in our credit agreements and other debt.
In addition, if we do not maintain adequate financial and management personnel, processes and controls, we may not be able to accurately report our financial performance on a timely basis, which could cause a default under certain covenants in the indentures governing certain of our public indebtedness, and other credit agreements.
A disruption or security breach in our information technology systems could disrupt our business and adversely impact our ability to compete.
A significant malfunction, disruption or security breach compromising the operation of our information technology systems could damage our reputation, disrupt our business and adversely impact our ability to compete.
Our ability to keep our business operating effectively depends on the functional and efficient operation of our information, data processing and telecommunications systems, including our vehicle design, manufacturing, inventory tracking and billing and payment systems. A significant or large-scale malfunction or interruption of any one of our computer or data processing systems could adversely affect our ability to manage and keep our operations running efficiently, and damage our reputation if we are unable to track transactions and deliver products to our dealers and customers. A malfunction or security breach that results in a wider or sustained disruption to our business could have a material adverse effect on our business, reputation, financial condition and results of operations.
In addition to supporting our operations, we use our systems to collect and store confidential and sensitive data, including information about our business, our customers and our employees. As our technology continues to evolve, we anticipate that we will collect and store even more data in the future and that our systems will increasingly use remote communication features that are sensitive to both willful and unintentional security breaches. Much of our value is derived from our confidential business information, including vehicle design, proprietary technology and trade secrets, and to the extent the confidentiality of such information is compromised, we may lose our competitive advantage and our vehicle sales may suffer. We also collect, retain and use personal information, including data we gather from customers for product development and marketing purposes, and data we obtain from employees. In the event of a breach in security that allows third parties access to this personal information, we are subject to a variety of ever-changing laws on a global basis that require us to provide notification to the data owners, and that subject us to lawsuits, fines and other means of regulatory enforcement. Our reputation could suffer in the event of such a data breach, which could cause consumers to purchase their vehicles from our competitors. Ultimately, any significant compromise in the integrity of our data security could have a material adverse effect on our business.
We may not be able to adequately protect our intellectual property rights, which may harm our business.
Our success depends, in part, on our ability to protect our intellectual property rights. If we fail to protect our intellectual property rights, others may be able to compete against us using intellectual property that is the same as or similar to our own. In addition, there can be no guarantee that our intellectual property rights are sufficient to provide us with a competitive advantage against others who offer products similar to ours. Despite our efforts, we may be unable to prevent third parties from infringing our intellectual property and using our technology for their competitive advantage. Any such infringement and use could adversely affect our business, financial condition or results of operations.
The laws of some countries in which we operate do not offer the same protection of our intellectual property rights as do the laws of the U.S. or Europe. In addition, effective intellectual property enforcement may be unavailable or limited in certain countries, making it difficult for us to protect our intellectual property from misuse or infringement there. Our inability to protect our intellectual property rights in some countries may harm our business, financial condition or results of operations.
12
We are subject to risks relating to international markets and exposure to changes in local conditions.
We are subject to risks inherent to operating globally, including those related to:
|
•
|
exposure to local economic and political conditions;
|
|
•
|
import and/or export restrictions;
|
|
•
|
multiple tax regimes, including regulations relating to transfer pricing and withholding and other taxes on remittances and other payments to or from subsidiaries;
|
|
•
|
foreign investment and/or trade restrictions or requirements, foreign exchange controls and restrictions on the repatriation of funds; and
|
|
•
|
the introduction of more stringent laws and regulations.
|
Unfavorable developments in any one or a combination of these areas (which may vary from country to country) could have a material adverse effect on our financial condition and results of operations.
Developments in emerging market countries may adversely affect our business.
We operate in a number of emerging markets, both directly (e.g., Brazil and Argentina) and through joint ventures and other cooperation agreements (e.g., Turkey, India, China and Russia) and have recently taken steps to expand our manufacturing presence in our South and Central America (“LATAM”) region and Asia and Pacific countries (“APAC”) region. Our exposure to other emerging countries has increased in recent years, as have the number and importance of such joint ventures and cooperation agreements. Economic developments in certain LATAM markets, as well as China, have had and could have in the future material adverse effects on our financial condition and results of operations. Further, in certain markets in which we or our joint ventures operate, government approval may be required for certain activities, which may limit our ability to act quickly in making decisions on our operations in those markets.
The automotive market in these emerging markets is highly competitive, with competition from many of the largest global manufacturers as well as numerous smaller domestic manufacturers. We anticipate that additional competitors, both international and domestic, will also seek to enter these markets and that existing market participants will try to aggressively protect or increase their market share. Increased competition may result in price reductions, reduced margins and our inability to gain or hold market share, which could have a material adverse effect on our financial condition and results of operations.
Our reliance on joint ventures in certain emerging markets may adversely affect the development of our business in those regions.
We intend to expand our presence in emerging markets, including China and India, through partnerships and joint ventures. For instance, we have entered into a joint venture with Guangzhou Automobile Group Co., Ltd (“GAC Group”) which has commenced local production of the Jeep Cherokee and will locally produce two other new Jeep vehicles for the Chinese market, expanding the portfolio of Jeep sport utility vehicles (“SUVs”) currently available to Chinese consumers as imports. We have also entered into a joint venture with TATA Motors Limited for the production of certain of our vehicles, engines and transmissions in India.
Our reliance on joint ventures to enter or expand our presence in these markets may expose us to risk of conflict with our joint venture partners and the need to divert management resources to oversee these shareholder arrangements. Further, as these arrangements require cooperation with third party partners, these joint ventures may not be able to make decisions as quickly as we would if we were operating on our own or may take actions that are different from what we would do on a standalone basis in light of the need to consider our partners’ interests. As a result, we may be less able to respond timely to changes in market dynamics, which could have an adverse effect on our financial condition and results of operations.
13
We depend on our relationships with suppliers.
We purchase raw materials and components from a large number of suppliers and depend on services and products provided by companies outside the Group. Close collaboration between an OEM and its suppliers is common in the automotive industry, and although this offers economic benefits in terms of cost reduction, it also means that we depend on our suppliers and are exposed to the possibility that difficulties, including those of a financial nature, experienced by those suppliers (whether caused by internal or external factors) could have a material adverse effect on our financial condition and results of operations.
We face risks associated with increases in costs, disruptions of supply or shortages of raw materials, parts, components and systems used in our vehicles.
We use a variety of raw materials in our business including steel, aluminum, lead, resin and copper, and precious metals such as platinum, palladium and rhodium, as well as energy. The prices for these raw materials fluctuate, and market conditions can affect our ability to manage our cost of sales over the short term. We may not be successful in managing our exposure to these risks. Substantial increases in the prices for raw materials would increase our operating costs and could reduce profitability if the increased costs cannot be offset by changes in vehicle prices or countered by productivity gains. In particular, certain raw materials are sourced from a limited number of suppliers and from a limited number of countries. We cannot guarantee that we will be able to maintain arrangements with these suppliers that assure access to these raw materials, and in some cases this access may be affected by factors outside of our control and the control of our suppliers. For instance, natural or man-made disasters or civil unrest may have severe and unpredictable effects on the price of certain raw materials in the future.
As with raw materials, we are also at risk for supply disruption and shortages in parts and components for use in our vehicles for many reasons including, but not limited to, tight credit markets or other financial distress, natural or man-made disasters, or production difficulties. We will continue to work with suppliers to monitor potential disruptions and shortages and to mitigate the effects of any emerging shortages on our production volumes and revenues. However, there can be no assurances that these events will not have an adverse effect on our production in the future, and any such effect may be material.
Any interruption in the supply or any increase in the cost of raw materials, parts, components and systems could negatively impact our ability to achieve our vehicle sales objectives and profitability. Long-term interruptions in supply of raw materials, parts, components and systems may result in a material impact on vehicle production, vehicle sales objectives, and profitability. Cost increases which cannot be recouped through increases in vehicle prices, or countered by productivity gains, may result in a material impact on our financial condition and/or results of operations.
Labor laws and collective bargaining agreements with our labor unions could impact our ability to increase the efficiency of our operations.
Substantially all of our production employees are represented by trade unions, are covered by collective bargaining agreements and/or are protected by applicable labor relations regulations that may restrict our ability to modify operations and reduce costs quickly in response to changes in market conditions. See
Item 6D. Employees
for a description of these arrangements. These and other provisions in our collective bargaining agreements may impede our ability to restructure our business successfully to compete more effectively, especially with those automakers whose employees are not represented by trade unions or are subject to less stringent regulations, which could have a material adverse effect on our financial condition and results of operations.
We are subject to risks associated with exchange rate fluctuations, interest rate changes, credit risk and other market risks.
We operate in numerous markets worldwide and are exposed to market risks stemming from fluctuations in currency and interest rates. The exposure to currency risk is mainly linked to the differences in geographic distribution of our manufacturing activities and commercial activities, resulting in cash flows from sales being denominated in currencies different from those connected to purchases or production activities.
We use various forms of financing to cover funding requirements for our industrial activities and for providing financing to our dealers and customers. Moreover, liquidity for industrial activities is also principally invested in variable-rate or short-term financial instruments. Our financial services businesses normally operate a matching policy to offset the impact of differences in rates of interest on the financed portfolio and related liabilities. Nevertheless, changes in interest rates can affect Net revenues, finance costs and margins.
14
In addition, although we manage risks associated with fluctuations in currency and interest rates through financial hedging instruments, fluctuations in currency or interest rates could have a material adverse effect on our financial condition and results of operations.
Our financial services activities are also subject to the risk of insolvency of dealers and retail customers, as well as unfavorable economic conditions in markets where these activities are carried out. Despite our efforts to mitigate such risks through the credit approval policies applied to dealers and retail customers, there can be no assurances that we will be able to successfully mitigate such risks, particularly with respect to a general change in economic conditions.
We are a Dutch public company with limited liability, and our shareholders may have rights different from those of shareholders of companies organized in the U.S.
The rights of our shareholders may be different from the rights of shareholders governed by the laws of U.S. jurisdictions. We are a Dutch public company with limited liability (
naamloze vennootschap
). Our corporate affairs are governed by our articles of association and by the laws governing companies incorporated in the Netherlands. The rights of shareholders and the responsibilities of members of our board of directors may be different from the rights of shareholders and the responsibilities of members of our board of directors in companies governed by the laws of other jurisdictions including the U.S. In the performance of its duties, our board of directors is required by Dutch law to consider our interests and the interests of our shareholders, our employees and other stakeholders, in all cases with due observation of the principles of reasonableness and fairness. It is possible that some of these parties will have interests that are different from, or in addition to, your interests as a shareholder.
It may be difficult to enforce U.S. judgments against us.
We are incorporated under the laws of the Netherlands, and a substantial portion of our assets are outside of the U.S. Most of our directors and senior management and our independent auditors are resident outside the U.S., and all or a substantial portion of their respective assets may be located outside the U.S. As a result, it may be difficult for U.S. investors to effect service of process within the U.S. upon these persons. It may also be difficult for U.S. investors to enforce within the U.S. judgments predicated upon the civil liability provisions of the securities laws of the U.S. or any state thereof. In addition, there is uncertainty as to whether the courts outside the U.S. would recognize or enforce judgments of U.S. courts obtained against us or our directors and officers predicated upon the civil liability provisions of the securities laws of the U.S. or any state thereof. Therefore, it may be difficult to enforce U.S. judgments against us, our directors and officers and our independent auditors.
We operate so as to be treated as exclusively resident in the United Kingdom for tax purposes, but the relevant tax authorities may treat us as also being tax resident elsewhere.
We are not a company incorporated in the United Kingdom (“U.K.”). Therefore, whether we are resident in the U.K. for tax purposes depends on whether our “central management and control” is located (in whole or in part) in the U.K. The test of “central management and control” is largely a question of fact and degree based on all the circumstances, rather than a question of law. Nevertheless, the decisions of the U.K. courts and the published practice of Her Majesty’s Revenue & Customs (“HMRC”), suggest that we, a group holding company, are likely to be regarded as having become U.K.-resident on this basis from incorporation and remaining so if, as we intend, (i) at least half of the meetings of our Board of Directors are held in the U.K. with a majority of directors present in the U.K. for those meetings; (ii) at those meetings there are full discussions of, and decisions are made regarding, the key strategic issues affecting us and our subsidiaries; (iii) those meetings are properly minuted; (iv) at least some of our directors, together with supporting staff, are based in the U.K.; and (v) we have permanent staffed office premises in the U.K. HMRC has accepted that our
“
central management and control
”
is in the U.K.
Although it has been accepted that our “central management and control” is in the U.K., we would nevertheless not be treated as U.K.-resident if (a) we were concurrently resident in another jurisdiction (applying the tax residence rules of that jurisdiction) that has a double tax treaty with the U.K. and (b) there were a tie-breaker provision in that tax treaty which allocated exclusive residence to that other jurisdiction.
Our residence for Italian tax purposes is largely a question of fact based on all circumstances. A rebuttable presumption of residence in Italy may apply under Article 73(5-
bis
) of the Italian Consolidated Tax Act (“CTA”). However, we have set up and thus far maintained, and intend to continue to maintain, our management and organizational structure in such a manner that we should be deemed resident in the U.K. from our incorporation for the purposes of the Italy-U.K. tax treaty. The result of this is that we should not be regarded as an Italian tax resident either for the purposes of the Italy-U.K. tax
15
treaty or for Italian domestic law purposes. Because this analysis is highly factual and may depend on future changes in our management and organizational structure, there can be no assurance regarding the final determination of our tax residence. Should we be treated as an Italian tax resident, we would be subject to taxation in Italy on our worldwide income and may be required to comply with withholding tax and/or reporting obligations provided under Italian tax law, which could result in additional costs and expenses.
Although it has been accepted that our “central management and control” is in the U.K., we will be resident in the Netherlands for Dutch corporate income tax and Dutch dividend withholding tax purposes on the basis that we are incorporated there. Nonetheless, we will be regarded as solely resident in either the U.K. or the Netherlands under the Netherlands-U.K. tax treaty if the U.K. and Dutch competent authorities agree that this is the case. We have applied for and received a ruling from the U.K. and Dutch competent authorities that we should be treated as resident solely in the U.K. for the purposes of the treaty. If there is a change over time to the facts upon which a ruling issued by the competent authorities is based, the ruling may be withdrawn or cease to apply.
The U.K.’s controlled foreign company taxation rules may reduce net returns to shareholders.
On the assumption that we are resident for tax purposes in the U.K., we will be subject to the U.K. controlled foreign company (“CFC”) rules. The CFC rules can subject U.K.-tax-resident companies (in this case, us) to U.K. tax on the profits of certain companies not resident for tax purposes in the U.K. in which they have at least a 25 percent direct or indirect interest. Interests of connected or associated persons may be aggregated with those of the U.K.-tax-resident company when applying this 25 percent threshold. For a company to be a CFC, it must be treated as directly or indirectly controlled by persons resident for tax purposes in the U.K. The definition of control is broad (it includes economic rights) and captures some joint ventures.
Various exemptions are available. One of these is that a CFC must be subject to tax in its territory of residence at an effective rate not less than 75 percent of the rate to which it would be subject in the U.K., after making specified adjustments. Another of the exemptions (the “excluded territories exemption”) is that the CFC is resident in a jurisdiction specified by HMRC in regulations (several jurisdictions in which our group has significant operations, including Brazil, Italy and the U.S., are so specified). For this exemption to be available, the CFC must not be involved in an arrangement with a main purpose of avoiding U.K. tax and the CFC’s income falling within certain categories (often referred to as the CFC’s “bad income”) must not exceed a set limit. In the case of the U.S. and certain other countries, the “bad income” test need not be met if the CFC does not have a permanent establishment in any other territory and the CFC or persons with an interest in it are subject to tax in its home jurisdiction on all its income (other than non-deductible distributions). We expect that our principal operating activities should fall within one or more of the exemptions from the CFC rules, in particular the excluded territories exemption.
Where the entity exemptions are not available, profits from activities other than finance or insurance will only be subject to apportionment under the CFC rules where:
|
•
|
some of the CFC’s assets or risks are acquired, managed or controlled to any significant extent in the U.K. (a) other than by a U.K. permanent establishment of the CFC and (b) other than under arm’s length arrangements;
|
|
•
|
the CFC could not manage the assets or risks itself; and
|
|
•
|
the CFC is party to arrangements which increase its profits while reducing tax payable in the U.K. and the arrangements would not have been made if they were not expected to reduce tax in some jurisdiction.
|
Profits from finance activities (whether considered trading or non-trading profits for U.K. tax purposes) or from insurance may be subject to apportionment under the CFC rules if they meet the tests set out above or specific tests for those activities. A full or 75 percent exemption may also be available for some non-trading finance profits.
Although we do not expect the U.K.’s CFC rules to have a material adverse impact on our financial position, the effect of the new CFC rules on us is not yet certain. We will continue to monitor developments in this regard and seek to mitigate any adverse U.K. tax implications which may arise. However, the possibility cannot be excluded that the CFC rules may have a material adverse impact on our financial position, reducing net returns to our shareholders.
16
If we are deemed to not maintain a permanent establishment in Italy, we could experience a material increase in our tax liability.
Whether we have maintained a permanent establishment in Italy after the Merger (an “Italian P.E.”) is largely a question of fact based on all the circumstances. We believe that, on the understanding that we should be a U.K.-resident company under the Italy-U.K. tax treaty, we are likely to be treated as maintaining an Italian P.E. because we have maintained and intend to continue to maintain sufficient employees, facilities and activities in Italy to qualify as maintaining an Italian P.E. Should this be the case (i) the embedded gains on our assets connected with the Italian P.E. cannot be taxed as a result of the Merger; (ii) our tax-deferred reserves cannot be taxed, inasmuch as they have been recorded in the Italian P.E.’s financial accounts; and (iii) the Italian fiscal unit that was headed by Fiat before the Merger (the “Fiscal Unit”), continues with respect to our Italian subsidiaries whose shareholdings are part of the Italian P.E.’s net worth.
FCA filed a ruling request with the Italian tax authorities in respect of the continuation of the Fiscal Unit via the Italian P.E. on April 16, 2014. The Italian tax authorities issued the ruling on December 10, 2014 (the “2014 Ruling”), confirming that the Fiscal Unit may continue via the Italian P.E. Moreover, in another ruling issued on October 9, 2015 (the “2015 Ruling”, and together with the 2014 Ruling, the “Rulings”), the Italian tax authorities confirmed that the separation of Ferrari from the Group (including the first demerger of certain assets held through the Italian P.E.) will qualify as a tax-free, neutral transaction from an Italian income tax perspective. However, the Rulings are not assessments of certain sets of facts and circumstances. Therefore, even though the 2014 Ruling confirms that the Fiscal Unit may continue via the Italian P.E. and the 2015 Ruling assumes such a P.E. to exist, this does not rule out that the Italian tax authorities may in the future verify whether FCA actually has a P.E. in Italy and potentially challenge the existence of such a P.E. Because the analysis is highly factual, there can be no assurance regarding our maintenance of an Italian P.E. after the Merger.
Risks Related to Our Substantial Existing Indebtedness
We have significant outstanding indebtedness, which may limit our ability to obtain additional funding on competitive terms and limit our financial and operating flexibility.
The extent of our indebtedness could have important consequences on our operations and financial results, including:
|
•
|
we may not be able to secure additional funds for working capital, capital expenditures, debt service requirements or general corporate purposes;
|
|
•
|
we may need to use a portion of our projected future cash flow from operations to pay principal and interest on our indebtedness, which may reduce the amount of funds available to us for other purposes;
|
|
•
|
we are more financially leveraged than some of our competitors, which may put us at a competitive disadvantage; and
|
|
•
|
we may not be able to adjust rapidly to changing market conditions, which may make us more vulnerable to a downturn in general economic conditions or our business.
|
These risks may be exacerbated by volatility in the financial markets, particularly those resulting from perceived strains on the finances and creditworthiness of several governments and financial institutions, particularly in the Eurozone.
Even though we are the 100 percent indirect owner of FCA US, it operates separately from a cash management standpoint. Additionally, we have not provided guarantees or security or undertaken any other similar commitment in relation to any financial obligation of FCA US, nor do we have any commitment to provide funding to FCA US in the future. However, with the replacement of the prior FCA revolving credit facilities with the new FCA revolving credit facilities entered into in June 2015, FCA no longer has limitations in providing funding to FCA US.
Furthermore, certain of our notes include covenants that may be affected by FCA US’s circumstances. In particular, these notes include cross-default clauses which may accelerate the relevant issuer’s obligation to repay its notes in the event that FCA US fails to pay certain debt obligations at maturity or is otherwise subject to an acceleration in the maturity of any of those obligations. Therefore, these cross-default provisions could require early repayment of those notes in the event FCA US's debt obligations are accelerated or are not repaid at maturity. There can be no assurance that the obligation to accelerate the repayment by FCA US of its debts will not arise or that it will be able to pay its debt obligations when due at maturity.
17
Restrictive covenants in our debt agreements could limit our financial and operating flexibility.
The indentures governing certain of our outstanding public indebtedness, and other credit agreements to which companies in the Group are a party, contain covenants that restrict the ability of certain companies in the Group to, among other things:
|
•
|
incur additional debt;
|
|
•
|
make certain investments;
|
|
•
|
enter into certain types of transactions with affiliates;
|
|
•
|
sell certain assets or merge with or into other companies;
|
|
•
|
use assets as security in other transactions; and
|
|
•
|
enter into sale and leaseback transactions.
|
For more information regarding our credit facilities and debt, see
Item 5B. Liquidity and Capital Resources
.
Restrictions arising out of FCA US’s senior credit facilities may hinder our ability to manage our operations on a consolidated, global basis.
FCA US is party to credit agreements for certain senior credit facilities. These debt instruments include covenants that restrict FCA US’s ability to pay dividends or enter into sale and leaseback transactions, make certain distributions or purchase or redeem capital stock, prepay other debt, encumber assets, incur or guarantee additional indebtedness, incur liens, transfer and sell assets or engage in certain business combinations, enter into certain transactions with affiliates or undertake various other business activities.
In particular, in January 2014 and February 2015, FCA US paid distributions of U.S.$1.9 billion (€1.4 billion) and U.S.$1.3 billion (€1.2 billion), respectively, to its members. Further distributions will be limited to 50 percent of FCA US’s cumulative consolidated net income (as defined in the agreements) from the period from January 1, 2012 until the end of the most recent fiscal quarter, less the amounts of the January 2014 and February 2015 distributions. See
Item 5B. Liquidity and Capital Resources.
These restrictive covenants could have an adverse effect on our business by limiting our ability to take advantage of financing, mergers and acquisitions, joint ventures or other corporate opportunities. In particular, the senior credit facilities contain, and future indebtedness may contain, other and more restrictive covenants. These agreements also limit FCA US’s ability to prepay certain of its indebtedness or impose limitations that make prepayment impractical. The senior credit facilities require FCA US to maintain borrowing base collateral coverage and a minimum liquidity threshold. A breach of any of these covenants or restrictions could result in an event of default on the indebtedness and the other indebtedness of FCA US or result in cross-default under certain of its or our indebtedness.
If FCA US is unable to comply with these covenants, its outstanding indebtedness may become due and payable and creditors may foreclose on pledged properties. In this case, FCA US may not be able to repay its debt and it is unlikely that it would be able to borrow sufficient additional funds. Even if new financing is made available to FCA US in such circumstances, it may not be available on acceptable terms.
Compliance with certain of these covenants could also restrict FCA US’s ability to take certain actions that its management believes are in FCA US’s and our best long-term interests.
Should FCA US be unable to undertake strategic initiatives due to the covenants provided for by the above-referenced instruments, our business prospects, financial condition and results of operations could be impacted.
No assurance can be given that restrictions arising out of FCA US’s senior credit facilities will be eliminated.
In connection with our capital planning to support the Business Plan, we have announced our intention to eliminate existing contractual terms limiting the free flow of capital among Group companies, including through prepayment,
18
refinancing and/or amendment of the outstanding FCA US senior credit facilities. No assurance can be given regarding the timing of such transactions or that such transactions will be completed.
Substantially all of the assets of FCA US and its U.S. subsidiary guarantors are unconditionally pledged as security under its senior credit facilities and could become subject to lenders’ contractual rights if an event of default were to occur.
FCA US is an obligor and several of its U.S. subsidiaries are guarantors under FCA US's senior credit facilities. The obligations under the senior credit facilities are secured by senior priority security interests in substantially all of the assets of FCA US and its U.S. subsidiary guarantors. The collateral includes 100 percent of the equity interests in FCA US’s U.S. subsidiaries, 65 percent of the equity interests in certain of its non-U.S. subsidiaries held directly by FCA US and its U.S. subsidiary guarantors. An event of default under FCA US’s senior credit facilities could trigger its lenders’ contractual rights to enforce their security interest in these assets.
Risks Related to our Common Shares
Our maintenance of two exchange listings may adversely affect liquidity in the market for our common shares and could result in pricing differentials of our common shares between the two exchanges.
Our common shares are listed and traded on both the New York Stock Exchange (“NYSE”) and the Mercato Telematico Azionario (“MTA”) operated by Borsa Italiana. The dual listing of our common shares may split trading between the two markets and may result in limited trading liquidity of the shares in one or both markets, which may adversely affect the development of an active trading market for our common shares on either or both exchanges and may result in price differentials between the exchanges. Differences in the trading schedules, as well as volatility in the exchange rate of the two trading currencies, among other factors, may result in different trading prices for our common shares on the two exchanges, which may contribute to volatility in the trading of our shares.
The loyalty voting structure may affect the liquidity of our common shares and reduce our common share price.
The implementation of the loyalty voting structure could reduce the liquidity of our common shares and adversely affect the trading prices of our common shares. The loyalty voting structure is intended to reward shareholders for maintaining long-term share ownership by granting initial shareholders and persons holding our common shares continuously for at least three years at any time following the effectiveness of the Merger the option to elect to receive our special voting shares. Our special voting shares cannot be traded and, immediately prior to the deregistration of common shares from the FCA Loyalty Register, any corresponding special voting shares shall be transferred to us for no consideration (
om niet
). This loyalty voting structure is designed to encourage a stable shareholder base and, conversely, it may deter trading by those shareholders who are interested in gaining or retaining our special voting shares. Therefore, the loyalty voting structure may reduce liquidity in our common shares and adversely affect their trading price.
The loyalty voting structure may make it more difficult for shareholders to acquire a controlling interest, change our management or strategy or otherwise exercise influence over us, and the market price of our common shares may be lower as a result.
The provisions of our articles of association which establish the loyalty voting structure may make it more difficult for a third party to acquire, or attempt to acquire, control of our company, even if a change of control were considered favorably by shareholders holding a majority of our common shares. As a result of the loyalty voting structure, a relatively large proportion of our voting power could be concentrated in a relatively small number of shareholders who would have significant influence over us. As of February 26, 2016, Exor had a voting interest in FCA of approximately 44.27 percent due to its participation in the loyalty voting structure and as a result will have the ability to exercise significant influence on matters involving our shareholders. Such shareholders participating in the loyalty voting structure could effectively prevent change of control transactions that may otherwise benefit our shareholders. The loyalty voting structure may also prevent or discourage shareholders' initiatives aimed at changing our management or strategy or otherwise exerting influence over us.
There may be potential Passive Foreign Investment Company tax considerations for U.S. Shareholders.
Shares of our stock held by a U.S. holder would be stock of a passive foreign investment company (“PFIC”) for U.S. federal income tax purposes with respect to a U.S. Shareholder if for any taxable year in which such U.S. Shareholder held our common shares, after the application of applicable look-through rules (i) 75 percent or more of our gross income for the taxable year consists of passive income (including dividends, interest, gains from the sale or exchange of investment property and rents and royalties other than rents and royalties which are received from unrelated parties in connection with the active
19
conduct of a trade or business, as defined in applicable Treasury Regulations), or (ii) at least 50 percent of its assets for the taxable year (averaged over the year and determined based upon value) produce or are held for the production of passive income. U.S. persons who own shares of a PFIC are subject to a disadvantageous U.S. federal income tax regime with respect to the income derived by the PFIC, the dividends they receive from the PFIC, and the gain, if any, they derive from the sale or other disposition of their shares in the PFIC.
While we believe that shares of our stock are not stock of a PFIC for U.S. federal income tax purposes, this conclusion is based on a factual determination made annually and thus is subject to change. Moreover, shares of our stock may become stock of a PFIC in future taxable years if there were to be changes in our assets, income or operations.
Tax consequences of the loyalty voting structure are uncertain.
No statutory, judicial or administrative authority directly discusses how the receipt, ownership, or disposition of special voting shares should be treated for Italian, U.K. or U.S. tax purposes and as a result, the tax consequences in those jurisdictions are uncertain.
The fair market value of our special voting shares, which may be relevant to the tax consequences, is a factual determination and is not governed by any guidance that directly addresses such a situation. Because, among other things, the special voting shares are not transferable (other than, in very limited circumstances, together with our associated common shares) and a shareholder will receive amounts in respect of the special voting shares only if we are liquidated, we believe and intend to take the position that the fair market value of each special voting share is minimal. However, the relevant tax authorities could assert that the value of the special voting shares as determined by us is incorrect.
The tax treatment of the loyalty voting structure is unclear and shareholders are urged to consult their tax advisors in respect of the consequences of acquiring, owning and disposing of special voting shares.
Tax may be required to be withheld from dividend payments.
Although the U.K. and Dutch competent authorities have ruled that we should be treated as solely resident in the U.K. for the purposes of the Netherlands-U.K. double tax treaty, under Dutch domestic law dividend payments made by us to Dutch residents are still subject to Dutch dividend withholding tax and we would have no obligation to pay additional amounts in respect of such payments.
Should Dutch or Italian withholding taxes be imposed on future dividends or distributions with respect to our common shares, whether such withholding taxes are creditable against a tax liability to which a shareholder is otherwise subject depends on the laws of such shareholder’s jurisdiction and such shareholder’s particular circumstances. Shareholders are urged to consult their tax advisors in respect of the consequences of the potential imposition of Dutch and/or Italian withholding taxes.
See “
We operate so as to be treated as exclusively resident in the United Kingdom for tax purposes, but the relevant tax authorities may treat it as also being tax resident elsewhere.”
in the section
—Risks Related to Our Business, Strategy and Operations
.
20
A. History and Development of the Company
History of FCA
Fiat Chrysler Automobiles N.V. was originally incorporated as a public limited liability company (
naamloze vennootschap
) under the laws of the Netherlands on April 1, 2014 and became the parent company of the Group on October 12, 2104 through the Merger described below. Its principal office is located at 25 St. James's Street, London SW1A 1HA, United Kingdom (telephone number: +44 (0)20 7766 0311).
Fiat, the predecessor to FCA, was founded as
Fabbrica Italiana Automobili Torino
, on July 11, 1899 in Turin, Italy as an automobile manufacturer. Fiat opened its first factory in 1900 in Corso Dante in Turin with 150 workers producing 24 cars. In 1902 Giovanni Agnelli, Fiat’s founder, became the Managing Director of the company.
Beginning in 2008, Fiat pursued a process of transformation in order to meet the challenges of a changing marketplace characterized by global overcapacity in automobile production and the consequences of economic recession that persisted particularly in the European markets on which it had historically depended. As part of its efforts to restructure operations, Fiat worked to expand the scope of its automotive operations, having concluded that significantly greater scale was necessary to enable it to be a competitive force in the increasingly global automotive markets.
In April 2009, Fiat and Old Carco LLC, formerly known as Chrysler LLC (“Old Carco”) entered into a master transaction agreement, pursuant to which FCA US LLC, formerly known as Chrysler Group LLC, (“FCA US”) agreed to purchase the principal operating assets of Old Carco and to assume certain of Old Carco's liabilities. Old Carco traced its roots to the company originally founded by Walter P. Chrysler in 1925 that, since that time, expanded through the acquisition of the Dodge and Jeep brands.
Following the closing of that transaction on June 10, 2009, Fiat held an initial 20 percent ownership interest in FCA US, with the UAW Retiree Medical Benefits Trust (the “VEBA Trust”), the U.S. Treasury and the Canadian government holding the remaining interests. FCA US's operations were funded with financing from the U.S. Treasury and Canadian government. In addition, Fiat held several options to acquire additional ownership interests in FCA US.
Over the following years, Fiat acquired additional ownership interests in FCA US, leading to majority ownership and full consolidation of FCA US’s results into our financial statements. On May 24, 2011 FCA US refinanced the U.S. and Canadian government loans and in July 2011, Fiat acquired the ownership interests in FCA US held by the U.S. Treasury and Canadian government.
On January 21, 2014, Fiat purchased all of the VEBA Trust’s equity interests in FCA US, which represented the 41.5 percent of FCA US interest not then held by us, resulting in FCA US becoming an indirect 100 percent owned subsidiary of FCA.
The FCA Merger
On January 29, 2014, the Board of Directors of Fiat approved a proposed corporate reorganization resulting in the formation of FCA and decided to establish FCA, organized in the Netherlands, as the parent company of the Group with its principal executive offices in the United Kingdom.
On June 15, 2014, the Board of Directors of Fiat approved the terms of a cross-border legal merger of Fiat, the parent of the Group, into its 100 percent owned direct subsidiary, FCA, (the “Merger”). Fiat shareholders received in the Merger one (1) FCA common share for each Fiat ordinary share that they held. Moreover, under the Articles of Association of FCA, FCA shareholders received, if they so elected and were otherwise eligible to participate in the loyalty voting structure, one (1) FCA special voting share for each FCA common share received in the Merger. The loyalty voting structure is designed to provide eligible long-term FCA shareholders with two votes for each FCA common share held. For additional information regarding the FCA special voting shares, see
Item 10. Additional Information — B. Memorandum and Article of Association -Loyalty Voting Structure.
21
FCA was incorporated under the name Fiat Investments N.V. with issued share capital of €200,000, fully paid and divided into 20,000,000 common shares having a nominal value of €0.01 each. Capital increased to €350,000 on May 13, 2014.
Fiat shareholders voted and approved the Merger at their extraordinary general meeting held on August 1, 2014. After this approval, Fiat shareholders not voting in favor of the Merger were entitled to exercise cash exit rights (the “Cash Exit Rights”). The redemption price payable to these shareholders was €7.727 per share (the “Exit Price”), equivalent to the average daily closing price published by Borsa Italiana for the six months prior to the date of the notice calling the meeting.
As a result of the exercise of the Cash Exit Rights, concurrent with the Merger, a total of 53,916,397 Fiat shares were canceled in the Merger with a resulting net aggregate cash disbursement of €417 million.
The Merger became effective on October 12, 2014 and, on October 13, 2014, FCA common shares commenced trading on the NYSE and on the MTA. The Merger is recognized in FCA’s consolidated financial statements from January 1, 2014. As a result, FCA, as successor of Fiat, is the parent company of the Group. There were no accounting effects as a direct result of the Merger.
Ferrari Spin-off
On October 26, 2015, Ferrari N.V., a subsidiary of FCA, completed its initial public offering (“IPO”) in which FCA sold 10 percent of Ferrari N.V. common shares (“Ferrari IPO”) and received net proceeds of approximately €0.9 billion, resulting in FCA owning 80 percent of Ferrari N.V. common shares, Piero Ferrari owning 10 percent of common shares and public shareholders owning the remaining 10 percent of Ferrari N.V. common shares. The Ferrari IPO was accounted for as an equity transaction.
In October 2015, in connection with the Ferrari IPO and in preparation for the spin-off of the remaining shares of Ferrari N.V. owned by FCA, FCA carried out an internal corporate restructuring. As part of this reorganization, FCA transferred its shares of Ferrari S.p.A. to Ferrari N.V. and provided a capital contribution to Ferrari N.V., while Ferrari N.V. issued a note payable to FCA in the amount of €2.8 billion. This internal restructuring was a common control transaction and did not have an accounting impact on FCA’s Consolidated Financial Statements. However, as a result and in connection with the transactions in which Piero Ferrari exchanged his shares in Ferrari S.p.A. for Ferrari N.V. shares, FCA paid €280 million to Piero Ferrari as consideration for the dilution of his share value due to the issuance of the €2.8 billion note payable, which was recorded as a reduction to non-controlling interests.
The transactions necessary to separate FCA’s remaining ownership interest in Ferrari N.V. and to distribute that ownership interest to holders of FCA shares and mandatory convertible securities were approved at a meeting of FCA shareholder on December 3, 2015. The transactions to separate Ferrari N.V. from the Group were completed on January 3, 2016.
As the spin-off of Ferrari N.V. was highly probable after the approval was obtained at the extraordinary general meeting of FCA shareholders and since it was available for immediate distribution, the Ferrari segment met the criteria to be classified as a disposal group held for distribution to owners on December 3, 2015. As a result, the Group classified the Ferrari segment as a discontinued operation for the year ended December 31, 2015. The results of Ferrari have been excluded from the Group's continuing operations, the after-tax result of Ferrari's operations are shown as a single line item within the Consolidated Income Statement for the year ended December 31, 2015 and all prior periods have been re-presented accordingly. In addition, the assets and liabilities of the Ferrari segment have been classified as Assets held for distribution and Liabilities held for distribution within the Consolidated Statement of Financial Position at December 31, 2015, while the assets and liabilities of Ferrari have not been re-classified as such for the comparative Consolidated Statement of Financial Position at December 31, 2014. Refer to the section
—Principal Activities
within the Consolidated Financial Statements included elsewhere in this report for additional detail.
22
B. Business Overview
Business Summary
We are an international automotive group engaged in designing, engineering, manufacturing, distributing and selling vehicles, components and production systems. We are the
seventh
largest automaker in the world based on total vehicle sales in 2015. We have operations in approximately
40 countries
and sell our vehicles directly or through distributors and dealers in more than
150 countries
. We design, engineer, manufacture, distribute and sell vehicles for the mass market under the Abarth, Alfa Romeo, Chrysler, Dodge, Fiat, Fiat Professional, Jeep, Lancia and Ram brands and the SRT performance vehicle designation. We support our vehicle sales by after-sales services and parts worldwide using the Mopar brand for mass market vehicles. We make available retail and dealer financing, leasing and rental services through our subsidiaries, joint ventures and commercial arrangements. In addition, we design, engineer, manufacture, distribute and sell luxury vehicles under the Maserati brand, which we support with financial services provided to our dealers and retail customers through our subsidiaries, joint ventures and commercial arrangements. We also operate in the components and production systems sectors under the Magneti Marelli, Teksid and Comau brands.
Our activities are carried out through six reportable segments: four regional mass-market vehicle segments (NAFTA, LATAM, APAC and EMEA), Maserati, our global luxury brand segment, and a global Components segment (see
—Overview of Our Business
for a description of our reportable segments).
Excluding the operations of Ferrari, in
2015
, we shipped
4.6 million
vehicles, we had Net revenues of €
110.6 billion
, EBIT of €
2.6 billion
and Net profit of €
0.1 billion
. At
December 31, 2015
, excluding Ferrari, we had available liquidity of €
24.6 billion
(including €
3.4 billion
available under undrawn committed credit lines) and we had net industrial debt of €
5.0 billion
. See
Item 5. Operating and Financial Review—Non-GAAP Financial Measures—Net Debt
.
Industry Overview
Vehicle Segments and Descriptions
We manufacture and sell passenger cars, light trucks and light commercial vehicles covering all market segments.
Passenger cars can be divided among seven main groups, whose definition could slightly vary by region. Mini cars, known as “A segment” vehicles in Europe and often referred to as “city cars,” are between 2.7 and 3.7 meters in length and include three- and five-door hatchbacks. Small cars, known as “B segment” vehicles in Europe and “sub-compacts” in the U.S., range in length from 3.7 meters to 4.4 meters and include three- and five-door hatchbacks and sedans. Compact cars, known as “C segment” vehicles in Europe, range in length from 4.3 meters to 4.7 meters, typically have a sedan body and mostly include three- and five-door hatchback cars. Mid-size cars, known as “D segment” vehicles in Europe, range between 4.7 meters to 4.9 meters, typically have a sedan body or are station wagons. Full-size cars range in length from 4.9 meters to 5.1 meters and are typically sedan cars or, in Europe, station wagons. Minivans, also known as multi-purpose vehicles, or MPVs, typically have seating for up to eight passengers. Utility vehicles include SUVs, which are available with four-wheel drive systems that provide true off-road capabilities, and cross utility vehicles, or CUVs, which are not designed for heavy off-road use.
Light trucks may be divided between vans (also known as light commercial vehicles), which typically are used for the transportation of goods or groups of people and have a payload capability up to 4.2 tons, and pickup trucks, which are light motor vehicles with an open-top rear cargo area and which range in length from 4.8 meters to 5.2 meters (in North America, the length of pickup trucks typically ranges from 5.5 meters to 6 meters). In North America, minivans and utility vehicles are categorized within trucks. In Europe, vans and pickup trucks are categorized as light commercial vehicles.
23
We characterize a vehicle as “new” if its vehicle platform is significantly different from the platform used in the prior model year and/or has had a full exterior renewal. We characterize a vehicle as “significantly refreshed” if it continues its previous vehicle platform but has extensive changes or upgrades from the prior model.
Our Industry
Designing, engineering, manufacturing, distributing and selling vehicles require significant investments in product design, engineering, research and development, technology, tooling, machinery and equipment, facilities and marketing in order to meet both consumer preferences and regulatory requirements. Automotive OEMs are able to benefit from economies of scale by leveraging their investments and activities on a global basis across brands and models. The automotive industry has also historically been highly cyclical, and to a greater extent than many industries, is impacted by changes in the general economic environment. In addition to having lower leverage and greater access to capital, larger OEMs that have a more diversified revenue base across regions and products tend to be better positioned to withstand industry downturns and to benefit from industry growth.
Most automotive OEMs produce vehicles for the mass market and some of them also produce vehicles for the luxury market. Vehicles in the mass market are typically intended to appeal to the largest number of consumers possible. Intense competition among manufacturers of mass market vehicles, particularly for non-premium brands, tends to compress margins, requiring significant volumes to be profitable. As a result, success is measured in part by vehicle unit sales relative to other automotive OEMs. Luxury vehicles on the other hand are designed to appeal to consumers with higher levels of disposable income, and can therefore more easily achieve much higher margins. This allows luxury vehicle OEMs to produce lower volumes, enhancing brand appeal and exclusivity, while maintaining profitability.
In 2015, 87 million automobiles were sold around the world. Although China is the largest single automotive sales market with approximately 19 million passenger cars sold, the majority of automobile sales are still in the developed markets, including North America, Western Europe and Japan. Growth in other emerging markets has also played an increasingly important part in global automotive demand in recent years.
The automotive industry is highly competitive, especially in our key markets, such as the U.S., Brazil, China and Europe. Vehicle manufacturers must continuously improve vehicle design, performance and content to meet consumer demands for quality, reliability, safety, fuel efficiency, comfort, driving experience and style. Historically, manufacturers relied heavily upon dealer, retail and fleet incentives, including cash rebates, option package discounts, guaranteed depreciation programs, and subsidized or subvented financing or leasing programs to compete for vehicle sales. Since 2009, manufacturers generally have worked to maintain a reduced reliance on pricing-related incentives as competitive tools in the North American market, while pricing pressure, under different forms, is still affecting sales in the European market since the inception of the financial crisis. However, an OEM’s ability to increase or maintain vehicle prices and reduce reliance on incentives is limited by the competitive pressures resulting from the variety of available competitive vehicles in each segment of the new vehicle market as well as continued global manufacturing overcapacity in the automotive industry. At the same time, OEMs generally cannot effectively lower prices as a means to increase vehicle sales without adversely affecting profitability, since the ability to reduce costs is limited by commodity market prices, contract terms with suppliers, evolving regulatory requirements and collective bargaining agreements and other factors that limit the ability to reduce labor expenses. Due to the capital intensive nature of our industry, we expect there will be greater levels of cooperation among automakers in the future.
OEMs generally sell vehicles to dealers and distributors, which then resell vehicles to retail and fleet customers. Retail customers purchase vehicles directly from dealers, while fleet customers purchase vehicles from dealers or directly from OEMs. Fleet sales comprise three primary channels: (i) daily rental, (ii) commercial and (iii) government. Vehicle sales in the daily rental and government channels are extremely competitive and often require significant discounts. Fleet sales are an important source of revenue and can also be an effective means for marketing vehicles. Fleet orders can also help normalize plant production as they typically involve the delivery of a large, pre-determined quantity of vehicles over several months. Fleet sales are also a source of aftermarket service parts revenue for OEMs and service revenue for dealers.
24
Environmental and Other Regulatory Matters
We manufacture and sell our products and offer our services around the world.with requirements relating to reduced emissions, increased fuel economy, and our manufacturing facilities, with requirements for stack emissions, treatment of waste, water and hazardous materials and prohibitions on soil contamination. Our vehicles and the engines that power them must also comply with extensive regional, national and local laws and regulations and industry self-regulations (including those that regulate emissions certification, end-of-life vehicles and the chemical content of our parts, noise, and worker health and safety). In addition, vehicle safety regulations are becoming increasingly strict.
We are substantially in compliance with the relevant global regulatory requirements affecting our facilities and products. We constantly monitor such requirements and adjust our operations and processes to remain in compliance.
Our Group Environmental Guidelines (“Guidelines”) apply to all Group operations worldwide. These Guidelines specify our approach to environmental issues and provide clear instructions on setting and updating environmental objectives, developing new products and conducting daily activities around the globe. Our implementation of these Guidelines is designed to have the Group comply with all applicable environmental legislation and regulations, and where feasible, to outperform them.
Automotive Emissions
Numerous laws and regulations limit automotive emissions, including vehicle exhaust emission standards, vehicle evaporative emission standards and onboard diagnostic, or OBD, system requirements. Advanced OBD systems are used to identify and diagnose problems with emission control systems. Emission and OBD requirements become more challenging each year, requiring vehicles to continually meet lower emission standards and implement new diagnostics. We expect these requirements will continue to become even more rigorous worldwide, especially in light of a recent significant EPA action involving the tailpipe emissions of a competitor’s vehicles.
NAFTA Region
Under the U.S. Clean Air Act, the Environmental Protection Agency, or EPA, and the California Air Resources Board, or CARB (by EPA waiver), require emission compliance certification before a vehicle can be sold in the U.S. or in California (and many other states that have adopted the California emissions requirements)
.
Both agencies impose limits on tailpipe and evaporative emissions of certain smog-forming pollutants from new motor vehicles and engines, and in some cases dictate the pollution control methodology our engines must employ.
EPA recently issued new tailpipe and evaporative emission standards, as well as fuel requirements, under its Tier 3 Vehicle Emission and Fuel Standards Program, or Tier 3 standards. These Tier 3 standards are generally more stringent than prior standards, and thus make it more onerous to obtain emissions certifications for our vehicles. The Tier 3 standards are also generally aligned with California’s Low Emission Vehicle III, or LEV III, tailpipe and evaporative standards, discussed below. These standards would increase the requirements to conduct post-production vehicle testing to demonstrate compliance with these emissions limits for the estimated useful life of a vehicle, now for up to 15 years and 150,000 miles, depending on the compliance category, and are scheduled to become effective in model year 2017 for light-duty vehicles and 2018 for heavy-duty vehicles.
In addition, EPA and CARB regulations require that a vehicle’s emissions performance be monitored with OBD systems
.
We have implemented hardware and software systems in all our vehicles to comply with the OBD requirements
.
Conditions identified through OBD systems could lead to vehicle recalls (or other remedial actions such as extended warranties) with significant costs for related inspections, repairs or per-vehicle penalties.
California sets its own emissions standards pursuant to a waiver from EPA under the Clean Air Act. CARB’s LEV III standards relate to vehicle certification, OBD and tailpipe and evaporative emissions limitations, and apply to 2015 and later model year vehicles. CARB regulations also require that a specified percentage of cars and certain light-duty trucks sold in California must be zero emission vehicles, or ZEVs, such as electric vehicles or hydrogen fuel cell vehicles. A manufacturer can earn credits toward the ZEV requirement through the sale of advanced-technology vehicles such as hybrid electric vehicles or natural gas vehicles with extremely low tailpipe emissions and, as set forth in the LEV III standards, over-
25
complying with the federal model year 2017 through 2025 greenhouse gas standards, retiring such credits and applying them to its ZEV obligation. The ZEV regulations, which CARB revised most recently for the 2018 and subsequent model years, require increasing volumes of ZEVs with each model year. We currently comply with ZEV requirements using a variety of vehicles, including battery electric vehicles, or full ZEVs, internal combustion engine vehicles certified to very low tailpipe emissions and zero evaporative emissions, or partial ZEVs.
The Clean Air Act permits other states to adopt California’s emission standards, starting with the 2014 model year. In addition to California, twelve states, as well as the Province of Quebec, Canada, currently use California’s LEV III standards in lieu of the federal EPA standards, and 10 states also have adopted California’s ZEV requirements.
LATAM Region
Certain countries in South America follow U.S. procedures, standards and OBD requirements, while others follow the European procedures, standards and OBD requirements described below under
—EMEA Region
. In Brazil, vehicle emission standards have been in place since 1988 for passenger cars and light commercial vehicles, and these regulations were extended to light diesel vehicles in 2012. Argentina has implemented regulations that mirror the Euro 5 standards for all new vehicles.
APAC Region
China 4 standards, which mirror Euro 4 standards, are currently in place in China. These standards defined limits for polluting emissions and implemented European OBD requirements nationwide for newly registered vehicles. However, some major cities, such as Beijing and Shanghai, have already enforced more stringent China 5 emissions standards that mirror the Euro 5 standards discussed under
—EMEA Region
below. The Fiat Viaggio, Fiat Ottimo and Jeep Cherokee launched in China have been developed to meet China 5 standards. Beginning April 1, 2016, China 5 standards will be enforced in 11 coastal provinces and municipal cities. Nationwide implementation of China 5 standards will be required for gasoline engines beginning in 2017 and for light duty diesel engines beginning in 2018.
South Korea has adopted regulations that largely mirror CARB’s LEV II exhaust emissions standards and implemented regulations that mirror CARB’s LEV III regulations beginning January 1, 2016. In
Japan, vehicle emissions are regulated through the requirement that vehicles undergo the “specific driving cycle” procedure, an emissions testing procedure unique to Japan. However, Japan may adopt the Worldwide Harmonized Light Vehicle Testing Procedures as soon as 2016. These regulations will define a global harmonized standard for determining the levels of pollutants and CO
2
emissions, fuel or energy consumption for light-duty vehicles and electric range for battery electric vehicles or hybrids. India currently follows dual emission norms (Bharat Stage IV in a few cities and Bharat Stage III in the rest of India). India plans to adopt Bharat Stage IV emission norms (equivalent to Euro 4 standards) across India beginning in 2017. The Indian government recently announced that India will migrate to Bharat Stage VI emission norms in 2020, skipping Euro 5 equivalent norms.
EMEA Region
In Europe, emissions are regulated by two different entities: the European Commission, or EC, and the United Nations Economic Commission for Europe, or UNECE. The EC imposes standardized emission control requirements on vehicles sold in all 28 European Union, or EU, member states, while non-EU countries apply regulations under the UNECE framework. EU Member States can give tax incentives for the purchase of vehicles that meet emission standards earlier than the compliance date. We must demonstrate that our vehicles will meet emission requirements and receive approval from the appropriate authorities before our vehicles can be sold in EU Member States. The regulatory requirements include random testing of newly assembled vehicles and a manufacturer in-use surveillance program. EU and UNECE requirements are equivalent in terms of stringency and implementation.
In 2011, updated standards for exhaust emission by cars and light-duty trucks, called Euro 5, became effective. Impending European emission standards focus particularly on further reducing emissions from diesel vehicles. The new Euro 6 emission levels, effective for all passenger cars on September 1, 2015 (one year later for light commercial vehicles), require additional technologies and further increase the cost of diesel engines, which currently cost more than gasoline engines, although FCA US's gasoline models are already compliant with Euro 6. These new technologies will put additional cost pressures on the already challenging European market for small and mid-size diesel-powered vehicles. Further requirements of Euro 6 have been developed by the EC and are expected to be implemented on September 1, 2017. In addition, a new test
26
procedure has been defined to directly assess the regulated emissions of light duty vehicles under real driving conditions and will be effective for new passenger cars on September 1, 2017 and for all passenger cars on September 1, 2019 (one year later for light commercial vehicles.
Automotive Fuel Economy and Greenhouse Gas Emissions
NAFTA Region
Since the enactment of the 1975 Energy Policy and Conservation Act, or EPCA, the National Highway Traffic Safety Administration, or NHTSA, has enforced minimum Corporate Average Fuel Economy requirements, or CAFE standards, for fleets of new passenger cars and light-duty trucks sold in the U.S. These CAFE standards apply to all manufacturers’ 2011-2025 model year domestic and imported passenger car and light-duty truck fleets. The 2007 Energy Independence and Security Act revised EPCA and required NHTSA to establish more stringent CAFE standards beginning with the 2011 model year.
Since the enactment of the Clean Air Act in 1965, EPA has enforced a variety of smog-forming tailpipe emissions and fuels requirements for light, medium and heavy-duty vehicles; greenhouse gases, or GHGs, were not regulated. In 2007, the U.S. Supreme Court held that GHGs are a “pollutant” under the Clean Air Act.
Because fuel economy performance dictates GHG emissions, and vice-versa, in 2009 NHTSA and EPA began promulgating “footprint-based” CAFE and GHG rules, meaning that each automaker’s fleet fuel economy and GHG emissions requirements are dependent on the size of the vehicle, and dependent on the sales volumes and the mix of models in the manufacturer’s fleet for that model year. EPA and NHTSA have issued two joint final rules governing GHG and fuel economy, respectively, for light-duty vehicles, covering model years 2012 through 2025 (although California adopted its own more stringent GHG rules, CARB agreed that compliance with the federal GHG rules constitutes compliance with CARB’s rules).
The rules provide for year-over-year increases in fuel economy, and corresponding decreases in GHG emissions, until each automaker’s average fleet-wide standards reach 54.5 mpg by 2025. The rules also call for a “mid-term review,” commencing in 2017 and to be completed by 2021, that compels EPA and NHTSA to evaluate the market acceptance of advance vehicle technology as well as the other assumptions that formed the basis for the stringency of the joint rules, to determine whether the 2022-2025 standards are appropriate. Specific provisions of the GHG rule contain a variety of compliance flexibilities, including the ability to purchase and sell GHG emissions credits amongst automakers, incentives for sales of electric vehicles and hybrids, as well as alternative fuels like compressed natural gas or hydrogen fuel cell vehicles, and the use of the ultra-low global warming potential refrigerant HFO1234yf. The CAFE rule continues to require that passenger cars imported into the U.S. are averaged separately from those manufactured in the U.S., that light duty trucks are not subject to that distinction, and that a civil fine can be paid in lieu of compliance (this is not the case under the GHG rule), and now allows the purchase and sale of CAFE credits as a compliance flexibility. The agencies have attempted to harmonize the two rules, which goal they generally achieved, but there are many inconsistencies that make compliance more difficult.
Additionally, EPA and NHTSA issued joint final rules in September 2011 that establish a similar GHG and fuel economy national program for medium and heavy-duty vehicles, beginning with model year 2014 for GHG standards and model year 2016 for fuel economy standards. Currently, EPA and NHTSA are in a proposed rulemaking period for “phase 2” of heavy-duty rules. The rules are proposed to commence in 2021, which would dictate that the 2018 standards would remain in place for model years 2019-2020.
While we believe that our current product plan will meet the applicable CAFE and GHG standards, our compliance depends on our ability to implement design features, take further costly actions, purchase GHG and/or CAFE credits, or to limit the sale of certain of our vehicles. If the vehicles we develop to comply with these requirements are not appealing to consumers or cannot be sold at a competitive price, we may not be able to achieve the vehicle fleet mix, depending on the type and volume of our customers’ purchases, which would enable us to meet the stringent fuel economy/GHG requirements, even though our long-range projection plans out a compliant path.
Canada and Mexico each have adopted GHG regulations that are generally harmonized with the U.S. GHG laws.
27
LATAM Region
In Brazil, governmental bodies and the Automobile Manufacturers Association have established a voluntary national program for the evaluation and labeling of light passenger and commercial vehicles equipped with internal combustion gasoline engines. This voluntary program, in which we participate, aims to increase vehicle energy efficiency by labeling vehicles with fuel consumption measurements for urban, extra-urban and combined (similar to city and highway mpg measurements in the U.S.) driving conditions.
In October 2012, the Brazilian government issued a decree which provides indirect tax incentives to eligible participant companies. As a first step, participant companies of the program have to meet vehicle energy efficiency targets on vehicles sold from October 1, 2016 to September 30, 2017. The level of potential indirect tax incentives varies based on the degree to which and the timing of when targets are met. To the extent targets are not met, penalties and interest are levied and no indirect tax incentives are available.
APAC Region
In China, Phase III of the Corporate Average Fuel Consumption (CAFE) is in place from 2012 to 2015 calendar year. Phase IV, covering 2016-2020 calendar years, provides an industry target of 5.0 liters per 100 kilometers by 2020 and includes single vehicle limits, yearly phase-in coefficients and off-cycle credits. Regulators are considering additional provisions for Phase IV, including penalties. India is also expected to introduce a corporate average fuel economy regulation in 2016.
South Korea has implemented a new phase of CAFE/CO
2
standards
beginning January 1, 2016 and the South Korea industry targets for 2020 are 95g CO
2
per kilometer and 24.5 kilometers per liter. Japan has implemented single vehicle limits, which require each individual vehicle sold in the country to meet a minimum fuel economy. In Japan, each vehicle must have a minimum fuel economy of 16.8 kilometers per liter by model year 2015 and 20.3 kilometers per liter by model year 2020, with penalties established for non-compliance.
EMEA Region
Legislation governing vehicle GHG emissions as a means of improving automotive fuel economy was passed in 2009 and went into effect in 2012 (generally GHG regulations focus on CO
2
). Each automobile manufacturer must meet a specific sales-weighted fleet average target for CO
2
emissions as related to vehicle weight. The phase in of this fleet-average requirement began in 2012, with full compliance required by 2015. In order to promote the sale of ultra-efficient vehicles, automobile manufacturers that sell vehicles emitting less than 50 grams of CO
2
per kilometer earn additional CO
2
credits. Furthermore, automobile manufacturers that make use of innovative technologies, or eco-innovations, which improve real-world fuel economy but may not show in the test cycle, such as solar panels or low-emission glass, may gain an average credit for the manufacturer's fleet of up to seven grams of CO
2
per kilometer. These credits may not be transferred. The legislation also sets a fleet average target of 95 grams of CO
2
per kilometer starting in 2020. We are developing a compliance plan to achieve these required targets.
In 2011, the EU adopted standards for regulating CO
2
emissions from light commercial vehicles. This regulation, modeled after CO
2
emissions regulation for passenger cars, proposed that new light commercial vehicles meet a fleet average CO
2
target of 175 grams of CO
2
per kilometer. The new regulation phased in beginning in 2014, with full compliance required by 2017. The manufacturer-specific CO
2
compliance target will be determined as a function of the weight of the vehicle in running order (including driver). Flexible compliance strategies, such as eco-innovations and super credits, are part of these light commercial vehicle standards as well. Additionally, an EU long-term target for 2020 of 147 grams of CO
2
per kilometer has been adopted for light commercial vehicles. We are developing a compliance plan to achieve the required targets.
The regulatory implementation of the 95 grams of CO
2
per kilometer (for passenger cars) and 147 grams of CO
2
per kilometer (for light commercial vehicles) targets have been approved. The individual manufacturer’s targets will continue to be determined based on average vehicle mass. Other compliance flexibilities have been proposed, adding additional challenges to compliance with the CO
2
fleet target. Flexibilities include: phase-in, which, for 2020 only, excludes from the average calculation the five percent of passenger cars with higher fuel consumption; and supercredits and eco-innovations award passenger cars equipped with low emission technologies, challenging automakers to introduce increasingly innovative technologies. In this sense, phase-in makes compliance easier while supercredits and eco-innovations encourage low-
28
emission technologies and vehicles. We are also taking into consideration these challenges while defining our compliance plan.
An EC regulation requiring low-rolling resistance tires, tire pressure monitoring systems and gear shift indicators was adopted in 2011 and became effective in 2012. Further, an additional EC regulation has been adopted that will require labeling of tires for noise and fuel efficiency, affecting vehicles at the point of sale as well as the sale of tires in the aftermarket.
Twenty EU Member States have introduced fuel consumption or CO
2
-based vehicle taxation schemes. These tax measures are within the jurisdiction of the EU Member States. We are faced with significant challenges with respect to the predictability of future tax laws and differences in tax schemes and thresholds.
In the EMEA region, other countries have introduced specific regulations to reduce vehicle CO
2
emissions or fuel consumption, such as Switzerland and Saudi Arabia (SASO).
Vehicle Safety
NAFTA Region
Under U.S. federal law, all vehicles sold in the U.S. must comply with Federal Motor Vehicle Safety Standards, or FMVSS promulgated by NHTSA, and must be certified by their manufacturer as being in compliance with all such standards at the time of the first purchase of the vehicle other than for resale. In addition, if a vehicle contains a defect that is related to motor vehicle safety or does not comply with an applicable FMVSS, the manufacturer must notify NHTSA and vehicle owners and provide a remedy. Moreover, the Transportation Recall Enhancement, Accountability, and Documentation (“TREAD
”
) Act authorized NHTSA to promulgate regulations requiring Early Warning Reporting, or EWR. EWR requires manufacturers to provide NHTSA several categories of information, including all claims which involve one or more fatalities or injuries; all incidents of which the manufacturer receives actual notice which involve fatalities or injuries which are alleged or proven to have been caused by a possible defect in such manufacturer’s motor vehicle or motor vehicle equipment in the U.S.; and all claims involving one or more fatality or in a foreign country when the possible defect is in a motor vehicle or motor vehicle equipment that is identical or substantially similar to a motor vehicle or motor vehicle equipment offered for sale in the U.S., as well as aggregate data on property damage claims from alleged defects in a motor vehicle or in motor vehicle equipment; warranty claims (including good will); consumer complaints and field reports about alleged or possible defects. The rules also require reporting of customer satisfaction campaigns, consumer advisories, recalls, or other activity involving the repair or replacement of motor vehicles or items of motor vehicle equipment, even if not safety related.
The compliance of TREAD Act EWR submissions has received heightened scrutiny recently, and resulted in three manufacturers, including FCA, agreeing to pay substantial civil penalties for deficient TREAD Act EWR submissions. Furthermore, in early 2016, NHTSA announced a set of Proactive Safety Principles to be implemented collaboratively with the industry. One of these principles is to enhance analysis and examination of Early Warning Reporting data, with a goal of incorporating advanced data analytics into future EWR analyses. Recently enacted legislation requires NHTSA to implement additional enhancements. Whether these enhancements remain voluntary, or are incorporated into future regulatory requirements, they will require substantial investments in advanced information technology solutions going forward. The specific commitments and associated expenditures related to the three other Principles (which are (1) enhancing and facilitating proactive safety; (2) maximize safety recall participation rates; and (3) enhance automotive cybersecurity) are unknown at this time, but are likely to involve the commitment of significant resources, both in terms of staffing and other investments.
Several new or amended FMVSSs will take effect during the next few years in certain instances under phase-in schedules that require only a portion of a manufacturer’s fleet to comply in the early years of the phase-in. These include an amendment to the side impact protection requirements that added several new tests and performance requirements (FMVSS No. 214), an amendment to roof crush resistance requirements (FMVSS No. 216), and a new rule for ejection mitigation requirements (FMVSS No. 226). In addition, NHTSA has adopted a new FMVSS that will require all light vehicles to be equipped with a rear-mounted video camera and an in-vehicle visual display, and has proposed to mandate the installation of event data recorders. NHTSA has also secured a voluntary commitment from manufacturers, including FCA, to equip future
29
vehicles with Automatic Electronic Braking systems. Compliance with these new requirements and commitments, as well as other possible prospective NHTSA requirements, is likely to be difficult and/or costly.
NHTSA has published guidelines for driver distraction, and, although not rising to the level of a FMVSS, there may be substantial costs associated with conformance.
At times, organizations like NHTSA or the U.S. Insurance Institute of Highway Safety, or IIHS, issue or reissue safety ratings applicable to vehicles. Changes to these ratings are subject to the agencies’ discretion. IIHS recently introduced new tests and modified its “Top Safety Pick” protocol. Pursuant to the new protocol, many of our vehicles’ existing Top Safety Pick ratings are at risk, and we could incur significant expense to maintain those ratings, or could suffer negative public relations if we do not maintain them.
Finally, NHTSA previously announced that it would issue regulations regarding its Connected Vehicles strategy in 2013. A specific proposal is expected in the first half of 2016. These regulations could subject the Group to substantial costs for vehicle integration components and software and may require auto manufacturers to provide significant funding for a national technology operating system. The regulations may also implicate cybersecurity issues that place additional legal and financial responsibilities on the Group.
In Mexico, a new safety regulation based on U.S. standards is expected to take effect in 2016 which will, among other things, include a deadline to provide the federal consumers agency of the launching date and a detailed description of every safety campaign related to vehicles sold in Mexico.
LATAM Region
Most countries, including Argentina and Brazil, have adopted standards that follow the European regulations for vehicle safety. In these countries, efforts are under way to further conform regulations to those in place in Europe. See
—EMEA Region
below.
APAC Region
Many countries in the Asia Pacific region, including China, South Korea, Japan and India, have adopted or are adopting measures for pedestrian protection.
EMEA Region
Vehicles sold in Europe are subject to vehicle safety regulations established by the EU or, in very limited cases and aspects, by individual Member States. In 2009, the EU established a simplified framework for vehicle safety, repealing more than 50 then-existing directives and replacing them with a single regulation aimed at incorporating relevant United Nations, or UN, standards. The incorporation of UN standards commenced in 2012. With respect to regulations on advanced safety systems, the EC now requires new model cars from 2011 on to have electronic stability control systems, required tire pressure monitoring systems beginning in 2012, introduced regulations relating to low-rolling resistance tires in 2013 and require heavy vehicles to have advanced emergency braking systems and lane departure warning systems. From April 2009, the criteria for whole vehicle type approval were extended to cover all new road vehicles, to be phased in over five years depending on the vehicle category. The extension also clarifies the criteria applicable to small commercial vehicles. In the EU, new safety requirements came into force starting in November 2012 for new vehicle types and came into force in 2014 for all new vehicles sold in the EU market. The new mandatory measures include safety belt reminders, electric car safety requirements and easier child seat anchorages. In addition, starting from 2018 in-vehicle emergency call systems will be mandatory in the EU markets. In Russia, a similar in-vehicle emergency call system became mandatory in January 2015.
Industrial Environmental Control
Our operations are subject to a wide range of environmental protection laws including those laws regulating air emissions, water discharges, waste management and environmental clean-up. Certain environmental statutes require that responsible parties fund remediation actions regardless of fault, legality of original disposal, or ownership of a disposal site. Under certain circumstances, these laws impose joint and several liability as well as liability for related damages to natural resources. Our Environmental Management System, or EMS, formalizes our commitment to responsible management of the
30
environment. Applied at all plants operating worldwide, the EMS consists of methodologies and processes designed to prevent or reduce the environmental impact of our manufacturing activities, and our Group Environmental Guidelines establish our policies on environmental targets.
Implementing an EMS compliant with the requirements of the ISO 14001 standard is one of our main objectives. Receipt of an ISO 14001 certification confirms that an organization has a management system capable of keeping the environmental impact of its operations under control and that it systematically seeks to improve this system in a way that is coherent, effective and, above all, sustainable.
Our focus on environmental and sustainability issues is also reflected through our internal WCM manufacturing system, which currently covers the majority of our plants.
Workplace Health and Safety
We are committed to ensuring a safe and healthy working environment for all our employees, and have also extended these efforts toward suppliers, service providers and customers. Our Occupational Health and Safety Guidelines are certified to the OHSAS 18001 standards. We focus on the following areas: application of uniform procedures for the identification and evaluation of risks, standards of safety and ergonomics in plant and machinery design, promotion of safe behavior through training initiatives and awareness campaigns, assurance of a healthy work environment and promotion of a healthy lifestyle. For several years, we have been tracking and analyzing monthly performance data in each of these areas to ensure that objectives are being met.
As of
December 31, 2015
, a total of 136 plants (including three operated through joint ventures), accounting for more than 180,000 employees, had an OHSMS in place and were OHSAS 18001-certified.
Financial Services
Because dealers and retail customers finance the purchase of a significant percentage of the vehicles sold worldwide, the availability and cost of financing is one of the most significant factors affecting vehicle sales volumes. Most dealers use wholesale or inventory financing arrangements to purchase vehicles from OEMs in order to maintain necessary vehicle inventory levels. Financial services companies may also provide working capital and real estate loans to facilitate investment in expansion or restructuring of the dealers’ premises. Financing may take various forms based on the nature of creditor protection provided under local law, but financial institutions tend to focus on maximizing credit protection on any financing originated in conjunction with a vehicle sale. Financing to retail customers takes a number of forms, including simple installment loans and finance leases. These financial products are usually distributed directly by the dealer and have a typical duration of three to five years. OEMs often use retail financing as a promotional tool, including through campaigns offering below market rate financing known as subvention programs. In such situations, an OEM typically compensates the financial services company up front for the difference between the financial return expected under standard market rates and the rates offered to the customer within the promotional campaign.
Many automakers rely on wholly-owned or controlled finance companies to provide this financing. In other situations, OEMs have relied on joint ventures or commercial relationships with banks and other financial institutions in order to provide access to financing for dealers and retail customers. The model adopted by any particular OEM in a particular market depends upon, among other factors, its sales volumes and the availability of stable and cost-effective funding sources in that market, as well as regulatory requirements.
Financial services companies controlled by OEMs typically receive funding from the OEM’s central treasury or from industrial and commercial operations of the OEM that have excess liquidity, however, they also access other forms of funding available from the banking system in each market, including sales or securitization of receivables either in negotiated sales or through securitization programs. Financial services companies controlled by OEMs compete primarily with banks, independent financial services companies and other financial institutions that offer financing to dealers and retail customers. The long-term profitability of finance companies also depends on the cyclical nature of the industry, interest rate volatility and the ability to access funding on competitive terms and to manage risks with particular reference to credit risks. OEMs within their global strategy aimed to expand their business, may provide access to financial services to their dealers and retail customers, for the financing of parts and accessories, as well as pre-paid service contracts.
31
Applicability of Banking Law and Regulation to Financial Services
Several of our captive finance companies, each of which provide financial services to our customers, are regulated as financial institutions in the jurisdictions in which they operate. Fidis S.p.A. and FCA Bank S.p.A., each incorporated in Italy, are subject to Bank of Italy supervision. Banco Fidis S.A., incorporated in Brazil, is subject to Brazilian Central Bank supervision. Fiat Credito Compañia Financiera S.A., incorporated in Argentina, is subject to Argentinian Central Bank supervision. FCA Automotive Finance Co., Ltd, incorporated in China, is subject to the supervision of the Chinese Banking Regulatory Commission and People’s Bank of China. As a result, those companies are subject to regulation in a wide range of areas including solvency, capital requirements, reporting, customer protection and account administration, among other matters.
Overview of Our Business
We design, engineer, develop and manufacture vehicles, components and production systems worldwide through
164
manufacturing facilities and
84
research and development centers (excluding Ferrari facilities and centers).
Our activities are carried out through six reportable segments: four regional mass-market vehicle segments, the Maserati global luxury brand segment and a global Components segment.
Our four regional mass-market vehicle reportable segments deal with the design, engineering, development, manufacturing, distribution and sale of passenger cars, light commercial vehicles and related parts and services in specific geographic areas: NAFTA, LATAM, APAC and EMEA. We also operate on a global basis in the luxury vehicle and components sectors. In the luxury vehicle sector, we have the Maserati operating segment, while in the components sector we have three operating segments: Magneti Marelli, Teksid and Comau.
We support our mass-market vehicle sales with the sale of related service parts and accessories, as well as service contracts, under the Mopar brand name. In support of our vehicle sales efforts, we make available dealer and retail customer financing either through subsidiaries or joint ventures and through strategic commercial arrangements with third party financial institutions.
For our mass-market vehicle brands, we have centralized design, engineering, development and manufacturing operations, which allow us to efficiently operate on a global scale.
The following list sets forth our six reportable segments:
|
(i)
|
NAFTA
: our operations to support distribution and sales of mass-market vehicles in the United States, Canada, Mexico and Caribbean islands primarily through the Chrysler, Dodge, Fiat, Jeep, Ram and Alfa Romeo brands, and the sales of related parts and accessories under the Mopar brand name.
|
|
(ii)
|
LATAM
: our operations to support the distribution and sale of mass-market vehicles in South and Central America primarily under the Fiat, Jeep, Chrysler, Dodge and Ram brands, with the largest focus of our business in the LATAM segment in Brazil and Argentina.
|
|
(iii)
|
APAC
: our operations to support the distribution and sale of mass-market vehicles in the Asia Pacific region (mostly in China, Japan, Australia, South Korea and India) carried out in the region through both subsidiaries and joint ventures, primarily under the Abarth, Alfa Romeo, Chrysler, Dodge, Fiat and Jeep brands.
|
|
(iv)
|
EMEA
: our operations to support the distribution and sale of mass-market vehicles in Europe (which includes the 28 members of the European Union and the members of the European Free Trade Association), the Middle East and Africa primarily under the Abarth, Alfa Romeo, Chrysler, Fiat, Fiat Professional, Jeep and Lancia brand names.
|
|
(v)
|
Maserati
: the design, engineering, development, manufacturing, worldwide distribution and sale of luxury vehicles under the Maserati brand.
|
|
(vi)
|
Components
: production and sale of lighting components, body control units, suspensions, shock absorbers, electronic systems, and exhaust systems and activities in powertrain (engine and transmissions) components,
|
32
engine control units, plastic molding components and in the after-market carried out under the Magneti Marelli brand name; cast iron components for engines, gearboxes, transmissions and suspension systems, and aluminum cylinder heads under the Teksid brand name; and design and production of industrial automation systems and related products for the automotive industry under the Comau brand name.
The following chart sets forth the mass-market vehicle brands we sell in each mass-market regional segment:
|
NAFTA
|
LATAM
|
APAC
|
EMEA
|
||||
|
Abarth
|
X
|
|
X
|
X
|
|||
|
Alfa Romeo
|
X
|
|
X
|
X
|
|||
|
Chrysler
|
X
|
X
|
X
|
X
|
|||
|
Dodge
|
X
|
X
|
X
|
|
|||
|
Fiat
|
X
|
X
|
X
|
X
|
|||
|
Fiat Professional
|
|
|
X
|
X
|
|||
|
Jeep
|
X
|
X
|
X
|
X
|
|||
|
Lancia
|
|
|
|
X
|
|||
|
Ram
|
X
|
X
|
|
|
|||
______________________
Note: Presence determined by sales in the regional segment, if material, through dealer entities of our dealer network.
We also hold interests in companies operating in other activities and businesses that are not considered part of our six reportable segments. These activities are grouped under “Other Activities,” which primarily consists of companies that provide services, including accounting, payroll, tax, insurance, purchasing, information technology, facility management and security for the Group as well as CNH Industrial N.V. (“CNHI”), manage central treasury activities and operate in media and publishing.
Mass-Market Vehicles
Mass-Market Vehicle Brands
We design, engineer, develop, manufacture, distribute and sell vehicles and service parts under 11 mass-market vehicle brands and designations. We believe that we can continue to increase our vehicle sales by building the value of our mass-market vehicle brands in particular by ensuring that each of our brands has a clear identity and market focus. Our mass-market vehicle brands are:
|
•
|
Abarth
: Abarth, named after the company founded by Carlo Abarth in 1949, specializes in performance modification for on-road sports cars.
|
|
•
|
Alfa Romeo
: Alfa Romeo, founded in 1910, and part of the Group since 1986, is known for a long, sporting tradition and Italian design. The Alfa Romeo brand is intended to appeal to drivers seeking high-level performance and handling combined with attractive and distinctive appearance.
|
|
•
|
Chrysler
: Chrysler, named after the company founded by Walter P. Chrysler in 1925, aims to create vehicles with distinctive design, craftsmanship, intuitive innovation and technology standing as a leader in design, engineering and value.
|
|
•
|
Dodge
: With a traditional focus on “muscle car” performance vehicles, the Dodge brand, which began production in 1914, offers a full line of vehicles intended to offer an excellent value for families looking for high performance, dependability and functionality in everyday driving situations.
|
|
•
|
Fiat
: Fiat brand cars have been produced since 1899 and are currently primarily focused on the mini and small vehicle segments. The brand aims to make cars that are flexible, easy to drive, affordable and energy efficient.
|
33
|
•
|
Fiat Professional
: Fiat Professional, launched in 2007 to replace the “Fiat Veicoli Commerciali” brand, offers light commercial vehicles and MPVs for commercial use by small to medium size business and public institutions.
|
|
•
|
Jeep
: Jeep, founded in 1941, is a globally recognized brand focused exclusively on the SUV and off-road vehicles market. Jeep set an all-time brand record in 2015 with over 1.3 million worldwide shipments.
|
|
•
|
Lancia
: Lancia, founded in 1906, and part of the Fiat Group since 1969, covers the spectrum of small segment cars and is targeted towards the Italian market.
|
|
•
|
Ram
: Ram, established as a standalone brand separate from Dodge in 2009, offers a line of full-size trucks, including light and heavy-duty pickup trucks, as well as light commercial vehicles.
|
In addition, the Mopar brand provides a full line of service parts and accessories for our mass-market vehicles worldwide. As of
December 31, 2015
, we had 51 parts distribution centers throughout the world to support our customer care efforts in each of our regions. Our Mopar brand accessories allow our customers to customize their vehicles by including after-market sales of products from side steps and lift-kits, to graphics packages, such as racing stripes, and custom leather interiors. Further, through the Mopar brand, we offer vehicle service contracts to our retail customers worldwide under the “Mopar Vehicle Protection” brand, with the majority of our service contract sales in
2015
in the U.S. and Europe. Finally, our Mopar customer care initiatives support our vehicle distribution and sales efforts in each of our mass-market segments through 25 call centers located around the world.
Mass-Market Vehicle Design and Manufacturing
Our mass-market vehicle brands target different groups of consumers in different regions. Leveraging the potential of our broad portfolio of brands, a key component of our strategic plan is to offer vehicles that appeal to a wide range of consumers located in each regional market. In order to optimize the mix of products we design and manufacture, a number of factors are considered, including:
|
•
|
consumer tastes, trends and preferences for certain vehicle types which vary based on geographic region, as well as regulatory requirements affecting our ability to meet consumer demands in those regions;
|
|
•
|
demographic trends, such as age of population and rate of family formation;
|
|
•
|
social and economic factors that affect preferences for optional features, affordability and fuel efficiency;
|
|
•
|
competitive environment, in terms of quantity and quality of competitors’ vehicles offered within a particular segment;
|
|
•
|
our brand portfolio, as each of our brands targets a different group of consumers, with the goal of avoiding overlapping product offerings or creating internal competition among brands and products;
|
|
•
|
our ability to leverage synergies with existing brands, products, platforms and distribution channels;
|
|
•
|
the impact of our products and processes on the environment;
|
|
•
|
development of a diversified portfolio of innovative technology solutions for both conventional engine technologies and alternative fuels and propulsion systems; and
|
|
•
|
manufacturing capacity, regulatory requirements and other factors that impact product development, including ability to minimize time-to-market for new vehicle launches.
|
We also consider these factors in developing a mix of vehicles within each brand, with an additional focus on ensuring that the vehicles we develop further our brand strategy.
We sell mass-market vehicles in all segments of the passenger car and truck markets. Our passenger car product portfolio includes vehicles such as the Fiat 500 (which has sold more than 1 million units globally since its launch in 2007),
34
Alfa Romeo Giulietta, Dodge Charger and Lancia Ypsilon. Our light commercial vehicles include vans such as the Fiat Professional Doblò, Fiat Professional Ducato and Ram ProMaster, and light and heavy-duty pickup trucks such as the Ram 1500 and 2500/3500. We also sell SUVs and CUVs in a number of vehicle segments, such as the Jeep Grand Cherokee, including expanding into the small SUV segment market with the recently-launched Jeep Renegade.
In order to leverage our brand recognition and names in various regions, we re-badge certain vehicles manufactured and sold in a region under one brand for sale in another region under a different brand based on brand recognition and equity in the particular region. For instance, we sell a re-badged version of the Dodge Journey as the Fiat Freemont in several markets outside the NAFTA region.
We also make use of common technology and parts in our vehicles. For example, we have produced almost six million Pentastar V-6 engines since 2010, for use in the Jeep Grand Cherokee, the Ram 1500 and 13 other vehicles. Because we designed this engine with flexible architecture, we can use it in a range of models, potentially with a variety of advanced technologies, such as direct injection or turbocharging.
Our efforts to respond to customer demand have led to a number of important initiatives, including the commencement of localized production of a Jeep vehicle in China to be sold in China, which will leverage the Jeep brand’s name recognition in that market.
Throughout our manufacturing operations, we have deployed WCM principles. WCM principles were developed by the WCM Association, a non-profit organization dedicated to developing superior manufacturing standards. We are the only OEM that is a member of the WCM Association. WCM fosters a manufacturing culture that targets improved safety, quality and efficiency, as well as the elimination of all types of waste. Unlike some other advanced manufacturing programs, WCM is designed to prioritize issues to focus on those initiatives believed likely to yield the most significant savings and improvements, and to direct resources to those initiatives. Concurrently with our January 2014 acquisition of the remaining 41.5 percent of FCA US owned by the VEBA Trust, FCA US entered into a memorandum of understanding to supplement the existing collective bargaining agreement with the International Union, United Automobile, Aerospace and Agricultural Implement Workers of America (the “UAW”), and provide for a specific commitment to support the implementation of our WCM principles throughout FCA US's manufacturing facilities, to facilitate benchmarking across all of our manufacturing plants and actively assist in the achievement of FCA US's long-term business plan. Beginning in 2006, we engaged key suppliers in the pilot phase of WCM Lite, a program through which suppliers can learn and incorporate WCM principles into their own operations.
Vehicle Sales Overview
We are the
seventh
largest automotive OEM in the world based on worldwide new vehicle sales for the
year ended December 31, 2015
. We compete with other large OEMs to attract vehicle sales and market share. Many of these OEMs have more significant financial or operating resources and liquidity at their disposal, which may enable them to invest more heavily on new product designs and manufacturing or in sales incentives.
35
Our new vehicle sales represent sales of vehicles primarily through dealers and distributors, or in some cases, directly by us, to retail customers and fleet customers. Our sales include mass-market and luxury vehicles manufactured at our plants, as well as vehicles manufactured by our joint ventures and third party contract manufacturers. Our sales figures exclude sales of vehicles that we contract manufactured for other OEMs. While our vehicle sales are illustrative of our competitive position and the demand for our vehicles, sales are not directly correlated to our revenues, cost of sales or other measures of financial performance, as such results are primarily driven by our vehicle shipments to dealers and distributors. For a discussion of our shipments, see
Item 5A. Operating Results—Shipment Information
. The following table shows our new vehicle sales by geographic market for the periods presented.
|
For the Years Ended December 31,
|
|||||||||
|
Segment
|
2015
|
2014
|
2013
|
||||||
|
Millions of units
|
|||||||||
|
NAFTA
|
2.6
|
|
2.5
|
|
2.1
|
|
|||
|
LATAM
|
0.6
|
|
0.8
|
|
0.9
|
|
|||
|
APAC
|
0.2
|
|
0.3
|
|
0.2
|
|
|||
|
EMEA
|
1.3
|
|
1.2
|
|
1.1
|
|
|||
|
Total Mass-Market Vehicle Brands
|
4.7
|
|
4.8
|
|
4.4
|
|
|||
|
Maserati
|
0.04
|
|
0.04
|
|
0.02
|
|
|||
|
Total Worldwide
|
4.7
|
|
4.8
|
|
4.4
|
|
|||
NAFTA
NAFTA Sales and Competition
The following table presents our mass-market vehicle sales and estimated market share in the NAFTA segment for the periods presented:
|
For the Years Ended December 31,
|
||||||||||||||||||
|
2015
(1),(2)
|
2014
(1),(2)
|
2013
(1),(2)
|
||||||||||||||||
|
NAFTA
|
Group Sales
|
Market Share
|
Group Sales
|
Market Share
|
Group Sales
|
Market Share
|
||||||||||||
|
Thousands of units (except percentages)
|
||||||||||||||||||
|
U.S.
|
2,244
|
|
12.6
|
%
|
2,091
|
|
12.4
|
%
|
1,800
|
|
11.4
|
%
|
||||||
|
Canada
|
293
|
|
15.2
|
%
|
290
|
|
15.4
|
%
|
260
|
|
14.6
|
%
|
||||||
|
Mexico and Other
|
87
|
|
6.3
|
%
|
78
|
|
6.7
|
%
|
87
|
|
7.9
|
%
|
||||||
|
Total
|
2,624
|
|
12.4
|
%
|
2,459
|
|
12.4
|
%
|
2,148
|
|
11.5
|
%
|
||||||
________________________________
(1) Certain fleet sales that are accounted for as operating leases are included in vehicle sales.
(2) Our estimated market share data presented are based on management’s estimates of industry sales data, which use certain data provided by third-party sources, including IHS Global Insight and Ward’s Automotive.
36
The following table presents our new vehicle market share information and our principal competitors in the U.S., our largest market in the NAFTA segment:
|
For the Years Ended December 31,
|
|||||||||
|
U.S.
|
2015
|
2014
|
2013
|
||||||
|
Automaker
|
Percentage of industry
|
||||||||
|
GM
|
17.3
|
%
|
17.4
|
%
|
17.6
|
%
|
|||
|
Ford
|
14.7
|
%
|
14.7
|
%
|
15.7
|
%
|
|||
|
Toyota
|
14.0
|
%
|
14.1
|
%
|
14.1
|
%
|
|||
|
FCA
|
12.6
|
%
|
12.4
|
%
|
11.4
|
%
|
|||
|
Honda
|
8.9
|
%
|
9.2
|
%
|
9.6
|
%
|
|||
|
Nissan
|
8.3
|
%
|
8.2
|
%
|
7.9
|
%
|
|||
|
Hyundai/Kia
|
7.8
|
%
|
7.8
|
%
|
7.9
|
%
|
|||
|
Other
|
16.4
|
%
|
16.2
|
%
|
15.9
|
%
|
|||
|
Total
|
100.0
|
%
|
100.0
|
%
|
100.0
|
%
|
|||
U.S. automotive market sales have steadily improved after a sharp decline from 2007 to 2010. U.S. industry sales, including medium- and heavy-duty vehicles, increased from 10.6 million units in 2009 to 17.8 million units in 2015, an increase of approximately 68 percent. Both macroeconomic factors, such as growth in per capita disposable income and improved consumer confidence, and automotive specific factors, such as the increasing age of vehicles in operation, improved consumer access to affordably priced financing and higher prices of used vehicles, contributed to the strong recovery.
Our vehicle line-up in the NAFTA segment leverages the brand recognition of the Chrysler, Dodge, Jeep and Ram brands to offer cars, utility vehicles, pickup trucks and minivans under those brands, as well as vehicles in smaller segments, such as the Fiat 500 in the micro/small-segment and the Fiat 500X and Jeep Renegade in the small SUV/crossover segment. Our vehicle sales and profitability in the NAFTA segment are generally weighted towards larger vehicles such as utility vehicles, trucks and vans, while overall industry sales in the NAFTA segment generally are more evenly weighted between smaller and larger vehicles.
NAFTA Distribution
In the NAFTA segment, our vehicles are sold primarily to dealers in our dealer network for sale to retail customers and fleet customers. The following table sets forth the number of independent entities in our dealer and distributor network in the NAFTA segment. The table counts each independent dealer entity, regardless of the number of contracts or points of sale the dealer operates. Where we have a relationship with a general distributor, this table reflects that general distributor as one distribution relationship:
|
Distribution Relationships
|
At December 31,
|
|||||
|
2015
|
2014
|
2013
|
||||
|
NAFTA
|
3,261
|
3,251
|
3,204
|
|||
In the NAFTA segment, fleet sales in the commercial channel are typically more profitable than sales in the government and daily rental channels since they more often involve customized vehicles with more optional features and accessories; however, vehicle orders in the commercial channel are usually smaller in size than the orders made in the daily rental channel. Fleet sales in the government channel are generally more profitable than fleet sales in the daily rental channel primarily due to the mix of products included in each respective channel. Rental car companies, for instance, place larger orders of small and mid-sized cars and minivans with minimal options, while sales in the government channel often involve a higher mix of relatively more profitable vehicles such as pickup trucks, minivans and large cars with more options.
37
NAFTA Segment Mass-Market Dealer and Customer Financing
In the NAFTA segment, we do not have a captive finance company or joint venture and instead rely upon independent financial service providers, primarily our strategic relationship with Santander Consumer USA Inc., or SCUSA, to provide financing for dealers and retail customers in the U.S. Prior to the agreement with SCUSA, we principally relied on Ally Financial Inc., or Ally, for dealer and retail financing and support. Additionally, we have arrangements with a number of financial institutions to provide a variety of dealer and retail customer financing programs in Canada.
In February 2013, we entered into a private label financing agreement with SCUSA, or the SCUSA Agreement, under which SCUSA provides a wide range of wholesale and retail financial services to our dealers and retail customers in the U.S., under the Chrysler Capital brand name. The financial services include credit lines to finance dealers’ acquisition of vehicles and other products that we sell or distribute, retail loans and leases to finance retail customer acquisitions of new and used vehicles at dealerships, financing for commercial and fleet customers, and ancillary services. In addition, SCUSA offers dealers construction loans, real estate loans, working capital loans and revolving lines of credit.
The SCUSA Agreement has a ten year term from February 2013, subject to early termination in certain circumstances, including the failure by a party to comply with certain of its ongoing obligations under the SCUSA Agreement. In accordance with the terms of the agreement, SCUSA provided us an upfront, nonrefundable payment in May 2013 which is being amortized over ten years.
Under the SCUSA Agreement, SCUSA has certain rights, including limited exclusivity to participate in specified minimum percentages of certain retail financing rate subvention programs. SCUSA’s exclusivity rights are subject to SCUSA maintaining price competitiveness based on market benchmark rates to be determined through a steering committee process as well as minimum approval rates.
The SCUSA Agreement replaced an auto finance relationship with Ally, which was terminated in 2013. As of
December 31, 2015
, Ally was providing wholesale lines of credit to approximately 37.5 percent of our dealers in the U.S. For the
year ended December 31, 2015
, we estimate that approximately 85 percent of the vehicles purchased by our U.S. retail customers were financed or leased through our dealer network, of which approximately 50 percent were financed or leased through Ally and SCUSA.
In December 2015, FCA Mexico entered into a ten year private label financing agreement with FC Financial, S.A De C.V., Sofom, E.R., Grupo Financiaro Inbursa (“FC Financial”), a wholly owned subsidiary of Banco Inbursa, under which FC Financial provides a wide range of wholesale and retail financial services to our dealers and retail customers under the FCA Financial Mexico brand name. The wholesale repurchase obligation under the new agreement will be limited to wholesale purchases in case of actual or constructive termination of a dealer's franchise agreement.
38
LATAM
LATAM Sales and Competition
The following table presents our mass-market vehicle sales and market share in the LATAM segment for the periods presented:
|
For the Years Ended December 31,
|
||||||||||||||||||
|
2015
(1)
|
2014
(1)
|
2013
(1)
|
||||||||||||||||
|
LATAM
|
Group Sales
|
Market Share
|
Group Sales
|
Market Share
|
Group Sales
|
Market Share
|
||||||||||||
|
Thousands of units (except percentages)
|
||||||||||||||||||
|
Brazil
|
483
|
|
19.5
|
%
|
706
|
|
21.2
|
%
|
771
|
|
21.5
|
%
|
||||||
|
Argentina
|
74
|
|
11.9
|
%
|
88
|
|
13.4
|
%
|
111
|
|
12.0
|
%
|
||||||
|
Other LATAM
|
27
|
|
2.7
|
%
|
37
|
|
3.0
|
%
|
51
|
|
3.6
|
%
|
||||||
|
Total
|
584
|
|
14.2
|
%
|
830
|
|
16.0
|
%
|
933
|
|
15.8
|
%
|
||||||
______________________________
(1) Our estimated market share data presented are based on management’s estimates of industry sales data, which use certain data provided by third-party sources, including IHS Global Insight, National Organization of Automotive Vehicles Distribution and Association of Automotive Producers.
The following table presents our mass-market vehicle market share information and our principal competitors in Brazil, our largest market in the LATAM segment:
|
Brazil
|
For the Years Ended December 31,
|
||||||||
|
2015
(1)
|
2014
(1)
|
2013
(1)
|
|||||||
|
Automaker
|
Percentage of industry
|
||||||||
|
FCA
|
19.5
|
%
|
21.2
|
%
|
21.5
|
%
|
|||
|
GM
|
15.6
|
%
|
17.4
|
%
|
18.1
|
%
|
|||
|
Volkswagen (*)
|
15.2
|
%
|
17.7
|
%
|
18.8
|
%
|
|||
|
Ford
|
10.2
|
%
|
9.2
|
%
|
9.4
|
%
|
|||
|
Other
|
39.5
|
%
|
34.5
|
%
|
32.2
|
%
|
|||
|
Total
|
100.0
|
%
|
100.0
|
%
|
100.0
|
%
|
|||
__________________________________
(1) Our estimated market share data presented are based on management’s estimates of industry sales data, which use certain data provided by third-party sources, including IHS Global Insight, National Organization of Automotive Vehicles Distribution and Association of Automotive Producers.
(*) Including Audi.
The automotive industry within which the LATAM segment operates decreased 20.7 percent from
2014
, to 4.1 million vehicles (cars and light commercial vehicles) in
2015
reflecting continued macroeconomic weakness in the region with a decrease of 25.6 percent in Brazil and a decrease of 5 percent in Argentina.
Despite the 30 percent decrease in the Group's sales in LATAM from 2014, the Group remained the market leader in Brazil increasing its lead over its nearest competitor to 380 basis points with market share at 19.5 percent, which decreased 170 basis points due to strong competition and pricing actions taken to protect margins. In Argentina, overall market share declined from 13.4 percent to 11.9 percent mainly due to continued import restrictions.
Our vehicle sales in the LATAM segment leverage the name recognition of Fiat and the relatively urban population of countries like Brazil to offer Fiat brand mini and small vehicles in our key markets in the LATAM segment. We are the leading automaker in Brazil, due in large part to our market leadership in the mini and small segments (which represent almost 58 percent of Brazilian market vehicle sales). Fiat also leads the pickup truck market in Brazil (with the Fiat Strada, 54.1 percent of segment share), although this segment is small as a percentage of total industry and compared to other countries in the LATAM segment. In addition, the all-new Jeep Renegade continued its growth trend reaching 29.7 percent segment market share in Brazil in the fourth quarter of 2015 and was named the “2016 Car of the Year” in Brazil during the annual automotive industry award ceremony hosted by Autoesporte magazine (Editora Globo).
39
We started production in our new assembly plant in Pernambuco, Brazil in 2015, which is enabling us to introduce new locally-manufactured vehicles that are not subject to import restrictions.
LATAM Distribution
The following table presents the number of independent entities in our dealer and distributor network. In the LATAM segment, we generally enter into multiple dealer agreements with a single dealer, covering one or more points of sale. Outside Brazil and Argentina, our major markets, we distribute our vehicles mainly through general distributors and their dealer networks. This table counts each independent dealer entity, regardless of the number of contracts or points of sale the dealer operates. Where we have relationships with a general distributor in a particular market, this table reflects that general distributor as one distribution relationship:
|
Distribution Relationships
|
At December 31,
|
||||||||
|
2015
|
2014
|
2013
|
|||||||
|
LATAM
|
442
|
|
441
|
|
450
|
|
|||
LATAM Dealer and Customer Financing
In the LATAM segment, we provide access to dealer and retail customer financing through both wholly-owned captive finance companies and through strategic relationships with financial institutions.
We have two wholly-owned captive finance companies in the LATAM segment: Banco Fidis S.A. in Brazil and Fiat Credito Compañia Financiera S.A. in Argentina. These captive finance companies offer dealer and retail customer financing. In addition, in Brazil we have two significant commercial partnerships with Banco Itaù and Bradesco to provide financing to retail customers purchasing Fiat brand vehicles. Banco Itaù is a leading vehicle retail financing company in Brazil. This partnership was renewed in August 2013 for a ten-year term ending in 2023. Under this agreement, Banco Itaù has exclusivity on our promotional campaigns and preferential rights on non-promotional financing. We receive commissions in connection with each vehicle financing above a certain threshold. This agreement applies only to our retail customers purchasing Fiat branded vehicles only. In July 2015, FCA Fiat Chrysler Automoveis Brasil ("FCA Brasil") and Banco Fidis signed a ten-year partnership contract with Bradesco, through its affiliate Bradesco Financiamentos. Bradesco Financiamentos will finance retail sales of Jeep, Chrysler, Dodge and Ram vehicles in Brazil. Banco Fidis will be in charge of the commercial management of this partnership, intermediating the relationship between FCA Brasil clients and dealers with Bradesco Financiamentos regarding the offer of financial products. Under this agreement, Bradesco has exclusivity on promotional campaigns and FCA Brasil will promote Bradesco as official financial partner. We receive commissions for partnership and for acting as banking agent based on profitability and penetration reached by the partnership.
40
APAC
APAC Sales and Competition
The following table presents our vehicle sales in the APAC segment for the periods presented:
|
For the Years Ended December 31,
|
||||||||||||||||||
|
2015
(1),(2),(4)
|
2014
(1),(2),(4)
|
2013
(1),(2)
|
||||||||||||||||
|
APAC
|
Group Sales
|
Market Share
|
Group Sales
|
Market Share
|
Group Sales
|
Market Share
|
||||||||||||
|
Thousands of units (except percentages)
|
||||||||||||||||||
|
China
|
139
|
|
0.8
|
%
|
171
|
|
1.0
|
%
|
129
|
|
0.8
|
%
|
||||||
|
India
(3)
|
9
|
|
0.3
|
%
|
12
|
|
0.5
|
%
|
10
|
|
0.4
|
%
|
||||||
|
Australia
|
35
|
|
3.1
|
%
|
44
|
|
4.0
|
%
|
34
|
|
3.1
|
%
|
||||||
|
Japan
|
17
|
|
0.4
|
%
|
18
|
|
0.4
|
%
|
16
|
|
0.4
|
%
|
||||||
|
South Korea
|
7
|
|
0.4
|
%
|
6
|
|
0.5
|
%
|
5
|
|
0.4
|
%
|
||||||
|
APAC 5 major Markets
|
207
|
|
0.7
|
%
|
251
|
|
0.9
|
%
|
194
|
|
0.7
|
%
|
||||||
|
Other APAC
|
8
|
|
—
|
|
6
|
|
—
|
|
6
|
|
—
|
|
||||||
|
Total
|
215
|
|
—
|
|
257
|
|
—
|
|
199
|
|
—
|
|
||||||
__________________________________
(1) Our estimated market share data presented are based on management’s estimates of industry sales data, which use certain data provided by third-party sources, including R.L. Polk Data, and National Automobile Manufacturing Associations.
(2) Sales data include vehicles sold by certain of our joint ventures within the Chinese market and, until 2012, the Indian market. Beginning in 2013, we took over the distribution from the joint venture partner and we started distributing vehicles in India through wholly-owned subsidiaries.
(3) India market share is based on wholesale volumes.
(4) Group sales reflect retail deliveries. APAC industry reflects aggregate for major markets where the Group competes (China, Australia, Japan, South Korea, and India). Market share is based on retail registrations except, as noted above, in India where market share is based on wholesale volumes.
The automotive industry in the APAC segment has shown strong year-over-year growth. Industry sales in the five key markets (China, India, Japan, Australia and South Korea) where we compete increased from 16.1 million in 2009 to
28.2
million in
2015
, a compound annual growth rate (“CAGR”) of approximately 10 percent. Industry demand increased 5 percent with growth in China (8 percent), India (8 percent), South Korea (11 percent), Australia (4 percent), offsetting a 10 percent decline in Japan.
We sell a range of vehicles in the APAC segment, including small and compact cars and utility vehicles. Although our smallest mass-market segment by vehicle sales, we believe the APAC segment represents a significant growth opportunity and we have invested in building relationships with key joint venture partners in China and India in order to increase our presence in the region. In 2010, the demand for mid-size vehicles in China led us to begin a joint venture with Guangzhou Automobile Group Co. for the production of Fiat brand passenger cars and in October 2015, we began local production of the Jeep Cherokee at our joint-venture plant in Changsha, with deliveries of the first Chinese-made Jeep Cherokee in December 2015. In addition, the Fiat Ottimo and Fiat Viaggio, along with our other Fiat-branded vehicles imported from Europe and North America, are distributed through the joint venture’s local dealer network in that country. We also work with a joint venture partner in India to manufacture Fiat branded vehicles that we distribute through wholly-owned subsidiaries. In other parts of the APAC segment, we distribute vehicles that we manufacture in the U.S. and Europe through our dealers and distributors.
41
APAC Distribution
In the key markets in the APAC segment (China, Australia, India, Japan and South Korea), we sell our vehicles through a wholly-owned subsidiary or through our joint ventures to local independent dealers. In other markets where we do not have a substantial presence, we have agreements with general distributors for the distribution of our vehicles through their networks. The following table presents the number of independent entities in our dealer and distributor network. The table counts each independent dealer entity, regardless of the number of contracts or points of sale the dealer operates. Where we have relationships with a general distributor in a particular market, this table reflects that general distributor as one distribution relationship:
|
Distribution Relationships
|
At December 31,
|
|||||
|
2015
|
2014
|
2013
|
||||
|
APAC
|
681
|
729
|
671
|
|||
APAC Dealer and Customer Financing
In the APAC segment, we operate a wholly-owned captive finance company, FCA Automotive Finance Co., Ltd, which supports, on a non-exclusive basis, our sales activities in China through dealer and retail customer financing and provides similar services to dealers and customers of CNHI. Cooperation agreements are also in place with third party financial institutions to provide dealer network and retail customer financing in India, South Korea, Australia and Japan.
EMEA
EMEA Sales and Competition
The following table presents our passenger car and light commercial vehicle sales in the EMEA segment for the periods presented:
|
For the Years Ended December 31,
|
||||||||||||||||||
|
2015
(1),(2),(3)
|
2014
(1),(2),(3)
|
2013
(1),(2),(3)
|
||||||||||||||||
|
EMEA
Passenger Cars |
Group Sales
|
Market Share
|
Group Sales
|
Market Share
|
Group Sales
|
Market Share
|
||||||||||||
|
Thousands of units (except percentages)
|
||||||||||||||||||
|
Italy
|
446
|
|
28.3
|
%
|
377
|
|
27.7
|
%
|
374
|
|
28.7
|
%
|
||||||
|
Germany
|
90
|
|
2.8
|
%
|
84
|
|
2.8
|
%
|
80
|
|
2.7
|
%
|
||||||
|
UK
|
83
|
|
3.2
|
%
|
80
|
|
3.2
|
%
|
72
|
|
3.2
|
%
|
||||||
|
France
|
71
|
|
3.7
|
%
|
62
|
|
3.5
|
%
|
62
|
|
3.5
|
%
|
||||||
|
Spain
|
47
|
|
4.5
|
%
|
36
|
|
4.3
|
%
|
27
|
|
3.7
|
%
|
||||||
|
Other Europe
|
127
|
|
3.3
|
%
|
121
|
|
3.5
|
%
|
123
|
|
3.7
|
%
|
||||||
|
Europe*
|
864
|
|
6.1
|
%
|
760
|
|
5.8
|
%
|
738
|
|
6.0
|
%
|
||||||
|
Other EMEA**
|
124
|
|
—
|
|
126
|
|
—
|
|
137
|
|
—
|
|
||||||
|
Total
|
988
|
|
—
|
|
886
|
|
—
|
|
875
|
|
—
|
|
||||||
_____________________________
* 28 members of the European Union and members of the European Free Trade Association (other than Italy, Germany, UK, France, and Spain).
** Market share not included in Other EMEA because our presence is less than one percent.
(1) Certain fleet sales accounted for as operating leases are included in vehicle sales.
(2) Our estimated market share data is presented based on the European Automobile Manufacturers Association (ACEA) Registration Databases and national Registration Offices databases.
(3) Sale data includes vehicle sales by our joint venture in Turkey.
42
|
For the Years Ended December 31,
|
||||||||||||||||||
|
2015
(1),(2),(3)
|
2014
(1),(2),(3)
|
2013
(1),(2),(3)
|
||||||||||||||||
|
EMEA
Light Commercial Vehicles |
Group Sales
|
Market Share
|
Group Sales
|
Market Share
|
Group Sales
|
Market Share
|
||||||||||||
|
Thousands of units (except percentages)
|
||||||||||||||||||
|
Europe*
|
217
|
|
11.3
|
%
|
197
|
|
11.5
|
%
|
182
|
|
11.6
|
%
|
||||||
|
Other EMEA**
|
77
|
|
—
|
|
68
|
|
—
|
|
68
|
|
—
|
|
||||||
|
Total
|
294
|
|
—
|
|
265
|
|
—
|
|
250
|
|
—
|
|
||||||
______________________________
* 28 members of the European Union and members of the European Free Trade Association.
** Market share not included in Other EMEA because our presence is less than one percent
.
(1) Certain fleet sales accounted for as operating leases are included in vehicle sales.
(2) Our estimated market share data is presented based on the national Registration Offices databases on products categorized under light commercial vehicles.
(3) Sale data includes vehicle sales by our joint venture in Turkey.
The following table summarizes our new vehicle market share information and our principal competitors in Europe, our largest market in the EMEA segment:
|
For the Years Ended December 31,
|
|||||||||
|
Europe-Passenger Cars
|
2015
(*)
|
2014
(*)
|
2013
(*)
|
||||||
|
Automaker
|
Percentage of industry
|
||||||||
|
Volkswagen
|
24.8
|
%
|
25.5
|
%
|
25.1
|
%
|
|||
|
PSA
|
10.4
|
%
|
10.7
|
%
|
10.9
|
%
|
|||
|
Renault
|
9.6
|
%
|
9.5
|
%
|
8.9
|
%
|
|||
|
Ford
|
7.2
|
%
|
7.3
|
%
|
7.3
|
%
|
|||
|
GM
|
6.7
|
%
|
7.1
|
%
|
7.9
|
%
|
|||
|
BMW
|
6.6
|
%
|
6.4
|
%
|
6.4
|
%
|
|||
|
FCA
(1)
|
6.1
|
%
|
5.9
|
%
|
6.0
|
%
|
|||
|
Daimler
|
5.9
|
%
|
5.4
|
%
|
5.5
|
%
|
|||
|
Toyota
|
4.3
|
%
|
4.3
|
%
|
4.4
|
%
|
|||
|
Other
|
18.4
|
%
|
17.9
|
%
|
17.6
|
%
|
|||
|
Total
|
100.0
|
%
|
100.0
|
%
|
100.0
|
%
|
|||
______________________________
* Including all 28 European Union (EU) Member States and the 4 European Free Trade Association, or EFTA member states.
** Including all 27 European Union (EU) Member States and the 4 European Free Trade Association, or EFTA member states.
(1) Market share data is presented based on the European Automobile Manufacturers Association, or ACEA Registration Databases, which also includes Ferrari and Maserati within our Group.
In 2015, there was an improvement in passenger car industry volumes in Europe (EU28+EFTA), with industry unit sales increasing 9.2 percent over the prior year to a total of 14.2 million, although still well below the pre-crisis level of approximately 16 million units in 2007. As a result of production over-capacity, however, significant price competition among automotive OEMs continues to be a factor, particularly in the small and mid-size segments.
Fiat brand continued its leadership in the minicar segment with a market share of 27.7 percent in EU 28+EFTA. In Italy, the Fiat 500X led its segment with a market share of 18.1 percent.
In EMEA the Jeep brand continued its growth, by selling 119,000 units, up 56 percent over the prior year.
Volumes were also higher in the light commercial vehicle, or LCV, segment, with industry sales up 11.4 percent over the prior year to about 1.92 million units. The Ducato continued its strong performance in 2015, leading its segment in Europe with 13 percent growth.
After the world preview at the Istanbul Motor Show in May 2015, the all-new Fiat Tipo was presented to the international press in November, launched in Italy in December and is being sold in over forty countries across EMEA. This four-door compact sedan marks the return of the Fiat brand in the compact sedan segment.
43
In Europe, FCA’s sales are largely weighted to passenger cars, with approximately 47 percent of our total vehicle sales in Europe in 2015 in the small car segment, reflecting demand for smaller vehicles driven by driving conditions prevalent in many European cities and stringent environmental regulations.
EMEA Distribution
In certain markets, such as Europe, our relationship with individual dealer entities can be represented by a number of contracts (typically, we enter into one agreement per brand of vehicles to be sold), and the dealer can sell those vehicles through one or more points of sale. In those markets, points of sale tend to be physically small and carry limited inventory.
In Europe, we sell our vehicles directly to independent and our own dealer entities located in most European markets. In other markets in the EMEA segment in which we do not have a substantial presence, we have agreements with general distributors for the distribution of our vehicles through their existing distribution networks.
The following table summarizes the number of independent entities in our dealer and distributor network. The table counts each independent dealer entity, regardless of the number of contracts or points of sale the dealer operates. Where we have relationships with a general distributor in a particular market, this table reflects that general distributor as one distribution relationship:
|
Distribution Relationships
|
At December 31,
|
||||||||
|
2015
|
2014
|
2013
|
|||||||
|
EMEA
|
2,090
|
|
2,143
|
|
2,300
|
|
|||
EMEA Dealer and Customer Financing
In the EMEA segment, dealer and retail customer financing is primarily managed by FCA Bank, our 50/50 joint venture with Crédit Agricole Consumer Finance S.A., or Crédit Agricole. FCA Bank operates in 17 European countries including Italy, France, Germany, the U.K. and Spain. We began this joint venture in 2007, and in July 2013, we reached an agreement with Crédit Agricole to extend its term through December 31, 2021. Under the agreement, FCA Bank will continue to benefit from the financial support of the Crédit Agricole Group while continuing to strengthen its position as an active player in the securitization and debt markets. FCA Bank provides retail and dealer financing to support our mass-market vehicle brands and Maserati vehicles, as well as certain other OEMs.
Fidis S.p.A., our wholly-owned captive finance company, provides dealer and other wholesale customer financing in certain markets in the EMEA segment in which FCA Bank does not operate. We also operate a joint venture providing financial services to retail customers in Turkey, and operate vendor programs with bank partners in other markets to provide access to financing in those markets.
Maserati
Maserati, a luxury vehicle brand founded in 1914, became part of our business in 1993. We believe that Maserati customers typically seek a combination of style, both in high quality interiors and external design, performance, sports handling and comfort that come with a top of the line luxury vehicle. In 2013, the Maserati brand was re-launched by the introduction of the next generation Quattroporte and the introduction of the all-new Ghibli (luxury four door sedans), the first addressed to the flagship large sedan segment and the second was designed to address the luxury full-size sedan vehicle segment. Maserati’s current vehicles also include the GranTurismo, the brand’s first modern two door, four seat coupe, also available in a convertible version. In 2016, Maserati will launch a luxury SUV, designed on the same platform as the Quattroporte and the Ghibli that will complete Maserati’s product portfolio with full coverage of the global luxury vehicle market.
44
The following tables show the distribution of Maserati sales by geographic regions as a percentage of total sales for each year ended December 31, 2015, 2014 and 2013:
|
As a percentage of 2015 sales
|
As a percentage of 2014 sales
|
As a percentage of 2013 sales
|
||||
|
Europe Top 4 countries
(1)
|
14
|
%
|
13
|
%
|
9
|
%
|
|
U.S.
|
37
|
%
|
39
|
%
|
41
|
%
|
|
Japan
|
5
|
%
|
4
|
%
|
4
|
%
|
|
China
|
22
|
%
|
25
|
%
|
26
|
%
|
|
Other countries
|
22
|
%
|
19
|
%
|
20
|
%
|
|
Total
|
100
|
%
|
100
|
%
|
100
|
%
|
_____________________________
(1) Europe Top 4 Countries by sales, includes Italy, UK, Germany and Switzerland.
In 2015, a total of 31.5 thousand Maserati vehicles were sold to retail customers, a decrease of 4.1 percent compared to 2014, primarily due to decreased volumes of the Quattroporte resulting from weaker segment demand in the U.S. and China.
We sell our Maserati vehicles through a worldwide distribution network of approximately 415 Maserati dealers as of December 31, 2015, that is separate from our mass-market vehicle distribution network.
FCA Bank provides access to retail customer financing for Maserati brand vehicles in Europe. In other regions, we rely on local agreements with financial services providers for financing of Maserati brand vehicles.
Components Segment
We sell components and production systems under the following brands:
Magneti Marelli
. Founded in 1919 as a joint venture between Fiat and Ercole Marelli, Magneti Marelli is an international leader in the design and production of state-of-the-art automotive systems and components. Through Magneti Marelli, we design and manufacture automotive lighting systems, powertrain (engines and transmissions) components and engine control units, electronic systems, suspension systems and exhaust systems, and plastic components and modules. The Automotive Lighting business line, headquartered in Reutlingen, Germany, is dedicated to the development, production and sale of automotive exterior lighting products for all major OEMs worldwide. The Powertrain business line is dedicated to the production of engine and transmission components for automobiles, motorbikes and light commercial vehicles and has a global presence due to its own research and development centers, applied research centers and production plants. The Electronic Systems business line provides know-how in the development and production of hardware and software in mechatronics, instrument clusters, telematics and satellite navigation. We also provide aftermarket parts and services and operate in the motorsport business, in particular electronic and electro-mechanical systems for championship motorsport racing, under the Magneti Marelli brand. We believe the Magneti Marelli brand is characterized by key technologies available to its final customers at a competitive price compared to other component manufacturers with high quality and competitive offerings, technology and flexibility.
Magneti Marelli provides wide-ranging expertise in electronics through a process of ongoing innovation and environmental sustainability in order to develop intelligent systems for active and passive vehicle safety, onboard comfort and powertrain technologies. Magneti Marelli products that are intended to improve energy efficiency (including hybrid systems, Xenon and LED lights, gasoline direct injection systems and automated manual transmissions) contributed €2.1 billion in revenues for 2015. With 89 production facilities (including joint ventures) and 43 research and development centers, Magneti Marelli has a presence in 18 countries and supplies all the major OEMs across the globe. In several countries, Magneti Marelli’s activities are carried out through a number of joint ventures with local partners with the goal of entering more easily into new markets by leveraging the partners' local relationships. Thirty-eight percent of Magneti Marelli’s
2015
revenue is derived from sales to the Group.
45
Teksid
. Originating from Fiat’s 1917 acquisition of Ferriere Piemontesi, the Teksid brand was established in 1978 and today specializes in grey and nodular iron castings production. Teksid produces iron engine blocks, cylinder heads, engine components, transmission parts, gearboxes and
suspensions. Teksid Aluminum produces aluminum engine blocks and cylinder heads. Forty-five percent of Teksid’s
2015
revenue is derived from sales to the Group.
Comau
. Founded in 1973, Comau, which originally derived its name from the acronyms of COnsorzio MAcchine Utensili (
consortium of machine tools)
, produces advanced manufacturing systems through an international network. Comau operates primarily in the field of integrated automation technology, delivering advanced turnkey systems to its customers. Through Comau, we develop and sell a wide range of industrial applications, including robotics, while we provide support service and training to customers. Comau’s main activities include powertrain metalcutting systems, mechanical assembly systems and testing, innovative and high performance body welding and assembly systems and robotics. Comau’s automation technology is used in a variety of industries, including automotive and aerospace. Comau also provides maintenance services in Latin America. Thirty percent of Comau’s
2015
revenue is derived from sales to the Group.
Supply of Raw Materials, Parts and Components
We purchase a variety of components (including mechanical, steel, electrical and electronic, plastic components as well as castings and tires), raw materials (steel, rubber, aluminum, resin, copper, lead, and precious metals including platinum, palladium and rhodium), supplies, utilities, logistics and other services from numerous suppliers which we use to manufacture our vehicles, parts and accessories. These purchases accounted for approximately
80
percent of total cost of sales for each of the
years ended December 31, 2015
,
2014
and
2013
. Fluctuations in cost of sales are primarily related to the number of vehicles we produce and sell along with shifts in vehicle mix, as newer models of vehicles generally have more technologically advanced components and enhancements and therefore additional costs per unit. The cost of sales could also be affected, to a lesser extent, by fluctuations of certain raw material prices. The cost of raw materials comprised approximately
15
percent of the previously described total purchases for each of the
years ended December 31, 2015
,
2014
and
2013
, while the remaining portion of purchases is made of components, transformation and overhead costs.
Our focus on quality improvement, cost reduction, product innovation and production flexibility requires us to rely upon suppliers with a focus on quality and the ability to provide cost reductions. We value our relationships with suppliers, and in recent years, we have worked to establish closer ties with a significantly reduced number of suppliers by selecting those that enjoy a leading position in the relevant markets. In addition, we source some of the parts and components for our vehicles internally from Magneti Marelli and Teksid. Although we have not experienced any major loss of production as a result of material or parts shortages in recent years, because we, like most of our competitors, regularly source some of our systems, components, parts, equipment and tooling from a single provider or limited number of providers, we are at risk of production delays and lost production should any supplier fail to deliver goods and services on time.
Supply of raw materials, parts and components may also be disrupted or interrupted by natural disasters. In such circumstances, we work proactively with our suppliers to identify material and part shortages and take steps to mitigate their impact by deploying additional personnel, accessing alternative sources of supply and managing our production schedules. We also continue to refine our processes to identify emerging capacity constraints in the supplier tiers given the ramp up in manufacturing volumes to meet our volume targets. Furthermore, we continuously monitor supplier performance according to key metrics such as part quality, delivery performance, financial solvency and sustainability.
Cyclical Nature of the Business
As is typical in the automotive industry, our vehicle sales are highly sensitive to general economic conditions, availability of low interest rate vehicle financing for dealers and retail customers and other external factors, including fuel prices, and as a result may vary substantially from quarter to quarter and year to year. Retail consumers tend to delay the purchase of a new vehicle when disposable income and consumer confidence are low. In addition, our vehicle production volumes and related revenues may vary from month to month, sometimes due to plant shutdowns, which may occur for several reasons, including production changes from one model year to the next. Plant shutdowns, whether associated with model year changeovers or other factors, such as temporary supplier interruptions, can have a negative impact on our revenues and a negative impact on our working capital as we continue to pay suppliers under standard contract terms while we do not receive proceeds from vehicle sales. Refer to
Item 5B. Liquidity and Capital Resources—Liquidity Overview
for additional information.
46
Legal Proceedings
As a global group with a diverse business portfolio, the Group is exposed to numerous legal risks, particularly in the areas of product liability, competition and antitrust law, environmental risks and tax matters, dealer and supplier relationships and intellectual property rights. Various legal proceedings, claims and governmental investigations are pending against us on a wide range of topics, including vehicle safety, emissions and fuel economy, dealer, supplier and other contractual relationships, intellectual property rights, product warranties and environmental matters. Some of these proceedings allege defects in specific component parts or systems (including air bags, seats, seat belts, brakes, ball joints, transmissions, engines and fuel systems) in various vehicle models or allege general design defects relating to vehicle handling and stability, sudden unintended movement or crashworthiness. These proceedings seek recovery for damage to property, personal injuries or wrongful death, and in some cases include a claim for exemplary or punitive damages. Adverse decisions in one or more of these proceedings could require us to pay substantial damages, or undertake service actions, recall campaigns or other costly actions. For information regarding specific legal proceedings, refer to Note
28
within our Consolidated Financial Statements included elsewhere in this report.
C. Organizational Structure
Principal Subsidiaries
The following table sets forth a list of the principal subsidiaries that are directly or indirectly controlled by FCA. Companies in the list are grouped according to each reportable segment.
For each principal subsidiary, the following information is provided: name, country of incorporation or residence, and the percentage interest held by FCA and its subsidiaries
at December 31, 2015
.
Principal Subsidiaries
at December 31, 2015
:
|
Name
|
Country
|
Percentage
Interest Held |
||
|
NAFTA Segment
|
||||
|
FCA US LLC
|
USA (Delaware)
|
100.00
(1)
|
||
|
FCA Canada Inc.
|
Canada
|
100.00
(1)
|
||
|
FCA Mexico, S.A. de C.V.
|
Mexico
|
100.00
(1)
|
||
|
LATAM Segment
|
||||
|
FCA Fiat Chrysler Automoveis Brasil LTDA
|
Brazil
|
100.00
|
||
|
Banco Fidis S.A.
|
Brazil
|
100.00
|
||
|
FCA Venezuela LLC
|
USA (Delaware)
|
100.00
(1)
|
||
|
FCA Automobiles Argentina S.A.
|
Argentina
|
100.00
|
||
|
APAC Segment
|
||||
|
FCA Australia Pty Ltd
|
Australia
|
100.00
(1)
|
||
|
Chrysler Group (China) Sales Limited
|
People’s Republic of China
|
100.00
(1)
|
||
|
EMEA Segment
|
||||
|
FCA Italy S.p.A.
|
Italy
|
100.00
|
||
|
FCA Melfi S.p.A.
|
Italy
|
100.00
|
||
|
FCA Serbia d.o.o. Kragujevac
|
Serbia
|
66.67
|
||
|
FCA Russia AO
|
Russia
|
100.00
(1)
|
||
|
Chrysler South Africa (Pty) Ltd.
|
South Africa
|
100.00
(1)
|
||
|
FCA Poland S.A.
|
Poland
|
100.00
|
||
47
|
Name
|
Country
|
Percentage
Interest Held |
||
|
FCA Germany AG
|
Germany
|
100.00
|
||
|
Fiat Chrysler Automobiles UK Ltd.
|
United Kingdom
|
100.00
|
||
|
FCA Powertrain Poland Sp. z o.o.
|
Poland
|
100.00
|
||
|
Fidis S.p.A.
|
Italy
|
100.00
|
||
|
Ferrari - Discontinued Operation
(2)
|
||||
|
Ferrari N.V.
|
Netherlands
|
80.00
|
||
|
Ferrari S.p.A.
|
Italy
|
80.00
(3)
|
||
|
Ferrari Financial Services, Inc.
|
USA (Delaware)
|
80.00
(3)
|
||
|
Ferrari North America, Inc.
|
USA (New Jersey)
|
80.00
(3)
|
||
|
Ferrari Financial Services AG
|
Germany
|
80.00
(3)
|
||
|
Ferrari Cars International Trading (Shanghai) Co. Ltd.
|
People’s Republic of China
|
64.00
(3)
|
||
|
Maserati
|
||||
|
Maserati S.p.A.
|
Italy
|
100.00
|
||
|
Maserati North America Inc.
|
USA (New Jersey)
|
100.00
|
||
|
Components
|
||||
|
Magneti Marelli S.p.A.
|
Italy
|
99.99
(3)
|
||
|
Automotive Lighting LLC
|
USA (Michigan)
|
100.00
|
||
|
Automotive Lighting Reutlingen GmbH
|
Germany
|
99.99
|
||
|
Magneti Marelli Sistemas Automotivos Industria e Comercio Ltda
|
Brazil
|
99.99
|
||
|
Teksid S.p.A.
|
Italy
|
100.00
(5)
|
||
|
Comau S.p.A.
|
Italy
|
100.00
|
||
|
Comau LLC
|
USA (Michigan)
|
100.00
|
||
|
Holding Companies and Other Companies
|
||||
|
FCA North America Holdings LLC
|
USA (Delaware)
|
100.00
|
||
|
Fiat Chrysler Finance S.p.A.
|
Italy
|
100.00
|
||
|
Fiat Chrysler Finance Europe S.A.
|
Luxembourg
|
100.00
|
||
|
Fiat Chrysler Finance North America, Inc.
|
USA (Delaware)
|
100.00
|
||
|
Neptunia Assicurazioni Marittime S.A.
|
Switzerland
|
100.00
|
||
(1) On January 21, 2014, we acquired the remaining 41.5 percent of FCA US that we did not previously own. See Item 4A. History and Development of the Company-History of FCA.
(2) At December 31, 2015, Ferrari met the criteria to be classified as a discontinued operation
(3) Following the Ferrari IPO in October 2015, the Group's interest in Ferrari decreased by approximately 10 percent.
(4) FCA holds 100 percent of the voting interest in Magneti Marelli S.p.A.
(5) In December 2015, we acquired the remaining 15.2 percent interest in Teksid S.p.A. from Renault.
D. Property, Plant and Equipment
As of
December 31, 2015
, we operated
164
manufacturing facilities (including vehicle and light commercial vehicle assembly, powertrain and components plants and excluding Ferrari facilities and centers), of which 40 were located in Italy, 35 in the rest of Europe, 29 in the U.S., 22 in Brazil, 14 in Mexico, 6 in Canada, and the remaining plants in Argentina, China and other countries. We also own other significant properties including parts distribution, research laboratories, test tracks, warehouses and office buildings. The total carrying value of our property, plant and equipment as of
December 31, 2015
was
€27.5 billion
.
48
A number of our manufacturing facilities and equipment, such as land and industrial buildings, plant and machinery and other assets, are subject to mortgages and other security interests granted to secure indebtedness to certain financial institutions. As of
December 31, 2015
, our property, plant and equipment (excluding property, plant and equipment of FCA US) reported as pledged as collateral for loans amounted to approximately
€1,400 million
, as compared to
€1,670 million
at December 31, 2014.
Substantially all the property, plant and equipment of FCA US and its U.S. subsidiary guarantors are unconditionally pledged as security under its senior credit facilities, other than its Auburn Hills, Michigan headquarters and technology center, which are not pledged. For a description of the senior credit facilities, see
Item 5B. Liquidity and Capital Resources
.
We believe that planned production capacity is adequate to satisfy anticipated retail demand and our operations are designed to be flexible enough to accommodate the planned product design changes required to meet global market conditions and new product programs (such as through leveraging existing production capacity in each region for export needs).
The following table provides information about our significant assembly plants
as of December 31, 2015
.
|
Country
|
Location
|
Covered Area
(square meters) |
|||
|
NAFTA
|
|||||
|
U.S.
|
Belvidere
|
357,888
|
|
||
|
U.S.
|
Jefferson North
|
199,596
|
|
||
|
U.S.
|
Sterling Heights
|
233,347
|
|
||
|
U.S.
|
Toledo North
|
225,476
|
|
||
|
U.S.
|
Toledo Supplier Park
|
114,267
|
|
||
|
U.S.
|
Warren Truck
|
296,193
|
|
||
|
Mexico
|
Toluca
|
306,570
|
|
||
|
Mexico
|
Saltillo
|
221,010
|
|
||
|
Canada
|
Brampton
|
221,687
|
|
||
|
Canada
|
Windsor
|
299,925
|
|
||
|
LATAM
|
|||||
|
Brazil
|
Pernambuco
|
534,482
|
|
||
|
Brazil
|
Betim
|
677,945
|
|
||
|
Argentina
|
Cordoba
|
227,162
|
|
||
|
Venezuela
|
Valencia
|
66,925
|
|
||
|
APAC
|
|||||
|
China
|
Changsha
|
199,800
|
|
||
|
India
|
Ranjangaon
|
103,289
|
|
||
|
EMEA
|
|||||
|
Italy
|
Turin
|
495,160
|
|
||
|
Italy
|
Cassino
|
458,747
|
|
||
|
Italy
|
Melfi
|
406,599
|
|
||
|
Italy
|
Pomigliano
|
494,727
|
|
||
|
Italy
|
Atessa
|
364,532
|
|
||
|
Poland
|
Tychy
|
189,070
|
|
||
|
Serbia
|
Kragujevac
|
369,907
|
|
||
|
Turkey
|
Bursa
|
278,843
|
|
||
____________________________
Note: Plants in Changsha, Ranjangaon, Atessa and Bursa are joint ventures with other partners.
49
We have two assembly plants for Maserati in Italy (including one plant owned by FCA Italy), as well as 76 worldwide manufacturing plants for Magneti Marelli (excluding joint ventures), 13 plants for Comau and five for Teksid
.
We are substantially in compliance with the relevant environmental requirements affecting our facilities and products. We constantly monitor such requirements and adjust our operations to remain in compliance. See
Item 4B. Business Overview—Industry Overview—Industrial Environmental Control.
None.
50
MANAGEMENT’S DISCUSSION AND ANALYSIS OF FINANCIAL CONDITION AND RESULTS OF OPERATIONS OF THE GROUP
The following discussion of our financial condition and results of operations should be read together with the information included under “Business,” “Selected Historical Consolidated Financial and Other Data” and the Consolidated Financial Statements included elsewhere in this report. This discussion includes forward-looking statements and involves numerous risks and uncertainties, including, but not limited to, those described under “Forward-Looking Statements” and “Item 3D. Risk Factors.” Actual results may differ materially from those contained in any forward looking statements.
Overview
We were incorporated as a public limited liability company (
naamloze vennootschap
) under the laws of the Netherlands on April 1, 2014. Fiat, our predecessor, was founded as
Fabbrica Italiana Automobili Torino
on July 11, 1899 in Turin, Italy as an automobile manufacturer. We are an international automotive group engaged in designing, engineering, manufacturing, distributing and selling vehicles and components. We are the
seventh
largest automaker in the world based on total vehicle sales in 2015. We have operations in approximately
40 countries
and sell our vehicles directly or through distributors and dealers in more than
150 countries
. We design, engineer, manufacture, distribute and sell vehicles for the mass-market under the Abarth, Alfa Romeo, Chrysler, Dodge, Fiat, Fiat Professional, Jeep, Lancia and Ram brands and the SRT performance vehicle designation. We support our vehicle sales by after-sales services and parts worldwide using the Mopar brand for mass-market vehicles. We make available retail and dealer financing, leasing and rental services through our subsidiaries, joint ventures and other commercial arrangements. We also design, engineer, manufacture, distribute and sell luxury vehicles under the Maserati brand, which we support with financial services provided to our dealers and retail customers. In addition, we operate in the components and production systems sectors through Magneti Marelli, Teksid and Comau.
Our activities are carried out through six reportable segments: four regional mass-market vehicle segments (NAFTA, LATAM, APAC and EMEA), Maserati as our global luxury brand segment and a global Components segment (see
Item 4B. Business Overview—Overview of Our Business
). In addition, as discussed in the section
—History and Development of the Company - Ferrari Spin-off
above, Ferrari is classified as a discontinued operation for the year ended December 31, 2015. The results of Ferrari have been excluded from the Group's continuing operations, the after-tax result of Ferrari's operations are shown as a single line item within the Consolidated Income Statement for the year ended December 31, 2015 and all prior periods have been re-presented accordingly. In addition, the assets and liabilities of the Ferrari segment have been classified as Assets held for distribution and Liabilities held for distribution within the Consolidated Statement of Financial Position at December 31, 2015.
Excluding the operations of Ferrari, in
2015
we shipped
4.6 million
vehicles, we had Net revenues of €
110.6 billion
, EBIT of €
2.6 billion
and Net profit of €
0.1 billion
. At
December 31, 2015
, excluding Ferrari, we had available liquidity of €
24.6 billion
(including €
3.4 billion
available under undrawn committed credit lines) and we had Net industrial debt of €
5.0 billion
. See
—Non-GAAP Financial Measures—Net Debt
.
51
Our Business Plan
In May 2014, we announced our 2014-2018 Business Plan, which focused on: strengthening and differentiating our portfolio of brands, including the globalization of Jeep and Alfa Romeo; volume growth; continued platform convergence and focus on cost efficiencies, as well as enhancing margins and strengthening our capital structure.
We presented an update to our Business Plan in January 2016 in order to address intervening market changes and announced the following actions:
|
•
|
Due to a continued shift in consumer preference towards utility vehicles and pickup trucks in the NAFTA region, we intend to realign our installed capacity in the region to better meet demand for Ram pickup trucks and Jeep vehicles within our existing plant infrastructure by discontinuing production of our Chrysler 200 and Dodge Dart passenger cars. As a result, we recorded a total charge of €834 million as described in more detail within the section —
Results by Segment - NAFTA
below. We intend to maintain our presence in the market for passenger cars through other arrangements.
|
|
•
|
We intend to slow the pace of our investments in the Alfa Romeo brand and the timing of future product launches, primarily in response to reduced demand for premium and imported vehicles in China.
|
|
•
|
The commencement of production at our new Pernambuco plant has coincided with a significant industry decline, intensified competitive pressures from non-major OEMs, and currency devaluation pressures in the LATAM region. As a result, we are offsetting inflation with pricing actions and we intend to explore opportunities to export vehicles produced in Brazil without an impact on our Pernambuco strategy.
|
|
•
|
Based on the Jeep brand’s significant volume growth across all regions and nameplates over the past six years, we have increased our expectations for the brand’s future growth.
|
Notwithstanding these market changes and the actions described above, we have stated our intent to deliver positive operating cash flows for each remaining year of the Business Plan and reiterated our goal to achieve a net industrial cash position by the end of 2018.
Trends, Uncertainties and Opportunities
Shipments
. Vehicle shipments are generally driven by our plans to meet consumer demand. Vehicle shipments occur shortly after production. We generally recognize revenue when the risks and rewards of ownership of a vehicle are transferred to our dealers or distributors. This usually occurs upon the release of the vehicle to the carrier responsible for transporting the vehicle to the dealer or distributor. Our shipments of passenger cars are driven by consumer demand which in turn is affected by economic conditions, availability and cost of dealer and customer financing and incentives offered to retail customers. Shipments, which correlate with Net revenues, are not necessarily directly correlated with retail sales from dealers, which may be affected by other factors including dealer inventory levels.
Economic Conditions
. Demand for new vehicles tends to reflect economic conditions in the various markets in which we operate because retail sales depend on individual purchasing decisions, which in turn are affected by many factors including levels of disposable income. Fleet sales and sales of light commercial vehicles are also influenced by economic conditions, which drives vehicle utilization and investment activity. Therefore, our performance is impacted by the macroeconomic trends in the markets in which we operate.
Regulation
. We face a regulatory environment in markets throughout the world where safety, vehicle emission and fuel economy regulations are becoming increasingly stringent, which will affect our vehicle sales and profitability. We must comply with these regulations in order to continue operations in those markets, including a number of markets where we derive substantial revenue, such as the U.S., Brazil and Europe. In the past several years, industry participants in these markets have faced increasing regulatory scrutiny. Further, developments in regulatory requirements in China, the largest single market in the world in
2015
, limit in some respects, the product offerings we can pursue as we expand the scope of our operations in that country. Developing, engineering and manufacturing vehicles that meet these requirements and therefore may be sold in those markets requires a significant expenditure of resources.
52
Consolidation.
The automotive industry is exceptionally capital intensive and capital expenditures and research and development requirements in our industry have continued to grow significantly in recent years as we pursue technological innovations and respond to a number of challenges. Compliance with enhanced emissions and safety regulations continue to impose new and increasing capital requirements as does the development of proprietary components. While we continue to implement our Business Plan, and we believe that our business will continue to grow and our operating margins will continue to improve, if we are unable to reduce our capital requirements either through cooperation or consolidation with other manufacturers, we may not be able to reduce component development costs, optimize manufacturing investments or product allocation and improve utilization of tooling, machinery and equipment, as a result of which our product development and manufacturing costs will continue to adversely impact our profitability and return on capital. Although there can be no assurance that these challenges can be overcome through large scale integration or product development and manufacturing collaboration, if we are unable to pursue such benefits our returns and valuations may suffer.
Dealer and Customer Financing
. Because dealers and retail customers finance their purchases of a large percentage of the vehicles we sell worldwide, the availability and cost of financing is a significant factor affecting our sales volumes and revenues. Availability of customer financing could affect the vehicle mix, as customers who have access to greater financing are able to purchase higher priced vehicles, whereas when customer financing is constrained, vehicle mix could shift towards less expensive vehicles. The low interest rate environment in recent years has had the positive effect of reducing the effective cost of vehicle ownership. While interest rates in the U.S. and Europe are at historically low levels, the availability and terms of financing will continue to change over time, impacting our results. We operate in many regions without a controlled finance company, as we provide access to financing through joint ventures and third party arrangements in several of our key markets. Therefore, we may be less able to ensure availability of financing for our dealers and retail customers in those markets than our competitors that own and operate affiliated finance companies.
Pricing
. Our profitability depends in part on our ability to maintain or improve pricing on the sale of our vehicles, notwithstanding that the automotive industry continues to experience intense price competition resulting from the variety of available competitive vehicles and excess global manufacturing capacity. We have generally been able to maintain or increase prices of current year models in the NAFTA segment, while the competitive trading environment in Europe, China and Australia has reduced pricing or increased incentives and negatively affected our results of operations in these markets. Historically, manufacturers have driven short-term vehicle sales by offering dealer, retail and fleet incentives, including cash rebates, option package discounts, guaranteed depreciation programs, and subsidized financing or leasing programs, all of which constrain margins on vehicle sales. Although we will continue to use such incentives from time to time, we are focusing on achieving higher sales volumes by building brand value, balancing our product portfolio by offering a wider range of vehicle models, and improving the content, quality, fuel economy and performance of our vehicles.
Vehicle Profitability
. Our results of operations reflect the profitability of the vehicles we sell, which tends to vary based upon a number of factors, including vehicle size, content of those vehicles, brand positioning and the customer base purchasing our vehicles. Vehicle profitability also depends on sales prices, net of sales incentives, costs of materials and components, as well as transportation and warranty costs. In the NAFTA segment, our larger vehicles such as our minivans, larger utility vehicles and pickup trucks have historically been more profitable than other vehicles; however, these vehicles have lower fuel economy and consumer preferences tend to shift away from larger vehicles in periods of significant rising fuel prices, which affects their profitability on a per unit and aggregate basis. In recent years, as fuel prices have declined, consumer preferences for certain vehicles, such as SUVs, has increased. Our utility vehicles, pickup trucks and minivans accounted for approximately 41 percent of our total U.S. retail vehicle sales in 2015 and the profitability of this portion of our portfolio is approximately 39 percent higher than that of our overall U.S. retail portfolio on a weighted-average basis. In all mass-market vehicle segments throughout the world, vehicles equipped with additional options are generally more profitable for us. As a result, our ability to offer attractive vehicle options and upgrades is critical to our ability to increase our profitability on these vehicles. Our vehicles sold under certain brand and model names, for instance, are generally more profitable given the strong brand recognition of those vehicles tied in many cases to a long history and in other cases to customers identifying these vehicles as being more modern and responsive to customer needs. For instance, in the EMEA region, our vehicles in the Fiat 500 family tend to be more profitable than older model vehicles of similar size. In addition, in the U.S. and Europe, our vehicle sales through dealers to retail customers are normally more profitable than our fleet sales, as the retail customers typically prefer additional optional features while fleet customers increasingly tend to concentrate purchases on smaller, more fuel-efficient vehicles with fewer optional features, which have historically had a lower profitability per unit.
53
Effects of Foreign Exchange Rates
. We are affected by fluctuations in foreign exchange rates (i) through translation of foreign currency financial statements into Euro for consolidation, which we refer to as the translation impact, and (ii) through transactions by entities in the Group in currencies other than their own functional currencies, which we refer to as the transaction impact.
Translation impacts arise in preparation of the Consolidated Financial Statements; in particular, we prepare our Consolidated Financial Statements in Euro, while the financial statements of each of our subsidiaries are prepared in the functional currency of that entity. In preparing the Consolidated Financial Statements, we translate assets and liabilities measured in the functional currency of the subsidiaries into Euro using the exchange rate prevailing at the balance sheet date, while we translate income and expenses using the average exchange rates for the period covered. Accordingly, fluctuations in the exchange rate of the functional currencies of our entities against the Euro impact our results of operations.
Transaction impacts arise when our entities conduct transactions in currencies other than their own functional currency. We are therefore exposed to foreign currency risks in connection with scheduled payments and receipts in multiple currencies. For example, the strength of the U.S. dollar against the Euro has had a positive effect on our recent financial results given the size of our U.S. operations relative to our overall operations.
Cost of Sales
. Cost of sales includes purchases, product warranty and recall campaign costs, labor costs, depreciation, amortization and logistic costs. We purchase a variety of components (including mechanical, steel, electrical and electronic, plastic components as well as castings and tires), raw materials (steel, rubber, aluminum, resin, copper, lead, and precious metals including platinum, palladium and rhodium), supplies, utilities, logistics and other services from numerous suppliers which we use to manufacture our vehicles, parts and accessories. These purchases accounted for approximately
80
percent of total Cost of sales for each of the years ended
December 31, 2015
,
2014
and
2013
. Fluctuations in Cost of sales are primarily related to the number of vehicles we produce and sell along with shifts in vehicle mix, as newer models of vehicles generally have more technologically advanced components and enhancements and therefore additional costs per unit. Cost of sales could also be affected, to a lesser extent, by fluctuations of certain raw material prices. The cost of raw materials comprised approximately
15
percent of the total purchases described above for each of the years ended
December 31, 2015
,
2014
and
2013
, while the remaining portion of purchases is made of components, transformation and overhead costs. We typically seek to manage these costs and minimize their volatility through the use of fixed price purchase contracts and the use of commercial negotiations and technical efficiencies. Because of these effects and relatively more stable commodities markets, for the periods reported, changes in component and raw material costs generally have not had a material effect on the period to period comparisons of our cost of sales. Nevertheless, our cost of sales related to materials and components has increased, as we have significantly enhanced the quality and content of our vehicles as we renew and refresh our product offerings. Over time, technological advancements and improved material sourcing may reduce the cost to us of the additional enhancements. In addition, we seek to recover higher costs through pricing actions, but even when competitive conditions permit this, there may be a time lag between the increase in our costs and our ability to realize improved pricing. Accordingly, our results are typically adversely affected, at least in the short term, until price increases are accepted in the market.
Further, in many markets where our vehicles are sold, we are required to pay import duties on those vehicles, which are included in Cost of sales. Although we can typically pass these costs along with our higher priced vehicles, for many of our vehicles, particularly in the mass-market vehicle segments, we cannot always pass along increases in those duties to our dealers and distributors and remain competitive. Our ability to price our vehicles to recover those increased costs has impacted, and will continue to impact, our profitability. Alternatively, we can try to eliminate or reduce the impact of these import duties by increasing local manufacturing of vehicles, as we have done in China and Brazil with new plants that began production in 2015. However, operating conditions, including labor regulations, in certain markets, have produced industry overcapacity which may make it hard for us to shift to more local production in other markets. As a result, we may experience lower plant utilization rates, which we will be unable to recover, if we are unable to reallocate production easily. These factors as well as the long capital investment cycles associated with building local production infrastructure may necessitate that we continue to produce a large proportion of our vehicles in existing facilities and satisfy most of our demand from emerging markets through exports.
54
Product Development
. An integral part of our business plan has been the continued refresh, renewal and growth of our vehicle portfolio, and we have committed significant capital and resources toward an aggressive launch program of completely new vehicles on all new platforms, with additions of new powertrain and transmission technology. In order to realize a return on the significant investments we have made to sustain market share and to achieve competitive operating margins, we will have to continue this accelerated pace of new vehicle launches. We believe efforts in developing common vehicle platforms and powertrains as well as parts commonization has accelerated the time-to-market for many of our new vehicle launches and resulted in cost savings.
Our efforts to develop our product offerings and the costs associated with vehicle improvements and launches can impact our EBIT. Refer to
Significant Accounting Policies—Format of the Financial Statements
included in the Consolidated Financial Statements included elsewhere in this report for a description of EBIT. During the development and launch of these new or refreshed offerings, despite the pace, we must also maintain our commitment to quality improvements. Moreover, our ability to continue to make the necessary investments in product development to achieve these plans depends in large part on the market acceptance and success of the new or significantly refreshed vehicles we introduce, as well as our ability to timely complete the aggressive launch schedule we have planned without sacrificing quality.
Costs we incur in the initial research phase for new projects (which may relate to vehicle models, vehicle platforms or powertrains) are expensed as incurred and reported as research and development costs. Costs we incur for product development are capitalized and recognized as development cost intangible assets if and when the following two conditions are both satisfied: (i) development costs can be measured reliably and (ii) the technical feasibility of the project, and the anticipated volumes and pricing, corroborate that the development expenditures will generate future economic benefits. Capitalized development costs include all direct and indirect costs that may be directly attributed to the development process. Such capitalized development costs are amortized on a straight-line basis commencing from production over the expected economic useful life of the product developed, and such amortization is recognized and reported as research and development costs in our Consolidated Income Statement. During a new vehicle launch and introduction to the market, we typically incur increased selling, general and advertising expenses associated with the advertising campaigns and related promotional activity. If vehicle production is terminated prior to the expected end date, any unamortized capitalized development costs are expensed during that period.
Future developments in our product portfolio to support certain of our brands’ growth strategy and their related development expenditures could lead to significant capitalization of development costs. Our time to market is approximately 24 months from the date the design is signed-off for tooling and production, but varies depending on product, after which, the project goes into production, resulting in an increase in amortization. Therefore our operating results, which are measured through EBIT, are impacted by the cyclicality of our research and development expenditures based on our product portfolio strategies and our product plans.
Critical Accounting Estimates
The Consolidated Financial Statements require the use of estimates, judgments and assumptions that affect the carrying amount of assets and liabilities, the disclosure of contingent assets and liabilities and the amounts of income and expenses recognized. The estimates and associated assumptions are based on elements that are known when the financial statements are prepared, on historical experience and on any other factors that are considered to be relevant.
The estimates and underlying assumptions are reviewed periodically and continuously by the Group. If the items subject to estimates do not perform as assumed, then the actual results could differ from the estimates, which would require adjustment accordingly. The effects of any changes in estimate are recognized in the Consolidated Income Statements in the period in which the adjustment is made, or in future periods.
The items requiring estimates for which there is a risk that a material difference may arise in respect of the carrying amounts of assets and liabilities in the future are discussed below.
Pension Plans
The Group sponsors both non-contributory and contributory defined benefit pension plans primarily in the U.S. and Canada. The majority of the plans are funded plans. The non-contributory pension plans cover certain hourly and salaried employees and the benefits are based on a fixed rate for each year of service. Additionally, contributory benefits are provided to certain salaried employees under the salaried employees’ retirement plans. These plans provide benefits based on the
55
employee’s cumulative contributions, years of service during which the employee contributions were made and the employee’s average salary during the five consecutive years in which the employee’s salary was highest in the 15 years preceding retirement or the freeze of such plans, as applicable.
In the United Kingdom, the Group participates, amongst others, in a pension plan financed by various entities belonging to the Group, called the “Fiat Group Pension Scheme” covering mainly deferred and retired employees.
The Group’s defined benefit pension plans are accounted for on an actuarial basis, which requires the use of estimates and assumptions to determine the net liability or net asset. The Group estimates the present value of the projected future payments to all participants taking into consideration parameters of a financial nature such as discount rates, the rates of salary increases and the likelihood of potential future events estimated by using demographic assumptions such as mortality, dismissal and retirement rates. These assumptions may have an effect on the amount and timing of future contributions. Plan obligations and costs are based on existing retirement plan provisions. Assumptions regarding any potential future changes to benefit provisions beyond those to which the Group is presently committed are not made. The assumptions used in developing the required estimates include the following:
|
•
|
Discount rates
. Our discount rates are based on yields of high-quality (AA-rated or better) fixed income investments for which the timing and amounts of maturities match the timing and amounts of the projected pension payments.
|
|
•
|
Salary growth.
The salary growth assumption reflects the Group’s long-term actual experience, outlook and assumed inflation.
|
|
•
|
Inflation.
The inflation assumption is based on an evaluation of external market indicators.
|
|
•
|
Expected contributions.
The expected amount and timing of contributions is based on an assessment of minimum funding requirements. From time to time contributions are made beyond those that are legally required.
|
|
•
|
Retirement rates.
Retirement rates are developed to reflect actual and projected plan experience.
|
|
•
|
Mortality rates
. Mortality rates are developed using our plan-specific populations, recent mortality information published by recognized experts in this field, primarily the U.S. Society of Actuaries and the Canadian Institute of Actuaries, and other data where appropriate to reflect actual and projected plan experience.
|
|
•
|
Plan assets measured at net asset value
. Plan assets are recognized and measured at fair value in accordance with IFRS 13
- Fair Value Measurement.
Plan assets for which the fair value is represented by the net asset value (“NAV”) since there are no active markets for these assets amounted to
€3,000 million
and €2,750 million at December 31, 2015 and at December 31, 2014, respectively. These investments include private equity, real estate and hedge fund investments.
|
In 2015, mortality assumptions used for our U.S. benefit plan valuations were updated to reflect recent trends in the industry and the revised outlook for future generational mortality improvements. Generational improvements represent decreases in mortality rates over time based upon historical improvements in mortality and expected future improvements. The change increased the Group's U.S. pension benefit obligations by approximately
€214 million
at December 31, 2015. In addition, retirement rate assumptions used for the Group's U.S. and Canada benefit plan valuations were updated to reflect an ongoing trend towards delayed retirement for FCA US and Canada employees. The change decreased the Group's U.S. and Canada pension benefit obligations by approximately
€209 million
at December 31, 2015.
In 2014, following the release of new standards by the Canadian Institute of Actuaries, mortality assumptions used for our Canadian benefit plan valuations were updated to reflect recent trends in the industry and the revised outlook for future generational mortality improvements. The change increased our Canadian pension obligations by approximately €41 million. Additionally, retirement rate assumptions used for our U.S. benefit plan valuations were updated to reflect an ongoing trend towards delayed retirement for FCA US employees. The change decreased our U.S. pension obligations by approximately €261 million.
56
Significant differences in actual experience or significant changes in assumptions may affect the pension obligations and pension expense. The effects of actual results differing from assumptions and of changing assumptions are included in Other comprehensive income/(loss).
At
December 31, 2015
the effect of the indicated decrease or increase in selected factors, holding all other assumptions constant, is shown below:
|
Effect on pension
defined benefit obligation |
||
|
( € million)
|
||
|
10 basis point decrease in discount rate
|
426
|
|
|
10 basis point increase in discount rate
|
(418
|
)
|
At
December 31, 2015
, the net liabilities and net assets for pension benefits amounted to €
5,310 million
and €
167 million
, respectively (€
5,166 million
and €
104 million
, respectively at
December 31, 2014
). Refer to
Significant Accounting Policies
and Note
21
within our Consolidated Financial Statements included elsewhere in this report for a discussion of the fair value hierarchy measurement and inputs used to determine fair value for each significant asset class or category.
Other Post-Employment Benefits
The Group provides health care, legal, severance indemnity, life insurance and other postretirement benefits to certain hourly and salaried employees. Upon retirement, these employees may become eligible for continuation of certain benefits. Benefits and eligibility rules may be modified periodically.
These other postretirement employee benefits (or “OPEB”) are accounted for on an actuarial basis, which requires the selection of various assumptions. The estimation of the Group’s obligations, costs and liabilities associated with OPEB, primarily retiree health care and life insurance, requires the use of estimates of the present value of the projected future payments to all participants, taking into consideration parameters of a financial nature such as discount rates, the rates of salary increases and the likelihood of potential future events estimated by using demographic assumptions such as mortality, dismissal and retirement rates, which may have an effect on the amount and timing of future payments.
Plan obligations and costs are based on existing plan provisions. Assumptions regarding any potential future changes to benefit provisions beyond those to which the Group is presently committed are not made.
The assumptions used in developing the required estimates include the following key factors:
|
•
|
Discount rates
. Our discount rates are based on yields of high-quality (AA-rated or better) fixed income investments for which the timing and amounts of maturities match the timing and amounts of the projected pension payments.
|
|
•
|
Health care cost trends
. The Group’s health care cost trend assumptions are developed based on historical cost data, the near-term outlook, and an assessment of likely long-term trends.
|
|
•
|
Salary growth
. The salary growth assumptions reflect the Group’s long-term actual experience, outlook and assumed inflation.
|
|
•
|
Retirement and employee leaving rates
. Retirement and employee leaving rates are developed to reflect actual and projected plan experience, as well as legal requirements for retirement in respective countries.
|
|
•
|
Mortality rates
. Mortality rates are developed using our plan-specific populations, recent mortality information published by recognized experts in this field and other data where appropriate to reflect actual and projected plan experience.
|
57
In 2015, mortality assumptions used for our U.S. benefit plan valuation were updated to reflect recent trends in the industry and the revised outlook for future generational mortality improvements. Generational improvements represent decreases in mortality rates over time based upon historical improvements in mortality and expected future improvements. The change increased the Group's U.S. other post-employment benefit obligations by approximately €28 million at December 31, 2015.
The impact of the updated 2014 mortality assumptions used on our Canadian benefit plan was not significant on our OPEB obligations. However, the retirement rate assumptions used for our U.S. benefit plan valuations were updated for the year ended December 31, 2014 to reflect an ongoing trend towards delayed retirement for FCA US employees. The change decreased our other post-employment benefit obligations by approximately €40 million at December 31, 2014.
At
December 31, 2015
, the effect of the indicated decreases or increases in the key factors affecting the health care, life insurance plans and severance indemnity in Italy (Trattamento di Fine Rapporto, or TFR), holding all other assumptions constant, is shown below:
|
Effect on health
care and life insurance defined benefit obligation |
Effect on the TFR
obligation |
||||
|
(€ million)
|
|||||
|
10 basis point / (100 basis point for TFR) decrease in discount rate
|
32
|
|
41
|
|
|
|
10 basis point / (100 basis point for TFR) increase in discount rate
|
(31
|
)
|
(38
|
)
|
|
|
100 basis point decrease in health care cost trend rate
|
(129
|
)
|
—
|
|
|
|
100 basis point increase in health care cost trend rate
|
157
|
|
—
|
|
|
Recoverability of non-current assets with definite useful lives
Non-current assets with definite useful lives include Property, plant and equipment, Intangible assets and Assets held for sale. Intangible assets with definite useful lives mainly consist of capitalized development costs related to the EMEA and NAFTA segments.
The Group periodically reviews the carrying amount of non-current assets with definite useful lives when events or circumstances indicate that an asset may be impaired. Impairment tests are performed by comparing the carrying amount and the recoverable amount of the cash-generating unit (“CGU”). A CGU is the smallest identifiable group of assets that generates cash inflows that are largely independent of the cash inflows from other assets or groups of assets. The recoverable amount is the higher of the CGU's fair value less costs of disposal and its value in use. In assessing the value in use, the pre-tax estimated future cash flows are discounted to their present value using a pre-tax discount rate that reflects current market assessments of the time value of money and the risks specific to the CGU.
During the year-ended December 31, 2015, impairment charges totaling €713 million were recognized. The most significant component of this impairment loss relates to the decision taken by the Group during the fourth quarter of 2015 to realign a portion of its manufacturing capacity in the NAFTA region, as part of the plan to improve NAFTA margins and to better meet market demand for Ram pickups and Jeep vehicles within the Group's existing plant infrastructure. The approval of this plan was deemed to be an indicator of impairment for certain of our vehicle platform CGUs due to the significant changes to the extent to which the assets are expected to be used. As a result of comparing the carrying amount of the assets included in the respective CGUs to their value in use, it was determined that the carrying amount of the CGUs exceeded their value in use and accordingly an impairment charge of €598 million was recorded for the year ended December 31, 2015, of which €422 million related to tangible asset impairments and €176 million related to the impairment of capitalized development costs with no future economic benefit.
Due to impairment indicators existing in 2014 and 2013, primarily related to losses incurred in EMEA due to weak demand for vehicles and strong competition as well as the new product strategy, impairment tests relating to the recoverability of CGUs in EMEA were performed. The tests compared the carrying amount of the assets allocated to the CGUs (comprising property, plant and equipment and capitalized development costs) to their value in use. The impairment test, which reflected the Group's available knowledge as to the expected future development of the business, markets and automotive industry, confirmed that the value in use of the CGUs in EMEA was greater than the carrying value at December
58
31, 2014 and as a result, no impairment losses were recognized in 2014. For the year ended December 31, 2013, total impairment charges of €116 million relating to CGUs in EMEA were recognized of which €61 million related to development costs and €55 million related to Property, plant and equipment.
For the year ended
December 31, 2015
, a total of €221 million specific capitalized development costs were impaired or written off, of which
€176
million related to the impairment of capitalized development costs as a result of the Group's plan to realign
a portion of the capacity in NAFTA to better meet market demand as described above.
For the year ended December 31, 2014, specific capitalized development costs which had no future economic benefits of €47 million within the EMEA segment and €28 million of development costs within the NAFTA segment were written off as a result of the streamlining of architectures and related production platforms associated with the Group's refocused product strategies. For the year ended December 31, 2013, specific capitalized development costs of €65 million within the Maserati segment, €90 million within the EMEA segment and €32 million of development costs within the LATAM segment with no future economic benefit were written off in connection with the Group's new product strategies. All amounts written off were recorded within Research and development costs in the Consolidated Income Statements for the years ended December 31, 2015, 2014 and 2013.
Initial Recognition and Subsequent Recoverability of Goodwill and Intangible Assets with Indefinite Useful Lives
The Group allocates the purchase price of our business combinations to the tangible assets, liabilities and identifiable intangible assets acquired based on their estimated fair values, with the excess purchase price over those fair values being recorded as goodwill. The fair value assigned to identifiable intangible assets acquired is supported by valuations that involve the use of a large number of estimates and assumptions provided by management. The assumptions and estimates applied are based on best estimates at the respective acquisition dates.
In accordance with IAS 36 -
Impairment of Assets
, Goodwill and intangible assets with indefinite useful lives are not amortized and are tested for impairment annually or more frequently if facts or circumstances indicate that the asset may be impaired.
Goodwill and intangible assets with indefinite useful lives are allocated to operating segments or to CGUs within the operating segments. The impairment test is performed by comparing the carrying amount (which mainly comprises property, plant and equipment, goodwill, brands and capitalized development costs) and the recoverable amount of each CGU or group of CGUs to which Goodwill has been allocated. The recoverable amount of a CGU is the higher of its fair value less costs to sell and its value in use. The balance of Goodwill and intangible assets with indefinite useful lives recognized by the Group relates primarily to the acquisition of FCA US. Goodwill arising from this transaction has been allocated to the NAFTA, EMEA, APAC and LATAM operating segments.
The assumptions used in the impairment test represent management’s best estimate for the period under consideration. The estimate of the recoverable amount of each operating segment for purposes of performing the annual impairment test was based on the following assumptions:
|
•
|
The expected future cash flows covering the period from 2016 through 2020 have been derived primarily from the Group’s 2014-2018 business plan presented on May 6, 2014, as updated. These cash flows relate to the respective CGUs in their condition when preparing the financial statements and exclude the estimated cash flows that might arise from restructuring plans or other structural changes. Volumes and sales mix used for estimating the future cash flow are based on assumptions that are considered reasonable and sustainable and represent the best estimate of expected conditions regarding market trends and segment, brand and model share for the respective region over the period considered.
|
|
•
|
The expected future cash flows include a normalized terminal period to estimate the future result beyond the time period explicitly considered which incorporates a long-term growth rate assumption of 2 percent.
|
|
•
|
Post-tax cash flows have been discounted using a post-tax discount rate which reflects the current market assessment of the time value of money for the period being considered and the risks specific to the operating segment under consideration. The Weighted Average Cost of Capital (“WACC”) ranged from approximately 16 percent to approximately 19 percent. The WACC was calculated using the Capital Asset Pricing Model technique.
|
59
The value estimated as described above was determined to be in excess of the book value of the net capital employed for each operating segment to which Goodwill has been allocated. As such, no impairment charges were recognized for Goodwill and Intangible assets with indefinite useful lives for the years ended December 31, 2015, 2014 and 2013.
Goodwill and Intangible assets with indefinite useful lives at
December 31, 2015
included
€11,359 million
of Goodwill (
€10,185 million
at
December 31, 2014
) and €3,288 million of Intangible assets with indefinite useful lives (€
2,953 million
at
December 31, 2014
) resulting from the acquisition of interests in FCA US.
While underlying performance in all of the Group's operations has not been affected, subsequent to December 31, 2015, equity values of companies within the automotive industry have declined, including FCA’s. Continued decline in share prices could be deemed to be an impairment indicator and could affect our judgments and estimates used to assess the recoverability of our non-current assets, including goodwill, intangible assets and property, plant and equipment.
Recoverability of Deferred Tax Assets
The carrying amount of deferred tax assets is reduced to the extent that it is not probable that sufficient taxable profit will be available to allow the benefit of part or all of the deferred tax assets to be utilized.
At
December 31, 2015
, the Group had deferred tax assets on deductible temporary differences of €
9,606 million
(€
8,662 million
at
December 31, 2014
), of which €533 million was not recognized (€480 million at
December 31, 2014
). At December 31, 2015 the Group also had theoretical tax benefits on losses carried forward of €
3,717 million
(€
4,696 million
at
December 31, 2014
), of which €2,650 million was unrecognized (€2,934 million at
December 31, 2014
). In addition, the Group also had deferred tax liabilities on taxable temporary differences of €
6,953 million
at
December 31, 2015
(€
6,630 million
at
December 31, 2014
).
The recoverability of deferred tax assets is dependent on the Group’s ability to generate sufficient future taxable income in the period in which it is assumed that the deductible temporary differences reverse and tax losses carried forward can be utilized. In making this assessment, the Group considers future taxable income arising on the most recent budgets and plans, prepared by using the same criteria described for testing the impairment of assets and goodwill moreover, it estimates the impact of the reversal of taxable temporary differences on earnings and it also considers the period over which these assets could be recovered. These estimates and assumptions are subject to a high degree of uncertainty, in particular with regard to the future performance in Latin America and the Eurozone; therefore changes in current estimates due to unanticipated events could have a significant impact on the Group’s consolidated financial statements.
At December 31, 2015, we had approximately €571 million in net deferred tax assets in Brazil. At this time, we consider it probable that we will have sufficient taxable income in the future that will allow us to realize these deferred tax assets. However, we are monitoring the conditions in Brazil and believe that there is a reasonable possibility that it may be determined that some or all of the deferred tax assets may not be recoverable if negative market conditions persist or worsen. The effects of any changes in judgment about our deferred tax assets and their recoverability will be reported in the interim period in which they occur.
Sales Incentives
The Group records the estimated cost of sales incentive programs offered to dealers and consumers as a reduction to revenue at the time of sale to the dealer. This estimated cost represents the incentive programs offered to dealers and consumers, as well as the expected modifications to these programs in order to facilitate sales of the dealer inventory. Subsequent adjustments to incentive programs related to vehicles previously sold to dealers are recognized as an adjustment to revenue in the period the adjustment is determinable.
The Group uses price discounts to adjust vehicle pricing in response to a number of market and product factors, including: pricing actions and incentives offered by competitors, economic conditions, the amount of excess industry production capacity, the intensity of market competition, consumer demand for the product and the desire to support promotional campaigns. The Group may offer a variety of sales incentive programs at any given point in time, including: cash offers to dealers and consumers and subvention programs offered to customers, or lease subsidies, which reduce the
60
retail customer’s monthly lease payment or cash due at the inception of the financing arrangement, or both. Incentive programs are generally brand, model and region specific for a defined period of time, which may be extended.
Multiple factors are used in estimating the future incentive expense by vehicle line including the current incentive programs in the market, planned promotional programs and the normal incentive escalation incurred as the model year ages. The estimated incentive rates are reviewed monthly and changes to the planned rates are adjusted accordingly, thus impacting revenues. As discussed previously, there are a multitude of inputs affecting the calculation of the estimate for sales incentives, and an increase or decrease of any of these variables could have a significant effect on recorded revenues.
Product warranties, recall campaigns and product liabilities
The Group establishes accruals for product warranties at the time the sale is recognized. The Group issues various types of product warranties under which the performance of products delivered is generally guaranteed for a certain period or term. The accrual for product warranties includes the expected costs of warranty obligations imposed by law or contract, as well as the expected costs for policy coverage, recall actions and buyback commitments. The estimated future costs of these actions are principally based on assumptions regarding the lifetime warranty costs of each vehicle line and each model year of that vehicle line, as well as historical claims experience for the Group’s vehicles. In addition, the number and magnitude of additional service actions expected to be approved, and policies related to additional service actions, are taken into consideration. Due to the uncertainty and potential volatility of these estimated factors, changes in the assumptions used could materially affect the results of operations.
The Group periodically initiates voluntary service and recall actions to address various customer satisfaction as well as safety and emissions issues related to vehicles sold. Included in the reserve is the estimated cost of these service and recall actions. The estimated future costs of these actions are based primarily on historical claims experience for our vehicles. Given recent increases in both the cost and frequency of recall campaigns, and increased regulatory activity across the industry in the U.S. and Canada, an additional actuarial analysis that gives greater weight to the more recent calendar year trends in recall campaign activity was added to our adequacy assessment during the three months ended September 30, 2015. Refer to Note
2
within the Consolidated Financial Statements included elsewhere in this report for additional information.
Estimates of the future costs of these actions are inevitably imprecise due to numerous uncertainties, including the enactment of new laws and regulations, the number of vehicles affected by a service or recall action and the nature of the corrective action. It is reasonably possible that the ultimate cost of these service and recall actions may require the Group to make expenditures in excess of (or less than) established reserves over an extended period of time and in a range of amounts that cannot be reasonably estimated. The estimate of warranty and additional service and recall action obligations is periodically reviewed during the year. Experience has shown that initial data for any given model year can be volatile; therefore, our process relies upon long-term historical averages until sufficient data is available. As actual experience becomes available, it is used to modify the historical averages to ensure that the forecast is within the range of likely outcomes. Resulting accruals are then compared with current spending rates to ensure that the balances are adequate to meet expected future obligations.
In addition, the Group makes provisions for estimated product liability costs arising from property damage and personal injuries including wrongful death, and potential exemplary or punitive damages alleged to be the result of product defects. By nature, these costs can be infrequent, difficult to predict and have the potential to vary significantly in amount. The valuation of the reserve is actuarially determined on an annual basis based on, among other factors, the number of vehicles sold and product liability claims incurred. Costs associated with these provisions are recorded in the Consolidated Income Statement and any subsequent adjustments are recorded in the period in which the adjustment is determined.
Other Contingent Liabilities
The Group makes provisions in connection with pending or threatened disputes or legal proceedings when it is considered probable that there will be an outflow of funds and when the amount can be reasonably estimated. If an outflow of funds becomes possible but the amount cannot be estimated, the matter is disclosed in the notes to the financial statements. The Group is the subject of legal and tax proceedings covering a wide range of matters in various jurisdictions. Due to the uncertainty inherent in such matters, it is difficult to predict the outflow of funds that could result from such disputes with any certainty. Moreover, the cases and claims against the Group often derive from complex legal issues which are subject to a differing degree of uncertainty, including the facts and circumstances of each particular case and the manner in which applicable law is likely to be interpreted and applied to such fact and circumstances, and the jurisdiction and the different
61
laws involved. The Group monitors the status of pending legal procedures and consults with experts on legal and tax matters on a regular basis. It is therefore possible that the provisions for the Group’s legal proceedings and litigation may vary as the result of future developments in pending matters.
Litigation
The Group monitors the status of pending legal procedures and consults with experts on legal and tax matters on a regular basis. As such, the provisions for the Group’s legal proceedings and litigation may vary as a result of future developments in pending matters.
Various legal proceedings, claims and governmental investigations are pending against the Group on a wide range of topics, including vehicle safety, emissions and fuel economy, dealer, supplier and other contractual relationships, intellectual property rights, product warranties and environmental matters. Some of these proceedings allege defects in specific component parts or systems (including airbags, seats, seat belts, brakes, ball joints, transmissions, engines and fuel systems) in various vehicle models or allege general design defects relating to vehicle handling and stability, sudden unintended movement or crashworthiness. These proceedings seek recovery for damage to property, personal injuries or wrongful death and in some cases include a claim for exemplary or punitive damages. Adverse decisions in one or more of these proceedings could require the Group to pay substantial damages, or undertake service actions, recall campaigns or other costly actions.
Litigation is subject to many uncertainties, and the outcome of individual matters is not predictable with assurance. Moreover, the cases and claims against the Group are often derived from complex legal issues which are subject to differing degrees of uncertainty, including the facts and circumstances of each particular case, the manner in which the applicable law is likely to be interpreted and applied and the jurisdiction and the different laws involved. An accrual is established in connection with pending or threatened litigation if a loss is probable there will be an outflow of funds and when the amount can be reasonably estimated. If an outflow of funds becomes probable, but the amount cannot be estimated, the matter is disclosed in the notes to the Consolidated Financial Statements. Since these accruals represent estimates, the resolution of some of these matters could require the Group to make payments in excess of the amounts accrued or may require the Group to make payments in an amount or range of amounts that could not be reasonably estimated.
Share-Based Compensation
The Group accounts for share-based compensation plans in accordance with IFRS 2 -
Share-based Payment,
which requires measuring share-based compensation expense based on fair value. As described in Note
20
within the Consolidated Financial Statements included elsewhere in this report, the Group granted share-based payments for the years ended
December 31, 2015
,
2014
and
2013
to certain employees and directors.
The grant date fair value of certain FCA equity-awards with market conditions is measured using the Monte Carlo simulation model. The Monte Carlo simulation model requires the input of subjective assumptions, including the expected volatility of our common stock, interest rates and correlation coefficient between our common stock and the relevant market index. The grant date fair value of certain restricted stock unit FCA awards is calculated as the closing price of our common stock on the date of grant taking into account the terms and conditions upon which the instruments were granted.
Management uses its best estimate incorporating both publicly observable data and discounted cash flow methodologies in the measurement of fair value for liability-classified awards. The Group updates the measurement of the fair value of these awards on a regular basis. It is therefore possible that the amount of share-based payments reserve and liabilities for share-based payments may vary as the result of a significant change in the assumptions and estimates used.
Since there are no publicly observable market prices for FCA US’s membership interests, the fair value of the FCA US awards at the grant date was determined using a discounted cash flow methodology. The Group uses this approach, which is based on projected cash flows, to estimate FCA US’s enterprise value. Then the Group deducts the fair value of FCA US’s outstanding interest bearing debt as of the measurement date from the enterprise value to arrive at the fair value of FCA US’s equity. The significant assumptions used in the measurement of the fair value of these awards at each measurement date include different assumptions, for example, three years of annual projections that reflect the estimated after-tax cash flows a market participant would expect to generate from FCA US’s operating business, an estimated after-tax weighted average cost of capital and projected worldwide factory shipments.
62
New Standards Applicable from January 1, 2015
For new standards, amendments and interpretations issued by the IASB that are effective from January 1, 2015, reference should be made to the notes within the Consolidated Financial Statements included elsewhere in this report.
Non-GAAP Financial Measures
We monitor our operations through the use of several non-generally accepted accounting procedures, or non-GAAP, financial measures: Net Debt, Net Industrial Debt, Adjusted EBIT and certain information provided on a constant currency basis. We believe that these non-GAAP financial measures provide useful and relevant information regarding our operating results and enhance the overall ability to assess our financial performance and financial position. They provide us with comparable measures which facilitate management’s ability to identify operational trends, as well as make decisions regarding future spending, resource allocations and other operational decisions. These and similar measures are widely used in the industry in which we operate.
These financial measures may not be comparable to other similarly titled measures of other companies and are not intended to be substitutes for measures of financial performance and financial position as prepared in accordance with IFRS.
Net Debt
The following table details our Net Debt at
December 31, 2015
and
2014
and provides a reconciliation of this non-GAAP measure to Debt, which is the most directly comparable measure included in our Consolidated Statement of Financial Position.
Due to different sources of cash flows used for the repayment of the financial debt between industrial activities and financial services (by cash from operations for industrial activities and by collection of financial receivables for financial services) and the different business structure and leverage implications, we provide a separate analysis of Net Debt between industrial activities and financial services.
The division between industrial activities and financial services represents a sub-consolidation based on the core business activities (industrial or financial services) of each Group company. The sub-consolidation for industrial activities also includes companies that perform centralized treasury activities, such as raising funding in the market and financing Group companies, but do not, however, provide financing to third parties. Financial services includes companies that provide retail and dealer finance, leasing and rental services in support of the mass-market vehicle brands in certain geographical segments and for Maserati.
Net Industrial Debt (
i.e.
, Net Debt of industrial activities) is management’s primary measure for analyzing our financial leverage and capital structure and is one of the key targets used to measure our performance, however it should not be considered as a substitute for cash flow or other methods of analyzing our results as reported under IFRS.
|
December 31, 2015
|
December 31, 2014
|
||||||||||||||||
|
Industrial
Activities |
Financial
Services |
Consolidated
|
Industrial
Activities |
Financial
Services |
Consolidated
|
||||||||||||
|
(€ million)
|
|||||||||||||||||
|
Debt with third parties
|
(26,682
|
)
|
(1,104
|
)
|
(27,786
|
)
|
(31,743
|
)
|
(1,981
|
)
|
(33,724
|
)
|
|||||
|
Net intercompany financial receivables/payables and current financial receivables from jointly-controlled financial services companies
|
545
|
|
(568
|
)
|
(23
|
)
|
1,511
|
|
(1,453
|
)
|
58
|
|
|||||
|
Other financial assets/(liabilities) (net)
|
103
|
|
14
|
|
117
|
|
(229
|
)
|
(4
|
)
|
(233
|
)
|
|||||
|
Current securities
|
457
|
|
25
|
|
482
|
|
180
|
|
30
|
|
210
|
|
|||||
|
Cash and cash equivalents
|
20,528
|
|
134
|
|
20,662
|
|
22,627
|
|
213
|
|
22,840
|
|
|||||
|
Net Debt
|
(5,049
|
)
|
(1,499
|
)
|
(6,548
|
)
|
(7,654
|
)
|
(3,195
|
)
|
(10,849
|
)
|
|||||
63
Adjusted EBIT
Adjusted EBIT is calculated as EBIT excluding: gains/(losses) on the disposal of investments, restructuring, impairments, asset write-offs and other unusual income/(expenses) that are considered rare or discrete events that are infrequent in nature. Adjusted EBIT is used for internal reporting to assess performance and as part of the Group's forecasting, budgeting and decision making processes as it provides additional transparency of the Group's core operations. We believe this measure allows management to view operating trends, perform analytical comparisons and benchmark performance between periods and among our segments. We also believe that Adjusted EBIT provides useful information to investors as it is a common performance measure to compare results or estimate valuations across companies in our industry. Refer to the section —
Group Results
below for further discussion and refer to Note
29
within the Consolidated Financial Statements included elsewhere in this report for a reconciliation of Adjusted EBIT to EBIT, which is the most directly comparable measure included in our Consolidated Income Statement. Adjusted EBIT should not be considered as a substitute for net profit/(loss), cash flow or other methods of analyzing our results as reported under IFRS.
Constant Currency Information
The discussion within
Item 5A. Operating Results—Results of Operations
includes information about our results at constant exchange rates (“CER”), which is calculated by applying the prior-year average exchange rates to current financial data expressed in local currency in which the relevant financial statements are denominated (see
Significant Accounting Policies
in the Consolidated Financial Statements included elsewhere in this report for information on the exchange rates applied). Although we do not believe that this non-GAAP measure is a substitute for GAAP measures, we do believe that such results excluding the impact of currency fluctuations year-on-year, provide additional useful information to investors regarding the operating performance and trends in our business on a local currency basis.
A. Operating Results
Shipment Information
As discussed in
Item 4B. Business Overview—Overview of Our Business,
our activities are carried out through six reportable segments: four regional mass-market vehicle segments (NAFTA, LATAM, APAC and EMEA), the Maserati global luxury brand segment and a global Components segment. The following table sets forth our vehicle shipment information by segment (excluding the Components segment). Vehicle shipments are generally aligned with current period production which is driven by our plans to meet consumer demand. Revenue is generally recognized when the risks and rewards of ownership of a vehicle have been transferred to our dealers or distributors, which usually occurs upon the release of the vehicle to the carrier responsible for transporting the vehicle to our dealer or distributor. Revenues related to new vehicle sales with a buy-back commitment, or through the Guaranteed Depreciation Program (“GDP”), under which the Group guarantees the residual value or otherwise assumes responsibility for the minimum resale value of the vehicle, are not recognized at the time of delivery but are accounted for similar to an operating lease and rental income is recognized over the contractual term of the lease on a straight line basis. For a description of our dealers and distributors see
Item 4B. Business Overview—Mass-Market Vehicles
. Accordingly, the number of vehicles sold does not necessarily correspond to the number of vehicles shipped for which revenues are recorded in any given period.
|
(In thousands of units)
|
Shipments
|
|||||||
|
For the Years Ended December 31,
|
||||||||
|
2015
|
2014
|
2013
|
||||||
|
NAFTA
|
2,726
|
|
2,493
|
|
2,238
|
|
||
|
LATAM
|
553
|
|
827
|
|
950
|
|
||
|
APAC
|
149
|
|
220
|
|
163
|
|
||
|
EMEA
|
1,142
|
|
1,024
|
|
979
|
|
||
|
Maserati
|
32
|
|
36
|
|
15
|
|
||
|
Total
|
4,602
|
|
4,601
(1)
|
|
4,345
|
|
||
__________________________
(1) Total may not add due to rounding
64
Results of Operations
Consolidated Results of Operations –
2015
compared to
2014
and
2014
compared to
2013
The following is a discussion of the results of operations for the year ended
December 31, 2015
as compared to the year ended
December 31, 2014
and for the year ended
December 31, 2014
as compared to the year ended
December 31, 2013
. The discussion of certain line items (Cost of sales, Selling, general and administrative costs and Research and development costs) includes a presentation of such line items as a percentage of Net revenues for the respective periods presented as well as constant exchange rates, to facilitate year-on-year comparisons.
|
For the Years Ended December 31,
|
|||||||||
|
(€ million)
|
2015
|
2014
|
2013
|
||||||
|
Net revenues
|
110,595
|
|
93,640
|
|
84,530
|
|
|||
|
Cost of sales
|
97,620
|
|
81,592
|
|
73,038
|
|
|||
|
Selling, general and administrative costs
|
7,728
|
|
6,947
|
|
6,615
|
|
|||
|
Research and development costs
|
2,864
|
|
2,334
|
|
2,275
|
|
|||
|
Result from investments
|
143
|
|
131
|
|
84
|
|
|||
|
Gains on disposal of investments
|
—
|
|
12
|
|
8
|
|
|||
|
Restructuring costs
|
53
|
|
50
|
|
28
|
|
|||
|
Other income/(expenses)
|
152
|
|
(26
|
)
|
(28
|
)
|
|||
|
EBIT
|
2,625
|
|
2,834
|
|
2,638
|
|
|||
|
Net financial expenses
|
2,366
|
|
2,051
|
|
1,989
|
|
|||
|
Profit before taxes
|
259
|
|
783
|
|
649
|
|
|||
|
Tax expense/(income)
|
166
|
|
424
|
|
(1,059
|
)
|
|||
|
Net profit from continuing operations
|
93
|
|
359
|
|
1,708
|
|
|||
|
Profit from discontinued operations, net of tax
|
284
|
|
273
|
|
243
|
|
|||
|
Net profit
|
377
|
|
632
|
|
1,951
|
|
|||
|
Net profit attributable to:
|
|||||||||
|
Owners of the parent
|
334
|
|
568
|
|
904
|
|
|||
|
Non-controlling interests
|
43
|
|
64
|
|
1,047
|
|
|||
Net revenues
|
For the Years Ended December 31,
|
Increase/(decrease)
|
||||||||||||||||||||||
|
(€ million, except percentages)
|
2015
|
2014
|
2013
|
2015 vs. 2014
|
CER
|
2014 vs. 2013
|
CER
|
||||||||||||||||
|
Net revenues
|
110,595
|
|
93,640
|
|
84,530
|
|
16,955
|
|
18.1
|
%
|
5.9
|
%
|
9,110
|
|
10.8
|
%
|
11.7
|
%
|
|||||
For a detailed discussion of Net revenues by segment for the years ended
December 31, 2015
,
2014
and
2013
, see
—
Results by
Segment
below.
65
Cost of sales
|
For the Years Ended December 31,
|
Increase/(decrease)
|
|||||||||||||||||||||||||||
|
(€ million,
except percentages) |
2015
|
Percentage
of net revenues |
2014
|
Percentage
of net revenues |
2013
|
Percentage
of net revenues |
2015 vs. 2014
|
2014 vs. 2013
|
||||||||||||||||||||
|
Cost of sales
|
97,620
|
|
88.3
|
%
|
81,592
|
|
87.1
|
%
|
73,038
|
|
86.4
|
%
|
16,028
|
|
19.6
|
%
|
8,554
|
|
11.7
|
%
|
||||||||
Cost of sales includes purchases, product warranty and recall campaign costs, labor costs, depreciation, amortization and logistic costs. We purchase a variety of components (including mechanical, steel, electrical and electronic, plastic components as well as castings and tires), raw materials (steel, rubber, aluminum, resin, copper, lead, and precious metals including platinum, palladium and rhodium), supplies, utilities, logistics and other services from numerous suppliers which we use to manufacture our vehicles, parts and accessories. These purchases generally account for approximately
80
percent of total Cost of sales. Fluctuations in Cost of sales are primarily related to the number of our vehicles we produce and ship, along with changes in vehicle mix, as newer models of vehicles generally have more technologically advanced components and enhancements and therefore additional costs per unit. Cost of sales could also be affected, to a lesser extent, by fluctuations in certain raw material prices.
2015
compared to
2014
The
increase
in Cost of sales in 2015 compared to 2014 of €
16.0 billion
or
19.6 percent
(7.3 percent at CER) was primarily due to (i) a total
€4.0
billion increase related to product mix as well as increased volumes in NAFTA, EMEA and Components, partially offset by a reduction in volumes in LATAM, APAC and M
aserati and (ii) foreign currency translation effects of €10.1 billion primarily related to the strengthening of the U.S.$.
2014
compared to
2013
Cost of sales increased in 2014 compared to 2013 by €
8.6 billion
or
11.7 percent
(12.6 percent at CER) was primarily due to the combination of (i) €5.6 billion related to increased vehicle shipments, primarily in the NAFTA, APAC, Maserati and EMEA segments, partially offset by a reduction in LATAM shipments, (ii) €2.5 billion related to vehicle and distribution channel mix primarily attributable to the NAFTA segment (iii) €0.8 billion related to an increase in warranty expense which included the effects of recall campaigns in the NAFTA segment (iv) €0.5 billion arising primarily from price increases for certain raw materials in LATAM, which were partially offset by (v) foreign currency translation effect of €0.7 billion.
In particular, the €2.5 billion increase in Cost of sales related to vehicle and distribution channel mix was primarily driven by the higher percentage of growth in certain SUV shipments as compared to passenger car shipments, along with more retail shipments relative to fleet shipments in NAFTA.
The foreign currency translation impact of €0.7 billion was primarily attributable to the LATAM segment, driven by the weakening of the Brazilian Real against the Euro.
For the year ended December 31, 2014, Cost of Sales included €98 million related to the remeasurement of our VEF denominated net monetary assets, which was excluded from Adjusted EBIT (described in more detail in Note
30
of the Consolidated Financial Statements included elsewhere in this report).
66
Selling, general and administrative costs
|
For the Years Ended December 31,
|
Increase/(decrease)
|
|||||||||||||||||||||||||||
|
(€ million, except percentages)
|
2015
|
Percentage
of net revenues |
2014
|
Percentage
of net revenues |
2013
|
Percentage
of net revenues |
2015 vs. 2014
|
2014 vs. 2013
|
||||||||||||||||||||
|
Selling, general and administrative costs
|
7,728
|
|
7.0
|
%
|
6,947
|
|
7.4
|
%
|
6,615
|
|
7.8
|
%
|
781
|
|
11.2
|
%
|
332
|
|
5.0
|
%
|
||||||||
2015
compared to
2014
Selling, general and administrative costs include advertising, personnel, and other costs. Advertising costs accounted for approximately 46 percent and 45 percent of total selling, general and administrative costs for the year ended
December 31, 2015
and
2014
respectively.
The
increase
in Selling, general and administrative costs in 2015 compared to 2014 of €
781 million
(1.9 percent at CER) was due to the combined effects of (i) foreign currency translation primarily resulting from the strengthening of the U.S.$ against the Euro of approximately €650 million, (ii) commercial launch costs related to the all-new 2015 Jeep Renegade and start-up costs for the Pernambuco plant in the LATAM segment totaling €104 million and (iii) an increase of €42 million in advertising expenses for the EMEA segment for the all-new 2015 Jeep Renegade and Fiat 500X, which was partially offset by (iv) lower marketing expenses in APAC.
2014
compared to
2013
The increase in Selling, general and administrative costs in 2014 compared to 2013 of €
332 million
(6.0 percent at CER) was due to the combined effects of (i) a €293 million increase in advertising expenses driven primarily by the NAFTA, APAC and EMEA segments, (ii) a €157 million increase in other Selling, general and administrative costs primarily attributable to the LATAM and Maserati segments, and to a lesser extent, the APAC segment which were partially offset by (iii) a reduction in other general and administrative expenses in the NAFTA segment and (iv) the impact of foreign currency translation of €68 million.
The increase in advertising expenses was largely attributable to the APAC and NAFTA segments to support the growth of the business in their respective markets. In addition, advertising expenses increased within the NAFTA segment for new product launches, including the all-new 2014 Jeep Cherokee and the all-new 2015 Chrysler 200. There were additional increases in advertising expenses for the EMEA segment related to the Jeep brand growth and new product launches, including the all-new 2014 Jeep Cherokee and Renegade. The foreign currency translation impact of €68 million was primarily attributable to the LATAM segment, driven by the weakening of the Brazilian Real against the Euro.
The increase in other Selling, general and administrative costs attributable to the Maserati segment has been driven by the increase in volumes. The increase in other selling, general and administrative costs attributable to the APAC segment was driven by volume growth in the region, while the increase in the LATAM segment includes the start-up costs of the Pernambuco plant.
67
Research and development costs
|
For the Years Ended December 31,
|
Increase/(decrease)
|
|||||||||||||||||||||||||||
|
(€ million, except percentages)
|
2015
|
Percentage
of net revenues |
2014
|
Percentage
of net revenues |
2013
|
Percentage
of net revenues |
2015 vs. 2014
|
2014 vs. 2013
|
||||||||||||||||||||
|
Research and
development expensed during the year |
1,449
|
|
1.3
|
%
|
1,320
|
|
1.4
|
%
|
1,257
|
|
1.5
|
%
|
129
|
|
9.8
|
%
|
63
|
|
5.0
|
%
|
||||||||
|
Amortization of
capitalized development costs |
1,194
|
|
1.1
|
%
|
932
|
|
1.0
|
%
|
768
|
|
0.9
|
%
|
262
|
|
28.1
|
%
|
164
|
|
21.4
|
%
|
||||||||
|
Write-down of
costs previously capitalized |
221
|
|
0.2
|
%
|
82
|
|
0.1
|
%
|
250
|
|
0.3
|
%
|
139
|
|
n.m.
(1)
|
|
(168
|
)
|
(67.2
|
)%
|
||||||||
|
Research and development
costs |
2,864
|
|
2.6
|
%
|
2,334
|
|
2.5
|
%
|
2,275
|
|
2.7
|
%
|
530
|
|
22.7
|
%
|
59
|
|
2.6
|
%
|
||||||||
(1) Number is not meaningful.
We conduct research and development for new vehicles and technology to improve the performance, safety, fuel efficiency, reliability, consumer perception and environmental impact of our vehicles. Research and development costs consist primarily of material costs and personnel related expenses that support the development of new and existing vehicles with powertrain technologies. For further details of research and development costs, see
Item 5. Operating and Financial Review—Trends, Uncertainties and Opportunities—Product Development and Item 5C. Research and Development, Patents and Licenses, etc.—Research and Development.
2015
compared to
2014
The increase in amortization of capitalized development costs in 2015 compared to 2014 was mainly attributable to the launch of new products primarily related to the NAFTA segment driven by the all-new 2015 Jeep Renegade, the Jeep Cherokee and the Dodge Challenger, as well as the EMEA segment driven by the all-new 2015 Fiat 500X.
The write-off of costs previously capitalized during the year ended December 31, 2015 mainly related to the Group's plan to realign a portion of its capacity in NAFTA to better meet market demand for Ram pickup trucks and Jeep vehicles within the Group's existing plant infrastructure, which resulted in an impairment charge of
€176
million for capitalized development costs that had no future economic benefit and which were excluded from Adjusted EBIT for the year ended
December 31, 2015
.
2014
compared to
2013
The increase in amortization of capitalized development costs in 2014 compared to 2013 was attributable to the launch of new products, and in particular related to the NAFTA segment, driven by the all-new 2014 Jeep Cherokee, which began shipping to dealers in late October 2013, and the all-new 2015 Chrysler 200, which was launched in the first quarter of 2014 and began arriving in dealerships in May 2014.
Result from investments
|
For the Years Ended December 31,
|
Increase/(decrease)
|
||||||||||||||||||||
|
(€ million, except percentages)
|
2015
|
2014
|
2013
|
2015 vs. 2014
|
2014 vs. 2013
|
||||||||||||||||
|
Result from investments
|
143
|
|
131
|
|
84
|
|
12
|
|
9.2
|
%
|
47
|
|
56.0
|
%
|
|||||||
68
2015
compared to
2014
and
2014
compared to
2013
The increase in Result from investments in 2015 compared to 2014 and the increase in 2014 compared to 2013 was primarily attributable to improved results of FCA Bank S.p.A. (“FCA Bank”), a jointly-controlled finance company that manages activities in retail automotive financing, dealership financing, long-term car rental and fleet management in 17 European countries, and Tofas-Turk Otomobil Fabrikasi A.S. (“Tofas”) a jointly-controlled Turkish automaker.
Other income/(expenses)
|
For the Years Ended December 31,
|
Increase/(decrease)
|
|||||||||||||||||||
|
(€ million, except percentages)
|
2015
|
2014
|
2013
|
2015 vs. 2014
|
2014 vs. 2013
|
|||||||||||||||
|
Other income/(expenses)
|
152
|
|
(26
|
)
|
(28
|
)
|
178
|
|
n.m.
(1)
|
(2
|
)
|
(7.1
|
)%
|
|||||||
(1) Number is not meaningful.
2015
compared to
2014
Other income/(expenses) for the year ended
December 31, 2015
included €104 million of income related to the favorable settlements of legal matters to which we were the plaintiff, and which has been excluded from Adjusted EBIT. This was partially offset by a total charge of €81 million resulting from a consent order agreed with NHTSA
on July 24, 2015, (the “Consent Order”)
which resolved the issues raised by NHTSA with respect to FCA US's execution of 23 recall campaigns in NHTSA's Special Order issued to FCA US on May 22, 2015. Pursuant to the Consent Order, FCA US made a U.S.$70 million (€63 million) cash payment to NHTSA in September 2015 and will spend U.S.$20 million (€18 million) on industry and consumer outreach activities and incentives to enhance certain recall and service campaign completion rates. In addition, an amendment to the Consent Order was issued in December 2015 whereby a penalty of U.S.$70 million (€63 million) was imposed by NHTSA following the Group's admission of deficiencies in its Transportation Recall Enhancement, Accountability and Documentation ("TREAD Act") reporting to NHTSA (refer to the section —
Results by Segment - NAFTA
below).
The penalty was paid on January 6, 2016.
There were no other items that were individually material.
2014
compared to
2013
For the year ended
December 31, 2014
, Other income/(expenses) included the €495 million expense recognized in connection with the execution of the MOU with the UAW entered into by FCA US in January 2014, which was partially offset by the non-taxable gain of €223 million on the remeasurement to fair value of the previously exercised options on approximately 10 percent of FCA US's membership interest in connection with the acquisition of the remaining equity interest in FCA US previously not owned. There were no other items that were individually material.
EBIT
|
For the Years Ended December 31,
|
Increase/(decrease)
|
||||||||||||||||||||
|
(€ million, except percentages)
|
2015
|
2014
|
2013
|
2015 vs. 2014
|
2014 vs. 2013
|
||||||||||||||||
|
EBIT
|
2,625
|
|
2,834
|
|
2,638
|
|
(209
|
)
|
(7.4
|
)%
|
196
|
|
7.4
|
%
|
|||||||
2015
compared to
2014
The
decrease
in EBIT in 2015 compared to 2014 was primarily attributable to decreases in (i) APAC of €
690 million
, (ii) LATAM of €
483 million
and (iii) Maserati of €
173 million
, which were partially offset by increases in (iv) NAFTA of €
1,172 million
, (v) EMEA of €
275 million
and (vi) Components of €
84 million
. For the year ended December 31, 2015, EBIT included net expenses totaling €2,169 of items that were excluded from our Adjusted EBIT non-GAAP measure, of which €
1,631 million
related to NAFTA,
€219 million
to LATAM,
€205 million
to APAC and €47 million to EMEA.
69
2014
compared to
2013
The increase in EBIT in 2014 compared to 2013 was primarily attributable to the combined effect of (i) a €397 million decrease in EMEA loss, (ii) a €202 million increase in APAC (iii) a €169 million increase in Maserati, (iv) a €114 million increase in Components and (v) the non-cash and non-taxable gain of €223 million on the re-measurement to fair value of the previously exercised options on approximately 10 percent of FCA US’s membership interest in connection with the acquisition of the remaining 41.5 percent interest in FCA US that was not previously owned, which were partially offset by (vi) a €643 million decrease in NAFTA and (vi) a €315 million decrease in LATAM.
Adjusted EBIT
|
For the Years Ended December 31,
|
Increase/(decrease)
|
||||||||||||||||||||
|
(€ million, except percentages)
|
2015
|
2014
|
2013
|
2015 vs. 2014
|
2014 vs. 2013
|
||||||||||||||||
|
Adjusted EBIT
|
4,794
|
|
3,362
|
|
3,181
|
|
1,432
|
|
42.6
|
%
|
181
|
|
5.7
|
%
|
|||||||
For a detailed discussion of group Adjusted EBIT by segment for the years ended
December 31, 2015
,
2014
and
2013
, see
—
Results by Segment
below.
Refer to Note
29
within the Consolidated Financial Statements included elsewhere in this report for a reconciliation of Adjusted EBIT to EBIT, which is the most directly comparable measure included in the Consolidated Income Statement.
Net financial expenses
|
For the Years Ended December 31,
|
Increase/(decrease)
|
||||||||||||||||||||
|
(€ million, except percentages)
|
2015
|
2014
|
2013
|
2015 vs. 2014
|
2014 vs. 2013
|
||||||||||||||||
|
Net financial expenses
|
2,366
|
|
2,051
|
|
1,989
|
|
315
|
|
15.4
|
%
|
62
|
|
3.1
|
%
|
|||||||
2015
compared to
2014
The increase in Net financial expenses in 2015 compared to 2014 was primarily due to higher debt levels and interest rates in Brazil, the net loss of €168 million recognized in connection with the prepayments of the FCA US secured senior notes due in 2019 and 2021, which included the call premiums, net of the remaining unamortized debt premiums, as well as unfavorable foreign currency translation. The increase was partially offset by interest cost savings resulting from the refinancing and reduction in overall gross debt in 2015.
2014
compared to
2013
Excluding the gain on the Fiat stock option-related equity swaps of €31 million recognized in 2013, net financial expenses were substantially unchanged as the benefits from the financing transactions completed in February 2014 by FCA US were offset by higher average debt levels (refer to Note
23
within the Consolidated Financial Statements included elsewhere in this report for a more detailed description of FCA US's financings).
Tax expense/(income)
|
For the Years Ended December 31,
|
Increase/(decrease)
|
|||||||||||||||||||
|
(€ million, except percentages)
|
2015
|
2014
|
2013
|
2015 vs. 2014
|
2014 vs. 2013
|
|||||||||||||||
|
Tax expense/(income)
|
166
|
|
424
|
|
(1,059
|
)
|
(258
|
)
|
(60.8
|
)%
|
1,483
|
|
n.m.
(1)
|
|||||||
(1) Number is not meaningful.
2015
compared to
2014
The decrease in tax expense in 2015 compared to 2014 was primarily related to lower Profit before taxes and a higher amount of non-taxable incentives. The decrease in tax expense was partially offset by a decrease in certain one-time
70
discrete items as Profit before taxes for the year
ended
December 31, 2014
included the non-taxable gain related to the fair value remeasurement of the previously exercised options in connection with the acquisition of the remaining equity interest of FCA US previously not owned.
The effective tax rate increased from
46.4 percent
in 2014 to
54.4 percent
in 2015 as a result of the decrease in Profit before tax and the relative increased impact of losses before tax in jurisdictions in which a tax benefit is not recorded on tax losses.
2014
compared to
2013
Higher deferred tax expense in 2014 was due to the recognition in 2013 of €1,500 million of previously unrecognized deferred tax assets, primarily related to tax loss carry forwards and temporary differences in NAFTA.
Profit from discontinued operations, net of tax
|
For the Years Ended December 31,
|
Increase/(decrease)
|
||||||||||||||||||||
|
(€ million, except percentages)
|
2015
|
2014
|
2013
|
2015 vs. 2014
|
2014 vs. 2013
|
||||||||||||||||
|
Profit from discontinued operations, net of tax
|
284
|
|
273
|
|
243
|
|
11
|
|
4.0
|
%
|
30
|
|
12.3
|
%
|
|||||||
As the spin-off of Ferrari was approved on December 3, 2015 and since it was available for immediate distribution, our Ferrari operating segment was presented as a discontinued operation in the Consolidated Financial Statements for the years ended December 31, 2015, 2014 and 2013. For more information, see
—Principal Activities
in our Consolidated Financial Statements included elsewhere in this report.
Results by Segment
The following is a discussion of Net revenues, Adjusted EBIT and shipments for each segment.
|
(€ million, except
shipments which are in
thousands of units)
|
Net revenues
for the years ended December 31,
|
Adjusted EBIT
for the years ended
December 31, |
Shipments
for the years ended
December 31, |
||||||||||||||||||
|
2015
|
2014
|
2013
|
2015
|
2014
|
2013
|
2015
|
2014
|
2013
|
|||||||||||||
|
NAFTA
|
69,992
|
|
52,452
|
|
45,777
|
|
4,450
|
|
2,179
|
|
2,219
|
|
2,726
|
|
2,493
|
|
2,238
|
|
|||
|
LATAM
|
6,431
|
|
8,629
|
|
9,973
|
|
(87
|
)
|
289
|
|
619
|
|
553
|
|
827
|
|
950
|
|
|||
|
APAC
|
4,885
|
|
6,259
|
|
4,668
|
|
52
|
|
541
|
|
338
|
|
149
|
|
220
|
|
163
|
|
|||
|
EMEA
|
20,350
|
|
18,020
|
|
17,335
|
|
213
|
|
(41
|
)
|
(291
|
)
|
1,142
|
|
1,024
|
|
979
|
|
|||
|
Maserati
|
2,411
|
|
2,767
|
|
1,659
|
|
105
|
|
275
|
|
171
|
|
32
|
|
36
|
|
15
|
|
|||
|
Components
|
9,770
|
|
8,619
|
|
8,080
|
|
395
|
|
285
|
|
208
|
|
—
|
|
—
|
|
—
|
|
|||
|
Other activities
|
844
|
|
831
|
|
929
|
|
(150
|
)
|
(116
|
)
|
(80
|
)
|
—
|
|
—
|
|
—
|
|
|||
|
Unallocated items &
adjustments
(1)
|
(4,088
|
)
|
(3,937
|
)
|
(3,891
|
)
|
(184
|
)
|
(50
|
)
|
(3
|
)
|
—
|
|
—
|
|
—
|
|
|||
|
Total
|
110,595
|
|
93,640
|
|
84,530
|
|
4,794
|
|
3,362
|
|
3,181
|
|
4,602
|
|
4,601
(2)
|
|
4,345
|
|
|||
__________________________
(1) Primarily includes intercompany transactions which are eliminated in consolidation
(2) Total do not add due to rounding
71
NAFTA
|
For the Years Ended December 31,
|
Increase/(decrease)
|
||||||||||||||||||||||||
|
(€ million, except
percentages and shipments which are in thousands of units) |
2015
|
2014
|
2013
|
2015 vs. 2014
|
CER
|
2014 vs. 2013
|
CER
|
||||||||||||||||||
|
Shipments
|
2,726
|
|
2,493
|
|
2,238
|
|
233
|
|
9.3
|
%
|
—
|
|
255
|
|
11.4
|
%
|
—
|
|
|||||||
|
Net revenues
|
69,992
|
|
52,452
|
|
45,777
|
|
17,540
|
|
33.4
|
%
|
13.1
|
%
|
6,675
|
|
14.6
|
%
|
14.6
|
%
|
|||||||
|
Adjusted EBIT
|
4,450
|
|
2,179
|
|
2,219
|
|
2,271
|
|
104.2
|
%
|
71.3
|
%
|
(40
|
)
|
(1.8
|
)%
|
(1.8
|
)%
|
|||||||
|
Adjusted EBIT margin
|
6.4
|
%
|
4.2
|
%
|
4.8
|
%
|
|
||||||||||||||||||
Net revenues
2015
compared to
2014
The
increase
in NAFTA Net revenues in 2015 compared to 2014 was primarily attributable to (i) an increase in volumes of €5.0 billion, (ii) positive net pricing of €0.7 billion and (iii) favorable foreign currency translation effects of €10.7 billion.
The
9.3
percent increase in vehicle shipments in 2015 compared to 2014 was driven by increased demand for the Jeep and Ram brands, led by the all-new 2015 Jeep Renegade and the Jeep Cherokee.
The €0.7 billion impact resulting from favorable net pricing reflected positive pricing and dealer discount reductions that were partially offset by incentives and foreign exchange transaction effects.
2014
compared to
2013
The
increase
in NAFTA Net revenues in 2014 compared to 2013 was primarily attributable to (i) an increase in shipments of €4.4 billion, (ii) favorable market and vehicle mix of €1.9 billion and (iii) favorable net pricing of €0.4 billion.
The 11.4 percent increase in vehicle shipments was largely driven by increased demand for the Group’s vehicles, including the all-new 2014 Jeep Cherokee, Ram pickups and the Jeep Grand Cherokee. These increases were partially offset by a reduction in the prior model year Chrysler 200 and Dodge Avenger shipments due to their discontinued production in the first quarter of 2014 in preparation for the launch and changeover to the all-new 2015 Chrysler 200, which began arriving in dealerships in May 2014.
Of the favorable mix impact of €1.9 billion, €1.7 billion related to vehicle mix due to a higher proportion of trucks and certain SUVs as compared to passenger cars (as these larger vehicles generally have a higher selling price), and €0.2 billion related to a shift in distribution channel mix to greater retail shipments as a percentage of total shipments, which is consistent with the continuing strategy to grow the U.S. retail market share while maintaining stable fleet shipments.
Favorable net pricing of €0.4 billion reflected favorable pricing and pricing for enhanced content, partially offset by incentive spending on certain vehicles in the portfolio.
Adjusted EBIT
2015
compared to
2014
The
increase
in NAFTA Adjusted EBIT in 2015 compared to 2014 was mainly attributable to (i) a positive impact of €1,164 million primarily related to the increase in volumes as described above, (ii) an increase of €736 million due to positive net pricing and (iii) an increase of €718 million primarily related to positive foreign currency translation effects, which was partially offset by (iv) an increase in industrial costs of €342 million including increased recall and warranty costs, as described below, as well as product costs for vehicle content enhancements, net of purchasing efficiencies. Adjusted EBIT excluded total net charges of €
1,631 million
, which primarily consisted of the items discussed below.
72
As part of the plan to improve margins in NAFTA, the Group will realign a portion of its manufacturing capacity in the region to better meet market demand for Ram pickup trucks and Jeep vehicles within the Group's existing plant infrastructure. As a result, a total of €834 million, of which €422 million related to tangible asset impairments, €236 million related to the payment of supplemental unemployment benefits due to planned extended downtime at certain plants associated with the implementation of the new manufacturing plan and €176 million related to the impairment of capitalized development costs with no future economic benefit, was recorded during the fourth quarter of 2015 and has been excluded from Adjusted EBIT for the year ended December 31, 2015.
Given recent increases in both the cost and frequency of recall campaigns and increased regulatory activity across the industry in the U.S and Canada, an additional actuarial analysis that gives greater weight to the more recent calendar year trends in recall campaign experience was added to the adequacy assessment to estimate future recall costs. This reassessment in the third quarter of 2015 resulted in a change in estimate for the campaign accrual of €761 million for the U.S. and Canada for estimated future recall campaign costs for vehicles sold in periods prior to the third quarter of 2015, which was excluded from Adjusted EBIT for the year ended December 31, 2015. In the second half of 2015, in connection with this reassessment, we incurred additional warranty costs related to the increase in the accrual rate per vehicle, which were included in Adjusted EBIT.
On July 24, 2015, FCA US entered into the Consent Order with NHTSA, which resolved the issues raised by NHTSA with respect to FCA US’s execution of 23 recall campaigns in NHTSA’s Special Order issued to FCA US on May 22, 2015 and further addressed at a NHTSA public hearing held on July 2, 2015. Pursuant to the Consent Order, FCA US made a U.S.$70 million (€63 million) cash payment to NHTSA in September 2015 and will spend U.S.$20 million (€18 million) on industry and consumer outreach activities and incentives to enhance certain recall and service campaign completion rates. For the year ended
December 31, 2015
, the total €81 million charge was excluded from Adjusted EBIT. An additional U.S.$15 million (€14 million) payment will be payable by FCA US if it fails to comply with certain terms of the Consent Order.
FCA US also agreed under the Consent Order to offer, as an alternative remedy, to repurchase vehicles subject to three recall campaigns that had not already been remedied as of the date of the Consent Order at a price equal to the original purchase price less a reasonable allowance for depreciation plus ten percent. In addition, FCA US offered consumer incentives to encourage owners of vehicles subject to the structural reinforcement campaign to participate in the campaign. All premiums paid to repurchase vehicles in the three recall campaigns and customer incentives will be applied as credits to the U.S.$20 million (€18 million) that FCA US has agreed to spend on industry outreach amounts under the Consent Order. Although such amounts may exceed U.S.$20 million (€18 million), FCA US does not expect the net cost of providing these additional alternatives will be material to its financial position, liquidity or results of operations. The Consent Order will remain in place for three years subject to NHTSA’s right to extend for an additional year in the event of FCA US's noncompliance with the Consent Order.
Following admission of deficiencies in FCA US's reporting to NHTSA pursuant to the TREAD Act, an amendment to the Consent Order was issued in December 2015 whereby a penalty of U.S.$70 million (€63 million) was imposed. The penalty, which was recorded within Other income/(expenses) and excluded from Adjusted EBIT for the year ended December 31, 2015, was paid on January 6, 2016.
For the year ended
December 31, 2015
, a total of €104 million of income related to the favorable settlements of legal matters to which we were the plaintiff has been excluded from Adjusted EBIT.
2014
compared to
2013
The decrease in NAFTA Adjusted EBIT in 2014 compared to 2013 was primarily attributable to (i) increased industrial costs of €1,549 million, (ii) a €29 million increase in Selling, general and administrative costs largely attributable to higher advertising costs to support new vehicle launches, including the all-new 2014 Jeep Cherokee and the all-new 2015 Chrysler 200, which was partially offset by (iii) the favorable volume/mix impact of €1,129 million, driven by the increase in shipments described above, and (iv) favorable net pricing of €411 million primarily due to pricing for enhanced content, partially offset by incentive spending on certain vehicles in the portfolio.
73
The increase in industrial costs was attributable to an increase in warranty costs of approximately €800 million which included the effects of certain recall campaigns, an increase in base material costs of €978 million mainly related to higher base material costs associated with vehicles and components and content enhancements on new models as well as €262 million in higher research and development costs and depreciation and amortization.
For the year ended December 31, 2014, Adjusted EBIT excluded the €495 million charge recorded in connection with the execution of the MOU with the UAW entered into by FCA US in January 2014.
LATAM
|
For the Years Ended December 31,
|
Increase/(decrease)
|
||||||||||||||||||||||||
|
(€ million, except
percentages and shipments which are in thousands of units) |
2015
|
2014
|
2013
|
2015 vs. 2014
|
CER
|
2014 vs. 2013
|
CER
|
||||||||||||||||||
|
Shipments
|
553
|
|
827
|
|
950
|
|
(274
|
)
|
(33.1
|
)%
|
—
|
|
(123
|
)
|
(12.9
|
)%
|
—
|
|
|||||||
|
Net revenues
|
6,431
|
|
8,629
|
|
9,973
|
|
(2,198
|
)
|
(25.5
|
)%
|
(17.8
|
)%
|
(1,344
|
)
|
(13.5
|
)%
|
(6.9
|
)%
|
|||||||
|
Adjusted EBIT
|
(87
|
)
|
289
|
|
619
|
|
(376
|
)
|
n.m.
(1)
|
|
n.m.
(1)
|
|
(330
|
)
|
(53.3
|
)%
|
(45.1
|
)%
|
|||||||
|
Adjusted EBIT margin
|
(1.4
|
)%
|
3.3
|
%
|
6.2
|
%
|
|
||||||||||||||||||
(1) Number is not meaningful.
Net revenues
2015
compared to
2014
The
decrease
in LATAM Net revenues in 2015 compared to 2014 was primarily attributable to (i) a decrease of €2.3 billion driven by lower shipments and (ii) unfavorable foreign currency translation of €0.7 billion, which was partially offset by (iii) a favorable product mix impact of €0.5 billion driven by the all-new 2015 Jeep Renegade and (iv) positive pricing actions of €0.3 billion.
The
33.1
percent
decrease
in vehicle shipments in 2015 compared to 2014 reflected the continued macroeconomic weakness in the region resulting in poor trading conditions in Brazil and Argentina. In addition, the decrease in shipments also was due to continued import restrictions in Argentina.
2014
compared to
2013
The
decrease
in LATAM Net revenues in 2014 compared to 2013 was primarily attributable to (i) a decrease of €1.2 billion driven by lower shipments and (ii) unfavorable foreign currency translation of €0.7 billion, which was partially offset by (iii) favorable net pricing and vehicle mix of €0.6 billion.
The
12.9
percent decrease in vehicle shipments in 2014 compared to 2013 reflected the weaker demand in the region’s main markets, where Brazil continued the negative market trend started in 2012, Argentina was impacted by import restrictions and additional tax on more expensive vehicles and Venezuela suffered from weaker trading conditions. The weakening of the Brazilian Real against the Euro impacted Net revenues by €0.6 billion, whereby the average exchange rate used to translate Brazilian Real balances for the year ended December 31, 2014 was 8.9 percent lower than the average exchange rate used for the same period in 2013.
Adjusted EBIT
2015
compared to
2014
The
decrease
in LATAM Adjusted EBIT in 2015 compared to 2014 was primarily attributable to (i) a negative impact of €344 million resulting from lower shipments in Brazil and Argentina, which was partially offset by favorable product mix driven by the all-new 2015 Jeep Renegade, (ii) an increase in industrial costs of €216 million primarily relating
74
to start-up costs for the Pernambuco plant and higher input cost inflation and (iii) an increase of €125 million in Selling, general and administrative costs primarily for the commercial launch of the all-new 2015 Jeep Renegade, which was partially offset by (iv) favorable net pricing of €279 million.
Adjusted EBIT for the year ended
December 31, 2015
excluded total charges of
€219 million
, of which €83 million related to the devaluation of the Argentinian Peso resulting from changes in monetary policy and €80 million related to
the adoption of the Marginal Currency System (the “SIMADI”) exchange rate at June 30, 2015
and the write-down of inventory in Venezuela to the lower of cost or net realizable value as described in Note
30
within our Consolidated Financial Statements included elsewhere in this report.
2014
compared to
2013
The decrease in LATAM Adjusted EBIT in 2014 compared to 2013 was primarily attributable to (i) an unfavorable volume/mix impact of €228 million related to a decrease in shipments, partially offset by an improvement in vehicle mix in Brazil, (ii) an increase in industrial costs of €441 million largely attributable to price increases for certain foreign currency denominated purchases, which were impacted by the weakening of the Brazilian Real and (iii) the impact of unfavorable foreign currency translation of €51 million attributable to the weakening of the Brazilian Real against the Euro, which was partially offset by (v) favorable pricing of €381 million driven by pricing actions in Brazil and Argentina.
LATAM Adjusted EBIT for the year ended December 31, 2014 excluded €98 million for the re-measurement charge on the Venezuelan subsidiary’s net monetary assets from VEF into U.S.$ (refer to Note
30
within our Consolidated Financial Statements included elsewhere in this report).
APAC
|
For the Years Ended December 31,
|
Increase/(decrease)
|
||||||||||||||||||||||||
|
(€ million, except
percentages and shipments which are in thousands of units) |
2015
|
2014
|
2013
|
2015 vs. 2014
|
CER
|
2014 vs. 2013
|
CER
|
||||||||||||||||||
|
Shipments
|
149
|
|
220
|
|
163
|
|
(71
|
)
|
(32.3
|
)%
|
—
|
|
57
|
|
35.0
|
%
|
—
|
|
|||||||
|
Net revenues
|
4,885
|
|
6,259
|
|
4,668
|
|
(1,374
|
)
|
(22.0
|
)%
|
(30.8
|
)%
|
1,591
|
|
34.1
|
%
|
34.6
|
%
|
|||||||
|
Adjusted EBIT
|
52
|
|
541
|
|
338
|
|
(489
|
)
|
(90.4
|
)%
|
(94.8
|
)%
|
203
|
|
60.1
|
%
|
60.1
|
%
|
|||||||
|
Adjusted EBIT margin
|
1.1
|
%
|
8.6
|
%
|
7.2
|
%
|
|
||||||||||||||||||
Net revenues
2015
compared to
2014
The
decrease
in APAC Net revenues in 2015 compared to 2014 was primarily a result of lower shipments as well as negative net pricing.
The
32.3
percent
decrease
in shipments in 2015 compared to 2014 was due to the interruption in supply from the Tianjin (China) port explosions as described below, strong competition from local producers and the transition to local production in China. In addition, pricing actions to offset the weakness of the Australian Dollar had a negative impact on volumes in Australia, while the unfavorable net pricing impact was primarily due to increased incentives in China and foreign exchange effects.
75
On August 12, 2015, a series of explosions which occurred at a container storage station at the Port of Tianjin, China, impacted several storage areas containing approximately 25,000 FCA branded vehicles, of which approximately 13,300 are owned by FCA and approximately 11,400 vehicles were previously sold to our distributor. As a result of the explosions, nearly all of the vehicles at the Port of Tianjin were affected and some were destroyed. During the year ended December 31, 2015, €89 million was recorded as a reduction to Net revenues that related to incremental incentives for vehicles affected by the explosions, which was excluded from Adjusted EBIT.
2014
compared to
2013
The
increase
in APAC Net revenues in 2014 compared to 2013 was primarily attributable to an increase in shipments and improved vehicle mix.
The
35.0
percent increase in shipments in 2014 compared to 2013 was largely supported by shipments to China and Australia, driven by the Jeep Grand Cherokee, Dodge Journey and the all-new 2014 Jeep Cherokee.
Adjusted EBIT
2015
compared to
2014
The
decrease
in APAC Adjusted EBIT in 2015 compared to 2014 was primarily attributable to (i) a negative impact of €334 million related to the decrease in volumes as described above, (ii) unfavorable net pricing of €126 million, which was partially offset by (iii) lower Selling, general and administrative costs of €72 million mainly as a result of reduced advertising expense.
APAC Adjusted EBIT for the year ended December 31, 2015 excluded total charges of
€205 million
, of which €142 million related to the write-down of inventory (€53 million) and incremental incentives (€89 million) for vehicles affected by the explosions at the Port of Tianjin.
2014
compared to
2013
The increase in APAC Adjusted EBIT in 2014 compared to 2013 was primarily attributable to (i) a positive volume/mix impact of €494 million as a result of the increase in shipments described above, partially offset by (ii) an increase in Selling, general and administrative costs of €111 million to support the growth of the APAC operations, (iii) an increase in industrial costs of €52 million due to higher research and development costs, increased fixed manufacturing costs for new product initiatives and higher production volumes and (iv) unfavorable pricing of €142 million due to the increasingly competitive trading environment, particularly in China
.
76
EMEA
|
For the Years Ended December 31,
|
Increase/(decrease)
|
||||||||||||||||||||||||
|
(€ million, except
percentages and shipments which are in thousands of units) |
2015
|
2014
|
2013
|
2015 vs. 2014
|
CER
|
2014 vs. 2013
|
CER
|
||||||||||||||||||
|
Shipments
|
1,142
|
|
1,024
|
|
979
|
|
118
|
|
11.5
|
%
|
—
|
|
45
|
|
4.6
|
%
|
—
|
|
|||||||
|
Net revenues
|
20,350
|
|
18,020
|
|
17,335
|
|
2,330
|
|
12.9
|
%
|
10.9
|
%
|
685
|
|
4.0
|
%
|
3.7
|
%
|
|||||||
|
Adjusted EBIT
|
213
|
|
(41
|
)
|
(291
|
)
|
254
|
|
n.m.
(1)
|
|
n.m.
(1)
|
|
250
|
|
n.m.
(1)
|
|
n.m.
(1)
|
|
|||||||
|
Adjusted EBIT margin
|
1.0
|
%
|
(0.2
|
)%
|
(1.7
|
)%
|
|
||||||||||||||||||
(1) Number is not meaningful.
Net revenues
2015
compared to
2014
The
increase
in EMEA Net revenues in
2015 compared to 2014
was primarily attributable to (i) a total positive impact of €1.9 billion related to higher volumes and favorable product mix, (ii) positive net pricing of €0.1 billion, which was mainly driven by pricing actions in non-European Union markets and (iii) favorable foreign exchange effects of €0.4 billion.
The
11.5
percent
increase
in vehicle shipments in
2015 compared to 2014 was largely driven by the Fiat 500 family and the Jeep brand, specifically the all-new Fiat 500X and the all-new 2015 Jeep Renegade.
2014
compared to
2013
The increase in EMEA Net revenues in 2014 compared to 2013 was mainly attributable to the combination of (i) a €0.6 billion increase in vehicle shipments, (ii) a €0.3 billion favorable sales mix impact primarily driven by Jeep brand and LCV shipments, partially offset by (iii) unfavorable pricing of €0.1 billion due to the increasingly competitive trading environment particularly related to passenger cars in Europe and (iv) €0.1 billion lower components sales.
The
4.6
percent increase in vehicle shipments in 2014 compared to 2013 was largely driven by the Fiat 500 family, the Jeep brand (the all-new Renegade and Cherokee) and the new Fiat Ducato.
Adjusted EBIT
2015
compared to
2014
The improvement in EMEA Adjusted EBIT in 2015 compared to an Adjusted EBIT loss in 2014 was primarily attributable to (i) increased volumes and favorable mix impact of €400 million reflecting the continued success of the Fiat 500 family and Jeep brand and (ii) a €101 million impact from positive net pricing, which was partially offset by (iii) a €91 million increase in Selling, general and administration costs primarily relating to marketing spending to support the all-new Fiat 500X and Jeep Renegade and (iv) a €187 million increase in industrial costs, reflecting higher costs for U.S. imported vehicles due to a stronger U.S.$, partially offset by cost efficiencies.
Adjusted EBIT for the year ended December 31, 2015 excluded total charges of €47 million which primarily related to asset impairments.
2014
compared to
2013
The improvement in EMEA Adjusted EBIT loss in 2014 compared to 2013 was primarily attributable to (i) a favorable volume/mix impact of €174 million driven by the increase in shipments described above and improved vehicle mix and (ii) a decrease in net industrial costs of €218 million mainly driven by industrial and purchasing efficiencies, which was partially offset by (iii) unfavorable pricing of €85 million as a result of the competitive trading environment and resulting price pressure and (iv) an increase in Selling, general and administrative costs of €67 million mainly related to advertising expenses primarily to support the growth of Jeep brand and the Jeep Renegade launch.
77
Adjusted EBIT for the year ended December 31, 2014 excluded total net charges of €68 million which primarily related to asset impairments and write-offs.
Maserati
|
For the Years Ended December 31,
|
Increase/(decrease)
|
||||||||||||||||||||||||
|
(€ million, except
percentages and shipments which are in thousands of units) |
2015
|
2014
|
2013
|
2015 vs. 2014
|
CER
|
2014 vs. 2013
|
CER
|
||||||||||||||||||
|
Shipments
|
32
|
|
36
|
|
15
|
|
(4
|
)
|
(10.9
|
)%
|
—
|
|
21
|
|
140.0
|
%
|
—
|
|
|||||||
|
Net revenues
|
2,411
|
|
2,767
|
|
1,659
|
|
(356
|
)
|
(12.9
|
)%
|
(22.4
|
)%
|
1,108
|
|
66.8
|
%
|
67.3
|
%
|
|||||||
|
Adjusted EBIT
|
105
|
|
275
|
|
171
|
|
(170
|
)
|
(61.8
|
)%
|
(65.5
|
)%
|
104
|
|
60.8
|
%
|
61.4
|
%
|
|||||||
|
Adjusted EBIT margin
|
4.4
|
%
|
9.9
|
%
|
10.3
|
%
|
|
||||||||||||||||||
Net revenues
2015
compared to
2014
The
decrease
in Maserati Net revenues in 2015 compared to 2014 was primarily driven by a decrease in Quattroporte volumes in 2015 that resulted from weaker segment demand in the U.S. and China.
2014
compared to
2013
The
increase
in Maserati Net revenues in 2014 compared to 2013 was primarily driven by an
increase
in vehicle shipments in 2014.
Adjusted EBIT
2015
compared to
2014
The decrease in Maserati Adjusted EBIT in 2015 compared to 2014 was due to lower volumes as described above, unfavorable mix and an increase in industrial costs related to start-up costs for the all-new Levante, which is expected to be launched in 2016.
2014
compared to
2013
The increase in Maserati Adjusted EBIT in 2014 compared to 2013 was primarily driven by the increase in shipments.
78
Components
|
For the Years Ended December 31,
|
Increase/(decrease)
|
||||||||||||||||||||||||
|
(€ million, except percentages)
|
2015
|
2014
|
2013
|
2015 vs. 2014
|
CER
|
2014 vs. 2013
|
CER
|
||||||||||||||||||
|
Magneti Marelli
|
|||||||||||||||||||||||||
|
Net revenues
|
7,262
|
|
6,500
|
|
5,988
|
|
762
|
|
11.7
|
%
|
10.8
|
%
|
512
|
|
8.6
|
%
|
10.9
|
%
|
|||||||
|
Adjusted EBIT
|
321
|
|
229
|
|
169
|
|
92
|
|
40.2
|
%
|
30.1
|
%
|
60
|
|
35.5
|
%
|
36.7
|
%
|
|||||||
|
Adjusted EBIT margin
|
4.4
|
%
|
3.5
|
%
|
2.8
|
%
|
|
||||||||||||||||||
|
Comau
|
|||||||||||||||||||||||||
|
Net revenues
|
1,952
|
|
1,550
|
|
1,463
|
|
402
|
|
25.9
|
%
|
19.1
|
%
|
87
|
|
5.9
|
%
|
10.0
|
%
|
|||||||
|
Adjusted EBIT
|
72
|
|
60
|
|
49
|
|
12
|
|
20.0
|
%
|
18.6
|
%
|
11
|
|
22.4
|
%
|
24.5
|
%
|
|||||||
|
Adjusted EBIT margin
|
3.7
|
%
|
3.9
|
%
|
3.3
|
%
|
|
||||||||||||||||||
|
Teksid
|
|||||||||||||||||||||||||
|
Net revenues
|
631
|
|
639
|
|
688
|
|
(8
|
)
|
(1.3
|
)%
|
(2.5
|
)%
|
(49
|
)
|
(7.1
|
)%
|
(5.2
|
)%
|
|||||||
|
Adjusted EBIT
|
2
|
|
(4
|
)
|
(10
|
)
|
6
|
|
n.m.
(1)
|
|
n.m.
(1)
|
|
6
|
|
n.m.
(1)
|
|
n.m.
(1)
|
|
|||||||
|
Adjusted EBIT margin
|
0.3
|
%
|
(0.6
|
)%
|
(1.5
|
)%
|
|
||||||||||||||||||
|
Intrasegment eliminations
|
|||||||||||||||||||||||||
|
Net revenues
|
(75
|
)
|
(70
|
)
|
(59
|
)
|
|
||||||||||||||||||
|
Components
|
|||||||||||||||||||||||||
|
Net revenues
|
9,770
|
|
8,619
|
|
8,080
|
|
1,151
|
|
13.4
|
%
|
11.3
|
%
|
539
|
|
6.7
|
%
|
9.3
|
%
|
|||||||
|
Adjusted EBIT
|
395
|
|
285
|
|
208
|
|
110
|
|
38.6
|
%
|
28.0
|
%
|
77
|
|
37.0
|
%
|
37.5
|
%
|
|||||||
|
Adjusted EBIT margin
|
4.0
|
%
|
3.3
|
%
|
2.6
|
%
|
|
||||||||||||||||||
____________________
(1) Number is not meaningful.
Net revenues
2015
compared to
2014
Magneti Marelli
The
increase
in Magneti Marelli Net revenues in 2015 compared to 2014 primarily reflected positive performance in the lighting and electronic systems businesses.
Comau
The
increase
in Comau Net revenues in 2015 compared to 2014 was mainly attributable to the body assembly, powertrain and robotics businesses.
Teksid
The
decrease
in Teksid Net revenues in 2015 compared to 2014 was primarily attributable to a 10 percent decrease in cast iron business volumes, which was partially offset by a 21 percent increase in aluminum business volumes
.
79
2014
compared to
2013
Magneti Marelli
The increase in Magneti Marelli Net revenues in 2014 compared to 2013 reflected positive performance in North America, China and Europe, partially offset by the performance in Brazil, which was impacted by the weakening of the Brazilian Real against the Euro.
Comau
The increase in Comau Net revenues in 2014 compared to 2013 was mainly attributable to the body welding business.
Teksid
The decrease in Teksid Net revenues in 2014 compared to 2013 was primarily attributable to a 4 percent decrease in cast iron business volumes, which were partially offset by a 24 percent increase in aluminum business volumes
.
Adjusted EBIT
2015
compared to
2014
Magneti Marelli
The
increase
in Magneti Marelli Adjusted EBIT in 2015 compared to 2014 primarily related to higher volumes, cost containment actions and efficiencies.
Comau
The
increase
in Comau Adjusted EBIT in 2015 compared to 2014 was primarily due to increased volumes.
Teksid
The
increase
in Teksid Adjusted EBIT in 2015 compared to 2014 was primarily attributable to favorable foreign exchange rate effects and industrial efficiencies.
2014
compared to
2013
Magneti Marelli
The increase in Magneti Marelli Adjusted EBIT in 2014 compared to 2013 mainly reflected higher volumes as well as the benefit of cost containment actions and efficiencies.
Comau
The increase in Adjusted EBIT in 2014 compared to 2013 was primarily due to increased volumes in the body welding operations and an improved mix.
Teksid
The increase in Teksid Adjusted EBIT in 2014 compared to 2013 was primarily driven by the increase in aluminum business volumes and improved net pricing.
80
Recent Developments
On February 17, 2016, the President of Venezuela announced changes to the foreign exchange systems. The official exchange rate, as regulated by the Central Bank of Venezuela and where all purchases and sales of food and medicine imports will continue to be made, was devalued from 6.3 VEF per U.S.$ to 10.0 VEF per U.S.$. Additionally, the single exchange exchange
rate (“SICAD”) was terminated and the government indicated the SIMADI exchange rate will become a floating rate. In addition, the price of gasoline was increased significantly, the minimum wage will be increased, and changes to the pricing laws are expected. While these changes have been announced, they have not yet been fully implemented. As such, the effect of these changes on our operations in Venezuela cannot yet be determined. We will continue to monitor the currency exchange regulations and other factors to assess whether our ability to control and benefit from our Venezuelan operations has been adversely affected.
B. Liquidity and Capital Resources
Liquidity Overview
We require significant liquidity in order to meet our obligations and fund our business. Short-term liquidity is required to purchase raw materials, parts and components for vehicle production, as well as to fund selling, administrative, research and development, and other expenses. In addition to our general working capital and operational needs, we expect to use significant amounts of cash for the following purposes: (i) capital expenditures to support our existing and future products, (ii) principal and interest payments under our financial obligations and (iii) pension and employee benefit payments. We make capital investments in the regions in which we operate primarily related to initiatives to introduce new products, enhance manufacturing efficiency, improve capacity and for maintenance and environmental compliance. Our capital expenditures in 2016 are expected to be in line with 2015 capital expenditures and within the range of €8.5 to €9 billion, which we plan to fund primarily with cash generated from our operating activities, as well as with credit lines provided to certain of our Group entities.
Our business and results of operations depend on our ability to achieve certain minimum vehicle sales volumes. As is typical for an automotive manufacturer, we have significant fixed costs and therefore, changes in our vehicle sales volume can have a significant effect on profitability and liquidity. We generally receive payment for sales of vehicles to dealers and distributors, shortly after shipment, whereas there is a lag between the time we receive parts and materials from our suppliers and the time we are required to pay for them. Therefore, during periods of increasing vehicle sales, there is generally a corresponding positive impact on our cash flow and liquidity. Conversely, during periods in which vehicle sales decline, there is generally a corresponding negative impact on our cash flow and liquidity. Delays in shipments of vehicles, including delays in shipments in order to address quality issues, tend to negatively affect our cash flow and liquidity. In addition, the timing of our collections of receivables for export sales of vehicles, fleet sales and part sales tend to be longer due to different payment terms. Although we regularly enter into factoring transactions for such receivables in certain countries in order to anticipate collections and transfer relevant risks to the factor, a change in volumes of such sales may cause fluctuations in our working capital. The increased internationalization of our product portfolio may also affect our working capital requirements as there may be an increased requirement to ship vehicles to countries different from where they are produced. Finally, working capital can be affected by the trend and seasonality of sales under vehicle buy-back programs.
Management believes that the funds currently available, in addition to those funds that will be generated from operating and financing activities, will enable the Group to meet its obligations and fund its businesses including funding planned investments, working capital needs as well as fulfill its obligations to repay its debts in the ordinary course of business.
Liquidity needs are met primarily through cash generated from operations, including the sale of vehicles, service and parts to dealers, distributors and other consumers worldwide.
The operating cash management and liquidity investment of the Group are centrally coordinated with the objective of ensuring effective and efficient management of the Group’s funds. The companies raise capital in the financial markets through various funding sources.
81
FCA US continues to manage its liquidity independently from the rest of the Group. Intercompany financing from FCA US to other Group entities is not restricted other than through the application of covenants requiring that transactions with related parties be conducted at arm’s length terms or be approved by a majority of the “disinterested” members of the Board of Directors of FCA US. In addition, certain of FCA US’s financing agreements place restrictions on the distributions which it is permitted to make. In particular, dividend distributions, other than certain exceptions including certain permitted distributions and distributions with respect to taxes, are generally limited to an amount not to exceed 50 percent of cumulative consolidated net income (as defined in the financing agreements) from January 2012 less distributions paid to date (refer to the section
—Capital Market - Senior Credit Facilities - FCA US
below).
FCA has not provided any guarantee, commitment or similar obligation in relation to any of FCA US’s financial indebtedness, nor has it assumed any kind of obligation or commitment to fund FCA US. However, with the replacement of the prior FCA revolving credit facilities with the new FCA revolving credit facilities entered into in June 2015, FCA no longer has limitations in providing funding to FCA US. Certain notes issued by FCA and its subsidiaries (other than FCA US and its subsidiaries) include covenants which may be affected by circumstances related to FCA US, in particular there are cross-default clauses which may accelerate repayments in the event that FCA US fails to pay certain of its debt obligations.
Long-term liquidity requirements may involve some level of debt refinancing as outstanding debt becomes due or we are required to make principal payments. Although we believe that our current level of total available liquidity is sufficient to meet our short-term and long-term liquidity requirements, we regularly evaluate opportunities to improve our liquidity position in order to enhance financial flexibility and to achieve and maintain a liquidity and capital position consistent with that of other companies in our industry.
However, any actual or perceived limitations of our liquidity may limit the ability or willingness of counterparties, including dealers, consumers, suppliers, lenders and financial service providers, to do business with us, or require us to restrict additional amounts of cash to provide collateral security for our obligations. Our liquidity levels are subject to a number of risks and uncertainties, including those described in
Item 3D. Risk Factors
.
82
Total Available Liquidity
The following table summarizes our total available liquidity:
|
As of December 31,
|
|||||||||
|
(€ million)
|
2015
(1)
|
2014
|
2013
|
||||||
|
Cash, cash equivalent and current securities
(2)
|
21,144
|
|
23,050
|
|
19,702
|
|
|||
|
Undrawn committed credit lines
(3)
|
3,413
|
|
3,171
|
|
3,043
|
|
|||
|
Total available liquidity
(4)
|
24,557
|
|
26,221
|
|
22,745
|
|
|||
_____________________________
|
(1)
|
The assets of the Ferrari segment have been classified as Assets held for distribution within the Consolidated Statement of Financial Position at December 31, 2015. These assets as well as the undrawn revolving credit facility of €500 million of Ferrari are not included in the figures presented.
|
|
(2)
|
Current securities comprise of short term or marketable securities which represent temporary investments but do not satisfy all the requirements to be classified as cash equivalents as they may not be able to be readily converted into cash, or they are subject to significant risk of change in value (even if they are short-term in nature or marketable).
|
|
(3)
|
Excludes the undrawn €0.3 billion medium/long-term dedicated credit lines available to fund scheduled investments at
December 31, 2015
(€0.9 billion was undrawn at
December 31, 2014
and €1.8 billion was undrawn at December 31, 2013) and the undisbursed €0.4 billion on the Mexico Bank Loan (as defined below) at
December 31, 2015
, which can be drawn subject to meeting the preconditions for additional disbursements.
|
|
(4)
|
The majority of our liquidity is available to our treasury operations in Europe, U.S. (subject to the restrictions on FCA US distributions as described above), and Brazil; however, liquidity is also available to certain subsidiaries which operate in other areas. Cash held in such countries may be subject to restrictions on transfer depending on the foreign jurisdictions in which these subsidiaries operate. Based on our review of such transfer restrictions in the countries in which we operate and maintain material cash balances, we do not believe such transfer restrictions have an adverse impact on the Group's ability to meet its liquidity requirements at the dates presented above.
|
Our liquidity is principally denominated in U.S.Dollar and in Euro. Out of the total €
21.1 billion
of cash, cash equivalents and current securities available at
December 31, 2015
(€23.0 billion at
December 31, 2014
, €19.7 billion at
December 31, 2013
), €12.6 billion, or 59.7 percent were denominated in U.S.$ (€10.6 billion, or 46.0 percent, at
December 31, 2014
, €8.3 billion, or 42.1 percent, at December 31, 2013) and €3.4 billion, or 16.1 percent, were denominated in Euro (€6.2 billion, or 27.0 percent, at
December 31, 2014
, €6.1 billion, or 31.0 percent, at December 31, 2013). Liquidity available in Brazil and denominated in Brazilian Real accounted for €1.2 billion or 5.6 percent at
December 31, 2015
(€1.6 billion or 7.0 percent, at
December 31, 2014
, €1.5 billion, or 7.6 percent, at December 31, 2013), with the remainder being distributed in various countries and denominated in the relevant local currencies.
In June 2015, FCA entered into a new €5.0 billion syndicated revolving credit facility (“RCF”) for general corporate purposes and the working capital needs of the Group. The RCF replaced and expanded the €2.1 billion three-year revolving credit facility entered into by FCA on June 21, 2013 and replaced the U.S.$1.3 billion five-year revolving credit facility of FCA US (“FCA US RCF”) that was scheduled to expire on May 24, 2016. On November 25, 2015, FCA US terminated its undrawn FCA US RCF. The RCF is available in two tranches and as of December 31, 2015, the first tranche of €2.5 billion was available and was undrawn. The first tranche matures in July 2018 and has two extension options (1-year and 11-months, respectively) which are exercisable on the first and second anniversary of signing. The second tranche, which consists of an additional €2.5 billion, matures in June 2020 and will be available upon the elimination of the restrictions under certain of FCA US's financing documentation on the provision of guarantees and payment of dividends by FCA US for the benefit of the rest of the Group (refer to the section
—Capital Market - Senior Credit Facilities - FCA US
below). The covenants of the RCF include financial covenants (Net Debt/Adjusted Earnings Before Interest, Depreciation and Amortization (“Adjusted EBITDA”) and Adjusted EBITDA/Net Interest ratios related to industrial activities) and negative pledge,
pari passu
, cross default and change of control clauses. The failure to comply with these covenants, and in certain cases if not suitably remedied, can lead to the requirement of early repayment of any outstanding amounts. At December 31, 2015, FCA was in compliance with the covenants of the RCF.
At December 31, 2015, undrawn committed credit lines totaling €3.4 billion included the first tranche of €2.5 billion tranche of the new €5.0 billion RCF and approximately €0.9 billion of other revolving credit facilities. At December 31, 2014 and December 31, 2013, undrawn committed credit lines included the €2.1 billion syndicated revolving credit facility entered into by FCA in 2013 and the U.S.$1.3 billion FCA US RCF.
At December 31, 2015, other committed facilities not reflected within total available liquidity include the undisbursed €0.4 billion Mexico Bank Loan (defined in
Capital Market - Bank Debt - Other
below), which is for working capital and general corporate purposes, and the €0.3 billion of undrawn committed credit lines available to the operating entities of the Group for the funding of scheduled investments.
83
The €1.7 billion
decrease
in total available liquidity from
December 31, 2014
to
December 31, 2015
primarily reflects the reduction in total indebtedness, which was partially offset by cash generated by operations, net of investing activities, net proceeds from the Ferrari IPO, favorable translation effects of €0.7 billion and an increase in available undrawn committed credit lines for €0.2 billion. Refer to the section
—Cash Flows
below for additional information.
Cash Flows
Year Ended
December 31, 2015
compared to
Years Ended
December 31, 2014
and
2013
The following table summarizes the cash flows from operating, investing and financing activities for each of the
years ended December 31, 2015
,
2014
and
2013
. For a complete discussion of our cash flows, see our Consolidated Statement of Cash Flows within our Consolidated Financial Statements included elsewhere in this report.
|
For the Years Ended December 31,
|
||||||||
|
(€ million)
|
2015
(1)
|
2014
(1)
|
2013
(1)
|
|||||
|
Cash and cash equivalents at beginning of the period
|
22,840
|
|
19,455
|
|
17,666
|
|
||
|
Cash flows from operating activities during the year from continuing operations
|
9,224
|
|
7,346
|
|
7,084
|
|
||
|
Cash flows from operating activities - discontinued operations
|
527
|
|
823
|
|
534
|
|
||
|
Cash flows used in investing activities from continuing operations
|
(8,874
|
)
|
(7,608
|
)
|
(7,753
|
)
|
||
|
Cash flows used in investing activities - discontinued operations
|
(426
|
)
|
(532
|
)
|
(301
|
)
|
||
|
Cash flows used in financing activities from continuing operations
|
(5,195
|
)
|
2,101
|
|
3,123
|
|
||
|
Cash flows from financing activities - discontinued operations
|
2,067
|
|
36
|
|
13
|
|
||
|
Translation exchange differences
|
681
|
|
1,219
|
|
(911
|
)
|
||
|
Total change in cash and cash equivalents
|
(1,996
|
)
|
3,385
|
|
1,789
|
|
||
|
Cash and cash equivalents at end of the period - included within Assets held for distribution
|
182
|
|
—
|
|
—
|
|
||
|
Cash and cash equivalents at end of the period
|
20,662
|
|
22,840
|
|
19,455
|
|
||
(1) The cash flows of FCA for the years ended December 31, 2015, 2014, and 2013 have been re-presented following the classification of Ferrari as a discontinued operation for the year ended December 31, 2015; Ferrari operating results were excluded from the Group's continuing operations and are presented as a single line item within the Consolidated Income Statements for each of the years presented. The assets and liabilities of Ferrari have been classified as Assets held for distribution and Liabilities held for distribution within the Consolidated Statement of Financial Position at December 31, 2015, while the assets and liabilities of Ferrari have not been classified as such within the comparative Consolidated Statement of Financial Position for any of the periods presented.
Operating Activities — Year Ended
December 31, 2015
For the year ended
December 31, 2015
, our net cash from operating activities of €
9,751 million
was primarily the result of:
|
(i)
|
net profit from continuing operations of
€93 million
adjusted to add back €
5,414 million
for depreciation and amortization expense and other non-cash items of €
812 million
, which included (a) total €713 million non-cash charges for asset impairments which mainly related to asset impairments in connection with the realignment of the Group's manufacturing capacity in NAFTA to better meet market demand and (b) €80 million charge recognized as a result of the adoption of the SIMADI exchange rate to remeasure our Venezuelan subsidiary’s net monetary assets in U.S.$ (reported, for the effect on cash and cash equivalents, within “Translation exchange differences”);
|
|
(ii)
|
a net increase of €
3,206 million
in provisions mainly related to an increase in the warranty provision, which includes the change in estimate for future recall campaign costs in NAFTA, and higher accrued sales incentives primarily related to increased sales volumes in NAFTA;
|
|
(iii)
|
€
112 million
dividends received from jointly-controlled entities; and
|
|
(iv)
|
€
527 million
of cash flows from discontinued operations.
|
84
These positive cash flows were partially offset by:
|
(v)
|
negative impact of change in working capital of €
158 million
primarily driven by (a) €958 million increase in inventories, which reflects the increased consumer demand for our vehicles and inventory buildup in NAFTA due to production changeovers (b) €191 million increase in trade receivables and (c) €580 million increase in net other current assets and liabilities reflecting the net payment of taxes and deferred expenses, which were partially offset by (d) €1,571 million increase in trade payables, mainly related to increased production levels in EMEA.
|
Operating Activities — Year Ended
December 31, 2014
For the year ended
December 31, 2014
, our net cash from operating activities of €
8,169 million
was primarily the result of:
|
(i)
|
net profit from continuing operations of €
359 million
adjusted to add back (a) €
4,607 million
for depreciation and amortization expense and (b) other non-cash items of €
348 million
, which primarily included (i) €381 million related to the non-cash portion of the expense recognized in connection with the execution of the MOU Agreement entered into by the UAW and FCA US in January 2014 (ii) €98 million re-measurement charge recognized as a result of the Group’s change in the exchange rate used to re-measure its Venezuelan subsidiary’s net monetary assets in U.S.$ (reported, for the effect on cash and cash equivalents, in the “Translation exchange differences”) which were partially offset by (iii) the non-taxable gain of €223 million on the re-measurement at fair value of the previously exercised options on approximately 10 percent of FCA US’s membership interests in connection with the acquisition of the remaining 41.5 percent interest in FCA US previously not owned;
|
|
(ii)
|
a net increase of
€1,169 million
in provisions, mainly related to a €959 million increase in Other provisions following net adjustments to warranties for NAFTA and higher accrued sales incentives, primarily due to an increase in retail incentives as well as an increase in dealer stock levels to support increased sales volumes in NAFTA, and a €210 million increase in employees benefits mainly related to U.S. and Canada pension plan as the impact of lower discount rates was not fully offset by the higher return on assets;
|
|
(iii)
|
positive impact of change in working capital of €
779 million
primarily driven by (a) €
1,470 million
increase in trade payables, mainly related to increased production in EMEA and NAFTA as a result of increased consumer demand for our vehicles, (b) €
106 million
decrease in trade receivables and (c) €
24 million
increase in net other current assets and liabilities, which were partially offset by (d) €
821 million
increase in inventory (net of vehicles sold under buy-back commitments), mainly related to increased finished vehicle and work in process levels at December 31, 2014 compared to December 31, 2013, in part driven by higher production levels in late 2014 to meet anticipated consumer demand in NAFTA, EMEA and Maserati; and
|
|
(iv)
|
€
87 million
dividends received from jointly-controlled entities; and
|
|
(v)
|
€
823 million
of cash flows from discontinued operations.
|
Operating Activities — Year Ended December 31, 2013
For the year ended December 31, 2013, our net cash from operating activities of €
7,618 million
was primarily the result of:
|
(i)
|
net profit from continuing operations of €
1,708 million
adjusted to add back (a) €
4,364 million
for depreciation and amortization expense and (b) other non-cash items of €
531 million
, which primarily included €336 million of impairment losses and asset write-offs on tangible and intangible assets, €59 million loss related to the devaluation of the official exchange rate of the VEF per U.S.$, €56 million write-off of the book value of the equity recapture rights resulting from the acquisition of the remaining 41.5 interest in FCA US that was previously not owned, €105 million of write-down in financial assets from the lending portfolio of our financial services activities, partially offset by €74 million of the share of profit or loss of equity method investees;
|
85
|
(ii)
|
positive impact of change in working capital of €
1,378 million
primarily driven by (a) €
1,322 million
increase in trade payables, mainly related to increased production in NAFTA as a result of increased consumer demand for our vehicles, and increased production in Maserati, (b) €
746 million
in net other current assets and liabilities mainly related to increases in accrued expenses and deferred income as well as indirect taxes payables, (c) €
232 million
decrease in trade receivables principally due to the contraction of sales volumes in EMEA and LATAM which were partially offset by (d) €
922 million
increase in inventory (net of vehicles sold under buy-back commitments), mainly related to increased finished vehicle and work in process levels at December 31, 2013 compared to December 31, 2012, in part driven by higher production levels in late 2013 to meet anticipated consumer demand in the NAFTA, APAC and Maserati segments;
|
|
(iii)
|
a net increase of
€464 million
in provisions, mainly related to accrued sales incentives due to increased dealer stock levels at December 31, 2013 compared to December 31, 2012 to support increased sales volumes; which were partially offset by a net reduction in the post-retirement benefit reserve; and
|
|
(iv)
|
€
92 million
dividends received from jointly-controlled entities; and
|
|
(v)
|
€
534 million
of cash flows from discontinued operations.
|
These positive contributions were partially offset by:
|
(vi)
|
€1,569 million non-cash impact of deferred taxes mainly arising from the recognition of previously unrecognized deferred tax assets relating to FCA US.
|
Investing Activities — Year Ended
December 31, 2015
For the year ended
December 31, 2015
,
net cash used in investing activities of €
9,300 million
was primarily the result of:
|
(i)
|
€
8,819 million
of capital expenditures, including €
2,504 million
of capitalized development costs that supported investments in existing and future products. Capital expenditures primarily related to the mass-market vehicle operations in NAFTA and EMEA, investment in Alfa Romeo and the completion of the Pernambuco plant;
|
|
(ii)
|
a total of €
266 million
for investments in joint ventures, associates and unconsolidated subsidiaries, of which €171 million was for the GAC Fiat Chrysler Automobiles Co. Ltd. joint venture; and
|
|
(iii)
|
€
426 million
of cash flows used by discontinued operations.
|
These cash outflows were partially offset by:
|
(iv)
|
€
410 million
of a net decrease in receivables from financing activities which primarily related to the decreased lending portfolio of the financial services activities of the Group in Brazil and China.
|
Investing Activities — Year Ended December 31, 2014
For the year ended December 31, 2014
,
net cash used in investing activities of €
8,140 million
was primarily the result of:
|
(i)
|
€
7,804 million
of capital expenditures, including €
2,132 million
of capitalized development costs, to support investments in existing and future products. Capital expenditures primarily related to the mass-market vehicle operations in NAFTA and EMEA and the ongoing construction of the plant at Pernambuco, Brazil;
|
|
(ii)
|
€
78 million
of a net decrease in receivables from financing activities which primarily related to the decreased lending portfolio of the financial services activities of the Group; and
|
86
|
(iii)
|
€
532 million
of cash flows used by discontinued operations.
|
Investing Activities — Year Ended December 31, 2013
For the year ended December 31, 2013, our net cash used in investing activities of €
8,054 million
was primarily the result of:
|
(i)
|
€
7,219 million
of capital expenditures, including €
1,950 million
of capitalized development costs, to support our investments in existing and future products. The capitalized development costs primarily included materials costs and personnel related expenses relating to engineering, design and development focused on content enhancement of existing vehicles, new models and powertrain programs in NAFTA and EMEA. The remaining capital expenditures primarily related to the mass-market vehicle operations in NAFTA and EMEA and the ongoing construction of the plant at Pernambuco, Brazil;
|
|
(ii)
|
€
166 million
related to equity investments, which principally included €94 million of additional investment in RCS MediaGroup S.p.A. and €37 million of capital injection into the 50 percent joint venture related to GAC Fiat Chrysler Automobiles Co. Ltd.;
|
|
(iii)
|
€
409 million
of net increase in receivables from financing activities, primarily due to the increased lending portfolio of the financial services activities of the Group; and
|
|
(iv)
|
€
301 million
of cash flows used by discontinued operations.
|
These cash outflows were partially offset by:
|
(v)
|
€
55 million
proceeds from the sale of tangible and intangible assets.
|
Financing Activities —Year Ended
December 31, 2015
For the year ended
December 31, 2015
,
net cash used in financing activities was €
3,128 million
and was primarily the result of:
|
(i)
|
the prepayment of FCA US's secured senior notes due June 15, 2019 for an aggregate principal amount of €2,518 million and the prepayment of FCA US's secured senior notes due June 15, 2021 for an aggregate principal amount of
€2,833
million;
|
|
(ii)
|
the repayment at maturity of two notes that had been issued under the Global Medium Term Note Programme (“GMTN Programme”), one for a principal amount of €1,500 million and another for a principal amount of CHF 425 million (€390 million); and
|
|
(iii)
|
the payment of medium-term borrowings for a total of €
4,412 million
, which included the repayment of the EIB loan of €250 million at maturity, the prepayment of our Mexican development banks credit facilities of €414 million as part of FCA Mexico's refinancing transaction completed in March 2015, total payments of €244 million on the Canadian HCT Notes, and other repayments of borrowings, primarily in Brazil and FCA treasury companies.
|
These items were partially offset by:
|
(iv)
|
proceeds from FCA's issuance of U.S.$3,000 million (€2,840 million) total principal amount of unsecured senior notes due in 2020 and 2023 (refer to the section
—Capital Market
below);
|
|
(v)
|
proceeds from new medium-term borrowings for a total of €
3,061 million
which included the initial disbursement received of €0.4 billion under the Mexico Bank Loan of
€0.8
billion (U.S.$0.9 billion) as part of FCA Mexico's refinancing transaction completed in March 2015, proceeds from the €600 million loan granted by EIB and SACE (refer to the section
—Capital Market
below) and other financing transactions, primarily in Brazil;
|
87
|
(vi)
|
net proceeds from the Ferrari IPO as discussed in more detail in the section
—History and Development of the Company - Ferrari Spin-off
above; and
|
|
(vii)
|
net proceeds of €2.0 billion from the draw-down of the syndicated loan facilities entered into by Ferrari N.V. in November 2015, included within
Cash flows from financing activities - discontinued operations
.
|
Financing Activities —Year Ended December 31, 2014
For the year ended December 31, 2014, net cash from financing activities of €
2,137 million
was primarily the result of:
|
(i)
|
net proceeds of €2,245 million from the issuance of mandatory convertible securities due 2016 and net proceeds of €849 million from the offering of 100 million common shares;
|
|
(ii)
|
proceeds from issuances of notes for a total amount of €
4,629 million
which included (a) approximately €2,556 million of notes issued under the GMTN Programme and (b) €2,073 million (for a total face value of U.S.$2,755 million) of secured senior notes issued by FCA US used to prepay the balance of FCA US's financial liability to the VEBA Trust (the “VEBA Trust Note”) that had been issued by FCA US in connection with the settlement of its obligations related to postretirement healthcare benefits for certain UAW retirees;
|
|
(iii)
|
proceeds from new medium-term borrowings for a total of €
4,873 million
, which included (a) the incremental term loan entered into by FCA US of U.S.$250 million (€181 million) under its original tranche B term loan facility and (b) the new U.S.$1,750 million (€1.3 billion) tranche B term loan, issued under a new term loan credit facility entered into by FCA US to facilitate the prepayment of the VEBA Trust Note, and new medium term borrowings in Brazil; and
|
|
(iv)
|
a positive net contribution of €
496 million
from the net change in other financial payables and other financial assets and liabilities.
|
These positive items, were partially offset by:
|
(v)
|
the cash payment to the VEBA Trust for the acquisition of the remaining 41.5 percent ownership interest in FCA US held by the VEBA Trust equal to U.S.$3,650 million (€2,691 million) and U.S.$60 million (€45 million) of tax distribution by FCA US to cover the VEBA Trust’s tax obligation;
|
|
(vi)
|
payment of medium-term borrowings for a total of €
5,834 million
, mainly related to the prepayment of all amounts under the VEBA Trust Note amounting to approximately U.S.$5.0 billion (€3.6 billion), including accrued and unpaid interest, and repayment of medium term borrowings primarily in Brazil;
|
|
(vii)
|
the repayment at maturity of notes that had been issued under the GMTN Programme for a total principal amount of €
2,150 million
; and
|
|
(viii)
|
the net cash disbursement of €
417 million
for the exercise of cash exit rights in connection with the Merger.
|
Financing Activities —Year Ended December 31, 2013
For the year ended December 31, 2013, net cash from financing activities of €
3,136 million
was primarily the result of:
|
(i)
|
proceeds from the issuance of notes under the GMTN Programme for a total amount of €
2,866 million
;
|
|
(ii)
|
proceeds from new medium-term borrowings for a total of €
3,188 million
, which mainly included (a) new borrowings by the Brazilian companies for €1,686 million, primarily in relation to investments in the country (b) €400 million loan granted by the EIB in order to fund our investments and research and development costs in Europe and (c) €595 million (U.S.$790 million) related to the amendments and re-pricings in 2013 of the U.S.$3.0 billion tranche B term loan which matures May 24, 2017 and the revolving credit facility that
|
88
matures in May 2016. In particular, pursuant to such amendments and re-pricings in 2013, an amount of U.S.$790 million of the outstanding principal balance of the U.S.$3.0 billion tranche B term loan which matures May 24, 2017 was repaid. However, new and continuing lenders acquired the portion of such loan, therefore the principal balance outstanding did not change; and
|
(iii)
|
a positive net contribution of €
662 million
from the net change in other financial payables and other financial assets and liabilities.
|
These positive items, were partially offset by:
|
(iv)
|
the repayment at maturity of notes that had been issued under the GMTN Programme for a total principal amount of €
1 billion
; and
|
|
(v)
|
repayment of medium-term borrowings for a total of €
2,556 million
, including the €595 million (U.S.$790 million) relating to the amendments and re-pricings of the senior credit facilities of FCA US.
|
The positive translation exchange differences for the years ended December 31, 2015 and 2014 of €
681 million
and €
1,219 million
, respectively and the negative translation exchange differences for the year ended December 31, 2013 of €
911 million
mainly reflected the change in the Euro-translated value of cash and cash equivalent balances denominated in U.S.$.
Net Debt
The following table details our Net debt at December 31, 2015 and 2014 and provides a reconciliation of this non-GAAP measure to Debt, the most directly comparable measure included in our Consolidated Statement of Financial Position.
Due to different sources of cash flows used for the repayment of the financial debt between industrial activities and financial services (by cash from operations for industrial activities and by collection of financial receivables for financial services) and the different business structure and leverage implications, we provide a separate analysis of Net Debt between industrial activities and financial services.
The division between industrial activities and financial services represents a sub-consolidation based on the core business activities (industrial or financial services) of each Group company. The sub-consolidation for industrial activities also includes companies that perform centralized treasury activities, such as raising funding in the market and financing Group companies, but do not however, provide financing to third parties. Financial services includes companies that provide retail and dealer financing, leasing and rental services in support of the mass-market vehicle brands in certain geographical segments and for the Maserati global luxury brand.
All FCA US activities are included under industrial activities. Since FCA US's cash management activities are managed separately from the rest of the Group, we also provide the analysis of Net Industrial Debt split between FCA excluding FCA US and FCA US.
89
|
December 31, 2015
(1)
|
December 31, 2014
|
||||||||||||||||||||||||||||
|
Industrial
Activities |
Financial
Services |
Consolidated
|
Industrial
Activities |
Financial
Services |
Consolidated
|
||||||||||||||||||||||||
|
(€ million)
|
Total
|
FCA ex
FCA US |
FCA US
|
Total
|
FCA ex
FCA US |
FCA US
|
|||||||||||||||||||||||
|
Third Parties Debt (Principal)
|
(26,555
|
)
|
(20,916
|
)
|
(5,639
|
)
|
(1,105
|
)
|
(27,660
|
)
|
(31,381
|
)
|
(21,011
|
)
|
(10,370
|
)
|
(1,980
|
)
|
(33,361
|
)
|
|||||||||
|
Capital Market
(2)
|
(13,382
|
)
|
(13,382
|
)
|
—
|
|
(264
|
)
|
(13,646
|
)
|
(17,378
|
)
|
(12,473
|
)
|
(4,905
|
)
|
(351
|
)
|
(17,729
|
)
|
|||||||||
|
Bank Debt
|
(11,602
|
)
|
(6,707
|
)
|
(4,895
|
)
|
(653
|
)
|
(12,255
|
)
|
(11,904
|
)
|
(7,484
|
)
|
(4,420
|
)
|
(1,216
|
)
|
(13,120
|
)
|
|||||||||
|
Other Debt
(3)
|
(1,571
|
)
|
(827
|
)
|
(744
|
)
|
(188
|
)
|
(1,759
|
)
|
(2,099
|
)
|
(1,054
|
)
|
(1,045
|
)
|
(413
|
)
|
(2,512
|
)
|
|||||||||
|
Accrued Interest and Other Adjustments
(4)
|
(127
|
)
|
(145
|
)
|
18
|
|
1
|
|
(126
|
)
|
(362
|
)
|
(200
|
)
|
(162
|
)
|
(1
|
)
|
(363
|
)
|
|||||||||
|
Debt with third Parties
|
(26,682
|
)
|
(21,061
|
)
|
(5,621
|
)
|
(1,104
|
)
|
(27,786
|
)
|
(31,743
|
)
|
(21,211
|
)
|
(10,532
|
)
|
(1,981
|
)
|
(33,724
|
)
|
|||||||||
|
Intercompany Financial Receivables/Payables (net)
(5)
|
529
|
|
579
|
|
(50
|
)
|
(568
|
)
|
(39
|
)
|
1,453
|
|
1,515
|
|
(62
|
)
|
(1,453
|
)
|
—
|
|
|||||||||
|
Current financial receivables from jointly-controlled financial services companies
(6)
|
16
|
|
16
|
|
—
|
|
—
|
|
16
|
|
58
|
|
58
|
|
—
|
|
—
|
|
58
|
|
|||||||||
|
Debt, net of intercompany and current financial receivables from jointly-controlled financial services companies
|
(26,137
|
)
|
(20,466
|
)
|
(5,671
|
)
|
(1,672
|
)
|
(27,809
|
)
|
(30,232
|
)
|
(19,638
|
)
|
(10,594
|
)
|
(3,434
|
)
|
(33,666
|
)
|
|||||||||
|
Other financial assets/(liabilities) (net)
(7)
|
103
|
|
(32
|
)
|
135
|
|
14
|
|
117
|
|
(229
|
)
|
(251
|
)
|
22
|
|
(4
|
)
|
(233
|
)
|
|||||||||
|
Current securities
|
457
|
|
457
|
|
—
|
|
25
|
|
482
|
|
180
|
|
180
|
|
—
|
|
30
|
|
210
|
|
|||||||||
|
Cash and cash equivalents
|
20,528
|
|
10,142
|
|
10,386
|
|
134
|
|
20,662
|
|
22,627
|
|
10,653
|
|
11,974
|
|
213
|
|
22,840
|
|
|||||||||
|
Net (Debt)/Cash
|
(5,049
|
)
|
(9,899
|
)
|
4,850
|
|
(1,499
|
)
|
(6,548
|
)
|
(7,654
|
)
|
(9,056
|
)
|
1,402
|
|
(3,195
|
)
|
(10,849
|
)
|
|||||||||
________________________________
|
(1)
|
The assets and liabilities of the Ferrari segment have been classified as Assets held for distribution and Liabilities held for distribution within the Consolidated Statement of Financial Position at December 31, 2015 and are not included in the figures presented. The assets and liabilities of the Ferrari segment are included within the balances presented at December 31, 2014.
|
|
(2)
|
Includes notes (€
13,078 million
at
December 31, 2015
and €
16,980 million
at
December 31, 2014
), the financial liability component of the mandatory convertible securities (€209 million at
December 31, 2015
and €373 million at December 31, 2014) and other securities (€359 million at
December 31, 2015
and €376 million at December 31, 2014) issued in financial markets, mainly from LATAM financial services companies.
|
|
(3)
|
Includes Canadian HCT notes (€
354 million
December 31, 2015
and €
620 million
at
December 31, 2014
), asset-backed financing, i.e. sales of receivables for which de-recognition is not allowed under IFRS (€
206 million
December 31, 2015
and €
469 million
at
December 31, 2014
) and arrangements accounted for as a lease under IFRIC 4 - Determining whether an arrangement contains a lease, and other financial payables.
|
|
(4)
|
Includes adjustments for fair value accounting on debt (€43 million at
December 31, 2015
and €67 million at
December 31, 2014
) and (accrued)/deferred interest and other amortizing cost adjustments (€83 million at
December 31, 2015
and €296 million at
December 31, 2014
).
|
|
(5)
|
Net amount between Industrial Activities financial receivables due from Financial Services (€664 million at
December 31, 2015
and €1,595 million at
December 31, 2014
) and Industrial Activities financial payables due to Financial Services (€96 million at
December 31, 2015
and €142 million at
December 31, 2014
). It also includes financial receivables due from discontinued operations (€98 million at December 31, 2015) and financial payables due to discontinued operations (€137 million at December 31, 2015).
|
|
(6)
|
Financial receivables due from FCA Bank.
|
|
(7)
|
Fair value of derivative financial instruments (net
positive
€
77 million
at
December 31, 2015
and net
negative
€
271 million
at
December 31, 2014
) and collateral deposits (€
40 million
at
December 31, 2015
and €
38 million
at
December 31, 2014
).
|
Change in Net Industrial Debt
As described in
Item 5. Operating and Financial Review—Non GAAP Financial Measures
, Net Industrial Debt is management’s primary measure for analyzing our financial leverage and capital structure and is one of the key targets used to measure our performance. The following section sets forth an explanation of the changes in our Net Industrial Debt during 2015, 2014 and 2013.
90
2015
In
2015
, Net Industrial Debt
decrease
d by €
2,605 million
from €
7,654 million
at
December 31, 2014
, which included Ferrari's Net Industrial Debt to €
5,049 million
at
December 31, 2015
, which excluded Ferrari's Net Industrial Debt of €963 million. The reduction in Net Industrial Debt during the year was primarily driven by:
|
(i)
|
cash flow from industrial operating activities of €9,703 million which represents the majority of the consolidated cash flow from operating activities of €
9,751 million
(refer to the section —Cash Flows section above for an explanation of the drivers in consolidated cash flows from operating activities);
|
|
(ii)
|
net cash proceeds from the Ferrari IPO of €
866 million
;
|
|
(iii)
|
the payment to non-controlling interests for €280 million in connection with the Ferrari IPO and in preparation for the spin-off of the remaining common shares of Ferrari N.V. owned by FCA (refer to the section —Principal Activities within our Consolidated Financial Statements included elsewhere in this report);
|
|
(iv)
|
positive translation exchange differences of €734 million, primarily reflecting the effect of the devaluation of Brazilian Real when converting the Brazilian companies’ net industrial debt to Euro;
|
These items were partially offset by:
|
(v)
|
investments in industrial activities of €8,816 million representing investments in property, plant and equipment and intangible assets, acquisition and capital increases in joint ventures, associates and unconsolidated subsidiaries for €268 million and cash used in industrial investing activities of discontinued operations of €372 million.
|
2014
In 2014, Net Industrial Debt increased by €640 million, from €7,014 million at December 31, 2013 to €7,654 million at December 31, 2014, which included Ferrari Net Industrial Debt. The movements in Net Industrial Debt were primarily driven by:
|
(i)
|
payments for the acquisition of the remaining 41.5 percent interest in FCA US previously not owned, inclusive of the previously exercised options on approximately 10 percent of FCA US's membership interest, of €2,691 million (U.S.$3,650 million);
|
|
(ii)
|
investments in industrial activities of €8,119 million representing investments in property, plant and equipment and intangible assets (including Ferrari);
|
The increases noted above were partially offset by the reductions in Net Industrial Debt primarily driven by:
|
(iii)
|
the issuance of the mandatory convertible securities due 2016 of €1,910 million (net proceeds of €2,245 million net of the liability component of €335 million) and the net proceeds from the offering of 100 million common shares of €849 million, net of the exercise of cash exit rights in connection with the Merger for a net aggregate cash disbursement of €417 million; and
|
|
(iv)
|
cash flow from industrial operating activities of €8,017 million which represented the consolidated cash flow from operating activities of €8,169 million, net of the cash flows from operating activities attributable to financial services. For an explanation of the drivers in consolidated cash flows from operating activities, refer to the section —
Cash Flows
above.
|
91
Capital Market
At
December 31, 2015
and
December 31, 2014
, capital market debt mainly related to notes issued under the GMTN Programme, the financial liability component of the mandatory convertible securities, and short and medium-term marketable financial instruments issued by various subsidiaries, principally in LATAM. At
December 31, 2015
, capital market debt also included a total principal amount of U.S.$3.0 billion (€2.8 billion) of unsecured senior debt securities issued by FCA in April 2015, as described below. At
December 31, 2014
, capital market debt included the secured senior notes of FCA US due in 2019 and 2021, which were prepaid in 2015.
The following table summarizes the outstanding notes at
December 31, 2015
and
2014
:
|
Currency
|
Face value of
outstanding notes (million) |
Coupon %
|
Maturity
|
December 31, 2015
|
December 31, 2014
|
|||||||||||
|
Global Medium Term Notes:
|
(€ million)
|
|||||||||||||||
|
Fiat Chrysler Finance Europe S.A.
(1)
|
EUR
|
1,500
|
|
6.875
|
|
February 13, 2015
|
—
|
|
1,500
|
|
||||||
|
Fiat Chrysler Finance Europe S.A.
(2)
|
CHF
|
425
|
|
5.000
|
|
September 7, 2015
|
—
|
|
353
|
|
||||||
|
Fiat Chrysler Finance Europe S.A.
(1)
|
EUR
|
1,000
|
|
6.375
|
|
April 1, 2016
|
1,000
|
|
1,000
|
|
||||||
|
Fiat Chrysler Finance Europe S.A.
(1)
|
EUR
|
1,000
|
|
7.750
|
|
October 17, 2016
|
1,000
|
|
1,000
|
|
||||||
|
Fiat Chrysler Finance Europe S.A.
(2)
|
CHF
|
400
|
|
5.250
|
|
November 23, 2016
|
369
|
|
333
|
|
||||||
|
Fiat Chrysler Finance Europe S.A.
(1)
|
EUR
|
850
|
|
7.000
|
|
March 23, 2017
|
850
|
|
850
|
|
||||||
|
Fiat Chrysler Finance North America Inc.
(1)
|
EUR
|
1,000
|
|
5.625
|
|
June 12, 2017
|
1,000
|
|
1,000
|
|
||||||
|
Fiat Chrysler Finance Europe S.A.
(2)
|
CHF
|
450
|
|
4.000
|
|
November 22, 2017
|
415
|
|
374
|
|
||||||
|
Fiat Chrysler Finance Europe S.A.
(1)
|
EUR
|
1,250
|
|
6.625
|
|
March 15, 2018
|
1,250
|
|
1,250
|
|
||||||
|
Fiat Chrysler Finance Europe S.A.
(1)
|
EUR
|
600
|
|
7.375
|
|
July 9, 2018
|
600
|
|
600
|
|
||||||
|
Fiat Chrysler Finance Europe S.A.
(2)
|
CHF
|
250
|
|
3.125
|
|
September 30, 2019
|
231
|
|
208
|
|
||||||
|
Fiat Chrysler Finance Europe S.A.
(1)
|
EUR
|
1,250
|
|
6.750
|
|
October 14, 2019
|
1,250
|
|
1,250
|
|
||||||
|
Fiat Chrysler Finance Europe S.A.
(1)
|
EUR
|
1,000
|
|
4.750
|
|
March 22, 2021
|
1,000
|
|
1,000
|
|
||||||
|
Fiat Chrysler Finance Europe S.A.
(1)
|
EUR
|
1,350
|
|
4.750
|
|
July 15, 2022
|
1,350
|
|
1,350
|
|
||||||
|
Others
|
EUR
|
7
|
|
7
|
|
7
|
|
|||||||||
|
Total Global Medium Term Notes
|
10,322
|
|
12,075
|
|
||||||||||||
|
Other notes:
|
||||||||||||||||
|
FCA US (Secured Senior Notes)
|
U.S.$
|
2,875
|
|
8.000
|
|
June 15, 2019
|
—
|
|
2,368
|
|
||||||
|
FCA US (Secured Senior Notes)
|
U.S.$
|
3,080
|
|
8.250
|
|
June 15, 2021
|
—
|
|
2,537
|
|
||||||
|
FCA Notes
(1)
|
U.S.$
|
1,500
|
|
4.500
|
|
April 15, 2020
|
1,378
|
|
—
|
|
||||||
|
FCA Notes
(1)
|
U.S.$
|
1,500
|
|
5.250
|
|
April 15, 2023
|
1,378
|
|
—
|
|
||||||
|
Total other notes
|
2,756
|
|
4,905
|
|
||||||||||||
|
Hedging effect and amortized cost valuation
|
363
|
|
668
|
|
||||||||||||
|
Total notes
|
13,441
|
|
17,648
|
|
||||||||||||
(1) Listing on the Irish Stock Exchange was obtained.
(2) Listing on the SIX Swiss Exchange was obtained.
92
Notes Issued Under The GMTN Programme
Certain notes issued by the Group, excluding FCA US, are governed by the terms and conditions of the GMTN Programme. A maximum of €20 billion may be used under this program, of which notes of approximately €
10.3 billion
were outstanding at
December 31, 2015
(€
12.1 billion
at
December 31, 2014
). The GMTN Programme is guaranteed by FCA, which may from time to time buy back notes in the market that have been issued. Such buybacks, if made, depend upon market conditions, the Group's financial situation and other factors which could affect such decisions.
Changes in notes issued under the GMTN Programme during
2015
were due to the:
|
•
|
repayment at maturity of two notes that had been issued by Fiat Chrysler Finance Europe S.A, one with a principal value of €1,500 million and one with a principal value of CHF 425 million (€390 million).
|
Changes in notes issued under the GMTN Programme during 2014 were due to the:
|
•
|
issuance of 4.75 percent notes at par in March 2014, having a principal of €1 billion and due March 2021 by Fiat Chrysler Finance Europe S.A;
|
|
•
|
issuance of 4.75 percent notes at par in July 2014, having a principal of €850 million and due July 2022 by Fiat Chrysler Finance Europe S.A; the notes issuance was reopened in September 2014 for a further €500 million principal value, priced at 103.265 percent of par value, increasing the total principal amount to €1.35 billion;
|
|
•
|
issuance of 3.125 percent notes at par in September 2014 having a principal of CHF 250 million and due September 2019 by Fiat Chrysler Finance Europe S.A.; and
|
|
•
|
repayment at maturity of two notes that had been issued by Fiat Chrysler Finance Europe S.A, one with a principal value of €900 million and one with a principal value of €1,250 million.
|
The notes issued by Fiat Chrysler Finance Europe S.A. and by Fiat Chrysler Finance North America Inc. impose covenants on the issuer and, in certain cases, on FCA as guarantor, which include: (i) negative pledge clauses which require that, in case any security interest upon assets of the issuer and/or FCA is granted in connection with other notes or debt securities having the same ranking, such security should be equally and ratably extended to the outstanding notes; (ii)
pari passu
clauses, under which the notes rank and will rank
pari passu
with all other present and future unsubordinated and unsecured obligations of the issuer and/or FCA; (iii) periodic disclosure obligations; (iv) cross-default clauses which require immediate repayment of the notes under certain events of default on other financial instruments issued by FCA’s main entities; and (v) other clauses that are generally applicable to securities of a similar type. A breach of these covenants may require the early repayment of the notes. At December 31, 2015, FCA was in compliance with the covenants of the GMTN Programme.
FCA US Secured Senior Notes
In February 2014, FCA US and certain of its U.S. subsidiaries, either as a co-issuer or guarantor, issued additional secured senior notes:
|
•
|
secured senior notes due 2019 – U.S.$1,375 million (€1,133 million at December 31, 2014) aggregate principal amount of 8.0 percent secured senior notes due June 15, 2019 (collectively with the May 2011 issuance of U.S.$1,500 million (€1,235 million at December 31, 2014) secured senior notes due 2019, the “2019 Notes”) at an issue price of 108.25 percent of the aggregate principal amount; and
|
|
•
|
secured senior notes due 2021 – U.S.$1,380 million (€1,137 million at December 31, 2014) aggregate principal amount of 8.25 percent secured senior notes due June 15, 2021 (collectively with the May 2011 issuance of U.S.$1,700 million (€1,400 million at December 31, 2014) secured senior notes due 2021, the “2021 Notes”) at an issue price of 110.50 percent of the aggregate principal amount.
|
93
The 2019 Notes and 2021 Notes are collectively referred to as the “Secured Senior Notes”.
On May 14, 2015, FCA US prepaid its 2019 Notes with an aggregate principal outstanding amount of U.S.$2,875 million (€2,518 million) at a price equal to the principal amount of the notes redeemed, plus accrued and unpaid interest to the date of redemption and a “make-whole” premium calculated in accordance with the terms of the indenture. The redemption payment of U.S.$3.1 billion (€2.7 billion) was made with cash on hand at FCA US.
On December 21, 2015, FCA US prepaid its 2021 Notes with an aggregate principal outstanding amount of U.S.$3,080 million (
€2,833
million) at a price equal to the principal amount of the notes redeemed, plus accrued and unpaid interest to the date of redemption and a “make-whole” premium calculated in accordance with the terms of the indenture. The redemption payment of U.S.$
3.3
billion (
€3.0
billion) was made with cash on hand at FCA US.
Notes Issued by FCA
In April 2015, FCA issued U.S.$1.5 billion (€1.4 billion) principal amount of 4.5 percent unsecured senior debt securities due April 15, 2020 (the “Initial 2020 Notes”) and U.S.$1.5 billion (€1.4 billion) principal amount of 5.25 percent unsecured senior debt securities due April 15, 2023 (the “Initial 2023 Notes”) at an issue price of 100 percent of their principal amount. The Initial 2020 Notes and the Initial 2023 Notes, collectively referred to as “the Initial Notes”, rank
pari passu
in right of payment with respect to all of FCA's existing and future senior unsecured indebtedness and senior in right of payment to any of FCA's future subordinated indebtedness and existing indebtedness, which is by its terms subordinated in right of payment to the Initial Notes.
On June 17, 2015, subject to the terms and conditions set forth in our prospectus, we commenced an offer to exchange up to U.S.$1.5 billion (€1.4 billion) aggregate principal amount of new 4.5 percent unsecured senior debt securities due 2020 (“2020 Notes”), for any and all of our outstanding Initial 2020 Notes issued on April 14, 2015, and up to U.S.$1.5 billion (€1.4 billion) aggregate principal amount of new 5.25 percent unsecured senior debt securities due 2023 (“2023 Notes”), for any and all of our outstanding Initial 2023 Notes issued on April 14, 2015. The 2020 Notes and the 2023 Notes, collectively referred to as “the Notes”, were identical in all material respects to the Initial Notes, except that the Notes did not contain restrictions on transfer. The exchange offer expired on July 23, 2015. Substantially all of the Initial Notes were tendered for the Notes.
The Notes impose covenants on FCA including: (i) negative pledge clauses which require that, in case any security interest upon assets of FCA is granted in connection with other notes or debt securities having the same ranking, such security should be equally and ratably extended to the outstanding Notes; (ii)
pari passu
clauses, under which the Notes rank and will rank
pari passu
with all other present and future unsubordinated and unsecured obligations of FCA; (iii) periodic disclosure obligations; (iv) cross-default clauses which require immediate repayment of the Notes under certain events of default on other financial instruments issued by FCA’s main entities; and (v) other clauses that are generally applicable to securities of a similar type. A breach of these covenants may require the early repayment of the Notes. At December 31, 2015, FCA was in compliance with the covenants of the Notes.
Bank Debt
Bank debt was primarily comprised of amounts due under (i) the senior credit facilities of FCA US of €4.4 billion at
December 31, 2015
and €4.0 billion at
December 31, 2014
, (ii) financial liabilities of the Brazilian operating entity (€4.1 billion at
December 31, 2015
and €4.7 billion at
December 31, 2014
) relating to a number of financing arrangements with certain Brazilian development banks, primarily used to support capital expenditures, including those in our Pernambuco plant (approximately €1.2 billion at
December 31, 2015
and at December 31, 2014), as well as to fund the financial services business in that country, (iii) loans provided by the EIB (€1.2 billion at
December 31, 2015
and €1.0 billion at
December 31, 2014
) to fund our investments and research and development costs, (iv) amounts drawn down by FCA treasury companies (excluding FCA US) under short and medium term credit facilities (€0.6 billion at
December 31, 2015
and €1.4 billion at
December 31, 2014
) and (v) amounts outstanding relating to financing arrangements of FCA Mexico amounting to
€0.5
billion at
December 31, 2015
(€0.4 billion was outstanding relating to financing arrangements of FCA Mexico with certain Mexico development banks at
December 31, 2014
).
94
Senior Credit Facilities - FCA US
The tranche B term loan due 2017 of FCA US consists of the original U.S.$3.0 billion tranche B term loan (
€2.8
billion) that matures on May 24, 2017 (the “Original Tranche B Term Loan”) and an additional U.S.$250 million (
€230
million at December 31, 2015) term loan entered into on February 7, 2014 under the Original Tranche B Term Loan that also matures on May 24, 2017, collectively the “Tranche B Term Loan due 2017.” At
December 31, 2015
,
€2,863
million (€2,587 million at
December 31, 2014
), which included accrued interest, was outstanding under the Tranche B Term Loan due 2017. The outstanding principal amount of the Tranche B Term Loan due 2017 is payable in equal quarterly installments of U.S.$8.1 million (
€7.4 million
) from March 2014, with the remaining balance due at maturity in May 2017. The Tranche B Term Loan due 2017 bears interest, at FCA's option, at either a base rate plus 1.75 percent per annum or at LIBOR plus 2.75 percent per annum, subject to a base rate floor of 1.75 percent per annum or a LIBOR floor of 0.75 percent per annum. For the years ended December 31, 2015 and 2014, interest was accrued based on LIBOR.
On February 7, 2014, FCA US entered into a new U.S.$1,750 million (€
1,607
million) tranche B term loan issued under a new term loan credit facility that matures on December 31, 2018 (the “Tranche B Term Loan due 2018”). At
December 31, 2015
, €
1,574
million (€1,421 million at
December 31, 2014
), which included accrued interest, was outstanding under the Tranche B Term Loan due 2018. The outstanding principal amount of the Tranche B Term Loan due 2018 is payable in quarterly installments of U.S.$4.4 million (
€4.0
million) from June 30, 2014, with the remaining balance due at maturity. The Tranche B Term Loan due 2018 bears interest, at FCA US's option, either at a base rate plus 1.50 percent per annum or at LIBOR plus 2.50 percent per annum, subject to a base rate floor of 1.75 percent per annum or a LIBOR floor of 0.75 percent per annum. For the years ended December 31, 2015 and 2014, interest was accrued based on LIBOR.
FCA US may pre-pay, refinance or re-price the Tranche B Term Loan due 2017 and the Tranche B Term Loan due 2018, collectively referred to as the “Senior Credit Facilities”, without premium or penalty.
The Senior Credit Facilities are secured by a senior priority security interest in substantially all of FCA US’s assets and the assets of its U.S. subsidiary guarantors, subject to certain exceptions. The collateral includes 100 percent of the equity interests in FCA US's U.S. subsidiaries and 65 percent of the equity interests in certain of its non-U.S. subsidiaries held directly by FCA US and its U.S. subsidiary guarantors.
The credit agreements that govern the Senior Credit Facilities (the “Senior Credit Agreements”) include a number of affirmative covenants, many of which are customary, including, but not limited to, the reporting of financial results and other developments, compliance with laws, payment of taxes, maintenance of insurance and similar requirements. The Senior Credit Agreements also include negative covenants, including but not limited to: (i) limitations on incurrence, repayment and prepayment of indebtedness; (ii) limitations on incurrence of liens; (iii) limitations on making restricted payments including a limit on declaring dividends or distributions to FCA; (iv) limitations on transactions with affiliates, swap agreements and sale and leaseback transactions; (v) limitations on fundamental changes, including certain asset sales and (vi) restrictions on certain subsidiary distributions. In addition, the Senior Credit Agreements require FCA US to maintain a minimum ratio of “borrowing base” to “covered debt” (as defined in the Senior Credit Agreements), as well as a minimum liquidity of U.S.$3.0 billion (
€2.8
billion). Furthermore, the Senior Credit Agreements contain a number of events of default related to: (i) failure to make payments when due; (ii) failure to comply with covenants; (iii) breaches of representations and warranties; (iv) certain changes of control; (v) cross–default with certain other debt and hedging agreements and (vi) the failure to pay or post note for certain material judgments. While the Senior Credit Facilities are outstanding, distributions to FCA will be limited to 50 percent of FCA US’s consolidated net income (as defined in the agreements) from January 2012 less distributions paid to date.
As of
December 31, 2015
, FCA US was in compliance with the covenants of the Senior Credit Agreements.
European Investment Bank Borrowings
We have financing agreements with the EIB for a total of €1.2 billion outstanding at December 31, 2015 (€1.1 billion outstanding at December 31, 2014), which included the (i) new €600 million facility described below, (ii) a facility of €400 million (maturing in 2018) for supporting certain investments and research and development programs in Italy to protect the environment through the reduction of emissions and improved energy efficiency and (iii) a €500 million facility (maturing in 2021) for an investment program relating to the modernization and expansion of production capacity of an automotive plant in Serbia.
95
On June 29, 2015, FCA, EIB and SACE finalized a €600 million loan earmarked to support the Group's automotive research, development and production plans for 2015 to 2017 which includes studies for efficient vehicle technologies for vehicle safety and new vehicle architectures. The three-year loan due July 2018 provided by the EIB, which is also 50 percent guaranteed by SACE, relates to FCA's production and research and development sites in both northern and southern Italy. The loan was fully drawn at December 31, 2015.
Brazil
Our Brazilian subsidiaries have access to various local bank facilities in order to fund investments and operations. Total debt outstanding under those facilities amounted to €4.1 billion at December 31, 2015 (€
4.7 billion
at December 31, 2014), of which €3.6 billion are medium term loans (€
4.3 billion
at December 31, 2014), with an average residual maturity between 2 to 3 years, while €0.5 billion (€
0.4 billion
at December 31, 2014) are short-term credit facilities. Medium-term facilities primarily include subsidized loans granted by such public financing institutions as Banco Nacional do Desenvolvimento (“BNDES”), with the aim to support industrial projects in certain areas. This provided the Group the opportunity to fund large investments in Brazil, with loans of sizeable amounts at low rates and with maturities greater than 10 years. At December 31, 2015, outstanding subsidized loans amounted to €1.9 billion (€
2.3 billion
at December 31, 2014), of which €1.2 billion (
€1.2 billion
at December 31, 2014), related to the construction of the plant in Pernambuco, which has been supported by subsidized credit lines totaling Brazilian Real (
“
BRL
”
) 6.5 billion (€1.5 billion). Approximately €0.3 billion (
€0.9 billion
at December 31, 2014), of committed credit lines contracted to fund scheduled investments in the area were undrawn at December 31, 2015. The average residual maturity of the subsidized loans was approximately 4 years.
Mexico Bank Loan
On March 20, 2015, FCA Mexico, S.A. de C.V., (“FCA Mexico”), our principal operating subsidiary in Mexico, entered into a U.S.$900 million (
€0.8
billion) non-revolving loan agreement (“Mexico Bank Loan”) maturing on March 20, 2022 and received an initial disbursement of U.S.$500 million (
€0.5
billion at
December 31, 2015
), which bears interest at one-month LIBOR plus 3.35 percent per annum. The proceeds were used to prepay all amounts outstanding under the Mexican development bank credit facilities amounting to approximately €414 million. Effective July 20, 2015, we extended the disbursement term of the Mexico Bank Loan through September 20, 2016, during which time the remaining U.S.$400 million (
€0.4
billion at December 31, 2015) is available for disbursement, subject to meeting certain preconditions for additional disbursements and a commitment fee of 0.50 percent per annum on the undisbursed balance. At December 31, 2015, the U.S.$400 million (
€0.4
billion) was undisbursed. The loan agreement requires FCA Mexico to maintain certain fixed and other assets as collateral, and comply with certain covenants, including, but not limited to, financial maintenance covenants, limitations on liens, incurrence of debt and asset sales. The Group may not prepay all or any portion of the loan prior to the 18-month anniversary of the effective date of the loan agreement. At December 31, 2015, the Group was in compliance with all covenants under the Mexico Bank Loan.
Other Debt
At
December 31, 2015
, Other debt included the principal balance of the unsecured Canadian HCT Notes, totaling €
354 million
(€
620 million
at
December 31, 2014
), which represents FCA US's principal Canadian subsidiary's financial liability to the Canadian Health Care Trust arising from the settlement of its obligations for postretirement health care benefits for National Automobile, Aerospace, Transportation and General Workers Union of Canada, or CAW (now part of Unifor), which represented employees, retirees and dependents. During the year ended
December 31, 2015
, FCA US's Canadian subsidiary prepaid the remaining scheduled payments on the Canada HCT Tranche A Note.
During the year ended December 31, 2014, the balance of the VEBA Trust Note was prepaid. The proceeds of the February 7, 2014 issuances of the Secured Senior Notes and the Senior Credit Facilities were used to prepay all amounts outstanding of approximately U.S.$5.0 billion (€3.6 billion) under the VEBA Trust Note.
At
December 31, 2015
, debt secured by assets of the Group (excluding FCA US) amounted to
€747 million
(
€777 million
at
December 31, 2014
), of which
€373 million
(
€379 million
at
December 31, 2014
) was due to creditors for assets acquired under finance leases and the remaining amount mainly related to subsidized financing in Latin America. The total carrying amount of assets acting as security for loans for the Group (excluding FCA US) amounted to
€1,400 million
at
December 31, 2015
(
€1,670 million
at
December 31, 2014
).
96
At
December 31, 2015
, debt secured by assets of FCA US amounted to
€5,254 million
and included
€4,437 million
relating to the Senior Credit Facilities,
€243 million
due to creditors for assets acquired under finance leases and other debt and financial commitments for
€574 million
. At December 31, 2014, debt secured by assets of FCA US amounted to
€9,881 million
and included €
9,093 million
relating to the Secured Senior Notes and Senior Credit Facilities, €
251 million
due to creditors for assets acquired under finance leases and other debt and financial commitments for
€537 million
.
C. Research and Development, Patents and Licenses, etc.
Research and Development
We engage in research and development activities aimed at improving the design, performance, safety, fuel efficiency, reliability, consumer perception and sustainability of our products and services.
As of
December 31, 2015
, we operated
84
research and development centers worldwide (excluding one for Ferrari) with a combined headcount of approximately 20 thousand employees supporting our research and development efforts. Our personnel support product development efforts and have expertise in a number of disciplines, including mechanical, electrical, materials, computer science and chemical engineering. We also provide several internal programs through which a portion of our engineers receive cross-training in various technical and business functions.
In
2015
, excluding Ferrari, total expenditures for
research and development amounted to
€
4.0 billion
, representing 3.6 percent of Net revenues attributable to industrial operations (excluding revenue from financial services).
Total expenditures for research and development for the year ended December 31, 2015 increased
14.5
percent from €
3,452 million
from the year ended
December 31, 2014
, which is in line with the Group's product development established in the 2014-2018
business plan.
Total expenditures on research and development amounted to €
3,452 million
for the year ended
December 31, 2014
, an
increase
of
7.6
percent from €
3,207 million
for the year ended
December 31, 2013
.
The following table summarizes our research and development expenditures in the
years ended December 31, 2015
,
2014
and
2013
(excluding Ferrari):
|
For the Years Ended December 31,
|
|||||||||
|
2015
|
2014
|
2013
|
|||||||
|
(€ million)
|
|||||||||
|
Research and development capitalized
|
2,504
|
|
2,132
|
|
1,950
|
|
|||
|
Research and development expensed during the year
|
1,449
|
|
1,320
|
|
1,257
|
|
|||
|
Total research and development expenditures
|
3,953
|
|
3,452
|
|
3,207
|
|
|||
|
Development costs capitalized as a percent of total expenditures on research and development
|
63.3
|
%
|
|
61.8
|
%
|
60.8
|
%
|
||
|
Research and development expensed during the year
|
1,449
|
|
1,320
|
|
1,257
|
|
|||
|
Amortization of capitalized development costs
|
1,194
|
|
932
|
|
768
|
|
|||
|
Write-down of capitalized research and development costs
|
221
|
|
82
|
|
250
|
|
|||
|
Total research and development costs
|
2,864
|
2,334
|
2,275
|
||||||
Fuel Efficiency and Reduced Emissions
We focus our research efforts on two areas aimed at improving efficiency and reducing fuel consumption and emissions: vehicle energy demand (including weight, aerodynamics, drag, rolling resistance, heating, air-conditioning and auxiliaries) and powertrain technologies (engines, transmissions, axles and drivelines, hybrid and electric propulsion and alternative fuels).
97
Vehicle Energy Demand
Our research focuses on reducing weight, aerodynamic drag, tire rolling resistance and driveline losses. We also continue to research vehicle applications for improving recuperation and re-use of thermal energy and of kinetic energy, thereby reducing energy consumption and related CO
2
emissions of conventional and hybrid electric vehicle models.
Since 2008, we have progressively introduced engine stop-start (“ESS”) and smart alternator technologies in order to further reduce fuel consumption. ESS technology turns off the engine and fuel flow automatically when the vehicle comes to a halt and re-starts the engine upon acceleration, while the smart alternator technology allows for the optimization of electric generation, partly recovering kinetic energy. These technologies are now widely employed in the Fiat, Alfa Romeo and Lancia models, and have been adopted in certain Jeep brand vehicles.
Powertrain Technologies
The evolution of FCA proprietary technologies like MultiAir and MultiJet (increased fuel pressure and improved injection pattern) has progressed in combination with other technologies such as direct injection, variable displacement oil pumps and electronic thermostats, leading to the development of more efficient powertrain architectures.
The second generation MultiAir technology brings further improvements in fuel efficiency and CO
2
emissions, building on the progress of the first generation MultiAir engines. Specific improvements to the MultiAir system include the introduction of new camshaft profiles and new engine control capabilities.
The wider use of smart technologies, which provide dynamic management of the vehicle’s powertrain systems, has also contributed to an improved balance between performance and fuel economy. These technologies include smart alternators, optimized engine cooling systems and cylinder deactivation. Conventional gasoline and diesel engines are expected to continue to play a predominant role in mobility in upcoming years. The Group believes that there is still significant potential to reduce the fuel consumption and emission levels of these engines through technological solutions.
Gasoline engines
In the EMEA region, the adoption of ESS has been extended to the entire vehicle range in order to improve average CO
2
emissions.
In multiple regions, completely new global small and medium gasoline engine families are being developed to improve fuel economy and emission levels. These new engine families are expected to cover a large range of vehicle applications with different power outputs and introduce features and technologies such as direct injection, downsizing and turbocharging, and cooled exhaust gas recirculation to improve efficiency, while also addressing internal friction and thermal management.
Natural Gas engines
We believe that compressed natural gas is a viable near to medium-term option for promoting compliance with future fuel economy and emissions requirements. We offer a wide range of eco-friendly bi-fuel (natural gas/gasoline) vehicles in Europe, satisfying the needs of a wide variety of private and commercial consumers. Safety and comfort remain uncompromised, as natural gas tanks in these vehicles are designed to be fully integrated into the vehicle structure.
A fundamental aspect of our vehicle emission reduction strategy and the use of alternative fuels, from natural gas to biofuels, is to offer technologies that are aligned with the fuels available in various markets, and capable of reducing emission levels.
98
Diesel engines
In recent years, diesel research has focused on the combustion process and after-treatment technologies.
On the combustion side, enhanced control of injection parameters together with optimization of combustion bowl shape represented a key step in reducing “engine-out” pollutants and enhancing fuel economy.
In terms of after-treatment systems, research and development activities have mainly focused on passive and active NOx reduction technologies and the study of real driving conditions to determine optimized configurations for the next generation diesel powertrains. Advanced after-treatment systems for the reduction of NOx emissions are under development both for passenger car and light commercial vehicle applications.
Transmissions
Our transmission portfolio includes manual transmissions, automated manual transmissions, or AMTs, dual dry clutch transmissions, or DDCTs, and automatic transmissions. We utilize a broad portfolio to meet market demands in the different regions where we operate to achieve the right vehicle performance characteristics for our brands. The Group transmission portfolio includes 8- and 9-speed units in order to gain efficiency, performance and drive comfort.
Axles and Driveline
We focus on producing lightweight axle and driveline systems that provide capability and efficiency across our entire portfolio of vehicles. Additionally, we have deployed automatic axle disconnect systems on the majority of our 4x4 and all-wheel drive equipped vehicles to reduce parasitic losses and improve fuel economy during normal driving conditions. Future development activities are focused on optimized system design and material utilization to reduce overall system weight without sacrificing capability or performance.
Hybrid and Battery Propulsion
Launching in 2016, the new Chrysler Pacifica Hybrid is expected to achieve an efficiency rating of 80 miles per gallon equivalent (MPGe), based on U.S. Environmental Protection Agency standards and provide an estimated range of 30 miles solely on zero-emissions electric power. When the battery’s energy is depleted to a certain threshold, the Pacifica Hybrid becomes a part-time electric vehicle, like a conventional hybrid.
Power to the wheels is supplied by the electric drive system or supplemented by a specially adapted new version of the award-winning Pentastar 3.6-liter V-6 engine which is paired with the US-patented dual-motor electrically variable transmission (EVT).
Intellectual Property
We own a significant number of patents, trade secrets, licenses, trademarks and service marks, including, in particular, the marks of our vehicle and component and production systems brands, which relate to our products and services. We expect the number to grow as we continue to pursue technological innovations. We file patent applications in Europe, the U.S. and around the world to protect technology and improvements considered important to our business. No single patent is material to our business as a whole.
D. Trend Information
Please refer to
Item 5 Operating and Financial Review—Trends, Uncertainties and Opportunities
for information required by this item.
99
E. Off-Balance Sheet Arrangements
We have entered into various off-balance sheet arrangements with unconsolidated third parties in the ordinary course of business, including financial guarantees. Such arrangements are described in more detail below. For additional information see Note
28
to our Consolidated Financial Statements included elsewhere in this report.
Financial Guarantees
At
December 31, 2015
we had pledged guarantees on the debt or commitments of third parties totaling €
19 million
as well as guarantees of
€4 million
on related party debt, relating to unconsolidated entities or dealers.
F. Tabular Disclosure of Contractual Obligations
The following table summarizes payments due under our significant contractual commitments as at
December 31, 2015
:
|
Payments due by period
|
||||||||||||||
|
(€ million)
|
Total
|
Less than 1 year
|
1-3 years
|
3-5 years
|
More than
5 years |
|||||||||
|
Long-term debt
(1)
|
24,290
|
|
4,463
|
|
11,303
|
|
3,820
|
|
4,704
|
|
||||
|
Capital Lease Obligations
(2)
|
637
|
|
96
|
|
183
|
|
172
|
|
186
|
|
||||
|
Interest on long-term financial liabilities
(3)
|
4,258
|
|
1,332
|
|
1,677
|
|
760
|
|
489
|
|
||||
|
Operating Lease Obligations
(4)
|
937
|
|
190
|
|
289
|
|
201
|
|
257
|
|
||||
|
Unconditional minimum purchase obligations
(5)
|
1,709
|
|
420
|
|
791
|
|
390
|
|
108
|
|
||||
|
Purchase Obligations
(6)
|
2,549
|
|
2,421
|
|
127
|
|
1
|
|
—
|
|
||||
|
Pension contribution requirements
(7)
|
140
|
|
140
|
|
—
|
|
—
|
|
—
|
|
||||
|
Total
|
34,520
|
|
9,062
|
|
14,370
|
|
5,344
|
|
5,744
|
|
||||
|
(1)
|
Amounts presented relate to the principal amounts of long-term debt and exclude the related interest expense that will be paid when due, fair value adjustments, discounts, premiums and loan origination fees. For additional information see Note
23
to the Consolidated Financial Statements included elsewhere in this report. The table above does not include short term debt obligations. See the table below for a reconciliation of the information to Note
23
to the Consolidated Financial Statements.
|
|
(2)
|
Capital lease obligations consist mainly of industrial buildings and plant, machinery and equipment used in our business. The amounts reported include the minimum future lease payments and payment commitments due under such leases. See Note
23
to the Consolidated Financial Statements included elsewhere in this report.
|
|
(3)
|
Amounts include interest payments based on contractual terms and current interest rates on our debt and capital lease obligations. Interest rates based on variable rates included above were determined using the current interest rates in effect at
December 31, 2015
.
|
|
(4)
|
Operating lease obligations mainly relate to leases for commercial and industrial properties used in our business. The amounts reported above include the minimum rental and payment commitments due under such leases.
|
|
(5)
|
Unconditional minimum purchase obligations relate to our unconditional purchase obligations to purchase a fixed or minimum quantity of goods and/or services from suppliers with fixed and determinable price provisions. From time to time, in the ordinary course of our business, we enter into various arrangements with key suppliers in order to establish strategic and technological advantages.
|
|
(6)
|
Purchase obligations comprise (i) the repurchase price guaranteed to certain customers on sales with a buy-back commitment in an aggregate amount of €884 million and (ii) commitments to purchase tangible fixed assets, mainly in connection with planned capital expenditure of various group companies, in an aggregate amount of approximately
€1,665 million
.
|
|
(7)
|
Pension contribution requirements are based on the estimate of our minimum funding requirements under our funded pension plans. We expect pension contributions to be approximately
€563 million
in
2016
. We may elect to make contributions in excess of the minimum funding requirements. We plan to make discretionary contributions to such plans of
€423 million
in
2016
and
€140 million
will be made to satisfy minimum funding requirements. Our minimum funding requirements after
2016
will depend on several factors, including investment performance and interest rates. Therefore, the above excludes payments beyond
2016
, since we cannot predict with reasonable reliability the timing and amounts of future minimum funding requirements.
|
100
The long-term debt obligations reflected in the table above can be reconciled to the amount in the
December 31, 2015
Statement of Financial Position as follows:
|
(€ million)
|
Amount
|
|
|
Debt
|
27,786
|
|
|
Capital lease obligations
|
(637
|
)
|
|
Short term debt obligations
|
(2,733
|
)
|
|
Amortized cost effects
|
(126
|
)
|
|
Long-term debt
|
24,290
|
|
Product warranties, recall campaigns and product liabilities
The contractual obligations set forth above do not include payments for product warranty and recall campaign costs. We issue various types of product warranties under which we generally guarantee the performance of products delivered for a certain period of time. The estimated future costs of product warranties are principally based on assumptions regarding the lifetime warranty costs of each vehicle line and each model year of that vehicle line, as well as historical claims experience for the Group’s vehicles. We also periodically initiate voluntary service and recall actions to address various customer satisfaction, safety and emissions issues related to the vehicles that we sell. The estimated future costs of these actions are based on an actuarial analysis that incorporates
recent trends in recall campaigns,
historical claims experience for the Group’s vehicles, assumptions about future activity and events. Estimates of the future costs of all these actions are inevitably imprecise due to numerous uncertainties, including the enactment of new laws and regulations, the number of vehicles affected by a service or recall action and the nature of the corrective action. It is reasonably possible that the ultimate costs of these services and recall actions may require us to make expenditures in excess of established reserves over an extended period of time and in a range of amounts that cannot be reasonably estimated. At
December 31, 2015
our product warranty and recall campaigns provision was €
6,471 million
.
Other Repurchase Obligations
In accordance with the terms of other wholesale financing arrangements in Mexico, FCA Mexico is required to repurchase dealer inventory financed under these arrangements, upon certain triggering events and with certain exceptions, including in the event of an actual or constructive termination of a dealer’s franchise agreement. These obligations exclude certain vehicles including, but not limited to, vehicles that have been damaged or altered, that are missing equipment or that have excessive mileage or an original invoice date that is more than one year prior to the repurchase date. In December 2015, FCA Mexico entered into a ten year private label financing agreement with FC Financial, S.A De C.V., Sofom, E.R., Grupo Financiaro Inbursa (“FC Financial”), a wholly owned subsidiary of Banco Inbursa, under which FC Financial provides a wide range of financial wholesale and retail financial services to FCA US's dealers and retail customers under the FCA Financial Mexico brand name. The wholesale repurchase obligation under the new agreement will be limited to wholesale purchases in case of actual or constructive termination of a dealer's franchise agreement.
At December 31, 2015, the maximum potential amount of future payments required to be made in accordance with these wholesale financing arrangements was approximately
€275 million
(U.S.$299 million) and was based on the aggregate repurchase value of eligible vehicles financed through such arrangements in the respective dealer’s stock. If vehicles are required to be repurchased through such arrangements, the total exposure would be reduced to the extent the vehicles can be resold to another dealer. The fair value of the guarantee was less than
€0.1 million
at
December 31, 2015
, which considers both the likelihood that the triggering events will occur and the estimated payment that would be made net of the estimated value of inventory that would be reacquired upon the occurrence of such events. These estimates are based on historical experience.
101
Pension and Other Post-Employment Benefits
Our provision for employee benefits
at December 31, 2015
and
2014
was as follows:
|
At December 31,
|
|||||
|
2015
|
2014
|
||||
|
(€ million)
|
|||||
|
Present value of defined benefit obligations:
|
|||||
|
Pension benefits
|
27,547
|
|
27,287
|
|
|
|
Health care and life insurance plans
|
2,459
|
|
2,276
|
|
|
|
Other post-employment benefits
|
969
|
|
1,074
|
|
|
|
Total present value of defined benefit obligations (a)
|
30,975
|
|
30,637
|
|
|
|
Fair value of plan assets (b)
|
22,415
|
|
22,231
|
|
|
|
Asset ceiling (c)
|
11
|
|
6
|
|
|
|
Total net defined benefit plans (a - b + c)
|
8,571
|
|
8,412
|
|
|
|
of which:
|
|||||
|
Net defined benefit liability (d)
|
8,738
|
|
8,516
|
|
|
|
(Defined benefit plan asset)
|
(167
|
)
|
(104
|
)
|
|
|
Other provisions for employees and liabilities for share-based payments (e)
|
1,326
|
|
1,076
|
|
|
|
Total Provisions for employee benefits (d + e)
|
10,064
|
|
9,592
|
|
|
We provide post-employment benefits for certain of our active employees and retirees. The way these benefits are provided varies according to the legal, fiscal and economic conditions of each country in which we operate and may change periodically. We classify these plans on the basis of the type of benefit provided as follows: pension benefits, health care and life insurance plans, and other post-employment benefits. Moreover, we provide post-employment benefits, such as pension or health care benefits, to our employees under defined contribution plans. In this case, we pay contributions to public or private insurance plans on a legally mandatory, contractual, or voluntary basis. By paying these contributions we fulfill all of our obligations. We recognize the cost for defined contribution plans over the period in which the employee renders service and classify this by function in Cost of sales, Selling, general and administrative costs and Research and development costs. During the year ended December 31,
2015
, this cost totaled
€1,541 million
(
€1,346 million
in
2014
and
€1,263
in
2013
).
Subsequent to January 21, 2014, when the Group’s ownership in FCA US increased to 100 percent, FCA may become subject to certain U.S. legal requirements making it secondarily responsible for a funding shortfall in certain of FCA US’s pension plans in the event that the pension plans were terminated and FCA US were to become insolvent.
Pension benefits
In the U.S. and Canada we sponsor both non-contributory and contributory defined benefit pension plans. The non-contributory pension plans cover certain hourly and salaried employees. Benefits are based on a fixed rate for each year of service. Additionally, we provide contributory benefits to certain salaried employees under the salaried employees’ retirement plans. These plans provide benefits based on the employee’s cumulative contributions, years of service during which the employee contributions were made and the employee’s average salary during the five consecutive years in which the employee’s salary was highest in the 15 years preceding retirement.
In the United Kingdom (“U.K.”), we participate, among others, in a pension plan financed by various Group entities, called the Fiat Group Pension Scheme covering mainly deferred and retired employees.
102
Our funding policy for defined benefit pension plans is to contribute at least the minimum amounts required by applicable laws and regulations. Occasionally, additional discretionary contributions in excess of these legally required are made to achieve certain desired funding levels. The expected benefit payments for pension plans are as follows:
|
(€ million)
|
Expected benefit payments
|
|
|
2016
|
1,854
|
|
|
2017
|
1,810
|
|
|
2018
|
1,785
|
|
|
2019
|
1,766
|
|
|
2020
|
1,747
|
|
|
2021 - 2025
|
8,573
|
|
Health care and life insurance plans
Liabilities arising from these plans comprise obligations for retiree health care and life insurance granted to employees and to retirees in the U.S. and Canada by FCA US. Upon retirement from the relevant company, these employees may become eligible for continuation of certain benefits. Benefits and eligibility rules may be modified periodically. These plans are unfunded. The expected benefit payments for unfunded health care and life insurance plans are as follows:
|
(€ million)
|
Expected benefit payments
|
|
|
2016
|
139
|
|
|
2017
|
139
|
|
|
2018
|
139
|
|
|
2019
|
139
|
|
|
2020
|
139
|
|
|
2021 - 2025
|
716
|
|
Other post-employment benefits
Other post-employment benefits includes other employee benefits granted to Group employees in Europe and comprise, amongst others, the Italian TFR obligation amounting to
€794 million
at December 31, 2015
and
€886 million
at December 31, 2014
. The TFR obligation consists of the residual obligation for the benefit due to employees of Italian companies until December 31, 2006, having more than 50 employees, accrued over the employee's working life and is settled when an employee leaves the Group. These schemes are required under Italian Law and are unfunded.
See Note
21
to the Consolidated Financial Statements included elsewhere in this report for additional information.
G. Safe Harbor
See section entitled
Forward-Looking Statements
at the beginning of this report.
103
A. Directors and Senior Management
Directors and Management of FCA
Set forth below are the names, year of birth and position of each of the persons currently serving as directors of FCA. Unless otherwise indicated, the business address of each person listed below will be c/o FCA, 25 St. James’s Street, London SW1A 1HA, United Kingdom. The Board of Directors of FCA has been appointed effective as of April 16, 2015 and its term of office will expire on the next Shareholders’ meeting, currently scheduled on April 15, 2016.
|
Name
|
Year of Birth
|
Position
|
||
|
John Elkann
|
1976
|
executive director
|
||
|
Sergio Marchionne
|
1952
|
executive director
|
||
|
Andrea Agnelli
|
1975
|
non-executive director
|
||
|
Tiberto Brandolini d’Adda
|
1948
|
non-executive director
|
||
|
Glenn Earle
|
1958
|
non-executive director
|
||
|
Valerie A. Mars
|
1959
|
non-executive director
|
||
|
Ruth J. Simmons
|
1945
|
non-executive director
|
||
|
Ronald L. Thompson
|
1949
|
non-executive director
|
||
|
Patience Wheatcroft
|
1951
|
non-executive director
|
||
|
Stephen M. Wolf
|
1941
|
non-executive director
|
||
|
Ermenegildo Zegna
|
1955
|
non-executive director
|
||
Summary biographies for persons who are currently directors of FCA are included below:
John Elkann
(executive director
)- John Elkann is Chairman of FCA. He was appointed Chairman of Fiat S.p.A. on April 21, 2010 where he previously served as Vice Chairman beginning in 2004 and as a board member beginning December 1997. Mr. Elkann is also Chairman and Chief Executive Officer of Exor S.p.A. and Chairman of Giovanni Agnelli e C. Sapaz.
Born in New York in 1976, Mr. Elkann obtained a scientific baccalaureate from the Lycée Victor Duruy in Paris, and graduated in Engineering from Politecnico, the Engineering University of Turin (Italy). While at university, he gained work experience in various companies of the Fiat Group in the UK and Poland (manufacturing) as well as in France (sales and marketing). He started his professional career in 2001 at General Electric as a member of the Corporate Audit Staff, with assignments in Asia, the USA and Europe. Mr. Elkann is Chairman of Italiana Editrice S.p.A. and a board member of CNHI, The Economist Group and News Corporation. Mr. Elkann is a member of the IAC of Brookings Institution and of the Museum of Modern Art (MoMA). He also serves as Vice Chairman of the Italian Aspen Institute and of the Giovanni Agnelli Foundation.
Sergio Marchionne
(executive director)
- Sergio Marchionne currently serves as Chief Executive Officer of FCA and Chairman of Ferrari N.V. He is also Chairman and Chief Executive Officer of both FCA US and FCA Italy and Chairman of CNHI.
Born in Chieti, Italy in 1952, he has dual Canadian and Italian citizenship. He holds a Bachelor of Arts with a major in Philosophy from the University of Toronto and a Bachelor of Laws from Osgoode Hall Law School at York University in Toronto, as well as a Master of Business Administration and a Bachelor of Commerce from the University of Windsor (Canada). Mr. Marchionne is a barrister, solicitor and chartered accountant.
104
Mr. Marchionne began his professional career in Canada. From 1983 to 1985, he worked for Deloitte & Touche. From 1985 to 1988, he was with the Lawson Mardon Group of Toronto. From 1989 to 1990, he served as Executive Vice President of Glenex Industries. From 1990 to 1992, he was Chief Financial Officer (CFO) at Acklands Ltd. From 1992 to 1994, also in Toronto, he held the position of Vice President of Legal and Corporate Development and CFO of the Lawson Mardon Group. From 1994 to 2000, he covered various positions of increasing responsibility at Algroup, headquartered in Zurich (Switzerland), until becoming its CEO. He then went on to head the Lonza Group Ltd, first as CEO (2000-2001) and then as Chairman (2002).
In February 2002, he became CEO of the SGS Group of Geneva. In March 2006, he was appointed Chairman of the company, a position which he continues to hold. From 2008 to April 2010, he also served as non-executive Vice Chairman and Senior Independent Director of UBS.
In 2010, Mr. Marchionne joined the Board of Directors of Exor S.p.A. and, in 2015, was appointed non-executive Vice Chairman. Since 2013, he has served as Chairman of CNHI, the company resulting from the mergers of Fiat Industrial S.p.A. and CNH Global N.V.
Mr. Marchionne
is currently a member of the Board of Philip Morris International Inc. and the Peterson Institute for International Economics, as well as Chairman of the Council for the United States and Italy. Mr. Marchionne is recipient of ad honorem degrees in Industrial Engineering and Management from Polytechnic University in Turin (Italy) and in Economics from the University of Cassino (Italy), a Masters honoris causa in Business Administration from the CUOA Foundation (Italy), an honorary Doctor of Laws from the University of Windsor (Canada) and Walsh College in Troy (Michigan), and honorary doctorates in Business Administration from the University of Toledo (Ohio), in Science from Oakland University in Rochester (Michigan) and in Humane Letters from Indiana University Kokomo (Indiana).
Mr. Marchionne also holds the honor of Cavaliere del Lavoro.
Andrea Agnelli
(non-executive director)
-Andrea Agnelli has been Chairman of Juventus Football Club S.p.A. since May 2010 and is also Chairman of Lamse S.p.A., a holding company of which he is a founding shareholder. Born in Turin in 1975, he studied at Oxford (St. Clare’s International College) and Milan (Università Commerciale Luigi Bocconi). While at university, he gained professional experience both in Italy and abroad, including positions at: Iveco-Ford in London; Piaggio in Milan; Auchan Hypermarché in Lille; Schroder Salomon Smith Barney in London; and, finally, Juventus Football Club S.p.A. in Turin.
Mr. Agnelli began his career in 1999 at Ferrari Idea in Lugano, where he was responsible for promoting and developing the Ferrari brand in non-automotive areas. In November 2000, he moved to Paris and assumed responsibility for marketing at Uni Invest SA, a Banque San Paolo company specialized in managed investment products. Mr. Agnelli worked at Philip Morris International in Lausanne from 2001 to 2004, where he initially had responsibility for marketing and sponsorships and, subsequently, corporate communication. In 2005, Mr. Agnelli returned to Turin to work in strategic development for IFIL Investments S.p.A. (now Exor S.p.A.) and he joined the Board of Directors of IFI S.p.A. (now Exor S.p.A.) in May 2006.
Mr. Agnelli is a general partner of Giovanni Agnelli e C. S.a.p.az. and a member of the advisory board of BlueGem Capital Partners LLP. He is also a member of the European Club Association’s executive board a board member of the Serie A National League of Professionals and a board member of the Foundation for the General Mutuality in Professional Team Sports. In September 2015, he was appointed to the UEFA Executive Committee as an ECA representative. Mr. Agnelli was appointed to the Board of Directors of Fiat S.p.A. on May 30, 2004 and became a member of the Board of Directors of FCA on October 12, 2014.
Tiberto Brandolini d’Adda (non-executive director
)-Born in Lausanne, Switzerland in 1948, Tiberto Brandolini d’Adda is a graduate in commercial law from the University of Parma. From 1972 to 1974, Mr. Brandolini d’Adda gained his initial work experience in the international department of Fiat S.p.A. and then at Lazard Bank in London. In 1975, he was appointed assistant to the Director General for Enterprise Policy at the European Economic Commission in Brussels. He joined Ifint in 1976, as General Manager for France. In 1985, he was appointed General Manager for Europe and then in 1993 Managing Director of Exor Group (formerly Ifint), where he also served as Vice Chairman from 2003 until 2007. He has extensive international experience as a main Board Director of several companies, including: Le Continent, Bolloré Investissement, Société Foncière Lyonnaise, Safic-Alcan and Chateau Margaux.
105
Mr. Brandolini d’Adda served as Director and, from 1997 to 2003, as Chairman of the conseil de surveillance of Club Mediterranée. He served as Vice Chairman of Exor S.p.A., formed through the merger between IFI and IFIL Investments, from 2009 until becoming Honorary Chairman in 2015. He was also a Director of SGS (Société Générale de Surveillance S.A.) from March 2005 to 2010. In May 2004, he was appointed Chairman of the conseil de surveillance of Worms & Cie, where he had served as Deputy Chairman since 2000. In May 2005, he became Chairman and Chief Executive Officer of Sequana Capital (formerly Worms & Cie). Mr. Brandolini d’Adda currently serves as Chairman of Exor S.A. (Luxembourg) and is also a member of the Board of Directors of YAFA S.p.A. In addition, since 2015 he has been an independent Board member of Gottex Fund Management Holing Limited. He is General Partner of Giovanni Agnelli & C. S.a.p.az. Mr Brandolini d’Adda is Officier de la Légion d’Honneur. Mr Brandolini d’Adda was appointed to the Board of Directors of Fiat S.p.A. on May 30, 2004 and became a member of the Board of Directors of FCA on October 12, 2014.
Glenn Earle
(non-executive director)
-Glenn Earle is a member of the Board of Directors of Affiliated Managers Group, Inc. and of Rothesay Life Group and a non-executive member of the Advisory Committee of Hayfin Capital Management LLP. Mr Earle is also Deputy Chairman of educational charity Teach First and a Board Member and Trustee of the Royal National Theatre. Mr. Earle retired in December 2011 from Goldman Sachs International, where he was most recently a Managing Director and the Chief Operating Officer. Mr. Earle was also Chief Executive of Goldman Sachs International Bank and his other responsibilities included co-Chairmanship of the firm's Global Commitments and Capital Committees and membership on the Goldman Sachs International Executive Committee. He previously worked at Goldman Sachs in various roles in New York, Frankfurt and London from 1987, becoming a Partner in 1996. From 1979 to 1985, he worked in the Latin America department at Grindlays Bank/ANZ in London and New York, leaving as a Vice President.
Mr. Earle is a graduate of Emmanuel College, Cambridge and of Harvard Business School, where he earned an MBA with High Distinction and was a Baker Scholar and Loeb, Rhoades Fellow. His other activities include membership of The Higher Education Commission and the Advisory Board of the Sutton Trust. His previous responsibilities include membership of the Board of Trustees of the Goldman Sachs Foundation and of the Ministerial Task Force for Gifted and Talented Youth and Chairmanship of the Advisory Board of Cambridge University Judge Business School. Mr Earle was appointed to the Board of Directors of Fiat S.p.A. in June 2014 and became a member of the Board of Directors of FCA in October 2014.
Valerie Mars
(non-executive director)
-Valerie Mars serves as Senior Vice President & Head of Corporate Development for Mars, Incorporated, a $35 billion diversified food business, operating in over 120 countries and one of the largest privately held companies in the world. In this position, she focuses on acquisitions, joint ventures and divestitures for the company. She served on the Mars, Incorporated Audit Committee, currently serves on its Remuneration Committee and is a member of the board of Royal Canin.
Additionally, Ms. Mars is a member of the Rabobank North American Advisory Board . She served on the board of Celebrity Inc., a NASDAQ listed company, from 1994 to September 2000. Previously, Ms. Mars was the Director of Corporate Development for Masterfoods Europe. Her European work experience began in 1996 when she became General Manager of Masterfoods Czech and Slovak Republics. Ms. Mars joined M&M/Mars on a part time basis in 1992 and began working on special projects. She worked on due diligence for acquisitions, was part of the company’s Innovation Team and VO2Max Team. Prior to joining Mars, Incorporated, Ms. Mars was a controller with Whitman Heffernan Rhein, a boutique investment company. She began her career with Manufacturers Hanover Trust Company as a training program participant and rose to Assistant Secretary. Ms. Mars is involved in a number of community and educational organizations and currently serves on the Board of Conservation International, including its Audit Committee. She is also Director Emeritus of The Open Space Institute. Previously she served on the Hotchkiss School Alumni Nominating Committee and the Prague American Chamber of Commerce Board.
Ms. Mars holds a Bachelor of Arts degree from Yale University and a Master of Business Administration from the Columbia Business School.
Ms. Mars was appointed to the Board of Directors of FCA in October 2014.
Ruth J. Simmons (non-executive director
)- Ruth J. Simmons served on the Board of Directors of FCA US from 2012 to 2014. She was also President of Brown University from 2001 to 2012, Professor in the Department of Comparative Literature and the Department of African Studies of Brown University from 2001 to 2014, and remains with the university as President Emerita.
106
Prior to joining Brown University, Ms. Simmons was President of Smith College, where she started the first engineering program at a U.S. women’s college. She also was Vice Provost at Princeton University and Provost at Spelman College and held various positions of increasing responsibility until becoming Associate Dean of the faculty at Princeton University. Ms. Simmons was previously Assistant Dean and then Associate Dean at the University of Southern California. She also held various positions including Acting Director of international programs at the California State University (Northridge), was Assistant Dean at the College of Liberal Arts, Assistant Professor of French at the University of New Orleans, Admissions Officer at Radcliffe College, instructor in French at the George Washington University and an interpreter-Language Services Division at the U.S. Department of State.
Ms. Simmons also serves on the boards of Rice University, Princeton University, Texas Instruments and Square Inc, and Mondelez International Inc.
Ms. Simmons is a graduate of Dillard University in New Orleans, and received her Ph.D. in Romance languages and literatures from Harvard University. She is a Fellow of the American Academy of Arts and Sciences and a member of the Council on Foreign Relations.
Ms. Simmons was appointed to the Board of Directors of FCA in October 2014.
Ronald L. Thompson
(non-executive director)
-Ronald L. Thompson served on the Board of Directors of FCA US from 2009 9to 2014. Mr. Thompson is currently chairman of the board of trustees for Teachers Insurance and Annuity Association (TIAA), a for-profit life insurance company that serves the retirement and financial needs of faculty and employees of colleges and universities, hospitals, cultural institutions and other nonprofit organizations. He also serves on the Board of Trustees for Washington University in St. Louis, Mo., on the Board of Trustees of the Medical University of South Carolina Foundation, and as a member of the Advisory Board of Plymouth Venture Partners Fund.
Mr. Thompson was previously the Chief Executive Officer and Chairman of Midwest Stamping Company of Maumee, Ohio, a manufacturer of medium and heavy gauge metal components for the automotive market. He sold the company in late 2005. Mr. Thompson has served on the boards of various companies including Commerce Bank of St. Louis, GR Group (U.S.), Illinova Corporation, Interstate Bakeries Corporation, McDonnell Douglas Corporation, Midwest Stamping Company, Ralston Purina Company and Ryerson Tull, Inc. He was also a member of the Board of Directors of the National Association of Manufacturers. He was Chairman and Chief Executive Officer at GR Group, General Manager at Puget Sound Pet Supply Company and Chairman and Chief Executive Officer at Evaluation Technologies. Mr. Thompson has served on the faculties of Old Dominion University, Virginia State University and the University of Michigan.
Mr. Thompson holds a Ph.D. and Master of Science in Agricultural Economics from Michigan State University and a Bachelor of Business Administration from the University of Michigan. He was born in Michigan.
Mr. Thompson was appointed Senior Non-Executive Director of FCA in October 2014.
Patience Wheatcroft
(non-executive director)
-Patience Wheatcroft is a British national and graduate in law from the University of Birmingham. She has been a member of the House of Lords since 2011 and is a financial commentator and journalist. Ms. Wheatcroft currently serves on the Advisory Board of the public relations company Bell Pottinger LLP. She also serves as Non-executive Director of the wealth management company St. James’s Place PLC. Ms. Wheatcroft has a broad range of experience in the media and corporate world with past positions at the Wall Street Journal Europe, where she was Editor-in-Chief, The Sunday Telegraph, The Times, Mail on Sunday, as well as serving as Non-executive Director of Barclays Group PLC and Shaftesbury PLC.
Finally Ms. Wheatcroft is also on the Board of Trustees of the British Museum. She was appointed to the Board of Directors of Fiat S.p.A. in April 2012 and became a member of the Board of Directors of FCA in October 2014.
Stephen M. Wolf
(non-executive director
)-Stephen M. Wolf served on the Board of Directors of FCA US from 2009 to 2014. Mr. Wolf served as Chairman of R. R. Donnelley & Sons Company, a full service provider of print and related services from 2004 to 2013. He has served as the Managing Partner of Alpilles LLC since 2003.
107
Previously, Mr. Wolf was Chairman of US Airways Group Inc. and US Airways Inc. He was Chairman and Chief Executive Officer of US Airways from 1996 until 1998. Prior to joining US Airways, Mr. Wolf had served since 1994 as Senior Advisor to the investment banking firm, Lazard Frères & Co. From 1987 to 1994, he served as Chairman and CEO of UAL Corporation and United Airlines Inc.
Mr. Wolf’s career in the aviation industry began in 1966 with American Airlines, where he rose to the position of Vice President. He joined Pan American World Airways as a Senior Vice President in 1981 and became President and Chief Operating Officer of Continental Airlines in 1982. In 1984, Mr. Wolf became President and CEO of Republic Airlines, where he served until 1986 at which time he orchestrated the company’s merger with Northwest Airlines. Thereafter, Mr. Wolf served as Chairman and Chief Executive Officer of Tiger International, Inc. and The Flying Tiger Line, Inc. where he oversaw the sale of the company to Federal Express.
Mr. Wolf serves as a member of the Board of Directors of Philip Morris International and as Chairman of the Advisory Board of Trilantic Capital Partners, previously Lehman Brothers Merchant Banking. Mr. Wolf previously served as Chairman of Lehman Brothers Private Equity Advisory Board.
Mr. Wolf is an Honorary Trustee of The Brookings Institution. He holds a Bachelor of Arts degree in Sociology from San Francisco State University.
Mr. Wolf was appointed to the Board of Directors of FCA in October 2014.
Ermenegildo Zegna (non-executive director
)-Ermenegildo Zegna has been Chief Executive Officer of the Ermenegildo Zegna Group since 1997, having served on the board since 1989. Previously, he held senior executive positions within the Zegna Group including the U.S., after a retail experience at Bloomingdale’s, New York. He is also a member of the International Advisory Board of IESE Business School of Navarra; he is board member of the Camera Nazionale della Moda Italiana and of the Council for the United States and Italy. In 2011 he was nominated Cavaliere del Lavoro by the President of the Italian Republic.
Zegna, the standard of excellence for the entire luxury fashion industry, is a vertically integrated company that covers sourcing wool at the markets of origin, manufacturing, marketing right through directly operated stores. Under the guidance of the fourth generation, the group expanded its network to 523 stores, of which 303 are fully owned, in over 100 countries. In 2015, Zegna reached consolidated sales of 1,260 billion euro, achieving global leadership in men’s luxury wear.
A graduate in economics from the University of London, Mr. Zegna also studied at the Harvard Business School.
Mr. Zegna was appointed to the Board of Directors of FCA in October 2014.
The Group’s management consists of a Group Executive Council (“GEC”) led by FCA’s Chief Executive Officer. The members of the GEC are:
|
•
|
Sergio Marchionne as Chief Executive Officer, FCA N.V., Chairman and Chief Executive Officer of both FCA US LLC and FCA Italy S.p.A., and Chief Operating Officer of NAFTA;
|
|
•
|
Alfredo Altavilla as Chief Operating Officer Europe, Africa and Middle East (EMEA) and Head of Business Development;
|
|
•
|
Stefan Ketter as Chief Operating Officer Latin America and Chief Manufacturing Officer;
|
|
•
|
Michael Manley as Chief Operating Officer APAC, Head of Jeep Brand and Head of Ram Brand;
|
|
•
|
Richard K. Palmer as Chief Financial Officer and Chief Operating Officer Systems and Castings effective January 1, 2016;
|
|
•
|
Pietro Gorlier as Chief Operating Officer Components and Head of Parts & Service (MOPAR);
|
|
•
|
Olivier François as Chief Marketing Officer and Head of Fiat Brand;
|
|
•
|
Harald J. Wester as Chief Technology Officer and Head of Alfa Romeo and Maserati;
|
108
|
•
|
Reid Bigland as Head of NAFTA Sales and Alfa Romeo and Head of NAFTA Fleet;
|
|
•
|
Timothy Kuniskis as Head of NAFTA Passenger Car Brands;
|
|
•
|
Ralph V. Gilles as Head of Design;
|
|
•
|
Scott R. Garberding as Head of Group Purchasing;
|
|
•
|
Robert (Bob) Lee as Head of Powertrain Coordination;
|
|
•
|
Mark M. Chernoby as Chief Operating Officer Product Development, Head of Product Portfolio Management and Head of Quality;
|
|
•
|
Linda I. Knoll as Chief Human Resources Officer;
|
|
•
|
Alessandro Baldi as Chief Audit Officer and Sustainability; and
|
|
•
|
Michael J. Keegan as GEC Coordinator.
|
Summary biographies for the persons who are currently members of the GEC are included below. For the biography of Mr. Marchionne, see above.
Alfredo Altavilla
-Alfredo Altavilla was appointed Chief Operating Officer Europe, Africa and Middle East (EMEA) on November 12, 2012. He has also been a member of the GEC and Head of Business Development since September 1, 2011.
Mr. Altavilla began his career as an assistant at Università Cattolica, Milan. In 1990, he joined Fiat Auto, where he initially focused on international ventures in the area of strategic planning and product development. In 1995, he was appointed head of Fiat Auto’s Beijing office and in 1999 head of Asian Operations. Mr. Altavilla has been involved in Business Development since 2001, becoming responsible for coordination of the alliance with General Motors in 2002 and, in 2004, being assigned responsibility for management of all alliances. In September 2004, he was appointed Chairman of FGP (Fiat/GM Powertrain JV) and Senior Vice President of Business Development of Fiat Auto. In July 2005, he became Chief Executive Officer of Türk Otomobil Fabrikasil A.S. (TOFAS) - a 50-50 joint venture between Fiat Auto and Koç Holding listed on the Istanbul stock exchange - while retaining his role as head of Business Development. In November 2006, Mr. Altavilla was named Chief Executive Officer of FPT - Fiat Powertrain Technologies. He became a member of the Board of Directors of FCA US in July 2009 and in October 2009 was named Executive Vice President of Business Development for Fiat Group. From November 2010 to November 2012, Mr. Altavilla was President and Chief Executive Officer of Iveco. He was a member of the Fiat Industrial Executive Council (FIEC) from January 2011 to November 2012. Mr. Altavilla holds a degree in Economics from Università Cattolica, Milan. He was born in Taranto, Italy.
Stefan Ketter
- Stefan Ketter was appointed Chief Operating Officer Latin America (LATAM) in October 2015. He has also been a member of the GEC and Chief Manufacturing Officer since September 2011. Mr. Ketter was appointed Chief Manufacturing Officer of the Fiat Group in January 2008. Mr. Ketter entered BMW Munich in 1986 as a trainee and held positions of growing responsibility in the technical area until 1996, when he was appointed Quality Manager. In 1996 Mr. Ketter joined AUDI and, in 1997, he became Quality Director of America Latina VW Group. In this framework, he was charged with the set-up of a new plant in Brazil for export to the U.S. In 2002, Mr. Ketter was assigned responsibility for Quality & Service of Volkswagen of America, where he integrated Group activities and regional operations. In 2004, he was named head of Quality at Fiat Group Automobiles, and in 2005 took over responsibility for Manufacturing. In addition to this position, in 2006 Mr. Ketter took on responsibility for coordinating implementation of WCM for the Fiat Group. Mr. Ketter was born in Sao Paulo, Brazil. He has a degree in Mechanical Engineering at the Technical University of Munich and has taken Business Management courses at Insead in France.
109
Michael Manley
- Michael. Manley was appointed Head of Ram Brand in October 2015. He was also appointed Chief Operating Officer Asia (APAC), Head of Jeep Brand and member of the GEC in September 2011. Mr. Manley was also appointed President and Chief Executive Officer-Jeep Brand, FCA USin June 2009. He was also the lead FCA US executive for the international activities of FCA US outside of NAFTA where he was responsible for implementing the co-operation agreements for distribution of FCA US products through Fiat’s international distribution network. Previously, Mr. Manley was Executive Vice President-International Sales and Global Product Planning Operations beginning in December 2008. In this position, he was responsible for product planning and all sales activities outside North America. Mr. Manley joined DaimlerChrysler in 2000 as Director-Network Development, DaimlerChrysler United Kingdom, Ltd., bringing with him extensive experience in the international automobile business at the distributor level. He holds a Master of Business Administration from Ashridge Management College.
Richard K. Palmer
- Richard K. Palmer was appointed Chief Financial Officer and a member of the GEC in September 2011. He was also named Chief Operating Officer Systems and Castings, effective January 2016. Mr. Palmer has also been Chief Financial Officer of FCA US since June 2009, where he remains responsible for all FCA US finance activities including corporate controlling, treasury and tax.
Mr. Palmer joined FCA US from the former Fiat Group Automobiles S.p.A., where he held the position of Chief Financial Officer beginning in December 2006. In 2003, he joined the Fiat Group as Chief Financial Officer of Comau, and in 2005, moved to Iveco in the same role. Prior to that appointment, he was Finance Manager for several business units at General Electric Oil and Gas. Mr. Palmer spent the first years of his career in Audit with Pricewaterhouse and later with United Technologies Corporation. Mr. Palmer has served as a member of the Board of directors of R. R. Donnelley & Sons Company since 2013.
Mr. Palmer is a Chartered Accountant and member of ICAEW (UK) and holds a Bachelor of Science degree in Microbiology from the University of Warwick (UK). Mr. Palmer was born in Keynsham, England.
Pietro Gorlier
-Pietro Gorlier was appointed Chief Operating Officer Components on June 30, 2015. He has also been a member of the GEC and Head of Parts & Service - MOPAR since September 2011. Mr. Gorlier was appointed President and Chief Executive Officer - MOPAR Brand Service, Parts and Customer Care, Chrysler Group LLC, in June 2009. He had shared accountability with the brands, responsible for parts and services growth and delivery, and an integrated world class approach to customer support. He joined Chrysler Group from Fiat Group Automobiles S.p.A. and CNH Global N.V., where he previously served as head of the Network and Owned Dealerships organization. Mr. Gorlier joined the Fiat Group in 1989 as a Market Analyst in Iveco and held various positions in Logistics, After Sales, and Customer Care before joining Fiat Group Automobiles in 2006 in Network Development. He holds a Master of Economics from the University of Turin. Mr. Gorlier was born in Turin, Italy
Olivier François
-Olivier François was appointed Head of Fiat brand and Chief Marketing Officer and named a member of the GEC in September 2011. Previously, Mr. François was appointed President and Chief Executive Officer for the Chrysler brand in October 2009. He joined the company from Fiat Group Automobiles, where he was President and Chief Executive Officer for the Lancia brand. He was also the lead marketing executive at Chrysler Group with responsibility for marketing strategies, brand development and advertising for the Chrysler Group and Fiat Group Automobiles brands. He has been the lead executive for Fiat Group Automobiles’ Lancia brand since September 2005. To enhance the effectiveness of Fiat Group Automobiles and further strengthen synergies within the company, from January 2009 to March 2013 he was head of Brand Marketing Communication with responsibility for coordinating communication activities for all brands. Before joining Fiat in 2005, Mr. François worked in positions of increasing responsibility at Citroën.
Mr. François holds a degree in Economy, Finance and Marketing from Dauphine University and a diploma from the IEP (Institute des Sciences Politiques) in Paris. He was born in Paris, France.
Harald J. Wester
-Harald J. Wester was appointed Chief Technology Officer and Head of Alfa Romeo, Abarth (until 2013) and Maserati and named a member of the GEC in September 2011. He was appointed Chief Technology Officer for Fiat Group in September 2007. In addition to this role, in August 2008 he was appointed Chief Executive Officer of Maserati S.p.A., in January 2009 Chief Executive Officer of Abarth & C. S.p.A. and in January 2010 Chief Executive Officer of Alfa Romeo Automobiles. Mr. Wester started his professional career at Volkswagen AG in Wolfsburg, where he was General Manager of the Vehicle Research & New Concepts department from 1991 to 1995. Later that year, he joined Audi AG in Ingolstadt where he became Program Manager for the A2 models & Special Vehicles, a position that he held until January 1999. Subsequently, he joined Ferrari S.p.A. at Maranello as Director of Product Development, where he remained until
110
January 2002. Mr. Wester was then hired by Magna Steyr AG, Magna AG (Graz, Vienna) as Group President Engineering and Chief Technical Officer (Research, Development and Technologies). In 2004 he joined the Fiat Group where he took on the role of Chief Technical Officer of Fiat Group Automobiles. Mr. Wester was born in Linz am Rhein, Germany. He obtained a Masters in Mechanical Engineering from Braunschweig University.
Reid Bigland
-Reid Bigland was appointed Head of NAFTA Fleet in October 2015. He remains Head of Alfa Romeo brand for the NAFTA region, a role he assumed in August 2014. Mr. Bigland was named a member of the GEC in September 1, 2011. He also remains Chairman, President and Chief Executive Officer, FCA Canada, Inc., a position he was named to in July 2006. In addition, Mr. Bigland continues as Head of U.S. Sales, a position he was named to in June 2011, with full responsibility for sales strategy, dealer relations and operations, order facilitation, incentives and field operations. Prior to Mr. Bigland’s current roles, he was President and CEO of the Ram Truck brand and President and CEO of the Dodge brand. He also served as President of Freightliner Custom Chassis Corporation, a South Carolina-based company. Mr. Bigland has served on the Board of Directors of the University of Windsor since 2006. He received a Bachelor of Arts from the University of British Columbia. Mr. Bigland holds both American and Canadian citizenship.
Timothy Kuniskis
-Timothy Kuniskis was appointed Head of NAFTA Passenger Car brands and member of the GEC in October 2015. In this role, he is responsible for the Chrysler, Dodge, SRT and Fiat brands for FCA North America. Previously, Mr. Kuniskis was President and CEO - Dodge and SRT brands, FCA North America, a role he assumed in April 2013. In addition, he served as the Head of Fiat brand for North America. Mr. Kuniskis joined the former Chrysler Corporation in 1992 and since then has held a series of positions of increasing responsibility in the Company’s business center operations and marketing organization. Mr. Kuniskis holds a Bachelor of Business Administration degree from State University of New York (1991).
Ralph V. Gilles-
Ralph V. Gilles was appointed Head of Design and named a member of the GEC in April 2015. Mr. Gilles has led the FCA - North America Product Design Office as Senior Vice President since June 2009. Mr. Gilles has also served as President and Chief Executive Officer - Motorsports; President and Chief Executive Officer - SRT Brand and President and Chief Executive Officer - Dodge Brand for FCA US. He was named Vice President - Design in September 2008. Previously, in 2006, he was Vice President - Interior Design Jeep/Truck and Specialty Vehicles. He joined Chrysler Corporation in 1992, within the Design Office. Mr. Gilles is the executive sponsor of the Chrysler African American Network (CAAN). He also serves on the board of McLaren Oakland in Pontiac, Michigan. At his alma mater, The College for Creative Studies (CCS) in Detroit, Gilles serves on The CCS Board of Trustees and The CCS Capital Committee. Mr. Gilles has earned numerous academic and industry awards and holds a Master of Business Administration from Michigan State University (2002) and a Bachelor of Fine Arts in Industrial Design from the College for Creative Studies in Detroit (1992). He was born in New York City.
Scott R. Garberding
-Scott R. Garberding was appointed Head of Group Purchasing and named a member of the GEC in September 2013. In December 2009 he was appointed Senior Vice President of Manufacturing/World Class Manufacturing, FCA US. In this position, he was responsible for all assembly, stamping, and powertrain manufacturing operations worldwide as well as implementation of the World Class Manufacturing system at all FCA US manufacturing facilities. Previously he was Head of Manufacturing/World Class Manufacturing, FCA US, an appointment he received in 2009. Prior to that, he was Senior Vice President and Chief Procurement Officer, FCA US since June 2009. He also held the position of Senior Vice President and Chief Procurement Officer, FCA US since June 2009. He also held the position of Senior Vice President and Chief Procurement Officer, FCA US since 2008, with responsibility for all global sourcing activities worldwide. He previously served as Vice President - Global Alliance Operations in 2008 and prior to that as Vice President - Supply and Supplier Quality, Chrysler LLC beginning in 2007. Mr. Garberding joined Chrysler Corporation in 1993 in the Manufacturing organization. Mr. Garberding earned a Bachelor of Science degree in Electrical Engineering from the University of Texas and a Master of Business Administration degree in Management from the Massachusetts Institute of Technology. He was born in Oak Park, Illinois.
111
Robert (Bob) Lee
-Robert (Bob) Lee was appointed Head of Powertrain Coordination and named a member of the GEC in September 2011. He was appointed Vice President and Head of Engine and Electrified Propulsion Engineering, FCA US in July 2011, with responsibility for directing the design, development and release of all engines and electrified propulsion systems for Chrysler Group LLC products. Mr. Lee joined the company in 1978 as an engineer-in-training in the Chrysler Institute of Engineering program and has since held a variety of positions in different areas of Powertrain. He has been an active member of the Society of Automotive Engineers (SAE) since 1978 and is a founding member of the SAE North American International Powertrain Conference Leadership Team where he served as the 2007 NAIPC Conference Chairman. Mr. Lee is known for leading many new engine programs including the rebirth of the iconic HEMI V-8 engine in 2003 and the new Pentastar V-6 engine in 2010. Mr. Lee holds a Master of Business Administration degree from Michigan State University, a Master of Science degree in Mechanical Engineering from the University of Michigan and a Bachelor of Science degree in Mechanical Engineering from Ohio State University.
Mark M. Chernoby
-Mark M. Chernoby was appointed Head of Quality in October 2014. In addition, Chernoby will remain a member of the GEC in his roles as Chief Operating Officer Product Development (since August 2014) and Head of Product Portfolio Management. He was appointed to the GEC on September 1, 2011. Prior to his current role, Mr. Chernoby was Senior Vice President of Engineering, Chrysler Group LLC, Product Committee Coordinator for the NAFTA Region and Head of Vehicle Engineering, Chrysler Group LLC. Since joining Chrysler Corporation in 1985 as a powertrain engineer, Mr. Chernoby has made use of his experience in focused component engineering, advanced vehicle programs and vehicle homologation for Chrysler, Jeep and Dodge products. In 2005, Mr. Chernoby was elected chair for the SAE Technical Standards Board, and in 2007, he served as a member of the Hydrogen Technology Advisory Committee reporting to the U.S. Secretary of Energy. He holds a master’s degree in business administration from the University of Michigan and a master’s degree in mechanical engineering from the University of Michigan. His studies began with a bachelor’s degree in mechanical engineering from Michigan State University. Mr. Chernoby was born in Bay City, Michigan.
Linda I. Knoll
- Linda Knoll is Chief Human Resources Officer and, since September 2011, a member of the GEC. She is responsible for providing leadership and company-wide oversight for the Human Resources function, including organizational development, talent management, compensation and benefits, employee relations, and compliance and staffing. Ms. Knoll has concurrently held the same positions at CNHI respectively since 2007 and 2005.
Ms. Knoll honed her career in the predecessor companies to FCA and CNHI through numerous operational assignments, accumulating a wealth of relevant industrial industry experience spanning more than 20 years. This ultimately culminated in a variety of leadership appointments, including Vice President and General Manager of the Crop Production Global Product Line, Vice President North America Agricultural Industrial Operations, Executive Vice President Agricultural Product Development, President Parts and Service (ad interim) and Executive Vice President Worldwide Agricultural Manufacturing, where she was responsible for overseeing twenty-two factories in ten countries around the world.
Prior to joining CNHI in 1994, Ms. Knoll spent eleven years with the Land Systems Division of General Dynamics Corporation in Sterling Heights, Michigan.
Ms. Knoll holds a Bachelor of Science Degree in Business Administration from Central Michigan University. She is a past board member of the National Association of Manufacturers (NAM) and in May 2014, was appointed an Independent Director on the Board of Schneider Electric S.E.
Alessandro Baldi
-Alessandro Baldi was named Head of Audit and Compliance in February 2013. He also coordinates the Group’s sustainability initiative. He began his professional career in 1981 as an auditor at Ernst & Young in Zurich, and subsequently became Senior Manager. In 1989, he joined the Internal Audit department at Alusuisse Lonza in Zurich (Algroup), and later became head of the department. In 1994, he was appointed Group Controller at Algroup. In 1997, Mr. Baldi became Chief Financial Officer of Algroup’s Aluminum Sector and the following year resumed his previous role as Group Controller. In 1999, he was appointed Group Controller for Lonza Group, the company formed through the demerger of the chemical and energy businesses of Algroup. In 2002, he moved to Société Générale Services (SGS) in Geneva to serve as Group Controller. Mr. Baldi was Head of Fiat Group Control from August 2004 to August 2011 and Head of Fiat Services & Holdings from September 2011 to January 2013. He was also GEC Coordinator. He was born in Prato Leventina, Switzerland and is a Swiss Chartered Accountant.
112
Michael J. Keegan
-Michael J. Keegan was appointed GEC Coordinator and named a member of the GEC in October 2013. He was also appointed Senior Vice President-Human Resources, FCA US effective in January 2014. From 2009 through 2013 he was Senior Vice President Supply Chain Management in FCA US . In this position he was been responsible for the critical volume planning and logistics functions in close coordination with the Brand Chief Executive Officers, establishing consistent and effective supply chain processes. Previously, Mr. Keegan was Volume Planning and Sales Operations Vice President. Mr. Keegan was also appointed Corporate Sustainability Officer for FCA US in November 2012. In this role, Mr. Keegan leads FCA US’s activities with respect to sustainable development, encompassing the areas of economic success, environmental stewardship, and social responsibility. Since joining Chrysler Corporation in 1990 as a Finance Controller, Mr. Keegan has made use of his experience in Sales & Marketing controlling, Strategic Planning and Post Demerger Integration from 1998 to 2006. Previously, he held various roles in the Finance department. Mr. Keegan earned a Bachelor of Business Administration degree in Accounting from the University of Michigan. He also earned a Master of Business Administration degree in Finance from Indiana University. Mr. Keegan was born in Pontiac, Michigan.
B. Compensation
REMUNERATION REPORT FOR EXECUTIVE DIRECTORS
The quality of our leadership and their commitment to the Company are fundamental to our success. FCA’s remuneration principles support our business strategy and growth objectives in a diverse and evolving global market. Our Remuneration Policy is designed to reward competitively the achievement of long-term sustainable performance and to attract, motivate and retain highly qualified executives who are committed to performing their roles in the long-term interest of our shareholders. Given the changing international standards regarding responsible and sound remuneration, a variety of factors are taken into consideration, such as the complexity of functions, the scope of responsibilities, the alignment of risks and rewards, national and international legislation and the long-term objectives of the Company and its shareholders. Our Remuneration Policy is reviewed annually by our Compensation Committee of the Board of Directors (the “Compensation Committee”).
REMUNERATION POLICY AVAILABLE ON OUR WEBSITE
The Non-Executive Directors of the Board determine the compensation for Executive Directors with reference to the Company’s Remuneration Policy for Executive Directors (the “Policy”) based on recommendations of the Compensation Committee. The Executive Directors’ Compensation is based on the remuneration policies adopted in the past by the Company (and its predecessors) as aligned with Dutch law and the Dutch Corporate Governance Code. At the 2015 Annual General Meeting of Shareholders (“AGM”), our shareholders approved the Company’s Remuneration Policy, which we presented for the first time as a merged, Netherlands incorporated entity, Fiat Chrysler Automobiles N.V. (“FCA”). Our Remuneration Policy is available in full on the Company’s website,
www.fcagroup.com
, found in the 2014 Annual Report.
The Compensation Committee reviews the Remuneration Policy versus its implementation, and its outcome versus actual performance. The Committee concluded that there were no reasons to recommend adjustments to the Policy at the 2016 AGM. However, to reflect the compensation decisions made for 2015 by the Compensation Committee, we are providing supporting information in the Remuneration Report table along with contextual discussion where necessary.
FINANCIAL YEAR 2015 - SELECT BUSINESS HIGHLIGHTS
A key tenet of the Policy is pay for performance. With regard to 2015 performance, the Company’s 2015 financial results exceeded the Company's guidance. To provide perspective of the Company’s performance during 2015, the following table highlights some of the key achievements and initiatives throughout the year:
113
|
Financial Highlights
|
Strategic Developments and Initiatives
|
|
Worldwide shipments of 4.6 million units; Jeep up 21 percent year-over-year
|
The Ferrari spin-off which improved the Company’s Net industrial debt
|
|
Net revenues increased by 18 percent year-over-year to €110.6 billion
|
Plan to remove US ring-fencing in 2016; major step with prepayment in 2015 of the secured senior notes of FCA US due in 2019 and 2021.
|
|
Adjusted EBIT of €4.8 billion, reflecting a 43 percent increase over 2014, with all segments profitable in the fourth quarter of 2015
|
Realignment of production portfolio to better meet market demand
|
|
€2,026 million of Adjusted net profit (i.e. Net profit excluding unusuals)
|
Key products launched in the year:
•
Jeep Renegade introduced in US, China and Brazil
•
Jeep Cherokee local production started in China
•
New Fiat Tipo compact sedan launched in EMEA
•
Production of New Fiat Toro mid-size pickup truck began at the new Pernambuco plant
|
|
Excluding Ferrari, Net industrial debt was €5.0 billion and total available liquidity was €24.6 billion at December 31, 2015
|
Continued enhancement of risk management, utilizing the Company’s Enterprise Risk Management model
|
As referenced in the above highlights, the Company’s 2015 performance was strong with regard to both actual financial results and strategic initiatives.
Worldwide shipments of 4.6 million units in 2015 reflected the continued global expansion of the Jeep brand, which achieved an all-time record of 1.3 million worldwide shipments.
In 2015, Net revenues increased 18 percent from 2014 to €110.6 billion. Adjusted EBIT increased 43 percent from 2014 to €4.8 billion, with NAFTA more than doubling and EMEA returning to profitability one year ahead of plan. Our Adjusted net profit of €2.0 billion in 2015 was nearly double compared to 2014.
In 2015, Net industrial debt decreased by €2,605 million to €5,049 million at December 31, 2015.
In May 2014, we presented an ambitious 5-year business plan and we have successfully achieved the plan targets in both 2014 and 2015. While there were some changes in trading conditions compared to our plan expectations, notably the negative market in Brazil, we acted quickly and decisively to address these changes and as a result, we have revised upwards our original financial targets in 2018, despite the spin-off of Ferrari.
REMUNERATION PRINCIPLES
The guiding principle of our Remuneration Policy is to provide a compensation structure that allows FCA to attract and retain the most highly qualified executive talent and to motivate such executives to achieve business and financial goals that create value for shareholders in a manner consistent with our core business and leadership values. FCA’s compensation philosophy, as set forth in the Remuneration Policy, aims to provide compensation to its Executive Directors as outlined below.
114
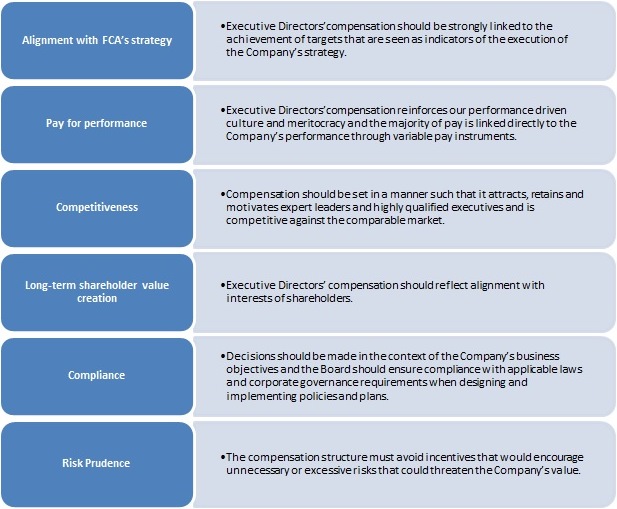
Peer Group Development
In 2014, our Compensation Committee reviewed our potential peer companies, which are companies operating in similar industries with whom we are most likely to exchange talent at the executive level. The Compensation Committee strives to develop a peer group that best reflects all aspects of FCA’s business and considers public listing, industry practices, geographic reach, and revenue proximity. Market cap was considered a secondary characteristic. Peer companies were selected and used to calibrate our executive compensation program. This peer group did not change for 2015.
U.S. Peer Group
This set of peer companies consisted of twenty-five large, U.S.-based public companies operating in a variety of industries excluding financial services. The peer companies had median revenues of €42.7 billion as compared to FCA’s revenue for 2015 of €110.6 billion.
European Peer Group
This set of peer companies was comprised of twenty-one large, public companies operating in the broad, industrial sector with median revenues of €47.5 billion.
115
2015 Compensation Peer Group
|
U.S. Peer Group
|
European Peer Group
|
||
|
General Motors
|
Pfizer
|
Volkswagen
|
Bayer
|
|
Ford
|
Lockheed Martin
|
Daimler
|
ThyssenKrupp
|
|
General Electric
|
Johnson Controls
|
BMW Group
|
Rio Tinto
|
|
Hewlett-Packard
|
Honeywell
|
Siemens
|
Roche
|
|
IBM
|
Deere
|
Nestle
|
Continental
|
|
Boeing
|
General Dynamics
|
BASF
|
LyondellBassell
|
|
Procter & Gamble
|
3M
|
ArcelorMittal
|
Sanofi
|
|
Johnson & Johnson
|
Northrop Grumman
|
Airbus
|
Volvo
|
|
PepsiCo
|
Raytheon
|
Peugeot
|
|
|
United Technologies
|
Xerox
|
Unilever
|
|
|
Dow Chemical
|
Goodyear
|
Novartis
|
|
|
Caterpillar
|
Whirlpool
|
Saint-Gobain
|
|
|
ConocoPhillips
|
Renault
|
||
116
Summary Overview of Remuneration Elements
The Executive Directors’ remuneration is simple and transparent in design, and consists of the following key elements:
|
Remuneration Element
|
Description
|
Strategic Role
|
|
Base Salary
|
Fixed cash compensation
|
Attracts and rewards high performing executives via market competitive pay
|
|
Short-term variable pay*
|
•
Performance objectives are annually predetermined and are based on achievements of specific measures
•
Comprised of three equally-weighted metrics, Adjusted EBIT, Adjusted net profit, and Net industrial debt
•
Target payout is 100 percent and maximum payout is 250 percent of base salary
|
•
Drives company-wide and individual performance
•
Rewards annual performance
•
Motivates executives to achieve performance objectives that are key to our annual operating and strategic plans
•
Aligns executives’ and shareholder interests
|
|
Long-term variable pay*
|
•
All equity awards are based on achievements of 2014-2018 business plan financial targets
•
Performance criteria are comprised of equally weighted metrics, relative Total Shareholder Return (TSR) and Adjusted net profit
•
Awards have three vesting opportunities, one third each, after 2016, 2017 and 2018 based on cumulative results
|
•
Encourages executives to achieve multi-year strategic and financial objectives
•
Motivates executives to deliver sustained long-term growth
•
Aligns executives’ and shareholder interests through long-term value creation
•
Enhances retention of key talent
|
|
Post-Mandate and Pension
|
•
The CEO participates in a company-wide pension scheme and a supplemental retirement benefit
•
Both the CEO and Chairman have post-mandate benefits in an amount equal to five times their last annual base compensation
|
Provides security and productivity
|
|
Other benefits
|
Executive Directors may receive typical benefits such as a company car, medical insurance, accident and disability insurance, tax preparation, financial counseling, tax equalization
|
Facilitates strong performance, consistent with offerings of peer group companies
|
*The Chairman receives fixed compensation only and is not eligible for any variable compensation.
2015 REMUNERATION OF EXECUTIVE DIRECTORS
Our executive compensation program is designed to align the interests of our Executive Directors with those of our shareholders to ensure prudent, short-term actions that will benefit the Company’s long-term value. It is designed to reward our executives based on the achievement of sustained financial and operating performance as well as demonstrated leadership. We aim to attract, engage, and retain high-performing executives who help us achieve immediate and future success and maintain our position as an industry leader. We support a shared, one-company mindset of performance and accountability to deliver on business objectives.
In 2015, our CEO’s compensation consisted of both fixed and variable pay elements. In keeping with our philosophy of long-term shareholder value creation, the CEO’s total pay mix for 2015 included a significant percentage of at-risk performance based compensation. For 2015, 86 percent of the CEO’s compensation was at-risk performance based incentive compensation. The Chairman is not eligible for variable compensation.
117

Fixed Component
Base salary is the only fixed component of our Executive Directors’ total cash compensation and is intended to provide market-competitive pay to attract and retain well qualified senior executives and expert leaders. Base salary is based on the individual’s skills, scope of job responsibilities, experience, individual performance and competitive market data. The base salaries of our Executive Directors are evaluated together with other components of compensation to ensure that they are in line with our overall compensation philosophy and are aligned with performance.
With FCA’s formation in October 2014, a new annual base salary of U.S.$4.0 million for our CEO and a new annual base salary of U.S.$2.0 million for our Chairman were approved. This decision was reached using the compensation program benchmarking and peer group review process described above. The Company believes that paying our Executive Directors at or above these benchmarks is appropriate to retain them throughout the business cycle.
2015 Base Salary
The Company does not guarantee annual base salary increases and the base salary did not change in 2015 for either of the Executive Directors.
Variable Components
The CEO is eligible to receive short-term variable compensation, subject to the achievement of pre-established, challenging economic and financial performance targets. The variable components of the CEO’s remuneration, both short and long-term, are linked to predetermined, measurable objectives which serve to motivate strong performance and shareholder returns and are approved by the Company’s Non-Executive Directors. The Non-Executive Directors believe that placing significantly more weight on the long-term component is appropriate for the CEO position because it focuses efforts on the Company’s long-term objectives in addition to being retentive.
Analysis of different scenarios are carried out on an annual basis to examine the relationship between the performance criteria chosen and the possible outcomes of the variable remuneration of the Executive Directors. The analysis conducted for 2015 demonstrated that the Company continued to maintain a strong link between financial and operational performance and remuneration, that the performance criteria selected for both the short-term and long term incentive components of total remuneration are appropriate, and that the performance criteria also support the Company’s near and long term strategic objectives.
118
|
OUR COMPENSATION PHILOSOPHY IS DESIGNED TO REWARD
PERFORMANCE AND LEADERSHIP
The bonus elements and calculations for the CEO follow the same philosophy as the company-wide Performance and Leadership Bonus Plan for all eligible FCA employees.
|
Short-Term Incentives
The primary objective of short-term variable incentives is to focus on the business priorities for the current year. The CEO’s variable incentive is based on achieving short-term (annual) financial and other designated objectives proposed by the Compensation Committee and approved by the Non-Executive Directors each year.
Our Methodology for Determining Annual Bonus Awards
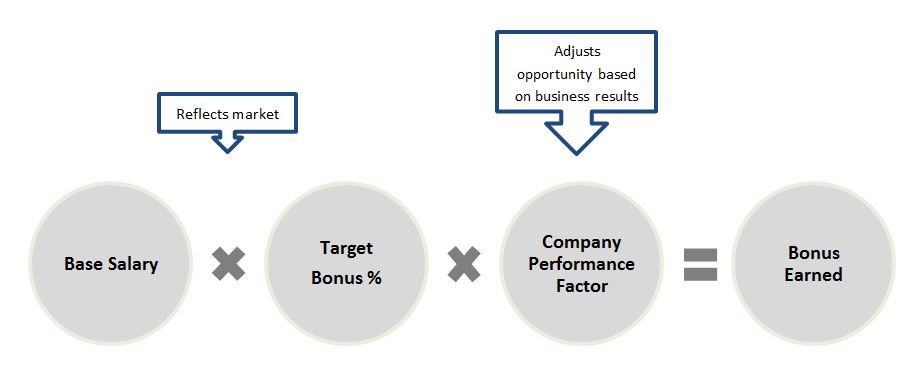
With regard to the determination of the CEO’s annual performance bonus, the Compensation Committee:
|
·
|
approves the objectives and maximum allowable bonus;
|
|
·
|
selects the choice and weighting of objectives;
|
|
·
|
sets the stretch objectives;
|
|
·
|
reviews any unusual items that occurred in the performance year to determine the appropriate overall measurement of achievement of the objectives; and
|
|
·
|
approves the final bonus determination.
|
For 2015, the Compensation Committee decided to replace the first metric, Trading Profit, with Adjusted EBIT to align the corporate metrics used in the performance bonus, with the Company's published guidance. The other two metrics, Adjusted net profit and Net industrial debt, remain unchanged as objectives for the CEO’s bonus plan. The three metrics were equally weighted at one-third each and the goals were set with challenging hurdles. Each objective pays out independently. There is no minimum bonus payout; if none of the threshold objectives are satisfied, there is no payment.
The bonus earned for the CEO for 2015 was U.S.$ 6,856,000, as determined by the achievement and corresponding company performance factors illustrated in the table below:
119
2015 Annual Bonus Program
|
2015 Performance Metric
|
Weight
|
Threshold
(€ millions)
|
Target
(€ millions)
|
Maximum
(€ millions)
|
Company Performance - Actual
(€ millions)
|
|
Weighted Company Performance Factor
|
|
Adjusted EBIT*
|
1/3
|
3,870
|
4,300
|
6,450
|
5,267
|
55.8%
|
|
|
Adjusted net profit**
|
1/3
|
990
|
1,100
|
1,650
|
1,255
|
47.4%
|
|
|
Net industrial debt***
|
1/3
|
(8,525)
|
(7,750)
|
(3,875)
|
(5,049)
|
68.2%
|
|
|
Overall Company Performance Factor:
|
171.4%
|
||||||
|
*Adjusted EBIT is calculated as EBIT excluding gains/losses on the disposal of investments, restructuring, impairments, asset write offs and other unusual income/(expenses) which are considered rare or discrete events that are infrequent in nature. Actual performance includes Ferrari, comparable to the target.
**Adjusted net profit is calculated as Net profit/(loss) excluding post-tax impacts of the same items excluded from Adjusted EBIT: gains/(losses) on the disposal of investments, restructuring, impairments, asset write-offs and other unusual income/(expenses) that are considered rare or discrete events that are infrequent in nature. However, the bonus achievement excludes only certain non-operational unusuals, as deemed appropriate by the Compensation Committee. Actual performance includes Ferrari, comparable to the target.
***Net industrial debt is defined as ending absolute balance.
|
|||||||
The annual bonus target incentive for the CEO is 100 percent of the U.S.$4 million annual base salary, which is below market, based on the average of our U. S. and European peers. This positioning further reinforces the value we place on a longer term perspective. The three performance metrics’ objectives are consistent with the Company's five-year business plan and with the the Company's guidance that is published. Threshold performance for any incentive earned is 90 percent of target; whereas, the upper limit performance to earn a maximum payout of 250 percent of base salary is 150 percent or greater of target. The Compensation Committee reviews results and achievement and presents the results to the Non-Executive Directors, typically in January of each year in connection with the completion of the Company’s year-end earnings release. For 2015, the threshold, target and maximum percentage opportunities for our CEO did not change.
Additionally, the Compensation Committee retains authority to grant periodic cash bonuses for specific transactions that are deemed exceptional in terms of strategic importance and effect on the Company’s results. This authority has not been exercised with respect to the Company’s performance in 2015.
Discussion of 2015 Results
Significant growth and improvement were achieved in 2015 in each of the three key performance criteria linked to the CEO’s annual incentive:
|
•
|
The Company achieved Adjusted EBIT of €5,267 million, including Ferrari, which was an increase of 40 percent over 2014 (excluding Ferrari, Adjusted EBIT was €4,794 million, which reflected a 43 percent increase from 2014).
|
|
•
|
Adjusted net profit increased over 90 percent from 2014 (€2,026 million in 2015 as compared to €1,060 million in 2014). With regard to the CEO’s annual bonus determination, although the authorized objective was to apply adjusted net profit, subsequently Management recommended that it was appropriate to include some of the unusual expenses in operating income, notwithstanding their unusual nature. The Compensation Committee considered Management’s recommendation, and within the confines of the authority granted to them in the Remuneration Policy permitting them to
“review any unusual items that occurred in the performance year to determine the appropriate overall measurement of achievement
”, agreed and took action consistent with Management’s recommendation.
If the full extent of the 2015 unusual items had been excluded, the bonus would have been higher.
|
|
•
|
For the third metric, Net industrial debt, the Company significantly reduced its Net industrial debt from €7.7 billion at December 31, 2014 to €5.0 million at December 31 , 2015. The successful implementation of the strategic
|
120
initiative to spin-off Ferrari helped contribute to the reduction and was deemed appropriate to consider in determining the 2015 performance that links to the CEO’s short-term incentive in 2015.
Long-Term Incentives
Long-term incentive compensation is a critical component of our executive compensation program. This compensation component is designed to motivate and reward long-term stockholder value creation and the attainment of Company performance goals, to retain top talent and create an ownership alignment with shareholders. Long-term incentives are an important retention tool that management and the Compensation Committee use to align the financial interests of executives and other key contributors with sustained shareholder value creation. We believe the compensation for Executive Directors should be aligned with the interests of our shareholders.
FCA’s long-term variable incentives consists of a share-based incentive plan that links a portion of the variable component to the achievement of pre-established performance targets consistent with the Company’s strategic horizon. These awards increase the link between behavior, realized compensation and shareholder interests, by delivering greater value to the CEO as shareholder value increases. Long term incentive awards are intended to motivate our executives to achieve significant returns for our shareholders over the long-term.
Equity Incentive Plan
On October 29, 2014, in connection with the formation of FCA and the presentation of the 2014-2018 business plan, the Board of Directors approved a new Long Term Incentive (“LTI”) program, covering the five year performance period, under the Fiat Chrysler Automobiles N.V. Equity Incentive Plan (“EIP”), consistent with the Company’s strategic horizon and under which equity awards can be granted to eligible individuals. The award vesting under the program is conditional on meeting two independent metrics, Adjusted net profit and Relative TSR weighted equally at target. The awards have three vesting opportunities, one-third after 2014-2016 results, one-third after 2014-2017 results, and the final third after the full 2014-2018 results. The Adjusted net profit component payout begins at 80 percent of target achievement and has a maximum payout at 100 percent of target.
The Relative TSR component has partial vesting if ranked seventh or better among an industry specific peer group of eleven, including the Company, and a maximum pay-out of 150 percent, if ranked first among the eleven peers. Listed below is the Relative TSR peer group.
2014-2018 Performance Cycle Relative TSR Metric Peers
|
Volkswagen AG
|
Toyota Motor
|
Daimler AG
|
General Motors
|
|
Ford Motor
|
Honda Motor
|
BMW AG
|
Hyundai Motor
|
|
PSA Peugeot Citroen
|
Renault SA
|
||
The Company’s target setting process for the incentive plans is built on the foundation of our rigorous business planning process which is determined by the overall business environment, industry and competitive market factors, and Company-wide business goals. Moreover, the targets are in line with the external forward looking guidance that we provide to analysts and investors.
121
Performance Cycle: 2014 - 2018 (Five Year Performance Period)
|
Performance Metric
|
Weight
|
Vesting
|
Threshold Achievement
|
Target Achievement
|
|
Adjusted net profit
|
50%
|
1/3, 1/3, 1/3 after 3,4,5 years’ cumulative results
|
80% of target
|
100% of target
|
|
Relative TSR
|
50%
|
1/3, 1/3, 1/3 after 3,4,5 years’ cumulative results
|
Rank seventh or better among 11 peers
|
Rank fourth among 11 peers
|
Discussion of 2015 Equity Awards
In 2015, the CEO was awarded 4,320,000 Performance Share Units subject to the vesting conditions under the above described LTI program. This grant was approved by Shareholders on April 16, 2015.
In addition, upon proposal of the Compensation Committee, the Non-Executive Directors exercised their authority to grant periodic bonuses for specific transactions that are deemed exceptional in terms of strategic importance and effect on the Company’s results. They granted a bonus to the CEO, who was instrumental in major strategic and financial accomplishments for the Group. Most notably, through the CEO’s vision and guidance, Fiat Chrysler Automobiles NV was formed, creating exceptional value for the Company, its shareholders, employees and stakeholders. The bonus consists of a one-time extraordinary grant of 1,620,000 restricted shares which vested immediately upon approval by Shareholders on April 16, 2015.
Pre-merger plans
On April 4, 2012, Fiat S.p.A. General Shareholders Meeting adopted a Long Term Incentive Plan (the “Retention LTI”), in the form of stock grants. As a result of the Shareholders’ resolution the Group attributed the CEO with 7 million rights, representative of an equal number of Fiat S.p.A. ordinary shares. The rights vested ratably over three years subject to the requirement that the CEO remained in office. On February 22, 2015, the final third vested.
On May 7, 2015, the FCA US LLC Board approved a valuation and unit freeze for the Directors’ RSUs, as of December 31, 2015 under the Amended and Restated FCA US LLC Directors Restricted Stock Unit Plan. The final unit valuation was U.S.$12.13 per unit. The number of units by Director can be referenced in the equity awards table at the end of this report.
For consistent treatment, the unit freeze was also applied to the CEO’s Unit Appreciation Right (“UAR”) award that was granted on December 3, 2012 by the FCA US LLC Board of Directors. The UAR arrangement was intended to place the CEO in a similar economic position to the other FCA US LLC directors, taking into account differences in payment timing under the CEO’s grant that were required by U.S. tax restrictions and previously applicable structural requirements of the U.S. Troubled Asset Relief Program. In order to provide for consistent payment timing among the CEO’s prior grants and those to other FCA US LLC directors, the CEO was originally granted the UAR that will be redeemed only at the earlier of the end of his Board service or 10 years from the UAR grant date (i.e. December 3, 2022) in cash using the final valuation of U.S.$12.13 per unit less the UAR reference price per unit. The UARs have no further appreciation opportunity. To approximate the economic treatment of awards for other FCA US LLC directors at the time of grant, the UAR was coupled with an arrangement whereby in December 2012 the CEO placed in escrow the entire gross proceeds required by U.S. tax law to be paid at that time to the CEO in respect of his prior FCA US LLC director grants, which will be released from escrow at the same time the UAR is redeemed. The combined value of the UAR and escrow approximates the value of the corresponding FCA US LLC awards held by FCA US LLC directors of equivalent tenure to the CEO.
Post Mandate and Pension
Based on legacy arrangements, both Executive Directors have a post-mandate benefit in an amount equal to five times their last annual base compensation. The award is payable quarterly over a period of 20 years commencing three months after
122
the conclusion of employment with the Company, with an option for a lump sum payment. Also under legacy plans, the CEO participates in pension plans for which the Company mandatorily pays defined contributions to social security institutions.
In 2015, the Company reported a cost of €0.8 million in connection with these post-mandate benefits and €3.1 million in social security contributions.
Other Benefits
We offer customary perquisites to our CEO and Chairman. The Executive Directors may also be entitled to usual and customary fringe benefits such as personal use of aircraft, company car and driver, personal/home security, medical insurance, accident and disability insurance, tax preparation, financial counseling and tax equalization. The Company’s Remuneration Policy also enables the Compensation Committee to grant other benefits to the Executive Directors in particular circumstances.
Tax Equalization
|
Action Taken
|
Rationale
|
|
Tax Equalization for Executive Directors
|
Maintain respective home country taxation on all employment income, in the event of incremental taxes
|
The Executive Directors, by nature of their role in our geographically diverse company, may be subject to tax on their employment income in multiple countries. Given the Executive Directors are subject to tax on their worldwide income in their respective home countries, the Company studied the prevalent practice for handling incremental tax costs incurred by globally mobile executives. Based on that analysis, in 2015, the Board decided to tax equalize all of the employment earnings, including equity income, to the Executive Directors’ respective home country effective tax rate, if incremental taxes over their home country tax rate would arise.
STOCK OWNERSHIP
Our Board recognizes the critical role that executive stock ownership has in aligning the interests of management with those of shareholders. While the Company does not maintain a formal stock ownership policy, the CEO’s stock holdings, when viewed as a multiple of his 2015 base salary, was significantly greater than common market practice for 2015.
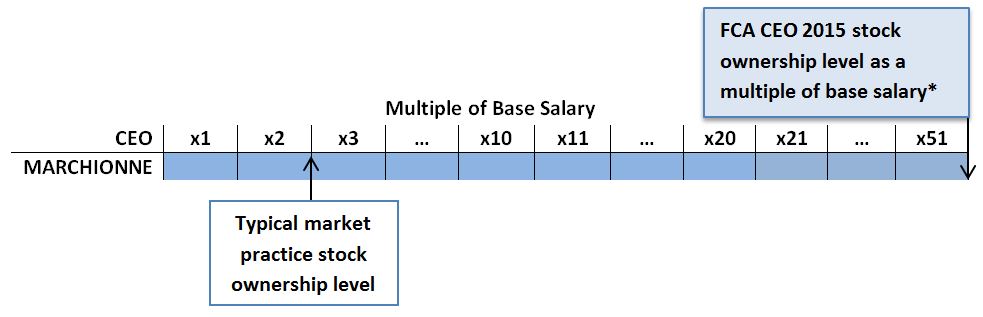
* The multiple shown above is based on shares held and excludes unvested outstanding shares and represents holdings as of December 31, 2015 using the NYSE closing stock price of U.S.$13.99.
123
RECOUPMENT OF INCENTIVE COMPENSATION (
CLAWBACK POLICY
)
The Board is dedicated to maintaining and enhancing a culture focused on integrity and accountability. The Company’s EIP defines the terms and conditions for any subsequent long term incentive program. The Recoupment Policy in the EIP provisions for the Company to recover, or “clawback,” incentive compensation with the ability to retroactively make adjustments if any cash or equity incentive award is predicated upon achieving financial results and the financial results were subject to an accounting restatement.
INSIDER TRADING POLICY
The Company maintains a strict insider trading policy applicable to all Directors, employees, members of the households and immediate family members (including spouse and children) of persons listed and other unrelated persons, if they are supported by the persons listed. The policy provides that the aforementioned individuals may not buy, sell or engage in other transactions in the Company’s stock while in possession of material non-public information; buy or sell securities of other companies while in possession of material non-public information about those companies they become aware of as a result of business dealings between the Company and those companies; disclose material non-public information to any unauthorized persons outside of the Company; or engage in hedging transactions through the use of certain derivatives, such as put and call options involving the Company’s securities. The policy also restricts trading to defined window periods which follow the Company’s quarterly earnings releases.
PROHIBITION ON SHORT SALES (ANTI-HEDGING)
To ensure alignment with shareholders' interest and to further strengthen our compensation risk management policies and practice, the Company’s insider trading policy prohibits all individuals for which the policy applies, from taking a short position on a financial instrument, making an additional sales activity and disclosing misleading negative information on the financial instrument in order to reduce its price.
REMUNERATION FOR NON-EXECUTIVE DIRECTORS
Remuneration of Non-Executive Directors is set forth in the Remuneration Policy, which is approved by the Company’s Shareholders and periodically reviewed by the Compensation Committee. The current remuneration for the Non-Executive Directors is shown in the table below.
|
Non-Executive Director Compensation
|
Total in U.S.$
|
|
|
Annual Cash Retainer
|
200,000
|
|
|
Additional retainer for Audit Committee member
|
10,000
|
|
|
Additional retainer for Audit Committee Chair
|
20,000
|
|
|
Additional retainer for Compensation/Governance Committee member
|
5,000
|
|
|
Additional retainer for Compensation/Governance Committee Chair
|
15,000
|
|
|
Additional retainer for Lead Independent Director
|
20,000
|
|
|
Additional retainer for Chairman of other Board committees
|
25,000
|
|
|
An automobile perquisite of one assigned company-furnished vehicle, rotated semi-annually, subject to taxes related to imputed income/employee price on purchase or lease of Company vehicles.
|
||
Non-Executive Directors elect whether their annual retainer fee will be made half in cash and common shares of FCA, or 100 percent in common shares of FCA, whereas, the committee membership and committee chair fee payments will be made all in cash (providing a board fee structure common to other large multinational companies to help attract a multinational board membership). Remuneration of Non-Executive Directors is fixed and not dependent on FCA's financial results. Non-Executive Directors are not eligible for variable compensation and do not participate in any incentive plans.
124
IMPLEMENTATION OF REMUNERATION POLICY IN 2016
If, and to the extent, any changes to 2016 remuneration are made, those changes will be in line with the approved policy.
Directors' Compensation
The following table summarizes the remuneration paid to the members of the Board of Directors for the year ended December 31, 2015.
_________________________
|
Office held
|
In office from/to
|
Annual fee (€)
|
Annual Incentive
(1)
(€)
|
Other Compensation (€)
|
Total (€)
|
||||||||
|
Directors of FCA
|
|||||||||||||
|
ELKANN John Philipp
|
Chairman
|
01/01/2015 - 12/31/2015
|
1,802,760
|
—
|
|
128,309
|
|
(2)
|
1,931,069
|
||||
|
MARCHIONNE Sergio
|
CEO
|
01/01/2015 - 12/31/2015
|
3,605,521
|
6,297,419
|
|
126,620
|
|
10,029,560
|
|||||
|
AGNELLI Andrea
|
Director
|
01/01/2015 - 12/31/2015
|
183,240
|
(3)
|
—
|
|
—
|
|
183,240
|
||||
|
BRANDOLINI D'ADDA Tiberto
|
Director
|
01/01/2015 - 12/31/2015
|
183,240
|
(3)
|
—
|
|
—
|
|
183,240
|
||||
|
EARLE Glenn
|
Director
|
01/01/2015 - 12/31/2015
|
201,563
|
(3)
|
—
|
|
—
|
|
201,563
|
||||
|
MARS Valerie
|
Director
|
01/01/2015 - 12/31/2015
|
194,581
|
(3)
|
—
|
|
—
|
|
194,581
|
||||
|
SIMMONS Ruth J.
|
Director
|
01/01/2015 - 12/31/2015
|
187,821
|
(3)
|
—
|
|
6,220
|
|
(2)
|
194,041
|
|||
|
THOMPSON Ronald L.
|
Director
|
01/01/2015 - 12/31/2015
|
215,306
|
(3)
|
—
|
|
6,220
|
|
(2)
|
221,526
|
|||
|
WHEATCROFT Patience
|
Director
|
01/01/2015 - 12/31/2015
|
196,982
|
(3)
|
—
|
|
5,898
|
|
(2)
|
202,880
|
|||
|
WOLF Stephen M.
|
Director
|
01/01/2015 - 12/31/2015
|
196,982
|
(3)
|
—
|
|
6,220
|
|
(2)
|
203,202
|
|||
|
ZEGNA Ermenegildo
|
Director
|
01/01/2015 - 12/31/2015
|
187,821
|
(3)
|
—
|
|
5,478
|
|
(2)
|
193,299
|
|||
|
Total
|
7,155,817
|
6,297,419
|
|
284,965
|
|
13,738,201
|
|||||||
(1) The annual incentives are related to the performance in 2015 which are paid out in 2016.
(2) The stated amount refers to the use of transport.
(3)
Non-Executive Directors receive a portion of their annual retainer fee in common shares of FCA. The amount of the annual fee here reported includes the fair value of the shares received.
125
Share Plans Granted to Directors
The following table gives an overview of the share plans held by the Chief Executive Officer and other Board Members.
|
Grant Date
|
Vesting Date
|
FV on Grant Date
(1)
|
Agnelli
|
Brandolini
|
Earle
|
Mars
|
Thompson
|
Wolf
|
Simmons
|
Wheatcroft
|
Zegna
|
Marchionne
|
Total
|
||||||||||||||
|
January 1, 2015
|
|||||||||||||||||||||||||||
|
FCA Stock grants
|
4/4/12
|
2/22/15
|
€
|
4.21
|
|
2,333,334
|
|
2,333,334
|
|
||||||||||||||||||
|
2009 FCA US RSUs
|
11/12/09
|
6/10/12
|
$
|
9.00
|
|
648,023
|
|
648,023
|
|
—
|
|
—
|
|
1,296,047
|
|
||||||||||||
|
2012 FCA US RSUs
|
7/30/12
|
6/10/13
|
$
|
9.00
|
|
32,477
|
|
32,477
|
|
32,477
|
|
32,477
|
|
129,906
|
|
||||||||||||
|
2013 FCA US RSUs
|
7/30/13
|
6/10/14
|
$
|
9.00
|
|
26,157
|
|
26,157
|
|
26,157
|
|
26,157
|
|
104,629
|
|
||||||||||||
|
706,657
|
|
706,657
|
|
58,634
|
|
58,634
(2)
|
|
1,530,582
|
|
||||||||||||||||||
|
2015 Dilution Adjustments
(3)
|
|||||||||||||||||||||||||||
|
2009 FCA US RSUs
|
11/12/09
|
6/10/12
|
$
|
7.77
|
|
102,582
|
|
102,582
|
|
—
|
|
—
|
|
205,164
|
|
||||||||||||
|
2012 FCA US RSUs
|
7/30/12
|
6/10/13
|
$
|
7.77
|
|
5,141
|
|
5,141
|
|
5,141
|
|
5,141
|
|
20,564
|
|
||||||||||||
|
2013 FCA US RSUs
|
7/30/13
|
6/10/14
|
$
|
7.77
|
|
4,141
|
|
4,141
|
|
4,141
|
|
4,141
|
|
16,564
|
|
||||||||||||
|
Granted during 2015
|
|||||||||||||||||||||||||||
|
2015 FCA PSU
|
4/16/15
|
Feb. 2017/2018/2019
|
$
|
14.84
|
|
—
|
|
—
|
|
—
|
|
4,320,000
|
|
4,320,000
|
|
||||||||||||
|
Special grant
|
4/16/15
|
4/16/15
|
$
|
16.29
|
|
—
|
|
—
|
|
—
|
|
1,620,000
|
|
1,620,000
|
|
||||||||||||
|
2015 FCA stock grants
(4)
|
January / October 2015
|
January / October 2015
|
$
|
14.76
|
|
11,228
|
|
7,009
|
|
9,488
|
|
7,009
|
|
7,009
|
|
13,775
|
|
13,636
|
|
7,009
|
|
7,009
|
|
—
|
|
83,172
|
|
|
Vested during 2015
|
|||||||||||||||||||||||||||
|
FCA stock grants
|
4/4/12
|
2/22/15
|
€
|
4.21
|
|
—
|
|
2,333,334
|
|
2,333,334
|
|
||||||||||||||||
|
Special grant
|
4/16/15
|
4/16/15
|
$
|
16.29
|
|
—
|
|
1,620,000
|
|
1,620,000
|
|
||||||||||||||||
|
2015 FCA stock grants
(4)
|
January / October 2015
|
January / October 2015
|
$
|
14.76
|
|
11,228
|
|
7,009
|
|
9,488
|
|
7,009
|
|
7,009
|
|
13,775
|
|
13,636
|
|
7,009
|
|
7,009
|
|
—
|
|
83,172
|
|
|
December 31, 2015
|
|||||||||||||||||||||||||||
|
2015 FCA PSU
|
04/16/15
|
02/18/17
|
$
|
14.84
|
|
—
|
|
—
|
|
—
|
|
4,320,000
|
|
4,320,000
|
|
||||||||||||
|
2009 FCA US RSUs
(5)
|
11/12/09
|
6/10/12
|
$
|
12.13
|
|
750,605
|
|
750,605
|
|
—
|
|
—
|
|
1,501,210
|
|
||||||||||||
|
2012 FCA US RSUs
(5)
|
7/30/12
|
6/10/13
|
$
|
12.13
|
|
37,618
|
|
37,618
|
|
37,618
|
|
37,618
|
|
150,472
|
|
||||||||||||
|
2013 FCA US RSUs
(5)
|
7/30/13
|
6/10/14
|
$
|
12.13
|
|
30,298
|
|
30,298
|
|
30,298
|
|
30,298
|
|
121,192
|
|
||||||||||||
|
—
|
|
—
|
|
—
|
|
—
|
|
818,521
|
|
818,521
|
|
67,916
|
|
—
|
|
—
|
|
67,916
|
|
1,772,874
|
|
||||||
(1) Fair value of the FCA US RSUs beginning balance and ending balances reflects the revaluation price in effect on those dates.
(2) Mr. Marchionne does not receive any direct compensation for his service on behalf of FCA US. In connection with his service as a Director of FCA US, similarly to the equity based compensation granted to the other Board Members, he was assigned “Restricted Stock Units” under the Director RSU Plan. Such RSUs will be paid within 60 days following the date he ceases to serve as a Director.
(3) FCA US RSU awards were adjusted for dilution by a factor of 1.1583 in November 2015.
(4) Non-Executive Directors receive a portion of their annual retainer fee in common shares of FCA. The fair value of the shares received and shown in the table above, is included in the amount of the annual fee reported in the Directors' compensation table.
(5) FCA US RSUs will be paid within 60 days following the date FCA Board service ceases. FCA US RSU awards revalued at $12.13/unit as of December 31, 2015.
126
The total cost booked in 2015 by the Company in connection with the above share plans was approximately €50 million.
Executive Officers’ Compensation
The aggregate amount of compensation paid to or accrued for executive officers that held office during 2015 was approximately €27 million, including €3.3 million of pensions and similar benefits paid or set aside by us. The aggregate amounts include 16 executives at December 31, 2015; during 2015, organizational changes occurred that were taken into consideration, pro
-
rata temporis, in the total compensation figures.
C. Board Practices
Please refer to
Item 6A. Directors and Senior Management
for additional information concerning the Company’s Directors required by this item.
Committees
On October 13, 2014, the Board of Directors of FCA appointed the following internal committees: (i) an Audit Committee; (ii) a Governance and Sustainability Committee and (iii) a Compensation Committee, such appointment becoming effective as of the Merger effective date. As of the date of March 23, 2015, the Board of Directors appointed Mrs.Valerie Mars as additional member of the Audit Committee.
The Audit Committee consists of the following members:
|
Name
|
Position
|
|
Glenn Earle
|
Chairman
|
|
Ronald L. Thompson
|
Member
|
|
Patience Wheatcroft
|
Member
|
|
Valerie Mars
|
Member
|
On October 29, 2014, the Board of Directors approved the charter of the Audit Committee. The function of the Audit Committee is to assist the Board of Directors’ oversight of,
inter alia
: (i) the integrity of the Company’s financial statements, including any published interim reports; (ii) the Company’s financing; (iii) the systems of internal controls that management and/or the Board of Directors have established; (iv) the Company’s compliance with legal and regulatory requirements; (v) the Company’s policies and procedures for addressing certain actual or perceived conflicts of interest; (vi) risk management guidelines and policies; and (vii) the implementation and effectiveness of the company’s ethics and compliance program. The Audit Committee shall be comprised of at least three (3) non-executive directors elected by the Board of Directors. Each member of the Audit Committee shall:
|
•
|
neither have a material relationship with the Company, as determined by the Board of Directors nor be performing the functions of auditors or accountants for the Company;
|
|
•
|
be an “independent” member of the Board of Directors under the rules of the NYSE and Rule 10A-3 under the Securities Exchange Act of 1934, or the Exchange Act, and within the meaning of the Dutch Corporate Governance Code; and
|
|
•
|
be “financially literate” and have “accounting or selected financial management expertise” qualifications, as determined by the Board of Directors.
|
127
At least one member of the Audit Committee shall be a “financial expert” as defined in rules of the SEC and best practice provisions of the Dutch Code.
The Governance and Sustainability Committee consists of the following members:
|
Name
|
Position
|
|
John Elkann
|
Chairman
|
|
Patience Wheatcroft
|
Member
|
|
Ruth J. Simmons
|
Member
|
On October 29, 2014, the Board of Directors approved the charter of the Governance and Sustainability Committee. The function of the Governance and Sustainability Committee is to assist the Board of Directors with respect to the determination of,
inter alia
: : (i) the identification of the criteria, professional and personal qualifications for candidates to serve as directors, (ii) periodic assessment of the size and composition of the Board of Directors, (iii) periodic assessment of the performance of individual directors and reporting this to the Board of Directors, (iv) proposals for appointment and reappointments of executive and non-executive directors, (v) supervision of the selection criteria and appointment procedure for senior management, (vi) monitoring and evaluating reports on the Group’s sustainable development policies and practices, management standards, strategy, performance and governance globally, and (vii) reviewing, assessing and making recommendations as to strategic guidelines for sustainability-related issues, and reviewing the annual Sustainability Report. The Governance and Sustainability Committee is elected by the Board of Directors and is comprised of at least three directors, at most one of whom may be an executive director and no more than two of whom will not be independent under the Dutch Corporate Governance Code, elected by the Board of Directors.
The Compensation committee consists of the following members:
|
Name
|
Position
|
|
|
Stephen M. Wolf
|
Chairman
|
|
|
Valerie A. Mars
|
Member
|
|
|
Ermenegildo Zegna
|
Member
|
|
On October 29, 2014, the Board of Directors approved the charter of the Compensation Committee. The function of the Compensation Committee is to assist and advise the Board of Directors’ oversight of: (i) executive compensation; (ii) remuneration policy to be pursued; (iii) compensation of non-executive directors; (iv) remuneration report. The Compensation Committee shall be comprised of at least three (3) non-executive directors, at most one (1) of whom will not be independent under the Dutch Corporate Governance Code, elected by the Board of Directors.
D. Employees
Human capital is a crucial factor in our success, both in terms of building a position among global leaders in the automobile sector and in creating value that is sustainable over the long-term. Recognizing performance and leadership, encouraging professional development, creating equal opportunity for individuals to develop and providing attractive career paths within the organization are all an essential part of our commitment toward our employees. Through structured, global human resources management process, we identify and develop talent and motivate employees. Some of our initiatives to meet this objective include:
|
•
|
Performance and Leadership Management, an appraisal system adopted worldwide to assess our manager, professional and salaried employees, and evaluation of our hourly workers through WCM performance management metrics;
|
|
•
|
talent management and succession planning, aimed at identifying the most talented employees and fast-tracking their development;
|
128
|
•
|
training and skill-building initiatives;
|
|
•
|
internal recruitment programs to foster cross-sector and intercompany transfers;
|
|
•
|
employee satisfaction and engagement surveys to monitor satisfaction levels, needs and requests of employees; and
|
|
•
|
flexible work arrangements, commuting programs and dedicated wellness programs.
|
At
December 31, 2015
, we had a total of 234,621 employees, a 2.6 percent increase over December 31, 2014 and a 4 percent increase over December 31, 2013. The following table provides a breakdown of our employees as of
December 31, 2015
,
2014
and
2013
, indicated by type of contract and region. Employees of certain joint ventures are omitted from the figures below.
|
Hourly
|
Salaried
|
Total
|
||||||||||||||||||||||||
|
2015
|
2014
|
2013
|
2015
|
2014
|
2013
|
2015
|
2014
|
2013
|
||||||||||||||||||
|
Europe
|
58,194
|
|
55,690
|
|
57,137
|
|
33,604
|
|
32,371
|
|
31,893
|
|
91,798
|
|
88,061
|
|
89,030
|
|
||||||||
|
North America
|
67,720
|
|
63,541
|
|
60,145
|
|
22,490
|
|
21,980
|
|
21,220
|
|
90,210
|
|
85,521
|
|
81,365
|
|
||||||||
|
Latin America
|
34,574
|
|
37,258
|
|
38,826
|
|
9,625
|
|
9,974
|
|
9,480
|
|
44,199
|
|
47,232
|
|
48,306
|
|
||||||||
|
Asia
|
2,562
|
|
2,636
|
|
2,696
|
|
5,680
|
|
5,065
|
|
4,003
|
|
8,242
|
|
7,701
|
|
6,699
|
|
||||||||
|
Rest of the world
|
4
|
|
6
|
|
25
|
|
168
|
|
169
|
|
162
|
|
172
|
|
175
|
|
187
|
|
||||||||
|
Total
|
163,054
|
|
159,131
|
|
158,829
|
|
71,567
|
|
69,559
|
|
66,758
|
|
234,621
|
|
228,690
|
|
225,587
|
|
||||||||
We maintain dialogue with trade unions and employee representatives to achieve consensus-based solutions for responding to different market conditions in each geographic area. We have had no significant instances of labor unrest overall, and no significant local labor actions in the past three years.
In Europe, we established a European Works Council, or EWC, in 1997 to ensure workers the right to information and consultation as required by EU regulations applicable to community-scale undertakings. The EWC was established on the basis of an implementing agreement initially signed in 1996 and subsequently revised and amended. During 2014, FCA and the IndustriALL European Trade Union (the European federation of metalworking, chemical and textile sector trade unions) jointly agreed to solutions to issues, primarily related to the absence of affiliated trade unions in certain Member States, that had prevented the proper establishment of a European Works Council. On November 19-20, 2014, the FCA EWC held its first meeting with 16 members representing workers from each European Member State in which the Group has a significant presence. The distribution of representation is based on the EWC renewal agreement signed June 28, 2011. Also present at the meeting were representatives of the trade unions signatories to the original establishing agreement.
Trade Unions and Collective Bargaining
Under our Code of Conduct, employees are free to join a trade union in accordance with local law and the rules of the various trade union organizations.
In Italy, 32.3 percent of our workers were trade union members in 2015 (compared with 33.2 percent of workers in 2014). In addition to the rights granted to all Italian trade unions and workers concerning freedom of association, we provide an additional service to our employees by paying the trade union dues on behalf of those employees who are members of trade unions that are signatories to the Collective Labor Agreement, referred to as CCSL, applicable to our Italian companies. Dues for employees who are members of trade unions that are not signatories to the FCA CCSL are paid either directly by employees or via deductions from employee wages.
A large portion of our workers in the U.S., Canada and Mexico are represented by trade unions.
Collective bargaining at various levels resulted in major agreements being reached with trade unions on both wage and employment conditions in several countries. Approximately 85 percent of our employees worldwide are covered by collective bargaining agreements.
129
In Italy, all of our employees are covered by collective bargaining agreements. In April, 2015, a new four-year compensation agreement was signed by FCA companies in Italy within the automobiles business. The new compensation agreement was subsequently included into the new labor agreement and was extended to all FCA companies in Italy on July 7, 2015. The compensation arrangement was effective retrospectively from January 1, 2015 through December 31, 2018 and incentivizes all employees toward achievement of the productivity, quality and profitability targets established in the 2015-2018 period of the 2014-2018 business plan developed in May 2014 by adding two variable additional elements to base pay:
|
•
|
an annual bonus calculated on the basis of production efficiencies achieved and the plant’s World Class Manufacturing (“WCM”) audit status; and
|
|
•
|
a component linked to achievement of the financial targets established in the 2015-2018 period of the 2014-2018 business plan (“Business Plan Bonus”) for the EMEA region, including the activities of the premium brands Alfa Romeo and Maserati. A portion of the Business Plan Bonus is a guaranteed amount based on employees' base salaries and is paid over four years in quarterly installments, while the remaining portion is to be paid in March 2019 to active employees as of December 31, 2018, with at least two years of service during 2015 through 2018.
|
Other major innovations introduced by the agreement include a continuous shift cycle (with a total of 20 shifts per week), which is based on the successful model already in place at the Melfi plant. In addition, an experimental classification system for new hires will be introduced with the current eight levels being reduced to three. The industrial relations process and the system of participation have also been significantly revised.
In October 2015, FCA US and the UAW agreed to a new four-year national collective bargaining agreement, which will expire in September 2019. The provisions of the new agreement continue certain opportunities for success-based compensation upon meeting certain quality and financial performance metrics. The agreement closes the pay gap between “Traditional” and “In-progression” employees over an eight year period and will continue to provide UAW-represented employees with a simplified adjusted profit sharing plan. The adjusted profit sharing plan will be effective for the 2016 plan
year and is directly aligned with NAFTA profitability. The agreement includes lump-sum payments in lieu of further wage increases of primarily $4,000 for “Traditional” employees and $3,000 for “In-progression” employees totaling approximately $141 million (€126 million) that was paid to UAW members on November 6, 2015.
In September 2012, the Canadian Auto Workers union (which merged with the Communications, Energy and Paperworkers Union in September 2013 to form a new union called Unifor) ratified a new four-year collective bargaining agreement. The provisions of this agreement, which cover approximately 10,200 employees at December 31, 2015, provide for a lump sum payment to eligible Unifor employees in each of the four years. In addition, the agreement maintains the current wage rates through September 2016 for employees hired prior to September 24, 2012, or traditional employees, and starts employees hired on or after September 24, 2012 at a lower wage rate that can increase to the current maximum wage rate of traditional employees at the end of ten years. The agreement expires in September 2016.
130
E. Share Ownership
The table below shows the number of FCA common shares owned at February 26, 2016 by members of FCA’s board and GEC.
|
FCA Directors Owning FCA Common Shares at February 26, 2016
|
Shares
|
Percent of Class
|
||||
|
Sergio Marchionne
|
14,620,000
|
|
1.13%*
|
|
||
|
John Elkann
|
133,000
|
|
—
|
%
|
||
|
Stephen M. Wolf
|
65,125
|
|
—
|
%
|
||
|
Ruth J. Simmons
|
19,786
|
|
—
|
%
|
||
|
Andrea Agnelli
|
17,266
|
|
—
|
%
|
||
|
Glenn Earle
|
13,672
|
|
—
|
%
|
||
|
Ermenegildo Zegna
|
13,119
|
|
—
|
%
|
||
|
Tiberto Brandolini d’Adda
|
10,084
|
|
—
|
%
|
||
|
Valerie Mars
|
10,084
|
|
—
|
%
|
||
|
Ronald L. Thompson
|
10,084
|
|
—
|
%
|
||
|
Patience Wheatcroft
|
10,084
|
|
—
|
%
|
||
|
FCA Officers Owning FCA Common Shares at February 26, 2016
|
Shares
|
Percent of Class
|
||||
|
Alessandro Baldi
|
35,450
|
|
—
|
%
|
||
|
Scott R. Garberding
|
33,000
|
|
—
|
%
|
||
|
Alfredo Altavilla
|
31,653
|
|
—
|
%
|
||
|
Linda I. Knoll
|
13,500
|
|
—
|
%
|
||
|
Harald J. Wester
|
12,000
|
|
—
|
%
|
||
|
Michael J. Keegan
|
9,000
|
|
—
|
%
|
||
|
Stefan Ketter
|
4,803
|
|
—
|
%
|
||
|
Michael Manley
|
3,800
|
|
—
|
%
|
||
_____________________________
*
Interest in full share capital, and percentage of overall voting rights, is 0.86 percent
131
A. Major Shareholders
Exor is the largest shareholder of FCA through its 29.15 percent shareholding interest in our issued common shares (as of February
26
, 2016). In December 2014, Exor also purchased an aggregate notional amount of mandatory convertible securities totaling U.S.$886 million (€730 million at the date of the issuance) (see Note
19
within the Consolidated Financial Statements included elsewhere in this report). As a result of the loyalty voting mechanism, Exor’s voting power is approximately
44.27
percent.
Consequently, Exor could strongly influence all matters submitted to a vote of FCA shareholders, including approval of annual dividends, election and removal of directors and approval of extraordinary business combinations.
Exor is controlled by Giovanni Agnelli e C. S.a.p.az, (“G.A.”) which holds 51.87 percent of its share capital. G.A. is a limited partnership with interests represented by shares (Societa’ in Accomandita per Azioni), founded by Giovanni Agnelli and currently held by members of the Agnelli and Nasi families, descendants of Giovanni Agnelli, founder of Fiat. Its present principal business activity is to purchase, administer and dispose of equity interests in public and private entities and, in particular, to ensure the cohesion and continuity of the administration of its controlling equity interests. The managing directors of G.A. are John Elkann, Tiberto Brandolini d’Adda, Alessandro Nasi, Andrea Agnelli, Gianluca Ferrero, Luca Ferrero de’ Gubernatis Ventimiglia and Maria Sole Agnelli.
Based on the information in FCA’s shareholder register, regulatory filings with the Netherlands Authority for the Financial Markets (
stichting Autoriteit Financiële Markten
, the “AFM”) and the SEC and other sources available to FCA, the following persons owned, directly or indirectly, in excess of three percent of the common shares of FCA, as of February
26
, 2016:
|
FCA Shareholders
|
Number of Issued Common Shares
|
Percentage Owned
|
||||
|
Exor
(1)
|
375,803,870
|
|
29.15
|
|
||
|
Baillie Gifford & Co.
(2)
|
67,993,899
|
|
5.27
|
|
||
|
(1)
|
As a result of the issuance of the mandatory convertible securities completed in December 2014 (“MCS Offering”), Exor beneficially owns 444,352,804 common shares of FCA, consisting of (i) 375,803,870 common shares of FCA owned prior to the MCS Offering, and (ii) 68,548,934 common shares underlying the mandatory convertible securities purchased in the MCS Offering, at the minimum conversion rate of 7.7369 common shares per mandatory convertible security (being the rate at which Exor may convert the mandatory convertible securities into common shares at its option). Including the common shares into which the mandatory convertible securities sold in the MCS Offering, are convertible at the option of the holders, the percentage is 29.40 percent. In addition, Exor holds 375,803,870 special voting shares. Exor’s beneficial ownership in FCA is approximately 44.27 percent excluding MCS Offering. Current Exor’s beneficial ownership in FCA is approximately 42.71 percent, calculated as the ratio of (i) the aggregate number of common and special voting shares owned prior to the MCS Offering, and the common shares underlying the mandatory convertible securities purchased by Exor in the MCS Offering, at the minimum conversion rate as set forth above and (ii) the aggregate number of outstanding common shares and issued special voting shares, and the common shares underlying all of the mandatory convertible securities sold in the MCS Offering, at the minimum conversion rate set forth above.
|
|
(2)
|
Baillie Gifford & Co., as an investment adviser in accordance with rule 240.13d-1 (b), beneficially owns 123,348,880 common shares with sole dispositive power (7.26 percent of the issued shares), of which 67,993,899 common shares are held with sole voting power (4.00 percent of the issued shares).
|
Based on the information in FCA’s shareholder register and other sources available to us, as of January 31, 2016, approximately 280 million FCA common shares, or 22 percent of the FCA common shares, were held in the United States. As of the same date, approximately 640 record holders had registered addresses in the United States.
B. Related Party Transactions
The related parties of the Group are entities and individuals capable of exercising control, joint control or significant influence over FCA and its subsidiaries, companies belonging to the Exor Group (including CNHI) and unconsolidated subsidiaries, associates or joint ventures of the Group. Members of FCA’s Board of Directors, Board of Statutory Auditors (through the date of the Merger) and executives with strategic responsibilities and their families are also considered related parties.
132
The Group carries out transactions with unconsolidated subsidiaries, jointly-controlled entities, associates and other related parties, on commercial terms that are normal in the respective markets, considering the characteristics of the goods or services involved. Transactions carried out by the Group, which have had an effect on revenues, cost of sales, and trade receivables and payables, with unconsolidated subsidiaries, jointly-controlled entities, associates and other related parties, are primarily of a commercial nature; these transactions primarily involve the following:
|
•
|
the sale of motor vehicles to the joint ventures Tofas and FCA Bank leasing and renting subsidiaries;
|
|
•
|
the sale of engines, other components and production systems and the purchase of commercial vehicles with the joint operation Sevel S.p.A.;
|
|
•
|
the sale of engines, other components and production systems to companies of CNHI;
|
|
•
|
the purchase of vehicles, the provision of services and the sale of goods with the joint operation Fiat India Automobiles Private Limited;
|
|
•
|
the provision of services and the sale of goods to the joint venture GAC Fiat Chrysler Automobiles Co. Ltd;
|
|
•
|
the provision of services (accounting, payroll, tax administration, information technology, purchasing and security) to the companies of CNHI;
|
|
•
|
the purchase of commercial vehicles from the joint venture Tofas; and
|
|
•
|
the purchase of commercial vehicles under contract manufacturing agreement from CNHI.
|
The most significant financial transactions with related parties generated Receivables from financing activities of the Group’s financial services companies from joint ventures and Asset-backed financing relating to amounts due to FCA Bank for the sale of receivables. Refer to Note
26
to the Consolidated Financial Statements included elsewhere in this report for further details on our related party transactions.
C. Interests of Experts and Counsel
Not applicable.
133
A. Consolidated Statements and Other Financial Information
Consolidated Financial Statements
Refer to
Item 18. Financial Statements
for our Consolidated Financial Statements and report of our independent registered public accounting firm.
Export Sales
Refer to
Item 4B. Business Overview
for a discussion of our sales and distribution channels.
Legal Proceedings
Refer to
Item 4B. Business Overview—Legal Proceedings
for information on significant legal and arbitration proceedings.
Dividend Policy
For 2015, the Board of Directors has not recommended a dividend payment on FCA common shares in order to further fund capital requirements of the Group’s five-year business plan presented on May 6, 2014 and as updated in January 2016.
The objectives identified by the Group for managing capital are to create value for shareholders as a whole, safeguard business continuity and support the growth of the Group. As a result, the Group endeavors to maintain an adequate level of capital that at the same time enables it to obtain a satisfactory economic return for its shareholders and guarantee economic access to external sources of funds, including by means of achieving an adequate credit rating.
The Group constantly monitors the ratio between debt and equity and in particular the level of net debt and the generation of cash from its industrial activities. In order to reach these objectives, the Group aims at a continuous improvement in the profitability of the business in which it operates. Further, in general, the Board of Directors may make proposals to Shareholders in the general meeting to reduce or increase share capital or, where permitted by law, to distribute reserves. In this context, the Group may also make purchases of treasury shares, without exceeding the limits authorized by Shareholders in the general meeting, under the same logic of creating value, compatible with the objectives of achieving financial equilibrium and an improvement in its rating.
For additional information on distribution of profits, refer to
Item 10B. Memorandum and Article of Association
.
B. Significant Changes
Except as otherwise disclosed within this report on Form 20-F, no significant change has occurred since the date of the audited Consolidated Financial Statements included elsewhere in this report.
134
A. Offer and Listing Details
On October 13, 2014, our common shares began trading on the NYSE under the symbol “FCAU” and the on the MTA under the symbol “FCA”. Prior to October 13, 2014, our ordinary shares were listed and traded on the MTA under the symbol “Fiat”.
The following table presents the high and low closing market prices of FCA common shares as reported on the NYSE and the MTA for each of the periods indicated. The Ferrari spin-off was completed on January 3, 2016. Beginning on January 4, 2016, FCA common shares have been traded excluding Ferrari. The share prices presented in this table have not been retroactively adjusted for the spin-off.
|
NYSE
|
MTA
|
||||||||||
|
High
|
Low
|
High
|
Low
|
||||||||
|
(in U.S.$)
|
(in €)
|
||||||||||
|
Year ended December 31, 2014
(1)
|
13.610
|
|
8.740
|
|
11.170
|
|
6.875
|
|
|||
|
Fourth Quarter 2014
(1)
|
13.610
|
|
8.740
|
|
11.170
|
|
6.875
|
|
|||
|
Year ended December 31, 2015
|
16.720
|
|
11.250
|
|
15.800
|
|
9.465
|
|
|||
|
First Quarter 2015
|
16.720
|
|
11.250
|
|
15.800
|
|
9.465
|
|
|||
|
Second Quarter 2015
|
16.710
|
|
14.330
|
|
15.630
|
|
12.800
|
|
|||
|
Third Quarter 2015
|
16.560
|
|
12.210
|
|
14.960
|
|
11.080
|
|
|||
|
Fourth Quarter 2015
|
16.470
|
|
13.090
|
|
14.520
|
|
11.850
|
|
|||
|
Monthly
|
|||||||||||
|
August 2015
|
16.560
|
|
13.740
|
|
14.960
|
|
12.010
|
|
|||
|
September 2015
|
15.120
|
|
12.210
|
|
13.240
|
|
11.080
|
|
|||
|
October 2015
|
16.470
|
|
13.520
|
|
14.520
|
|
11.870
|
|
|||
|
November 2015
|
14.890
|
|
13.430
|
|
13.520
|
|
12.450
|
|
|||
|
December 2015
|
14.370
|
|
13.090
|
|
13.330
|
|
11.850
|
|
|||
|
January 2016
|
9.070
|
|
6.890
|
|
8.365
|
|
6.200
|
|
|||
________________________________
(1) From October 13, 2014.
The following table presents the high and low closing market prices of Fiat ordinary shares as reported on the MTA for each of the periods indicated:
|
MTA
|
|||||
|
High
|
Low
|
||||
|
(in €)
|
|||||
|
Year ended December 31, 2011
|
7.937
|
|
3.312
|
|
|
|
Year ended December 31, 2012
|
4.842
|
|
3.314
|
|
|
|
Year ended December 31, 2013
|
6.450
|
|
3.890
|
|
|
|
Annual 2014
(1)
|
9.070
|
|
6.465
|
|
|
|
First Quarter 2014
|
8.450
|
|
6.580
|
|
|
|
Second Quarter 2014
|
9.070
|
|
7.130
|
|
|
|
Third Quarter 2014
|
8.045
|
|
6.465
|
|
|
|
Fourth Quarter 2014
(1)
|
7.445
|
|
6.940
|
|
|
________________________________
(1) Through October 10, 2014.
135
B. Plan of Distribution
Not applicable.
C. Markets
Our common shares are listed and traded on the NYSE under the symbol “FCAU” and on the MTA under the symbol “FCA”. Prior to the effectiveness of the Merger, our ordinary shares were listed and traded on the MTA under the symbol “Fiat”. Our mandatory convertible securities are listed and traded on the NYSE under the symbol “FCAM”.
D. Selling Shareholders
Not applicable.
E. Dilution
Not applicable.
F. Expenses of the Issue
Not applicable.
A. Share Capital
Not applicable.
B. Memorandum and Article of Association
A copy of our articles of association has been filed as Exhibit 3.1 to the Form F-4 filed by FCA on July 3, 2014 and is also incorporated by reference as Exhibit 3.1 to the Form F-4 filed by FCA on May 19, 2015.
THE FCA SHARES, ARTICLES OF ASSOCIATION AND TERMS AND CONDITIONS OF THE SPECIAL VOTING SHARES
FCA was incorporated as a public limited liability company (
naamloze vennootschap
) under the laws of the Netherlands on April 1, 2014 in contemplation of the Merger under the name Fiat Investments N.V. Upon effectiveness of the Merger, this name was changed to Fiat Chrysler Automobiles N.V. FCA’s corporate seat (
statutaire zetel
) is in Amsterdam, the Netherlands, and its registered office and principal place of business is located at 25 St. James’ Street, London SW1A 1HA, United Kingdom. FCA is registered with the Trade Register of the Dutch Chamber of Commerce under number 60372958. Its telephone number is +44 (0) 20 7766 0311.
Following is a summary of material information relating to the FCA common shares, including summaries of certain provisions of the FCA Articles of Association (the “FCA Articles of Association”), the terms and conditions in respect of the FCA special voting shares (the “Terms and Conditions of Special Voting Shares”) and the applicable Dutch law provisions in effect at the date of this report. The summaries of the FCA Articles of Association and the Terms and Conditions of Special Voting Shares as set forth in this report are qualified in their entirety by reference to the full text of the FCA Articles of Association, and the Terms and Conditions of Special Voting Shares.
136
Share Capital
The authorized share capital of FCA is forty million Euro (€40,000,000), divided into two billion (2,000,000,000) FCA common shares, nominal value of one Euro cent (€0.01) per share and two billion (2,000,000,000) special voting shares, nominal value of one Euro cent (€0.01) per share.
In connection with the Merger, we assumed the obligations under the Fiat S.p.A. July 2004 Stock Options to CEO, the Fiat S.p.A. November 2006 Stock Option Plan and the Fiat S.p.A. 2012 Long Term Incentive Plan, which we refer to collectively as the Plans. As of the effectiveness of the Merger, there were an additional 31,163,334 common shares issuable under the Plans. As of the end of February 2015, all the rights related to the Plans were exercised by the CEO and the other beneficiaries.
Fiat Investments N.V. was incorporated with an issued capital of €200,000, fully paid and divided into 20,000,000 common shares having a nominal value of €0.01 each. Capital increased to € 350,000 on May 13, 2014.
On October 29, 2014, the Board of Directors of FCA resolved to authorize the issuance of up to a maximum of 90,000,000 common shares under the framework equity incentive plan which had been adopted before the closing of the Merger. Any issuance of shares thereunder in the period from 2014 to 2018 will be subject to the satisfaction of certain performance/retention requirements. Any issuances to directors will be subject to shareholder approval.
On December 16, 2014, FCA completed the following capital transactions:
|
•
|
FCA completed the sale of 100 million common shares, nominal value €0.01 per share, consisted of the common shares previously held by FCA as treasury shares and additional common shares that FCA issued to replenish the share capital canceled in accordance with applicable law following the exercise by Fiat S.p.A. shareholders of cash exit rights under Italian law in connection with the cross border merger of Fiat into FCA.
|
|
•
|
FCA issued an aggregate notional amount of U.S.$2,875 million of mandatory convertible securities due 2016. The mandatory convertible securities will be mandatorily converted into FCA common shares at the stated mandatory conversion date (December 15, 2016) unless earlier converted at the option of the holder or FCA or upon certain specified events in accordance with their terms.
|
|
•
|
The mandatory convertible securities will automatically convert on the Mandatory Conversion Date into a number of common shares equal to the conversion rate calculated based on the share price relative to the applicable market value (“AMV”), as defined in the prospectus, as follows:
|
|
•
|
Maximum Conversion Rate:
261,363,375 shares if the AMV is less than or equal to the Initial Price (U.S.$11), in aggregate the Maximum Number of Shares
|
|
•
|
A number of shares equivalent to the value of U.S.$100 (i.e., U.S.$100 / AMV), if Initial Price (U.S.$11) is less than the AMV and the AMV is less than the Threshold Appreciation Price (U.S.$12.925)
|
|
•
|
Minimum Conversion Rate:
222,435,875 shares if the AMV is greater than or equal to the Threshold Appreciation Price (U.S.$12.925), in aggregate the Minimum Number of Shares
|
|
•
|
Upon Mandatory Conversion:
Holders receive: (i) any deferred coupon payments, (ii) accrued and unpaid coupon payments in cash or in Shares at the election of the Group.
|
In accordance with the terms of the mandatory convertible securities, certain economic provisions of the mandatory convertible securities were adjusted, effective as of January, 15, 2016, as a consequence of the spin-off of the common shares of Ferrari N.V. to the holders of the mandatory convertible securities:
|
•
|
Initial Price was adjusted from U.S.$11.00 to U.S.$7.1244
|
|
•
|
Threshold Appreciation Price was adjusted from U.S.$12.9250 to U.S.$8.3712
|
|
•
|
Stated Amount was adjusted from U.S.$100.00 to U.S.$64.7675
|
137
|
•
|
The common share prices included within the definition of “Early Conversion Rate” applicable to a “fundamental change” (as defined in the prospectus of the Mandatory Convertible Securities) were also adjusted.
|
The relevant fraction used to affect the adjustments noted above was calculated using the average of the daily Volume Weighted Average Price (“VWAP”) from January 4, 2016 to January 15, 2016 for both FCA common shares and Ferrari N.V. common shares.
At December 31, 2014 there were 1,250,000 common shares reserved for issuance under the FCA Non-Executive Directors’ Compensation Plan in the following 5 years. During 2015, a total of 83,172 common shares were issued at fair market value. Fair market value equals the average of the highest and lowest sale price of a common share during normal trading hours on the NYSE on the last trading day of the applicable plan year quarter. On January 11, 2016, an additional 37,897 common shares were issued at fair market value.
FCA common shares are registered shares represented by an entry in the share register of FCA. The FCA Board of Directors may determine that, for the purpose of trading and transfer of shares on a foreign stock exchange, such share certificates shall be issued in such form as shall comply with the requirements of such foreign stock exchange. A register of shareholders is maintained by FCA in the Netherlands and a branch register is maintained in the U.S. on FCA’s behalf by the Transfer Agent, which serves as branch registrar and transfer agent.
Beneficial interests in FCA common shares that are traded on the NYSE are held through the book-entry system provided by The Depository Trust Company (DTC) and are registered in FCA’s register of shareholders in the name of Cede & Co., as DTC’s nominee. Beneficial interests in the FCA common shares traded on the MTA are held through Monte Titoli S.p.A., the Italian central clearing and settlement system, as a participant in DTC.
Directors
Set forth below is a summary description of the material provisions of the FCA Articles of Association (the “FCA Articles of Association”), relating to our directors. The summary does not restate the Articles of Association in their entirety.
FCA’s directors serve on the FCA Board of Directors for a term of approximately one year, such term ending on the day that the first annual general meeting of the shareholders is held in the following calendar year. FCA’s shareholders appoint the directors of the FCA Board of Directors at a general meeting. Each director may be reappointed for an unlimited number of terms. The general meeting of shareholders determines whether a director is an executive director or a non-executive director.
The FCA Board of Directors is a single board and consists of three or more members, comprising both members having responsibility for the day-to-day management of FCA (executive directors) and members not having such day-to-day responsibility (non-executive directors). The tasks of the executive and non-executive directors in a one-tier board such as FCA’s Board of Directors may be allocated under or pursuant to the FCA Articles of Association, provided that the general meeting has stipulated whether such director is appointed as executive or as non-executive director and furthermore provided that the task to supervise the performance by the directors of their duties can only be performed by the non-executive directors. In addition, an executive director may not be appointed chairman of the board or delegated the task of establishing the remuneration of executive directors or nominating directors for appointment. Tasks that are not allocated fall within the power of the FCA Board of Directors as a whole. Regardless of an allocation of tasks, all directors remain collectively responsible for the proper management and strategy of FCA (including supervision thereof in case of non-executive directors).
FCA has a policy in respect of the remuneration of the members of the FCA Board of Directors. With due observation of the remuneration policy, the FCA Board of Directors may determine the remuneration for the directors in respect of the performance of their duties. The FCA Board of Directors must submit to the general meeting of shareholders for its approval plans to award shares or the right to subscribe for shares.
FCA shall not grant the directors any personal loans or guarantees.
138
Loyalty Voting Structure
FCA issued special voting shares with a nominal value of one Euro cent (€0.01) per share, to those shareholders of Fiat who elected to receive such special voting shares upon closing of the Merger in addition to FCA common shares, provided they met the conditions more fully described under “Terms and Conditions of the Special Voting Shares” below.
Subject to meeting certain conditions, FCA common shares can be registered in the loyalty register of FCA, or the Loyalty Register, and may qualify as qualifying common shares, or the Qualifying Common Shares. The holder of Qualifying Common Shares are entitled to receive without consideration one FCA special voting share in respect of each such Qualifying Common Share. Pursuant to the terms and conditions of the FCA special voting shares, or the Terms and Conditions, and for so long as the FCA common shares remain in the Loyalty Register, such FCA common shares shall not be sold, disposed of, transferred, except in very limited circumstances (
i.e.,
transfers to affiliates or to relatives through succession, donation or other transfers (defined in the Terms and Conditions as, the Loyalty Transferee), but a shareholder may create or permit to exist any pledge lien, fixed or floating charge or other encumbrance over such FCA common shares, provided that the voting rights in respect of such FCA common shares and any corresponding special voting shares remain with such shareholder at all times. FCA’s shareholders who want to directly or indirectly sell, dispose of, trade or transfer such FCA common shares or otherwise grant any right or interest therein, or create or permit to exist any pledge, lien, fixed or floating charge or other encumbrance over such FCA common shares with a potential transfer of voting rights relating to such encumbrances will need to submit a de-registration request as referred to in the Terms and Conditions, in order to transfer the relevant FCA common shares to the regular trading system (“the Regular Trading System”) except that an FCA shareholder may transfer FCA common shares included in the Loyalty Register to a Loyalty Transferee (as defined in the Terms and Conditions) of such FCA shareholder without transferring such shares from the Loyalty Register to the Regular Trading System.
FCA’s shareholders who seek to qualify to receive special voting shares can also request to have their FCA common shares registered in the Loyalty Register. Upon registration in the Loyalty Register such shares will be eligible to be treated as Qualifying Common Shares, provided they meet the conditions more fully described under “Terms and Conditions of the Special Voting Shares” below.
Notwithstanding the fact that Article 13 of the FCA Articles of Association permits the Board of Directors of FCA to approve transfers of special voting shares, the special voting shares cannot be traded and are transferrable only in very limited circumstances (
i.e.,
to a Loyalty Transferee described above, or to FCA for no consideration (
om niet
)).
The special voting shares have immaterial economic entitlements. Such economic entitlements are designed to comply with Dutch law but are immaterial for investors. The special voting shares carry the same voting rights as FCA common shares.
Section 10 of the Terms and Conditions include liquidated damages provisions intended to deter any attempt by holders to circumvent the terms of the special voting shares. Such liquidated damages provisions may be enforced by FCA by means of a legal action brought by FCA before competent courts of Amsterdam, the Netherlands. In particular, a violation of the provisions of the Terms and Conditions concerning the transfer of special voting shares, “Electing Common Shares” (common shares registered in the Loyalty Register for the purpose of becoming Qualifying Common Shares in accordance with the FCA Articles of Association) and Qualifying Common Shares may lead to the imposition of liquidated damages. Because we expect the restrictions on transfers of the special voting shares to be effective in practice we do not expect the liquidated damages provisions to be used.
Pursuant to Section 12 of the Terms and Conditions, any amendment to the Terms and Conditions (other than merely technical, non-material amendments and unless such amendment is required to ensure compliance with applicable law or regulations or the listing rules of any securities exchange on which the FCA common shares are listed) may only be made with the approval of the general meeting of shareholders of FCA.
At any time, a holder of Qualifying Common Shares or Electing Common Shares may request the de-registration of such shares from the Loyalty Register to enable free trading thereof in the “Regular Trading System”. Upon the de-registration from the Loyalty Register, such shares will cease to be Electing Common Shares or Qualifying Common Shares as the case may be and will be freely tradable and voting rights attached to the corresponding special voting shares will be suspended with immediate effect and such special voting shares shall be transferred to FCA for no consideration (
om niet
).
139
Terms and Conditions of the Special Voting Shares
The Terms and Conditions apply to the issuance, allocation, acquisition, holding, repurchase and transfer of special voting shares in the share capital of FCA and to certain aspects of Electing Common Shares, Qualifying Common Shares and FCA common shares, which are or will be registered in the Loyalty Register.
Application for Special Voting Shares
An FCA shareholder may at any time elect to participate in the loyalty voting structure by requesting that FCA register all or some of the number of FCA common shares held by such FCA shareholder in the Loyalty Register. Such election shall be effective and registration in the Loyalty Register shall occur as of the end of the calendar month during which the election is made. If such FCA common shares (i.e. Electing Common Shares) have been registered in the Loyalty Register (and thus blocked from trading in the Regular Trading System) for an uninterrupted period of three years in the name of the same shareholder, the holder of such FCA common shares will be entitled to receive one FCA special voting share for each such FCA common share that has been registered. If at any moment in time such FCA common shares are de-registered from the Loyalty Register for whatever reason, the relevant shareholder loses its entitlement to hold a corresponding number of FCA special voting shares.
Withdrawal of Special Voting Shares
As described above, a holder of Qualifying Common Shares or Electing Common Shares may request that some or all of its Qualifying Common Shares or Electing Common Shares be de-registered from the Loyalty Register and if held outside the Regular Trading System, transfer such shares back to the Regular Trading System, which will allow such shareholder to freely trade its FCA common shares, as described below. From the moment of such request, the holder of Qualifying Common Shares shall be considered to have waived his rights to cast any votes associated with the FCA special voting shares which were issued and allocated in respect of such Qualifying Common Shares. Any such request would automatically trigger a mandatory transfer requirement pursuant to which the FCA special voting shares will be offered and transferred to FCA for no consideration (
om niet
) in accordance with the FCA Articles of Association and the Terms and Conditions. FCA may continue to hold the special voting shares as treasury stock, but will not be entitled to vote any such treasury stock. Alternatively, FCA may withdraw and cancel the special voting shares, as a result of which the nominal value of such shares will be allocated to the special capital reserves of FCA. Consequently, the loyalty voting feature will terminate as to the relevant Qualifying Common Shares being deregistered from the Loyalty Register. No shareholder required to transfer special voting shares pursuant to the Terms and Conditions shall be entitled to any purchase price for such special voting shares and each shareholder expressly waives any rights in that respect as a condition to participation in the loyalty voting structure.
Change of Control
A shareholder who is a holder of Qualifying Common Shares or Electing Common Shares must promptly notify the Agent and FCA upon the occurrence of a “change of control” as defined in the FCA Articles of Association, as described below. The change of control will trigger the de-registration of the relevant Electing Common Shares or Qualifying Common Shares or the relevant FCA common shares in the Loyalty Register. The voting rights attached to the special voting shares issued and allocated in respect of the relevant Qualified Common Shares will be suspended upon a direct or indirect change of control in respect of the relevant holder of such Qualifying Common Shares that are registered in the Loyalty Register.
For the purposes of this section a “change of control” shall mean, in respect of any FCA shareholder that is not an individual (
natuurlijk persoon
), any direct or indirect transfer in one or a series of related transactions as a result of which (i) a majority of the voting rights of such shareholder, (ii) the de facto ability to direct the casting of a majority of the votes exercisable at general meetings of shareholders of such shareholder and/or (iii) the ability to appoint or remove a majority of the directors, executive directors or board members or executive officers of such shareholder or to direct the casting of a majority or more of the voting rights at meetings of the board of directors, governing body or executive committee of such shareholder has been transferred to a new owner, provided that no change of control shall be deemed to have occurred if (a) the transfer of ownership and/or control is an intragroup transfer under the same parent company, (b) the transfer of ownership and /or control is the result of the succession or the liquidation of assets between spouses or the inheritance,
inter vivos
donation or other transfer to a spouse or a relative up to and including the fourth degree or (c) the fair market value of the Qualifying Common Shares held by such shareholder represents less than twenty percent (20%) of the total assets of the Transferred Group at the time of the transfer and the Qualifying Common Shares held by such shareholder, in the sole
140
judgment of the company, are not otherwise material to the Transferred Group or the change of control transaction. “Transferred Group” shall mean the relevant shareholder together with its affiliates, if any, over which control was transferred as part of the same change of control transaction within the meaning of the definition of change of control.
Liability to Further Capital Calls
All of the outstanding FCA common shares are fully paid and non-assessable.
Discriminating Provisions
There are no provisions of the FCA Articles of Association that discriminate against a shareholder because of its ownership of a substantial number of shares.
Additional Issuances and Rights of Preference
Issuance of Shares
The general meeting of shareholders of FCA, or the General Meeting, has the authority to resolve on any issuance of shares. In such a resolution, the General Meeting must determine the price and other terms of issuance. The Board of Directors of FCA may have the power to issue shares if it has been authorized to do so by the General Meeting, or pursuant to the FCA Articles of Association. Under Dutch law, such authorization may not exceed a period of five years, but may be renewed by a resolution of the General Meeting for subsequent five-year periods at any time. The FCA Board of Directors has been designated by the FCA Articles of Association as the competent body to issue FCA common shares and special voting shares up to the maximum aggregate amount of the FCA authorized share capital for an initial period of five years from October 12, 2014, which may be extended by the General Meeting with additional consecutive periods of up to a maximum of five years each.
FCA will not be required to obtain approval from a General Meeting of shareholders to issue shares pursuant to the exercise of a right to subscribe for shares that was previously granted pursuant to authority granted by the shareholders or pursuant to delegated authority by the Board of Directors. The general meeting of shareholders of FCA shall, for as long as any such designation of the Board of Directors for this purpose is in force, no longer has authority to decide on the issuance of shares.
Rights of Pre-emption
Under Dutch law and the FCA Articles of Association, each FCA shareholder has a right of pre-emption in proportion to the aggregate nominal value of its shareholding upon the issuance of new FCA common shares (or the granting of rights to subscribe for FCA common shares). Exceptions to this right of pre-emption include the issuance of new FCA common shares (or the granting of rights to subscribe for common shares): (i) to employees of FCA or another member of its Group pursuant to a stock compensation plan of FCA, (ii) against payment in kind (contribution other than in cash) and (iii) to persons exercising a previously granted right to subscribe for FCA common shares.
In the event of an issuance of special voting shares, shareholders shall not have any right of pre-emption.
The General Meeting may resolve to limit or exclude the rights of pre-emption upon an issuance of FCA common shares, which resolution requires approval of at least two-thirds of the votes cast, if less than half of the issued share capital is represented at the General Meeting. The FCA Articles of Association or the General Meeting may also designate the FCA Board of Directors to resolve to limit or exclude the rights of pre-emption in relation to the issuance of FCA common shares. Pursuant to Dutch law, the designation by the General Meeting may be granted to the FCA Board of Directors for a specified period of time of not more than five years and only if the FCA Board of Directors has also been designated or is simultaneously designated the authority to resolve to issue FCA common shares. The FCA Board of Directors is designated in the FCA Articles of Association as the competent body to exclude or limit rights of pre-emption for an initial period of five years from October 12, 2014 which may be extended by the General Meeting with additional periods up to a maximum of five years per period.
141
Repurchase of Shares
Upon agreement with the relevant FCA shareholder, FCA may acquire its own shares at any time for no consideration (
om niet
), or subject to certain provisions of Dutch law and the FCA Articles of Association for consideration, if: (i) FCA’s shareholders’ equity less the payment required to make the acquisition does not fall below the sum of called-up and paid-in share capital and any statutory reserves, (ii) FCA and its subsidiaries would thereafter not hold shares or hold a pledge over FCA common shares with an aggregate nominal value exceeding 50 percent of the FCA’s issued share capital and (iii) the FCA Board of Directors has been authorized to do so by the General Meeting.
The acquisition of fully paid-up shares by FCA other than for no consideration (
om niet
) requires authorization by the General Meeting. Such authorization may be granted for a period not exceeding 18 months and shall specify the number of shares, the manner in which the shares may be acquired and the price range within which shares may be acquired. The authorization is not required for the acquisition of shares for employees of FCA or another member of its Group, under a scheme applicable to such employees and no authorization is required for repurchase of shares acquired in certain other limited circumstances in which the acquisition takes place by operation of law, such as pursuant to mergers or demergers. Such shares must be officially listed on a price list of an exchange.
At a General Meeting the shareholders may resolve to designate the Board of Directors as the competent body to resolve on FCA acquiring any FCA’s fully paid up FCA common shares other than for no consideration (
om niet
) for a period of up to 18 months.
FCA may, jointly with its subsidiaries, hold FCA shares in its own capital exceeding one-tenth of its issued capital for no more than three years after acquisition of such FCA shares for no consideration (om niet) or in certain other limited circumstances in which the acquisition takes place by operation of law, such as pursuant to mergers or demergers. Any FCA shares held by FCA in excess of the amount permitted shall transfer to all members of the FCA Board of Directors jointly at the end of the last day of such three year period. Each member of the FCA Board of Directors shall be jointly and severally liable to compensate FCA for the value of the FCA shares at such time, with interest at the statutory rate thereon from such time. The term FCA shares in this paragraph shall include depositary receipts for shares and shares in respect of which FCA holds a right of pledge.
No votes may be cast at a General Meeting on the FCA shares held by FCA or its subsidiaries. Also no voting rights may be cast at a General Meeting in respect of FCA shares for which depositary receipts have been issued that are owned by FCA. Nonetheless, the holders of a right of usufruct or pledge in respect of shares held by FCA and its subsidiaries in FCA’s share capital are not excluded from the right to vote on such shares, if the right of usufruct or pledge was granted prior to the time such shares were acquired by FCA or its subsidiaries. Neither FCA nor any of its subsidiaries may cast votes in respect of a share on which it or its subsidiaries holds a right of usufruct or pledge. No right of pledge may be established on special voting shares and the voting rights attributable to special voting shares may not be assigned to a usufructuary.
Reduction of Share Capital
Shareholders at a General Meeting have the power to cancel shares acquired by FCA or to reduce the nominal value of the shares. A resolution to reduce the share capital requires a majority of at least two-thirds of the votes cast at the General Meeting, if less than one-half of the issued capital is present or represented at the meeting. If more than one-half of the issued share capital is present or represented at the meeting, a simple majority of the votes cast at the General Meeting is required. Any proposal for cancellation or reduction of nominal value is subject to general requirements of Dutch law with respect to reduction of share capital.
Transfer of Shares
In accordance with the provisions of Dutch law, pursuant to Article 12 of the FCA Articles of Association, the transfer or creation of shares or a right
in rem
thereon requires a deed of transfer executed before a Dutch civil law notary, unless shares are (or shall shortly be) admitted to trading on a regulated market or multilateral trading facility as referred to in Article 1:1 of the Dutch Financial Supervision Act or a system comparable to a regulated market or multilateral trading facility.
142
The transfer of FCA common shares that have not been entered into a book-entry system will be effected in accordance with Article 12 of the FCA Articles of Association.
Common shares that have been entered into the DTC book-entry system will be registered in the name of Cede & Co., as nominee for DTC and transfers of beneficial ownership of shares held through DTC will be effected by electronic transfer made by DTC participants. Article 12 of the FCA Articles of Association does not apply to the trading of such FCA common shares on a regulated market or the equivalent thereof.
Transfers of shares held outside of DTC (including Monte Titoli S.p.A., as a participant in DTC) or another direct registration system maintained by Computershare US, FCA’s transfer agent in New York, or the Transfer Agent, and not represented by certificates are effected by a stock transfer instrument and require the written acknowledgement by FCA. Transfer of registered certificates is effected by presenting and surrendering the certificates to the Transfer Agent. A valid transfer requires the registered certificates to be properly endorsed for transfer as provided for in the certificates and accompanied by proper instruments of transfer and stock transfer tax stamps for, or funds to pay, any applicable stock transfer taxes.
FCA common shares are freely transferrable. As described below, special voting shares are generally not transferrable.
At any time, a holder of FCA common shares that are registered in the Loyalty Register (i.e. Electing Common Shares or Qualifying Common Shares) wishing to transfer such FCA common shares other than in limited specified circumstances (
i.e.,
transfers to affiliates or to relatives through succession, donation or other transfers) must first request a de-registration of such shares from the Loyalty Register and if held outside the Regular Trading System, transfer such common shares back into the Regular Trading System. After de-registration from the Loyalty Register, such FCA common shares no longer qualify as Electing Common Shares or Qualifying Common Shares, as a result, the holder of such FCA common shares is required to offer and transfer the special voting shares associated with such FCA common shares that were previously Qualifying Common Shares to FCA for no consideration (
om niet
) as described in detail in “-Loyalty Voting Structure-Terms and Conditions of the Special Voting Shares-Withdrawal of Special Voting Shares.”
Annual Accounts and Independent Auditor
FCA’s financial year is the calendar year. Pursuant to FCA’s deed of incorporation, the first financial year of FCA ended on December 31, 2014. Within four months after the end of each financial year, the FCA Board of Directors will prepare the annual accounts, which must be accompanied by an annual report and an auditor’s report and will publish the accounts and annual report and will make those available for inspection at FCA’s registered office. All members of the FCA Board of Directors are required to sign the annual accounts and in case the signature of any member is missing, the reason for this must be stated. The annual accounts are to be adopted by the General Meeting at the annual general meeting of shareholders, at which meeting the members of the FCA Board of Directors will be discharged from liability for performance of their duties with respect to any matter disclosed in the annual accounts the relevant financial year insofar this appears from the annual accounts. The annual accounts, the annual report and independent auditor’s report are made available through FCA’s website to the shareholders for review as from the day of the notice convening the annual general meeting of shareholders.
Payment of Dividends
FCA may make distributions to the shareholders and other persons entitled to the distributable profits only to the extent that its shareholders’ equity exceeds the sum of the paid-up portion of the share capital and the reserves that must be maintained in accordance with Dutch law. No distribution of profits may be made to FCA itself for shares that FCA holds in its own share capital.
FCA may only make a distribution of dividends to the shareholders after the adoption of its statutory annual accounts demonstrating that such distribution is legally permitted. The FCA Board of Directors may determine that other freely distributable distributions shall be made, in whole or in part, from FCA’s share premium reserve or from any other reserve, provided that payments from reserves may only be made to the shareholders that are entitled to the relevant reserve upon the dissolution of FCA and provided further that the policy of FCA on additions to reserves and dividends is duly observed.
143
Holders of special voting shares will not receive any dividend in respect of the special voting shares, however FCA maintains a separate dividend reserve for the special voting shares for the sole purpose of the allocation of the mandatory minimal profits that accrue to the special voting shares. This allocation establishes a reserve for the amount that would otherwise be paid. The special voting shares do not carry any entitlement to any other reserve. Any distribution out of the special dividend reserve or the partial or full release of such reserve requires a prior proposal from the FCA Board of Directors and a subsequent resolution of the meeting of holders of special voting shares.
Insofar as the profits have not been distributed or allocated to the reserves, they may, by resolution of the General Meeting, be distributed as dividends on the FCA common shares only. The General Meeting may resolve, on the proposal of the FCA Board of Directors, to declare and distribute dividends in U.S.$. The FCA Board of Directors may decide, subject to the approval of the General Meeting and the FCA Board of Directors having been designated as the body competent to pass a resolution for the issuance of shares, that a distribution shall, wholly or partially, be made in the form of shares, or that shareholders shall be given the option to receive a distribution either in cash or in the form of shares.
The right to dividends and distributions will lapse if the dividends or distributions are not claimed within five years following the day after the date on which they first became payable. Any dividends or other distributions made in violation of the FCA Articles of Association or Dutch law will have to be repaid by the shareholders who knew or should have known, of such violation.
General Meetings and Voting Rights
Annual Meeting
An annual General Meeting must be held within six months from the end of FCA’s preceding financial year. The purpose of the annual General Meeting is to discuss, among other things, the annual report, the adoption of the annual accounts, allocation of profits (including the proposal to distribute dividends), release of members of the FCA Board of Directors from liability for their management and supervision, and other proposals brought up for discussion by the FCA Board of Directors.
General Meeting and Place of Meetings
Other General Meetings will be held if requested by the FCA Board of Directors, the Chairman or the Chief Executive Officer, or as otherwise required by Dutch law, or by the written request (stating the exact subjects to be discussed) of one or more shareholders representing in aggregate at least 10 percent of the issued share capital of the company (taking into account the relevant provisions of Dutch law, and the FCA Articles of Association and the applicable stock exchange regulations). General Meetings will be held in Amsterdam or Haarlemmermeer (Schiphol Airport), the Netherlands.
Convocation Notice and Agenda
General Meetings can be convened by a notice, specifying the subjects to be discussed, the place and the time of the meeting and admission and participation procedure, issued at least 42 days before the meeting. All convocations, announcements, notifications and communications to shareholders and other persons entitled to attend the General Meeting must be made on the company’s corporate website in accordance with the relevant provisions of Dutch law. The agenda for a General Meeting may contain the items requested by one or more shareholders representing at least three percent of the issued share capital of the company, taking into account the relevant provisions of Dutch law. Requests must be made in writing, including the reasons for adding the relevant item on the agenda, and received by the FCA Board of Directors at least 60 days before the day of the meeting.
Admission and Registration
Each shareholder entitled to vote, and each person holding a usufruct or pledge to whom the right to vote on the FCA common shares accrues, shall be authorized to attend the General Meeting, to address the General Meeting and to exercise its voting rights. The registration date of each General Meeting is the twenty-eighth day prior to the date of the General Meeting so as to establish which shareholders are entitled to attend and vote at the General Meeting. Only holders of shares and other persons entitled to vote or attend the General Meeting, at such registration date are entitled to attend and vote at the General Meeting. The convocation notice for the meeting shall state the registration date and the manner in which the persons entitled to attend the General Meeting may register and exercise their rights.
144
Those entitled to attend a General Meeting may be represented at a General Meeting by a proxy authorized in writing. The requirement that a proxy must be in written form is also fulfilled when it is recorded electronically.
Members of the FCA Board of Directors have the right to attend a General Meeting. In these General Meetings they have an advisory role.
Voting Rights
Each FCA common share and each special voting share confers the right on the holder to cast one vote at a General Meeting. Resolutions are passed by a simple majority of the votes cast, unless Dutch law or the FCA Articles of Association prescribes a larger majority. Under Dutch law and/or the FCA Articles of Association, the following matters require at least two-thirds of the votes cast at a meeting if less than half of the issued share capital is present or represented:
|
•
|
a resolution to reduce the issued share capital;
|
|
•
|
a resolution to amend the FCA Articles of Association;
|
|
•
|
a resolution to restrict or exclude rights of pre-emption;
|
|
•
|
a resolution to authorize the FCA Board of Directors to restrict or exclude shareholder rights of pre-emption;
|
|
•
|
a resolution to enter into a legal merger or a legal demerger; or
|
|
•
|
a resolution to dissolve FCA.
|
Shareholders’ Votes on Certain Transactions
Any important change in the identity or character of FCA must be approved by the General Meeting, including (i) the transfer to a third party of the business of FCA or practically the entire business of FCA; (ii) the entry into or breaking off of any long-term cooperation of FCA or a subsidiary with another legal entity or company or as a fully liable partner of a general partnership or limited partnership, where such entry into or breaking off is of far-reaching importance to FCA; and (iii) the acquisition or disposal by FCA or a subsidiary of an interest in the capital of a company with a value of at least one-third of FCA’s assets according to the Consolidated Statement of Financial Position with explanatory notes included in the last adopted annual accounts of FCA.
Amendments to the FCA Articles of Association, including Variation of Rights
A resolution of the General Meeting to amend the FCA Articles of Association or to wind up FCA may be approved only if proposed by the FCA Board of Directors and must be approved by a vote of a majority of at least two-thirds of the votes cast if less than one-half of the issued share capital is present or represented at such General Meeting.
The rights of shareholders may be changed only by amending the FCA Articles of Association in compliance with Dutch law.
Dissolution and Liquidation
The General Meeting may resolve to dissolve FCA, upon a proposal of the FCA Board of Directors thereto. A majority of at least two-thirds of the votes cast shall be required if less than one-half of the issued capital is present or represented at the meeting. In the event of dissolution, FCA will be liquidated in accordance with Dutch law and the FCA Articles of Association and the liquidation shall be arranged by the members of the FCA Board of Directors, unless the General Meeting appoints other liquidators. During liquidation, the provisions of the FCA Articles of Association will remain in force as long as possible.
145
If FCA is dissolved and liquidated, whatever remains of FCA’s equity after all its debts have been discharged shall first be applied to distribute the aggregate balance of share premium reserves and other reserves (other than the special dividend reserve), to holders of FCA common shares in proportion to the aggregate nominal value of the FCA common shares held by each holder; secondly, from any balance remaining, an amount equal to the aggregate amount of the nominal value of the FCA common shares will be distributed to the holders of FCA common shares in proportion to the aggregate nominal value of FCA common shares held by each of them; thirdly, from any balance remaining, an amount equal to the aggregate amount of the special voting shares dividend reserve will be distributed to the holders of special voting shares in proportion to the aggregate nominal value of the special voting shares held by each of them; fourthly, from any balance remaining, the aggregate amount of the nominal value of the special voting shares will be distributed to the holders of special voting shares in proportion to the aggregate nominal value of the special voting shares held by each of them; and, lastly, any balance remaining will be distributed to the holders of FCA common shares in proportion to the aggregate nominal value of FCA common shares held by each of them.
Liability of Directors
Under Dutch law, the management of a company is a joint undertaking and each member of the Board of Directors can be held jointly and severally liable to FCA for damages in the event of improper or negligent performance of their duties. Further, members of the Board of Directors can be held liable to third parties based on tort, pursuant to certain provisions of the Dutch Civil Code. All directors are jointly and severally liable for failure of one or more co-directors. An individual director is only exempted from liability if he proves that he cannot be held seriously culpable for the mismanagement and that he has not been negligent in seeking to prevent the consequences of the mismanagement. In this regard a director may, however, refer to the allocation of tasks between the directors. In certain circumstances, directors may incur additional specific civil and criminal liabilities.
Indemnification of Directors and Officers
Under Dutch law, indemnification provisions may be included in a company’s articles of association. Under the FCA Articles of Association, FCA is required to indemnify its directors, officers, former directors, former officers and any person who may have served at FCA’s request as a director or officer of another company in which FCA owns shares or of which FCA is a creditor who were or are made a party or are threatened to be made a party or are involved in, any threatened, pending or completed action, suit, or proceeding, whether civil, criminal, administrative, arbitrative or investigative (each a “Proceeding”), or any appeal in such a Proceeding or any inquiry or investigation that could lead to such a Proceeding, against any and all liabilities, damages, reasonable and documented expenses (including reasonably incurred and substantiated attorney’s fees), financial effects of judgments, fines, penalties (including excise and similar taxes and punitive damages) and amounts paid in settlement in connection with such Proceeding by any of them. Notwithstanding the above, no indemnification shall be made in respect of any claim, issue or matter as to which any of the above-mentioned indemnified persons shall be adjudged to be liable for gross negligence or willful misconduct in the performance of such person’s duty to FCA. This indemnification by FCA is not exclusive of any other rights to which those indemnified may be entitled otherwise. FCA has purchased directors’ and officers’ liability insurance for the members of the Board of Directors and certain other officers, substantially in line with that purchased by similarly situated companies.
Dutch Corporate Governance Code
The Dutch Corporate Governance Code contains principles and best practice provisions that regulate relations between the board and the shareholders (e.g. the General Meeting). The Dutch Corporate Governance Code is divided into five sections which address the following topics: (i) compliance with and enforcement of the Dutch Corporate Governance Code; (ii) the management board, including matters such as the composition of the board, selection of board members and director qualification standards, director responsibilities, board committees and term of appointment; (iii) the supervisory board or the non-executive directors in a one-tier board; (iv) the shareholders and the general meeting of shareholders; and (v) the audit of the financial reporting and the position of the internal audit function and the external auditor.
Dutch companies whose shares are listed on a government-recognized stock exchange, such as the NYSE or the MTA, are required under Dutch law to disclose in their annual reports whether or not they apply the provisions of the Dutch Corporate Governance Code and, in the event that they do not apply a certain provision, to explain the reasons why they have chosen to deviate.
146
FCA acknowledges the importance of good corporate governance and supports the best practice provisions of the Dutch Corporate Governance Code. Therefore, FCA intends to comply with the relevant best practice provisions of the Dutch Corporate Governance Code except as may be noted from time to time in FCA’s annual reports.
Disclosure of Holdings under Dutch Law
As a result of the listing of the FCA common shares on the MTA, chapter 5.3 of the Dutch Financial Supervision Act (“AFS”) applies, pursuant to which any person who, directly or indirectly, acquires or disposes of an actual or potential capital interest and/or actual or potential voting rights in FCA must immediately give written notice to the AFM of such acquisition or disposal by means of a standard form if, as a result of such acquisition or disposal, the percentage of capital interest and/or voting rights held by such person reaches, exceeds or falls below the following thresholds: 3 percent, 5 percent, 10 percent, 15 percent, 20 percent, 25 percent, 30 percent, 40 percent, 50 percent, 60 percent, 75 percent and 95 percent.
For the purpose of calculating the percentage of capital interest or voting rights, the following interests must,
inter alia
, be taken into account: (i) shares and/or voting rights directly held (or acquired or disposed of) by any person, (ii) shares and/or voting rights held (or, acquired or disposed of) by such person’s controlled entities or by a third party for such person’s account, (iii) voting rights held (or acquired or disposed of) by a third party with whom such person has concluded an oral or written voting agreement, (iv) voting rights acquired pursuant to an agreement providing for a temporary transfer of voting rights in consideration for a payment, and (v) shares which such person, or any controlled entity or third party referred to above, may acquire pursuant to any option or other right to acquire shares.
As a consequence of the above, special voting shares shall be added to FCA common shares for the purposes of the above thresholds.
Controlled entities (within the meaning of the AFS) do not themselves have notification obligations under the AFS as their direct and indirect interests are attributed to their (ultimate) parent. If a person who has a three percent or larger interest in FCA’s share capital or voting rights ceases to be a controlled entity it must immediately notify the AFM and all notification obligations under the AFS will become applicable to such former controlled entity.
Special rules apply to the attribution of shares and/or voting rights which are part of the property of a partnership or other form of joint ownership. A holder of a pledge or right of usufruct in respect of shares can also be subject to notification obligations, if such person has, or can acquire, the right to vote on the shares. The acquisition of (conditional) voting rights by a pledgee or beneficial owner may also trigger notification obligations as if the pledgee or beneficial owner were the legal holder of the shares and/or voting rights.
Furthermore, when calculating the percentage of capital interest, a person is also considered to be in possession of shares if (i) such person holds a financial instrument the value of which is (in part) determined by the value of the shares or any distributions associated therewith and which does not entitle such person to acquire any shares, (ii) such person may be obliged to purchase shares on the basis of an option, or (iii) such person has concluded another contract whereby such person acquires an economic interest comparable to that of holding a share.
If a person’s capital interest and/or voting rights reaches, exceeds or falls below the above-mentioned thresholds as a result of a change in FCA’s issued and outstanding share capital or voting rights, such person is required to make a notification not later than on the fourth trading day after the AFM has published FCA’s notification as described below.
Following the implementation of Directive 2013/50/EU into the AFS, every holder of three percent more of the issued and outstanding share capital or voting rights whose interest has changed compared to his most recent notification, and which holder knows or should know that pursuant to this change his interest reaches or crosses a threshold as a result of certain acts (as described above and including the exchange of a financial instrument or a contract (pursuant to which the holder is deemed to have issued and outstanding shares or voting rights at his disposal)), must notify the AFM of this change.
FCA is required to notify the AFM promptly of any change of one percent or more in its issued and outstanding share capital or voting rights since a previous notification. Other changes in FCA’s issued and outstanding share capital or voting rights must be notified to the AFM within eight days after the end of the quarter in which the change occurred.
147
Each person whose holding of capital interest or voting rights at the date FCA common shares are listed on the MTA amounts to three percent or more of FCA’s issued and outstanding share capital, must notify the AFM of such holding without delay.
In addition to the above described notification obligations pertaining to capital interest or voting rights, pursuant to Regulation (EU) No 236/2012, notification must be made of any net short position of 0.2 percent in the issued share capital of FCA, and of every subsequent 0.1 percent above this threshold. Notifications starting at 0.5 percent and every subsequent 0.1 percent above this threshold will be made public via the short selling register of the AFM. Furthermore, gross short positions shall be notified in the event that a threshold is reached, exceeded or fallen below. The same subsequent disclosure thresholds as for holders of capital interests and/or voting rights apply.
Furthermore, each member of the Board of Directors must notify the AFM:
|
•
|
immediately after FCA common shares are listed on the MTA of the number of shares he/she holds and the number of votes he/she is entitled to cast in respect of FCA’s issued and outstanding share capital; and
|
|
•
|
subsequently of each change in the number of shares he/she holds and of each change in the number of votes he/she is entitled to cast in respect of FCA’s issued and outstanding share capital, immediately after the relevant change.
|
The AFM keeps a public register of all notifications made pursuant to these disclosure obligations and publishes any notification received which can be accessed via
www.afm.nl
. The notifications referred to in this paragraph should be made in writing by means of a standard form or electronically through the notification system of the AFM.
Non-compliance with these disclosure obligations is an economic offense and may lead to criminal prosecution. The AFM may impose administrative penalties for non-compliance, and the publication thereof. In addition, a civil court can impose measures against any person who fails to notify or incorrectly notifies the AFM of matters required to be notified. A claim requiring that such measures be imposed may be instituted by FCA and/or by one or more shareholders who alone or together with others represent at least three percent of the issued and outstanding share capital of FCA or are able to exercise at least three percent of the voting rights. The measures that the civil court may impose include:
|
•
|
an order requiring appropriate disclosure;
|
|
•
|
suspension of the right to exercise the voting rights for a period of up to three years as determined by the court;
|
|
•
|
voiding a resolution adopted by the General Meeting, if the court determines that the resolution would not have been adopted but for the exercise of the voting rights of the person with a duty to disclose, or suspension of a resolution adopted by the general meeting of shareholders until the court makes a decision about such voiding; and
|
|
•
|
an order to refrain, during a period of up to five years as determined by the court, from acquiring shares and/or voting rights in FCA.
|
Shareholders are advised to consult with their own legal advisers to determine whether the disclosure obligations apply to them.
Mandatory Bid Requirement
Under Dutch law any person, acting alone or in concert with others, who, directly or indirectly, acquires 30 percent or more of FCA’s voting rights will be obliged to launch a public offer for all outstanding shares in FCA’s share capital. An exception is made for shareholders who, whether alone or acting in concert with others, had an interest of at least 30 percent of FCA’s voting rights before the shares were first listed on the MTA and who still maintained such an interest after such first listing. Immediately after the first listing of FCA common shares on the MTA, Exor held more than 30 percent of FCA’s voting rights. Therefore Exor’s interest in FCA was grandfathered and the exception that applies to it will continue to apply to it for as long as its holding of shares represents over 30 percent of FCA’s voting rights.
148
Dutch Financial Reporting Supervision Act
On the basis of the Dutch Financial Reporting Supervision Act (Wet toezicht financiële verslaggeving), or the FRSA, the AFM supervises the application of financial reporting standards by, amongst others, companies whose corporate seat is in the Netherlands and whose securities are listed on a regulated Dutch or foreign stock exchange.
Pursuant to the FRSA, the AFM has an independent right to (i) request an explanation from us regarding our application of the applicable financial reporting standards and (ii) recommend to us the making available of further explanations. If we do not comply with such a request or recommendation, the AFM may request that the Enterprise Chamber order us to (i) make available further explanations as recommended by the AFM, (ii) provide an explanation of the way we have applied the applicable financial reporting standards to our financial reports or (iii) prepare our financial reports in accordance with the Enterprise Chamber’s instructions.
Compulsory Acquisition
Pursuant to article 2:92a of the Dutch Civil Code, a shareholder who, for its own account, holds at least 95 percent of the issued share capital of FCA may institute proceedings against the other shareholders jointly for the transfer of their shares to it. The proceedings are held before the Dutch Enterprise Chamber and can be instituted by means of a writ of summons served upon each of the minority shareholders in accordance with the provisions of the Dutch Code of Civil Procedure. The Enterprise Chamber may grant the claim for the squeeze-out in relation to all minority shareholders and will determine the price to be paid for the shares, if necessary after appointment of one or three expert(s) who will offer an opinion to the Enterprise Chamber on the value to be paid for the shares of the minority shareholders. Once the order to transfer becomes final before the Enterprise Chamber, the person acquiring the shares must give written notice of the date and place of payment and the price to the holders of the shares to be acquired whose addresses are known to it. Unless the addresses of all of them are known to it, it must also publish the same in a Dutch daily newspaper with a national circulation. A shareholder can only appeal against the judgment of the Enterprise Chamber before the Dutch Supreme Court.
In addition, pursuant to article 2:359c of the Dutch Civil Code, following a public offer, a holder of at least 95 percent of the issued share capital and of voting rights of FCA has the right to require the minority shareholders to sell their shares to it. Any such request must be filed with the Enterprise Chamber within three months after the end of the acceptance period of the public offer. Conversely, pursuant to article 2:359d of the Dutch Civil Code each minority shareholder has the right to require the holder of at least 95 percent of the issued share capital and the voting rights of FCA to purchase its shares in such case. The minority shareholder must file such claim with the Enterprise Chamber within three months after the end of the acceptance period of the public offer.
Disclosure of Trades in Listed Securities
Pursuant to the Dutch Financial Supervision Act, each of the members of the FCA Board of Directors and any other person who has managerial responsibilities within FCA and who in that capacity is authorized to make decisions affecting the future developments and business prospects of FCA and who has regular access to inside information relating, directly or indirectly, to FCA (each, an “Insider”) must notify the AFM of all transactions, conducted or carried out for his/her own account, relating to FCA common shares or financial instruments, the value of which is (in part) determined by the value of FCA common shares.
In addition, persons designated by the Market Abuse Decree (
Besluit melding zeggenschap en kapitaalbelang in uitgevende instellingen Wft)
, or the Market Abuse Decree, who are closely associated with members of the Board of Directors or any of the Insiders must notify the AFM of all transactions conducted for their own account relating to FCA’s shares or financial instruments, the value of which is (in part) determined by the value of FCA’s shares. The Market Abuse Decree designates the following categories of persons: (i) the spouse or any partner considered by applicable law as equivalent to the spouse, (ii) dependent children, (iii) other relatives who have shared the same household for at least one year at the relevant transaction date, and (iv) any legal person, trust or partnership, among other things, whose managerial responsibilities are discharged by a member of the Board of Directors or any other Insider or by a person referred to under (i), (ii) or (iii) above.
149
The AFM must be notified of transactions effected in either FCA’s shares or financial instruments, the value of which is (in part) determined by the value of FCA’s shares, no later than the fifth business day following the transaction date by means of a standard form. Notification may be postponed until the date that the value of the transactions carried out on a person’s own account, together with the transactions carried out by the persons associated with that person, reaches or exceeds the amount of €5,000 in the calendar year in question. The AFM keeps a public register of all notifications made pursuant to the AFS.
Non-compliance with these reporting obligations under the AFS could lead to criminal penalties, administrative fines and cease-and-desist orders (and the publication thereof), imprisonment or other sanctions.
Shareholder Disclosure and Reporting Obligations under U.S. Law
Holders of FCA shares are subject to certain U.S. reporting requirements under the Exchange Act, for shareholders owning more than 5 percent of any class of equity securities registered pursuant to Section 12 of the Exchange Act. Among the reporting requirements are disclosure obligations intended to keep investors aware of significant accumulations of shares that may lead to a change of control of an issuer.
If FCA were to fail to qualify as a foreign private issuer in the future, Section 16(a) of the Exchange Act would require FCA’s directors and executive officers, and persons who own more than ten percent of a registered class of FCA’s equity securities, to file reports of ownership of, and transactions in, FCA’s equity securities with the SEC. Such directors, executive officers and ten percent stockholders would also be required to furnish FCA with copies of all Section 16 reports they file.
Further disclosure requirements shall apply to FCA under Italian law by virtue of the listing of FCA’s shares on the MTA. Summarized below are the most significant disclosure requirements to be complied with by FCA. Further requirements may be imposed by CONSOB and/or Borsa Italiana S.p.A. upon admission to listing of FCA’s shares on the MTA.
The breach of the obligations described below may be used in the application of fines and criminal penalties (including, for instance, those provided for insider trading and market manipulation).
Disclosure Requirements under Italian law
Summarized below are the most significant requirements to be complied with by FCA in connection with the admission to listing of FCA common shares on the MTA. The breach of the obligations described below may result in the application of fines and criminal penalties (including, for instance, those provided for insider trading and market manipulation). Further requirements may be imposed by CONSOB and/or Borsa Italiana as a result of the listing of FCA common shares on the MTA.
In particular, the following main disclosure obligations provided for by the Legislative Decree no. 58/1998, or the Italian Financial Act, effective as of the date of this report shall apply to FCA, article 92 (equal treatment principle), article 114 (information to be provided to the public), article 114-
bis
(information to be provided to the market concerning the allocation of financial instruments to corporate officers, employees and collaborators), article 115 (information to be disclosed to CONSOB), article 115-
bis
(register of persons having access to inside information) and article 180 and the following (relating to insider trading and market manipulation). In addition to the above, the applicable provisions set forth under the market rules (including those relating to the timing for the payment of dividends) shall apply to FCA.
Disclosure of Inside Information
Pursuant to the Italian Financial Act, FCA shall disclose to the public, without delay, any inside information which: (i) is specific, (ii) has not been made public, (iii) relates, directly or indirectly, to FCA or FCA’s common shares, and (iv) if it were made public, would be likely to have a material impact on the prices of FCA’s common shares (the “Inside Information”). In this regard, Inside Information shall be deemed specific if: (a) it refers to a set of circumstances which exists or may reasonably be expected to occur and (b) it is precise enough to allow the recipient to come to a conclusion as to the possible effect of the relevant set of circumstances or events on the prices of listed financial instruments (i.e., FCA’s common shares). The above disclosure requirement shall be complied with through the publication of a press release by FCA, in accordance with the modalities set forth from time to time under Italian law, disclosing to the public the relevant Inside Information.
150
Under specific circumstances, CONSOB may at any time request: (a) FCA to disclose to the public specific information or documentation where deemed appropriate or necessary or alternatively (b) to be provided with specific information or documentation. For this purpose, CONSOB has wide powers to, among other things, carry out inspections or request information to the members of the managing board, the members of the supervisory board or to the external auditor.
FCA shall publish and transmit to CONSOB any information disseminated in any non EU-countries where FCA’s common shares are listed (i.e., the U.S.), if this information is significant for the purposes of the evaluation of FCA’s common shares listed on the MTA.
Insiders’ Register
FCA and its subsidiaries, as well as persons acting on their behalf or for their account, shall draw up, and keep regularly updated, a list of persons who, in the exercise of their employment, profession or duties, have access to Inside Information.
Public Tender Offers
Certain rules provided for under Italian law with respect to both voluntary and mandatory public tender offers shall apply to any offer launched for FCA’s common shares. In particular, among other things, the provisions concerning the tender offer price, the content of the offer document and the disclosure of the tender offer will be subject to the supervision by CONSOB and Italian law.
Election and Removal of Directors
FCA’s Articles of Association provide that FCA’s Board of Directors shall be composed of three or more members.
Directors are appointed by a simple majority of the votes validly cast at a General Meeting. The General Meeting may at any time suspend or dismiss any director.
C. Material Contracts
For a discussion of our Global Medium Term Notes Programme, please see Note
23
of our Consolidated Financial Statements for the year ended
December 31, 2015
.
For a discussion of our 2020 Notes and 2023 Notes, please see Note 23 of our Consolidated Financial Statements for the year ended December 31, 2015.
For a discussion of our mandatory convertibles securities, please see Note
19
of our Consolidated Financial Statements for the year ended
December 31, 2015
.
For a discussion of the Company’s equity plans, please see Note
19
of our Consolidated Financial Statements for the year ended
December 31, 2015
.
D. Exchange Controls
Under Dutch law, there are no foreign exchange control restrictions on investments in, or payments on, the FCA common shares. There are no special restrictions in the FCA Articles of Association or Dutch law that limit the right of shareholders who are not citizens or residents of the Netherlands to hold or vote the FCA common shares.
151
E. Taxation
Material U.S. Federal Income Tax Consequences
This section describes the material U.S. federal income tax consequences of owning FCA stock. It applies solely to persons that hold shares as capital assets for U.S. federal income tax purposes. This section does not apply to members of a special class of holders subject to special rules, including:
|
•
|
a dealer in securities or foreign currencies;
|
|
•
|
a regulated investment company;
|
|
•
|
a trader in securities that elects to use a mark-to-market method of accounting for securities holdings;
|
|
•
|
a tax-exempt organization;
|
|
•
|
a bank, financial institution, or insurance company;
|
|
•
|
a person liable for alternative minimum tax;
|
|
•
|
a person that actually or constructively owns 10 percent or more, by vote or value, of FCA;
|
|
•
|
a person that holds shares as part of a straddle or a hedging, conversion, or other risk reduction transaction for U.S. federal income tax purposes;
|
|
•
|
a person that acquired shares pursuant to the exercise of employee stock options or otherwise as compensation; or
|
|
•
|
a person whose functional currency is not the U.S.$.
|
This section is based on the Internal Revenue Code of 1986, as amended, the Code, its legislative history, existing and proposed regulations, published rulings and court decisions, as well as on applicable tax treaties, all as of the date hereof. These laws are subject to change, possibly on a retroactive basis.
If an entity or arrangement treated as a partnership for U.S. federal income tax purposes holds shares, the U.S. federal income tax treatment of a partner will generally depend on the status of the partner and the tax treatment of the partnership. A partner in an entity treated as a partnership for U.S. federal income tax purposes holding shares should consult its tax advisors with regard to the U.S. federal income tax treatment of the ownership of FCA stock.
No statutory, judicial or administrative authority directly discusses how the ownership of FCA stock should be treated for U.S. federal income tax purposes. As a result, the U.S. federal income tax consequences of the ownership of FCA stock are uncertain. Shareholders should consult their own tax advisors regarding the U.S. federal, state and local and foreign and other tax consequences of owning and disposing of FCA stock in their particular circumstances.
For the purposes of this discussion, a “U.S. Shareholder” is a beneficial owner of shares that is:
|
•
|
an individual that is a citizen or resident of the United States;
|
|
•
|
a corporation, or other entity taxable as a corporation, created or organized under the laws of the United States;
|
|
•
|
an estate whose income is subject to U.S. federal income tax regardless of its source; or
|
|
•
|
a trust if a U.S. court can exercise primary supervision over the trust’s administration and one or more U.S. persons are authorized to control all substantial decisions of the trust.
|
152
Tax Consequences of Owning FCA Stock
Taxation of Dividends
. Under the U.S. federal income tax laws, and subject to the discussion of PFIC taxation below, a U.S. Shareholder must include in its gross income the gross amount of any dividend paid by FCA to the extent of its current or accumulated earnings and profits (as determined for U.S. federal income tax purposes). Dividends will be taxed as ordinary income to the extent that they are paid out of FCA’s current or accumulated
earnings and profits. Dividends paid to a non-corporate U.S. Shareholder by certain “qualified foreign corporations” that constitute qualified dividend income are taxable to the shareholder at the preferential rates
applicable to long-term capital gains provided that the shareholder holds the shares for more than 60 days during the 121-day period beginning 60 days before the ex-dividend date and meets other holding period requirements. For this purpose, stock of FCA is treated as stock of a qualified foreign corporation if FCA is eligible for the benefits of an applicable comprehensive income tax treaty with the United States or if such stock is listed on an established securities market in the United States. The common shares of FCA are listed on the NYSE and FCA expects to be eligible for the benefits of such a treaty. Accordingly, subject to the discussion of PFIC taxation below, dividends FCA pays with respect to the shares will constitute qualified dividend income, assuming the holding period requirements are met.
A U.S. Shareholder must include any foreign tax withheld from the dividend payment in this gross amount even though the shareholder does not in fact receive the amount withheld. The dividend is taxable to a U.S. Shareholder when the U.S. Shareholder receives the dividend, actually or constructively.
The dividend will not be eligible for the dividends-received deduction allowed to U.S. corporations in respect of dividends received from other U.S. corporations.
Distributions in excess of current and accumulated earnings and profits, as determined for U.S. federal income tax purposes, will be treated as a non-taxable return of capital to the extent of the U.S. Shareholder’s basis in the shares of FCA stock, causing a reduction in the U.S. Shareholder’s adjusted basis in FCA stock, and thereafter as capital gain.
Subject to certain limitations, any non-U.S. tax withheld and paid over to a non-U.S. taxing authority is eligible for credit against a U.S. Shareholder’s U.S. federal income tax liability except to the extent a refund of the tax withheld is available to the U.S. Shareholder under non-U.S. tax law or under an applicable tax treaty. The amount allowed to a U.S. Shareholder as a credit is limited to the amount of the U.S. Shareholder’s U.S. federal income tax liability that is attributable to income from sources outside the U.S. and is computed separately with respect to different types of income that the U.S. Shareholder receives from non-U.S. sources. Subject to the discussion below regarding Section 904(h) of the Code, dividends paid by FCA will be foreign source income and depending on the circumstances of the U.S. Shareholder, will be either “passive” or “general” income for purposes of computing the foreign tax credit allowable to a U.S. Shareholder.
Under Section 904(h) of the Code, dividends paid by a foreign corporation that is treated as 50 percent or more owned, by vote or value, by U.S. persons may be treated as U.S. source income (rather than foreign source income) for foreign tax credit purposes, to the extent the foreign corporation earns U.S. source income. In certain circumstances, U.S. Shareholders may be able to choose the benefits of Section 904(h)(10) of the Code and elect to treat dividends that would otherwise be U.S. source dividends as foreign source dividends, but in such a case the foreign tax credit limitations would be separately determined with respect to such “resourced” income. In general, therefore, the application of Section 904(h) of the Code may adversely affect a U.S. Shareholder’s ability to use foreign tax credits. FCA does not believe that it is 50 percent or more owned by U.S. persons, but this conclusion is a factual determination and is subject to change; no assurance can therefore be given that FCA may not be treated as 50 percent or more owned by U.S. persons for purposes of Section 904(h) of the Code. U.S. Shareholders are strongly urged to consult their own tax advisors regarding the possible impact if Section 904(h) of the Code should apply.
Taxation of Capital Gains
. Subject to the discussion of PFIC taxation below, a U.S. Shareholder that sells or otherwise disposes of its FCA common shares will recognize capital gain or loss for U.S. federal income
tax purposes equal to the difference between the U.S.$ value of the amount that the U.S. Shareholder realizes and the U.S. Shareholder’s tax basis in those shares. Capital gain of a noncorporate U.S. Shareholder is generally taxed at preferential rates where the property is held for more than one year. The gain or loss will be U.S. source income or loss for foreign tax credit limitation purposes. The deduction of capital losses is subject to limitations.
153
Loyalty Voting Structure
NO STATUTORY, JUDICIAL OR ADMINISTRATIVE AUTHORITY DIRECTLY DISCUSSES HOW THE RECEIPT, OWNERSHIP OR DISPOSITION OF SPECIAL VOTING SHARES SHOULD BE TREATED FOR U.S. FEDERAL INCOME TAX PURPOSES AND AS A RESULT, THE U.S. FEDERAL INCOME TAX CONSEQUENCES ARE UNCERTAIN. ACCORDINGLY, WE URGE U.S. SHAREHOLDERS TO CONSULT THEIR TAX ADVISOR AS TO THE TAX CONSEQUENCES OF THE RECEIPT, OWNERSHIP AND DISPOSITION OF SPECIAL VOTING SHARES.
If a U.S. Shareholder receives special voting shares after requesting all or some of the number of its FCA common shares be registered on the Loyalty Register, the tax consequences of the receipt of special voting shares is unclear. While distributions of stock are tax-free in certain circumstances, the distribution of special voting shares would be taxable if it were considered to result in a “disproportionate distribution.” A disproportionate distribution is a distribution or series of distributions, including deemed distributions, that have the effect of the receipt of cash or other property by some shareholders of FCA and an increase in the proportionate interest of other shareholders of FCA in FCA’s assets or earnings and profits. It is possible that the distribution of special voting shares to a U.S. Shareholder that has requested all or some of the number of its FCA common shares be registered on the Loyalty Register and a distribution of cash in respect of FCA common shares could be considered together to constitute a “disproportionate distribution.” Unless FCA has not paid cash dividends in the 36 months prior to a U.S. Shareholder’s receipt of special voting shares and FCA does not intend to pay cash dividends in the 36 months following a U.S. Shareholder’s receipt of special voting shares, FCA intends to treat the receipt of special voting shares as a distribution that is subject to tax as described above in “Consequences of Owning FCA Stock—Taxation of Dividends.” The amount of the dividend should equal the fair market value of the special voting shares received. For the reasons stated above, FCA believes and intends to take the position that the value of each special voting share is minimal. However, because the fair market value of the special voting shares is factual and is not governed by any guidance that directly addresses such a situation, the IRS could assert that the value of the special voting shares (and thus the amount of the dividend) as determined by FCA is incorrect.
Ownership of Special Voting Shares
. FCA believes that U.S. Shareholders holding special voting shares should not have to recognize income in respect of amounts transferred to the special voting shares dividend reserve that are not paid out as dividends. Section 305 of the Code may, in certain circumstances, require a holder of preferred shares to recognize income even if no dividends are actually received on such shares if the preferred shares are redeemable at a premium and the redemption premium results in a “constructive distribution.” Preferred shares for this purpose refer to shares that do not participate in corporate growth to any significant extent. FCA believes that Section 305 of the Code should not apply to any amounts transferred to the special voting shares dividend reserve that are not paid out as dividends so as to require current income inclusion by U.S. Shareholders because, among other things, (i) the special voting shares are not redeemable on a specific date and a U.S. Shareholder is only entitled to receive amounts in respect of the special voting shares upon liquidation, (ii) Section 305 of the Code does not require the recognition of income in respect of a redemption premium if the redemption premium does not exceed a de minimis amount and, even if the amounts transferred to the special voting shares dividend reserve that are not paid out as dividends are considered redemption premium, the amount of the redemption premium is likely to be “de minimis” as such term is used in the applicable Treasury Regulations. FCA therefore intends to take the position that the transfer of amounts to the special voting shares dividend reserve that are not paid out as dividends does not result in a “constructive distribution,” and this determination is binding on all U.S. Shareholders of special voting shares other than a U.S. Shareholder that explicitly discloses its contrary determination in the manner prescribed by the applicable regulations. However, because the tax treatment of the loyalty voting structure is unclear and because FCA’s determination is not binding on the IRS, it is possible that the IRS could disagree with FCA’s determination and require current income inclusion in respect of such amounts transferred to the special voting shares dividend reserve that are not paid out as dividends.
Disposition of Special Voting Shares
. The tax treatment of a U.S. Shareholder that has its special voting shares redeemed for zero consideration after removing its common shares from the Loyalty Register is unclear. It is possible that a U.S. Shareholder would recognize a loss to the extent of the U.S. Shareholder’s basis in its
special voting shares, which should equal (i) if the special voting shares were received in connection with the
Merger, the basis allocated to the special voting shares, and (ii) if the special voting shares were received after the requisite holding period on the Loyalty Register, the amount that was included in income upon receipt. Such loss would be a capital loss and would be a long-term capital loss if a U.S. Shareholder has held its special voting shares for more than one year. It is also possible that a U.S. Shareholder would not be allowed to recognize a loss upon the redemption of its special voting shares and instead a U.S. Shareholder should increase the basis in its FCA common shares by an amount equal to the basis in its special voting shares. Such basis increase in a U.S. Shareholder’s FCA common shares would decrease the gain, or increase the loss, that a U.S. Shareholder would recognize upon the sale or other taxable disposition of its FCA common shares.
154
THE U.S. FEDERAL INCOME TAX TREATMENT OF THE LOYALTY VOTING STRUCTURE IS UNCLEAR AND U.S. SHAREHOLDERS ARE URGED TO CONSULT THEIR TAX ADVISORS IN RESPECT OF THE CONSEQUENCES OF ACQUIRING, OWNING, AND DISPOSING OF SPECIAL VOTING SHARES.
PFIC Considerations—Consequences of Holding FCA Stock
FCA believes that shares of its stock are not stock of a PFIC for U.S. federal income tax purposes, but this conclusion is based on a factual determination made annually and thus is subject to change. As discussed in greater detail below, if shares of FCA stock were to be treated as stock of a PFIC, gain realized (subject to the discussion below regarding a mark-to-market election) on the sale or other disposition of shares of FCA stock would not be treated as capital gain, and a U.S. Shareholder would be treated as if such U.S. Shareholder had realized such gain and certain “excess distributions” ratably over the U.S. Shareholder’s holding period for its shares of FCA stock and would be taxed at the highest tax rate in effect for each such year to which the gain was allocated, together with an interest charge in respect of the tax attributable to each such year. With certain exceptions, a U.S. Shareholder’s shares of FCA stock would be treated as stock in a PFIC if FCA were a PFIC at any time during such U.S. Shareholder’s holding period in the shares. Dividends received from FCA would not be eligible for the special tax rates applicable to qualified dividend income if FCA were treated as a PFIC in the taxable years in which the dividends are paid or in the preceding taxable year (regardless of whether the U.S. holder held shares of FCA stock in such year) but instead would be taxable at rates applicable to ordinary income.
FCA would be a PFIC with respect to a U.S. Shareholder if for any taxable year in which the U.S. Shareholder held shares of FCA stock, after the application of applicable “look-through rules”:
|
•
|
75 percent or more of FCA’s gross income for the taxable year consists of “passive income” (including dividends, interest, gains from the sale or exchange of investment property and rents and royalties other than rents and royalties which are received from unrelated parties in connection with the active conduct of a trade or business, as defined in applicable Treasury Regulations); or
|
|
•
|
at least 50 percent of its assets for the taxable year (averaged over the year and determined based upon value) produce or are held for the production of passive income.
|
Because the determination whether a foreign corporation is a PFIC is primarily factual and there is little administrative or judicial authority on which to rely to make a determination, the IRS might not agree that FCA is not a PFIC. Moreover, no assurance can be given that FCA would not become a PFIC for any future taxable year if there were to be changes in FCA’s assets, income or operations.
If FCA were to be treated as a PFIC for any taxable year (and regardless of whether FCA remains a PFIC for subsequent taxable years), each U.S. Shareholder that is treated as owning FCA stock for purposes of the PFIC rules (i) would be liable to pay U.S. federal income tax at the highest applicable income tax rates on (a) ordinary income upon the receipt of excess distributions (the portion of any distributions received by the U.S. Shareholder on FCA stock in a taxable year in excess of 125 percent of the average annual distributions received by the U.S. Shareholder in the three preceding taxable years or, if shorter, the U.S. Shareholder’s holding period for the FCA stock) and (b) on any gain from the disposition of FCA stock, plus interest on such amounts, as if such excess distributions or gain had been recognized ratably over the U.S. Shareholder’s holding period of the FCA stock, and (ii) may be required to annually file Form 8621 with the IRS reporting information concerning FCA.
If FCA were to be treated as a PFIC for any taxable year and provided that FCA common shares are treated as “marketable stock” within the meaning of applicable Treasury Regulations, which FCA believes will be the case, a U.S. Shareholder may make a mark-to-market election. Under a mark-to-market election, any excess of the fair market value of the FCA common shares at the close of any taxable year over the U.S. Shareholder’s adjusted tax basis in the FCA common shares is included in the U.S. Shareholder’s income as ordinary income. These amounts of ordinary income would not be eligible for the favorable tax rates applicable to qualified dividend income or long-term capital gains. In addition, the excess, if any, of the U.S. Shareholder’s adjusted tax basis at the close of any taxable year over the fair market value of the FCA common shares is deductible in an amount equal to the lesser of the amount of the excess or the amount of the net mark-to-market gains that the U.S. Shareholder included in income in prior years. A U.S. Shareholder’s tax basis in FCA common shares would be adjusted to reflect any such income or loss. Gain realized on the sale, exchange or other disposition of FCA common shares would be treated as ordinary income, and any loss realized on the sale, exchange or other disposition of FCA common shares would be treated as ordinary loss to the extent that such loss does not exceed the net mark-to-market gains previously included by the U.S. Shareholder. It is not expected that the special voting shares would be treated as “marketable stock” and eligible for the mark-to-market election.
155
The adverse consequences of owning stock in a PFIC could also be mitigated if a U.S. Shareholder makes a valid “qualified electing fund” election, or QEF election, which, among other things, would require a U.S. Shareholder to include currently in income its pro rata share of the PFIC’s net capital gain and ordinary earnings, based on earnings and profits as determined for U.S. federal income tax purposes. Because of the administrative burdens involved, FCA does not intend to provide information to its shareholders that would be required to make such election effective.
A U.S. Shareholder which holds FCA stock during a period when FCA is a PFIC will be subject to the foregoing rules for that taxable year and all subsequent taxable years with respect to that U.S. Shareholder’s holding of FCA stock, even if FCA ceases to be a PFIC, subject to certain exceptions for U.S. Shareholders which made a mark-to-market or QEF election. U.S. Shareholders are strongly urged to consult their tax advisors regarding the PFIC rules, and the potential tax consequences to them if FCA were determined to be a PFIC.
Medicare Tax on Net Investment Income
A U.S. person that is an individual or estate, or a trust that does not fall into a special class of trusts that is exempt from such tax, is subject to a 3.8 percent tax, the Medicare tax, on the lesser of (i) the U.S. person’s “net investment income” (or undistributed net investment income in the case of an estate or trust) for the relevant taxable year and (ii) the excess of the U.S. person’s modified adjusted gross income for the taxable year over a certain threshold (which in the case of individuals is between U.S.$125,000 and U.S.$250,000, depending on the individual’s circumstances). A shareholder’s net investment income generally includes its dividend income and its net gains from the disposition of shares, unless such dividends or net gains are derived in the ordinary course of the conduct of a trade or business (other than a trade or business that consists of certain passive or trading activities). If a shareholder is a U.S. person that is an individual, estate or trust, the shareholder is urged to consult the shareholder’s tax advisors regarding the applicability of the Medicare tax to the shareholder’s income and gains in respect of the shareholder’s investment in FCA stock.
Information with Respect to Foreign Financial Assets
Owners of “specified foreign financial assets” with an aggregate value in excess of U.S.$50,000, (and in some cases, a higher threshold) may be required to file an information report with respect to such assets with their tax returns. “Specified foreign financial assets” include any financial accounts maintained by foreign financial institutions, as well as any of the following, but only if they are held for investment and not held in accounts maintained by financial institutions: (i) stocks and securities issued by non-U.S. persons, (ii) financial instruments and contracts that have non-U.S. issuers or counterparties and (iii) interests in foreign entities. U.S. Shareholders are urged to consult their tax advisors regarding the application of this legislation to their ownership of FCA stock.
Backup Withholding and Information Reporting
Information reporting requirements for a noncorporate U.S. Shareholder, on IRS Form 1099, will apply to:
|
•
|
dividend payments or other taxable distributions made to such U.S. Shareholder within the U.S.; and
|
|
•
|
the payment of proceeds to such U.S. Shareholder from the sale of FCA stock effected at a U.S. office of a broker.
|
Additionally, backup withholding (currently at a 28 percent rate) may apply to such payments to a noncorporate U.S. Shareholder that:
|
•
|
fails to provide an accurate taxpayer identification number;
|
|
•
|
is notified by the IRS that such U.S. Shareholder has failed to report all interest and dividends required to be shown on such U.S. Shareholder’s federal income tax returns; or
|
|
•
|
in certain circumstances, fails to comply with applicable certification requirements.
|
A person may obtain a refund of any amounts withheld under the backup withholding rules that exceed the person’s income tax liability by properly filing a refund claim with the IRS.
156
Material Netherlands Tax Consequences
This section describes solely the material Dutch tax consequences of the acquisition, ownership and disposal of FCA common shares and, if applicable, FCA special voting shares by Non-resident holders of such shares (as defined below). It does not consider every aspect of Dutch taxation that may be relevant to a particular holder of FCA common shares and, if applicable, FCA special voting shares in special circumstances or who is subject to special treatment under applicable law. Shareholders and any potential investor should consult their own tax advisors regarding the Dutch tax consequences of acquiring, owning and disposing of FCA common shares and, if applicable, FCA special voting shares in their particular circumstances.
Where in this section English terms and expressions are used to refer to Dutch concepts, the meaning to be attributed to such terms and expressions shall be the meaning to be attributed to the equivalent Dutch concepts under Dutch tax law. Where in this section the terms “the Netherlands” and “Dutch” are used, these refer solely to the European part of the Kingdom of the Netherlands. This summary also assumes that the board shall control the conduct of the affairs of FCA and shall procure that FCA is organized in accordance with the facts, based upon which the competent authorities of the United Kingdom and The Netherlands have ruled that FCA should be treated as solely resident of the United Kingdom for the application of the tax treaty as concluded between the United Kingdom and The Netherlands. A change in facts and circumstances based upon which the ruling was issued may invalidate the contents of this section, which will not be updated to reflect any such change.
This description is based on the tax law of the Netherlands (unpublished case law not included) as it stands at the date of this Form. The law upon which this description is based is subject to change, perhaps with retroactive effect. Any such change may invalidate the contents of this description, which will not be updated to reflect such change.
Where in this Dutch taxation discussion reference is made to “a holder of FCA common shares and, if applicable, FCA special voting shares”, that concept includes, without limitation:
|
1.
|
an owner of one or more FCA common shares and/or FCA special voting shares who in addition to the title to such FCA common shares and/or FCA special voting shares, has an economic interest in such FCA common shares and/or FCA special voting shares;
|
|
2.
|
a person who or an entity that holds the entire economic interest in one or more FCA common shares and/or FCA special voting shares;
|
|
3.
|
a person who or an entity that holds an interest in an entity, such as a partnership or a mutual fund, that is transparent for Dutch tax purposes, the assets of which comprise one or more FCA common shares and/or FCA special voting shares, within the meaning of 1. or 2. above; or
|
|
4.
|
a person who is deemed to hold an interest in FCA common shares and/or FCA special voting shares, as referred to under 1. to 3., pursuant to the attribution rules of article 2.14a, of the Dutch Income Tax Act 2001 (
Wet inkomstenbelasting 2001
), with respect to property that has been segregated, for instance in a trust or a foundation.
|
Scope of the summary
The summary of Dutch taxes set out in this section “Material Dutch tax consequences” only applies to a holder of FCA common shares and, if applicable FCA special voting shares who is a Non-Resident holder of such shares. For the purpose of this summary a holder of FCA common shares and, if applicable FCA special voting shares is a Non-Resident holder of such shares if such holder is neither a resident nor deemed to be resident in The Netherlands for purposes of Dutch income tax or corporation tax as the case may be.
This summary does not describe the tax considerations for holders of FCA common shares and, if applicable FCA special voting shares who are individuals and derive benefits from FCA common shares and, if applicable FCA special voting shares that are a remuneration or deemed to be a remuneration in connection with past, present or future employment performed in The Netherlands or management activities and functions or membership of a management board (
bestuurder
) or a supervisory board (
commissaris
) of a Netherlands resident entity by such holder or certain individuals related to such holder (as defined in The Dutch Income Tax Act 2001).
157
Taxes on income and capital gains
A Non-resident holder (as defined above) of FCA common shares and, if applicable, FCA special voting shares will not be subject to any Dutch taxes on income or capital gains in respect of any benefits derived or deemed to be derived by such holder from such holder’s FCA common shares and, if applicable, FCA special voting shares, including any capital gain realized on the disposal thereof, unless:
|
1.
|
such holder derives profits from an enterprise directly, or pursuant to a co-entitlement to the net value of such enterprise, other than as a holder of securities, which enterprise either is managed in the Netherlands or carried on, in whole or in part, through a permanent establishment or a permanent representative which is taxable in the Netherlands, and such holder’s FCA common shares and, if applicable, FCA special voting shares are attributable to such enterprise; or
|
|
2.
|
such holder is an individual and such holder derives benefits from FCA common shares and, if applicable, FCA special voting shares that are taxable as benefits from miscellaneous activities (
resultaat uit overige werkzaamheden
) in the Netherlands. Such holder may, inter alia, derive, or be deemed to derive, benefits from FCA common shares and, if applicable, FCA special voting shares that are taxable as benefits from miscellaneous activities if such holder’s investment activities go beyond the activities of an active portfolio investor, for instance in the case of use of insider knowledge or comparable forms of special knowledge.
|
Benefits derived or deemed to be derived from certain miscellaneous activities by a child or a foster child who is under eighteen years of age are attributed to the parent who exercises, or the parents who exercise, authority over the child, irrespective of the country of residence of the child.
Dividend withholding tax
FCA is generally required to withhold Dutch dividend withholding tax at a rate of 15 percent from dividends distributed by it. However, the competent authorities of the United Kingdom and The Netherlands have ruled that FCA is resident of the United Kingdom for the application of the tax treaty as concluded between The Netherlands and the United Kingdom. Consequently payments made by FCA on the common shares and or the special voting shares to non-resident shareholders may be made free from Dutch dividend withholding tax.
Gift and inheritance taxes
If a holder of FCA common shares and, if applicable, FCA special voting shares disposes of FCA common shares and, if applicable, FCA special voting shares by way of gift, in form or in substance, or if a holder of FCA common shares and, if applicable, FCA special voting shares who is an individual dies, no Dutch gift tax or Dutch inheritance tax, as applicable, will be due, unless:
|
i.
|
the donor is, or the deceased was, resident or deemed to be resident in the Netherlands for purposes of Dutch gift tax or Dutch inheritance tax, as applicable; or
|
|
ii.
|
the donor made a gift of FCA common shares and, if applicable, FCA special voting shares, then became a resident or deemed resident of the Netherlands, and died as a resident or deemed resident of the Netherlands within 180 days of the date of the gift.
|
For purposes of the above, a gift of FCA common shares and, if applicable, FCA special voting shares made under a condition precedent is deemed to be made at the time the condition precedent is satisfied.
Value Added Tax
No Dutch value added tax will arise in respect of any payment in consideration for the issue of FCA common shares and, if applicable, FCA special voting shares.
158
Registration taxes and duties
No Dutch registration tax, transfer tax, stamp duty or any other similar documentary tax or duty, other than court fees, is payable in the Netherlands by a holder in respect of or in connection with (i) the subscription, issue, placement or allotment of FCA common shares and, if applicable, FCA special voting shares, (ii) the enforcement by way of legal proceedings (including the enforcement of any foreign judgment in the courts of the Netherlands) of the documents relating to the issue of FCA common shares and, if applicable, FCA special voting shares or the performance by FCA of FCA’s obligations under such documents, or (iii) the transfer of FCA common shares and, if applicable, FCA special voting shares.
Material U.K. Tax Consequences
This section describes the material United Kingdom tax consequences of the ownership of FCA common shares for U.S. Shareholders. It does not purport to be a complete analysis of all potential U.K. tax consequences of holding FCA common shares. This section is based on current U.K. tax law and what is understood to be the current practice of H.M. Revenue and Customs, as well as on applicable tax treaties. This law and practice and these treaties are subject to change, possibly on a retroactive basis.
This section applies only to shareholders of FCA that are U.S. Shareholders, that are not resident or domiciled in the U.K., that are not individuals temporarily non-resident in the U.K. for a period of up to five years, that hold their shares as an investment (other than through an individual savings account), and that are the absolute beneficial owner of both the shares and any dividends paid on them. This section does not apply to members of any special class of shareholders subject to special rules, such as:
|
•
|
a pension fund;
|
|
•
|
a charity;
|
|
•
|
persons acquiring their shares in connection with an office or employment;
|
|
•
|
a dealer in securities;
|
|
•
|
an insurance company; or
|
|
•
|
a collective investment scheme.
|
In addition, this section may not apply to:
|
•
|
any shareholders that, either alone or together, with one or more associated persons, such as personal trusts and connected persons, control directly or indirectly at least ten percent of the voting rights or of any class of share capital of FCA; or
|
|
•
|
any person holding shares as a borrower under a stock loan or an interim holder under a repo.
|
Shareholders should consult their own tax advisors on the U.K. tax consequences of owning and disposing of FCA common shares in their particular circumstances.
Tax Consequences of Owning FCA Common Shares
Taxation of Dividends
Dividend payments may be made without withholding or deduction for or on account of U.K. income tax.
A U.S. Shareholder will not be liable to account for income or corporation tax in the U.K. on dividends paid on the shares unless the shareholder carries on a trade (or profession or vocation) in the U.K. and the dividends are either a receipt of that trade or, in the case of corporation tax, the shares are held by or for a U.K. permanent establishment through which the trade is carried on (unless, if certain conditions are met, the trade is carried on through an independent broker or investment manager).
159
Some non-U.K.-resident shareholders of FCA common shares will be entitled to a non-repayable U.K. tax credit equal to one-ninth of the amount of the dividend received and brought into the charge to tax including any foreign tax withheld (or ten percent of the aggregate of that dividend and tax credit).
Such a non-U.K.-resident shareholder that is not otherwise liable to income or corporation tax on dividends will not generally be able to claim repayment of any significant part of the tax credit attaching to dividends received from FCA as the U.K. will levy income tax at the source to offset the amount of the credit.
A U.S. Shareholder will not ordinarily be entitled to such a U.K. dividend tax credit or any cash payment in respect of it.
A shareholder that is resident outside the United Kingdom for tax purposes should consult its own tax advisor as to its tax position on dividends received from FCA.
Taxation of Capital Gains
A disposal of FCA common shares by a shareholder that is not resident in the United Kingdom for tax purposes will not give rise to a chargeable gain or allowable loss unless that shareholder carries on a trade, profession or vocation in the United Kingdom through a branch, agency or permanent establishment (excluding, if certain conditions are met, an independent broker or investment manager) and has used, held or acquired FCA common shares for the purposes of that trade, profession or vocation or that branch, agency or permanent establishment.
Stamp duty and stamp duty reserve tax
No liability to U.K. stamp duty or SDRT will arise on the issue of FCA common shares to shareholders. FCA will not maintain any share register in the U.K. and, accordingly, (i) U.K. stamp duty will not normally be payable in connection with a transfer of common shares, provided that the instrument of transfer is executed and retained outside the U.K. and no other action is taken in the U.K. by the transferor or transferee, and (ii) no U.K. SDRT will be payable in respect of any agreement to transfer FCA common shares.
Tax Consequences of Participating in the Loyalty Voting Structure
A U.S. Shareholder that would not be subject to tax on dividends or capital gains in respect of FCA common shares will not be subject to tax in respect of the special voting shares.
FCA will not maintain any share register in the U.K. and, accordingly, no liability to U.K. stamp duty or SDRT will arise to shareholders on the issue or repurchase of special voting shares.
F. Dividends and Paying Agents
Not applicable.
G. Statements by Experts
Not applicable.
H. Documents on Display
You may read and copy any document we file with or furnish to the SEC at the SEC’s public reference room at 100 F Street, N.E., Room 1580, Washington, D.C. 20549. You may also obtain documents we file with or furnish to the SEC on the SEC's website at
www.sec.gov
. The address of the SEC’s website is provided solely for information purposes and is not intended to be an active link. Please visit the website or call the SEC at 1-800-732-0330 for further information about its public reference room. Reports and other information concerning the business of FCA may also be inspected at the offices of the New York Stock Exchange, 11 Wall Street, New York, New York 10005.
We also make our periodic reports as well as other information filed with or furnished to the SEC available, free of charge, through our website, at
www.fcagroup.com
, as soon as reasonably practicable after those reports and other
160
information are electronically filed with or furnished to the SEC. The information on our website is not incorporated by reference in this report.
I. Subsidiary Information
Not applicable.
161
Quantitative and Qualitative Disclosures about Market Risk
Due to the nature of our business, we are exposed to a variety of market risks, including foreign currency exchange rate risk, interest rate risk and commodity price risk.
Our exposure to foreign currency exchange rate risk arises both in connection with the geographical distribution of our industrial activities compared to the markets in which we sell our products, and in relation to the use of external borrowings denominated in foreign currencies.
Our exposure to interest rate risk arises from the need to fund industrial and financial operating activities and the necessity to deploy surplus funds. Changes in market interest rates may have the effect of either increasing or decreasing our net profit/ (loss), thereby indirectly affecting the costs and returns of financing and investing transactions.
Our exposure to commodity price risk arises from the risk of changes occurring in the price of certain raw materials and energy used in production. Changes in the price of raw materials and energy could have a significant effect on our results by indirectly affecting costs and product margins.
These risks could significantly affect our financial position and results, and for this reason we systematically identify, and monitor these risks, in order to detect potential negative effects in advance and take the necessary actions to mitigate them, primarily through our operating and financing activities and if required, through the use of derivative financial instruments in accordance with our established risk management policies.
Our policy permits derivatives to be used only for managing the exposure to fluctuations in foreign currency exchange rates and interest rates as well as commodity prices connected with future cash flows and assets and liabilities, and not for speculative purposes.
We utilize derivative financial instruments designated as fair value hedges mainly to hedge:
|
•
|
the foreign currency exchange rate risk on financial instruments denominated in foreign currency; and
|
|
•
|
the interest rate risk on fixed rate loans and borrowings.
|
The instruments used for these hedges are mainly foreign currency forward contracts, interest rate swaps and combined interest rate and foreign currency financial instruments.
We use derivative financial instruments as cash flow hedges for the purpose of pre-determining:
|
•
|
the exchange rate at which forecasted transactions denominated in foreign currencies will be accounted for;
|
|
•
|
the interest paid on borrowings, both to match the fixed interest received on loans (customer financing activity), and to achieve a targeted mix of floating versus fixed rate funding; and
|
|
•
|
the price of certain commodities.
|
The foreign currency exchange rate exposure on forecasted commercial flows is hedged by foreign currency swaps and forward contracts. Interest rate exposures are usually hedged by interest rate swaps and, in limited cases, by forward rate agreements. Exposure to changes in the price of commodities is generally hedged by using commodity swaps.
Counterparties to these agreements are major financial institutions.
162
The following section provides qualitative and quantitative disclosures on the effect that these risks may have. The quantitative data reported below does not have any predictive value, in particular the sensitivity analysis on financial market risks does not reflect the complexity of the market or the reaction which may result from any changes that are assumed to take place.
Financial instruments held by the funds that manage pension plan assets are not included in this analysis.
Venezuela
On February 10, 2015, the Venezuelan government introduced a new market-based exchange system, the SIMADI exchange rate with certain specified limitations on its usage by individuals and legal entities. On February 12, 2015, the SIMADI exchange rate began trading at 170.0 VEF to U.S.$ for individuals and entities in the private sector. In February 2015, the Venezuelan government also announced that the Supplementary Foreign Currency Administration System (“SICAD I”) and the additional auction-based foreign exchange system introduced by the Venezuelan government in March 2014(“SICAD II”) would be merged into a single exchange system, or SICAD, with a rate starting at 12.0 VEF to U.S.$. As of March 31, 2015, the SICAD exchange rate was expected to be used to complete the majority of FCA Venezuela's transactions to exchange VEF for U.S.$ and as such, it was deemed the appropriate rate to use to convert our VEF denominated monetary assets and liabilities to U.S.$ for the first quarter 2015.
Due to the continuing deterioration of the economic conditions in Venezuela, as of June 30, 2015 we determined that it was unlikely that the majority of our future transactions to exchange VEF to U.S.$ would be at the SICAD rate. Rather, we had determined that the SIMADI exchange rate was the most appropriate rate to use based on the volume of VEF to U.S.$ exchange transactions that have occurred in Venezuela utilizing the SIMADI exchange rate as compared to the SICAD. As a result of adopting the SIMADI exchange rate at June 30, 2015, we recorded a remeasurement charge on our VEF denominated net monetary assets, including cash and cash equivalents in Venezuela of €53 million using an exchange rate of 197.3 VEF per U.S.$. In addition to the remeasurement charge, we recorded a €27 million charge for the write-down of inventory in Venezuela to the lower of cost or net realizable value, as due to pricing controls, we are unable to increase the VEF sales price in Venezuela to compensate for the devaluation. As of December 31, 2015, the SIMADI exchange rate of 199 VEF per U.S.$ did not result in the recording of any additional material charges. The total charge of €80 million was recorded in Cost of Sales for the year ended December 31, 2015.
We continue to monitor the appropriate rate to be used for remeasuring our net monetary assets. Additionally, we will continue to monitor the currency exchange regulations and other factors to assess whether our ability to control and benefit from our Venezuelan operations has been adversely affected. As of December 31, 2015, we continue to control and therefore consolidate our Venezuelan operations. We will continue to assess conditions in Venezuela, and if in the future we conclude that we no longer maintain control over our operations in Venezuela, we may incur a pre-tax charge of approximately €178 million using the current exchange rate of 199 VEF to USD. Refer to the section
—Recent Developments
above for information on changes made in Venezuela in February 2016.
During the year ended December 31, 2014, we recorded a remeasurement charge of €98 million in Cost of Sales resulting from our initial adoption of the SICAD I exchange rate to remeasure our VEF denominated net monetary assets. During the year ended December 31, 2013, we recorded €43 million in Cost of Sales for the devaluation of the VEF exchange rate relative to the U.S.$ and the remeasurement on the Group's VEF denominated net monetary assets.
Quantitative information on foreign currency exchange rate risk
The Group is exposed to risk resulting from changes in foreign currency exchange rates, which can affect its earnings and equity. In particular:
|
•
|
where a Group company incurs costs in a currency different from that of its revenues, any change in exchange rates can affect the operating results of that company;
|
|
•
|
the principal exchange rates to which the Group is exposed are:
|
|
◦
|
EUR/U.S.$, relating to sales in U.S.$ made by Italian companies (in particular, companies belonging to the Maserati segment) and to sales and purchases in Euro made by FCA US;
|
163
|
◦
|
U.S.$/CAD, primarily relating to FCA US's Canadian manufacturing operations;
|
|
◦
|
CNY, in relation to sales in China originating from FCA US and from Italian companies (in particular, companies belonging to the Maserati segment);
|
|
◦
|
GBP, AUD, MXN, CHF, ARS and VEF in relation to sales in the UK, Australian, Mexican, Swiss, Argentinean and Venezuelan markets;
|
|
◦
|
PLN and TRY, relating to manufacturing costs incurred in Poland and Turkey;
|
|
◦
|
JPY mainly in relation to purchase of parts from Japanese suppliers and sales of vehicles in Japan; and
|
|
◦
|
U.S.$/BRL, EUR/BRL, relating to Brazilian manufacturing operations and the related import and export flows.
|
The Group’s policy is to use derivative financial instruments to hedge a percentage of certain exposures subject to foreign currency exchange rate risk for the upcoming 12 months (including such risk before or beyond that date where it is deemed appropriate in relation to the characteristics of the business) and to hedge the exposure resulting from firm commitments unless not deemed appropriate.
Group companies may have trade receivables or payables denominated in a currency different from their respective functional currency. In addition, in a limited number of cases, it may be convenient from an economic point of view, or it may be required under local market conditions, for Group companies to obtain financing or use funds in a currency different from their respective functional currency. Changes in exchange rates may result in exchange gains or losses arising from these situations. The Group’s policy is to hedge, whenever deemed appropriate, the exposure resulting from receivables, payables and securities denominated in foreign currencies different from the respective Group companies' functional currency.
Certain of the Group’s companies are located in countries which are outside of the Eurozone, in particular the U.S., Brazil, Canada, Poland, Serbia, Turkey, Mexico, Argentina, the Czech Republic, India, China and South Africa. As the Group's reporting currency is the Euro, the income statements of those entities, who have a reporting currency other than the Euro, are translated into Euro using the average exchange rate for the period. In addition, the monetary assets and liabilities of these consolidated companies are translated into Euro at the period-end foreign exchange rate. The effects of these changes in foreign exchange rates are recognized directly in the Cumulative Translation Adjustments reserve included in Other comprehensive income/(losses). Changes in exchange rates may lead to effects on the translated balances of revenues, costs and monetary assets and liabilities reported in Euro, even when corresponding items are unchanged in the respective local currency of these companies.
The Group monitors its principal exposure to conversion exchange risk, although there was no specific hedging in this respect at the balance sheet dates.
There have been no substantial changes in 2015 in the nature or structure of exposure to foreign currency exchange rate risk or in the Group’s hedging policies.
The potential loss in fair value of derivative financial instruments held for foreign currency exchange rate risk management (currency swaps/forwards, cross-currency interest rate and currency swaps) at December 31, 2015 resulting from a hypothetical 10.0 percent change in the exchange rates would have been approximately €1,490 million (€1,402 million at December 31, 2014).
Receivables, payables and future trade flows whose hedging transactions have been analyzed were not considered in this analysis. It is reasonable to assume that changes in exchange rates will produce the opposite effect, of an equal or greater amount, on the underlying transactions that have been hedged.
Quantitative information on interest rate risk
The manufacturing companies and treasuries of the Group make use of external borrowings and invest in monetary and financial market instruments. In addition, Group companies sell receivables resulting from their trading activities on a
164
continuing basis. Changes in market interest rates can affect the cost of the various forms of financing, including the sale of receivables, or the return on investments, and the employment of funds, thus negatively impacting the net financial expenses incurred by the Group.
In addition, the financial services companies provide loans (mainly to customers and dealers), financing themselves using various forms of direct debt or asset-backed financing (e.g. factoring of receivables). Where the characteristics of the variability of the interest rate applied to loans granted differ from those of the variability of the cost of the financing obtained, changes in the current level of interest rates can affect the operating result of those companies and the Group as a whole.
In order to manage these risks, the Group uses interest rate derivative financial instruments, mainly interest rate swaps and forward rate agreements, when available in the market, with the object of mitigating, under economically acceptable conditions, the potential variability of interest rates on Net profit/(loss).
In assessing the potential impact of changes in interest rates, the Group segregates fixed rate financial instruments (for which the impact is assessed in terms of fair value) from floating rate financial instruments (for which the impact is assessed in terms of cash flows).
The fixed rate financial instruments used by the Group consist principally of part of the portfolio of the financial services companies (basically customer financing and financial leases) and part of debt (including subsidized loans and notes).
The potential loss in fair value of fixed rate financial instruments (including the effect of interest rate derivative financial instruments) held at December 31, 2015, resulting from a hypothetical 10 percent change in market interest rates, would have been approximately €85 million (approximately €100 million at December 31, 2014).
Floating rate financial instruments consist principally of cash and cash equivalents, loans provided by the financial services companies to the sales network and part of debt. The effect of the sale of receivables is also considered in the sensitivity analysis as well as the effect of hedging derivative instruments.
A hypothetical 10 percent change in short-term interest rates at December 31, 2015, applied to floating rate financial assets and liabilities, operations for the sale of receivables and derivative financial instruments, would have resulted in increased net financial expenses before taxes, on an annual basis, of approximately €7 million (€12 million at December 31, 2014).
This analysis is based on the assumption that there is a general change of 10.0 percent proportionate to interest rate levels across homogeneous categories. A homogeneous category is defined on the basis of the currency in which the financial assets and liabilities are denominated. In addition, the sensitivity analysis applied to floating rate financial instruments assumes that cash and cash equivalents and other short-term financial assets and liabilities which expire during the projected 12 month period will be renewed or reinvested in similar instruments, bearing the hypothetical short-term interest rates.
Quantitative information on commodity price risk
The Group has entered into derivative contracts for certain commodities to hedge its exposure to commodity price risk associated with buying raw materials and energy used in its normal operations.
In connection with the commodity price derivative contracts outstanding at December 31, 2015, a hypothetical 10.0 percent change in the price of the commodities at that date would have caused a fair value loss of €40 million (€50 million at December 31, 2014). Future trade flows whose hedging transactions have been analyzed were not considered in this analysis. It is reasonable to assume that changes in commodity prices will produce the opposite effect, of an equal or greater amount, on the underlying transactions that have been hedged.
165
A. Debt Securities
Not applicable.
B. Warrants and Rights
Not applicable.
C. Other Securities
Not applicable.
D. American Depositary Shares
Not applicable.
None.
None.
Disclosure Controls and Procedures
Under the supervision, and with the participation, of our management, including our Chief Executive Officer and Chief Financial Officer, we conducted an evaluation of the effectiveness of our disclosure controls and procedures as of December 31, 2015 pursuant to Exchange Act Rule 13a-15(b). Based on that evaluation, our Chief Executive Officer and Chief Financial Officer concluded that our disclosure controls and procedures are effective to provide reasonable assurance that information required to be disclosed in our Exchange Act filings is recorded, processed, summarized and reported within the time periods specified in the SEC’s rules and forms and that such information is accumulated and communicated to our management, including our Chief Executive Officer and Chief Financial Officer, as appropriate, to allow timely decisions regarding required disclosure.
Management's Report on Internal Control over Financial Reporting
The Company’s management is responsible for establishing and maintaining adequate internal control over financial reporting. The Company’s internal control system was designed to provide reasonable assurance regarding the preparation and fair presentation of published financial statements in accordance with IFRS.
All internal control systems, no matter how well designed, have inherent limitations. Therefore, even those systems determined to be effective can provide only reasonable assurance with respect to financial statement preparation and presentation in accordance with IFRS.
Management assessed the effectiveness of the Company’s internal control over financial reporting as of December 31, 2015, using the criteria set forth in the “Internal Control - Integrated Framework (2013)” issued by the Committee of Sponsoring Organizations of the Treadway Commission. Based on that assessment, management believes that, as of December 31, 2015, the Company’s internal control over financial reporting was effective.
The Company’s independent registered public accounting firm has issued an audit report on the effectiveness of the Company’s internal control over financial reporting. That report is included herein.
166
Changes in Internal Control
No change to our internal control over financial reporting occurred during the year ended December 31, 2015 that has materially affected, or is reasonably likely to materially affect, our internal control over financial reporting.
167
REPORT OF INDEPENDENT REGISTERED PUBLIC ACCOUNTING FIRM
To the Board of Directors and Shareholders of
Fiat Chrysler Automobiles N.V.
We have audited Fiat Chrysler Automobiles N.V.’s internal control over financial reporting as of December 31, 2015, based on criteria established in Internal Control-Integrated Framework issued by the Committee of Sponsoring Organizations of the Treadway Commission (2013 framework) (the COSO criteria). Fiat Chrysler Automobiles N.V.’s management is responsible for maintaining effective internal control over financial reporting, and for its assessment of the effectiveness of internal control over financial reporting included in the accompanying Management’s Annual Report on Internal Control over Financial Reporting. Our responsibility is to express an opinion on the company’s internal control over financial reporting based on our audit.
We conducted our audit in accordance with the standards of the Public Company Accounting Oversight Board (United States). Those standards require that we plan and perform the audit to obtain reasonable assurance about whether effective internal control over financial reporting was maintained in all material respects. Our audit included obtaining an understanding of internal control over financial reporting, assessing the risk that a material weakness exists, testing and evaluating the design and operating effectiveness of internal control based on the assessed risk, and performing such other procedures as we considered necessary in the circumstances. We believe that our audit provides a reasonable basis for our opinion.
A company’s internal control over financial reporting is a process designed to provide reasonable assurance regarding the reliability of financial reporting and the preparation of financial statements for external purposes in accordance with generally accepted accounting principles. A company’s internal control over financial reporting includes those policies and procedures that (1) pertain to the maintenance of records that, in reasonable detail, accurately and fairly reflect the transactions and dispositions of the assets of the company; (2) provide reasonable assurance that transactions are recorded as necessary to permit preparation of financial statements in accordance with generally accepted accounting principles, and that receipts and expenditures of the company are being made only in accordance with authorizations of management and directors of the company; and (3) provide reasonable assurance regarding prevention or timely detection of unauthorized acquisition, use, or disposition of the company’s assets that could have a material effect on the financial statements.
Because of its inherent limitations, internal control over financial reporting may not prevent or detect misstatements. Also, projections of any evaluation of effectiveness to future periods are subject to the risk that controls may become inadequate because of changes in conditions, or that the degree of compliance with the policies or procedures may deteriorate.
In our opinion, Fiat Chrysler Automobiles N.V. maintained, in all material respects, effective internal control over financial reporting as of December 31, 2015 based on the COSO criteria.
We also have audited, in accordance with the standards of the Public Company Accounting Oversight Board (United States), the consolidated statements of financial position of Fiat Chrysler Automobiles N.V. as of December 31, 2015 and 2014, and the related consolidated statements of income, comprehensive income, cash flows and changes in equity for each of the three years in the period ended December 31, 2015 and our report dated February 29, 2016 expressed an unqualified opinion thereon.
/s/ Reconta Ernst & Young S.p.A.
Turin, Italy
February 29, 2016
168
Our board of directors has determined that Glenn Earle and Ronald Thompson are “audit committee financial experts.” Messrs. Earle and Thompson are independent directors under NYSE standards.
We have adopted a Code of Conduct, which applies to all of our employees, including our principal executive, principal financial and principal accounting officers. Our Code of Conduct is intended to meet the definition of “code of ethics” under Item 16B of Form 20-F under the Exchange Act. Our Code of Conduct is posted on our website at http://www.fcagroup.com/en-US/governance/code_conduct/. If the provisions of our Code of Conduct that apply to our principal executive officer, principal financial officer or principal accounting officer are amended, or if a waiver is granted, we will disclose such amendment or waiver.
Reconta Ernst & Young S.p.A., the member firms of Ernst & Young and their respective affiliates (collectively, the Ernst & Young Entities) were appointed to serve as our independent registered public accounting firm for the years ended
December 31, 2015
and
2014
. We incurred the following fees from the Ernst & Young Entities for professional services for the years ended
December 31, 2015
and
2014
, respectively:
|
For the Years Ended December 31,
|
||||||
|
(€ thousands)
|
2015
|
2014
|
||||
|
Audit fees
|
22,107
|
|
22,518
|
|
||
|
Audit-related fees
|
791
|
|
492
|
|
||
|
Tax fees
|
696
|
|
247
|
|
||
|
TOTAL
|
23,594
|
|
23,257
|
|
||
“Audit Fees” are the aggregate fees billed by the Ernst & Young Entities for the audit of our consolidated annual financial statements, reviews of interim financial statements and attestation services that are provided in connection with statutory and regulatory filings or engagements. “Audit-Related Fees” are fees charged by the Ernst & Young Entities for assurance and related services that are reasonably related to the performance of the audit or review of our financial statements and are not reported under “Audit Fees.” This category comprises fees for the audit of employee benefit plans and pension plans, agreed-upon procedure engagements and other attestation services subject to regulatory requirements.
Audit Committee’s pre-approval policies and procedures
Our Audit Committee nominates and engages our independent registered public accounting firm to audit our consolidated financial statements. Our Audit Committee has a policy requiring management to obtain the Audit Committee’s approval before engaging our independent registered public accounting firm to provide any other audit or permitted non-audit services to us or our subsidiaries. Pursuant to this policy, which is designed to ensure that such engagements do not impair the independence of our independent registered public accounting firm, the Audit Committee reviews and pre-approves (if appropriate) specific audit and non-audit services in the categories Audit Services, Audit-Related Services, Tax Services, and any other services that may be performed by our independent registered public accounting firm.
None.
We currently have no announced share buyback plans.
169
Not applicable.
Fiat Chrysler Automobiles N.V. is a company organized under the laws of The Netherlands and qualifies as a foreign private issuer under the NYSE listing standards. In accordance with the NYSE corporate governance rules, listed companies that are foreign private issuers are permitted to follow home-country practice in some circumstances in lieu of the provisions of the corporate governance rules contained in Section 303A of the NYSE Listed Company Manual that are applicable to U.S. companies. In addition, we must disclose any significant ways in which our corporate governance practices differ from those followed by U.S. companies listed on the NYSE.
Both the Dutch and NYSE corporate governance regimes were adopted with the goal of restoring trust and confidence in the honesty, integrity and transparency of how business is conducted at and by public companies. Because these corporate governance regimes are based on the same principles, they are similar in many respects. However, certain differences exist between Dutch and NYSE corporate governance rules, as summarized below. We believe that our corporate governance practices and guidelines are consistent, in principle, with those required of U.S. companies listed on the NYSE. In addition, we endorse the principles and best practice provisions of the Dutch Corporate Governance Code, or the ”Dutch Code”. In contrast to NYSE rules applicable to U.S. companies, the Dutch Code is based on the “comply or explain” principle. As a result, deviations from best practice provision of the Dutch Code is allowed, as long as such deviations are explained in the annual report.
The discussion below summarizes the significant differences between our corporate governance practices and the NYSE standards applicable to U.S. companies, as well as certain ways in which our governance practices deviate from those suggested in the Dutch Code.
Dutch legal requirements concerning director independence differ in certain respects from the rules applicable to U.S. companies listed on the NYSE. While under most circumstances both regimes require that a majority of board members be “independent,” the definition of this term under Dutch law differs from the definition used under the NYSE corporate governance standards. In some cases the Dutch requirement is more stringent, such as by requiring a longer “look-back” period (five years) for former executive directors and employees and by requiring that only one non-executive board member may be “dependent”. Currently, a majority of our Board (seven of the eleven members) is “independent” under the NYSE definition and the Dutch Code. Because two of our nine non-executive directors are not independent we deviate from the Dutch Code’s general best practice provision regarding the maximum number of non-executives that may not be independent.
However, for one-tier governance structures, specifically the Dutch Code suggests it is sufficient that a majority of the members of the board be non-executive and independent. Finally, persons may not be appointed as non-executive directors of FCA if such persons are non-executive directors, member of the supervisory boards or other similar bodies for at least five other (Dutch) companies of a certain size.
The NYSE requires that, when an audit committee member of a U.S. domestic listed company serves on four or more audit committees of public companies, the listed company should disclose (either on its website or in its annual proxy statement or annual report on Form 10-K) that the board of directors has determined that this simultaneous service would not impair the director’s service to the listed company. Dutch law does not require the Company to make such a determination.
NYSE rules require a U.S. listed company to have a compensation committee and a nominating/corporate governance committee composed entirely of independent directors. As a foreign private issuer, we do not have to comply with this requirement, however the Dutch Code also requires us to have a Compensation Committee and a Governance and Sustainability Committee. Our Compensation Committee Charter states that a maximum of one member of the Compensation Committee may be non-independent according to the Dutch Code. All three current members of the Compensation Committee are independent under both the Dutch Code and the NYSE rules. Our Governance and Sustainability Committee Charter states that the Committee shall be comprised of at least three directors, elected by the Board, which shall also appoint one of them as chairperson of the Governance and Sustainability Committee, or the Chairperson. Of the directors elected to serve on the Governance and Sustainability Committee, no more than one may be an executive director and no more than two may not be independent under the Dutch Code. These are both deviations from the Dutch Code which suggests that only non-executive directors and at most one non-independent director serve on Board committees. We allow for an executive director
170
to serve, as the committee’s broad duties benefit from the presence of an executive board member. Although our Governance and Sustainability Committee allows for two non-independent members, we do not intend to make use of this possibility. Current composition of our Governance and Sustainability Committee comprises an executive director as the Chairman and two other directors who are considered independent under both the Dutch Corporate Governance Code and the NYSE Standard.
In contrast to NYSE rules applicable to U.S. companies, which require that external auditors be appointed by the Audit Committee, the general rule under Dutch law is that external auditors are appointed by the general meeting of shareholders. In accordance with the requirements of Dutch law, the appointment and removal of our independent registered public accounting firm must be resolved upon by the general meeting of shareholders. Our Audit Committee is responsible for the recommendation to the shareholders of the appointment and compensation of the independent registered public accounting firm and oversees and evaluates the work of our independent registered public accounting firm.
Under NYSE listing standards, shareholders of U.S. companies must be given the opportunity to vote on all equity compensation plans and to approve material revisions to those plans, with limited exceptions set forth in the NYSE rules. As a foreign private issuer we are permitted to follow our home country laws regarding shareholder approval of compensation plans, and, under Dutch law, such approval from shareholders is not required for equity compensation plans for employees other than the members of the Board, and to the extent the authority to grant equity rights has been delegated by the general meeting of shareholders to the Board. For equity compensation plans for members of the Board and/or in the event that the authority to issue shares and/or rights to subscribe for shares has not been delegated to the Board, approval of the general meeting of shareholders is required.
While NYSE rules do not require listed companies to have shareholders approve or declare dividends, the Dutch Code requires that a dividend distribution be a separate agenda item in the general meeting of shareholders, in which the annual accounts are adopted. In our case, Article 23 of our Articles of Association provide that annual dividends must be resolved upon by our general meeting of shareholders. However, interim dividend distribution can be resolved upon by the Board, subject to meeting certain criteria listed in Articles 23 of our Articles of Association. For a discussion of our dividend policy, see
Item 10B. Memorandum and Articles of Association—Payment of Dividends
.
In accordance with the corporate governance rules of the NYSE applicable to foreign private issuers, we also disclose these differences between our corporate governance practices and those required of domestic companies by the NYSE listing standards on our website at www.fcagroup.com.
Not applicable.
We have responded to Item 18 in lieu of responding to this item.
The audited Consolidated Financial Statements as required under Item 18 are attached hereto starting on page F-1 of this Form 20-F.
In accordance with Rule 3-09 of Regulation S-X, the Company has filed separate audited financial statements for FCA Bank S.p.A. as Exhibits 99.1 and 99.2, due to the significance of the results of operations of this unconsolidated joint venture during the years ended December 31, 2015 and December 31, 2013. Financial statements at December 31, 2014 and for the year then ended are provided for comparative purposes and are not required to be audited. The Rule 3-09 financial statements were prepared and provided to the Company by FCA Bank.
171
|
Exhibit
Number
|
Description of Documents
|
|
1.1
|
English translation of the Articles of Association of Fiat Chrysler Automobiles N.V. (incorporated by reference to Exhibit 3.1 to Amendment No. 3 to Registration Statement on Form F-1, filed with the SEC on December 4, 2014, File No. 333-199285)
|
|
1.2
|
English translation of the Deed of Incorporation of Fiat Chrysler Automobiles N.V. (incorporated by reference to Exhibit 3.2 to Registration Statement on Form F-4, filed with the SEC on July 3, 2014, File No. 333-197229)
|
|
2.1
|
Terms and Conditions of the Global Medium Term Notes (incorporated by reference to Exhibit 4.1 to Registration Statement on Form F-4, filed with the SEC on July 3, 2014, File No. 333-197229)
|
|
2.2
|
Deed of Guarantee, dated as of March 19, 2013, by Fiat S.p.A. in favor of the Relevant Account Holders and the holders for the time being of the Global Medium Term Notes and the interest coupons appertaining to the Global Medium Term Notes (incorporated by reference to Exhibit 4.2 to Registration Statement on Form F-4, filed with the SEC on July 3, 2014, File No. 333-197229)
|
|
There have not been filed as exhibits to this Form 20-F certain long-term debt instruments, none of which relates to indebtedness that exceeds 10% of the consolidated assets of Fiat Chrysler Automobiles N.V. Fiat Chrysler Automobiles N.V. agrees to furnish the Securities and Exchange Commission, upon its request, a copy of any instrument defining the rights of holders of long-term debt of Fiat Chrysler Automobiles N.V. and its consolidated subsidiaries.
|
|
|
4.1
|
Indenture, dated December 16, 2014, between Fiat Chrysler Automobiles N.V. and The Bank of New York Mellon, as Trustee, relating to 7.875% Mandatory Convertible Securities due 2016 (incorporated by reference to Exhibit 4.1 to Report on Form 6-K, filed with the SEC on December 16, 2014, File No. 001-36675)
|
|
4.2
|
Fiat Chrysler Automobiles N.V. Equity Incentive Plan (incorporated by reference to Exhibit 4.2 to Registration Statement on Form S-8, filed with the SEC on January 12, 2015, File No. 333-201440)
|
|
4.3
|
Fiat Chrysler Automobiles N.V. Remuneration Policy (incorporated by reference to Exhibit 4.3 to Registration Statement on Form S-8, filed with the SEC on January 12, 2015, File No. 333-201440)
|
|
4.4
|
Indenture, dated as of April 14, 2015, between Fiat Chrysler Automobiles N.V. and The Bank of New York Mellon, as Trustee, relating to senior debt securities (incorporated by reference to Exhibit 4.1 to Report on Form 6-K, filed with the SEC on April 16, 2015, File No. 001-36676)
|
|
4.5
|
Form of 4.500% Rule 144A Global Note due 2020 (incorporated by reference to Exhibit 4.2 to Report on Form 6-K, filed with the SEC on April 16, 2015, File No. 001-36676)
|
|
4.6
|
Form of 4.500% Regulation S Global Note due 2020 (incorporated by reference to Exhibit 4.3 to Report on Form 6-K, filed with the SEC on April 16, 2015, File No. 001-36676)
|
|
4.7
|
Form of 5.250% Rule 144A Global Note due 2023 (incorporated by reference to Exhibit 4.4 to Report on Form 6-K, filed with the SEC on April 16, 2015, File No. 001-36676)
|
|
4.8
|
Form of 5.250% Regulation S Global Note due 2023 (incorporated by reference to Exhibit 4.5 to Report on Form 6-K, filed with the SEC on April 16, 2015, File No. 001-36676)
|
|
4.9
|
Registration Rights Agreement, dated as of April 14, 2015, between Fiat Chrysler Automobiles N.V. and J.P. Morgan Securities LLC and Merrill Lynch, Pierce, Fenner & Smith Incorporated, as Representatives of the other several Initial Purchasers (incorporated by reference to Exhibit 4.6 to Report on Form 6-K, filed with the SEC on April 16, 2015, File No. 001-36676)
|
|
8.1
|
Subsidiaries
|
|
12.1
|
Section 302 Certification of the Chief Executive Officer
|
|
12.2
|
Section 302 Certification of the Chief Financial Officer
|
|
13.1
|
Certification of the Chief Executive Officer Pursuant to 18 U.S.C. Section 1350, As Adopted Pursuant to Section 906 of the Sarbanes-Oxley Act of 2002
|
|
13.2
|
Certification of the Chief Financial Officer Pursuant to 18 U.S.C. Section 1350, As Adopted Pursuant to Section 906 of the Sarbanes-Oxley Act of 2002
|
172
|
99.1
|
Consolidated Financial Statements of FCA Bank S.p.A. at December 31, 2015
|
|
99.2
|
Consolidated Financial Statements of FCA Bank S.p.A. at December 31, 2014 and 2013
|
SIGNATURES
The registrant hereby certifies that it meets all of the requirements for filing on Form 20-F and that it has duly caused and authorized the undersigned to sign this annual report on its behalf.
|
FIAT CHRYSLER AUTOMOBILES N.V.
|
||
|
(Registrant)
|
||
|
By:
|
/s/ Richard K. Palmer
|
|
|
Name: Richard K. Palmer
|
||
|
Title: Chief Financial Officer
|
||
|
Dated: February 29, 2016
|
||
173
FIAT CHRYSLER AUTOMOBILES N.V. AND SUBSIDIARIES
Index to Consolidated Financial Statements
|
Page
|
||
F - 1
REPORT OF INDEPENDENT REGISTERED PUBLIC ACCOUNTING FIRM
To the Board of Directors and Shareholders of
Fiat Chrysler Automobiles N.V.
We have audited the accompanying consolidated statements of financial position of Fiat Chrysler Automobiles N.V. as of December 31, 2015 and 2014, and the related consolidated statements of income, comprehensive income, cash flows and changes in equity for each of the three years in the period ended December 31, 2015. These financial statements are the responsibility of the Company’s management. Our responsibility is to express an opinion on these financial statements based on our audits.
We conducted our audits in accordance with the standards of the Public Company Accounting Oversight Board (United States). Those standards require that we plan and perform the audit to obtain reasonable assurance about whether the financial statements are free of material misstatement. An audit includes examining, on a test basis, evidence supporting the amounts and disclosures in the financial statements. An audit also includes assessing the accounting principles used and significant estimates made by management, as well as evaluating the overall financial statement presentation. We believe that our audits provide a reasonable basis for our opinion.
In our opinion, the financial statements referred to above present fairly, in all material respects, the consolidated financial position of Fiat Chrysler Automobiles N.V. at December 31, 2015 and 2014, and the consolidated results of its operations and its cash flows for each of the three years in the period ended December 31, 2015, in conformity with International Financial Reporting Standards as issued by the International Accounting Standards Board.
We also have audited, in accordance with the standards of the Public Company Accounting Oversight Board (United States), Fiat Chrysler Automobiles N.V.'s internal control over financial reporting as of December 31, 2015, based on criteria established in Internal Control-Integrated Framework issued by the Committee of Sponsoring Organizations of the Treadway Commission (2013 framework) and our report dated February 29, 2016 expressed an unqualified opinion thereon.
/s/ Reconta Ernst & Young S.p.A.
Turin, Italy
February 29, 2016
F - 2
FIAT CHRYSLER AUTOMOBILES N.V. AND SUBSIDIARIES
CONSOLIDATED INCOME STATEMENT
for the Years Ended December 31,
2015
,
2014
and
2013
|
For the Years Ended December 31,
|
||||||||||
|
Note
|
2015
|
2014
|
2013
|
|||||||
|
(€ million)
|
||||||||||
|
Net revenues
|
(1)
|
110,595
|
|
|
93,640
|
|
|
84,530
|
|
|
|
Cost of sales
|
(2)
|
97,620
|
|
81,592
|
|
73,038
|
|
|||
|
Selling, general and administrative costs
|
(3)
|
7,728
|
|
6,947
|
|
6,615
|
|
|||
|
Research and development costs
|
(4)
|
2,864
|
|
|
2,334
|
|
|
2,275
|
|
|
|
Result from investments:
|
143
|
|
131
|
|
84
|
|
||||
|
Share of the profit of equity method investees
|
(13)
|
130
|
|
117
|
|
74
|
|
|||
|
Other income from investments
|
13
|
|
14
|
|
10
|
|
||||
|
Gains on disposal of investments
|
—
|
|
12
|
|
8
|
|
||||
|
Restructuring costs
|
53
|
|
50
|
|
28
|
|
||||
|
Other income/(expenses)
|
(5)
|
152
|
|
(26
|
)
|
(28
|
)
|
|||
|
EBIT
|
2,625
|
|
|
2,834
|
|
|
2,638
|
|
||
|
Net financial expenses
|
(6)
|
2,366
|
|
2,051
|
|
1,989
|
|
|||
|
Profit before taxes
|
259
|
|
783
|
|
649
|
|
||||
|
Tax expense/(benefit)
|
(7)
|
166
|
|
424
|
|
(1,059
|
)
|
|||
|
Net profit from continuing operations
|
93
|
|
359
|
|
1,708
|
|
||||
|
Profit from discontinued operations, net of tax
|
284
|
|
273
|
|
243
|
|
||||
|
Net profit
|
377
|
|
|
632
|
|
|
1,951
|
|
||
|
Net profit attributable to:
|
||||||||||
|
Owners of the parent
|
334
|
|
|
568
|
|
|
904
|
|
||
|
Non-controlling interests
|
43
|
|
64
|
|
1,047
|
|
||||
|
Profit from continuing operations attributable to:
|
||||||||||
|
Owners of the parent
|
83
|
|
327
|
|
690
|
|
||||
|
Non-controlling interests
|
10
|
|
32
|
|
1,018
|
|
||||
|
Earnings per share:
|
(9)
|
|||||||||
|
Basic earnings per ordinary share (in €)
|
0.221
|
|
0.465
|
|
0.744
|
|
||||
|
Diluted earnings per ordinary share (in €)
|
0.221
|
|
0.460
|
|
0.736
|
|
||||
|
Earnings per share for profit from continuing operations:
|
||||||||||
|
Basic earnings per ordinary share (in €)
|
0.055
|
|
0.268
|
|
0.568
|
|
||||
|
Diluted earnings per ordinary share (in €)
|
0.055
|
|
0.265
|
|
0.562
|
|
||||
The accompanying notes are an integral part of the Consolidated Financial Statements.
F - 3
FIAT CHRYSLER AUTOMOBILES N.V. AND SUBSIDIARIES
CONSOLIDATED STATEMENT OF COMPREHENSIVE INCOME/(LOSS)
for the Years Ended December 31,
2015
,
2014
and
2013
|
For the Years Ended December 31,
|
||||||||||
|
Note
|
2015
|
2014
|
2013
|
|||||||
|
(€ million)
|
||||||||||
|
Net profit (A)
|
377
|
|
632
|
|
1,951
|
|
||||
|
Items that will not be reclassified to the Consolidated Income Statement in subsequent periods:
|
(19)
|
|||||||||
|
Gains/(losses) on remeasurement of defined benefit plans
|
679
|
|
(327
|
)
|
2,679
|
|
||||
|
Share of (losses) on remeasurement of defined benefit plans for
equity method investees |
(2
|
)
|
(4
|
)
|
(7
|
)
|
||||
|
Related tax impact
|
(201
|
)
|
28
|
|
237
|
|
||||
|
Items relating to discontinued operations, net of tax
|
3
|
|
(5
|
)
|
(1
|
)
|
||||
|
Total items that will not be reclassified to the Consolidated Income Statement in subsequent periods (B1)
|
479
|
|
(308
|
)
|
2,908
|
|
||||
|
Items that may be reclassified to the Consolidated Income Statements in subsequent periods:
|
(19)
|
|||||||||
|
Gains/(losses) on cash flow hedging instruments
|
186
|
|
(144
|
)
|
107
|
|
||||
|
Gains/(losses) on available-for-sale financial assets
|
11
|
|
(24
|
)
|
4
|
|
||||
|
Exchange differences on translating foreign operations
|
928
|
|
1,255
|
|
(708
|
)
|
||||
|
Share of Other comprehensive (loss)/income for equity method investees
|
(17
|
)
|
51
|
|
(88
|
)
|
||||
|
Related tax impact
|
(48
|
)
|
26
|
|
(10
|
)
|
||||
|
Items relating to discontinued operations, net of tax
|
18
|
|
(74
|
)
|
26
|
|
||||
|
Total items that may be reclassified to the Consolidated Income Statement in subsequent periods (B2)
|
1,078
|
|
1,090
|
|
(669
|
)
|
||||
|
Total Other comprehensive income/(loss), net of tax (B1)+(B2)=(B)
|
1,557
|
|
782
|
|
2,239
|
|
||||
|
Total Comprehensive income/(loss) (A)+(B)
|
1,934
|
|
1,414
|
|
4,190
|
|
||||
|
Total Comprehensive income/(loss) attributable to:
|
||||||||||
|
Owners of the parent
|
1,879
|
|
1,282
|
|
2,117
|
|
||||
|
Non-controlling interests
|
55
|
|
132
|
|
2,073
|
|
||||
|
1,934
|
|
1,414
|
|
4,190
|
|
|||||
|
Total Comprehensive income/(loss) attributable to owners of the parent:
|
||||||||||
|
Continuing operations
|
1,611
|
|
1,114
|
|
1,878
|
|
||||
|
Discontinued operations
|
268
|
|
168
|
|
239
|
|
||||
|
1,879
|
|
1,282
|
|
2,117
|
|
|||||
The accompanying notes are an integral part of the Consolidated Financial Statements.
F - 4
FIAT CHRYSLER AUTOMOBILES N.V. AND SUBSIDIARIES
CONSOLIDATED STATEMENT OF FINANCIAL POSITION
at December 31,
2015
and
2014
|
At December 31,
|
|||||||
|
Note
|
2015
|
2014
|
|||||
|
(€ million)
|
|||||||
|
Assets
|
|||||||
|
Intangible assets:
|
24,736
|
|
22,847
|
|
|||
|
Goodwill and intangible assets with indefinite useful lives
|
(10)
|
14,790
|
|
14,012
|
|
||
|
Other intangible assets
|
(11)
|
9,946
|
|
8,835
|
|
||
|
Property, plant and equipment
|
(12)
|
27,454
|
|
26,408
|
|
||
|
Investments and other financial assets:
|
(13)
|
2,242
|
|
|
2,020
|
|
|
|
Investments accounted for using the equity method
|
1,658
|
|
|
1,471
|
|
||
|
Other investments and financial assets
|
584
|
|
|
549
|
|
||
|
Deferred tax assets
|
(7)
|
3,343
|
|
3,547
|
|
||
|
Other assets
|
176
|
|
114
|
|
|||
|
Total Non-current assets
|
57,951
|
|
54,936
|
|
|||
|
Inventories
|
(14)
|
11,351
|
|
|
10,449
|
|
|
|
Assets sold with a buy-back commitment
|
1,881
|
|
2,018
|
|
|||
|
Trade receivables
|
(15)
|
2,668
|
|
|
2,564
|
|
|
|
Receivables from financing activities
|
(15)
|
2,006
|
|
|
3,843
|
|
|
|
Current tax receivables
|
(15)
|
405
|
|
|
328
|
|
|
|
Other current assets
|
(15)
|
3,078
|
|
|
2,761
|
|
|
|
Current financial assets:
|
1,383
|
|
761
|
|
|||
|
Current investments
|
48
|
|
36
|
|
|||
|
Current securities
|
(16)
|
482
|
|
|
210
|
|
|
|
Other financial assets
|
(17)
|
853
|
|
515
|
|
||
|
Cash and cash equivalents
|
(18)
|
20,662
|
|
|
22,840
|
|
|
|
Assets held for sale
|
5
|
|
|
10
|
|
||
|
Assets held for distribution
|
3,650
|
|
—
|
|
|||
|
Total Current assets
|
47,089
|
|
45,574
|
|
|||
|
Total Assets
|
105,040
|
|
100,510
|
|
|||
|
Equity and liabilities
|
|||||||
|
Equity:
|
(19)
|
16,255
|
|
|
13,738
|
|
|
|
Equity attributable to owners of the parent
|
16,092
|
|
13,425
|
|
|||
|
Non-controlling interest
|
163
|
|
313
|
|
|||
|
Provisions:
|
23,856
|
|
20,372
|
|
|||
|
Employee benefits
|
(21)
|
10,064
|
|
|
9,592
|
|
|
|
Other provisions
|
(22)
|
13,792
|
|
10,780
|
|
||
|
Deferred tax liabilities
|
(7)
|
156
|
|
233
|
|
||
|
Debt
|
(23)
|
27,786
|
|
|
33,724
|
|
|
|
Other financial liabilities
|
(17)
|
736
|
|
748
|
|
||
|
Other current liabilities
|
(24)
|
10,930
|
|
|
11,495
|
|
|
|
Current tax payables
|
272
|
|
346
|
|
|||
|
Trade payables
|
21,465
|
|
|
19,854
|
|
||
|
Liabilities held for distribution
|
|
3,584
|
|
|
—
|
|
|
|
Total Equity and liabilities
|
105,040
|
|
100,510
|
|
|||
The accompanying notes are an integral part of the Consolidated Financial Statements.
F - 5
FIAT CHRYSLER AUTOMOBILES N.V. AND SUBSIDIARIES
for the Years Ended December 31,
2015
,
2014
and
2013
|
For the Years Ended December 31,
|
||||||||||
|
Note
|
2015
|
2014
|
2013
|
|||||||
|
(€ million)
|
||||||||||
|
Cash and cash equivalents at beginning of the period
|
(18)
|
22,840
|
|
19,455
|
|
17,666
|
|
|||
|
Cash flows from operating activities:
|
|
|
|
|
|
|
||||
|
Net profit from continuing operations
|
93
|
|
359
|
|
1,708
|
|
||||
|
Amortization and depreciation
|
5,414
|
|
4,607
|
|
4,364
|
|
||||
|
Net losses on disposal of tangible and intangible assets
|
18
|
|
8
|
|
32
|
|
||||
|
Net (gains) on disposal of investments
|
—
|
|
(9
|
)
|
(8
|
)
|
||||
|
Other non-cash items
|
(27)
|
812
|
|
348
|
|
531
|
|
|||
|
Dividends received
|
112
|
|
87
|
|
92
|
|
||||
|
Change in provisions
|
3,206
|
|
1,169
|
|
464
|
|
||||
|
Change in deferred taxes
|
(279
|
)
|
(179
|
)
|
(1,569
|
)
|
||||
|
Change due to buy-back commitments and GDP vehicles
|
6
|
|
177
|
|
92
|
|
||||
|
Change in working capital
|
(27)
|
(158
|
)
|
779
|
|
1,378
|
|
|||
|
Cash flows from operating activities - discontinued operations
|
527
|
|
823
|
|
534
|
|
||||
|
Total
|
9,751
|
|
8,169
|
|
7,618
|
|
||||
|
Cash flows used in investing activities:
|
|
|
|
|
|
|
||||
|
Investments in property, plant and equipment and intangible assets
|
(8,819
|
)
|
(7,804
|
)
|
(7,219
|
)
|
||||
|
Investments in joint ventures, associates and unconsolidated subsidiaries
|
(266
|
)
|
(17
|
)
|
(166
|
)
|
||||
|
Proceeds from the sale of tangible and intangible assets
|
29
|
|
38
|
|
55
|
|
||||
|
Proceeds from disposal of other investments
|
—
|
|
38
|
|
5
|
|
||||
|
Net change in receivables from financing activities
|
410
|
|
78
|
|
(409
|
)
|
||||
|
Change in current securities
|
(256
|
)
|
43
|
|
(10
|
)
|
||||
|
Other changes
|
28
|
|
16
|
|
(9
|
)
|
||||
|
Cash flows used in investing activities - discontinued operations
|
(426
|
)
|
(532
|
)
|
(301
|
)
|
||||
|
Total
|
(9,300
|
)
|
(8,140
|
)
|
(8,054
|
)
|
||||
|
Cash flows from/(used in) financing activities:
|
(27)
|
|
|
|
|
|
|
|||
|
Issuance of notes
|
2,840
|
|
4,629
|
|
2,866
|
|
||||
|
Repayment of notes
|
(7,241
|
)
|
(2,150
|
)
|
(1,000
|
)
|
||||
|
Issuance of other medium-term borrowings
|
3,061
|
|
4,873
|
|
3,188
|
|
||||
|
Repayment of other medium-term borrowings
|
(4,412
|
)
|
(5,834
|
)
|
(2,556
|
)
|
||||
|
Net change in other financial payables and other financial assets/liabilities
|
(36
|
)
|
496
|
|
662
|
|
||||
|
Net proceeds from initial public offering of 10 percent of Ferrari N.V.
|
866
|
|
—
|
|
—
|
|
||||
|
Issuance of Mandatory Convertible Securities and other share issuances
|
(19)
|
—
|
|
3,094
|
|
—
|
|
|||
|
Cash Exit Rights following the merger of Fiat into FCA
|
—
|
|
(417
|
)
|
—
|
|
||||
|
Exercise of stock options
|
—
|
|
146
|
|
4
|
|
||||
|
Distributions paid
|
(283
|
)
|
—
|
|
(1
|
)
|
||||
|
Distribution of certain tax obligations
|
—
|
|
(45
|
)
|
(6
|
)
|
||||
|
Acquisition of non-controlling interests
|
(27)
|
—
|
|
(2,691
|
)
|
(34
|
)
|
|||
|
Capital increase
|
10
|
|
—
|
|
—
|
|
||||
|
Cash flows from financing activities - discontinued operations
|
2,067
|
|
36
|
|
13
|
|
||||
|
Total
|
(3,128
|
)
|
2,137
|
|
3,136
|
|
||||
|
Translation exchange differences
|
681
|
|
1,219
|
|
(911
|
)
|
||||
|
Total change in Cash and cash equivalents
|
(1,996
|
)
|
3,385
|
|
1,789
|
|
||||
|
Cash and cash equivalents at end of the period - included within Assets held for distribution
|
182
|
|
—
|
|
—
|
|
||||
|
Cash and cash equivalents at end of the period
|
(18)
|
20,662
|
|
22,840
|
|
19,455
|
|
|||
F - 6
FIAT CHRYSLER AUTOMOBILES N.V. AND SUBSIDIARIES
CONSOLIDATED STATEMENT OF CHANGES IN EQUITY
for the Years Ended December 31,
2015
,
2014
and
2013
|
Attributable to owners of the parent
|
|||||||||||||||||||||||||||||
|
Share capital
|
Treasury shares
|
Other reserves
|
Cash flow hedge reserve
|
Currency translation differences
|
Available-for-sale financial assets
|
Remeasure-ment of defined benefit plans
|
Cumulative share of OCI of equity method investees
|
Non-controlling interests
|
Total
|
||||||||||||||||||||
|
(€ million)
|
|||||||||||||||||||||||||||||
|
At December 31, 2012
|
4,476
|
|
(259
|
)
|
3,935
|
|
15
|
|
618
|
|
(17
|
)
|
(2,541
|
)
|
(40
|
)
|
2,182
|
|
8,369
|
|
|||||||||
|
Capital increase
|
1
|
|
—
|
|
2
|
|
—
|
|
—
|
|
—
|
|
—
|
|
—
|
|
1
|
|
4
|
|
|||||||||
|
Share-based payments
|
—
|
|
—
|
|
9
|
|
—
|
|
—
|
|
—
|
|
—
|
|
—
|
|
—
|
|
9
|
|
|||||||||
|
Net profit
|
—
|
|
—
|
|
904
|
|
—
|
|
—
|
|
—
|
|
—
|
|
—
|
|
1,047
|
|
1,951
|
|
|||||||||
|
Other comprehensive income/(loss)
|
—
|
|
—
|
|
—
|
|
86
|
|
(567
|
)
|
4
|
|
1,784
|
|
(94
|
)
|
1,026
|
|
2,239
|
|
|||||||||
|
Distribution for tax withholding obligations
|
—
|
|
—
|
|
—
|
|
—
|
|
—
|
|
—
|
|
—
|
|
—
|
|
(6
|
)
|
(6
|
)
|
|||||||||
|
Purchase of shares in subsidiaries from non-controlling interests
|
—
|
|
—
|
|
2
|
|
—
|
|
—
|
|
—
|
|
—
|
|
—
|
|
—
|
|
2
|
|
|||||||||
|
Other changes
|
—
|
|
—
|
|
8
|
|
—
|
|
—
|
|
—
|
|
—
|
|
—
|
|
8
|
|
16
|
|
|||||||||
|
At December 31, 2013
|
4,477
|
|
(259
|
)
|
4,860
|
|
101
|
|
51
|
|
(13
|
)
|
(757
|
)
|
(134
|
)
|
4,258
|
|
12,584
|
|
|||||||||
|
Capital increase
|
2
|
|
—
|
|
989
|
|
—
|
|
—
|
|
—
|
|
—
|
|
—
|
|
3
|
|
994
|
|
|||||||||
|
Merger of Fiat into FCA
|
(4,269
|
)
|
224
|
|
4,045
|
|
—
|
|
—
|
|
—
|
|
—
|
|
—
|
|
—
|
|
—
|
|
|||||||||
|
Mandatory Convertible Securities
|
—
|
|
—
|
|
1,910
|
|
—
|
|
—
|
|
—
|
|
—
|
|
—
|
|
—
|
|
1,910
|
|
|||||||||
|
Exit Rights
|
(193
|
)
|
—
|
|
(224
|
)
|
—
|
|
—
|
|
—
|
|
—
|
|
—
|
|
—
|
|
(417
|
)
|
|||||||||
|
Dividends distributed
|
—
|
|
—
|
|
—
|
|
—
|
|
—
|
|
—
|
|
—
|
|
—
|
|
(50
|
)
|
(50
|
)
|
|||||||||
|
Share-based payments
|
—
|
|
35
|
|
(31
|
)
|
—
|
|
—
|
|
—
|
|
—
|
|
—
|
|
—
|
|
4
|
|
|||||||||
|
Net profit
|
—
|
|
—
|
|
568
|
|
—
|
|
—
|
|
—
|
|
—
|
|
—
|
|
64
|
|
632
|
|
|||||||||
|
Other comprehensive income/(loss)
|
—
|
|
—
|
|
—
|
|
(205
|
)
|
1,198
|
|
(24
|
)
|
(303
|
)
|
48
|
|
68
|
|
782
|
|
|||||||||
|
Distribution for tax withholding obligations on behalf of NCI
|
—
|
|
—
|
|
—
|
|
—
|
|
—
|
|
—
|
|
—
|
|
—
|
|
(45
|
)
|
(45
|
)
|
|||||||||
|
Purchase of shares in subsidiaries from non-controlling interests
|
—
|
|
—
|
|
1,633
|
|
35
|
|
175
|
|
—
|
|
(518)
(1)
|
|
—
|
|
(3,990
|
)
|
(2,665
|
)
|
|||||||||
|
Other changes
|
—
|
|
—
|
|
4
|
|
—
|
|
—
|
|
—
|
|
—
|
|
—
|
|
5
|
|
9
|
|
|||||||||
|
At December 31, 2014
|
17
|
|
—
|
|
13,754
|
|
(69
|
)
|
1,424
|
|
(37
|
)
|
(1,578
|
)
|
(86
|
)
|
313
|
|
13,738
|
|
|||||||||
|
Capital increase
|
—
|
|
—
|
|
—
|
|
—
|
|
—
|
|
—
|
|
—
|
|
—
|
|
10
|
|
10
|
|
|||||||||
|
Distributions
|
—
|
|
—
|
|
(17
|
)
|
—
|
|
—
|
|
—
|
|
—
|
|
—
|
|
(283
|
)
|
(300
|
)
|
|||||||||
|
Share-based payments
|
—
|
|
—
|
|
80
|
|
—
|
|
—
|
|
—
|
|
—
|
|
—
|
|
—
|
|
80
|
|
|||||||||
|
Net profit
|
—
|
|
—
|
|
334
|
|
—
|
|
—
|
|
—
|
|
—
|
|
—
|
|
43
|
|
377
|
|
|||||||||
|
Initial public offering of 10 percent Ferrari N.V.
|
—
|
|
—
|
|
869
|
|
7
|
|
(4
|
)
|
—
|
|
1
|
|
—
|
|
(7
|
)
|
866
|
|
|||||||||
|
Other comprehensive income/(loss)
|
—
|
|
—
|
|
—
|
|
132
|
|
942
|
|
11
|
|
479
|
|
(19
|
)
|
12
|
|
1,557
|
|
|||||||||
|
Other changes
|
—
|
|
—
|
|
(149
|
)
|
—
|
|
1
|
|
—
|
|
—
|
|
—
|
|
75
|
|
(73
|
)
|
|||||||||
|
At December 31, 2015
|
17
|
|
—
|
|
14,871
|
|
70
|
|
2,363
|
|
(26
|
)
|
(1,098
|
)
|
(105
|
)
|
163
|
|
16,255
|
|
|||||||||
_________________________
(1) The €518 million relates to the 41.5 percent interest in FCA US's remeasurement of defined benefit plans reserve of €1,248 million upon FCA's acquisition of the 41.5 percent remaining interest in FCA US previously not owned.
The accompanying notes are an integral part of the Consolidated Financial Statements.
F - 7
FIAT CHRYSLER AUTOMOBILES N.V. AND SUBSIDIARIES
NOTES TO THE CONSOLIDATED FINANCIAL STATEMENTS
At December 31, 2015 and 2014
PRINCIPAL ACTIVITIES
The FCA Merger
On January 29, 2014, the Board of Directors of Fiat S.p.A. (“Fiat”) approved a proposed corporate reorganization resulting in the formation of Fiat Chrysler Automobiles N.V. and decided to establish Fiat Chrysler Automobiles N.V., organized in the Netherlands, as the parent of the Group with its principal executive offices in the United Kingdom. Fiat Chrysler Automobiles N.V. was incorporated as a public limited liability company (
naamloze vennootschap
) under the laws of the Netherlands on April 1, 2014 under the name Fiat Investments N.V.
On June 15, 2014, the Board of Directors of Fiat approved the terms of a cross-border legal merger of Fiat into its 100 percent owned direct subsidiary Fiat Investments N.V. (the “Merger”), subject to several conditions precedent.
Fiat Chrysler Automobiles N.V. was incorporated with issued share capital of €200,000, which was composed of 20,000,000 common shares having a nominal value of €0.01 each. Share capital increased to €350,000 on May 13, 2014. Fiat shareholders voted and approved the Merger at their extraordinary general meeting held on August 1, 2014 and after this approval, Fiat shareholders not voting in favor of the Merger were entitled to exercise cash exit rights (the “Cash Exit Rights”) by August 20, 2014, which were exercised for a net aggregate cash disbursement of €417 million.
The Merger, which took the form of a reverse merger, became effective on October 12, 2014 and resulted in Fiat Investments N.V. being the surviving entity and was renamed Fiat Chrysler Automobiles N.V. (“FCA NV”). The Merger was recognized in FCA NV’s Consolidated Financial Statements from January 1, 2014 and FCA NV, as successor of Fiat, was deemed to be the parent company. As the Merger is a transaction in which all of the combining entities are controlled ultimately by the same party both before and after the reverse merger, and based on the fact that the control is not transitory, the transition was deemed to be a combination of entities under common control and therefore outside the scope of IFRS 3R -
Business Combinations
and IFRIC 17
- Distributions of Non-cash Assets to Owners.
As a result, the Merger was accounted for without adjusting the carrying amounts of assets and liabilities involved in the transaction and did not have an accounting impact on the Consolidated Financial Statements.
Unless otherwise specified, the terms “Group”, “FCA Group”, “Company” and “FCA”, refer to FCA, together with its subsidiaries and its predecessor prior to the completion of the Merger, or any one or more of them, as the context may require. Any references to “Fiat” refer solely to Fiat S.p.A., the predecessor of FCA NV prior to the Merger.
Ferrari Spin-off and Discontinued Operations
On October 26, 2015, Ferrari N.V., a subsidiary of FCA, completed its initial public offering (“IPO”) in which FCA sold 10 percent of Ferrari N.V. common shares (“Ferrari IPO”) and received net proceeds of approximately €0.9 billion, which resulted in FCA owning 80 percent of Ferrari N.V. common shares, Piero Ferrari owning 10 percent of common shares and public shareholders owning the remaining 10 percent of common shares. The Ferrari IPO was accounted for as an equity transaction with the effect on Equity attributable to owners of the parent as follows:
|
At October 26, 2015
|
||
|
(€ million)
|
||
|
Consideration received
|
866
|
|
|
Less: Carrying amount of equity interest sold
|
(7
|
)
|
|
Effect on Equity attributable to owners of the parent
|
873
|
|
In October 2015, in connection with the Ferrari IPO and in preparation for the spin-off of the remaining common shares of Ferrari N.V. owned by FCA, FCA carried out an internal corporate restructuring. As part of this reorganization, FCA transferred its shares of Ferrari S.p.A. to Ferrari N.V. and provided a capital contribution to Ferrari N.V., while Ferrari N.V. issued a note payable to FCA in the amount of €2.8 billion. This internal restructuring was a common control transaction and did not have
F - 8
an accounting impact on the Consolidated Financial Statements. As a result and in connection with the transactions in which Piero Ferrari exchanged his shares in Ferrari S.p.A. for Ferrari N.V. shares, FCA paid €280 million to Piero Ferrari as consideration for the dilution of his share value due to the issuance of the €2.8 billion note payable, which was recorded as a reduction to non-controlling interests.
On December 3, 2015, an extraordinary general meeting of FCA shareholders was held, whereby the transactions intended to separate FCA’s remaining ownership interest in Ferrari N.V. and to distribute that ownership interest to holders of FCA shares and mandatory convertible securities were approved. The transactions to separate Ferrari N.V. from the Group were completed on January 3, 2016 (Note
32
).
As the spin-off of Ferrari N.V. became highly probable with the aforementioned shareholders’ approval and since it was available for immediate distribution at that date, the Ferrari segment met the criteria to be classified as a disposal group held for distribution to owners and a discontinued operation pursuant to IFRS 5 -
Non-current Assets Held for Sale and Discontinued Operations.
Since Exor S.p.A., which controls and consolidates FCA (Note
26
), will continue to control and consolidate Ferrari N.V. after the spin-off, this was deemed to be a common control transaction and was accounted for at book value.
The presentation of the Ferrari segment was as follows:
|
•
|
The operating results of Ferrari have been excluded from the Group's continuing operations and are presented as a single line item within the Consolidated Income Statements for the years ended December 31, 2015, 2014 and 2013. In order to present the financial effects of a discontinued operation, revenues and expenses arising from intercompany transactions were eliminated except for those revenues and expenses that are considered to continue after the spin-off of the discontinued operation. However, no profit or loss is recognized for intercompany transactions within the Consolidated Income Statements.
|
|
•
|
The assets and liabilities of Ferrari have been classified as Assets held for distribution and Liabilities held for distribution within the Consolidated Statement of Financial Position at December 31, 2015, while the assets and liabilities of Ferrari have not been re-classified for the comparative Consolidated Statement of Financial Position at December 31, 2014.
|
|
•
|
Cash flows arising from the Ferrari segment have been presented separately as discontinued cash flows from operating, investing and financing activities within the Consolidated Statement of Cash Flows for the years ended December 31, 2015, 2014 and 2013. The cash flows represent those arising from transactions with third parties.
|
In anticipation of the spin-off of Ferrari N.V., on November 30, 2015, Ferrari N.V. entered into a €2.5 billion syndicated loan facility. The facility consisted of a bridge loan (the “Ferrari Bridge Loan”) and a term loan (the “Ferrari Term Loan”) of €2 billion in aggregate as well as a revolving credit facility of €500 million (the “Ferrari RCF”). Proceeds of the Ferrari Bridge Loan and Ferrari Term Loan were used to refinance indebtedness owed to FCA. The €2.5 billion syndicated loan facility is limited in recourse to Ferrari N.V. and any of its subsidiaries which borrow under the facility, and is without recourse to any other part of FCA. The Ferrari Bridge Loan and the Ferrari Term Loan are classified within Liabilities held for distribution within the Consolidated Statement of Financial Position at December 31, 2015. The Ferrari RCF was undrawn at December 31, 2015.
F - 9
The following assets and liabilities of the Ferrari segment were classified as held for distribution at December 31, 2015:
|
At December 31, 2015
|
||
|
(€ million)
|
||
|
Assets classified as held for distribution
|
||
|
Goodwill
|
786
|
|
|
Other intangible assets
|
297
|
|
|
Property, plant and equipment
|
627
|
|
|
Other non-current assets
|
134
|
|
|
Receivables from financing activities
|
1,176
|
|
|
Cash and cash equivalents
|
182
|
|
|
Other current assets
|
448
|
|
|
Total Assets held for distribution
|
3,650
|
|
|
Liabilities classified as held for distribution
|
||
|
Provisions
|
224
|
|
|
Debt
|
2,256
|
|
|
Other current liabilities
|
624
|
|
|
Trade payables
|
480
|
|
|
Total Liabilities held for distribution
|
3,584
|
|
The table below summarizes the major line items of the Consolidated Income Statement for discontinued operations for the years ended December 31, 2015, 2014 and 2013.
|
For the Years Ended December 31,
|
||||||||
|
2015
|
2014
|
2013
|
||||||
|
(€ million)
|
||||||||
|
Net revenues
|
2,596
|
|
2,450
|
|
2,094
|
|
||
|
Expenses
|
2,152
|
|
2,061
|
|
1,730
|
|
||
|
EBIT
|
444
|
|
389
|
|
364
|
|
||
|
Net financial expenses/(income)
|
16
|
|
(4
|
)
|
(2
|
)
|
||
|
Profit before taxes from discontinued operations
|
428
|
|
393
|
|
366
|
|
||
|
Tax expense
|
144
|
|
120
|
|
123
|
|
||
|
Profit from discontinued operations, net of tax
|
284
|
|
273
|
|
243
|
|
||
The amounts presented above are not representative of the income statement and the financial position of Ferrari on a stand-alone basis, as these amounts are net of intercompany transactions, except as noted above.
Corporate Information
The Group and its subsidiaries, among which the most significant is FCA US LLC (“FCA US”), together with its subsidiaries, are engaged in the design, engineering, manufacturing, distribution and sale of automobiles and light commercial vehicles, engines, transmission systems, automotive-related components, metallurgical products and production systems. In addition, the Group is also involved in certain other activities, including services (mainly captive) and publishing, which represent an insignificant portion of the Group's business.
All references in this report to “Euro” and “€” refer to the currency introduced at the start of the third stage of European Economic and Monetary Union pursuant to the Treaty on the Functioning of the European Union, as amended. The Group’s financial information is presented in Euro except that, in some instances, information in U.S. $ is provided in the Consolidated Financial Statements and information included elsewhere in this report. All references to “U.S. Dollars,” “U.S. Dollar”, “U.S.$” and “$” refer to the currency of the United States of America (or “U.S.”).
F - 10
SIGNIFICANT ACCOUNTING POLICIES
Authorization of Consolidated Financial Statements and compliance with International Financial Reporting Standards
The Consolidated Financial Statements, together with notes thereto of FCA, at
December 31, 2015
were authorized for issuance on February 29, 2016 and have been prepared in accordance with the International Financial Reporting Standards (“IFRS”) as issued by the International Accounting Standards Board (“IASB”). The designation “IFRS” also includes International Accounting Standards (“IAS”) as well as all interpretations of the IFRS Interpretations Committee (“IFRIC”).
Basis of Preparation
The Consolidated Financial Statements are prepared under the historical cost method, modified as required for the measurement of certain financial instruments, as well as on a going concern basis. In this respect, the Group’s assessment is that no material uncertainties (as defined in paragraph 25 of IAS 1-
Presentation of Financial Statements
) exist about its ability to continue as a going concern.
Format of the Consolidated Financial Statements
For presentation of the Consolidated Income Statement, the Group uses a classification based on the function of expenses, rather than based on their nature, as it is more representative of the format used for internal reporting and management purposes and is consistent with international practice in the automotive sector. The Group also presents a subtotal for Earnings before Interest and Taxes (“EBIT”). EBIT distinguishes between the Profit before taxes arising from operating activities and those arising from financing activities.
For the Consolidated Statement of Financial Position, a mixed format has been selected to present current and non-current assets and liabilities, as permitted by IAS 1 paragraph 60. More specifically, the Group’s Consolidated Financial Statements include both industrial and financial services companies. The investment portfolios of the financial services companies are included in current assets, as the investments will be realized in their normal operating cycle. However, the financial services companies obtain only a portion of their funding from the market while the remainder is obtained from Group operating companies through the Group’s treasury companies (included within the industrial companies), which provide funding to both industrial and financial services companies in the Group as the need arises. This financial services structure within the Group does not allow the separation of financial liabilities funding the financial services operations (whose assets are reported within current assets) and those funding the industrial operations. Presentation of financial liabilities as current or non-current based on their date of maturity would not facilitate a meaningful comparison with financial assets, which are categorized on the basis of their normal operating cycle. Disclosure as to the due date of the financial liabilities is provided in Note
23
.
The Consolidated Statement of Cash Flows is presented using the indirect method.
Reclassifications
Certain prior year amounts have been reclassified to conform to the current year presentation. For the year ended December 31, 2015, the Group is no longer presenting the separate line item Other unusual income/(expenses) within the Consolidated Income Statement. All amounts previously reported within the Other unusual income/(expenses) line item have been reclassified into the appropriate line item within the Consolidated Income Statements for the years ended December 31, 2014 and 2013 based upon the nature of the transaction. For the year ended
December 31, 2014
, of the total €390 million previously presented as Other unusual income/(expenses), €98 million related to the remeasurement of our Venezuelan Bolivar (“VEF”) denominated net monetary assets and was reclassified to Cost of sales. In addition, a net €277 million was reclassified to Other income/(expenses), which primarily included the €495 million expense recognized in connection with the execution of the memorandum of understanding (the “MOU”) with the International Union, United Automobile, Aerospace and Agricultural Implement Workers of America (the “UAW”) entered into by FCA US in January 2014, offset by the non-taxable gain of €223 million on the remeasurement to fair value of the previously exercised options on approximately
F - 11
10 percent of FCA US's membership interest in connection with the acquisition of the remaining interest in FCA US previously not owned.
For the year ended
December 31, 2013
, the net €499 million previously presented as Other unusual income/(expenses) included other unusual expenses of €686 million and other unusual income of €187 million. Of the total other unusual expenses of €686 million, €226 million that related to the write-down of development costs was reclassified to Research and development costs (Note
4
). In addition, €273 million was reclassified to Cost of sales of which €115 million related to certain voluntary safety recall costs, €57 million related to the impairment charges for the cast-iron business in the Components segment (Teksid), €55 million related to the impairment of property, plant and equipment in the EMEA segment and €43 million related to the net charge resulting from the devaluation of the VEF exchange rate relative to the U.S.$ and the remeasurement on the Group's VEF denominated net monetary assets (Note
30
). Furthermore, €119 million was reclassified to Other income/(expenses), which included the €56 million write-off of the book value of the right associated with the acquisition of the remaining interest in FCA US previously not owned. Of the total other unusual income of €187 million, €166 million related to the impact of the pension curtailment gain following FCA US's amendment to its U.S. and Canadian defined benefit pension plans and was reclassified as a reduction to Cost of sales.
Basis of Consolidation
Subsidiaries
Subsidiaries are entities over which the Group has control. Control is achieved when the Group has power over the investee, when it is exposed to, or has rights to, variable returns from its involvement with the investee, and has the ability to use its power over the investee to affect the amount of the investor’s returns. Subsidiaries are consolidated on a line by line basis from the date which control is achieved by the Group. The Group reassesses whether or not it controls an investee if facts and circumstances indicate that there are changes to one or more of the three elements of control listed above.
The Group recognizes a non-controlling interest in the acquiree on a transaction-by-transaction basis, either at fair value or at the non-controlling interest’s share of the recognized amounts of the acquiree’s identifiable net assets. Net profit or loss and each component of Other comprehensive income/(loss) are attributed to Equity attributable to owners of the parent and to Non-controlling interests. Total comprehensive income/(loss) of subsidiaries is attributed to Equity attributable to the owners of the parent and to the non-controlling interest even if this results in a deficit balance in Non-controlling interests.
Changes in the Group’s ownership interests in a subsidiary that do not result in the Group losing control over the subsidiary are accounted for as an equity transaction. The carrying amounts of the Equity attributable to owners of the parent and Non-controlling interests are adjusted to reflect the changes in their relative interests in the subsidiary. Any difference between the carrying amount of the non-controlling interests and the fair value of the consideration paid or received in the transaction is recognized directly in the Equity attributable to the owners of the parent.
Subsidiaries are deconsolidated from the date which control ceases. When the Group ceases to have control over a subsidiary, it de-recognizes the assets (including any goodwill) and liabilities of the subsidiary at their carrying amounts, de-recognizes the carrying amount of non-controlling interests in the former subsidiary and recognizes the fair value of any consideration received from the transaction. Any retained interest in the former subsidiary is then remeasured to its fair value.
All intra-group balances and transactions and any unrealized gains and losses arising from intra-group transactions are eliminated in preparing the Consolidated Financial Statements.
Interests in Joint Ventures and Associates
A joint venture is a joint arrangement whereby the parties that have joint control of the arrangement have rights to the net assets of the arrangement.
An associate is an entity over which the Group has significant influence. Significant influence is the power to participate in the financial and operating policy decisions of the investees but does not have control or joint control over those policies.
F - 12
Joint ventures and associates are accounted for using the equity method of accounting from the date joint control and significant influence is obtained. On acquisition of the investment, any excess of the cost of the investment and the Group’s share of the net fair value of the investee’s identifiable assets and liabilities is recognized as goodwill and is included in the carrying amount of the investment. Any excess of the Group’s share of the net fair value of the investee’s identifiable assets and liabilities over the cost of the investment is included as income in the determination of the Group’s share of the investee’s profit or loss in the acquisition period.
Under the equity method, the investments are initially recognized at cost and adjusted thereafter to recognize the Group’s share of the profit/(loss) and other comprehensive income/(loss) of the investee. The Group’s share of the investee’s profit/(loss) is recognized in the Consolidated Income Statement. Distributions received from an investee reduce the carrying amount of the investment. Post-acquisition movements in Other comprehensive income/(loss) are recognized in Other comprehensive income/(loss) with a corresponding adjustment to the carrying amount of the investment.
Unrealized gains on transactions between the Group and its joint ventures and associates are eliminated to the extent of the Group’s interest in the joint venture or associate. Unrealized losses are also eliminated unless the transaction provides evidence of an impairment of the asset transferred.
When the Group’s share of the losses of a joint venture or associate exceeds the Group’s interest in that joint venture or associate, the Group discontinues recognizing its share of further losses. Additional losses are provided for, and a liability is recognized, only to the extent that the Group has incurred legal or constructive obligations or made payments on behalf of the joint venture or associate.
The Group discontinues the use of the equity method from the date the investment ceases to be an associate or a joint venture, or when it is classified as available-for-sale.
Interests in Joint Operations
A joint operation is a joint arrangement whereby the parties that have joint control of the arrangement have rights to the assets and obligations for the liabilities relating to the arrangement. Joint control is the contractually agreed sharing of control of an arrangement, which exists only when decisions about the relevant activities require the unanimous consent of the parties sharing control.
When the Group undertakes its activities under joint operations, it recognizes its related interest in the joint operation including: (i) its assets, including its share of any assets held jointly, (ii) its liabilities, including its share of any liabilities incurred jointly, (iii) its revenue from the sale of its share of the output arising from the joint operation (iv) its share of the revenue from the sale of the output by the joint operation and (v) its expenses, including its share of any expenses incurred jointly.
Interests in other companies
Interests in other companies are measured at fair value. Investments in equity investments that do not have a quoted market price in an active market and whose fair value cannot be reliably measured are recognized at cost. For investments classified as available-for-sale, financial assets gains or losses arising from changes in fair value are recognized in Other comprehensive income/(loss) until the assets are sold or are impaired; at that time, the cumulative Other comprehensive income/(loss) is recognized in the Consolidated Income Statement. Interests in other companies for which fair value is not available are stated at cost less any impairment losses.
Dividends received are included in Other income/(expenses) from investments.
Assets held for sale, Assets held for distribution and Discontinued Operations
Pursuant to IFRS 5 -
Non-current Assets Held for Sale and Discontinued Operations
, non-current assets and disposal groups are classified as held for sale if their carrying amount will be recovered principally through a sale transaction rather than through continuing use. This condition is regarded as met only when the asset (or disposal group) is available for immediate sale in its present condition subject only to terms that are usual and customary for sales of such asset (or disposal group) and the sale is highly probable, with the sale occurring within one year from the date of classification.
F - 13
Non-current assets (and disposal groups) classified as held for sale are measured at the lower of their carrying amount and fair value less costs to sell and are presented separately in the Consolidated Statement of Financial Position. Non-current assets (and disposal groups) are not classified as held for sale within the comparative period presented for the Consolidated Statement of Financial Position.
A discontinued operation is a component of the Group that either has been disposed of or is classified as held for sale and:
|
•
|
represents either a separate major line of business or a geographical area of operations;
|
|
•
|
is part of a single coordinated plan to dispose of a separate major line of business or geographical area of operations; or
|
|
•
|
is a subsidiary acquired exclusively with a view to resale and the disposal involves loss of control.
|
Classification as a discontinued operation occurs upon disposal or when the asset (or disposal group) meets the criteria to be classified as held for sale, if earlier. When the asset (or disposal group) is classified as a discontinued operation, the comparative information is reclassified within the Consolidated Income Statements as if the asset (or disposal group) had been discontinued from the start of the earliest comparative period presented.
The classification, presentation and measurement requirements of IFRS 5-
Non-current Assets Held for Sale and Discontinued Operations
also apply to an asset (or disposal group) that is classified as held for distribution to owners, whereby there must be commitment to the distribution, the asset (or disposal group) must be available for immediate distribution and the distribution must be highly probable.
Foreign currency
The functional currency of the Group’s entities is the currency of their respective primary economic environment. In individual companies, transactions in foreign currencies are recorded at the exchange rate prevailing at the date of the transaction. Monetary assets and liabilities denominated in foreign currencies at the balance sheet date are translated at the exchange rate prevailing at that date. Exchange differences arising on the settlement of monetary items, or on reporting monetary items at rates different from those initially recorded, are recognized in the Consolidated Income Statement.
All assets and liabilities of foreign consolidated companies with a functional currency other than the Euro are translated using the closing rates at the date of the Consolidated Statement of Financial Position. Income and expenses are translated into Euro at the average exchange rate for the period. Translation differences resulting from the application of this method are classified as Other comprehensive income/(loss) until the disposal of the subsidiary. Average exchange rates for the period are used to translate the cash flows of foreign subsidiaries in preparing the Consolidated Statement of Cash Flows.
The principal exchange rates used to translate other currencies into Euro were as follows:
|
2015
|
2014
|
2013
|
|||||||||
|
Average
|
At December 31,
|
Average
|
At December 31,
|
Average
|
At December 31,
|
||||||
|
U.S. Dollar
|
1.109
|
1.089
|
1.329
|
1.214
|
1.328
|
1.379
|
|||||
|
Brazilian Real
|
3.699
|
4.312
|
3.121
|
3.221
|
2.867
|
3.258
|
|||||
|
Chinese Renminbi
|
6.972
|
7.061
|
8.187
|
7.536
|
8.164
|
8.349
|
|||||
|
Canadian Dollar
|
1.418
|
1.512
|
1.466
|
1.406
|
1.368
|
1.467
|
|||||
|
Mexican Peso
|
17.611
|
18.915
|
17.657
|
17.868
|
16.960
|
18.073
|
|||||
|
Polish Zloty
|
4.184
|
4.264
|
4.184
|
4.273
|
4.197
|
4.154
|
|||||
|
Argentine Peso
|
10.271
|
14.136
|
10.782
|
10.382
|
7.263
|
8.988
|
|||||
|
Pound Sterling
|
0.726
|
0.734
|
0.806
|
0.779
|
0.849
|
0.834
|
|||||
|
Swiss Franc
|
1.068
|
1.084
|
1.215
|
1.202
|
1.231
|
1.228
|
|||||
F - 14
Intangible assets
Goodwill
Goodwill represents the excess of the fair value of consideration paid over the fair value of net tangible and identifiable intangible assets acquired in a business combination. Goodwill is not amortized, but is tested for impairment annually or more frequently if events or changes in circumstances indicate that it might be impaired. After initial recognition, Goodwill is measured at cost less any accumulated impairment losses.
Development costs
Development costs for vehicle project production and related components, engines and production systems are recognized as an asset if both of the following conditions under IAS 38 –
Intangible assets
are met: that development costs can be measured reliably and that the technical feasibility of the product, volumes and pricing support the view that the development expenditure will generate future economic benefits. Capitalized development costs include all direct and indirect costs that may be directly attributed to the development process.
Capitalized development costs are amortized on a straight-line basis from the beginning of production over the expected life cycle of the models (generally 5-6 years) or powertrains developed (generally 10-12 years). All other development costs are expensed as incurred.
Intangible assets with indefinite useful lives
Intangible assets with indefinite useful lives consist principally of brands which have no legal, contractual, competitive, economic, or other factors that limit their useful lives. Intangible assets with indefinite useful lives are not amortized, but are tested for impairment annually, or more frequently whenever there is an indication that the asset may be impaired, by comparing the carrying amount with the recoverable amount.
Property, plant and equipment
Cost
Property, plant and equipment is initially recognized at cost and includes the purchase price, any costs directly attributable to bringing the assets to the location and condition necessary to be capable of operating in the manner intended by management and any initial estimate of the costs of dismantling and removing the item and restoring the site on which it is located. Self-constructed assets are initially recognized at production cost. Subsequent expenditures and the cost of replacing parts of an asset are capitalized only if they increase the future economic benefits embodied in that asset. All other expenditures are expensed as incurred. When such replacement costs are capitalized, the carrying amount of the parts that are replaced is recognized in the Consolidated Income Statement.
Assets held under finance leases, which provide the Group with substantially all the risks and rewards of ownership, are recognized as assets of the Group at their fair value or, if lower, at the present value of the minimum lease payments. The corresponding liability to the lessor is included in the Consolidated Statement of Financial Position within Debt.
During years ended
December 31, 2015
,
2014
and
2013
, the assets were depreciated on a straight-line basis over their estimated useful lives using the following rates:
|
Depreciation rates
|
|
|
Buildings
|
3% - 8%
|
|
Plant, machinery and equipment
|
3% - 33%
|
|
Other assets
|
5% - 33%
|
Leases under which the lessor retains substantially all the risks and rewards of ownership of the leased assets are classified as operating leases. Operating lease expenditures are expensed on a straight-line basis over the lease terms.
F - 15
Borrowing Costs
Borrowing costs that are directly attributable to the acquisition, construction or production of property, plant or equipment or an intangible asset that is deemed to be a qualifying asset as defined in IAS 23 -
Borrowing Costs
are capitalized. The amount of borrowing costs eligible for capitalization corresponds to the actual borrowing costs incurred during the period less any investment income on the temporary investment of any borrowed funds not yet used. The amount of borrowing costs capitalized at
December 31, 2015
and
2014
was €286 million and €256 million, respectively.
Impairment of assets
At the end of each reporting period, the Group assesses whether there is any indication that its intangible assets (including capitalized development costs) and its property, plant and equipment may be impaired.
If indications of impairment are present, the carrying amount of the asset is reduced to its recoverable amount which is the higher of fair value less costs to sell and its value in use. The recoverable amount is determined for the individual asset, unless the asset does not generate cash inflows that are largely independent of those from other assets or groups of assets, in which case the asset is tested as part of the cash-generating unit (“CGU”) to which the asset belongs. A CGU is the smallest identifiable group of assets that generates cash inflows that are largely independent of the cash inflows from other assets or groups of assets. In assessing the value in use of an asset or CGU, the estimated future cash flows are discounted to their present value using a discount rate that reflects current market assessments of the time value of money and the risks specific to the asset or CGU. An impairment loss is recognized if the recoverable amount is lower than the carrying amount.
When an impairment loss for assets, other than Goodwill, no longer exists or has decreased, the carrying amount of the asset or CGU is increased to the revised estimate of its recoverable amount, but not in excess of the carrying amount that would have been recorded had no impairment loss been recognized. The reversal of an impairment loss is recognized in the Consolidated Income Statement. Refer to the section
—
Use of Estimates
below for additional information.
Financial instruments
Presentation
Financial instruments held by the Group are presented in the Consolidated Financial Statements as described in the following paragraphs.
Investments and other non-current financial assets consist of investments in unconsolidated companies and other non-current financial assets (held-to-maturity securities, non-current loans and receivables and other non-current available-for-sale financial assets).
Current financial assets, as defined in IAS 39 –
Financial Instruments: Recognition and Measurement
, include Trade receivables, Receivables from financing activities, Current investments, Current securities and Other financial assets (which include derivative financial instruments stated at fair value), as well as Cash and cash equivalents. Cash and cash equivalents include cash at banks, units in money market funds and other money market securities, primarily comprised of commercial paper and certificates of deposit that are readily convertible into cash and are subject to an insignificant risk of changes in value. Money market funds consist of investments in high quality, short-term, diversified financial instruments which can generally be liquidated on demand. Current securities include short-term or marketable securities which represent temporary investments of available funds and do not satisfy the requirements for being classified as cash equivalents. Current securities include both available-for-sale and held-for-trading securities.
Financial liabilities consist of Debt and Other financial liabilities (which include derivative financial instruments measured at fair value), Trade payables and Other current liabilities.
Measurement
Non-current financial assets other than Investments, as well as current financial assets and financial liabilities, are accounted for in accordance with IAS 39 –
Financial Instruments: Recognition and Measurement
.
F - 16
Current financial assets and held-to-maturity securities are recognized on the basis of the settlement date and, on initial recognition, are measured at acquisition cost, including transaction costs. Subsequent to initial recognition, available-for-sale and held-for-trading financial assets are measured at fair value. When market prices are not directly available, the fair value of available-for-sale financial assets is measured using appropriate valuation techniques (e.g. discounted cash flow analysis based on market information available at the balance sheet date).
Gains and losses on available-for-sale financial assets are recognized in Other comprehensive income/(loss) until the financial asset is disposed of or is impaired. When the asset is disposed of, the cumulative gains or losses, including those previously recognized in Other comprehensive income/(loss), are reclassified to the Consolidated Income Statement during the period and are recognized within Net financial expenses. When the asset is impaired, accumulated losses are recognized in the Consolidated Income Statement. Gains and losses arising from changes in the fair value of held-for-trading financial instruments are recognized in the Consolidated Income Statement.
Loans and receivables which are not held by the Group for trading (loans and receivables originating in the ordinary course of business), held-to-maturity securities and equity investments whose fair value cannot be determined reliably, are measured, to the extent that they have a fixed term, at amortized cost, using the effective interest method. When the financial assets do not have a fixed term, they are measured at acquisition cost. Receivables with maturities of over one year which bear no interest, or have an interest rate significantly lower than market rates, are discounted using market rates. Assessments are made regularly as to whether there is any objective evidence that a financial asset or group of assets may be impaired. If any such evidence exists, the impairment loss is recognized in the Consolidated Income Statement.
Except for derivative instruments, financial liabilities are measured at amortized cost using the effective interest method.
Financial assets and liabilities hedged against changes in fair value (fair value hedges) are measured in accordance with hedge accounting principles: gains and losses arising from remeasurement at fair value, due to changes in the respective hedged risk, are recognized in the Consolidated Income Statement and are offset by the effective portion of the gain or loss arising from remeasurement at fair value of the hedging instrument.
Derivative financial instruments
Derivative financial instruments are used for economic hedging purposes in order to reduce currency, interest rate and market price risks (primarily related to commodities and securities). In accordance with IAS 39 -
Financial Instruments: Recognition and Measurement
, all derivative financial instruments are measured at fair value. Furthermore, derivative financial instruments qualify for hedge accounting only when there is formal designation and documentation of the hedging relationship at inception of the hedge, the hedge is expected to be highly effective, its effectiveness can be reliably measured and it is highly effective throughout the financial reporting periods for which it is designated.
When derivative financial instruments qualify for hedge accounting, the following accounting treatments apply:
|
•
|
Fair value hedges
– Where a derivative financial instrument is designated as a hedge of the exposure to changes in fair value of a recognized asset or liability that is attributable to a particular risk and could affect the Consolidated Income Statement, the gain or loss from remeasuring the hedging instrument at fair value is recognized in the Consolidated Income Statement. The gain or loss on the hedged item attributable to the hedged risk adjusts the carrying amount of the hedged item and is recognized in the Consolidated Income Statement.
|
|
•
|
Cash flow hedges
– Where a derivative financial instrument is designated as a hedge of the exposure to variability in future cash flows of a recognized asset or liability or a highly probable forecasted transaction and could affect the Consolidated Income Statement, the effective portion of any gain or loss on the derivative financial instrument is recognized directly in Other comprehensive income/(loss). The cumulative gain or loss is reclassified from Other comprehensive income/(loss) to the Consolidated Income Statement at the same time as the economic effect arising from the hedged item that affects the Consolidated Income Statement. The gain or loss associated with a hedge or part of a hedge that has become ineffective is recognized in the Consolidated Income Statement immediately. When a hedging instrument or hedge relationship is terminated but the hedged transaction is still expected to occur, the cumulative gain or loss realized to the point of termination remains in Other comprehensive income/(loss) and is recognized in the Consolidated Income Statement at the same time as
|
F - 17
the underlying transaction occurs. If the hedged transaction is no longer probable, the cumulative unrealized gain or loss held in Other comprehensive income/(loss) is recognized in the Consolidated Income Statement immediately.
|
•
|
Hedges of a net investment
– If a derivative financial instrument is designated as a hedging instrument for a net investment in a foreign operation, the effective portion of the gain or loss on the derivative financial instrument is recognized in Other comprehensive income/(loss). The cumulative gain or loss is reclassified from Other comprehensive income/(loss) to the Consolidated Income Statement upon disposal of the foreign operation.
|
Refer to Note
17
for further information on the effects reflected in the Consolidated Income Statement on derivative financial instruments.
If hedge accounting cannot be applied, the gains or losses from the fair value measurement of derivative financial instruments are recognized immediately in the Consolidated Income Statement.
Transfers of financial assets
The Group derecognizes financial assets when the contractual rights to the cash flows arising from the asset are no longer held or if it transfers substantially all the risks and rewards of ownership of the financial asset. On derecognition of financial assets, the difference between the carrying amount of the asset and the consideration received or receivable for the transfer of the asset is recognized in the Consolidated Income Statement.
The Group transfers certain of its financial, trade and tax receivables, mainly through factoring transactions. Factoring transactions may be either with recourse or without recourse. Certain transfers include deferred payment clauses (for example, when the payment by the factor of a minor part of the purchase price is dependent on the total amount collected from the receivables) requiring first loss cover, whereby the transferor has priority participation in the losses, or requires a significant exposure to the cash flows arising from the transferred receivables to be retained. These types of transactions do not meet the requirements of IAS 39 –
Financial Instruments: Recognition and Measurement
for the derecognition of the assets since the risks and rewards connected with collection are not transferred, and accordingly the Group recognizes the receivables transferred by this means within the Consolidated Statement of Financial Position and recognizes a financial liability for the same amount under Asset-backed financing, which is included within Debt. The gains and losses arising from the transfer of these receivables are only recognized when they are derecognized.
Inventories
Inventories of raw materials, semi-finished products and finished goods are stated at the lower of cost and net realizable value, with cost being determined on a first-in, first-out (FIFO) basis. The measurement of Inventories includes the direct cost of materials and labor as well as indirect costs (variable and fixed). A provision is made for obsolete and slow-moving raw materials, finished goods, spare parts and other supplies based on their expected future use and realizable value. Net realizable value is the estimated selling price in the ordinary course of business, less the estimated costs of completion and the estimated costs for sale and distribution.
The measurement of production systems construction contracts is based on the stage of completion determined as the proportion of cost incurred at the balance sheet date over the estimated total contract cost. These items are presented net of progress billings received from customers. Any losses on such contracts are recorded in the Consolidated Income Statement when they are known.
Employee benefits
Defined contribution plans
Costs arising from defined contribution plans are expensed as incurred.
F - 18
Defined benefit plans
The Group’s net obligations are determined separately for each plan by estimating the present value of future benefits that employees have earned and deducting the fair value of any plan assets. The present value of defined benefit obligations are measured using actuarial techniques and actuarial assumptions that are unbiased, mutually compatible and attribute benefits to periods in which the obligation to provide post-employment benefits arise by using the Projected Unit Credit Method. Plan assets are recognized and measured at fair value.
When the net obligation is a potential asset, the recognized amount is limited to the present value of any economic benefits available in the form of future refunds or reductions in future contributions to the plan (asset ceiling).
The components of the defined benefit cost are recognized as follows:
|
•
|
service cost is recognized in the Consolidated Income Statement by function and presented in the relevant line items (Cost of sales, Selling, general and administrative costs and Research and development costs);
|
|
•
|
net interest on the defined benefit liability or asset is recognized in the Consolidated Income Statement within Financial expense and is determined by multiplying the net liability/(asset) by the discount rate used to discount obligations taking into account the effect of contributions and benefit payments made during the year; and
|
|
•
|
remeasurement components of the net obligations, which comprise actuarial gains and losses, the return on plan assets (excluding interest income recognized in the Consolidated Income Statement) and any change in the effect of the asset ceiling are recognized immediately in Other comprehensive income/(loss). These remeasurement components are not reclassified to the Consolidated Income Statement in a subsequent period.
|
Past service costs arising from plan amendments and curtailments and gains and losses on the settlement of a plan are recognized immediately in the Consolidated Income Statement.
Other long term employee benefits
The Group’s obligations represent the present value of future benefits that employees have earned in return for their service. Remeasurement components on other long term employee benefits are recognized in the Consolidated Income Statement in the period in which they arise.
Share-based compensation
We have various compensation plans that provide for the granting of share-based compensation to certain employees and directors. Share-based compensation plans are accounted for in accordance with IFRS 2 -
Share-based Payment,
which require us to recognize share-based compensation expense based on fair value. Compensation expense for equity-classified awards is measured at the grant date based on the fair value of the award and using the Monte Carlo simulation model, which requires the input of subjective assumptions, including the expected volatility of our common stock, interest rates and a correlation coefficient between our common stock and the relevant market index. For those awards with post-vesting contingencies, we apply an adjustment to account for the probability of meeting the contingencies.
Management uses its best estimates incorporating both publicly observable data and discounted cash flow methodologies in the measurement of fair value for liability-classified awards, which are remeasured to fair value at each balance sheet date until the award is settled.
Compensation expense is recognized over the vesting period with an offsetting increase to equity or other liabilities depending on the nature of the award. Share-based compensation expense related to plans with graded vesting are recognized using the graded vesting method. Share-based compensation expense is recognized within Selling, general and administrative costs within the Consolidated Income Statement.
F - 19
Revenue recognition
Revenue from sale of vehicles and service parts is recognized if it is probable that the economic benefits associated with a transaction will flow to the Group and the revenue can be reliably measured. Revenue is recognized when the risks and rewards of ownership are transferred to the customer, the sales price is agreed or determinable and collectability is reasonably assured. For vehicles, this generally corresponds to the date when the vehicles are made available to dealers, or when the vehicles are released to the carrier responsible for transporting vehicles to dealers. Revenue from the sale of vehicles, which subsequent to the sale become subject to the issuance of a residual value guarantee to an independent financing provider, is recognized consistent with the timing noted above, provided that significant risks related to the vehicle have been transferred to the customer. At that same time, a provision is made for the estimated residual value risk. Revenues are recognized net of discounts, including but not limited to, sales incentives and customer bonuses. The estimated costs of sales incentive programs include incentives offered to dealers and retail customers, and granting of retail financing at a significant discount to market interest rates. These costs are recognized at the time of the sale of the vehicle.
New vehicle sales with a buy-back commitment, or through the Guarantee Depreciation Program (“GDP”) under which the Group guarantees the residual value, or otherwise assumes responsibility for the minimum resale value of the vehicle, are not recognized at the time of delivery but are accounted for similar to an operating lease. Rental income is recognized over the contractual term of the lease on a straight-line basis. At the end of the lease term, the Group recognizes revenue for the portion of the vehicle sales price which had not been previously recognized as rental income and recognizes the remainder of the cost of the vehicle within Cost of sales.
Revenue from services contracts, separately-priced extended warranty and from construction contracts is recognized over the contract period in proportion to the costs expected to be incurred based on historical information. A loss on these contracts is recognized if the sum of the expected costs for services under the contract exceeds unearned revenue.
Cost of sales
Cost of sales comprises expenses incurred in the manufacturing and distribution of vehicles and parts, of which cost of materials and components are the most significant portion. The remaining costs primarily include labor costs, consisting of direct and indirect wages, depreciation of Property, plant and equipment and amortization of Other intangible assets relating to production and transportation costs. In addition, expenses which are directly attributable to the financial services companies, including interest expense related to their financing as a whole and provisions for risks and write-downs of assets, are recorded within Cost of sales. Furthermore, estimated costs related to product warranty and recall campaigns are recorded within Cost of sales. Refer to the section —
Use of Estimates
below for further information.
Government Grants
Government grants are recognized in the Consolidated Financial Statements when there is reasonable assurance of the Group's compliance with the conditions for receiving such grants and that the grants will be received. Government grants are recognized as income over the periods necessary to match them with the related costs which they are intended to offset.
The benefit of a government loan at a below-market rate of interest is treated for accounting purposes as a government grant. The benefit of the below-market rate of interest is measured as the difference between the initial carrying amount of the loan (fair value plus transaction costs) and the proceeds received, and it is accounted for in accordance with the policies used for the recognition of government grants.
Taxes
Income taxes include all taxes based on the taxable profits of the Group. Current and deferred taxes are recognized as a benefit or expense and are included in the Consolidated Income Statement for the period, except tax arising from (i) a transaction or event which is recognized, in the same or a different period, either in Other comprehensive income/(loss) or directly in Equity, or (ii) a business combination.
Deferred taxes are accounted for under the full liability method. Deferred tax liabilities are recognized for all taxable temporary differences between the carrying amounts of assets or liabilities and their tax base, except to the extent that the deferred tax liabilities arise from the initial recognition of goodwill or the initial recognition of an asset or liability in a transaction which is not a business combination and at the time of the transaction, affects neither accounting profit nor
F - 20
taxable profit. Deferred tax assets are recognized for all deductible temporary differences to the extent that it is probable that taxable profit will be available against which the deductible temporary differences can be utilized, unless the deferred tax assets arise from the initial recognition of an asset or liability in a transaction that is not a business combination and at the time of the transaction, affects neither accounting profit nor taxable profit.
Deferred tax assets and liabilities are measured at the substantively enacted tax rates in the respective jurisdictions in which the Group operates that are expected to apply to the period when the asset is realized or liability is settled.
The Group recognizes deferred tax liabilities associated with the existence of a subsidiary’s undistributed profits, except when it is able to control the timing of the reversal of the temporary difference, and it is probable that this temporary difference will not reverse in the foreseeable future. The Group recognizes deferred tax assets associated with the deductible temporary differences on investments in subsidiaries only to the extent that it is probable that the temporary differences will reverse in the foreseeable future and taxable profit will be available against which the temporary difference can be utilized.
Deferred tax assets relating to the carry-forward of unused tax losses and tax credits as well as those arising from deductible temporary differences, are recognized to the extent that it is probable that future profits will be available against which they can be utilized. The Group reassesses unrecognized deferred tax assets at the end of each year and recognizes a previously unrecognized deferred tax asset to the extent that it has become probable that future taxable profit will allow the deferred tax asset to be recovered.
Current income taxes and deferred taxes are offset when they relate to the same taxation authority and there is a legally enforceable right of offset. Other taxes not based on income, such as property taxes and capital taxes, are included within Other income/(expenses).
Fair Value Measurement
Fair value for measurement and or disclosure purposes is determined as the price that would be received to sell an asset or paid to transfer a liability in an orderly transaction between market participants at the measurement date, regardless of whether that price is directly observable or estimated using a valuation technique. The fair value measurement is based on the presumption that the transaction to sell the asset or transfer the liability takes place either:
|
•
|
in the principal market for the asset or liability; or
|
|
•
|
in the absence of a principal market, in the most advantageous market for the asset or liability.
|
The fair value of an asset or a liability is measured using the assumptions that market participants would use when pricing the asset or liability, assuming that market participants act in their economic best interest. A fair value measurement of a non-financial asset takes into account a market participant's ability to generate economic benefits by using the asset in its highest and best use or by selling it to another market participant that would use the asset in its highest and best use. In estimating fair value, we use market-observable data to the extent it is available. When market-observable data is not available, we use valuation techniques that maximize the use of relevant observable inputs and minimize the use of unobservable inputs.
IFRS 13 -
Fair Value Measurement
establishes a hierarchy, which prioritizes the inputs used in measuring fair value. The hierarchy gives the highest priority to quoted prices (unadjusted) in active markets for identical assets and liabilities (level 1 inputs) and the lowest priority to unobservable inputs (level 3 inputs). In some cases, the inputs used to measure the fair value of an asset or a liability might be categorized within different levels of the fair value hierarchy. In those cases, the fair value measurement is categorized in its entirety in the same level of the fair value hierarchy at the lowest level input that is significant to the entire measurement.
Levels used in the hierarchy are as follows:
|
•
|
Level 1 inputs include quoted prices (unadjusted) in active markets for identical assets and liabilities that the Group can access at the measurement date. Level 1 primarily consists of financial instruments such as cash and cash equivalents and certain available-for-sale and held-for-trading securities.
|
|
•
|
Level 2 inputs include those which are directly or indirectly observable as of the measurement date. Level 2 instruments include commercial paper and non-exchange-traded derivatives such as over-the-counter currency and commodity forwards, swaps and option contracts, which are valued using models or other valuation methodologies.
|
F - 21
These models are primarily industry-standard models that consider various assumptions, including quoted forward prices for similar instruments in active markets, quoted prices for identical or similar inputs not in active markets, and observable inputs.
|
•
|
Level 3 inputs are unobservable from objective sources in the market and reflect management judgment about the assumptions market participants would use in pricing the instruments. Instruments in this category include non-exchange-traded derivatives such as over-the-counter commodity option and swap contracts.
|
Refer to Note
25
for additional information on fair value measurements.
New standards and amendments effective from January 1, 2015
The following new standards and amendments applicable from January 1, 2015 were adopted by the Group. There was no effect from the adoption of these amendments:
|
•
|
The Group adopted the narrow scope amendments to IAS 19 – Employee benefits
entitled “
Defined Benefit Plans: Employee Contributions
” which apply to contributions from employees or third parties to defined benefit plans in order to simplify their accounting in specific cases.
|
|
•
|
The Group adopted the IASB's Annual Improvements to IFRSs 2010 – 2012 Cycle and Annual Improvements to IFRSs 2011–2013 Cycle. The most important topics addressed in these amendments are, among others, the definition of vesting conditions in IFRS 2 –
Share-based payments
, the disclosure on judgment used in the aggregation of operating segments in IFRS 8 –
Operating Segments,
the identification and disclosure of a related party transaction that arises when a management entity provides key management personnel service to a reporting entity in IAS 24 –
Related Party disclosures,
the extension of the exclusion from the scope of IFRS 3 –
Business Combinations
to all types of joint arrangements and to clarify the application of certain exceptions in IFRS 13 –
Fair value Measurement.
|
New standards, amendments and interpretations not yet effective
The following new standards and amendments applicable from January 1, 2016 were issued by the IASB. For new standards and amendments effective after January 1, 2017, we are currently evaluating the implementation method and the impact of adoption on our Consolidated Financial Statements. We will comply with the relevant guidance no later than their respective effective dates.
|
•
|
In May 2014, the IASB issued amendments to IFRS 11 –
Joint arrangements: Accounting for acquisitions of interests in joint operations
which clarify the accounting for acquisitions of an interest in a joint operation that constitutes a business. The amendments are effective prospectively for annual periods beginning on or after January 1, 2016 with earlier application permitted for any new acquisition. No significant effect is expected from the adoption of these amendments.
|
|
•
|
In May 2014, the IASB issued an amendment to IAS 16 –
Property, Plant and Equipment
and to IAS 38 –
Intangible Assets.
The IASB has clarified that the use of revenue-based methods to calculate the depreciation of an asset is not appropriate because revenue generated by an activity that includes the use of an asset generally reflects factors other than the consumption of the economic benefits embodied in the asset. The IASB also clarified that revenue is generally presumed to be an inappropriate basis for measuring the consumption of the economic benefits embodied in an intangible asset. This presumption, however, can be rebutted in certain limited circumstances. These amendments are effective for annual periods beginning on or after January 1, 2016, with early application permitted. No significant effect is expected from the adoption of these amendments.
|
|
•
|
In May 2014, the IASB issued IFRS 15 –
Revenue from contracts with customers
. The standard requires a company to recognize revenue upon transfer of control of goods or services to a customer at an amount that reflects the consideration it expects to receive. This new revenue recognition model defines a five step process to achieve this objective. The updated guidance also requires additional disclosures about the nature, amount, timing and uncertainty of revenue and cash flows arising from customer contracts. On September 11,2015, the IASB issued an amendment to this standard, formalizing the deferral of the effective date for periods beginning January 1, 2018, with early adoption permitted.
|
F - 22
|
•
|
In July 2014, the IASB issued IFRS 9 –
Financial Instruments
. The improvements introduced by the new standard include a logical approach for classification and measurement of financial instruments driven by cash flow characteristics and the business model in which an asset is held, a single “expected loss” impairment model for financial assets and a substantially reformed approach for hedge accounting. The standard is effective, retrospectively with limited exceptions, for annual periods beginning on or after January 1, 2018 with earlier adoption permitted.
|
|
•
|
In September 2014, the IASB issued narrow amendments to IFRS 10 –
Consolidated Financial Statements
and IAS 28 –
Investments in Associates and Joint Ventures
(2011). The amendments address an acknowledged inconsistency between the requirements in IFRS 10 and those in IAS 28 (2011), in dealing with the sale or contribution of assets between an investor and its associate or joint venture. The main consequence of the amendments is that a full gain or loss is recognized when a transaction involves a business (whether it is housed in a subsidiary or not). A partial gain or loss is recognized when a transaction involves assets that do not constitute a business, even if these assets are housed in a subsidiary. The amendments which were initially expected to be effective prospectively from January 1, 2016, have been postponed indefinitely by the IASB in planning a broader review that may result in a simplification of accounting of such transactions.
|
|
•
|
In September 2014, the IASB issued the Annual Improvements to IFRSs 2012-2014 cycle, a series of amendments to IFRSs in response to issues raised mainly on IFRS 5 –
Non-current assets held for sale and discontinued operations
, on the changes of method of disposal, on IFRS 7 –
Financial Instruments: Disclosures on the servicing contracts
, on the IAS 19 –
Employee Benefits
, on the discount rate determination. The effective date of the amendments is January 1, 2016. No significant effect is expected from the adoption of these amendments.
|
|
•
|
In December 2014 the IASB issued amendments to IAS 1-
Presentation of Financial Statements
as part of its major initiative to improve presentation and disclosure in financial reports. The amendments make clear that materiality applies to the whole of financial statements and that the inclusion of immaterial information can inhibit the usefulness of financial disclosures. Furthermore, the amendments clarify that companies should use
professional judgment in determining where and in what order information is presented in the financial disclosures. The amendments are effective for annual periods beginning on or after January 1, 2016 with early adoption permitted.
|
|
•
|
In January 2016, the IASB issued IFRS 16 -
Leases
which sets out the principles for the recognition, measurement, presentation and disclosure of leases for both parties to a contract and replaces the previous leases standard, IAS 17 -
Leases
. IFRS 16, which is not applicable to service contracts, but only applicable to leases or lease components of a contract, defines a lease as a contract that conveys to the customer (lessee) the right to use an asset for a period of time in exchange for consideration. IFRS 16 eliminates the classification of leases for the lessee as either operating leases or finance leases as required by IAS 17 and instead, introduces a single lessee accounting model whereby a lessee is required to recognize assets and liabilities for all leases with a term that is greater than 12 months, unless the underlying asset is of low value, and to recognize depreciation of leases assets separately from interest on lease liabilities in the income statement. As IFRS 16 substantially carries forward the lessor accounting requirements in IAS 17, a lessor will continue to classify its leases as operating leases or finance leases and to account for those two types of leases differently. IFRS 16 is effective from January 1, 2019, with early adoption allowed only if IFRS 15 -
Revenue from Contracts with Customers
is also adopted.
|
|
•
|
In January 2016, the IASB issued amendments to IAS
12- Income Taxes
that clarify how to account for deferred tax assets related to debt instruments measured at fair value. These amendments are effective for annual periods beginning on or after January 1, 2017, with earlier adoption permitted.
|
|
•
|
In January 2016, the IASB issued amendments to IAS 7
- Statement of Cash Flows
introducing additional disclosures that will enable users of financial statements to evaluate changes in liabilities arising from financing activities. The amendments are effective from January 1, 2017, with earlier adoption permitted.
|
SEGMENT REPORTING
The Group’s four regional mass-market vehicle operating segments deal with the design, engineering, development, manufacturing, distribution and sale of passenger cars, light commercial vehicles and related parts and services in specific geographic areas: NAFTA, LATAM, APAC and EMEA. The Group also operates on a global basis in the luxury vehicle
F - 23
sector with the Maserati segment and in the global components sector with the Magneti Marelli, Teksid and Comau operating segments.
The reportable segments reflect the operating segments of the Group that are regularly reviewed by the Chief Executive Officer, who is the “chief operating decision maker”, as defined under IFRS 8 –
Operating Segments
, for making strategic decisions and allocating resources and assessing performance, and that exceed the quantitative threshold provided in IFRS 8 –
Operating Segments
or whose information is considered useful for the users of the financial statements. The Group's reportable segments include the four regional mass-market vehicle operating segments (NAFTA, LATAM, APAC and EMEA), the Maserati luxury brand operating segment and a global Components operating segment, which are described as follows:
|
•
|
NAFTA designs, engineers, develops, manufactures and distributes vehicles. NAFTA mainly earns its revenues from the sale of vehicles under the Chrysler, Jeep, Dodge, Ram, Fiat and Alfa Romeo brand names and from sales of the related parts and accessories (under the Mopar brand name) in the United States, Canada, Mexico and Caribbean islands.
|
|
•
|
LATAM designs, engineers, develops, manufactures and distributes vehicles. LATAM mainly earns its revenues from the sale of passenger cars and light commercial vehicles and related spare parts under the Fiat and Jeep brand names in South and Central America as well as from the distribution of the Chrysler, Dodge and Ram brand cars in the same region. In addition, the segment provides financial services to the dealer network in Brazil and to retail customers in Argentina.
|
|
•
|
APAC mainly earns its revenues from the distribution and sale of cars and related spare parts under the Abarth, Alfa Romeo, Chrysler, Dodge, Fiat and Jeep brands mostly in China, Japan, Australia, South Korea and India. These activities are carried out through both subsidiaries and joint ventures. In addition, the segment provides financial services to the dealer network and retail customers in China.
|
|
•
|
EMEA designs, engineers, develops, manufactures and distributes vehicles. EMEA mainly earns its revenues from the sale of passenger cars and light commercial vehicles under the Fiat, Alfa Romeo, Lancia, Abarth, Jeep and Fiat Professional brand names, the sale of the related spare parts in Europe, Middle East and Africa, and from the distribution of the Chrysler, Dodge and Ram brand vehicles in these areas. In addition, the segment provides financial services related to the sale of cars and light commercial vehicles in Europe, primarily through FCA Bank S.p.A., a joint venture with the Crédit Agricole group, and Fidis S.p.A., a fully owned captive finance company that is mainly involved in the factoring business.
|
|
•
|
Maserati designs, engineers, develops, manufactures and distributes vehicles. Maserati earns its revenues from the sale of luxury vehicles under the Maserati brand.
|
|
•
|
Components earns its revenues from the production and sale of lighting components, body control units, suspensions, shock absorbers, electronic systems, exhaust systems and plastic molding components. In addition, the segment earns revenues with its spare parts distribution activities carried out under the Magneti Marelli brand name, cast iron components for engines, gearboxes, transmissions and suspension systems and aluminum cylinder heads (Teksid), in addition to the design and production of industrial automation systems and related products for the automotive industry (Comau).
|
USE OF ESTIMATES
The Consolidated Financial Statements are prepared in accordance with IFRS which require the use of estimates, judgments and assumptions that affect the carrying amount of assets and liabilities, the disclosure of contingent assets and liabilities and the amounts of income and expenses recognized. The estimates and associated assumptions are based on elements that are known when the financial statements are prepared, on historical experience and on any other factors that are considered to be relevant.
F - 24
The estimates and underlying assumptions are reviewed periodically and continuously by the Group. Actual results could differ from the estimates, which would require adjustment accordingly. The effects of any changes in estimates are recognized in the Consolidated Income Statement in the period in which the adjustment is made, or in future periods.
The items requiring estimates for which there is a risk that a material difference may arise in respect of the carrying amounts of assets and liabilities in the future are discussed below.
Employee Benefits
The Group provides post-employment benefits for certain of its active employees and retirees. The way these benefits are provided varies according to the legal, fiscal and economic conditions of each country in which the Group operates and may change periodically. The plans are classified by the Group on the basis of the type of benefit provided as follows: pension benefits, health care and life insurance plans, and other post-employment benefits.
Group companies provide certain post-employment benefits, such as pension or health care benefits, to their employees under defined contribution plans whereby the Group pays contributions to public or private insurance plans on a legally mandatory, contractual, or voluntary basis. The Group recognizes the cost for defined contribution plans over the period in which the employee renders service and classifies this by function within Cost of sales, Selling, general and administrative costs and Research and development costs in the Consolidated Income Statement.
Pension plans
The Group sponsors both non-contributory and contributory defined benefit pension plans primarily in the U.S. and Canada. The majority of the plans are funded plans. The non-contributory pension plans cover certain hourly and salaried employees and the benefits are based on a fixed rate for each year of service. Additionally, contributory benefits are provided to certain salaried employees under the salaried employees’ retirement plans. These plans provide benefits based on the employee’s cumulative contributions, years of service during which the employee contributions were made and the employee’s average salary during the five consecutive years in which the employee’s salary was highest in the 15 years preceding retirement or the freeze of such plans, as applicable.
The Group’s defined benefit pension plans are accounted for on an actuarial basis, which requires the use of estimates and assumptions to determine the net liability or net asset. The Group estimates the present value of the projected future payments to all participants taking into consideration parameters of a financial nature such as discount rates, the rates of salary increases and the likelihood of potential future events estimated by using demographic assumptions such as mortality, dismissal and retirement rates. These assumptions may have an effect on the amount and timing of future contributions.
Plan obligations and costs are based on existing retirement plan provisions. Assumptions regarding any potential future changes to benefit provisions beyond those to which the Group is presently committed are not made. The assumptions used in developing the required estimates include the following key factors:
|
•
|
Discount rates
. Our discount rates are based on yields of high-quality (AA-rated) fixed income investments for which the timing and amounts of maturities match the timing and amounts of the projected benefit payments.
|
|
•
|
Salary growth.
The salary growth assumption reflects the Group’s long-term actual experience, outlook and assumed inflation.
|
|
•
|
Inflation.
The inflation assumption is based on an evaluation of external market indicators.
|
|
•
|
Expected contributions.
The expected amount and timing of contributions is based on an assessment of minimum funding requirements. From time to time contributions are made beyond those that are legally required.
|
|
•
|
Retirement rates.
Retirement rates are developed to reflect actual and projected plan experience.
|
F - 25
|
•
|
Mortality rates
. Mortality rates are developed using our plan-specific populations, recent mortality information published by recognized experts in this field, primarily the U.S. Society of Actuaries and the Canadian Institute of Actuaries, and other data where appropriate to reflect actual and projected plan experience.
|
|
•
|
Plan assets measured at net asset value
. Plan assets are recognized and measured at fair value in accordance with IFRS 13
- Fair Value Measurement.
Plan assets for which there are no active markets are represented by the net asset value (“NAV”) and amounted to
€3,000 million
and €2,750 million at December 31, 2015 and 2014, respectively. These investments include private equity, real estate and hedge fund investments.
|
Significant differences in actual experience or significant changes in assumptions may affect the pension obligations and pension expense. The effects of actual results differing from assumptions and of amended assumptions are included in Other comprehensive income/(loss). The weighted average discount rates used to determine the benefit obligation for the defined benefit obligation for the defined benefit plan were 4.44 percent and 4.03 percent at December 31, 2015 and 2014, respectively.
At December 31, 2015 the effect of the indicated decrease or increase in the discount rate, holding all other assumptions constant, is as follows:
|
Effect on pension
defined benefit obligation |
||
|
( € million)
|
||
|
10 basis point decrease in discount rate
|
426
|
|
|
10 basis point increase in discount rate
|
(418
|
)
|
Refer to Note
21
for additional information on the Group’s pension plans.
Other post-employment benefits
The Group provides health care, legal, severance, indemnity life insurance benefits and other postretirement benefits to certain hourly and salaried employees. Upon retirement, these employees may become eligible for continuation of certain benefits. Benefits and eligibility rules may be modified periodically.
These postretirement employee benefits (or “OPEB”) are accounted for on an actuarial basis, which requires the selection of various assumptions. The estimation of the Group’s obligations, costs and liabilities associated with OPEB requires the use of estimates of the present value of the projected future payments to all participants, taking into consideration the likelihood of potential future events estimated by using demographic assumptions such as mortality, dismissal and retirement rates, which may have an effect on the amount and timing of future payments.
Plan obligations and costs are based on existing plan provisions. Assumptions regarding any potential future changes to benefit provisions beyond those to which the Group is presently committed are not made.
The assumptions used in developing the required estimates include the following key factors:
|
•
|
Discount rates
. Our discount rates are based on yields of high-quality (AA-rated) fixed income investments for which the timing and amounts of maturities match the timing and amounts of the projected benefit payments.
|
|
•
|
Health care cost trends
. The Group’s health care cost trend assumptions are developed based on historical cost data, the near-term outlook, and an assessment of likely long-term trends.
|
|
•
|
Salary growth
. The salary growth assumptions reflect the Group’s long-term actual experience, outlook and assumed inflation.
|
|
•
|
Retirement and employee leaving rates
. Retirement and employee leaving rates are developed to reflect actual and projected plan experience, as well as legal requirements for retirement in respective countries.
|
F - 26
|
•
|
Mortality rates
. Mortality rates are developed using our plan-specific populations, recent mortality information published by recognized experts in this field and other data where appropriate to reflect actual and projected plan experience.
|
At December 31, 2015, the effect of the indicated decreases or increases in the key factors affecting the health care, life insurance plans and severance indemnity in Italy (trattamento di fine rapporto or “TFR”), holding all other assumptions constant, is shown below:
|
Effect on health
care and life insurance defined benefit obligation |
Effect on the TFR
obligation |
||||
|
(€ million)
|
|||||
|
10 basis point / (100 basis point for TFR) decrease in discount rate
|
32
|
|
41
|
|
|
|
10 basis point / (100 basis point for TFR) increase in discount rate
|
(31
|
)
|
(38
|
)
|
|
|
100 basis point decrease in health care cost trend rate
|
(129
|
)
|
—
|
|
|
|
100 basis point increase in health care cost trend rate
|
157
|
|
—
|
|
|
Refer to Note
21
for additional information on the Group’s Other post-employment benefits.
Recoverability of non-current assets with definite useful lives
Non-current assets with definite useful lives include Property, plant and equipment, Intangible assets and Assets held for sale. Intangible assets with definite useful lives mainly consist of capitalized development costs related to the NAFTA and EMEA segments. The Group periodically reviews the carrying amount of non-current assets with definite useful lives when events or circumstances indicate that an asset may be impaired.
During the year ended December 31, 2015, impairment losses totaling €713 million were recognized. The most significant component of this impairment loss related to the decision taken by the Group during the fourth quarter of 2015 to realign a portion of its manufacturing capacity in the NAFTA region, as part of the plan to improve NAFTA margins and to better meet market demand for Ram pickup trucks and Jeep vehicles within the Group's existing plant infrastructure. The approval of this plan was deemed to be an indicator of impairment for certain of our vehicle platform cash generating units (“CGUs”) due to the significant changes to the extent to which the assets are expected to be used. The impairment test compared the carrying amount of the assets included in the respective CGUs (comprising property, plant and equipment and capitalized development costs) to their value in use, which was determined not to be materially different from their fair value, and was determined using a discounted cash flow methodology. The value in use of the CGUs, which was based primarily on unobservable inputs, was determined using pre-tax estimated future cash flows attributable to the CGU that were discounted using a pre-tax discount rate reflecting current market assessments of the time value of money and the risks specific to the CGUs. As a result of completing the impairment test, it was determined that the carrying amount of the CGUs exceeded their value in use and an impairment charge of €598 million was recorded for the year ended December 31, 2015, of which €422 million related to tangible asset impairments and €176 million related to the impairment of capitalized development costs.
Due to impairment indicators existing in 2014 and 2013, primarily related to losses incurred in EMEA due to weak demand for vehicles and strong competition as well as changes in product strategy, impairment tests relating to the recoverability of CGUs in EMEA were performed. The impairment tests compared the carrying amount of the assets allocated to the CGUs (comprising property, plant and equipment and capitalized development costs) to their value in use using pre-tax estimated future cash flows based on the Group's 2014-2018 business plan presented on May 6, 2014, which were discounted to their present value using a pre-tax discount rate reflecting current market assessments of the time value of money and the risks specific to the CGUs. The impairment test, which reflected the Group's available knowledge as to the expected future development of the business, markets and automotive industry, confirmed that the value in use of the CGUs in EMEA was greater than the carrying value at December 31, 2014 and as a result, no impairment losses were recognized in 2014. For the year ended December 31, 2013, total impairment charges of €116 million relating to CGUs in EMEA were recognized of which €61 million related to capitalized development costs (Note
4
) and €55 million related to property, plant and equipment.
F - 27
Recoverability of Goodwill and Intangible assets with indefinite useful lives
In accordance with IAS 36 -
Impairment of Assets
, Goodwill and intangible assets with indefinite useful lives are not amortized and are tested for impairment annually or more frequently if facts or circumstances indicate that the asset may be impaired.
Goodwill and intangible assets with indefinite useful lives are allocated to operating segments or to CGUs within the operating segments. The impairment test is performed by comparing the carrying amount (which mainly comprises property, plant and equipment, goodwill, brands and capitalized development costs) and the recoverable amount of each CGU or group of CGUs to which Goodwill has been allocated. The recoverable amount of a CGU is the higher of its fair value less costs to sell and its value in use. The balance of Goodwill and intangible assets with indefinite useful lives recognized by the Group primarily relates to the acquisition of FCA US. Goodwill has been allocated to the NAFTA, EMEA, APAC and LATAM operating segments.
The assumptions used in the impairment test represent management’s best estimate for the period under consideration. The estimate of the recoverable amount, for purposes of performing the annual impairment test for each of the operating segments, was determined using fair value less cost to sell for the year ended December 31, 2015 and was based on the following assumptions:
|
•
|
The expected future cash flows covering the period from 2016 through 2020 have been derived primarily from the Group’s 2014-2018 business plan presented on May 6, 2014, as updated. These cash flows relate to the respective CGUs in their condition when preparing the financial statements and exclude the estimated cash flows that might arise from restructuring plans or other structural changes. Volumes and sales mix used for estimating the future cash flow are based on assumptions that are considered reasonable and sustainable and represent the best estimate of expected conditions regarding market trends and segment, brand and model share for the respective operating segment over the period considered.
|
|
•
|
The expected future cash flows include a normalized terminal period to estimate the future result beyond the time period explicitly considered which incorporates a long-term growth rate assumption of 2 percent.
|
|
•
|
Post-tax cash flows have been discounted using a post-tax discount rate which reflects the current market assessment of the time value of money for the period being considered and the risks specific to the operating segment under consideration. The Weighted Average Cost of Capital ("WACC") ranged from approximately 16 percent to approximately 19 percent. The WACC was calculated using the Capital Asset Pricing Model technique.
|
The value estimated as described above was determined to be in excess of the book value of the net capital employed for each operating segment to which Goodwill has been allocated. As such, no impairment charges were recognized for Goodwill and Intangible assets with indefinite useful lives for the year ended December 31, 2015.
There were no impairment charges resulting from the impairment tests performed for the years ended December 31, 2014 and 2013.
Recoverability of deferred tax assets
The carrying amount of deferred tax assets is reduced to the extent that it is not probable that sufficient taxable profit will be available to allow the benefit of a part of or all of the deferred tax assets to be utilized. The recoverability of deferred tax assets is dependent on the Group’s ability to generate sufficient future taxable income in the period in which it is assumed that the deductible temporary differences reverse and tax losses carried forward can be utilized. In making this assessment, the Group considers future taxable income arising on the most recent budgets and plans, prepared by using the same criteria described for testing the impairment of assets and goodwill. Moreover, the Group estimates the impact of the reversal of taxable temporary differences on earnings and it also considers the period over which these assets could be recovered.
These estimates and assumptions are subject to a high degree of uncertainty especially as it relates to future performance in Latin America and the Eurozone. Therefore changes in current estimates due to unanticipated events could have a significant impact on the Group’s Consolidated Financial Statements.
F - 28
Sales incentives
The Group records the estimated cost of sales incentive programs offered to dealers and consumers as a reduction to revenue at the time of sale of the vehicle to the dealer. This estimated cost represents the incentive programs offered to dealers and consumers, as well as the expected modifications to these programs in order to facilitate sales of the dealer inventory. Subsequent adjustments to sales incentive programs related to vehicles previously sold to dealers are recognized as an adjustment to Net revenues in the period the adjustment is determinable.
The Group uses price discounts to adjust vehicle pricing in response to a number of market and product factors, including pricing actions and incentives offered by competitors, economic conditions, the amount of excess industry production capacity, the intensity of market competition, consumer demand for the product and the desire to support promotional campaigns. The Group may offer a variety of sales incentive programs at any given point in time, including cash offers to dealers and consumers and subvention programs offered to customers, or lease subsidies, which reduce the retail customer’s monthly lease payment or cash due at the inception of the financing arrangement, or both. Sales incentive programs are generally brand, model and region specific for a defined period of time.
Multiple factors are used in estimating the future incentive expense by vehicle line including the current incentive programs in the market, planned promotional programs and the normal incentive escalation incurred as the model year ages. The estimated incentive rates are reviewed monthly and changes to planned rates are adjusted accordingly, thus impacting revenues. As there are a multitude of inputs affecting the calculation of the estimate for sales incentives, an increase or decrease of any of these variables could have a significant effect on Net revenues.
Product warranties, recall campaigns and product liabilities
The Group establishes reserves for product warranties at the time the sale is recognized. The Group issues various types of product warranties under which the performance of products delivered is generally guaranteed for a certain period or term. The accrual for product warranties includes the expected costs of warranty obligations imposed by law or contract, as well as the expected costs for policy coverage, recall actions and buyback commitments. The estimated future costs of these actions are principally based on assumptions regarding the lifetime warranty costs of each vehicle line and each model year of that vehicle line, as well as historical claims experience for the Group’s vehicles. In addition, the number and magnitude of additional service actions expected to be approved and policies related to additional service actions are taken into consideration. Due to the uncertainty and potential volatility of these estimated factors, changes in the assumptions used could materially affect the results of operations.
The Group periodically initiates voluntary service and recall actions to address various customer satisfaction as well as safety and emissions issues related to vehicles sold. Included in the reserve is the estimated cost of these service and recall actions. The estimated future costs of these actions are based primarily on historical claims experience for our vehicles. Given recent increases in both the cost and frequency of recall campaigns, and increased regulatory activity across the industry in the U.S. and Canada, an additional actuarial analysis that gives greater weight to the more recent calendar year trends in recall campaign activity was added to our adequacy assessment during the three months ended September 30, 2015. Refer to Note
2
for additional information.
Estimates of the future costs of these actions are inevitably imprecise due to numerous uncertainties, including the enactment of new laws and regulations, the number of vehicles affected by a service or recall action and the nature of the corrective action. It is reasonably possible that the ultimate cost of these service and recall actions may require the Group to make expenditures in excess of (or less than) established reserves over an extended period of time and in a range of amounts that cannot be reasonably estimated. The estimate of warranty and additional service and recall action obligations is periodically reviewed during the year. Experience has shown that initial data for any given model year can be volatile; therefore, our process relies upon long-term historical averages until sufficient data is available. As actual experience becomes available, it is used to modify the historical averages to ensure that the forecast is within the range of likely outcomes. Resulting accruals are then compared with current spending rates to ensure that the balances are adequate to meet expected future obligations.
In addition, the Group makes provisions for estimated product liability costs arising from property damage and personal injuries including wrongful death, and potential exemplary or punitive damages alleged to be the result of product defects. By nature, these costs can be infrequent, difficult to predict and have the potential to vary significantly in amount. The valuation of the reserve is actuarially determined on an annual basis based on, among other factors, the number of
F - 29
vehicles sold and product liability claims incurred. Costs associated with these provisions are recorded in the Consolidated Income Statement and any subsequent adjustments are recorded in the period in which the adjustment is determined.
Litigation
Various legal proceedings, claims and governmental investigations are pending against the Group on a wide range of topics, including vehicle safety, emissions and fuel economy, dealer, supplier and other contractual relationships, intellectual property rights, product warranties and environmental matters. Some of these proceedings allege defects in specific component parts or systems (including airbags, seats, seat belts, brakes, ball joints, transmissions, engines and fuel systems) in various vehicle models or allege general design defects relating to vehicle handling and stability, sudden unintended movement or crashworthiness. These proceedings seek recovery for damage to property, personal injuries or wrongful death and in some cases include a claim for exemplary or punitive damages. Adverse decisions in one or more of these proceedings could require the Group to pay substantial damages, or undertake service actions, recall campaigns or other costly actions.
Litigation is subject to many uncertainties, and the outcome of individual matters is not predictable with assurance. Moreover, the cases and claims against the Group are often derived from complex legal issues which are subject to differing degrees of uncertainty, including the facts and circumstances of each particular case, the manner in which the applicable law is likely to be interpreted and applied and the jurisdiction and the different laws involved. An accrual is established in connection with pending or threatened litigation if a loss is probable, there will be an outflow of funds and when the amount can be reasonably estimated. If an outflow of funds becomes probable, but the amount cannot be estimated, the matter is disclosed in the notes to the Consolidated Financial Statements. Since these accruals represent estimates, the resolution of some of these matters could require the Group to make payments in excess of the amounts accrued or may require the Group to make payments in an amount or range of amounts that could not be reasonably estimated.
The Group monitors the status of pending legal procedures and consults with experts on legal and tax matters on a regular basis. As such, the provisions for the Group’s legal proceedings and litigation may vary as a result of future developments in pending matters.
SCOPE OF CONSOLIDATION
At
December 31, 2015
and
December 31, 2014
, FCA had the following significant direct and indirect interests in the following subsidiaries:
|
At December 31, 2015
|
At December 31, 2014
|
|||||||||
|
Name
|
Country
|
Shares held
by the Group
|
Shares
held by NCI
|
Shares held
by the Group
|
Shares
held by NCI
|
|||||
|
Directly held interests
|
||||||||||
|
FCA Italy S.p.A.
|
Italy
|
100.00%
|
—
|
100.00%
|
—
|
|||||
|
Ferrari N.V.
|
Italy
|
80.00%
|
20.00%
|
—
|
—
|
|||||
|
Maserati S.p.A.
|
Italy
|
100.00%
|
—
|
100.00%
|
—
|
|||||
|
Magneti Marelli S.p.A.
|
Italy
|
99.99%
|
0.01%
|
99.99%
|
0.01%
|
|||||
|
Teksid S.p.A.
|
Italy
|
100.00%
|
—
|
84.79%
|
15.21%
|
|||||
|
Comau S.p.A.
|
Italy
|
100.00%
|
—
|
100.00%
|
—
|
|||||
|
Indirectly held interests
|
||||||||||
|
FCA US LLC
|
U.S.
|
100.00%
|
—
|
100.00%
|
—
|
|||||
|
Ferrari S.p.A.
|
Italy
|
80.00%
|
20.00%
|
90.00%
|
10.00%
|
|||||
Each of these subsidiaries holds direct or indirect interests in other Group companies. The Consolidated Financial Statements included 303 and 306 subsidiaries consolidated on a line-by-line basis at
December 31, 2015
and 2014, respectively.
F - 30
CHANGES IN THE SCOPE OF CONSOLIDATION
The following significant changes in the scope of consolidation occurred during the years ended December 31,
2015
,
2014
, and
2013
:
2015
|
•
|
In January 2015, FCA entered into a merger agreement with Mercurio S.p.A. (“Mercurio”)
whereby the net assets of FCA's wholly owned subsidiary, La Stampa, were merged with Mercurio's wholly owned subsidiary, Società Edizioni e Pubblicazioni S.p.A. (“SEP”), which owned and operated the Italian newspaper “Il Secolo XIX.” As a result of the merger agreement, FCA owns 77 percent of the combined entity, Italiana Editrice S.p.A., with the remaining 23 percent owned by Mercurio. In addition, FCA granted Mercurio a put option to sell its entire share in Italiana Editrice S.p.A., which is exercisable from January 1, 2019 to December 31, 2019. Given the net assets acquired by FCA constitute a business and FCA was deemed to be the acquirer and in control of Italiana Editrice S.p.A., the Group accounted for the merger transaction as a business combination. The Group recorded the identifiable net assets acquired at fair value and recognized €54 million of goodwill.
|
2014
|
•
|
In January 2014, FCA acquired the remaining 41.5 percent interest in FCA US previously not owned (described below).
|
|
•
|
In May 2014, FCA disposed of a subsidiary within the Components segment (Fonderie du Poitou Fonte S.A.S.).
|
2013
|
•
|
In October 2013, FCA acquired the 50 percent remaining interest of VM Motori Group previously not owned from General Motors.
|
|
•
|
In November 2013, the investment in the Brazilian company, CMP Componentes e Modulos Plasticos Industria e Commercio Ltda, which was previously classified as held for sale on acquisition, was consolidated on a line-by-line basis as a result of changes in the plans for its sale.
|
ACQUISITION OF THE REMAINING OWNERSHIP INTEREST IN FCA US
As of December 31, 2013, FCA held a 58.5 percent ownership interest in FCA US and the UAW Retiree Medical Benefits Trust, (the “VEBA Trust”) held the remaining 41.5 percent. On January 1, 2014, FCA 's 100 percent owned subsidiary FCA North America Holdings LLC, (“FCA NA”) and the VEBA Trust announced that they had entered into an agreement (“the Equity Purchase Agreement”) under which FCA NA agreed to acquire the VEBA Trust’s 41.5 percent interest in FCA US, which included an approximately 10 percent interest in FCA US subject to previously exercised options that had been subject to ongoing litigation, for cash consideration of U.S.$3,650 million (€2,691 million) as follows:
|
•
|
a special distribution of U.S.$1,900 million (€1,404 million) paid by FCA US to its members, which served to fund a portion of the transaction, wherein FCA NA directed its portion of the special distribution to the VEBA Trust as part of the purchase consideration; and
|
|
•
|
an additional cash payment by FCA NA to the VEBA Trust of U.S.$1,750 million (€1.3 billion).
|
The previously exercised options for approximately 10 percent interest in FCA US were historically carried at cost, which was zero as the options were on shares that did not have a quoted market price in an active market and as the interpretation of the formula required to calculate the exercise price on the options was disputed by the VEBA Trust and had been subject to ongoing litigation. Upon consummation of the transactions contemplated by the Equity Purchase Agreement, the fair value of the underlying equity and the estimated exercise price of the options, at that point, became reliably estimable. As such, on the transaction date, the options were remeasured to their fair value of U.S.$302 million (€223 million at the transaction date), which resulted in a corresponding non-taxable gain that was recorded within Other income/(expenses).
F - 31
The fair value of the options was calculated as the difference between the estimated exercise price for the disputed options encompassed in the Equity Purchase Agreement of U.S.$650 million (€481 million) and the estimated fair value for the underlying approximately 10 percent interest in FCA US of U.S.$952 million (€704 million). Management had estimated the exercise price for the disputed options to be U.S.$650 million (€481 million at the transaction date) representing the mid-point of the range between U.S.$600 million (€444 million at the transaction date) and U.S.$700 million (€518 million at the transaction date. Management believed this amount represented the appropriate point estimate of the exercise price encompassed in the Equity Purchase Agreement.
Since there was no publicly observable market price for FCA US’s membership interests, the fair value as of the transaction date of the approximately 10 percent non-controlling ownership interest in FCA US was determined based on the range of potential values determined in connection with the IPO that FCA US was pursuing at the time the Equity Purchase Agreement was negotiated and executed, which was corroborated by a discounted cash flow valuation that estimated a value near the mid-point of the range of potential IPO values. Management concluded that the mid-point of the range of potential IPO value provided the best evidence of the fair value of FCA US’s membership interests at the transaction date as it reflects market input obtained during the IPO process, thus providing better evidence of the price at which a market participant would transact consistent with IFRS 13
- Fair Value Measurement.
The potential IPO values for 100 percent of FCA US’s equity on a fully distributed basis ranged from $10.5 billion to U.S.$12.0 billion (€7.6 billion to €8.7 billion at December 31, 2013). Management concluded the mid-point of this range, U.S.$11.25 billion (€8.16 billion at December 31, 2013), was the best point estimate of fair value. The IPO value range was determined using earnings multiples observed in the market for publicly traded U.S.-based automotive companies. This fully distributed value was then reduced by approximately 15 percent for the expected discount that would have been realized in order to complete a successful IPO for the minority interest being sold between a willing buyer and a willing seller pursuant to the principles in IFRS 13 -
Fair Value Measurement
. This discount was estimated based on certain factors that a market participant would have considered including the fact that Fiat intended on remaining the majority owner of FCA US, that there was no active market for FCA US’s equity and that the IPO price represents the creation of the public market, which would have taken time to develop into an active market.
Concurrent with the closing of the acquisition under the Equity Purchase Agreement, FCA US and UAW executed and delivered a contractually binding and legally enforceable Memorandum of Understanding (“MOU”) to supplement FCA US’s existing collective bargaining agreement. Under the MOU, the UAW committed to (i) use the best efforts to cooperate in the continued roll-out of FCA US’s World Class Manufacturing (“WCM”) programs, (ii) to actively participate in benchmarking efforts associated with implementation of WCM programs across all FCA's manufacturing sites to ensure objective competitive assessments of operational performance and provide a framework for the proper application of WCM principles, and (iii) to actively assist in the achievement of FCA US’s long-term business plan. In consideration for these legally enforceable commitments, FCA US agreed to make payments to a UAW-organized independent VEBA Trust totaling U.S.$700 million (€518 million at the transaction date) to be paid in four equal annual installments. Considering FCA US’s non-performance risk over the payment period as of the transaction date and its unsecured nature, this payment obligation had a fair value of U.S.$672 million (€497 million) as of the transaction date.
F - 32
The Group considered the terms and conditions set forth in the above mentioned agreements and accounted for the Equity Purchase Agreement and the MOU as a single commercial transaction with multiple elements. As such, the fair value of the consideration paid discussed above, which amounts to U.S.$4,624 million (€3,411 million at the transaction date), including the fair value of the previously exercised disputed options, was allocated to the elements obtained by the Group. Due to the unique nature and inherent judgment involved in determining the fair value of the UAW's commitments under the MOU, a residual value methodology was used to determine the portion of the consideration paid attributable to the UAW's commitments as follows:
|
January 21, 2014
|
||
|
(€ million)
|
||
|
Special distribution from FCA US
|
1,404
|
|
|
Cash payment from FCA NA
|
1,287
|
|
|
Fair value of the previously exercised options
|
223
|
|
|
Fair value of financial commitments under the MOU
|
497
|
|
|
Fair value of total consideration paid
|
3,411
|
|
|
Less the fair value of an approximately 41.5 percent non-controlling ownership interest in FCA US
|
(2,916
|
)
|
|
Consideration allocated to the UAW’s commitments
|
495
|
|
The fair value of the 41.5 percent non-controlling ownership interest in FCA US acquired by FCA from the VEBA Trust (which includes the approximately 10 percent pursuant to the settlement of the previously exercised options discussed above) was determined using the valuation methodology discussed above.
The residual of the fair value of the consideration paid of U.S.$670 million (€495 million) was allocated to the UAW’s contractually binding and legally enforceable commitments to FCA US under the MOU.
The effects of changes in ownership interests in FCA US were as follows:
|
January 21, 2014
|
||
|
(€ million)
|
||
|
Carrying amount of non-controlling interest acquired
|
3,976
|
|
|
Less consideration allocated to the acquisition of the non-controlling interest
|
(2,916
|
)
|
|
Additional net deferred tax assets
|
251
|
|
|
Effect on the equity attributable to owners of the parent
|
1,311
|
|
In accordance with IFRS 10 –
Consolidated Financial Statements
, equity reserves were adjusted to reflect the change in the ownership interest in FCA US through a corresponding adjustment to Equity attributable to the parent. As the transaction described above resulted in the elimination of the non-controlling interest in FCA US, all items of Other comprehensive income/(loss) previously attributed to the non-controlling interest were recognized in equity reserves.
Accumulated actuarial gains and losses from the remeasurement of the defined benefit plans of FCA US totaling €1,248 million has been recognized since the consolidation of FCA US in 2011. As of the transaction date, €518 million, which is approximately 41.5 percent of this amount, had been recognized in non-controlling interest. In connection with the acquisition of the non-controlling interest in FCA US, this amount was recognized as an adjustment to the equity reserve within Remeasurement of defined benefit plans.
With respect to the MOU entered into with the UAW, the Group recognized €495 million (U.S.$670 million) in Other income/(expenses) in the Consolidated Income Statement. The first U.S.$175 million installment under the MOU was paid to the VEBA Trust on January 21, 2014, which was equivalent to €129 million at that date, and is reflected in the operating section of the Consolidated Statement of Cash Flows. The second installment of U.S.$175 million (approximately €151 million at that date) was paid to the VEBA Trust on January 21, 2015. The remaining outstanding obligation pursuant to the MOU as of December 31, 2015 of
€313 million
(U.S.$341 million), which includes €8 million (U.S.$9 million) of accreted interest, is recorded in Other current liabilities in the Consolidated Statement of Financial Position. The third installment of U.S.$175 million (approximately €161 million at that date) was paid to the VEBA Trust on January 21, 2016.
F - 33
The Equity Purchase Agreement also provided for a tax distribution from FCA US to its members under the terms of FCA US ’s Limited Liability Company Operating Agreement (as amended from time to time, the “LLC Operating Agreement”) in the amount of approximately U.S.$60 million (€45 million) to cover the VEBA Trust’s tax obligation. As this payment was made pursuant to a specific requirement in the LLC Operating Agreement, it was not considered part of the multiple element transaction.
Transactions with non-controlling interests during the years ended December 31,
2015
,
2014
, and
2013
were as follows:
|
•
|
Acquisition of the remaining 15.2 percent interest in Teksid S.p.A. from Renault in December 2015. As a result, all the rights and obligations arising from the previous shareholder agreement between FCA and Renault, including the put option were canceled.
|
|
•
|
In August 2014, Ferrari S.p.A. acquired an additional 21 percent in the share capital of the subsidiary Ferrari Maserati Cars International Trading (Shanghai) Co. Ltd. increasing its interest from 59 percent to 80 percent (the Group’s interests increased from 53.1 percent to 72 percent). In accordance with IFRS 10
- Consolidated Financial Statements,
non-controlling interest and equity reserves were adjusted to reflect the change in the ownership interest through a corresponding adjustment to Equity attributable to the parent.
|
F - 34
(
1
) Net revenues
Net revenues were as follows:
|
For the Years Ended December 31,
|
||||||||
|
2015
|
2014
|
2013
|
||||||
|
(€ million)
|
||||||||
|
Revenues from:
|
||||||||
|
Sales of goods
|
107,095
|
|
90,308
|
|
81,563
|
|
||
|
Services provided
|
1,600
|
|
1,644
|
|
1,490
|
|
||
|
Contract revenues
|
1,309
|
|
1,150
|
|
1,038
|
|
||
|
Interest income of financial services activities
|
188
|
|
230
|
|
201
|
|
||
|
Lease installments from assets sold with a buy-back commitment
|
403
|
|
308
|
|
238
|
|
||
|
Total Net revenues
|
110,595
|
|
|
93,640
|
|
|
84,530
|
|
Net revenues were attributed as follows:
|
For the Years Ended December 31,
|
||||||||
|
2015
|
2014
|
2013
|
||||||
|
(€ million)
|
||||||||
|
Revenues in:
|
||||||||
|
North America
|
71,979
|
|
53,991
|
|
47,044
|
|
||
|
Italy
|
7,165
|
|
6,849
|
|
6,566
|
|
||
|
Brazil
|
5,103
|
|
7,498
|
|
8,417
|
|
||
|
China
|
4,720
|
|
6,065
|
|
4,223
|
|
||
|
Germany
|
3,794
|
|
3,298
|
|
2,897
|
|
||
|
France
|
2,852
|
|
1,784
|
|
1,902
|
|
||
|
UK
|
1,744
|
|
1,559
|
|
1,171
|
|
||
|
Turkey
|
1,682
|
|
1,378
|
|
1,259
|
|
||
|
Spain
|
1,254
|
|
1,081
|
|
919
|
|
||
|
Argentina
|
1,175
|
|
1,180
|
|
1,438
|
|
||
|
Australia
|
936
|
|
1,184
|
|
954
|
|
||
|
Other countries
|
8,191
|
|
7,773
|
|
7,740
|
|
||
|
Total Net revenues
|
110,595
|
|
93,640
|
|
84,530
|
|
||
(
2
) Cost of sales
Cost of sales during the years ended December 31,
2015
,
2014
and
2013
amounted to €
97,620 million
, €
81,592 million
and €
73,038 million
, respectively, and included €
115 million
, €
155 million
and €
173 million
, respectively, of interest and other financial expenses from financial services companies. Cost of sales also included €432 million, €160 million and €196 million related to the decrease in value for assets sold with buy-back commitments during the years ended December 31, 2015, 2014 and 2013, respectively.
F - 35
As part of the plan to improve margins in NAFTA, the Group will realign a portion of its manufacturing capacity in the region to better meet market demand for Ram pickup trucks and Jeep vehicles within the Group's existing plant infrastructure. As a result, a total of €658 million, of which €422 million related to asset impairments and €236 million related to the
payment of supplemental unemployment benefits
due to extended downtime at certain plants associated with the implementation of the new manufacturing plan, was recognized during the fourth quarter and was recorded within Cost of sales for the year ended December 31, 2015.
Given recent increases in both the cost and frequency of recall campaigns and increased regulatory activity across the industry in the U.S and Canada, an additional actuarial analysis, that gives greater weight to the more recent calendar year trends in recall campaign experience, has been added to the adequacy assessment to estimate future recall costs. This reassessment resulted in a change in estimate for estimated future recall campaign costs for the U.S. and Canada of €761 million related to vehicles sold in periods prior to the third quarter that was recorded within Cost of sales for the year ended December 31, 2015. In the second half of 2015, in connection with this reassessment, we incurred additional warranty costs related to the increase in the accrual rate per vehicle.
Cost of sales for the year ended December 31, 2015 included total charges of €163 million, of which €80 million was due to the adoption of the Venezuelan government’s Marginal Currency System (the "SIMADI" exchange rate) at June 30, 2015 (Note
30
) and €83 million was due to the devaluation of the Argentinian Peso resulting from changes in monetary policy.
Cost of sales for the years ended December 31, 2014 and 2013 included charges of €98 million and €43 million, respectively, related to the devaluation of the Venezuelan Bolivar ("VEF") exchange rate relative to the U.S.$ and the remeasurement of our VEF denominated net monetary assets (Note
30
).
Cost of sales for the year ended December 31, 2013 included charges of €
115 million
related to the voluntary safety recall as well as customer satisfaction actions for certain Jeep vehicles and €57 million related to certain write-downs within the cast-iron business of the Components segment (Teksid), which were partially offset by the €166 million impact of a curtailment gain and plan amendments following FCA US's amendment to its U.S. and Canadian salaried defined benefit pension plans.
(
3
) Selling, general and administrative costs
Selling costs for the years ended December 31,
2015
,
2014
and
2013
amounted to
€5,050 million
,
€4,499 million
and
€4,213 million
, respectively, and mainly consisted of marketing, advertising, and sales personnel costs. Marketing and advertising expenses consisted of media campaigns as well as marketing support in the form of trade and auto shows, events, and sponsorships.
General and administrative costs for the years ended December 31,
2015
,
2014
and
2013
amounted to
€2,678 million
,
€2,448 million
and
€2,402 million
, respectively, and mainly consisted of administration expenses which were not attributable to sales, manufacturing or research and development functions.
(
4
) Research and development costs
Research and development costs were as follows:
|
For the Years Ended December 31,
|
|||||
|
2015
|
2014
|
2013
|
|||
|
(€ million)
|
|||||
|
Research and development costs expensed during the year
|
1,449
|
1,320
|
1,257
|
||
|
Amortization of capitalized development costs
|
1,194
|
932
|
768
|
||
|
Impairment and write-off of costs previously capitalized
|
221
|
82
|
250
|
||
|
Total Research and development costs
|
2,864
|
|
2,334
|
|
2,275
|
F - 36
The impairment and write-off of costs previously capitalized during the year ended December 31, 2015 mainly related to the Group's plan to realign a portion of its manufacturing capacity in NAFTA to better meet demand for Ram pickup trucks and Jeep vehicles within the Group's existing plant infrastructure, which resulted in an impairment charge of
€176
million for capitalized development costs that had no future economic benefit.
As a result of new product strategies and the streamlining of architectures and related production platforms associated with the Group, the operations to which specific capitalized development costs belonged were redesigned during the year ended December 31, 2014. As no future economic benefits were expected from these specific capitalized development costs, €47 million within the EMEA segment and €28 million within the NAFTA segment of development costs were written off and recorded within Research and development costs in the Consolidated Income Statement for the year ended December 31, 2014.
To reflect changes in its product strategy, the Group wrote-off specific capitalized development costs totaling €250 million during the year ended December 31,
2013
. This amount mainly included €151 million for the EMEA segment, €32 million for the LATAM segment and €65 million for Maserati in connection with development costs on new vehicles, which had been shifted to new platforms considered technologically more appropriate.
Refer to Note
11
for information on capitalized development costs.
(
5
) Other income/(expenses)
For the year ended
December 31, 2015
, Other income/(expenses) amounted to €
152 million
and
included income from royalties and licenses as well as €104 million of income related to legal settlements to which we were the plaintiff. This was partially offset by a total charge of €81 million resulting from a consent order (the
“
Consent Order”) entered into by FCA US with
the U.S. Department of Transportation's National Highway Traffic Safety Administration (“
NHTSA”) o
n July 24, 2015. The Consent Order resolved the issues raised by NHTSA with respect to FCA US’s execution of 23 recall campaigns in NHTSA’s Special Order issued to FCA US on May 22, 2015 and further addressed at a NHTSA public hearing held on July 2, 2015. Pursuant to the Consent Order, FCA US made a U.S.$70 million (€63 million) cash payment to NHTSA in September 2015 and will spend U.S.$20 million (€18 million) on industry and consumer outreach activities and incentives to enhance certain recall and service campaign completion rates. An additional U.S.$15 million (€14 million) payment will be payable by FCA US if it fails to comply with certain terms of the Consent Order.
FCA US also agreed under the Consent Order to offer, as an alternative remedy, to repurchase vehicles subject to three recall campaigns that had not already been remedied as of the date of the Consent Order at a price equal to the original purchase price less a reasonable allowance for depreciation plus ten percent. In addition, FCA US offered consumer incentives to encourage owners of vehicles subject to the structural reinforcement campaign to participate in the campaign. All premiums paid to repurchase vehicles in the three recall campaigns and customer incentives will be applied as credits to the U.S.$20 million (€18 million) that FCA US has agreed to spend on industry outreach amounts under the Consent Order. Although such amounts may exceed U.S.$20 million (€18 million), FCA US does not expect the net cost of providing these additional alternatives will be material to its financial position, liquidity or results of operations. FCA US began its buyback program on October 1, 2015. The Consent Order will remain in place for three years subject to NHTSA’s right to extend for an additional year in the event of FCA US's noncompliance with the Consent Order.
As a result of the Group's heightened scrutiny of its regulatory reporting obligations growing out of the Consent Order, the Group identified deficiencies in FCA US's Transportation Recall Enhancement, Accountability, and Documentation (TREAD) reporting. Following admission of these deficiencies to NHTSA, an amendment to the Consent Order was issued in December 2015 whereby a penalty of U.S.$70 million (€63 million) was imposed by NHTSA. The penalty, which was recorded within Other income/(expenses), was paid on January 6, 2016.
There were no other amounts
within Other
income/(expenses)
that were individually material for the year ended December 31, 2015.
F - 37
For the year ended
December 31, 2014
,
Other
income/(expenses)
primarily included the €495 million expense recognized in connection with the execution of the MOU with the UAW entered into by FCA US in January 2014, that was partially offset by the non-taxable gain of €223 million on the remeasurement to fair value of the previously exercised options on approximately 10 percent of FCA US's membership interest in connection with the acquisition of the remaining interest in FCA US previously not owned as described in the section —
Changes in Scope of Consolidation -
Acquisition of the remaining ownership interest in FCA US
above. There were no other items
that were individually material.
For the year ended
December 31, 2013
, Other income/(expenses) included €56 million related to the write-off of the book value of the right associated with the acquisition of the remaining interest in FCA US previously not owned. This charge was
offset by other items that were not individually material.
F - 38
(
6
) Net financial expenses
The following table summarizes the Group’s financial income and expenses, including the amounts reported in the Consolidated Income Statement within Net financial income/(expenses), as well as interest income from financial services activities, recognized within Net revenues, and interest cost and other financial charges from financial services companies, recognized within Cost of sales.
|
For the Years Ended December 31,
|
||||||
|
2015
|
2014
|
2013
|
||||
|
Financial income:
|
(€ million)
|
|||||
|
Interest income and other financial income:
|
351
|
229
|
206
|
|
||
|
Interest income from banks deposits
|
157
|
169
|
152
|
|
||
|
Interest income from securities
|
10
|
7
|
8
|
|
||
|
Other interest income and financial income
|
184
|
53
|
46
|
|
||
|
Interest income of financial services activities
|
188
|
230
|
201
|
|
||
|
Gains on disposal of securities
|
14
|
3
|
4
|
|
||
|
Total Financial income
|
553
|
462
|
411
|
|
||
|
Total Financial income relating to:
|
||||||
|
Industrial companies (A)
|
365
|
232
|
210
|
|
||
|
Financial services companies (reported within Net revenues)
|
188
|
230
|
201
|
|
||
|
Financial expenses:
|
||||||
|
Interest expense and other financial expenses:
|
2,179
|
1,915
|
1,897
|
|
||
|
Interest expense on notes
|
1,196
|
1,204
|
959
|
|
||
|
Interest expense on borrowings from bank
|
527
|
426
|
367
|
|
||
|
Commission expenses
|
20
|
21
|
19
|
|
||
|
Other interest cost and financial expenses
|
436
|
264
|
552
|
|
||
|
Write-downs of financial assets
|
61
|
77
|
102
|
|
||
|
Losses on disposal of securities
|
28
|
6
|
3
|
|
||
|
Net interest expense on employee benefits provisions
|
350
|
330
|
371
|
|
||
|
Total Financial expenses
|
2,618
|
2,328
|
2,373
|
|
||
|
Net expenses/(income) from derivative financial instruments and exchange rate differences
|
228
|
110
|
(1
|
)
|
||
|
Total Financial expenses and net expenses from derivative financial instruments and exchange rate differences
|
2,846
|
2,438
|
2,372
|
|
||
|
Total Financial expenses and net expenses from derivative financial instruments and exchange rate differences relating to:
|
||||||
|
Industrial companies (B)
|
2,731
|
2,283
|
2,199
|
|
||
|
Financial services companies (reported within Cost of sales)
|
115
|
155
|
173
|
|
||
|
Net Financial expenses relating to industrial companies (A - B)
|
2,366
|
2,051
|
1,989
|
|
||
Other interest cost and financial expenses for the year ended December 31, 2015 included a loss on extinguishment of debt totaling €168 million related to the prepayment of the secured senior notes of FCA US due in 2019 and 2021 (Note
23
).
Other interest cost and financial expenses included interest expense of €41 million, €50 million, and €61 million related to the Canadian Health Care Trust Notes (Note
23
) for the years ended December 31, 2015, 2014 and 2013, respectively. For the years ended December 31, 2014 and 2013, Other interest and financial expenses included interest expense related to the outstanding financial liability with the VEBA Trust (the “VEBA Trust Note”) of €33 million and €326 million, respectively.
Net expenses/(income) from derivative financial instruments and exchange rate differences included income of
€31 million
for the year ended December 31,
2013
arising from equity swaps on FCA and CNH Industrial N.V. (“CNHI”) shares relating to certain stock option plans that had expired in 2013.
F - 39
(
7
) Tax expense/(benefit)
The following table summarizes Tax expense/(benefit):
|
For the Years Ended December 31,
|
||||||||
|
2015
|
2014
|
2013
|
||||||
|
(€ million)
|
||||||||
|
Current tax expense
|
445
|
|
557
|
|
486
|
|
||
|
Deferred tax (income)/expense
|
(277
|
)
|
(147
|
)
|
(1,563
|
)
|
||
|
Taxes relating to prior periods
|
(2
|
)
|
14
|
|
18
|
|
||
|
Total Tax expense/(benefit)
|
166
|
|
424
|
|
(1,059
|
)
|
||
The applicable tax rate used to determine the theoretical income taxes was 20.25 percent in 2015, which was the weighted-average statutory rate applicable in 2015 in the United Kingdom, the tax jurisdiction in which FCA is resident. In 2014, the weighted-average statutory rate in the United Kingdom was 21.5 percent. In 2013, the applicable tax rate used to determine the theoretical income taxes was 27.5 percent, which was the statutory rate applicable in Italy, the tax jurisdiction in which Fiat was resident. The change in the applicable tax rate is a result of the change in tax jurisdiction in connection with the Merger. The reconciliation between the theoretical income taxes calculated on the basis of the theoretical tax rate and income taxes recognized was as follows:
|
For the Years Ended December 31,
|
||||||||
|
2015
|
2014
|
2013
|
||||||
|
(€ million)
|
||||||||
|
Theoretical income taxes
|
51
|
|
168
|
|
178
|
|
||
|
Tax effect on:
|
||||||||
|
Recognition and utilization of previously unrecognized deferred tax assets
|
(20)
|
|
(172)
|
|
(1742)
|
|
||
|
Permanent differences
|
(36)
|
|
(132)
|
|
23
|
|
||
|
Tax credits
|
(238)
|
|
(68)
|
|
(32)
|
|
||
|
Deferred tax assets not recognized and write-downs
|
303
|
|
378
|
|
380
|
|
||
|
Differences between foreign tax rates and the theoretical applicable tax rate and tax holidays
|
70
|
|
66
|
|
23
|
|
||
|
Taxes relating to prior years
|
(2)
|
|
14
|
|
22
|
|
||
|
Withholding tax
|
49
|
|
46
|
|
84
|
|
||
|
Other differences
|
(36)
|
|
63
|
|
(46)
|
|
||
|
Total Tax expense/(income), excluding IRAP
|
141
|
|
363
|
|
(1,110
|
)
|
||
|
Effective tax rate
|
54.4
|
%
|
46.4
|
%
|
n.m.
(1)
|
|
||
|
IRAP (current and deferred)
|
25
|
|
61
|
|
51
|
|
||
|
Total Tax expense/(benefit)
|
166
|
|
424
|
|
(1059)
|
|
||
(1) Number is not meaningful.
In
2015
, the Regional Italian Income Tax (“IRAP”) recognized within current taxes was
€16 million
(
€41 million
in
2014
and
€38 million
in
2013
) and IRAP recognized within deferred tax expense was
€9 million
(
€20 million
in
2014
and
€13 million
in
2013
). Since the IRAP taxable basis differs from Profit before taxes, it is excluded from the above effective tax rate calculation.
In
2015
, the Group’s effective tax rate was
54.4 percent
. The difference between the U.K. statutory tax rate and the effective tax rate is primarily due to
€303 million
arising from the unrecognized deferred tax assets on temporary differences and tax losses originating during the year,
€70 million
effect of higher foreign tax rates and a
€98 million
effect of the decrease in the Italian corporate tax rate, which is partially offset by the recognition of non-taxable incentives generating deferred tax benefits of
€168 million
, and U.S. tax credits of
€238 million
.
F - 40
In
2014
, the Group’s effective tax rate was
46.4 percent
. The difference between the UK statutory tax rate and the effective income tax rate was primarily due to
€378 million
arising from unrecognized deferred tax assets on temporary differences and tax losses originating in the year in EMEA, which was partially offset by the recognition of non-recurring deferred tax benefits of
€172 million
.
The effective tax rate of
46.4 percent
in 2014 increased to
54.4 percent
in 2015 as a result of the decrease in Profit before tax and the relative increased impact of losses before tax in jurisdictions in which a tax benefit is not recorded on tax losses.
In
2013
, the Group’s effective tax rate includes a significant tax benefit and is not comparable to prior periods primarily due to FCA US recognizing previously unrecognized deferred tax assets of
€1,500 million
. Excluding this effect, the effective tax rate of the Group in 2013 would have been
60.1 percent
. The difference between the 2013 Italian statutory tax rate and effective tax rate was primarily due to the above-mentioned recognition and utilization of previously unrecognized deferred tax assets of €
1,742 million
(€
1,500 million
. of which was recognized in income taxes and €
242 million
in Other comprehensive income/(loss)). These benefits were partially offset by the negative impact of €
380 million
arising from the unrecognized deferred tax assets on temporary differences and tax losses originating in the year.
The Group recognizes the amount of Deferred tax assets less the Deferred tax liabilities of the individual companies within Deferred tax assets, where these may be offset. Amounts recognized were as follows:
|
At December 31,
|
|||||
|
2015
|
2014
|
||||
|
(€ million)
|
|||||
|
Deferred tax assets
|
3,343
|
|
|
3,547
|
|
|
Deferred tax liabilities
|
(156
|
)
|
(233
|
)
|
|
|
Net deferred tax assets
|
3,187
|
|
3,314
|
|
|
F - 41
In
2015
, Net deferred tax assets
decrease
d by
€127 million
mainly due to a
€1,374 million
decrease related to the utilization of U.S. tax loss and credit carryforwards and a
€104 million
decrease due to the reclassification of Ferrari’s deferred tax assets to Assets held for distribution, offset by a
€1,076 million
increase due to an increase in U.S. deductible temporary differences and decrease in U.S. taxable temporary differences, a
€211 million
increase primarily due to an increase in Brazil tax loss carryforwards and other increases of
€64 million
.
The significant components of Deferred tax assets and liabilities and their changes during the years ended
December 31, 2015
and
2014
were as follows:
|
At January 1, 2015
|
Recognized in Consolidated Income Statement
|
Recognized in Equity
|
Translation
differences and other changes |
Transfer to assets held for distribution
|
At December 31, 2015
|
||||||||||||
|
(€ million)
|
|||||||||||||||||
|
Deferred tax assets arising on:
|
|||||||||||||||||
|
Provisions
|
4,567
|
|
1,330
|
|
—
|
|
230
|
|
(99
|
)
|
6,028
|
|
|||||
|
Provision for employee benefits
|
1,412
|
|
360
|
|
12
|
|
371
|
|
(2
|
)
|
2,153
|
|
|||||
|
Intangible assets
|
328
|
|
(78
|
)
|
—
|
|
(1
|
)
|
—
|
|
249
|
|
|||||
|
Impairment of financial assets
|
174
|
|
(24
|
)
|
—
|
|
5
|
|
—
|
|
155
|
|
|||||
|
Inventories
|
310
|
|
(45
|
)
|
—
|
|
3
|
|
(25
|
)
|
243
|
|
|||||
|
Allowances for doubtful accounts
|
111
|
|
(7
|
)
|
—
|
|
(11
|
)
|
(6
|
)
|
87
|
|
|||||
|
Other
|
1,760
|
|
(935
|
)
|
(16
|
)
|
(38
|
)
|
(80
|
)
|
691
|
|
|||||
|
Total
|
8,662
|
|
601
|
|
(4
|
)
|
559
|
|
(212
|
)
|
9,606
|
|
|||||
|
Deferred tax liabilities arising on:
|
|||||||||||||||||
|
Accelerated depreciation
|
(2,706
|
)
|
195
|
|
—
|
|
(248
|
)
|
13
|
|
(2,746
|
)
|
|||||
|
Capitalization of development costs
|
(1,976
|
)
|
(179
|
)
|
—
|
|
(297
|
)
|
76
|
|
(2,376
|
)
|
|||||
|
Other Intangible assets and Intangible assets with indefinite useful lives
|
(1,296
|
)
|
42
|
|
—
|
|
(173
|
)
|
—
|
|
(1,427
|
)
|
|||||
|
Provision for employee benefits
|
(21
|
)
|
5
|
|
(215
|
)
|
215
|
|
2
|
|
(14
|
)
|
|||||
|
Other
|
(631
|
)
|
222
|
|
(34
|
)
|
32
|
|
21
|
|
(390
|
)
|
|||||
|
Total
|
(6,630
|
)
|
285
|
|
(249
|
)
|
(471
|
)
|
112
|
|
(6,953
|
)
|
|||||
|
Deferred tax asset arising on tax loss carry-forwards
|
4,696
|
|
(778
|
)
|
—
|
|
(194
|
)
|
(7
|
)
|
3,717
|
|
|||||
|
Unrecognized deferred tax assets
|
(3,414
|
)
|
197
|
|
1
|
|
30
|
|
3
|
|
(3,183
|
)
|
|||||
|
Total Net deferred tax assets
|
3,314
|
|
305
|
|
(252
|
)
|
(76
|
)
|
(104
|
)
|
3,187
|
|
|||||
F - 42
|
At
January 1,
2014
|
Recognized in
Consolidated Income Statement |
Recognized in Equity
|
Changes in the scope of consolidation
|
Translation
differences and other changes |
At December 31, 2014
|
||||||||||||
|
(€ million)
|
|||||||||||||||||
|
Deferred tax assets arising on:
|
|||||||||||||||||
|
Provisions
|
2,938
|
|
533
|
|
—
|
|
4
|
|
1,092
|
|
4,567
|
|
|||||
|
Provision for employee benefits
|
1,131
|
|
101
|
|
35
|
|
—
|
|
145
|
|
1,412
|
|
|||||
|
Intangible assets
|
343
|
|
(31
|
)
|
—
|
|
—
|
|
16
|
|
328
|
|
|||||
|
Impairment of financial assets
|
191
|
|
(7
|
)
|
—
|
|
—
|
|
(10
|
)
|
174
|
|
|||||
|
Inventories
|
261
|
|
41
|
|
—
|
|
—
|
|
8
|
|
310
|
|
|||||
|
Allowances for doubtful accounts
|
110
|
|
—
|
|
—
|
|
—
|
|
1
|
|
111
|
|
|||||
|
Other
|
1,209
|
|
(947
|
)
|
42
|
|
(4
|
)
|
1,460
|
|
1,760
|
|
|||||
|
Total
|
6,183
|
|
(310
|
)
|
77
|
|
—
|
|
2,712
|
|
8,662
|
|
|||||
|
Deferred tax liabilities arising on:
|
|||||||||||||||||
|
Accelerated depreciation
|
(1,404
|
)
|
(80
|
)
|
—
|
|
—
|
|
(1,222
|
)
|
(2,706
|
)
|
|||||
|
Capitalization of development costs
|
(1,416
|
)
|
(155
|
)
|
—
|
|
2
|
|
(407
|
)
|
(1,976
|
)
|
|||||
|
Other Intangible assets and Intangible assets with indefinite useful lives
|
(640
|
)
|
23
|
|
—
|
|
16
|
|
(695
|
)
|
(1,296
|
)
|
|||||
|
Provision for employee benefits
|
(20
|
)
|
2
|
|
(2
|
)
|
—
|
|
(1
|
)
|
(21
|
)
|
|||||
|
Other
|
(562
|
)
|
(56
|
)
|
27
|
|
(16
|
)
|
(24
|
)
|
(631
|
)
|
|||||
|
Total
|
(4,042
|
)
|
(266
|
)
|
25
|
|
2
|
|
(2,349
|
)
|
(6,630
|
)
|
|||||
|
Deferred tax asset arising on tax loss carry-forward
|
3,810
|
|
777
|
|
—
|
|
—
|
|
109
|
|
4,696
|
|
|||||
|
Unrecognized deferred tax assets
|
(3,326
|
)
|
(56
|
)
|
—
|
|
(2
|
)
|
(30
|
)
|
(3,414
|
)
|
|||||
|
Total Net deferred tax assets
|
2,625
|
|
145
|
|
102
|
|
—
|
|
442
|
|
3,314
|
|
|||||
The decision to recognize deferred tax assets is made for each company in the Group by critically assessing whether conditions exist for the future recoverability of such assets by taking into account recent forecasts from budgets and plans. Despite a tax loss in the Group’s wholly-owned consolidated Italian subsidiaries, the Group continued to recognize Italian deferred tax assets of
€764 million
(
€799 million
at December 31, 2014) as the Group expects Italian taxable income in future periods and based on the fact that Italian tax losses can be carried forward indefinitely. The Group also continues to recognize Brazilian deferred tax assets of
€571 million
(
€364 million
at December 31, 2014) as the Group expects Brazilian taxable income in future periods and because Brazilian tax losses can be carried forward indefinitely.
At
December 31, 2015
, the Group had deferred tax assets on deductible temporary differences of
€9,606 million
(
€8,662 million
at
December 31, 2014
), of which
€533 million
was not recognized (
€480 million
at
December 31, 2014
). At the same date the Group also had theoretical tax benefits on losses carried forward of
€3,717 million
(
€4,696 million
at
December 31, 2014
), of which
€2,650 million
was unrecognized (
€2,934 million
at
December 31, 2014
). The Group also had deferred tax liabilities on taxable temporary differences of
€6,953 million
(
€6,630 million
at
December 31, 2014
).
Deferred taxes on the undistributed earnings of subsidiaries have not been recognized, except in cases where it is probable the distribution will occur in the foreseeable future.
F - 43
Total deductible and taxable temporary differences and accumulated tax losses at
December 31, 2015
, together with the amounts for which deferred tax assets have not been recognized, analyzed by year of expiration, were as follows:
|
Years of expiration
|
||||||||||||||||||||
|
Total at December 31, 2015
|
2016
|
2017
|
2018
|
2019
|
Beyond 2019
|
Unlimited/indeterminable
|
||||||||||||||
|
(€ million)
|
||||||||||||||||||||
|
Temporary differences and tax losses relating to corporate taxation:
|
||||||||||||||||||||
|
Deductible temporary differences
|
27,841
|
|
6,708
|
|
3,886
|
|
3,744
|
|
4,855
|
|
8,648
|
|
—
|
|
||||||
|
Taxable temporary differences
|
(20,017
|
)
|
(2,848
|
)
|
(2,360
|
)
|
(2,331
|
)
|
(2,321
|
)
|
(10,469
|
)
|
312
|
|
||||||
|
Tax losses
|
14,457
|
|
90
|
|
79
|
|
132
|
|
138
|
|
631
|
|
13,387
|
|
||||||
|
Amounts for which deferred tax assets were not recognized
|
(11,781
|
)
|
33
|
|
(4
|
)
|
119
|
|
(60
|
)
|
(1,106
|
)
|
(10,763
|
)
|
||||||
|
Temporary differences and tax losses relating to corporate taxation
|
10,500
|
|
3,983
|
|
1,601
|
|
1,664
|
|
2,612
|
|
(2,296
|
)
|
2,936
|
|
||||||
|
Temporary differences and tax losses relating to local taxation (i.e. IRAP in Italy):
|
||||||||||||||||||||
|
Deductible temporary differences
|
20,623
|
|
5,218
|
|
2,967
|
|
2,917
|
|
3,766
|
|
5,755
|
|
—
|
|
||||||
|
Taxable temporary differences
|
(18,349
|
)
|
(2,374
|
)
|
(2,081
|
)
|
(2,116
|
)
|
(2,083
|
)
|
(10,018
|
)
|
323
|
|
||||||
|
Tax losses
|
1,297
|
|
(3
|
)
|
(1
|
)
|
6
|
|
4
|
|
47
|
|
1,243
|
|
||||||
|
Amounts for which deferred tax assets
were not recognized |
(613
|
)
|
182
|
|
(45
|
)
|
(22
|
)
|
104
|
|
(154
|
)
|
(677
|
)
|
||||||
|
Temporary differences and tax losses relating to local taxation
|
2,958
|
|
3,023
|
|
840
|
|
785
|
|
1,791
|
|
(4,370
|
)
|
889
|
|
||||||
(
8
) Other information by nature
Personnel costs for the Group, including Ferrari, for the years ended December 31,
2015
,
2014
and
2013
amounted to €
11,870 million
,
€10,099 million
and
€9,471 million
, respectively, which included costs that were capitalized mainly in connection with product development activities.
For the year ended December 31,
2015
, FCA, including Ferrari, had an average number of employees of
236,559
(
231,613
employees in
2014
and
223,658
employees in
2013
).
(
9
) Earnings per share
Basic earnings per share
The basic earnings per share for the years ended December 31,
2015
,
2014
and
2013
was determined by dividing the Net profit attributable to the equity holders of the parent by the weighted average number of shares outstanding during the periods. In addition, for the years ended December 31, 2015 and 2014, the weighted average number of shares outstanding included the minimum number of ordinary shares to be converted as a result of the issuance of the mandatory convertible securities (Note
19
).
F - 44
The following table provides the amounts used in the calculation of basic earnings per share for the years ended
December 31, 2015
,
2014
and
2013
:
|
For the Years Ended December 31,
|
||||||||||
|
2015
|
2014
|
2013
|
||||||||
|
Net profit attributable to owners of the parent
|
€
|
million
|
334
|
|
568
|
|
904
|
|
||
|
Weighted average number of shares outstanding
|
thousand
|
1,510,555
|
|
1,222,346
|
|
1,215,921
|
|
|||
|
Basic earnings per ordinary share
|
€
|
0.221
|
|
0.465
|
|
0.744
|
|
|||
|
For the Years Ended December 31,
|
||||||||||
|
2015
|
2014
|
2013
|
||||||||
|
Net profit from continuing operations attributable to owners of the parent
|
€
|
million
|
83
|
|
327
|
|
690
|
|
||
|
Weighted average number of shares outstanding
|
thousand
|
1,510,555
|
|
1,222,346
|
|
1,215,921
|
|
|||
|
Basic earnings per ordinary share from continuing operations
|
€
|
0.055
|
|
0.268
|
|
0.568
|
|
|||
|
For the Years Ended December 31,
|
||||||||||
|
2015
|
2014
|
2013
|
||||||||
|
Net profit from discontinued operations attributable to owners of the parent
|
€
|
million
|
251
|
|
241
|
|
214
|
|
||
|
Weighted average number of shares outstanding
|
thousand
|
1,510,555
|
|
1,222,346
|
|
1,215,921
|
|
|||
|
Basic earnings per ordinary share from discontinued operations
|
€
|
0.166
|
|
0.197
|
|
0.176
|
|
|||
Diluted earnings per share
In order to calculate the diluted earnings per share, the weighted average number of shares outstanding has been increased to take into consideration the theoretical effect of the potential common shares that would be issued for the restricted and performance share units outstanding and unvested at December 31, 2015 (Note
20
) as determined using the treasury stock method. For the years ended December 31, 2014 and 2013, the weighted average number of shares outstanding was increased to take into consideration the theoretical effect that would arise if all the share-based payment plans were exercised.
In addition, the weighted average number of shares outstanding has been increased to take into consideration the theoretical effect that would arise if the shares related to the mandatory convertible securities (Note
19
) were issued for the years ended December 31, 2015 and 2014. Based on FCA's share price, the minimum number of shares would have been issued had the mandatory convertible securities been converted at December 31, 2015. As such, there was no difference between the basic and diluted earnings per share for the year ended December 31, 2015 in respect of the mandatory convertible securities.
There were no instruments excluded from the calculation of diluted earnings per share for the periods presented because of an anti-dilutive impact.
F - 45
The following table provides the amounts used in the calculation of diluted earnings per share for the years ended
December 31, 2015
,
2014
and
2013
:
|
For the Years Ended December 31,
|
||||||||||
|
2015
|
2014
|
2013
|
||||||||
|
Net profit attributable to owners of the parent
|
€
|
million
|
334
|
|
568
|
|
904
|
|
||
|
Weighted average number of shares outstanding
|
thousand
|
1,510,555
|
|
1,222,346
|
|
1,215,921
|
|
|||
|
Number of shares deployable for share-based compensation
|
thousand
|
3,452
|
|
11,204
|
|
13,005
|
|
|||
|
Dilutive effect of Mandatory Convertible Securities
|
thousand
|
—
|
|
547
|
|
—
|
|
|||
|
Weighted average number of shares outstanding for
diluted earnings per share
|
thousand
|
1,514,007
|
|
1,234,097
|
|
1,228,926
|
|
|||
|
Diluted earnings per ordinary share
|
€
|
0.221
|
|
0.460
|
|
0.736
|
|
|||
|
For the Years Ended December 31,
|
||||||||||
|
2015
|
2014
|
2013
|
||||||||
|
Net profit from continuing operations attributable to owners of the parent
|
€
|
million
|
83
|
|
327
|
|
690
|
|
||
|
Weighted average number of shares outstanding for
diluted earnings per share
|
thousand
|
1,514,007
|
|
1,234,097
|
|
1,228,926
|
|
|||
|
Diluted earnings per ordinary share from continuing operations
|
€
|
0.055
|
|
0.265
|
|
0.562
|
|
|||
|
For the Years Ended December 31,
|
||||||||||
|
2015
|
2014
|
2013
|
||||||||
|
Net profit from discontinued operations attributable to owners of the parent
|
€
|
million
|
251
|
|
241
|
|
214
|
|
||
|
Weighted average number of shares outstanding for
diluted earnings per share
|
thousand
|
1,514,007
|
|
1,234,097
|
|
1,228,926
|
|
|||
|
Diluted earnings per ordinary share from discontinued operations
|
€
|
0.166
|
|
0.195
|
|
0.174
|
|
|||
(
10
) Goodwill and intangible assets with indefinite useful lives
Goodwill and intangible assets with indefinite useful lives at
December 31, 2015
and
December 31, 2014
are summarized below:
|
Balance at January 1, 2015
|
Change in the
scope of consolidation |
Translation
differences |
Transfer to Assets held for distribution
|
Balance at December 31, 2015
|
||||||||||
|
Gross amount
|
11,501
|
|
54
|
|
1,198
|
|
(787
|
)
|
11,966
|
|
||||
|
Accumulated impairment losses
|
(442
|
)
|
—
|
|
(28
|
)
|
1
|
|
(469
|
)
|
||||
|
Goodwill
|
11,059
|
|
54
|
|
1,170
|
|
(786
|
)
|
11,497
|
|
||||
|
Brands
|
2,953
|
|
—
|
|
340
|
|
—
|
|
3,293
|
|
||||
|
Total Goodwill and intangible assets with indefinite useful lives
|
14,012
|
|
54
|
|
1,510
|
|
(786
|
)
|
14,790
|
|
||||
F - 46
|
Balance at
January 1, 2014
|
Translation
differences |
Balance at
December 31, 2014
|
||||||
|
( € million)
|
||||||||
|
Gross amount
|
10,283
|
|
1,218
|
|
11,501
|
|
||
|
Accumulated impairment losses
|
(443
|
)
|
1
|
|
(442
|
)
|
||
|
Goodwill
|
9,840
|
|
1,219
|
|
11,059
|
|
||
|
Brands
|
2,600
|
|
353
|
|
2,953
|
|
||
|
Total Goodwill and intangible assets with indefinite useful lives
|
12,440
|
|
1,572
|
|
14,012
|
|
||
Foreign exchange effects in
2015
and in
2014
amounted to
€1,510 million
and
€1,572 million
, respectively, and arose mainly from changes in the U.S.$/Euro rate.
Brands
Brands are composed of the Chrysler, Jeep, Dodge, Ram and Mopar brands which resulted from the acquisition of FCA US. These rights are protected legally through registration with government agencies and through the continuous use in commerce. As these rights have no legal, contractual, competitive or economic term that limits their useful lives, they are classified as intangible assets with indefinite useful lives, and are therefore not amortized but are instead tested annually for impairment.
For the purpose of impairment testing, the carrying value of Brands, which is allocated to the NAFTA segment, is tested jointly with the Goodwill allocated to the NAFTA segment.
Goodwill
At
December 31, 2015
, goodwill included
€11,359 million
from the acquisition of FCA US (
€10,185 million
at December 31,
2014
). At December 31, 2015,
€786 million
of goodwill related to Ferrari has been classified within Assets held for distribution as a result of Ferrari meeting the held for sale criteria noted within IFRS 5 -
Non-current Assets Held for Sale and Discontinued Operations
on December 3, 2015 (refer to the section —
Principal Activities
above).
There were no impairment charges recognized in respect of goodwill and intangible assets with indefinite lives during the years ended December 31, 2015, 2014 and 2013.
The following table presents the allocation of Goodwill across our reportable segments:
|
At December 31,
|
|||||
|
2015
|
2014
|
||||
|
( € million)
|
|||||
|
NAFTA
|
9,312
|
|
8,350
|
|
|
|
APAC
|
1,210
|
|
1,085
|
|
|
|
LATAM
|
583
|
|
517
|
|
|
|
EMEA
|
276
|
|
233
|
|
|
|
Ferrari
(1)
|
—
|
|
786
|
|
|
|
Components
|
62
|
|
52
|
|
|
|
Other activities
|
54
|
|
36
|
|
|
|
Total Goodwill
|
11,497
|
|
11,059
|
|
|
_________________________
(1) Goodwill related to Ferrari was reclassified to Assets held for distribution; refer to the section - Principal Activities above
F - 47
(
11
) Other intangible assets
|
Externally
acquired development costs |
Development
costs internally generated |
Patents,
concessions, licenses and credits |
Other
intangible assets |
Total
|
||||||||||
|
( € million)
|
||||||||||||||
|
Gross carrying amount at January 1, 2014
|
6,859
|
|
4,654
|
|
2,285
|
|
621
|
|
14,419
|
|
||||
|
Additions
|
1,542
|
|
725
|
|
350
|
|
89
|
|
2,706
|
|
||||
|
Divestitures
|
(8
|
)
|
(36
|
)
|
(38
|
)
|
(6
|
)
|
(88
|
)
|
||||
|
Translation differences and other changes
|
239
|
|
168
|
|
207
|
|
4
|
|
618
|
|
||||
|
Balance at December 31, 2014
|
8,632
|
|
5,511
|
|
2,804
|
|
708
|
|
17,655
|
|
||||
|
Additions
|
1,459
|
|
1,200
|
|
247
|
|
130
|
|
3,036
|
|
||||
|
Divestitures
|
—
|
|
(46
|
)
|
(12
|
)
|
(10
|
)
|
(68
|
)
|
||||
|
Translation differences and other changes
|
430
|
|
(178
|
)
|
212
|
|
(72
|
)
|
392
|
|
||||
|
Transfer to Assets held for distribution
|
(1,259
|
)
|
—
|
|
(131
|
)
|
(55
|
)
|
(1,445
|
)
|
||||
|
Balance at December 31, 2015
|
9,262
|
|
6,487
|
|
3,120
|
|
701
|
|
19,570
|
|
||||
|
Accumulated amortization and impairment losses
Balance at January 1, 2014 |
3,165
|
|
2,678
|
|
1,086
|
|
416
|
|
7,345
|
|
||||
|
Amortization
|
648
|
|
409
|
|
225
|
|
49
|
|
1,331
|
|
||||
|
Impairment losses and asset write-offs
|
46
|
|
36
|
|
—
|
|
—
|
|
82
|
|
||||
|
Divestitures
|
(6
|
)
|
(30
|
)
|
(33
|
)
|
(4
|
)
|
(73
|
)
|
||||
|
Translation differences and other changes
|
(84
|
)
|
152
|
|
59
|
|
8
|
|
135
|
|
||||
|
Balance at December 31, 2014
|
3,769
|
|
3,245
|
|
1,337
|
|
469
|
|
8,820
|
|
||||
|
Amortization
|
857
|
|
452
|
|
301
|
|
54
|
|
1,664
|
|
||||
|
Impairment losses and asset write-offs
|
187
|
|
34
|
|
—
|
|
2
|
|
223
|
|
||||
|
Divestitures
|
—
|
|
(34
|
)
|
(11
|
)
|
(9
|
)
|
(54
|
)
|
||||
|
Translation differences and other changes
|
165
|
|
(80
|
)
|
73
|
|
(39
|
)
|
119
|
|
||||
|
Transfer to Assets held for distribution
|
(985
|
)
|
—
|
|
(117
|
)
|
(46
|
)
|
(1,148
|
)
|
||||
|
Balance at December 31, 2015
|
3,993
|
|
3,617
|
|
1,583
|
|
431
|
|
9,624
|
|
||||
|
Carrying amount at December 31, 2014
|
4,863
|
|
2,266
|
|
1,467
|
|
239
|
|
8,835
|
|
||||
|
Carrying amount at December 31, 2015
|
5,269
|
|
2,870
|
|
1,537
|
|
270
|
|
9,946
|
|
||||
Additions of €
3,036 million
in
2015
(€
2,706 million
in
2014
) included development costs of €
2,659 million
(€
2,267 million
in
2014
), consisting primarily of material costs and personnel related expenses relating to engineering, design and development focused on content enhancement of existing vehicles, new models and powertrain programs, as well as the investment for the development of Alfa Romeo vehicles. Of the €
223 million
impairment losses and asset write-offs in 2015, €176 million related to the impairment of capitalized development costs that had no future economic benefit as a result of the Group's plan to realign
a portion of its manufacturing capacity in NAFTA to better meet market demand for Ram pickups and Jeep vehicles
within the Group's existing plant infrastructure
.
Translation differences principally reflect foreign exchange gains of
€298 million
in
2015
and
€482 million
in
2014
primarily related to foreign currency translation of the U.S.$ to the Euro.
Refer to Note
4
for information about the write-down of certain capitalized development costs.
F - 48
(
12
) Property, plant and equipment
|
Land
|
Industrial
buildings |
Plant, machinery and equipment
|
Other
assets |
Advances and
tangible assets in progress |
Total
|
||||||||||||
|
(€ million)
|
|||||||||||||||||
|
Gross carrying amount at January 1, 2014
|
880
|
|
7,035
|
|
38,405
|
|
2,037
|
|
2,284
|
|
50,641
|
|
|||||
|
Additions
|
14
|
|
766
|
|
2,877
|
|
292
|
|
1,466
|
|
5,415
|
|
|||||
|
Divestitures
|
(7
|
)
|
(94
|
)
|
(1,248
|
)
|
(37
|
)
|
(2
|
)
|
(1,388
|
)
|
|||||
|
Translation differences
|
35
|
|
316
|
|
1,586
|
|
168
|
|
132
|
|
2,237
|
|
|||||
|
Other changes
|
23
|
|
2
|
|
867
|
|
62
|
|
(969
|
)
|
(15
|
)
|
|||||
|
Balance at December 31, 2014
|
945
|
|
8,025
|
|
42,487
|
|
2,522
|
|
2,911
|
|
56,890
|
|
|||||
|
Additions
|
3
|
|
534
|
|
3,262
|
|
302
|
|
2,047
|
|
6,148
|
|
|||||
|
Divestitures
|
(4
|
)
|
(40
|
)
|
(1,126
|
)
|
(62
|
)
|
(6
|
)
|
(1,238
|
)
|
|||||
|
Translation differences
|
(27
|
)
|
(64
|
)
|
231
|
|
99
|
|
(127
|
)
|
112
|
|
|||||
|
Other changes
|
6
|
|
(30
|
)
|
758
|
|
11
|
|
(704
|
)
|
41
|
|
|||||
|
Transfer to Assets held for distribution
|
(23
|
)
|
(317
|
)
|
(1,704
|
)
|
(138
|
)
|
(35
|
)
|
(2,217
|
)
|
|||||
|
Balance at December 31, 2015
|
900
|
|
8,108
|
|
43,908
|
|
2,734
|
|
4,086
|
|
59,736
|
|
|||||
|
Accumulated depreciation and
impairment losses at January 1, 2014 |
7
|
|
2,394
|
|
23,918
|
|
1,078
|
|
11
|
|
27,408
|
|
|||||
|
Depreciation
|
—
|
|
266
|
|
3,099
|
|
201
|
|
—
|
|
3,566
|
|
|||||
|
Divestitures
|
(2
|
)
|
(87
|
)
|
(1,219
|
)
|
(33
|
)
|
—
|
|
(1,341
|
)
|
|||||
|
Impairment losses and asset write-offs
|
—
|
|
6
|
|
27
|
|
—
|
|
—
|
|
33
|
|
|||||
|
Translation differences
|
—
|
|
57
|
|
653
|
|
61
|
|
—
|
|
771
|
|
|||||
|
Other changes
|
2
|
|
10
|
|
19
|
|
9
|
|
5
|
|
45
|
|
|||||
|
Balance at December 31, 2014
|
7
|
|
2,646
|
|
26,497
|
|
1,316
|
|
16
|
|
30,482
|
|
|||||
|
Depreciation
|
—
|
|
309
|
|
3,453
|
|
262
|
|
—
|
|
4,024
|
|
|||||
|
Divestitures
|
—
|
|
(31
|
)
|
(1,091
|
)
|
(53
|
)
|
(2
|
)
|
(1,177
|
)
|
|||||
|
Impairment losses and asset write-offs
|
1
|
|
11
|
|
474
|
|
3
|
|
1
|
|
490
|
|
|||||
|
Translation differences
|
(1
|
)
|
(14
|
)
|
3
|
|
19
|
|
(1
|
)
|
6
|
|
|||||
|
Other changes
|
37
|
|
(26
|
)
|
39
|
|
(2
|
)
|
(1
|
)
|
47
|
|
|||||
|
Transfer to Assets held for distribution
|
—
|
|
(113
|
)
|
(1,375
|
)
|
(102
|
)
|
—
|
|
(1,590
|
)
|
|||||
|
Balance at December 31, 2015
|
44
|
|
2,782
|
|
28,000
|
|
1,443
|
|
13
|
|
32,282
|
|
|||||
|
Carrying amount at December 31, 2014
|
938
|
|
5,379
|
|
15,990
|
|
1,206
|
|
2,895
|
|
26,408
|
|
|||||
|
Carrying amount at December 31, 2015
|
856
|
|
5,326
|
|
15,908
|
|
1,291
|
|
4,073
|
|
27,454
|
|
|||||
Additions of €
6,148 million
in
2015
(€
5,415 million
in
2014
) were primarily related to the mass-market vehicle operations in the NAFTA segment, as well as for the construction of the plant in Pernambuco (Brazil).
In
2015
, of the total €
490 million
of impairment losses and asset write-offs, €422 million related to the realignment of
a portion of the Group's manufacturing capacity in NAFTA to better meet market demand
. For the year ended December 31,
2014
, €25 million of impairment losses related to the EMEA segment for certain powertrains that were abandoned.
In
2015
, translation differences of €
106 million
mainly reflected the strengthening of the U.S.$ against the Euro, which was partially offset by the devaluation of the Brazilian Real. In 2014, translation differences of €
1,466 million
mainly reflected the strengthening of the U.S.$ against the Euro.
F - 49
The net carrying amount of assets leased under finance lease agreements includes assets that are legally owned by suppliers but are recognized in the Consolidated Financial Statements in accordance with IFRIC 4
- Determining Whether an Arrangement Contains a Lease,
with the corresponding recognition of a financial lease payable. The total net carrying amount of assets leased under finance lease agreements included in Property, plant and equipment (excluding FCA US) were as follows:
|
At December 31,
|
|||||
|
2015
|
2014
|
||||
|
(€ million)
|
|||||
|
Industrial buildings
|
81
|
|
84
|
|
|
|
Plant machinery and equipment
|
298
|
|
299
|
|
|
|
Property, plant and equipment
|
379
|
|
383
|
|
|
The net carrying amount of assets leased under finance lease agreements for FCA US was €470 million and €414 million at December 31, 2015 and 2014, respectively.
Property, plant and equipment of the Group (excluding FCA US) reported as pledged as security for debt are summarized as follows:
|
At December 31,
|
|||||
|
2015
|
2014
|
||||
|
(€ million)
|
|||||
|
Land and industrial buildings pledged as security for debt
|
934
|
|
1,019
|
|
|
|
Plant and machinery pledged as security for debt and other commitments
|
462
|
|
648
|
|
|
|
Other assets pledged as security for debt and other commitments
|
4
|
|
3
|
|
|
|
Property, plant and equipment pledged as security for debt
|
1,400
|
|
1,670
|
|
|
Information on the assets of FCA US subject to lien are set out in Note
23
.
At
December 31, 2015
and 2014, the Group had contractual commitments for the purchase of Property, plant and equipment amounting to
€1,665 million
and
€2,263 million
, respectively.
F - 50
(
13
) Investments and other financial assets
The following table summarizes our Investments and other financial assets:
|
At December 31,
|
|||||
|
2015
|
2014
|
||||
|
( € million)
|
|||||
|
Interest in joint ventures
|
1,528
|
|
1,329
|
|
|
|
Interest in associates
|
80
|
|
105
|
|
|
|
Interest in unconsolidated subsidiaries
|
50
|
|
37
|
|
|
|
Equity method investments
|
1,658
|
|
|
1,471
|
|
|
Available-for-sale investments
|
203
|
|
124
|
|
|
|
Investments at fair value
|
203
|
|
124
|
|
|
|
Other investments measured at cost
|
64
|
|
59
|
|
|
|
Total Investments
|
1,925
|
|
1,654
|
|
|
|
Non-current financial receivables
|
271
|
|
296
|
|
|
|
Other securities and other financial assets
|
46
|
|
70
|
|
|
|
Total Investments and other financial assets
|
2,242
|
|
|
2,020
|
|
Our ownership percentages and carrying value of our investments accounted for under the equity method were as follows:
|
Ownership Percentage
|
Investment balance
|
|||||||
|
At December 31, 2015
|
At December 31, 2014
|
At December 31, 2015
|
At December 31, 2014
|
|||||
|
( € million)
|
||||||||
|
Interest in Joint Ventures
|
||||||||
|
FCA Bank S.p.A. (“FCA Bank”)
|
50%
|
50%
|
985
|
|
894
|
|
||
|
Tofas-Turk Otomobil Fabrikasi A.S. (“Tofas”)
|
37.9%
|
37.9%
|
305
|
|
299
|
|
||
|
GAC FIAT Chrysler Automobiles Co.
|
50%
|
50%
|
145
|
|
45
|
|
||
|
Others
|
93
|
|
91
|
|
||||
|
Total Interest in Joint Ventures
|
1,528
|
|
1,329
|
|
||||
|
Interest in Associates
|
||||||||
|
RCS MediaGroup S.p.A. (“RCS”)
|
16.7%
|
16.7%
|
51
|
|
74
|
|
||
|
Others
|
29
|
|
31
|
|
||||
|
Total Interest in Associates
|
80
|
|
105
|
|
||||
FCA Bank, which is a joint venture with Crédit Agricole Consumer Finance S.A. FCA Bank operates in 16 European countries including Italy, France, Germany, UK and Spain. In July 2013, the Group reached an agreement with Crédit Agricole to extend the term of the joint venture through to December 31, 2021. Under the agreement, FCA Bank will continue to benefit from the financial support of the Crédit Agricole Group while continuing to strengthen its position as an active player in the securitization and debt markets. FCA Bank provides retail and dealer financing and long-term rental services in the automotive sector, directly or through its subsidiaries as a partner of the Group's mass-market vehicle brands and for Maserati and Ferrari vehicles.
Tofas, which is registered with the Turkish Capital Market Board, is listed on the İstanbul Stock Exchange. At
December 31, 2015
, the fair value of the Group’s interest in Tofas was
€1,129 million
(
€1,076 million
at
December 31, 2014
). In addition, at
December 31, 2015
, the fair value of the Group’s interest in RCS, which is a company listed on the MTA, was
€54 million
(
€81 million
at
December 31, 2014
).
F - 51
The Group's proportionate share of the earnings of our joint ventures, associates and interest in unconsolidated subsidiaries accounted for using the equity method is reflected within Result from investments within the Consolidated Income Statement. The following table summarizes information relating to Results from investments:
|
For the Years Ended December 31,
|
||||||||
|
2015
|
2014
|
2013
|
||||||
|
(€ million)
|
||||||||
|
Joint Ventures
|
155
|
|
127
|
|
112
|
|
||
|
Associates
|
(27
|
)
|
(20
|
)
|
(42
|
)
|
||
Immaterial Joint Ventures and Associates
The aggregate amounts for the Group’s share in all individually immaterial joint ventures and associates that are accounted for using the equity method were as follows:
|
For the Years Ended December 31,
|
||||||||
|
2015
|
2014
|
2013
|
||||||
|
(€ million)
|
||||||||
|
Joint Ventures:
|
||||||||
|
Profit from continuing operations
|
31
|
|
36
|
|
27
|
|
||
|
Net profit
|
31
|
|
36
|
|
27
|
|
||
|
Other comprehensive income/(loss)
|
(30
|
)
|
37
|
|
(90
|
)
|
||
|
Total other comprehensive income/(loss)
|
1
|
|
73
|
|
(63
|
)
|
||
|
Associates:
|
||||||||
|
Loss from continuing operations
|
(27
|
)
|
(20
|
)
|
(42
|
)
|
||
|
Net loss
|
(27
|
)
|
(20
|
)
|
(42
|
)
|
||
|
Other comprehensive income/(loss)
|
3
|
|
3
|
|
2
|
|
||
|
Total other comprehensive income/(loss)
|
(24
|
)
|
(17
|
)
|
(40
|
)
|
||
Investments at fair value
At
December 31, 2015
and 2014, the Available-for-sale investments primarily related to the investment in CNHI, which consisted of
15,948,275
common shares for an amount of
€101 million
and €
107 million
, respectively. In addition, at
December 31, 2015
and 2014, the Group had an additional 15,948,275 special voting shares which cannot directly or indirectly be sold, disposed of or transferred, and over which the Group cannot create or permit to exist any pledge, lien, fixed or floating charge or other encumbrance. These special voting shares do not have any dividend right and they will expire when the common shares referenced above are sold. As a result, no value has been attributed to these special voting shares. The total investment in CNHI corresponded to
1.7
percent of voting rights at
December 31, 2015
and
December 31, 2014
, respectively.
(
14
) Inventories
|
At December 31,
|
|||||
|
2015
|
2014
|
||||
|
( € million)
|
|||||
|
Raw materials, supplies and finished goods
|
11,190
|
|
10,294
|
|
|
|
Gross amount due from customers for contract work
|
161
|
|
155
|
|
|
|
Total Inventories
|
11,351
|
|
10,449
|
|
|
F - 52
Inventories at December 31, 2015
increase
d by €
902 million
from December 31, 2014 as a result of a higher level of finished products to support increased demand in the NAFTA and EMEA segments in addition to positive translation differences primarily related to the strengthening of the U.S.$ against the Euro.
The amount of inventory write-downs recognized within Cost of sales during the years ended December 31,
2015
and 2014 was
€653 million
and €436 million, respectively.
The amount due from customers for contract work relates to the design and production of industrial automation systems and related products for the automotive sector at
December 31, 2015
and
2014
was as follows:
|
At December 31,
|
|||||
|
2015
|
2014
|
||||
|
( € million)
|
|||||
|
Aggregate amount of costs incurred and recognized profits (less recognized losses) to date
|
2,097
|
|
1,817
|
|
|
|
Less: Progress billings
|
(2,163
|
)
|
(1,914
|
)
|
|
|
Construction contracts, net of advances on contract work
|
(66
|
)
|
(97
|
)
|
|
|
Gross amount due from customers for contract work as an asset
|
161
|
|
155
|
|
|
|
Less: Gross amount due to customers for contract work as a liability included in Other
current liabilities (Note 24) |
(227
|
)
|
(252
|
)
|
|
|
Construction contracts, net of advances on contract work
|
(66
|
)
|
(97
|
)
|
|
(
15
) Receivables and Other current assets
The composition of receivables and other current assets was as follows:
|
At December 31,
|
|||||
|
2015
|
2014
|
||||
|
( € million)
|
|||||
|
Trade receivables
|
2,668
|
|
|
2,564
|
|
|
Receivables from financing activities
|
2,006
|
|
|
3,843
|
|
|
Current tax receivables
|
405
|
|
|
328
|
|
|
Other current assets:
|
|||||
|
Other current receivables
|
2,386
|
|
|
2,246
|
|
|
Accrued income and prepaid expenses
|
692
|
|
515
|
|
|
|
Total Other current assets
|
3,078
|
|
|
2,761
|
|
|
Total receivables and other current assets
|
8,157
|
|
9,496
|
|
|
The analysis by due date (excluding Accrued income and prepaid expenses) was as follows:
F - 53
|
At December 31,
|
|||||||||||||||||||||||
|
2015
|
2014
|
||||||||||||||||||||||
|
Due within one year
|
Due between one and five years
|
Due beyond
five years
|
Total
|
Due within one year
|
Due between one and five years
|
Due beyond
five years |
Total
|
||||||||||||||||
|
(€ million)
|
|||||||||||||||||||||||
|
Trade receivables
|
2,651
|
|
16
|
|
1
|
|
2,668
|
|
2,564
|
|
—
|
|
—
|
|
2,564
|
|
|||||||
|
Receivables from financing activities
|
1,778
|
|
228
|
|
—
|
|
2,006
|
|
3,013
|
|
776
|
|
54
|
|
3,843
|
|
|||||||
|
Current tax receivables
|
307
|
|
58
|
|
40
|
|
405
|
|
284
|
|
7
|
|
37
|
|
328
|
|
|||||||
|
Other current receivables
|
2,129
|
|
243
|
|
14
|
|
2,386
|
|
2,076
|
|
156
|
|
14
|
|
2,246
|
|
|||||||
|
Total receivables
|
6,865
|
|
545
|
|
55
|
|
7,465
|
|
7,937
|
|
939
|
|
105
|
|
8,981
|
|
|||||||
Trade receivables
Trade receivables, amounting to €
2,668 million
at
December 31, 2015
(€
2,564 million
at
December 31, 2014
), are shown net of the allowance for doubtful accounts of €
303 million
at
December 31, 2015
(€
320 million
at
December 31, 2014
). At December 31, 2015 a total of €98 million of trade receivables, net of an allowance for doubtful accounts, related to Ferrari were classified within Assets held for distribution.
Changes in the allowance for doubtful accounts, which is calculated on the basis of historical losses on receivables, were as follows:
|
At January 1, 2015
|
Provision
|
Use and
other changes |
Transfer to Assets held for distribution
|
At December 31, 2015
|
||||||||||
|
(€ million)
|
||||||||||||||
|
Allowance for doubtful accounts
|
320
|
|
46
|
|
(42
|
)
|
(21
|
)
|
303
|
|
||||
|
At January 1, 2014
|
Provision
|
Use and
other changes |
At December 31, 2014
|
||||||||
|
(€ million)
|
|||||||||||
|
Allowance for doubtful accounts
|
344
|
|
33
|
|
(57
|
)
|
320
|
|
|||
Receivables from financing activities
Receivables from financing activities mainly relate to the business of financial services companies fully consolidated by the Group and are summarized as follows.
|
At December 31,
|
|||||
|
2015
|
2014
|
||||
|
( € million)
|
|||||
|
Dealer financing
|
1,650
|
|
2,313
|
|
|
|
Retail financing
|
238
|
|
1,039
|
|
|
|
Finance leases
|
8
|
|
349
|
|
|
|
Other
|
110
|
|
142
|
|
|
|
Total Receivables from financing activities
|
2,006
|
|
|
3,843
|
|
F - 54
At December 31, 2015, a total of €
1,176 million
of receivables from financing activities, net of an allowance for doubtful accounts, related to Ferrari were classified within Assets held for distribution.
Receivables from financing activities are shown net of an allowance for doubtful accounts determined on the basis of specific insolvency risks. At
December 31, 2015
, the allowance for doubtful accounts amounted to €
40 million
(€
73 million
at
December 31, 2014
). Changes in the allowance for receivables from financing activities were as follows:
|
At January 1, 2015
|
Provision
|
Use and
other changes |
Transfer to Assets held for distribution
|
At December 31, 2015
|
||||||||||
|
(€ million)
|
||||||||||||||
|
Allowance for Receivables from financing activities
|
73
|
|
64
|
|
(78
|
)
|
(19
|
)
|
40
|
|
||||
|
At January 1, 2014
|
Provision
|
Use and
other changes |
At December 31, 2014
|
||||||||
|
(€ million)
|
|||||||||||
|
Allowance for Receivables from financing activities
|
119
|
|
69
|
|
(115
|
)
|
73
|
|
|||
Receivables for dealer financing are typically generated by sales of vehicles and are generally managed under dealer network financing programs as a component of the portfolio of the financial services companies. These receivables are interest bearing, with the exception of an initial limited, non-interest bearing period. The contractual terms governing the relationships with the dealer networks vary from country to country, although payment terms range from two to six months.
Finance lease receivables refer to vehicles and other assets leased under finance lease arrangements, mainly from the Maserati segment. Finance lease receivables by due date are as follows (gross of an allowance of
€1 million
at
December 31, 2015
and
€10 million
at
December 31, 2014
):
|
At December 31,
|
|||||||||||||||||||||||
|
2015
|
2014
|
||||||||||||||||||||||
|
Due within
one year |
Due between one and five years
|
Due beyond five years
|
Total
|
Due within
one year |
Due between one and five years
|
Due beyond five years
|
Total
|
||||||||||||||||
|
(€ million)
|
|||||||||||||||||||||||
|
Receivables for future minimum lease payments
|
6
|
|
1
|
|
2
|
|
9
|
|
110
|
|
281
|
|
8
|
|
399
|
|
|||||||
|
Less: unrealized interest income
|
—
|
|
—
|
|
—
|
|
—
|
|
(16
|
)
|
(24
|
)
|
—
|
|
(40
|
)
|
|||||||
|
Present value of future minimum lease payments
|
6
|
|
1
|
|
2
|
|
9
|
|
94
|
|
257
|
|
8
|
|
359
|
|
|||||||
Other current assets
At
December 31, 2015
, Other current assets mainly consisted of Other tax receivables for VAT and other indirect taxes of
€1,529 million
(
€1,430 million
at
December 31, 2014
), Receivables from employees of
€126 million
(
€151 million
at
December 31, 2014
) and Accrued income and prepaid expenses of
€692 million
(
€515 million
at
December 31, 2014
).
Transfer of financial assets
At
December 31, 2015
, the Group had receivables due after that date which had been transferred without recourse and which were derecognized in accordance with IAS 39 amounting to
€4,950 million
(
€4,511 million
at
December 31, 2014
). The transfers related to trade receivables and other receivables for
€4,165 million
(
€3,676 million
at
December 31, 2014
) and financial receivables for
€785 million
(
€835 million
at
December 31, 2014
). These amounts included receivables of
€3,022 million
(
€2,611 million
at
December 31, 2014
), mainly due from the sales network, transferred to jointly controlled financial services companies (FCA Bank).
F - 55
At
December 31, 2015
and
2014
, the carrying amount of transferred financial assets not derecognized and the related liabilities were as follows:
|
At December 31,
|
|||||||||||||||||||||||
|
2015
|
2014
|
||||||||||||||||||||||
|
Trade receivables
|
Receivables
from
financing
activities |
Current tax
receivables |
Total
|
Trade
receivables
|
Receivables
from
financing
activities |
Current tax
receivables |
Total
|
||||||||||||||||
|
(€ million)
|
|||||||||||||||||||||||
|
Carrying amount of assets transferred and not derecognized
|
22
|
|
184
|
|
—
|
|
206
|
|
37
|
|
407
|
|
25
|
|
469
|
|
|||||||
|
Carrying amount of the related liabilities
|
22
|
|
184
|
|
—
|
|
206
|
|
37
|
|
407
|
|
25
|
|
469
|
|
|||||||
(
16
) Current securities
Current securities consisted of short-term or marketable securities which represent temporary investments, but which do not satisfy all the requirements to be classified as cash equivalents.
|
At December 31,
|
|||||
|
2015
|
2014
|
||||
|
(€ million)
|
|||||
|
Current securities available-for-sale
|
269
|
|
30
|
|
|
|
Current securities held-for-trading
|
213
|
|
180
|
|
|
|
Total current securities
|
482
|
|
|
210
|
|
F - 56
(
17
) Other financial assets and Other financial liabilities
These line items mainly consist of fair value measurement of derivative financial instruments. They also include some collateral deposits (held in connection with derivative transactions and debt obligations).
|
At December 31,
|
|||||||||||
|
2015
|
2014
|
||||||||||
|
Positive fair
value |
Negative fair
value |
Positive fair
value |
Negative fair
value |
||||||||
|
(€ million)
|
|||||||||||
|
Fair value hedges:
|
|||||||||||
|
Interest rate risk - interest rate swaps
|
58
|
|
(3
|
)
|
82
|
|
—
|
|
|||
|
Interest rate and exchange rate risk - combined interest rate
and currency swaps |
—
|
|
(96
|
)
|
—
|
|
(41
|
)
|
|||
|
Total Fair value hedges
|
58
|
|
(99
|
)
|
82
|
|
(41
|
)
|
|||
|
Cash flow hedges:
|
|||||||||||
|
Currency risks - forward contracts, currency swaps and
currency options |
287
|
|
(376
|
)
|
222
|
|
(467
|
)
|
|||
|
Interest rate risk - interest rate swaps
|
1
|
|
—
|
|
1
|
|
(4
|
)
|
|||
|
Interest rate and currency risk - combined interest rate and
currency swaps |
127
|
|
(1
|
)
|
60
|
|
(7
|
)
|
|||
|
Commodity price risk – commodity swaps and commodity options
|
—
|
|
(43
|
)
|
4
|
|
(16
|
)
|
|||
|
Total Cash flow hedges
|
415
|
|
(420
|
)
|
287
|
|
(494
|
)
|
|||
|
Derivatives for trading
|
340
|
|
(217
|
)
|
108
|
|
(213
|
)
|
|||
|
Fair value of derivative instruments
|
813
|
|
(736
|
)
|
477
|
|
(748
|
)
|
|||
|
Collateral deposits
|
40
|
|
—
|
|
38
|
|
—
|
|
|||
|
Other financial assets/(liabilities)
|
853
|
|
|
(736
|
)
|
|
515
|
|
|
(748
|
)
|
The overall change in Other financial assets (from €
515 million
at
December 31, 2014
to €
853 million
at
December 31, 2015
) and in Other financial liabilities (from €
748 million
at
December 31, 2014
to €
736 million
at
December 31, 2015
) was mostly due to fluctuations in exchange rates, interest rates, commodity prices during the year and the settlement of the instruments which matured during the year ended December 31, 2015.
As Other financial assets and liabilities primarily consist of hedging derivatives, the change in their value is compensated by the change in the value of the hedged items.
At
December 31, 2015
and 2014, Derivatives for trading primarily consisted of derivative contracts entered for hedging purposes which do not qualify for hedge accounting and one embedded derivative in a bond issue in which the yield is determined as a function of trends in the inflation rate and related hedging derivative, which converts the exposure to floating rate (the total value of the embedded derivative is offset by the value of the hedging derivative).
F - 57
The following table summarizes the outstanding notional amounts of the Group's derivative financial instruments by due date:
|
At December 31,
|
|||||||||||||||||||||||
|
2015
|
2014
|
||||||||||||||||||||||
|
Due within
one year |
Due between
one and five years |
Due beyond
five years |
Total
|
Due within
one year |
Due between
one and five years |
Due
beyond five years |
Total
|
||||||||||||||||
|
(€ million)
|
|||||||||||||||||||||||
|
Currency risk management
|
18,769
|
|
363
|
|
—
|
|
19,132
|
|
15,328
|
|
2,544
|
|
—
|
|
17,872
|
|
|||||||
|
Interest rate risk management
|
264
|
|
1,448
|
|
—
|
|
1,712
|
|
172
|
|
1,656
|
|
—
|
|
1,828
|
|
|||||||
|
Interest rate and currency risk management
|
1,380
|
|
1,178
|
|
65
|
|
2,623
|
|
698
|
|
1,513
|
|
—
|
|
2,211
|
|
|||||||
|
Commodity price risk management
|
517
|
|
31
|
|
—
|
|
548
|
|
483
|
|
59
|
|
—
|
|
542
|
|
|||||||
|
Other derivative financial instruments
|
—
|
|
—
|
|
14
|
|
14
|
|
—
|
|
—
|
|
14
|
|
14
|
|
|||||||
|
Total notional amount
|
20,930
|
|
3,020
|
|
79
|
|
24,029
|
|
16,681
|
|
5,772
|
|
14
|
|
22,467
|
|
|||||||
Cash flow hedges
The effects recognized in the Consolidated Income Statement mainly relate to currency risk management and, to a lesser extent, to hedges regarding commodity price risk management and the cash flows that are exposed to interest rate risk.
The Group's policy for managing currency risk normally requires hedging of projected future flows from trading activities which will occur within the following twelve months, and from orders acquired (or contracts in progress), regardless of their due dates. The hedging effect arising from this and recorded in the cash flow hedge reserve will be recognized in the Consolidated Income Statement, mainly during the following year.
Derivatives relating to interest rate and currency risk management are treated as cash flow hedges and are entered into for the purpose of hedging notes issued in foreign currencies. The amount recorded in the cash flow hedge reserve is recognized in the Consolidated Income Statement according to the timing of the flows of the underlying notes.
F - 58
With respect to cash flow hedges, the Group reclassified losses of €
221 million
during the year ended December 31, 2015 (losses of €
108 million
in
2014
and gains of €
178 million
in
2013
), net of the tax effect, from Other comprehensive income/(loss) to the Consolidated Income Statements. These items were reported in the following lines:
|
For the Years Ended December 31,
|
||||||||
|
2015
|
2014
|
2013
|
||||||
|
(€ million)
|
||||||||
|
Currency risk
|
||||||||
|
Increase in Net revenues
|
33
|
|
33
|
|
118
|
|
||
|
Decrease in Cost of sales
|
101
|
|
11
|
|
44
|
|
||
|
Net financial (expenses)/income
|
(148
|
)
|
(141
|
)
|
13
|
|
||
|
Result from investments
|
1
|
|
(13
|
)
|
17
|
|
||
|
Interest rate risk
|
||||||||
|
Increase in Cost of sales
|
(10
|
)
|
(2
|
)
|
(6
|
)
|
||
|
Result from investments
|
(2
|
)
|
(3
|
)
|
(4
|
)
|
||
|
Financial (expenses)
|
(77
|
)
|
(11
|
)
|
(10
|
)
|
||
|
Commodity price risk
|
||||||||
|
Increase in Cost of sales
|
(23
|
)
|
(2
|
)
|
(1
|
)
|
||
|
Ineffectiveness and discontinued hedges
|
1
|
|
5
|
|
4
|
|
||
|
Tax (income)/expense
|
(97
|
)
|
15
|
|
3
|
|
||
|
Total recognized in Net profit from continuing operations
|
(221
|
)
|
(108
|
)
|
178
|
|
||
|
Recognized in Profit from discontinued operations, net of tax
|
(116
|
)
|
2
|
|
12
|
|
||
|
Total recognized in Consolidated Income Statement
|
(337
|
)
|
(106
|
)
|
190
|
|
||
Fair value hedges
The gains and losses arising from the valuation of outstanding interest rate derivatives (for managing interest rate risk) and currency derivatives (for managing currency risk) recognized in accordance with fair value hedge accounting and the gains and losses arising from the respective hedged items are summarized in the following table:
|
For the Years Ended December 31,
|
||||||||
|
2015
|
2014
|
2013
|
||||||
|
(€ million)
|
||||||||
|
Currency risk
|
||||||||
|
Net gains/(losses) on qualifying hedges
|
(49
|
)
|
(53
|
)
|
19
|
|
||
|
Fair value changes in hedged items
|
49
|
|
53
|
|
(19
|
)
|
||
|
Interest rate risk
|
||||||||
|
Net (losses) on qualifying hedges
|
(34
|
)
|
(20
|
)
|
(28
|
)
|
||
|
Fair value changes in hedged items
|
34
|
|
20
|
|
29
|
|
||
|
Net gains
|
—
|
|
—
|
|
1
|
|
||
F - 59
(
18
) Cash and cash equivalents
The following table summarizes the Group's Cash and cash equivalents:
|
At December 31,
|
|||||
|
2015
|
2014
|
||||
|
(€ million)
|
|||||
|
Cash at banks
|
9,274
|
|
10,645
|
|
|
|
Money market securities
|
11,388
|
|
12,195
|
|
|
|
Total Cash and cash equivalents
|
20,662
|
|
|
22,840
|
|
Cash and cash equivalents includes cash at banks, units in money market funds and other money market securities, primarily comprised of commercial paper, bankers' acceptances and certificate of deposits that are readily convertible into cash, with original maturities of three months or less at the date of purchase. Cash and cash equivalents are subject to an insignificant risk of changes in value, and consist of balances spread across various primary national and international banking institutions, and money market instruments.
Cash at banks included bank deposits which may be used exclusively by Group companies entitled to perform specific operations (cash with a pre-determined use) amounting to
€3 million
at
December 31, 2015
and 2014.
The Group has a subsidiary operating in Venezuela with a U.S.$ functional currency. Pursuant to certain Venezuelan foreign currency exchange control regulations, the Central Bank of Venezuela centralizes all foreign currency transactions in the country. Under these regulations, the purchase and sale of foreign currency must be made through the Centro Nacional de Comercio Exterior en Venezuela from January 1, 2014. The cash and cash equivalents denominated in VEF amounted to
€9 million
(VEF
2,055 million
) at
December 31, 2015
and
€123 million
(VEF
1,785 million
) at
December 31, 2014
. The reduction, in Euro terms, was essentially due to the adoption of the SIMADI exchange rate for the conversion of the VEF denominated monetary items (see Note
30
for further discussion on Venezuelan currency regulations).
In addition, cash and cash equivalents held in certain foreign countries (primarily, China and Argentina) are subject to local exchange control regulations providing for restrictions on the amount of cash other than dividends that can leave the country.
(
19
) Equity
Consolidated shareholders’ equity at
December 31, 2015
increase
d by €
2,517 million
from
December 31, 2014
, primarily as a result of Net profit for the period of €
377 million
, the net proceeds received from the Ferrari IPO of €
866 million
, the increase in cumulative exchange differences on translating foreign operations of €923 million and the remeasurement of defined benefit plans of €
479 million
.
Consolidated shareholders’ equity at
December 31, 2014
increase
d by €
1,154 million
from
December 31, 2013
, mainly due to the issuance of mandatory convertible securities (described below) resulting in an increase of €1,910 million, the placement of 100,000,000 common shares (described below) resulting in an aggregate increase of €994 million, net profit for the period of €632 million and the increase in cumulative exchange differences on translating foreign operations of €782 million. The increase was partially offset by the decrease of €2,665 million arising from the acquisition of the 41.5 percent non-controlling interest in FCA US and the disbursement to Fiat shareholders who exercised the Cash Exit Rights.
Share capital
At
December 31, 2015
, fully paid-up share capital of FCA amounted to €
17 million
(€
17 million
at
December 31, 2014
) and consisted of
1,288,956,011
common shares and of
408,941,767
s
pecial voting shares, all with a par value of €0.01 each (1,284,919,505 common shares and 408,941,767
special voting shares, all with a par value of €0.01 each at December 31, 2014).
F - 60
On December 12, 2014, FCA issued 65,000,000 new common shares and sold 35,000,000 of treasury shares for aggregate net proceeds of U.S.$1,065 million (€849 million) comprised of gross proceeds of U.S.$1,100 million (€877 million) less U.S.$35 million (€28 million) of transaction costs.
On October 29, 2014, the Board of Directors of FCA resolved to authorize the issuance of up to a maximum of 90,000,000 common shares under the equity incentive plan and the long term incentive program, which had been adopted before the closing of the Merger and under which equity awards can be granted to eligible individuals. Any issuance of shares during the period from 2014 to 2018 are subject to the satisfaction of certain performance/retention requirements and any issuances to directors are subject to FCA shareholders' approval.
Treasury shares
There were no treasury shares held by FCA at
December 31, 2015
and
December 31, 2014
(see section -
Merger,
below).
Merger
As a result of the merger described in the section
Principle Activities—FCA Merger
above becoming effective on October 12, 2014:
|
•
|
of the 60,002,027 Fiat ordinary shares that were reacquired by Fiat, 6,085,630 shares were purchased by Fiat shareholders and 53,916,397 Fiat shares were canceled.
|
|
•
|
FCA was the surviving entity and all Fiat ordinary shares outstanding as of the Merger date (1,167,181,255 ordinary shares) were canceled and exchanged. FCA allotted one new FCA common share (each having a nominal value of €0.01) for each Fiat ordinary share (each having a nominal value of €3.58). The original investment of FCA in Fiat which consisted of 35,000,000 common shares was not canceled resulting in 35,000,000 treasury shares in FCA. On December 12, 2014, FCA completed the placement of these treasury shares on the market.
|
The following table provides a summary of the changes in ordinary shares primarily related to the Merger and the resulting outstanding ordinary shares of FCA at December 31, 2014.
|
Fiat S.p.A.
|
FCA
|
|||||||||||||||||||||||||
|
(in thousand)
|
At
December 31, 2013 |
Share-based payments and exercise of stock options
|
Cash Exit Rights
|
Cancellation of treasury shares upon the Merger
|
At the date of the Merger
|
FCA share capital at date of Merger
|
Issuance of FCA common shares and sale of treasury shares
|
Exercise of stock options
|
At
December 31, 2014 |
|||||||||||||||||
|
Shares issued
|
1,250,688
|
|
320
|
|
(53,916
|
)
|
(29,911
|
)
|
1,167,181
|
|
35,000
|
|
65,000
|
|
17,738
|
|
1,284,919
|
|
||||||||
|
Less: treasury shares
|
(34,578
|
)
|
4,667
|
|
—
|
|
29,911
|
|
—
|
|
(35,000
|
)
|
35,000
|
|
—
|
|
—
|
|
||||||||
|
Shares issued and outstanding
|
1,216,110
|
|
4,987
|
|
(53,916
|
)
|
—
|
|
1,167,181
|
|
—
|
|
100,000
|
|
17,738
|
|
1,284,919
|
|
||||||||
Mandatory Convertible Securities
In December 2014, FCA issued an aggregate notional amount of U.S.$2,875 million (€2,293 million) of mandatory convertible securities (the “Mandatory Convertible Securities”). Pursuant to the terms of the prospectus, the Mandatory Convertible Securities will pay cash coupons at a rate of 7.875 percent per annum, which can be deferred at the option of FCA. The Mandatory Convertible Securities will mature on December 15, 2016 (the “Mandatory Conversion Date”). The purpose of the issuance was to provide additional financing to the Group for general corporate purposes.
As part of the issuance of the Mandatory Convertible Securities, the underwriters had the option to purchase, within 30 days beginning on, and including, the date of initial issuance of U.S.$2,500 million (€1,994 million) of Mandatory Convertible Securities, up to an additional U.S.$375 million (€299 million) of Mandatory Convertible Securities from FCA at the same price as that sold to the public, less the underwriting discounts and commissions (the “over-allotment option”). The underwriters exercised the over-allotment option concurrent with the issuance of the Mandatory Convertible Securities and purchased an additional U.S.$375 million (€299 million) of Mandatory Convertible Securities, resulting in the aggregate notional amount of U.S.$2,875 million (€2,293 million) of Mandatory Convertible Securities that were issued.
F - 61
The Mandatory Convertible Securities will automatically convert on the Mandatory Conversion Date into a number of common shares equal to the conversion rate calculated based on the share price relative to
the applicable market value (“AMV”), as defined in the prospectus, as follows:
|
•
|
Maximum Conversion Rate:
261,363,375 shares if the AMV ≤ Initial Price (U.S.$11), in aggregate the Maximum Number of Shares
(1)
|
|
•
|
A number of shares equivalent to the value of U.S.$100 (i.e., U.S.$100 / AMV), if Initial Price (U.S.$11) ≤ the AMV ≤ Threshold Appreciation Price (U.S.$12.925)
(1)
|
|
•
|
Minimum Conversion Rate:
222,435,875 shares if the AMV ≥ Threshold Appreciation Price (U.S.$12.925), in aggregate the Minimum Number of Shares
(1)
|
|
•
|
Upon Mandatory Conversion: Holders receive: (i) any deferred coupon payments, (ii) accrued and unpaid coupon payments in cash or in Shares at the election of the Group.
|
Other features of the Mandatory Convertible Securities are outlined below:
|
•
|
Early Conversion at Option of the Group:
FCA has the option to convert the Mandatory Convertible Securities and deliver the Maximum Number of Shares prior to the Mandatory Conversion Date, subject to limitations around timing of the Ferrari spin-off. Upon exercise of this option, holders receive cash equal to: (i) any deferred coupon payments, (ii) accrued and unpaid coupon payments, and (iii) the present value of all remaining coupon payments on the Mandatory Convertible Securities discounted at the Treasury Yield rate.
|
|
•
|
Early Conversion at Option of the Holder:
holders have the option to convert their Mandatory Convertible Securities early and receive the Minimum Number of Shares, subject to limitations around timing of the Ferrari spin-off. Upon exercise of this option, holders receive any deferred coupon payments in cash or in common shares at the election of FCA.
|
|
•
|
The Mandatory Convertible Securities also provide for the possibility of early conversion in limited situations upon occurrence of defined events outlined in the prospectus.
|
Under IAS 32
- Financial Instruments: Presentation
, the issuer of a financial instrument shall classify the instrument, or its component parts, on initial recognition in accordance with the substance of the contractual arrangement and whether the components meet the definitions of a financial asset, financial liability or an equity instrument. As the Mandatory Convertible Securities are a compound financial instrument that is an equity contract combined with a financial liability for the coupon payments, there are two units of account for this instrument.
The equity contract meets the definition of an equity instrument as described in paragraph 16 of IAS 32 as the equity contract does not include a contractual obligation to (i) deliver cash or another financial asset to another entity or (ii) exchange financial assets or financial liabilities with another entity under conditions that are potentially unfavorable to FCA. Additionally, the equity contract is a non-derivative that includes no contractual obligation for FCA to deliver a variable number of its own equity, as FCA controls its ability to settle for a fixed number of shares under the terms of the contract. Management has determined that the terms of the contract are substantive as there are legitimate corporate objectives that could cause FCA to seek early conversion of the Mandatory Convertible Securities. As a result, the equity conversion feature has been accounted for as an equity instrument.
_________________________
(1) The Conversion Rates, the Initial Price and the Threshold Appreciation Price are each subject to adjustment related to dilutive events. In addition, upon the occurrence of a Spin-Off (as defined), the Threshold Appreciation Price, the Initial Price and the Stated Amount are also subject to adjustment. As a result of the spin-off of Ferrari that was completed on January 3, 2016, the metrics were adjusted on January 15, 2016 (see Note
32
for additional information).
F - 62
The obligation to pay coupons meets the definition of a financial liability as it is a contractual obligation to deliver cash to another entity. FCA has the right to, or in certain limited circumstances, the investors can force FCA to prepay the coupons, in addition to settling the equity conversion feature, before maturity. Under IFRS, the early settlement features would be bifurcated from the financial liability for the coupon payments since they require the repayment of the coupon obligation at an amount other than fair value or the amortized cost of the debt instrument as required by IAS 39.AG30(g).
As required by paragraph 31 of IAS 32, the initial carrying amount of a compound financial instrument is allocated to its equity and liability components. The equity component is assigned the residual amount after deducting the amount separately determined for the liability component from the fair value of the instrument as a whole. The value of any derivative features embedded in the compound financial instrument other than the equity component is included in the liability component. Therefore, the financial liability for the coupon payments was initially recognized at its fair value. The derivative related to the early settlement conversion features defined in the Mandatory Convertible Securities was bifurcated from the financial liability for the coupon payments and are accounted for at fair value through profit and loss. Subsequently, the financial liability related to the coupon payments is accounted for at amortized cost using the effective interest method. The financial liabilities related to the embedded derivative features are remeasured to their fair value at each reporting date with the remeasurement gains or losses being recorded in the Consolidated Income Statement. The residual amount of the proceeds received from the issuance of the Mandatory Convertible Securities were allocated to share reserves in Equity and are accordingly, not subsequently remeasured.
Under IAS 32, transaction costs that relate to the issue of a compound financial instrument are allocated to the liability and equity components of the instrument in proportion to the allocation of proceeds. The portion allocated to the equity component should be accounted for as a deduction from equity to the extent that they are incremental costs directly attributable to the equity transaction. The portion allocated to the liability component (including third party costs and creditor fees) are deducted from the liability component balance, are accounted for as a debt discount and are amortized over the life of the coupon payments using the effective interest method.
Net proceeds of U.S.$2,814 million (€2,245 million at date of issuance), consisting of gross proceeds of U.S.$2,875 million (€2,293 million) less total transaction costs of U.S.$61 million (€48 million) directly related to the issuance, were received in connection with the issuance of the Mandatory Convertible Securities. The fair value amount determined for the liability component at issuance was U.S.$419 million (€335 million) which was calculated as the present value of the coupon payments due, less allocated transaction costs of U.S.$9 million (€7 million) that are accounted for as a debt discount (Note
23
). The remaining net proceeds of U.S.$2,395 million (€1,910 million) (including allocated transaction costs of U.S.$52 million (€41 million) were recognized within equity reserves.
Other reserves
Other reserves mainly include:
|
•
|
legal reserve of €11,744 million at
December 31, 2015
(€10,816 million at
December 31, 2014
) that was determined in accordance to the Dutch law and mainly refers to development costs capitalized by subsidiaries and their earnings subject to certain restrictions on distributions to FCA. The legal reserve also includes the reserve for the equity component of the Mandatory Convertible Securities of €1,910 million. Pursuant to Dutch law, limitations exist relating to the distribution of shareholders' equity up to the total amount of the legal reserve;
|
|
•
|
capital reserves amounting to €3,805 million at
December 31, 2015
(€3,742 million at December 31, 2014);
|
|
•
|
retained earnings, that after separation of the legal reserve, are negative €1,117 million (negative €1,458 million at
December 31, 2014
); and
|
|
•
|
profit attributable to owners of the parent of €
334 million
for the year ended
December 31, 2015
(€
568 million
for the year ended
December 31, 2014
).
|
F - 63
Other comprehensive income/(loss)
Other comprehensive income/(loss) was as follows:
|
For the Years Ended December 31,
|
||||||||
|
2015
|
2014
|
2013
|
||||||
|
(€ million)
|
||||||||
|
Items that will not be reclassified to the Consolidated Income Statement in subsequent periods:
|
||||||||
|
Gains/(losses) on remeasurement of defined benefit plans
|
679
|
|
(327
|
)
|
2,679
|
|
||
|
Shares of (Losses) on remeasurement of defined benefit plans for equity method investees
|
(2
|
)
|
(4
|
)
|
(7
|
)
|
||
|
Items relating to discontinued operations
|
4
|
|
(6
|
)
|
(3
|
)
|
||
|
Total items that will not be reclassified to the Consolidated Income Statement (B1)
|
681
|
|
(337
|
)
|
2,669
|
|
||
|
Items that may be reclassified to the Consolidated Income Statement in subsequent periods:
|
||||||||
|
Gains/(losses) on cash flow hedging instruments arising during the period
|
63
|
|
(251
|
)
|
270
|
|
||
|
Gains/(losses) on cash flow hedging instruments reclassified to the Consolidated Income Statement
|
123
|
|
107
|
|
(163
|
)
|
||
|
Gains/(losses) on cash flow hedging instruments
|
186
|
|
(144
|
)
|
107
|
|
||
|
Gains/(losses) on available-for-sale financial assets
|
11
|
|
(24
|
)
|
4
|
|
||
|
Exchange differences on translating foreign operations
|
928
|
|
1,255
|
|
(708
|
)
|
||
|
Share of Other comprehensive income/(loss) for equity method investees arising during the period
|
(18
|
)
|
35
|
|
(75
|
)
|
||
|
Share of Other comprehensive income/(loss) for equity method investees reclassified to the Consolidated Income Statement
|
1
|
|
16
|
|
(13
|
)
|
||
|
Total Share of Other comprehensive (loss)/income for equity method investees
|
(17
|
)
|
51
|
|
(88
|
)
|
||
|
Items relating to discontinued operations
|
21
|
|
(121
|
)
|
43
|
|
||
|
Total items that may be reclassified to the Consolidated Income Statement (B2)
|
1,129
|
|
1,017
|
|
(642
|
)
|
||
|
Total Other comprehensive income/(loss) (B1)+(B2)=(B)
|
1,810
|
|
680
|
|
2,027
|
|
||
|
Tax effect
|
(249
|
)
|
54
|
|
227
|
|
||
|
Tax effect - discontinued operations
|
(4
|
)
|
48
|
|
(15
|
)
|
||
|
Total Other comprehensive income/(loss), net of tax
|
1,557
|
|
782
|
|
2,239
|
|
||
With reference to the defined benefit plans, the gains and losses arising from the remeasurement mainly include actuarial gains and losses arising during the period, the return on plan assets (net of interest income recognized in the Consolidated Income Statement) and any changes in the effect of the asset ceiling. These gains and losses are offset against the related net liabilities or assets for defined benefit plans (Note
21
).
F - 64
The following table summarizes the tax effect relating to Other comprehensive income/(loss):
|
For the Years Ended December 31,
|
||||||||||||||||||||||||||
|
2015
|
2014
|
2013
|
||||||||||||||||||||||||
|
Pre-tax
balance |
Tax
income/ (expense) |
Net
balance |
Pre-tax
balance |
Tax
income/ (expense) |
Net
balance |
Pre-tax
balance |
Tax
income/ (expense) |
Net
balance |
||||||||||||||||||
|
(€ million)
|
||||||||||||||||||||||||||
|
Gains/(losses) on
remeasurement of defined benefit plans |
679
|
|
(201
|
)
|
478
|
|
(327
|
)
|
28
|
|
(299
|
)
|
2,679
|
|
237
|
|
2,916
|
|
||||||||
|
Gains/(losses) on cash flow
hedging instruments |
186
|
|
(48
|
)
|
138
|
|
(144
|
)
|
26
|
|
(118
|
)
|
107
|
|
(10
|
)
|
97
|
|
||||||||
|
Gains/(losses) on available-
for-sale financial assets |
11
|
|
—
|
|
11
|
|
(24
|
)
|
—
|
|
(24
|
)
|
4
|
|
—
|
|
4
|
|
||||||||
|
Exchange gains/(losses) on
translating foreign operations |
928
|
|
—
|
|
928
|
|
1,255
|
|
—
|
|
1,255
|
|
(708
|
)
|
—
|
|
(708
|
)
|
||||||||
|
Share of Other comprehensive income/(loss) for equity method investees
|
(19
|
)
|
—
|
|
(19
|
)
|
47
|
|
—
|
|
47
|
|
(95
|
)
|
—
|
|
(95
|
)
|
||||||||
|
Items relating to discontinued operations
|
25
|
|
(4
|
)
|
21
|
|
(127
|
)
|
48
|
|
(79
|
)
|
40
|
|
(15
|
)
|
25
|
|
||||||||
|
Total Other comprehensive
income/(loss) |
1,810
|
|
(253
|
)
|
1,557
|
|
680
|
|
102
|
|
782
|
|
2,027
|
|
212
|
|
2,239
|
|
||||||||
Policies and processes for managing capital
The objectives identified by the Group for managing capital are to create value for shareholders as a whole, safeguard business continuity and support the growth of the Group. As a result, the Group endeavors to maintain an adequate level of capital that at the same time enables it to obtain a satisfactory economic return for its shareholders and guarantee economic access to external sources of funds, including by means of achieving an adequate credit rating.
The Group constantly monitors the ratio between debt and equity, particularly the level of net debt and the generation of cash from its industrial activities. In order to reach these objectives, the Group continues to aim for improvement in the profitability of its operations. Furthermore, the Group may sell part of its assets to reduce the level of its debt, while the Board of Directors may make proposals to FCA shareholders in the general meeting to reduce or increase share capital or, where permitted by law, to distribute reserves. The Group may also make purchases of treasury shares, without exceeding the limits authorized by FCA shareholders in the general meeting, under the same logic of creating value, compatible with the objectives of achieving financial equilibrium and an improvement in the Group's rating.
For 2015, the Board of Directors has not recommended a dividend payment on FCA common shares in order to further fund capital requirements of the Group’s business plan.
The FCA loyalty voting structure
The purpose of the loyalty voting structure is to reward long-term ownership of FCA common shares and to promote stability of the FCA shareholder base by granting long-term FCA shareholders with special voting shares to which one voting right is attached additional to the one granted by each FCA common share that they hold. In connection with the Merger, FCA issued 408,941,767 special voting shares, with a nominal value of €0.01 each, to those eligible shareholders of Fiat who had elected to participate in the loyalty voting structure upon completion of the Merger in addition to FCA common shares. In addition, an FCA shareholder may at any time elect to participate in the loyalty voting structure by requesting that FCA register all or some of the number of FCA common shares held by such FCA shareholder in the Loyalty Register. Only a minimal dividend accrues to the special voting shares allocated to a separate special dividend reserve, and they shall not carry any entitlement to any other reserve of FCA. Having only immaterial economics entitlements, the special voting shares do not impact earnings per share.
F - 65
(
20
) Share-based compensation
Performance Share Units
During the year ended December 31, 2015, FCA awarded a total of 14,713,100 Performance Share Units (“PSU awards”) to certain key employees under the framework equity incentive plan (Note
19
). The PSU awards, which represent the right to receive FCA shares, have financial performance goals covering a five-year period from 2014 to 2018. The performance goals include a net income target as well as total shareholder return (“TSR”) target, with each weighted at 50 percent and settled independently of the other. Half of the award will vest based on our achievement of the targets for net income (“PSU NI awards”) and will have a payout scale ranging from 0 percent to 100 percent. The remaining 50 percent of the PSU awards, (“PSU TSR awards”) are based on market conditions and have a payout scale ranging from 0 percent to 150 percent. Accordingly, the total number of shares that will eventually be issued may vary from the original award of 14.7 million shares. One third of total PSU awards will vest in February 2017, a cumulative two-thirds in February 2018 and a cumulative 100 percent in February 2019 if the respective performance goals for the years 2014 to 2016, 2014 to 2017 and 2014 to 2018 are achieved. None of the PSU awards were forfeited and none of the outstanding PSU awards had vested as of
December 31, 2015
.
The vesting of the PSU NI awards will be determined by comparing the Group's net profit excluding unusual items compared to the net income targets established in the business plan that was published in May 2014. The performance period for the PSU NI awards commenced on January 1, 2014. As the performance period commenced substantially prior to the commencement of the service period, which coincides with the grant date, the Company determined that the net income target did not meet the definition of a performance condition under IFRS 2 -
Share-based Payment
, and therefore is required to be accounted for as a non-vesting condition. As such, the fair values of the PSU NI awards were calculated using a Monte Carlo simulation model. The weighted average fair value of the PSU-NI awards granted during the year ended December 31, 2015 was €8.78 (U.S.$9.76).
The key assumptions utilized to calculate the grant-date fair values for the PSU NI awards issued are summarized below:
|
Key assumptions
|
Range
|
|
|
Grant Date Stock Price
|
€13.44 - €15.21
|
|
|
Expected volatility
|
40
|
%
|
|
Risk-free rate
|
0.7
|
%
|
The expected volatility was based on the observed historical volatility for common shares of FCA. The risk-free rate was based on the yields of the U.S. Treasury bonds with similar terms to the vesting date of each PSU NI award.
The weighted average fair value of the PSU TSR awards granted during the year ended December 31, 2015 was €16.52 (U.S.$18.35), which was calculated using a Monte Carlo simulation model. The key assumptions utilized to calculate the grant date fair values for the PSU TSR awards issued are summarized below:
|
Key assumptions
|
Range
|
|
|
Grant Date Stock Price
|
€13.44 - €15.21
|
|
|
Expected volatility
|
37% - 39%
|
|
|
Dividend yield
|
0
|
%
|
|
Risk-free rate
|
0.7% - 0.8%
|
|
The expected volatility was based on the observed historical volatility for common shares of FCA. The risk-free rate was based on the yields of the U.S. Treasury bonds with similar term to the vesting date of the PSU TSR awards. In addition, since the volatility of each member of the defined peer group are not wholly independent of one another, a correlation coefficient was developed based on historical share price changes for FCA and the defined peer group over a three-year period leading up to the grant date of the awards.
F - 66
Restricted Share Units
During the year ended
December 31, 2015
, FCA awarded 5,196,550 Restricted Share Units (“RSU awards”) to certain key employees of the Company which represent the right to receive FCA shares. These shares will vest in three equal tranches in February of 2017, 2018 and 2019. None of the outstanding RSU awards were forfeited and none of the outstanding RSU awards had vested as of
December 31, 2015
.
Total expense for the PSU awards and RSU awards of approximately €54 million was recorded for the year ended
December 31, 2015
. As of
December 31, 2015
, the Group had unrecognized compensation expense related to the non-vested PSU awards and RSU awards of approximately €178 million based on current forfeiture assumptions, which will be recognized over a weighted-average period of 2.2 years. The corresponding tax benefit for the year ended December 31, 2015 was €7 million.
Chief Executive Officer - Special Recognition Award
On April 16, 2015, Shareholders of FCA approved a grant of 1,620,000 common shares to the Chief Executive Officer, which vested immediately. This grant was for recognition of the Chief Executive Officer's vision and guidance in the formation of Fiat Chrysler Automobiles N.V., which created significant value for the Company, its shareholders, stakeholders and employees. The weighted-average fair value of the shares at the grant date was €15.21 (U.S.$16.29), measured using FCA's share price on the grant date. A one-time charge of €24.6 million was recorded within Selling, general and administrative costs during the year ended
December 31, 2015
related to this grant.
Stock option plans linked to Fiat and CNHI ordinary shares
On July 26, 2004, the Board of Directors granted the Chief Executive Officer, as a part of his variable compensation in that position, options to purchase 10,670,000 Fiat ordinary shares at a price of €6.583 per share. Following the de-merger of CNHI from Fiat, the beneficiary had the right to receive one ordinary Fiat share and one ordinary CNHI share for each original option, with the option exercise price remaining unchanged. The options were fully vested and they were exercisable at any time until January 1, 2016. The options were exercised in total in November 2014 and the beneficiary received 10,670,000 shares of FCA since the options were exercised after the Merger, in addition to 10,670,000 CNHI shares.
On November 3, 2006, the Fiat Board of Directors approved (subject to the subsequent approval of Shareholders obtained on April 5, 2007), the “November 2006 Stock Option Plan”, an eight year stock option plan, which granted certain managers of the Group and the Chief Executive Officer of Fiat the right to purchase a specific number of Fiat ordinary shares at a fixed price of €13.37 each. More specifically, the 10 million options granted to employees and the 5 million options granted to the Chief Executive Officer had a vesting period of four years, with an equal number vesting each year, were subject to achieving certain predetermined profitability targets (Non-Market Conditions or “NMC”) in the reference period and were exercisable from February 18, 2011. An additional 5,000,000 options were granted to the Chief Executive Officer of Fiat that were not subject to performance conditions but also had a vesting period of four years with an equal number vesting each year and were exercisable from November 2010. The ability to exercise the options was also subject to specific restrictions regarding the duration of the employment relationship or the continuation of the position held. Following the demerger of CNHI from Fiat, the beneficiaries had the right to receive one ordinary Fiat share and one ordinary CNHI share for each original option, with the option exercise price remaining unchanged.
F - 67
The contractual terms of the plan were as follows:
|
Plan
|
Recipient
|
Expiry date
|
Strike
price
(€)
|
N° of options
vested |
Vesting date
|
Vesting portion
|
||||||||
|
Stock Option - November 2006
|
Chief Executive Officer
|
November 3, 2014
|
13.37
|
|
5,000,000
|
|
November 2007
November 2008 November 2009 November 2010 |
25%
25% 25% 25% |
||||||
|
Stock Option - November 2006
|
Chief Executive Officer
|
November 3, 2014
|
13.37
|
|
5,000,000
|
|
1st Quarter 2008 (*)
1st Quarter 2009 (*) 1st Quarter 2010 (*) 1st Quarter 2011 (*) |
25%xNMC
25%xNMC 25%xNMC 25%xNMC |
||||||
|
Stock Option - November 2006
|
Managers
|
November 3, 2014
|
13.37
|
|
10,000,000
|
|
1st Quarter 2008 (*)
1st Quarter 2009 (*) 1st Quarter 2010 (*) 1st Quarter 2011 (*) |
25%xNMC
25%xNMC 25%xNMC 25%xNMC |
||||||
_________________________
(*)
On approval of the prior year’s Consolidated Financial Statements; subject to continuation of the employment relationship
.
With specific reference to the options under the November 2006 Stock Option Plan for which vesting was subject to the achievement of pre-established profitability targets, only the first tranche of those rights had vested as the profitability targets originally established for the 3-year period 2008-2010 were not met.
Changes during the years ended December 31,
2014
and
2013
were as follows:
|
Rights granted to managers
|
||||||||||||
|
2014
|
2013
|
|||||||||||
|
Number of
options |
Average exercise price (€)
|
Number of
options |
Average exercise price (€)
|
|||||||||
|
Outstanding shares at the beginning of the year
|
1,240,000
|
|
13.37
|
|
1,576,875
|
|
13.37
|
|
||||
|
Exercised
|
(1,139,375
|
)
|
13.37
|
|
(285,000
|
)
|
13.37
|
|
||||
|
Expired
|
(100,625
|
)
|
—
|
|
(51,875
|
)
|
13.37
|
|
||||
|
Outstanding shares at the
end of the year |
—
|
|
—
|
|
1,240,000
|
|
13.37
|
|
||||
|
Exercisable at the end of the year
|
—
|
|
—
|
|
1,240,000
|
|
13.37
|
|
||||
|
Rights granted to the Chief Executive Officer
|
||||||||||||
|
2014
|
2013
|
|||||||||||
|
Number of
options |
Average exercise price (
€
)
|
Number of
options |
Average exercise price (
€
)
|
|||||||||
|
Outstanding shares at the beginning of the year
|
6,250,000
|
|
13.37
|
|
6,250,000
|
|
13.37
|
|
||||
|
Exercised
|
(6,250,000
|
)
|
13.37
|
|
—
|
|
—
|
|
||||
|
Outstanding shares at the end of the year
|
—
|
|
—
|
|
6,250,000
|
|
13.37
|
|
||||
|
Exercisable at the end of the year
|
—
|
|
—
|
|
6,250,000
|
|
13.37
|
|
||||
Stock Grant plans linked to Fiat shares
On April 4, 2012, the Shareholders resolved to approve the adoption of a Long Term Incentive Plan (the “Retention LTI Plan”), in the form of stock grants. As a result, the Group granted the Chief Executive Officer 7 million rights, which represented an equal number of ordinary shares. One third of the rights vested on February 22, 2013, one third vested on February 22, 2014 and one third vested on February 22, 2015, which had been subject to the requirement that the Chief Executive Officer remain in office. The Plan was serviced in 2015 through the issuance of new shares.
F - 68
Changes in the Retention LTI Plan during the year ended
December 31, 2015
were as follows:
|
2015
|
2014
|
2013
|
|||||||||||||||
|
Number of FCA
shares |
Average fair
value at the grant date (€) |
Number of FCA
shares |
Average fair
value at the grant date (€) |
Number of Fiat
shares |
Average fair
value at the grant date (€) |
||||||||||||
|
Outstanding shares unvested at the beginning of the year
|
2,333,334
|
|
4.205
|
|
4,666,667
|
|
4.205
|
|
7,000,000
|
|
4.205
|
|
|||||
|
Vested
|
(2,333,334
|
)
|
4.205
|
|
(2,333,333
|
)
|
4.205
|
|
(2,333,333
|
)
|
4.205
|
|
|||||
|
Outstanding shares unvested at the end of the year
|
—
|
|
4.205
|
|
2,333,334
|
|
4.205
|
|
4,666,667
|
|
4.205
|
|
|||||
Nominal costs for this plan of €0.3 million, €2 million and €6 million were recognized during the years ended
December 31, 2015
,
2014
and 2013, respectively.
Share-Based Compensation Plans Issued by FCA US
As of December 31, 2015, FCA US has units outstanding under two legacy share-based compensation plans: the Amended and Restated FCA US Directors’ Restricted Stock Unit Plan (“FCA US Directors’ RSU Plan”) and the FCA US 2012 Long-Term Incentive Plan (“2012 LTIP Plan”). There are no units outstanding under the FCA US Restricted Stock Unit Plan or the FCA US Deferred Phantom Share Plan. Compensation expense for those plans during the years ended December 31, 2015, 2014 and 2013 and cash payments made under those plans during those periods were not material.
The fair value of each unit issued under the FCA US share-based compensation plans is based on the fair value of FCA US’s membership interests. Each unit represents a “FCA US Unit,” which is equal to
1/600
th of the value of a FCA US membership interest. Since there is no publicly observable trading price for FCA US membership interests, fair value was determined using a discounted cash flow methodology. This approach, which is based on projected cash flows of FCA US, is used to estimate the enterprise value of FCA US. The fair value of FCA US’s outstanding interest bearing debt as of the measurement date is deducted from the enterprise value of FCA US to arrive at the fair value of equity. This amount is then divided by the total number of FCA US Units, as determined above, to estimate the fair value of a single FCA US Unit.
Anti-Dilution Adjustments
The documents governing FCA US's share-based compensation plans contain anti-dilution provisions which provide for an adjustment to the number of FCA US Units granted under the plans in order to preserve, or alternatively prevent the enlargement of, the benefits intended to be made available to the holders of the awards should an event occur that impacts the capital structure of FCA US.
On February 3, 2015, FCA US made a special distribution to FCA in the amount of $1,338 million (€1,176 million), which reduced the fair value of FCA US's equity. As a result of this dilutive event and pursuant to the anti-dilution provisions, the FCA US Board of Directors approved an anti-dilution adjustment factor to increase the number of outstanding FCA US Units in order to preserve the economic benefit intended to be provided to each participant. The value of the outstanding awards immediately prior to the dilutive event was equal to the value of the adjusted awards subsequent to the dilutive event. No additional expense was recognized as a result of this modification during 2015. For comparative purposes, the number of FCA US Units and all December 31, 2014 and 2013 fair value references have been adjusted to reflect the impact of the dilutive transaction and the anti-dilution adjustment.
During the year ended December 31, 2014, two transactions occurred that diluted the fair value of FCA US's equity and the per unit fair value of a FCA US Unit. These transactions were:
|
•
|
the U.S.$1,900 million (€1,404 million) distribution paid on January 21, 2014, which served to fund a portion of the transaction whereby Fiat acquired the VEBA Trust's remaining ownership interest in FCA US (as described above in the section —
Acquisition of the Remaining Ownership Interest in FCA US
); and
|
|
•
|
the prepayment of the VEBA Trust Note on February 7, 2014 that accelerated tax deductions that were being passed through to the FCA US's members.
|
F - 69
As a result of these two dilutive events and pursuant to the anti-dilution provisions an anti-dilution adjustment factor was approved by FCA US's Compensation and Leadership Development Committee ("Compensation Committee") to increase the number of outstanding FCA US Units (excluding performance share units granted under the 2012 LTIP Plan (“LTIP PSUs”)) in order to preserve the economic benefit intended to be provided to each participant. The value of the outstanding awards immediately prior to the dilutive events was equal to the value of the adjusted awards subsequent to the dilutive events. No additional expense was recognized as a result of the modifications during 2014.
There were no similar changes of FCA US's capital structure in 2013 that required an anti-dilution adjustment.
Restricted Stock Unit Plans issued by FCA US
There were no awards outstanding under our FCA US Restricted Stock Unit Plan (“FCA US RSU Plan”) as of December 31, 2015.
Director RSUs were granted to non-employee members of the FCA US Board of Directors. Under the plan, settlement of the awards is made within
60 days
of the Director’s cessation of service on the FCA US Board of Directors and awards are paid in cash. On May 7, 2015, the FCA US Board of Directors approved an amendment to the Director RSU Plan, freezing the Director RSU awards unit value as of December 31, 2015.
The expense recognized in total for both the FCA US RSU Plan and the Directors' RSU Plan for the years ended
December 31, 2015
,
2014
and
2013
was approximately
€8 million
,
€6 million
and
€14 million
, respectively. The corresponding tax benefit for the year ended December 31, 2015 was €3 million and for the years ended December 31, 2014 and 2013, the tax benefit was immaterial. There is no unrecognized compensation expense for both the FCA US RSU plan and the Directors' RSU Plan at December 31, 2015.
Changes during
2015
,
2014
and
2013
for the FCA US RSU Plan were as follows:
|
|
|||||||||||||||||
|
Adjusted for Anti-Dilution
|
|||||||||||||||||
|
2015
|
2014
|
2013
|
|||||||||||||||
|
FCA US Restricted
Stock Units |
Weighted
average fair
value at the
grant date (€) |
FCA US Restricted
Stock Units |
Weighted
average fair
value at the
grant date (€) |
FCA US Restricted
Stock Units |
Weighted
average fair value at the grant date (€) |
||||||||||||
|
Outstanding shares unvested at the beginning of the year
|
1,545,985
|
|
4.18
|
|
5,550,897
|
|
3.14
|
|
7,116,320
|
|
2.89
|
|
|||||
|
Granted
|
—
|
|
—
|
|
—
|
|
—
|
|
242,383
|
|
4.98
|
|
|||||
|
Vested
|
(1,545,985
|
)
|
4.58
|
|
(3,893,470
|
)
|
3.01
|
|
(1,469,075
|
)
|
1.74
|
|
|||||
|
Forfeited
|
—
|
|
—
|
|
(111,442
|
)
|
3.85
|
|
(338,731
|
)
|
3.49
|
|
|||||
|
Outstanding shares unvested at the end of the year
|
—
|
|
—
|
|
1,545,985
|
|
4.18
|
|
5,550,897
|
|
3.14
|
|
|||||
F - 70
|
|
|||||||||||
|
As Previously Reported
|
|||||||||||
|
2014
|
2013
|
||||||||||
|
FCA US Restricted
Stock Units |
Weighted
average fair
value at the
grant date (€) |
FCA US Restricted
Stock Units |
Weighted
average fair value at the grant date (€) |
||||||||
|
Outstanding shares unvested at the beginning of the year
|
4,792,279
|
|
3.64
|
|
6,143,762
|
|
3.35
|
|
|||
|
Granted
|
—
|
|
—
|
|
209,258
|
|
5.75
|
|
|||
|
Vested
|
(3,361,366
|
)
|
3.48
|
|
(1,268,303
|
)
|
2.01
|
|
|||
|
Forfeited
|
(96,211
|
)
|
4.46
|
|
(292,438
|
)
|
4.05
|
|
|||
|
Outstanding shares unvested at the end of the year
|
1,334,702
|
|
4.84
|
|
4,792,279
|
|
3.64
|
|
|||
2012 LTIP Plan
In
February 2012
, the Compensation Committee of FCA US approved the 2012 LTIP Plan that covers senior executives of FCA US (other than the Chief Executive Officer). As of December 31, 2015, only restricted share units (“LTIP RSUs”) remain outstanding under the plan, all of which will be settled prior to March 31, 2016.
Changes during
2015
,
2014
and 2013 were as follows:
|
Adjusted for Anti-Dilution
|
|||||||||||||||||
|
Year Ended December 31,
|
|||||||||||||||||
|
2015
|
2014
|
2013
|
|||||||||||||||
|
LTIP RSUs
|
Weighted
average fair value at the grant date (€) |
LTIP RSUs
|
Weighted
average fair value at the grant date (€) |
LTIP RSUs
|
Weighted
average fair value at the grant date (€) |
||||||||||||
|
Outstanding shares unvested at the beginning of the year
|
2,303,928
|
|
4.67
|
|
4,054,807
|
|
4.08
|
|
2,712,700
|
|
3.85
|
|
|||||
|
Granted
|
—
|
|
—
|
|
—
|
|
—
|
|
2,447,759
|
|
4.59
|
|
|||||
|
Vested
|
(1,544,664
|
)
|
4.98
|
|
(1,630,392
|
)
|
4.15
|
|
(924,682
|
)
|
3.84
|
|
|||||
|
Forfeited
|
(104,558
|
)
|
5.36
|
|
(120,487
|
)
|
4.24
|
|
(180,970
|
)
|
4.13
|
|
|||||
|
Outstanding shares unvested at the end of the year
|
654,706
|
|
5.50
|
|
2,303,928
|
|
4.67
|
|
4,054,807
|
|
4.08
|
|
|||||
|
As Previously Reported
|
|||||||||||
|
December 31, 2014
|
December 31, 2013
|
||||||||||
|
LTIP RSUs
|
Weighted
average fair value at the grant date (€) |
LTIP RSUs
|
Weighted
average fair value at the grant date (€) |
||||||||
|
Outstanding shares unvested at the beginning of the year
|
3,500,654
|
|
4.73
|
|
2,341,967
|
|
4.46
|
|
|||
|
Granted
|
—
|
|
—
|
|
2,113,234
|
|
5.32
|
|
|||
|
Vested
|
(1,407,574
|
)
|
4.81
|
|
(798,310
|
)
|
4.45
|
|
|||
|
Forfeited
|
(104,020
|
)
|
4.91
|
|
(156,237
|
)
|
4.78
|
|
|||
|
Outstanding shares unvested at the end of the year
|
1,989,060
|
|
5.41
|
|
3,500,654
|
|
4.73
|
|
|||
F - 71
|
Year Ended December 31,
|
|||||||||||||||||
|
2015
|
2014
|
2013
|
|||||||||||||||
|
LTIP PSUs
(1)
|
Weighted
average fair value at the grant date ( € ) |
LTIP PSUs
(1)
|
Weighted
average fair value at the grant date ( € ) |
LTIP PSUs
(1)
|
Weighted
average fair value at the grant date ( € ) |
||||||||||||
|
Outstanding shares unvested at the beginning of the year
|
5,320,540
|
|
8.62
|
|
8,417,511
|
|
5.64
|
|
8,419,684
|
|
5.78
|
|
|||||
|
Granted
|
—
|
|
—
|
|
5,556,503
|
|
7.62
|
|
587,091
|
|
7.15
|
|
|||||
|
Vested
|
(5,302,138
|
)
|
9.44
|
|
—
|
|
—
|
|
—
|
|
—
|
|
|||||
|
Forfeited
|
(18,402
|
)
|
9.44
|
|
(8,653,474
|
)
|
5.89
|
|
(589,264
|
)
|
5.77
|
|
|||||
|
Outstanding shares unvested at the end of the year
|
—
|
|
—
|
|
5,320,540
|
|
8.62
|
|
8,417,511
|
|
5.64
|
|
|||||
_________________________
(1) Not adjusted for the 2015 anti-dilution based on the amendment approved on May 12, 2014.
The expense recognized in connection with the 2012 LTIP Plan in
2015
was
€4 million
(
€6 million
in
2014
and €
36 million
in
2013
). Total unrecognized compensation expense at
December 31, 2015
was less than
€1 million
, which will be recognized over the remaining service periods. The corresponding tax benefit for the year ended December 31, 2015 was €2 million and for the years ended December 31, 2014 and 2013, the tax benefit was immaterial.
(
21
) Provisions for employee benefits
The following table summarizes the provisions and net assets for employee benefits:
|
At December 31,
|
|||||
|
2015
|
2014
|
||||
|
(€ million)
|
|||||
|
Present value of defined benefit obligations:
|
|||||
|
Pension benefits
|
27,547
|
|
27,287
|
|
|
|
Health care and life insurance plans
|
2,459
|
|
2,276
|
|
|
|
Other post-employment benefits
|
969
|
|
1,074
|
|
|
|
Total present value of defined benefit obligations (a)
|
30,975
|
|
30,637
|
|
|
|
Fair value of plan assets (b)
|
22,415
|
|
22,231
|
|
|
|
Asset ceiling (c)
|
11
|
|
6
|
|
|
|
Total net defined benefit plans (a - b + c)
|
8,571
|
|
8,412
|
|
|
|
of which:
|
|||||
|
Net defined benefit liability (d)
|
8,738
|
|
8,516
|
|
|
|
(Defined benefit plan asset)
|
(167
|
)
|
(104
|
)
|
|
|
Other provisions for employees and liabilities for share-based payments (e)
|
1,326
|
|
1,076
|
|
|
|
Total Provisions for employee benefits (d + e)
|
10,064
|
|
9,592
|
|
|
The Group recognized a total of
€1,541 million
for the cost for defined contribution plans for the year ended December 31, 2015 (
€1,346 million
in
2014
and
€1,263
million in
2013
).
F - 72
Pension benefits
Liabilities arising from the Group's defined benefit plans are usually funded by contributions made by Group subsidiaries and, at times by their employees, into legally separate trusts from which the employee benefits are paid. The Group’s funding policy for defined benefit pension plans is to contribute the minimum amounts required by applicable laws and regulations. Occasionally, additional discretionary contributions in excess of these legally required are made to achieve certain desired funding levels. In the U.S. these excess amounts are tracked, and the resulting credit balance can be used to satisfy minimum funding requirements in future years. At
December 31, 2015
, the combined credit balances for the U.S. and Canada qualified pension plans were approximately
€2.1 billion
, the usage of the credit balances to satisfy minimum funding requirements is subject to the plans maintaining certain funding levels. The Group contributions to funded pension plans for
2016
are expected to be
€563 million
, of which
€542 million
relate to FCA US, with
€408 million
being discretionary contributions and
€134 million
will be made to satisfy minimum funding requirements. The expected benefit payments for pension plans are as follows:
|
Expected benefit
payments |
||
|
(€ million)
|
||
|
2016
|
1,854
|
|
|
2017
|
1,810
|
|
|
2018
|
1,785
|
|
|
2019
|
1,766
|
|
|
2020
|
1,747
|
|
|
2021-2025
|
8,573
|
|
The following summarizes the changes in the pension plans:
|
2015
|
2014
|
||||||||||||||||||||||
|
Obligation
|
Fair value of plan assets
|
Asset ceiling
|
Liability
(asset) |
Obligation
|
Fair value of plan assets
|
Asset ceiling
|
Liability
(asset) |
||||||||||||||||
|
(€ million)
|
|||||||||||||||||||||||
|
At January 1,
|
27,287
|
|
(22,231
|
)
|
6
|
|
5,062
|
|
23,137
|
|
(18,982
|
)
|
3
|
|
4,158
|
|
|||||||
|
Included in the Consolidated Income Statement
|
1,327
|
|
(816
|
)
|
—
|
|
511
|
|
1,290
|
|
(816
|
)
|
—
|
|
474
|
|
|||||||
|
Included in Other comprehensive income/(loss)
|
|||||||||||||||||||||||
|
Actuarial (gains)/losses from:
|
|||||||||||||||||||||||
|
- Demographic assumptions
|
(101
|
)
|
—
|
|
—
|
|
(101
|
)
|
(256
|
)
|
—
|
|
—
|
|
(256
|
)
|
|||||||
|
- Financial assumptions
|
(1,296
|
)
|
—
|
|
—
|
|
(1,296
|
)
|
1,916
|
|
(8
|
)
|
—
|
|
1,908
|
|
|||||||
|
- Other
|
33
|
|
(8
|
)
|
—
|
|
25
|
|
2
|
|
—
|
|
—
|
|
2
|
|
|||||||
|
Return on assets
|
—
|
|
749
|
|
—
|
|
749
|
|
—
|
|
(1,514
|
)
|
—
|
|
(1,514
|
)
|
|||||||
|
Changes in the effect of limiting net assets
|
—
|
|
—
|
|
4
|
|
4
|
|
—
|
|
—
|
|
3
|
|
3
|
|
|||||||
|
Changes in exchange rates
|
2,181
|
|
(1,743
|
)
|
1
|
|
439
|
|
2,802
|
|
(2,273
|
)
|
—
|
|
529
|
|
|||||||
|
Other
|
|||||||||||||||||||||||
|
Employer contributions
|
—
|
|
(237
|
)
|
—
|
|
(237
|
)
|
—
|
|
(229
|
)
|
—
|
|
(229
|
)
|
|||||||
|
Plan participant contributions
|
2
|
|
(2
|
)
|
—
|
|
—
|
|
2
|
|
(2
|
)
|
—
|
|
—
|
|
|||||||
|
Benefits paid
|
(1,857
|
)
|
1,849
|
|
—
|
|
(8
|
)
|
(1,611
|
)
|
1,606
|
|
—
|
|
(5
|
)
|
|||||||
|
Other changes
|
(29
|
)
|
24
|
|
—
|
|
(5
|
)
|
5
|
|
(13
|
)
|
—
|
|
(8
|
)
|
|||||||
|
At December 31,
|
27,547
|
|
(22,415
|
)
|
11
|
|
5,143
|
|
27,287
|
|
(22,231
|
)
|
6
|
|
5,062
|
|
|||||||
During
2015
, an increase in discount rates resulted in actuarial gains for the year ended
December 31, 2015
, while a decrease in discount rates resulted in actuarial losses for the year ended
December 31, 2014
.
F - 73
Amounts recognized in the Consolidated Income Statement were as follows:
|
For the Years Ended December 31,
|
||||||||
|
2015
|
2014
|
2013
|
||||||
|
(€ million)
|
||||||||
|
Current service cost
|
196
|
|
184
|
|
292
|
|
||
|
Interest expense
|
1,143
|
|
1,089
|
|
1,026
|
|
||
|
(Interest income)
|
(912
|
)
|
(878
|
)
|
(768
|
)
|
||
|
Other administration costs
|
92
|
|
62
|
|
42
|
|
||
|
Past service costs/(credits) and gains/(losses) arising from settlements/curtailments
|
(8
|
)
|
17
|
|
(162
|
)
|
||
|
Total recognized in the Consolidated Income Statement
|
511
|
|
474
|
|
430
|
|
||
During the year ended December 31, 2015, mortality assumptions used for our U.S. benefit plan valuation were updated to reflect recent trends in the industry and the revised outlook for future generational mortality improvements. Generational improvements represent decreases in mortality rates over time based upon historical improvements in mortality and expected future improvements. The change increased the Group's U.S. pension and other post-employment benefit obligations by approximately
€214 million
and €28 million, respectively at December 31, 2015. In addition, retirement rate assumptions used for the Group's U.S. and Canada benefit plan valuations were updated to reflect an ongoing trend towards delayed retirement for U.S. and Canada employees. The change decreased the Group's U.S. and Canada pension benefit obligations by approximately
€209 million
at December 31, 2015.
During the year ended December 31, 2014, following the release of new standards by the Canadian Institute of Actuaries, mortality assumptions used for our Canadian benefit plan valuations were updated to reflect recent trends in the industry and the revised outlook for future generational mortality improvements. The change increased the Group's Canadian pension obligations by approximately €41 million. In addition, retirement rate assumptions used for the Group's U.S. benefit plan valuations were updated to reflect an ongoing trend towards delayed retirement for FCA US employees. The change decreased the Group's U.S. pension and other post-employment benefit obligations by approximately €261 million and €40 million, respectively.
There were no significant plan amendments or curtailments to the Group's pension plans for the years ended December 31, 2015 and 2014. During the year ended December 31, 2013, FCA US amended its U.S. and Canadian salaried defined benefit pension plans. The U.S. plans were amended in order to comply with U.S. regulations, cease the accrual of future benefits effective December 31, 2013, and enhance the retirement factors. The Canada amendment ceased the accrual of future benefits effective December 31, 2014, enhanced the retirement factors and continued to consider future salary increases for the affected employees. An interim re-measurement was performed for these plans, which resulted in a curtailment gain of
€166 million
recognized in Other income/(expenses) in the Consolidated Income Statement. In addition, the Group recognized a
€509 million
reduction to its pension obligation, a
€7 million
reduction to defined benefit plan assets and a corresponding
€502 million
increase in accumulated Other comprehensive income/(loss) for the year ended December 31, 2013.
F - 74
The fair value of plan assets by class was as follows:
|
At December 31, 2015
|
At December 31, 2014
|
||||||||||
|
Amount
|
of which have a
quoted market price in an active market |
Amount
|
of which have a
quoted market price in an active market |
||||||||
|
(€ million)
|
|||||||||||
|
Cash and cash equivalents
|
589
|
|
512
|
|
713
|
|
614
|
|
|||
|
U.S. equity securities
|
2,209
|
|
2,208
|
|
2,406
|
|
2,338
|
|
|||
|
Non-U.S. equity securities
|
1,388
|
|
1,388
|
|
1,495
|
|
1,463
|
|
|||
|
Commingled funds
|
2,025
|
|
164
|
|
2,009
|
|
186
|
|
|||
|
Equity instruments
|
5,622
|
|
3,760
|
|
5,910
|
|
3,987
|
|
|||
|
Government securities
|
2,610
|
|
852
|
|
2,948
|
|
780
|
|
|||
|
Corporate bonds (including Convertible and high yield bonds)
|
6,028
|
|
—
|
|
6,104
|
|
4
|
|
|||
|
Other fixed income
|
928
|
|
7
|
|
892
|
|
7
|
|
|||
|
Fixed income securities
|
9,566
|
|
859
|
|
9,944
|
|
791
|
|
|||
|
Private equity funds
|
1,787
|
|
—
|
|
1,648
|
|
—
|
|
|||
|
Commingled funds
|
137
|
|
117
|
|
5
|
|
5
|
|
|||
|
Mutual funds
|
3
|
|
—
|
|
4
|
|
—
|
|
|||
|
Real estate funds
|
1,502
|
|
—
|
|
1,395
|
|
—
|
|
|||
|
Hedge funds
|
2,607
|
|
—
|
|
1,841
|
|
—
|
|
|||
|
Investment funds
|
6,036
|
|
117
|
|
4,893
|
|
5
|
|
|||
|
Insurance contracts and other
|
602
|
|
49
|
|
771
|
|
91
|
|
|||
|
Total fair value of plan assets
|
22,415
|
|
5,297
|
|
22,231
|
|
5,488
|
|
|||
Non-U.S. Equity securities are invested broadly in developed international and emerging markets. Debt instruments are fixed income securities which are primarily comprised of long-term U.S. Treasury and global government bonds, as well as U.S., developed international and emerging market companies’ debt securities diversified by sector, geography and through a wide range of market capitalization. Commingled funds include common collective trust funds, mutual funds and other investment entities. Private equity funds include those in limited partnerships that invest primarily in operating companies that are not publicly traded on a stock exchange. Real estate investments include those in limited partnerships that invest in various commercial and residential real estate projects both domestically and internationally. Hedge fund investments include those seeking to maximize absolute return using a broad range of strategies to enhance returns and provide additional diversification.
The investment strategies and objectives for pension assets primarily in the U.S. and Canada reflect a balance of liability-hedging and return-seeking investment considerations. The investment objectives are to minimize the volatility of the value of the pension assets relative to the pension liabilities and to ensure assets are sufficient to pay plan obligations. The objective of minimizing the volatility of assets relative to liabilities is addressed primarily through asset diversification, partial asset–liability matching and hedging. Assets are broadly diversified across many asset classes to achieve risk–adjusted returns that, in total, lower asset volatility relative to the liabilities. Additionally, in order to minimize pension asset volatility relative to the pension liabilities, a portion of the pension plan assets are allocated to fixed income securities. The Group policy for these plans ensures actual allocations are in line with target allocations as appropriate.
Assets are actively managed, primarily, by external investment managers. Investment managers are not permitted to invest outside of the asset class or strategy for which they have been appointed. The Group uses investment guidelines to ensure investment managers invest solely within the mandated investment strategy. Certain investment managers use derivative financial instruments to mitigate the risk of changes in interest rates and foreign currencies impacting the fair values of certain investments. Derivative financial instruments may also be used in place of physical securities when it is more cost effective and/or efficient to do so. Plan assets do not include shares of FCA or properties occupied by Group companies, with the possible exception of comingled investment vehicles where FCA does not control the investment guidelines.
Sources of potential risk in the pension plan assets measurements relate to market risk, interest rate risk and operating risk. Market risk is mitigated by diversification strategies and as a result, there are no significant concentrations of risk in terms of sector, industry, geography, market capitalization, or counterparty. Interest rate risk is mitigated by partial asset–liability matching. The fixed income target asset allocation partially matches the bond–like and long–dated nature of the pension liabilities. Interest rate increases generally will result in a decline in the fair value of the investments in fixed income securities
F - 75
and the present value of the obligations. Conversely, interest rate decreases generally will increase the fair value of the investments in fixed income securities and the present value of the obligations.
The weighted average assumptions used to determine the defined benefit obligations were as follows:
|
At December 31, 2015
|
At December 31, 2014
|
||||||||||||||||
|
U.S.
|
Canada
|
UK
|
U.S.
|
Canada
|
UK
|
||||||||||||
|
Discount rate
|
4.5
|
%
|
4.0
|
%
|
3.8
|
%
|
4.0
|
%
|
3.8
|
%
|
4.0
|
%
|
|||||
|
Future salary increase rate
|
—
|
%
|
3.5
|
%
|
2.9
|
%
|
—
|
%
|
3.5
|
%
|
3.0
|
%
|
|||||
The average duration of the U.S. and Canadian liabilities was approximately
11
and
13 years
, respectively. The average duration of the UK pension liabilities was approximately
20 years
.
Health care and life insurance plans
Liabilities arising from these plans comprise obligations for retiree health care and life insurance granted to employees and to retirees in the U.S. and Canada by FCA US companies. Upon retirement from the Group, these employees may become eligible for continuation of certain benefits. Benefits and eligibility rules may be modified periodically. These plans are unfunded. The expected benefit payments for unfunded health care and life insurance plans are as follows:
|
Expected benefit payments
|
||
|
(€ million)
|
||
|
2016
|
139
|
|
|
2017
|
139
|
|
|
2018
|
139
|
|
|
2019
|
139
|
|
|
2020
|
139
|
|
|
2021-2025
|
716
|
|
Changes in the net defined benefit obligations for healthcare and life insurance plans were as follows:
|
2015
|
2014
|
||||
|
(€ million)
|
|||||
|
Present value of obligations at January 1,
|
2,276
|
|
1,945
|
|
|
|
Included in the Consolidated Income Statement
|
134
|
|
126
|
|
|
|
Included in OCI:
|
|||||
|
Actuarial losses/(gains) from:
|
|||||
|
- Demographic assumptions
|
5
|
|
(95
|
)
|
|
|
- Financial assumptions
|
(9
|
)
|
187
|
|
|
|
- Other
|
1
|
|
—
|
|
|
|
Effect of movements in exchange rates
|
204
|
|
244
|
|
|
|
Other changes
|
|||||
|
Benefits paid
|
(152
|
)
|
(128
|
)
|
|
|
Other
|
—
|
|
(3
|
)
|
|
|
Present value of obligations at December 31,
|
2,459
|
|
2,276
|
|
|
F - 76
Amounts recognized in the Consolidated Income Statement were as follows:
|
For the Years Ended December 31,
|
||||||||
|
2015
|
2014
|
2013
|
||||||
|
(€ million)
|
||||||||
|
Current service cost
|
32
|
|
21
|
|
23
|
|
||
|
Interest expense
|
102
|
|
98
|
|
89
|
|
||
|
Past service costs (credits) and gains or losses arising from settlements
|
—
|
|
7
|
|
—
|
|
||
|
Total recognized in the Consolidated Income Statement
|
134
|
|
126
|
|
112
|
|
||
Health care and life insurance plans are accounted for on an actuarial basis, which requires the selection of various assumptions, in particular, it requires the use of estimates of the present value of the projected future payments to all participants, taking into consideration the likelihood of potential future events such as health care cost increases and demographic experience.
The weighted average assumptions used to determine the defined benefit obligations were as follows:
|
At December 31, 2015
|
At December 31, 2014
|
||||||||||
|
U.S.
|
Canada
|
U.S.
|
Canada
|
||||||||
|
Discount rate
|
4.5
|
%
|
4.2
|
%
|
4.1
|
%
|
3.9
|
%
|
|||
|
Salary growth
|
1.5
|
%
|
1.5
|
%
|
—
|
%
|
—
|
%
|
|||
|
Weighted average ultimate healthcare cost trend rate
|
4.5
|
%
|
4.3
|
%
|
5.0
|
%
|
3.6
|
%
|
|||
The average duration of the U.S. and Canadian liabilities was approximately 13 and 16 years, respectively.
The annual rate of increase in the per capita cost of covered U.S. health care benefits assumed for next year and used in the
2015
plan valuation was
7.0 percent
(
6.5 percent
in
2014
). The annual rate was assumed to decrease gradually to
4.5 percent
after 2029 and remain at that level thereafter. The annual rate of increase in the per capita cost of covered Canadian health care benefits assumed for next year and used in the
2015
plan valuation was
4.66 percent
(
3.3 percent
in
2014
). The annual rate was assumed to decrease gradually to
4.32 percent
in 2029 and remain at that level thereafter.
Other post-employment benefits
Other post-employment benefits includes other employee benefits granted to Group employees in Europe and comprises, amongst others, the Italian employee severance indemnity (“TFR”) obligation amounting to
€794 million
at
December 31, 2015
and
€886 million
at
December 31, 2014
. These schemes are required under Italian Law.
The amount of TFR to which each employee is entitled must be paid when the employee leaves the Group and is calculated based on the period of employment and the taxable earnings of each employee. Under certain conditions the entitlement may be partially advanced to an employee during their working life.
The legislation regarding this scheme was amended by Law 296 of December 27, 2006 and subsequent decrees and regulations issued in the first part of 2007. Under these amendments, companies with at least 50 employees are obliged to transfer the TFR to the “Treasury fund” managed by the Italian state-owned social security body (INPS) or to supplementary pension funds. Prior to the amendments, accruing TFR for employees of all Italian companies could be managed by the company itself. Consequently, the Italian companies’ obligation to INPS and the contributions to supplementary pension funds take the form, under IAS 19
- Employee Benefits,
of defined contribution plans whereas the amounts recorded in the provision for employee severance pay retain the nature of defined benefit plans. Accordingly, the provision for employee severance indemnity in Italy consists of the residual obligation for TFR until December 31, 2006. This is an unfunded defined benefit plan as the benefits have already been entirely earned, with the sole exception of future revaluations. Since 2007 the scheme has been classified as a defined contribution plan and the Group recognizes the associated cost over the period in which the employee renders service.
F - 77
Changes in defined benefit obligations for other post-employment benefits was as follows:
|
2015
|
2014
|
||||
|
(€ million)
|
|||||
|
Present value of obligations at January 1,
|
1,074
|
|
1,023
|
|
|
|
Included in the Consolidated Income Statement:
|
16
|
|
31
|
|
|
|
Included in OCI:
|
|||||
|
Actuarial (gains)/losses from:
|
|||||
|
Demographic assumptions
|
(1
|
)
|
(2
|
)
|
|
|
Financial assumptions
|
(27
|
)
|
81
|
|
|
|
Other
|
(11
|
)
|
14
|
|
|
|
Effect of movements in exchange rates
|
(1
|
)
|
1
|
|
|
|
Other:
|
|||||
|
Benefits paid
|
(60
|
)
|
(77
|
)
|
|
|
Change in the scope of consolidation
|
—
|
|
15
|
|
|
|
Transfer to Liabilities held for distribution
|
(23
|
)
|
—
|
|
|
|
Other
|
2
|
|
(12
|
)
|
|
|
Present value of obligations at December 31,
|
969
|
|
1,074
|
|
|
Amounts recognized in the Consolidated Income Statement were as follows:
|
For the Years Ended December 31,
|
||||||||
|
2015
|
|
2014
|
|
2013
|
|
|||
|
(€ million)
|
||||||||
|
Current service cost
|
10
|
|
20
|
|
9
|
|
||
|
Interest expense
|
6
|
|
11
|
|
15
|
|
||
|
Total recognized in the Consolidated Income Statement
|
16
|
|
31
|
|
24
|
|
||
The discount rates used for the measurement of the Italian TFR obligation are based on yields of high-quality (AA rated) fixed income securities for which the timing and amounts of maturities match the timing and amounts of the projected benefit payments. For this plan, the single weighted average discount rate that reflects the estimated timing and amount of the scheme future benefit payments for
2015
is equal to
1.6 percent
(
1.7 percent
in
2014
). The average duration of the Italian TFR is approximately
7
years. Retirement or employee leaving rates are developed to reflect actual and projected Group experience and law requirements for retirement in Italy.
Other provisions for employees and liabilities for share-based payments
At
December 31, 2015
, Other provisions for employees and liabilities for share-based payments consisted of other long term benefits obligations for
€384 million
(
€376 million
at
December 31, 2014
), representing the expected obligation for benefits, which include a bonus for tenure at the Company and long term disability benefits granted to certain employees.
F - 78
(
22
) Other provisions
Changes in Other provisions were as follows:
|
At
December 31, 2014 |
Additional
provisions |
Settlements
|
Unused
amounts |
Translation
differences |
Transfer to Liabilities held for distribution
|
Changes in
the scope of consolidation and other changes |
At
December 31, 2015 |
||||||||||||||||
|
(€ million)
|
|||||||||||||||||||||||
|
Product warranty and recall campaigns provision
|
4,845
|
|
4,710
|
|
(3,303
|
)
|
—
|
|
325
|
|
(80
|
)
|
(26
|
)
|
6,471
|
|
|||||||
|
Sales incentives
|
3,695
|
|
12,711
|
|
(11,472
|
)
|
(20
|
)
|
282
|
|
—
|
|
—
|
|
5,196
|
|
|||||||
|
Legal proceedings and disputes
|
575
|
|
103
|
|
(89
|
)
|
(29
|
)
|
(30
|
)
|
(47
|
)
|
17
|
|
500
|
|
|||||||
|
Commercial risks
|
381
|
|
288
|
|
(207
|
)
|
(31
|
)
|
6
|
|
(9
|
)
|
(107
|
)
|
321
|
|
|||||||
|
Restructuring provision
|
131
|
|
32
|
|
(42
|
)
|
(20
|
)
|
3
|
|
—
|
|
(5
|
)
|
99
|
|
|||||||
|
Other risks
|
1,153
|
|
342
|
|
(157
|
)
|
(119
|
)
|
43
|
|
(10
|
)
|
(47
|
)
|
1,205
|
|
|||||||
|
Total Other provisions
|
10,780
|
|
18,186
|
|
(15,270
|
)
|
(219
|
)
|
629
|
|
(146
|
)
|
(168
|
)
|
13,792
|
|
|||||||
Product warranty and recall campaigns provision at December 31, 2015 included the change in estimate for estimated future recall campaign costs for the U.S. and Canada of €761 million related to vehicles sold in periods prior to the third quarter of 2015 as well as additional warranty costs in the second half of 2015 related to the increase in the accrual rate per vehicle. Translation differences primarily related to the foreign currency translation from U.S.$ to Euro.
None of the provisions within the total Legal proceedings and disputes provision are individually significant. As described within the section
—
Use of Estimates
above, a provision for legal proceedings is recognized when it is deemed probable that the proceedings will result in an outflow of resources.
Commercial risks arise in connection with the sale of products and services such as maintenance contracts. An accrual is recorded when the expected costs to complete the services under these contracts exceed the revenues expected to be realized.
Other risks include, among other items: provisions for disputes with suppliers related to supply contracts or other matters that are not subject to legal proceedings, provisions for product liabilities arising from personal injuries including wrongful death and potential exemplary or punitive damages alleged to be the result of product defects, disputes with other parties relating to contracts or other matters not subject to legal proceedings and management's best estimate of the Group’s probable environmental obligations which also includes costs related to claims on environmental matters.
F - 79
(
23
) Debt
The following table summarizes debt by category and by maturity:
|
At December 31,
|
|||||||||||||||||||||||
|
2015
|
2014
|
||||||||||||||||||||||
|
Due
within one year |
Due
between one and five years |
Due
beyond five years |
Total
|
Due within
one year |
Due
between one and five years |
Due
beyond five years |
Total
|
||||||||||||||||
|
(€ million)
|
|||||||||||||||||||||||
|
Notes
|
2,689
|
|
7,017
|
|
3,735
|
|
13,441
|
|
2,292
|
|
10,367
|
|
4,989
|
|
17,648
|
|
|||||||
|
Borrowings from banks
|
3,364
|
|
7,803
|
|
795
|
|
11,962
|
|
3,670
|
|
8,131
|
|
950
|
|
12,751
|
|
|||||||
|
Payables represented by securities
|
490
|
|
226
|
|
209
|
|
925
|
|
559
|
|
544
|
|
270
|
|
1,373
|
|
|||||||
|
Asset-backed financing
|
206
|
|
—
|
|
—
|
|
206
|
|
444
|
|
25
|
|
—
|
|
469
|
|
|||||||
|
Other debt
|
619
|
|
498
|
|
135
|
|
1,252
|
|
745
|
|
424
|
|
314
|
|
1,483
|
|
|||||||
|
Total Debt
|
7,368
|
|
15,544
|
|
4,874
|
|
27,786
|
|
7,710
|
|
19,491
|
|
6,523
|
|
33,724
|
|
|||||||
The decrease in total Debt was €6,174 million, net of foreign exchange translation effects. The decrease reflects the repayment of two notes at their respective maturity dates that had been issued under the Global Medium Term Note Programme (“GMTN Programme”), one for a principal amount of €1,500 million and another for a principal amount of CHF 425 million (€390 million), the prepayment of FCA US's secured senior notes due June 15, 2019 for an aggregate principal amount of €2,518 million (U.S.$2,875 million), the prepayment of FCA US's secured senior notes due June 15, 2021 for an aggregate principal amount of €2,833 million (U.S.$3,080 million), the repayment of the loan granted by the European Investment Bank ("EIB") of €250 million at maturity as well as a total of €288 million for payments including interest on the unsecured Canadian Health Care Trust Notes (“Canadian HCT Notes”
)
, which also included the prepayment of the remaining scheduled payments of the Canada Health Care Trust Tranche A Note (“Canadian HCT Tranche A Note”). The decrease in total Debt was partially offset by the issuance of the new unsecured senior debt securities by FCA in April 2015 (described below) for a total principal amount of U.S.$3.0 billion (€2.8 billion) and the draw-down of the €600 million loan with EIB and SACE that was executed in June 2015 (described below). During the year ended
December 31, 2015
, medium and long-term loans (those expiring after twelve months) obtained by FCA amounted to €
3,061 million
, while medium and long-term borrowings repayments amounted to €
4,412 million
.
The annual effective interest rates and the nominal currencies of debt at
December 31, 2015
and
2014
were as follows:
|
Interest rate
|
Total at December 31, 2015
|
||||||||||||||||
|
less than
5% |
from 5% to
7.5% |
from 7.5%
to 10% |
from 10%
to 12.5% |
more than 12.5%
|
|||||||||||||
|
(€ million)
|
|||||||||||||||||
|
Euro
|
6,671
|
|
5,358
|
|
1,003
|
|
75
|
|
—
|
|
13,107
|
|
|||||
|
U.S.$
|
7,784
|
|
1,685
|
|
1
|
|
5
|
|
190
|
|
9,665
|
|
|||||
|
Brazilian Real
|
723
|
|
383
|
|
794
|
|
87
|
|
1,075
|
|
3,062
|
|
|||||
|
Swiss Franc
|
652
|
|
369
|
|
—
|
|
—
|
|
—
|
|
1,021
|
|
|||||
|
Canadian Dollar
|
12
|
|
—
|
|
354
|
|
—
|
|
—
|
|
366
|
|
|||||
|
Chinese Renminbi
|
114
|
|
51
|
|
—
|
|
—
|
|
—
|
|
165
|
|
|||||
|
Argentinian Peso
|
—
|
|
—
|
|
3
|
|
—
|
|
155
|
|
158
|
|
|||||
|
Other
|
174
|
|
1
|
|
29
|
|
32
|
|
6
|
|
242
|
|
|||||
|
Total Debt
|
16,130
|
|
7,847
|
|
2,184
|
|
199
|
|
1,426
|
|
27,786
|
|
|||||
F - 80
|
Interest rate
|
Total at December 31, 2014
|
||||||||||||||||
|
less than
5% |
from 5% to
7.5% |
from 7.5%
to 10% |
from 10%
to 12.5% |
more than 12.5%
|
|||||||||||||
|
(€ million)
|
|||||||||||||||||
|
Euro
|
6,805
|
|
7,500
|
|
1,003
|
|
87
|
|
—
|
|
15,395
|
|
|||||
|
U.S.$
|
5,769
|
|
2,651
|
|
2,537
|
|
8
|
|
206
|
|
11,171
|
|
|||||
|
Brazilian Real
|
1,720
|
|
430
|
|
282
|
|
376
|
|
1,330
|
|
4,138
|
|
|||||
|
Swiss Franc
|
593
|
|
686
|
|
—
|
|
—
|
|
—
|
|
1,279
|
|
|||||
|
Canadian Dollar
|
31
|
|
229
|
|
393
|
|
—
|
|
—
|
|
653
|
|
|||||
|
Mexican Peso
|
—
|
|
164
|
|
233
|
|
—
|
|
—
|
|
397
|
|
|||||
|
Chinese Renminbi
|
1
|
|
333
|
|
—
|
|
—
|
|
—
|
|
334
|
|
|||||
|
Other
|
197
|
|
20
|
|
37
|
|
24
|
|
79
|
|
357
|
|
|||||
|
Total Debt
|
15,116
|
|
12,013
|
|
4,485
|
|
495
|
|
1,615
|
|
33,724
|
|
|||||
For further information on the management of interest rate and currency risk, refer to Note
31
.
F - 81
Notes
The following table summarizes the outstanding notes at
December 31, 2015
and 2014:
|
At December 31,
|
||||||||||||||
|
Currency
|
Face value of
outstanding notes (million) |
Coupon %
|
Maturity
|
2015
|
2014
|
|||||||||
|
Global Medium Term Note Programme:
|
(€ million)
|
|||||||||||||
|
Fiat Chrysler Finance Europe S.A.
(1)
|
EUR
|
1,500
|
|
6.875
|
February 13, 2015
|
—
|
|
1,500
|
|
|||||
|
Fiat Chrysler Finance Europe S.A.
(2)
|
CHF
|
425
|
|
5.000
|
September 7, 2015
|
—
|
|
353
|
|
|||||
|
Fiat Chrysler Finance Europe S.A.
(1)
|
EUR
|
1,000
|
|
6.375
|
April 1, 2016
|
1,000
|
|
1,000
|
|
|||||
|
Fiat Chrysler Finance Europe S.A.
(1)
|
EUR
|
1,000
|
|
7.750
|
October 17, 2016
|
1,000
|
|
1,000
|
|
|||||
|
Fiat Chrysler Finance Europe S.A.
(2)
|
CHF
|
400
|
|
5.250
|
November 23, 2016
|
369
|
|
333
|
|
|||||
|
Fiat Chrysler Finance Europe S.A.
(1)
|
EUR
|
850
|
|
7.000
|
March 23, 2017
|
850
|
|
850
|
|
|||||
|
Fiat Chrysler Finance North America Inc.
(1)
|
EUR
|
1,000
|
|
5.625
|
June 12, 2017
|
1,000
|
|
1,000
|
|
|||||
|
Fiat Chrysler Finance Europe S.A.
(2)
|
CHF
|
450
|
|
4.000
|
November 22, 2017
|
415
|
|
374
|
|
|||||
|
Fiat Chrysler Finance Europe S.A.
(1)
|
EUR
|
1,250
|
|
6.625
|
March 15, 2018
|
1,250
|
|
1,250
|
|
|||||
|
Fiat Chrysler Finance Europe S.A.
(1)
|
EUR
|
600
|
|
7.375
|
July 9, 2018
|
600
|
|
600
|
|
|||||
|
Fiat Chrysler Finance Europe S.A.
(2)
|
CHF
|
250
|
|
3.125
|
September 30, 2019
|
231
|
|
208
|
|
|||||
|
Fiat Chrysler Finance Europe S.A.
(1)
|
EUR
|
1,250
|
|
6.750
|
October 14, 2019
|
1,250
|
|
1,250
|
|
|||||
|
Fiat Chrysler Finance Europe S.A.
(1)
|
EUR
|
1,000
|
|
4.750
|
March 22, 2021
|
1,000
|
|
1,000
|
|
|||||
|
Fiat Chrysler Finance Europe S.A.
(1)
|
EUR
|
1,350
|
|
4.750
|
July 15, 2022
|
1,350
|
|
1,350
|
|
|||||
|
Others
|
EUR
|
7
|
|
7
|
|
7
|
|
|||||||
|
Total Global Medium Term Notes
|
10,322
|
|
|
12,075
|
|
|||||||||
|
|
|
|
|
|
||||||||||
|
Other Notes:
|
||||||||||||||
|
FCA US (Secured Senior Notes)
|
U.S.$
|
2,875
|
|
8.000
|
June 15, 2019
|
—
|
|
|
2,368
|
|
||||
|
FCA US (Secured Senior Notes)
|
U.S.$
|
3,080
|
|
8.250
|
June 15, 2021
|
—
|
|
|
2,537
|
|
||||
|
FCA Notes
(1)
|
U.S.$
|
|
1,500
|
|
|
4.500
|
|
April 15, 2020
|
|
1,378
|
|
—
|
|
|
|
FCA Notes
(1)
|
U.S.$
|
|
1,500
|
|
|
5.250
|
|
April 15, 2023
|
|
1,378
|
|
—
|
|
|
|
Total Other Notes
|
2,756
|
|
|
4,905
|
|
|||||||||
|
Hedging effect, accrued interest and amortized cost valuation
|
363
|
|
|
668
|
|
|||||||||
|
Total Notes
|
13,441
|
|
|
17,648
|
|
|||||||||
_________________________
(1) Listing on the Irish Stock Exchange was obtained.
(2) Listing on the SIX Swiss Exchange was obtained.
Notes Issued Through GMTN Programme
Certain notes issued by the Group, excluding FCA US, are governed by the terms and conditions of the GMTN Programme. A maximum of €20 billion may be used under this program, of which notes of approximately €
10.3 billion
were outstanding at
December 31, 2015
(€
12.1 billion
at
December 31, 2014
). The GMTN Programme is guaranteed by FCA, which may from time to time buy back notes in the market that have been issued. Such buybacks, if made, depend upon market conditions, the Group's financial situation and other factors which could affect such decisions.
F - 82
Changes in notes issued under the GMTN Programme during the year ended December 31,
2015
were due to the:
|
•
|
repayment at maturity of two notes that had been issued by Fiat Chrysler Finance Europe S.A, one with a principal value of €1,500 million and one with a principal value of CHF 425 million (€390 million).
|
Changes in notes issued under the GMTN Programme during the year ended December 31, 2014 were due to the:
|
•
|
issuance of 4.75 percent notes at par in March 2014, having a principal of €1 billion and due March 2021 by Fiat Chrysler Finance Europe S.A.
|
|
•
|
issuance of 4.75 percent notes at par in July 2014, having a principal of €850 million and due July 2022 by Fiat Chrysler Finance Europe S.A. The notes issuance was reopened in September 2014 for a further €500 million principal value, priced at 103.265 percent of par value, increasing the total principal amount to €1.35 billion.
|
|
•
|
issuance of 3.125 percent notes at par in September 2014 having a principal of CHF 250 million and due September 2019 by Fiat Chrysler Finance Europe S.A.
|
|
•
|
repayment at maturity of two notes that had been issued by Fiat Chrysler Finance Europe S.A, one with a principal value of €900 million and one with a principal value of €1,250 million.
|
The notes issued by Fiat Chrysler Finance Europe S.A. and by Fiat Chrysler Finance North America Inc. impose covenants on the issuer and, in certain cases, on FCA as guarantor, which include: (i) negative pledge clauses which require that, in case any security interest upon assets of the issuer and/or FCA is granted in connection with other notes or debt securities having the same ranking, such security should be equally and ratably extended to the outstanding notes; (ii)
pari passu
clauses, under which the notes rank and will rank
pari passu
with all other present and future unsubordinated and unsecured obligations of the issuer and/or FCA; (iii) periodic disclosure obligations; (iv) cross-default clauses which require immediate repayment of the notes under certain events of default on other financial instruments issued by FCA’s main entities; and (v) other clauses that are generally applicable to securities of a similar type. A breach of these covenants may require the early repayment of the notes. At December 31, 2015, FCA was in compliance with all covenants under the GMTN programme.
FCA US Secured Senior Notes
In February 2014, FCA US and certain of its U.S. subsidiaries, either as a co-issuer or guarantor, issued additional secured senior notes:
|
•
|
secured senior notes due 2019 – U.S.$1,375 million (€1,133 million at December 31, 2014) aggregate principal amount of 8.0 percent secured senior notes due June 15, 2019 (collectively with the May 2011 issuance of U.S.$1,500 million (€1,235 million at December 31, 2014) secured senior notes due 2019, the “2019 Notes”) at an issue price of 108.25 percent of the aggregate principal amount; and
|
|
•
|
secured senior notes due 2021 – U.S.$1,380 million (€1,137 million at December 31, 2014) aggregate principal amount of 8.25 percent secured senior notes due June 15, 2021 (collectively with the May 2011 issuance of U.S.$1,700 million (€1,400 million at December 31, 2014) secured senior notes due 2021, the “2021 Notes”) at an issue price of 110.50 percent of the aggregate principal amount.
|
The 2019 Notes and 2021 Notes are collectively referred to as the “Secured Senior Notes”.
On May 14, 2015, FCA US prepaid its 2019 Notes with an aggregate principal amount outstanding of U.S.$2,875 million (€2,518 million) at a price equal to the principal amount of the notes redeemed, plus accrued and unpaid interest to the date of redemption and a “make-whole” premium calculated in accordance with the terms of the indenture. The redemption payment of U.S.$3.1 billion (€2.7 billion) was made with cash on hand at FCA US. In connection with the redemption, a charge of €51 million, which consisted of the “make-whole” premium and the write-off of the remaining unamortized debt issuance costs partially offset by the write-off of the remaining unamortized debt premium, was recorded as a loss on extinguishment of debt within Net financial expenses in the Consolidated Income Statement during the year ended December 31, 2015.
F - 83
On December 21, 2015, FCA US prepaid its 2021 Notes with an aggregate principal amount outstanding of U.S.$3,080 million (
€2,833
million) at a price equal to the principal amount of the notes redeemed, plus accrued and unpaid interest to the date of redemption and a “make-whole” premium calculated in accordance with the terms of the indenture. The redemption payment of U.S.$
3.3
billion (
€3.0
billion) was made with cash on hand at FCA US. In connection with the redemption, a charge of €117 million, which consisted of the “make-whole” premium and the write-off of the remaining unamortized debt issuance costs partially offset by the write-off of the remaining unamortized debt premium, was recorded as a loss on extinguishment of debt within Net financial expenses in the Consolidated Income Statement during the year ended December 31, 2015.
Notes Issued by FCA
In April 2015, FCA issued U.S.$1.5 billion (€1.4 billion) principal amount of 4.5 percent unsecured senior debt securities due April 15, 2020 (the “Initial 2020 Notes”) and U.S.$1.5 billion (€1.4 billion) principal amount of 5.25 percent unsecured senior debt securities due April 15, 2023 (the “Initial 2023 Notes”) at an issue price of 100 percent of their principal amount. The Initial 2020 Notes and the Initial 2023 Notes, collectively referred to as “the Initial Notes”, rank
pari passu
in right of payment with respect to all of FCA's existing and future senior unsecured indebtedness and senior in right of payment to any of FCA's future subordinated indebtedness and existing indebtedness, which is by its terms subordinated in right of payment to the Initial Notes.
On June 17, 2015, subject to the terms and conditions set forth in our prospectus, we commenced an offer to exchange up
to U.S.$1.5 billion (€1.4 billion) aggregate principal amount of new 4.5 percent unsecured senior debt securities due 2020 (“2020 Notes”), for any and all of our outstanding Initial 2020 Notes issued on April 14, 2015, and up to U.S.$1.5 billion (€1.4 billion) aggregate principal amount of new 5.25 percent unsecured senior debt securities due 2023 (“2023 Notes”), for any and all of our outstanding Initial 2023 Notes issued on April 14, 2015. The 2020 Notes and the 2023 Notes, collectively referred to as “the Notes”, were identical in all material respects to the Initial Notes, except that the Notes did not contain restrictions on transfer. The exchange offer expired on July 23, 2015. Substantially all of the Initial Notes were tendered for the Notes.
The Notes impose covenants on FCA including: (i) negative pledge clauses which require that, in case any security interest upon assets of FCA is granted in connection with other notes or debt securities having the same ranking, such security should be equally and ratably extended to the outstanding Notes; (ii)
pari passu
clauses, under which the Notes rank and will rank
pari passu
with all other present and future unsubordinated and unsecured obligations of FCA; (iii) periodic disclosure obligations; (iv) cross-default clauses which require immediate repayment of the Notes under certain events of default on other financial instruments issued by FCA’s main entities; and (v) other clauses that are generally applicable to securities of a similar type. A breach of these covenants may require the early repayment of the Notes. As of December 31, 2015, FCA was in compliance with the covenants of the Notes.
FCA used the net proceeds from the offering of the Notes for general corporate purposes and the refinancing of a portion of the outstanding Secured Senior Notes. Debt issuance costs, arrangement fees and other direct costs were split evenly across the 2020 Notes and the 2023 Notes, were recorded as a reduction in the carrying value of the Notes and are amortized using the effective interest rate method over the respective life of the Notes. Interest on the 2020 Notes and the 2023 Notes is payable semi-annually in April and October.
Borrowings from banks
Senior Credit Facilities - FCA US
At
December 31, 2015
, Borrowings from banks included the tranche B term loan maturing May 24, 2017 of FCA US which consists of the original U.S.$3.0 billion tranche B term loan (
€2.8
billion) that matures on May 24, 2017, (the “Original Tranche B Term Loan”), and an additional U.S.$250 million (
€230
million at December 31, 2015) term loan entered into on February 7, 2014 under the Original Tranche B Term Loan that also matures on May 24, 2017, collectively the “Tranche B Term Loan due 2017.” At
December 31, 2015
,
€2,863
million (€2,587 million at
December 31, 2014
), which included accrued interest, was outstanding under the Tranche B Term Loan due 2017. The outstanding principal amount of the Tranche B Term Loan due 2017 is payable in equal quarterly installments of U.S.$8.1 million (
€7.4 million
) from March 2014, with the remaining balance due at maturity in May 2017. The Tranche B Term Loan due 2017 bears interest, at FCA's option, at either a base rate plus 1.75 percent per annum or at LIBOR plus 2.75 percent per annum, subject to a base rate floor
F - 84
of 1.75 percent per annum or a LIBOR floor of 0.75 percent per annum. For the years ended December 31, 2015 and 2014, interest was accrued based on LIBOR.
On February 7, 2014, FCA US entered into a new U.S.$1,750 million (€
1,607
million) tranche B term loan issued under a new credit facility, that matures on December 31, 2018 of FCA US (the “Tranche B Term Loan due 2018”). At
December 31, 2015
, €
1,574
million (€1,421 million at
December 31, 2014
), which included accrued interest, was outstanding under the Tranche B Term Loan due 2018. The outstanding principal amount for the Tranche B Term Loan due 2018 is payable in equal quarterly installments of U.S.$4.4 million (
€4.0
million) from June 30, 2014, with the remaining balance due at maturity. The Tranche B Term Loan due 2018 bears interest, at FCA US’s option, either at a base rate plus 1.5 percent per annum or at LIBOR plus 2.5 percent per annum, subject to a base rate floor of 1.75 percent per annum or a LIBOR floor of 0.75 percent per annum. For the years ended December 31, 2015 and 2014, interest was accrued based on LIBOR.
FCA US may pre-pay, refinance or re-price the Tranche B Term Loan due 2017 and the Tranche B Term Loan due 2018, collectively referred to as the “Senior Credit Facilities”, without premium or penalty.
The Senior Credit Facilities are secured by a senior priority security interest in substantially all of FCA US’s assets and the assets of its U.S. subsidiary guarantors, subject to certain exceptions. The collateral includes 100 percent of the equity interests in FCA US's U.S. subsidiaries and 65 percent of the equity interests in certain of its non-U.S. subsidiaries held directly by FCA US and its U.S. subsidiary guarantors.
The credit agreements that govern the Senior Credit Facilities (the “Senior Credit Agreements”) include a number of affirmative covenants, many of which are customary, including, but not limited to, the reporting of financial results and other developments, compliance with laws, payment of taxes, maintenance of insurance and similar requirements. The Senior Credit Agreements also include negative covenants, including but not limited to: (i) limitations on incurrence, repayment and prepayment of indebtedness; (ii) limitations on incurrence of liens; (iii) limitations on making restricted payments, including a limit on declaring dividends or distributions to FCA; (iv) limitations on transactions with affiliates, swap agreements and sale and leaseback transactions; (v) limitations on fundamental changes, including certain asset sales and (vi) restrictions on certain subsidiary distributions. In addition, the Senior Credit Agreements require FCA US to maintain a minimum ratio of “borrowing base” to “covered debt” (as defined in the Senior Credit Agreements), as well as a minimum liquidity of U.S.$3.0 billion (
€2.8
billion). Furthermore, the Senior Credit Agreements contain a number of events of default related to: (i) failure to make payments when due; (ii) failure to comply with covenants; (iii) breaches of representations and warranties; (iv) certain changes of control; (v) cross–default with certain other debt and hedging agreements and (vi) the failure to pay or post bond for certain material judgments. While the Senior Credit Facilities are outstanding, distributions to FCA will be limited to 50 percent of FCA US’s consolidated net income (as defined in the agreements) from January 2012 less distributions paid to date.
As of
December 31, 2015
, FCA US was in compliance with the covenants of the Senior Credit Agreements.
Revolving Credit Facilities
In June 2015, FCA entered into a new €5.0 billion syndicated revolving credit facility (“RCF”). The RCF, which is for general corporate purposes and working capital needs of the Group, replaced and expanded the €2.1 billion three-year revolving credit facility entered into by FCA on June 21, 2013 and replaced the U.S.$1.3 billion five-year revolving credit facility of FCA US (“FCA US RCF”) that was scheduled to expire on May 24, 2016. On November 25, 2015, FCA US terminated its undrawn FCA US RCF.
The RCF is available in two tranches. As of
December 31, 2015
, the first tranche of €2.5 billion was available and was undrawn. The first tranche matures in July 2018 and has two extension options (1-year and 11-months, respectively) which are exercisable on the first and second anniversary of signing. The second tranche, which consists of an additional €2.5 billion, matures in June 2020 and will be available upon the elimination of the restrictions under certain of FCA US's financing documentation on the provision of guarantees and payment of dividends by FCA US for the benefit of the rest of the Group (as described above in respect of the Senior Credit Facilities).
The covenants of the RCF include financial covenants (Net Debt/Adjusted Earnings Before Interest, Depreciation and Amortization ("Adjusted EBITDA") and Adjusted EBITDA/Net Interest ratios related to industrial activities) and negative pledge,
pari passu
, cross default and change of control clauses. The failure to comply with these covenants and, in
F - 85
certain cases if not suitably remedied, can lead to the requirement of early repayment of any outstanding amounts. At December 31, 2015, FCA was in compliance with the covenants of the RCF.
At December 31, 2015, undrawn committed credit lines totaling €3.4 billion included the first tranche of €2.5 billion of the new €5.0 billion RCF and approximately €0.9 billion of other revolving credit facilities. At December 31, 2014, undrawn committed credit lines included the €2.1 billion syndicated revolving credit facility entered into by FCA in 2013 and the U.S.$1.3 billion FCA US RCF.
European Investment Bank Borrowings
We have financing agreements with the EIB for a total of €1.2 billion outstanding at December 31, 2015 (€1.1 billion outstanding at December 31, 2014), which included the (i) new €600 million facility described below, (ii) a facility of €400 million (maturing in 2018) for supporting certain investments and research and development programs in Italy to protect the environment through the reduction of emissions and improved energy efficiency and (iii) a €500 million facility (maturing in 2021) for an investment program relating to the modernization and expansion of production capacity of an automotive plant in Serbia.
On June 29, 2015, FCA, EIB and SACE finalized a €600 million loan earmarked to support the Group's automotive research, development and production plans for 2015 to 2017 which includes studies for efficient vehicle technologies for vehicle safety and new vehicle architectures. The three-year loan due July 2018 provided by EIB, which is also 50 percent guaranteed by SACE, relates to FCA's production and research and development sites in both northern and southern Italy. The loan was drawn in full at
December 31, 2015
.
Brazil
Our Brazilian subsidiaries have access to various local bank facilities in order to fund investments and operations.
Total debt outstanding under those facilities amounted to €4.1 billion at December 31, 2015 (€
4.7 billion
at December 31, 2014), of which €3.6 billion are medium term loans (€
4.3 billion
at December 31, 2014), with an average residual maturity between 2 to 3 years, while €0.5 billion (€
0.4 billion
at December 31, 2014) are short-term credit facilities. Medium-term facilities primarily include subsidized loans granted by such public financing institutions as Banco Nacional do Desenvolvimento ("BNDES"), with the aim to support industrial projects in certain areas. This provided the Group the opportunity to fund large investments in Brazil, with loans of sizeable amounts at low rates and with maturities greater than 10 years. At December 31, 2015, outstanding subsidized loans amounted to €1.9 billion (€
2.3 billion
at December 31, 2014), of which €1.2 billion (
€1.2 billion
at December 31, 2014), related to the construction of the plant in Pernambuco (Brazil), which has been supported by subsidized credit lines totaling Brazilian Real ("BRL") 6.5 billion (€1.5 billion). Approximately €0.3 billion of committed credit lines contracted to fund scheduled investments in the area were undrawn at December 31, 2015 (
€0.9 billion
at December 31, 2014). The average residual maturity of the subsidized loans was approximately 4 years.
Mexico Bank Loan
On March 20, 2015, FCA Mexico, S.A. de C.V., (“FCA Mexico”), our principal operating subsidiary in Mexico, entered into a U.S.$900 million (
€0.8
billion) non-revolving loan agreement (“Mexico Bank Loan”) maturing on March 20, 2022 and received an initial disbursement of U.S.$500 million (
€0.5
billion at
December 31, 2015
), which bears interest at one-month LIBOR plus 3.35 percent per annum. Effective July 20, 2015, the Group extended the disbursement term of the Mexico Bank Loan through September 20, 2016, during which time the remaining U.S.$400 million (
€0.4
billion at December 31, 2015) is available for disbursement, subject to meeting certain preconditions for additional disbursements and a commitment fee of 0.50 percent per annum on the undisbursed balance. Principal payments are due on the loan in seventeen equal quarterly installments based on the total amount of all disbursements made under the loan agreement, beginning March 20, 2018, and interest is paid monthly throughout the term of the loan. The loan agreement requires FCA Mexico to maintain certain fixed and other assets as collateral, and comply with certain covenants, including, but not limited to, financial maintenance covenants, limitations on liens, incurrence of debt and asset sales. At December 31, 2015, the Group was in compliance with all covenants under the Mexico Bank Loan. The Group may not prepay all or any portion of the loan prior to the 18-month anniversary of the effective date of the loan agreement. The proceeds of this transaction were used to prepay all amounts outstanding under the Mexican development bank credit facilities amounting to approximately €414 million. In connection with the prepayment of the Mexican development bank credit facilities, a loss on extinguishment of debt of €9 million was recorded within Net financial expenses in the Consolidated Income Statement for the year ended
December 31,
F - 86
2015
reflecting the write-off of the remaining unamortized debt issuance costs. At December 31, 2015, €0.4 billion of the Mexico Bank Loan was undisbursed.
Payables represented by securities
At
December 31, 2015
, Payables represented by securities primarily included the unsecured Canadian HCT Notes totaling
€366 million
, including accrued interest, (
€651 million
at
December 31, 2014
, including accrued interest), which represents FCA US’s principal Canadian subsidiary’s financial liability to the Canadian Health Care Trust arising from the settlement of its obligations for postretirement health care benefits for National Automobile, Aerospace, Transportation and General Workers Union of Canada “CAW” (now part of Unifor), which represented employees, retirees and dependents. During the year ended
December 31, 2015
, FCA US's Canadian subsidiary made payments on the Canadian HCT Notes, which included prepayments on the remaining scheduled payments due on the Canada HCT Tranche A Note and accrued interest, totaling €288 million. The prepayment on the Canadian HCT Tranche A Note made on July 31, 2015 resulted in a €16 million gain on extinguishment of debt that was recorded within Net financial expenses in the Consolidated Income Statement for the year ended December 31, 2015.
As described in more detail in Note
19
, FCA issued Mandatory Convertible Securities with an aggregate notional amount of U.S.$2,875 million (€2,293 million). The obligation to pay coupons as required by the Mandatory Convertible Securities meets the definition of a financial liability as it is a contractual obligation to deliver cash to another entity. The fair value amount determined for the liability component at issuance of the Mandatory Convertible Securities was U.S.$419 million (€335 million at
December 31, 2014
) calculated as the present value of the coupon payments due less allocated transaction costs of U.S.$9 million (€7 million at
December 31, 2014
) that are accounted for as a debt discount. Subsequent to issuance, the financial liability for the coupon payments is accounted for at amortized cost. At
December 31, 2015
, the financial liability component was U.S.$216 million (€199 million) (U.S.$420 million or €346 million at
December 31, 2014
).
During the year ended December 31, 2014, the balance of FCA US's financial liability to the VEBA Trust (the “VEBA Trust Note”) that had been issued by FCA US in connection with the settlement of its obligations related to postretirement healthcare benefits for certain UAW retirees, was prepaid. The proceeds of the February 7, 2014 issuances of the Secured Senior Notes and the Senior Credit Facilities were used to prepay all amounts outstanding of approximately $5.0 billion (€3.6 billion) under the VEBA Trust Note. The $4,715 million (€3,473 million) principal payment of the VEBA Trust Note consisted of $128 million (€94 million) of interest that was previously capitalized as additional debt with the remaining $4,587 million (€3,379 million) representing the original face value of the VEBA Trust Note.
Asset-backed financing
Asset-backed financing represents the amount of financing received through factoring transactions which do not meet IAS 39 derecognition requirements and are recognized as assets of the same amount in the Consolidated Statement of Financial Position within Current receivables and other current assets (Note
15
). At
December 31, 2015
the Group’s assets include current receivables to settle Asset-backed financing of €
206 million
(€469 million at
December 31, 2014
).
Debt secured by assets
At
December 31, 2015
, debt secured by assets of the Group (excluding FCA US) amounted to
€747 million
(
€777 million
at
December 31, 2014
), of which
€373 million
(
€379 million
at
December 31, 2014
) was due to creditors for assets acquired under finance leases and the remaining amount mainly related to subsidized financing in Latin America. The total carrying amount of assets acting as security for loans for the Group (excluding FCA US) amounted to
€1,400 million
at
December 31, 2015
(
€1,670 million
at
December 31, 2014
) (Note 12).
At
December 31, 2015
, debt secured by assets of FCA US amounted to
€5,254 million
and included
€4,437 million
relating to the Senior Credit Facilities,
€243 million
due to creditors for assets acquired under finance leases and
€574 million
for other debt and financial commitments. At December 31, 2014 debt secured by assets of FCA US of
€9,881 million
included
€9,093 million
relating to the Secured Senior Notes and Senior Credit Facilities,
€251 million
due to creditors for assets acquired under finance leases and
€537 million
for other debt and financial commitments.
F - 87
Other debt
The following table summarizes the Group's payables for finance leases:
|
At December 31,
|
|||||||||||||||||||||||||||||
|
2015
|
2014
|
||||||||||||||||||||||||||||
|
Due
within one year |
Due
between one and three years |
Due
between three and five years |
Due
beyond five years |
Total
|
Due
within one year |
Due
between one and three years |
Due
between three and five years |
Due
beyond five years |
Total
|
||||||||||||||||||||
|
(€ million)
|
|||||||||||||||||||||||||||||
|
Minimum future lease
payments |
115
|
|
211
|
|
182
|
|
190
|
|
698
|
|
114
|
|
209
|
|
188
|
|
243
|
|
754
|
|
|||||||||
|
Interest expense
|
(25
|
)
|
(37
|
)
|
(16
|
)
|
(4
|
)
|
(82
|
)
|
(33
|
)
|
(51
|
)
|
(31
|
)
|
(9
|
)
|
(124
|
)
|
|||||||||
|
Present value of minimum
lease payments |
90
|
|
174
|
|
166
|
|
186
|
|
616
|
|
81
|
|
158
|
|
157
|
|
234
|
|
630
|
|
|||||||||
At
December 31, 2015
and 2014, the Group (excluding FCA US) had outstanding financial lease agreements for assets whose overall net carrying amount totaled €
379 million
and €
383 million
, respectively. FCA US had outstanding financial lease agreements for assets whose net carrying amount totaled €470 million and €414 million at December 31, 2015 and 2014, respectively (Note
12
).
(
24
) Other current liabilities
Other current liabilities consisted of the following:
|
At December 31,
|
|||||
|
2015
|
2014
|
||||
|
(€ million)
|
|||||
|
Advances on buy-back agreements
|
2,492
|
|
2,571
|
|
|
|
Indirect tax payables
|
1,305
|
|
1,495
|
|
|
|
Accrued expenses and deferred income
|
3,178
|
|
2,992
|
|
|
|
Payables to personnel
|
972
|
|
932
|
|
|
|
Social security payables
|
333
|
|
338
|
|
|
|
Amounts due to customers for contract work
|
227
|
|
252
|
|
|
|
Other
|
2,423
|
|
2,915
|
|
|
|
Total Other current liabilities
|
10,930
|
|
|
11,495
|
|
An analysis of Other current liabilities (excluding Accrued expenses and deferred income) by due date was as follows:
|
At December 31,
|
|||||||||||||||||||||||
|
2015
|
2014
|
||||||||||||||||||||||
|
Due within one year
|
Due
between one and five years |
Due
beyond five years |
Total
|
Due within
one year |
Due
between one and five years |
Due
beyond five years |
Total
|
||||||||||||||||
|
(€ million)
|
|||||||||||||||||||||||
|
Total Other current liabilities (excluding Accrued expenses and deferred income)
|
6,728
|
|
1,013
|
|
11
|
|
7,752
|
|
7,248
|
|
1,230
|
|
25
|
|
8,503
|
|
|||||||
F - 88
Advances on buy-back agreements refers to buy-back agreements entered into by the Group and includes the price received for the product recognized as an advance at the date of the sale, and subsequently, the repurchase price and the remaining lease installments yet to be recognized.
Indirect tax payables includes taxes on commercial transactions accrued by the Brazilian subsidiary, FCA Brazil, for which the company (as well as a number of important industrial groups that operate in Brazil) is awaiting the decision by the Supreme Court regarding its claim alleging double taxation. In March 2007, FCA Brazil received a preliminary trial court decision allowing the payment of such tax on a taxable base consistent with the Group’s position. Since it is a preliminary decision and the amount may be required to be paid to the tax authorities at any time, the difference between the tax payments as preliminary allowed and the full amount determined as required by the legislation still in force is recognized as a current liability due between one and five years. Timing for the Supreme Court decision is not predictable.
Included within Other current liabilities is the outstanding obligation of
€313 million
arising from the MOU signed by FCA US and the UAW. For further information on the MOU refer to the section —
Changes in Scope of Consolidation -
Acquisition of the remaining ownership interest in FCA US
.
Deferred income includes revenues not yet recognized in relation to separately-priced extended warranties and service contracts offered by FCA US. These revenues will be recognized in the Consolidated Income Statement over the contract period in proportion to the costs expected to be incurred based on historical information.
(
25
) Fair value measurement
Assets and liabilities that are measured at fair value on a recurring basis
The following table shows the fair value hierarchy for financial assets and liabilities that are measured at fair value on a recurring basis at
December 31, 2015
and December 31, 2014:
|
At December 31, 2015
|
At December 31, 2014
|
||||||||||||||||||||||||
|
Note
|
Level 1
|
Level 2
|
Level 3
|
Total
|
Level 1
|
Level 2
|
Level 3
|
Total
|
|||||||||||||||||
|
(€ million)
|
|||||||||||||||||||||||||
|
Assets at fair value available-for-sale:
|
|||||||||||||||||||||||||
|
Investments at fair value with changes directly in Other comprehensive income/(loss)
|
(13)
|
184
|
|
19
|
|
—
|
|
203
|
|
110
|
|
14
|
|
—
|
|
124
|
|
||||||||
|
Other non-current securities
|
(13)
|
31
|
|
—
|
|
12
|
|
43
|
|
45
|
|
—
|
|
22
|
|
67
|
|
||||||||
|
Current securities available-for-sale
|
(16)
|
264
|
|
5
|
|
—
|
|
269
|
|
30
|
|
—
|
|
—
|
|
30
|
|
||||||||
|
Financial assets at fair value held-for-trading:
|
—
|
|
|||||||||||||||||||||||
|
Current investments
|
48
|
|
—
|
|
—
|
|
48
|
|
36
|
|
—
|
|
—
|
|
36
|
|
|||||||||
|
Current securities held for trading
|
(16)
|
213
|
|
—
|
|
—
|
|
213
|
|
180
|
|
—
|
|
—
|
|
180
|
|
||||||||
|
Other financial assets
|
(17)
|
40
|
|
813
|
|
—
|
|
853
|
|
38
|
|
473
|
|
4
|
|
515
|
|
||||||||
|
Cash and cash equivalents
|
(18)
|
18,097
|
|
2,565
|
|
—
|
|
20,662
|
|
20,804
|
|
2,036
|
|
—
|
|
22,840
|
|
||||||||
|
Total Assets
|
18,877
|
|
3,402
|
|
12
|
|
22,291
|
|
21,243
|
|
2,523
|
|
26
|
|
23,792
|
|
|||||||||
|
Other financial liabilities
|
(17)
|
—
|
|
701
|
|
35
|
|
736
|
|
—
|
|
740
|
|
8
|
|
748
|
|
||||||||
|
Total Liabilities
|
—
|
|
701
|
|
35
|
|
736
|
|
—
|
|
740
|
|
8
|
|
748
|
|
|||||||||
In
2015
, there were no transfers between Levels in the fair value hierarchy.
F - 89
The fair value of Other financial assets and liabilities, which mainly include derivatives financial instruments, is measured by taking into consideration market parameters at the balance sheet date and using valuation techniques widely accepted in the financial business environment. In particular:
|
•
|
the fair value of forward contracts and currency swaps is determined by taking the prevailing exchange rates and interest rates at the balance sheet date;
|
|
•
|
the fair value of interest rate swaps and forward rate agreements is determined by taking the prevailing interest rates at the balance sheet date and using the discounted expected cash flow method;
|
|
•
|
the fair value of combined interest rate and currency swaps is determined using the exchange and interest rates prevailing at the balance sheet date and the discounted expected cash flow method;
|
|
•
|
the fair value of swaps and options hedging commodity price risk is determined by using suitable valuation techniques and taking market parameters at the balance sheet date (in particular, underlying prices, interest rates and volatility rates).
|
The carrying value of Cash and cash equivalents (Note
18
) usually approximates fair value due to the short maturity of these instruments. The fair value of money market funds is also based on available market quotations. Where appropriate, the fair value of cash equivalents is determined with discounted expected cash flow techniques using observable market yields (categorized as Level 2).
The following table provides a reconciliation of the changes in items measured at fair value and categorized as Level 3 at December 31,
2015
and December 31, 2014:
|
Other non-
current securities |
Other financial
assets/(liabilities) |
||||
|
(€ million)
|
|||||
|
At January 1, 2014
|
12
|
|
2
|
|
|
|
Gains/(losses) recognized in Consolidated Income Statement
|
—
|
|
16
|
|
|
|
Gains/(losses) recognized in Other comprehensive income/(loss)
|
—
|
|
(8
|
)
|
|
|
Issues/Settlements
|
10
|
|
(14
|
)
|
|
|
At December 31, 2014
|
22
|
|
(4
|
)
|
|
|
Gains/(losses) recognized in Consolidated Income Statement
|
1
|
|
(14
|
)
|
|
|
Gains/(losses) recognized in Other comprehensive income/(loss)
|
—
|
|
(39
|
)
|
|
|
Transfer to Assets held for distribution
|
(11
|
)
|
—
|
|
|
|
Issues/Settlements
|
—
|
|
22
|
|
|
|
At December 31, 2015
|
12
|
|
(35
|
)
|
|
The gains/losses included in the Consolidated Income Statements are recognized within Cost of sales. Of the total gains/(losses) recognized in Other comprehensive income/(loss), €37 million was reflected within cash flow reserves and €2 million was reflected within currency translation differences.
Assets and liabilities not measured at fair value on recurring basis
For financial instruments represented by short-term receivables and payables, for which the present value of future cash flows does not differ significantly from carrying value, we assume that carrying value is a reasonable approximation of the fair value. In particular, the carrying amount of Current receivables and Other current assets and of Trade payables and Other current liabilities approximates their fair value.
Refer to Note
19
for a detailed discussion of the allocation of the fair value of the liability component of the Mandatory Convertible Securities issued by FCA in December 2014.
F - 90
Refer to the section —
Changes in the Scope of Consolidation - Acquisition of the remaining ownership interest in FCA US
for a discussion of the residual value methodology used to determine the fair values of the acquired elements in connection with the transactions related to the acquisition of the remaining 41.5 percent interest in FCA US and the MOU.
The following table provides the carrying amount and fair value for financial assets and liabilities not measured at fair value on a recurring basis:
|
At December 31,
|
|||||||||||||
|
2015
|
2014
|
||||||||||||
|
Note
|
Carrying
amount |
Fair
Value |
Carrying
amount |
Fair
Value |
|||||||||
|
(€ million)
|
|||||||||||||
|
Dealer financing
|
1,650
|
|
1,649
|
|
2,313
|
|
2,312
|
|
|||||
|
Retail financing
|
238
|
|
232
|
|
1,039
|
|
1,032
|
|
|||||
|
Finance lease
|
8
|
|
8
|
|
349
|
|
351
|
|
|||||
|
Other receivables from financing activities
|
110
|
|
110
|
|
142
|
|
142
|
|
|||||
|
Receivables from financing activities
|
(15)
|
2,006
|
|
1,999
|
|
3,843
|
|
3,837
|
|
||||
|
Asset backed financing
|
206
|
|
206
|
|
469
|
|
469
|
|
|||||
|
Notes
|
13,441
|
|
14,120
|
|
17,648
|
|
18,794
|
|
|||||
|
Other debt
|
14,139
|
|
14,074
|
|
15,607
|
|
15,685
|
|
|||||
|
Debt
|
(23)
|
27,786
|
|
28,400
|
|
33,724
|
|
34,948
|
|
||||
The fair values of Receivables from financing activities, which are categorized within Level 3 of the fair value hierarchy, have been estimated with discounted cash flows models. The most significant inputs used for this measurement are market discount rates that reflect conditions applied in various reference markets on receivables with similar characteristics, adjusted in order to take into account the credit risk of the counterparties.
Notes that are traded in active markets for which close or last trade pricing is available are classified within Level 1 of the fair value hierarchy. Notes for which such prices are not available (such as the FCA US Secured Senior Notes that were prepaid in 2015 (Note
23
)), are valued at the last available price or based on quotes received from independent pricing services or from dealers who trade in such securities and are categorized as Level 2. At
December 31, 2015
,
€14,113 million
and
€7 million
of notes were classified within Level 1 and Level 2, respectively. At
December 31, 2014
,
€13,433 million
and
€5,361 million
of notes were classified within Level 1 and Level 2, respectively.
The fair value of Other debt included in Level 2 of the fair value hierarchy has been estimated using discounted cash flow models. The main inputs used are year-end market interest rates, adjusted for market expectations of the Group’s non-performance risk implied in quoted prices of traded securities issued by the Group and existing credit derivatives on Group liabilities. The fair value of the debt that requires significant adjustments using unobservable inputs is categorized in Level 3 of the fair value hierarchy. At
December 31, 2015
,
€12,099 million
and
€1,975 million
of Other Debt was classified within Level 2 and Level 3, respectively. At
December 31, 2014
,
€13,144 million
and
€2,541 million
of Other Debt was classified within Level 2 and Level 3, respectively.
(
26
) Related party transactions
Pursuant to IAS 24
- Related Party Disclosures
, the related parties of the Group are entities and individuals capable of exercising control, joint control or significant influence over the Group and its subsidiaries. Related parties include companies belonging to Exor S.p.A. (the largest shareholder of FCA through its
29.16
percent common shares shareholding interest and
44.27
percent voting power at December 31, 2015) who also purchased U.S.$886 million (€730 million at December 31, 2014) in aggregate notional amount of Mandatory Convertible Securities that were issued in December 2014 (Note
19
). Related parties also include CNHI and other unconsolidated subsidiaries, associates or joint ventures of the Group. In addition, members of the FCA Board of Directors, Board of Statutory Auditors (through the date of the Merger) and executives with strategic responsibilities and their families are also considered related parties.
F - 91
The Group carries out transactions with unconsolidated subsidiaries, joint ventures, associates and other related parties, on commercial terms that are normal in the respective markets, considering the characteristics of the goods or services involved. Transactions carried out by the Group with unconsolidated subsidiaries, joint ventures, associates and other related parties are primarily of a commercial nature, which have had an effect on revenues, cost of sales, and trade receivables and payables; these transactions primarily relate to:
|
•
|
the sale of motor vehicles to the joint ventures Tofas and FCA Bank leasing and renting subsidiaries;
|
|
•
|
the sale of engines, other components and production systems and the purchase of commercial vehicles with the joint operation Sevel S.p.A.;
|
|
•
|
the sale of engines, other components and production systems to companies of CNHI;
|
|
•
|
the purchase of vehicles, the provision of services and the sale of goods with the joint operation Fiat India Automobiles Private Limited;
|
|
•
|
the provision of services and the sale of goods to the joint venture GAC Fiat Chrysler Automobiles Co. Ltd;
|
|
•
|
the provision of services (accounting, payroll, tax administration, information technology, purchasing and security) to the companies of CNHI;
|
|
•
|
the purchase of commercial vehicles from the joint venture Tofas;
|
|
•
|
the purchase of commercial vehicles under contract manufacturing agreement from CNHI; and
|
|
•
|
the purchase of engines from the VM Motori group during the first half of 2013.
|
The most significant financial transactions with related parties generated Receivables from financing activities of the Group’s financial services companies from joint ventures and Asset-backed financing relating to amounts due to FCA Bank for the sale of receivables which do not qualify for derecognition under IAS 39 –
Financial Instruments: Recognition and Measurement
.
The amounts of the transactions with related parties recognized in the Consolidated Income Statements were as follows:
F - 92
|
For the Years Ended December 31,
|
|||||||||||||||||||||||||||||||||||
|
2015
|
2014
|
2013
|
|||||||||||||||||||||||||||||||||
|
Net
Revenues |
Cost of
sales |
Selling,
general
and
admin.
costs
|
Financial
income/ (expenses) |
Net
Revenues |
Cost of
sales |
Selling,
general and admin. costs |
Financial
income/ (expenses) |
Net
Revenues |
Cost of
sales |
Selling,
general and admin. costs |
Financial
income/ (expenses) |
||||||||||||||||||||||||
|
(€ million)
|
|||||||||||||||||||||||||||||||||||
|
Tofas
|
1,533
|
|
1,611
|
|
—
|
|
—
|
|
1,247
|
|
1,189
|
|
1
|
|
—
|
|
1,145
|
|
1,287
|
|
3
|
|
—
|
|
|||||||||||
|
Sevel S.p.A.
|
311
|
|
—
|
|
4
|
|
—
|
|
274
|
|
—
|
|
4
|
|
—
|
|
237
|
|
—
|
|
3
|
|
—
|
|
|||||||||||
|
FCA Bank
|
1,447
|
|
14
|
|
9
|
|
(30
|
)
|
276
|
|
10
|
|
7
|
|
(29
|
)
|
223
|
|
62
|
|
10
|
|
(24
|
)
|
|||||||||||
|
GAC Fiat Chrysler Automobiles Co. Ltd
|
252
|
|
—
|
|
—
|
|
—
|
|
153
|
|
—
|
|
—
|
|
—
|
|
144
|
|
—
|
|
1
|
|
—
|
|
|||||||||||
|
Fiat India Automobiles
Limited |
15
|
|
4
|
|
—
|
|
—
|
|
17
|
|
—
|
|
—
|
|
—
|
|
14
|
|
—
|
|
2
|
|
1
|
|
|||||||||||
|
VM Motori Group
|
—
|
|
—
|
|
—
|
|
—
|
|
—
|
|
—
|
|
—
|
|
—
|
|
—
|
|
121
|
|
—
|
|
—
|
|
|||||||||||
|
Other
|
29
|
|
22
|
|
—
|
|
—
|
|
18
|
|
22
|
|
—
|
|
—
|
|
7
|
|
6
|
|
—
|
|
—
|
|
|||||||||||
|
Total joint arrangements
|
3,587
|
|
1,651
|
|
13
|
|
(30
|
)
|
1,985
|
|
1,221
|
|
12
|
|
(29
|
)
|
1,770
|
|
1,476
|
|
19
|
|
(23
|
)
|
|||||||||||
|
Total associates
|
143
|
|
14
|
|
6
|
|
—
|
|
102
|
|
2
|
|
6
|
|
—
|
|
70
|
|
4
|
|
5
|
|
—
|
|
|||||||||||
|
CNHI
|
564
|
|
431
|
|
—
|
|
—
|
|
602
|
|
492
|
|
—
|
|
—
|
|
703
|
|
500
|
|
—
|
|
—
|
|
|||||||||||
|
Directors, Statutory Auditors and Key Management
|
—
|
|
—
|
|
132
|
|
—
|
|
—
|
|
—
|
|
89
|
|
—
|
|
—
|
|
—
|
|
49
|
|
—
|
|
|||||||||||
|
Other
|
—
|
|
1
|
|
17
|
|
—
|
|
—
|
|
4
|
|
20
|
|
—
|
|
—
|
|
24
|
|
13
|
|
—
|
|
|||||||||||
|
Total CNHI, Directors and others
|
564
|
|
432
|
|
149
|
|
—
|
|
602
|
|
496
|
|
109
|
|
—
|
|
703
|
|
524
|
|
62
|
|
—
|
|
|||||||||||
|
Total unconsolidated
subsidiaries |
79
|
|
13
|
|
8
|
|
1
|
|
52
|
|
7
|
|
21
|
|
(1
|
)
|
45
|
|
15
|
|
28
|
|
1
|
|
|||||||||||
|
Total transactions with related parties
|
4,373
|
|
2,110
|
|
176
|
|
(29
|
)
|
2,741
|
|
1,726
|
|
148
|
|
(30
|
)
|
2,588
|
|
2,019
|
|
114
|
|
(22
|
)
|
|||||||||||
|
Total for the Group
|
110,595
|
|
97,620
|
|
7,728
|
|
(2,366
|
)
|
93,640
|
|
81,592
|
|
6,947
|
|
(2,051
|
)
|
84,530
|
|
73,038
|
|
6,615
|
|
(1,989
|
)
|
|||||||||||
Non-financial assets and liabilities originating from related party transactions were as follows:
|
At December 31,
|
|||||||||||||||||||||||
|
2015
|
2014
|
||||||||||||||||||||||
|
Trade
receivables |
Trade
payables |
Other
current assets |
Other
current liabilities |
Trade
receivables |
Trade
payables |
Other
current assets |
Other
current liabilities |
||||||||||||||||
|
(€ million)
|
|||||||||||||||||||||||
|
Tofas
|
13
|
|
157
|
|
—
|
|
—
|
|
48
|
|
160
|
|
—
|
|
1
|
|
|||||||
|
FCA Bank
|
80
|
|
218
|
|
3
|
|
117
|
|
65
|
|
234
|
|
6
|
|
92
|
|
|||||||
|
GAC Fiat Chrysler Automobiles Co. Ltd
|
147
|
|
3
|
|
—
|
|
61
|
|
48
|
|
20
|
|
—
|
|
1
|
|
|||||||
|
Sevel S.p.A.
|
19
|
|
—
|
|
1
|
|
5
|
|
12
|
|
—
|
|
—
|
|
4
|
|
|||||||
|
Fiat India Automobiles Limited
|
1
|
|
—
|
|
—
|
|
—
|
|
2
|
|
2
|
|
—
|
|
—
|
|
|||||||
|
Other
|
21
|
|
2
|
|
—
|
|
—
|
|
9
|
|
2
|
|
—
|
|
—
|
|
|||||||
|
Total joint arrangements
|
281
|
|
380
|
|
4
|
|
183
|
|
184
|
|
418
|
|
6
|
|
98
|
|
|||||||
|
Total associates
|
42
|
|
24
|
|
—
|
|
21
|
|
38
|
|
13
|
|
—
|
|
23
|
|
|||||||
|
CNHI
|
48
|
|
76
|
|
26
|
|
6
|
|
49
|
|
24
|
|
23
|
|
8
|
|
|||||||
|
Other
|
—
|
|
2
|
|
—
|
|
—
|
|
—
|
|
7
|
|
—
|
|
—
|
|
|||||||
|
Total CNHI and others
|
48
|
|
78
|
|
26
|
|
6
|
|
49
|
|
31
|
|
23
|
|
8
|
|
|||||||
|
Total unconsolidated subsidiaries
|
80
|
|
18
|
|
2
|
|
1
|
|
31
|
|
13
|
|
2
|
|
2
|
|
|||||||
|
Total originating from related parties
|
451
|
|
500
|
|
32
|
|
211
|
|
302
|
|
475
|
|
31
|
|
131
|
|
|||||||
|
Total for the Group
|
2,668
|
|
21,465
|
|
3,078
|
|
10,930
|
|
2,564
|
|
19,854
|
|
2,761
|
|
11,495
|
|
|||||||
F - 93
Financial assets and liabilities originating from related party transactions were as follows:
|
At December 31,
|
|||||||||||||||||
|
2015
|
2014
|
||||||||||||||||
|
Current
receivables from financing activities |
Asset-
backed financing |
Other debt
|
Current
receivables from financing activities |
Asset-
backed financing |
Other debt
|
||||||||||||
|
(€ million)
|
|||||||||||||||||
|
FCA Bank
|
45
|
|
133
|
|
49
|
|
73
|
|
100
|
|
4
|
|
|||||
|
Tofas
|
18
|
|
—
|
|
—
|
|
39
|
|
—
|
|
—
|
|
|||||
|
Sevel S.p.A.
|
9
|
|
—
|
|
4
|
|
5
|
|
—
|
|
13
|
|
|||||
|
Other
|
5
|
|
—
|
|
—
|
|
8
|
|
—
|
|
—
|
|
|||||
|
Total joint arrangements
|
77
|
|
133
|
|
53
|
|
125
|
|
100
|
|
17
|
|
|||||
|
Total associates
|
20
|
|
—
|
|
—
|
|
7
|
|
—
|
|
—
|
|
|||||
|
Total CNHI
|
5
|
|
—
|
|
—
|
|
6
|
|
—
|
|
—
|
|
|||||
|
Total unconsolidated subsidiaries
|
25
|
|
—
|
|
14
|
|
24
|
|
—
|
|
30
|
|
|||||
|
Total originating from related parties
|
127
|
|
133
|
|
67
|
|
162
|
|
100
|
|
47
|
|
|||||
|
Total for the Group
|
2,006
|
|
206
|
|
27,580
|
|
3,843
|
|
469
|
|
33,255
|
|
|||||
Commitments and Guarantees pledged in favor of related parties
Guarantees pledged in favor of related parties were as follows:
|
At December 31,
|
|||||
|
2015
|
2014
|
||||
|
(€ million)
|
|||||
|
Joint ventures
|
4
|
|
11
|
|
|
|
Unconsolidated subsidiaries
|
—
|
|
1
|
|
|
|
Total related parties guarantees
|
4
|
|
12
|
|
|
In addition, at
December 31, 2015
, the Group had commitments for investments in joint ventures for €101 million, which included our commitment for contributions to our GAC Fiat Chrysler Automobiles Co. Ltd joint venture (Note
28
). Additionally, with reference to the interest in the joint venture Tofas, the Group had a take or pay commitment whose future minimum expected obligations as of
December 31, 2015
were as follows:
|
(€ million)
|
||
|
2016
|
138
|
|
|
2017
|
138
|
|
|
2018
|
138
|
|
|
2019
|
99
|
|
|
2020
|
93
|
|
|
2021 and thereafter
|
100
|
|
F - 94
Compensation to Directors, Statutory Auditors and Key Management
The fees of the Directors and Statutory Auditors of the Group for carrying out their respective functions, including those in other consolidated companies, were as follows:
|
For the Years Ended December 31,
|
||||||||
|
2015
|
2014
|
2013
|
||||||
|
(€ thousand)
|
||||||||
|
Directors (a)
|
38,488
|
|
14,305
|
|
18,912
|
|
||
|
Statutory auditors of Fiat
|
—
|
|
186
|
|
230
|
|
||
|
Total compensation
|
38,488
|
|
14,491
|
|
19,142
|
|
||
_________________________
(a)
This amount includes the notional compensation cost arising from long-term share compensation granted to the Chief Executive Officer and share based payments to non-executive Directors.
Refer to Note
20
for information related to the special recognition award granted to the Chief Executive Officer on April 16, 2015 and the PSU and RSU awards granted to certain key employees in 2015.
The aggregate compensation expense for remaining executives with strategic responsibilities was approximately €65 million for
2015
(€23 million in
2014
and €30 million in
2013
), which includes:
|
•
|
an amount of approximately €38 million in 2015 (approximately €2 million in 2014 and approximately €10 million in 2013) for share-based compensation expense;
|
|
•
|
an amount of approximately €8 million in
2015
(approximately €9 million in
2014
and approximately €15 million in
2013
) for short-term employee benefits;
|
|
•
|
an amount of €3 million in
2015
(€2 million in
2014
and €3 million in
2013
) for FCA’s contribution to State and employer defined contribution pension funds;
|
|
•
|
an amount of approximately €2 million in
2015
(€0 million in
2014
and approximately
€1 million
in
2013
) for termination benefits.
|
In 2014, the Chief Executive Officer received a cash award of €24.7 million and was assigned a €12 million post-mandate award as recognition that he was instrumental in major strategic and financial accomplishments for the Group. Most notably, through his vision and guidance, FCA was formed, creating enormous value for the Company, its shareholders and stakeholders.
In 2014, Ferrari S.p.A. recorded a cost of €15 million in connection with the resignation of Mr. Luca Cordero di Montezemolo, as Chairman of Ferrari S.p.A., former Director of Fiat.
(
27
) Explanatory notes to the Consolidated Statement of Cash Flows
The Consolidated Statement of Cash Flows sets out changes in Cash and cash equivalents during the year. As required by IAS 7 –
Statement of Cash Flows
, cash flows are separated into operating, investing and financing activities. The effects of changes in exchange rates on cash and cash equivalents are shown separately under the line item Translation exchange differences.
Non-cash items
For the year ended December 31, 2015, Other non-cash items of €
812 million
mainly included (i) €713 million non-cash charges for asset impairments impairments which mainly related to asset impairments in connection with the
F - 95
realignment of the Group's manufacturing capacity in NAFTA to better meet market demand and (ii) €80 million charge recognized as a result of the adoption of the SIMADI exchange rate to re-measure the net monetary assets of the Group’s Venezuelan subsidiary in U.S.$ (Note 30) (reported, for the effect on cash and cash equivalents, within Translation exchange differences).
For the year ended December 31,
2014
, Other non-cash items of €
348 million
mainly included (i) €381 million related to the non-cash portion of the expense recognized in connection with the execution of the UAW MOU entered into by FCA US, as described in the section —
Changes in the Scope of Consolidation
-
Acquisition
of the remaining ownership interest in FCA US
and (ii) €98 million remeasurement charge recognized as a result of the Group's change in the exchange rate used to remeasure its Venezuelan subsidiary’s net monetary assets in U.S.$ (Note
30
) (reported, for the effect on cash and cash equivalents, within Translation differences), which were partially offset by (iii) the non-taxable gain of €223 million on the remeasurement to fair value of the previously exercised options on approximately 10 percent of FCA US's membership interest in connection with the acquisition of the remaining interest in FCA US previously not owned.
For the year ended December 31,
2013
, Other non-cash items of €
531 million
mainly included (i) €336 million of impairment losses and asset write-offs on tangible and intangible assets, (ii) €59 million loss related to the devaluation of the official exchange rate of the VEF relative to the U.S.$ (Note
30
) and (iii) €56 million related to the write-off of the book value of the right associated with the acquisition of the remaining interest in FCA US previously not owned.
Change in working capital
For the year ended December 31, 2015, the negative change in working capital of €
158 million
was primarily driven by (i) €958 million increase in inventories, which reflects the increased consumer demand for our vehicles and inventory buildup in NAFTA due to production changeovers (ii) €191 million increase in trade receivables and (iii) €580 million increase in net other current assets and liabilities reflecting the net payment of taxes and deferred expenses, which were partially offset by (iv) €1,571 million increase in trade payables, mainly related to increased production levels in EMEA.
For the year ended December 31, 2014, change in working capital of €
779 million
was primarily driven by (i) €
1,470 million
increase in trade payables, mainly related to increased production in EMEA and NAFTA as a result of increased consumer demand for our vehicles, (ii) €
106 million
decrease in trade receivables and (iii) €
24 million
increase in net other current assets and liabilities, which were partially offset by (iv) €
821 million
increase in inventory (net of vehicles sold under buy-back commitments), mainly related to increased finished vehicle and work in process levels at December 31, 2014 compared to December 31, 2013, in part driven by higher production levels in late 2014 to meet anticipated consumer demand in NAFTA, EMEA and Maserati.
For the year ended December 31, 2013, change in working capital of €
1,378 million
was primarily driven by (i) €
1,322 million
increase in trade payables, mainly related to increased production in NAFTA as a result of increased consumer demand for our vehicles, and increased production in Maserati, (ii) €
746 million
in net other current assets and liabilities mainly related to increases in accrued expenses and deferred income as well as indirect taxes payables, (iii) €
232 million
decrease in trade receivables principally due to the contraction of sales volumes in EMEA and LATAM, which were partially offset by (iv) €
922 million
increase in inventory (net of vehicles sold under buy-back commitments), mainly related to increased finished vehicle and work in process levels at December 31, 2013 compared to December 31, 2012, in part driven by higher production levels in late 2013 to meet anticipated consumer demand in the NAFTA, APAC and Maserati segments.
F - 96
Financing activities
For the year ended December 31,
2015
, net cash used in financing activities was €
3,128 million
and was primarily the result of (i) the prepayment of the FCA US Secured Senior Notes and the repayment at maturity of two notes issued under the GMTN Programme as described in more detail in Note
23
for a total of
€7,241 million
, (ii) the repayment of medium-term borrowings for a total of
€4,412 million
, which were partially offset by (iii) net proceeds of
€866 million
from the Ferrari IPO as discussed in the section —
Principal Activities
above
,
(iv) proceeds from the issuance of the Notes by FCA for a total of
€2,840 million
as described in more detail in Note
23
, (v)
3,061 million
provided by new medium-term borrowings and (vi) net proceeds from the €2.0 billion Ferrari Bridge Loan and Ferrari Term Loan, which are reflected within cash flows used in financing activities - discontinued operations in the Consolidated Statement of Cash Flows.
For the year ended December 31,
2014
, net cash provided by financing activities was €
2,137 million
and was primarily the result of (i) the net proceeds from the issuance of the Mandatory Convertible Securities as described in more detail in Note
19
, (ii) the proceeds from note issuances and new medium term borrowings as discussed in Note
23
, which were partially offset by (iii) the cash payment to the VEBA Trust for the acquisition of the remaining 41.5 percent ownership interest in FCA US (see section —
Changes in the Scope of Consolidation - Acquisition of the Remaining Ownership Interest in FCA US
above), (iv) the repayment of medium-term borrowings for a total of €
5,834 million
, mainly related to the prepayment of all amounts under the VEBA Trust Note amounting to approximately U.S.$5 billion (€3.6 billion), including accrued and unpaid interest, and repayment of medium term borrowings primarily in Brazil, (v) the repayment at maturity of notes issued under the GMTN Programme, as discussed in Note
23
and (vi) the net cash disbursement in connection with the Merger (see section —
Principal Activities -
The FCA Merger
above).
For the year ended December 31,
2013
, net cash provided by financing activities was €
3,136 million
and was primarily the result of (i) the proceeds from issuances relating to notes issued as part of the GMTN Programme, which were partially offset by (ii) the repayment at maturity of notes issued under the GMTN Programme and the repayment at maturity of medium-term borrowings.
The Group, including Ferrari, paid interest of
€2,087 million
,
€2,054 million
and
€1,832 million
and received interest of
€469 million
,
€441 million
and
€398 million
during the years ended December 31, 2015,
2014
and
2013
, respectively. Amounts indicated are also inclusive of interest rate differentials paid or received on interest rate derivatives.
The Group, including Ferrari, made income tax payments, net of refunds, totaling
€664 million
,
€542 million
and
€429 million
during the years ended December 31,
2015
, 2014 and
2013
, respectively.
(
28
) Guarantees granted, commitments and contingent liabilities
Guarantees granted
At
December 31, 2015
, the Group had pledged guarantees on the debt or commitments of third parties totaling
€19 million
(
€27 million
at
December 31, 2014
), as well as guarantees of
€4 million
on related party debt (
€12 million
at
December 31, 2014
).
SCUSA Private-Label Financing Agreement
In
February 2013
, FCA US entered into a private-label financing agreement (the “SCUSA Agreement”) with Santander Consumer USA Inc. (“SCUSA”), an affiliate of Banco Santander, which launched on May 1, 2013. Under the SCUSA Agreement, SCUSA provides a wide range of wholesale and retail financing services to FCA US's dealers and consumers in accordance with its usual and customary lending standards, under the Chrysler Capital brand name. The financing services include credit lines to finance dealers’ acquisition of vehicles and other products that FCA US sells or distributes, retail loans and leases to finance consumer acquisitions of new and used vehicles at independent dealerships, financing for commercial and fleet customers, and ancillary services. In addition, SCUSA offers dealers construction loans, real estate loans, working capital loans and revolving lines of credit.
F - 97
The SCUSA Agreement has a
ten-year
term from February 2013, subject to early termination in certain circumstances, including the failure by a party to comply with certain of its ongoing obligations under the SCUSA Agreement. In accordance with the terms of the agreement, SCUSA provided an upfront, nonrefundable payment of
€109 million
(
U.S.$150 million
) in
May 2013
, which was recognized as deferred revenue and is amortized over ten years. At
December 31, 2015
,
€101 million
(U.S.$110 million) remained in deferred revenue.
From time to time, FCA US works with certain lenders to subsidize interest rates or cash payments at the inception of a financing arrangement to incentivize customers to purchase its vehicles, a practice known as “subvention.” FCA US has provided SCUSA with limited exclusivity rights to participate in specified minimum percentages of certain of its retail financing rate subvention programs. SCUSA has committed to certain revenue sharing arrangements, as well as to consider future revenue sharing opportunities. SCUSA bears the risk of loss on loans contemplated by the SCUSA Agreement. The parties share in any residual gains and losses in respect of consumer leases, subject to specific provisions in the SCUSA Agreement, including limitations on FCA US participation in gains and losses.
Other Repurchase Obligations
In accordance with the terms of other wholesale financing arrangements in Mexico, FCA Mexico is required to repurchase dealer inventory financed under these arrangements, upon certain triggering events and with certain exceptions, including in the event of an actual or constructive termination of a dealer’s franchise agreement. These obligations exclude certain vehicles including, but not limited to, vehicles that have been damaged or altered, that are missing equipment or that have excessive mileage or an original invoice date that is more than one year prior to the repurchase date. In December 2015, FCA Mexico entered into a ten year private label financing agreement with FC Financial, S.A De C.V., Sofom, E.R., Grupo Financiaro Inbursa (“FC Financial”), a wholly owned subsidiary of Banco Inbursa, under which FC Financial provides a wide range of financial wholesale and retail financial services to FCA US's dealers and retail customers under the FCA Financial Mexico brand name. The wholesale repurchase obligation under the new agreement will be limited to wholesale purchases in case of actual or constructive termination of a dealer's franchise agreement.
At December 31, 2015, the maximum potential amount of future payments required to be made in accordance with these wholesale financing arrangements was approximately
€275 million
(U.S.$299 million) and was based on the aggregate repurchase value of eligible vehicles financed through such arrangements in the respective dealer’s stock. If vehicles are required to be repurchased through such arrangements, the total exposure would be reduced to the extent the vehicles can be resold to another dealer. The fair value of the guarantee was less than
€0.1 million
at
December 31, 2015
, which considers both the likelihood that the triggering events will occur and the estimated payment that would be made net of the estimated value of inventory that would be reacquired upon the occurrence of such events. These estimates are based on historical experience.
Arrangements with Key Suppliers
From time to time, in the ordinary course of our business, the Group enters into various arrangements with key third party suppliers in order to establish strategic and technological advantages. A limited number of these arrangements contain unconditional purchase obligations to purchase a fixed or minimum quantity of goods and/or services with fixed and determinable price provisions. Future minimum purchase obligations under these arrangements at
December 31, 2015
were as follows:
|
(€ million)
|
|||
|
2016
|
420
|
|
|
|
2017
|
426
|
|
|
|
2018
|
365
|
|
|
|
2019
|
214
|
|
|
|
2020
|
176
|
|
|
|
2021 and thereafter
|
108
|
|
|
F - 98
Operating lease contracts
The Group has operating lease contracts for the right to use industrial buildings and equipment with an average term of
10-20 years
and
3-5 years
, respectively. The following table summarizes the total future minimum lease payments under non-cancellable lease contracts at
December 31, 2015
:
|
At December 31, 2015
|
||||||||||||||
|
Due within
one year
|
Due between
one and three years |
Due between
three and five years |
Due
beyond five years |
Total
|
||||||||||
|
(€ million)
|
||||||||||||||
|
Future minimum lease payments under operating lease agreements
|
190
|
|
|
289
|
|
|
201
|
|
|
257
|
|
|
937
|
|
During
2015
, the Group recognized lease payments expense of
€246 million
(
€195 million
in
2014
and €199 million in
2013
).
Other commitments, arrangements and contractual rights
GAC Group
During the year ended
December 31, 2015
, the Group committed to contributing a total 1.3 billion Renminbi (“RMB”) (approximately €186 million) to our GAC Fiat Chrysler Automobiles Co. Ltd joint venture, which has begun localizing the production of Jeep vehicles for the Chinese market, of which RMB 700 million (approximately €100 million) was contributed in October 2015 and the remaining amount of RMB 600 million (approximately €85 million) is expected to be contributed in 2016. A total of €171 million was contributed during the year ended December 31, 2015 and the Group's ownership percentage remained unchanged at 50 percent.
UAW Labor Agreement
I
n October 2015, FCA US and the UAW agreed to a new four-year national collective bargaining agreement, which will expire in September 2019. The provisions of the new agreement continue certain opportunities for success-based compensation upon meeting certain quality and financial performance metrics. The agreement closes the pay gap between “Traditional” and “In-progression” employees over an eight year period and will continue to provide UAW-represented employees with a simplified adjusted profit sharing plan. The adjusted profit sharing plan will be effective for the 2016 plan year and is directly aligned with NAFTA profitability. The agreement includes lump-sum payments in lieu of further wage increases of primarily $4,000 for “Traditional” employees and $3,000 for “In-progression” employees totaling approximately $141 million (€127 million) that was paid to UAW members on November 6, 2015. These payments are being amortized ratably over the four-year labor agreement period.
Italian Labor Agreement
In April 2015, a new four-year compensation agreement was signed by FCA companies in Italy within the automobiles business. The new compensation agreement was subsequently included into the new labor agreement and was extended to all FCA companies in Italy on July 7, 2015.
The compensation arrangement was effective retrospectively from January 1, 2015 through to December 31, 2018 and incentivizes all employees toward achievement of the productivity, quality and profitability targets established in the 2015-2018 period of the 2014-2018 business plan developed in May 2014 by adding two variable additional elements to base pay:
|
•
|
an annual bonus calculated on the basis of production efficiencies achieved and the plant’s World Class Manufacturing (“WCM”) audit status, and
|
F - 99
|
•
|
a component linked to achievement of the financial targets established in the 2015-2018 period of the 2014-2018 business plan (“Business Plan Bonus”) for the EMEA region, including the activities of the premium brands Alfa Romeo and Maserati. A portion of the Business Plan Bonus is a guaranteed amount based on employees' base salaries and is paid over four years in quarterly installments, while the remaining portion is to be paid in March 2019 to active employees as of December 31, 2018, with at least two years of service during 2015 through 2018.
|
During the year ended
December 31, 2015
, €115 million was recorded as an expense in respect of the compensation agreement.
The Group has commitments and rights deriving from outstanding agreements which are summarized below.
Canada labor agreement
The collective bargaining labor agreement between FCA Canada and Unifor will expire September 2016.
Mercurio
In January 2015, the Group granted Mercurio a put option as a result of the merger agreement described above within the section —
Changes in the
Scope of Consolidation
.
Sevel S.p.A.
As part of the Sevel cooperation agreement with Peugeot-Citroen SA (“PSA”), the Group is party to a call agreement with PSA whereby, from July 1, 2017 to September 30, 2017, the Group will have the right to acquire the residual interest in the joint operation Sevel with effect from December 31, 2017.
Contingent liabilities
Contingent liabilities estimated by the Group for which no provisions have been recognized since an outflow of resources is not considered to be probable and contingent liabilities for which a reliable estimate can be made amounted to approximately €70 million and €100 million at
December 31, 2015
and 2014, respectively. Furthermore, contingent assets and expected reimbursement in connection with these contingent liabilities for approximately
€8 million
and
€10 million
at
December 31, 2015
and 2014, respectively, have been estimated but not recognized. The Group will recognize the related amounts when it is probable that an outflow of resources embodying economic benefits will be required to settle obligations and the amounts can be reliably estimated.
Furthermore, in connection with significant asset divestitures carried out in prior years, the Group provided indemnities to purchasers with the maximum amount of potential liability under these contracts generally capped at a percentage of the purchase price. These liabilities refer principally to potential liabilities arising from possible breaches of representations and warranties provided in the contracts and, in certain instances, environmental or tax matters, generally for a limited period of time. Potential obligations with respect to these indemnities were approximately €240 million at
December 31, 2015
and 2014. At
December 31, 2015
and 2014, a total of €50 million and
€58 million
, respectively, within Other provisions, has been recognized related to these obligations. The Group has provided certain other indemnifications that do not limit potential payment and as such, it was not possible to estimate the maximum amount of potential future payments that could result from claims made under these indemnities.
Litigation
On July 9, 2012, a lawsuit was filed against FCA US in the Superior Court of Decatur County, Georgia, U.S. ("the Court"), with respect to a March 2012 fatality in a rear-impact collision involving a 1999 Jeep Grand Cherokee. Plaintiffs alleged that the manufacturer had acted in a reckless and wanton fashion when it designed and sold the vehicle due to the placement of the fuel tank behind the rear axle and had breached a duty to warn of the alleged danger. On April 2, 2015, a jury found in favor of the plaintiffs and the trial court entered a judgment against FCA US in the amount of U.S.$148.5 million (€138 million). On July 24, 2015, the Court issued a remittitur reducing the judgment against FCA US to U.S.$40 million (€36 million).
F - 100
FCA US believes the jury verdict was not supported by the evidence or the law. FCA US maintains that the 1999 Jeep Grand Cherokee is not defective, and its fuel system does not pose an unreasonable risk to motor vehicle safety. The vehicle met or exceeded all applicable Federal Motor Vehicle Safety Standards, including the standard governing fuel system integrity. Furthermore, FCA US submitted extensive data to NHTSA validating that the vehicle performs as well as, or better than, peer vehicles in impact studies, and nothing revealed in the trial altered this data. During the trial, however, FCA US was not allowed to introduce all the data previously provided to NHTSA, which demonstrated that the vehicle’s fuel system is not defective.
On August 10, 2015, FCA US filed a notice of appeal with the Georgia Court of Appeals. While a decision by an appellate court could affirm the judgment, FCA US believes it is more likely that the verdict will be overturned, that a new trial will be ordered or that the amount of the judgment will be further modified. FCA US does not, therefore, believe a loss is probable at the present time. The amount of the possible loss cannot reasonably be estimated at this time given that FCA US is in the early stages of what could be a lengthy appellate process, and the range of possible outcomes is between zero (as the verdict could be overturned or the award could be reduced to an immaterial amount) and the current judgment of U.S.$40 million (€36 million).
(
29
) Segment reporting
The reportable segments, as described in the section —
Segment reporting
above, reflect the operating segments of the Group that are regularly reviewed by the Chief Executive Officer, who is the “chief operating decision maker”, for making strategic decisions, allocating resources and assessing performance, and that exceed the quantitative threshold provided in IFRS 8 -
Operating Segments
, or whose information is considered useful for the users of the financial statements.
Transactions among mass-market vehicle segments generally are presented on a “where-sold” basis, which reflects the profit/(loss) on the ultimate sale to the external customer within the segment. This presentation generally eliminates the effect of the legal entity transfer price within the segments. Revenues of the other segments, aside from the mass-market vehicle segments, are those directly generated by or attributable to the segment as the result of its usual business activities and include revenues from transactions with third parties as well as those arising from transactions with segments, recognized at normal market prices.
Other activities include the results of the activities and businesses that are not operating segments under IFRS 8 -
Operating Segments.
In addition, Unallocated items and adjustments include consolidation adjustments and eliminations in addition to financial income and expense and income taxes that are not attributable to the performance of the segments as they do not fall under the scope of their operational responsibilities. As a result, such items and adjustments, which primarily arise from the management of treasury assets and liabilities by the treasuries of FCA and FCA US that work independently and separately within the Group, are subject to separate assessment by the chief operating decision maker.
Adjusted Earnings Before Interest and Taxes (“Adjusted EBIT”) is the measure used by the chief operating decision maker to assess performance, allocate resources to the Group's operating segments and to view operating trends, perform analytical comparisons and benchmark performance between periods and among the segments. Adjusted EBIT is calculated as EBIT excluding: gains/(losses) on the disposal of investments, restructuring, impairments, asset write-offs and other unusual income/(expenses) that are considered rare or discrete events that are infrequent in nature. See below for a reconciliation of Adjusted EBIT to EBIT, which is the most directly comparable measure included in our Consolidated Income Statement. Operating assets are not included in the data reviewed by the chief operating decision maker, and as a result and as permitted by IFRS 8 -
Operating Segments
, the related information is not provided.
F - 101
The following tables summarize selected financial information by segment for the years ended December 31,
2015
,
2014
and
2013
:
|
Mass-Market Vehicles
|
|||||||||||||||||||||||||||
|
2015
|
NAFTA
|
LATAM
|
APAC
|
EMEA
|
Maserati
|
Components
|
Other activities
|
Unallocated items & adjustments
|
FCA
|
||||||||||||||||||
|
(€ million)
|
|||||||||||||||||||||||||||
|
Revenues
|
69,992
|
|
6,431
|
|
4,885
|
|
20,350
|
|
2,411
|
|
9,770
|
|
844
|
|
(4,088
|
)
|
110,595
|
|
|||||||||
|
Revenues from transactions with other segments
|
(1
|
)
|
(194
|
)
|
(25
|
)
|
(304
|
)
|
(13
|
)
|
(3,095
|
)
|
(456
|
)
|
4,088
|
|
—
|
|
|||||||||
|
Revenues from external customers
|
69,991
|
|
6,237
|
|
4,860
|
|
20,046
|
|
2,398
|
|
6,675
|
|
388
|
|
—
|
|
110,595
|
|
|||||||||
|
Adjusted EBIT
|
4,450
|
|
(87
|
)
|
52
|
|
213
|
|
105
|
|
395
|
|
(150
|
)
|
(184
|
)
|
4,794
|
|
|||||||||
|
Change in estimate for future recall campaign costs
(1)
|
(761
|
)
|
—
|
|
—
|
|
—
|
|
—
|
|
—
|
|
—
|
|
—
|
|
(761
|
)
|
|||||||||
|
Tianjin (China) port explosions
(2)
|
—
|
|
—
|
|
(142
|
)
|
—
|
|
—
|
|
—
|
|
—
|
|
—
|
|
(142
|
)
|
|||||||||
|
NAFTA capacity realignment
(3)
|
(834
|
)
|
—
|
|
—
|
|
—
|
|
—
|
|
—
|
|
—
|
|
—
|
|
(834
|
)
|
|||||||||
|
Currency devaluations
(1)
|
—
|
|
(163
|
)
|
—
|
|
—
|
|
—
|
|
—
|
|
—
|
|
—
|
|
(163
|
)
|
|||||||||
|
NHTSA Consent Order and Amendment
(4)
|
(144
|
)
|
—
|
|
—
|
|
—
|
|
—
|
|
—
|
|
—
|
|
—
|
|
(144
|
)
|
|||||||||
|
Other impairments and asset write offs
|
—
|
|
(16
|
)
|
(22
|
)
|
(46
|
)
|
(3
|
)
|
(20
|
)
|
—
|
|
(11
|
)
|
(118
|
)
|
|||||||||
|
Restructuring (costs)/reversal
|
11
|
|
(40
|
)
|
—
|
|
—
|
|
—
|
|
(23
|
)
|
(2
|
)
|
1
|
|
(53
|
)
|
|||||||||
|
Other income/(expenses)
|
97
|
|
—
|
|
(41
|
)
|
(1
|
)
|
—
|
|
(8
|
)
|
1
|
|
(2
|
)
|
46
|
|
|||||||||
|
EBIT
|
2,625
|
|
|||||||||||||||||||||||||
_________________________
(1) Refer to Note 2; (2) Adjustment relates to the write-down of inventory (€53 million) and incremental incentives (€89 million) for vehicles affected by the explosions at the Port of Tianjin in August 2015; (3) Refer to Notes 2 and 4; (4) Refer to Note 5
|
Mass-Market Vehicles
|
|||||||||||||||||||||||||||
|
2014
|
NAFTA
|
LATAM
|
APAC
|
EMEA
|
Maserati
|
Components
|
Other activities
|
Unallocated items & adjustments
|
FCA
|
||||||||||||||||||
|
(€ million)
|
|||||||||||||||||||||||||||
|
Revenues
|
52,452
|
|
8,629
|
|
6,259
|
|
18,020
|
|
2,767
|
|
8,619
|
|
831
|
|
(3,937
|
)
|
93,640
|
|
|||||||||
|
Revenues from transactions with other segments
|
(271
|
)
|
(100
|
)
|
(10
|
)
|
(587
|
)
|
(7
|
)
|
(2,526
|
)
|
(436
|
)
|
3,937
|
|
—
|
|
|||||||||
|
Revenues from external customers
|
52,181
|
|
8,529
|
|
6,249
|
|
17,433
|
|
2,760
|
|
6,093
|
|
395
|
|
—
|
|
93,640
|
|
|||||||||
|
Adjusted EBIT
|
2,179
|
|
289
|
|
541
|
|
(41
|
)
|
275
|
|
285
|
|
(116
|
)
|
(50
|
)
|
3,362
|
|
|||||||||
|
Currency devaluations
(1)
|
—
|
|
(98
|
)
|
—
|
|
—
|
|
—
|
|
—
|
|
—
|
|
—
|
|
(98
|
)
|
|||||||||
|
Gains/(losses) on the disposal of investments
|
—
|
|
8
|
|
—
|
|
1
|
|
—
|
|
(1
|
)
|
4
|
|
—
|
|
12
|
|
|||||||||
|
Other impairments and asset write offs
(2)
|
(28
|
)
|
—
|
|
(4
|
)
|
(72
|
)
|
—
|
|
(5
|
)
|
(5
|
)
|
(1
|
)
|
(115
|
)
|
|||||||||
|
Restructuring (costs)/reversal
|
5
|
|
(22
|
)
|
—
|
|
(21
|
)
|
—
|
|
(15
|
)
|
3
|
|
—
|
|
(50
|
)
|
|||||||||
|
Other income/(expenses)
(3)
|
(509
|
)
|
—
|
|
—
|
|
24
|
|
—
|
|
(4
|
)
|
—
|
|
212
|
|
(277
|
)
|
|||||||||
|
EBIT
|
2,834
|
|
|||||||||||||||||||||||||
_________________________
(1) Refer to Note 2; (2) Refer to Note 4; (3) Primarily comprised of the one-off charge of €495 million in connection with the UAW MOU entered into by FCA US in January 2014 and the non-taxable gain of €223 million on the fair value remeasurement of the previously exercised options in connection with the acquisition of FCA US
F - 102
|
Mass-Market Vehicles
|
|||||||||||||||||||||||||||
|
2013
|
NAFTA
|
LATAM
|
APAC
|
EMEA
|
Maserati
|
Components
|
Other activities
|
Unallocated items & adjustments
|
FCA
|
||||||||||||||||||
|
(€ million)
|
|||||||||||||||||||||||||||
|
Revenues
|
45,777
|
|
9,973
|
|
4,668
|
|
17,335
|
|
1,659
|
|
8,080
|
|
929
|
|
(3,891
|
)
|
84,530
|
|
|||||||||
|
Revenues from transactions with other segments
|
(173
|
)
|
(100
|
)
|
(2
|
)
|
(637
|
)
|
(20
|
)
|
(2,521
|
)
|
(438
|
)
|
3,891
|
|
—
|
|
|||||||||
|
Revenues from external customers
|
45,604
|
|
9,873
|
|
4,666
|
|
16,698
|
|
1,639
|
|
5,559
|
|
491
|
|
—
|
|
84,530
|
|
|||||||||
|
Adjusted EBIT
|
2,219
|
|
619
|
|
338
|
|
(291
|
)
|
171
|
|
208
|
|
(80
|
)
|
(3
|
)
|
3,181
|
|
|||||||||
|
Jeep voluntary recall charge
(1)
|
(115
|
)
|
—
|
|
—
|
|
—
|
|
—
|
|
—
|
|
—
|
|
—
|
|
(115
|
)
|
|||||||||
|
Pension curtailment gain
(1)
|
166
|
|
—
|
|
—
|
|
—
|
|
—
|
|
—
|
|
—
|
|
—
|
|
166
|
|
|||||||||
|
Currency devaluations
(1)
|
—
|
|
(43
|
)
|
—
|
|
—
|
|
—
|
|
—
|
|
—
|
|
—
|
|
(43
|
)
|
|||||||||
|
Gains on the disposal of investments
|
—
|
|
—
|
|
—
|
|
6
|
|
—
|
|
—
|
|
2
|
|
—
|
|
8
|
|
|||||||||
|
Other impairments and asset write offs
(2)
|
—
|
|
(32
|
)
|
—
|
|
(206
|
)
|
(65
|
)
|
(59
|
)
|
—
|
|
—
|
|
(362
|
)
|
|||||||||
|
Restructuring (costs)/reversal
|
11
|
|
—
|
|
—
|
|
3
|
|
—
|
|
(2
|
)
|
(39
|
)
|
(1
|
)
|
(28
|
)
|
|||||||||
|
Other income/(expenses)
|
9
|
|
(52
|
)
|
(3
|
)
|
(18
|
)
|
—
|
|
(1
|
)
|
(50
|
)
|
(54
|
)
|
(169
|
)
|
|||||||||
|
EBIT
|
2,638
|
|
|||||||||||||||||||||||||
_________________________
(1) Refer to Note 2; (2) Refer to Note 4
Information about geographical area
|
At December 31,
|
||||||
|
2015
|
2014
|
|||||
|
Non-current assets (excluding financial assets, deferred tax assets and post-employment benefits
assets) in: |
(€ million)
|
|||||
|
North America
|
33,701
|
|
30,539
|
|
||
|
Italy
|
11,476
|
|
11,538
|
|
||
|
Brazil
|
4,612
|
|
4,638
|
|
||
|
Poland
|
1,208
|
|
1,183
|
|
||
|
Serbia
|
772
|
|
882
|
|
||
|
Other countries
|
2,346
|
|
2,129
|
|
||
|
Total Non-current assets (excluding financial assets, deferred tax assets and post-employment
benefits assets) |
54,115
|
|
50,909
|
|
||
(
30
) Venezuela Currency Regulations and Devaluation
On February 10, 2015, the Venezuelan government introduced a new market-based exchange system, the SIMADI exchange rate, with certain specified limitations on its usage by individuals and legal entities. On February 12, 2015, the SIMADI exchange rate began trading at 170.0 VEF to U.S.$ for individuals and entities in the private sector. In February 2015, the Venezuelan government also announced that the Supplementary Foreign Currency Administration System (“SICAD I”) and the additional auction-based foreign exchange system introduced by the Venezuelan government in March 2014 (“SICAD II”) would be merged into a single exchange system (the “SICAD”) with a rate starting at 12.0 VEF to U.S.$. As of March 31, 2015, the SICAD exchange rate was expected to be used to complete the majority of FCA Venezuela's transactions to exchange VEF for U.S.$ and as such, it was deemed the appropriate rate to use to convert our VEF denominated monetary assets and liabilities to U.S.$ for the first quarter 2015.
Due to the continuing deterioration of the economic conditions in Venezuela, as of June 30, 2015, we determined that it was unlikely that the majority of our future transactions to exchange VEF to U.S.$ would be at the SICAD rate. Rather, we had determined that the SIMADI exchange rate was the most appropriate rate to use based on the volume of VEF to U.S.$ exchange transactions that have occurred in Venezuela utilizing the SIMADI exchange rate as compared to the SICAD. As a
F - 103
result of adopting the SIMADI exchange rate at June 30, 2015, we recorded a remeasurement charge on our VEF denominated net monetary assets, including cash and cash equivalents in Venezuela of €53 million using an exchange rate of 197.3 VEF per U.S.$. In addition to the remeasurement charge, we recorded a €27 million charge for the write-down of inventory in Venezuela to the lower of cost or net realizable value, as due to pricing controls, we are unable to increase the VEF sales price in Venezuela to compensate for the devaluation. As of December 31, 2015, the SIMADI exchange rate of 199 VEF per U.S.$ did not result in the recording of any additional material charges. The total charge of €80 million was recorded in Cost of Sales for the year ended December 31, 2015.
During the year ended December 31, 2014, we recorded a remeasurement charge of €98 million in Cost of Sales resulting from our initial adoption of the SICAD I exchange rate to remeasure our VEF denominated net monetary assets. During the year ended December 31, 2013, we recorded €43 million in Cost of Sales for the devaluation of the VEF exchange rate relative to the U.S.$ and the remeasurement on the Group's VEF denominated net monetary assets.
(
31
) Qualitative and quantitative information on financial risks
The Group is exposed to the following financial risks connected with its operations:
|
•
|
credit risk, principally arising from its normal commercial relations with final customers and dealers, and its financing activities;
|
|
•
|
liquidity risk, with particular reference to the availability of funds and access to the credit market and to financial instruments in general;
|
|
•
|
financial market risk (principally relating to exchange rates, interest rates and commodity prices), since the Group operates at an international level in different currencies and uses financial instruments which generate interest. The Group is also exposed to the risk of changes in the price of certain commodities and of certain listed shares.
|
These risks could significantly affect the Group’s financial position and results and for this reason, the Group systematically identifies and monitors these risks in order to detect potential negative effects in advance and take the necessary action to mitigate them, primarily through its operating and financing activities and if required, through the use of derivative financial instruments in accordance with established risk management policies.
Financial instruments held by the funds that manage pension plan assets are not included in this analysis (see Note
21
).
The following section provides qualitative and quantitative disclosures on the effect that these risks may have upon the Group. The quantitative data reported in the following does not have any predictive value, in particular the sensitivity analysis on finance market risks does not reflect the complexity of the market or the reaction which may result from any changes that are assumed to take place.
Credit risk
Credit risk is the risk of economic loss arising from the failure to collect a receivable. Credit risk encompasses the direct risk of default and the risk of a deterioration of the creditworthiness of the counterparty.
The Group’s credit risk differs in relation to the activities carried out. In particular, dealer financing and operating and financial lease activities that are carried out through the Group’s financial services companies are exposed both to the direct risk of default and the deterioration of the creditworthiness of the counterparty, while the sale of vehicles and spare parts is mostly exposed to the direct risk of default of the counterparty. These risks are however mitigated by the fact that collection exposure is spread across a large number of counterparties and customers.
Overall, the credit risk regarding the Group’s trade receivables and receivables from financing activities is concentrated in the European Union, Latin America and North American markets.
F - 104
In order to test for impairment, significant receivables from corporate customers and receivables for which collectability is at risk are assessed individually, while receivables from end customers or small business customers are grouped into homogeneous risk categories. A receivable is considered impaired when there is objective evidence that the Group will be unable to collect all amounts due specified in the contractual terms. Objective evidence may be provided by the following factors: significant financial difficulties of the counterparty, the probability that the counterparty will be involved in an insolvency procedure or will default on its installment payments, the restructuring or renegotiation of open items with the counterparty, changes in the payment status of one or more debtors included in a specific risk category and other contractual breaches. The calculation of the amount of the impairment loss is based on the risk of default by the counterparty, which is determined by taking into account all the information available as to the customer’s solvency, the fair value of any guarantees received for the receivable and the Group’s historical experience.
The maximum credit risk to which the Group is potentially exposed at
December 31, 2015
is represented by the carrying amounts of financial assets in the financial statements and the nominal value of the guarantees provided on liabilities and commitments to third parties as discussed in Note
28
.
Dealers and final customers for which the Group provides financing are subject to specific assessments of their creditworthiness under a detailed scoring system; in addition to carrying out this screening process, the Group also obtains financial and non-financial guarantees for risks arising from credit granted. These guarantees are further strengthened where possible by reserve of title clauses on financed vehicle sales to the sales network made by Group financial service companies and on vehicles assigned under finance and operating lease agreements.
Receivables for financing activities amounting to €
2,006 million
at
December 31, 2015
(€
3,843 million
at
December 31, 2014
) contained balances totaling
€4 million
(
€3 million
at
December 31, 2014
), which have been written down on an individual basis. Of the remainder, balances totaling
€44 million
are past due by up to one month (
€71 million
at
December 31, 2014
), while balances totaling
€21 million
are past due by more than one month (
€31 million
at
December 31, 2014
). In the event of installment payments, even if only one installment is overdue, the entire receivable balance is classified as overdue.
Trade receivables and Other current receivables amounting to
€5,054 million
at
December 31, 2015
(
€4,810 million
at
December 31, 2014
) contain balances totaling
€13 million
(
€19 million
at
December 31, 2014
) which have been written down on an individual basis. Of the remainder, balances totaling
€214 million
are past due by up to one month (
€248 million
at
December 31, 2014
), while balances totaling
€211 million
are past due by more than one month (
€280 million
at
December 31, 2014
).
Even though our Current securities and Cash and cash equivalents consist of balances spread across various primary national and international banking institutions and money market instruments that are measured at fair value, there was no exposure to sovereign debt securities at
December 31, 2015
which might lead to significant repayment risk.
Liquidity risk
Liquidity risk arises if the Group is unable to obtain the funds needed to carry out its operations under economic conditions. Any actual or perceived limitations on the Group’s liquidity may affect the ability of counterparties to do business with the Group or may require additional amounts of cash and cash equivalents to be allocated as collateral for outstanding obligations.
The continuation of a difficult economic situation in the markets in which the Group operates and the uncertainties that characterize the financial markets, necessitate special attention to the management of liquidity risk. In that sense, measures taken to generate funds through operations and to maintain a conservative level of available liquidity are important factors for ensuring operational flexibility and addressing strategic challenges over the next few years.
The main factors that determine the Group’s liquidity situation are the funds generated by or used in operating and investing activities, the debt lending period and its renewal features or the liquidity of the funds employed and market terms and conditions.
F - 105
The Group has adopted a series of policies and procedures whose purpose is to optimize the management of funds and to reduce liquidity risk as follows:
|
•
|
centralizing the management of receipts and payments, where it may be economical in the context of the local civil, currency and fiscal regulations of the countries in which the Group is present;
|
|
•
|
maintaining a conservative level of available liquidity;
|
|
•
|
diversifying the means by which funds are obtained and maintaining a continuous and active presence in the capital markets;
|
|
•
|
obtaining adequate credit lines;
|
|
•
|
monitoring future liquidity on the basis of business planning.
|
The Group manages liquidity risk by monitoring cash flows and keeping an adequate level of funds at its disposal. The operating cash management and liquidity investment of the Group are centrally coordinated in the Group's treasury companies, with the objective of ensuring effective and efficient management of the Group’s funds. These companies obtain funds in the financial markets various funding sources.
FCA US currently manages its liquidity independently from the rest of the Group. Intercompany financing from FCA US to other Group entities is not restricted other than through the application of covenants requiring that transactions with related parties be conducted at arm’s length terms or be approved by a majority of the “disinterested” members of the Board of Directors of FCA US. In addition certain of FCA US ’s finance agreements restrict the distributions which it is permitted to make. In particular, dividend distributions, other than certain exceptions including permitted distributions and distributions with respect to taxes, are generally limited to an amount not to exceed 50 percent of cumulative consolidated net income (as defined in the agreements) from January 1, 2012 less distributions paid to date.
FCA has not provided any guarantee, commitment or similar obligation in relation to any of FCA US’s financial indebtedness, nor has it assumed any kind of obligation or commitment to fund FCA US. However, with the replacement of the prior FCA revolving credit facilities with the new FCA revolving credit facilities entered into in June 2015, FCA no longer has limitations in providing funding to FCA US. Certain notes issued by FCA and its subsidiaries (other than FCA US and its subsidiaries) include covenants which may be affected by circumstances related to FCA US, including cross-default clauses which may accelerate repayments in the event that FCA US fails to pay certain of its debt obligations.
Details of the repayment structure of the Group’s financial assets and liabilities are provided in Note
15
and in Note
23
. Details of the repayment structure of derivative financial instruments are provided in Note
17
.
The Group believes that the Group's total available liquidity, in addition to the funds that will be generated from operating and financing activities, will enable the Group to satisfy the requirements of its investing activities and working capital needs, fulfill its obligations to repay its debt at the natural due dates and ensure an appropriate level of operating and strategic flexibility.
Financial market risks
Due to the nature of our business, the Group is exposed to a variety of market risks, including foreign currency exchange rate risk, commodity price risk and interest rate risk.
The Group’s exposure to foreign currency exchange rate risk arises both in connection with the geographical distribution of the Group’s industrial activities compared to the markets in which it sells its products, and in relation to the use of external borrowing denominated in foreign currencies.
The Group’s exposure to interest rate risk arises from the need to fund industrial and financial operating activities and the necessity to deploy surplus funds. Changes in market interest rates may have the effect of either increasing or decreasing the Group’s Net profit/(loss), thereby indirectly affecting the costs and returns of financing and investing transactions.
F - 106
The Group’s exposure to commodity price risk arises from the risk of changes in the price of certain raw materials and energy used in production. Changes in the price of raw materials could have a significant effect on the Group’s results by indirectly affecting costs and product margins.
These risks could significantly affect the Group’s financial position and results and for this reason, these risks are systematically identified and monitored, in order to detect potential negative effects in advance and take the necessary actions to mitigate them, primarily through its operating and financing activities and if required, through the use of derivative financial instruments in accordance with its established risk management policies.
The Group’s policy permits derivatives to be used only for managing the exposure to fluctuations in foreign currency exchange rates and interest rates as well as commodities prices connected with future cash flows and assets and liabilities, and not for speculative purposes.
The Group utilizes derivative financial instruments designated as fair value hedges mainly to hedge:
|
•
|
the foreign currency exchange rate risk on financial instruments denominated in foreign currency; and
|
|
•
|
the interest rate risk on fixed rate loans and borrowings.
|
The instruments used for these hedges are mainly foreign currency forward contracts, interest rate swaps and combined interest rate and foreign currency financial instruments.
The Group uses derivative financial instruments as cash flow hedges for the purpose of pre-determining:
|
•
|
the exchange rate at which forecasted transactions denominated in foreign currencies will be accounted for;
|
|
•
|
the interest paid on borrowings, both to match the fixed interest received on loans (customer financing activity), and to achieve a targeted mix of floating versus fixed rate funding structured loans; and
|
|
•
|
the price of certain commodities.
|
The foreign currency exchange rate exposure on forecasted commercial flows is hedged by foreign currency swaps and forward contracts. Interest rate exposures are usually hedged by interest rate swaps and, in limited cases, by forward rate agreements. Exposure to changes in the price of commodities is generally hedged by using commodity swaps and commodity options. Counterparties to these agreements are major financial institutions.
Information on the fair value of derivative financial instruments held at the balance sheet date is provided in Note
17
.
Quantitative information on foreign currency exchange rate risk
The Group is exposed to risk resulting from changes in foreign currency exchange rates, which can affect its earnings and equity. In particular:
|
•
|
where a Group company incurs costs in a currency different from that of its revenues, any change in exchange rates can affect the operating results of that company.
|
|
•
|
the principal exchange rates to which the Group is exposed are:
|
|
▪
|
EUR/U.S.$, relating to sales in U.S.$ made by Italian companies (in particular, companies belonging to the Maserati segment) and to sales and purchases in Euro made by FCA US;
|
|
▪
|
U.S.$/CAD, primarily relating to FCA US's Canadian manufacturing operations;
|
|
▪
|
CNY, in relation to sales in China originating from FCA US and from Italian companies (in particular, companies belonging to the Maserati segment);
|
|
▪
|
GBP, AUD, MXN, CHF, ARS and VEF in relation to sales in the UK, Australian, Mexican, Swiss, Argentinean and Venezuelan markets;
|
|
▪
|
PLN and TRY, relating to manufacturing costs incurred in Poland and Turkey;
|
F - 107
|
▪
|
JPY mainly in relation to purchase of parts from Japanese suppliers and sales of vehicles in Japan;
|
|
▪
|
U.S.$/BRL, EUR/BRL, relating to Brazilian manufacturing operations and the related import and export flows.
|
The Group’s policy is to use derivative financial instruments to hedge a percentage of certain exposures subject to foreign currency exchange rate risk for the upcoming 12 months (including such risk before or beyond that date where it is deemed appropriate in relation to the characteristics of the business) and to hedge the exposure resulting from firm commitments unless not deemed appropriate.
Group companies may have trade receivables or payables denominated in a currency different from their respective functional currency. In addition, in a limited number of cases, it may be convenient from an economic point of view, or it may be required under local market conditions, for Group companies to obtain financing or use funds in a currency different from their respective functional currency. Changes in exchange rates may result in exchange gains or losses arising from these situations. The Group’s policy is to hedge, whenever deemed appropriate, the exposure resulting from receivables, payables and securities denominated in foreign currencies different from the respective Group companies' functional currency.
Certain of the Group’s companies are located in countries which are outside of the Eurozone, in particular the U.S., Brazil, Canada, Poland, Serbia, Turkey, Mexico, Argentina, the Czech Republic, India, China and South Africa. As the Group's reporting currency is the Euro, the income statements of those entities that have a reporting currency other than the Euro, are translated into Euro using the average exchange rate for the period. In addition, the monetary assets and liabilities of these consolidated companies are translated into Euro at the period-end foreign exchange rate. The effects of these changes in foreign exchange rates are recognized directly in the Cumulative Translation Adjustments reserve included in Other comprehensive income/(losses). Changes in exchange rates may lead to effects on the translated balances of revenues, costs and monetary assets and liabilities reported in Euro, even when corresponding items are unchanged in the respective local currency of these companies.
The Group monitors its principal exposure to conversion exchange risk, although there was no specific hedging in this respect at the balance sheet dates.
There have been no substantial changes in
2015
in the nature or structure of exposure to foreign currency exchange rate risk or in the Group’s hedging policies.
The potential loss in fair value of derivative financial instruments held for foreign currency exchange rate risk management (currency swaps/forwards, cross-currency interest rate and currency swaps) at
December 31, 2015
resulting from a hypothetical
10.0 percent
change in the exchange rates would have been approximately
€1,490 million
(
€1,402 million
at
December 31, 2014
).
Receivables, payables and future trade flows whose hedging transactions have been analyzed were not considered in this analysis. It is reasonable to assume that changes in exchange rates will produce the opposite effect, of an equal or greater amount, on the underlying transactions that have been hedged.
Quantitative information on interest rate risk
The manufacturing companies and treasuries of the Group make use of external borrowings and invest in monetary and financial market instruments. In addition, Group companies sell receivables resulting from their trading activities on a continuing basis. Changes in market interest rates can affect the cost of the various forms of financing, including the sale of receivables, or the return on investments, and the employment of funds, thus negatively impacting the net financial expenses incurred by the Group.
In addition, the financial services companies provide loans (mainly to customers and dealers), financing themselves using various forms of direct debt or asset-backed financing (e.g. factoring of receivables). Where the characteristics of the variability of the interest rate applied to loans granted differ from those of the variability of the cost of the financing obtained, changes in the current level of interest rates can affect the operating result of those companies and the Group as a whole.
F - 108
In order to manage these risks, the Group uses interest rate derivative financial instruments, mainly interest rate swaps and forward rate agreements, when available in the market, with the object of mitigating, under economically acceptable conditions, the potential variability of interest rates on Net profit/(loss).
In assessing the potential impact of changes in interest rates, the Group segregates fixed rate financial instruments (for which the impact is assessed in terms of fair value) from floating rate financial instruments (for which the impact is assessed in terms of cash flows).
The fixed rate financial instruments used by the Group consist principally of part of the portfolio of the financial services companies (basically customer financing and financial leases) and part of debt (including subsidized loans and notes).
The potential loss in fair value of fixed rate financial instruments (including the effect of interest rate derivative financial instruments) held at
December 31, 2015
, resulting from a hypothetical
10 percent
change in market interest rates, would have been approximately
€85 million
(approximately
€100 million
at
December 31, 2014
).
Floating rate financial instruments consist principally of cash and cash equivalents, loans provided by the financial services companies to the sales network and part of debt. The effect of the sale of receivables is also considered in the sensitivity analysis as well as the effect of hedging derivative instruments.
A hypothetical
10 percent
change in short-term interest rates at
December 31, 2015
, applied to floating rate financial assets and liabilities, operations for the sale of receivables and derivative financial instruments, would have resulted in increased net financial expenses before taxes, on an annual basis, of approximately
€7 million
(
€12 million
at
December 31, 2014
).
This analysis is based on the assumption that there is a general change of
10.0 percent
proportionate to interest rate levels across homogeneous categories. A homogeneous category is defined on the basis of the currency in which the financial assets and liabilities are denominated. In addition, the sensitivity analysis applied to floating rate financial instruments assumes that cash and cash equivalents and other short-term financial assets and liabilities which expire during the projected 12 month period will be renewed or reinvested in similar instruments, bearing the hypothetical short-term interest rates.
Quantitative information on commodity price risk
The Group has entered into derivative contracts for certain commodities to hedge its exposure to commodity price risk associated with buying raw materials and energy used in its normal operations.
In connection with the commodity price derivative contracts outstanding at
December 31, 2015
, a hypothetical
10.0 percent
change in the price of the commodities at that date would have caused a fair value loss of
€40 million
(
€50 million
at
December 31, 2014
). Future trade flows whose hedging transactions have been analyzed were not considered in this analysis. It is reasonable to assume that changes in commodity prices will produce the opposite effect, of an equal or greater amount, on the underlying transactions that have been hedged.
(
32
) Subsequent events
The Group has evaluated subsequent events through February 29, 2016, which is the date the financial statements were authorized for issuance.
Ferrari Spin-off
The transactions to separate Ferrari N.V. from the Group were completed on January 3, 3016. FCA shareholders received one common share of Ferrari N.V. for every ten common shares of FCA and holders of the mandatory convertible securities (Note
19
) were entitled to receive 0.77369 common shares of Ferrari N.V. for each mandatory convertible security of U.S.$100 notional amount held of record on January 5, 2016. In addition, FCA shareholders participating in the FCA loyalty voting structure received one special voting share of Ferrari N.V. for every ten special voting shares of FCA held of record on January 5, 2016. Furthermore, on January 13, 2016, holders of FCA shares received a cash payment of €0.01, less any required applicable withholding tax, for each share held of record as of January 5, 2016.
F - 109
In accordance with the terms of the Mandatory Convertible Securities, certain economic provisions of the Mandatory Convertible Securities (Note
19
) were adjusted, effective as of January, 15, 2016, as a consequence of the spin-off of Ferrari N.V. to the holders of the Mandatory Convertible Securities:
|
•
|
Initial Price was adjusted from U.S.$11.00 to U.S.$7.1244
|
|
•
|
Threshold Appreciation Price was adjusted from U.S.$12.9250 to U.S.$8.3712
|
|
•
|
Stated Amount was adjusted from U.S.$100.00 to U.S.64.7675
|
|
•
|
the common share prices included within the definition of “Early Conversion Rate” applicable to a “fundamental change” (as defined in the prospectus of the Mandatory Convertible Securities) were also adjusted
|
The relevant fraction used to affect the adjustments noted above was calculated using the average of the daily Volume Weighted Average Price (“VWAP”) from January 5, 2016 to January 15, 2016 for both FCA common shares and Ferrari N.V. common shares.
On January 26, 2016, a conversion factor of 1.5440 was approved by the FCA Compensation Committee and applied to outstanding FCA NV PSU and RSU awards (Note
20
) as an equitable adjustment to make equity award holders whole for the diminution in value of an FCA share resulting from the spin-off of Ferrari N.V.
F - 110
TABLE OF CONTENTS
Part IItem 1. Identity Of Directors, Senior Management and AdvisersItem 2. Offer Statistics and Expected Time TableItem 3. Key InformationItem 3D. Risk FactorsItem 5. Operating and Financial ReviewItem 5. Operating and Financial Review Trends, Uncertainties and OpportunitiesItem 4B. Business Overview Industry Overview Environmental and Other Regulatory MattersItem 5. Operating and Financial Review Critical Accounting Estimates Pension PlansItem 5B. Liquidity and Capital ResourcesItem 6D. EmployeesItem 4. Information on The CompanyItem 10. Additional Information B. Memorandum and Article Of Association -loyalty Voting StructureItem 5. Operating and Financial Review Non-gaap Financial Measures Net DebtItem 5A. Operating Results Shipment InformationItem 5B. Liquidity and Capital Resources Liquidity OverviewItem 4B. Business Overview Industry Overview Industrial Environmental ControlItem 4A. Unresolved Staff CommentsItem 4B. Business Overview Overview Of Our BusinessItem 5A. Operating Results Results Of OperationsItem 4B. Business Overview Overview Of Our Business,Item 4B. Business Overview Mass-market VehiclesItem 5. Operating and Financial Review Non Gaap Financial MeasuresItem 5 Operating and Financial Review Trends, Uncertainties and OpportunitiesItem 6. Directors, Senior Management and EmployeesItem 6A. Directors and Senior ManagementItem 7. Major Shareholders and Related Party TransactionsItem 8. Financial InformationItem 18. Financial StatementsItem 4B. Business OverviewItem 4B. Business Overview Legal ProceedingsItem 10B. Memorandum and Article Of AssociationItem 9. The Offer and ListingItem 10. Additional InformationItem 11. Quantitative and Qualitative DisclosuresItem 12. Description Of Securities Other Than Equity SecuritiesPart IIItem 13. Defaults, Dividends Arrearages and DelinquenciesItem 14. Material Modifications To The Rights Of Security Holders and Use Of ProceedsItem 15. Controls and ProceduresItem 16A. Audit Committee Financial ExpertItem 16B. Code Of EthicsItem 16C. Principal Accountant Fees and ServicesItem 16D. Exemptions From The Listing Standards For Audit CommitteesItem 16E. Purchases Of Equity Securities By The Issuer and Affiliated PurchasersItem 16F. Change in Registrant's Certifying AccountantItem 16G. Corporate GovernanceItem 10B. Memorandum and Articles Of Association Payment Of DividendsItem 16H. Mine Safety DisclosurePart IIIItem 17. Financial StatementsItem 19. Exhibits