|
|
|
|
|
|
|
|
|
|
|
|
|
|
|
|
|
|
|
|
|
|
|
|
|
|
|
|
|
|
|
|
|
|
|
|
|
|
|
|
|
|
|
|
|
|
|
|
|
|
|
|
|
|
|
|
UNITED STATES
SECURITIES AND EXCHANGE COMMISSION
WASHINGTON, D.C. 20549
FORM 10-Q
x Quarterly Report Pursuant to Section 13 or 15(d) of the Securities Exchange Act of 1934
For the quarterly period ended March 31, 2014
OR
o Transition Report Pursuant to Section 13 or 15(d) of the Securities Exchange Act of 1934
Commission File Number 0-21719
Steel Dynamics, Inc.
(Exact name of registrant as specified in its charter)
|
Indiana |
|
35-1929476 |
|
(State or other jurisdiction of incorporation or organization) |
|
(I.R.S. Employer Identification No.) |
|
|
|
|
|
7575 West Jefferson Blvd, Fort Wayne, IN |
|
46804 |
|
(Address of principal executive offices) |
|
(Zip Code) |
Registrant’s telephone number, including area code: (260) 969-3500
Indicate by check mark whether the registrant (1) has filed all reports required to be filed by Section 13 or 15(d) of the Securities Exchange Act of 1934 during the preceding 12 months (or for such shorter period that the registrant was required to file such reports), and (2) has been subject to such filing requirements for the past 90 days. Yes x No o
Indicate by check mark whether the registrant has submitted electronically and posted on its corporate Web site, if any, every Interactive Data File required to be submitted and posted pursuant to Rule 405 of Regulation S-T (§232.405 of this chapter) during the preceding 12 months (or for such shorter period that the registrant was required to submit and post such files). Yes x No o
Indicate by check mark whether the registrant is a large accelerated filer, an accelerated filer, a non-accelerated filer, or a smaller reporting company (see definitions of “large accelerated filer,” “accelerated filer” and “smaller reporting company” in Rule 12b-2 of the Exchange Act).
|
(Check one): |
|
Large accelerated filer x |
|
Accelerated filer o |
|
Non-accelerated filer o |
|
Smaller reporting company o |
Indicate by check mark whether the registrant is a shell company (as defined in Rule 12b-2 of the Exchange Act). Yes o No x
As of April 30, 2014, Registrant had 223,375,430 outstanding shares of common stock.
STEEL DYNAMICS, INC.
|
|
|
|
|
Page |
|
Item 1. |
Financial Statements: |
|
|
|
|
|
|
|
Consolidated Balance Sheets as of March 31, 2014 (unaudited) and December 31, 2013 |
1 |
|
|
|
|
|
|
2 |
|
|
|
|
|
|
|
3 |
|
|
|
|
|
|
|
4 |
|
|
|
|
|
|
Management’s Discussion and Analysis of Financial Condition and Results of Operations |
15 |
|
|
|
|
|
|
22 |
||
|
|
|
|
|
22 |
||
|
|
|
|
|
|
|
|
|
|
|
|
|
|
|
|
|
|
|
|
|
23 |
||
|
|
|
|
|
23 |
||
|
|
|
|
|
23 |
||
|
|
|
|
|
23 |
||
|
|
|
|
|
23 |
||
|
|
|
|
|
23 |
||
|
|
|
|
|
24 |
||
|
|
|
|
|
|
25 |
STEEL DYNAMICS, INC.
(in thousands, except share data)
|
|
|
March 31, |
|
December 31, |
|
|||
|
|
|
2014 |
|
2013 |
|
|||
|
|
|
(unaudited) |
|
|
||||
|
Assets |
|
|
|
|
|
|||
|
Current assets |
|
|
|
|
|
|||
|
Cash and equivalents |
|
$ |
342,919 |
|
$ |
395,156 |
|
|
|
Accounts receivable, net |
|
760,654 |
|
664,208 |
|
|||
|
Accounts receivable-related parties |
|
50,446 |
|
56,392 |
|
|||
|
Inventories |
|
1,332,101 |
|
1,314,747 |
|
|||
|
Deferred income taxes |
|
17,871 |
|
17,964 |
|
|||
|
Other current assets |
|
24,363 |
|
25,167 |
|
|||
|
Total current assets |
|
2,528,354 |
|
2,473,634 |
|
|||
|
|
|
|
|
|
|
|||
|
Property, plant and equipment, net |
|
2,197,503 |
|
2,226,134 |
|
|||
|
|
|
|
|
|
|
|||
|
Restricted cash |
|
18,588 |
|
23,827 |
|
|||
|
Intangible assets, net |
|
379,488 |
|
386,159 |
|
|||
|
Goodwill |
|
730,360 |
|
731,996 |
|
|||
|
Other assets |
|
59,564 |
|
91,256 |
|
|||
|
Total assets |
|
$ |
5,913,857 |
|
$ |
5,933,006 |
|
|
|
|
|
|
|
|
|
|||
|
Liabilities and Equity |
|
|
|
|
|
|||
|
Current liabilities |
|
|
|
|
|
|||
|
Accounts payable |
|
$ |
401,539 |
|
$ |
404,605 |
|
|
|
Accounts payable-related parties |
|
15,629 |
|
10,327 |
|
|||
|
Income taxes payable |
|
23,531 |
|
4,023 |
|
|||
|
Accrued payroll and benefits |
|
57,384 |
|
93,432 |
|
|||
|
Accrued interest |
|
21,911 |
|
31,363 |
|
|||
|
Accrued expenses |
|
87,715 |
|
89,884 |
|
|||
|
Current maturities of long-term debt |
|
343,722 |
|
341,544 |
|
|||
|
Total current liabilities |
|
951,431 |
|
975,178 |
|
|||
|
|
|
|
|
|
|
|||
|
Long-term debt |
|
|
|
|
|
|||
|
Term note |
|
209,687 |
|
220,000 |
|
|||
|
Senior notes |
|
1,500,000 |
|
1,500,000 |
|
|||
|
Other long-term debt |
|
45,341 |
|
46,045 |
|
|||
|
Total long-term debt |
|
1,755,028 |
|
1,766,045 |
|
|||
|
|
|
|
|
|
|
|||
|
Deferred income taxes |
|
550,225 |
|
556,038 |
|
|||
|
Other liabilities |
|
22,843 |
|
23,376 |
|
|||
|
|
|
|
|
|
|
|||
|
Commitments and contingencies |
|
|
|
|
|
|||
|
|
|
|
|
|
|
|||
|
Redeemable noncontrolling interests |
|
121,834 |
|
116,514 |
|
|||
|
|
|
|
|
|
|
|||
|
Equity |
|
|
|
|
|
|||
|
Common stock voting, $.0025 par value; 900,000,000 shares authorized; 259,046,646 and 258,840,350 shares issued; and 223,173,055 and 222,867,408 shares outstanding, as of March 31, 2014 and December 31, 2013, respectively |
|
646 |
|
645 |
|
|||
|
Treasury stock, at cost; 35,873,591 and 35,972,942 shares, as of March 31, 2014 and December 31, 2013, respectively |
|
(716,545 |
) |
(718,529 |
) |
|||
|
Additional paid-in capital |
|
1,092,281 |
|
1,085,694 |
|
|||
|
Retained earnings |
|
2,192,413 |
|
2,179,513 |
|
|||
|
Total Steel Dynamics, Inc. equity |
|
2,568,795 |
|
2,547,323 |
|
|||
|
Noncontrolling interests |
|
(56,299 |
) |
(51,468 |
) |
|||
|
Total equity |
|
2,512,496 |
|
2,495,855 |
|
|||
|
Total liabilities and equity |
|
$ |
5,913,857 |
|
$ |
5,933,006 |
|
|
See notes to consolidated financial statements.
STEEL DYNAMICS, INC.
CONSOLIDATED STATEMENTS OF INCOME (UNAUDITED)
(in thousands, except per share data)
|
|
|
Three Months Ended |
|
||||
|
|
|
March 31, |
|
||||
|
|
|
2014 |
|
2013 |
|
||
|
|
|
|
|
|
|
||
|
Net sales |
|
|
|
|
|
||
|
Unrelated parties |
|
$ |
1,765,881 |
|
$ |
1,728,401 |
|
|
Related parties |
|
64,201 |
|
67,295 |
|
||
|
Total net sales |
|
1,830,082 |
|
1,795,696 |
|
||
|
|
|
|
|
|
|
||
|
Costs of goods sold |
|
1,666,778 |
|
1,619,432 |
|
||
|
Gross profit |
|
163,304 |
|
176,264 |
|
||
|
|
|
|
|
|
|
||
|
Selling, general and administrative expenses |
|
70,042 |
|
65,262 |
|
||
|
Profit sharing |
|
5,395 |
|
6,643 |
|
||
|
Amortization of intangible assets |
|
6,935 |
|
8,127 |
|
||
|
Total selling, general and administrative expenses |
|
82,372 |
|
80,032 |
|
||
|
|
|
|
|
|
|
||
|
Operating income |
|
80,932 |
|
96,232 |
|
||
|
|
|
|
|
|
|
||
|
Interest expense, net of capitalized interest |
|
30,569 |
|
34,629 |
|
||
|
Other expense (income), net |
|
(631 |
) |
(1,046 |
) |
||
|
Income before income taxes |
|
50,994 |
|
62,649 |
|
||
|
|
|
|
|
|
|
||
|
Income taxes |
|
17,296 |
|
21,397 |
|
||
|
|
|
|
|
|
|
||
|
Net income |
|
33,698 |
|
41,252 |
|
||
|
|
|
|
|
|
|
||
|
Net loss attributable to noncontrolling interests |
|
4,881 |
|
6,963 |
|
||
|
|
|
|
|
|
|
||
|
Net income attributable to Steel Dynamics, Inc. |
|
$ |
38,579 |
|
$ |
48,215 |
|
|
|
|
|
|
|
|
||
|
Basic earnings per share attributable to Steel Dynamics, Inc. stockholders |
|
$ |
.17 |
|
$ |
.22 |
|
|
|
|
|
|
|
|
||
|
Weighted average common shares outstanding |
|
223,011 |
|
219,995 |
|
||
|
|
|
|
|
|
|
||
|
Diluted earnings per share attributable to Steel Dynamics, Inc. stockholders, including the effect of assumed conversions when dilutive |
|
$ |
.17 |
|
$ |
.21 |
|
|
|
|
|
|
|
|
||
|
Weighted average common shares and share equivalents outstanding |
|
241,394 |
|
238,087 |
|
||
|
|
|
|
|
|
|
||
|
Dividends declared per share |
|
$ |
.115 |
|
$ |
.11 |
|
See notes to consolidated financial statements.
STEEL DYNAMICS, INC.
CONSOLIDATED STATEMENTS OF CASH FLOWS (UNAUDITED)
(in thousands)
|
|
|
Three Months Ended |
|
||||
|
|
|
March 31, |
|
||||
|
|
|
2014 |
|
2013 |
|
||
|
|
|
|
|
|
|
||
|
Operating activities: |
|
|
|
|
|
||
|
Net income |
|
$ |
33,698 |
|
$ |
41,252 |
|
|
|
|
|
|
|
|
||
|
Adjustments to reconcile net income to net cash provided by (used in) operating activities: |
|
|
|
|
|
||
|
Depreciation and amortization |
|
57,568 |
|
57,061 |
|
||
|
Equity-based compensation |
|
5,768 |
|
4,753 |
|
||
|
Deferred income taxes |
|
(4,091 |
) |
10,935 |
|
||
|
(Gain) loss on disposal of property, plant and equipment |
|
2,641 |
|
(1,383 |
) |
||
|
Changes in certain assets and liabilities: |
|
|
|
|
|
||
|
Accounts receivable |
|
(88,950 |
) |
(110,938 |
) |
||
|
Inventories |
|
(17,354 |
) |
32,348 |
|
||
|
Other assets |
|
7,359 |
|
3,358 |
|
||
|
Accounts payable |
|
5,041 |
|
38,988 |
|
||
|
Income taxes receivable/payable |
|
19,393 |
|
(3,022 |
) |
||
|
Accrued expenses and liabilities |
|
(48,320 |
) |
(43,642 |
) |
||
|
Net cash provided by (used in) operating activities |
|
(27,247 |
) |
29,710 |
|
||
|
|
|
|
|
|
|
||
|
Investing activities: |
|
|
|
|
|
||
|
Purchases of property, plant and equipment |
|
(24,841 |
) |
(45,346 |
) |
||
|
Other investing activities |
|
28,884 |
|
33,934 |
|
||
|
Net cash provided by (used in) investing activities |
|
4,043 |
|
(11,412 |
) |
||
|
|
|
|
|
|
|
||
|
Financing activities: |
|
|
|
|
|
||
|
Issuance of current and long-term debt |
|
43,453 |
|
409,261 |
|
||
|
Repayment of current and long-term debt |
|
(56,246 |
) |
(305,691 |
) |
||
|
Debt issuance costs |
|
— |
|
(5,997 |
) |
||
|
Proceeds from exercise of stock options, including related tax effect |
|
2,905 |
|
7,614 |
|
||
|
Contributions from noncontrolling investors, net |
|
5,370 |
|
411 |
|
||
|
Dividends paid |
|
(24,515 |
) |
(21,952 |
) |
||
|
Net cash provided by (used in) financing activities |
|
(29,033 |
) |
83,646 |
|
||
|
|
|
|
|
|
|
||
|
Increase (decrease) in cash and equivalents |
|
(52,237 |
) |
101,944 |
|
||
|
Cash and equivalents at beginning of period |
|
395,156 |
|
375,917 |
|
||
|
|
|
|
|
|
|
||
|
Cash and equivalents at end of period |
|
$ |
342,919 |
|
$ |
477,861 |
|
|
|
|
|
|
|
|
||
|
Supplemental disclosure information: |
|
|
|
|
|
||
|
Cash paid for interest |
|
$ |
39,663 |
|
$ |
49,732 |
|
|
Cash paid for federal and state income taxes, net |
|
$ |
2,143 |
|
$ |
11,165 |
|
See notes to consolidated financial statements.
STEEL DYNAMICS, INC.
NOTES TO CONSOLIDATED FINANCIAL STATEMENTS (UNAUDITED)
Description of the Business
Steel Dynamics, Inc. (SDI), together with its subsidiaries (the company), is a domestic manufacturer of steel products and metals recycler. The company has three reporting segments: steel operations, metals recycling and ferrous resources operations, and steel fabrication operations.
Steel Operations. Steel operations include the company’s Flat Roll Division, Structural and Rail Division, Engineered Bar Products Division, Roanoke Bar Division, Steel of West Virginia and The Techs operations. These operations consist of mini-mills, producing steel from steel scrap, using electric arc furnaces, continuous casting, automated rolling mills, and downstream finishing facilities. Steel operations accounted for 61% and 59% of the company’s external net sales during the three-month periods ended March 31, 2014 and 2013, respectively.
Metals Recycling and Ferrous Resources Operations. Metals recycling and ferrous resources operations primarily include OmniSource Corporation, the company’s metals recycling, steel scrap procurement, and processing locations, and our two ironmaking initiatives: Iron Dynamics, a liquid pig iron production facility; and our Minnesota iron operations, an iron nugget production facility and operations to supply the nugget facility with its primary raw material, iron concentrate. Metals recycling and ferrous resources operations accounted for 32% and 35% of the company’s external net sales during the three-month periods ended March 31, 2014 and 2013, respectively.
Steel Fabrication Operations. Steel fabrication operations include the company’s six New Millennium Building Systems joist and deck plants located throughout the United States and Northern Mexico. Revenues from these plants are generated from the fabrication of trusses, girders, steel joists and steel decking used within the non-residential construction industry. Steel fabrication operations accounted for 6% and 5% of the company’s external net sales during the three-month periods ended March 31, 2014 and 2013, respectively.
Significant Accounting Policies
Principles of Consolidation . The consolidated financial statements include the accounts of SDI, together with its wholly and majority-owned or controlled subsidiaries, after elimination of significant intercompany accounts and transactions. Noncontrolling interests represent the noncontrolling owner’s proportionate share in the equity, income, or losses of the company’s majority-owned or controlled consolidated subsidiaries.
Use of Estimates. These financial statements are prepared in conformity with accounting principles generally accepted in the United States and, accordingly, include amounts that require management to make estimates and assumptions that affect the amounts reported in the financial statements and in the notes thereto. Significant items subject to such estimates and assumptions include the carrying value of property, plant and equipment, intangible assets and goodwill; valuation allowances for trade receivables, inventories and deferred income tax assets; unrecognized tax benefits; potential environmental liabilities; and litigation claims and settlements. Actual results may differ from these estimates and assumptions.
In the opinion of management, these financial statements reflect all normal recurring adjustments necessary for a fair presentation of the interim period results. These financial statements and notes should be read in conjunction with the audited financial statements and notes thereto included in the company’s Annual Report on Form 10-K for the year ended December 31, 2013.
Goodwill . The company’s goodwill is allocated to the following reporting units at March 31, 2014, and December 31, 2013, (in thousands):
|
|
|
March 31, |
|
December 31, |
|
||
|
|
|
2014 |
|
2013 |
|
||
|
OmniSource — Metals Recycling/Ferrous Resources Segment |
|
$ |
556,611 |
|
$ |
558,247 |
|
|
The Techs — Steel Segment |
|
142,783 |
|
142,783 |
|
||
|
Roanoke Bar Division — Steel Segment |
|
29,041 |
|
29,041 |
|
||
|
New Millennium Building Systems — Fabrication Segment |
|
1,925 |
|
1,925 |
|
||
|
|
|
$ |
730,360 |
|
$ |
731,996 |
|
OmniSource goodwill decreased $1.6 million from December 31, 2013 to March 31, 2014, in recognition of the 2014 tax benefit related to the amortization of the component of OmniSource tax-deductible goodwill in excess of book goodwill.
STEEL DYNAMICS, INC.
NOTES TO CONSOLIDATED FINANCIAL STATEMENTS (UNAUDITED)
Basic earnings per share is based on the weighted average shares of common stock outstanding during the period. Diluted earnings per share assumes the weighted average dilutive effect of common share equivalents outstanding during the period applied to the company’s basic earnings per share. Common share equivalents represent potentially dilutive stock options, restricted stock units, deferred stock units, and dilutive shares related to the company’s 5.125% convertible senior notes, which mature in June 2014; and are excluded from the computation in periods in which they have an anti-dilutive effect. No options to purchase shares were anti-dilutive at March 31, 2014, while options to purchase 3.0 million shares were anti-dilutive at March 31, 2013.
The following table presents a reconciliation of the numerators and the denominators of the company’s basic and diluted earnings per share computations for net income attributable to Steel Dynamics, Inc. (in thousands, except per share data):
|
|
|
Three Months Ended March 31, |
|
||||||||||||||
|
|
|
2014 |
|
2013 |
|
||||||||||||
|
|
|
Net Income
|
|
Shares
|
|
Per Share
|
|
Net Income
|
|
Shares
|
|
Per Share
|
|
||||
|
Basic earnings per share |
|
$ |
38,579 |
|
223,011 |
|
$ |
.17 |
|
$ |
48,215 |
|
219,995 |
|
$ |
0.22 |
|
|
Dilutive common share equivalents |
|
— |
|
1,608 |
|
|
|
— |
|
1,460 |
|
|
|
||||
|
5.125% convertible senior notes, net of tax |
|
2,358 |
|
16,775 |
|
|
|
2,358 |
|
16,632 |
|
|
|
||||
|
Diluted earnings per share |
|
$ |
40,937 |
|
241,394 |
|
$ |
.17 |
|
$ |
50,573 |
|
238,087 |
|
$ |
0.21 |
|
Inventories are stated at lower of cost or market. Cost is determined using a weighted average cost method for scrap, and on a first-in, first-out basis for other inventory. Inventory consisted of the following (in thousands):
|
|
|
March 31, |
|
December 31, |
|
||
|
|
|
2014 |
|
2013 |
|
||
|
Raw materials |
|
$ |
615,776 |
|
$ |
660,384 |
|
|
Supplies |
|
292,119 |
|
293,533 |
|
||
|
Work in progress |
|
112,504 |
|
84,710 |
|
||
|
Finished goods |
|
311,702 |
|
276,120 |
|
||
|
Total inventories |
|
$ |
1,332,101 |
|
$ |
1,314,747 |
|
The following table provides a reconciliation of the beginning and ending carrying amounts of total equity, equity attributable to stockholders of Steel Dynamics, Inc. and equity and redeemable amounts attributable to the noncontrolling interests (in thousands):
|
|
|
Stockholders of Steel Dynamics, Inc. |
|
|
|
|
|
|
|
|||||||||||||
|
|
|
Common |
|
Additional
|
|
Retained |
|
Treasury |
|
Noncontrolling |
|
Total |
|
Redeemable
|
|
|||||||
|
|
|
Stock |
|
Capital |
|
Earnings |
|
Stock |
|
Interests |
|
Equity |
|
Interests |
|
|||||||
|
|
|
|
|
|
|
|
|
|
|
|
|
|
|
|
|
|||||||
|
Balances at January 1, 2014 |
|
$ |
645 |
|
$ |
1,085,694 |
|
$ |
2,179,513 |
|
$ |
(718,529 |
) |
$ |
(51,468 |
) |
$ |
2,495,855 |
|
$ |
116,514 |
|
|
Proceeds from the exercise of stock options, including related tax effect |
|
1 |
|
3,537 |
|
— |
|
— |
|
— |
|
3,538 |
|
— |
|
|||||||
|
Dividends declared |
|
— |
|
— |
|
(25,665 |
) |
— |
|
— |
|
(25,665 |
) |
— |
|
|||||||
|
Equity-based compensation and issuance of restricted stock |
|
— |
|
3,050 |
|
(14 |
) |
1,984 |
|
— |
|
5,020 |
|
— |
|
|||||||
|
Contributions from noncontrolling investors |
|
— |
|
— |
|
— |
|
— |
|
89 |
|
89 |
|
5,320 |
|
|||||||
|
Distributions to noncontrolling investors |
|
— |
|
— |
|
— |
|
— |
|
(39 |
) |
(39 |
) |
— |
|
|||||||
|
Net income (loss) |
|
— |
|
— |
|
38,579 |
|
— |
|
(4,881 |
) |
33,698 |
|
— |
|
|||||||
|
Balances at March 31, 2014 |
|
$ |
646 |
|
$ |
1,092,281 |
|
$ |
2,192,413 |
|
$ |
(716,545 |
) |
$ |
(56,299 |
) |
$ |
2,512,496 |
|
$ |
121,834 |
|
STEEL DYNAMICS, INC.
NOTES TO CONSOLIDATED FINANCIAL STATEMENTS (UNAUDITED)
The company is exposed to certain risks relating to its ongoing business operations. The company utilizes derivative instruments to mitigate interest rate risk, foreign currency exchange rate risk, and commodity margin risk. Interest rate swaps may be entered into to manage interest rate risk associated with the company’s fixed and floating-rate borrowings. Forward exchange contracts on various foreign currencies may be entered into to manage foreign currency exchange rate risk as necessary. No interest rate swaps or forward exchange contracts on foreign currency existed for the periods presented. The company routinely enters into forward exchange traded futures and option contracts to manage the price risk associated with nonferrous metals inventory as well as purchases and sales of nonferrous metals (specifically aluminum, copper, nickel and silver). The company offsets fair value amounts recognized for derivative instruments executed with the same counterparty under master netting agreements. The company designates certain of its nonferrous metals, forward exchange futures contracts as fair value hedges of inventory and firm sales commitments.
Commodity Futures Contracts . If the company is “long” on a futures contract, it means the company has more futures contracts purchased than futures contracts sold for the underlying commodity. If the company is “short” on a futures contract, it means the company has more futures contracts sold than futures contracts purchased for the underlying commodity. The following summarizes the company’s futures contract commitments as of March 31, 2014 (MT represents metric tons and Lbs represents pounds):
|
Commodity Futures |
|
Long/Short |
|
Total |
|
|
|
|
Aluminum |
|
Long |
|
2,625 |
|
MT |
|
|
Aluminum |
|
Short |
|
1,525 |
|
MT |
|
|
Copper |
|
Long |
|
4,260 |
|
MT |
|
|
Copper |
|
Short |
|
15,014 |
|
MT |
|
|
Silver |
|
Short |
|
343 |
|
Lbs |
|
The following summarizes the location and amounts of the fair values reported on the company’s balance sheets as of March 31, 2014, and December 31, 2013, and gains and losses related to derivatives included in the company’s statement of income for the three-month periods ended March 31, 2014 and 2013 (in thousands):
|
|
|
Asset Derivatives |
|
Liability Derivatives |
|
||||||||||
|
|
|
|
|
Fair Value |
|
Fair Value |
|
||||||||
|
|
|
Balance sheet location |
|
March 31, 2014 |
|
December 31,
|
|
March 31, 2014 |
|
December 31,
|
|
||||
|
Derivative instruments designated as fair value hedges - Commodity futures |
|
Other current assets |
|
$ |
2,154 |
|
$ |
658 |
|
$ |
(1,048 |
) |
$ |
1,886 |
|
|
|
|
|
|
|
|
|
|
|
|
|
|
||||
|
Derivative instruments not designated as hedges - Commodity futures |
|
Other current assets |
|
$ |
1,466 |
|
$ |
352 |
|
$ |
(478 |
) |
2,601 |
|
|
|
|
|
|
|
|
|
|
|
|
|
|
|
||||
|
Total derivative instruments |
|
|
|
$ |
3,620 |
|
$ |
1,010 |
|
$ |
(1,526 |
) |
$ |
4,487 |
|
The fair value of the above derivative instruments along with required margin deposit amounts with the same counterparty under master netting arrangements, which totaled $5.4 million at March 31, 2014 and $3.6 million at December 31, 2013, are reflected in other current assets in the consolidated balance sheet.
|
|
|
Location of gain |
|
Amount of gain recognized in
|
|
Hedged items |
|
Location of gain (loss) |
|
Amount of gain (loss) recognized in
|
|
||||||||
|
|
|
recognized in income on |
|
months ended |
|
in fair value hedge |
|
recognized in income on |
|
the three months ended |
|
||||||||
|
|
|
derivatives |
|
March 31, 2014 |
|
March 31, 2013 |
|
relationships |
|
related hedged item |
|
March 31, 2014 |
|
March 31, 2013 |
|
||||
|
Derivatives in fair value hedging relationships - Commodity futures |
|
Costs of goods sold |
|
$ |
1,617 |
|
$ |
8,046 |
|
Firm commitments |
|
Costs of goods sold |
|
$ |
984 |
|
$ |
1,316 |
|
|
|
|
|
|
|
|
|
|
Inventory |
|
Costs of goods sold |
|
(2,488 |
) |
(6,808 |
) |
||||
|
|
|
|
|
|
|
|
|
|
|
|
|
$ |
(1,504 |
) |
$ |
(5,492 |
) |
||
|
|
|
|
|
|
|
|
|
|
|
|
|
|
|
|
|
||||
|
Derivatives not designated as hedging instruments - Commodity futures |
|
Costs of goods sold |
|
$ |
7,956 |
|
$ |
2,401 |
|
|
|
|
|
|
|
|
|
||
STEEL DYNAMICS, INC.
NOTES TO CONSOLIDATED FINANCIAL STATEMENTS (UNAUDITED)
Derivatives accounted for as fair value hedges had ineffectiveness resulting in gains of $296,000 and $221,000 during the three-month periods ended March 31, 2014 and 2013, respectively; and a loss excluded from hedge effectiveness testing of $183,000 that increased costs of goods sold during the three-month period ended March 31, 2014, and a gain excluded from hedge effectiveness testing of $2.3 million, that reduced cost of goods sold during the three-month period ended March 31, 2013.
FASB accounting standards provide a comprehensive framework for measuring fair value and sets forth a definition of fair value and establishes a hierarchy prioritizing the inputs to valuation techniques, giving the highest priority to quoted prices in active markets for identical assets and liabilities and the lowest priority to unobservable value inputs. Levels within the hierarchy are defined as follows:
· Level 1—Unadjusted quoted prices for identical assets and liabilities in active markets;
· Level 2—Quoted prices for similar assets and liabilities in active markets (other than those included in Level 1) which are observable for the asset or liability, either directly or indirectly; and
· Level 3—Valuations derived from valuation techniques in which one or more significant inputs or significant value drivers are unobservable.
The following table sets forth financial assets and liabilities measured at fair value in the consolidated balance sheets and the respective levels to which the fair value measurements are classified within the fair value hierarchy as of March 31, 2014, and December 31, 2013 (in thousands):
|
|
|
Total |
|
Quoted Prices in
|
|
Significant
|
|
Significant
|
|
||||
|
March 31, 2014 |
|
|
|
|
|
|
|
|
|
||||
|
Commodity futures — financial assets |
|
$ |
3,620 |
|
$ |
— |
|
$ |
3,620 |
|
$ |
— |
|
|
Commodity futures — financial liabilities |
|
(1,526 |
) |
— |
|
(1,526 |
) |
— |
|
||||
|
|
|
|
|
|
|
|
|
|
|
||||
|
December 31, 2013 |
|
|
|
|
|
|
|
|
|
||||
|
Commodity futures — financial assets |
|
$ |
1,010 |
|
$ |
— |
|
$ |
1,010 |
|
$ |
— |
|
|
Commodity futures — financial liabilities |
|
4,487 |
|
— |
|
4,487 |
|
— |
|
||||
The carrying amounts of financial instruments including cash and equivalents approximate fair value. The fair values of commodity futures contracts are estimated by the use of quoted market prices, estimates obtained from brokers, and other appropriate valuation techniques based on references available. The fair value of long-term debt, including current maturities, as determined by quoted market prices (Level 2), was approximately $2.2 billion and $2.3 billion (with a corresponding carrying amount in the consolidated balance sheets of $2.1 billion and $2.1 billion) at March 31, 2014 and December 31, 2013, respectively.
STEEL DYNAMICS, INC.
NOTES TO CONSOLIDATED FINANCIAL STATEMENTS (UNAUDITED)
The company is involved in various routine litigation matters, including administrative proceedings, regulatory proceedings, governmental investigations, environmental matters, and commercial and construction contract disputes, none of which are expected to have a material impact on our financial condition, results of operations, or liquidity.
The company is involved, along with other steel manufacturing companies, in a class action antitrust complaint filed in federal court in Chicago, Illinois in September 2008, which alleges a conspiracy to fix, raise, maintain and stabilize the price at which steel products were sold in the United States during a period between 2005 and 2007, by artificially restricting the supply of such steel products. All but one of the complaints were brought on behalf of a purported class consisting of all direct purchasers of steel products. The other complaint was brought on behalf of a purported class consisting of all indirect purchasers of steel products within the same time period. A ninth complaint, in December 2010, was brought on behalf of indirect purchasers of steel products in Tennessee and has been consolidated with the original complaints. All complaints seek treble damages and costs, including reasonable attorney fees, pre- and post-judgment interest and injunctive relief. Following a period of discovery relating to class certification matters, plaintiffs’ motion for class action certification filed in 2012, and briefing by both sides, the court, on March 5 – 7 and April 11, 2014, held a class certification hearing. At the conclusion of the hearing, the court took the class certification issue under advisement.
Due to the uncertain nature of litigation, the company cannot presently determine the ultimate outcome of this litigation. However, we have determined, based on the information available at this time, that there is not presently a “reasonable possibility” (as that term is defined in ASC 450-20-20), that the outcome of these legal proceedings would have a material impact on our financial condition, results of operations, or liquidity. Although not presently necessary or appropriate to make a dollar estimate of exposure to loss, if any, in connection with the above matter, we may in the future determine that a loss accrual is necessary. Although we may make loss accruals, if and as warranted, any amounts that we may accrue from time to time could vary significantly from the amounts we actually pay, due to inherent uncertainties and the inherent shortcomings of the estimation process, the uncertainties involved in litigation and other factors. Additionally, an adverse result could have a material effect on our financial condition, results of operations and liquidity.
The company has three reportable segments: steel operations, metals recycling and ferrous resources operations, and steel fabrication operations. These operations are described in Note 1 to the financial statements. Revenues included in the category “Other” are from subsidiary operations that are below the quantitative thresholds required for reportable segments and primarily consist of further processing, slitting, and sale of certain steel products and the resale of certain secondary and excess steel products. In addition, “Other” also includes certain unallocated corporate accounts, such as the company’s senior secured credit facility, senior notes, convertible senior notes, certain other investments, and certain profit sharing expenses.
STEEL DYNAMICS, INC.
NOTES TO CONSOLIDATED FINANCIAL STATEMENTS (UNAUDITED)
Note 8. Segment Information (Continued)
The company’s operations are primarily organized and managed by operating segment. Operating segment performance and resource allocations are primarily based on operating results before income taxes. The accounting policies of the reportable segments are consistent with those described in Note 1 to the financial statements. Intra-segment and intra-company sales and any related profits are eliminated in consolidation. Refer to the company’s Annual Report on Form 10-K for the year ended December 31, 2013, for more information related to the company’s segment reporting. The company’s segment results for the three-month periods ended March 31, 2014 and 2013 are as follows (in thousands):
|
For the three months ended |
|
|
|
Metals Recycling / |
|
Steel Fabrication |
|
|
|
|
|
|
|
||||||
|
March 31, 2014 |
|
Steel Operations |
|
Ferrous Resources |
|
Operations |
|
Other |
|
Eliminations |
|
Consolidated |
|
||||||
|
|
|
|
|
|
|
|
|
|
|
|
|
|
|
||||||
|
Net Sales |
|
|
|
|
|
|
|
|
|
|
|
|
|
||||||
|
External |
|
$ |
1,061,079 |
|
$ |
517,957 |
|
$ |
115,861 |
|
$ |
20,621 |
|
$ |
— |
|
$ |
1,715,518 |
|
|
External Non-U.S. |
|
56,519 |
|
57,817 |
|
— |
|
228 |
|
— |
|
114,564 |
|
||||||
|
Other segments |
|
43,732 |
|
343,928 |
|
— |
|
6,673 |
|
(394,333 |
) |
— |
|
||||||
|
|
|
1,161,330 |
|
919,702 |
|
115,861 |
|
27,522 |
|
(394,333 |
) |
1,830,082 |
|
||||||
|
Operating income (loss) |
|
105,643 |
|
(15,519 |
) |
3,126 |
|
(16,545 |
)(1) |
4,227 |
(2) |
80,932 |
|
||||||
|
Income (loss) before income taxes |
|
91,998 |
|
(22,696 |
) |
1,652 |
|
(24,187 |
) |
4,227 |
|
50,994 |
|
||||||
|
Depreciation and amortization |
|
27,377 |
|
26,621 |
|
2,222 |
|
1,399 |
|
(51 |
) |
57,568 |
|
||||||
|
Capital expenditures |
|
18,606 |
|
5,779 |
|
311 |
|
145 |
|
— |
|
24,841 |
|
||||||
|
|
|
|
|
|
|
|
|
|
|
|
|
|
|
||||||
|
As of March 31, 2014 |
|
|
|
|
|
|
|
|
|
|
|
|
|
||||||
|
Assets |
|
2,731,246 |
|
2,537,892 |
|
263,688 |
|
609,206 |
(3) |
(228,175 |
)(4) |
5,913,857 |
|
||||||
|
Liabilities |
|
576,643 |
|
613,611 |
|
17,022 |
|
2,290,332 |
(5) |
(218,081 |
)(6) |
3,279,527 |
|
||||||
Footnotes related to the three months ended March 31, 2014 segment results (in millions):
|
(1) |
Corporate SG&A |
|
$ |
(8.3 |
) |
|
|
Company-wide equity-based compensation |
|
(4.6 |
) |
|
|
|
Profit sharing |
|
(4.7 |
) |
|
|
|
Other, net |
|
1.1 |
|
|
|
|
|
|
$ |
(16.5 |
) |
|
(2) |
Gross profit increase from intra-company sales |
|
$ |
4.2 |
|
|
(3) |
Cash and equivalents |
|
$ |
285.6 |
|
|
|
Accounts receivable |
|
12.3 |
|
|
|
|
Inventories |
|
13.5 |
|
|
|
|
Deferred income taxes |
|
17.8 |
|
|
|
|
Property, plant and equipment, net |
|
71.6 |
|
|
|
|
Debt issuance costs |
|
24.4 |
|
|
|
|
Intra-company debt |
|
153.8 |
|
|
|
|
Other |
|
30.2 |
|
|
|
|
|
|
$ |
609.2 |
|
|
(4) |
Elimination of intra-company receivables |
|
$ |
(65.1 |
) |
|
|
Elimination of intra-company debt |
|
(153.8 |
) |
|
|
|
Other |
|
(9.3 |
) |
|
|
|
|
|
$ |
(228.2 |
) |
|
(5) |
Accounts payable |
|
$ |
44.1 |
|
|
|
Income taxes payable |
|
23.5 |
|
|
|
|
Accrued interest |
|
21.7 |
|
|
|
|
Accrued profit sharing |
|
4.8 |
|
|
|
|
Debt |
|
2,031.4 |
|
|
|
|
Deferred income taxes |
|
138.0 |
|
|
|
|
Other |
|
26.8 |
|
|
|
|
|
|
$ |
2,290.3 |
|
|
(6) |
Elimination of intra-company payables |
|
$ |
(65.5 |
) |
|
|
Elimination of intra-company debt |
|
(153.8 |
) |
|
|
|
Other |
|
1.2 |
|
|
|
|
|
|
$ |
(218.1 |
) |
STEEL DYNAMICS, INC.
NOTES TO CONSOLIDATED FINANCIAL STATEMENTS (UNAUDITED)
|
For the three months ended |
|
|
|
Metals Recycling / |
|
Steel Fabrication |
|
|
|
|
|
|
|
||||||
|
March 31, 2013 |
|
Steel Operations |
|
Ferrous Resources |
|
Operations |
|
Other |
|
Eliminations |
|
Consolidated |
|
||||||
|
|
|
|
|
|
|
|
|
|
|
|
|
|
|
||||||
|
Net Sales |
|
|
|
|
|
|
|
|
|
|
|
|
|
||||||
|
External |
|
$ |
1,011,195 |
|
$ |
557,611 |
|
$ |
93,797 |
|
$ |
19,371 |
|
$ |
— |
|
$ |
1,681,974 |
|
|
External Non-U.S. |
|
50,117 |
|
63,517 |
|
— |
|
88 |
|
— |
|
113,722 |
|
||||||
|
Other segments |
|
61,048 |
|
276,364 |
|
578 |
|
5,395 |
|
(343,385 |
) |
— |
|
||||||
|
|
|
1,122,360 |
|
897,492 |
|
94,375 |
|
24,854 |
|
(343,385 |
) |
1,795,696 |
|
||||||
|
Operating income (loss) |
|
119,301 |
|
(9,824 |
) |
1,530 |
|
(16,439 |
)(1) |
1,664 |
(2) |
96,232 |
|
||||||
|
Income (loss) before income taxes |
|
105,007 |
|
(17,854 |
) |
(76 |
) |
(26,092 |
) |
1,664 |
|
62,649 |
|
||||||
|
Depreciation and amortization |
|
26,387 |
|
27,136 |
|
2,057 |
|
1,532 |
|
(51 |
) |
57,061 |
|
||||||
|
Capital expenditures |
|
24,726 |
|
19,069 |
|
881 |
|
670 |
|
— |
|
45,346 |
|
||||||
|
|
|
|
|
|
|
|
|
|
|
|
|
|
|
||||||
|
As of March 31, 2013 |
|
|
|
|
|
|
|
|
|
|
|
|
|
||||||
|
Assets |
|
2,566,642 |
|
2,529,951 |
|
254,176 |
|
822,064 |
(3) |
(216,259 |
)(4) |
5,956,574 |
|
||||||
|
Liabilities |
|
557,404 |
|
526,457 |
|
15,646 |
|
2,556,590 |
(5) |
(205,527 |
)(6) |
3,450,570 |
|
||||||
Footnotes related to the three months ended March 31, 2013 segment results (in millions):
|
(1) |
Corporate SG&A |
|
$ |
(8.0 |
) |
|
|
Company-wide equity-based compensation |
|
(3.2 |
) |
|
|
|
Profit sharing |
|
(5.9 |
) |
|
|
|
Other, net |
|
0.7 |
|
|
|
|
Total |
|
$ |
(16.4 |
) |
|
(2) |
Gross profit increase from intra-company sales |
|
$ |
1.7 |
|
|
(3) |
Cash and equivalents |
|
$ |
445.8 |
|
|
|
Accounts receivable |
|
11.6 |
|
|
|
|
Inventories |
|
13.2 |
|
|
|
|
Deferred income taxes |
|
23.5 |
|
|
|
|
Property, plant and equipment, net |
|
74.8 |
|
|
|
|
Debt issuance costs, net |
|
31.3 |
|
|
|
|
Intra-company debt |
|
156.0 |
|
|
|
|
Other |
|
65.9 |
|
|
|
|
Total |
|
$ |
822.1 |
|
|
(4) |
Elimination of intra-company receivables |
|
$ |
(49.4 |
) |
|
|
Elimination of intra-company debt |
|
(156.0 |
) |
|
|
|
Other |
|
(10.9 |
) |
|
|
|
Total |
|
$ |
(216.3 |
) |
|
(5) |
Accounts payable |
|
$ |
38.8 |
|
|
|
Income taxes payable |
|
13.4 |
|
|
|
|
Accrued interest |
|
19.1 |
|
|
|
|
Accrued profit sharing |
|
5.9 |
|
|
|
|
Debt |
|
2,247.1 |
|
|
|
|
Deferred income taxes |
|
213.8 |
|
|
|
|
Other |
|
18.5 |
|
|
|
|
Total |
|
$ |
2,556.6 |
|
|
(6) |
Elimination of intra-company payables |
|
$ |
(49.7 |
) |
|
|
Elimination of intra-company debt |
|
(156.0 |
) |
|
|
|
Other |
|
0.2 |
|
|
|
|
Total |
|
$ |
(205.5 |
) |
STEEL DYNAMICS, INC.
NOTES TO CONSOLIDATED FINANCIAL STATEMENTS (UNAUDITED)
Certain 100%-owned subsidiaries of SDI have fully and unconditionally guaranteed all of the indebtedness relating to the issuance of the company’s senior notes due 2014, 2019, 2020, 2022 and 2023. Following are the company’s condensed consolidating financial statements, including the guarantors, which present the financial position, results of operations and cash flows of (i) SDI (in each case, reflecting investments in its consolidated subsidiaries under the equity method of accounting), (ii) the guarantor subsidiaries of SDI, (iii) the non-guarantor subsidiaries of SDI, and (iv) the eliminations necessary to arrive at the information on a consolidated basis. The following statements should be read in conjunction with the accompanying consolidated financial statements and the company’s Annual Report on Form 10-K for the year ended December 31, 2013.
|
|
|
|
|
|
|
Combined |
|
Consolidating |
|
Total |
|
|||||
|
|
|
Parent |
|
Guarantors |
|
Non-Guarantors |
|
Adjustments |
|
Consolidated |
|
|||||
|
As of March 31, 2014 |
|
|
|
|
|
|
|
|
|
|
|
|||||
|
Cash and equivalents |
|
$ |
281,376 |
|
$ |
48,071 |
|
$ |
13,472 |
|
$ |
— |
|
$ |
342,919 |
|
|
Accounts receivable, net |
|
320,996 |
|
1,012,562 |
|
42,095 |
|
(564,553 |
) |
811,100 |
|
|||||
|
Inventories |
|
728,638 |
|
502,339 |
|
105,553 |
|
(4,429 |
) |
1,332,101 |
|
|||||
|
Other current assets |
|
48,969 |
|
6,968 |
|
5,048 |
|
(18,751 |
) |
42,234 |
|
|||||
|
Total current assets |
|
1,379,979 |
|
1,569,940 |
|
166,168 |
|
(587,733 |
) |
2,528,354 |
|
|||||
|
Property, plant and equipment, net |
|
1,042,424 |
|
598,946 |
|
558,500 |
|
(2,367 |
) |
2,197,503 |
|
|||||
|
Intangible assets, net |
|
— |
|
379,488 |
|
— |
|
— |
|
379,488 |
|
|||||
|
Goodwill |
|
— |
|
730,360 |
|
— |
|
— |
|
730,360 |
|
|||||
|
Other assets, including investments in subs |
|
2,604,100 |
|
21,572 |
|
7,352 |
|
(2,554,872 |
) |
78,152 |
|
|||||
|
Total assets |
|
$ |
5,026,503 |
|
$ |
3,300,306 |
|
$ |
732,020 |
|
$ |
(3,144,972 |
) |
$ |
5,913,857 |
|
|
|
|
|
|
|
|
|
|
|
|
|
|
|||||
|
Accounts payable |
|
$ |
178,731 |
|
$ |
266,205 |
|
$ |
89,012 |
|
$ |
(116,780 |
) |
$ |
417,168 |
|
|
Accrued expenses |
|
124,762 |
|
107,284 |
|
10,050 |
|
(51,555 |
) |
190,541 |
|
|||||
|
Current maturities of long-term debt |
|
318,969 |
|
300 |
|
66,580 |
|
(42,127 |
) |
343,722 |
|
|||||
|
Total current liabilities |
|
622,462 |
|
373,789 |
|
165,642 |
|
(210,462 |
) |
951,431 |
|
|||||
|
Long-term debt |
|
1,714,982 |
|
— |
|
182,506 |
|
(142,460 |
) |
1,755,028 |
|
|||||
|
Other liabilities |
|
120,264 |
|
2,004,584 |
|
30,844 |
|
(1,582,624 |
) |
573,068 |
|
|||||
|
|
|
|
|
|
|
|
|
|
|
|
|
|||||
|
Redeemable noncontrolling interests |
|
— |
|
— |
|
121,834 |
|
— |
|
121,834 |
|
|||||
|
|
|
|
|
|
|
|
|
|
|
|
|
|||||
|
Common stock |
|
646 |
|
33,896 |
|
18,121 |
|
(52,017 |
) |
646 |
|
|||||
|
Treasury stock |
|
(716,545 |
) |
— |
|
— |
|
— |
|
(716,545 |
) |
|||||
|
Additional paid-in-capital |
|
1,092,281 |
|
117,737 |
|
575,877 |
|
(693,614 |
) |
1,092,281 |
|
|||||
|
Retained earnings (deficit) |
|
2,192,413 |
|
770,300 |
|
(306,505 |
) |
(463,795 |
) |
2,192,413 |
|
|||||
|
Total Steel Dynamics, Inc. equity |
|
2,568,795 |
|
921,933 |
|
287,493 |
|
(1,209,426 |
) |
2,568,795 |
|
|||||
|
Noncontrolling interests |
|
— |
|
— |
|
(56,299 |
) |
— |
|
(56,299 |
) |
|||||
|
Total equity |
|
2,568,795 |
|
921,933 |
|
231,194 |
|
(1,209,426 |
) |
2,512,496 |
|
|||||
|
Total liabilities and equity |
|
$ |
5,026,503 |
|
$ |
3,300,306 |
|
$ |
732,020 |
|
$ |
(3,144,972 |
) |
$ |
5,913,857 |
|
STEEL DYNAMICS, INC.
NOTES TO CONSOLIDATED FINANCIAL STATEMENTS (UNAUDITED)
Note 9. Condensed Consolidating Information (Continued)
|
|
|
|
|
|
|
Combined |
|
Consolidating |
|
Total |
|
|||||
|
|
|
Parent |
|
Guarantors |
|
Non-Guarantors |
|
Adjustments |
|
Consolidated |
|
|||||
|
As of December 31, 2013 |
|
|
|
|
|
|
|
|
|
|
|
|||||
|
Cash and equivalents |
|
$ |
320,866 |
|
$ |
61,148 |
|
$ |
13,142 |
|
$ |
— |
|
$ |
395,156 |
|
|
Accounts receivable, net |
|
309,691 |
|
874,707 |
|
32,018 |
|
(495,816 |
) |
720,600 |
|
|||||
|
Inventories |
|
673,763 |
|
557,640 |
|
91,199 |
|
(7,855 |
) |
1,314,747 |
|
|||||
|
Other current assets |
|
50,228 |
|
8,399 |
|
3,259 |
|
(18,755 |
) |
43,131 |
|
|||||
|
Total current assets |
|
1,354,548 |
|
1,501,894 |
|
139,618 |
|
(522,426 |
) |
2,473,634 |
|
|||||
|
Property, plant and equipment, net |
|
1,046,093 |
|
619,617 |
|
562,843 |
|
(2,419 |
) |
2,226,134 |
|
|||||
|
Intangible assets, net |
|
— |
|
386,159 |
|
— |
|
— |
|
386,159 |
|
|||||
|
Goodwill |
|
— |
|
731,996 |
|
— |
|
— |
|
731,996 |
|
|||||
|
Other assets, including investments in subs |
|
2,630,411 |
|
21,789 |
|
8,092 |
|
(2,545,209 |
) |
115,083 |
|
|||||
|
Total assets |
|
$ |
5,031,052 |
|
$ |
3,261,455 |
|
$ |
710,553 |
|
$ |
(3,070,054 |
) |
$ |
5,933,006 |
|
|
|
|
|
|
|
|
|
|
|
|
|
|
|||||
|
Accounts payable |
|
$ |
160,255 |
|
$ |
258,406 |
|
$ |
60,987 |
|
$ |
(64,716 |
) |
$ |
414,932 |
|
|
Accrued expenses |
|
142,055 |
|
115,182 |
|
10,694 |
|
(49,229 |
) |
218,702 |
|
|||||
|
Current maturities of long-term debt |
|
315,521 |
|
300 |
|
52,163 |
|
(26,440 |
) |
341,544 |
|
|||||
|
Total current liabilities |
|
617,831 |
|
373,888 |
|
123,844 |
|
(140,385 |
) |
975,178 |
|
|||||
|
Long-term debt |
|
1,725,433 |
|
— |
|
204,385 |
|
(163,773 |
) |
1,766,045 |
|
|||||
|
Other liabilities |
|
140,465 |
|
1,986,260 |
|
34,895 |
|
(1,582,206 |
) |
579,414 |
|
|||||
|
|
|
|
|
|
|
|
|
|
|
|
|
|||||
|
Redeemable noncontrolling interest |
|
— |
|
— |
|
116,514 |
|
— |
|
116,514 |
|
|||||
|
|
|
|
|
|
|
|
|
|
|
|
|
|||||
|
Common stock |
|
645 |
|
33,896 |
|
18,121 |
|
(52,017 |
) |
645 |
|
|||||
|
Treasury stock |
|
(718,529 |
) |
— |
|
— |
|
— |
|
(718,529 |
) |
|||||
|
Additional paid-in-capital |
|
1,085,694 |
|
117,737 |
|
552,946 |
|
(670,683 |
) |
1,085,694 |
|
|||||
|
Retained earnings (deficit) |
|
2,179,513 |
|
749,674 |
|
(288,684 |
) |
(460,990 |
) |
2,179,513 |
|
|||||
|
Total Steel Dynamics, Inc. equity |
|
2,547,323 |
|
901,307 |
|
282,383 |
|
(1,183,690 |
) |
2,547,323 |
|
|||||
|
Noncontrolling interests |
|
— |
|
— |
|
(51,468 |
) |
— |
|
(51,468 |
) |
|||||
|
Total equity |
|
2,547,323 |
|
901,307 |
|
230,915 |
|
(1,183,690 |
) |
2,495,855 |
|
|||||
|
Total liabilities and equity |
|
$ |
5,031,052 |
|
$ |
3,261,455 |
|
$ |
710,553 |
|
$ |
(3,070,054 |
) |
$ |
5,933,006 |
|
STEEL DYNAMICS, INC.
NOTES TO CONSOLIDATED FINANCIAL STATEMENTS (UNAUDITED)
Note 9. Condensed Consolidating Information (Continued)
|
For the three months ended, |
|
|
|
|
|
Combined |
|
Consolidating |
|
Total |
|
|||||
|
March 31, 2014 |
|
Parent |
|
Guarantors |
|
Non-Guarantors |
|
Adjustments |
|
Consolidated |
|
|||||
|
Net sales |
|
$ |
863,563 |
|
$ |
2,112,389 |
|
$ |
105,849 |
|
$ |
(1,251,719 |
) |
$ |
1,830,082 |
|
|
Costs of goods sold |
|
761,395 |
|
2,015,576 |
|
123,573 |
|
(1,233,766 |
) |
1,666,778 |
|
|||||
|
Gross profit (loss) |
|
102,168 |
|
96,813 |
|
(17,724 |
) |
(17,953 |
) |
163,304 |
|
|||||
|
Selling, general and administrative |
|
28,834 |
|
54,289 |
|
3,408 |
|
(4,159 |
) |
82,372 |
|
|||||
|
Operating income (loss) |
|
73,334 |
|
42,524 |
|
(21,132 |
) |
(13,794 |
) |
80,932 |
|
|||||
|
Interest expense, net of capitalized interest |
|
19,361 |
|
10,561 |
|
1,880 |
|
(1,233 |
) |
30,569 |
|
|||||
|
Other (income) expense, net |
|
(976 |
) |
395 |
|
(1,284 |
) |
1,234 |
|
(631 |
) |
|||||
|
Income (loss) before income taxes and equity in net income of subsidiaries |
|
54,949 |
|
31,568 |
|
(21,728 |
) |
(13,795 |
) |
50,994 |
|
|||||
|
Income taxes (benefit) |
|
9,925 |
|
10,942 |
|
696 |
|
(4,267 |
) |
17,296 |
|
|||||
|
|
|
45,024 |
|
20,626 |
|
(22,424 |
) |
(9,528 |
) |
33,698 |
|
|||||
|
Equity in net loss of subsidiaries |
|
(6,445 |
) |
— |
|
— |
|
6,445 |
|
— |
|
|||||
|
Net loss attributable to noncontrolling interests |
|
— |
|
— |
|
4,881 |
|
— |
|
4,881 |
|
|||||
|
Net income (loss) attributable to Steel Dynamics, Inc. |
|
$ |
38,579 |
|
$ |
20,626 |
|
$ |
(17,543 |
) |
$ |
(3,083 |
) |
$ |
38,579 |
|
|
For the three months ended, |
|
|
|
|
|
Combined |
|
Consolidating |
|
Total |
|
|||||
|
March 31, 2013 |
|
Parent |
|
Guarantors |
|
Non-Guarantors |
|
Adjustments |
|
Consolidated |
|
|||||
|
Net sales |
|
$ |
827,201 |
|
$ |
2,015,487 |
|
$ |
66,370 |
|
$ |
(1,113,362 |
) |
$ |
1,795,696 |
|
|
Costs of goods sold |
|
706,387 |
|
1,914,058 |
|
95,941 |
|
(1,096,954 |
) |
1,619,432 |
|
|||||
|
Gross profit (loss) |
|
120,814 |
|
101,429 |
|
(29,571 |
) |
(16,408 |
) |
176,264 |
|
|||||
|
Selling, general and administrative |
|
28,686 |
|
53,992 |
|
2,138 |
|
(4,784 |
) |
80,032 |
|
|||||
|
Operating income (loss) |
|
92,128 |
|
47,437 |
|
(31,709 |
) |
(11,624 |
) |
96,232 |
|
|||||
|
Interest expense, net of capitalized interest |
|
22,046 |
|
12,039 |
|
1,701 |
|
(1,157 |
) |
34,629 |
|
|||||
|
Other (income) expense, net |
|
(820 |
) |
(200 |
) |
(1,183 |
) |
1,157 |
|
(1,046 |
) |
|||||
|
Income (loss) before income taxes and equity in net income of subsidiaries |
|
70,902 |
|
35,598 |
|
(32,227 |
) |
(11,624 |
) |
62,649 |
|
|||||
|
Income taxes (benefit) |
|
11,394 |
|
12,919 |
|
699 |
|
(3,615 |
) |
21,397 |
|
|||||
|
|
|
59,508 |
|
22,679 |
|
(32,926 |
) |
(8,009 |
) |
41,252 |
|
|||||
|
Equity in net loss of subsidiaries |
|
(11,293 |
) |
— |
|
— |
|
11,293 |
|
— |
|
|||||
|
Net loss attributable to noncontrolling interests |
|
— |
|
— |
|
6,963 |
|
— |
|
6,963 |
|
|||||
|
Net income (loss) attributable to Steel Dynamics, Inc. |
|
$ |
48,215 |
|
$ |
22,679 |
|
$ |
(25,963 |
) |
$ |
3,284 |
|
$ |
48,215 |
|
STEEL DYNAMICS, INC.
NOTES TO CONSOLIDATED FINANCIAL STATEMENTS (UNAUDITED)
|
For the three months ended, |
|
|
|
|
|
Combined |
|
Consolidating |
|
Total |
|
|||||
|
March 31, 2014 |
|
Parent |
|
Guarantors |
|
Non-Guarantors |
|
Adjustments |
|
Consolidated |
|
|||||
|
|
|
|
|
|
|
|
|
|
|
|
|
|||||
|
Net cash provided by (used in) operating activities |
|
$ |
9,027 |
|
$ |
(17,195 |
) |
$ |
(14,149 |
) |
$ |
(4,930 |
) |
$ |
(27,247 |
) |
|
Net cash provided by (used in) investing activities |
|
(12,430 |
) |
(3,997 |
) |
(1,625 |
) |
22,095 |
|
4,043 |
|
|||||
|
Net cash provided by (used in) financing activities |
|
(36,087 |
) |
8,115 |
|
16,104 |
|
(17,165 |
) |
(29,033 |
) |
|||||
|
Increase (decrease) in cash and equivalents |
|
(39,490 |
) |
(13,077 |
) |
330 |
|
— |
|
(52,237 |
) |
|||||
|
Cash and equivalents at beginning of period |
|
320,866 |
|
61,148 |
|
13,142 |
|
— |
|
395,156 |
|
|||||
|
Cash and equivalents at end of period |
|
$ |
281,376 |
|
$ |
48,071 |
|
$ |
13,472 |
|
$ |
— |
|
$ |
342,919 |
|
|
For the three months ended, |
|
|
|
|
|
Combined |
|
Consolidating |
|
Total |
|
|||||
|
March 31, 2013 |
|
Parent |
|
Guarantors |
|
Non-Guarantors |
|
Adjustments |
|
Consolidated |
|
|||||
|
Net cash provided by (used in) operating activities |
|
$ |
29,373 |
|
$ |
14,903 |
|
$ |
(17,530 |
) |
$ |
2,964 |
|
$ |
29,710 |
|
|
Net cash used in investing activities |
|
(8,837 |
) |
(11,985 |
) |
(6,805 |
) |
16,215 |
|
(11,412 |
) |
|||||
|
Net cash provided by (used in) financing activities |
|
98,746 |
|
(22,047 |
) |
26,126 |
|
(19,179 |
) |
83,646 |
|
|||||
|
Increase (decrease) in cash and equivalents |
|
119,282 |
|
(19,129 |
) |
1,791 |
|
— |
|
101,944 |
|
|||||
|
Cash and equivalents at beginning of period |
|
322,707 |
|
41,675 |
|
11,535 |
|
— |
|
375,917 |
|
|||||
|
Cash and equivalents at end of period |
|
$ |
441,989 |
|
$ |
22,546 |
|
$ |
13,326 |
|
$ |
— |
|
$ |
477,861 |
|
ITEM 2 . MANAGEMENT’S DISCUSSION AND ANALYSIS OF FINANCIAL CONDITION AND RESULTS OF OPERATIONS
Forward-Looking Statements
This report contains some predictive statements about future events, including statements related to the steel and recycled metals markets, our revenues, costs of purchased materials, future profitability and earnings, and the operation of new or existing facilities. These statements are intended to be made as “forward-looking,” subject to many risks and uncertainties, within the safe harbor protections of the Private Securities Litigation Reform Act of 1995. Some factors that could cause such forward-looking statements to turn out differently than anticipated include: (1) the effects of a recurrent slowing in industrial demand; (2) changes in economic conditions, either generally or in any of the steel or scrap-consuming sectors which affect demand for our products, including the strength of the non-residential and residential construction, automotive, manufacturing, appliance, and other steel-consuming industries; (3) fluctuations in the cost of key raw materials (including steel scrap, iron units, and energy costs) and our ability to pass-on any cost increases; (4) the impact of domestic and foreign import price competition; (5) risks and uncertainties involving product and/or technology development; and (6) occurrences of unexpected plant outages or equipment failures.
More specifically, we refer you to the sections titled Special Note Regarding Forward-Looking Statements and Risk Factors in our annual report on Form 10-K for the year ended December 31, 2013, as well as in other reports which we file with the Securities and Exchange Commission, for a more detailed discussion of some of the many factors, variable risks and uncertainties that could cause actual results to differ materially from those we may have expected or anticipated. These reports are available publicly on the SEC web site, www.sec.gov , and on our web site, www.steeldynamics.com . Forward-looking or predictive statements we make are based upon information and assumptions, concerning our businesses and the environments in which they operate, which we consider reasonable as of the date on which these statements are made. Due to the foregoing risks and uncertainties however, as well as, matters beyond our control which can affect forward-looking statements, you are cautioned not to place undue reliance on these predictive statements, which speak only as of the date of this report. We undertake no duty to update or revise any forward-looking statement, whether as a result of new information, future events or otherwise.
Operating Statement Classifications
Net Sales . Net sales from our operations are a factor of volumes shipped, product mix and related pricing. We charge premium prices for certain grades of steel, product dimensions, certain smaller volumes, and for value-added processing or coating of the steel products. Except for our steel fabrication operations segment, we recognize revenue from sales and the allowance for estimated costs associated with returns from these sales at the time the title of the product is transferred to the customer. Provision is made for estimated product returns and customer claims based on estimates and actual historical experience. Net sales from steel fabrication operations are recognized from construction contracts utilizing a percentage-of-completion method, which is based on the percentage of steel consumed to date as compared to the estimated total steel required for each contract.
Costs of Goods Sold . Our costs of goods sold represent all direct and indirect costs associated with the manufacture of our products. The principal elements of these costs are scrap and scrap substitutes (which represent the most significant single component of our consolidated costs of goods sold), steel, direct and indirect labor and related benefits, alloys, zinc, transportation and freight, repairs and maintenance, utilities (most notably electricity and natural gas), and depreciation.
Selling, General and Administrative Expenses . Selling, general and administrative expenses consist of all costs associated with our sales, finance and accounting, and administrative departments. These costs include, among other items, labor and related benefits, professional services, insurance premiums, property taxes, company-wide profit sharing, and amortization of intangible and other assets.
Interest Expense, net of Capitalized Interest . Interest expense consists of interest associated with our senior credit facilities and other debt net of interest costs that are required to be capitalized during the construction period of certain capital investment projects.
Other Expense (Income), net . Other income consists of interest income earned on our temporary cash deposits and investments; any other non-operating income activity, including gains on certain short-term investments; and income from non-consolidated investments accounted for under the equity method. Other expense consists of any non-operating costs, such as certain financing expenses.
Overview
Net income was $38.6 million, or $0.17 per diluted share, during the first quarter of 2014, compared with net income of $48.2 million, or $0.21 per diluted share, during the first quarter of 2013, while comparative operating income decreased $15.3 million, or 16%, to $80.9 million. We experienced one of the most severe and prolonged winter periods in recent history, especially in the Midwest where a majority of our operations are located. This severe weather caused production disruptions and diminished availability of transportation, resulting in lower shipments and meaningful increases in energy costs, most notably within our steel segment at our Flat Roll and Structural and Rail Divisions. As a result, despite a 4% increase in metal spread, our steel segment operating income decreased $13.7 million, or 11%. Underlying sheet steel demand remains good, and demand in structural and special bar quality long product steel increased as end-market demand continues to improve.
Metals Recycling and Ferrous Resources operating losses increased $5.7 million, as metals recycling ferrous and nonferrous metal spreads each decreased, operating costs increased due to the severe weather, and weather-related damages to several of our buildings resulted in $2.6 million in losses. Fabrication segment operating income more than doubled in the first quarter of 2014, as compared to the first quarter of 2013, to $3.1 million. Fabrication realized growth in shipments as a result of the improving non-residential construction market as well as increases in market penetration, and achieved reduced operating costs from manufacturing efficiencies and increased production rates.
Our March/April 2013 debt repayments and refinancing activities resulted in decreased interest expense for the first quarter of 2014 of $4.1 million compared to the first quarter of 2013. These activities also elongated our debt maturities profile.
Segment Operating Results 2014 vs. 2013 ( dollars in thousands )
|
|
|
Three Months Ended
|
|
|||||
|
|
|
|
|
% |
|
|
||
|
|
|
2014 |
|
Change |
2013 |
|
||
|
|
|
|
|
|
|
|
||
|
Net sales |
|
|
|
|
|
|
||
|
Steel |
|
$ |
1,161,330 |
|
3% |
$ |
1,122,360 |
|
|
Metals recycling and ferrous resources |
|
919,702 |
|
2% |
897,492 |
|
||
|
Steel fabrication |
|
115,861 |
|
23% |
94,375 |
|
||
|
Other |
|
27,522 |
|
11% |
24,854 |
|
||
|
|
|
2,224,415 |
|
|
2,139,081 |
|
||
|
Intra-company |
|
(394,333 |
) |
|
(343,385 |
) |
||
|
Consolidated |
|
$ |
1,830,082 |
|
2% |
$ |
1,795,696 |
|
|
|
|
|
|
|
|
|
||
|
Operating income (loss) |
|
|
|
|
|
|
||
|
Steel |
|
$ |
105,643 |
|
(11)% |
$ |
119,301 |
|
|
Metals recycling and ferrous resources |
|
(15,519 |
) |
(58)% |
(9,824 |
) |
||
|
Steel fabrication |
|
3,126 |
|
104% |
1,530 |
|
||
|
Other |
|
(16,545 |
) |
(1)% |
(16,439 |
) |
||
|
|
|
76,705 |
|
|
94,568 |
|
||
|
Intra-company |
|
4,227 |
|
|
1,664 |
|
||
|
Consolidated |
|
$ |
80,932 |
|
(16)% |
$ |
96,232 |
|
|
Steel Operations |
Steel Operations. Steel operations consist of our five electric arc furnace mini-mills, producing steel from steel scrap, utilizing continuous casting, automated rolling mills, and various downstream finishing facilities, including The Techs operations. Collectively, our steel operations sell directly to end users and service centers. These products are used in numerous industry sectors, including the automotive, construction, commercial, transportation, agriculture and industrial machinery markets. In the first quarter of 2014 and 2013, our steel operations accounted for 61% and 59% of our external net sales, respectively.
Sheet Products. Our Flat Roll Division sells a broad range of sheet steel products, such as hot rolled, cold rolled and coated steel products, including a large variety of specialty products such as light gauge hot rolled, galvanized, Galvalume ® and painted products. The Techs operations, comprised of three galvanizing lines, also sells specialized galvanized sheet steels used in non-automotive applications.
Long Products. Our Structural and Rail Division sells structural steel beams and pilings to the construction market, as well as standard-grade and premium rail to the railroad industry. Our Engineered Bar Products Division primarily sells engineered, special-bar-quality and merchant bar quality rounds, round-cornered squares, and smaller-diameter round engineered bars. Our Roanoke Bar Division primarily sells merchant steel products, including angles, plain rounds, flats and channels. Steel of West Virginia primarily sells merchant beams, channels and specialty structural steel sections.
Steel Operations Shipments (net tons):
|
|
|
Three Months Ended |
|
||||
|
|
|
March 31, |
|
||||
|
|
|
2014 |
|
%
|
|
2013 |
|
|
Shipments |
|
|
|
|
|
|
|
|
Flat Roll Division |
|
641,520 |
|
(9)% |
|
704,290 |
|
|
The Techs |
|
153,237 |
|
1% |
|
151,137 |
|
|
Sheet products |
|
794,757 |
|
(7)% |
|
855,427 |
|
|
|
|
|
|
|
|
|
|
|
Structural and Rail Division |
|
292,316 |
|
4% |
|
280,897 |
|
|
Engineered Bar Products Division |
|
144,303 |
|
28% |
|
112,821 |
|
|
Roanoke Bar Division |
|
143,782 |
|
3% |
|
139,950 |
|
|
Steel of West Virginia |
|
75,574 |
|
(6)% |
|
80,707 |
|
|
Long products |
|
655,975 |
|
7% |
|
614,375 |
|
|
|
|
|
|
|
|
|
|
|
Total shipments |
|
1,450,732 |
|
(1)% |
|
1,469,802 |
|
|
Intra-segment shipments |
|
(45,508 |
) |
|
|
(32,090 |
) |
|
Segment shipments |
|
1,405,224 |
|
(2)% |
|
1,437,712 |
|
|
|
|
|
|
|
|
|
|
|
External shipments |
|
1,338,573 |
|
—% |
|
1,344,432 |
|
Net sales for the steel segment increased 3% in the first quarter of 2014 when compared to the first quarter of 2013, as a 2% decrease in segment shipments was more than offset by an increase of 6%, or $45 per ton, in average selling prices. The lower segment shipments, primarily at the Flat Roll Division, was largely driven by the historically significant severe winter weather conditions during the first quarter of 2014 which adversely impacted production volumes and limited shipments due to the diminished availability of rail cars and trucks during the period. The fundamental overall demand for sheet steel did not diminish, and demand for long products, most notably structural beams and special bar quality long product steel, improved as end-market demand continues to improve.
Metallic raw materials used in our electric arc furnaces represent our single most significant manufacturing cost. Our metallic raw material cost per net ton consumed in our steel operations increased $29 in the first quarter of 2014, compared with the first quarter of 2013. During the first quarter of 2014 and 2013, our metallic raw material costs represented 65% of our steel operations’ manufacturing costs, excluding the operations of The Techs, which purchases, rather than produces, the steel it further processes.
Despite the increased metal spread, operating income for the steel segment decreased 11%, to $105.6 million in the first quarter of 2014, compared to the same period of 2013, as the impact of the severe and prolonged winter weather during the first quarter of 2014 hindered production and shipments, and resulted in meaningfully higher electricity and natural gas cost, primarily at our Midwest operations.
|
Metals Recycling and Ferrous Resources Operations |
Metals Recycling and Ferrous Resources Operations. This operating segment primarily includes our metals recycling operations (OmniSource); our liquid pig iron production facility, Iron Dynamics (IDI); and our Minnesota iron operations. Our metals recycling and ferrous resources operations segment accounted for 32% and 35% of our external net sales in the first quarter of 2014 and 2013, respectively. Operating loss for the metals recycling and ferrous resources operations segment of $15.5 million, increased $5.7 million compared to the first quarter of 2013, due primarily to decreased ferrous and nonferrous metal spreads and increased operating costs in metals recycling, while operating losses in our Minnesota iron operations decreased.
Metals Recycling and Ferrous Resources Shipments:
|
|
|
Three Months Ended |
|
||||
|
|
|
March 31, |
|
||||
|
|
|
2014 |
|
%
|
|
2013 |
|
|
Ferrous metal shipments (gross tons) |
|
|
|
|
|
|
|
|
Total |
|
1,364,533 |
|
2% |
|
1,342,929 |
|
|
Intra-segment |
|
(300 |
) |
|
|
(1,969 |
) |
|
Segment shipments |
|
1,364,233 |
|
2% |
|
1,340,960 |
|
|
|
|
|
|
|
|
|
|
|
External shipments |
|
649,552 |
|
(18)% |
|
789,039 |
|
|
|
|
|
|
|
|
|
|
|
Nonferrous metals shipments (thousands of pounds) |
|
|
|
|
|
|
|
|
Total |
|
270,978 |
|
(3)% |
|
279,656 |
|
|
Intra-segment |
|
(18,343 |
) |
|
|
(1,431 |
) |
|
Segment shipments |
|
252,635 |
|
(9)% |
|
278,225 |
|
|
|
|
|
|
|
|
|
|
|
External shipments |
|
251,588 |
|
(9)% |
|
276,127 |
|
|
|
|
|
|
|
|
|
|
|
Mesabi Nugget shipments (metric tons) — intra-company |
|
37,488 |
|
(37)% |
|
59,685 |
|
|
|
|
|
|
|
|
|
|
|
Iron Dynamics (metric tons) — intra-company |
|
57,122 |
|
(12)% |
|
64,685 |
|
Metals Recycling. Our metals recycling operations (OmniSource) represent our metals sourcing and processing operations and are the most significant source of net sales in this segment. These operations sell ferrous metals to steel mills and foundries, and nonferrous metals, such as copper, brass, aluminum and stainless steel to, among others, ingot manufacturers, copper refineries and mills, smelters, and specialty mills. Our metals recycling operations represented 90% and 93% of this segment’s net sales during the first quarter of 2014 and 2013, respectively. Metals recycling operations sales were $880.6 million and $835.0 million, and operating income was $5.0 million and $19.5 million, during the first quarter 2014 and 2013, respectively.
Net sales for metals recycling increased 5% overall in the first quarter of 2014 when compared to the first quarter of 2013, as sales prices of ferrous metals increased 11% on 2% higher volumes, while nonferrous metals sales volumes decreased 3%, coupled with a 4% decrease in average selling prices. In spite of increased net sales, operating income for the first quarter of 2014 decreased 74% when compared to the first quarter of 2013, due to decreased metal margins in both ferrous – 6%, and nonferrous – 12% metals. The severe and prolonged winter weather hampered the flow of scrap metals during the first quarter of 2014 and increased operating and maintenance costs. Additionally, we incurred $2.6 million of costs associated with building damage related to excessive snow accumulation.
Ferrous Resources. Our ferrous resource operations consist of our two ironmaking initiatives: Iron Dynamics (IDI), a liquid pig iron production facility, and our Minnesota iron operations, consisting of an iron nugget production facility and operations to supply the nugget facility with its primary raw material, iron concentrate. IDI primarily produces liquid pig iron, which is used as a scrap substitute raw material input exclusively at our Flat Roll Division. Our Minnesota iron operations consists of Mesabi Nugget, (owned 81% by us); our potential future iron mining operations, Mesabi Mining; and, our iron tailings operations, Mining Resources (owned 80% by us). The impact of losses from our Minnesota iron operations on first quarter 2014 net income was approximately $8.9 million, as compared to approximately $13.8 million during the first quarter of 2013. The iron nugget production facility utilizes a pioneering production process, which has experienced operational, quality control and production cost challenges. The facility commenced initial production of iron nuggets in 2010. We have continued to modify, re-engineer and further refine this production process and have changed or modified equipment configurations with resulting improvement in plant availability, production, and quality. Certain meaningful adjunct trials related to product yield and cost of production that began in the latter half of the fourth quarter of 2013 were scheduled to be completed during the first quarter of 2014. Due to the unanticipated severe winter weather, not all of these trials were able to be completed: however meaningful progress was made. The remaining trials are expected to be completed before the end of the second quarter of 2014. In the first quarter of 2014, Mesabi Nugget shipped 37,000 metric tons of iron-nuggets for use by our own steel mills, compared to 60,000 during the same period in 2013. Weather had a negative impact on our operations during the first quarter of 2014, limiting production and shipments, and increasing natural gas costs.
|
Steel Fabrication Operations |
Our steel fabrication operations represent the company’s six New Millennium Building Systems’ plants located throughout the United States and Northern Mexico. Revenues from these plants are generated from the fabrication of trusses, girders, steel joists and steel decking used within the non-residential construction industry. Steel fabrication operations accounted for 6% and 5% of our external net sales during the first quarter of 2014 and 2013, respectively.
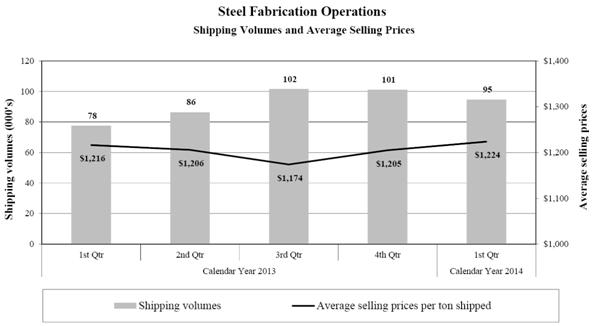
Net sales for the steel fabrication operations segment increased 23% in the first quarter of 2014 compared to the first quarter of 2013, as volumes increased 22%. Our steel fabrication operations continue to increase market share with our expanded geographic footprint and penetration into new markets, and benefit from the improving demand in the non-residential construction industry.
The purchase of various steel products is the largest single cost of production for our steel fabrication operations. During the first quarter of 2014 and 2013, the cost of steel products purchased represented 73% and 71%, respectively, of the total cost of manufacturing for our steel fabrication operations. The average cost of steel consumed increased in the first quarter of 2014, as compared to the same period in 2013, by $31 per ton.
Operating income for the steel fabrication segment of $3.0 million in the first quarter of 2014 more than doubled compared to the same period in 2013 due to the increased selling volumes and related cost compression, in addition to decreases in conversion costs realized from manufacturing efficiencies.
First Quarter Consolidated Results 2014 vs. 2013
Selling, General and Administrative Expenses. Selling, general and administrative expenses (including profit sharing, and amortization of intangible assets) were $82.4 million during the first quarter of 2014, as compared to $80.0 million during the first quarter of 2013, comparable in that they represented 4.5% of our total net sales during each period.
Interest Expense, net of Capitalized Interest. During the first quarter of 2014, gross interest expense decreased $3.5 million to $31.9 million, and capitalized interest increased $538,000 to $1.3 million, when compared to the same period in 2013. The interest capitalized during these periods relates to construction activities at our various operating segments. The decrease in gross interest expense is due to refinancing activities during March/April of 2013 that reduced outstanding debt by $100.0 million and decreased the effective interest rate on $400.0 million of senior notes that were refinanced.
Income Taxes. During the first quarter of 2014, our income tax expense was $17.3 million with an effective tax rate of 33.9%, as compared to $21.4 million with an effective tax rate of 34.2% during the same period in 2013. First quarter 2014 income tax expense includes a benefit related to a change in Indiana’s corporate income tax rate which resulted in the reduction of our deferred income tax. The effective tax rate in the first quarter of 2013 includes a favorable adjustment related to 2012 research and development tax credits that were enacted into the tax code in January 2013.
Liquidity and Capital Resources
Our business is capital intensive and requires substantial expenditures for, among other things, the purchase and maintenance of equipment used in our steelmaking and finishing operations and to remain in compliance with environmental laws. Our short-term and long-term liquidity needs arise primarily from capital expenditures, working capital requirements and principal and interest payments related to our outstanding indebtedness. We have met these liquidity requirements primarily with cash provided by operations, long-term borrowings and issuances of common stock. Our liquidity at March 31, 2014 is as follows:
|
Cash and equivalents |
|
$ |
342,919 |
|
|
Revolver availability |
|
1,086,264 |
|
|
|
Total liquidity |
|
$ |
1,429,183 |
|
Working Capital. We used $27.2 million of cash flow in operating activities during the first quarter 2014, due to increased working capital requirements, based on increases in trade receivables and inventory, which used $89.0 and $17.4 million of cash, respectively, and decreases in accrued expenses, which utilized $48.3 million of cash. Accounts receivable increased primarily due to increased sales late in the first quarter of 2014, as compared to late in the fourth quarter of 2013, while days sales outstanding remained consistent. The increase in inventory is primarily the result of builds in steel segment work in process and finished goods inventory due to strong demand related production outpacing the shipments we were able to make during the difficult first quarter 2014 winter weather. This increase was partially offset by reductions in scrap and other raw material inventory used in production. Accrued expenses decreased primarily due to payments of 2013 accrued profit sharing and incentive compensation, as well as semiannual payments of interest on our senior notes.
Capital Investments. During the first three months of 2014, we invested $24.8 million in property, plant and equipment, as compared to $45.3 million during the same period in 2013. Approximately 50% of the 2014 capital investment related to announced growth or expansion projects at two of our steel mills, which are near completion. We estimate total capital expenditures for 2014 to be in the range of $125 million to $150 million.
During the first three months of 2014, our total outstanding debt of $2.1 billion remained relatively unchanged, decreasing by $8.8 million due to required payments. Our total long-term debt to capitalization ratio (representing our long-term debt, including current maturities, divided by the sum of our long-term debt, redeemable noncontrolling interests, and our total stockholders’ equity) decreased to 44.3% at March 31, 2014, from 44.7% at December 31, 2013.
We have a senior secured credit facility (Facility) that matures in September 2016 which provides for a $1.1 billion Revolver. Subject to certain conditions, we have the opportunity to increase the Revolver capacity by an additional $125.0 million. The Facility is guaranteed by certain of our subsidiaries and is secured by substantially all of our accounts receivable and inventories and pledges of shares of our wholly owned subsidiaries’ capital stock. The Revolver is available to fund working capital, capital expenditures, and other general corporate purposes.
The outstanding balance on the Revolver must be the lesser of $1.1 billion less other applicable commitments such as letters of credit and other secured debt, as defined within the Facility or the sum of 85% of our eligible accounts receivable and 65% of our eligible inventories, less other applicable commitments. At March 31, 2014, we had $1.1 billion of availability on the Revolver, excluding the $13.7 million of outstanding letters of credit and other obligations.
The Facility contains financial and other covenants that limit or restrict our ability to make capital expenditures; incur indebtedness; permit liens on property; enter into transactions with affiliates; make restricted payments or investments; enter into mergers, acquisitions or consolidations; conduct asset sales; pay dividends or distributions and enter into other specified transactions and activities. Our ability to borrow funds within the terms of the Revolver is dependent upon our continued compliance with the financial and other covenants.
The financial covenants under our Facility state that we must maintain an interest coverage ratio of not less than 2.50:1.00. Our interest coverage ratio is calculated by dividing our last-twelve trailing months (LTM) consolidated adjusted EBITDA (earnings before interest, taxes, depreciation, amortization, and certain other non-cash transactions as allowed in our Facility) by our LTM gross interest expense. In addition, a net debt (as defined in the Facility) to consolidated LTM adjusted EBITDA ratio (leverage ratio) of not more than 5.00:1.00 must be maintained. If the leverage ratio exceeds 3.50:1:00 at any time, our ability to make restricted payments as defined in the credit agreement (which includes cash dividends to stockholders and share purchases, among other things), is limited. At March 31, 2014, our interest coverage ratio and net debt leverage ratio were 5.27:1.00 and 2.76:1.00, respectively. We were therefore in compliance with these covenants at March 31, 2014, and we anticipate we will continue to be in compliance during the remainder of the year.
Cash Dividends. As a reflection of confidence in our current and future strength regarding our cash flow generation ability and financial position, we increased our quarterly cash dividend by 5% to $0.115 per share (from $0.110 per share during 2013), resulting in declared cash dividends of $25.7 million during the first quarter of 2014. We paid cash dividends of $24.5 million and $22.0 million during the first three months of 2014 and 2013, respectively. Our board of directors, along with management, approves the payment of dividends on a quarterly basis. During the remainder of 2014, we anticipate maintaining our current level of quarterly dividends; however, the determination to pay cash dividends in the future is at the discretion of our board of directors, after taking into account various factors, including our financial condition, results of operations, outstanding indebtedness, current and anticipated cash needs and growth plans. In addition, the terms of our senior secured revolving credit agreement and the indenture relating to our senior notes may restrict the amount of cash dividends we can pay.
Other. Our ability to meet our debt service obligations and reduce our total debt will depend upon our future performance which, in turn, will depend upon general economic, financial and business conditions, along with competition, legislation and regulatory factors that are largely beyond our control. In addition, we cannot assure you that our operating results, cash flows, access to credit markets and capital resources will be sufficient for repayment of our indebtedness in the future. We believe that based upon current levels of operations and anticipated growth, cash flows from operations, together with other available sources of funds, including additional borrowings under our senior secured credit agreement through its term, which expires in September 2016, will be adequate for the next twelve months for making required payments of principal and interest on our indebtedness, funding working capital requirements, and anticipated capital expenditures.
Other Matters
Inflation . We believe that inflation has not had a material effect on our results of operations.
Environmental and Other Contingencies . We have incurred, and in the future will continue to incur, capital expenditures and operating expenses for matters relating to environmental control, remediation, monitoring, and compliance. We believe, apart from our dependence on environmental construction and operating permits for our existing and proposed manufacturing facilities, that compliance with current environmental laws and regulations is not likely to have a materially adverse effect on our financial condition, results of operations or liquidity; however, environmental laws and regulations have changed rapidly in recent years, and we may become subject to more stringent environmental laws and regulations in the future, such as the impact of United States government or various governmental agencies introducing regulatory changes in response to the potential of climate change.
Critical Accounting Policies and Estimates
No material changes have occurred to the indicated critical accounting policies and estimates as disclosed in our 2013 Annual Report on Form 10-K.
ITEM 3. QUANTITATIVE AND QUALITATIVE DISCLOSURES ABOUT MARKET RISK
Interest Rate Risk
In the normal course of business, we are exposed to interest rate changes. Our objectives in managing exposure to interest rate changes are to limit the impact of these rate changes on earnings and cash flows and to lower overall borrowing costs. To achieve these objectives, we primarily use interest rate swaps to manage net exposure to interest rate changes related to our portfolio of borrowings. We did not have any interest rate swaps during the periods ended March 31, 2014 or 2013.
Commodity Risk
In the normal course of business we are exposed to the market risk and price fluctuations related to the sale of steel products and to the purchase of raw materials used in our operations, such as metallic raw materials, electricity, natural gas, iron concentrate, fuel and zinc. Our risk strategy associated with product sales has generally been to obtain competitive prices for our products and to allow operating results to reflect market price movements dictated by supply and demand.
Our risk strategy associated with the purchase of raw materials utilized within our operations has generally been to make some commitments with suppliers relating to future expected requirements for certain commodities such as electricity, natural gas and its transportation services, air products, fuel, and zinc. Certain commitments contain provisions which require us to “take or pay” for specified quantities without regard to actual usage for periods of up to 43 months for physical commodity requirements, for up to 7 years for commodity transportation requirements, and for up to 14 years for air products. We also purchase electricity consumed at our Flat Roll Division pursuant to a contract which extends through December 2014. The contract designates 160 hours annually as “interruptible service” and establishes an agreed fixed-rate energy charge per Mill/kWh consumed for each year through the expiration of the agreement. At March 31, 2014, no material changes had occurred related to these commodity risks from the information disclosed in our Annual Report on Form 10-K for the year ended December 31, 2013. We utilized such “take or pay” requirements during the past three years under these contracts. We believe that production requirements will be such that consumption of the products or services purchased under these commitments will occur in the normal production process.
In our metals recycling operations we have certain fixed price contracts with various customers and suppliers for future delivery of nonferrous metals. Our risk strategy has been to enter into base metal financial contracts with the goal to protect the profit margin, within certain parameters, that was contemplated when we entered into the transaction with the customer or supplier. At March 31, 2014, we had a cumulative unrealized gain associated with these financial contracts of $2.1 million, substantially all of which have a settlement date within the next twelve months. We believe the customer and supplier contracts associated with the financial contracts will be fully consummated.
ITEM 4. CONTROLS AND PROCEDURES
(a) Evaluation of Disclosure Controls and Procedures . Our management, with the participation of our principal executive officer and principal financial officer, evaluated the effectiveness of our disclosure controls and procedures as of March 31, 2014. The term “disclosure controls and procedures,” as defined in Rules 13a-15(e) and 15d-15(e) under the Exchange Act, means controls and other procedures of a company that are designed to ensure that information required to be disclosed by a company in the reports that it files or submits under the Exchange Act is recorded, processed, summarized and reported, within the time periods specified in the Commissions rules and forms. Disclosure controls and procedures include, without limitation, controls and procedures designed to ensure that information required to be disclosed by a company in the reports that it files or submits under the Exchange Act is accumulated and communicated to the company’s management, including its principal executive and principal financial officers, as appropriate to allow timely decisions regarding required disclosure. Based on the evaluation of our disclosure controls and procedures as of March 31, 2014, our principal executive officer and principal financial officer concluded that, as of such date, our disclosure controls and procedures were effective.
(b) Changes in Internal Controls Over Financial Reporting . No change in our internal control over financial reporting (as defined in Rules 13a-15(f) and 15d-15(f) under the Exchange Act) occurred during the fiscal quarter ended March 31, 2014 that has materially affected, or is reasonably likely to materially affect, our internal control over financial reporting.
We are involved in various routine litigation matters, including administrative proceedings, regulatory proceedings, governmental investigations, environmental matters, and commercial and construction contract disputes.
We are also involved, along with eight other steel manufacturing companies, in a class action antitrust complaint filed in federal court in Chicago, Illinois in March 2008, which alleges a conspiracy to fix, raise, maintain and stabilize the price at which steel products were sold in the United States starting in 2005, by artificially restricting the supply of such steel products. All but one of the Complaints were brought on behalf of a purported class consisting of all direct purchasers of steel products. The other Complaint was brought on behalf of a purported class consisting of all indirect purchasers of steel products within the same time period. In addition, in December 2010, we and the other co-defendants were served with a substantially similar complaint purporting to be on behalf of indirect purchasers of steel products in Tennessee and has been consolidated with the original complaint. All Complaints seek treble damages and costs, including reasonable attorney fees, pre- and post-judgment interest and injunctive relief. Following a period of discovery relating to class certification matters, plaintiffs’ motion for class certification filed in 2012, and briefing by both sides, the court, on March 5 – 7 and April 11, 2014, held a class certification hearing. At the conclusion of the hearing, the court took the class certification issue under advisement.
Although not presently necessary or appropriate to make a dollar estimate of exposure to loss, if any, in connection with the above matter, we may in the future determine that a loss accrual is necessary. Although we may make loss accruals, if and as warranted, any amounts that we may accrue from time to time could vary significantly from the amounts we actually pay, due to inherent uncertainties and the inherent shortcomings of the estimation process, the uncertainties involved in litigation and other factors. Additionally, an adverse result could have a material effect on our financial condition, results of operations and liquidity.
No material changes have occurred to the indicated risk factors as disclosed in our 2013 Annual Report on Form 10-K.
ITEM 2. UNREGISTERED SALES OF EQUITY SECURITIES AND USE OF PROCEEDS
None.
ITEM 3. DEFAULTS UPON SENIOR SECURITIES
None.
ITEM 4. MINE SAFETY DISCLOSURES
The information required to be furnished pursuant to Item 4 concerning mine safety disclosure matters required by Section 1503(a) of the Dodd-Frank Wall Street Reform and Consumer Protection Act and Item 104 of Regulation S-K (17 CFR 229.104) is included in Exhibit 95 to this Quarterly Report.
None.
Executive Officer Certifications
|
31.1* |
|
Certification of Principal Executive Officer required by Item 307 of Regulation S-K as promulgated by the Securities and Exchange Commission and pursuant to Section 302 of the Sarbanes-Oxley Act of 2002. |
|
|
|
|
|
31.2* |
|
Certification of Principal Financial Officer required by Item 307 of Regulation S-K as promulgated by the Securities and Exchange Commission and pursuant to Section 302 of the Sarbanes-Oxley Act of 2002. |
|
|
|
|
|
32.1* |
|
Certification of Chief Executive Officer Pursuant to 18 U.S.C Section 1350, as Adopted Pursuant to Section 906 of the Sarbanes-Oxley Act of 2002. |
|
|
|
|
|
32.2* |
|
Certification of Chief Financial Officer Pursuant to 18 U.S.C Section 1350, as Adopted Pursuant to Section 906 of the Sarbanes-Oxley Act of 2002. |
Other
|
95* |
|
Mine Safety Disclosures. |
XBRL Documents
|
101.INS* |
|
XBRL Instance Document |
|
|
|
|
|
101.SCH* |
|
XBRL Taxonomy Extension Schema Document |
|
|
|
|
|
101.CAL* |
|
XBRL Taxonomy Extension Calculation Document |
|
|
|
|
|
101.LAB* |
|
XBRL Taxonomy Extension Label Document |
|
|
|
|
|
101.PRE* |
|
XBRL Taxonomy Presentation Document |
|
|
|
|
|
101.DEF* |
|
XBRL Taxonomy Definition Document |
* Filed concurrently herewith
Pursuant to the requirements of the Securities Exchange Act of 1934, the registrant has duly caused this report to be signed on its behalf by the undersigned, thereunto duly authorized.
|
May 8, 2014 |
|
|
|
|
|
|
|
|
STEEL DYNAMICS, INC. |
|
|
|
|
|
|
|
By: |
/s/ Theresa E. Wagler |
|
|
|
Theresa E. Wagler |
|
|
|
Executive Vice President and Chief Financial Officer |
|
|
|
(Principal Accounting Officer) |