|
|
|
|
|
|
|
|
|
|
|
|
|
|
|
|
|
|
|
|
|
|
|
|
|
|
|
|
|
|
|
|
|
|
|
|
|
|
|
|
|
|
|
|
|
|
|
|
|
|
|
|
|
|
|
|
UNITED STATES
SECURITIES AND EXCHANGE COMMISSION
WASHINGTON, D.C. 20549
FORM 10-Q
x Quarterly Report Pursuant to Section 13 or 15(d) of the Securities Exchange Act of 1934
For the quarterly period ended June 30, 2015
OR
o Transition Report Pursuant to Section 13 or 15(d) of the Securities Exchange Act of 1934
Commission File Number 0-21719
Steel Dynamics, Inc.
(Exact name of registrant as specified in its charter)
|
Indiana |
|
35-1929476 |
|
(State or other jurisdiction of incorporation or organization) |
|
(I.R.S. Employer Identification No.) |
|
|
|
|
|
7575 West Jefferson Blvd, Fort Wayne, IN |
|
46804 |
|
(Address of principal executive offices) |
|
(Zip Code) |
Registrant’s telephone number, including area code: (260) 969-3500
Indicate by check mark whether the registrant (1) has filed all reports required to be filed by Section 13 or 15(d) of the Securities Exchange Act of 1934 during the preceding 12 months (or for such shorter period that the registrant was required to file such reports), and (2) has been subject to such filing requirements for the past 90 days. Yes x No o
Indicate by check mark whether the registrant has submitted electronically and posted on its corporate website, if any, every Interactive Data File required to be submitted and posted pursuant to Rule 405 of Regulation S-T (§232.405 of this chapter) during the preceding 12 months (or for such shorter period that the registrant was required to submit and post such files). Yes x No o
Indicate by check mark whether the registrant is a large accelerated filer, an accelerated filer, a non-accelerated filer, or a smaller reporting company (see definitions of “large accelerated filer,” “accelerated filer” and “smaller reporting company” in Rule 12b-2 of the Exchange Act).
|
(Check one): |
|
Large accelerated filer x |
|
Accelerated filer o |
|
Non-accelerated filer o |
|
Smaller reporting company o |
Indicate by check mark whether the registrant is a shell company (as defined in Rule 12b-2 of the Exchange Act). Yes o No x
As of July 31, 2015, Registrant had 242,063,063 outstanding shares of common stock.
STEEL DYNAMICS, INC.
|
PART I. Financial Information |
||
|
|
|
|
|
Item 1. |
Financial Statements: |
Page |
|
|
|
|
|
|
Consolidated Balance Sheets as of June 30, 2015 (unaudited) and December 31, 2014 |
1 |
|
|
|
|
|
|
2 |
|
|
|
|
|
|
|
3 |
|
|
|
|
|
|
|
4 |
|
|
|
|
|
|
Management’s Discussion and Analysis of Financial Condition and Results of Operations |
18 |
|
|
|
|
|
|
26 |
||
|
|
|
|
|
26 |
||
|
|
|
|
|
|
|
|
|
27 |
||
|
|
|
|
|
27 |
||
|
|
|
|
|
27 |
||
|
|
|
|
|
27 |
||
|
|
|
|
|
27 |
||
|
|
|
|
|
27 |
||
|
|
|
|
|
28 |
||
|
|
|
|
|
|
29 |
|
STEEL DYNAMICS, INC.
(in thousands, except share data)
|
|
|
June 30, |
|
December 31, |
|
||
|
|
|
2015 |
|
2014 |
|
||
|
|
|
(unaudited) |
|
|
|
||
|
Assets |
|
|
|
|
|
||
|
Current assets |
|
|
|
|
|
||
|
Cash and equivalents |
|
$ |
419,401 |
|
$ |
361,363 |
|
|
Accounts receivable, net |
|
772,309 |
|
859,835 |
|
||
|
Accounts receivable-related parties |
|
44,213 |
|
42,990 |
|
||
|
Inventories |
|
1,292,069 |
|
1,618,419 |
|
||
|
Deferred income taxes |
|
31,396 |
|
35,503 |
|
||
|
Other current assets |
|
32,004 |
|
55,655 |
|
||
|
Total current assets |
|
2,591,392 |
|
2,973,765 |
|
||
|
|
|
|
|
|
|
||
|
Property, plant and equipment, net |
|
3,047,401 |
|
3,123,906 |
|
||
|
|
|
|
|
|
|
||
|
Restricted cash |
|
19,571 |
|
19,312 |
|
||
|
Intangible assets, net |
|
358,402 |
|
370,669 |
|
||
|
Goodwill |
|
741,898 |
|
745,158 |
|
||
|
Other assets |
|
68,099 |
|
78,217 |
|
||
|
Total assets |
|
$ |
6,826,763 |
|
$ |
7,311,027 |
|
|
|
|
|
|
|
|
||
|
Liabilities and Equity |
|
|
|
|
|
||
|
Current liabilities |
|
|
|
|
|
||
|
Accounts payable |
|
$ |
438,363 |
|
$ |
489,791 |
|
|
Accounts payable-related parties |
|
8,335 |
|
21,265 |
|
||
|
Income taxes payable |
|
2,411 |
|
6,086 |
|
||
|
Accrued payroll and benefits |
|
78,201 |
|
128,968 |
|
||
|
Accrued interest |
|
38,988 |
|
50,405 |
|
||
|
Accrued expenses |
|
97,215 |
|
107,607 |
|
||
|
Current maturities of long-term debt |
|
35,075 |
|
46,460 |
|
||
|
Total current liabilities |
|
698,588 |
|
850,582 |
|
||
|
|
|
|
|
|
|
||
|
Long-term debt |
|
|
|
|
|
||
|
Senior term loan |
|
231,250 |
|
237,500 |
|
||
|
Senior notes |
|
2,350,000 |
|
2,700,000 |
|
||
|
Other long-term debt |
|
38,324 |
|
40,206 |
|
||
|
Total long-term debt |
|
2,619,574 |
|
2,977,706 |
|
||
|
|
|
|
|
|
|
||
|
Deferred income taxes |
|
567,754 |
|
542,033 |
|
||
|
Other liabilities |
|
16,147 |
|
18,839 |
|
||
|
Commitments and contingencies |
|
|
|
|
|
||
|
Redeemable noncontrolling interests |
|
125,972 |
|
126,340 |
|
||
|
|
|
|
|
|
|
||
|
Equity |
|
|
|
|
|
||
|
Common stock voting, $.0025 par value; 900,000,000 shares authorized; 261,904,809, and 261,420,126 shares issued; and 242,055,377, and 241,449,423 shares outstanding, as of June 30, 2015 and December 31, 2014, respectively |
|
636 |
|
635 |
|
||
|
Treasury stock, at cost; 19,849,432, and 19,970,703 shares, as of June 30, 2015 and December 31, 2014, respectively |
|
(396,491 |
) |
(398,898 |
) |
||
|
Additional paid-in capital |
|
1,099,669 |
|
1,083,435 |
|
||
|
Retained earnings |
|
2,223,599 |
|
2,227,843 |
|
||
|
Total Steel Dynamics, Inc. equity |
|
2,927,413 |
|
2,913,015 |
|
||
|
Noncontrolling interests |
|
(128,685 |
) |
(117,488 |
) |
||
|
Total equity |
|
2,798,728 |
|
2,795,527 |
|
||
|
Total liabilities and equity |
|
$ |
6,826,763 |
|
$ |
7,311,027 |
|
See notes to consolidated financial statements.
STEEL DYNAMICS, INC.
CONSOLIDATED STATEMENTS OF INCOME (UNAUDITED)
(in thousands, except per share data)
|
|
|
Three Months Ended |
|
Six Months Ended |
|
||||||||
|
|
|
June 30, |
|
June 30, |
|
||||||||
|
|
|
2015 |
|
2014 |
|
2015 |
|
2014 |
|
||||
|
|
|
|
|
|
|
|
|
|
|
||||
|
Net sales |
|
|
|
|
|
|
|
|
|
||||
|
Unrelated parties |
|
$ |
1,945,983 |
|
$ |
1,987,635 |
|
$ |
3,949,956 |
|
$ |
3,753,516 |
|
|
Related parties |
|
59,024 |
|
82,126 |
|
102,486 |
|
146,327 |
|
||||
|
Total net sales |
|
2,005,007 |
|
2,069,761 |
|
4,052,442 |
|
3,899,843 |
|
||||
|
|
|
|
|
|
|
|
|
|
|
||||
|
Costs of goods sold |
|
1,833,264 |
|
1,846,990 |
|
3,693,657 |
|
3,513,768 |
|
||||
|
Gross profit |
|
171,743 |
|
222,771 |
|
358,785 |
|
386,075 |
|
||||
|
|
|
|
|
|
|
|
|
|
|
||||
|
Selling, general and administrative expenses |
|
82,660 |
|
73,463 |
|
159,010 |
|
143,505 |
|
||||
|
Profit sharing |
|
5,031 |
|
10,469 |
|
9,629 |
|
15,864 |
|
||||
|
Amortization of intangible assets |
|
6,493 |
|
6,934 |
|
12,816 |
|
13,869 |
|
||||
|
Operating income |
|
77,559 |
|
131,905 |
|
177,330 |
|
212,837 |
|
||||
|
|
|
|
|
|
|
|
|
|
|
||||
|
Interest expense, net of capitalized interest |
|
37,163 |
|
30,050 |
|
80,250 |
|
60,619 |
|
||||
|
Other expense (income), net |
|
(1,212 |
) |
(1,754 |
) |
14,980 |
|
(2,385 |
) |
||||
|
Income before income taxes |
|
41,608 |
|
103,609 |
|
82,100 |
|
154,603 |
|
||||
|
|
|
|
|
|
|
|
|
|
|
||||
|
Income taxes |
|
16,283 |
|
37,268 |
|
29,821 |
|
54,564 |
|
||||
|
|
|
|
|
|
|
|
|
|
|
||||
|
Net income |
|
25,325 |
|
66,341 |
|
52,279 |
|
100,039 |
|
||||
|
|
|
|
|
|
|
|
|
|
|
||||
|
Net loss attributable to noncontrolling interests |
|
6,225 |
|
5,962 |
|
10,032 |
|
10,843 |
|
||||
|
|
|
|
|
|
|
|
|
|
|
||||
|
Net income attributable to Steel Dynamics, Inc. |
|
$ |
31,550 |
|
$ |
72,303 |
|
$ |
62,311 |
|
$ |
110,882 |
|
|
|
|
|
|
|
|
|
|
|
|
||||
|
Basic earnings per share attributable to Steel Dynamics, Inc. stockholders |
|
$ |
.13 |
|
$ |
0.32 |
|
$ |
.26 |
|
$ |
0.49 |
|
|
|
|
|
|
|
|
|
|
|
|
||||
|
Weighted average common shares outstanding |
|
241,900 |
|
226,220 |
|
241,718 |
|
224,615 |
|
||||
|
|
|
|
|
|
|
|
|
|
|
||||
|
Diluted earnings per share attributable to Steel Dynamics, Inc. stockholders, including the effect of assumed conversions when dilutive |
|
$ |
.13 |
|
0.31 |
|
$ |
.26 |
|
$ |
0.48 |
|
|
|
|
|
|
|
|
|
|
|
|
|
||||
|
Weighted average common shares and share equivalents outstanding |
|
243,491 |
|
242,048 |
|
243,179 |
|
241,721 |
|
||||
|
|
|
|
|
|
|
|
|
|
|
||||
|
Dividends declared per share |
|
$ |
.1375 |
|
$ |
0.1150 |
|
$ |
.2750 |
|
$ |
0.2300 |
|
See notes to consolidated financial statements.
STEEL DYNAMICS, INC.
CONSOLIDATED STATEMENTS OF CASH FLOWS (UNAUDITED)
(in thousands)
|
|
|
Three Months Ended |
|
Six Months Ended |
|
||||||||
|
|
|
June 30, |
|
June 30, |
|
||||||||
|
|
|
2015 |
|
2014 |
|
2015 |
|
2014 |
|
||||
|
|
|
|
|
|
|
|
|
|
|
||||
|
Operating activities: |
|
|
|
|
|
|
|
|
|
||||
|
Net income |
|
$ |
25,325 |
|
$ |
66,341 |
|
$ |
52,279 |
|
$ |
100,039 |
|
|
|
|
|
|
|
|
|
|
|
|
||||
|
Adjustments to reconcile net income to net cash provided by operating activities: |
|
|
|
|
|
|
|
|
|
||||
|
Depreciation and amortization |
|
74,273 |
|
58,441 |
|
147,095 |
|
116,009 |
|
||||
|
Equity-based compensation |
|
6,357 |
|
4,700 |
|
14,900 |
|
10,468 |
|
||||
|
Deferred income taxes |
|
16,367 |
|
(280 |
) |
33,084 |
|
(4,371 |
) |
||||
|
Loss on disposal of property, plant and equipment |
|
998 |
|
3,456 |
|
5,983 |
|
6,097 |
|
||||
|
Changes in certain assets and liabilities: |
|
|
|
|
|
|
|
|
|
||||
|
Accounts receivable |
|
(47,149 |
) |
(99,696 |
) |
85,935 |
|
(188,646 |
) |
||||
|
Inventories |
|
161,174 |
|
11,230 |
|
326,173 |
|
(6,124 |
) |
||||
|
Other assets |
|
7,386 |
|
345 |
|
11,894 |
|
7,704 |
|
||||
|
Accounts payable |
|
62,735 |
|
13,385 |
|
(64,318 |
) |
18,426 |
|
||||
|
Income taxes receivable/payable |
|
(6,844 |
) |
(4,964 |
) |
9,421 |
|
14,429 |
|
||||
|
Accrued expenses and liabilities |
|
8,590 |
|
23,056 |
|
(78,527 |
) |
(25,264 |
) |
||||
|
Net cash provided by operating activities |
|
309,212 |
|
76,014 |
|
543,919 |
|
48,767 |
|
||||
|
|
|
|
|
|
|
|
|
|
|
||||
|
Investing activities: |
|
|
|
|
|
|
|
|
|
||||
|
Purchases of property, plant and equipment |
|
(22,821 |
) |
(33,534 |
) |
(56,172 |
) |
(58,375 |
) |
||||
|
Other investing activities |
|
806 |
|
2,314 |
|
2,469 |
|
31,198 |
|
||||
|
Net cash used in investing activities |
|
(22,015 |
) |
(31,220 |
) |
(53,703 |
) |
(27,177 |
) |
||||
|
|
|
|
|
|
|
|
|
|
|
||||
|
Financing activities: |
|
|
|
|
|
|
|
|
|
||||
|
Issuance of current and long-term debt |
|
60,941 |
|
63,945 |
|
111,034 |
|
107,398 |
|
||||
|
Repayment of current and long-term debt |
|
(60,557 |
) |
(76,412 |
) |
(488,008 |
) |
(132,658 |
) |
||||
|
Exercise of stock options proceeds, including related tax effect |
|
5,206 |
|
8,516 |
|
6,959 |
|
11,421 |
|
||||
|
Contributions from noncontrolling investors, net |
|
(1,135 |
) |
(606 |
) |
(1,164 |
) |
4,764 |
|
||||
|
Dividends paid |
|
(33,233 |
) |
(25,666 |
) |
(60,999 |
) |
(50,181 |
) |
||||
|
Net cash used in financing activities |
|
(28,778 |
) |
(30,223 |
) |
(432,178 |
) |
(59,256 |
) |
||||
|
|
|
|
|
|
|
|
|
|
|
||||
|
Increase (decrease) in cash and equivalents |
|
258,419 |
|
14,571 |
|
58,038 |
|
(37,666 |
) |
||||
|
Cash and equivalents at beginning of period |
|
160,982 |
|
342,919 |
|
361,363 |
|
395,156 |
|
||||
|
|
|
|
|
|
|
|
|
|
|
||||
|
Cash and equivalents at end of period |
|
$ |
419,401 |
|
$ |
357,490 |
|
$ |
419,401 |
|
$ |
357,490 |
|
|
|
|
|
|
|
|
|
|
|
|
||||
|
Supplemental disclosure information: |
|
|
|
|
|
|
|
|
|
||||
|
Cash paid for interest |
|
$ |
48,550 |
|
$ |
20,838 |
|
$ |
88,644 |
|
$ |
60,501 |
|
|
Cash paid (received) for federal and state income taxes, net |
|
$ |
7,046 |
|
$ |
43,008 |
|
$ |
(11,493 |
) |
$ |
45,151 |
|
See notes to consolidated financial statements.
STEEL DYNAMICS, INC.
NOTES TO CONSOLIDATED FINANCIAL STATEMENTS (UNAUDITED)
Description of the Business
Steel Dynamics, Inc. (SDI), together with its subsidiaries (the company), is a domestic manufacturer of steel products and metals recycler. The company has three reporting segments: steel operations, metals recycling and ferrous resources operations, and steel fabrication operations.
Steel Operations. Steel operations include the company’s Butler Flat Roll Division, Columbus Flat Roll Division (acquired September 16, 2014), The Techs galvanizing lines, Structural and Rail Division, Engineered Bar Products Division, Roanoke Bar Division, and Steel of West Virginia. These operations consist of electric arc furnace steel mills, producing steel from ferrous scrap, utilizing continuous casting, automated rolling mills, and eight downstream coating facilities. Steel operations accounted for 69% and 61% of the company’s consolidated external net sales during the three-month periods ended June 30, 2015 and 2014, and 68% and 61% of the company’s consolidated external net sales during the six-month periods ended June 30, 2015 and 2014, respectively.
Metals Recycling and Ferrous Resources Operations. Metals recycling and ferrous resources operations primarily include OmniSource Corporation (OmniSource), the company’s metals recycling and processing locations, ferrous scrap procurement, and an ironmaking facility, Iron Dynamics (IDI), a liquid pig iron production facility. Our other ironmaking operations located in Minnesota were indefinitely idled in May 2015, due to a significant and sustained decline in global pig iron pricing, which resulted in the cost of iron nugget production being higher than product selling values. Metals recycling and ferrous resources operations accounted for 23% and 31% of the company’s consolidated external net sales during the three-month periods ended June 30, 2015, and 2014, and 23% and 31% of the company’s consolidated external net sales during the six-month periods ended June 30, 2015 and 2014, respectively.
Steel Fabrication Operations. Steel fabrication operations include the company’s six New Millennium Building Systems’ joist and deck plants located throughout the United States and Northern Mexico. Revenues from these plants are generated from the fabrication of trusses, girders, steel joists and steel decking used within the non-residential construction industry. Steel fabrication operations accounted for approximately 8% and 7% of the company’s consolidated external net sales during the three-month periods ended June 30, 2015, and 2014, and 8% and 6% of the company’s consolidated external net sales during the six-month periods ended June 30, 2015 and 2014, respectively.
Significant Accounting Policies
Principles of Consolidation . The consolidated financial statements include the accounts of SDI, together with its wholly and majority-owned or controlled subsidiaries, after elimination of significant intercompany accounts and transactions. Noncontrolling interests represent the noncontrolling owner’s proportionate share in the equity, income, or losses of the company’s majority-owned or controlled consolidated subsidiaries.
Use of Estimates. These financial statements are prepared in conformity with accounting principles generally accepted in the United States, and accordingly, include amounts that require management to make estimates and assumptions that affect the amounts reported in the financial statements and in the notes thereto. Significant items subject to such estimates and assumptions include the carrying value of property, plant and equipment, intangible assets, and goodwill; valuation allowances for trade receivables, inventories and deferred income tax assets; unrecognized tax benefits; potential environmental liabilities; and litigation claims and settlements. Actual results may differ from these estimates and assumptions.
In the opinion of management, these financial statements reflect all normal recurring adjustments necessary for a fair presentation of the interim period results. These financial statements and notes should be read in conjunction with the audited financial statements and notes thereto included in the company’s Annual Report on Form 10-K for the year ended December 31, 2014.
Goodwill . The company’s goodwill is allocated to the following reporting units at June 30, 2015, and December 31, 2014, (in thousands):
|
|
|
June 30, |
|
December 31, |
|
||
|
|
|
2015 |
|
2014 |
|
||
|
OmniSource — Metals Recycling/Ferrous Resources Segment |
|
$ |
453,467 |
|
$ |
456,727 |
|
|
The Techs — Steel Segment |
|
142,783 |
|
142,783 |
|
||
|
Butler Flat Roll Division, Structural and Rail Division, and Engineered Bar Division — Metals Recycling and Ferrous Resources Segment |
|
95,000 |
|
95,000 |
|
||
|
Roanoke Bar Division — Steel Segment |
|
29,041 |
|
29,041 |
|
||
|
Columbus Flat Roll Division — Steel Segment |
|
19,682 |
|
19,682 |
|
||
|
New Millennium Building Systems — Fabrication Segment |
|
1,925 |
|
1,925 |
|
||
|
|
|
$ |
741,898 |
|
$ |
745,158 |
|
OmniSource goodwill decreased $3.3 million from December 31, 2014 to June 30, 2015, in recognition of the 2015 tax benefit related to the amortization of the component of OmniSource tax-deductible goodwill in excess of book goodwill.
STEEL DYNAMICS, INC.
NOTES TO CONSOLIDATED FINANCIAL STATEMENTS (UNAUDITED)
Recently Issued Accounting Standards.
In May 2014, the FASB issued guidance codified in ASC 606, Revenue Recognition — Revenue from Contracts with Customers, which amends the guidance in former ASC 605, Revenue Recognition. The core principle of ASC 606 is that an entity should recognize revenue to depict the transfer of promised goods or services to customers in an amount that reflects the consideration to which the entity expects to be entitled in exchange for those goods or services. Because the guidance in ASC 606 is principles-based, it can be applied to all contracts with customers regardless of industry-specific or transaction-specific fact patterns. Additionally, ASC 606 requires additional disclosures to help users of financial statements better understand the nature, amount, timing, and potential uncertainty of revenue that is recognized. This guidance is effective, as deferred by the FASB on July 9, 2015, for annual and interim periods ending after December 15, 2017, but can be early adopted for annual and interim periods ending after December 15, 2016. The company is currently evaluating the impact of the provisions of ASC 606, including the timing of adoption.
In August 2014, the FASB issued ASU 2014-15, Presentation of Financial Statements — Going Concern (Subtopic 205-40: Disclosure of Uncertainties about an Entity’s Ability to Continue as a Going Concern), effective for annual and interim periods ending after December 15, 2016. ASU 2014-15 requires management to evaluate whether there are conditions or events, considered in aggregate, that raise substantial doubt about the entity’s ability to continue as a going concern within one year after the date that the financial statements are issued. There are required disclosures if principal conditions or events are identified that raised substantial doubt about the entity’s ability to continue as a going concern (before consideration of management’s plans), as well as management’s evaluation of the significance of those conditions or events in relation to the entity’s ability to meet its obligations, and management’s plans that alleviated substantial doubt about the entity’s ability to continue as a going concern. This ASU is not expected to have any impact on our overall results of operations, financial position or cash flows.
In April 2015, the FASB issued ASU 2015-03, Interest — Imputation of Interest (Subtopic 835-30) — Simplifying the Presentation of Debt Issuance Costs, which requires debt issuance costs to be presented as a deduction from the corresponding debt liability, rather than as a separate asset, which is the current accounting method of the company. Implementation of this new guidance is required by the company in the first quarter of 2016, but can be early adopted. Upon adoption, the company must apply the new guidance retrospectively to all prior periods presented in the financial statements. The company is currently evaluating when, and the manner in which to adopt the presentation and disclosure requirements of the new guidance, however we do not expect it to have any impact on our overall results of operations, equity or cash flows as previously reported.
In July 2015, the FASB issued ASU 2015-11, Inventory (Topic 330): Simplifying the Measurement of Inventory, which requires an entity to measure inventory at the lower of cost and net realizable value, rather than at the lower of cost or market. This new guidance is effective for interim and annual periods beginning after December 15, 2016, but can be early adopted. The company is currently evaluating the impact of this ASU’s adoption.
The company completed its acquisition of 100% of Severstal Columbus, LLC (Columbus) on September 16, 2014, for a purchase price of $1.625 billion, with additional working capital adjustments of $44.4 million. The acquisition was funded through the issuance of $1.2 billion in Senior Notes, borrowings under the company’s senior secured credit facility, and available cash. The company purchased Columbus to significantly expand and diversify its steel operating base with the addition of 3.4 million tons of hot roll steel production capacity. The product offerings are diversified with respect to width, gauge, and strength when compared to the capabilities of our Butler Flat Roll Division. Located in northeast Mississippi, Columbus is one of the newest and most technologically advanced sheet steel electric arc furnace mills in North America. Additionally, Columbus is advantageously located to serve the growing markets in the southern U.S. and Mexico, providing the company with geographic diversification and growth opportunities.
Unaudited Proforma Information . Columbus’ operating results have been reflected in the company’s financial statements since the effective date of the acquisition, September 16, 2014, in the steel operations reporting segment. The following unaudited pro forma information is presented below for comparison purposes as if the Columbus acquisition was completed as of January 1, 2013, (in thousands):
|
|
|
Six Months Ended |
|
|
|
|
|
June 30, 2014 |
|
|
|
Net sales |
|
$ |
4,985,410 |
|
|
Net income attributable to Steel Dynamics, Inc. |
|
161,119 |
|
|
The information presented is for information purposes only and is not necessarily indicative of the actual results that would have occurred had the acquisition been consummated at January 1, 2013, nor is it necessarily indicative of future operating results of the combined companies under the ownership and management of the company. The pro forma results reflect the pre-acquisition operations of Columbus for the six-month period ended June 30, 2014.
STEEL DYNAMICS, INC.
NOTES TO CONSOLIDATED FINANCIAL STATEMENTS (UNAUDITED)
Basic earnings per share is based on the weighted average shares of common stock outstanding during the period. Diluted earnings per share assumes the weighted average dilutive effect of common share equivalents outstanding during the period applied to the company’s basic earnings per share. Common share equivalents represent potentially dilutive stock options, restricted stock units, deferred stock units, and dilutive shares related to the company’s convertible subordinated debt; and are excluded from the computation in periods in which they have an anti-dilutive effect. There were no anti-dilutive options at June 30, 2015, and 2014.
The following table presents a reconciliation of the numerators and the denominators of the company’s basic and diluted earnings per share computations for the three- and six-month periods ended June 30, 2015 and 2014 (in thousands, except per share data):
|
|
|
Three Months Ended June 30, |
|
||||||||||||||
|
|
|
2015 |
|
2014 |
|
||||||||||||
|
|
|
Net Income
|
|
Shares
|
|
Per Share
|
|
Net Income
|
|
Shares
|
|
Per Share
|
|
||||
|
Basic earnings per share |
|
$ |
31,550 |
|
241,900 |
|
$ |
.13 |
|
$ |
72,303 |
|
226,220 |
|
$ |
.32 |
|
|
Dilutive common share equivalents |
|
— |
|
1,591 |
|
|
|
— |
|
1,789 |
|
|
|
||||
|
5.125% Convertible Senior Notes, net of tax |
|
— |
|
— |
|
|
|
1,969 |
|
14,039 |
|
|
|
||||
|
Diluted earnings per share |
|
$ |
31,550 |
|
243,491 |
|
$ |
.13 |
|
$ |
74,272 |
|
242,048 |
|
$ |
.31 |
|
|
|
|
Six Months Ended June 30, |
|
||||||||||||||
|
|
|
2015 |
|
2014 |
|
||||||||||||
|
|
|
Net Income
|
|
Shares
|
|
Per Share
|
|
Net Income
|
|
Shares
|
|
Per Share
|
|
||||
|
Basic earnings per share |
|
$ |
62,311 |
|
241,718 |
|
$ |
.26 |
|
$ |
110,882 |
|
224,615 |
|
$ |
.49 |
|
|
Dilutive common share equivalents |
|
— |
|
1,461 |
|
|
|
— |
|
1,699 |
|
|
|
||||
|
5.125% convertible senior notes, net of tax |
|
— |
|
— |
|
|
|
4,327 |
|
15,407 |
|
|
|
||||
|
Diluted earnings per share |
|
$ |
62,311 |
|
243,179 |
|
$ |
.26 |
|
$ |
115,209 |
|
241,721 |
|
$ |
.48 |
|
Inventories are stated at lower of cost or market. Cost is determined using a weighted average cost method for scrap, and on a first-in, first-out, basis for other inventory. Inventory consisted of the following (in thousands):
|
|
|
June 30, |
|
December 31, |
|
||
|
|
|
2015 |
|
2014 |
|
||
|
Raw materials |
|
$ |
518,096 |
|
$ |
764,883 |
|
|
Supplies |
|
385,728 |
|
374,599 |
|
||
|
Work in progress |
|
110,750 |
|
128,882 |
|
||
|
Finished goods |
|
277,495 |
|
350,055 |
|
||
|
Total inventories |
|
$ |
1,292,069 |
|
$ |
1,618,419 |
|
During the second quarter 2015, the company recorded an inventory lower-of-cost or market charge of $21.0 million (inclusive of noncontrolling interests of $3.6 million), related to the idling of its Minnesota ironmaking operations. The expense is recorded within cost of goods sold during the three- and six-months ended June 30, 2015.
On March 16, 2015, the company called and repaid all $350.0 million of its outstanding 7 5/8% Senior Notes due 2020 (the “Notes”) at a redemption price of 103.813% of the principal amount of the Notes, plus accrued interest and unpaid interest to, but not including, the date of redemption. Associated premiums and the write off of deferred financing costs of approximately $16.7 million were recorded in other expense in conjunction with the redemption.
STEEL DYNAMICS, INC.
NOTES TO CONSOLIDATED FINANCIAL STATEMENTS (UNAUDITED)
The following table provides a reconciliation of the beginning and ending carrying amounts of total equity, equity attributable to stockholders of Steel Dynamics, Inc. and equity and redeemable amounts attributable to the noncontrolling interests (in thousands):
|
|
|
Stockholders of Steel Dynamics, Inc. |
|
|
|
|
|
|
|
|||||||||||||
|
|
|
Common |
|
Additional
|
|
Retained |
|
Treasury |
|
Noncontrolling |
|
Total |
|
Redeemable
|
|
|||||||
|
|
|
Stock |
|
Capital |
|
Earnings |
|
Stock |
|
Interests |
|
Equity |
|
Interests |
|
|||||||
|
|
|
|
|
|
|
|
|
|
|
|
|
|
|
|
|
|
|
|
|
|
|
|
|
Balances at January 1, 2015 |
|
$ |
635 |
|
$ |
1,083,435 |
|
$ |
2,227,843 |
|
$ |
(398,898 |
) |
$ |
(117,488 |
) |
$ |
2,795,527 |
|
$ |
126,340 |
|
|
Exercise of stock options proceeds, including related tax effect |
|
1 |
|
7,153 |
|
— |
|
— |
|
— |
|
7,154 |
|
— |
|
|||||||
|
Dividends declared |
|
— |
|
— |
|
(66,515 |
) |
— |
|
— |
|
(66,515 |
) |
— |
|
|||||||
|
Distributions to noncontrolling investors, net |
|
— |
|
— |
|
— |
|
— |
|
(1,165 |
) |
(1,165 |
) |
(368 |
) |
|||||||
|
Equity-based compensation |
|
— |
|
9,081 |
|
(40 |
) |
2,407 |
|
— |
|
11,448 |
|
— |
|
|||||||
|
Comprehensive and net income (loss) |
|
— |
|
— |
|
62,311 |
|
— |
|
(10,032 |
) |
52,279 |
|
— |
|
|||||||
|
Balances at June 30, 2015 |
|
$ |
636 |
|
$ |
1,099,669 |
|
$ |
2,223,599 |
|
$ |
(396,491 |
) |
$ |
(128,685 |
) |
$ |
2,798,728 |
|
$ |
125,972 |
|
The company is exposed to certain risks relating to its ongoing business operations. The company utilizes derivative instruments to mitigate interest rate risk, foreign currency exchange rate risk, and commodity margin risk. The company routinely enters into forward exchange traded futures and option contracts to manage the price risk associated with nonferrous metals inventory as well as purchases and sales of nonferrous metals (specifically aluminum, copper, nickel and silver). The company offsets fair value amounts recognized for derivative instruments executed with the same counterparty under master netting agreements.
Commodity Futures Contracts . If the company is “long” on futures contracts, it means the company has more futures contracts purchased than futures contracts sold for the underlying commodity. If the company is “short” on a futures contract, it means the company has more futures contracts sold than futures contracts purchased for the underlying commodity. The following summarizes the company’s futures contract commitments as of June 30, 2015 (MT represents metric tons and Lbs represents pounds):
|
Commodity Futures |
|
Long/Short |
|
Total |
|
|
|
|
Aluminum |
|
Long |
|
2,825 |
|
MT |
|
|
Aluminum |
|
Short |
|
3,275 |
|
MT |
|
|
Copper |
|
Long |
|
8,912 |
|
MT |
|
|
Copper |
|
Short |
|
16,041 |
|
MT |
|
|
Silver |
|
Short |
|
343 |
|
Lbs |
|
The following summarizes the location and amounts of the fair values reported on the company’s balance sheets as of June 30, 2015, and December 31, 2014, and gains and losses related to derivatives included in the company’s statement of income for the three- and six-month periods ended June 30, 2015, and 2014 (in thousands):
|
|
|
Asset Derivatives |
|
Liability Derivatives |
|
||||||||||
|
|
|
|
|
Fair Value |
|
Fair Value |
|
||||||||
|
|
|
Balance sheet location |
|
June 30, 2015 |
|
December 31, 2014 |
|
June 30, 2015 |
|
December 31, 2014 |
|
||||
|
Derivative instruments designated as fair value hedges - |
|
|
|
|
|
|
|
|
|
|
|
||||
|
Commodity futures |
|
Other current assets |
|
$ |
2,508 |
|
$ |
3,180 |
|
$ |
1,479 |
|
$ |
913 |
|
|
|
|
|
|
|
|
|
|
|
|
|
|
||||
|
Derivative instruments not designated as hedges - |
|
|
|
|
|
|
|
|
|
|
|
||||
|
Commodity futures |
|
Other current assets |
|
1,964 |
|
2,132 |
|
1,974 |
|
626 |
|
||||
|
|
|
|
|
|
|
|
|
|
|
|
|
||||
|
Total derivative instruments |
|
|
|
$ |
4,472 |
|
$ |
5,312 |
|
$ |
3,453 |
|
$ |
1,539 |
|
STEEL DYNAMICS, INC.
NOTES TO CONSOLIDATED FINANCIAL STATEMENTS (UNAUDITED)
The fair value of the above derivative instruments, along with required margin deposit amounts with the same counterparty under master netting arrangements, which totaled $6.4 million at June 30, 2015, and $7.6 million at December 31, 2014, are reflected in other current assets in the consolidated balance sheet.
|
|
|
Location of gain
|
|
Amount of gain (loss)
|
|
Hedged items in |
|
Location of gain
|
|
Amount of gain (loss)
|
|
||||||||
|
|
|
in income on
|
|
June 30,
|
|
June 30,
|
|
fair value hedge
|
|
in income on related
|
|
June 30,
|
|
June 30,
|
|
||||
|
Derivatives in fair value hedging relationships - Commodity futures |
|
Costs of goods sold |
|
$ |
3,075 |
|
$ |
(2,632 |
) |
Firm commitments |
|
Costs of goods sold |
|
$ |
362 |
|
$ |
(653 |
) |
|
|
|
|
|
|
|
|
|
Inventory |
|
Costs of goods sold |
|
(2,165 |
) |
2,846 |
|
||||
|
|
|
|
|
|
|
|
|
|
|
|
|
$ |
(1,803 |
) |
$ |
2,193 |
|
||
|
|
|
|
|
|
|
|
|
|
|
|
|
|
|
|
|
||||
|
Derivatives not designated as hedging instruments - Commodity futures |
|
Costs of goods sold |
|
$ |
(326 |
) |
$ |
(2,030 |
) |
|
|
|
|
|
|
|
|
||
|
|
|
|
|
|
|
|
|
|
|
|
|
||||||||
|
|
|
Location of gain
|
|
Amount of gain (loss)
|
|
Hedged items in |
|
Location of gain
|
|
Amount of gain recognized in
|
|
||||||||
|
|
|
in income on
|
|
June 30,
|
|
June 30,
|
|
fair value hedge
|
|
income on related
|
|
June 30,
|
|
June 30,
|
|
||||
|
Derivatives in fair value hedging relationships - Commodity futures |
|
Costs of goods sold |
|
$ |
(1,238 |
) |
$ |
(1,015 |
) |
Firm commitments |
|
Costs of goods sold |
|
$ |
856 |
|
$ |
331 |
|
|
|
|
|
|
|
|
|
|
Inventory |
|
Costs of goods sold |
|
491 |
|
358 |
|
||||
|
|
|
|
|
|
|
|
|
|
|
|
|
$ |
1,347 |
|
$ |
689 |
|
||
|
|
|
|
|
|
|
|
|
|
|
|
|
|
|
|
|
||||
|
Derivatives not designated as hedging instruments - Commodity futures |
|
Costs of goods sold |
|
$ |
6,670 |
|
$ |
5,926 |
|
|
|
|
|
|
|
|
|
||
Derivatives accounted for as fair value hedges had ineffectiveness resulting in gains of $20,000 and $160,000 during the three-month periods ended June 30, 2015, and 2014, respectively; and gains of $127,000 and $456,000 during the six-month periods ended June 30, 2015 and 2014, respectively. Gains excluded from hedge effectiveness testing of $1,252,000 reduced cost of goods sold during the three-month period ended June 30, 2015, and losses of $599,000 increased costs of goods sold during the three-month period ended June 30, 2014. Losses of $18,000 and $782,000 increased cost of goods sold during the six-month periods ended June 30, 2015 and 2014, respectively.
FASB accounting standards provide a comprehensive framework for measuring fair value and sets forth a definition of fair value and establishes a hierarchy prioritizing the inputs to valuation techniques, giving the highest priority to quoted prices in active markets for identical assets and liabilities and the lowest priority to unobservable value inputs. Levels within the hierarchy are defined as follows:
· Level 1—Unadjusted quoted prices for identical assets and liabilities in active markets;
· Level 2—Quoted prices for similar assets and liabilities in active markets (other than those included in Level 1) which are observable for the asset or liability, either directly or indirectly; and
· Level 3—Valuations derived from valuation techniques in which one or more significant inputs or significant value drivers are unobservable.
STEEL DYNAMICS, INC.
NOTES TO CONSOLIDATED FINANCIAL STATEMENTS (UNAUDITED)
The following table sets forth financial assets and liabilities measured at fair value on a recurring basis in the consolidated balance sheet and the respective levels to which the fair value measurements are classified within the fair value hierarchy as of June 30, 2015, and December 31, 2014 (in thousands):
|
|
|
Total |
|
Quoted Prices in
|
|
Significant
|
|
Significant
|
|
||||
|
June 30, 2015 |
|
|
|
|
|
|
|
|
|
|
|
|
|
|
Commodity futures — financial assets |
|
$ |
4,472 |
|
$ |
— |
|
$ |
4,472 |
|
$ |
— |
|
|
Commodity futures — financial liabilities |
|
3,453 |
|
— |
|
3,453 |
|
— |
|
||||
|
|
|
|
|
|
|
|
|
|
|
||||
|
December 31, 2014 |
|
|
|
|
|
|
|
|
|
||||
|
Commodity futures — financial assets |
|
$ |
5,312 |
|
$ |
— |
|
$ |
5,312 |
|
$ |
— |
|
|
Commodity futures — financial liabilities |
|
1,539 |
|
— |
|
1,539 |
|
— |
|
||||
The carrying amounts of financial instruments including cash and equivalents approximate fair value. The fair values of commodity futures contracts are estimated by the use of quoted market prices, estimates obtained from brokers, and other appropriate valuation techniques based on references available. The fair value of long-term debt, including current maturities, as determined by quoted market prices (Level 2), was approximately $2.7 billion and $3.1 billion (with a corresponding carrying amount in the consolidated balance sheets of $2.7 billion and $3.0 billion) at June 30, 2015, and December 31, 2014, respectively.
The company is involved in various routine litigation matters, including administrative proceedings, regulatory proceedings, governmental investigations, environmental matters, and commercial and construction contract disputes, none of which are expected to have a material impact on our financial condition, results of operations, or liquidity.
The company is involved, along with other steel manufacturing companies, in several class action antitrust complaints pending in federal court in Chicago, Illinois, which allege a conspiracy to fix, raise, maintain and stabilize the price at which steel products were sold in the United States during a period between 2005 and 2007, by artificially restricting the supply of such steel products. One of the complaints was brought on behalf of a purported class consisting of all direct purchasers of steel products. A second complaint was brought on behalf of a purported class consisting of all indirect purchasers of steel products within the same time period. An additional complaint was brought in December 2010, on behalf of indirect purchasers of steel products in Tennessee and has been consolidated with the original complaints. All complaints seek treble damages and costs, including reasonable attorney fees, pre- and post-judgment interest and injunctive relief. Plaintiffs filed a Motion for Class Certification in May 2012, and on February 28, 2013, Defendants filed their Joint Memorandum in Opposition to Plaintiffs’ Motion for Class Certification. A hearing on class certification was held on March 5 – 7 and April 11, 2014, and the matter remains under advisement. It’s unclear when the court will issue its ruling on class certification.
Due to the uncertain nature of litigation, the company cannot presently determine the ultimate outcome of this litigation. However, we have determined, based on the information available at this time, that there is not presently a “reasonable possibility” (as that term is defined in ASC 450-20-20), that the outcome of these legal proceedings would have a material impact on our financial condition, results of operations, or liquidity. Although not presently necessary or appropriate to make a dollar estimate of exposure to loss, if any, in connection with the above matter, we may in the future determine that a loss accrual is necessary. Although we may make loss accruals, if and as warranted, any amounts that we may accrue from time to time could vary significantly from the amounts we actually pay, due to inherent uncertainties and the inherent shortcomings of the estimation process, the uncertainties involved in litigation and other factors. Additionally, an adverse result could have a material effect on our financial condition, results of operations and liquidity.
STEEL DYNAMICS, INC.
NOTES TO CONSOLIDATED FINANCIAL STATEMENTS (UNAUDITED)
The company has three reportable segments: steel operations (includes Columbus since its September 16, 2014 acquisition), metals recycling and ferrous resources operations, and steel fabrication operations. Columbus is reported in the steel operations reporting segment from its September 16, 2014, acquisition date. The segment operations are described in Note 1 to the financial statements. Revenues included in the category “Other” are from subsidiary operations that are below the quantitative thresholds required for reportable segments and primarily consist of further processing, slitting, and sale of certain steel products, and the resale of certain secondary and excess steel products. In addition, “Other” also includes certain unallocated corporate accounts, such as the company’s senior secured credit facility, senior notes, certain other investments and certain profit sharing expenses.
The company’s operations are primarily organized and managed by operating segment. Operating segment performance and resource allocations are primarily based on operating results before income taxes. The accounting policies of the reportable segments are consistent with those described in Note 1 to the financial statements. Intra-segment sales and any related profits are eliminated in consolidation. Refer to the company’s Annual Report on Form 10-K for the year ended December 31, 2014, for more information related to the company’s segment reporting. The company’s segment results for the three- and six-month periods ended June 30, 2015, and 2014, are as follows (in thousands):
For the three months ended
|
|
|
Steel Operations |
|
Metals Recycling and
|
|
Steel Fabrication
|
|
Other |
|
Eliminations |
|
Consolidated |
|
||||||
|
June 30, 2015 |
|
|
|
|
|
|
|
|
|
|
|
|
|
||||||
|
Net Sales |
|
|
|
|
|
|
|
|
|
|
|
|
|
||||||
|
External |
|
$ |
1,303,278 |
|
$ |
416,525 |
|
$ |
154,513 |
|
$ |
13,044 |
|
$ |
— |
|
$ |
1,887,360 |
|
|
External Non-U.S. |
|
72,399 |
|
45,108 |
|
— |
|
140 |
|
— |
|
117,647 |
|
||||||
|
Other segments |
|
53,560 |
|
218,480 |
|
12 |
|
5,973 |
|
(278,025 |
) |
— |
|
||||||
|
|
|
1,429,237 |
|
680,113 |
|
154,525 |
|
19,157 |
|
(278,025 |
) |
2,005,007 |
|
||||||
|
Operating income (loss) |
|
107,761 |
|
(35,182 |
) |
27,660 |
|
(18,191 |
)(1) |
(4,489 |
)(2) |
77,559 |
|
||||||
|
Income (loss) before income taxes |
|
86,039 |
|
(40,312 |
) |
25,879 |
|
(25,508 |
) |
(4,490 |
) |
41,608 |
|
||||||
|
Depreciation and amortization |
|
49,171 |
|
21,775 |
|
2,158 |
|
1,221 |
|
(52 |
) |
74,273 |
|
||||||
|
Capital expenditures |
|
9,762 |
|
12,121 |
|
534 |
|
404 |
|
— |
|
22,821 |
|
||||||
|
|
|
|
|
|
|
|
|
|
|
|
|
|
|
||||||
|
As of June 30, 2015 |
|
|
|
|
|
|
|
|
|
|
|
|
|
||||||
|
Assets |
|
4,023,351 |
|
2,023,082 |
|
295,642 |
|
693,993 |
(3) |
(209,305 |
)(4) |
6,826,763 |
|
||||||
|
Liabilities |
|
710,780 |
|
541,396 |
|
57,566 |
|
2,792,947 |
(5) |
(200,626 |
)(6) |
3,902,063 |
|
||||||
Footnotes related to the three months ended June 30, 2015 segment results (in millions):
|
(1) |
|
Corporate SG&A |
|
$ |
(8.1 |
) |
|
|
|
Company-wide equity-based compensation |
|
(6.3 |
) |
|
|
|
|
Profit sharing |
|
(3.5 |
) |
|
|
|
|
Other, net |
|
(0.3 |
) |
|
|
|
|
|
|
$ |
(18.2 |
) |
|
|
|
|
|
|
|
|
|
(2) |
|
Gross profit decrease from intra-company sales |
|
$ |
(4.5 |
) |
|
|
|
|
|
|
|
|
|
(3) |
|
Cash and equivalents |
|
$ |
355.6 |
|
|
|
|
Accounts receivable |
|
8.4 |
|
|
|
|
|
Inventories |
|
12.3 |
|
|
|
|
|
Deferred income taxes |
|
31.4 |
|
|
|
|
|
Property, plant and equipment, net |
|
67.1 |
|
|
|
|
|
Debt issuance costs |
|
35.6 |
|
|
|
|
|
Intra-company debt |
|
146.6 |
|
|
|
|
|
Other |
|
37.0 |
|
|
|
|
|
|
|
$ |
694.0 |
|
|
|
|
|
|
|
|
|
|
(4) |
|
Elimination of intra-company receivables |
|
$ |
(53.1 |
) |
|
|
|
Elimination of intra-company debt |
|
(146.6 |
) |
|
|
|
|
Other |
|
(9.6 |
) |
|
|
|
|
|
|
$ |
(209.3 |
) |
|
|
|
|
|
|
|
|
|
(5) |
|
Accounts payable |
|
$ |
47.8 |
|
|
|
|
Income taxes payable |
|
2.6 |
|
|
|
|
|
Accrued interest |
|
38.8 |
|
|
|
|
|
Accrued profit sharing |
|
7.0 |
|
|
|
|
|
Debt |
|
2,597.0 |
|
|
|
|
|
Deferred income taxes |
|
79.2 |
|
|
|
|
|
Other |
|
20.5 |
|
|
|
|
|
|
|
$ |
2,792.9 |
|
|
|
|
|
|
|
|
|
|
(6) |
|
Elimination of intra-company payables |
|
$ |
(53.5 |
) |
|
|
|
Elimination of intra-company debt |
|
(146.6 |
) |
|
|
|
|
Other |
|
(0.5 |
) |
|
|
|
|
|
|
$ |
(200.6 |
) |
STEEL DYNAMICS, INC.
NOTES TO CONSOLIDATED FINANCIAL STATEMENTS (UNAUDITED)
Note 10. Segment Information (Continued)
For the three months ended
|
|
|
Steel Operations |
|
Metals Recycling and
|
|
Steel Fabrication
|
|
Other |
|
Eliminations |
|
Consolidated |
|
||||||
|
|
|
|
|
|
|
|
|
|
|
|
|
|
|
||||||
|
June 30, 2014 |
|
|
|
|
|
|
|
|
|
|
|
|
|
||||||
|
Net Sales |
|
|
|
|
|
|
|
|
|
|
|
|
|
||||||
|
External |
|
$ |
1,214,247 |
|
$ |
587,385 |
|
$ |
134,852 |
|
$ |
24,181 |
|
$ |
— |
|
$ |
1,960,665 |
|
|
External Non-U.S. |
|
50,857 |
|
57,831 |
|
— |
|
408 |
|
— |
|
109,096 |
|
||||||
|
Other segments |
|
69,802 |
|
303,617 |
|
— |
|
7,309 |
|
(380,728 |
) |
— |
|
||||||
|
|
|
1,334,906 |
|
948,833 |
|
134,852 |
|
31,898 |
|
(380,728 |
) |
2,069,761 |
|
||||||
|
Operating income (loss) |
|
155,949 |
|
(6,053 |
) |
7,590 |
|
(24,159 |
)(1) |
(1,422 |
)(2) |
131,905 |
|
||||||
|
Income (loss) before income taxes |
|
142,594 |
|
(12,634 |
) |
6,099 |
|
(31,028 |
) |
(1,422 |
) |
103,609 |
|
||||||
|
Depreciation and amortization |
|
28,869 |
|
25,870 |
|
2,401 |
|
1,352 |
|
(51 |
) |
58,441 |
|
||||||
|
Capital expenditures |
|
16,332 |
|
16,384 |
|
536 |
|
282 |
|
— |
|
33,534 |
|
||||||
|
|
|
|
|
|
|
|
|
|
|
|
|
|
|
||||||
|
As of June 30, 2014 |
|
|
|
|
|
|
|
|
|
|
|
|
|
||||||
|
Assets |
|
2,732,388 |
|
2,551,899 |
|
297,149 |
|
624,518 |
(3) |
(220,752 |
)(4) |
5,985,202 |
|
||||||
|
Liabilities |
|
578,124 |
|
640,459 |
|
20,879 |
|
1,996,306 |
(5) |
(209,776 |
)(6) |
3,025,992 |
|
||||||
Footnotes related to the three months ended June 30, 2014 segment results (in millions):
|
(1) |
|
Corporate SG&A |
|
$ |
(11.0 |
) |
|
|
|
Company-wide equity-based compensation |
|
(4.7 |
) |
|
|
|
|
Profit sharing |
|
(8.9 |
) |
|
|
|
|
Other, net |
|
0.4 |
|
|
|
|
|
|
|
$ |
(24.2 |
) |
|
|
|
|
|
|
|
|
|
(2) |
|
Gross profit decrease from intra-company sales |
|
$ |
(1.4 |
) |
|
|
|
|
|
|
|
|
|
(3) |
|
Cash and equivalents |
|
$ |
299.9 |
|
|
|
|
Accounts receivable |
|
14.4 |
|
|
|
|
|
Inventories |
|
12.4 |
|
|
|
|
|
Deferred income taxes |
|
17.7 |
|
|
|
|
|
Property, plant and equipment, net |
|
70.9 |
|
|
|
|
|
Debt issuance costs |
|
22.9 |
|
|
|
|
|
Intra-company debt |
|
158.1 |
|
|
|
|
|
Other |
|
28.2 |
|
|
|
|
|
|
|
$ |
624.5 |
|
|
|
|
|
|
|
|
|
|
(4) |
|
Elimination of intra-company receivables |
|
$ |
(52.0 |
) |
|
|
|
Elimination of intra-company debt |
|
(158.1 |
) |
|
|
|
|
Other |
|
(10.7 |
) |
|
|
|
|
|
|
$ |
(220.8 |
) |
|
|
|
|
|
|
|
|
|
(5) |
|
Accounts payable |
|
$ |
46.0 |
|
|
|
|
Income taxes payable |
|
19.4 |
|
|
|
|
|
Accrued interest |
|
30.5 |
|
|
|
|
|
Accrued profit sharing |
|
13.6 |
|
|
|
|
|
Debt |
|
1,737.0 |
|
|
|
|
|
Deferred income taxes |
|
120.5 |
|
|
|
|
|
Other |
|
29.3 |
|
|
|
|
|
|
|
$ |
1,996.3 |
|
|
|
|
|
|
|
|
|
|
(6) |
|
Elimination of intra-company payables |
|
$ |
(52.4 |
) |
|
|
|
Elimination of intra-company debt |
|
(158.1 |
) |
|
|
|
|
Other |
|
0.7 |
|
|
|
|
|
|
|
$ |
(209.8 |
) |
STEEL DYNAMICS, INC.
NOTES TO CONSOLIDATED FINANCIAL STATEMENTS (UNAUDITED)
For the six months ended
|
|
|
Steel Operations |
|
Metals Recycling and
|
|
Steel Fabrication
|
|
Other |
|
Eliminations |
|
Consolidated |
|
||||||
|
|
|
|
|
|
|
|
|
|
|
|
|
|
|
||||||
|
June 30, 2015 |
|
|
|
|
|
|
|
|
|
|
|
|
|
||||||
|
Net Sales |
|
|
|
|
|
|
|
|
|
|
|
|
|
||||||
|
External |
|
$ |
2,616,704 |
|
$ |
843,936 |
|
$ |
315,537 |
|
$ |
35,158 |
|
$ |
— |
|
$ |
3,811,335 |
|
|
External Non-U.S. |
|
144,392 |
|
96,411 |
|
— |
|
304 |
|
— |
|
241,107 |
|
||||||
|
Other segments |
|
102,463 |
|
445,558 |
|
16 |
|
12,662 |
|
(560,699 |
) |
— |
|
||||||
|
|
|
2,863,559 |
|
1,385,905 |
|
315,553 |
|
48,124 |
|
(560,699 |
) |
4,052,442 |
|
||||||
|
Operating income (loss) |
|
219,301 |
|
(52,248 |
) |
49,021 |
|
(38,111 |
)(1) |
(633 |
)(2) |
177,330 |
|
||||||
|
Income (loss) before income taxes |
|
171,945 |
|
(64,982 |
) |
45,473 |
|
(69,702 |
) |
(634 |
) |
82,100 |
|
||||||
|
Depreciation and amortization |
|
97,785 |
|
42,613 |
|
4,388 |
|
2,411 |
|
(102 |
) |
147,095 |
|
||||||
|
Capital expenditures |
|
24,448 |
|
29,779 |
|
1,571 |
|
374 |
|
— |
|
56,172 |
|
||||||
Footnotes related to the six months ended June 30, 2015 segment results (in millions):
|
(1) |
|
Corporate SG&A |
|
$ |
(17.5 |
) |
|
|
|
Company-wide equity-based compensation |
|
(12.2 |
) |
|
|
|
|
Profit sharing |
|
(7.0 |
) |
|
|
|
|
Other, net |
|
(1.4 |
) |
|
|
|
|
Total |
|
$ |
(38.1 |
) |
|
|
|
|
|
|
|
|
|
(2) |
|
Gross profit decrease from intra-company sales |
|
$ |
(0.6 |
) |
For the six months ended
|
|
|
Steel Operations |
|
Metals Recycling and
|
|
Steel Fabrication
|
|
Other |
|
Eliminations |
|
Consolidated |
|
||||||
|
|
|
|
|
|
|
|
|
|
|
|
|
|
|
||||||
|
June 30, 2014 |
|
|
|
|
|
|
|
|
|
|
|
|
|
||||||
|
Net Sales |
|
|
|
|
|
|
|
|
|
|
|
|
|
||||||
|
External |
|
$ |
2,275,326 |
|
$ |
1,105,342 |
|
$ |
250,713 |
|
$ |
44,802 |
|
$ |
— |
|
$ |
3,676,183 |
|
|
External Non-U.S. |
|
107,376 |
|
115,648 |
|
— |
|
636 |
|
— |
|
223,660 |
|
||||||
|
Other segments |
|
113,534 |
|
647,545 |
|
— |
|
13,982 |
|
(775,061 |
) |
— |
|
||||||
|
|
|
2,496,236 |
|
1,868,535 |
|
250,713 |
|
59,420 |
|
(775,061 |
) |
3,899,843 |
|
||||||
|
Operating income (loss) |
|
261,592 |
|
(21,572 |
) |
10,716 |
|
(40,704 |
)(1) |
2,805 |
(2) |
212,837 |
|
||||||
|
Income (loss) before income taxes |
|
234,592 |
|
(35,330 |
) |
7,751 |
|
(55,215 |
) |
2,805 |
|
154,603 |
|
||||||
|
Depreciation and amortization |
|
56,246 |
|
52,491 |
|
4,623 |
|
2,751 |
|
(102 |
) |
116,009 |
|
||||||
|
Capital expenditures |
|
34,938 |
|
22,163 |
|
847 |
|
427 |
|
— |
|
58,375 |
|
||||||
Footnotes related to the six months ended June 30, 2014 segment results (in millions):
|
(1) |
|
Corporate SG&A |
|
$ |
(19.3 |
) |
|
|
|
Company-wide equity-based compensation |
|
(9.3 |
) |
|
|
|
|
Profit sharing |
|
(13.6 |
) |
|
|
|
|
Other, net |
|
1.5 |
|
|
|
|
|
Total |
|
$ |
(40.7 |
) |
|
|
|
|
|
|
|
|
|
(2) |
|
Gross profit increase from intra-company sales |
|
$ |
2.8 |
|
STEEL DYNAMICS, INC.
NOTES TO CONSOLIDATED FINANCIAL STATEMENTS (UNAUDITED)
Certain 100%-owned subsidiaries of SDI have fully and unconditionally guaranteed all of the indebtedness relating to the issuance of the company’s senior unsecured notes due 2019, 2021, 2022, 2023 and 2024. Following are the company’s condensed consolidating financial statements, including the guarantors, which present the financial position, results of operations, and cash flows of (i) SDI (in each case, reflecting investments in its consolidated subsidiaries under the equity method of accounting), (ii) the guarantor subsidiaries of SDI, which includes Columbus since acquired on September 16, 2014, (iii) the non-guarantor subsidiaries of SDI, and (iv) the eliminations necessary to arrive at the information on a consolidated basis. The following statements should be read in conjunction with the accompanying consolidated financial statements and the company’s Annual Report on Form 10-K for the year ended December 31, 2014.
|
|
|
|
|
|
|
Combined |
|
Consolidating |
|
Total |
|
|||||
|
|
|
Parent |
|
Guarantors |
|
Non-Guarantors |
|
Adjustments |
|
Consolidated |
|
|||||
|
As of June 30, 2015 |
|
|
|
|
|
|
|
|
|
|
|
|||||
|
Cash and equivalents |
|
$ |
351,996 |
|
$ |
55,586 |
|
$ |
11,819 |
|
$ |
— |
|
$ |
419,401 |
|
|
Accounts receivable, net |
|
262,708 |
|
1,182,293 |
|
36,919 |
|
(665,398 |
) |
816,522 |
|
|||||
|
Inventories |
|
590,104 |
|
658,048 |
|
47,494 |
|
(3,577 |
) |
1,292,069 |
|
|||||
|
Other current assets |
|
69,807 |
|
7,343 |
|
4,436 |
|
(18,186 |
) |
63,400 |
|
|||||
|
Total current assets |
|
1,274,615 |
|
1,903,270 |
|
100,668 |
|
(687,161 |
) |
2,591,392 |
|
|||||
|
Property, plant and equipment, net |
|
979,749 |
|
1,769,536 |
|
300,229 |
|
(2,113 |
) |
3,047,401 |
|
|||||
|
Intangible assets, net |
|
— |
|
358,402 |
|
— |
|
— |
|
358,402 |
|
|||||
|
Goodwill |
|
— |
|
741,898 |
|
— |
|
— |
|
741,898 |
|
|||||
|
Other assets, including investments in subs |
|
3,573,407 |
|
23,085 |
|
6,491 |
|
(3,515,313 |
) |
87,670 |
|
|||||
|
Total assets |
|
$ |
5,827,771 |
|
$ |
4,796,191 |
|
$ |
407,388 |
|
$ |
(4,204,587 |
) |
$ |
6,826,763 |
|
|
|
|
|
|
|
|
|
|
|
|
|
|
|||||
|
Accounts payable |
|
$ |
140,249 |
|
$ |
314,074 |
|
$ |
89,416 |
|
$ |
(97,041 |
) |
$ |
446,698 |
|
|
Accrued expenses |
|
126,025 |
|
168,859 |
|
6,484 |
|
(84,553 |
) |
216,815 |
|
|||||
|
Current maturities of long-term debt |
|
13,097 |
|
809 |
|
61,445 |
|
(40,276 |
) |
35,075 |
|
|||||
|
Total current liabilities |
|
279,371 |
|
483,742 |
|
157,345 |
|
(221,870 |
) |
698,588 |
|
|||||
|
Long-term debt |
|
2,585,806 |
|
224 |
|
167,639 |
|
(134,095 |
) |
2,619,574 |
|
|||||
|
Other liabilities |
|
35,181 |
|
1,505,382 |
|
35,490 |
|
(992,152 |
) |
583,901 |
|
|||||
|
|
|
|
|
|
|
|
|
|
|
|
|
|||||
|
Redeemable noncontrolling interests |
|
— |
|
— |
|
125,972 |
|
— |
|
125,972 |
|
|||||
|
|
|
|
|
|
|
|
|
|
|
|
|
|||||
|
Common stock |
|
636 |
|
1,727,859 |
|
18,121 |
|
(1,745,980 |
) |
636 |
|
|||||
|
Treasury stock |
|
(396,491 |
) |
— |
|
— |
|
— |
|
(396,491 |
) |
|||||
|
Additional paid-in-capital |
|
1,099,669 |
|
117,737 |
|
641,858 |
|
(759,595 |
) |
1,099,669 |
|
|||||
|
Retained earnings (deficit) |
|
2,223,599 |
|
961,247 |
|
(610,352 |
) |
(350,895 |
) |
2,223,599 |
|
|||||
|
Total Steel Dynamics, Inc. equity |
|
2,927,413 |
|
2,806,843 |
|
49,627 |
|
(2,856,470 |
) |
2,927,413 |
|
|||||
|
Noncontrolling interests |
|
— |
|
— |
|
(128,685 |
) |
— |
|
(128,685 |
) |
|||||
|
Total equity |
|
2,927,413 |
|
2,806,843 |
|
(79,058 |
) |
(2,856,470 |
) |
2,798,728 |
|
|||||
|
Total liabilities and equity |
|
$ |
5,827,771 |
|
$ |
4,796,191 |
|
$ |
407,388 |
|
$ |
(4,204,587 |
) |
$ |
6,826,763 |
|
STEEL DYNAMICS, INC.
NOTES TO CONSOLIDATED FINANCIAL STATEMENTS (UNAUDITED)
Note 11. Condensed Consolidating Information (Continued)
Condensed Consolidating Balance Sheets (in thousands)
|
|
|
|
|
|
|
Combined |
|
Consolidating |
|
Total |
|
|||||
|
|
|
Parent |
|
Guarantors |
|
Non-Guarantors |
|
Adjustments |
|
Consolidated |
|
|||||
|
As of December 31, 2014 |
|
|
|
|
|
|
|
|
|
|
|
|||||
|
Cash and equivalents |
|
$ |
265,313 |
|
$ |
81,690 |
|
$ |
14,360 |
|
$ |
— |
|
$ |
361,363 |
|
|
Accounts receivable, net |
|
321,493 |
|
1,176,849 |
|
44,696 |
|
(640,213 |
) |
902,825 |
|
|||||
|
Inventories |
|
662,970 |
|
862,796 |
|
94,916 |
|
(2,263 |
) |
1,618,419 |
|
|||||
|
Other current assets |
|
94,634 |
|
8,416 |
|
6,577 |
|
(18,469 |
) |
91,158 |
|
|||||
|
Total current assets |
|
1,344,410 |
|
2,129,751 |
|
160,549 |
|
(660,945 |
) |
2,973,765 |
|
|||||
|
Property, plant and equipment, net |
|
1,002,407 |
|
1,826,208 |
|
297,505 |
|
(2,214 |
) |
3,123,906 |
|
|||||
|
Intangible assets, net |
|
— |
|
370,669 |
|
— |
|
— |
|
370,669 |
|
|||||
|
Goodwill |
|
— |
|
745,158 |
|
— |
|
— |
|
745,158 |
|
|||||
|
Other assets, including investments in subs |
|
3,900,691 |
|
24,810 |
|
6,635 |
|
(3,834,607 |
) |
97,529 |
|
|||||
|
Total assets |
|
$ |
6,247,508 |
|
$ |
5,096,596 |
|
$ |
464,689 |
|
$ |
(4,497,766 |
) |
$ |
7,311,027 |
|
|
|
|
|
|
|
|
|
|
|
|
|
|
|||||
|
Accounts payable |
|
$ |
151,517 |
|
$ |
371,037 |
|
$ |
98,886 |
|
$ |
(110,384 |
) |
$ |
511,056 |
|
|
Accrued expenses |
|
191,433 |
|
166,101 |
|
11,695 |
|
(76,163 |
) |
293,066 |
|
|||||
|
Current maturities of long-term debt |
|
13,073 |
|
777 |
|
73,767 |
|
(41,157 |
) |
46,460 |
|
|||||
|
Total current liabilities |
|
356,023 |
|
537,915 |
|
184,348 |
|
(227,704 |
) |
850,582 |
|
|||||
|
Long-term debt |
|
2,942,360 |
|
624 |
|
158,665 |
|
(123,943 |
) |
2,977,706 |
|
|||||
|
Other liabilities |
|
36,110 |
|
1,807,989 |
|
28,719 |
|
(1,311,946 |
) |
560,872 |
|
|||||
|
|
|
|
|
|
|
|
|
|
|
|
|
|||||
|
Redeemable noncontrolling interests |
|
— |
|
— |
|
126,340 |
|
— |
|
126,340 |
|
|||||
|
|
|
|
|
|
|
|
|
|
|
|
|
|||||
|
Common stock |
|
635 |
|
1,727,859 |
|
18,121 |
|
(1,745,980 |
) |
635 |
|
|||||
|
Treasury stock |
|
(398,898 |
) |
— |
|
— |
|
— |
|
(398,898 |
) |
|||||
|
Additional paid-in-capital |
|
1,083,435 |
|
117,737 |
|
635,156 |
|
(752,893 |
) |
1,083,435 |
|
|||||
|
Retained earnings (deficit) |
|
2,227,843 |
|
904,472 |
|
(569,172 |
) |
(335,300 |
) |
2,227,843 |
|
|||||
|
Total Steel Dynamics, Inc. equity |
|
2,913,015 |
|
2,750,068 |
|
84,105 |
|
(2,834,173 |
) |
2,913,015 |
|
|||||
|
Noncontrolling interests |
|
— |
|
— |
|
(117,488 |
) |
— |
|
(117,488 |
) |
|||||
|
Total equity |
|
2,913,015 |
|
2,750,068 |
|
(33,383 |
) |
(2,834,173 |
) |
2,795,527 |
|
|||||
|
Total liabilities and equity |
|
$ |
6,247,508 |
|
$ |
5,096,596 |
|
$ |
464,689 |
|
$ |
(4,497,766 |
) |
$ |
7,311,027 |
|
STEEL DYNAMICS, INC.
NOTES TO CONSOLIDATED FINANCIAL STATEMENTS (UNAUDITED)
Note 11. Condensed Consolidating Information (Continued)
|
|
|
|
|
|
|
Combined |
|
Consolidating |
|
Total |
|
|||||
|
|
|
Parent |
|
Guarantors |
|
Non-Guarantors |
|
Adjustments |
|
Consolidated |
|
|||||
|
For the three months ended, June 30, 2015 |
|
|
|
|
|
|
|
|
|
|
|
|||||
|
Net sales |
|
$ |
766,056 |
|
$ |
2,153,141 |
|
$ |
101,880 |
|
$ |
(1,016,070 |
) |
$ |
2,005,007 |
|
|
Costs of goods sold |
|
669,259 |
|
2,019,025 |
|
134,335 |
|
(989,355 |
) |
1,833,264 |
|
|||||
|
Gross profit (loss) |
|
96,797 |
|
134,116 |
|
(32,455 |
) |
(26,715 |
) |
171,743 |
|
|||||
|
Selling, general and administrative |
|
29,905 |
|
65,736 |
|
2,668 |
|
(4,125 |
) |
94,184 |
|
|||||
|
Operating income (loss) |
|
66,892 |
|
68,380 |
|
(35,123 |
) |
(22,590 |
) |
77,559 |
|
|||||
|
Interest expense, net of capitalized interest |
|
18,166 |
|
18,376 |
|
1,658 |
|
(1,037 |
) |
37,163 |
|
|||||
|
Other (income) expense, net |
|
(773 |
) |
(654 |
) |
(822 |
) |
1,037 |
|
(1,212 |
) |
|||||
|
Income (loss) before income taxes and equity in net loss of subsidiaries |
|
49,499 |
|
50,658 |
|
(35,959 |
) |
(22,590 |
) |
41,608 |
|
|||||
|
Income taxes (benefit) |
|
8,097 |
|
19,172 |
|
(2,510 |
) |
(8,476 |
) |
16,283 |
|
|||||
|
|
|
41,402 |
|
31,486 |
|
(33,449 |
) |
(14,114 |
) |
25,325 |
|
|||||
|
Equity in net loss of subsidiaries |
|
(9,852 |
) |
— |
|
— |
|
9,852 |
|
— |
|
|||||
|
Net loss attributable to noncontrolling interests |
|
— |
|
— |
|
6,225 |
|
— |
|
6,225 |
|
|||||
|
Net income (loss) attributable to Steel Dynamics, Inc. |
|
$ |
31,550 |
|
$ |
31,486 |
|
$ |
(27,224 |
) |
$ |
(4,262 |
) |
$ |
31,550 |
|
|
|
|
|
|
|
|
Combined |
|
Consolidating |
|
Total |
|
|||||
|
|
|
Parent |
|
Guarantors |
|
Non-Guarantors |
|
Adjustments |
|
Consolidated |
|
|||||
|
For the three months ended, June 30, 2014 |
|
|
|
|
|
|
|
|
|
|
|
|||||
|
Net sales |
|
$ |
1,007,569 |
|
$ |
2,313,459 |
|
$ |
121,239 |
|
$ |
(1,372,506 |
) |
$ |
2,069,761 |
|
|
Costs of goods sold |
|
860,024 |
|
2,183,181 |
|
141,362 |
|
(1,337,577 |
) |
1,846,990 |
|
|||||
|
Gross profit (loss) |
|
147,545 |
|
130,278 |
|
(20,123 |
) |
(34,929 |
) |
222,771 |
|
|||||
|
Selling, general and administrative |
|
35,419 |
|
56,411 |
|
3,406 |
|
(4,370 |
) |
90,866 |
|
|||||
|
Operating income (loss) |
|
112,126 |
|
73,867 |
|
(23,529 |
) |
(30,559 |
) |
131,905 |
|
|||||
|
Interest expense, net of capitalized interest |
|
19,031 |
|
10,294 |
|
1,986 |
|
(1,261 |
) |
30,050 |
|
|||||
|
Other (income) expense, net |
|
(1,556 |
) |
(46 |
) |
(1,412 |
) |
1,260 |
|
(1,754 |
) |
|||||
|
Income (loss) before income taxes and equity in net income of subsidiaries |
|
94,651 |
|
63,619 |
|
(24,103 |
) |
(30,558 |
) |
103,609 |
|
|||||
|
Income taxes (benefit) |
|
23,950 |
|
23,076 |
|
814 |
|
(10,572 |
) |
37,268 |
|
|||||
|
|
|
70,701 |
|
40,543 |
|
(24,917 |
) |
(19,986 |
) |
66,341 |
|
|||||
|
Equity in net loss of subsidiaries |
|
1,602 |
|
— |
|
— |
|
(1,602 |
) |
— |
|
|||||
|
Net loss attributable to noncontrolling interests |
|
— |
|
— |
|
5,962 |
|
— |
|
5,962 |
|
|||||
|
Net income (loss) attributable to Steel Dynamics, Inc. |
|
$ |
72,303 |
|
$ |
40,543 |
|
$ |
(18,955 |
) |
$ |
(21,588 |
) |
$ |
72,303 |
|
STEEL DYNAMICS, INC.
NOTES TO CONSOLIDATED FINANCIAL STATEMENTS (UNAUDITED)
Note 11. Condensed Consolidating Information (Continued)
|
|
|
|
|
|
|
Combined |
|
Consolidating |
|
Total |
|
|||||
|
|
|
Parent |
|
Guarantors |
|
Non-Guarantors |
|
Adjustments |
|
Consolidated |
|
|||||
|
For the six months ended, June 30, 2015 |
|
|
|
|
|
|
|
|
|
|
|
|||||
|
Net sales |
|
$ |
1,564,774 |
|
$ |
4,344,150 |
|
$ |
206,453 |
|
$ |
(2,062,935 |
) |
$ |
4,052,442 |
|
|
Costs of goods sold |
|
1,362,834 |
|
4,091,150 |
|
253,116 |
|
(2,013,443 |
) |
3,693,657 |
|
|||||
|
Gross profit (loss) |
|
201,940 |
|
253,000 |
|
(46,663 |
) |
(49,492 |
) |
358,785 |
|
|||||
|
Selling, general and administrative |
|
60,648 |
|
123,769 |
|
6,033 |
|
(8,995 |
) |
181,455 |
|
|||||
|
Operating income (loss) |
|
141,292 |
|
129,231 |
|
(52,696 |
) |
(40,497 |
) |
177,330 |
|
|||||
|
Interest expense, net of capitalized interest |
|
38,703 |
|
40,216 |
|
3,392 |
|
(2,061 |
) |
80,250 |
|
|||||
|
Other (income) expense, net |
|
14,879 |
|
34 |
|
(1,994 |
) |
2,061 |
|
14,980 |
|
|||||
|
Income (loss) before income taxes and equity in net loss of subsidiaries |
|
87,710 |
|
88,981 |
|
(54,094 |
) |
(40,497 |
) |
82,100 |
|
|||||
|
Income taxes (benefit) |
|
15,038 |
|
32,206 |
|
(3,626 |
) |
(13,797 |
) |
29,821 |
|
|||||
|
|
|
72,672 |
|
56,775 |
|
(50,468 |
) |
(26,700 |
) |
52,279 |
|
|||||
|
Equity in net loss of subsidiaries |
|
(10,361 |
) |
— |
|
— |
|
10,361 |
|
— |
|
|||||
|
Net loss attributable to noncontrolling interests |
|
— |
|
— |
|
10,032 |
|
— |
|
10,032 |
|
|||||
|
Net income (loss) attributable to Steel Dynamics, Inc. |
|
$ |
62,311 |
|
$ |
56,775 |
|
$ |
(40,436 |
) |
$ |
(16,339 |
) |
$ |
62,311 |
|
|
|
|
|
|
|
|
Combined |
|
Consolidating |
|
Total |
|
|||||
|
|
|
Parent |
|
Guarantors |
|
Non-Guarantors |
|
Adjustments |
|
Consolidated |
|
|||||
|
For the six months ended, June 30, 2014 |
|
|
|
|
|
|
|
|
|
|
|
|||||
|
Net sales |
|
$ |
1,871,132 |
|
$ |
4,425,848 |
|
$ |
227,088 |
|
$ |
(2,624,225 |
) |
$ |
3,899,843 |
|
|
Costs of goods sold |
|
1,621,419 |
|
4,198,757 |
|
264,935 |
|
(2,571,343 |
) |
3,513,768 |
|
|||||
|
Gross profit (loss) |
|
249,713 |
|
227,091 |
|
(37,847 |
) |
(52,882 |
) |
386,075 |
|
|||||
|
Selling, general and administrative |
|
64,253 |
|
110,700 |
|
6,814 |
|
(8,529 |
) |
173,238 |
|
|||||
|
Operating income (loss) |
|
185,460 |
|
116,391 |
|
(44,661 |
) |
(44,353 |
) |
212,837 |
|
|||||
|
Interest expense, net of capitalized interest |
|
38,392 |
|
20,855 |
|
3,866 |
|
(2,494 |
) |
60,619 |
|
|||||
|
Other (income) expense, net |
|
(2,532 |
) |
349 |
|
(2,696 |
) |
2,494 |
|
(2,385 |
) |
|||||
|
Income (loss) before income taxes and equity in net loss of subsidiaries |
|
149,600 |
|
95,187 |
|
(45,831 |
) |
(44,353 |
) |
154,603 |
|
|||||
|
Income taxes (benefit) |
|
33,875 |
|
34,018 |
|
1,510 |
|
(14,839 |
) |
54,564 |
|
|||||
|
|
|
115,725 |
|
61,169 |
|
(47,341 |
) |
(29,514 |
) |
100,039 |
|
|||||
|
Equity in net loss of subsidiaries |
|
(4,843 |
) |
— |
|
— |
|
4,843 |
|
— |
|
|||||
|
Net loss attributable to noncontrolling interests |
|
— |
|
— |
|
10,843 |
|
— |
|
10,843 |
|
|||||
|
Net income (loss) attributable to Steel Dynamics, Inc. |
|
$ |
110,882 |
|
$ |
61,169 |
|
$ |
(36,498 |
) |
$ |
(24,671 |
) |
$ |
110,882 |
|
STEEL DYNAMICS, INC.
NOTES TO CONSOLIDATED FINANCIAL STATEMENTS (UNAUDITED)
|
|
|
|
|
|
|
Combined |
|
Consolidating |
|
Total |
|
|||||
|
|
|
Parent |
|
Guarantors |
|
Non-Guarantors |
|
Adjustments |
|
Consolidated |
|
|||||
|
|
|
|
|
|
|
|
|
|
|
|
|
|||||
|
For the six months ended, June 30, 2015 |
|
|
|
|
|
|
|
|
|
|
|
|||||
|
Net cash provided by operating activities |
|
$ |
212,624 |
|
$ |
322,486 |
|
$ |
246 |
|
$ |
8,563 |
|
$ |
543,919 |
|
|
Net cash used in investing activities |
|
(31,419 |
) |
(18,495 |
) |
(13,260 |
) |
9,471 |
|
(53,703 |
) |
|||||
|
Net cash provided by (used in) financing activities |
|
(94,522 |
) |
(330,095 |
) |
10,473 |
|
(18,034 |
) |
(432,178 |
) |
|||||
|
Increase (decrease) in cash and equivalents |
|
86,683 |
|
(26,104 |
) |
(2,541 |
) |
— |
|
58,038 |
|
|||||
|
Cash and equivalents at beginning of period |
|
265,313 |
|
81,690 |
|
14,360 |
|
— |
|
361,363 |
|
|||||
|
Cash and equivalents at end of period |
|
$ |
351,996 |
|
$ |
55,586 |
|
$ |
11,819 |
|
$ |
— |
|
$ |
419,401 |
|
|
|
|
|
|
|
|
Combined |
|
Consolidating |
|
Total |
|
|||||
|
|
|
Parent |
|
Guarantors |
|
Non-Guarantors |
|
Adjustments |
|
Consolidated |
|
|||||
|
|
|
|
|
|
|
|
|
|
|
|
|
|||||
|
For the six months ended, June 30, 2014 |
|
|
|
|
|
|
|
|
|
|
|
|||||
|
Net cash provided by (used in) operating activities |
|
$ |
94,219 |
|
$ |
(19,938 |
) |
$ |
(23,559 |
) |
$ |
(1,955 |
) |
$ |
48,767 |
|
|
Net cash used in investing activities |
|
(34,747 |
) |
(10,007 |
) |
(13,076 |
) |
30,653 |
|
(27,177 |
) |
|||||
|
Net cash provided by (used in) financing activities |
|
(83,113 |
) |
19,258 |
|
33,297 |
|
(28,698 |
) |
(59,256 |
) |
|||||
|
Decrease in cash and equivalents |
|
(23,641 |
) |
(10,687 |
) |
(3,338 |
) |
— |
|
(37,666 |
) |
|||||
|
Cash and equivalents at beginning of period |
|
320,866 |
|
61,148 |
|
13,142 |
|
— |
|
395,156 |
|
|||||
|
Cash and equivalents at end of period |
|
$ |
297,225 |
|
$ |
50,461 |
|
$ |
9,804 |
|
$ |
— |
|
$ |
357,490 |
|
ITEM 2. MANAGEMENT’S DISCUSSION AND ANALYSIS OF FINANCIAL CONDITION AND RESULTS OF OPERATIONS
Forward-Looking Statements
This report contains some predictive statements about future events, including statements related to conditions in the steel and metallic scrap markets, our revenues, costs of purchased materials, future profitability and earnings, and the operation of new or existing facilities. These statements are intended to be made as “forward-looking,” subject to many risks and uncertainties, within the safe harbor protections of the Private Securities Litigation Reform Act of 1995, incorporated in Section 27A of the Securities Act of 1933 and Section 21E of the Securities Exchange Act of 1934. Such forward-looking statements involve both known and unknown risks, uncertainties and other factors that may cause our actual results, performance or achievements to be materially different from any future results, performance or achievements expressed or implied by such forward-looking statements. These statements speak only as of this date and are based upon information and assumptions, which we consider reasonable as of this date, concerning our businesses and the environments in which they operate. Such predictive statements are not guarantees of future performance, and we undertake no duty to update or revise any such statements. Some factors that could cause such forward-looking statements to turn out differently than anticipated include: (1) the effects of uncertain economic conditions; (2) cyclical and changing industrial demand; (3) changes in conditions in any of the steel or scrap-consuming sectors of the economy which affect demand for our products, including the strength of the non-residential and residential construction, automotive, appliance, pipe and tube, and other steel-consuming industries; (4) fluctuations in the cost of key raw materials (including ferrous scrap, iron units, and energy costs) and our ability to pass-on any cost increases; (5) the impact of domestic and foreign import price competition; (6) unanticipated difficulties in integrating or starting up new or acquired businesses; (7) risks and uncertainties involving product and/or technology development; and (8) occurrences of unexpected plant outages or equipment failures.
More specifically, we refer you to our more detailed explanation of these and other factors and risks that may cause such predictive statements to turn out differently, as set forth in our most recent Annual Report on Form 10-K for the year ended December 31, 2014, in our quarterly reports on Form 10-Q or in other reports which we from time to time file with the Securities and Exchange Commission. These reports are available publicly on the Securities and Exchange Commission website, www.sec.gov , and on our website, www.steeldynamics.com .
Description of the Business
We are a domestic manufacturer of steel products and metals recycler. We have three reporting segments: steel operations, metals recycling and ferrous resources operations, and steel fabrication operations.
Operating Statement Classifications
Net Sales . Net sales from our operations are a factor of volumes shipped, product mix and related pricing. We charge premium prices for certain grades of steel, product dimensions, certain smaller volumes, and for value-added processing or coating of the steel products. Except for our steel fabrication operations segment, we recognize revenue from sales and the allowance for estimated costs associated with returns from these sales at the time the title of the product is transferred to the customer. Provision is made for estimated product returns and customer claims based on estimates and actual historical experience. Net sales from steel fabrication operations are recognized from construction contracts utilizing a percentage of completion methodology based on steel tons used on completed units to date as a percentage of estimated total steel tons required for each contract.
Costs of Goods Sold . Our costs of goods sold represent all direct and indirect costs associated with the manufacture of our products. The principal elements of these costs are scrap and scrap substitutes (which represent the most significant single component of our consolidated costs of goods sold), steel, direct and indirect labor and related benefits, alloys, zinc, transportation and freight, repairs and maintenance, utilities (most notably electricity and natural gas), and depreciation.
Selling, General and Administrative Expenses . Selling, general and administrative expenses consist of all costs associated with our sales, finance and accounting, and administrative departments. These costs include, among other items, labor and related benefits, professional services, insurance premiums, property taxes, company-wide profit sharing, and amortization of intangible and other assets.
Interest Expense, net of Capitalized Interest . Interest expense consists of interest associated with our senior credit facilities and other debt net of interest costs that are required to be capitalized during the construction period of certain capital investment projects.
Other Expense (Income), net . Other income consists of interest income earned on our temporary cash deposits and investments; any other non-operating income activity, including income from non-consolidated investments accounted for under the equity method. Other expense consists of any non-operating costs, such as acquisition and certain financing expenses.
Results Overview
Consolidated operating income decreased $54.3 million, or 41%, to $77.6 million for the second quarter of 2015, compared to $131.9 million for the second quarter of 2014. Second quarter of 2015 net income decreased $40.7 million, or 56%, to $31.6 million, from $72.3 million for the second quarter of 2014.
For the first half of 2015, operating income decreased $35.5 million, or 17%, to $177.3 million compared to the same period of 2014, while net income decreased $48.6 million, or 44%, to $62.3 million.
Our second quarter 2015 and first half 2015 operational and financial performance was negatively impacted by decreased steel shipments and product pricing, driven by excessive and historically high levels of steel product imports. While scrap costs decreased significantly in the first quarter of 2015 and remained at lower levels during the second quarter of 2015, metal margins contracted as the drop in steel selling prices more than offset the decline of scrap costs. Underlying domestic steel consumption remains strong, as we continue to see improvements in non-residential construction, as well as, automotive and other manufacturing segments. However, a large portion of this domestic steel demand was served by imports in 2015. As a result, domestic steel mill utilization rates decreased in 2015, as compared to 2014, resulting in decreased ferrous scrap shipments in our metals recycling operations. These decreased volumes, along with compressed metal margins due to price volatility, reduced profitability in our metals recycling operations in 2015, as compared to 2014. During 2015, our fabrication operations continue to benefit from the improving non-residential construction market, and raw material costs, resulting in significant increases in both sales and operating income, compared to the same periods in 2014. In May 2015, we indefinitely idled our Minnesota ironmaking operations due to significant and sustained decreases in selling prices to levels that are below our cash costs to produce iron nuggets. In conjunction with the idling, we also made the decision to sell the associated raw material inventory, resulting in a $21.0 million (inclusive of noncontrolling interests of $3.6 million), lower-of-cost or market charge in the second quarter 2015.
Segment Operating Results 2015 vs. 2014 ( dollars in thousands )
|
|
|
Three Months Ended |
|
First |
|
|
|
Six Months Ended |
|
|||||||||||||
|
|
|
June 30, |
|
Quarter |
|
|
|
June 30, |
|
|||||||||||||
|
|
|
2015 |
|
%
|
|
2014 |
|
2015 |
|
Sequential
|
|
2015 |
|
%
|
|
2014 |
|
|||||
|
Net sales: |
|
|
|
|
|
|
|
|
|
|
|
|
|
|
|
|
|
|||||
|
Steel |
|
$ |
1,429,237 |
|
7 |
% |
$ |
1,334,906 |
|
$ |
1,434,322 |
|
— |
% |
$ |
2,863,559 |
|
15 |
% |
$ |
2,496,236 |
|
|
Metals recycling and ferrous resources |
|
680,113 |
|
(28 |
)% |
948,833 |
|
705,792 |
|
(4 |
)% |
1,385,905 |
|
(26 |
)% |
1,868,535 |
|
|||||
|
Steel fabrication |
|
154,525 |
|
15 |
% |
134,852 |
|
161,028 |
|
(4 |
)% |
315,553 |
|
26 |
% |
250,713 |
|
|||||
|
Other |
|
19,157 |
|
(40 |
)% |
31,898 |
|
28,967 |
|
(34 |
)% |
48,124 |
|
(19 |
)% |
59,420 |
|
|||||
|
|
|
2,283,032 |
|
|
|
2,450,489 |
|
2,330,109 |
|
|
|
4,613,141 |
|
|
|
4,674,904 |
|
|||||
|
Intra-company |
|
(278,025 |
) |
|
|
(380,728 |
) |
(282,674 |
) |
|
|
(560,699 |
) |
|
|
(775,061 |
) |
|||||
|
Consolidated |
|
$ |
2,005,007 |
|
(3 |
)% |
$ |
2,069,761 |
|
$ |
2,047,435 |
|
(2 |
)% |
$ |
4,052,442 |
|
4 |
% |
$ |
3,899,843 |
|
|
|
|
|
|
|
|
|
|
|
|
|
|
|
|
|
|
|
|
|||||
|
Operating income (loss): |
|
|
|
|
|
|
|
|
|
|
|
|
|
|
|
|
|
|||||
|
Steel |
|
$ |
107,761 |
|
(31 |
)% |
$ |
155,949 |
|
$ |
111,540 |
|
(3 |
)% |
$ |
219,301 |
|
(16 |
)% |
$ |
261,592 |
|
|
Metals recycling and ferrous resources |
|
(35,182 |
) |
(481 |
)% |
(6,053 |
) |
(17,066 |
) |
(106 |
)% |
(52,248 |
) |
(142 |
)% |
(21,572 |
) |
|||||
|
Steel fabrication |
|
27,660 |
|
264 |
% |
7,590 |
|
21,361 |
|
29 |
% |
49,021 |
|
357 |
% |
10,716 |
|
|||||
|
Other |
|
(18,191 |
) |
25 |
% |
(24,159 |
) |
(19,920 |
) |
9 |
% |
(38,111 |
) |
6 |
% |
(40,704 |
) |
|||||
|
|
|
82,048 |
|
|
|
133,327 |
|
95,915 |
|
|
|
177,963 |
|
|
|
210,032 |
|
|||||
|
Intra-company |
|
(4,489 |
) |
|
|
(1,422 |
) |
3,856 |
|
|
|
(633 |
) |
|
|
2,805 |
|
|||||
|
Consolidated |
|
$ |
77,559 |
|
(41 |
)% |
$ |
131,905 |
|
$ |
99,771 |
|
(22 |
)% |
$ |
177,330 |
|
(17 |
)% |
$ |
212,837 |
|
|
Steel Operations |
Steel Operations. Steel Operations consist of our six electric arc furnace steel mills, producing steel from ferrous scrap, utilizing continuous casting, automated rolling mills, and eight downstream coating facilities. Collectively, our steel operations sell directly to end users and service centers. These products are used in numerous industry sectors, including the automotive, construction, commercial, transportation, agriculture, industrial machinery, pipe and tube and energy markets. Steel operations accounted for 69% and 61% of our consolidated external net sales during the second quarter of 2015 and 2014, and 68% and 61% of our consolidated external net sales during the first half of 2015 and 2014, respectively.
Sheet Products. Our sheet operations consist of our Butler Flat Roll Division (Butler), Columbus Flat Roll Division — acquired September 16, 2014 (Columbus), and our downstream coating facilities, including The Techs. These operations sell a broad range of sheet steel products, such as hot roll, cold roll and coated steel products, including a wide variety of specialty products, such as light gauge hot roll and galvanized. Butler sells other products such as Galvalume ® and painted products, while Columbus, currently sells other products such as high-strength OCTG pipe and non-energy line pipe products. The Techs is comprised of three galvanizing lines which sell specialized galvanized sheet steels used in non-automotive applications.
Long Products. Our Structural and Rail Division sells structural steel beams and pilings to the construction market, as well as standard-grade and premium rail to the railroad industry. Our Engineered Bar Products Division primarily sells engineered, special-bar-quality and merchant-bar-quality rounds, round-cornered squares, and smaller-diameter round engineered bars. Our Roanoke Bar Division primarily sells merchant steel products, including angles, merchant rounds, flats and channels, and reinforcing bar. Steel of West Virginia primarily sells beams, channels and specialty steel sections.
Steel Operations Shipments (tons):
|
|
|
Three Months Ended |
|
First |
|
|
|
Six Months Ended |
|
||||||||
|
|
|
June 30, |
|
Quarter |
|
|
|
June 30, |
|
||||||||
|
|
|
2015 |
|
%
|
|
2014 |
|
2015 |
|
Sequential
|
|
2015 |
|
%
|
|
2014 |
|
|
Shipments: |
|
|
|
|
|
|
|
|
|
|
|
|
|
|
|
|
|
|
Butler Flat Roll Division |
|
721,115 |
|
(7 |
)% |
778,220 |
|
579,493 |
|
24 |
% |
1,300,608 |
|
(8 |
)% |
1,419,740 |
|
|
Columbus Flat Roll Division |
|
693,772 |
|
100 |
% |
— |
|
564,241 |
|
23 |
% |
1,258,013 |
|
100 |
% |
— |
|
|
The Techs |
|
182,239 |
|
(5 |
)% |
191,934 |
|
145,934 |
|
25 |
% |
328,173 |
|
(5 |
)% |
345,171 |
|
|
Sheet products |
|
1,597,126 |
|
65 |
% |
970,154 |
|
1,289,668 |
|
24 |
% |
2,886,794 |
|
64 |
% |
1,764,911 |
|
|
|
|
|
|
|
|
|
|
|
|
|
|
|
|
|
|
|
|
|
Structural and Rail Division |
|
302,250 |
|
(10 |
)% |
336,380 |
|
304,352 |
|
(1 |
)% |
606,602 |
|
(4 |
)% |
628,696 |
|
|
Engineered Bar Products Division |
|
120,559 |
|
(21 |
)% |
152,768 |
|
156,366 |
|
(23 |
)% |
276,925 |
|
(7 |
)% |
297,071 |
|
|
Roanoke Bar Division |
|
140,795 |
|
(2 |
)% |
143,583 |
|
125,123 |
|
13 |
% |
265,918 |
|
(7 |
)% |
287,365 |
|
|
Steel of West Virginia |
|
81,678 |
|
9 |
% |
74,881 |
|
73,511 |
|
11 |
% |
155,189 |
|
3 |
% |
150,455 |
|
|
Long products |
|
645,282 |
|
(9 |
)% |
707,612 |
|
659,352 |
|
(2 |
)% |
1,304,634 |
|
(4 |
)% |
1,363,587 |
|
|
|
|
|
|
|
|
|
|
|
|
|
|
|
|
|
|
|
|
|
Total shipments |
|
2,242,408 |
|
34 |
% |
1,677,766 |
|
1,949,020 |
|
15 |
% |
4,191,428 |
|
34 |
% |
3,128,498 |
|
|
Intra-segment shipments |
|
(62,417 |
) |
|
|
(57,930 |
) |
(56,094 |
) |
|
|
(118,511 |
) |
|
|
(103,438 |
) |
|
Segment shipments |
|
2,179,991 |
|
35 |
% |
1,619,836 |
|
1,892,926 |
|
15 |
% |
4,072,917 |
|
35 |
% |
3,025,060 |
|
|
|
|
|
|
|
|
|
|
|
|
|
|
|
|
|
|
|
|
|
External shipments |
|
2,078,685 |
|
37 |
% |
1,518,882 |
|
1,816,371 |
|
14 |
% |
3,895,056 |
|
36 |
% |
2,857,455 |
|
Net sales for the steel segment increased 7% in the second quarter of 2015, when compared to the second quarter of 2014, due primarily to the inclusion of Columbus in 2015 results. While second quarter 2015 segment shipments improved 35%, compared to prior year’s second quarter, shipments excluding Columbus decreased 8%, as they were negatively impacted by continued elevated steel imports. Additionally, our Engineered Bar Products Division experienced some customer inventory destocking, resulting in volumes decreasing 21% in the second quarter of 2015, compared to the same period in 2014. The elevated levels of imported steel into the domestic market continued to compress steel selling prices, with our average steel product selling prices decreasing $168 per ton, or 20%, compared to the same quarter in 2014. Though overall domestic steel demand remains solid, the continued elevated levels of steel imports has been a significant negative impact to our sales volumes, product pricing, and mill utilization rates. Our average steel mill utilization rate was 87% for the second quarter of 2015, as compared to 95% in the second quarter of 2014. Net sales for the steel segment increased 15% in the first half of 2015, when compared to the first half of 2014, as a 35% increase in segment shipments more than offset a decrease of 15%, or $122 per ton, in average selling prices. Again, the increase in net sales is largely due to the inclusion of Columbus in first half 2015 results, as sales volumes in 2015, excluding Columbus, are down 7% compared to the first half of 2014, due primarily to elevated steel imports during 2015.
Metallic raw materials used in our electric arc furnaces represent our single most significant steel manufacturing cost. During the second quarter 2015 and 2014, our metallic raw material costs represented 57% and 66%, respectively, of our steel operations’ manufacturing costs, excluding the operations of The Techs, which purchases, rather than produces, the steel it further processes. Our metallic raw material cost per net ton consumed in our steel operations decreased $109, or 30%, in the second quarter of 2015, compared with the second quarter of 2014, as the market cost of scrap decreased significantly, consistent with overall scrap market pricing. In the first half of 2015, our metallic raw material cost per net ton consumed decreased $91, or 25%, compared to the same period in 2014.
In spite of decreased raw material cost per ton, second quarter 2015 metal spread (which we define as the difference between average selling prices and the cost of ferrous scrap consumed) contracted compared to the second quarter of 2014, as decreases in product selling prices outpaced decreased raw material costs. Thus, despite the increase in sales in the second quarter of 2015 with the inclusion of Columbus, operating income for the steel segment decreased 31%, to $107.8 million, compared to the same period of 2014. Likewise, first half 2015 operating income decreased 16%, to $219.3 million, compared to the first half of 2014.
|
Metals Recycling and Ferrous Resources Operations |
Metals Recycling and Ferrous Resources Operations. This operating segment primarily includes our metals recycling operations (OmniSource); our liquid pig iron production facility, Iron Dynamics (IDI); and our idled Minnesota ironmaking operations. Our metals recycling and ferrous resources operations segment accounted for 23% and 31% of our consolidated net sales in the second quarter and first half of 2015 and 2014, respectively. Segment operating losses were $35.2 million in the second quarter of 2015, a decline of $29.1 million compared to the second quarter of 2014. Increased losses were primarily driven by increased costs at our Minnesota ironmaking operations in connection with its idling in May 2015, and losses at IDI related to a planned major furnace maintenance outage. Similarly, operating losses for the segment increased $30.7 million in the first half of 2015, to $52.2 million, compared to the first half of 2014.
Metals Recycling and Ferrous Resources Shipments:
|
|
|
Three Months Ended |
|
First |
|
|
|
Six Months Ended |
|
||||||||
|
|
|
June 30, |
|
Quarter |
|
|
|
June 30, |
|
||||||||
|
|
|
2015 |
|
%
|
|
2014 |
|
2015 |
|
Sequential
|
|
2015 |
|
%
|
|
2014 |
|
|
Ferrous metal (gross tons) |
|
|
|
|
|
|
|
|
|
|
|
|
|
|
|
|
|
|
Total |
|
1,357,755 |
|
(5 |
)% |
1,422,697 |
|
1,233,001 |
|
10 |
% |
2,590,756 |
|
(7 |
)% |
2,787,230 |
|
|
Intra-segment |
|
— |
|
|
|
(103 |
) |
— |
|
|
|
— |
|
|
|
(403 |
) |
|
Segment shipments |
|
1,357,755 |
|
(5 |
)% |
1,422,594 |
|
1,233,001 |
|
10 |
% |
2,590,756 |
|
(7 |
)% |
2,786,827 |
|
|
|
|
|
|
|
|
|
|
|
|
|
|
|
|
|
|
|
|
|
External shipments |
|
626,264 |
|
(19 |
)% |
769,046 |
|
642,080 |
|
(2 |
)% |
1,268,344 |
|
(11 |
)% |
1,418,598 |
|
|
|
|
|
|
|
|
|
|
|
|
|
|
|
|
|
|
|
|
|
Nonferrous metals (thousands of pounds) |
|
|
|
|
|
|
|
|
|
|
|
|
|
|
|
|
|
|
Total |
|
275,439 |
|
(4 |
)% |
288,233 |
|
259,903 |
|
6 |
% |
535,342 |
|
(4 |
)% |
559,211 |
|
|
Intra-segment |
|
(21,598 |
) |
|
|
(17,263 |
) |
(17,850 |
) |
|
|
(39,448 |
) |
|
|
(35,606 |
) |
|
Segment shipments |
|
253,841 |
|
(6 |
)% |
270,970 |
|
242,053 |
|
5 |
% |
495,894 |
|
(5 |
)% |
523,605 |
|
|
|
|
|
|
|
|
|
|
|
|
|
|
|
|
|
|
|
|
|
External shipments |
|
253,273 |
|
(6 |
)% |
270,271 |
|
241,580 |
|
5 |
% |
494,853 |
|
(5 |
)% |
521,859 |
|
|
|
|
|
|
|
|
|
|
|
|
|
|
|
|
|
|
|
|
|
Mesabi Nugget shipments (metric tons) – intra-company |
|
14,035 |
|
(57 |
)% |
32,542 |
|
36,480 |
|
(62 |
)% |
50,515 |
|
(28 |
)% |
70,030 |
|
|
|
|
|
|
|
|
|
|
|
|
|
|
|
|
|
|
|
|
|
Iron Dynamics (metric tons) – intra-company |
|
42,212 |
|
(35 |
)% |
64,756 |
|
65,293 |
|
(35 |
)% |
107,505 |
|
(12 |
)% |
121,878 |
|
Metals Recycling. OmniSource represents our metals sourcing and processing operations and is the primary source of net sales in this segment. These operations sell ferrous metals to steel mills and foundries, and nonferrous metals, such as copper, brass, aluminum and stainless steel to, among others, ingot manufacturers, copper refineries and mills, smelters, and specialty mills. Our metals recycling operations represented 87% and 88% of this segment’s net sales during the second quarter of 2015 and 2014, and 86% and 89% in the first half of 2015 and 2014, respectively.
Metals recycling operations net sales were $645.4 million and $891.6 million, during the second quarter of 2015 and 2014, respectively. Ferrous shipments decreased 5% in the second quarter of 2015, compared to the same period in 2014, due primarily to reduced domestic steel mill utilization, as a result of elevated steel product imports in 2015. Nonferrous shipments also decreased 4%. While both ferrous and nonferrous selling prices decreased during the second quarter of 2015, as compared to the same period in 2014, our ferrous selling prices declined by 34%, consistent with overall scrap market selling prices. While ferrous metal spreads in the second quarter 2015 were consistent with those of second quarter 2014, the reduced nonferrous selling prices caused metal spreads for nonferrous materials to contract, decreasing 25%, during the second quarter of 2015, when compared to the same period in 2014. The declines in shipments and nonferrous metal spreads resulted in second quarter 2015 operating income of $8.3 million, as compared to operating income of $13.9 million for the same period in 2014
Metals recycling operations net sales were $1.3 billion and $1.8 billion, during the first half of 2015 and 2014, respectively. Ferrous shipments decreased 7% in the first half of 2015, compared to the same period in 2014, due to reduced domestic steel mill utilization, as a result of elevated steel product imports in 2015. Nonferrous shipments also decreased 4%. While both ferrous and nonferrous selling prices decreased during the first half of 2015, as compared to the same 2014 period, our ferrous selling prices declined by 31% consistent with overall market selling prices. As a result of reduced selling prices, metal spreads for ferrous and nonferrous materials contracted 6% and 19%, respectively, during the first half of 2015, when compared to the same period in 2014. These declines in shipments and metal spreads resulted in operating income in the first half of 2015 decreasing $15.1 million, or 80%, to $3.8 million, compared to the first half of 2014.
Ferrous Resources. Our ferrous resources operations consist primarily of Iron Dynamics (IDI), and our idled Minnesota ironmaking operations. IDI primarily produces liquid pig iron, which is used as a scrap substitute raw material input exclusively at our Butler Flat Roll Division. IDI experienced additional losses during the second quarter 2015, related to a planned major furnace maintenance outage that generally takes place every five or more years.
Our Minnesota ironmaking operations consists of Mesabi Nugget, (owned 82% by us); our iron concentrate and potential future iron mining operations, Mesabi Mining; and, our iron tailings operations, Mining Resources (owned 82% by us). The nugget facility was idled in February 2015 to allow us to work through company-wide nugget inventory, as well as, to complete installation of new equipment in the iron concentrate facility to reestablish product yield. However, pig iron prices declined significantly late in the first quarter 2015, have remained low, and are expected to continue to remain low. Current selling prices are below our cash cost to produce iron nuggets. Given this significant and sustained decline in pig iron pricing, we elected to indefinitely idle the Minnesota ironmaking operations and to monetize existing raw material inventory. As a result, we recorded an inventory lower-of-cost or market charge of $21.0 million (inclusive of noncontrolling interests of $3.6 million), in cost of goods sold during the three- and six-months ended June 30, 2015. The impact of losses, and lower-of-cost or market and other charges from the Minnesota iron operations on second quarter 2015 reduced net income by approximately $16.5 million, as compared to approximately $9.1 million during the second quarter 2014. For the first half of 2015, losses, from the Minnesota iron operations reduced net income by approximately $22.8 million, compared with $18.0 million in the first half of 2014.
|
Steel Fabrication Operations |
Steel Fabrication Operations consist of our six New Millennium Building Systems plants located throughout the United States and Northern Mexico. Revenues from these plants are generated from the fabrication of trusses, girders, steel joists and steel decking used within the non-residential construction industry. Steel fabrication operations accounted for 8% and 7% of our consolidated net sales during the second quarter of 2015 and 2014, and 8% and 6% of the company’s consolidated net sales during the first half of 2015 and 2014, respectively.
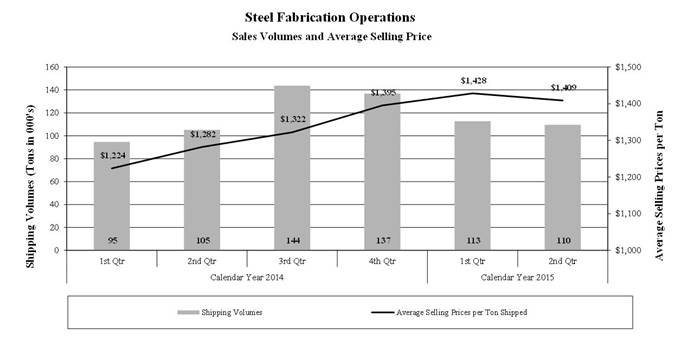
Net sales for the steel fabrication operations segment increased $19.7 million, or 15%, in the second quarter of 2015, compared to the second quarter of 2014. Shipments and selling prices increased 4% and 10%, respectively, in the second quarter of 2015, as compared to the same period in 2014, based on increased demand from the non-residential construction market and our continued market share expansion. Net sales for the segment increased $64.8 million, or 26%, in the first half of 2015, compared to the first half of 2014, as volumes increased 11% and selling prices increased 13% for the same reasons. Our steel fabrication operations continue to realize strength in order activity and resulting shipments and selling prices, as we leverage our national operating footprint and market demand improves.
The purchase of various steel products is the largest single cost of production for our steel fabrication operations generally representing more than two-thirds of the total cost of manufacturing for our steel fabrication operations. The average cost of steel consumed decreased in the second quarter of 2015, as compared to the same period in 2014, by 11%, and coupled with 10% higher selling prices resulted in expanded metal spreads. Likewise, during the first half of 2015 the average cost of steel consumed decreased, as compared to the same period in 2014, by 5%, coupled with a 13% increase in average selling prices.
As a result of the increased shipments and metal spread expansion, operating income of $27.7 million in the second quarter of 2015 was over three and a half times that of the same period in 2014 of $7.6 million. Similarly, segment operating income of $49.0 million in the first half of 2015 increased 357%, from $10.7 million in the first half of 2014.
Second Quarter Consolidated Results 2015 vs. 2014
Selling, General and Administrative Expenses. Selling, general and administrative expenses (including profit sharing and amortization of intangible assets) were $94.2 million during the second quarter of 2015, as compared to $90.9 million during the second quarter of 2014, an increase of $3.3 million, or 4%. During the second quarters of 2015 and 2014, these selling, general and administrative expenses were comparable in total, and as a percentage of net sales, representing approximately 4.7% and 4.4% of net sales, respectively.
Interest Expense, net of Capitalized Interest. During the second quarter of 2015, interest expense increased $7.1 million to $37.2 million, when compared to the same period in 2014. The increase in interest expense is due primarily to the addition of the $1.2 billion senior notes in September 2014, in conjunction with our acquisition of Columbus, partially offset by the conversion or payoff at maturity of $287.5 million of 5.125% convertible notes in June 2014, and the call of our $350.0 million 7 5 / 8 % Senior Notes due 2020 in March 2015.
Other Expense (Income), net. During the second quarter of 2015, net other income of $1.2 million was comparable to net other income of $1.8 million in the same period in 2014.
Income Taxes. During the second quarter of 2015, our income tax expense was $16.3 million with an effective income tax rate of 39.1%, as compared to $37.3 million with an effective income tax rate of 36.0% during the second quarter of 2014. The higher effective tax rate in the second quarter of 2015 is due primarily to the impact on the effective tax rate of higher proportional (to pretax income) noncontrolling interest losses in the second quarter of 2015 as compared to the same period in 2014.
First Six Months Consolidated Results 2015 vs. 2014
Selling, General and Administrative Expenses. Selling, general and administrative expenses (including profit sharing and amortization of intangible assets) were $181.5 million during the first half of 2015, as compared to $173.2 million during the first half of 2014, an increase of $8.2 million, or 5%. During the first half of 2015 and 2014, these selling, general and administrative expenses were comparable, representing approximately 4.5% and 4.4% of net sales, respectively.
Interest Expense, net of Capitalized Interest. During the first half of 2015, interest expense increased $19.6 million to $80.3 million, when compared to the same period in 2014. The increase in interest expense is due primarily to the addition of the $1.2 billion senior notes in September 2014, in conjunction with our acquisition of Columbus, partially offset by the conversion or payoff at maturity of $287.5 million of 5.125% convertible notes in June 2014, and the call of our $350.0 million 7 5 / 8 % Senior Notes due 2020 in March 2015.
Other Expense (Income), net. During the first half of 2015, net other expense of $15.0 million increased $17.4 million compared to net other income of $2.4 million in the same period in 2014, due primarily to $16.7 million of call premium and other finance expenses associated with the March 2015 senior note call and prepayment.
Income Taxes. During the first half of 2015, our income tax expense was $29.8 million with an effective income tax rate of 36.3%, as compared to $54.6 million with an effective income tax rate of 35.3% during the first half of 2014. The higher effective tax rate in the first half of 2015 is due primarily to the impact on the effective tax rate of higher proportional (to pretax income) noncontrolling interest losses in the first half of 2015 as compared to the same period in 2014.
Liquidity and Capital Resources
|
Cash and equivalents |
|
$ |
419,401 |
|
|
Revolver availability |
|
1,186,175 |
|
|
|
Total liquidity |
|
$ |
1,605,576 |
|
Our total outstanding debt decreased $369.5 million during the first half of 2015, to $2.7 billion, due primarily to our March 2015 call and prepayment of $350.0 million in 7 5 / 8 % senior notes due 2020. As a result, our total long-term debt to capitalization ratio (representing our long-term debt, including current maturities, divided by the sum of our long-term debt, redeemable noncontrolling interests, and our total stockholders’ equity) decreased to 47.6% at June 30, 2015, from 50.9% at December 31, 2014.
We have a senior secured credit facility (Facility) that matures in November 2019 which provides for a $1.2 billion Revolver along with a term loan facility. Subject to certain conditions, we also have the ability to increase the combined facility size by a minimum of $750 million. The Facility contains financial and other covenants pertaining to our ability (which may under certain circumstances be limited) to make capital expenditures; incur indebtedness; permit liens on property; enter into transactions with affiliates; make restricted payments or investments; enter into mergers, acquisitions or consolidations; conduct asset sales; pay dividends or distributions and enter into other specified transactions and activities. Our ability to borrow funds within the terms of the Revolver is dependent upon our continued compliance with the financial and other covenants. At June 30, 2015, we had $1.2 billion of availability on the Revolver, $13.8 million of outstanding letters of credit and other obligations which reduce availability, and there were no borrowings outstanding.
The financial covenants under our Facility state that we must maintain an interest coverage ratio of not less than 2.50:1.00. Our interest coverage ratio is calculated by dividing our last-twelve trailing months (LTM) consolidated adjusted proforma EBITDA (earnings before interest, taxes, depreciation, amortization, and certain other non-cash transactions as allowed in our Facility) by our LTM proforma gross interest expense, less amortization of financing fees. In addition, a net debt (as defined in the Facility) to consolidated LTM adjusted proforma EBITDA (net debt leverage ratio) of not more than 5.00:1.00 must be maintained. If the net debt leverage ratio exceeds 3.50:1:00 at any time, our ability to make certain payments as defined in the Facility (which includes cash dividends to stockholders and share purchases, among other things), is limited. At June 30, 2015, our interest coverage ratio and net debt leverage ratio were 5.71:1.00 and 2.40:1.00, respectively. We were therefore in compliance with these covenants at June 30, 2015, and we anticipate we will continue to be in compliance during 2015.
Working Capital. We generated cash flow from operations of $543.9 million in the first half of 2015. Operational working capital, representing amounts invested in trade receivables and inventories, less current liabilities other than income taxes payable and debt, decreased $275.7 million during the first half of 2015, to $1.4 billion. Amounts invested in accounts receivable and inventories, net of accounts payable, decreased $348.3 million in conjunction with a slight decrease in sales and production volume and a significant decrease in the cost of scrap and steel when compared to the fourth quarter of 2014.
Capital Investments. During the first half of 2015, we invested $56.2 million in property, plant and equipment, as compared to $58.4 million during the same period in 2014. We believe these capital investments will benefit our net sales and related cash flows as each project attains appropriate operational metrics. Our current estimated 2015 annual cash allocation plan includes the investment of approximately $150 million in capital expenditures in our existing and announced operations.
Cash Dividends. As a reflection of confidence in our current and future cash flow generation ability and financial position, we increased our quarterly cash dividend by 20% to $0.1375 per share in the first quarter 2015 (from $0.115 per share previously), resulting in declared cash dividends of $66.5 million during the first half of 2015, compared to $53.2 million during the first half of 2014. We paid cash dividends of $61.0 million and $50.2 million during the first half of 2015 and 2014, respectively. Our board of directors, along with executive management, approves the payment of dividends on a quarterly basis. The determination to pay cash dividends in the future is at the discretion of our board of directors, after taking into account various factors, including our financial condition, results of operations, outstanding indebtedness, current and anticipated cash needs and growth plans. In addition, the terms of our senior secured credit facility and the indenture relating to our senior notes may restrict the amount of cash dividends we can pay.
Other. Our ability to meet our debt service obligations and reduce our total debt will depend upon our future performance which, in turn, will depend upon general economic, financial and business conditions, along with competition, legislation and regulatory factors that are largely beyond our control. In addition, we cannot assure that our operating results, cash flows, access to credit markets and capital resources will be sufficient for repayment of our indebtedness in the future. We believe that based upon current levels of operations and anticipated growth, cash flows from operations, together with other available sources of funds, including additional borrowings under our Revolver through its term, which expires in November 2019, will be adequate for the next twelve months for making required payments of principal and interest on our indebtedness, funding working capital requirements, and anticipated capital expenditures.
Other Matters
Inflation . We believe that inflation has not had a material effect on our results of operations.
Environmental and Other Contingencies . We have incurred, and in the future will continue to incur, capital expenditures and operating expenses for matters relating to environmental control, remediation, monitoring and compliance. We believe, apart from our dependence on environmental construction and operating permits for our existing and any future manufacturing facilities, that compliance with current environmental laws and regulations is not likely to have a materially adverse effect on our financial condition, results of operations or liquidity; however, environmental laws and regulations evolve and change, and we may become subject to more stringent environmental laws and regulations in the future, such as the impact of U.S. government or various governmental agencies introducing regulatory changes in response to the potential of climate change.
Critical Accounting Policies and Estimates
No material changes have occurred to the indicated critical accounting policies and estimates as disclosed in our 2014 Annual Report on Form 10-K.
ITEM 3. QUANTITATIVE AND QUALITATIVE DISCLOSURES ABOUT MARKET RISK
Interest Rate Risk
In the normal course of business, we are exposed to interest rate changes. Our objectives in managing exposure to interest rate changes are to limit the impact of these rate changes on earnings and cash flows and to lower overall borrowing costs. To achieve these objectives, we occasionally use interest rate swaps to manage net exposure to interest rate changes related to our portfolio of borrowings. We did not have any interest rate swaps during the periods ended June 30, 2015 or 2014.
Commodity Risk
In the normal course of business we are exposed to the market risk and price fluctuations related to the sale of our products and to the purchase of raw materials used in our operations, such as metallic raw materials, electricity, natural gas and its transportation services, fuel, air products, and zinc. Our risk strategy associated with product sales has generally been to obtain competitive prices for our products and to allow operating results to reflect market price movements dictated by supply and demand.
Our risk strategy associated with the purchase of raw materials utilized within our operations has generally been to make some commitments with suppliers relating to future expected requirements for some commodities such as electricity, natural gas and its transportation services, fuel, air products, and zinc. Certain of these commitments contain provisions which require us to “take or pay” for specified quantities without regard to actual usage for periods of up to 30 months for physical commodity requirements, for up to 5 years for commodity transportation requirements, and for up to 13 years for air products. We utilized such “take or pay” requirements during the past three years under these contracts. We believe that production requirements will be such that consumption of the products or services purchased under these commitments will occur in the normal production process. We also purchase electricity consumed at our Butler Flat Roll Division pursuant to a contract which extends through December 2015. The contract designates 160 hours annually as “interruptible service” and establishes an agreed fixed-rate energy charge per Mill/kWh consumed for each year through the expiration of the agreement.
In our metals recycling operations we have certain fixed price contracts with various customers and suppliers for future delivery of nonferrous metals. Our risk strategy has been to enter into base metal financial contracts with the goal to protect the profit margin, within certain parameters, that was contemplated when we entered into the transaction with the customer or vendor. At June 30, 2015, we had a cumulative unrealized gain associated with these financial contracts of $1.0 million, substantially all of which have a settlement date within the next twelve months. We believe the customer contracts associated with the financial contracts will be fully consummated.
ITEM 4. CONTROLS AND PROCEDURES
(a) Evaluation of Disclosure Controls and Procedures . Our management, with the participation of our principal executive officer and principal financial officer, evaluated the effectiveness of our disclosure controls and procedures as of June 30, 2015. The term “disclosure controls and procedures,” as defined in Rules 13a-15(e) and 15d-15(e) under the Exchange Act, means controls and other procedures of a company that are designed to ensure that information required to be disclosed by a company in the reports that it files or submits under the Exchange Act is recorded, processed, summarized and reported, within the time periods specified in the Commission’s rules and forms. Disclosure controls and procedures include, without limitation, controls and procedures designed to ensure that information required to be disclosed by a company in the reports that it files or submits under the Exchange Act is accumulated and communicated to the company’s management, including its principal executive and principal financial officers, as appropriate to allow timely decisions regarding required disclosure. Based on the evaluation of our disclosure controls and procedures as of June 30, 2015, our principal executive officer and principal financial officer concluded that, as of such date, our disclosure controls and procedures were effective.
(b) Changes in Internal Controls Over Financial Reporting . No change in our internal control over financial reporting (as defined in Rules 13a-15(f) and 15d-15(f) under the Exchange Act) occurred during the fiscal quarter ended June 30, 2015 that has materially affected, or is reasonably likely to materially affect, our internal control over financial reporting.
We are involved in various routine litigation matters, including administrative proceedings, regulatory proceedings, governmental investigations, environmental matters, and commercial and construction contract disputes.
We are involved, along with other steel manufacturing companies, in several class action antitrust complaints pending in federal court in Chicago, Illinois, which allege a conspiracy to fix, raise, maintain and stabilize the price at which steel products were sold in the United States during a period between 2005 and 2007, by artificially restricting the supply of such steel products. One of the complaints was brought on behalf of a purported class consisting of all direct purchasers of steel products. A second complaint was brought on behalf of a purported class consisting of all indirect purchasers of steel products within the same time period. An additional complaint was brought in December 2010, on behalf of indirect purchasers of steel products in Tennessee and has been consolidated with the original complaints. All complaints seek treble damages and costs, including reasonable attorney fees, pre- and post-judgment interest and injunctive relief. Plaintiffs filed a Motion for Class Certification in May 2012, and on February 28, 2013, Defendants filed their Joint Memorandum in Opposition to Plaintiffs’ Motion for Class Certification. A hearing on class certification was held on March 5 — 7 and April 11, 2014, and the matter remains under advisement. It’s unclear when the court will issue its ruling on class certification.
Due to the uncertain nature of litigation, we cannot presently determine the ultimate outcome of this litigation. However, we have determined, based on the information available at this time, that there is not presently a “reasonable possibility” (as that term is defined in ASC 450-20-20), that the outcome of these legal proceedings would have a material impact on our financial condition, results of operations, or liquidity. Although not presently necessary or appropriate to make a dollar estimate of exposure to loss, if any, in connection with the above matter, we may in the future determine that a loss accrual is necessary. Although we may make loss accruals, if and as warranted, any amounts that we may accrue from time to time could vary significantly from the amounts we actually pay, due to inherent uncertainties and the inherent shortcomings of the estimation process, the uncertainties involved in litigation and other factors. Additionally, an adverse result could have a material effect on our financial condition, results of operations and liquidity.
No material changes have occurred to the indicated risk factors as disclosed in our 2014 Annual Report on Form 10-K.
ITEM 2. UNREGISTERED SALES OF EQUITY SECURITIES AND USE OF PROCEEDS
None.
ITEM 3. DEFAULTS UPON SENIOR SECURITIES
None.
ITEM 4. MINE SAFETY DISCLOSURES
The information required to be furnished pursuant to Item 4 concerning mine safety disclosure matters required by Section 1503(a) of the Dodd-Frank Wall Street Reform and Consumer Protection Act and Item 104 of Regulation S-K (17 CFR 229.104) is included in Exhibit 95 to this Quarterly Report.
None.
Executive Officer Certifications
|
31.1* |
|
Certification of Principal Executive Officer required by Item 307 of Regulation S-K as promulgated by the Securities and Exchange Commission and pursuant to Section 302 of the Sarbanes-Oxley Act of 2002. |
|
|
|
|
|
31.2* |
|
Certification of Principal Financial Officer required by Item 307 of Regulation S-K as promulgated by the Securities and Exchange Commission and pursuant to Section 302 of the Sarbanes-Oxley Act of 2002. |
|
|
|
|
|
32.1* |
|
Certification of Chief Executive Officer Pursuant to 18 U.S.C Section 1350, as Adopted Pursuant to Section 906 of the Sarbanes-Oxley Act of 2002. |
|
|
|
|
|
32.2* |
|
Certification of Chief Financial Officer Pursuant to 18 U.S.C Section 1350, as Adopted Pursuant to Section 906 of the Sarbanes-Oxley Act of 2002. |
|
|
|
|
|
Other |
|
|
|
|
|
|
|
95* |
|
Mine Safety Disclosures. |
|
|
||
|
XBRL Documents |
||
|
|
|
|
|
101.INS* |
|
XBRL Instance Document |
|
|
|
|
|
101.SCH* |
|
XBRL Taxonomy Extension Schema Document |
|
|
|
|
|
101.CAL* |
|
XBRL Taxonomy Extension Calculation Document |
|
|
|
|
|
101.LAB* |
|
XBRL Taxonomy Extension Label Document |
|
|
|
|
|
101.PRE* |
|
XBRL Taxonomy Presentation Document |
|
|
|
|
|
101.DEF* |
|
XBRL Taxonomy Definition Document |
* Filed concurrently herewith
Pursuant to the requirements of the Securities Exchange Act of 1934, the registrant has duly caused this report to be signed on its behalf by the undersigned, thereunto duly authorized.
|
August 10, 2015 |
|
|
|
|
|
|
|
|
|
STEEL DYNAMICS, INC. |
|
|
|
|
|
|
By: |
/s/ Theresa E. Wagler |
|
|
|
Theresa E. Wagler |
|
|
Executive Vice President and Chief Financial Officer |
|
|
|
( Principal Financial Officer and Principal Accounting Officer ) |
|