|
|
|
|
|
|
|
|
|
|
|
|
|
|
|
|
|
|
|
|
|
|
|
|
|
|
|
|
|
|
|
|
|
|
|
|
|
|
|
|
|
|
|
|
|
|
|
|
|
|
|
|
|
|
|
|
|
|
|
|
|
|
Table of Contents
SECURITIES AND EXCHANGE COMMISSION
|
ANNUAL REPORT PURSUANT TO SECTION 13 OR 15(d)
OF THE SECURITIES EXCHANGE ACT OF 1934 |
||
| Delaware | 54-1272589 | |
| (State or other jurisdiction of incorporation or organization) | (I.R.S. Employer Identification No.) |
Securities registered pursuant to Section 12(b) of the Act:
|
Title of each class
Common Stock, par value $.02 per share |
Name of each exchange on which registered
Nasdaq Stock Market |
| Large accelerated filer o | Accelerated filer þ | Non-accelerated filer o | Smaller reporting company o | |||
|
(Do
not check if a smaller
reporting company) |
| Common Stock, par value $.02 per share | 10,332,179 | |
| (Class of Common Stock) | Number of Shares |
| Page | ||||||||
|
|
||||||||
| 3 | ||||||||
|
|
||||||||
| 6 | ||||||||
|
|
||||||||
| 8 | ||||||||
|
|
||||||||
| 8 | ||||||||
|
|
||||||||
| 8 | ||||||||
|
|
||||||||
| 8 | ||||||||
|
|
||||||||
|
|
||||||||
| 9 | ||||||||
|
|
||||||||
| 11 | ||||||||
|
|
||||||||
| 12 | ||||||||
|
|
||||||||
| 17 | ||||||||
|
|
||||||||
| 17 | ||||||||
|
|
||||||||
| 17 | ||||||||
|
|
||||||||
| 17 | ||||||||
|
|
||||||||
| 17 | ||||||||
|
|
||||||||
|
|
||||||||
| 18 | ||||||||
|
|
||||||||
| 18 | ||||||||
|
|
||||||||
| 18 | ||||||||
|
|
||||||||
| 18 | ||||||||
|
|
||||||||
| 18 | ||||||||
|
|
||||||||
|
|
||||||||
| 19 | ||||||||
|
|
||||||||
| 22 | ||||||||
|
|
||||||||
| F-1 | ||||||||
|
|
||||||||
| Exhibit 4.4 | ||||||||
| Exhibit 21 | ||||||||
| Exhibit 23 | ||||||||
| Exhibit 31.1 | ||||||||
| Exhibit 31.2 | ||||||||
| Exhibit 32.1 | ||||||||
| Exhibit 32.2 | ||||||||
2
Table of Contents
| Item 1. |
Business
|
3
Table of Contents
| • |
Smaller, more frequent and cost-effective production runs,
|
| • |
Identification and elimination of manufacturing bottlenecks and waste,
|
| • |
Use of cellular manufacturing in the production of components, and
|
| • |
Improvement of our relationships with suppliers by establishing primary
suppliers.
|
4
Table of Contents
5
Table of Contents
1641 Fairystone Park Highway
Stanleytown, Virginia 24168
Attention: Mr. Douglas I. Payne
Telephone: 276-627-2010
Fax: 276-629-5114
Or e-mail your request to: Investor@Stanleyfurniture.com
| Item 1A. |
Risk Factors
|
6
Table of Contents
| • |
Our ability to service customers could be adversely affected and result in lower sales
and earnings.
|
|
Our sourcing partners may not supply goods that meet our manufacturing, quality or safety
specifications, in a timely manner and at an acceptable price. We may reject goods that
do not meet our specifications and either manufacture internally or find alternative
sourcing arrangements at a higher cost, or may be forced to discontinue the product.
Also, delivery of goods from our foreign sourcing partners may be delayed for reasons not
typically encountered with domestic manufacturing or sourcing, such as shipment delays
caused by customs or labor issues.
|
| • |
Changes in political, economic and social conditions, as well as laws and regulations, in
the countries from which we source products could adversely affect us.
|
|
Foreign sourcing is subject to political and social instability in countries where our
sourcing partners are located. This could make it more difficult for us to service our
customers. Also, significant fluctuations of foreign exchange rates against the value of
the U.S. dollar could increase costs and decrease earnings. In addition, an outbreak of
the avian flu or similar epidemic in Asia or elsewhere may lower our sales and earnings
by disrupting our supply chain in the countries impacted.
|
| • |
International trade policies of the United States and countries from which we source
products could adversely affect us
.
|
|
Imposition of trade sanctions relating to imports, taxes, import duties and other charges
on imports could increase our costs and decrease our earnings.
|
7
Table of Contents
| Item 1B. |
Unresolved Staff Comments
|
| Item 2. |
Properties
|
| Approximate | Owned | |||||||||||
| Facility Size | or | |||||||||||
| Location | Primary Use | (Square Feet) | Leased | |||||||||
|
Stanleytown, VA
|
Manufacturing /Warehouse and Corporate Headquarters | 1,721,000 | Owned | |||||||||
|
Robbinsville, NC
|
Manufacturing/Warehouse | 562,100 | Owned | |||||||||
|
Martinsville, VA
|
Warehouse | 300,000 | Owned | |||||||||
|
High Point, NC
|
Showroom | 51,000 | Leased | |||||||||
| Item 3. |
Legal Proceedings
|
| Item 4. |
Submission of Matters to a Vote of Security Holders
|
8
Table of Contents
| Name | Age | Position | ||||||
|
|
||||||||
|
Albert L. Prillaman
|
64 | Chairman | ||||||
|
|
||||||||
|
Glenn Prillaman
|
38 | President and Chief Executive Officer | ||||||
|
|
||||||||
|
Douglas I. Payne
|
52 | Executive Vice President — Finance and Administration and Secretary | ||||||
| Item 5. |
Market for Registrant’s Common Equity, Related Stockholder Matters and Issuer
Purchases of Equity Securities
|
| 2009 | 2008 | |||||||||||||||||||||||
| Dividends | Dividends | |||||||||||||||||||||||
| High | Low | Paid | High | Low | Paid | |||||||||||||||||||
|
First Quarter
|
$ | 8.59 | $ | 6.50 | — | $ | 14.90 | $ | 9.39 | $ | .10 | |||||||||||||
|
Second Quarter
|
11.10 | 7.08 | — | 12.93 | 9.30 | .10 | ||||||||||||||||||
|
Third Quarter
|
13.48 | 9.69 | — | 11.14 | 6.79 | .10 | ||||||||||||||||||
|
Fourth Quarter
|
11.01 | 7.13 | — | 11.15 | 5.60 | .10 | ||||||||||||||||||
9
Table of Contents
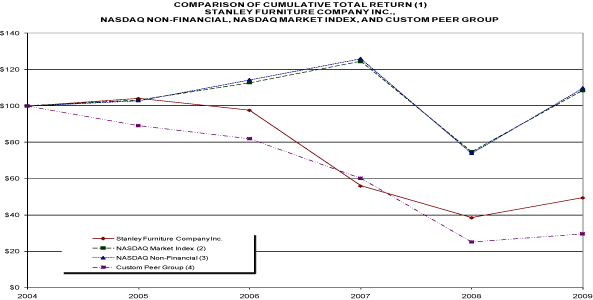
| (1) |
The graph shows the cumulative total return on $100 invested at the market close on
December 31, 2004, the last trading day in 2004, in common stock or the specified index,
including reinvestments of dividends.
|
|
| (2) |
Nasdaq Market Index as prepared by Morningstar, Inc.
|
|
| (3) |
Nasdaq Non-Financial Stock Index as prepared by Morningstar, Inc.
|
|
| (4) |
Peer group Index as prepared by Morningstar, Inc. consists of SIC Code 2511 Wood
Household Furniture Index and SIC Code 2512 Wood Household Furniture, Upholstered. At
January 5, 2010, Morningstar Inc. reported that these two indexes consisted of Aaron’s,
Inc., Bassett Furniture Industries, Inc., Chromcraft Revington, Inc., Consolidated
Mercantile, Inc., Ethan Allen Interiors, Inc., Flexsteel Industries, Inc., Furniture Brands
International, Inc., Hooker Furniture Corporation, Industrie Natuzzi, Keller Manufacturing
Company, Inc., Kimball International, Inc., La-Z-Boy, Inc., Luxor Industrial, Rowe
Companies, Virco Manufacturing Corporation, and Stanley Furniture Company, Inc.
|
| Number of shares | Weighted-average | Number of shares | ||||||||||
| to be issued upon | exercise price | remaining available | ||||||||||
| exercise of | of outstanding | for future issuance | ||||||||||
| outstanding options, | options, warrants | under equity | ||||||||||
| warrants and rights | and rights | compensation plans | ||||||||||
|
Equity compensation plans
approved by stockholders
|
1,640,624 | $ | 11.71 | 812,364 | ||||||||
10
Table of Contents
| Item 6. |
Selected Financial Data
|
| Years Ended December 31, | ||||||||||||||||||||
| 2009 | 2008 | 2007 | 2006 | 2005 | ||||||||||||||||
| (in thousands, except per share data) | ||||||||||||||||||||
|
Income Statement Data:
|
||||||||||||||||||||
|
Net sales
|
$ | 160,451 | $ | 226,522 | $ | 282,847 | $ | 307,547 | $ | 333,646 | ||||||||||
|
Cost of sales (1)
|
154,988 | 193,929 | 235,937 | 242,679 | 251,937 | |||||||||||||||
|
|
||||||||||||||||||||
|
Gross profit
|
5,463 | 32,593 | 46,910 | 64,868 | 81,709 | |||||||||||||||
|
Selling, general and administrative
expenses (2)
|
30,373 | 36,441 | 39,573 | 42,139 | 44,267 | |||||||||||||||
|
Pension plan termination charge (3)
|
(6,605 | ) | ||||||||||||||||||
|
|
||||||||||||||||||||
|
Operating income (loss)
|
(24,910 | ) | (3,848 | ) | 732 | 22,729 | 37,442 | |||||||||||||
|
Income from Continued Dumping and Subsidy Offset Act, net
|
9,340 | 11,485 | 10,429 | 4,419 | ||||||||||||||||
|
Other income, net
|
160 | 308 | 265 | 297 | 288 | |||||||||||||||
|
Interest expense, net
|
3,703 | 3,211 | 2,679 | 1,710 | 1,825 | |||||||||||||||
|
|
||||||||||||||||||||
|
Income (loss) before income taxes
|
(19,113 | ) | 4,734 | 8,747 | 25,735 | 35,905 | ||||||||||||||
|
Income taxes (benefit)
|
(7,362 | ) | 998 | 2,845 | 8,954 | 12,674 | ||||||||||||||
|
|
||||||||||||||||||||
|
Net income (loss)
|
$ | (11,751 | ) | $ | 3,736 | $ | 5,902 | $ | 16,781 | $ | 23,231 | |||||||||
|
|
||||||||||||||||||||
|
|
||||||||||||||||||||
|
Basic Earnings (loss) Per Share: (4)
|
||||||||||||||||||||
|
Net income (loss)
|
$ | (1.14 | ) | $ | .36 | $ | .56 | $ | 1.44 | $ | 1.82 | |||||||||
|
|
||||||||||||||||||||
|
Weighted average shares
|
10,332 | 10,332 | 10,478 | 11,649 | 12,766 | |||||||||||||||
|
|
||||||||||||||||||||
|
|
||||||||||||||||||||
|
Diluted Earnings (loss) Per Share: (4)
|
||||||||||||||||||||
|
Net income (loss)
|
$ | (1.14 | ) | $ | .36 | $ | .55 | $ | 1.41 | $ | 1.77 | |||||||||
|
|
||||||||||||||||||||
|
Weighted average shares
|
10,332 | 10,332 | 10,677 | 11,924 | 13,154 | |||||||||||||||
|
|
||||||||||||||||||||
|
|
||||||||||||||||||||
|
Cash dividends paid per share
|
$ | $ | .40 | $ | .40 | $ | .32 | $ | .24 | |||||||||||
|
|
||||||||||||||||||||
|
|
||||||||||||||||||||
|
Balance Sheet and Other Data:
|
||||||||||||||||||||
|
Cash
|
$ | 41,827 | $ | 44,013 | $ | 31,648 | $ | 6,269 | $ | 12,556 | ||||||||||
|
Inventories
|
37,225 | 47,344 | 58,086 | 59,364 | 69,961 | |||||||||||||||
|
Working capital
|
87,277 | 97,059 | 91,852 | 72,036 | 91,200 | |||||||||||||||
|
Total assets
|
150,462 | 165,871 | 173,731 | 162,678 | 190,488 | |||||||||||||||
|
Long-term debt including
current maturities
|
27,857 | 29,286 | 30,714 | 8,571 | 11,428 | |||||||||||||||
|
Stockholders’ equity
|
92,847 | 103,108 | 102,851 | 109,647 | 132,749 | |||||||||||||||
|
Capital expenditures
|
$ | 2,621 | $ | 2,261 | $ | 3,951 | $ | 4,196 | $ | 4,986 | ||||||||||
|
Stock repurchases:
|
||||||||||||||||||||
|
Shares (4)
|
639 | 1,423 | 1,057 | |||||||||||||||||
|
Total cost
|
$ | 13,557 | $ | 33,576 | $ | 22,993 | ||||||||||||||
| (1) |
Included in cost of sales in 2009 is $5.2 million pre-tax ($3.2 million after-tax), or
$.31 per diluted share, for restructuring and related charges for a warehouse
consolidation, elimination of certain positions, and a write-down of inventories.
Included in cost of sales in 2008 is $5.9 million pre-tax ($4.6 million after-tax), or $.45
per diluted share, for the consolidation of two manufacturing facilities into one. Included
in cost of sales in 2007 is $3.6 million pre-tax ($2.4 million after-tax), or $.28 per
diluted share, for the conversion of a manufacturing facility to a warehouse operation.
|
|
| (2) |
Included in selling, general and administrative expenses in 2009 is $876 thousand
pre-tax ($539 thousand after-tax), or $.05 per diluted share, and 2008 is $1.4 million
pre-tax ($1.1 million after-tax), or $.11 per diluted share, of restructuring charges.
|
|
| (3) |
We terminated our defined benefit pension plan in 2007, resulting in a charge to
earnings of $6.6 million pre-tax ($4.5 million after-tax), or $.42 per diluted share.
|
|
| (4) |
Amounts have been adjusted to reflect the two-for-one stock split, distributed in the
form of a stock dividend, on June 6, 2005.
|
11
Table of Contents
| Item 7. |
Management’s Discussion and Analysis of Financial Condition and Results of
Operation
|
12
Table of Contents
13
Table of Contents
14
Table of Contents
| Payment due or commitment expiration | ||||||||||||||||||||
| Less Than | Over | |||||||||||||||||||
| Total | 1 year | 2-3 years | 4-5 years | 5 years | ||||||||||||||||
|
Contractual cash obligations:
|
||||||||||||||||||||
|
Long-term debt
|
$ | 27,857 | $ | 1,429 | $ | 8,571 | $ | 7,142 | $ | 10,715 | ||||||||||
|
Postretirement benefits other than pensions(1)
|
3,353 | 478 | 841 | 690 | 1,344 | |||||||||||||||
|
Fixed interest payment on long-term debt
|
7,770 | 1,831 | 2,934 | 1,923 | 1,082 | |||||||||||||||
|
Operating leases
|
2,790 | 683 | 1,071 | 883 | 153 | |||||||||||||||
|
|
||||||||||||||||||||
|
Total contractual cash obligations
|
$ | 41,770 | $ | 4,421 | $ | 13,417 | $ | 10,638 | $ | 13,294 | ||||||||||
|
|
||||||||||||||||||||
|
Other commercial commitments:
|
||||||||||||||||||||
|
Letters of credit
|
$ | 1,566 | $ | 1,566 | ||||||||||||||||
|
|
||||||||||||||||||||
| (1) |
The RP-2000 Mortality tables were used in estimating future benefit payments, and the
health care cost trend rate for determining payments is 9.5% for 2010 and gradually
declines to 5.5% in 2018 where it is assumed to remain constant for the remaining years.
|
15
Table of Contents
16
Table of Contents
| Item 7A. |
Quantitative and Qualitative Disclosures about Market Risk
|
| Item 8. |
Financial Statements and Supplementary Data
|
| Item 9. |
Changes in and Disagreements with Accountants on Accounting and Financial
Disclosure
|
| Item 9A. |
Controls and Procedures
|
| Item 9B. |
Other Information
|
17
Table of Contents
| Item 10. |
Directors, Executive Officers and Corporate Governance
|
| Item 11. |
Executive Compensation
|
| Item 12. |
Security Ownership of Certain Beneficial Owners and Management and Related Stockholder
Matters
|
| Item 13. |
Certain Relationships and Related Transactions, and Director Independence
|
| Item 14. |
Principal Accounting Fees and Services
|
18
Table of Contents
| Item 15. |
Exhibits, Financial Statement Schedules
|
| (a) |
Documents filed as a part of this Report:
|
| (1) |
The following consolidated financial statements are included in this report on Form 10-K:
|
||
|
Report of Independent Registered Public Accounting Firm
|
|||
|
Consolidated Balance Sheets as of December 31, 2009 and 2008
|
|||
|
Consolidated Statements of Income for each of the three years in the period ended December 31, 2009
|
|||
|
Consolidated Statements of Changes in Stockholders’ Equity for each of the three years in the period
ended December 31, 2009
|
|||
|
Consolidated Statements of Cash Flow for each of the three years in the period ended December 31, 2009
|
|||
|
Notes to Consolidated Financial Statements
|
|||
| (2) |
Financial Statement Schedule:
|
||
|
Schedule II — Valuation and Qualifying Accounts for each of the three years in the period ended
December 31, 2009
|
| (b) |
Exhibits:
|
|
|
||||
| 3.1 |
The Restated Certificate of Incorporation of the Registrant (incorporated by reference to Exhibit 3.1
to the Registrant’s Form 10-Q (Commission File No. 0-14938) for the quarter ended July 2, 2005).
|
|||
|
|
||||
| 3.2 |
By-laws of the Registrant as amended (incorporated by reference to Exhibit 3.1 to the Registrant’s
Form 8-K (Commission File No. 0-14938) filed February 3, 2010).
|
|||
|
|
||||
| 4.1 |
The Certificate of Incorporation and By-laws of the Registrant as currently in effect (incorporated
by reference to Exhibits 3.1 and 3.2 hereto).
|
|||
|
|
||||
| 4.2 |
Amended and Restated Note Purchase and Private Shelf Agreement dated as of January 26, 2007, among
the Registrant, The Prudential Insurance Company of America, the other purchasers named therein and
the affiliates of Prudential who became purchasers as defined therein (incorporated by reference to
Exhibit 4.1 to the Registrant’s Form 8-K (Commission File No 0-14938) filed February 1, 2007).
|
|||
|
|
||||
| 4.3 |
Amendment to Amended and Restated Note Purchase and Private Shelf Agreements dated as of October 12,
2007, among the Registrant, The Prudential Insurance Company of America (“Prudential”), Hartford Life
Insurance Company, Medica Health Plans, Pruco Life Insurance Company of New Jersey, Prudential
Retirement Insurance and Annuity Company, Mutual of Omaha Insurance Company. (incorporated by
Reference to Exhibit 4.1 to the Registrant’s Form 10-Q (Commission File No 0-17938) for the quarter
ended September 29, 2007).
|
|||
|
|
||||
| 4.4 |
Second Amendment to Note Purchase and Private Shelf Agreement dated as of December 30, 2008, among
the Registrant, The Prudential Life Insurance Company of America, Pruco Life Insurance Company of New
Jersey, Prudential Retirement Insurance and Annuity Company, Hartford Life Insurance Company, Mutual
of Omaha Insurance Company and Medica Health Plans. (1)
|
|||
|
|
||||
| 4.5 |
Third Amendment to Note Purchase and Private Shelf Agreement dated as of January 23, 2009, among the
Registrant, The Prudential Insurance Company of America, Pruco Life Insurance Company of New Jersey,
Prudential Retirement Insurance and Annuity Company, Hartford Life Insurance Company, Mutual of Omaha
Insurance Company and Medica Health Plans (incorporated by Reference to Exhibit 4.01 to the
Registrant’s Form 8-K (Commission File No. 0-14938) filed January 29, 2009).
|
|||
|
|
||||
| 4.6 |
Fourth Amendment to Note Purchase and Private Shelf Agreement dated as of December 18, 2009, among
the Registrant, The Prudential Insurance Company of America, and other holders of Notes named therein
(incorporated by Reference to Exhibit 9.01 to the Registrant’s Form 8-K (Commission File No. 0-14938)
filed December 22, 2009).
|
| (1) |
Filed Herewith
|
19
Table of Contents
| 10.1 |
Supplemental Retirement Plan of Stanley
Furniture Company, Inc., as restated
effective January 1, 1993 (incorporated by
reference to Exhibit 10.8 to the
Registrant’s Form 10-K (Commission File No.
0-14938) for the year ended December 31,
1993).(2)
|
|||
|
|
||||
| 10.2 |
First Amendment to Supplemental Retirement
Plan of Stanley Furniture Company, Inc.,
effective December 31, 1995, adopted
December 15, 1995 (incorporated by reference
to Exhibit 10.7 to the Registrant’s Form
10-K (Commission File No. 0-14938) for the
year ended December 31, 1995).(2)
|
|||
|
|
||||
| 10.3 |
Stanley Interiors Corporation Deferred
Compensation Capital Enhancement Plan,
effective January 1, 1986, as amended and
restated effective August 1, 1987
(incorporated by reference to Exhibit 10.12
to the Registrant’s Registration Statement
on Form S-1 (Commission File No. 0-14938),
No. 33-7300).(2)
|
|||
|
|
||||
| 10.4 |
Employment Agreement dated as of December
31, 2008, between Douglas I. Payne and the
Registrant (incorporated by reference to
Exhibit 10.1 to the Registrant’s Form 8-K
(Commission File No. 0-14938) filed on
December 10,2008).(2)
|
|||
|
|
||||
| 10.5 |
2000 Incentive Compensation Plan
(incorporated by reference to Exhibit A to
the Registrant’s Proxy Statement (Commission
File No. 0-14938) for the special meeting of
stockholders held on August 24,
2000).(2)
|
|||
|
|
||||
| 10.6 |
Second Amendment to Supplemental Retirement
Plan of Stanley Furniture Company, Inc.
effective January 1, 2002 (incorporated by
reference to Exhibit 10.33 to the
Registrant’s Form 10-K (Commission File No.
0-14938) for the year ended December 31,
2002).(2)
|
|||
|
|
||||
| 10.7 |
2005 Incentive Compensation Award, dated as
of December 15, 2004, from the Registrant to
Douglas I. Payne (incorporated by reference
to Exhibit 10.22 to the Registrant’s Form
10-K (Commission File No. 0-14938) for the
year ended December 31, 2004).(2)
|
|||
|
|
||||
| 10.8 |
Form of Stock Option Award under 2000
Incentive Plan (ISO) (incorporated by
reference to Exhibit 10.23 to the
Registrant’s Form 10-K (Commission File No.
0-14938) for the year ended December 31,
2004).(2)
|
|||
|
|
||||
| 10.9 |
Form of Stock Option Award under 2000
Incentive Plan (ISO/NSO) (incorporated by
reference to Exhibit 10.24 to the
Registrant’s Form 10-K (Commission File No.
0-14938) for the year ended December 31,
2004).(2)
|
|||
|
|
||||
| 10.10 |
Form of Stock Option Award under 2000
Incentive Plan (Directors) (incorporated by
reference to Exhibit 10.25 to the
Registrant’s Form 10-K (Commission File No.
0-14938) for the year ended December 31,
2004).(2)
|
|||
|
|
||||
| 10.11 |
Form of Indemnification Agreement between
the Registrant and each of its Directors
(incorporated by reference to Exhibit 10.1
to the Registrant’s Form 8-K (Commission
File No. 0-14938) filed on September 25,
2008).
|
|||
|
|
||||
| 10.12 |
Voluntary Separation Agreement and General
Release by and between Jeffrey R. Scheffer
and Stanley Furniture Company, Inc. dated
September 23, 2008 (incorporated by
reference to Exhibit 10.2 to the Registrant’s
Form 8-K (Commission File No. 0-14938) filed
on September 25, 2008).
|
|||
|
|
||||
| 10.13 |
Change in Control Protection Agreement,
dated December 11, 2009, by and between
Stanley Furniture Company, Inc. and Glenn
Prillaman (incorporated by reference to
Exhibit 10.1 to the Registrant’s Form 8-K
(commission File No. 0-14938) filed on
December 14, 2009). (2)
|
|||
|
|
||||
| 10.14 |
2008 Incentive Compensation Plan
(incorporated by reference to Exhibit A to
the Registrant’s Proxy Statement (Commission
File No. 0-14938) for the annual meeting of
stockholders held on April 15, 2008).
(2)
|
| (2) |
Management contract or compensatory plan
|
20
Table of Contents
| 10.15 |
Form of Stock Option Award under 2008
Incentive Plan (Officers) (incorporated by
reference to Exhibit 10.21 to the
Registrant’s Form 10-K (Commission File No.
0-14938) for the year ended December 31,
2008). (2)
|
|||
|
|
||||
| 10.16 |
Form of Stock Option Award under 2008
Incentive Plan (Directors) (incorporated by
reference to Exhibit 10.22 to the
Registrant’s Form 10-K (Commission File No.
0-14938) for the year ended December 31,
2008). (2)
|
|||
|
|
||||
| 10.17 |
Form
of Separation Agreement and General Release between Stephen A.
Bullock and the Registrant (incorporated by reference to the
Registrant’s Form 8-K (Commission File No.
0-14938) filed on December 14,
2009). (2)
|
|||
|
|
||||
| 21 |
List of Subsidiaries. (1)
|
|||
|
|
||||
| 23 |
Consent of PricewaterhouseCoopers LLP. (1)
|
|||
|
|
||||
| 31.1 |
Certification by Glenn Prillaman, our Chief
Executive Officer, pursuant to Rule
13a-14(a)/15d-14(a) of the Securities
Exchange Act of 1934, as amended. (1)
|
|||
|
|
||||
| 31.2 |
Certification by Douglas I. Payne, our Chief
Financial Officer, pursuant to Rule
13a-14(a)/15d-14(a) of the Securities
Exchange Act of 1934, as amended. (1)
|
|||
|
|
||||
| 32.1 |
Certification by Glenn Prillaman, our Chief
Executive Officer, pursuant to 18 U.S.C.
Section 1350, as adopted pursuant to Section
906 of the Sarbanes-Oxley Act of
2002. (1)
|
|||
|
|
||||
| 32.2 |
Certification by Douglas I. Payne, our Chief
Financial Officer, pursuant to 18 U.S.C.
Section 1350, as adopted pursuant to Section
906 of the Sarbanes-Oxley Act of
2002. (1)
|
| (1) |
Filed Herewith
|
|
|
|
||
| (2) |
Management contract or compensatory plan
|
21
Table of Contents
|
STANLEY FURNITURE COMPANY, INC.
|
||||
| February 5, 2010 | By: | /s/ Glenn Prillaman | ||
| Glenn Prillaman | ||||
| President and Chief Executive Officer | ||||
| Signature | Title | Date | ||
|
|
||||
|
/s/ Albert L. Prillaman
|
Chairman and Director | February 5, 2010 | ||
|
(Albert L. Prillaman)
|
||||
|
|
||||
|
/s/ Glenn Prillaman
|
President and Chief Executive Officer | February 5, 2010 | ||
|
(Glenn Prillaman)
|
(Principal Executive Officer) and Director | |||
|
|
||||
|
/s/ Douglas I. Payne
|
Executive Vice President — Finance and | February 5, 2010 | ||
|
(Douglas I. Payne)
|
Administration and Secretary
(Principal Financial and Accounting Officer) |
|||
|
|
||||
|
/s/ Robert G. Culp, III
|
Director | February 5, 2010 | ||
|
(Robert G. Culp, III)
|
||||
|
|
||||
|
/s/ Michael P. Haley
|
Director | February 5, 2010 | ||
|
(Michael P. Haley)
|
||||
|
|
||||
|
/s/ Thomas L. Millner
|
Director | February 5, 2010 | ||
|
(Thomas L. Millner)
|
||||
|
|
||||
|
/s/ T. Scott McIlhenny, Jr.
|
Director | February 5, 2010 | ||
|
(T. Scott McIlhenny, Jr.)
|
22
Table of Contents
ANNUAL REPORT ON FORM 10-K
FOR THE YEAR ENDED DECEMBER 31, 2009
| Consolidated Financial Statements | Page | |||
|
|
||||
| F-2 | ||||
|
|
||||
| F-3 | ||||
|
|
||||
| F-4 | ||||
|
|
||||
| F-5 | ||||
|
|
||||
| F-6 | ||||
|
|
||||
| F-7 | ||||
|
|
||||
|
Financial Statement Schedule
|
||||
|
|
||||
| S-1 | ||||
F-1
Table of Contents
Richmond, Virginia
February 5, 2010
F-2
Table of Contents
| December 31, | ||||||||
| 2009 | 2008 | |||||||
|
ASSETS
|
||||||||
|
Current assets:
|
||||||||
|
Cash
|
$ | 41,827 | $ | 44,013 | ||||
|
Accounts receivable, less allowances of $1,747 and $1,644
|
15,297 | 21,873 | ||||||
|
Inventories:
|
||||||||
|
Finished goods
|
22,376 | 36,803 | ||||||
|
Work-in-process
|
8,184 | 3,493 | ||||||
|
Raw materials
|
6,665 | 7,048 | ||||||
|
|
||||||||
|
Total inventories
|
37,225 | 47,344 | ||||||
|
|
||||||||
|
Prepaid expenses and other current assets
|
4,898 | 3,758 | ||||||
|
Income tax receivable
|
6,882 | |||||||
|
Deferred income taxes
|
3,433 | 3,906 | ||||||
|
|
||||||||
|
Total current assets
|
109,562 | 120,894 | ||||||
|
|
||||||||
|
Property, plant and equipment, net
|
31,375 | 35,445 | ||||||
|
Goodwill
|
9,072 | 9,072 | ||||||
|
Other assets
|
453 | 460 | ||||||
|
|
||||||||
|
Total assets
|
$ | 150,462 | $ | 165,871 | ||||
|
|
||||||||
|
|
||||||||
|
LIABILITIES
|
||||||||
|
Current liabilities:
|
||||||||
|
Current maturities of long-term debt
|
$ | 1,429 | $ | 1,429 | ||||
|
Accounts payable
|
11,633 | 11,236 | ||||||
|
Accrued salaries, wages and benefits
|
6,597 | 6,280 | ||||||
|
Other accrued expenses
|
2,626 | 4,890 | ||||||
|
|
||||||||
|
Total current liabilities
|
22,285 | 23,835 | ||||||
|
|
||||||||
|
Long-term debt, exclusive of current maturities
|
26,428 | 27,857 | ||||||
|
Deferred income taxes
|
2,128 | 2,778 | ||||||
|
Other long-term liabilities
|
6,774 | 8,293 | ||||||
|
|
||||||||
|
Total liabilities
|
57,615 | 62,763 | ||||||
|
|
||||||||
|
|
||||||||
|
Commitments and Contingencies
|
||||||||
|
|
||||||||
|
STOCKHOLDERS’ EQUITY
|
||||||||
|
Common stock, $0.02 par value, 25,000,000 shares authorized,
10,332,179 shares issued and outstanding
|
207 | 207 | ||||||
|
Capital in excess of par value
|
1,897 | 1,058 | ||||||
|
Retained earnings
|
90,852 | 102,603 | ||||||
|
Accumulated other comprehensive loss
|
(109 | ) | (760 | ) | ||||
|
|
||||||||
|
Total stockholders’ equity
|
92,847 | 103,108 | ||||||
|
|
||||||||
|
Total liabilities and stockholders’ equity
|
$ | 150,462 | $ | 165,871 | ||||
|
|
||||||||
of the consolidated financial statements.
F-3
Table of Contents
| For the Years Ended | ||||||||||||
| December 31, | ||||||||||||
| 2009 | 2008 | 2007 | ||||||||||
|
Net sales
|
$ | 160,451 | $ | 226,522 | $ | 282,847 | ||||||
|
|
||||||||||||
|
Cost of sales
|
154,988 | 193,929 | 235,937 | |||||||||
|
|
||||||||||||
|
|
||||||||||||
|
Gross profit
|
5,463 | 32,593 | 46,910 | |||||||||
|
|
||||||||||||
|
Selling, general and administrative expenses
|
30,373 | 36,441 | 39,573 | |||||||||
|
|
||||||||||||
|
Pension plan termination charge
|
(6,605 | ) | ||||||||||
|
|
||||||||||||
|
|
||||||||||||
|
Operating income (loss)
|
(24,910 | ) | (3,848 | ) | 732 | |||||||
|
|
||||||||||||
|
Income from Continued Dumping and Subsidy
Offset Act, net
|
9,340 | 11,485 | 10,429 | |||||||||
|
Other income, net
|
160 | 308 | 265 | |||||||||
|
Interest income
|
45 | 591 | 556 | |||||||||
|
Interest expense
|
3,748 | 3,802 | 3,235 | |||||||||
|
|
||||||||||||
|
|
||||||||||||
|
Income (loss) before income taxes
|
(19,113 | ) | 4,734 | 8,747 | ||||||||
|
|
||||||||||||
|
Income tax (benefit) expense
|
(7,362 | ) | 998 | 2,845 | ||||||||
|
|
||||||||||||
|
|
||||||||||||
|
Net income (loss)
|
$ | (11,751 | ) | $ | 3,736 | $ | 5,902 | |||||
|
|
||||||||||||
|
|
||||||||||||
|
Earnings (loss) per share:
|
||||||||||||
|
|
||||||||||||
|
Basic
|
$ | (1.14 | ) | $ | .36 | $ | .56 | |||||
|
|
||||||||||||
|
Diluted
|
$ | (1.14 | ) | $ | .36 | $ | .55 | |||||
|
|
||||||||||||
|
|
||||||||||||
|
Weighted average shares outstanding:
|
||||||||||||
|
|
||||||||||||
|
Basic
|
10,332 | 10,332 | 10,478 | |||||||||
|
|
||||||||||||
|
Diluted
|
10,332 | 10,332 | 10,677 | |||||||||
|
|
||||||||||||
|
|
||||||||||||
|
Cash dividends declared and paid
per common share
|
$ | $ | .40 | $ | .40 | |||||||
|
|
||||||||||||
of the consolidated financial statements.
F-4
Table of Contents
| Accumulated | ||||||||||||||||||||||||
| Capital in | Other | |||||||||||||||||||||||
| Common Stock | Excess of | Retained | Comprehensive | |||||||||||||||||||||
| Shares | Amount | Par Value | Earnings | Loss | Total | |||||||||||||||||||
|
|
||||||||||||||||||||||||
|
Balance at December 31, 2006
|
10,929 | $ | 219 | $ | 59 | $ | 114,189 | $ | (4,820 | ) | $ | 109,647 | ||||||||||||
|
|
||||||||||||||||||||||||
|
Cumulative effect of adoption of FIN48
|
21 | 21 | ||||||||||||||||||||||
|
|
||||||||||||||||||||||||
|
Adjusted balance, January 1, 2007
|
10,929 | 219 | 59 | 114,210 | (4,820 | ) | 109,668 | |||||||||||||||||
|
|
||||||||||||||||||||||||
|
Net income
|
5,902 | 5,902 | ||||||||||||||||||||||
|
Prior service cost, net of deferred income tax benefit of $1
|
(2 | ) | (2 | ) | ||||||||||||||||||||
|
Actuarial loss, net of deferred income tax
benefit of $136
|
(141 | ) | (141 | ) | ||||||||||||||||||||
|
|
||||||||||||||||||||||||
|
Comprehensive Income
|
5,759 | |||||||||||||||||||||||
|
|
||||||||||||||||||||||||
|
Termination of defined benefit pension
plan, net of deferred income tax benefit
of $2,488
|
4,017 | 4,017 | ||||||||||||||||||||||
|
Exercise of stock options
|
43 | 1 | 531 | 532 | ||||||||||||||||||||
|
Stock-based compensation
|
534 | 534 | ||||||||||||||||||||||
|
Tax benefit on exercise of stock options
|
92 | 92 | ||||||||||||||||||||||
|
Purchase and retirement of stock
|
(640 | ) | (13 | ) | (625 | ) | (12,919 | ) | (13,557 | ) | ||||||||||||||
|
Dividends paid, $0.40 per share
|
(4,194 | ) | (4,194 | ) | ||||||||||||||||||||
|
|
||||||||||||||||||||||||
|
|
||||||||||||||||||||||||
|
Balance at December 31, 2007
|
10,332 | 207 | 591 | 102,999 | (946 | ) | 102,851 | |||||||||||||||||
|
|
||||||||||||||||||||||||
|
Net income
|
3,736 | 3,736 | ||||||||||||||||||||||
|
Prior service cost, net of deferred income
tax benefit of $3
|
(5 | ) | (5 | ) | ||||||||||||||||||||
|
Actuarial gain, net of deferred income tax
expense of $118
|
191 | 191 | ||||||||||||||||||||||
|
|
||||||||||||||||||||||||
|
Comprehensive Income
|
3,922 | |||||||||||||||||||||||
|
|
||||||||||||||||||||||||
|
Stock-based compensation
|
467 | 467 | ||||||||||||||||||||||
|
Dividends paid, $0.40 per share
|
(4,132 | ) | (4,132 | ) | ||||||||||||||||||||
|
|
||||||||||||||||||||||||
|
|
||||||||||||||||||||||||
|
Balance at December 31, 2008
|
10,332 | 207 | 1,058 | 102,603 | (760 | ) | 103,108 | |||||||||||||||||
|
|
||||||||||||||||||||||||
|
Net loss
|
(11,751 | ) | (11,751 | ) | ||||||||||||||||||||
|
Negative plan amendment, net of deferred
income tax benefit of $130
|
209 | 209 | ||||||||||||||||||||||
|
Prior service cost, net of deferred income
tax benefit of $326
|
526 | 526 | ||||||||||||||||||||||
|
Actuarial loss, net of deferred income tax
expense of $138
|
(84 | ) | (84 | ) | ||||||||||||||||||||
|
|
||||||||||||||||||||||||
|
Comprehensive Income
|
(11,100 | ) | ||||||||||||||||||||||
|
|
||||||||||||||||||||||||
|
Stock-based compensation
|
839 | 839 | ||||||||||||||||||||||
|
|
||||||||||||||||||||||||
|
|
||||||||||||||||||||||||
|
Balance at December 31, 2009
|
10,332 | $ | 207 | $ | 1,897 | $ | 90,852 | $ | (109 | ) | $ | 92,847 | ||||||||||||
|
|
||||||||||||||||||||||||
of the consolidated financial statements.
F-5
Table of Contents
| For the Years Ended | ||||||||||||
| December 31, | ||||||||||||
| 2009 | 2008 | 2007 | ||||||||||
|
Cash flows from operating activities:
|
||||||||||||
|
Cash received from customers
|
$ | 168,504 | $ | 230,255 | $ | 289,951 | ||||||
|
Cash paid to suppliers and employees
|
(171,349 | ) | (215,527 | ) | (269,795 | ) | ||||||
|
Cash from Continued Dumping and Subsidy
Offset Act, net
|
7,443 | 10,828 | 9,986 | |||||||||
|
Interest paid
|
(3,664 | ) | (3,111 | ) | (2,359 | ) | ||||||
|
Income taxes paid
|
(2,120 | ) | (4,168 | ) | (4,775 | ) | ||||||
|
|
||||||||||||
|
Net cash (used) provided by operating activities
|
(1,186 | ) | 18,277 | 23,008 | ||||||||
|
|
||||||||||||
|
|
||||||||||||
|
Cash flows from investing activities:
|
||||||||||||
|
Capital expenditures
|
(2,621 | ) | (2,261 | ) | (3,951 | ) | ||||||
|
Proceeds from sale of assets
|
1,303 | |||||||||||
|
Other, net
|
360 | (20 | ) | |||||||||
|
|
||||||||||||
|
Net cash used by investing activities
|
(1,318 | ) | (1,901 | ) | (3,971 | ) | ||||||
|
|
||||||||||||
|
|
||||||||||||
|
Cash flows from financing activities:
|
||||||||||||
|
Proceeds from senior notes
|
25,000 | |||||||||||
|
Purchase and retirement of common stock
|
(13,557 | ) | ||||||||||
|
Repayment of senior notes
|
(1,429 | ) | (1,429 | ) | (2,857 | ) | ||||||
|
Dividends paid
|
(4,132 | ) | (4,194 | ) | ||||||||
|
Proceeds from exercise of stock options
|
532 | |||||||||||
|
Tax benefit from exercise of stock options
|
32 | |||||||||||
|
Proceeds from insurance policy loans
|
1,747 | 1,550 | 1,386 | |||||||||
|
|
||||||||||||
|
Net cash provided (used) by financing activities
|
318 | (4,011 | ) | 6,342 | ||||||||
|
|
||||||||||||
|
|
||||||||||||
|
Net (decrease) increase in cash
|
(2,186 | ) | 12,365 | 25,379 | ||||||||
|
Cash at beginning of year
|
44,013 | 31,648 | 6,269 | |||||||||
|
|
||||||||||||
|
|
||||||||||||
|
Cash at end of year
|
$ | 41,827 | $ | 44,013 | $ | 31,648 | ||||||
|
|
||||||||||||
|
|
||||||||||||
|
Reconciliation of net (loss) income to net cash
(used) provided by operating activities:
|
||||||||||||
|
|
||||||||||||
|
Net (loss) income
|
$ | (11,751 | ) | $ | 3,736 | $ | 5,902 | |||||
|
Adjustments to reconcile net (loss) income to net cash
(used) provided by operating activities:
|
||||||||||||
|
Pension plan termination charge
|
6,605 | |||||||||||
|
Depreciation
|
5,908 | 8,805 | 8,982 | |||||||||
|
Amortization
|
86 | 48 | 72 | |||||||||
|
Inventory write-down
|
2,077 | |||||||||||
|
Deferred income taxes
|
(177 | ) | (2,571 | ) | (4,083 | ) | ||||||
|
Stock-based compensation
|
839 | 467 | 534 | |||||||||
|
Other, net
|
188 | |||||||||||
|
Changes in assets and liabilities:
|
||||||||||||
|
Accounts receivable
|
6,576 | 3,520 | 6,867 | |||||||||
|
Inventories
|
8,042 | 10,742 | 1,278 | |||||||||
|
Prepaid expenses and other current assets
|
(10,435 | ) | (2,041 | ) | (1,142 | ) | ||||||
|
Accounts payable
|
397 | (4,870 | ) | (1,783 | ) | |||||||
|
Accrued salaries, wages and benefits
|
1,580 | (525 | ) | (3,028 | ) | |||||||
|
Other accrued expenses
|
(2,875 | ) | 904 | 2,528 | ||||||||
|
Other assets
|
66 | 103 | 88 | |||||||||
|
Other long-term liabilities
|
(1,519 | ) | (41 | ) | ||||||||
|
|
||||||||||||
|
Net cash (used) provided by operating activities
|
$ | (1,186 | ) | $ | 18,277 | $ | 23,008 | |||||
|
|
||||||||||||
of the consolidated financial statements.
F-6
Table of Contents
F-7
Table of Contents
NOTES TO CONSOLIDATED FINANCIAL STATEMENTS (CONTINUED)
F-8
Table of Contents
NOTES TO CONSOLIDATED FINANCIAL STATEMENTS (CONTINUED)
| Depreciable | ||||||||||||
| lives | (in thousands) | |||||||||||
| (in years) | 2009 | 2008 | ||||||||||
|
Land and buildings
|
20 to 50 | $ | 33,900 | $ | 39,862 | |||||||
|
Machinery and equipment
|
5 to 12 | 63,403 | 65,448 | |||||||||
|
Office furniture and equipment
|
3 to 10 | 1,284 | 1,384 | |||||||||
|
Construction in progress
|
670 | 120 | ||||||||||
|
|
||||||||||||
|
Property, plant and equipment, at cost
|
99,257 | 106,814 | ||||||||||
|
Less accumulated depreciation
|
67,882 | 71,369 | ||||||||||
|
|
||||||||||||
|
Property, plant and equipment, net
|
$ | 31,375 | $ | 35,445 | ||||||||
|
|
||||||||||||
| (in thousands) | ||||||||
|
|
2009 | 2008 | ||||||
|
6.73% Senior notes due through May 3, 2017
|
$ | 25,000 | $ | 25,000 | ||||
|
6.94% Senior notes due through May 3, 2011
|
2,857 | 4,286 | ||||||
|
|
||||||||
|
Total
|
27,857 | 29,286 | ||||||
|
Less current maturities
|
1,429 | 1,429 | ||||||
|
|
||||||||
|
Long-term debt, exclusive of current maturities
|
$ | 26,428 | $ | 27,857 | ||||
|
|
||||||||
F-9
Table of Contents
NOTES TO CONSOLIDATED FINANCIAL STATEMENTS (CONTINUED)
| 2009 | 2008 | 2007 | ||||||||||
|
|
||||||||||||
|
Current:
|
||||||||||||
|
Federal
|
$ | (6,398 | ) | $ | 3,163 | $ | 5,730 | |||||
|
State
|
(329 | ) | 633 | 1,072 | ||||||||
|
|
||||||||||||
|
Total current
|
(6,727 | ) | 3,796 | 6,802 | ||||||||
|
|
||||||||||||
|
Deferred:
|
||||||||||||
|
Federal
|
(569 | ) | (2,432 | ) | (3,439 | ) | ||||||
|
State
|
(66 | ) | (366 | ) | (517 | ) | ||||||
|
|
||||||||||||
|
Total deferred
|
(635 | ) | (2,798 | ) | (3,957 | ) | ||||||
|
|
||||||||||||
|
Income tax expense (benefit)
|
$ | (7,362 | ) | $ | 998 | $ | 2,845 | |||||
|
|
||||||||||||
| 2009 | 2008 | 2007 | ||||||||||
|
|
||||||||||||
|
Federal statutory rate
|
(35.0 | )% | 34.0 | % | 35.0 | % | ||||||
|
State tax, net of federal benefit
|
(1.6 | ) | 3.6 | 4.9 | ||||||||
|
State tax credits and adjustments
|
(.8 | ) | (2.8 | ) | ||||||||
|
Increase in cash surrender value
of life insurance policies
|
(2.8 | ) | (9.6 | ) | (4.7 | ) | ||||||
|
Deduction for qualified domestic
production activities
|
(1.2 | ) | (.8 | ) | ||||||||
|
Tax-exempt interest income
|
(.1 | ) | (3.7 | ) | (1.4 | ) | ||||||
|
Increase to valuation allowance
|
1.5 | |||||||||||
|
Other, net
|
.3 | .8 | (.5 | ) | ||||||||
|
|
||||||||||||
|
Effective income tax rate
|
(38.5 | )% | 21.1 | % | 32.5 | % | ||||||
|
|
||||||||||||
| 2009 | 2008 | |||||||
|
Current deferred tax assets (liabilities):
|
||||||||
|
Accounts receivable
|
$ | 668 | $ | 629 | ||||
|
Employee benefits
|
2,247 | 2,785 | ||||||
|
Other accrued expenses
|
541 | 460 | ||||||
|
Net operating loss carry forward
|
165 | |||||||
|
|
||||||||
|
Gross current deferred tax asset
|
3,621 | 3,874 | ||||||
|
Less valuation allowance
|
188 | |||||||
|
|
||||||||
|
Net current deferred tax asset
|
$ | 3,433 | $ | 3,874 | ||||
|
|
||||||||
|
|
||||||||
|
Noncurrent deferred tax liabilities (assets):
|
||||||||
|
Property, plant and equipment
|
$ | 4,851 | $ | 5,124 | ||||
|
Employee benefits
|
(2,288 | ) | (1,913 | ) | ||||
|
Other noncurrent assets
|
(435 | ) | (433 | ) | ||||
|
|
||||||||
|
Net noncurrent deferred tax liability
|
$ | (2,128 | ) | $ | 2,778 | |||
|
|
||||||||
F-10
Table of Contents
NOTES TO CONSOLIDATED FINANCIAL STATEMENTS (CONTINUED)
| 2009 | 2008 | |||||||
|
Unrecognized tax benefits balance at January 1
|
$ | 940 | $ | 991 | ||||
|
Gross increases for tax positions of prior years
|
39 | |||||||
|
Gross decreases for tax positions of prior years
|
(79 | ) | ||||||
|
Settlements
|
||||||||
|
Lapse of statute of limitations
|
(53 | ) | (90 | ) | ||||
|
|
||||||||
|
Unrecognized tax benefits balance at December 31
|
$ | 808 | $ | 940 | ||||
|
|
||||||||
| 2009 | 2008 | 2007 | ||||||||||
|
Weighted average shares outstanding
for basic calculation
|
10,332 | 10,332 | 10,478 | |||||||||
|
Dilutive effect of stock options
|
199 | |||||||||||
|
|
||||||||||||
|
Weighted average shares outstanding
for diluted calculation
|
10,332 | 10,332 | 10,677 | |||||||||
|
|
||||||||||||
F-11
Table of Contents
NOTES TO CONSOLIDATED FINANCIAL STATEMENTS (CONTINUED)
|
Expected price volatility
|
42.97 | % | ||
|
Risk-free interest rate
|
2.29 | % | ||
|
Weighted average expected life in years
|
5.7 | |||
|
Dividend yield
|
3.0 | % | ||
|
Forfeiture rate
|
15.21 | % |
| Weighted- | ||||||||||||||||
| Average | Aggregate | |||||||||||||||
| Weighted- | Remaining | Intrinsic | ||||||||||||||
| Average | Contractual | Value | ||||||||||||||
| Number | Exercise | Term | (in | |||||||||||||
| of shares | Price | (in years) | thousands) | |||||||||||||
|
Outstanding at December 31, 2006
|
925,403 | $ | 16.64 | 5.8 | ||||||||||||
|
Lapsed
|
(30,000 | ) | 24.04 | |||||||||||||
|
Exercised
|
(42,900 | ) | 12.41 | |||||||||||||
|
Granted
|
187,985 | 11.79 | ||||||||||||||
|
|
||||||||||||||||
|
|
||||||||||||||||
|
Outstanding at December 31, 2007
|
1,040,448 | $ | 15.73 | 4.4 | ||||||||||||
|
Lapsed
|
(374,500 | ) | 15.77 | |||||||||||||
|
Granted
|
535,808 | 9.70 | ||||||||||||||
|
|
||||||||||||||||
|
|
||||||||||||||||
|
Outstanding at December 31, 2008
|
1,201,796 | $ | 13.02 | 8.9 | ||||||||||||
|
Lapsed
|
(243,000 | ) | 9.61 | |||||||||||||
|
Granted
|
681,828 | 8.64 | ||||||||||||||
|
|
||||||||||||||||
|
|
||||||||||||||||
|
Outstanding at December 31, 2009
|
1,640,624 | $ | 11.71 | 6.8 | $ | 1,148 | ||||||||||
|
|
||||||||||||||||
|
|
||||||||||||||||
|
Exercisable at December 31, 2009
|
834,874 | $ | 14.04 | 4.8 | $ | 158 | ||||||||||
|
|
||||||||||||||||
F-12
Table of Contents
NOTES TO CONSOLIDATED FINANCIAL STATEMENTS (CONTINUED)
| 2009 | 2008 | 2007 | ||||||||||
|
Average fair market value of options granted
(per share)
|
$ | 2.74 | $ | 2.32 | $ | 3.25 | ||||||
|
Proceeds from stock options exercised
|
532 | |||||||||||
|
Tax benefits related to stock options exercised
|
92 | |||||||||||
|
Intrinsic value of stock options exercised
|
246 | |||||||||||
| 7. Employee Benefits Plans | ||
| 2009 | 2008 | |||||||
| Supplemental | Supplemental | |||||||
| Plan | Plan | |||||||
|
Change in benefit obligation:
|
||||||||
|
Beginning benefit obligation
|
$ | 1,879 | $ | 1,921 | ||||
|
Interest cost
|
110 | 116 | ||||||
|
Actuarial gain
|
113 | 3 | ||||||
|
Benefits paid
|
(177 | ) | (161 | ) | ||||
|
|
||||||||
|
Ending benefit obligation
|
1,925 | 1,879 | ||||||
|
|
||||||||
|
Change in plan assets:
|
||||||||
|
Beginning fair value of plan assets
|
||||||||
|
Employer contributions
|
177 | 161 | ||||||
|
Benefits paid
|
(177 | ) | (161 | ) | ||||
|
|
||||||||
|
Ending fair value of plan assets
|
||||||||
|
|
||||||||
|
Funded status
|
$ | (1,925 | ) | $ | (1,879 | ) | ||
|
|
||||||||
|
|
||||||||
|
Amount recognized in the
consolidated balance sheet:
|
||||||||
|
Current liabilities
|
$ | (154 | ) | $ | (163 | ) | ||
|
Non current liabilities
|
(1,771 | ) | (1,716 | ) | ||||
|
|
||||||||
|
Total
|
$ | (1,925 | ) | $ | (1,879 | ) | ||
|
|
||||||||
F-13
Table of Contents
NOTES TO CONSOLIDATED FINANCIAL STATEMENTS (CONTINUED)
| 2009 | 2008 | 2007 | ||||||||||
|
Interest cost
|
$ | 110 | $ | 116 | $ | 272 | ||||||
|
Expected return on plan assets
|
(188 | ) | ||||||||||
|
Net amortization and deferral
|
113 | 3 | 219 | |||||||||
|
|
||||||||||||
|
Net cost
|
223 | 119 | 303 | |||||||||
|
Settlement expense
|
6,606 | |||||||||||
|
|
||||||||||||
|
Total expense
|
$ | 223 | $ | 119 | $ | 6,909 | ||||||
|
|
||||||||||||
| 2009 | 2008 | 2007 | ||||||||||
|
Discount rate for funded status
|
5.50 | %(a) | 6.25 | %(a) | 6.20 | %(a) | ||||||
|
Discount rate for pension cost
|
6.25 | % | 6.20 | % | 5.75%/5.00 | %(b) | ||||||
|
Return on assets
|
||||||||||||
| (a) |
Rate relates to the Supplemental Retirement Plan.
|
|
| (b) |
The 5.75% relates to the Supplemental Retirement Plan. The Stanley Retirement Plan
used a discount rate of 5.00%, which is the rate that was used at distribution.
|
| 2009 | 2008 | |||||||
|
Change in benefit obligation:
|
||||||||
|
Beginning benefit obligation
|
$ | 2,908 | $ | 2,954 | ||||
|
Service cost
|
61 | 73 | ||||||
|
Interest cost
|
177 | 172 | ||||||
|
Actuarial loss (gain)
|
179 | (146 | ) | |||||
|
Negative plan amendment
|
(1,254 | ) | ||||||
|
Plan participants’ contributions
|
232 | 199 | ||||||
|
Benefits paid
|
(339 | ) | (344 | ) | ||||
|
|
||||||||
|
Ending benefit obligation
|
1,964 | 2,908 | ||||||
|
|
||||||||
|
Change in plan assets:
|
||||||||
|
Beginning fair value of plan assets
|
||||||||
|
Employer contributions
|
107 | 144 | ||||||
|
Plan participants’ contributions
|
232 | 199 | ||||||
|
Benefits paid
|
(339 | ) | (343 | ) | ||||
|
|
||||||||
|
Ending fair value of plan assets
|
||||||||
|
|
||||||||
|
Funded status
|
$ | (1,964 | ) | $ | (2,908 | ) | ||
|
|
||||||||
F-14
Table of Contents
NOTES TO CONSOLIDATED FINANCIAL STATEMENTS (CONTINUED)
|
Current liabilities
|
$ | 324 | $ | 284 | ||||
|
Non current liabilities
|
1,640 | 2,624 | ||||||
|
|
||||||||
|
Total
|
$ | 1,964 | $ | 2,908 | ||||
|
|
||||||||
| 2009 | 2008 | 2007 | ||||||||||
|
Service cost
|
$ | 61 | $ | 73 | $ | 79 | ||||||
|
Interest cost
|
177 | 172 | 172 | |||||||||
|
Amortization of transition obligation
|
122 | 122 | 122 | |||||||||
|
Amortization of net actuarial loss
|
23 | 33 | 39 | |||||||||
|
Curtailment gain
|
(55 | ) | ||||||||||
|
|
||||||||||||
|
Net periodic postretirement benefit cost
|
$ | 328 | $ | 400 | $ | 412 | ||||||
|
|
||||||||||||
| 2009 | 2008 | 2007 | ||||||||||
|
Discount rate for funded status
|
4.75 | % | 6.25 | % | 6.05 | % | ||||||
|
Discount rate for postretirement benefit cost
|
6.25 | % | 6.05 | % | 5.75 | % | ||||||
|
Health care cost assumed trend rate for next year
|
9.50 | % | 6.00 | % | 8.00 | % | ||||||
|
Rate that the cost trend rate gradually declines to
|
5.50 | % | 5.50 | % | 5.50 | % | ||||||
|
Year that the rate reaches the rate it is assumed to
remain at
|
2018 | 2010 | 2010 | |||||||||
| Other | ||||||||
| Supplemental | Postretirement | |||||||
| Plan | Benefits | |||||||
|
Net loss
|
$ | 321 | $ | 718 | ||||
|
Prior service credit
|
(861 | ) | ||||||
|
|
||||||||
|
Total
|
$ | 321 | $ | (143 | ) | |||
|
|
||||||||
F-15
Table of Contents
NOTES TO CONSOLIDATED FINANCIAL STATEMENTS (CONTINUED)
| Other | ||||||||
| Supplemental | Postretirement | |||||||
| Plan | Benefits | |||||||
|
Net loss
|
$ | 11 | $ | 61 | ||||
|
Prior service credit
|
(154 | ) | ||||||
|
|
||||||||
|
Total
|
$ | 11 | $ | (93 | ) | |||
|
|
||||||||
| 2009 | 2008 | 2007 | ||||||||||
|
Accelerated depreciation and equipment relocation
|
$ | 1,613 | $ | 4,319 | $ | 3,422 | ||||||
|
Severance and other termination cost
|
1,889 | 1,929 | 163 | |||||||||
|
Inventory write-down
|
2,077 | |||||||||||
|
Other cost
|
528 | 1,051 | ||||||||||
|
|
||||||||||||
|
|
||||||||||||
|
Total restructuring and related charges
|
$ | 6,107 | $ | 7,299 | $ | 3,585 | ||||||
|
|
||||||||||||
|
Cost of sales
|
$ | 5,231 | $ | 5,860 | $ | 3,585 | ||||||
|
Selling, general and administrative expenses
|
876 | 1,439 | ||||||||||
|
|
||||||||||||
|
Total restructuring and related charges
|
$ | 6,107 | $ | 7,299 | $ | 3,585 | ||||||
|
|
||||||||||||
F-16
Table of Contents
NOTES TO CONSOLIDATED FINANCIAL STATEMENTS (CONTINUED)
| Severance and other | ||||||||||||
| termination cost | Other cost | Total | ||||||||||
|
Accrual January 1, 2009
|
$ | 1,446 | $ | 1,446 | ||||||||
|
Charges to expense
|
1,889 | $ | 259 | 2,148 | ||||||||
|
Cash Payments
|
(2,265 | ) | (259 | ) | (2,524 | ) | ||||||
|
|
||||||||||||
|
Accrual December 31, 2009
|
$ | 1,070 | $ | 1,070 | ||||||||
|
|
||||||||||||
F-17
Table of Contents
NOTES TO CONSOLIDATED FINANCIAL STATEMENTS (CONTINUED)
| (in thousands, except per share data) | ||||||||||||||||
| 2009 Quarters: | First | Second | Third | Fourth | ||||||||||||
|
Net Sales
|
$ | 39,764 | $ | 42,326 | $ | 38,455 | $ | 39,906 | ||||||||
|
Gross profit
|
4,742 | 3,575 | (601 | ) | (2,253 | ) | ||||||||||
|
Net income (loss)
|
(2,376 | )(1) | (3,023 | ) | (5,073 | )(2) | (1,279 | )(3)(4) | ||||||||
|
Net income (loss) per share:
|
||||||||||||||||
|
Basic
|
$ | (.23 | )(1) | $ | (.29 | ) | $ | (.49 | )(2) | (.12) | (3)(4) | |||||
|
Diluted
|
(.23 | )(1) | (.29 | ) | (.49 | )(2) | (.12) | (3)(4) | ||||||||
|
Dividend paid per share
|
||||||||||||||||
| 2008 Quarters: | First | Second | Third | Fourth | ||||||||||||
|
Net Sales
|
$ | 62,534 | $ | 59,148 | $ | 54,483 | $ | 50,357 | ||||||||
|
Gross profit
|
10,820 | 9,961 | 4,991 | 6,821 | ||||||||||||
|
Net income
(loss)
|
1,049 | (68 | ) | (3,489 | )(5) | 6,246 | (4)(5) | |||||||||
|
Net income
(loss) per share:
|
||||||||||||||||
|
Basic
|
$ | .10 | $ | (.01 | ) | $ | (.33 | )(5) | .60 | (4)(5) | ||||||
|
Diluted
|
.10 | (.01 | ) | (.33 | )(5) | .60 | (4)(5) | |||||||||
|
Dividend paid per share
|
.10 | .10 | .10 | .10 | ||||||||||||
| (1) |
Includes after-tax restructuring and other charges of $99 thousand, or $.01 per share,
for the consolidation of manufacturing operations & other restructuring related charges.
|
|
| (2) |
Includes after-tax restructuring and other charges of $641 thousand, or $.06 per share,
for the consolidation of two warehouses.
|
|
| (3) |
Includes after-tax restructuring and other related charges of $3.0 million, or $.29 per
share, for the consolidation of two warehouses, and other downsizing initiatives
implemented in the fourth quarter of 2009.
|
|
| (4) |
Continued Dumping and Subsidy Offset Act receipts totaled $5.7 million after-tax, or
$.56 per share, and $9.1 million after-tax, or $.88 per share, for 2009 and 2008
respectively.
|
|
| (5) |
Includes after-tax restructuring charge of $2.8 million, or $.27 per share, for the
consolidation of manufacturing operations and other restructuring related charges.
|
F-18
Table of Contents
For each of the Three Years in the Period Ended December 31, 2009
(in thousands)
| Column A | Column B | Column C | Column D | Column E | ||||||||||||
| Charged | ||||||||||||||||
| Balance at | (Credited) | Balance | ||||||||||||||
| Beginning | to Costs & | at End of | ||||||||||||||
| Descriptions | of Period | Expenses | Deductions | Period | ||||||||||||
|
2009
|
||||||||||||||||
|
Doubtful receivables
|
$ | 1,000 | $ | 604 | $ | 444 | (a) | $ | 1,160 | |||||||
|
Discounts, returns,
and allowances
|
644 | (57 | )(b) | 587 | ||||||||||||
|
|
||||||||||||||||
|
|
$ | 1,644 | $ | 547 | $ | 444 | $ | 1,747 | ||||||||
|
|
||||||||||||||||
|
|
||||||||||||||||
|
2008
|
||||||||||||||||
|
Doubtful receivables
|
$ | 825 | $ | 756 | $ | 581 | (a) | $ | 1,000 | |||||||
|
Discounts,
returns, and allowances
|
657 | (13 | )(b) | 644 | ||||||||||||
|
|
||||||||||||||||
|
|
$ | 1,482 | $ | 743 | $ | 581 | $ | 1,644 | ||||||||
|
|
||||||||||||||||
|
|
||||||||||||||||
|
2007
|
||||||||||||||||
|
Doubtful receivables
|
$ | 715 | $ | 480 | $ | 370 | (a) | $ | 825 | |||||||
|
Discounts,
returns, and allowances
|
839 | (182 | )(b) | 657 | ||||||||||||
|
|
||||||||||||||||
|
|
$ | 1,554 | $ | 298 | $ | 370 | $ | 1,482 | ||||||||
|
|
||||||||||||||||
| (a) |
Uncollectible receivables written-off, net of recoveries.
|
|
| (b) |
Represents net decrease in the reserve.
|
S-1