STRATEGIC EDUCATION, INC.
10-Ks and 10-Qs
|
|
|
|
|
|
|
|
|
|
|
|
|
|
|
|
|
|
|
|
|
|
|
|
|
|
|
|
|
|
|
|
|
|
|
|
|
|
|
|
|
|
|
|
|
|
|
|
|
|
|
|
|
|
|
|
UNITED STATES SECURITIES AND EXCHANGE COMMISSION
WASHINGTON, D.C. 20549
FORM 10-K
ANNUAL REPORT PURSUANT TO SECTION 13 OR 15(d) OF
THE SECURITIES EXCHANGE ACT OF 1934
For the fiscal year ended December 31, 2012
Commission file number: 0-21039
STRAYER EDUCATION, INC.
(Exact name of registrant as specified in its charter)
|
MARYLAND
|
52-1975978
|
|
(State or other jurisdiction of
incorporation or organization)
|
(I.R.S. Employer Identification Number)
|
2303 Dulles Station Boulevard, Herndon, VA 20171
(Address of principal executive offices)
REGISTRANT’S TELEPHONE NUMBER INCLUDING AREA CODE: (703) 247-2500
SECURITIES REGISTERED PURSUANT TO SECTION 12(b) OF THE ACT:
|
COMMON STOCK, $.01 PAR VALUE
|
NASDAQ GLOBAL SELECT MARKET
|
|
(Title of class)
|
(Name of each exchange on
which registered)
|
SECURITIES REGISTERED PURSUANT TO SECTION 12(g) OF THE ACT:
NONE
Indicate by check mark if the registrant is a well-known seasoned issuer, as defined in Rule 405 of the Securities
Act:
þ
Yes
¨
No
Indicate by check mark if the registrant is not required to file reports pursuant to Section 13 or Section 15(d) of the
Act:
¨
Yes
þ
No
Indicate by check mark whether the Registrant (1) has filed all reports required to be filed by Section 13 or 15(d) of the Securities Exchange Act of 1934 during the preceding 12 months (or for such shorter period that the Registrant was required to file such reports), and (2) has been subject to such filing requirements for the last 90 days.
þ
Yes
¨
No
Indicate by check mark whether the registrant has submitted electronically and posted on its corporate Website, if any, every Interactive Data File required to be submitted and posted pursuant to Rule 405 of Regulation S-T (§ 229.405 of this chapter) during the preceding 12 months (or for such shorter period that the registrant was required to submit and post such files).
þ
Yes
¨
No
Indicate by check mark if disclosure of delinquent filers pursuant to Item 405 of Regulation S-K (Section 229.405 of this chapter) is not contained herein, and will not be contained, to the best of Registrant’s knowledge, in definitive proxy or information statements incorporated by reference in Part III of this Form 10-K or any amendment to this Form 10-K.
þ
Indicate by check mark whether the registrant is a large accelerated filer, an accelerated filer, a non-accelerated filer, or a smaller reporting company. See the definitions of “large accelerated filer,” “accelerated filer” and “smaller reporting company” in Rule 12b-2 of the Exchange Act. (Check one):
|
þ
Large accelerated filer
|
¨
Accelerated filer
|
¨
Non-accelerated filer
|
¨
Smaller reporting company
|
|
(Do not check if a smaller reporting company)
|
|||
Indicate by check mark whether the Registrant is a shell company (as defined in Rule 12b-2 of the Securities Exchange
Act).
¨
Yes
þ
No
The aggregate market value of the voting and non-voting common stock held by non-affiliates (computed by reference to the price at which the common stock was last sold) as of June 29, 2012, the last business day of the Registrant’s most recently completed second fiscal quarter, was approximately $1.2 billion.
The total number of shares of common stock outstanding as of February 1, 2013 was 11,357,324.
DOCUMENTS INCORPORATED BY REFERENCE
Certain portions of the Registrant’s Definitive Proxy Statement for its 2013 Annual Meeting of Stockholders (which is expected to be filed with the Commission within 120 days after the end of the Registrant’s 2012 fiscal year) are incorporated by reference into Part III of this Report.
STRAYER EDUCATION, INC.
FORM 10-K
INDEX
|
Page
|
||
|
PART I
|
||
|
Item 1
|
Business
|
4
|
|
Item 1A
|
Risk Factors
|
28
|
|
Item 1B
|
Unresolved Staff Comments
|
36
|
|
Item 2
|
Properties
|
36
|
|
Item 3
|
Legal Proceedings
|
36
|
|
Item 4
|
Mine Safety Disclosures
|
36
|
|
PART II
|
||
|
Item 5
|
Market for Registrant’s Common Equity, Related Stockholder Matters and Issuer Purchases of Equity Securities
|
37
|
|
Item 6
|
Selected Financial Data
|
40
|
|
Item 7
|
Management’s Discussion and Analysis of Financial Condition and Results of Operations
|
41
|
|
Item 7A
|
Quantitative and Qualitative Disclosures about Market Risk
|
47
|
|
Item 8
|
Financial Statements and Supplementary Data
|
48
|
|
Item 9
|
Changes in and Disagreements With Accountants on Accounting and Financial Disclosure
|
68
|
|
Item 9A
|
Controls and Procedures
|
68
|
|
Item 9B
|
Other Information
|
69
|
|
PART III
|
||
|
Item 10
|
Directors, Executive Officers and Corporate Governance
|
70
|
|
Item 11
|
Executive Compensation
|
73
|
|
Item 12
|
Security Ownership of Certain Beneficial Owners and Management
|
73
|
|
Item 13
|
Certain Relationships and Related Transactions
|
73
|
|
Item 14
|
Principal Accounting Fees and Services
|
73
|
|
PART IV
|
||
|
Item 15
|
Exhibits and Financial Statement Schedules
|
74
|
|
SIGNATURES
|
75
|
|
2
CAUTIONARY NOTICE REGARDING FORWARD-LOOKING STATEMENTS:
This document and the documents incorporated by reference herein include “forward-looking statements,” within the meaning of Section 27A of the Securities Act of 1933, as amended (the “Securities Act”), and Section 21E of the Securities Exchange Act of 1934, as amended (the “Exchange Act”), including, in particular, the statements about our plans, strategies and prospects under the headings “Management’s Discussion and Analysis of Financial Condition and Results of Operations” and “Business.” We have typically used the words “may,” “will,” “expect,” “believe,” “estimate,” “plan,” “intend” and similar expressions in this document and the documents incorporated by reference herein to identify forward-looking statements. We have based these forward-looking statements on our current views with respect to future events and financial performance. Actual results could differ materially from those projected in the forward-looking statements. These forward-looking statements are subject to many risks, uncertainties and assumptions, including, among other things:
|
|
•
|
student enrollment;
|
|
|
•
|
our continued compliance with Title IV of the Higher Education Act of 1965, as amended (the “Higher Education Act”), and the regulations thereunder, as well as state regulatory requirements and accrediting agency requirements;
|
|
|
•
|
changes in regulation of the U.S. education industry and eligibility of proprietary schools to participate in U.S. federal student financial aid programs;
|
|
|
•
|
risks related to the timing of regulatory approvals;
|
|
|
•
|
competitive factors;
|
|
|
•
|
our ability to continue to implement our online growth strategy;
|
|
|
•
|
risks associated with the opening of new campuses;
|
|
|
•
|
risks associated with the offering of new educational programs and adapting to other program changes;
|
|
|
•
|
risks associated with the acquisition of educational institutions;
|
|
|
•
|
risks associated with the ability of our students to finance their education in a timely manner; and
|
|
|
•
|
general economic and market conditions.
|
You should not put undue reliance on any forward-looking statements. You should understand that many important factors, including those discussed under the headings “Management’s Discussion and Analysis of Financial Condition and Results of Operations” and “Business,” could cause our results to differ materially from those expressed or suggested in any forward-looking statements. Further information about these and other relevant risks and uncertainties may be found in Item 1A (“Risk Factors”) below and elsewhere in this Annual Report on Form 10-K and in our other filings with the Securities and Exchange Commission. We undertake no obligation to update or revise forward-looking statements, except as required by law.
References to “we,” “our” and the “Company” refer to Strayer Education, Inc., together in each case with our consolidated subsidiary unless the context suggests otherwise.
3
|
Item 1.
|
Business
|
Overview
Our company provides post-secondary education services. Our mission is to make higher education achievable for working adults in today’s economy. We work to fulfill this mission by offering a variety of academic programs through our wholly-owned subsidiary Strayer University (the “University”), both in traditional classroom courses and online. Strayer University prides itself on making post-secondary education accessible to working adults who were previously unable to take advantage of higher education opportunities.
Founded in 1892, Strayer University is an institution of higher learning that offers undergraduate and graduate degree programs in business administration, accounting, information technology, education, health services administration, public administration, and criminal justice at 100 physical campuses in Alabama, Arkansas, Delaware, Florida, Georgia, Illinois, Indiana, Kentucky, Louisiana, Maryland, Minnesota, Mississippi, Missouri, New Jersey, North Carolina, Ohio, Pennsylvania, South Carolina, Tennessee, Texas, Utah, Virginia, West Virginia, Wisconsin, and Washington, D.C., and online. Strayer University also offers an executive MBA online through its Jack Welch Management Institute. For the 2012 fall term, we had approximately 52,000 students enrolled in our programs. Strayer University is accredited by the Middle States Commission on Higher Education (“Middle States” or “Middle States Commission”), one of the six regional collegiate accrediting agencies recognized by the U.S. Department of Education (“Department of Education”). As part of its program offering, the University also offers classes online, providing its working adult students more flexibility and convenience. Strayer University, with its online offerings, attracts students from around the country and throughout the world.
Over the last several years, we have grown primarily by expanding geographically with new campuses. Since our initial public offering in 1996, we have grown from eight campuses in one state and Washington, D.C., to 100 campuses in 24 states and Washington, D.C. We open new campuses in the promising areas of those states in which we currently operate physical campuses, as well as ones in contiguous states that exhibit strong demand for adult education in business and information technology programs. We have opened 86 of our campuses since the beginning of 2001. We have also developed a robust online education program. Since receiving regulatory approval to offer our degree programs online in 1997, our online programs have experienced significant growth. In the last five years, approximately 30% of our graduating students took 100% of their classes online.
Since 2001, when a new management team was hired and a new growth strategy adopted, we have made significant investments in new campuses where there is a strong demand for adult education and in information technology infrastructure to support growth in our online programs. As a result of these efforts, between 2000 and 2012 our revenues grew 18% on a compounded annual basis, from $78 million in 2000 to $562 million in 2012. Throughout this time, we continued to invest heavily in our various initiatives to serve working adult students. For more information relating to our revenues, profits and financial condition, please refer to “Management’s Discussion and Analysis of Financial Condition and Results of Operations” and our consolidated financial statements included in this Annual Report on Form 10-K.
Industry Background and Outlook
The market for post-secondary education is large and highly fragmented, and has experienced significant growth. The U.S. Bureau of Labor Statistics has reported that approximately 62 million working adults in the United States do not have more than a high school education and approximately 34 million people have some college experience but no college degree. Although demand has been reduced during the difficult economic times the past few years, we believe that over time the demand for post-secondary education will increase as a result of demographic, economic and social trends, including:
|
|
•
|
increasing demand by employers for professional and skilled workers;
|
|
|
•
|
approximately 9% growth in the number of high school graduates from 2.8 million in 1999-2000 to 3.1 million in 2011-
2012, despite a decline over the past two years;
|
|
|
•
|
the significant and measurable income premium and enhanced employment prospects attributable to post-secondary education; and
|
|
|
•
|
budgetary constraints at traditional colleges and universities.
|
The adult education market is a significant component of the post-secondary education market. We believe that the market for post-secondary adult education should increase as working adults seek additional education to update and improve their skills. In addition, we believe that many working adults will seek degree programs from regionally accredited institutions that provide flexibility to accommodate the fixed schedules and time commitments associated with their professional, family and personal obligations.
According to the National Center for Education Statistics, in 2012 there were 2,968 four-year degree-granting institutions in the United States, including 682 public colleges and universities, 1,553 not-for-profit colleges and universities, and 733 for-profit institutions.
4
Growth in the market for post-secondary education has recently been negatively affected by the downturn in the economy as well as by the uncertainty associated with legislative and regulatory proposals. Controversy about the cost of higher education and the unemployment or under-employment of college graduates due to the difficult economic conditions may also have caused some prospective students to question the value proposition of higher education. According to the National Student Clearinghouse Research Center, college enrollments declined 1.8% in fall 2012. The industry is heavily dependent on continued availability of funding for programs under Title IV of the Higher Education Act (“Title IV programs”) and concerns about potential reductions in such funding also can reduce the level of growth.
Company Strengths
We have a 121-year operating history and a track record of providing practical and convenient education programs for working adults. We believe the following strengths position us to capitalize on the demand for post-secondary education among working adults:
|
|
•
|
Consistent operating history.
We have been in continuous operation since 1892 and have demonstrated an ability to operate consistently and grow profitably.
|
|
|
•
|
Practical and diversified curricula.
We offer core curricula in stable, practical areas of adult education. In order to keep pace with a changing knowledge-based economy, we constantly strive to meet the evolving needs of our working adult students and their employers by regularly refining and updating our existing educational programs. In December 2011, we acquired the Jack Welch Management Institute, an online leadership education program that enables us to offer a differentiated executive MBA degree and executive certificates to students and employees of leading corporations. In addition, we are able to offer programs that are successful in a given region at other locations in our campus network. Strayer University currently offers approximately 90 different degree, diploma and certificate programs, including emphases and concentrations, to its students.
|
|
|
•
|
Focus on working adults pursuing degree programs.
We focus on serving working adults who are pursuing undergraduate and graduate degrees in order to advance their careers and employment opportunities. We believe this is an attractive market within the post-secondary education sector due to the number of adult students enrolling in post-secondary education programs and the highly motivated nature of adult students. We consider adult students to be our primary customers, with the various business and government organizations that provide tuition assistance to their employees as our secondary customers. In addition, we believe that the structure of our curriculum, featuring associate, bachelor’s and graduate-level degree programs, encourages students to continue their education and results in extended periods of student enrollment which positively impacts the visibility and predictability of our future revenues. Approximately 99% of our students were enrolled in degree programs for the 2012 fall term.
|
|
|
•
|
Flexible program offerings.
We maintain flexible quarterly programs that allow working adult students to attend classes and complete coursework on a convenient evening and weekend schedule throughout the calendar year. Our online programs enable students to pursue a degree partially or entirely via the Internet, thereby increasing the convenience, accessibility and flexibility of our educational programs. Approximately 60% of our students enrolled for the 2012 fall term were taking all of their courses online. We believe that these flexible offerings distinguish us from many traditional universities that currently do not effectively address the unique requirements of working adults.
|
|
|
•
|
Attractive and convenient campus locations.
Our campuses are located in growing metropolitan areas, mostly in the Mid-Atlantic and Southern regions where there are large populations of working adults with demographic characteristics similar to those of our typical students. Strayer University’s campuses are attractive and modern, offering conducive learning environments in convenient locations.
|
|
|
•
|
Established brand name and alumni support.
With a 121-year operating history, Strayer University is an established brand name in post-secondary adult education, and our students and graduates work throughout corporate America. Our alumni network fosters additional referral opportunities for students.
|
|
|
•
|
Strong owner-oriented management team.
In connection with our recapitalization in 2001, we developed a new growth strategy and hired a new senior management team to implement this strategy. As described below, under the leadership of Robert S. Silberman, our Chairman and Chief Executive Officer, we embarked on various initiatives to serve the working adult market by expanding our campuses and developing an online learning platform. Our senior officers have made investments in Strayer through outright share purchases, in addition to any compensatory stock awards.
|
Company Strategy
Our goal is to be a leading, nationwide provider of post-secondary education programs that prepare working adults for advancement in their careers and professional lives primarily in the areas of business, accounting and information technology. We have identified the following factors as key to executing our growth strategy:
|
|
•
|
Maintain stable enrollment in our mature markets.
We have a total of 100 campuses in various stages of growth. Our experience has generally been that we enroll an incremental 100-150 students at a campus each year until it reaches an enrollment level of approximately 1,000 students. Once a campus has reached this state of maturity, we hope to maintain stable campus enrollment while increasing revenues with market-based tuition increases.
|
5
|
|
•
|
Open new campuses.
Our goal is to serve demand for post-secondary education nationwide by opening new campuses in states in which we currently operate physical campuses, and in contiguous states that exhibit strong demand for adult education in business and information technology programs. Since our initial public offering in 1996, we have grown from eight campuses in one state and Washington, D.C. to 100 campuses in 24 states and Washington, D.C. We have opened 86 new campuses since the beginning of 2001. These campuses are set forth in the table below:
|
New Campuses Opened
(since the beginning of 2001)
|
2001
|
Baltimore, MD (Owings Mills Campus)
|
|
|
Norfolk, VA (Chesapeake Campus)
|
||
|
Norfolk, VA (Newport News Campus)
|
||
|
2002
|
Charlotte, NC (North Charlotte Campus)
|
|
|
Charlotte, NC (South Charlotte Campus)
|
||
|
Raleigh-Durham, NC (Research Triangle Park Campus)
|
||
|
2003
|
Memphis, TN (Thousand Oaks Campus)
|
|
|
Nashville, TN
|
||
|
Raleigh-Durham, NC (North Raleigh Campus)
|
||
|
Philadelphia, PA (Lower Bucks Campus)
|
||
|
Philadelphia, PA (Delaware County Campus)
|
||
|
2004
|
Greenville, SC
|
|
|
Memphis, TN (Shelby Oaks Campus)
|
||
|
Atlanta, GA (Cobb County Campus)
|
||
|
Atlanta, GA (Chamblee Campus)
|
||
|
Philadelphia, PA (King of Prussia Campus)
|
||
|
2005
|
Tampa, FL (Tampa East Campus)
|
|
|
Tampa, FL (Tampa Westshore Campus)
|
||
|
Greensboro, NC
|
||
|
Columbia, SC
|
||
|
Atlanta, GA (Morrow Campus)
|
||
|
2006
|
Wilmington, DE
|
|
|
Philadelphia, PA (Center City Campus)
|
||
|
Pittsburgh, PA (Penn Center West Campus)
|
||
|
Pittsburgh, PA (Cranberry Woods Campus)
|
||
|
Norfolk, VA (Virginia Beach Campus)
|
||
|
Atlanta, GA (Roswell Campus)
|
||
|
Charleston, SC
|
||
|
Birmingham, AL
|
||
|
2007
|
Louisville, KY
|
|
|
Lexington, KY
|
||
|
Orlando, FL (Maitland Campus)
|
||
|
Orlando, FL (Orlando East Campus)
|
||
|
Atlanta, GA (Douglasville Campus)
|
6
| 2007 |
Cherry Hill, NJ
|
|
|
Willingboro, NJ
|
||
|
Knoxville, TN
|
|
2008
|
Charlotte, NC (Huntersville Campus)
|
|
|
Raleigh, NC (South Raleigh Campus)
|
||
|
Atlanta, GA (Lithonia Campus)
|
||
|
Orlando, FL (Sandlake Campus)
|
||
|
Jacksonville, FL
|
||
|
Palm Beach, FL
|
||
|
Ft. Lauderdale, FL
|
||
|
Ft. Lauderdale, FL (Coral Springs Campus)
|
||
|
Savannah, GA
|
||
|
2009
|
Augusta, GA
|
|
|
Huntsville, AL
|
||
|
Allentown, PA
|
||
|
Charleston, WV
|
||
|
Salt Lake City, UT
|
||
|
Cincinnati, OH (Mason Campus)
|
||
|
Columbus, OH
|
||
|
Cleveland, OH (Fairview Park Campus)
|
||
|
Akron, OH
|
||
|
Florence, KY
|
||
|
Miami, FL (Miramar Campus)
|
||
|
2010
|
Lawrenceville, NJ
|
|
|
Piscataway, NJ
|
||
|
Little Rock, AR
|
||
|
Miami, FL (Doral Campus)
|
||
|
Miami, FL (Brickell Campus)
|
||
|
Austin, TX
|
||
|
New Orleans, LA
|
||
|
Dallas, TX (Plano Campus)
|
||
|
Dallas, TX (Irving Campus)
|
||
|
Jackson, MS
|
||
|
Columbus, GA
|
||
|
Houston, TX (Katy Campus)
|
||
|
Houston, TX (Northwest Campus)
|
||
|
2011
|
Cincinnati, OH
|
|
|
Dayton, OH
|
||
|
Milwaukee, WI
|
||
|
Dallas, TX (Cedar Hill Campus)
|
||
|
Indianapolis, IN
|
||
|
Dallas, TX (North Dallas Campus)
|
||
|
Chicago, IL (Downers Grove Campus)
|
||
|
Chicago, IL (Schaumberg Campus)
|
||
|
2012
|
Minneapolis, MN
|
|
|
Bloomington, MN
|
||
|
Chicago, IL (Aurora Campus)
|
||
|
Chicago, IL (Chicago Campus)
|
||
|
San Antonio, TX
|
||
|
Houston, TX (Stafford Campus)
|
||
|
St. Louis, MO
|
||
|
Kansas City, MO
|
7
Although we do not currently have plans to open new campuses in 2013, we continue to apply to operate in other states generally adjacent to our current footprint and expect to pursue approvals and open campuses in new states as part of our multi-year expansion plan, with the ultimate goal of becoming a nationwide university.
|
|
•
|
Expand Online.
Our online classes are available to students throughout the U.S. and on a global basis. We believe that the added flexibility of both traditional and online courses allows us to better serve our working adult students. Due to the convenience and flexibility of online courses, particularly in the asynchronous format, this medium has rapidly grown in acceptance and is expected to continue to grow. In the last five years, approximately 30% of our graduating students took 100% of their classes online.
|
|
|
•
|
Develop corporate/institutional alliances.
We continue to pursue opportunities in the large corporate/institutional market. Our convenient evening, weekend and online courses provide an attractive solution for the education and training needs of employers and their employees. We currently have employer agreements or billing arrangements of various types with many corporations in a range of industries such as aerospace, defense, commercial banking, food services, specialty retail, telecommunications, as well as various government agencies. We are actively working with prospective corporations and institutions to increase the number of such arrangements and to further develop existing relationships. These relationships, once established, provide an ongoing source of new and continuing students.
|
|
|
•
|
Partner with community colleges.
Strayer currently has approximately 200 community college articulation agreements, including nine statewide compacts, covering over 1,000 colleges and campuses nationally. These agreements allow for credits and degrees earned at partner institutions to be transferable toward a related Strayer University degree. In addition, we have entered into innovative space-sharing arrangements with some community college partners to permit their use of our facilities, free of charge, during daytime hours when their demand is high and our need is low. We encourage first-time students to explore options at community colleges before considering returning to Strayer for their university degrees. Approximately 25% of our total enrollment each term comes from two-year college alliances. These partnerships allow us to leverage our available resources to best serve the needs of our students and our communities.
|
|
|
•
|
Optimize the use of stockholders’ capital.
We compare all uses of our capital (including but not limited to organic growth investments, dividends, share repurchases and acquisitions) in terms of return on our owners’ capital and enhancing shareholder value. In 2012, we repurchased approximately 485,000 shares of our common stock and paid an annual dividend of $4.00 per share. In November 2012, we announced that we do not intend to pay a regular quarterly dividend in 2013. We had $95 million remaining under our share repurchase authorization at December 31, 2012. We periodically evaluate opportunities to acquire other providers of post-secondary education. Currently, we have no commitments with regard to potential acquisitions.
|
8
Strayer University
Curriculum
Strayer University offers business, information technology and professional curricula to equip students with specialized and practical knowledge and skills for careers in business, industry and government. Our Academic School Deans and Program Curriculum Committees regularly review and revise the University’s course offerings to improve the educational programs and respond to competitive changes in job markets. We regularly evaluate new programs and degrees to ensure that we stay current with the needs of our students and their employers.
Strayer University offers programs in the following areas:
| Graduate Programs | Undergraduate Programs | |||
| • |
Master of Business Administration (M.B.A.) Degree
|
• | Bachelor of Science (B.S.) Degree | |
| • |
Jack Welch Executive Master of Business Administration (M.B.A.) Degree
(1)
|
Accounting
|
||
| • |
Master of Education (M.Ed.) Degree
|
Information Systems
|
||
| • |
Master of Health Services Administration (M.H.S.A.) Degree
|
Information Technology
|
||
| • |
Master of Public Administration (M.P.A.) Degree
|
Economics
|
||
| • |
Master of Science (M.S.) Degree
|
Criminal Justice
|
||
|
Information Systems
|
• |
Bachelor of Business Administration (B.B.A.) Degree
|
||
|
Accounting
|
• |
Associate in Arts (A.A.) Degree
|
||
|
Human Resource Management
|
Accounting
|
|||
|
Management
|
Acquisition and Contract Management
|
|||
| • |
Executive Graduate Certificate Program
|
Business Administration
|
||
|
Business Administration
|
Information Systems
|
|||
|
Information Technology
|
||||
|
Economics
|
||||
|
Marketing
|
||||
|
Criminal Justice
|
||||
| • |
Diploma Program
|
|||
|
Acquisition and Contract Management
|
||||
| • |
Undergraduate Certificate Program
|
|||
|
Business Administration
|
||||
|
(1)
|
In December 2011, Strayer University acquired the Jack Welch Management Institute, an online leadership education program that offers a differentiated executive MBA degree and executive certificates.
|
Each undergraduate degree program includes courses in oral and written communication skills as well as mathematics and various disciplines in the humanities and social sciences. In addition to our degree, diploma and certificate programs, we offer classes to non-degree and non-program students wishing to take courses for personal or professional enrichment.
Although all of our programs are generally offered at each campus, the University adapts its course offerings to the demands of the student population at each location. Strayer University students may enroll in courses at more than one campus and take courses online.
Strayer University structures its curricula to allow students to advance sequentially from one learning level to another by applying credits earned in one program toward attainment of a more advanced degree. For example, a student originally pursuing an associate degree in information systems can extend his or her original educational objective by taking additional courses leading to a bachelor’s degree in information systems, and ultimately a master’s degree in information systems. This curriculum design provides students a level of competency and a measure of attainment in the event they interrupt their education or choose to work in their field of concentration prior to obtaining their final degree.
Online
In August 1997, the University began offering classes online. Students may take classes online using either a synchronous (“real time”) or asynchronous (“on demand”) format. The asynchronous format was first introduced by the University in the summer 2001 quarter and has grown significantly due to increasing demand. Currently, almost all students taking classes online choose the asynchronous format. Students may take all of their courses online or may take online courses in combination with traditional, classroom-based courses. A student taking classes online has the same admission and financial aid requirements, is subject to the same policies and procedures and receives the same student services and support as campus-based Strayer University students. Tuition for online courses is the same as for campus courses.
9
Faculty
The University appoints faculty who hold appropriate academic credentials, are dedicated, active professionals in their field and are enthusiastic and committed to teaching working adults. In accordance with our educational mission, the University faculty focuses its efforts on teaching. The normal course load for a full-time faculty member is four courses per quarter for each of three quarters, or 12 courses per academic year. In addition, the University requires full-time faculty members to provide eight hours per week of student academic counseling and other student support services. Further, many full-time faculty members participate actively in the life of the University through service on curricular and assessment committees.
We provide financial support for faculty members seeking to enhance their skills and knowledge. The University maintains a tuition plan that typically reimburses full-time faculty and deans pursuing doctorate degrees for part of their program’s tuition at other institutions. Full-time faculty (and all other employees) receive a 90% discount for all Strayer University courses. The University also conducts annual in-house faculty workshops in each discipline. We believe that our dedicated and capable faculty is one of the keys to our success.
Organization of Strayer University
Overall academic and business decisions of the University, including review and approval of the annual financial budget, are directed by its Board of Trustees. The Board of Trustees consists of Dr. Charlotte F. Beason, Chairwoman of the Board of Trustees, and currently eight other members. The University By-Laws prescribe that a majority of members be independent from the University and Strayer Education, Inc. to assure independent oversight of all academic programs and services. The current Board of Trustees members are listed below:
Board of Trustees
|
Dr. Charlotte F. Beason
|
Dr. Beason is the Chairwoman of the Board of Trustees. She has served as a member of the Board of Trustees since 1996. She has extensive experience in education, distance learning, and the accreditation of education programs. (See Item 10 below for additional biographical information.)
|
|
Mr. Roland Carey*
|
Mr. Carey has served as a member of the Board of Trustees since 1990. He served for 23 years as a U.S. Army Officer in the specialties of Air Defense Missile Evaluation and Military Education. He retired in 1986 as a Lieutenant Colonel. Mr. Carey served 12 years as a mathematics instructor and as an Intervention Program Coordinator with Fairfax County Public Schools. Additionally, he has served on two other organizational management and supervisory boards. Mr. Carey holds a bachelor’s degree in mathematics from Florida A&M University and a master’s degree in educational leadership from George Mason University.
|
|
Dr. Jonathan Gueverra*
|
Dr. Gueverra was elected to the Board of Trustees in 2012. He now serves as the President and Chief Executive Officer of Florida Keys Community College. Prior to this appointment, he was the founding Chief Executive Officer of the Community College of the District of Columbia, the first community college in Washington, DC. With over 20 years of higher education experience, Dr. Gueverra has served in a variety of administrative and faculty positions in two-year and four-year colleges and universities along the nation’s east coast. He is a member of the board of the American Association for Community Colleges and chairs the Commission on Academic Student and Community Development. Dr. Gueverra holds a bachelor’s degree from Providence College, and a master’s degree in business administration and a doctorate in education both from the University of Massachusetts.
|
|
Mr. Karl McDonnell
|
Mr. McDonnell was elected to the Board of Trustees in 2007. Mr. McDonnell joined Strayer Education, Inc. in July 2006 as President and Chief Operating Officer. (See Item 10 below for additional biographical information.)
|
|
Mr. Todd A. Milano
|
Mr. Milano has served as a member of the Board of Trustees since 1992 and has more than 30 years of experience in post-secondary education. He is President Emeritus and Ambassador for Central Penn College, where he has devoted his entire professional career, having served as President and Chief Executive Officer from 1989 to 2012. (See Item 10 below for additional biographical information.)
|
|
Dr. Michael Plater
|
Dr. Michael Plater was elected to the Board of Trustees in 2012 as an ex officio member. He has served as Strayer University President since 2011. Dr. Plater joined Strayer in 2010 as the Provost and Chief Academic Officer. Prior to joining Strayer, Dr. Plater had a distinguished career with various other academic institutions. (See Item 10 below for additional biographical information.)
|
10
|
Dr. William C. Reha, MD*
|
Dr. Reha has served as a member of the Board of Trustees since 2007. He is a Board Certified Urologic Surgeon in Woodbridge, Virginia. He also serves as Speaker of The House for the Medical Society of Virginia and President of the Virginia Urological Society. Dr. Reha is active in Strayer University alumni affairs and is the 2005 Outstanding Alumni Award winner. Dr. Reha has served as president of the Prince William County Medical Society and the Potomac Hospital Medical Staff and is a Fellow of the Claude Moore Physician Leadership Institute. He holds a bachelor’s degree in biochemistry from Binghamton University, an M.D. from New York Medical College, and a master’s in business administration from Strayer University. He completed his residency in Surgery/Urology at Georgetown University.
|
|
Dr. Peter D. Salins*
|
Dr. Salins has served as a member of the Board of Trustees since 2002. Having served as Provost and Vice Chancellor for Academic Affairs of the State University of New York (SUNY) system from 1997 to 2006, he is currently University Professor of Political Science at SUNY’s Stony Brook University and Director of its graduate program in public policy. Dr. Salins is a member of the Advisory Board of the Syracuse University School of Architecture and the Editorial Board of the Journal of the American Planning Association, and is a Director of the Citizens Housing and Planning Council of New York. Dr. Salins holds a bachelor’s degree in architecture, a master’s degree in regional planning and a doctorate in metropolitan studies and regional planning, all from Syracuse University.
|
|
Dr. J. Chris Toe*
|
Dr. Toe has served as a member of the Board of Trustees since 2003. He served as President of Strayer University from 2003 to April 2006 and as Minister of Agriculture of the Republic of Liberia from 2006 to 2009. Dr. Toe now serves as Chairman of the APEX Group, a consulting, trading and investment company based in Liberia. Dr. Toe holds a bachelor’s degree in economics from the University of Liberia, and a master’s degree in agricultural economics and a doctorate in economics, both from Texas Tech University.
|
|
*
|
Independent member.
|
Within the academic, strategic and financial parameters set by the Board of Trustees, the University is managed on a daily basis by the University President. The President is charged with the responsibility of overseeing the implementation of the policies established by the Board of Trustees and is supported in this function by senior administrative officers, including the Provost and Chief Academic Officer. The majority of the University’s operations are centralized within the President’s Office or the University’s senior administrative staff offices, such as faculty development, curriculum development, institutional research and assessment, library administration, student records, student affairs, accounting and auditing, human resources, operations, marketing, public relations, facilities, information technology, and regulatory compliance, including oversight of the University’s participation in federal student financial aid programs.
Within this centralized structure is a division of responsibilities into two broad categories: academics and administrative operations. For the academic functions, the President is supported by the Provost, the Senior Vice Provost of Student Affairs, and five Senior Vice Provosts for Academics, who are responsible for academic operations on a regional and local level. Also reporting to the President are the Senior Vice Provost of Academic Talent Acquisition and Development and the Director of College Relations. The Provost is supported by the Senior Vice Provost of Faculty Affairs, the Vice President of Academic Technology and Curriculum, the Vice President of Academic Operations, the Deans of each School as well as by the University Registrar and the Dean of Institutional Research, Assessment and Evaluation.
For administrative operations, the President and Provost work closely with the Senior Vice Presidents for Operations, who are responsible for ensuring that regional, campus and online operations meet the annual University budget established by the Board of Trustees; as well as with the Senior Vice Provosts for Academics. Other senior administrative officers also support the President in areas such as legal compliance, accounting and auditing, computer technology, insurance and human resources.
University Senior Management
Dr. Michael A. Plater is University President. His biographical information is set forth in Item 10 below. At the campus level, the academic functions are overseen by a Campus Dean and day-to-day business operations are managed by a Campus Director. Each campus is staffed with personnel performing instructional, academic advising, financial aid, student services, admissions and career development functions. A Learning Resource Center at each campus supports the University’s instructional programs. Each Learning Resource Center contains a library and computer laboratories and is operated by a full-time manager and support staff who assist students in the use of research resources.
Strayer Education, Inc. Executive Officers
For a description of Strayer Education, Inc.’s senior management, see the biographical information set forth in Item 10 below.
11
Outreach
To identify potential students, we engage in a broad range of activities to inform working adults and their employers about the programs offered at Strayer University. These activities include direct mail, online marketing, marketing to our existing students and graduates, print and broadcast advertising, student referrals, and corporate and government outreach activities. Direct response methods (direct mail and online advertising) are used to generate inquiries from potential students. Strayer University maintains booths and information tables at appropriate conferences and expos, as well as at transfer days at community colleges. We also depend on the recommendation of our alumni network to maintain and enhance Strayer University’s reputation and promote its quality education. Our business-to-business outreach efforts include personal telephone calls, distribution of information through corporate intranets and human resource departments, and on-site information meetings. We record inquiries in our database and track them through to application and registration. Additionally, we provide information about new programs and new locations to students and alumni to encourage them to return for further education.
Student Profile
The majority of Strayer University students are working adults completing their first college degree to improve their job skills and advance their careers. Of the students enrolled in Strayer University’s programs at the beginning of the 2012 fall quarter, approximately 66% were age 31 or older and approximately 86% were engaged in part-time study (fewer than three courses each quarter). In the 2012 fall quarter, our students registered for an average of eight course credits (about two classes per student).
Strayer University has a very diverse student population. At the beginning of the 2012 fall quarter, approximately 75% of students reporting ethnicity were minorities and approximately 64% of students were women. Approximately 1% of the University’s students were international, and approximately 1% were active duty military personnel. Strayer University prides itself on making post-secondary education accessible to working adults who were previously unable to take advantage of educational opportunities.
The following is a breakdown of our students by program level as of the 2012 fall term:
|
Program
|
Number of
students
|
Percentage of
total students
|
||||||
|
Bachelor’s
|
27,902 | 54 | % | |||||
|
Master’s
|
16,297 | 32 | % | |||||
|
Associate
|
6,783 | 13 | % | |||||
|
Total Degree
|
50,982 | 99 | % | |||||
|
Diploma
|
47 | * | ||||||
|
Undergraduate Certificate
|
50 | * | ||||||
|
Graduate Certificate
|
238 | * | ||||||
|
Undeclared
|
410 | * | ||||||
|
Total Non-Degree
|
745 | 1 | % | |||||
|
Total Students
|
51,727 | 100 | % | |||||
|
*
|
Represents less than 1%.
|
Our business is seasonal and as a result, our quarterly results of operations tend to vary within the year due to student enrollment patterns. Enrollment generally is highest in the fourth quarter, or fall term, and lowest in the third quarter, or summer term.
Student Admissions
Students attending Strayer University’s undergraduate programs must possess a high school diploma or a General Educational Development (GED) Certificate. Students attending Strayer University’s graduate programs must have a bachelor’s degree from an accredited institution and meet certain other requirements. If a student’s undergraduate major varies widely from the student’s proposed graduate course of study, certain undergraduate prerequisite courses may also be necessary for admission. To maximize undergraduate students’ chances for academic success and to ensure they receive the support they need, Strayer University evaluates incoming student’s proficiency in fundamental English and math prior to the first quarter’s registration.
International students applying for admission must meet the same admission requirements as other students. Those students whose native language is not English must provide evidence that they are able to use the English language with sufficient facility to perform college-level work in an English-speaking institution.
Tuition and Fees
Strayer University charges tuition by the course. Tuition rates may vary in states with specific regulations governing tuition costs. Each course is 4.5 credit hours. As of January 1, 2013, undergraduate full-time students are charged $1,700 per course. Undergraduate part-time students are charged $1,775 per course. Students in graduate programs are charged at the rate of $2,325 per course, except for Jack Welch Management Institute students who pay $2,580 per course. Accordingly, a full-time student seeking to obtain a bachelor’s degree in four years currently would pay approximately $17,000 per year in tuition. Strayer University implemented a tuition price increase of approximately 3% per course effective January 1, 2013, which is reflected in the above tuition rates. Under a variety of different programs, Strayer University offers scholarships and tuition discounts to students and in connection with various corporate and government sponsorship and tuition reimbursement arrangements.
12
Career Development Services
Although most of Strayer University’s students are already employed, the University actively assists its students and alumni with career-related matters. The focus for Career Services at Strayer University is to provide career guidance and resources to assist students and alumni in reaching their educational and professional goals. Services are delivered through various media including online, in person, recorded video, books, periodicals, and by telephone. The services provided include career webinars, recorded seminars, career teleconferences, career advising and resume review.
We regularly conduct alumni surveys to monitor the career progression of our graduates and to support outcome assessment efforts required by Middle States and state regulators.
Employees
As of December 31, 2012, we had 2,019 full-time employees including 419 full-time faculty members. Full-time faculty members teach on average 4-5 courses per quarter. The remainder of the classes are taught by adjunct faculty who normally teach 1-2 courses per quarter. Although we had approximately 2,200 adjunct faculty, not all of them teach every quarter. In the 2012 fall quarter, approximately 30% of our courses were taught by full-time faculty. We also employed 1,733 non-faculty staff in information systems, financial aid, recruitment and admissions, student administration, marketing and human resources, corporate accounting and other administrative functions. Of our non-faculty staff, 1,600 were employed full-time and 133 were employed part-time. Because we are not a research university, all faculty are expected to spend their time teaching and advising students.
Intellectual Property
In the ordinary course of business, we develop many kinds of intellectual property that are or will be the subject of copyright, trademark, service mark, patent, trade secret or other protections. Such intellectual property includes, but is not limited to, our courseware materials for classes taught online or other distance-learning means and business know-how and internal processes and procedures developed to respond to the requirements of its operations and various education regulatory agencies. We also claim rights to the mark “STRAYER” for educational services and have obtained federal registration of the mark.
Competition
The higher education industry is highly competitive, but with no single participant possessing a significant market share. We compete for students with traditional public and private two-year and four-year degree-granting accredited colleges and universities, other proprietary degree-granting accredited schools and also alternatives to higher education. In addition, we face competition from various nontraditional, credit-bearing and noncredit-bearing education programs, provided by both proprietary and not-for-profit providers, including massive open online courses offered worldwide without charge by traditional educational institutions and other direct-to-consumer education services. As the proportion of traditional colleges providing alternative learning modalities increases, we will face increasing competition for students from traditional colleges, including colleges with well-established reputations for excellence. As the online and distance learning segment of the postsecondary education market matures, we believe that the intensity of the competition we face will continue to increase.
We believe the key factors affecting our competitive position include the quality of the programs offered, the quality of other services provided to students, our reputation among students and in the marketplace in general, the cost and perceived value of our offerings, the employment rate and terms of employment for our graduates, the ease of access to our offerings, the quality and reputation of our faculty and other employees, the time commitment required to complete our program and obtain a degree, the quality and size of our alumni and our relationship with other learning institutions.
Regulation
Regulatory Environment
As an institution of higher education accredited by Middle States and operating in multiple jurisdictions, Strayer University is subject to accreditation rules and varying state licensing and regulatory requirements. In addition, the federal Higher Education Act and the regulations promulgated thereunder require all higher education institutions that participate in the various Title IV programs, including Strayer University, both to comply with detailed substantive and reporting requirements and to undergo periodic regulatory scrutiny. The Higher Education Act mandates specific regulatory responsibility for each of the following components of the higher education regulatory triad: (1) the institutional accrediting agencies recognized by the U.S. Secretary of Education (“Secretary of Education”); (2) state education regulatory bodies; and (3) the federal government through the Department of Education. The regulations, standards and policies of these regulatory agencies are subject to frequent change.
13
Accreditation
Strayer University has been institutionally accredited since 1981 by Middle States, a regional accrediting agency recognized by the Secretary of Education. Strayer University’s current period of accreditation by Middle States extends through 2017. Accreditation is a system for recognizing educational institutions and their programs for integrity, educational quality, faculty, physical resources, administrative capability and financial stability that signifies that they merit the confidence of the educational community and the public. In the United States, this recognition comes primarily through private voluntary associations of institutions and programs of higher education. These associations establish criteria for accreditation, conduct peer-review evaluations of institutions and programs, and publicly designate those institutions that meet their standards. Accredited schools are subject to periodic review by accrediting bodies to determine whether such schools maintain the performance, integrity and quality required for accreditation.
Middle States accredits degree-granting public and private colleges and universities in its region (including Delaware, Washington, D.C., Maryland, New Jersey, New York, Pennsylvania, Puerto Rico and U.S. Virgin Islands), including distance education programs offered by those institutions. Accreditation by Middle States is an important attribute of Strayer University. Colleges and universities depend on accreditation in evaluating transfers of credit and applications to graduate schools. Employers rely on the accreditation status of institutions when evaluating a candidate’s credentials or considering tuition reimbursement programs. Students rely on accreditation status for assurance that an institution maintains quality educational standards.
In order for institutions to be eligible to participate in federal student financial assistance programs, they must be accredited by an institutional accreditor recognized by the Department of Education. The Higher Education Act charges the National Advisory Committee on Institutional Quality and Integrity (NACIQI) with recommending to the Secretary of Education which accrediting or state approval agencies should be recognized as reliable authorities for judging the quality of post-secondary institutions and programs. NACIQI in December 2012 renewed its recognition of Middle States, which will submit a follow up staff report within a year.
As with all its regulatory relationships, Strayer University strives to maintain close contact with, and to provide frequent status updates to, Middle States regarding matters pertinent to accrediting standards and policies. This regular contact keeps Middle States informed of the University’s planned activities and aims to ensure that the University’s performance continues to meet Middle States’ expectations. To this end, Strayer University is committed to evaluating periodically its own performance, submitting reports to Middle States and making any necessary improvements to continue meeting Middle States’ accreditation standards as the University grows and expands geographically. If an institution’s performance were ever not to meet its accrediting agency’s (or other regulator’s) expectations or applicable standards, then its operations could be conditioned, severely constrained or even curtailed, depending on the severity of the non-compliance. Accordingly, Strayer University endeavors proactively to keep Middle States (and all of its other regulators) fully informed and satisfied with its performance and strives to maintain good regulatory relationships as a key University priority.
In 2006, Strayer University completed a comprehensive self-study report, which was submitted to Middle States in support of Strayer University’s request for early reaffirmation of accreditation prior to Middle States’ next scheduled accreditation review in 2011. Our objective is to provide a high quality post-secondary education to working adult students, and participation in academic peer review processes is an important way to help us meet that objective. Middle States reviewed Strayer University’s report and on June 28, 2007, reaffirmed Strayer University’s accreditation for 10 years through 2017. In accordance with Middle States’ accreditation standards, every accredited institution must file a periodic review report at the mid-point between its decennial evaluations. Strayer University filed its periodic review report on May 15, 2012, demonstrating that the institution continues to meet Middle States’ standards. At its regular meeting on November 15, 2012, Middle States accepted the Periodic Review Report and reaffirmed Strayer University’s accreditation. Strayer University’s next progress report is due to Middle States by October 1, 2013, and the next evaluation visit is scheduled for 2016-2017. All of Strayer University’s new campus locations and other substantive changes require prior Middle States approval.
In 2000, the agencies that accredit higher education institutions in various regions of the United States adopted a Policy Statement on Evaluation of Institutions Operating Interregionally. Under that policy, both the home regional accreditor and the host regional accreditor cooperate to evaluate an institution that delivers education at a physical site in the host accreditor’s region. Although the home region is solely responsible for final accreditation actions, as we open campuses in regions outside Middle States’ region, the host regional accreditors may elect to participate in the accreditation process of such expansion operations.
State Education Licensure
Licensure of Physical Campuses
Strayer University is required by the federal Higher Education Act and certain state laws to be legally authorized to provide educational programs in the states in which the University is physically located. We are authorized to offer our programs by the applicable educational regulatory agencies in all states where our physical campuses and online delivery facilities are located. We are dependent upon the authorization of each state where we are physically located to allow us to operate and to grant degrees, diplomas or certificates to students in those states. We are subject to extensive regulation in each jurisdiction in which our campuses are located, including: Alabama, Arkansas, Delaware, Florida, Georgia, Illinois, Indiana, Kentucky, Louisiana, Maryland, Minnesota, Missouri, Mississippi, New Jersey, North Carolina, Ohio, Pennsylvania, South Carolina, Tennessee, Texas, Utah, Virginia, West Virginia, Wisconsin and Washington, D.C. We will be subject to similar extensive regulation in those additional states in which we may expand our operations in the future. State laws and regulations affect our operations and may limit our ability to introduce educational programs or establish new campuses.
14
On October 29, 2010, the Department of Education adopted new regulations, effective July 1, 2011, regarding state authorization that set new requirements for state authorization for purposes of Title IV eligibility. Every state above in which Strayer is authorized has processes in place that comply with these new requirements.
Licensure of Online Programs
The increasing popularity and use of the Internet and other technology for the delivery of education has led and may lead to the adoption of new laws and regulatory practices in the United States or foreign countries or to interpretation of existing laws and regulations to apply to such services. These new laws and interpretations may relate to issues such as the requirement that online education institutions be licensed as a school in one or more jurisdictions even where they have no physical location. New laws, regulations, or interpretations related to doing business over the Internet could increase Strayer University’s cost of doing business, affect its ability to increase enrollments and revenues, or otherwise have a material adverse effect on our business.
On October 29, 2010, the Department of Education adopted new regulations, effective July 1, 2011, regarding state authorization of online programs. The revised rules specified that an institution offering distance post-secondary education must meet any state requirements for it to be legally offering post-secondary distance or correspondence education in that state. On May 6, 2011, the Department of Education issued a Dear Colleague Letter interpreting this new regulation, stating that it “will not initiate any action to establish repayment liabilities or limit student eligibility for distance education activities undertaken by an institution before July 1, 2014, so long as the institution is making good faith efforts to identify and obtain necessary State authorizations before that date.” On July 12, 2011, the U.S. District Court for the District of Columbia vacated the regulation relating to state authorization for distance education, holding that the Department of Education did not provide proper notice of the proposed changes as required by the Administrative Procedure Act. On September 8, 2011, the Department of Education filed an appeal of the U.S. District Court’s ruling with the U.S. Court of Appeals for the District of Columbia Circuit. On June 5, 2012, the Court of Appeals upheld the lower court’s ruling vacating the state authorization of online programs requirement.
On July 27, 2012, the Department of Education issued a Dear Colleague Letter cautioning education institutions to remain in compliance with all applicable state laws and regulations related to distance education. The Department of Education has not announced its next steps, but it may engage in the future in a negotiated rulemaking to address distance education and state authorization.
Department of Education
To be eligible to participate in Title IV programs, Strayer University must comply with specific standards and procedures set forth in the Higher Education Act and the regulations issued thereunder by the Department of Education. An institution must, among other things, be authorized to offer its educational programs by each state in which it is physically located and maintain institutional accreditation by a recognized accrediting agency as discussed above. The institution also must be certified by the Department of Education to participate in Title IV programs and follow Department of Education rules regarding the awarding and processing of funds issued under the Title IV programs. For purposes of the Title IV programs, Strayer University and all of its campuses are considered to be a single institution of higher education, such that Department of Education requirements applicable to an institution of higher education are generally applied to all of Strayer University’s campuses in the aggregate rather than on an individual basis. On January 20, 2012, Strayer University executed a provisional Program Participation Agreement with the Department of Education allowing it to participate in Title IV programs until September 30, 2014.
Other Approvals
Strayer University is approved by appropriate authorities for the education of veterans and members of the selective reserve and their dependents, as well as for the rehabilitation of veterans. In addition, Strayer University is authorized by the U.S. Department of Homeland Security to admit foreign students for study in the United States subject to applicable requirements. The U.S. Department of Homeland Security, working with the U.S. Department of State, has implemented a mandatory electronic reporting system for schools that enroll foreign students and exchange visitors. The University is also authorized to participate in state financial aid programs in Pennsylvania, Florida and Vermont.
Financing Student Education
Students finance their Strayer University education in a variety of ways, and historically about three quarters of our students participated in one or more Title IV programs. Many financial aid programs are designed to assist eligible students whose financial resources are inadequate to meet the cost of education. With these programs, financial aid is awarded on the basis of financial need, generally defined under the Higher Education Act as the difference between the cost of attending a program of study and the amount a student reasonably can be expected to contribute to those expenses. All recipients of federal student financial aid must maintain a satisfactory grade point average and progress in a timely manner toward completion of a program of study.
15
In addition, many of our working adult students finance their own education or receive full or partial tuition reimbursement from their employers. Congress has enacted several tax credits for students pursuing higher education and has provided for a tax deduction for interest on student loans and exclusions from income of certain tuition reimbursement amounts. Eligible students at Strayer University may also participate in educational assistance programs administered by the Commonwealth of Pennsylvania, the State of Florida, State of Vermont, private organizations, the U.S. Department of Veterans Affairs, and the U.S. Department of Defense (“DOD”).
Congress recently expanded education benefits available to veterans who have served on active duty since September 11, 2001. Under the relevant law, known as the Post-9/11 Veterans Educational Assistance Act of 2009 (as amended August 1, 2011), sometimes referred to as the “New GI Bill,” eligible veterans may receive, among other benefits, tuition benefits up to the net cost to the student (after accounting for state and federal aid, scholarships, institutional aid, fee waivers, and similar assistance), subject to a cap of $17,500 for non-public domestic institutions. In addition, eligible students pursuing an educational program solely through distance learning are eligible to receive a housing stipend, equal to half the amount available to students attending classroom-based programs or programs that combine classroom learning and distance learning.
DOD promulgated regulations, published December 7, 2012 and effective January 7, 2013, that require all institutions participating in DOD military tuition assistance programs to sign a Memorandum of Understanding, or MOU, by March 1, 2013.
Strayer University participates in DOD military tuition assistance programs under a Memorandum of Understanding with the DOD and various branches of the armed services. Thereunder, the University agrees to comply with DOD rules and procedures regarding the receipt of tuition assistance on behalf of active duty military personnel (and qualifying family members) in attendance at the University.
Title IV Programs
Strayer University maintains eligibility for its students to participate in the following Title IV programs:
|
|
•
|
Federal Grants.
Grants under the Federal Pell Grant program are available to eligible students based on financial need and other factors. In April 2011, year-round Pell Grant awards beginning with the 2011-2012 award year were permanently eliminated. In addition, effective July 1, 2012, eligibility for Pell Grants was reduced from 18 semesters to 12 semesters.
|
|
|
•
|
Campus-Based Programs.
The campus-based Title IV programs include the Federal Supplemental Educational Opportunity Grant program, the Federal Perkins Loan, and the Federal Work-Study Program. Strayer University does not actively participate in the Perkins Loan or the Federal Work-Study Program.
|
|
|
•
|
Federal Direct Student Loans.
Under the William D. Ford Federal Direct Loan Program, the Department of Education makes loans directly to students and their parents. Students who demonstrate financial need may qualify for a subsidized loan. With a subsidized loan, the federal government will pay the interest on the loan while the student is in school and during any approved periods of deferment, until the student’s obligation to repay the loan begins. Unsubsidized loans are available to students who do not qualify for a subsidized loan or, in some cases, in addition to a subsidized loan. PLUS loans, including Graduate PLUS loans, are unsubsidized. The Budget Control Act of 2011, signed into law on August 2, 2011 eliminated federal direct subsidized loans for graduate and professional students as of July 1, 2012. The terms and conditions of subsidized loans originated prior to July 1, 2012 are not affected by the change.
|
Federal Financial Aid Regulation
To be eligible to participate in Title IV programs, Strayer University must comply with specific standards and procedures set forth in the Higher Education Act and the regulations issued thereunder by the Department of Education. As part of those participation standards, the Department of Education determines whether, among other things, the institution meets certain standards of administrative capability and financial responsibility. The institution must also follow extensive Department of Education rules regarding the awarding and processing of funds issued under the Title IV programs. Some of the key provisions regarding institutional eligibility and processing federal financial aid are described below.
Program Participation Agreement
Each institution participating in Title IV programs must enter into a Program Participation Agreement with the Department of Education. Under the agreement, the institution agrees to follow the Department of Education’s rules and regulations governing Title IV programs. Strayer University’s provisional Program Participation Agreement with the Department of Education allows it to participate in Title IV programs until September 30, 2014.
16
Provisional Certification
In certain circumstances, the Department of Education may certify an institution’s continuing eligibility to participate in Title IV programs on a provisional basis for three complete award years (July 1 – June 30) from the date of provisional certification. During the period of provisional certification, the institution must comply with any additional conditions included in its program participation agreement. If the Department of Education determines that a provisionally certified institution is unable to meet its responsibilities under its program participation agreement, it may seek to revoke or further condition the institution’s certification to participate in Title IV programs with fewer due process protections for the institution than if it were fully certified. Should the Department of Education seek to revoke eligibility during the provisional period, the institution will have an opportunity to show cause why such revocation is not warranted and the Department’s decision to accept or reject such cause will constitute final agency action. Strayer University is operating under a provisional Program Participation Agreement through September 30, 2014, and must obtain Department of Education approval for substantial changes, including the addition of any new location, level of academic offering, or non-degree program.
Administrative Capability
Department of Education regulations specify extensive criteria by which an institution must establish that it has the requisite administrative capability to participate in Title IV programs. To meet the administrative capability standards, an institution, among other things, must comply with all applicable Title IV program regulations, must not have cohort default rates above specified levels, must have various procedures in place for safeguarding federal funds, must not be, and not have any principal or affiliate who is, debarred or suspended from federal contracting or engaging in activity that is cause for debarment or suspension, must submit in a timely manner all reports and financial statements required by the regulations and must not otherwise appear to lack administrative capability. On December 22, 2011, the Department of Education notified Strayer University that its Program Participation Agreement was approved on a provisional basis because “the institution did not disburse Title IV funds timely to students in each payment period.”
Financial Responsibility
The Higher Education Act and Department of Education regulations establish extensive standards of financial responsibility that institutions such as Strayer University must satisfy in order to participate in Title IV programs. These standards generally require that an institution provide the services described in its official publications and statements, properly administer the Title IV programs in which it participates and meet all of its financial obligations, including required refunds and any repayments to the Department of Education for debts and liabilities incurred in programs administered by the Department of Education.
Department of Education standards utilize a complex formula to assess financial responsibility. The standards focus on three financial ratios: (1) equity ratio (which measures the institution’s capital resources and ability to borrow); (2) primary reserve ratio (which measures the institution’s financial viability and liquidity) and (3) net income ratio (which measures the institution’s ability to operate at a profit or within its means). An institution’s financial ratios must yield a composite score of at least 1.5 for the institution to be deemed financially responsible without alternative measures and further federal oversight. Strayer University has applied the financial responsibility standards to its audited financial statements as of and for the year ended December 31, 2012, and based on its composite score and other relevant factors, Strayer believes that Strayer University meets the Department of Education’s financial responsibility standards.
Student Loan Defaults
Under the Higher Education Act, an educational institution may lose its eligibility to participate in some or all of the Title IV programs if defaults on the repayment of Direct Loan or FFEL Program loans by its students exceed certain levels. The Department of Education uses a specific methodology to determine default rates and imposes varying sanctions based upon the results of that calculation. As discussed below, the current cohort default rate calculation and threshold for regulatory sanctions will change effective 2014 as a result of the reauthorization of the Higher Education Act through the Higher Education Opportunity Act (“HEOA”), which was effective August 18, 2008.
17
The Department of Education calculates a rate of student defaults (known as a cohort default rate) for each institution with 30 or more borrowers entering repayment in a given federal fiscal year. The Department of Education includes in the cohort all student borrowers at the institution who entered repayment on any Direct or FFEL Program loan during that year. The cohort default rate is the percentage of those borrowers who default by the end of the following federal fiscal year, resulting in a two-year cohort default rate. Because of the need to collect data on defaults, the Department of Education publishes cohort default rates two years in arrears; for example, in the fall of 2012, the Department issued cohort default rates for federal fiscal year 2010.
The Department of Education may take adverse action against an institution if it has excessive cohort default rates, including the following:
|
|
•
|
If an institution’s most recent cohort default rate is greater than 40%, the institution’s participation in Title IV loan programs terminates 30 days after notification by the Department of Education, unless the institution timely appeals that determination on specified grounds according to specified procedures.
|
|
|
•
|
If an institution’s three most recent cohort default rates are each 25% or greater, the institution’s participation in Title IV loan programs and Federal Pell Grant Program terminates 30 days after notification by the Department of Education, unless the institution timely appeals that determination on specified grounds according to specified procedures.
|
An institution whose participation ends under either of the foregoing provisions may not participate in the relevant programs for the remainder of the fiscal year in which the institution receives the notification, as well as for the next two fiscal years.
|
|
•
|
If an institution’s cohort default rate equals or exceeds 25% in any of the three most recent federal fiscal years, the Department of Education may place the institution on provisional certification. Provisional certification does not limit an institution’s access to Title IV program funds; however, an institution with provisional status is subject to closer review by the Department of Education and may be subject to summary adverse action if it violates Title IV program requirements.
|
The regulations also address cohort default rates for institutions that have undergone a change in status, such as acquisition or merger of institutions and acquisition of another institution’s branches or locations. Strayer University’s cohort default rates for the 2008, 2009, and 2010 federal fiscal years, the three most recent years for which this information is available, were 6.7%, 10.0%, and 8.6%, respectively. The average cohort default rates for proprietary institutions nationally were 11.6%, 15.0%, and 12.9% for federal fiscal years 2008, 2009, and 2010, respectively.
Cohort Default Rate Provisions Effective 2014
In 2008, Congress, through the HEOA, modified the cohort default rate provisions related to Title IV loans in two significant ways, described below. The HEOA provides, however, that the current method of calculating cohort default rates will be used to determine any sanctions on institutions until 2014, when three consecutive years of official cohort default rates calculated under the new formula will be available.
First, under the new provisions, the period for measuring defaults will be expanded by one year, resulting in a three-year cohort default rate. Beginning with cohort default rate calculations for federal fiscal year 2009, the cohort default rate is the percentage of borrowers who become subject to their repayment obligation in the relevant federal fiscal year and default by the end of the second federal fiscal year following that fiscal year.
Second, the cohort default rate ceiling will increase from 25% to 30%. This change has several consequences:
|
|
•
|
If an institution’s cohort default rate is 30% or more in a given fiscal year, the institution will be required to assemble a “default prevention task force” and submit to the Department of Education a default improvement plan.
|
|
|
•
|
If an institution’s cohort default rate exceeds 30% for two consecutive years, the institution will be required to review, revise and resubmit its default improvement plan. The Department of Education may direct that the plan be amended to include actions, with measurable objectives, that it determines will promote loan repayment.
|
|
|
•
|
If an institution’s cohort default rate exceeds 30% for two out of three consecutive years, the Department of Education may subject the institution to provisional certification. The institution may file a timely appeal on specified grounds according to specified procedures, and if the Secretary of Education determines that the institution demonstrated a basis for relief, the Secretary may not subject the institution to provisional certification based solely on the institution’s cohort default rate.
|
|
|
•
|
If an institution’s cohort default rate is equal to or greater than 30% for each of the three most recent federal fiscal years for which data are available, the institution will be ineligible to participate in the Direct Loan Program and Federal Pell Grant Program.
|
The revisions to the cohort default rate rule did not change the existing provision that an institution generally loses eligibility to participate in Title IV loan programs if its most recent cohort default rate is greater than 40%.
Effective July 1, 2010, the Department of Education issues two cohort default rates – a two-year cohort default rate and a three-year cohort default rate – for fiscal years 2009 through 2011. The Department of Education will rely on the two-year cohort default rate and related thresholds to determine institutional eligibility until 2014, when the Department of Education issues official three-year cohort default rates for the fiscal year 2011 cohort.
The Department of Education issued the first official three-year cohort default rate, for fiscal year 2009, in September 2012. Strayer’s official fiscal year 2009 three-year cohort default rate was 13.9%. The average official three-year cohort default rate for proprietary institutions nationally was 22.7% for fiscal year 2009. Strayer University’s unofficial three-year cohort default rates for fiscal years 2007 and 2008, which were released for informational purposes only, were 13.0% and 12.7%, respectively. The average unofficial informational three-year cohort default rates for proprietary institutions nationally were 21.2% and 25.0% for federal fiscal years 2007 and 2008, respectively.
18
As part of its compliance program related to the cohort default rate, Strayer University provides entrance and exit counseling to its students and engages the services of a third party to counsel students once they are in repayment status regarding their repayment obligations.
The 90/10 Rule
A requirement of the Higher Education Act, commonly referred to as the 90/10 Rule, applies only to proprietary institutions of higher education, which includes Strayer University. Under this rule, a proprietary institution is prohibited from deriving from Title IV funds, on a cash accounting basis (except for certain institutional loans) for any fiscal year, more than 90% of its revenues (as revenues are computed under the Department of Education’s methodology).
The 90/10 Rule is a compliance obligation that is part of an institution’s program participation agreement with the Department of Education. A proprietary institution of higher education that violates the 90/10 Rule for any fiscal year will be placed on provisional status for two fiscal years. Proprietary institutions of higher education that violate the 90/10 Rule for two consecutive fiscal years will become ineligible to participate in Title IV programs for at least two fiscal years and will be required to demonstrate compliance with Title IV eligibility and certification requirements for at least two fiscal years prior to resuming Title IV program participation. In addition, the Department of Education discloses on its website any proprietary institution of higher education that fails to meet the 90/10 requirement, and reports annually to Congress the relevant ratios for each proprietary institution of higher education.
HEOA changes in 2008 generally codified the regulatory formula for 90/10 rule calculations, but also expanded on the Department of Education’s formula in certain respects, including by broadening the categories of funds that may be counted as non-Title IV revenue for 90/10 Rule purposes. The HEOA provisions were effective on August 14, 2008, and the Department of Education issued final regulations implementing the 90/10 Rule and certain other HEOA provisions that were effective July 1, 2010, but institutions could have, at their discretion, implemented the 90/10 Rule regulations on or after November 1, 2009. These regulations clarify the treatment of certain types of revenue, and require institutions to report in their annual financial statement audits not only the percentage of revenues derived from Title IV funds during the fiscal year, but also the dollar amounts of the numerator and denominator of the 90/10 calculation and specified categories of revenue. The regulations also shorten from 90 to 45 days the time period within which institutions must notify the Secretary after the end of a fiscal year in which the institution failed to meet the 90/10 Rule requirement.
Using the HEOA formula, Strayer University derived approximately 78% and 76% of its cash-basis revenues from Title IV program funds in 2010 and 2011, respectively. Our computation for 2012 has not yet been finalized and audited.
The key components of non-Title IV revenue for Strayer University are individual student payments, employer tuition reimbursement payments, veterans benefits, vocational rehabilitation funds, private loans, state grants, and scholarships. Certain members of Congress have proposed to revise the 90/10 Rule to count DOD tuition assistance and veterans education benefits along with Title IV revenue toward the 90% limit and to reduce the limit to 85% of total revenue.
Incentive Compensation
As a part of an institution’s program participation agreement with the Department of Education and in accordance with the Higher Education Act, the institution may not provide any commission, bonus or other incentive payment based directly or indirectly on success in securing enrollments or financial aid to any person or entity engaged in any student recruitment, admissions or financial aid awarding activity. Failure to comply with the incentive payment rule could result in loss of certification to participate in federal student financial aid programs, limitations on participation in the federal student financial aid programs, or financial penalties.
Effective July 1, 2011, the Department of Education eliminated 12 “safe harbors” that had been established in 2002 to define circumstances under which an institution would not run afoul of the incentive payment prohibition. The final rules prohibit payments made “in any part,” directly or indirectly upon the success of securing enrollments or financial aid, apply to all employees at an institution who are engaged in or responsible for any student recruitment or admission activity, limit “profit-sharing payments,” and set rules for third-party contracts. The Department of Education has published a subsequent Dear Colleague Letter interpreting this regulation.
Gainful Employment
On June 13, 2011, the Department of Education published final regulations on the metrics to determine whether an academic program prepares a student for gainful employment. Pursuant to the final regulations, which were set to become effective on July 1, 2012, an academic program is considered to lead to gainful employment if it meets at least one of the following three metrics:
19
|
|
•
|
If at least 35% of students are in a satisfactory repayment status with respect to their federal student loans three to four years after entering repayment;
|
|
|
•
|
If the annual loan payment of a typical graduate of the program for all debt incurred by the graduate for the program does not exceed 30% of the average or median discretionary income in the third or fourth year after graduation; or
|
|
|
•
|
If the annual loan payment of a typical graduate of the program for all debt incurred by the graduate for the program does not exceed 12% of the average or median annual earnings in the third or fourth year after graduation.
|
A particular program offered by an institution would have become ineligible for Title IV funding if it could not pass one of the three above metrics in three out of four consecutive years, beginning with fiscal year 2012. After one failure, the institution would be required to disclose to students the amount by which the particular program missed the metric and what the institution plans to do to improve performance. After two failures consecutively or within a three-year period, the institution would have to inform each current and prospective student that their debts may be unaffordable, that the program may lose eligibility, and what transfer options exists. After three failures consecutively or within four years, a program would lose eligibility for Title IV funds and could not re-establish eligibility for at least three years. As adopted, the first year that a program could have lost eligibility under the regulation would have been 2015, with eligibility losses in that year limited to the lowest 5% of all programs across institutions. The regulations provide means by which an institution may challenge the Department of Education’s calculation of any of the three debt metrics.
On June 30, 2012, the U.S. District Court for the District of Columbia, considering a challenge to the regulations brought by the Association of Private Sector Colleges and Universities, vacated the debt measures as well as the rules requiring institutions to report to the Department of Education information about students who complete gainful employment programs. On July 30, 2012, the Department of Education filed a motion to alter or amend the Court’s June 30 judgment, urging the court to reinstate the reporting requirements. The court requested additional briefing on the issue, and a decision on the motion to alter or amend the judgment remains pending.
If the debt measures or reporting requirements were to be reinstituted on appeal or by a future Department of Education rulemaking that passes judicial scrutiny, the gainful employment regulations will substantially increase our administrative burdens and could affect our student enrollment, persistence and retention. Further, although the regulations provide opportunities for an institution to correct any potential deficiencies in a program prior to the loss of Title IV eligibility, if the rule is reinstated, the continuing eligibility of our academic programs could be affected by factors beyond management’s control such as changes in our graduates’ income levels, changes in student borrowing levels, increases in interest rates, changes in the percentage of former students who are current in the repayment of their student loans, and various other factors. Even if we were able to correct any deficiency in the gainful employment metrics in a timely manner, the disclosure requirements associated with a program’s failure to meet at least one metric could adversely affect student enrollments in that program and could adversely affect the reputation of our institution.
Return of Federal Funds
Under the Higher Education Act’s return-of-funds provision, an institution must return Title IV funds to a Title IV program in a timely manner if a student received funds from that program but did not earn them due to the student’s withdrawal from the institution. In order to determine if funds should be returned, the institution must first determine the amount of Title IV program funds that the student earned. If the student attends the institution, but withdraws during the first 60% of any period of enrollment or payment period, the amount of Title IV program funds that the student earned is equal to a pro rata portion of the funds for which the student would otherwise be eligible. Strayer University uses the student’s last day of attendance as the withdrawal date for purposes of return to Title IV. Effective July 1, 2011, institutions that use the last day of attendance are required to measure the last day of attendance based on official attendance records, and “attendance” for online classes must include participation in an academically related activity. Strayer University’s current systems allow for measurement on this basis. If the student withdraws after the 60% point, then the student has earned 100% of the Title IV program funds. The institution must return to the appropriate Title IV programs, in a specified order, the lesser of the unearned Title IV program funds or the institutional charges incurred by the student for the period multiplied by the percentage of unearned Title IV program funds. An institution must return the funds no later than 45 days after the date that the institution determines that a student withdrew.
If the funds are not returned in a timely manner, an institution may be subject to adverse action, including being required to submit a letter of credit equal to 25% of the refunds the institution should have made in its most recently completed fiscal year. Under Department of Education regulations, if late returns of Title IV program funds constitute 5% or more of students sampled in the institution’s annual compliance audit for either of its two most recently completed fiscal years, an institution generally must submit an irrevocable letter of credit payable to the Secretary of Education.
Third-Party Servicers
Department of Education regulations permit an institution to enter into a written contract with a third-party servicer for the administration of any aspect of the institution’s participation in Title IV programs. The third-party servicer must, among other obligations, comply with Title IV requirements and be jointly and severally liable with the institution to the Secretary of Education for any violation by the servicer of any Title IV provision. An institution must report to the Department of Education new contracts or any significant modifications to contracts with third-party servicers as well as other matters related to third-party servicers. Strayer University has written contracts with third-party servicers to perform activities related to Strayer University’s participation in Title IV programs. Strayer University also has a contract with Sallie Mae Business Solutions for processing stipends due to students and with General Revenue Corporation for loan default prevention. Prior to September 30, 2011, Strayer University utilized Global Financial Services, Inc., for services including certifying Title IV loan applications, preparing reports from Strayer University to the Department of Education, and issuing federal grant program payments. The University’s agreement with Global Financial Aid Services expired on September 30, 2011, at which point Strayer University in-sourced its financial aid processing.
20
Lender Relationships
As part of an institution’s program participation agreement with the Department of Education, the institution must adopt a code of conduct pertaining to student loans. Strayer University has a code of conduct that it believes complies with the provisions of HEOA in all material respects. In addition to the code of conduct requirements that apply to institutions, HEOA contains provisions that apply to lenders, prohibiting lenders from engaging in certain activities as they interact with institutions.
Prior to the termination of the FFEL Program on June 30, 2010, Strayer University was subject to rules applicable to institutions that make available a list of recommended or suggested federal loan lenders for use by potential borrowers. Strayer University remains subject to those rules with respect to private education loans.
Restrictions on Adding Locations and Educational Programs
State requirements and accrediting agency standards limit the ability of Strayer University to establish additional locations and programs. Most states require approval before institutions can add new programs, campuses or teaching locations. Middle States requires institutions that it accredits to notify it in advance of implementing new programs or locations, which may require additional approval. At its discretion, Middle States may also conduct site visits to additional locations to ensure that accredited institutions that experience rapid growth in the number of additional locations maintain educational quality. All new Strayer University campus locations require Middle States approval before students are enrolled, and the Higher Education Act requires Middle States to monitor institutions with significant enrollment growth. In addition, under Strayer University’s provisional certification, the Department of Education must approve any new campus location, level of academic offering and non-degree program.
The Higher Education Act requires proprietary institutions of higher education to be in full operation for two years before qualifying to participate in Title IV programs. However, the applicable regulations in many circumstances permit an institution that is already qualified to participate in Title IV programs to establish additional locations that are exempt from the two-year rule. These additional locations generally may qualify immediately for participation in the Title IV programs, unless the location was acquired from another institution that has ceased offering educational programs at that location and has Title IV liabilities that it is not repaying in accordance with an agreement to do so, and the acquiring institution does not agree, among other matters, to be responsible for certain liabilities of the acquired institution. The new location must satisfy all other applicable requirements for institutional eligibility, including approval of the additional location by the relevant state authorizing agency and the institution’s accrediting agency. Strayer University’s expansion plans assume its continued ability to establish new campuses as additional locations of Strayer University under such applicable regulations and thereby to avoid incurring the two-year delay in participation in Title IV programs. The loss of state authorization or accreditation of Strayer University or an existing campus, or the failure of Strayer University or a new campus to obtain state authorization or accreditation, would render Strayer University ineligible to participate in Title IV programs at least in that state or at that location. Department of Education regulations require institutions to report to the Department of Education a new additional location at which at least 50% of an eligible program will be offered, if the institution wants to disburse Title IV program funds to students enrolled at that location. Under its provisional Program Participation Agreement with the Department of Education, Strayer University must obtain Department of Education approval for the addition of any new location. Institutions are responsible for knowing whether they need approval, and institutions that add locations and disburse Title IV program funds without having obtained any necessary approval may be subject to administrative repayments and other sanctions.
Effective July 1, 2011, Department of Education regulations required a proprietary institution to notify the Department of Education of new programs if the program had a Classification of Instructional Programs (“CIP”) code under the taxonomy of instructional program classifications and descriptions developed by the National Center for Education Statistics (“NCES”) that was different from any other program offered by the institution, the program had the same CIP code as another program offered by the institution but lead to a different degree or certificate, or the institution’s accrediting agency had determined the program to be an additional program. Notification was required at least 90 days before the first day of class, and the institution could then proceed to offer the program, unless the Department of Education advised the institution that the additional educational program had to be approved. On June 30, 2012, the U.S. District Court for the District of Columbia, in addition to striking down the Gainful Employment debt measures and reporting requirements, also vacated the program approval rules. Pending a final ruling in this case, the Department of Education has advised schools to follow the rules on additional programs that immediately preceded the gainful employment rules. The version once again in effect provides that
approval of new programs is not required if the additional program prepares students for gainful employment in the same or related occupation as an educational program that has previously been designated as eligible and is at least eight semester hours, twelve quarter hours, or 600 clock hours.
21
Other Regulations Governing Title IV Programs
The Department of Education has enacted a comprehensive set of regulations governing an institution’s participation in the Title IV programs. If Strayer University were not to continue to comply with these regulations, such non-compliance might affect the operations of the University and its ability to participate in Title IV programs.
Compliance Reviews
Strayer University is subject to announced and unannounced compliance reviews and audits by various external agencies, including the Department of Education, its Office of Inspector General, state licensing agencies, guaranty agencies, and accrediting agencies. The Higher Education Act and Department of Education regulations also require an institution to submit annually to the Secretary of Education a compliance audit of its administration of the Title IV programs conducted by an independent certified public accountant in accordance with Government Auditing Standards and applicable audit guides of the Department of Education’s Office of Inspector General. In addition, to enable the Secretary of Education to make a determination of financial responsibility, an institution must submit annually to the Secretary of Education audited financial statements prepared in accordance with Department of Education regulations.
In an August 2010, letter to members of the Senate Health, Education, Labor and Pensions (HELP) Committee, the Secretary of Education announced plans to increase the number of program reviews by 50%, from 200 conducted in 2010 to 300 in 2011. The Department of Education is conducting a program review of Strayer University’s administration of Title IV programs. If the program review finds that we failed to comply with Title IV and its implementing regulations, the Department of Education could impose sanctions or conditions that could have a material adverse effect on our operations and financial condition. On March 25, 2011, the Department of Education issued a preliminary program review report indicating its position that Strayer University’s Associate in Arts in General Studies program was not an eligible program under Title IV of the Higher Education Act. The Company has communicated its disagreement with this finding, has enrolled affected students in other programs, and is working with the Department of Education to resolve the matter. Strayer University continues to communicate with the Department of Education, and has provided requested data, but has not received a Final Program Review Determination Letter. On December 22, 2011, the Department of Education notified Strayer University that its Program Participation Agreement was approved on a provisional basis because “the institution did not disburse Title IV funds timely to students in each payment period.”
Potential Effect of Regulatory Violations
If Strayer University fails to comply with the regulatory standards governing Title IV programs, the Department of Education could impose one or more sanctions, including transferring Strayer University from the advance payment method to the reimbursement or cash monitoring system of payment, seeking to require repayment of certain Title IV funds, requiring the University to post a letter of credit in favor of the Department of Education as a condition for continued Title IV certification, taking emergency action against the University, referring the matter for criminal prosecution or initiating proceedings to impose a fine or to limit, condition, suspend or terminate Strayer University’s participation in Title IV programs. Although there are no such sanctions currently in force, if such sanctions or proceedings were imposed against Strayer University and resulted in a substantial curtailment, or termination, of the University’s participation in Title IV programs or resulted in substantial fines or monetary liabilities, Strayer University would be materially and adversely affected.
If Strayer University lost its eligibility to participate in Title IV programs, or if Congress reduced the amount of available federal student financial aid, the University would seek to arrange or provide alternative sources of revenue or financial aid for students. Although the University believes that one or more private organizations would be willing to provide financial assistance to students attending Strayer University, there is no assurance that this would be the case, and the interest rate and other terms of such student financial aid are unlikely to be as favorable as those for Title IV program funds. Strayer University might be required to guarantee all or part of such alternative assistance in a manner that complies with rules governing schools’ relationships with lenders or might incur other additional costs in connection with securing alternative sources of financial aid. Accordingly, the loss of eligibility of Strayer University to participate in Title IV programs, or a reduction in the amount of available federal student financial aid, would be expected to have a material adverse effect on Strayer University even if it could arrange or provide alternative sources of revenue or student financial aid.
In addition to the actions that may be brought against us as a result of our participation in Title IV programs, we also may be subject, from time to time, to complaints and lawsuits relating to regulatory compliance brought not only by our regulatory agencies, but also by other government agencies and third parties.
22
Change in Ownership Resulting in a Change of Control
Many states and accrediting agencies require institutions of higher education to report or obtain approval of certain changes in ownership or other aspects of institutional status, but the types of and triggers for such reporting or approval vary among states and accrediting agencies. In addition, Strayer University’s accrediting agency, Middle States, requires institutions that it accredits to inform it in advance of any substantive change, including a change that significantly alters the ownership or control of the institution. Examples of substantive changes requiring advance notice to and approval of Middle States include changes in the legal status, ownership or form of control of the institution, such as the sale of a proprietary institution. Middle States must approve a substantive change in advance in order to include the change in the institution’s accreditation status. Middle States will undertake a site visit to an institution that has undergone a change in ownership or control no later than six months after the change.
The Higher Education Act provides that an institution that undergoes a change in ownership resulting in a change of control loses its eligibility to participate in the Title IV programs and must apply to the Department of Education in order to reestablish such eligibility. An institution is ineligible to receive Title IV program funds during the period prior to recertification. The Higher Education Act provides that the Department of Education may temporarily, provisionally certify an institution seeking approval of a change of ownership and control based on preliminary review by the Department of Education of a materially complete application received by the Department of Education within 10 business days after the transaction. The Department of Education may continue such temporary, provisional certification on a month-to-month basis until it has rendered a final decision on the institution’s application. If the Department of Education determines to approve the application after a change in ownership and control, it issues a provisional certification, which extends for a period expiring not later than the end of the third complete award year following the date of provisional certification. The Higher Education Act defines one of the events that would trigger a change in ownership resulting in a change of control as the transfer of the controlling interest of the stock of the institution or its parent corporation. For a publicly traded corporation, the securities of which are required to be registered under the Exchange Act, such as Strayer, the Department of Education regulations implementing the Higher Education Act define a change in ownership resulting in a change of control as occurring when a person acquires ownership and control of a corporation such that the corporation is required to file a Form 8-K with the Securities and Exchange Commission (SEC) notifying that agency of the change of control. The regulations also provide that a change in ownership and control of a publicly traded corporation occurs if a person who is a controlling stockholder of the corporation ceases to be a controlling stockholder. A controlling stockholder is a stockholder who holds or controls through agreement both 25% or more of the total outstanding voting stock of the corporation and more shares of voting stock than any other stockholder.
The U.S. Department of Homeland Security, working with the U.S. Department of State, has implemented a mandatory electronic reporting system for schools that enroll foreign students and exchange visitors. Strayer University currently is authorized by the U.S. Department of Homeland Security to admit foreign students for study in the United States subject to applicable requirements. In certain circumstances, the Department of Homeland Security may require an institution to obtain approval for a change in ownership and control.
Pursuant to federal law providing benefits for veterans and reservists, some of the programs offered by Strayer University are approved for the enrollment of persons eligible to receive U.S. Department of Veterans Affairs educational benefits by the state approving agencies in Alabama, Delaware, Florida, Georgia, Kentucky, Maryland, New Jersey, North Carolina, Ohio, Pennsylvania, South Carolina, Tennessee, Virginia, and Washington, D.C. In certain circumstances, state approving agencies may require an institution to obtain approval for a change in ownership and control.
If Strayer University underwent a change of control that required approval by any state authority, Middle States or any federal agency, and any required regulatory approval were significantly delayed, limited or denied, there could be a material adverse effect on Strayer University’s ability to offer certain educational programs, award certain degrees, diplomas or certificates, operate one or more of its locations, admit certain students or participate in Title IV programs, which in turn would materially and adversely affect Strayer University’s operations. A change that required approval by a state regulatory authority, Middle States or a federal agency could also delay Strayer University’s ability to establish new campuses or educational programs and may have other adverse regulatory effects. Furthermore, the suspension from Title IV programs and the necessity of obtaining regulatory approvals in connection with a change of control may materially limit Strayer University’s flexibility in future financing or acquisition transactions.
Recent or Pending Legislative and Regulatory Activity
Congress is considering legislation that would make further changes in the Higher Education Act and other education-related federal laws. Congressional activity may adversely affect enrollment in for-profit educational institutions. We cannot predict the impact, if any, of these recent or pending legislative changes on our long-term business model, although the uncertainty associated with Congressional activity has had a negative impact on the industry as a whole.
On June 13, 2011, the Department of Education published final regulations on the metrics to determine whether an academic program prepares a student for gainful employment. Pursuant to the final regulation, which was to become effective on July 1, 2012, an academic program is considered to lead to gainful employment if it meets one of the three metrics. As discussed more fully above, on June 30, 2012, the U.S. District Court for the District of Columbia invalidated these debt measures as well as the accompanying reporting and additional program approval requirements. Pending a final ruling in this case, the Department of Education has advised schools to follow the rules on additional programs that immediately preceded the gainful employment rules.
23
Congress
Congress historically has reauthorized the Higher Education Act (“HEA”)
,
which is the law governing Title IV programs, approximately every five to six years, but undertook the most recent reauthorization through multiple pieces of legislation. On July 31, 2008, Congress reauthorized the HEA through September 30, 2013, by passing the HEOA, which then President Bush signed into law on August 14, 2008. HEOA provisions became effective upon enactment, unless otherwise specified in the law. HEOA includes numerous new and revised requirements for higher education institutions. In October 2009, the Department of Education published final regulations to implement HEOA changes to Title IV of the Higher Education Act. Those regulations were effective July 1, 2010.
In addition to HEOA, three other laws to amend and reauthorize aspects of the Higher Education Act have been enacted over the last few years. In February 2006, then President Bush signed the Deficit Reduction Act of 2005, which included the Higher Education Reconciliation Act of 2005, or HERA. Among other measures, HERA reauthorized the Higher Education Act with respect to the federal guaranteed student loan programs. In September 2007, then President Bush signed the College Cost Reduction and Access Act, which increased benefits to students under the Title IV programs and reduced payments to and raised costs for lenders that participate in the federal student loan programs. In May 2008, then President Bush signed the Ensuring Continued Access to Student Loans Act of 2008, or ECASLA, which was designed to facilitate student loan availability and to increase student access to federal financial aid in light of then-current market conditions. Congress extended ECASLA for an additional year, to June 30, 2010. In March 2010, Congress passed the Student Aid and Fiscal Responsibility Act of 2009, which eliminated the FFEL Program and required all institutions participating in Title IV programs to convert exclusively to the Direct Loan Program by July 1, 2010.
The Consumer Financial Protection Bureau submitted two reports to Congress in 2012 with specific recommendations for restructuring the student borrowing experience, including requiring institutions to certify that a student is not eligible for any further federal funds before a private loan may be issued to such student. On January 23, 2013, Senator Durbin introduced the Know Before You Owe Private Student Loan Act of 2013, which would require institutions to certify to a private loan lender a student’s cost of attendance and estimated federal financial assistance before a loan may be issued to such student. The Act would also require institutions to counsel students about their loan options, including discussion of differences between federal loans and private loans. Private loan lenders would be required to provide students with quarterly account updates on the balance and interest accrued. On January 23, 2013, Senator Durbin also introduced the Fairness for Struggling Students Act of 2013, which would allow private student loans to be dischargeable in bankruptcy. We do not know what steps Congress may take in response to these actions and whether such actions (if any) will have an adverse effect on our business or results of operations.
Appropriations
Congress reviews and determines appropriations for Title IV programs on an annual basis. An elimination of certain Title IV programs, a reduction in federal funding levels of such programs, material changes in the requirements for participation in such programs, or the substitution of materially different programs could reduce the ability of certain students to finance their education. This, in turn, could lead to lower enrollments at Strayer University or require Strayer University to increase its reliance upon alternative sources of student financial aid. Given the significant percentage of Strayer University’s revenues that are derived indirectly from the Title IV programs, the loss of or a significant reduction in Title IV program funds available to Strayer University’s students could have a material adverse effect on Strayer.
Appropriations for certain Title IV programs could be affected by sequestration, a process of automatic spending reductions. The Budget Control Act of 2011 and the Statutory Pay-As-You-Go Act of 2010 each provide for the possibility of sequestration as a budgetary enforcement tool. On January 2, 2013, Congress enacted the American Taxpayer Relief Act of 2012, which delayed potential sequestration under the Budget Control Act of 2011 until March 1, 2013. If sequestration is triggered by either the Budget Control Act of 2011 or the Statutory Pay-As-You-Go Act of 2010, funding for Title IV programs would be affected. Pell Grants would be exempt from cuts through FY2013, but could be subject to sequestration in FY2014 and beyond. Most other federal student aid programs would be subject to across-the-board cuts to discretionary programs at a rate of approximately 8.2%. Origination fees for Stafford loans and PLUS loans would increase approximately 7.6%, to approximately 1.076% and 4.304% of the total loan, respectively. Cuts to the Department of Education’s Federal Student Aid Administration budget could lead to delays in student eligibility determinations and delays in processing and origination of federal student loans.
Senate Health, Education, Labor and Pensions (HELP) Committee
In 2010, the U.S. Congress increased its focus on proprietary education institutions, including regarding participation in Title IV programs and DOD oversight of tuition assistance for military service members. Since June 2010 the HELP Committee has held hearings to examine the proprietary education sector. Other Committees of the U.S. Congress have also held hearings into, among other things, the standards and procedures of accrediting agencies, credit hours and program length, the portion of federal student financial aid going to proprietary institutions, and the receipt of veterans and military education benefits by students enrolled at proprietary institutions. Strayer University has cooperated with these inquiries. A number of legislators have variously requested the Government Accountability Office (GAO) to review and make recommendations regarding, among other things, recruitment practices, educational quality, student outcomes, the sufficiency of integrity safeguards against waste, fraud and abuse in Title IV programs, and the percentage of proprietary institutions’ revenue coming from Title IV and other federal funding sources. The GAO released four reports on for-profit post-secondary education: first, a report in August 2010 (subsequently revised in November 2010) that concluded, based on a three-month undercover investigation, that employees at a non-random sample of 15 proprietary institutions (not Strayer University) made deceptive statements to students about accreditation, graduation rates, job placement, program costs, and financial aid; second, a report in October 2010 critical of the Department of Education’s efforts to enforce the ban on incentive payments; third, a report in October 2011 critical of the student experience and instructor performance at some for-profit online institutions; and fourth, a report in December 2011 comparing various student outcomes across proprietary, non-profit, and public institutions.
24
On July 30, 2012, the Senate HELP Committee released its final report on the for-profit sector of higher education entitled “For Profit Higher Education: The Failure to Safeguard the Federal Investment and Ensure Student Success.” While acknowledging that for-profit institutions have a role to play in higher education, the report criticized the proprietary institution industry on many fronts, and recommended several measures for reform which could change the participation of proprietary institutions in Title IV funding, including the following:
|
•
|
Tie access to federal financial aid to minimum student outcome thresholds.
|
|
•
|
Prohibit institutions from funding marketing, advertising and recruiting activities with federal financial aid dollars.
|
|
•
|
Expand the reporting period for cohort default rates beyond 3 years.
|
|
•
|
Require that for-profits receive 15% of revenues from non-federal sources.
|
|
•
|
Extend the ban on incentive compensation to include all employees of institutions of higher education, and clarify that this ban extends to numeric threshold or quota-based termination policies.
|
The report was not adopted by the full Committee, and the minority Members released their own report criticizing the majority’s investigation in many aspects, including that it did not include a review of all institutions of higher education.
On September 21, 2012, a group of senators wrote a letter to the Federal Trade Commission urging it to evaluate the marketing practices utilized by many proprietary institutions through the use of third-party lead generators. In addition, legislation was introduced in the Senate in April 2012, which remains pending in Committee, which would prevent institutions from using Title IV funds for marketing activities.
This increased congressional activity is expected to continue and may result in legislation, further rulemaking affecting participation in Title IV programs, and other governmental actions.
U.S. Department of Education
Title IV regulations applicable to Strayer University have been subject to frequent revisions, many of which have increased the level of scrutiny to which higher education institutions are subjected and have raised applicable standards. In October 2009, the Department of Education published final regulations to implement the HEOA’s numerous new and revised requirements for higher education institutions. These regulations were effective July 1, 2010. On October 29, 2010, the Department of Education published final regulations regarding program integrity at higher education institutions (Program Integrity Regulations), most of which became effective July 1, 2011. On May 5, 2011, the Department of Education initiated a new negotiated rulemaking process on teacher preparation programs and federal student loans. The negotiations ended in April of 2012. The Department of Education has yet to issue a Notice of Proposed Rulemaking for public comment on these issues, which it must do prior to promulgating a final regulation.
In May of 2012, the Department of Education announced its intent to establish a negotiated rulemaking committee to prepare proposed regulations designed to prevent fraud and otherwise ensure proper use of Title IV, HEA program funds, especially in the context of current technologies. In particular, the Department of Education intends to propose regulations to address the use of debit cards and other banking mechanisms for disbursing Federal Student Aid funds, and to improve and streamline the campus-based Federal Student Aid programs. Public hearings were held in May 2012, and negotiations are anticipated to begin in the near future.
State Licensure
Under the Program Integrity Regulations regarding state licensure, a proprietary institution is considered legally authorized by a state if the state has a process to review and appropriately act on complaints concerning the institution, including enforcing applicable state laws, and the institution complies with any applicable state approval or licensure requirements consistent with the Program Integrity Regulations. These requirements became effective July 1, 2011, and institutions were permitted to request a one-year extension of the effective date to July 1, 2012, and if necessary, an additional one-year extension to July 1, 2013. To receive an extension, an institution must obtain from the state an explanation of how a one-year extension will permit the state to modify its procedures to comply with the new requirements.
25
The revised rules specify that an institution is legally authorized in a state for Title IV purposes if it is established or licensed as an educational institution by name. If an institution offers post-secondary education through distance or correspondence education to students in a state in which it is not physically located or in which it is otherwise subject to state jurisdiction as determined by the state, the institution must meet any state requirements for it to be legally offering post-secondary distance or correspondence education in that state. On June 5, 2012, the Court of Appeals upheld a lower court’s ruling vacating the state authorization of online programs requirement. On July 27, 2012, the Department of Education issued a Dear Colleague Letter cautioning education institutions to remain in compliance with all applicable state laws and regulations related to distance education. The Department of Education has not announced its next steps, but it may engage in the future in a negotiated rulemaking to address distance education and state authorization.
The final rule also amended the general provisions regarding student consumer information. Under this revision, the institution must make available for review to any enrolled or prospective student upon request, a copy of the documents describing the institution’s accreditation and its state, federal, or tribal approval or licensing. The institution must also provide its students or prospective students with contact information for filing complaints with its accreditor and with its state approval or licensing entity and any other relevant state official or agency that would appropriately handle a student’s complaint.
We are authorized to offer our programs by the applicable educational regulatory agencies in all states where our physical campuses and online delivery facilities are located, and these states have the applicable processes in place as required by the regulations.
Incentive Compensation
Institutions participating in the Title IV programs may not pay any commission, bonus, or other incentive payment based directly or indirectly on securing enrollments or financial aid to personnel engaged in recruitment or admissions or making decisions about awarding Title IV aid. Previously, there were 12 “safe harbors” relating to payment and compensation plans that institutions may practice without fear of violating the prohibition. The Program Integrity Regulations removed the safe harbors when they became effective on July 1, 2011.
The new regulations prohibit incentive compensation to employees engaged in any student recruitment or admission activity or in making decisions regarding the award of Title IV funds that is based in any part, directly or indirectly, upon success in securing enrollments or the award of financial aid. Merit-based adjustments to employee compensation may be made if they are not based in any part, directly or indirectly, upon success in securing enrollments or the award of financial aid. Profit-sharing payments may be made as long as they are not provided to any person who is engaged in student recruitment or admission activity or in making decisions regarding the award of Title IV funds. The regulations also obligate a third-party servicer to refer to the Office of Inspector General of the Department of Education any information indicating payment of any commission, bonus, or other incentive payment based in any part, directly or indirectly, upon success in securing enrollments or the award of financial aid to any person or entity engaged in any student recruitment or admission activity or in making decisions regarding the award of Title IV funds.
Misrepresentation
Under the Higher Education Act, the Department of Education may fine, suspend or terminate the participation in Title IV programs by an institution that engages in substantial misrepresentation of the nature of its educational program, its financial charges, or the employability of its graduates. The Program Integrity Regulations set forth the types of activities that constitute misrepresentation and describe the adverse actions that the Department of Education may take if it finds that an institution or a third party that provides educational programs, marketing, advertising, recruiting or admissions services to the institution engaged in substantial misrepresentation. The new rule specifies the types of statements that can subject the institution to liability for misrepresentation, the nature and form of misleading statements, and provides that an institution may not describe the eligible institution’s participation in Title IV programs in a manner that suggests approval or endorsement by the U.S. Department of Education of the quality of its educational programs. On June 5, 2012, the U.S. Court of Appeals for the District of Columbia Circuit held that the Department of Education’s expansion of the definition of misrepresentation to include “any statement that has the likelihood or tendency to deceive or confuse” was unsupported by law, and thus vacated that portion of the regulation.
Gainful Employment Reporting and Disclosure
Under the Higher Education Act, a proprietary institution offering programs of study other than a baccalaureate degree in liberal arts (for which there is a limited statutory exception) must prepare students for gainful employment in a recognized occupation. The Program Integrity Regulations established new annual reporting requirements that are applicable to these programs, and the first reports were due to the Department of Education on October 1, 2011, for the 2006-2007, 2007-2008 and 2009-2010 federal financial aid award years. For each such program, Strayer University reported specific information regarding the program, the students enrolled in the program, and students who completed the program, including the amount the student received from private educational loans and institutional financing plans. In addition, the Program Integrity Regulations require institutions with gainful employment programs to disclose to prospective students certain information relating to those programs, including the occupations that the program prepares students to enter; the on-time graduation rate; tuition, fees, and costs; job placement rates, if applicable; and median loan debt of students who completed the program. Strayer University makes such disclosures on its website and in promotional materials. The June 30, 2012, U.S. District Court for the District of Columbia decision related to Gainful Employment vacated the reporting requirements, but the disclosure requirements remain in effect. A motion to reconsider the Court’s invalidation of the reporting requirements remains pending.
The Department of Education required institutions to make disclosures by July 1, 2011, and to update such disclosures for the 2011-2012 award year by January 31, 2013. We made our first disclosures in 2011, and completed a timely update of the disclosures for the 2011-2012 year.
26
New Programs
The Program Integrity Regulations established requirements intended to remain in place until the Department of Education implements performance-based standards for approving additional programs using gainful employment measures. These regulations required an institution to notify the Department of Education of new programs (defined in the regulations) that are subject to gainful employment requirements. Notification was to be made at least 90 days before the first day of class. The institution could proceed to offer the program, unless the Department of Education advised the institution that the additional educational program must be approved. This new program approval process was vacated by the U.S. District Court for the District of Columbia in its June 30, 2012 decision invalidating the gainful employment regulation.
Pending a final ruling in this case, the Department of Education has advised schools to follow the rules on additional programs that immediately preceded the gainful employment rules.
Administration of Financial Aid
Several of the Program Integrity Regulations relate to the administration of financial aid, including the areas of the definition of online attendance, definition of credit hours, measuring satisfactory academic progress, return of federal funds when a student withdraws, verification and disbursement.
College Affordability and Transparency Lists
The Department of Education publishes on its website lists of the top 5% of institutions, in each of nine categories, with (1) the highest tuition and fees for the most recent academic year, (2) the highest “net price” for the most recent academic year, (3) the largest percentage increase in tuition and fees for the most recent three academic years, and (4) the largest percentage increase in net price for the most recent three academic years. An institution that is placed on a list for high percentage increases in either tuition and fees or in net price must submit a report to the Department of Education explaining the increases and the steps that it intends to take to reduce costs. The Department of Education will report annually to Congress on these institutions and will publish their reports on its web site. The Department of Education also posts lists of the top 10% of institutions in each of the nine categories with lowest tuition and fees or the lowest net price for the most recent academic year. Under HEOA, net price means average yearly price actually charged to first-time, full-time undergraduate students who receive student aid at a higher education institution after such aid is deducted.
Executive Order on Military and Veterans Benefits Programs
In April 2012, President Obama issued an Executive Order directing the Departments of Defense and Veterans Affairs, along with other Executive Branch agencies, to implement actions to establish “Principles of Excellence” to apply to educational institutions receiving funding from Federal military and veterans educational benefits programs, including benefits programs provided by the Post-9/11 GI Bill and the Tuition Assistance program. The Principles relate broadly to information regarding tuition and fees, academic quality, marketing, and state authorization requirements.
Credit Hours
In 2009 the Department of Education’s Office of Inspector General criticized three accreditors, including Middle States, for deficiency in their oversight of institutions’ credit hour allocations. In June 2010 the House Education and Labor Committee held a hearing concerning accrediting agencies’ standards for assessing institutions’ credit hour policies. The Program Integrity Regulations define the term “credit hour” for the first time and require accrediting agencies to review the reliability and accuracy of an institution’s credit hour assignments. If an accreditor does not comply with this requirement, its recognition by the Department of Education could be jeopardized. If an accreditor identifies systematic or significant noncompliance in one or more of an institution’s programs, the accreditor must notify the Secretary of Education. If the Department of Education determines that an institution is out of compliance with the credit hour definition, the Department could impose liabilities or other sanctions.
Additional Information
We maintain a website at www.strayereducation.com. The information on our website is not incorporated by reference in this Annual Report on Form 10-K and our web address is included as an inactive textual reference only. We make available on our website our Annual Report on Form 10-K, Quarterly Reports on Form 10-Q, Current Reports on Form 8-K and amendments to those reports filed or furnished pursuant to Section 13(a) or 15(d) of the Exchange Act as soon as reasonably practicable after we electronically file such material with, or furnish it to, the SEC.
27
The Form 10-K and other reports filed with the SEC can be read or copied at the SEC’s Public Reference Room at 100 F Street, NE, Washington, D.C. 20549. Information on the operation of the Public Reference Room can be obtained by calling the SEC at 1-800-SEC-0330. The SEC maintains a website that contains reports, proxy and information statements, and other information regarding issuers that file electronically with the SEC; the website address is www.sec.gov.
|
Item 1A.
|
Risk Factors
|
Investing in our common stock involves a high degree of risk. You should carefully consider the following risk factors and all other information contained in this Annual Report on Form 10-K or in the documents incorporated by reference herein before deciding to purchase our common stock. The occurrence of any of the following risks could materially harm our business, adversely affect the market price of our common stock and could cause you to suffer a partial or complete loss of your investment. See “Cautionary Notice Regarding Forward-Looking Statements.”
Risks Related to Extensive Regulation of Our Business
If we fail to comply with the extensive regulatory requirements for our business, we could face significant monetary liabilities, fines and penalties, including loss of access to federal student loans and grants for our students.
As a provider of higher education, we are subject to extensive regulation on both the federal and state levels. In particular, the Higher Education Act and related regulations subject Strayer University and all other higher education institutions that participate in the various Title IV programs to significant regulatory scrutiny.
The Higher Education Act mandates specific regulatory responsibilities for each of the following components of the higher education regulatory triad: (1) the federal government through the Department of Education; (2) the accrediting agencies recognized by the U.S. Secretary of Education (Secretary of Education) and (3) state education regulatory bodies.
The regulations, standards and policies of these regulatory agencies frequently change, and changes in, or new interpretations of, applicable laws, regulations, standards or policies could have a material adverse effect on our accreditation, authorization to operate in various states, permissible activities, receipt of funds under Title IV programs or costs of doing business.
If we are found to be in noncompliance with these laws, regulations, standards or policies, we could lose our access to Title IV program funds, which would have a material adverse effect on our business. Findings of noncompliance also could result in our being required to pay monetary damages, or being subjected to fines, penalties, injunctions, restrictions on our access to Title IV program funds or other censure that could have a material adverse effect on our business.
Regulatory changes by the Department of Education may have a material adverse effect on our business.
The Department of Education issued on October 28, 2010, final rules that address program integrity issues for post-secondary education institutions participating in Title IV programs, most of which took effect on July 1, 2011. On June 13, 2011, the Department of Education published final regulations on the metrics to determine whether an academic program prepares a student for gainful employment. Pursuant to the final regulation, which was set to become effective on July 1, 2012, an academic program is considered to lead to gainful employment if it meets one of the three metrics, as discussed more fully above. As adopted, the first year that a program could become ineligible is 2015, and a program will not lose eligibility unless it fails all three metrics in three of four years. However, failure of a program in any given year would lead to heightened disclosure requirements. Although the regulations related to debt metrics were vacated by the U.S. District Court for the District of Columbia, if they were to be reinstated on appeal or otherwise properly promulgated by the Department of Education in the future, compliance with the rules could affect how we conduct our business, and insufficient time or lack of sufficient guidance for compliance could have a material adverse effect on our business. Uncertainty surrounding the rules, interpretive regulations or guidance by the Department of Education may continue for some period of time and may adversely affect our business.
Congressional examination of for-profit post-secondary education could lead to legislation or other governmental action that may negatively affect the industry.
In 2010, the U.S. Congress increased its focus on for-profit education institutions, including regarding participation in Title IV programs and DOD oversight of tuition assistance for military service members attending for-profit colleges. Since June 2010 the Senate HELP Committee has held hearings to examine the proprietary education sector and the final report of the majority Members of the Committee was critical of the industry as a whole. Further, the report recommended various reforms which would affect proprietary institutions’ participation in Title IV programs. Other Committees of the U.S. Congress have also held hearings into, among other things, the standards and procedures of accrediting agencies, credit hours and program length, the portion of federal student financial aid going to proprietary institutions, and the receipt of veterans and military education benefits by students enrolled at proprietary institutions. Strayer University has cooperated with these inquiries. A number of legislators have variously requested the GAO to review and make recommendations regarding, among other things, recruitment practices, educational quality, student outcomes, the sufficiency of integrity safeguards against waste, fraud and abuse in Title IV programs, and the percentage of proprietary institutions’ revenue coming from Title IV and other federal funding sources. GAO released four reports on for-profit post-secondary education: first, a report in August 2010 (subsequently revised in November 2010) that concluded, based on a three-month undercover investigation, that employees at a non-random sample of 15 proprietary institutions (not Strayer University) made deceptive statements to students about accreditation, graduation rates, job placement, program costs, and financial aid; second, a report in October 2010 critical of the Department of Education’s efforts to enforce the ban on incentive payments; third, a report in October 2011 critical of the student experience and instructor performance at some for-profit online institutions; and fourth, a report in December 2011 comparing various student outcomes across proprietary, non-profit, and public institutions.
28
On July 30, 2012, the Senate HELP Committee released a report entitled “For Profit Higher Education: The Failure to Safeguard the Federal Investment and Ensure Student Success.” While acknowledging that for-profit institutions have a role to play in higher education, the report criticized the proprietary institution industry on many fronts, and recommended several measures for reform which could change the participation of proprietary institutions in Title IV funding, including the following:
|
·
|
Tie access to federal financial aid to minimum student outcome thresholds.
|
|
·
|
Prohibit institutions from funding marketing, advertising and recruiting activities with federal financial aid dollars.
|
|
·
|
Expand the reporting period for cohort default rates beyond three years.
|
|
·
|
Require that for-profits receive 15% of revenues from non-federal sources.
|
|
·
|
Extend the ban on incentive compensation to include all employees of institutions of higher education, and clarify that this ban extends to numeric threshold or quota-based termination policies.
|
The report was not adopted by the full Committee, and the minority Members released their own report criticizing the majority’s investigation in many aspects, including that it did not include a review of all institutions of higher education.
On September 21, 2012, a group of senators wrote a letter to the Federal Trade Commission urging it to evaluate the marketing practices utilized by many proprietary institutions through the use of third-party lead generators. In addition, legislation was introduced in the Senate in April 2012, which remains pending in Committee, which would prevent institutions from using Title IV funds for marketing activities.
This increased activity is expected to continue and may result in legislation, further rulemaking affecting participation in Title IV programs, and other governmental actions. In addition, concerns generated by Congressional activity may adversely affect enrollment in and revenues of for-profit educational institutions. Limitations on the amount of federal student financial aid for which our students are eligible under Title IV could materially and adversely affect our business.
We are dependent on the renewal and maintenance of Title IV programs.
Congress historically has reauthorized the Higher Education Act, which is the law governing Title IV programs, approximately every five to six years, with the next authorization expected in 2013. Congress completed the most recent reauthorization through multiple pieces of legislation and may reauthorize the Higher Education Act in a piecemeal manner in the future. Additionally, Congress determines the funding level for each Title IV program on an annual basis. Any action by Congress that significantly reduces funding for Title IV programs or the ability of our school or students to participate in these programs could materially harm our business. A reduction in government funding levels could lead to lower enrollments at our school and require us to arrange for alternative sources of financial aid for our students. Lower student enrollments or our inability to arrange such alternative sources of funding could adversely affect our business.
We are subject to compliance reviews, which, if they resulted in a material finding of non-compliance could affect our ability to participate in Title IV programs.
Because we operate in a highly regulated industry, we are subject to compliance reviews and claims of non-compliance and related lawsuits by government agencies, accrediting agencies and third parties, including claims brought by third parties on behalf of the federal government. For example, the Department of Education regularly conducts program reviews of educational institutions that are participating in Title IV programs and the Office of Inspector General of the Department of Education regularly conducts audits and investigations of such institutions. In August 2010, the Secretary of Education announced plans to increase the number of program reviews by 50% to 300 in 2011, and the Department of Education is conducting such a program review of Strayer University’s administration of Title IV programs. On March 25, 2011, the Department of Education issued a preliminary program review report indicating its position that Strayer University’s Associate in Arts in General Studies (“AAGS”) program was not an eligible program under Title IV. The Company has communicated its disagreement with this finding, has enrolled affected students in other programs, and is working with the Department of Education to resolve the matter. Strayer continues to communicate with the Department of Education, and has provided requested data, but has not received a Final Program Review Determination Letter. If such a final determination finds that we failed to comply with Title IV and its implementing regulations, the Department of Education could impose sanctions or conditions that could have a material adverse effect on our operations and financial condition. On December 22, 2011, the Department of Education notified Strayer University that its Program Participation Agreement was approved on a provisional basis because “the institution did not disburse Title IV funds timely to students in each payment period.”
29
If we fail to maintain our institutional accreditation or if our institutional accrediting body loses recognition by the Department of Education, we would lose our ability to participate in Title IV programs.
The loss of Strayer University’s accreditation by Middle States or Middle States’ loss of recognition by the Department of Education would render Strayer University ineligible to participate in Title IV programs and would have a material adverse effect on our business. In addition, an adverse action by Middle States other than loss of accreditation, such as issuance of a warning, could have a material adverse effect on our business. Increased scrutiny of accreditors by the Secretary of Education in connection with the Department of Education’s recognition process may result in increased scrutiny of institutions by accreditors or have other consequences.
If we fail to maintain any of our state authorizations, we would lose our ability to operate in that state and to participate in Title IV programs there.
Each Strayer University campus is authorized to operate and to grant degrees, diplomas or certificates by the applicable education agency of the state where the campus is located. Such state authorization is required for students at the campus to participate in Title IV programs. The loss of state authorization would, among other things, render Strayer University ineligible to participate in Title IV programs at least at those state campus locations, limit Strayer University’s ability to operate in that state and could have a material adverse effect on our business.
Effective July 1, 2011, Department of Education regulations provide that a proprietary institution is considered legally authorized by a state if the state has a process to review and appropriately act on complaints concerning the institution, including enforcing applicable state laws, and the institution complies with any applicable state approval or licensure requirements consistent with the new rules. However, if a state in which Strayer has a physical campus fails to comply in the future with the provisions of the new rule or fails to provide the University with legal authorization, it could limit Strayer University’s ability to operate in that state and have a material adverse effect on our operations.
If we fail to obtain recertification by the Department of Education when required, we would lose our ability to participate in Title IV programs.
An institution generally must seek recertification from the Department of Education at least every six years and possibly more frequently depending on various factors, such as whether it is provisionally certified. The Department of Education may also review an institution’s continued eligibility and certification to participate in Title IV programs, or scope of eligibility and certification, in the event the institution undergoes a change in ownership resulting in a change of control or expands its activities in certain ways, such as the addition of certain types of new programs, or, in certain cases, changes to the academic credentials that it offers. In certain circumstances, the Department of Education must provisionally certify an institution. The Department of Education may withdraw our certification if it determines that we are not fulfilling material requirements for continued participation in Title IV programs. If the Department of Education does not renew or withdraws our certification to participate in Title IV programs, our students would no longer be able to receive Title IV program funds, which would have a material adverse effect on our business.
Each institution participating in Title IV programs must enter into a Program Participation Agreement with the Department of Education. Under the agreement, the institution agrees to follow the Department of Education’s rules and regulations governing Title IV programs. On January 20, 2012, Strayer University executed a provisional Program Participation Agreement with the Department of Education allowing it to participate in Title IV programs until September 30, 2014. Under the provisional agreement, Strayer University must obtain Department of Education approval for substantial changes, including the addition of any new location, level of academic offering, or non-degree program.
A failure to demonstrate financial responsibility or administrative capability may result in the loss of eligibility to participate in Title IV programs.
If we fail to demonstrate financial responsibility under the Department of Education’s regulations, we could lose our eligibility to participate in Title IV programs or have that eligibility adversely conditioned, which would have a material adverse effect on our business. If we fail to maintain administrative capability as defined by the Department of Education, we could lose our eligibility to participate in Title IV programs or have that eligibility adversely conditioned, which would have a material adverse effect on our business. On December 22, 2011, the Department of Education notified Strayer University that its Program Participation Agreement was approved on a provisional basis because “the institution did not disburse Title IV funds timely to students in each payment period.”
30
Student loan defaults could result in the loss of eligibility to participate in Title IV programs.
In general, under the Higher Education Act, an educational institution may lose its eligibility to participate in some or all Title IV programs if, for three consecutive federal fiscal years, 25% or more of its students who were required to begin repaying their student loans in the relevant federal fiscal year default on their payment by the end of the next federal fiscal year. In addition, an institution may lose its eligibility to participate in some or all Title IV programs if its default rate for a federal fiscal year was greater than 40%.
Beginning with cohort default rate calculations for federal fiscal year 2009, the cohort default rate will be calculated by determining the rate at which borrowers who become subject to their repayment obligation in the relevant federal fiscal year, default by the end of the second (rather than next) federal fiscal year that follows that fiscal year. The current method of calculating rates will remain in effect and will be used to determine institutional eligibility until three consecutive years of official cohort default rates calculated under the new formula are available. In addition, the cohort default rate threshold of 25% will be increased to 30% for purposes of certain sanctions and requirements related to cohort default rates. If we lose eligibility to participate in Title IV programs because of high student loan default rates, it would have a material adverse effect on our business. Strayer University’s two-year cohort default rates for the 2008, 2009, and 2010 federal fiscal years, the three most recent years for which this information is available, were 6.7%, 10.0%, and 8.6%, respectively. The average two-year cohort default rates for proprietary institutions nationally were 11.6%, 15.0%, and 12.9% for federal fiscal years 2008, 2009, and 2010, respectively.
Our school could lose its eligibility to participate in federal student financial aid programs or be provisionally certified with respect to such participation if the percentage of our revenues derived from those programs were too high.
A proprietary institution may lose its eligibility to participate in the federal student financial aid programs if it derives more than 90% of its revenues, on a cash basis, from these programs for two consecutive fiscal years. A proprietary institution of higher education that violates the 90/10 Rule for any fiscal year will be placed on provisional status for two fiscal years. Using the formula specified in the Higher Education Opportunity Act, we derived approximately 76% of our cash-basis revenues from these programs in 2011. Certain members of Congress have proposed to revise the 90/10 Rule to count DOD tuition assistance and veterans education benefits, along with Title IV revenue, toward the 90% limit and to reduce the limit to 85% of total revenue. If we were to violate the 90/10 Rule, the loss of eligibility to participate in the federal student financial aid programs would have a material adverse effect on our business.
Our failure to comply with the Department of Education’s new gainful employment regulations could result in heightened disclosure requirements and loss of Title IV eligibility.
To be eligible for Title IV funding, academic programs offered by proprietary institutions of higher education must prepare students for gainful employment in a recognized occupation. As adopted, the gainful employment regulations were to take effect on July 1, 2012, and provided that an academic program is considered to comply with this requirement if it satisfies at least one of three metrics:
|
|
•
|
If at least 35% of students are in a satisfactory repayment status with respect to their federal student loans three to four years after entering repayment;
|
|
|
•
|
If the annual loan payment of a typical graduate of the program for all debt incurred by the graduate for the program does not exceed 30% of the average or median discretionary income in the third or fourth year after graduation; or
|
|
|
•
|
If the annual loan payment of a typical graduate of the program for all debt incurred by the graduate for the program does not exceed 12% of the average or median annual earnings in the third or fourth year after graduation.
|
A program would become ineligible for Title IV funding if it failed one of these three metrics in three out of four consecutive years, beginning with fiscal year 2012. After one failure, the institution must disclose to students the amount by which the particular program missed the metric and what the institution plans to do to improve performance. After two failures consecutively or within a three-year period, the institution must inform each current and prospective student that their debts may be unaffordable, that the program may lose eligibility, and what transfer options exists. After three failures consecutively or within four years, a program would lose eligibility for Title IV funds and could not re-establish eligibility for at least three years. The first year that a program could lose eligibility under the regulation as adopted was 2015, with eligibility losses in that year limited to the lowest 5% of all programs across institutions. The regulations as adopted provide a means by which an institution may challenge the Department of Education’s calculation of any of the three debt metrics prior to loss of Title IV eligibility.
As discussed more fully above, these metrics as well as the reporting requirements were invalidated by the U.S. District Court for the District of Columbia on June 30, 2012. However, if the rules were to be reinstituted on appeal or in a future Department of Education rulemaking that passes judicial scrutiny, the continuing eligibility of our academic programs will be affected by factors beyond management’s control such as changes in our graduates’ income levels, changes in student borrowing levels, increases in interest rates, changes in the percentage of former students who are current in the repayment of their student loans, and various other factors. Even if we were able to correct in a timely manner any deficiency in the gainful employment metrics, the disclosure requirements associated with a program’s failure to meet a metric in any year may adversely affect student enrollments in that program and may adversely affect the reputation of our institution.
31
The University must still comply with the gainful employment disclosure requirements, which were upheld by the District Court. Failure to comply with those requirements could result in sanctions or other liability, which could have a material adverse effect on our business.
Our failure to comply with the Department of Education’s incentive compensation rules could result in sanctions and other liability.
If we pay a bonus, commission or other incentive payment in violation of applicable Department of Education rules or if the Department or other third parties interpret our compensation practices as such, we could be subject to sanctions or other liability, which could have a material adverse effect on our business.
Our failure to comply with the Department of Education’s new misrepresentation rules could result in sanctions and other liability.
The Higher Education Act prohibits an institution that participates in Title IV programs from engaging in “substantial misrepresentation” of the nature of its educational program, its financial charges, or the employability of its graduates. The Department of Education’s Program Integrity Regulations, which took effect July 1, 2011, interpret this provision to prohibit any statement on those topics, made by the institution or a third party that provides educational programs, marketing, advertising, recruiting, or admissions services to the institution, that has the likelihood or tendency to confuse. Although the U.S. Court of Appeals for the District Columbia held on June 5, 2012, that the term “substantial misrepresentation” could not include true, nondeceitful statements that are merely confusing, the new misrepresentation rules are expansive. In the event of substantial misrepresentation, the Department of Education may revoke an institution’s program participation agreement, limit the institution’s participation in Title IV programs, deny applications from the institution such as to add new programs or locations, initiate proceedings to fine the institution or limit, suspend, or terminate its eligibility to participate in Title IV programs. If the Department of Education or other third parties interpret statements made by us or on our behalf to be in violation of the new regulations, we could be subject to sanctions and other liability, which could have a material adverse effect on our business.
Our failure to comply with the Department of Education’s credit hour rule could result in sanctions and other liability.
In 2009 the Department of Education’s Office of Inspector General criticized three accreditors, including Middle States, for deficiency in their oversight of institutions’ credit hour allocations. In June 2010 the House Education and Labor Committee held a hearing concerning accrediting agencies’ standards for assessing institutions’ credit hour policies. The Program Integrity Regulations define the term “credit hour” for the first time and require accrediting agencies to review the reliability and accuracy of an institution’s credit hour assignments. If an accreditor does not comply with this requirement, its recognition by the Department of Education could be jeopardized. If an accreditor identifies systematic or significant noncompliance in one or more of an institution’s programs, the accreditor must notify the Secretary of Education. If the Department of Education determines that an institution is out of compliance with the credit hour definition, the Department could impose liabilities or other sanctions.
We are subject to sanctions if we fail to calculate accurately and make timely payment of refunds of Title IV program funds for students who withdraw before completing their educational program.
The Higher Education Act and Department of Education regulations require us to calculate refunds of unearned Title IV program funds disbursed to students who withdraw from their educational program before completing it. If refunds are not properly calculated or timely paid, we may be required to post a letter of credit with the Department of Education or be subject to sanctions or other adverse actions by the Department of Education, which could have a material adverse effect on our business.
Investigations, legislative and regulatory developments and general credit market conditions related to the student loan industry may result in fewer lenders and loan products and increased regulatory burdens and costs.
The Higher Education Opportunity Act contains new requirements pertinent to relationships between lenders and institutions. In 2009 the Department of Education promulgated regulations that address these relationships, and state legislators have also passed or may be considering legislation related to relationships between lenders and institutions. In addition, new procedures introduced and recommendations made by the Consumer Financial Protection Bureau create uncertainty about whether Congress will impose new burdens on private student lenders. These developments as well as legislative and regulatory changes such as those relating to gainful employment and repayment rates creating uncertainty in the industry and general credit market conditions may cause some lenders to decide not to provide certain loan products and may impose increased administrative and regulatory costs. Such actions could reduce demand for and/or availability of private education loans, decrease Strayer University’s non-Title IV revenue and thereby increase Strayer University’s 90/10 ratio and have a material adverse effect on our business.
32
We rely on one or more third parties to administer our participation in Title IV programs and failure to comply with applicable regulations by a third-party or by us could cause us to lose our eligibility to participate in Title IV programs.
Until September 30, 2011, Global Financial Aid Services, Inc. assisted us with the administration of our participation in Title IV programs, and other third parties continue to assist us with other aspects of our participation in the Title IV programs. Because Strayer University is jointly and severally liable to the Department of Education for the actions of third-party servicers, failure of such servicers to comply with applicable regulations could have a material adverse effect on Strayer University, including loss of eligibility to participate in Title IV programs. If any of the third party servicers discontinue providing such services to us, we may not be able to replace them in a timely, cost-efficient, or effective manner, or at all, and we could lose our ability to comply with the requirements of the Title IV programs, which could adversely affect our enrollment, revenues and results of operations. Since September 30, 2011, we have directly administered Strayer University’s participation in Title IV programs, rather than relying on a third-party. If our financial aid personnel, processes, and quality assurance procedures fail to comply with applicable regulation, such failure could have a material adverse effect on Strayer University, including loss of eligibility to participate in Title IV programs.
Sequestration could reduce demand by reducing the availability of Title IV funds and increasing processing time.
Congressional actions that reduce Title IV program funding (whether through across-the-board funding reductions, sequestration or otherwise) or materially affect the eligibility of Strayer University or its students to participate in Title IV programs would have a material adverse effect on our enrollment, financial condition, results of operations and cash flows. If either the Budget Control Act of 2011 or the Statutory Pay-As-You-Go Act of 2010 triggers sequestration, funding for Title IV programs would be affected. Most federal student aid programs would be subject to across-the-board cuts at a rate of approximately 8.2%, other than Pell Grants, which would be exempt from cuts through FY2013. In addition, origination fees for Stafford loans and PLUS loans would increase. A reduction in the maximum annual Pell Grant amount or changes in eligibility could increase student borrowing and make it more difficult for us to comply with other regulatory requirements, such as the cohort default rate regulations. In addition, the Department of Education’s Federal Student Aid administration budget would be reduced by sequestration, which could delay student eligibility determinations and processing of federal student loans. These events could make it more difficult for students to obtain funding for a Strayer University education, either in a timely manner or at all.
Our business could be harmed if we experience a disruption in our ability to process student loans under the Federal Direct Loan Program.
We collected the majority of our fiscal year 2012 total consolidated net revenue from receipt of Title IV financial aid program funds, principally from federal student loans under the Federal Direct Loan Program (FDLP). Any processing disruptions by the Department of Education may affect our students’ ability to obtain student loans on a timely basis. If we experience a disruption in our ability to process student loans through the FDLP, either because of administrative challenges on our part or the inability of the Department of Education to process the volume of direct loans on a timely basis, our business, financial condition, results of operations and cash flows could be adversely and materially affected.
Risks Related to Our Business
Our growth rate is uncertain, and we may not be able to assess our future enrollments effectively.
Our growth depends on a number of factors, including many of the regulatory risks discussed above. In 2011 we revised our business model to acknowledge lower growth or reductions in enrollments. Our enrollment in 2013 could be lower than our historical performance and will be affected by legislative uncertainty, regulatory activity, and market conditions. Increased unemployment and the resulting lower confidence in job prospects may be factors contributing to lower enrollments. Until legislative, regulatory, and market uncertainty are resolved, it may be difficult to assess whether and to what extent there is an impact on our long term growth prospects. We plan to continue to invest in new campuses and to pursue our strategic goals. However, there can be no assurance as to what our growth rate will be or as to the steps we may need to take if regulatory and legislative matters are not clarified or if market conditions do not stabilize.
Our strategy of opening new campuses and adding new services is dependent on our forecast of the demand for adult-focused post-secondary education and on regulatory approvals.
Establishing new locations and adding new services require us to expend significant resources, including making human capital and financial capital investments, incurring marketing expenses and reallocating other resources. Since significant growth in enrollment in new campuses is required for them to become profitable, our willingness to add new campuses depends on our ability to predict growth in enrollment. The recent activity by the Department of Education and the U.S. Congress has introduced uncertainties into our business model and has slowed our pace of opening of new campuses, and we do not currently have plans to open new campuses in 2013. To open a new location, we are required to obtain appropriate federal, state, and accrediting agency approvals, which may be conditioned or delayed in a manner that could significantly affect our growth plans. We cannot assure investors that we will continue to open new campus locations or add new services in the future.
33
Our future success depends in part upon our ability to recruit and retain key personnel.
Our success to date has been, and our continuing success will be, substantially dependent upon our ability to attract and retain highly qualified executive officers, faculty and administrators and other key personnel. If we cease to employ any of these integral personnel or fail to manage a smooth transition to new personnel, our business could suffer.
Our success depends in part on our ability to update and expand the content of existing academic programs and develop new programs in a cost-effective manner and on a timely basis.
Our success depends in part on our ability to update and expand the content of our academic programs, develop new programs in a cost-effective manner and meet students’ needs in a timely manner. Prospective employers of our graduates increasingly demand that their entry-level employees possess appropriate technological and other skills. The update and expansion of our existing programs and the development of new programs may not be received favorably by students, prospective employers or the online education market. If we cannot respond to changes in industry requirements, our business may be adversely affected. Even if we are able to develop acceptable new programs, we may not be able to introduce these new programs as quickly as students require due to regulatory constraints or as quickly as our competitors introduce competing new programs.
Our financial performance depends in part on our ability to continue to develop awareness of the academic programs we offer among working adult students.
The continued development of awareness of the academic programs we offer among working adult students is critical to the continued acceptance and growth of our programs. If we are unable to continue to develop awareness of the programs we offer, this could limit our enrollments and negatively impact our business. The following are some of the factors that could prevent us from successfully marketing our programs:
|
●
|
the emergence of more successful competitors;
|
|
●
|
customer dissatisfaction with our services and programs;
|
|
●
|
performance problems with our online systems; and
|
|
●
|
our failure to maintain or expand our brand or other factors related to our marketing.
|
Congressional and other governmental activities could damage the reputation of Strayer University and limit our ability to attract and retain students.
Since 2010, the U.S. Congress has increased its focus on proprietary educational institutions, including administration of Title IV programs, military assistance programs, and other federal programs. The Department of Education has indicated to Congress that it intends to increase its regulation of and attention to proprietary educational institutions. And the Government Accountability Office has released several reports of investigations into proprietary educational institutions. These and other governmental activities, including new regulations on program integrity and gainful employment, even if resulting in no adverse findings or actions against Strayer, singly or cumulatively could affect public perception of investor-funded higher education, damage the reputation of Strayer University, and limit our ability to attract and retain students.
We face strong competition in the post-secondary education market.
Post-secondary education in our market area is highly competitive. We compete with traditional public and private two-year and four-year colleges, other for-profit schools and alternatives to higher education, such as employment and military service. Public colleges may offer programs similar to those of Strayer University at a lower tuition level as a result of government subsidies, government and foundation grants, tax-deductible contributions and other financial sources not available to proprietary institutions. Some of our competitors in both the public and private sectors have substantially greater financial and other resources than we do. Congress, the Department of Education, and other agencies require increasing disclosure of information to consumers. While we believe that Strayer University provides valuable education to its students, we cannot predict the bases on which individual students and potential students will choose among the range of educational and other options available to them. This strong competition could adversely affect our business.
34
Strayer University relies on exclusive proprietary rights and intellectual property, and competitors may attempt to duplicate Strayer programs and methods.
Third parties may attempt to develop competing programs or duplicate or copy aspects of Strayer University’s curriculum, online library, quality management and other proprietary content. Any such attempt, if successful, could adversely affect our business. In the ordinary course of its business, Strayer develops intellectual property of many kinds that is or will be the subject of copyright, trademark, service mark, patent, trade secret or other protections. Such intellectual property includes but is not limited to Strayer’s courseware materials for classes taught online and business know-how and internal processes and procedures developed to respond to the requirements of its various education regulatory agencies.
Seasonal and other fluctuations in our operating results could adversely affect the trading price of our common stock.
Our business is subject to seasonal fluctuations, which cause our operating results to fluctuate from quarter to quarter. This fluctuation may result in volatility or have an adverse effect on the market price of our common stock. We experience, and expect to continue to experience, seasonal fluctuations in our revenue. Historically, our quarterly revenues and income have been lowest in the third quarter (July through September) because fewer students are enrolled during the summer months. We also incur significant expenses in preparing for our peak enrollment in the fourth quarter (October through December), including investing in online and campus infrastructure necessary to support increased usage. These investments result in fluctuations in our operating results which could result in volatility or have an adverse effect on the market price of our common stock. In addition, the online education market is a rapidly evolving market, and we may not be able to forecast accurately future enrollment growth and revenues.
Regulatory requirements may make it more difficult to acquire us.
A change in ownership resulting in a change of control of Strayer would trigger a requirement for recertification of Strayer University by the Department of Education for purposes of participation in federal student financial aid programs, a review of Strayer University’s accreditation by Middle States and reauthorization of Strayer University by certain state licensing and other regulatory agencies. If we underwent a change of control that required approval by any state authority, Middle States or any federal agency, and any required regulatory approval were significantly delayed, limited or denied, there could be a material adverse effect on our ability to offer certain educational programs, award certain degrees, diplomas or certificates, operate one or more of our locations, admit certain students or participate in Title IV programs, which in turn could have a material adverse effect on our business. These factors may discourage takeover attempts.
Capacity constraints or system disruptions to Strayer University’s computer networks could damage the reputation of Strayer University and limit our ability to attract and retain students.
The performance and reliability of Strayer University’s computer networks, especially the online educational platform, is critical to our reputation and ability to attract and retain students. Any system error or failure, or a sudden and significant increase in traffic, could result in the unavailability of Strayer University’s computer networks. We cannot assure you that Strayer University, including its online educational platform, will be able to expand its program infrastructure on a timely basis sufficient to meet demand for its programs. Strayer University’s computer systems and operations could be vulnerable to interruption or malfunction due to events beyond its control, including natural disasters and telecommunications failures. Any interruption to Strayer University’s computer systems or operations could have a material adverse effect on our ability to attract and retain students.
Strayer University’s computer networks may be vulnerable to security risks that could disrupt operations and require it to expend significant resources.
Strayer University’s computer networks may be vulnerable to unauthorized access, computer hackers, computer viruses and other security problems. A user who circumvents security measures could misappropriate proprietary information or cause interruptions or malfunctions in operations. As a result, Strayer University may be required to expend significant resources to protect against the threat of these security breaches or to alleviate problems caused by these breaches.
The personal information that we collect may be vulnerable to breach, theft or loss that could adversely affect our reputation and operations.
Possession and use of personal information in our operations subjects us to risks and costs that could harm our business. We collect, use and retain large amounts of personal information regarding our students and their families, including social security numbers, tax return information, personal and family financial data and credit card numbers. We also collect and maintain personal information of our employees in the ordinary course of our business. Some of this personal information is held and managed by certain of our vendors. Although we use security and business controls to limit access and use of personal information, a third party may be able to circumvent those security and business controls, which could result in a breach of student or employee privacy. In addition, errors in the storage, use or transmission of personal information could result in a breach of student or employee privacy. Possession and use of personal information in our operations also subjects us to legislative and regulatory burdens that could require notification of data breaches and restrict our use of personal information. We cannot assure you that a breach, loss or theft of personal information will not occur. A breach, theft or loss of personal information regarding our students and their families or our employees that is held by us or our vendors could have a material adverse effect on our reputation and results of operations and result in liability under state and federal privacy statutes and legal actions by state authorities and private litigants, and any of which could have a material adverse effect on our business.
35
Strayer University, with its online programs, operates in a highly competitive market with rapid technological changes and it may not compete successfully.
Online education is a highly fragmented and competitive market that is subject to rapid technological change. Competitors vary in size and organization from traditional colleges and universities, many of which have some form of online education programs, to for-profit schools, corporate universities and software companies providing online education and training software. We expect the online education and training market to be subject to rapid changes in technologies. Strayer University’s success will depend on its ability to adapt to these changing technologies.
We may not be able to complete or integrate any future acquisitions successfully.
As part of our growth strategy, we expect to consider selective acquisitions. We cannot assure investors that we will be able to complete successfully any acquisitions on favorable terms, or that if we do, we will be able to integrate successfully the personnel, operations and technologies of any such acquisitions. Our failure to complete or integrate successfully future acquisitions could disrupt our business and materially and adversely affect our profitability and liquidity by distracting our management and employees and increasing our expenses. In addition, because an acquisition is considered a change in ownership and control of the acquired institution under applicable regulatory standards, we must seek approval from the Department of Education, if the acquired institution participates in Title IV programs, and most applicable state agencies and accrediting agencies and possibly other regulatory bodies when we acquire an institution. If we were unable to obtain such approvals of an institution we acquired, depending on the size of that acquisition, that failure could have a material adverse effect on our business.
|
Item 1B.
|
Unresolved Staff Comments
|
There are no SEC staff comments on our periodic SEC reports which are unresolved.
|
Item 2.
|
Properties
|
We lease our campus and administrative facilities except for five campus facilities which we own. Our campuses are located in Alabama, Arkansas, Delaware, Florida, Georgia, Illinois, Indiana, Kentucky, Louisiana, Maryland, Minnesota, Mississippi, Missouri, New Jersey, North Carolina, Ohio, Pennsylvania, South Carolina, Tennessee, Texas, Utah, Virginia, West Virginia, Wisconsin, and Washington, D.C., and our corporate headquarters is located in Virginia. Our leases generally range from five to 10 years with one to two renewal options for extended terms. As of December 31, 2012, we leased 98 campus and administrative facilities consisting of approximately 1.8 million square feet. The facilities that we own consist of approximately 110,000 square feet.
We evaluate current utilization of our facilities and anticipated enrollment to determine facility needs. We do not anticipate any significant addition of campus or administrative space in 2013.
|
Item 3.
|
Legal Proceedings
|
From time to time, the Company is involved in litigation and other legal proceedings arising out of the ordinary course of its business. On October 15, 2010, a putative securities class action styled
Kinnett v. Strayer Education, Inc., et al
., was filed in the United States District Court for the Middle District of Florida. On March 20, 2012, the District Court granted the Company’s motion to dismiss the complaint for failure to state a claim, and the Eleventh Circuit Court of Appeals upheld that dismissal on December 13, 2012. On April 4, 2011, a shareholder derivative action alleging similar facts was filed in the Circuit Court of Fairfax County, Virginia, which action was voluntarily dismissed by nonsuit on June 12, 2012. There are no pending material legal proceedings to which we are subject or to which our property is subject.
|
Item 4.
|
Mine Safety Disclosures
|
Not applicable.
36
|
Item 5.
|
Market for Registrant’s Common Equity, Related Stockholder Matters and Issuer Purchases of Equity Securities
|
Our common stock is traded on the NASDAQ Stock Market under the symbol “STRA.” The following table sets forth, for the periods indicated, the high, low, and closing sale prices of our common stock, as reported on the NASDAQ Stock Market.
|
High
|
Low
|
Close
|
Cash
Dividends
Declared
|
|||||||||||||
|
2011
|
||||||||||||||||
|
First Quarter
|
$ | 154.61 | $ | 113.25 | $ | 130.49 | $ | 1.00 | ||||||||
|
Second Quarter
|
$ | 152.99 | $ | 113.33 | $ | 126.39 | $ | 1.00 | ||||||||
|
Third Quarter
|
$ | 147.19 | $ | 74.48 | $ | 76.67 | $ | 1.00 | ||||||||
|
Fourth Quarter
|
$ | 100.04 | $ | 69.34 | $ | 97.19 | $ | 1.00 | ||||||||
|
2012
|
||||||||||||||||
|
First Quarter
|
$ | 120.00 | $ | 92.51 | $ | 94.28 | $ | 1.00 | ||||||||
|
Second Quarter
|
$ | 109.50 | $ | 82.46 | $ | 109.02 | $ | 1.00 | ||||||||
|
Third Quarter
|
$ | 113.28 | $ | 62.53 | $ | 64.35 | $ | 1.00 | ||||||||
|
Fourth Quarter
|
$ | 69.16 | $ | 42.98 | $ | 56.17 | $ | 1.00 | ||||||||
As of February 1, 2013, there were 11,357,324 shares of common stock outstanding, and 58 holders of record. In addition, there are approximately 7,500 institutional and other holders of common stock whose shares are held in nominee accounts by brokers.
In 2012, we paid $47.3 million in dividends or $1.00 per share each quarter. In November 2012, we announced that we do not intend to pay a regular quarterly dividend in 2013. Whether to declare dividends and the amount of dividends to be paid in the future will be reviewed periodically by our Board of Directors in light of our earnings, cash flow, financial condition, capital needs, investment opportunities and regulatory considerations. There is no requirement or assurance that common dividends will be paid in the future.
Peer Group Performance Graph
The following performance graph compares the cumulative stockholder return on our common stock since December 31, 2007 with The NASDAQ Stock Market (U.S.) Index and a self-determined peer group consisting of Apollo Group, Inc. (APOL), Career Education Corporation (CECO), Corinthian Colleges, Inc. (COCO), DeVry, Inc. (DV), and ITT Educational Services, Inc. (ESI). At present, there is no comparative index for the education industry. This graph is not deemed to be “soliciting material” or to be filed with the SEC or subject to the SEC’s proxy rules or to the liabilities of Section 18 of the Securities Exchange Act, and the graph shall not be deemed to be incorporated by reference into any of our prior or subsequent filings under the Securities Act or the Securities Exchange Act.
37
Comparison of 60 Month Cumulative Total Return*
Among Strayer Education, Inc.
The NASDAQ Stock Market (U.S.) Index and a Peer Group
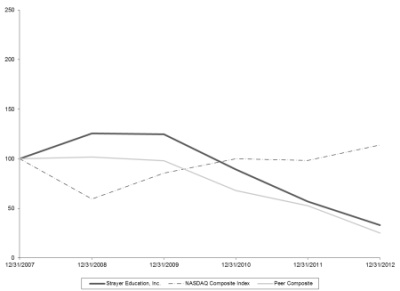
|
Name
|
12/31/07
|
12/31/08
|
12/31/09
|
12/31/10
|
12/31/11
|
12/31/12
|
||||||||||||||||||
|
Strayer Education, Inc.
|
100 | 126 | 125 | 89 | 57 | 33 | ||||||||||||||||||
|
NASDAQ Stock Market (U.S.)
|
100 | 59 | 86 | 100 | 98 | 114 | ||||||||||||||||||
|
Peer Group
|
100 | 102 | 98 | 68 | 53 | 25 | ||||||||||||||||||
|
*
|
The comparison assumes $100 was invested on December 31, 2007 in our common stock, the NASDAQ Stock Market (U.S.) Index and the peer companies selected by us.
|
There were no sales by us of unregistered securities during the year ended December 31, 2012.
In November 2003, our Board of Directors authorized us to repurchase shares of common stock in open market purchases from time to time at the discretion of our management, depending on market conditions and other corporate considerations. Our Board of Directors amended the program on various dates, increasing the repurchase amount authorized and extending the expiration date. At December 31, 2012, approximately $95.0 million of our share repurchase authorization was remaining for repurchases through the end of 2013. All of our share repurchases were effected in compliance with Rule 10b-18 under the Exchange Act. Some repurchases have been made in accordance with a share repurchase plan adopted by us under Rule 10b5-1 under the Exchange Act. Our share repurchase program may be modified, suspended or terminated at any time by us without notice.
38
A summary of our share repurchases since the inception of the plan is as follows:
|
Total
number of
shares
repurchased
|
Average
dollar price
paid per
share
|
Cost of share
repurchases
(millions)
|
||||||||||
|
2003
|
32,350 | $ | 99.57 | $ | 3.2 | |||||||
|
2004
|
346,444 | 106.13 | 36.8 | |||||||||
|
2005
|
410,071 | 92.59 | 38.0 | |||||||||
|
2006
|
349,066 | 100.39 | 35.0 | |||||||||
|
2007
|
260,818 | 146.05 | 38.1 | |||||||||
|
2008
|
603,382 | 180.86 | 109.1 | |||||||||
|
2009
|
451,613 | 177.34 | 80.1 | |||||||||
|
2010
|
687,340 | 168.06 | 115.5 | |||||||||
|
2011
|
1,581,444 | 128.15 | 202.7 | |||||||||
|
2012
|
484,841 | 51.56 | 25.0 | |||||||||
|
Total
|
5,207,369 | $ | 131.25 | $ | 683.5 | |||||||
A summary of our share repurchases during the three months ended December 31, 2012 is as follows:
|
Total
number of
shares
repurchased
(1)
|
Average
dollar price
paid per
share
|
Remaining
authorization
under the plan
(millions)
|
||||||||||
|
October
|
– | $ | – | $ | 120.0 | |||||||
|
November
|
235,161 | 48.20 | 108.7 | |||||||||
|
December
|
249,680 | 54.74 | 95.0 | |||||||||
|
Total
|
484,841 | $ | 51.56 | $ | 95.0 | |||||||
|
(1)
|
All shares repurchased were part of a publicly announced plan.
|
39
|
Item 6.
|
Selected Financial Data
|
The following table sets forth, for the periods and at the dates indicated, selected consolidated financial and operating data. The financial information has been derived from our consolidated financial statements. Effective during the first quarter of 2011, we made changes in our presentation of operating expenses and reclassified prior periods to conform to the current presentation. We determined that these changes would provide more meaningful information and increased transparency of our operations. Also effective during the first quarter of 2011, we changed the presentation of tuition receivable and unearned tuition in our consolidated balance sheets to record tuition receivable and unearned tuition for our students upon the start of the academic term. These changes have been reported retrospectively for all periods presented and had no impact on income from operations, net income, earnings per share, working capital, retained earnings, stockholders’ equity or on net cash provided by operating activities. These changes did not affect our revenue recognition policies. All prior period amounts have been reclassified to conform to the current period presentation. The information set forth below is qualified by reference to and should be read in conjunction with our consolidated financial statements and notes thereto and “Management’s Discussion and Analysis of Financial Condition and Results of Operations” and other information included elsewhere or incorporated by reference in this Annual Report on Form 10-K.
|
Year Ended December 31,
|
||||||||||||||||||||
|
2008
|
2009
|
2010
|
2011
|
2012
|
||||||||||||||||
|
(Dollar and share amounts in thousands, except per share data)
|
||||||||||||||||||||
|
Income Statement Data:
|
||||||||||||||||||||
|
Revenues
|
$ | 396,275 | $ | 511,961 | $ | 636,732 | $ | 627,434 | $ | 561,979 | ||||||||||
|
Costs and expenses:
|
||||||||||||||||||||
|
Instruction and educational support
|
167,333 | 218,551 | 269,557 | 292,003 | 300,098 | |||||||||||||||
|
Marketing
|
43,701 | 54,967 | 70,270 | 74,293 | 71,864 | |||||||||||||||
|
Admissions advisory
|
19,606 | 23,017 | 25,277 | 26,531 | 26,374 | |||||||||||||||
|
General and administration
|
38,784 | 43,072 | 55,857 | 55,464 | 50,056 | |||||||||||||||
|
Income from operations
|
126,851 | 172,354 | 215,771 | 179,143 | 113,587 | |||||||||||||||
|
Investment and other income
|
4,527 | 1,408 | 1,228 | 152 | 4 | |||||||||||||||
|
Interest expense
|
– | – | – | 3,773 | 4,616 | |||||||||||||||
|
Income before income taxes
|
131,378 | 173,762 | 216,999 | 175,522 | 108,975 | |||||||||||||||
|
Provision for income taxes
|
50,570 | 68,684 | 85,739 | 69,478 | 43,045 | |||||||||||||||
|
Net income
|
$ | 80,808 | $ | 105,078 | $ | 131,260 | $ | 106,044 | $ | 65,930 | ||||||||||
|
Net income per share:
|
||||||||||||||||||||
|
Basic
|
$ | 5.77 | $ | 7.67 | $ | 9.78 | $ | 8.91 | $ | 5.79 | ||||||||||
|
Diluted
|
$ | 5.67 | $ | 7.60 | $ | 9.70 | $ | 8.88 | $ | 5.76 | ||||||||||
|
Weighted average shares outstanding:
|
||||||||||||||||||||
|
Basic
|
14,015 | 13,703 | 13,426 | 11,906 | 11,390 | |||||||||||||||
|
Diluted
(a)
|
14,242 | 13,825 | 13,535 | 11,943 | 11,440 | |||||||||||||||
|
Other Data:
|
||||||||||||||||||||
|
Depreciation and amortization
|
$ | 10,761 | $ | 13,937 | $ | 17,309 | $ | 21,525 | $ | 23,973 | ||||||||||
|
Stock-based compensation expense
|
$ | 11,127 | $ | 10,954 | $ | 11,987 | $ | 13,234 | $ | 5,464 | ||||||||||
|
Capital expenditures
|
$ | 20,657 | $ | 30,431 | $ | 46,015 | $ | 29,991 | $ | 24,733 | ||||||||||
|
Cash dividends per common share (paid):
|
||||||||||||||||||||
|
Regular
|
$ | 1.63 | $ | 2.25 | $ | 3.25 | $ | 4.00 | $ | 4.00 | ||||||||||
|
Special
|
$ | 2.00 | – | – | – | – | ||||||||||||||
|
Average enrollment
(b)
|
38,449 | 47,142 | 56,002 | 53,901 | 49,323 | |||||||||||||||
|
Campuses
(c)
|
60 | 71 | 84 | 92 | 97 | |||||||||||||||
|
Full-time employees
(d)
|
1,488 | 1,811 | 2,099 | 2,140 | 2,019 | |||||||||||||||
40
|
At December 31,
|
||||||||||||||||||||
|
2008
|
2009
|
2010
|
2011
|
2012
|
||||||||||||||||
|
(In thousands)
|
||||||||||||||||||||
|
Balance Sheet Data:
|
||||||||||||||||||||
|
Cash, cash equivalents and marketable securities
|
$ | 107,331 | $ | 116,516 | $ | 76,493 | $ | 57,137 | $ | 47,517 | ||||||||||
|
Working capital
(e)
|
112,679 | 105,735 | 62,205 | 17,484 |
46,631
|
|||||||||||||||
|
Total assets
|
216,088 | 238,441 | 235,178 | 231,133 | 227,792 | |||||||||||||||
|
Long-term debt
|
– | – | – | 90,000 | 121,875 | |||||||||||||||
|
Other long-term liabilities
|
11,663 | 11,745 | 12,644 | 21,656 |
21,905
|
|||||||||||||||
|
Total liabilities
|
40,007 | 48,621 | 59,174 | 188,840 | 186,804 | |||||||||||||||
|
Total stockholders’ equity
|
176,081 | 189,820 | 176,004 | 42,293 | 40,988 | |||||||||||||||
|
(a)
|
Diluted weighted average shares outstanding include common shares issued and outstanding, and the dilutive impact of restricted stock and outstanding stock options using the Treasury Stock Method.
|
|
(b)
|
Reflects average student enrollment for the four academic terms for each year indicated.
|
|
(c)
|
Reflects number of campuses offering classes during the fourth quarter of each year indicated.
|
|
(d)
|
Reflects full-time employees including full-time faculty as of December 31 of each year.
|
|
(e)
|
Working capital is calculated by subtracting current liabilities from current assets.
|
|
Item 7.
|
Management’s Discussion and Analysis of Financial Condition and Results of Operations
|
You should read the following discussion in conjunction with “Selected Historical Financial and Other Information,” our consolidated financial statements and the notes thereto, the “Cautionary Notice Regarding Forward-Looking Statements,” Item 1A entitled “Risk Factors” and the other information appearing elsewhere, or incorporated by reference, in this Annual Report on Form 10-K.
Background and Overview
We are an education services holding company that owns Strayer University. Strayer University is an institution of higher education which offers undergraduate and graduate degree programs at 100 campuses in Alabama, Arkansas, Delaware, Florida, Georgia, Illinois, Indiana, Kentucky, Louisiana, Maryland, Minnesota, Mississippi, Missouri, New Jersey, North Carolina, Ohio, Pennsylvania, South Carolina, Tennessee, Texas, Utah, Virginia, West Virginia, Wisconsin, and Washington, D.C., and worldwide via the Internet.
Set forth below are average enrollment, full-time tuition rates, revenues, income from operations, net income, and diluted net income per share for the last three years.
|
Year Ended December 31,
|
||||||||||||
|
2010
|
2011
|
2012
|
||||||||||
|
Average enrollment
|
56,002 | 53,901 | 49,323 | |||||||||
|
% Change from prior year
|
19 | % | (4 | %) | (8 | %) | ||||||
|
Full-time tuition (per course)
|
$ | 1,515 | $ | 1,590 | $ | 1,650 | ||||||
|
% Change from prior year
|
5 | % | 5 | % | 4 | % | ||||||
|
Revenues (in thousands)
|
$ | 636,732 | $ | 627,434 | $ | 561,979 | ||||||
|
% Change from prior year
|
24 | % | (1 | %) | (10 | %) | ||||||
|
Income from operations (in thousands)
|
$ | 215,771 | $ | 179,143 | $ | 113,587 | ||||||
|
% Change from prior year
|
25 | % | (17 | %) | (37 | %) | ||||||
|
Net income (in thousands)
|
$ | 131,260 | $ | 106,044 | $ | 65,930 | ||||||
|
% Change from prior year
|
25 | % | (19 | %) | (38 | %) | ||||||
|
Diluted net income per share
|
$ | 9.70 | $ | 8.88 | $ | 5.76 | ||||||
|
% Change from prior year
|
28 | % | (8 | %) | (35 | %) | ||||||
Strayer University derives approximately 96% of its revenue from tuition collected from its students. The academic year of the University is divided into four quarters, which approximately coincide with the four quarters of the calendar year. Students make payment arrangements for the tuition for each course at the time of enrollment. Tuition revenue is recognized in the quarter of instruction. If a student withdraws from a course prior to completion, the University refunds a portion of the tuition depending on when the withdrawal occurs. Tuition revenue is shown net of any refunds, withdrawals, corporate discounts, employee tuition discounts and scholarships. The University also derives revenue from other sources such as textbook-related income, application fees, technology fees, placement test fees, withdrawal fees, certificate revenue, and other income, which are all recognized when earned.
41
We record tuition receivable and unearned tuition for our students upon the start of the academic term. Because the University’s academic quarters coincide with the calendar quarters, at the end of the fiscal quarter (and academic term), tuition receivable represents amounts due from students for educational services already provided and unearned tuition represents advance payments from students for academic services to be provided in the future. Based upon past experience and judgment, the University establishes an allowance for doubtful accounts with respect to accounts receivable. Any uncollected account more than six months past due is charged against the allowance. Our bad debt expense as a percentage of revenues for the years ended December 31, 2010, 2011, and 2012 was 3.8%, 4.0% and 4.2%, respectively.
Effective during the first quarter of 2011, we made changes in our presentation of operating expenses and reclassified prior periods to conform to the current presentation. We determined that these changes would provide more meaningful information and increased transparency of our operations. There were no changes to the total operating expenses or operating income as a result of these reclassifications. Below is a description of the nature of the costs included in our operating expense categories:
|
|
•
|
Instruction and educational support expenses
generally contain items of expense directly attributable to educational activities of the University. This expense category includes salaries and benefits of faculty and academic administrators, as well as administrative personnel who support and serve student interests. Instruction and educational support expenses also include costs of educational supplies and facilities, including rent for campus facilities, certain costs of establishing and maintaining computer laboratories and all other physical plant and occupancy costs, with the exception of costs attributable to the corporate offices. Bad debt expense incurred on delinquent student account balances is also included in instruction and educational support expenses.
|
|
|
•
|
Marketing expenses
include the costs of advertising and production of marketing materials and related personnel costs.
|
|
|
•
|
Admissions advisory expenses
include salaries, benefits and related costs of personnel engaged in admissions.
|
|
|
•
|
General and administration expenses
include salaries and benefits of management and employees engaged in accounting, human resources, legal, regulatory compliance, and other corporate functions, along with the occupancy and other related costs attributable to such functions.
|
Investment income consists primarily of earnings and realized gains or losses on investments, and interest expense consists of interest incurred on our outstanding borrowings, unused revolving credit facility fees, and amortization of deferred financing costs.
Critical Accounting Policies and Estimates
“Management’s Discussion and Analysis of Financial Condition and Results of Operations” discusses our consolidated financial statements, which have been prepared in accordance with accounting principles generally accepted in the United States of America. The preparation of these consolidated financial statements requires management to make estimates and judgments that affect the reported amounts of assets, liabilities, revenues and expenses and the related disclosures of contingent assets and liabilities. On an ongoing basis, management evaluates its estimates and judgments related to its allowance for doubtful accounts, income tax provisions, the useful lives of property and equipment, valuation of deferred tax assets, goodwill, and intangible assets, valuation of its interest rate swap arrangement, forfeiture rates and achievability of performance targets for stock-based compensation plans, and accrued expenses. Management bases its estimates and judgments on historical experience and various other factors and assumptions that are believed to be reasonable under the circumstances, the results of which form the basis for making judgments regarding the carrying values of assets and liabilities that are not readily apparent from other sources. Management regularly reviews its estimates and judgments for reasonableness and may modify them in the future. Actual results may differ from these estimates under different assumptions or conditions.
Management believes that the following critical accounting policies are its more significant judgments and estimates used in the preparation of its consolidated financial statements. Tuition revenue is recognized as income, net of any refunds or withdrawals, in the respective quarter of instruction. Advance registrations for future quarters are recorded as unearned tuition at the start of each academic term. Any cash received prior to the start of an academic term is recorded as unearned tuition. We record estimates for our allowance for doubtful accounts for tuition receivable from students. If the financial condition of our students were to deteriorate, resulting in impairment of their ability to make required payments for tuition payable to us, additional allowances may be required. We record estimates for certain of our accrued expenses and income tax liabilities. We estimate the useful lives of our property and equipment. We periodically assess goodwill and intangible assets for impairment. We assess the value of our interest rate swap arrangement every quarter. We periodically review our assumed forfeiture rates and ability to achieve performance targets for stock-based awards and adjust them as necessary. Should actual results differ from our estimates, revisions to our accrued expenses, carrying amount of goodwill and intangible assets, stock-based compensation expense, and income tax liabilities may be required.
42
New Campuses
Our goal is to serve the demand for post-secondary adult education nationwide by opening new campuses. For the last twelve years, we have pursued this goal by opening new campuses. A new campus typically requires approximately $1 million in upfront capital costs for leasehold improvements, furniture and fixtures, and computer equipment. In the first year of operation, assuming a mid-year opening, we expect to incur operating losses of approximately $1.0-$1.2 million including depreciation related to the upfront capital costs. A new campus is typically expected to begin generating operating income on a quarterly basis after six quarters of operation, which is generally upon reaching an enrollment level of about 250-300 students. Our new campus notional model assumes an increase of average enrollment by 100-150 students per year until reaching a level of about 1,000 students. Given the potential internal rate of return achieved with each new campus, opening new campuses is an important part of our strategy. We believe opening new campuses and having the option to attend classes on campus is important to attracting, retaining and servicing students. We believe we have sufficient capital resources from cash, cash equivalents, cash generated from operating activities and availability on our credit facility (discussed below) to continue to open new campuses, although we currently are not planning to open any in 2013. We opened eight new campuses in 2011 and eight in 2012. See “New Campuses Opened” table in Item 1 for information regarding the locations of these new campuses.
Results of Operations
In 2012, we generated $562.0 million in revenue, a 10% decrease compared to 2011, primarily as a result of a decline in average enrollment of 8%. Income from operations was $113.6 million in 2012, a decrease of 37% compared to 2011. Net income in 2012 was $65.9 million, a decrease of 38% compared to 2011. Earnings per diluted share was $5.76 in 2012 compared to $8.88 in 2011, a decrease of 35%.
Key enrollment trends by quarter were as follows:
|
Academic Term
|
2011
|
2012
|
%
Change
|
% Change
in new
students
|
|||||||||||||
|
Winter
|
57,608 | 50,432 | -12 | % | -8 | % | |||||||||||
|
Spring
|
55,974 | 50,896 | -9 | % | 12 | % | |||||||||||
|
Summer
|
47,790 | 44,236 | -7 | % | 9 | % | |||||||||||
|
Fall
|
54,233 | 51,727 | -5 | % | 4 | % | |||||||||||
|
Average
|
53,901 | 49,323 | -8 | % | 4 | % | |||||||||||
Although we do not know for sure why our recent enrollment trends and that of the proprietary higher education sector generally have been negative, we believe that sustained levels of high unemployment and the resulting lower confidence in job prospects are contributing factors. The 19% decline in our new students in 2011 had an adverse impact on 2012 enrollment since there were fewer students from 2011 continuing their education in 2012. We believe it will take several quarters of new student growth in order to achieve overall enrollment growth.
We cannot predict future enrollments or whether new student enrollment will decline further, stabilize or increase in response to the economy or other factors. We can describe what we think our business model may look like financially under different enrollment scenarios. We implemented a 3% tuition increase in 2013 but we expect roughly flat revenue per student in 2013 due to the University’s continued mix shift towards graduate and corporate sponsored students, as well as continued targeted use of scholarships. We also expect Strayer University’s expenses to grow 1% to 2% in 2013, reflecting the annualization of operating costs at the eight new campuses opened during 2012, but that no additional campuses are currently planned for 2013. We expect that at the 2012 revenue level, anticipated 2013 expenses would lead to a 19-20% operating margin in 2013, and EPS in the $5.40-$5.60 range. Each 1% increase (or decrease) in revenue from 2012 levels in 2013 will have an approximate 50 basis points positive (or negative) impact on operating margin, and an approximate $0.20 positive (or negative) impact on earnings per share. Finally, this model assumes an effective tax rate of 39.5% and 11,500,000 diluted shares outstanding.
43
The following table sets forth certain income statement data as a percentage of revenues for the periods indicated:
|
Year Ended December 31,
|
||||||||||||
|
2010
|
2011
|
2012
|
||||||||||
|
Revenues
|
100.0 | % | 100.0 | % | 100.0 | % | ||||||
|
Costs and expenses:
|
||||||||||||
|
Instruction and educational support
|
42.3 | 46.6 | 53.4 | |||||||||
|
Marketing
|
11.0 | 11.8 | 12.8 | |||||||||
|
Admissions advisory
|
4.0 | 4.2 | 4.7 | |||||||||
|
General and administration
|
8.8 | 8.8 | 8.9 | |||||||||
|
Income from operations
|
33.9 | 28.6 | 20.2 | |||||||||
|
Investment income
|
0.2 | – | – | |||||||||
|
Interest expense
|
– | 0.6 | 0.8 | |||||||||
|
Income before income taxes
|
34.1 | 28.0 | 19.4 | |||||||||
|
Provision for income taxes
|
13.5 | 11.1 | 7.7 | |||||||||
|
Net income
|
20.6 | % | 16.9 | % | 11.7 | % | ||||||
|
Effective tax rate
|
39.5 | % | 39.6 | % | 39.5 | % | ||||||
Year Ended December 31, 2012 Compared To Year Ended December 31, 2011
Enrollment.
Average enrollment decreased 8% to 49,323 students for the year ended December 31, 2012 from 53,901 students for the same period in 2011.
Revenues.
Revenues decreased 10% to $562.0 million in 2012 from $627.4 million in 2011 principally due to lower average enrollment.
Instruction and educational support expenses.
Instruction and educational support expenses increased $8.1 million, or 3%, to $300.1 million in 2012 from $292.0 million in 2011. This increase includes approximately $6.0 million of additional costs necessary to support our opening of eight new campuses during 2012, and approximately $2.4 million of one-time costs associated with the consolidation of certain non-campus functions. These expenses as a percentage of revenues increased to 53.4% in 2012 from 46.6% in 2011, largely due to instructional and academic staff costs growing while tuition revenues declined.
Marketing expenses.
Marketing expenses decreased $2.4 million, or 3%, to $71.9 million in 2012 from $74.3 million in 2011. These expenses as a percentage of revenues increased to 12.8% in 2012 from 11.8% in 2011, largely due to marketing expenses decreasing at a lower rate than tuition revenue.
Admissions advisory expenses
. Admissions advisory expenses decreased slightly by $0.1 million, or 1%, to $26.4 million in 2012 from $26.5 million in 2011. Admissions advisory expenses as a percentage of revenues increased to 4.7% in 2012 from 4.2% in 2011 as these expenses remained largely unchanged while tuition revenue declined.
General and administration expenses.
General and administration expenses decreased $5.4 million, or 10%, to $50.1 million in 2012 from $55.5 million in 2011. The decrease is primarily attributable to lower stock-based compensation expense of $7.0 million related to certain awards with performance criteria that are unlikely to be met, partially offset by one-time charges including costs associated with the consolidation of certain administrative functions. General and administration expenses as a percentage of revenues remained largely unchanged at 8.9% in 2012 compared to 8.8% in 2011.
Income from operations.
Income from operations decreased $65.5 million, or 37%, to $113.6 million in 2012 from $179.1 million in 2011, due to the aforementioned factors.
Investment income.
Investment income decreased from $0.2 million to approximately $4,000 in 2012. This decrease was principally due to lower investment yields on existing cash balances.
Interest expense.
Interest expense increased $0.8 million, or 22% to $4.6 million in 2012 compared to $3.8 million in 2011 primarily due to higher average borrowings in 2012.
Provision for income taxes.
Income tax expense decreased $26.5 million, or 38%, to $43.0 million in 2012 from $69.5 million in 2011, primarily due to the decrease in income before taxes attributable to the factors discussed above. Our effective tax rate was 39.5% for 2012 as compared to 39.6% for 2011.
44
Net income.
Net income decreased $40.1 million, or 38%, to $65.9 million in 2012 from $106.0 million in 2011 due to the factors discussed above.
Year Ended December 31, 2011 Compared To Year Ended December 31, 2010
Enrollment.
Average enrollment decreased 4% to 53,901 students for the year ended December 31, 2011 from 56,002 students for the same period in 2010.
Revenues.
Revenues decreased 1% to $627.4 million in 2011 from $636.7 million in 2010 principally due to lower average enrollment, partly offset by a 5% tuition increase implemented at the beginning of 2011.
Instruction and educational support expenses.
Instruction and educational support expenses increased $22.4 million, or 8%, to $292.0 million in 2011 from $269.6 million in 2010. This increase was principally due to direct costs necessary to support students at existing and new campuses, including faculty and related academic staff compensation ($14.6 million) and campus facility costs ($6.3 million). These expenses as a percentage of revenues increased to 46.6% in 2011 from 42.3% in 2010, largely due to instructional and academic staff costs growing at a higher rate than tuition revenues.
Marketing expenses.
Marketing expenses increased $4.0 million, or 6%, to $74.3 million in 2011 from $70.3 million in 2010. This increase was principally due to the direct costs required to build the Strayer University brand, particularly in new markets, and to attract prospective students. These expenses as a percentage of revenues increased to 11.8% in 2011 from 11.0% in 2010 primarily due to incremental expenditures in new markets and lower tuition revenue.
Admissions advisory expenses
. Admissions advisory expenses increased $1.2 million, or 5%, to $26.5 million in 2011 from $25.3 million in 2010. This increase was principally due to the addition of admissions personnel, particularly at new campuses. Admissions advisory expenses as a percentage of revenues increased slightly to 4.2% in 2011 from 4.0% in 2010.
General and administration expenses.
General and administration expenses decreased $0.4 million, or 1%, to $55.5 million in 2011 from $55.9 million in 2010. General and administration expenses as a percentage of revenues were 8.8% in both 2011 and 2010.
Income from operations.
Income from operations decreased $36.7 million, or 17%, to $179.1 million in 2011 from $215.8 million in 2010, due to the aforementioned factors.
Investment income.
Investment income decreased $1.0 million to $0.2 million in 2011 from $1.2 million in 2010. This decrease was principally due to a lower average cash balance and lower investment yields.
Interest expense.
Interest expense, which was $3.8 million in 2011, related to borrowings against the revolving credit facility and term loan facility, and unused revolving credit fees. There were no borrowings in 2010.
Provision for income taxes.
Income tax expense decreased $16.2 million, or 19%, to $69.5 million in 2011 from $85.7 million in 2010, primarily due to the decrease in income before taxes attributable to the factors discussed above. Our effective tax rate increased slightly to 39.6% for 2011 as compared to 39.5% for 2010.
Net income.
Net income decreased $25.3 million, or 19%, to $106.0 million in 2011 from $131.3 million in 2010 due to the factors discussed above.
Seasonality
Our quarterly results of operations tend to vary significantly within a year because of student enrollment patterns. Enrollment generally is highest in the fourth quarter, or fall term, and lowest in the third quarter, or summer term. In 2012, enrollment by term was as follows:
2012 Enrollment by Term
|
Term
|
Enrollment
|
|||
|
Winter
|
50,432 | |||
|
Spring
|
50,896 | |||
|
Summer
|
44,236 | |||
|
Fall
|
51,727 | |||
|
Average
|
49,323 | |||
45
The following table sets forth our revenues on a quarterly basis for the years ended December 31, 2010, 2011 and 2012:
Quarterly Revenues
(dollars in thousands)
|
2010
|
2011
|
2012
|
|||||||||||||||||||||||||
|
Three Months Ended
|
Amount
|
Percent
|
Amount
|
Percent
|
Amount
|
Percent
|
|||||||||||||||||||||
|
March 31
|
$ | 157,901 | 25 | % | $ | 171,956 | 27 | % | $ | 149,532 | 27 | % | |||||||||||||||
|
June 30
|
159,283 | 25 | 163,789 | 26 | 146,254 | 26 | |||||||||||||||||||||
|
September 30
|
147,597 | 23 | 135,865 | 22 | 124,260 | 22 | |||||||||||||||||||||
|
December 31
|
171,951 | 27 | 155,824 | 25 | 141,933 | 25 | |||||||||||||||||||||
|
Total for Year
|
$ | 636,732 | 100 | % | $ | 627,434 | 100 | % | $ | 561,979 | 100 | % | |||||||||||||||
Costs generally are not affected by the seasonal factors as much as enrollment and revenue, and do not vary significantly on a quarterly basis.
Liquidity and Capital Resources
At December 31, 2012, we had cash and cash equivalents of $47.5 million compared to $57.1 million at December 31, 2011. At December 31, 2012, most of our cash was invested in bank overnight deposits.
On November 8, 2012, we entered into a second amended and restated revolving credit and term loan agreement which is secured by our assets and provides for a $100.0 million revolving credit facility and $125.0 million term loan facility with a maturity date of December 31, 2016. Proceeds from the new term loan were used to pay off $77.5 million outstanding under the original term loan facility. We had no outstanding balance under the prior revolving credit facility on the day of closing. At December 31, 2012, we had $125.0 million outstanding under the new term loan and no balance outstanding under the revolving credit facility. In 2013, we are obligated to repay $3.1 million of the term loan.
For the year ended December 31, 2012, we generated $82.1 million net cash from operating activities compared to $154.4 million for the same period in 2011. Capital expenditures were $24.7 million for the year ended December 31, 2012 compared to $30.0 million for the same period in 2011. Capital expenditures for the year ending December 31, 2013 are expected to be in the range of $15-20 million as we are not currently planning to open additional campuses in 2013.
For the year ended December 31, 2012, we paid $47.3 million in regular cash dividends and invested $25.0 million to repurchase common shares in the open market. In 2013, we do not intend to pay a regular quarterly dividend.
In 2012, bad debt expense as a percentage of revenue was 4.2% compared to 4.0% for the same period in 2011. Days sales outstanding was 15 days at the end of the fourth quarter of both 2012 and 2011.
Currently, we maintain our cash in mostly FDIC-insured bank accounts and invest our excess cash in money market funds. We have available $100 million under our revolving credit facility. We believe that existing cash and cash equivalents, cash generated from operating activities, and if necessary, cash borrowed under the credit facility, will be sufficient to meet our requirements for at least the next 12 months.
The table below sets forth our cash and cash equivalents and marketable securities as of December 31, 2010, 2011 and 2012:
Cash and Marketable Securities
(in millions)
|
At December 31,
|
||||||||||||
|
2010
|
2011
|
2012
|
||||||||||
|
Cash and cash equivalents
|
$ | 64.1 | $ | 57.1 | $ | 47.5 | ||||||
|
Marketable securities (short-term bond fund)
|
12.4 | – | – | |||||||||
|
Total
|
$ | 76.5 | $ | 57.1 | $ | 47.5 | ||||||
|
Year Ended December 31,
|
||||||||||||
|
2010
|
2011
|
2012
|
||||||||||
|
Investment income
|
$ | 1.2 | $ | 0.1 | $ | 0.0 | ||||||
46
Contractual Obligations
The table below sets forth our contractual commitments associated with operating leases and the repayment of debt as of December 31, 2012:
|
Payments Due By Period (in thousands)
|
||||||||||||||||||||
|
Total
|
Within
1 Year
|
1-3 Years
|
3-5 Years
|
More than
5 Years
|
||||||||||||||||
|
Operating leases
|
$ | 242,429 | $ | 39,992 | $ | 77,128 | $ | 59,393 | $ | 65,916 | ||||||||||
|
Term loan
|
125,000 | 3,125 | 9,375 | 112,500 | – | |||||||||||||||
| $ | 367,429 | $ | 43,117 | $ | 86,503 | $ | 171,893 | $ | 65,916 | |||||||||||
Impact of Inflation
Inflation has not had a significant impact on our historical operations.
Off-Balance Sheet Arrangements
As of December 31, 2012, we do not have any off-balance sheet arrangements as defined by Item 303(a)(4) of the Securities Exchange Commission Regulation S-K.
We are subject to the impact of interest rate changes and may be subject to changes in the market values of our future investments. We invest our excess cash in bank overnight deposits, money market funds and marketable securities. We have not used derivative financial instruments in our investment portfolio. Earnings from investments in bank overnight deposits, money market mutual funds, and marketable securities may be adversely affected in the future should interest rates decline, although such a decline may reduce the interest rate payable on any borrowings under our revolving credit facility. Our future investment income may fall short of expectations due to changes in interest rates or we may suffer losses in principal if forced to sell securities that have declined in market value due to changes in interest rates. As of December 31, 2012, a 1% increase or decrease in interest rates would not have a material impact on our future earnings, fair values, or cash flows related to investments in cash equivalents or interest earning marketable securities.
Changing interest rates could also have a negative impact on the amount of interest expense we incur. On November 8, 2012, we entered into a second amended and restated revolving credit and term loan agreement providing for a $100 million revolving credit facility and a $125 million term loan facility. Borrowings under the $100 million revolving credit facility bear interest at LIBOR or a base rate plus a margin ranging from 2.00% to 2.50%, depending on our leverage ratio. Also on November 8, 2012, we entered into an additional interest rate swap arrangement for the $125 million term loan facility that fixes our interest rate on the term loan facility at approximately 3.1% for the duration of the term loan. Although an increase in LIBOR would not affect interest expense on the term loan, it would affect interest expense on any outstanding balance of the revolving credit facility and the fair value of the interest rate swap arrangement. For every 100 basis points increase in LIBOR, we would incur an incremental $1.0 million in interest expense per year assuming the entire $100 million revolving credit facility were utilized, but such an increase in LIBOR would not materially affect the value of our interest rate swap.
47
|
Item 8.
|
Financial Statements and Supplementary Data
|
INDEX TO CONSOLIDATED FINANCIAL STATEMENTS
|
Page
|
|
|
Strayer Education, Inc.
|
|
|
Report of Independent Registered Public Accounting Firm
|
49
|
|
Consolidated Balance Sheets as of December 31, 2011 and 2012
|
50
|
|
Consolidated Statements of Income for each of the three years in the period ended December 31, 2012
|
51
|
|
Consolidated Statements of Comprehensive Income for each of the three years in the period ended December 31, 2012
|
51
|
|
Consolidated Statements of Stockholders’ Equity for each of the three years in the period ended December 31, 2012
|
52
|
|
Consolidated Statements of Cash Flows for each of the three years in the period ended December 31, 2012
|
53
|
|
Notes to Consolidated Financial Statements
|
54
|
|
Schedule II-Valuation and Qualifying Accounts
|
68
|
All other schedules are omitted because they are not applicable or the required information is included in the consolidated financial statements or notes thereto.
48
Report of Independent Registered Public Accounting Firm
To Board of Directors and Stockholders
Strayer Education, Inc.
In our opinion, the consolidated financial statements listed in the accompanying index present fairly, in all material respects, the financial position of Strayer Education, Inc. and its subsidiaries (the “Company”) at December 31, 2012 and 2011, and the results of their operations and their cash flows for each of the three years in the period ended December 31, 2012 in conformity with accounting principles generally accepted in the United States of America. In addition, in our opinion, the financial statement schedule listed in the accompanying index presents fairly, in all material respects, the information set forth therein when read in conjunction with the related consolidated financial statements. Also in our opinion, the Company maintained, in all material respects, effective internal control over financial reporting as of December 31, 2012, based on criteria established in
Internal Control – Integrated Framework
issued by the Committee of Sponsoring Organizations of the Treadway Commission (COSO). The Company’s management is responsible for these financial statements and financial statement schedule, for maintaining effective internal control over financial reporting and for its assessment of the effectiveness of internal control over financial reporting, included in Management’s Report on Internal Control Over Financial Reporting appearing under Item 9A. Our responsibility is to express opinions on these financial statements, on the financial statement schedule, and on the Company’s internal control over financial reporting based on our integrated audits. We conducted our audits in accordance with the standards of the Public Company Accounting Oversight Board (United States). Those standards require that we plan and perform the audits to obtain reasonable assurance about whether the financial statements are free of material misstatement and whether effective internal control over financial reporting was maintained in all material respects. Our audits of the financial statements included examining, on a test basis, evidence supporting the amounts and disclosures in the financial statements, assessing the accounting principles used and significant estimates made by management, and evaluating the overall financial statement presentation. Our audit of internal control over financial reporting included obtaining an understanding of internal control over financial reporting, assessing the risk that a material weakness exists, and testing and evaluating the design and operating effectiveness of internal control based on the assessed risk. Our audits also included performing such other procedures as we considered necessary in the circumstances. We believe that our audits provide a reasonable basis for our opinions.
A company’s internal control over financial reporting is a process designed to provide reasonable assurance regarding the reliability of financial reporting and the preparation of financial statements for external purposes in accordance with generally accepted accounting principles. A company’s internal control over financial reporting includes those policies and procedures that (i) pertain to the maintenance of records that, in reasonable detail, accurately and fairly reflect the transactions and dispositions of the assets of the company; (ii) provide reasonable assurance that transactions are recorded as necessary to permit preparation of financial statements in accordance with generally accepted accounting principles, and that receipts and expenditures of the company are being made only in accordance with authorizations of management and directors of the company; and (iii) provide reasonable assurance regarding prevention or timely detection of unauthorized acquisition, use, or disposition of the company’s assets that could have a material effect on the financial statements.
Because of its inherent limitations, internal control over financial reporting may not prevent or detect misstatements. Also, projections of any evaluation of effectiveness to future periods are subject to the risk that controls may become inadequate because of changes in conditions, or that the degree of compliance with the policies or procedures may deteriorate.
PricewaterhouseCoopers LLP
McLean, Virginia
February 19, 2013
49
STRAYER EDUCATION, INC.
(in thousands, except share and per share data)
|
December 31,
|
||||||||
|
2011
|
2012
|
|||||||
|
ASSETS
|
||||||||
|
Current assets:
|
||||||||
|
Cash and cash equivalents
|
$ | 57,137 | $ | 47,517 | ||||
|
Tuition receivable, net of allowances for doubtful accounts of $7,279 and $6,596 at December 31, 2011 and 2012, respectively
|
25,006 | 23,262 | ||||||
|
Income taxes receivable
|
394 | 4,454 | ||||||
|
Other current assets
|
12,131 | 14,422 | ||||||
|
Total current assets
|
94,668 | 89,655 | ||||||
|
Property and equipment, net
|
121,149 | 121,520 | ||||||
|
Deferred income taxes
|
3,326 | 3,279 | ||||||
|
Goodwill
|
6,800 | 6,800 | ||||||
|
Other assets
|
5,190 | 6,538 | ||||||
|
Total assets
|
$ | 231,133 | $ | 227,792 | ||||
|
LIABILITIES & STOCKHOLDERS’ EQUITY
|
||||||||
|
Current liabilities:
|
||||||||
|
Accounts payable and accrued expenses
|
$ | 34,039 | $ |
39,124
|
||||
|
Unearned tuition
|
15,364 | 494 | ||||||
|
Other current liabilities
|
281 | 281 | ||||||
|
Current portion of term loan
|
27,500 | 3,125 | ||||||
|
Total current liabilities
|
77,184 |
43,024
|
||||||
|
Revolving credit facility
|
20,000 | – | ||||||
|
Term loan, less current portion
|
70,000 | 121,875 | ||||||
|
Other long-term liabilities
|
21,656 | 21,905 | ||||||
|
Total liabilities
|
188,840 | 186,804 | ||||||
|
Commitments and contingencies
|
||||||||
|
Stockholders’ equity:
|
||||||||
|
Common stock, par value $.01; 20,000,000 shares authorized; 11,792,456 and 11,387,299 shares issued and outstanding at December 31, 2011 and 2012, respectively
|
118 | 114 | ||||||
|
Additional paid-in capital
|
295 | 299 | ||||||
|
Retained earnings
|
42,491 | 41,311 | ||||||
|
Accumulated other comprehensive income (loss)
|
(611 | ) | (736 | ) | ||||
|
Total stockholders’ equity
|
42,293 | 40,988 | ||||||
|
Total liabilities and stockholders’ equity
|
$ | 231,133 | $ | 227,792 | ||||
The accompanying notes are an integral part of these consolidated financial statements.
50
STRAYER EDUCATION, INC.
(in thousands, except per share data)
|
For the Year Ended
December 31,
|
||||||||||||
|
2010
|
2011
|
2012
|
||||||||||
|
Revenues
|
$ | 636,732 | $ | 627,434 | $ | 561,979 | ||||||
|
Costs and expenses:
|
||||||||||||
|
Instruction and educational support
|
269,557 | 292,003 | 300,098 | |||||||||
|
Marketing
|
70,270 | 74,293 | 71,864 | |||||||||
|
Admissions advisory
|
25,277 | 26,531 | 26,374 | |||||||||
|
General and administration
|
55,857 | 55,464 | 50,056 | |||||||||
|
Income from operations
|
215,771 | 179,143 | 113,587 | |||||||||
|
Investment income
|
1,228 | 152 | 4 | |||||||||
|
Interest expense
|
– | 3,773 | 4,616 | |||||||||
|
Income before income taxes
|
216,999 | 175,522 | 108,975 | |||||||||
|
Provision for income taxes
|
85,739 | 69,478 | 43,045 | |||||||||
|
Net income
|
$ | 131,260 | $ | 106,044 | $ | 65,930 | ||||||
|
Earnings per share:
|
||||||||||||
|
Basic
|
$ | 9.78 | $ | 8.91 | $ | 5.79 | ||||||
|
Diluted
|
$ | 9.70 | $ | 8.88 | $ | 5.76 | ||||||
|
Weighted average shares outstanding:
|
||||||||||||
|
Basic
|
13,426 | 11,906 | 11,390 | |||||||||
|
Diluted
|
13,535 | 11,943 | 11,440 | |||||||||
STRAYER EDUCATION, INC.
CONSOLIDATED STATEMENTS OF COMPREHENSIVE INCOME
(in thousands)
|
For the Year Ended
December 31,
|
||||||||||||
|
2010
|
2011
|
2012
|
||||||||||
|
Net income
|
$ | 131,260 | $ | 106,044 | $ | 65,930 | ||||||
|
Other comprehensive income:
|
||||||||||||
|
Change in fair value of derivative instrument, net of income tax
|
– | (611 | ) | (125 | ) | |||||||
|
Unrealized gain (loss) on investment, net of income tax
|
(265 | ) | (40 | ) | – | |||||||
|
Comprehensive income
|
$ | 130,995 | $ | 105,393 | $ | 65,805 | ||||||
The accompanying notes are an integral part of these consolidated financial statements.
51
STRAYER EDUCATION, INC.
CONSOLIDATED STATEMENTS OF STOCKHOLDERS’ EQUITY
(in thousands, except share data)
|
Accumulated
Other
Comprehensive
(Loss) Income
|
||||||||||||||||||||||||
|
Additional
Paid-in
Capital
|
||||||||||||||||||||||||
|
Common Stock
|
Retained
Earnings
|
|||||||||||||||||||||||
|
Shares
|
Par Value
|
Total
|
||||||||||||||||||||||
|
Balance, December 31, 2009
|
13,957,596 | $ | 140 | $ | 1,157 | $ | 188,218 | $ | 305 | $ | 189,820 | |||||||||||||
|
Exercise of stock options
|
6,667 | – | 452 | – | – | 452 | ||||||||||||||||||
|
Tax benefits associated with stock-based compensation arrangements
|
– | – | 2,808 | – | – | 2,808 | ||||||||||||||||||
|
Repurchase of common stock
|
(687,340 | ) | (7 | ) | (15,198 | ) | (100,312 | ) | – | (115,517 | ) | |||||||||||||
|
Restricted stock grants, net of
forfeitures
|
39,899 | – | – | – | – | – | ||||||||||||||||||
|
Stock-based compensation
|
– | – | 11,987 | – | – | 11,987 | ||||||||||||||||||
|
Common stock dividends
|
– | – | – | (44,541 | ) | – | (44,541 | ) | ||||||||||||||||
|
Change in net unrealized gains and losses on marketable securities, net of income tax
|
– | – | – | – | (265 | ) | (265 | ) | ||||||||||||||||
|
Net income
|
– | – | – | 131,260 | – | 131,260 | ||||||||||||||||||
|
Balance, December 31, 2010
|
13,316,822 | 133 | 1,206 | 174,625 | 40 | 176,004 | ||||||||||||||||||
|
Tax shortfall associated with stock-based compensation arrangements
|
– | – | (569 | ) | – | – | (569 | ) | ||||||||||||||||
|
Repurchase of common stock
|
(1,581,444 | ) | (16 | ) | (13,575 | ) | (189,073 | ) | – | (202,664 | ) | |||||||||||||
|
Restricted stock grants, net of
forfeitures
|
57,078 | 1 | (1 | ) | – | – | – | |||||||||||||||||
|
Stock-based compensation
|
– | – | 13,234 | – | – | 13,234 | ||||||||||||||||||
|
Common stock dividends
|
– | – | – | (49,105 | ) | – | (49,105 | ) | ||||||||||||||||
|
Change in net unrealized gains and losses on marketable securities, net of income tax
|
– | – | – | – | (40 | ) | (40 | ) | ||||||||||||||||
|
Change in fair value of derivative instrument, net of income tax
|
– | – | – | – | (611 | ) | (611 | ) | ||||||||||||||||
|
Net income
|
– | – | – | 106,044 | – | 106,044 | ||||||||||||||||||
|
Balance, December 31, 2011
|
11,792,456 | 118 | 295 | 42,491 | (611 | ) | 42,293 | |||||||||||||||||
|
Tax shortfall associated with stock-based compensation arrangements
|
– | – | (245 | ) | – | – | (245 | ) | ||||||||||||||||
|
Repurchase of common stock
|
(484,841 | ) | (5 | ) | (5,214 | ) | (19,782 | ) | – | (25,001 | ) | |||||||||||||
|
Restricted stock grants, net of
forfeitures
|
79,684 | 1 | (1 | ) | – | – | – | |||||||||||||||||
|
Stock-based compensation
|
– | – | 5,464 | – | – | 5,464 | ||||||||||||||||||
|
Common stock dividends
|
– | – | – | (47,328 | ) | – | (47,328 | ) | ||||||||||||||||
|
Change in fair value of derivative instrument, net of income tax
|
– | – | – | – | (125 | ) | (125 | ) | ||||||||||||||||
|
Net income
|
– | – | – | 65,930 | – | 65,930 | ||||||||||||||||||
|
Balance, December 31, 2012
|
11,387,299 | $ | 114 | $ | 299 | $ | 41,311 | $ | (736 | ) | $ | 40,988 | ||||||||||||
The accompanying notes are an integral part of these consolidated financial statements.
52
STRAYER EDUCATION, INC.
(in thousands)
|
For the Year Ended December 31,
|
||||||||||||
|
2010
|
2011
|
2012
|
||||||||||
|
Cash flows from operating activities:
|
||||||||||||
|
Net income
|
$ | 131,260 | $ | 106,044 | $ | 65,930 | ||||||
|
Adjustments to reconcile net income to net cash provided by operating activities:
|
||||||||||||
|
Amortization of gain on sale of assets
|
(281 | ) | (281 | ) | (281 | ) | ||||||
|
Amortization of deferred rent
|
275 | 1,177 | 323 | |||||||||
|
Gain on sale of marketable securities
|
(406 | ) | (66 | ) | – | |||||||
|
Amortization of deferred financing costs
|
– | 663 | 795 | |||||||||
|
Depreciation and amortization
|
17,309 | 21,525 | 23,973 | |||||||||
|
Deferred income taxes
|
353 | 3,722 | (38 | ) | ||||||||
|
Stock-based compensation
|
11,987 | 13,234 | 5,464 | |||||||||
|
Changes in assets and liabilities:
|
||||||||||||
|
Tuition receivable, net
|
(4,233 | ) | (2,995 | ) | 1,744 | |||||||
|
Other current assets
|
(1,153 | ) | (768 | ) | (2,130 | ) | ||||||
|
Other assets
|
(258 | ) | 102 | (135 | ) | |||||||
|
Accounts payable and accrued expenses
|
10,146 | (3,360 | ) | 5,673 | ||||||||
|
Income taxes payable and income taxes receivable
|
(1,358 | ) | (1,279 | ) | (4,306 | ) | ||||||
|
Excess tax benefits from stock-based payment arrangements
|
(2,808 | ) | – | – | ||||||||
|
Unearned tuition
|
1,083 | 11,841 | (14,870 | ) | ||||||||
|
Other long-term liabilities
|
905 | 4,804 |
(80
|
) | ||||||||
|
Net cash provided by operating activities
|
162,821 | 154,363 | 82,062 | |||||||||
|
Cash flows from investing activities:
|
||||||||||||
|
Purchases of property and equipment
|
(46,015 | ) | (29,991 | ) | (24,733 | ) | ||||||
|
Purchases of marketable securities
|
(559 | ) | (2 | ) | – | |||||||
|
Proceeds from the sale of marketable securities
|
40,700 | 12,388 | – | |||||||||
|
Acquisition of assets
|
– | (7,000 | ) | – | ||||||||
|
Net cash used in investing activities
|
(5,874 | ) | (24,605 | ) | (24,733 | ) | ||||||
|
Cash flows from financing activities:
|
||||||||||||
|
Common dividends paid
|
(44,541 | ) | (49,105 | ) | (47,328 | ) | ||||||
|
Proceeds from exercise of stock options
|
452 | – | – | |||||||||
|
Excess tax benefits from stock-based payment arrangements
|
2,808 | – | – | |||||||||
|
Repurchase of common stock
|
(115,517 | ) | (202,664 | ) | (25,001 | ) | ||||||
|
Proceeds from revolving credit facility
|
– | 120,000 | 63,000 | |||||||||
|
Payments on revolving credit facility
|
– | (100,000 | ) | (83,000 | ) | |||||||
|
Proceeds from term loan
|
– | 100,000 | 47,500 | |||||||||
|
Payments on term loan
|
– | (2,500 | ) | (20,000 | ) | |||||||
|
Payment of deferred financing costs
|
– | (2,459 | ) | (2,120 | ) | |||||||
|
Net cash used in financing activities
|
(156,798 | ) | (136,728 | ) | (66,949 | ) | ||||||
|
Net increase (decrease) in cash and cash equivalents
|
149 | (6,970 | ) | (9,620 | ) | |||||||
|
Cash and cash equivalents – beginning of year
|
63,958 | 64,107 | 57,137 | |||||||||
|
Cash and cash equivalents – end of year
|
$ | 64,107 | $ | 57,137 | $ | 47,517 | ||||||
|
Non-cash transactions:
|
||||||||||||
|
Purchases of property and equipment included in accounts payable
|
$ | 5,508 | $ | 1,115 | $ | 529 | ||||||
The accompanying notes are an integral part of these consolidated financial statements.
53
STRAYER EDUCATION, INC.
NOTES TO CONSOLIDATED FINANCIAL STATEMENTS
|
1.
|
Nature of Operations
|
Strayer Education, Inc. (the “Company”), a Maryland corporation, conducts its operations through its wholly owned subsidiary, Strayer University (the “University”). The University is an accredited institution of higher education that provides undergraduate and graduate degrees in various fields of study through 100 campuses in Alabama, Arkansas, Delaware, Florida, Georgia, Illinois, Indiana, Kentucky, Louisiana, Maryland, Minnesota, Mississippi, Missouri, New Jersey, North Carolina, Ohio, Pennsylvania, South Carolina, Tennessee, Texas, Utah, Virginia, West Virginia, Wisconsin, and Washington, D.C., and online. With the Company’s focus on the student, regardless of whether he or she chooses to take classes at a physical campus or online, it has only one reporting segment.
|
2.
|
Significant Accounting Policies
|
The consolidated financial statements include the accounts of the Company and its only subsidiary, the University. All intercompany accounts and transactions have been eliminated in the consolidated financial statements.
Financial statement presentation
Effective during the first quarter of 2011, the Company made changes in its presentation of operating expenses and reclassified prior periods to conform to the current presentation. The Company determined that these changes would provide more meaningful information and increased transparency of its operations. There were no changes to total operating expenses or operating income as a result of these reclassifications. Below is a description of the nature of the costs included in the Company’s operating expense categories.
Instruction and educational support expenses generally contain items of expense directly attributable to educational activities of the University. This expense category includes salaries and benefits of faculty and academic administrators, as well as administrative personnel who support and serve student interests. Instruction and educational support expenses also include costs of educational supplies and facilities, including rent for campus facilities, certain costs of establishing and maintaining computer laboratories and all other physical plant and occupancy costs, with the exception of costs attributable to the corporate offices. Bad debt expense incurred on delinquent student account balances is also included in instruction and educational support expenses.
Marketing expenses include the costs of advertising and production of marketing materials and related personnel costs.
Admissions advisory expenses include salaries, benefits, and related costs of personnel engaged in admissions.
General and administration expenses include salaries and benefits of management and employees engaged in accounting, human resources, legal, regulatory compliance, and other corporate functions, along with the occupancy and other related costs attributable to such functions.
The following table presents the Company’s operating expenses as previously reported and as reclassified on its consolidated statements of income for the year ended December 31, 2010:
|
December 31, 2010
|
||||||||
|
As
Reported
|
As
Reclassified
|
|||||||
|
Instruction and educational support
|
$ | 205,212 | $ | 269,557 | ||||
|
Marketing
(1)
|
114,164 | 70,270 | ||||||
|
Admissions advisory
|
– | 25,277 | ||||||
|
General and administration
|
101,585 | 55,857 | ||||||
| $ | 420,961 | $ | 420,961 | |||||
|
(1)
|
This line item was labeled Marketing and admissions expense on an “as reported” basis in 2010. Marketing and admissions expenses related to student support services were reclassified to Instruction and educational support expense, those related to admissions to Admissions advisory expense, and those related to corporate overhead were reclassified to General and administration expense in 2010.
|
54
Change in accounting principle
Effective during the first quarter of 2011, the Company changed its presentation of tuition receivable and unearned tuition in its consolidated balance sheets. The Company believes that this change is preferable because it improves the comparability of results with others in the educational services industry and provides more transparency of its operations. Prior to the change, the Company recorded tuition receivable and unearned tuition upon a student’s registration. Effective with this change, the Company records tuition receivable and unearned tuition for its students upon the start of the academic term. Therefore, at the end of the quarter (and academic term), tuition receivable represents amounts due from students for educational services already provided and unearned tuition represents advance payments from students for academic services to be provided in the future. This change has been reported retrospectively for all periods presented and had no impact on income from operations, net income, earnings per share, working capital, retained earnings, stockholders’ equity or on net cash provided by operating activities. This change did not affect the Company’s revenue recognition policies.
Revenues
The Company’s educational programs are offered on a quarterly basis. Approximately 96% of the Company’s revenues during the year ended December 31, 2012 consisted of tuition revenue. Tuition revenue is recognized in the quarter of instruction. Tuition revenue is shown net of any refunds, withdrawals, corporate discounts, scholarships and employee tuition discounts. At the start of each academic term, a liability (unearned tuition) is recorded for academic services to be provided and a tuition receivable is recorded for the portion of the tuition not paid upfront in cash. Any cash received prior to the start of an academic term is recorded as unearned tuition. Revenues also include textbook-related income, application fees, technology fees, placement test fees, withdrawal fees, certificate revenue, and other income, which are recognized when earned.
Cash and Cash Equivalents
Cash and cash equivalents consist of cash maintained in mostly FDIC-insured bank accounts and cash invested in bank overnight deposits and money market mutual funds. The Company places its cash and temporary cash investments with various financial institutions. The Company considers all highly liquid instruments purchased with a maturity of three months or less at the date of purchase to be cash equivalents.
Concentration of Credit Risk
The Company places its cash and temporary cash investments in bank overnight deposits and money market mutual funds with various financial institutions. Cash and cash equivalent balances are in excess of the FDIC insurance limit. The Company has not experienced any losses on its cash and cash equivalents.
Tuition receivables are not collateralized; however, credit risk is minimized as a result of the diverse nature of the University’s student base. The University establishes an allowance for doubtful tuition accounts based upon historical trends and other information.
Property and Equipment
Property and equipment are stated at cost less accumulated depreciation and amortization. In accordance with the Property, Plant and Equipment Topic, ASC 360, the carrying values of the Company’s assets are re-evaluated when events or changes in circumstances indicate that the carrying amount of an asset may not be recoverable. If it is determined that an impairment loss has occurred based on expected undiscounted future cash flows, then a loss is recognized using a fair-value based model. Through 2012, no such impairment loss had occurred. Depreciation and amortization of property and equipment is calculated using the straight-line method over the estimated useful lives ranging from 3 to 40 years. Depreciation and amortization amounted to $17.3 million, $21.5 million, and $24.0 million for the years ended December 31, 2010, 2011, and 2012 respectively.
Construction in progress includes costs of computer software developed for internal use, and is accounted for in accordance with the Internal-Use Software Topic, ASC 350-40. Computer software development costs that are incurred in the preliminary project stage are expensed as incurred. During the development stage direct consulting costs, payroll and payroll-related costs for employees that are directly associated with the project are capitalized and will be amortized over the estimated useful life of the software once placed into operation. Purchases of property and equipment and changes in accounts payable for each of the three years in the period ended December 31, 2012 in the Consolidated Statements of Cash Flows have been adjusted to exclude non-cash purchases of property and equipment transactions during that period.
55
Fair Value
The Fair Value Measurement Topic, ASC 820-10 (“ASC 820-10”), establishes a framework for measuring fair value, establishes a fair value hierarchy based upon the observability of inputs used to measure fair value, and expands disclosures about fair value measurements. Assets and liabilities are classified in their entirety within the fair value hierarchy based on the lowest level input that is significant to the fair value measurement. Under ASC 820-10, fair value of an investment is the price that would be received to sell an asset or to transfer a liability to an entity in an orderly transaction between market participants at the measurement date. The hierarchy gives the highest priority to assets and liabilities with readily available quoted prices in an active market and lowest priority to unobservable inputs which require a higher degree of judgment when measuring fair value, as follows:
|
|
●
|
Level 1 assets or liabilities use quoted prices in active markets for identical assets or liabilities as of the measurement date;
|
|
|
●
|
Level 2 assets or liabilities use observable inputs, other than quoted market prices, that are either directly or indirectly observable in the marketplace for identical or similar assets and liabilities; and
|
|
|
●
|
Level 3 assets or liabilities use unobservable inputs that are supported by little or no market activity.
|
The Company’s assets and liabilities that are subject to fair value measurement are categorized in one of the three levels above. Fair values are based on the inputs available at the measurement dates, and may rely on certain assumptions that may affect the valuation of fair value for certain assets or liabilities.
Goodwill and Indefinite-Lived Intangible Assets
Goodwill represents the excess of the purchase price of an acquired business over the amount assigned to the assets acquired and liabilities assumed. Indefinite-lived intangible assets, which include a trade name, are recorded at fair market value on their acquisition date. An indefinite life was assigned to the trade name because it has the continued ability to generate cash flows indefinitely.
Goodwill and the indefinite-lived intangible asset are assessed at least annually for impairment during the three-month period ending September 30, or more frequently if events occur or circumstances change between annual tests that would more likely than not reduce the fair value of the respective reporting unit below its carrying amount. Under Accounting Standards Update No. 2011-08,
Intangibles-Goodwill and Other (Topic 350): Testing Goodwill for Impairment
, the Company is permitted, but not required, to first assess qualitative factors to determine whether it is necessary to perform the more thorough quantitative goodwill impairment test. Following its qualitative assessment, the Company determined it was not more likely than not that the fair value of its goodwill was less than the carrying amount and, accordingly, no impairment existed in 2012.
Long-Term Liabilities
Included in the Company’s long-term liabilities are lease incentives related to the opening of new campuses, the straight-lining of rent expense, a deferred gain related to the sale and lease back of a campus facility, and other deferred facility costs. In conjunction with the opening of some new campuses and other facilities, the Company was reimbursed by the lessors for improvements made to those leased properties. In accordance with the Operating Leases Subtopic, ASC 840-20 (“ASC 840-20”), these reimbursements were capitalized as leasehold improvements and a liability was established. The leasehold improvements and the liability are amortized on a straight-line basis over the corresponding lease terms, which generally range from five to ten years. In accordance with ASC 840-20, the Company records rent expense on a straight-line basis over the initial term of a lease. The cumulative difference between the rent payment and the straight-line rent expense is recorded as a liability. The Company also records the non-current portion of the gain related to the sale and lease back of a campus facility as a long-term liability. (See Note 9 below for more information.)
Accounting for Derivative Instruments and Hedging Activities
On the date that the Company enters into a derivative contract, it designates the derivative as a hedge of (a) a forecasted transaction or (b) the variability of cash flows that are to be received or paid in connection with a recognized asset or liability (a cash flow hedge). All derivatives are recognized in the balance sheet at their fair value.
Changes in the fair value of a derivative that is highly effective and that is designated and qualifies as a cash flow hedge, to the extent that the hedge is effective, are recorded, net of income tax, in other comprehensive income, until earnings are affected by the variability of cash flows of the hedged transaction (e.g., until periodic settlements of a variable-rate asset or liability are recorded in earnings). Any hedge ineffectiveness (which represents the amount by which the changes in the fair value of the derivative exceed the variability in the cash flows of the forecasted transaction) is recorded in current-period earnings.
The Company formally documents all relationships between hedging instruments and hedged items, as well as its risk-management objective and strategy for undertaking various hedge transactions. The Company also formally assesses (both at the hedge’s inception and on an ongoing basis) whether the derivatives that are used in hedging transactions have been highly effective in offsetting changes in the fair value or cash flows of hedged items and whether those derivatives may be expected to remain highly effective in future periods. When it is determined that a derivative is not (or has ceased to be) highly effective as a hedge, the Company discontinues hedge accounting prospectively.
56
Authorized Stock
The Company has authorized 20,000,000 shares of common stock, par value $.01, of which 11,792,456 and 11,387,299 shares were issued and outstanding as of December 31, 2011 and 2012, respectively. The Company also has authorized 8,000,000 shares of preferred stock, none of which has been issued or outstanding since 2004. Before any preferred stock may be issued in the future, the Board of Directors would need to establish the preferences, conversion or other rights, voting powers, restrictions, limitations as to dividends, qualifications, and the terms or conditions of the redemption of the preferred stock.
Advertising Costs
The Company expenses advertising costs in the quarter incurred, except for costs associated with the production of media commercials which are expensed when the commercial is first aired.
Stock-Based Compensation
As required by the Stock Compensation Topic, ASC 718, the Company measures and recognizes compensation expense for all share-based payment awards made to employees and directors, including employee stock options and employee stock purchases related to the Company’s Employee Stock Purchase Plan, based on estimated fair values. Stock-based compensation expense recognized in the Consolidated Statements of Income for each of the three years in the period ended December 31 2012, is based on awards ultimately expected to vest and, therefore, has been adjusted for estimated forfeitures. The Company is required to estimate forfeitures at the time of grant and revise, if necessary, the estimate in subsequent periods if actual forfeitures differ from those estimates. The forfeiture rate used is based on historical experience. The Company also assesses the likelihood that performance criteria associated with performance-based awards will be met. If it is determined that it is more likely than not that performance criteria will not be achieved, the Company revises its estimate of the number of shares it believes will ultimately vest.
Net Income Per Share
Basic earnings per share is computed by dividing net income by the weighted average number of shares of common stock outstanding during the periods. Diluted earnings per share reflects the potential dilution that could occur assuming conversion or exercise of all dilutive unexercised stock options and restricted stock. The dilutive effect of stock awards was determined using the treasury stock method. Under the treasury stock method, all of the following are assumed to be used to repurchase shares of the Company’s common stock: (1) the proceeds received from the exercise of stock options, (2) the amount of compensation cost associated with the stock awards for future service not yet recognized by the Company, and (3) the amount of tax benefits that would be recorded in additional paid-in capital when the stock awards become deductible for income tax purposes. Stock options are not included in the computation of diluted earnings per share when the stock option exercise price of an individual grant exceeds the average market price for the period. During the year ended December 31, 2012, the Company had no issued and outstanding stock options that were included in the calculation.
Set forth below is a reconciliation of shares used to calculate basic and diluted earnings per share (in thousands).
|
2010
|
2011
|
2012
|
||||||||||
|
Weighted average shares outstanding used to compute basic earnings per share
|
13,426 | 11,906 | 11,390 | |||||||||
|
Incremental shares issuable upon the assumed exercise of stock options
|
36 | 8 | – | |||||||||
|
Unvested restricted stock
|
73 | 29 | 50 | |||||||||
|
Shares used to compute diluted earnings per share
|
13,535 | 11,943 | 11,440 | |||||||||
Income Taxes
The Company provides for deferred income taxes based on temporary differences between financial statement and income tax bases of assets and liabilities using enacted tax rates in effect in the year in which the differences are expected to reverse.
The Income Taxes Topic, ASC 740 (“ASC 740”), requires the company to determine whether uncertain tax positions should be recognized within the Company’s financial statements. As a result of the implementation of ASC 740, no material adjustment in the liability for unrecognized income tax benefits was recognized. The amount of unrecognized tax benefits at the adoption date of January 1, 2007 and at December 31, 2012 was immaterial. The Company recognizes interest and penalties, if any, related to uncertain tax positions in income tax expense. As of December 31, 2012, the amount of accrued interest and penalties related to uncertain tax positions was immaterial. The tax years 2011 and 2012 remain open for Federal tax examination and the tax years 2009 – 2012 remain open to examination by state and local taxing jurisdictions in which the Company is subject.
57
Use of Estimates
The preparation of financial statements in conformity with accounting principles generally accepted in the United States of America requires management to make estimates and assumptions that affect the reported amounts of assets and liabilities at the date of the financial statements and the reported amounts of expenses during the period reported. The most significant management estimates included allowances for doubtful accounts, the useful lives of property and equipment, accrued expenses, forfeiture rates and the likelihood of achieving performance criteria for stock-based awards, valuation of goodwill, intangible assets and the interest rate swap arrangement, and the provision for income taxes. Actual results could differ from those estimates.
Comprehensive Income
Comprehensive income consists of net income and unrealized gains or losses on investments in marketable securities, and the change in the fair value of the Company’s interest rate swap, net of income taxes.
Reclassifications
Certain prior period amounts have been reclassified to conform to the current period presentation.
Recent Accounting Pronouncements
In September 2011, the Financial Accounting Standards Board (the “FASB”) issued Auditing Standards Update No. 2011-08,
Intangibles – Goodwill and Other (Topic 350): Testing Goodwill for Impairment
(“ASU 2011-08”), which permits an entity to first assess qualitative factors to determine whether a two-step quantitative goodwill impairment test is required to be performed. ASU 2011-08 is effective for annual and interim goodwill impairment tests performed for fiscal years beginning after December 15, 2011. The Company adopted ASU 2011-08 in 2012; the adoption of ASU 2011-08 did not have a material impact on the Company’s financial condition, results of operations or disclosures.
In May 2011, the FASB issued Accounting Standards Update No. 2011-04,
Fair Value Measurement (Topic 820): Amendments to Achieve Common Fair Value Measurement and Disclosure Requirements in U.S. GAAP and IFRSs
(“ASU 2011-04”), which results from a joint project with the International Accounting Standards Board, who issued IFRS 13, Fair Value Measurement, in May 2011. Under ASU 2011-04, the fair values of financial instruments generally are required to be measured based on the level of the unit of account, rather than at an aggregated or disaggregated level. ASU 2011-04 is effective in fiscal years beginning after December 15, 2011. Application of ASU 2011-04 is prospective. The adoption of ASU 2011-04 did not have a material impact on the Company’s financial condition, results of operations or disclosures.
In January 2010, the FASB issued Auditing Standards Update No. 2010-06,
Fair Value Measurements and Disclosures (Topic 820): Improving Disclosures about Fair Value Measurements
(“ASU 2010-06”). Under ASU 2010-06, new disclosures are required regarding transfers within the fair value hierarchy and the Level 3 reconciliation, and clarifies existing disclosure requirements. This guidance is effective for interim and annual reporting periods beginning after December 15, 2009. The adoption of ASU 2010-06 did not have a material impact on the Company’s consolidated financial statements.
|
3.
|
Property and Equipment
|
The composition of property and equipment as of December 31, 2011 and 2012 is as follows (in thousands):
|
2011
|
2012
|
Estimated useful life
(years)
|
||||||||||
|
Land
|
$ | 7,138 | $ | 7,138 | – | |||||||
|
Buildings and improvements
|
17,995 | 18,188 | 5-40 | |||||||||
|
Furniture, equipment, and computer hardware and software
|
146,523 | 153,597 | 5-10 | |||||||||
|
Leasehold improvements
|
33,692 | 38,362 | 3-10 | |||||||||
|
Construction in progress
|
843 | 670 | – | |||||||||
| 206,191 | 217,955 | |||||||||||
|
Accumulated depreciation and amortization
|
(85,042 | ) | (96,435 | ) | ||||||||
| $ | 121,149 | $ | 121,520 | |||||||||
Construction in progress includes costs associated with the construction of new campuses and the development of information technology applications. In 2011 and 2012, the Company recorded leasehold improvements of $2.0 million and $1.1 million, respectively, which were reimbursed by lessors as lease incentives. In 2011 and 2012, the Company wrote off $10.9 million and $12.5 million, respectively, in fixed assets that were fully depreciated and no longer in service.
58
|
4.
|
Restricted Cash
|
In 2003, as part of commencing operations in Pennsylvania, the Company was required to maintain a “minimum protective endowment” of at least $500,000 in an interest-bearing account. These funds are required as long as the Company operates its campuses in the state. The Company accounts for these funds as a long-term asset.
|
5.
|
Acquisition
|
On December 27, 2011, the Company completed an acquisition (the “Acquisition”) of certain assets which support the operations of the Jack Welch Management Institute (“JWMI”), an online leadership education program that offers a differentiated executive MBA degree and executive certificates. Simultaneous with the Acquisition, the Company entered into a License and Participation Agreement with Mr. Welch. The Company paid $7.0 million in the acquisition. The Company received $2.8 million from Mr. Welch representing his economic interest in JWMI, and the Company will make deferred payments to the sellers through 2021 valued at $2.1 million as of December 31, 2012. These amounts are included in other long-term liabilities in the Company’s consolidated balance sheets. The Company will make additional payments to Mr. Welch as he provides services to the Company on behalf of JWMI under the License and Participation Agreement.
In connection with the Acquisition, the Company acquired course content valued at $0.8 million which is being amortized over its estimated useful life of five years. The Company has also recorded indefinite-lived intangible assets of $1.6 million, which are included in other assets in the Company’s consolidated balance sheets. The Acquisition resulted in recording $6.8 million of goodwill, representing the excess of the purchase price over the fair value assigned to the underlying assets acquired. At December 31, 2012, the carrying amount of goodwill and the other assets acquired approximated the values at the acquisition date.
JWMI’s operating results are included in the consolidated financial statements from the date of the Acquisition. The results of operations of JWMI would not have had a material impact on the Company’s reported financial results if the Acquisition had been completed on January 1, 2011.
|
6.
|
Term Loan and Revolving Credit Facility
|
On November 8, 2012, the Company entered into a Second Amended and Restated Revolving Credit and Term Loan Agreement (the “Amended Credit Facility”), providing for a $100.0 million revolving credit facility and $125.0 million term loan facility, with an option, subject to obtaining additional loan commitments and the satisfaction of certain conditions, to increase the commitments under the Credit Facility by up to $50.0 million in the future. Each of the revolving portions of the Amended Credit Facility, which includes a letter of credit subfacility of $50.0 million, and the term loan portion of the Amended Credit Facility matures on December 31, 2016, and amends and refinances the Company’s original Credit Facility. The term loan portion of the Amended Credit Facility, also includes required quarterly amortization payments in the amount of $781,250 in the case of each payment made during calendar years 2013 and 2014, 0.625% of the aggregate original principal amount of the term loan facility, and $1,562,500 in the case of each payment made during calendar years 2015 and 2016, 1.25% of the aggregate original principal amount of the term loan facility. The Amended Credit Facility is guaranteed by the Company’s subsidiary and is secured by substantially all of the personal property and assets of the Company and the guarantor.
Borrowings under the Amended Credit Facility bear interest at LIBOR or a base rate plus a margin ranging from 2.00% to 2.50%, depending on the Company’s leverage ratio. For the $125.0 million term loan facility, the Company entered into an additional interest rate swap arrangement that fixes its interest rate on the entire term loan facility at an effective rate of approximately 3.1%. In addition, an unused commitment fee ranging from 0.30% to 0.40%, depending on the Company’s leverage ratio, accrues on unused amounts under the revolving portion of the Amended Credit Facility. The Amended Credit Facility contains customary affirmative and negative covenants, representations, warranties, events of default and remedies upon default, including acceleration and rights to foreclose on the collateral securing the Amended Credit Facility. In addition, the Amended Credit Facility requires that the Company satisfy certain financial maintenance covenants, including:
|
●
|
a total leverage ratio of not greater than 2.00:1.00;
|
|
●
|
a coverage ratio of not less than 1.75:1.00; and
|
|
●
|
a Department of Education financial composite score of not less than 1.5.
|
The Company was in compliance with all the terms of the Amended Credit Facility at December 31, 2012.
During the year ended December 31, 2012, the Company paid cash interest of $3.8 million, and the Company’s average annual interest rate, including noncash charges for the amortization of debt financing costs, was 4.6%.
59
As of December 31, 2012, the Company had $125.0 million outstanding under the term loan facility and no balance outstanding under the revolving credit facility.
Debt and short-term borrowings consist of the following as of December 31, 2012 (in thousands):
|
Term loan
|
$ | 125,000 | ||
|
Revolving credit facility
|
– | |||
|
Total debt
|
125,000 | |||
|
Less: Current portion of long-term debt
|
3,125 | |||
|
Long-term debt
|
$ | 121,875 |
Aggregate debt maturities as of December 31, 2012 are as follows:
|
2013
|
$ | 3,125 | ||
|
2014
|
3,125 | |||
|
2015
|
6,250 | |||
|
2016
|
112,500 | |||
| $ | 125,000 |
Interest Rate Swaps
The Company was party to an interest rate swap on the outstanding balance of the Company’s existing Credit Facility. On November 8, 2012, the Company entered into an additional interest rate swap arrangement in order to minimize the interest rate exposure on the entire balance of the term loan facility (the “Swaps”, inclusive of the existing swap). The Swaps effectively fix the variable interest rate on the associated debt at approximately 3.1% rather than being subject to fluctuations in the LIBOR rate. The terms of the Swaps effectively match the term of the underlying term loan facility. The Swaps have been designated as a cash flow hedge and have been deemed effective in accordance with the Derivatives and Hedging Topic, ASC 815. The Company expects the Swaps to continue to be deemed effective for the duration of the Swaps. The fair value of the Swaps is included in other long-term liabilities in the Company’s consolidated balance sheets.
|
7.
|
Fair Value Measurement
|
Assets and liabilities measured at fair value on a recurring basis consist of the following as of December 31, 2012 (in thousands):
|
Fair Value Measurements at Reporting Date Using
|
||||||||||||||||
|
December 31,
2012
|
Quoted Prices in
Active Markets for
Identical Assets/
Liabilities
(Level 1)
|
Significant
Other
Observable
Inputs
(Level 2)
|
Significant
Unobservable
Inputs
(Level 3)
|
|||||||||||||
|
Assets:
|
||||||||||||||||
|
Cash equivalents:
|
||||||||||||||||
|
Money market funds
|
$ | 1,380 | $ | 1,380 | $ | – | $ | – | ||||||||
|
Total assets at fair value on a recurring basis
|
$ | 1,380 | $ | 1,380 | $ | – | $ | – | ||||||||
|
Liabilities:
|
||||||||||||||||
|
Other liabilities:
|
||||||||||||||||
|
Interest rate swaps
|
$ | 1,211 | $ | – | $ | 1,211 | $ | – | ||||||||
|
Deferred payments
|
2,119 | – | – | 2,119 | ||||||||||||
|
Total liabilities at fair value on a recurring basis
|
$ | 3,330 | $ | – | $ | 1,211 | $ | 2,119 | ||||||||
60
Assets and liabilities measured at fair value on a recurring basis consist of the following as of December 31, 2011 (in thousands):
|
Fair Value Measurements at Reporting Date Using
|
||||||||||||||||
|
December 31,
2011
|
Quoted Prices in
Active Markets for
Identical Assets/
Liabilities
(Level 1)
|
Significant
Other
Observable
Inputs
(Level 2)
|
Significant
Unobservable
Inputs
(Level 3)
|
|||||||||||||
|
Assets:
|
||||||||||||||||
|
Cash equivalents:
|
||||||||||||||||
|
Money market funds
|
$ | 7,606 | $ | 7,606 | $ | – | $ | – | ||||||||
|
Total assets at fair value on a recurring basis
|
$ | 7,606 | $ | 7,606 | $ | – | $ | – | ||||||||
|
Liabilities:
|
||||||||||||||||
|
Other liabilities:
|
||||||||||||||||
|
Interest rate swap
|
$ | 1,010 | $ | – | $ | 1,010 | $ | – | ||||||||
|
Deferred payments
|
2,200 | – | – | 2,200 | ||||||||||||
|
Total liabilities at fair value on a recurring basis
|
$ | 3,210 | $ | – | $ | 1,010 | $ | 2,200 | ||||||||
The Company measures the above items on a recurring basis at fair value as follows:
|
|
●
|
Money market funds – Classified in Level 1 is excess cash the Company holds in both taxable and tax-exempt money market funds and are included in cash and cash equivalents in the accompanying consolidated balance sheets. The Company records any net unrealized gains and losses for changes in fair value as a component of accumulated other comprehensive income in stockholders’ equity. Realized gains and losses from the sale of marketable securities are based on the specific identification method. The Company’s remaining cash and cash equivalents held at December 31, 2011 and 2012, approximate fair value and is not disclosed in the above tables because of the short-term nature of the financial instruments.
|
|
|
●
|
Interest rate swaps – The Company has two interest rate swaps with a notional amount of $125.0 million as of December 31, 2012, used to minimize the interest rate exposure on a portion of the Company’s variable rate debt. The interest rate swaps are used to fix the variable interest rate on the associated debt. The swaps are classified within Level 2 and are valued using readily available pricing sources which utilize market observable inputs including the current variable interest rate for similar types of instruments.
|
|
|
●
|
Deferred payments – Classified within Level 3 as there is no liquid market for similarly priced instruments, and valued using a discounted cash flow model that encompassed significant unobservable inputs to estimate the operating results of the Acquisition. The assumptions used to prepare the discounted cash flows include estimates for interest rates, enrollment growth, retention rates and pricing strategies. These assumptions are subject to change as the underlying data sources evolve and the program matures.
|
At December 31, 2012, the carrying value of the Company’s debt was $125.0 million. All of the Company’s debt is variable interest rate debt and the carrying amount approximates fair value.
The Company did not change its valuation techniques associated with recurring fair value measurements from prior periods, and no assets or liabilities were transferred between levels of the fair value hierarchy during the years ended December 31, 2011 or 2012. Assets measured at fair value on a non-recurring basis as of December 31, 2011 and 2012, include $6.8 million of goodwill and $1.6 million of other indefinite-lived intangible assets resulting from the Acquisition. The deferred payment liability was established at the time of the Acquisition on December 27, 2011, and changes in the fair value of the Company’s Level 3 liability during the year ended December 31, 2012 are as follows (in thousands):
|
Deferred
Payments
|
||||
|
Balance at December 31, 2011
|
$ | 2,200 | ||
|
Amounts earned
|
(136 | ) | ||
|
Adjustments to fair value
|
55 | |||
|
Transfers in or out of Level 3
|
— | |||
|
Balance at December 31, 2012
|
$ | 2,119 | ||
61
|
8.
|
Stock Options and Restricted Stock
|
In April 2011, the Company’s stockholders approved the Strayer Education, Inc. 2011 Equity Compensation Plan (the “Plan”), which replaced the Company’s 1996 equity compensation plan (the “1996 Plan”) and made 300,000 new shares available for issuance as equity compensation. In addition, shares previously available for issuance under the 1996 Plan were effectively carried over and are available for issuance under the Plan, for a total of approximately 350,000 shares that were made available for issuance as equity compensation under the Plan. The Plan provides for the granting of restricted stock, stock options intended to qualify as incentive stock options, options that do not qualify as incentive stock options, and other forms of equity compensation and performance-based awards to employees, officers and directors of the Company, or to a consultant or advisor to the Company, at the discretion of the Board of Directors. Vesting provisions are at the discretion of the Board of Directors. Options may be granted at option prices based at or above the fair market value of the shares at the date of grant. The maximum term of the awards granted under the Plan is ten years.
In February 2012, the Company’s Board of Directors approved grants of 72,013 shares of restricted stock to certain individuals. These shares, which vest over a five- to seven-year period, were granted pursuant to the Plan. The Company’s stock price closed at $115.55 on the date of these restricted stock grants.
In April 2012, the Company’s Board of Directors approved grants of 10,728 shares of restricted stock. These shares, which vest over a three-year period, were awarded to various non-employee members of the Company’s Board of Directors, as part of the Company’s annual director compensation program. The Company’s stock price closed at $83.88 on the date of these restricted stock grants.
Dividends paid on unvested restricted stock are reimbursed to the Company if the recipient forfeits his or her shares as a result of termination of employment, prior to vesting in the award.
Restricted Stock
The table below sets forth the restricted stock activity for the years ended December 31, 2010, 2011 and 2012:
|
Number of
shares
|
Weighted-average
grant price
|
|||||||
|
Balance, December 31, 2009
|
352,728 | $ | 194.39 | |||||
|
Grants
|
51,739 | 173.09 | ||||||
|
Vested shares
|
(51,187 | ) | 106.68 | |||||
|
Forfeitures
|
(11,840 | ) | 176.75 | |||||
|
Balance, December 31, 2010
|
341,440 | $ | 204.89 | |||||
|
Grants
|
74,868 | 130.96 | ||||||
|
Vested shares
|
(17,574 | ) | 131.31 | |||||
|
Forfeitures
|
(17,790 | ) | 155.01 | |||||
|
Balance, December 31, 2011
|
380,944 | $ | 194.26 | |||||
|
Grants
|
82,741 | 111.44 | ||||||
|
Vested shares
|
(26,189 | ) | 195.58 | |||||
|
Forfeitures
|
(3,057 | ) | 127.51 | |||||
|
Balance, December 31, 2012
|
434,439 | $ | 178.88 | |||||
62
Stock Options
The table below sets forth the stock option activity for the years ended December 31, 2010, 2011 and 2012 and other stock option information at December 31, 2012:
|
Number of
shares
|
Weighted-average
exercise price
|
Weighted-
average
remaining
contractual
life (yrs.)
|
Aggregate
intrinsic
value(1)
(in thousands)
|
|||||||||||||
|
Balance, December 31, 2009
|
106,667 | $ | 104.81 | 2.9 | $ | 11,489 | ||||||||||
|
Grants
|
– | – | ||||||||||||||
|
Exercises
|
(6,667 | ) | 67.84 | |||||||||||||
|
Forfeitures
|
– | – | ||||||||||||||
|
Balance, December 31, 2010
|
100,000 | $ | 107.28 | 2.1 | $ | 4,494 | ||||||||||
|
Grants
|
– | – | ||||||||||||||
|
Exercises
|
– | – | ||||||||||||||
|
Forfeitures
|
– | – | ||||||||||||||
|
Balance, December 31, 2011
|
100,000 | $ | 107.28 | 1.1 | $ | – | ||||||||||
|
Grants
|
– | – | ||||||||||||||
|
Exercises
|
– | – | ||||||||||||||
|
Forfeitures
|
– | – | ||||||||||||||
|
Balance, December 31, 2012
|
100,000 | $ | 107.28 | 0.1 | $ | – | ||||||||||
|
Exercisable, December 31, 2012
|
100,000 | $ | 107.28 | 0.1 | – | |||||||||||
|
(1)
|
The aggregate intrinsic value in the table above represents the total pre-tax intrinsic value (the difference between the Company’s closing stock price on the respective trading day and the exercise price, multiplied by the number of in-the-money options) that would have been received by the option holder had all option been exercised on the respective trading day. The amount of intrinsic value will change based on the fair market value of the Company’s common stock.
|
The number of shares exercisable as of December 31, 2010, 2011 and 2012 are as follows:
|
Number of
shares
|
Weighted-average
exercise price
|
|||||||
|
Exercisable, December 31, 2010
|
100,000 | $ | 107.28 | |||||
|
Exercisable, December 31, 2011
|
100,000 | $ | 107.28 | |||||
|
Exercisable, December 31, 2012
|
100,000 | $ | 107.28 | |||||
Valuation and Expense Information under Stock Compensation Topic ASC 718
At December 31, 2012, total stock-based compensation cost which has not yet been recognized was $35.8 million, all for unvested restricted stock. This cost is expected to be recognized over the next 62 months on a weighted-average basis. Awards of approximately 230,000 shares of restricted stock are subject to performance conditions. The accrual for stock-based compensation for performance awards is based on the Company’s estimates that such performance criteria are probable of being achieved. Such a determination involves significant judgment surrounding future operating performance of the Company. If the performance targets are not reached during the vesting period, or it is determined it is more likely than not that the performance criteria will not be achieved, related compensation expense is adjusted. During 2012, the Company determined that of the approximately 230,000 shares of restricted stock subject to performance conditions, it was more likely than not that certain performance criteria for 45,920 shares would not be met, and reduced stock-based compensation expense by approximately $7.0 million.
The following table sets forth the amount of stock-based compensation expense recorded in each of the expense line items (in thousands):
|
2010
|
2011
|
2012
|
||||||||||
|
Instruction and educational support
|
$ | 2,400 | $ | 3,635 | $ | 3,273 | ||||||
|
Marketing
|
80 | 65 | – | |||||||||
|
Admissions advisory
|
– | – | – | |||||||||
|
General and administration
|
9,507 | 9,534 | 2,191 | |||||||||
|
Stock-based compensation expense included in operating expense
|
11,987 | 13,234 | 5,464 | |||||||||
|
Tax benefit
|
4,735 | 5,245 | 2,158 | |||||||||
|
Stock-based compensation expense, net of tax
|
$ | 7,252 | $ | 7,989 | $ | 3,306 | ||||||
63
The following table summarizes information regarding share-based payment arrangements for the years ended December 31, 2010, 2011 and 2012 (in thousands):
|
For the year ended
December 31,
|
||||||||||||
|
2010
|
2011
|
2012
|
||||||||||
|
Proceeds from stock options exercised
|
$ | 452 | $ | – | $ | – | ||||||
|
Excess tax benefits (shortfall) related to share-based payment arrangements
|
$ | 2,808 | $ | (569 | ) | $ | (245 | ) | ||||
|
Intrinsic value of stock options exercised(1)
|
$ | 1,184 | $ | – | $ | – | ||||||
|
(1)
|
Intrinsic value of stock options exercised is estimated by taking the difference between the Company’s closing stock price on the date of exercise and the exercise price, multiplied by the number of options exercised for each option holder and then aggregated.
|
|
9.
|
Other Long-Term Liabilities
|
Other long-term liabilities consist of the following as of December 31, 2011 and 2012 (in thousands):
|
2011
|
2012
|
|||||||
|
Deferred rent and other facility costs
|
$ | 10,302 | $ | 11,650 | ||||
|
Deferred payments (see Note 5)
|
5,000 | 4,919 | ||||||
|
Lease incentives
|
4,088 | 3,150 | ||||||
|
Fair value of interest rate swap (see Note 6)
|
1,010 | 1,211 | ||||||
|
Deferred gain on sale of campus building
|
1,256 | 975 | ||||||
| $ | 21,656 | $ | 21,905 | |||||
Deferred Rent and Other Facility Costs
In accordance with ASC 840-20, the Company records rent expense on a straight-line basis over the initial term of a lease. The difference between the rent payment and the straight-line rent expense is recorded as a liability. Other facility costs include lease costs of non-campus facilities that are not currently in use.
Lease Incentives
In conjunction with the opening of new campuses, the Company, in some instances, was reimbursed by the lessors for improvements made to the leased properties. In accordance with ASC 840-20, these improvements were capitalized as leasehold improvements and a liability was established for the reimbursements. The leasehold improvements and the liability are amortized on a straight-line basis over the corresponding lease terms, which generally range from five to 10 years.
Deferred Gain on Sale of Campus Building
In June 2007, the Company sold one of its campus buildings for $5.8 million. The Company is leasing back most of the campus building over a 10-year period. In conjunction with this sale and lease back transaction, the Company realized a gain of $2.8 million before tax, which is deferred and recognized over the 10-year lease term.
|
10.
|
Other Employee Benefit Plans
|
The Company has a 401(k) plan covering all eligible employees of the Company. Employee contributions are voluntary. Discretionary contributions were made by the Company matching 100% of employee deferrals up to 3% of the employee’s annual salary and matching an additional 50% of employee deferrals between 3% and 5% of annual salary. The Company’s contributions, which vest immediately, totaled $2.3 million, $2.7 million and $2.9 million for the years ended December 31, 2010, 2011, and 2012, respectively. Effective January 1, 2013, participants may contribute up to $17,500 of their base compensation annually and the Company intends to make discretionary contributions matching 50% of employee deferrals up to 3% of the employee’s annual salary.
64
In May 1998, the Company adopted the Strayer Education, Inc. Employee Stock Purchase Plan (“ESPP”). Under the ESPP, eligible employees may purchase shares of the Company’s common stock, subject to certain limitations, at 90% of its market value at the date of purchase. Purchases are limited to 10% of an employee’s eligible compensation. The aggregate number of shares of common stock that may be made available for purchase by participating employees under the ESPP is 2,500,000 shares. Shares purchased in the open market for employees for the years ended December 31, 2010, 2011, and 2012 were as follows:
|
Shares purchased
|
Average price
per share
|
|||||||
|
2010
|
4,836 | $ | 168.86 | |||||
|
2011
|
6,636 | $ | 98.55 | |||||
|
2012
|
6,549 | $ | 71.14 | |||||
|
11.
|
Stock Repurchase Plan
|
As announced on November 3, 2003, the Company’s Board of Directors initially authorized the Company to repurchase up to an aggregate of $15 million in value of common stock through December 31, 2004 in open market purchases from time to time at the discretion of the Company’s management depending on market conditions and other corporate considerations. The Company’s Board of Directors amended the program on various dates, increasing the repurchase amount authorized and extending the expiration date. At December 31, 2012, approximately $95 million of the Company’s share repurchase authorization was remaining for repurchases through December 31, 2013. All of the Company’s share repurchases were effected in compliance with Rule 10b-18 under the Securities Exchange Act of 1934, as amended. This stock repurchase plan may be modified, suspended or terminated at any time by the Company without notice.
A summary of the Company’s stock repurchase activity for the years ended December 31, 2010, 2011, and 2012, all of which was part of a publicly announced plan, is set forth in the table below:
|
Number of shares
repurchased
|
Average price paid
per share
|
Amount available for
future repurchases
(in millions)
|
||||||||||
|
2010
|
687,340 | $ | 168.06 | $ | 107.7 | |||||||
|
2011
|
1,581,444 | $ | 128.15 | $ | 80.0 | |||||||
|
2012
|
484,841 | $ | 51.56 | $ | 95.0 | |||||||
Repurchases of common stock are recorded as a reduction to additional paid-in capital. To the extent additional paid-in capital has been reduced to zero through stock repurchases, retained earnings is then reduced.
|
12.
|
Commitments and Contingencies
|
The University participates in various federal student financial assistance programs which are subject to audit. Management believes that the potential effects of audit adjustments, if any, for the periods currently under audit will not have a material adverse effect, individually or in the aggregate, on the Company’s consolidated financial position, results of operations or cash flows.
As of December 31, 2012, the Company had 98 long-term, non-cancelable operating leases for campuses and other administrative facilities. Rent expense was $32.6 million, $42.2 million, and $46.5 million for the years ended December 31, 2010, 2011, and 2012, respectively. The rents on the Company’s leases are subject to annual increases. The minimum rental commitments for the Company as of December 31, 2012 are as follows (in thousands):
|
Minimum
rental
commitments
|
||||
|
2013
|
$ | 39,992 | ||
|
2014
|
39,925 | |||
|
2015
|
37,203 | |||
|
2016
|
32,433 | |||
|
2017
|
26,960 | |||
|
Thereafter
|
65,916 | |||
|
Total
|
$ | 242,429 | ||
65
|
13.
|
Income Taxes
|
The income tax provision for the years ended December 31, 2010, 2011 and 2012 is summarized below (in thousands):
|
2010
|
2011
|
2012
|
||||||||||
|
Current:
|
||||||||||||
|
Federal
|
$ | 70,967 | $ | 53,344 | $ | 36,028 | ||||||
|
State
|
14,815 | 12,081 | 8,333 | |||||||||
|
Total current
|
85,782 | 65,425 | 44,361 | |||||||||
|
Deferred:
|
||||||||||||
|
Federal
|
(71 | ) | 4,760 | (608 | ) | |||||||
|
State
|
28 | (707 | ) | (708 | ) | |||||||
|
Total deferred
|
(43 | ) | 4,053 | (1,316 | ) | |||||||
|
Total provision for income taxes
|
$ | 85,739 | $ | 69,478 | $ | 43,045 | ||||||
The tax effects of the principal temporary differences that give rise to the Company’s deferred tax assets are as follows as of December 31, 2011 and 2012 (in thousands):
|
2011
|
2012
|
|||||||
|
Tuition receivable
|
$ | 4,629 | $ | 4,215 | ||||
|
Employee-related liabilities
|
420 | 280 | ||||||
|
Other facility-related costs
|
111 | 826 | ||||||
|
Current net deferred tax asset
|
5,160 | 5,321 | ||||||
|
Property and equipment
|
(15,335 | ) | (15,972 | ) | ||||
|
Deferred leasing costs
|
4,130 | 3,475 | ||||||
|
Stock-based compensation
|
13,656 | 13,814 | ||||||
|
Other facility-related costs
|
495 | 1,484 | ||||||
|
Interest rate swap
|
399 | 474 | ||||||
|
Other
|
(19 | ) | 4 | |||||
|
Long-term net deferred tax asset
|
3,326 | 3,279 | ||||||
|
Net deferred tax asset
|
$ | 8,486 | $ | 8,600 | ||||
A reconciliation between the Company’s statutory tax rate and the effective tax rate for the years ended December 31, 2010, 2011, and 2012 is as follows:
|
2010
|
2011
|
2012
|
||||||||||
|
Statutory federal rate
|
35.0 | % | 35.0 | % | 35.0 | % | ||||||
|
State income taxes, net of federal benefits
|
4.4 | 4.3 | 4.3 | |||||||||
|
Non-taxable interest income
|
(0.1 | ) | – | – | ||||||||
|
Other
|
0.2 | 0.3 | 0.2 | |||||||||
|
Effective tax rate
|
39.5 | % | 39.6 | % | 39.5 | % | ||||||
Cash payments for income taxes were $81.6 million in 2010, $67.0 million in 2011 and $47.4 million in 2012.
66
|
14.
|
Summarized Quarterly Financial Data (Unaudited)
|
Quarterly financial information for 2011 and 2012 is as follows (in thousands except per share data):
|
Quarter
|
||||||||||||||||
|
2011
|
First
|
Second
|
Third
|
Fourth
|
||||||||||||
|
Revenues
|
$ | 171,956 | $ | 163,789 | $ | 135,865 | $ | 155,824 | ||||||||
|
Income from operations
|
59,225 | 50,145 | 24,405 | 45,369 | ||||||||||||
|
Net income
|
35,791 | 29,647 | 13,935 | 26,671 | ||||||||||||
|
Net income per share:
|
||||||||||||||||
|
Basic
|
$ | 2.81 | $ | 2.54 | $ | 1.20 | $ | 2.31 | ||||||||
|
Diluted
|
$ | 2.80 | $ | 2.53 | $ | 1.20 | $ | 2.30 | ||||||||
|
Quarter
|
||||||||||||||||
|
2012
|
First
|
Second
|
Third
|
Fourth
|
||||||||||||
|
Revenues
|
$ | 149,532 | $ | 146,254 | $ | 124,260 | $ | 141,933 | ||||||||
|
Income from operations
|
40,858 | 36,168 | 7,836 | 28,725 | ||||||||||||
|
Net income
|
23,989 | 21,212 | 4,103 | 16,627 | ||||||||||||
|
Net income per share:
|
||||||||||||||||
|
Basic
|
$ | 2.10 | $ | 1.86 | $ | 0.36 | $ | 1.47 | ||||||||
|
Diluted
|
$ | 2.09 | $ | 1.85 | $ | 0.36 | $ | 1.47 | ||||||||
|
15.
|
Litigation
|
From time to time, the Company is involved in litigation and other legal proceedings arising out of the ordinary course of its business. On October 15, 2010, a putative securities class action was filed in the United States District Court for the Middle District of Florida. On March 20, 2012, the District Court granted the Company’s motion to dismiss the complaint for failure to state a claim, and the Eleventh Circuit Court of Appeals upheld that dismissal on December 13, 2012. A shareholder derivative action alleging similar facts was filed in the Circuit Court of Fairfax County, Virginia, which action was voluntarily dismissed by nonsuit on June 12, 2012. There are no pending material legal proceedings to which we are subject or to which our property is subject.
|
16.
|
Regulation
|
On June 13, 2011, the Department of Education published its final regulations defining the term “gainful employment.” Under the regulations, which become effective July 1, 2012, a particular program offered by an institution would become ineligible for Title IV funding if it could not pass at least one of three alternative measurements in three out of four consecutive years. The first year that a program could have become ineligible under the regulations as adopted was 2015. On June 30, 2012, the U.S. District Court for the District of Columbia vacated these debt measures, as well as the rules requiring institutions to report to the Department of Education information about students who complete gainful employment programs. The Department has filed a motion for the Court to reconsider its decision as related to the reporting requirements, which motion is pending.
67
STRAYER EDUCATION, INC.
Schedule II – Valuation and Qualifying Accounts
(in thousands)
|
Description
|
Balance
beginning
of period
|
Additions
charged
to expense
|
Deductions
|
Balance
end of
period
|
Bad debt
expense as
a % of
revenue
|
|||||||||||||||
|
Deduction from asset account:
|
||||||||||||||||||||
|
Allowance for doubtful accounts:
|
||||||||||||||||||||
|
Year ended December 31, 2012
|
$ | 7,279 | $ | 23,728 | $ | (24,411 | ) | $ | 6,596 | 4.2 | % | |||||||||
|
Year ended December 31, 2011
|
$ | 7,935 | $ | 24,877 | $ | (25,533 | ) | $ | 7,279 | 4.0 | % | |||||||||
|
Year ended December 31, 2010
|
$ | 6,175 | $ | 24,216 | $ | (22,456 | ) | $ | 7,935 | 3.8 | % | |||||||||
|
Item 9.
|
Changes in and Disagreements With Accountants on Accounting and Financial Disclosure
|
None.
|
Item 9A.
|
Controls and Procedures
|
The Company’s Chief Executive Officer and Chief Financial Officer have evaluated the effectiveness of the Company’s disclosure controls and procedures as of December 31, 2012. Based upon such review, the Chief Executive Officer and Chief Financial Officer have concluded that the Company had in place, as of December 31, 2012, effective controls and procedures designed to ensure that information required to be disclosed by the Company (including consolidated subsidiaries) in the reports it files or submits under the Securities Exchange Act of 1934, as amended, and the rules thereunder, is recorded, processed, summarized and reported within the time periods specified in the Commission’s rules and forms. Disclosure controls and procedures include, without limitation, controls and procedures designed to ensure that information required to be disclosed by an issuer in reports it files or submits under the Securities Exchange Act is accumulated and communicated to the Company’s management, including its principal executive officer or officers and principal financial officer or officers, or persons performing similar functions, as appropriate to allow timely decisions regarding required disclosure.
Management’s Report on Internal Control Over Financial Reporting
The Company’s management is responsible for establishing and maintaining adequate internal control over financial reporting, as such term is defined in Exchange Act Rule 13a-15(f). A company’s internal control over financial reporting is a process designed to provide reasonable assurance regarding the reliability of financial reporting and the preparation of financial statements for external purposes in accordance with generally accepted accounting principles. A company’s internal control over financial reporting includes those policies and procedures that (i) pertain to the maintenance of records that, in reasonable detail, accurately and fairly reflect the transactions and dispositions of the assets of the company; (ii) provide reasonable assurance that transactions are recorded as necessary to permit preparation of financial statements in accordance with generally accepted accounting principles, and that receipts and expenditures are being made only in accordance with authorizations of management and directors of the company; and (iii) provide reasonable assurance regarding prevention or timely detection of unauthorized acquisition, use or disposition of the company’s assets that could have a material effect on the financial statements.
Because of its inherent limitations, internal control over financial reporting may not prevent or detect misstatements. Also, projections of any evaluation of effectiveness to future periods are subject to the risk that controls may become inadequate because of changes in conditions, or that the degree of compliance with the policies or procedures may deteriorate.
Under the supervision and with the participation of the Company’s principal executive officer and principal financial officer, the Company’s management assessed the effectiveness of the registrant’s internal control over financial reporting, as of December 31, 2012 based on the framework in
Internal Control — Integrated Framework
issued by the Committee of Sponsoring Organizations of the Treadway Commission. Based on our assessment under the framework in
Internal Control — Integrated Framework
, our management concluded that our internal control over financial reporting was effective as of December 31, 2012.
The effectiveness of the Company’s internal control over financial reporting as of December 31, 2012 has been audited by PricewaterhouseCoopers LLP, an independent registered public accounting firm, as stated in their report which appears herein.
68
Changes in Internal Controls over Financial Reporting
The Company’s Chief Executive Officer and Chief Financial Officer have evaluated any changes in the Company’s internal control over financial reporting that occurred during the quarter ended December 31, 2012, and have concluded that there was no change during such quarter that has materially affected, or is reasonably likely to materially affect, the Company’s internal control over financial reporting.
|
Item 9B.
|
Other Information
|
None
69
|
Item 10.
|
Directors, Executive Officers and Corporate Governance
|
The following table sets forth certain information with respect to the Company’s directors, executive officers, and significant employees.
|
Name
|
Age
|
Position
|
||
|
Directors:
|
||||
|
Robert S. Silberman
|
55
|
Chairman of the Board and Chief Executive Officer
|
||
|
Robert R. Grusky
|
55
|
Presiding Independent Director
|
||
|
Dr. Charlotte F. Beason
|
65
|
Director
|
||
|
William E. Brock
|
82
|
Director
|
||
|
Dr. John T. Casteen III
|
69
|
Director
|
||
|
David A. Coulter
|
65
|
Director
|
||
|
Robert L. Johnson
|
66
|
Director
|
||
|
Karl McDonnell
|
46
|
Director, President and Chief Operating Officer
|
||
|
Todd A. Milano
|
60
|
Director
|
||
|
G. Thomas Waite, III
|
61
|
Director
|
||
|
J. David Wargo
|
59
|
Director
|
||
|
Executive Officers and Significant Employees:
|
||||
|
Dr. Michael Plater
|
56
|
President, Strayer University
|
||
|
Mark C. Brown
|
53
|
Executive Vice President and Chief Financial Officer
|
||
|
Kelly J. Bozarth
|
44
|
Executive Vice President and Chief Administrative Officer
|
||
|
Randi Reich Cosentino
|
39
|
Provost and Chief Academic Officer
|
||
|
Sonya G. Udler
|
45
|
Senior Vice President – Corporate Communications
|
Directors
Mr. Robert S. Silberman
has been Chairman of the Board since February 2003 and Chief Executive Officer since March 2001. From 1995 to 2000, Mr. Silberman served in a variety of senior management positions at CalEnergy Company, Inc., including as President and Chief Operating Officer. From 1993 to 1995, Mr. Silberman was Assistant to the Chairman and Chief Executive Officer of International Paper Company. From 1989 to 1993, Mr. Silberman served in several senior positions in the U.S. Department of Defense, including as Assistant Secretary of the Army. Mr. Silberman has been a Director of Strayer since March 2001. He serves on the Board of Directors of Covanta Holding Company. He also serves on the Board of Trustees of the Phillips Exeter Academy and on the Board of Visitors of The Johns Hopkins University School of Advanced International Studies. Mr. Silberman is a member of the Council on Foreign Relations. Mr. Silberman holds a bachelor’s degree in history from Dartmouth College and a master’s degree in international policy from The Johns Hopkins University.
Mr. Robert R. Grusky
is serving as the Presiding Independent Director of Strayer Education, Inc. Board of Directors, on which he has served since 2001. He is the Founder and Managing Member of Hope Capital Management, LLC, an investment manager, since 2000. He co-founded New Mountain Capital, LLC, a private equity firm, in 2000 and was a Principal and Member from 2000 to 2005, and has been a Senior Advisor since then. From 1998 to 2000, Mr. Grusky served as President of RSL Investments Corporation. From 1985 to 1997, with the exception of 1990 to 1991 when he was on a leave of absence to serve as a White House Fellow and Assistant for Special Projects to the Secretary of Defense, Mr. Grusky served in a variety of capacities at Goldman, Sachs & Co., first in its Mergers & Acquisitions Department and then in its Principal Investment Area. He also serves on the Board of Directors of AutoNation, Inc. In the past five years, he has also served on the Board of Directors of National Medical Health Card Systems, Inc. and AutoZone, Inc. In addition to serving as the Presiding Independent Director, he is also Chair of the Corporation’s Nominating Committee of the Board. He holds a bachelor’s degree in history from Union College and a master’s degree in business administration from Harvard University.
70
Dr. Charlotte F. Beason
is a consultant in education and health care administration, as she was from 2004 to 2005. She was Executive Director of the Kentucky Board of Nursing from 2005 to 2012. From 2000 to 2003, Dr. Beason was Chair and Vice Chair of the Commission on Collegiate Nursing Education (an autonomous agency accrediting baccalaureate and graduate programs in nursing); she is an evaluator for the Commission on Collegiate Nursing Education. From 1988 to 2004, Dr. Beason was with the Department of Veterans Affairs, first as Director of Health Professions Education Service and the Health Professional Scholarship Program, and then as Program Director, Office of Nursing Services. Dr. Beason has served on the Board since 1996 and is a member of the Nominating Committee of the Board. She is also Chairwoman of the Strayer University Board of Trustees. Dr. Beason holds a bachelor’s degree in nursing from Berea College, a master’s degree in psychiatric nursing from Boston University and a doctorate in clinical psychology and public practice from Harvard University.
Mr. William E. Brock
is the Founder and Chairman of the Brock Offices, a firm specializing in international trade, investment and human resources. From 1985 to 1987, Mr. Brock served in the President’s Cabinet as the U.S. Secretary of Labor, and from 1981 to 1985, as the U.S. Trade Representative. Mr. Brock previously served as a Member of Congress, as U.S. Senator for the State of Tennessee. Mr. Brock is a member of the Board of Directors of On Assignment, Inc., and ResCare, Inc., and is a Senior Counselor and Member of the Board of Trustees of the Center for Strategic and International Studies, where he chairs the International Policy Roundtable. In the past five years, Mr. Brock has also served on the Board of Directors of Catalyst Health Solutions, Inc. Mr. Brock has been a member of the Board since 2001 and is a member of the Compensation Committee of the Board. He holds a bachelor’s degree in commerce from Washington and Lee University.
Dr. John T. Casteen III
is the President Emeritus of the University of Virginia. He served as the President and Professor of English of the University of Virginia from 1990 through 2010. Prior to his service to the University of Virginia, Dr. Casteen was President of the University of Connecticut from 1985 to 1990. From 1982 to 1985, Dr. Casteen served as the Secretary of Education for the Commonwealth of Virginia. Dr. Casteen is on the board of directors of Altria, Inc., and served on the board of directors of Wachovia Corporation until 2008. Dr. Casteen also is a member of the board of directors of a number of charitable and privately-held business entities, including the Chesapeake Bay Foundation, ECHO 360, the National Student Clearinghouse, Sage Publications, Inc., RuffaloCODY, Inc., the Virginia Foundation for Community College Education, Virginia Intermont College, and the Woodrow Wilson International Center for Scholars. Dr. Casteen also serves on the Board of Trustees of the Jonestown-Yorktown Foundation. He has chaired the boards of both the College Entrance Examination Board and the Association of American Universities. Dr. Casteen has been a member of the Board since 2011, and is a member of the Nominating Committee of the Board. Dr. Casteen holds a bachelor’s degree, master’s degree and a Ph.D. in English from the University of Virginia.
Mr. David A. Coulter
is Vice Chairman at Warburg Pincus, LLC. He was Vice Chairman of J.P. Morgan Chase & Co. from December 2000 to December 2005. Prior to joining J.P. Morgan Chase, Mr. Coulter led the West Coast operations of the Beacon Group, a private investment and strategic advisory firm, and prior to that, Mr. Coulter served as the Chairman and Chief Executive Officer of the BankAmerica Corporation. Mr. Coulter is a member of the Board of Directors of Sterling Financial Corporation, Webster Bank, Aeolus Re, Triton Container International Ltd., and MBIA, Inc. In the past five years, Mr. Coulter has also served on the Board of Directors of The Irvine Company, Metavante Corporation and First Data Corporation. Mr. Coulter also serves on the Board of Trustees of Carnegie Mellon University and Lincoln Center. Mr. Coulter has been a member of the Board since 2002, and is Chair of the Compensation Committee of the Board. Mr. Coulter holds a bachelor’s degree in mathematics and economics and a master’s degree in industrial administration, both from Carnegie Mellon University.
Mr. Robert L. Johnson
is the Founder and Chairman of The RLJ Companies, which owns or holds interests in businesses operating in hotel real estate investment, private equity, consumer financial services, asset management, insurance services, automobile dealerships, sports and entertainment, and video lottery terminal gaming. Mr. Johnson is the founder of Black Entertainment Television (BET), a subsidiary of Viacom and the leading African-American operated media and entertainment company in the United States, and served as its Chief Executive Officer until January 2006. In 2002, Mr. Johnson became the first African-American majority owner of a major sports franchise, the Charlotte Bobcats of the NBA. From 1976 to 1979, he served as Vice President of Governmental Relations for the National Cable & Telecommunications Association (NCTA). Mr. Johnson also served as Press Secretary for the Honorable Walter E. Fauntroy, Congressional Delegate from the District of Columbia. He serves on the following boards: KB Home, Lowe’s Companies, Inc., Think Finance, Inc., NBA Board of Governors, The Business Council, and the Smithsonian Institution’s National Museum of African American History and Culture. Mr. Johnson has served on the Board since 2003, and is a member of the Compensation Committee of the Board. He holds a bachelor’s degree in social studies from the University of Illinois and a master’s degree in public affairs from the Woodrow Wilson School of Public and International Affairs at Princeton University.
Mr. Karl McDonnell
has been President and Chief Operating Officer since 2006. Mr. McDonnell served as Chief Operating Officer of InteliStaf Healthcare, Inc., one of the nation’s largest privately-held healthcare staffing firms. Prior to his tenure at InteliStaf, he served as Vice President of the Investment Banking Division at Goldman, Sachs & Co. Mr. McDonnell has held senior management positions with several Fortune 100 companies, including The Walt Disney Company. He has served on the Board since 2011 and is also a member of the Strayer University Board of Trustees. Mr. McDonnell holds a bachelor’s degree from Virginia Wesleyan College and a master’s degree in business administration from Duke University.
71
Mr. Todd A. Milano
is President Emeritus and Ambassador for Central Penn College, where he served as President and Chief Executive Officer from 1989 to 2012. Mr. Milano has served on the Board since 1996 and is a member of the Audit Committee of the Board and is also a member of the Strayer University Board of Trustees. Mr. Milano holds a bachelor’s degree in industrial management from Purdue University.
Mr. G. Thomas Waite, III
has been Treasurer and Chief Financial Officer of the Humane Society of the United States since 1997 and Controller since 1993. In 1992, Mr. Waite was the Director of Commercial Management of The National Housing Partnership. Mr. Waite has served on the Board since 1996, is a member of the Audit Committee of the Board and is a former member of the Strayer University Board of Trustees. Mr. Waite holds a bachelor’s degree in commerce from the University of Virginia and is a Certified Public Accountant.
Mr. J. David Wargo
has been President of Wargo and Company, Inc., an investment management company, since 1993. Mr. Wargo is a co-founder and was a Member of New Mountain Capital, LLC, from 2000 to 2008, and was a Senior Advisor there from 2008 until 2011. From 1989 to 1992, Mr. Wargo was a Managing Director and Senior Analyst of The Putnam Companies, a Boston-based investment management company. From 1985 to 1989, Mr. Wargo was a partner and held other positions at Marble Arch Partners. Mr. Wargo is also a Director of Liberty Global, Inc. and Discovery Communications, Inc. In the past five years, he also served on the board of Fun Technologies, Inc. Mr. Wargo has served on the Board since 2001 and is Chair of the Audit Committee of the Board. Mr. Wargo holds a bachelor’s degree in physics and a master’s degree in nuclear engineering, both from the Massachusetts Institute of Technology. He also holds a master’s degree in management science from the Sloan School of Management, which is the business school of the Massachusetts Institute of Technology.
Executive Officers and Significant Employees
Dr. Michael A. Plater
is the University President. He joined Strayer University in March 2010 as the Provost and Chief Academic Officer. Prior to joining Strayer, Dr. Plater was the Dean of the College of Arts and Sciences at North Carolina A&T State University, where he managed a faculty and staff of approximately 400 people in 13 academic departments, and five affiliated academic programs. Previous to joining North Carolina A&T, Dr. Plater was at Brown University as the Associate Dean of the Graduate School. Before joining Brown, Dr. Plater taught “capstone” Business Policy/Strategic Management classes in the M.B.A. program and the introductory undergraduate management course at the University of Florida. He received a bachelor’s degree in economics from Harvard University, a master’s degree in business administration from the University of Pennsylvania, and a Ph.D. from the College of William and Mary.
Mr. Mark C. Brown
is Executive Vice President and Chief Financial Officer, having joined Strayer in 2001. Mr. Brown was previously the Chief Financial Officer of the Kantar Group, the information and consultancy division of WPP Group, a multi-national communications services company. Prior to that, for nearly 12 years, Mr. Brown held a variety of management positions at PepsiCo, Inc., including Director of Corporate Planning for Pepsi Bottling Group and Business Unit Chief Financial Officer for Pepsi-Cola International. Mr. Brown is a Certified Public Accountant who started his career with PricewaterhouseCoopers, LLP. Mr. Brown holds a bachelor’s degree in accounting from Duke University and a master’s degree in business administration from Harvard University.
Ms. Kelly J. Bozarth
is Executive Vice President and Chief Administrative Officer. She joined Strayer in 2008 and has served as Senior Vice President and Chief Business Officer of Strayer University and as Senior Vice President and Controller of the Company. Previously, Ms. Bozarth held senior management roles in finance and operations in the education sector for five years. Prior to that, she held a variety of senior management positions in finance and in operations with The Walt Disney Company over a 10 year period. Ms. Bozarth is a Certified Public Accountant who began her career at Deloitte and Touche. Ms. Bozarth holds a bachelor’s degree in accounting from Missouri State University.
Ms. Randi Reich Cosentino
is Provost and Chief Academic Officer. Ms. Cosentino has been with the University since 2001 and has served as Senior Vice President – Academic Administration, Director of Online Operations, Director of Business Processes, Director of New Campus Openings, and as an Adjunct Faculty Member. Prior to joining Strayer, Ms. Cosentino co-founded and managed business and strategic development for Mascot Network, an application service provider serving the higher education market. Ms. Cosentino also served several years in city government with the City of New York as the Assistant Director in the Mayor’s Office of Transportation. Ms. Cosentino holds a bachelor’s degree in psychology and political science from the University of Pennsylvania, a master’s degree in business administration from Harvard University, and an Ed.D in higher education also from the University of Pennsylvania.
Ms. Sonya G. Udler
is Senior Vice President, Corporate Communications. Ms. Udler joined Strayer in 2002, and brings more than 20 years of public relations and marketing communications experience to Strayer. For the two years prior to joining Strayer, she served as a public relations and media strategies consultant. She previously served as Senior Vice President at Young & Associates, Inc., a public relations agency, where she developed communications strategies and media programs for Bell Atlantic, Siemens, Verizon and other leading technology companies. Ms. Udler holds a bachelor’s degree in journalism from the University of Maryland.
72
Additional information responsive to this item is hereby incorporated by reference from the sections titled “Election of Directors,” “Board Structure,” “Code of Ethics” and “Section 16(a) Beneficial Ownership Reporting Compliance” contained in the Company’s Proxy Statement, which will be filed no later than 120 days following December 31, 2012.
|
Item 11.
|
Executive Compensation
|
The information required by this Item is hereby incorporated by reference from the sections entitled “Compensation Discussion and Analysis” and the related tables and narrative thereto, “Director Compensation” and the related tables thereto, “Compensation Committee Interlocks and Insider Participation” and “Compensation Committee Report” to be contained in the Company’s Proxy Statement, which will be filed no later than 120 days following December 31, 2012.
|
Item 12.
|
Security Ownership of Certain Beneficial Owners and Management
|
The information required by this Item is hereby incorporated by reference from the section entitled “Beneficial Ownership of Common Stock” to be contained in the Company’s Proxy Statement, which will be filed no later than 120 days following December 31, 2012.
|
Item 13.
|
Certain Relationships and Related Transactions
|
The information required by this Item is hereby incorporated by reference from the sections entitled “Board Structure” and “Certain Transactions with Related Parties” to be contained in the Company’s Proxy Statement, which will be filed no later than 120 days following December 31, 2012.
|
Item 14.
|
Principal Accounting Fees and Services
|
The information required by this Item is hereby incorporated by reference from the section entitled “Proposal 2 – Ratification of Appointment of Independent Registered Public Accounting Firm” to be contained in the Company’s Proxy Statement, which will be filed no later than 120 days following December 31, 2012.
73
(A)(1) Financial Statements
All required financial statements of the registrant are set forth under Item 8 of this report on Form 10-K.
(A)(2) Financial Statement Schedule
The required financial statement schedule of the registrant is set forth under Item 8 of this report on Form 10-K.
(A)(3) Exhibits
The exhibits required to be filed as a part of this Annual Report on Form 10-K are listed in the Exhibit Index attached hereto and are incorporated herein by reference.
74
SIGNATURES
Pursuant to the requirements of Section 13 or 15(d) of the Securities Exchange Act of 1934, the registrant has duly caused this Report to be signed on its behalf by the undersigned, thereunto duly authorized.
|
STRAYER EDUCATION, INC.
|
|
|
By:
|
/s/ Robert S. Silberman
|
|
Robert S. Silberman
|
|
|
Chairman of the Board and
Chief Executive Officer
|
|
Date: February 19, 2013
75
POWER OF ATTORNEY
KNOW ALL MEN BY THESE PRESENTS, that each person whose signature appears below constitutes and appoints Robert S. Silberman and Mark C. Brown, and each of them individually, as his true and lawful attorneys-in-fact and agents, with full power of substitution and resubstitution, for him and his name, place and stead in any and all capacities, to sign the report and any and all amendments to this report, and to file the same, with all exhibits thereto, and other documents in connection therewith, with the Securities and Exchange Commission, granting unto said attorneys-in-fact and agents, full power and authority to perform each and every act and thing requisite and necessary to be done in and about the premises, as fully to all intents and purposes as he might or could do in person, hereby ratifying and confirming all that said attorneys-in-fact and agents, or their substitutes, may lawfully do or cause to be done by virtue thereof.
Pursuant to the requirements of the Securities Exchange Act of 1934, this Report has been signed below by the following persons on behalf of the registrant in the capacities and on the date indicated.
|
SIGNATURES
|
TITLE
|
DATE
|
||
|
/s/ Robert S. Silberman
(Robert S. Silberman) |
Chairman of the Board and Chief
Excutive Officer
(Principal Executive Officer)
|
February 19, 2013
|
||
|
/s/ Mark C. Brown
(Mark C. Brown)
|
Chief Financial Officer (Principal
Financial and ccounting Officer)
|
February 19, 2013
|
||
|
/s/ Charlotte F. Beason
(Charlotte F. Beason)
|
Director
|
February 19, 2013
|
||
|
/s/ William E. Brock
(William E. Brock)
|
Director
|
February 19, 2013
|
||
|
/s/ John T. Casteen III
(John T. Casteen III)
|
Director
|
February 19, 2013
|
||
|
/s/ David A. Coulter
(David A. Coulter)
|
Director
|
February 19, 2013
|
||
|
/s/ Robert R. Grusky
(Robert R. Grusky)
|
Director
|
February 19, 2013
|
||
|
/s/ Robert L. Johnson
(Robert L. Johnson)
|
Director
|
February 19, 2013
|
||
|
/s/ Karl McDonnell
(Karl McDonnell)
|
Director, President and Chief Operating Officer
|
February 19, 2013
|
||
|
/s/ Todd A. Milano
(Todd A. Milano)
|
Director
|
February 19, 2013
|
||
|
/s/ G. Thomas Waite, III
(G. Thomas Waite, III)
|
Director
|
February 19, 2013
|
||
|
/s/ J. David Wargo
(J. David Wargo)
|
Director
|
February 19, 2013
|
76
Exhibit Index
|
Exhibit
Number
|
Description
|
|
|
3.1
|
Amended Articles of Incorporation and Articles Supplementary of the Company (incorporated by reference to Exhibit 3.01 of the Company’s Annual Report on Form 10-K (File No. 000-21039) filed with the Commission on March 28, 2002).
|
|
|
3.2
|
Amended and Restated Bylaws of the Company (incorporated by reference to Exhibit 3.1 of the Company’s Current Report on Form 8-K filed with the Commission on November 4, 2010).
|
|
|
4.1
|
Specimen Stock Certificate (incorporated by reference to Exhibit 4.01 of Amendment No. 3 to the Company’s Registration Statement on Form S-1 (File No. 333-3967) filed with the Commission on July 16, 1996).
|
|
|
10.1
|
Second Amended and Restated Revolving Credit and Term Loan Agreement, dated as of November 8, 2012, among the Company, SunTrust Bank, as Administrative Agent, and the other lenders and agents party thereto (incorporated by reference to Exhibit 10.1 of the Company’s Current Report on Form 8-K filed with the Commission on November 9, 2012).
|
|
|
10.2†
|
Employment Agreement, dated as of April 6, 2001, between Strayer Education, Inc. and Robert S. Silberman (incorporated by reference to Exhibit 10.03 of the Company’s Annual Report on Form 10-K
(File No. 000-21039) filed with the Commission on March 28, 2002).
|
|
|
10.3†
|
2011 Equity Compensation Plan (incorporated by reference to Exhibit A of the Company’s Proxy Statement (File No. 000-21039) filed with the Commission on March 29, 2011).
|
|
|
10.4†
|
Form of Restricted Stock Award Agreement —Time Vesting — under the 2011 Equity Compensation Plan (incorporated by reference to Exhibit 10.1 of the Company's Current Report on Form 8-K (File No. 000-21039) filed with the Commission on February 14, 2013)
|
|
|
10.5†
|
Form of Restricted Stock Award Agreement — Performance Vesting — under the 2011 Equity Compensation Plan (incorporated by reference to Exhibit 10.2 of the Company's Current Report on Form 8-K (File No. 000-21039) filed with the Commission on February 14, 2013)
|
|
|
10.6†
|
Form of Option Agreement under the 2011 Equity Compensation Plan (incorporated by reference to Exhibit 10.3 of the Company's Current Report on Form 8-K (File No. 000-21039) filed with the Commission on February 14, 2013)
|
|
|
10.7†
|
Form of Restricted Stock Award Agreement for Non-Employee Directors under the 2011 Equity Compensation Plan (incorporated by reference to Exhibit 10.4 of the Company's Current Report on Form 8-K (File No. 000-21039) filed with the Commission on February 14, 2013) | |
|
21.1*
|
Subsidiaries of Registrant.
|
|
|
23.1*
|
Consent of PricewaterhouseCoopers LLP.
|
|
|
24.1*
|
Power of Attorney (included in signature page hereto).
|
|
|
31.1*
|
Certification of Chief Executive Officer pursuant to Rule 13a-14(a) of the Securities Act.
|
|
|
31.2*
|
Certification of Chief Financial Officer pursuant to Rule 13a-14(a) of the Securities Act.
|
|
|
32.1*
|
Certification of Chief Executive Officer pursuant to 18 U.S.C. Section 1350, as adopted pursuant to Section 906 of the Sarbanes-Oxley Act of 2002.
|
|
|
32.2*
|
Certification of Chief Financial Officer pursuant to 18 U.S.C. Section 1350, as adopted pursuant to Section 906 of the Sarbanes-Oxley Act of 2002.
|
77
|
Exhibit
Number
|
Description
|
|
|
101.INS
|
XBRL Instance Document
|
|
|
101.SCH
|
XBRL Schema Document
|
|
|
101.CAL
|
XBRL Calculation Linkbase Document
|
|
|
101.LAB
|
XBRL Labels Linkbase Document
|
|
|
101.PRE
|
XBRL Presentation Linkbase Document
|
|
|
101.DEF
|
XBRL Definition Linkbase Document
|
|
*
|
Filed herewith.
|
|
†
|
Denotes management contract or compensation plan or arrangement.
|
78
TABLE OF CONTENTS
Part IItem 1. BusinessItem 1A. Risk FactorsItem 1B. Unresolved Staff CommentsItem 2. PropertiesItem 3. Legal ProceedingsItem 4. Mine Safety DisclosuresPart IIItem 5. Market For Registrant S Common Equity, Related Stockholder Matters and Issuer Purchases Of Equity SecuritiesItem 6. Selected Financial DataItem 7. Management S Discussion and Analysis Of Financial Condition and Results Of OperationsItem 7A. Quantitative and Qualitative Disclosures About Market RiskItem 8. Financial Statements and Supplementary DataItem 9. Changes in and Disagreements with Accountants on Accounting and Financial DisclosureItem 9A. Controls and ProceduresItem 9B. Other InformationPart IIIItem 10. Directors, Executive Officers and Corporate GovernanceItem 11. Executive CompensationItem 12. Security Ownership Of Certain Beneficial Owners and ManagementItem 13. Certain Relationships and Related TransactionsItem 14. Principal Accounting Fees and ServicesPart IVItem 15. Exhibits and Financial Statement Schedules