DIGIRAD CORP
10-Ks and 10-Qs
|
|
|
|
|
|
|
|
|
|
|
|
|
|
|
|
|
|
|
|
|
|
|
|
|
|
|
|
|
|
|
|
|
|
|
|
|
|
|
|
|
|
|
|
|
|
|
|
|
|
UNITED STATES
SECURITIES AND EXCHANGE COMMISSION
WASHINGTON, DC 20549
|
Form 10-K
|
(Mark One)
ý
ANNUAL REPORT PURSUANT TO SECTION 13 OR 15(d) OF THE SECURITIES EXCHANGE ACT OF 1934
For the fiscal year ended
December 31, 2011
or
o
TRANSITION REPORT PURSUANT TO SECTION 13 OR 15(d) OF THE SECURITIES EXCHANGE ACT OF 1934
For the transition period from to
Commission file number: 000-50789
|
Digirad Corporation
|
|
(Exact Name of Registrant as Specified in its Charter)
|
|
Delaware
|
|
33-0145723
|
|
(State or Other Jurisdiction of
Incorporation or Organization)
|
|
(I.R.S. Employer
Identification No.)
|
|
13950 Stowe Drive, Poway, CA
|
|
92064
|
|
(Address of Principal Executive Offices)
|
|
(Zip Code)
|
(858) 726-1600
(Registrant’s Telephone Number, Including Area Code)
Securities registered pursuant to Section 12(b) of the Act:
|
Title of Each Class
|
|
Name of Each Exchange on Which Registered
|
|
Common Stock, par value $0.0001 per share
|
|
NASDAQ Global Market
|
Securities registered pursuant to Section 12(g) of the Act:
Common Stock, par value $0.0001 per share
Indicate by check mark if the registrant is a well-known seasoned issuer, as defined in Rule 405 of the Securities Act. Yes
¨
No
ý
Indicate by check mark if the registrant is not required to file reports pursuant to Section 13 or Section 15(d) of the Act. Yes
¨
No
ý
Indicate by check mark whether the registrant: (1) has filed all reports required to be filed by Section 13 or 15(d) of the Securities Exchange Act of 1934 during the preceding 12 months (or for such shorter period that the registrant was required to file such reports), and (2) has been subject to such filing requirements for the past 90 days. Yes
ý
No
¨
Indicate by check mark whether the registrant has submitted electronically and posted on its corporate Web site, if any, every Interactive Data File required to be submitted and posted pursuant to Rule 405 of Regulation S-T (§232.405 of this chapter) during the preceding 12 months (or for such shorter period that the registrant was required to submit and post such files). Yes
ý
No
¨
Indicate by check mark if disclosure of delinquent filers pursuant to Item 405 of Regulation S-K (§ 229.405 of this chapter) is not contained herein, and will not be contained, to the best of registrant’s knowledge, in definitive proxy or information statements incorporated by reference in Part III of this Form 10-K or any amendment to this Form 10-K.
¨
Indicate by check mark whether registrant is a large accelerated filer, an accelerated filer, a non-accelerated filer, or a smaller reporting company. See the definitions of “large accelerated filer,” “accelerated filer” and “smaller reporting company” in Rule 12b-2 of the Exchange Act.
Large accelerated filer
¨
Accelerated filer
¨
Non-accelerated filer
x
Smaller reporting company
¨
(Do not check if a smaller reporting company)
Indicate by check mark whether the registrant is a shell company (as defined in Rule 12b-2 of the Exchange Act). Yes
¨
No
ý
As of June 30, 2011, the aggregate market value of the registrant’s voting and non-voting common stock held by non-affiliates was approximately $52.3 million, based on the closing price of Digirad common stock on the NASDAQ Global Market on June 30, 2011 of $2.71 per share. Shares of common stock held by each officer and director and by each person who owns 10% or more of the outstanding Common Stock of the registrant have been excluded in that such persons may be deemed to be affiliates. This determination of affiliate status is not necessarily a conclusive determination for other purposes.
The number of outstanding shares of the registrant’s common stock, par value $0.0001 per share, as of January 31, 2012 was 19,531,463.
DOCUMENTS INCORPORATED BY REFERENCE
Portions of the registrant’s definitive Proxy Statement to be filed with the Securities and Exchange Commission within 120 days after registrant’s fiscal year ended
December 31, 2011
are incorporated by reference into Part III of this report.
DIGIRAD CORPORATION
FORM 10-K—ANNUAL REPORT
For the Fiscal Year Ended December 31, 2011
Table of Contents
|
|
|
Page
|
|
Item 1
|
||
|
Item 1A
|
||
|
Item 1B
|
||
|
Item 2
|
||
|
Item 3
|
||
|
Item 4
|
||
|
Item 5
|
||
|
Item 6
|
||
|
Item 7
|
||
|
Item 7A
|
||
|
Item 8
|
||
|
Item 9
|
||
|
Item 9A
|
||
|
Item 9B
|
||
|
Item 10
|
||
|
Item 11
|
||
|
Item 12
|
||
|
Item 13
|
||
|
Item 14
|
||
|
Item 15
|
||
Cautionary Statement Regarding Forward-Looking Statements
This report contains various forward-looking statements regarding our business, financial condition, results of operations and future plans and projects. Forward-looking statements discuss matters that are not historical facts and can be identified by the use of words such as “believes,” “expects,” “anticipates,” “intends,” “estimates,” “projects,” “can,” “could,” “may,” “will,” “would” or similar expressions. In this report, for example, we make forward-looking statements regarding, among other things, our expectations about the rate of revenue growth in specific business segments and the reasons for that growth and our profitability, our expectations regarding an increase in sales, strategic traction and marketing and sales spending, uncertainties relating to our ability to compete, uncertainties relating to our ability to increase our market share, changes in coverage and reimbursement policies of third-party payors and the effect on our ability to sell our products and services, the existence and likelihood of strategic acquisitions and our ability to timely develop new products or services that will be accepted by the market.
Although these forward-looking statements reflect the good faith judgment of our management, such statements can only be based upon facts and factors currently known to us. Forward-looking statements are inherently subject to risks and uncertainties, many of which are beyond our control. As a result, our actual results could differ materially from those anticipated in these forward-looking statements as a result of various factors, including those set forth below under the caption “Risk Factors.” For these statements, we claim the protection of the safe harbor for forward-looking statements contained in the Private Securities Litigation Reform Act of 1995. You should not unduly rely on these forward-looking statements, which speak only as of the date on which they were made. They give our expectations regarding the future but are not guarantees. We undertake no obligation to update publicly or revise any forward-looking statements, whether as a result of new information, future events or otherwise, unless required by law.
Corporate Information
Digirad Corporation was incorporated in Delaware in 1997. Unless the context requires otherwise, in this report the terms “we,” “us” and “our” refer to Digirad
®
Corporation and our wholly-owned subsidiaries, Digirad Imaging Solutions
®
, Inc. and Digirad Ultrascan Solutions, Inc. and their predecessors.
|
ITEM 1.
|
BUSINESS
|
Overview
We generate revenues within two primary operating segments: our Product equipment sales and service segment and our imaging services segment. We are the pioneer developer and a leading manufacturer of medical diagnostic imaging systems, including solid-state gamma cameras for nuclear cardiology and general nuclear medicine applications. We also are one of the largest national providers of in-office nuclear cardiology and ultrasound imaging services to physician practices, hospitals and imaging centers through our Digirad Imaging Solutions, Inc. (“DIS”) subsidiary.
We were the first to commercialize solid-state nuclear gamma cameras for the detection of cardiovascular disease and other medical conditions. Our imaging systems are sold in both portable (i.e., movable) and fixed (i.e., stationary) configurations, and provide enhanced operability, improved patient comfort and can result in lower healthcare costs. Our triple-head Cardius
®
3 XPO system provides significantly shorter image acquisition time when compared to traditional vacuum tube cameras or our single or dual head Cardius
®
cameras. Our ergo
TM
imaging system is a large field-of-view general purpose imager featuring a sleek ergonomic (portable) design that offers clinical versatility and high performance. The ergo
TM
expands our reach beyond nuclear cardiology into general nuclear medicine with applicability to various disease states. Our nuclear cameras fit easily into floor spaces as small as seven feet by eight feet and facilitate the delivery of nuclear medicine procedures in a physician’s office or an outpatient hospital setting. Our new ergo
TM
can be used in the intensive and critical care units, pediatrics, trauma units, patient floors, emergency and operating rooms, women’s health or research areas.
Through DIS, we offer a convenient and economically efficient imaging services program as an alternative to purchasing a gamma camera or ultrasound equipment or outsourcing the procedures to another physician or imaging center. For physicians who wish to perform nuclear imaging, echocardiography, vascular or general ultrasound tests, or any combination of these procedures in their offices, we provide the ability for them to engage our services, which includes the use of our imaging system, qualified personnel, and related items required to perform imaging in the their own offices and bill Medicare, Medicaid or one of the third-party healthcare insurers directly for those services. These services are also used by large and small hospitals, multi-practice physician groups, and imaging centers. The flexibility of our products and our DIS service allows physicians to ensure continuity of care and convenience for their patients and allows them to retain revenue from procedures they would otherwise refer to imaging centers and hospitals. DIS services are primarily provided to cardiologists, internal
1
medicine physicians, and family practice doctors who enter into annual contracts for a set number of days ranging from once per month to five times per week. We experience some seasonality in our DIS business related to vacations, holidays, and inclement weather. Most of the DIS business focuses on cardiac care with an increase in a combination of cardiac and general ultrasound imaging in recent months. Many of the physicians who use DIS services are reliant on reimbursements from Medicare and third-party insurers where there has been downward pressure and uncertainty due to factors outside the physicians’ control. The uncertainty created by the 2010 healthcare reform laws, Congress’ continued deferred action on the Sustainable Growth Rate reimbursement factor (which is part of the Relative Value Unit calculation of reimbursements for all medical codes) and other legislation has also impacted our business. These changes may require further modifications to our business model in order for our physician customers and us to maintain a viable economic model.
Our Product revenue results primarily from selling solid-state gamma cameras and camera maintenance contracts. We sell our imaging systems to physician offices, hospitals and imaging centers primarily in the United States, although we have sold a small number of imaging systems internationally. Recently, we introduced our first general imaging camera called the ergo
TM
, which is targeted to hospital customers. Prior to that, we introduced a new product called the Cardius
®
X-ACT camera, which is a rapid cardiac SPECT/VCT imager. The Cardius
®
X-ACT camera also is positioned more toward the hospital and larger cardiology practices.
Market Opportunity
Nuclear Imaging
Nuclear imaging is a form of diagnostic imaging in which depictions of the internal anatomy or physiology are generated primarily through non-invasive means. Diagnostic imaging facilitates the early diagnosis of diseases and disorders, often minimizing the scope, cost and amount of care required and reducing the need for more invasive procedures. Currently, the major types of non-invasive diagnostic imaging technologies available are: x-ray, magnetic resonance imaging (MRI), computerized tomography (CT), ultrasound, positron emission tomography or PET (which is a form of nuclear imaging) and nuclear imaging. The most widely used imaging acquisition technology utilizing gamma cameras is single photon emission computed tomography, or SPECT. All of our current cardiac gamma cameras employ SPECT methodology.
According to industry sources, (despite the improving image quality and increasing utilization rates of competing modalities such as computed tomography, positron emission tomography, and magnetic resonance imaging, and diagnostic procedures such as CT angiography), SPECT procedures performed with gamma cameras will continue to be used for a substantial number of cardiac-specific imaging procedures. We believe continued utilization will be driven by patients having easier access to nuclear medicine services at physicians’ offices, lower purchase and maintenance costs, a smaller physical footprint, and easier service logistics of gamma cameras. In an emerging trend in cardiology, SPECT technologies are being integrated with other imaging modalities, to form hybrid imaging modalities, such as SPECT/CT, resulting in improved clinical quality and diagnostic certainty. We are also seeking other market opportunities to expand the use of our technology.
Clinical Applications for Nuclear Imaging
Nuclear imaging is used primarily in cardiovascular, oncology, and neurological applications. Nuclear imaging involves the introduction of very low-level radiopharmaceuticals into the patient’s bloodstream. The radiopharmaceuticals are specially formulated to concentrate temporarily in the specific part of the body to be studied. The radiation signals emitted by the materials are then converted into an image of the body part or organ. Nuclear imaging has several advantages over other diagnostic imaging modalities, showing not only the anatomy or structure of an organ or body part, but also its function including blood flow, organ function, metabolic activity, and biochemical activity. Cardiologists and an increasing number of internists and other physicians either purchase our nuclear cameras or subscribe to our DIS services for in-office cardiac imaging for these advantages We are also exploring various applications of our nuclear imaging in hospitals, including but not limited to use in the emergency room, surgical suite and nuclear labs.
Ultrasound Imaging
Ultrasound is a form of diagnostic imaging in which depictions of the internal anatomy are generated primarily through non-invasive means. Ultrasound imagers use sonar techniques to generate diagnostic images that facilitate the early diagnosis of diseases and disorders, often minimizing the scope and cost of care required and reducing the need for invasive procedures.
Clinical Applications for Ultrasound Imaging
Ultrasound is one of the most widely used imaging techniques in the United States. Ultrasound imaging is used primarily in obstetrics, internal medicine, cardiovascular care, and vascular health applications. Ultrasound imaging involves the transmission and detection of sound waves into and from a patient’s body. The sound waves transmitted by the ultrasound
2
system are then converted into an image of the body part or organ. Ultrasound imaging also shows the anatomy or structure of many internal organs or body parts, as well as key functional information—including blood flow, wall motion and organ function. Our ultrasound services are used by an increasing number of cardiologists, internists and other physicians for in-office echocardiography and general ultrasound imaging.
Our Imaging Services
DIS offers portable nuclear and ultrasound imaging services. We have obtained Intersocietal Commission for Nuclear Cardiology Laboratories (ICANL) and Intersocietal Commission for Echocardiography Laboratories (ICAEL) accreditation for our services. Our nuclear modality services include an imaging system, a certified nuclear medicine technologist and a cardiac stress technician, often certified or a trained nurse or paramedic, the supply of radiopharmaceuticals, and required licensing services for the performance of nuclear imaging procedures under the supervision of physicians. Our licensing infrastructure provides the radioactive materials license, radiation safety officer services, radiation safety training, monitoring and compliant policies and procedures, and the quality assurance function to ensure adherence to applicable state and federal nuclear regulations. The ultrasound imaging service is similar, in that we provide the ultrasound equipment and one experienced ultrasound technologist.
Our portable nuclear imaging operations use a “hub and spoke” model in which centrally located regional hubs anchor multiple van routes in the surrounding metropolitan areas. At our DIS hubs, clinical personnel load the equipment, radiopharmaceuticals, and other supplies onto specially equipped vans for transport to the physician’s office or other customer locations, where they set up the equipment for the day. After quality assurance testing, a technologist under the physician’s supervision will gather patient information, inject the patient with a radiopharmaceutical, and then acquire the images for interpretation by the physician.
We provide nuclear and ultrasound services primarily under annual contracts for services delivered on a per-day basis. Under these agreements, physicians pay us a fixed amount for each day and they commit to the scheduling of a minimum number of lease days during the lease term, which normally runs for one year. The same fixed payment amount is due for each day regardless of the number of patients seen or the reimbursement or payment obtained by the physician, practice, hospital, or imaging center.
Our Products
Digirad markets and manufactures a line of nuclear medicine cameras for nuclear cardiology and general nuclear medicine applications. Our cameras are used in hospitals, imaging centers, physician offices and by mobile service providers. The central component of a nuclear camera is the detector and it ultimately determines the overall clinical quality of the image a camera produces. Our nuclear cameras feature detectors based on advanced proprietary solid-state technology developed by us. Solid-state systems have a number of benefits over conventional photomultiplier tube-based camera designs typically offered by our competitors. Our solid-state technology systems are typically 2 – 5 times lighter and considerably more compact than most traditional nuclear systems, making them far easier and less costly to build, as well as very reliable. Our solid-state technology provides us with the capability to market and manufacture a diverse family of high-performance dedicated cardiac and general-purpose cameras that offer a number of economic, service and performance benefits over traditional PMT-based camera systems.
Our Cardius
®
family of dedicated cardiac SPECT (single-photon emission computerized tomography) solid-state imagers are noted for their compactness, portability and unique upright imaging capabilities that make it possible to image patients up to 500 pounds in a sitting position. Upright imaging makes it possible to image large bariatric, COPD (Chronic Obstructive Pulmonary Disease) or claustrophobic patients that typically could not be imaged lying down on competitive systems and afford our users the ability to generate added revenue to their practices. We offer fixed dual-head and triple-head cardiac camera models for dedicated use within a facility and a portable dual-head configuration that makes it possible to move the system to provide service to multiple rooms or sites. We are a market leader in the mobile solid-state nuclear camera segment. Our newest flagship in cardiology is the Cardius
®
XACT SPECT/CT system. It features a triple-head design and a low dose volume CT attenuation correction methodology, making it possible to perform studies faster with greater interpretation diagnostic confidence. Our XACT camera is increasingly being sought by departments seeking to improve productivity, increase clinical accuracy or employ new low dose clinical protocols.
Recently, we introduced the new ergo
TM
large-field-of-view planar portable imaging camera. We have received orders and installed several of these cameras at some prominent medical centers in the United States, as well as our first camera placement in Europe. The ergo
TM
imaging system is targeted to hospitals with multi-camera general nuclear medicine departments, academic centers, pediatric hospitals, regional trauma centers, women’s health centers, and cancer centers. Most general nuclear medicine departments have the need for a single-head planar portable camera for imaging patients more conveniently on hospital stretchers, for imaging patients that can’t be moved, and for imaging patient’s at their bedside (pediatrics, intensive
3
care units, critical care units, emergency rooms, surgical suites, women’s health clinics, or on regular patient floors). A single-head planar camera provides a more economical and convenient way to perform approximately 25% or more of all studies commonly performed in general nuclear medicine. It also opens the door to perform studies on critically ill patients in the patient’s room and the ability to perform new molecular breast imaging protocols that offer new revenue generation potential while improving the standard of patient care. We believe the ergo™ imaging system offers strong growth potential in segments like surgery, as well as in a number of important international markets.
Competitive Strengths
We believe that our competitive strength is based on our proprietary solid-state technology in general nuclear medicine and cardiology. We also believe that we hold a recognized position as a market leader in solid-state technology.
|
•
|
Leading Solid-State Technology.
Our solid-state gamma cameras utilize proprietary photo-detector modules which enable us to build smaller and lighter cameras that are portable, with a degree of ruggedness that can withstand the vibration associated with transportation. We have continued to invest in technology advancements that enhance the performance of our solid-state photodiode detectors over traditional photomultiplier tube-based systems for both cardiac and general purpose nuclear medicine applications. We now offer a more geometric-efficient design for cardiology and introduced our ergo
TM
imaging system in mid-2010, our first large field-of-view solid-state detector system for use in general nuclear medicine, pediatrics, women’s health and surgery. We see expanded opportunities for such systems worldwide as departments replace aged single-head systems and migrate towards more modern solid-state systems offering higher performance, greater clinical flexibility and the ability to be used portably to image patients at their bedsides.
|
|
•
|
Portable Applications through Reduced Size and Weight
. Our cameras, depending on the model, weigh anywhere from 600 to 1,000 pounds. Competitive anger photomultiplier tube-based technology cameras generally weigh 2 to 5 times as much. Our dedicated cardiac imagers require a floor space of as little as seven feet by eight feet and generally can be installed without facility renovations and use standard power (20 Amps @ 120 VAC). Our portable cameras are ideal for mobile operators or practices desiring to service multiple office locations or imaging facilities, and for use in our DIS in-office service business. We bring nuclear technology to the patient. Our systems do not require the patient to be taken to the camera, a significant competitive advantage.
|
|
•
|
Speed and Image Quality.
We believe our Cardius
®
3 XPO and X-ACT rapid imaging dedicated cardiac cameras, equipped with our proprietary nSPEED 3DOSEM software, can acquire images up to four times faster than conventional fixed 90 or variable dual-head photomultiplier vacuum tube camera designs with equivalent image quality. Increased imaging speed optimizes workflow and resource utilization and allows for reduction of the administered dose of radiation to patients or the use of low dose imaging protocols, which we believe is increasingly of interest to our physician customers. Use of rapid imaging systems, combined with nSPEED, gives us an efficiency advantage over other mobile service providers.
|
|
•
|
Fully-Integrated low dose SPECT/CT Technology.
Our Cardius
®
XACT rapid imaging system (triple-head) equipped with a low dose volume CT attenuation correction system allows studies to be performed faster using less radiation than competitive techniques, with improved diagnostic confidence in interpreted results. The competitive advantages of our Cardius
®
XACT system include its ability to deliver higher productivity and lower radiation exposure to patients.
|
|
•
|
Improved Patient Comfort and Utilization.
We believe the upright and open architecture of our patient chair reduces patient claustrophobia and increases patient comfort when compared to traditional vacuum tube-based imaging systems, the majority of which require the patient to lie flat and have detector heads rotate around the patient. Upright imaging positioning also reduces false indications that can result from organs pushing-up against the heart while patients are on their backs. Our Cardius
®
XPO camera series allows for the imaging of patients weighing up to 500 pounds.
|
|
•
|
Broad Portfolio of Cardiovascular Imaging Services.
Another competitive advantage is our ability to offer nuclear cardiology, echocardiography and complete vascular imaging services. Our ability to offer multiple services strengthens our competitive position and expands our revenue potential. The depth of services offered varies depending on the local market opportunity, availability of personnel and credentialing requirements in the individual markets.
|
|
•
|
Unique Dual Sales and Leasing Service Offering.
We sell imaging systems to physicians who wish to perform nuclear imaging in their facilities and manage the related service logistics. Through DIS, we offer both nuclear and ultrasound services in which we lease our systems and certified personnel to physicians on an annual basis in flexible increments, ranging from one day per month to several days per week without requiring them to make a capital investment, hire
|
4
personnel, obtain licensure, or manage other logistics associated with operating a nuclear imaging site.
|
•
|
Intellectual Property Portfolio.
We have developed an intellectual property portfolio that includes product, component and process patents covering various aspects of our imaging systems. As of December 31,
2011
, we had 36 issued U.S. patents and an additional 9 pending U.S. patent applications. We also license patents from third parties to enhance our product offering. In addition to our patent portfolio, we have developed proprietary manufacturing, business know-how, and trade secrets. This portfolio of intellectual property combined with our ability to design, manufacture, sell and service our own equipment provides us with a distinct competitive advantage.
|
Business Strategy
Our goals to achieve and maintain profitability and generate consistent positive cash flow via the following:
|
•
|
Imaging Services (DIS).
After a difficult 2010 with headwinds in radiopharmaceutical shortages, healthcare reform uncertainties and reimbursement declines, 2011 showed signs of stabilization. The supply of radiopharmaceuticals stabilized, the impact of healthcare reform is being absorbed and Medicare reimbursements in nuclear codes increased in 2011 over 2010. We expect to continue supporting our physician customers by working with them to adjust our DIS business model; for example, with regulatory changes in 2011, we developed a process to assist them in obtaining direct accreditation. This initiative added value to our customers and will provide an additional revenue stream to our DIS business. We continue to focus on aligning our labor and other costs with the variable nature of our revenue streams. Also, we expect to provide greater value in our service channel via strategic and technological initiatives designed to increase revenue per day for us and our physician customers, as well as expand our service model offerings.
|
|
•
|
Product Equipment Sales.
In order to overcome the market decline of cardiac specific cameras and the general downturn in the economy that has limited the amount of healthcare capital spending, we intend to increase our market share by expanding beyond the cardiac-specific nuclear market. Our Cardius
®
XACT camera is particularly geared toward hospitals and large physician practices. Our new ergo
TM
imaging system also addresses the larger market of general nuclear imaging and provides us with a new untapped market opportunity within the hospital. Our ergo
TM
imaging system is not just part of a hospital nuclear suite. It is a camera that enables the imaging to be performed wherever the patient is located and has great promise in areas of the hospital where previously no nuclear imaging has been performed, such as the emergency room and the surgical suite. Although the selling cycle in hospitals can be long, we anticipate increased sales of our ergo™ imaging system in 2012 and beyond.
|
Manufacturing
We manufacture our gamma cameras and employ a strategy that combines our internal design expertise and proprietary process technology with selective outsourcing. Outsourcing the manufacturing of certain components of our cameras has resulted in cost efficiencies. We perform subassembly and final system performance tests at our facility. In addition, suppliers of our critical materials, components, and subassemblies undergo ongoing quality audits by us.
We use enterprise resource planning and collaborative software to help improve efficiency in the handling and security of inventory, purchasing, and the reduction of manufacturing variances. We use forecasting software to allow for more detailed and separate planning of service and product inventory. In some cases, we are in-sourcing when volumes do not allow for cost effective outsourcing.
We and our third-party manufacturers are subject to FDA Quality System Regulations, state regulations, such as those promulgated by the California Department of Health Services, and standards set by the International Organization for Standardization, or ISO. We are currently certified to the ISO 13485:2003 quality standard. In 2009, we received certification authorizing CE Marking of our Cardius
®
XPO and 2020tc family of gamma cameras, as well as U.S. Food and Drug Administration (FDA) 510(k) clearance for our new Cardius
®
X-ACT camera. The X-ACT camera utilizes a patent pending x-ray technology to provide attenuation correction information for the SPECT reconstruction. In 2010, we received FDA 510(k) clearance for our new Ergo LFOV General Purpose Imager. And in 2011, we received certification authorizing CE Marking of our Ergo imaging system. The CE Mark is a requirement for selling in many international markets.
Competition
The medical device industry, including the market for nuclear and ultrasound imaging systems and services, is highly competitive. Our business in the private practice and hospital sectors continues to face the challenge of a decline in demand for nuclear imaging equipment and services, which we believe reflects in part, the impact of the Deficit Reduction Act on the reimbursement environment and the 2010 Healthcare Reform laws, decline in the overall economy and competition from competing imaging modalities, such as CT (computed tomography) angiography, PET (positron emission tomography), and
5
hybrid technologies. We believe that the principal competitive factors in our market include acceptance by physicians, budget availability, qualification for reimbursement, pricing, ease-of-use, reliability and mobility.
In providing DIS imaging services, we compete against many smaller local and regional nuclear and/or ultrasound providers, often owner-operators. The fixed-installation operators often utilize used equipment and the mobile operators may use older Digirad single-head cameras or newer dual-head cameras. We are the only mobile provider with our own exclusive source of triple-head mobile systems. Some competing operators place new or used cameras into physician offices and then provide the staffing, supplies and other support as an alternative to a DIS lease. In addition, we compete against imaging centers that install fixed nuclear gamma cameras and make them available to referring physicians in their geographic vicinity. In these cases, the physician sends his/her patients to the imaging center.
In selling our imaging systems, we compete against several large medical device manufacturers who offer a full line of imaging cameras for each diagnostic imaging technology, including x-ray, MRI, CT, ultrasound, nuclear medicine, or SPECT/CT and PET/CT hybrid imagers. The existing nuclear imaging systems sold by these competitors have been in use for a longer period of time than our products and are more widely recognized and used by physicians and hospitals for nuclear imaging; however, they are generally not solid-state, light-weight, as flexible and portable. Additionally, certain medical device companies have developed solid-state gamma cameras which may directly compete with our product offerings. Many of the larger multi-modality competitors enjoy significant competitive advantages over us, including greater name recognition, greater financial and technical resources, established relationships with healthcare professionals, broader distribution networks, more resources for product development and marketing and sales and have the ability to bundle products to offer discounts.
Sales
We maintain two sales organizations, which operate independently: Product sales and DIS sales. The sales teams work together to ensure that our customers make the right decisions in purchasing a gamma camera or utilizing our imaging. DIS sales teams are aligned with the eight geographic areas we have established in order to better serve local market needs. Our nuclear and ultrasound imaging business has been restructured to have a President and a Vice President of Sales and Marketing that oversee ten areas. Each area is led by a local or regional business director who is responsible for the needs of our customers in that area and who has local P&L responsibility. DIS expects to increase market penetration by executing new quantitative profiling approaches to identifying suitable physician practices and by expanding the breadth of available imaging services in select markets to include nuclear medicine, echocardiography, and vascular and general ultrasound scans. The Product team is divided into six territories, each managed by a Product Sales Manager (PSM). The SMs sell directly to physicians, clinics and hospital customers and work closely with distributors in some of the regions. They currently focus on hospitals, cardiology practices, and large primary care multi-specialty groups.
Research and Development
As of
December 31, 2011
, our research and development staff consisted of eleven full-time employees plus part-time employees and consultants. We have a long and extensive commitment to research and development, including an established history in developing innovative solid-state gamma cameras. We have an established core competency in the development of silicon photodiodes and related scintillator assemblies, signal processing electronics and image processing software, which are the core technologies of our gamma cameras. In 2009, we received U.S. Food and Drug Administration (FDA) 510(k) clearance for our new Cardius
®
X-ACT camera. The X-ACT camera utilizes a patent-pending x-ray technology to provide attenuation correction information for the SPECT reconstruction. In 2010, we received FDA 510(k) clearance for our new ergo LFOV General Purpose Imager.
Our research and development efforts are primarily focused in the near term on developing further enhancements to our existing products as well as developing our next generation products. Our objective is to increase the image quality, sensitivity, and reliability of our imaging systems. Our research and development expense was
$2.7 million
,
$2.9 million
, and
$3.4 million
in
2011
,
2010
, and
2009
, respectively.
Government Regulation
We and our medical professional customers must comply with a mosaic of federal and state laws and regulations. Violations of such laws and regulations can be punishable by criminal, civil, and/or administrative sanctions, including, in some instances, imprisonment and exclusion from participation in healthcare programs such as Medicare and Medicaid. Federal and state governmental agencies are continuing heightened enforcement efforts in the healthcare industry, and whistleblower cases are becoming more common. Accordingly, we maintain a vigorous compliance program and a hotline that permits our personnel to report violations while remaining anonymous if they wish. Our compliance committee, consisting of senior management, other select employees and our Compliance Officer, meets regularly to provide oversight of our compliance initiatives. We also conduct periodic audits to help ensure compliance with applicable laws.
6
The following is a summary of some of the laws and regulations governing our business:
|
•
|
Anti-Kickback Laws.
The Medicare/Medicaid Patient Protection Act of 1987, as amended, which is commonly referred to as the Anti-Kickback Statute, prohibits us from knowingly and willingly offering, paying, soliciting, or receiving any form of remuneration in return for the referral of items or services, or to purchase, lease, order or arrange for or recommend purchasing, leasing, or ordering any good, facility service or item, for which payment may be made under a federal healthcare program. Violation of the federal anti-kickback law is a felony, punishable by criminal fines and imprisonment, or both, and can result in civil penalties and exclusion from participation in healthcare programs such as Medicare and Medicaid. Many states have adopted similar statutes prohibiting payments intended to induce referrals of products or services paid by Medicaid or other nongovernmental third-party payors.
|
|
•
|
Physician Self-Referral Laws.
Federal regulations commonly referred to as the “Stark Law” prohibit physician referrals of Medicare or Medicaid patients to an entity for certain designated health services if the physician or an immediate family member has an indirect or direct financial relationship with the entity, unless a statutory exception applies. We believe that referrals made by our physician customers are eligible to qualify for the “in-office ancillary services” exception to the Stark Law, provided that the services are provided or supervised by the physician or a member of his or her “Group Practice,” as that term is defined under the law, the services are performed in the same building in which the physicians regularly practice medicine, and the services are billed by or for the supervising physician or Group Practice. Violations of the Stark Law may lead to the imposition of penalties and fines, the exclusion from participation in federal healthcare programs, and liability under the federal False Claims Act and its whistleblower provisions. Many states have adopted similar statutes prohibiting self-referral arrangements that cover all patients and not just Medicare and Medicaid patients.
|
|
•
|
Federal False Claims Act.
The federal False Claims Act imposes civil and criminal liability on individuals or entities for the submission of false or fraudulent claims for payment to the government. Violations of the federal False Claims Act may result in civil penalties and exclusion from participation in federal healthcare programs. The federal False Claims Act also allows a private individual to bring a qui tam suit on behalf of the government against an individual or entity for violations of the False Claims Act. In a qui tam suit, a private plaintiff initiates a lawsuit for money of which the government was defrauded. If successful, the private plaintiff is entitled to receive up to 30% of the recovered amount plus reasonable expenses and attorney fees. A number of states have enacted laws modeled after the False Claims Act.
|
|
•
|
HIPAA
. The Health Insurance Portability and Accountability Act of 1996, or HIPAA, prohibits schemes to defraud healthcare benefit programs and fraudulent conduct in connection with the delivery of, or payment for, healthcare benefits, items or services. HIPAA also establishes standards governing electronic healthcare transactions and protecting the security and privacy of individually identifiable health information. Some states have also enacted privacy and security statutes or regulations that, in some cases, are more stringent than those issued under HIPAA.
|
The American Recovery and Reinvestment Act of 2009, enacted February 17, 2009 made significant changes to HIPAA privacy and security regulation. Effective February 17, 2010, we are regulated directly under all of the HIPAA rules protecting the security of electronic individually identifiable health information and many of the rules governing the privacy of such information. In addition, the statute significantly increases and strengthens the penalties and enforcement of the HIPAA privacy and security rules.
|
•
|
Medical Device Regulation.
The FDA classifies medical devices, such as our cameras, into one of three classes, depending on the degree of risk associated with the device and the extent of control needed to ensure safety and effectiveness. Devices deemed to pose lower risk are placed in either class I or II, which generally requires the manufacturer to submit to the FDA a pre-market notification requesting permission for commercial distribution. This process is known as 510(k) clearance. Devices deemed to pose the greatest risk, such as life-sustaining, life-supporting or implantable devices, or devices deemed not substantially equivalent to a previously cleared 510(k) device, are placed in Class III, requiring an approved Premarket Approval Application (PMA). Our cameras are Class II medical devices which have been cleared for marketing by the FDA. After a device receives 510(k) clearance, any modification that could significantly affect its safety or effectiveness or that would constitute a major change in its intended use requires a new 510(k) clearance. The FDA requires each device manufacturer to determine whether a modification requires a new clearance or approval, but the FDA can disagree with a manufacturer’s determination. If so, the FDA can require the manufacturer to cease marketing and/or recall the modified device until 510(k) clearance or approval is obtained. We are also subject to post-market regulatory requirements relating to our manufacturing process, marketing and sales activities, product performance and medical device reports should there be deaths and serious injuries associated with our products.
|
|
•
|
Pharmaceutical Regulation.
Federal and state agencies, including the FDA and state pharmacy boards, regulate the radiopharmaceuticals used in our DIS business. These agencies administer laws governing the manufacturing, sale,
|
7
distribution, use, administration, prescribing, and dispensing of drugs. Some of our activities may be deemed by relevant agencies to require additional permits or licensure that we currently do not possess.
|
•
|
Radioactive Materials Laws.
We must maintain licensure under, and comply with, federal and state radioactive materials laws, or RAM laws. RAM laws require, among other things, that radioactive materials are used by, or that their use be supervised by, individuals with specified training, expertise, and credentials and include specific provisions applicable to the medical use of radioactive materials. In our case, the authorized user must be a physician with training and expertise in the use of radioactive materials for diagnostic purposes. We have entered into contracts with qualified physicians in each of our regions to serve as authorized users. Because our physician customers in our lease services business are not licensees, and in most cases are not qualified to serve as authorized users, they perform nuclear medicine procedures as “supervised persons.”
|
Intellectual Property
We rely on a combination of patent, trademark, copyright, trade secret, and other intellectual property laws, nondisclosure agreements, and other measures to protect our intellectual property. We require our employees, consultants, and advisors to execute confidentiality agreements and to agree to disclose and assign to us all inventions conceived during the work day, using our property, or which relate to our business. Despite any measures taken to protect our intellectual property, unauthorized parties may attempt to copy aspects of our products or to obtain and use information that we regard as proprietary.
Patents
We have developed a patent portfolio that covers our overall products, components and processes. As of
December 31, 2011
, we had 36 issued U.S. patents and 9 pending U.S. patent applications. The issued and pending patents cover, among other things, aspects of solid-state radiation detectors including our photodiodes, signal processing, and system configuration. Our issued patents expire between August 9, 2016 and April 20, 2030. We have multiple patents covering unique aspects and improvements for many of our products. We have entered into a royalty-bearing license for several U.S. patents with a third parties, where we are the licensee, for exclusive or non-exclusive use in nuclear imaging (subject to certain reservation of rights by the U.S. Government). In addition to our solid-state detector and photodiode technology patents, we hold specific patents for an alternative solid-state method using Cadmium Zinc Telluride that we previously pursued for use in gamma cameras. While each of our patents applies to nuclear medicine, many also apply to the construction of area detectors for other types of medical and non-medical imagers and imaging methods.
Trademarks
As of
December 31, 2011
, we hold trademark registrations in the United States for the following marks: 2020
tc
IMAGER
®
, Digirad
®
, DigiServ
®
, Cardius
®
, SPECTour
®
, SPECTpak Plus
®
, Solidium
®
, and DigiTech
®
, We have obtained and sought trademark protection for some of these listed marks in the European Union and Japan.
Reimbursement
Our customers typically rely primarily on the Medicare and Medicaid programs and private payors for reimbursement. As a result, demand for our products is dependent in part on the coverage and reimbursement policies of these payors. Third party coverage and reimbursement is subject to extensive federal, state, local, and foreign regulation, and private payor rules and policies. In many instances, the applicable regulations, policies and rules have not been definitively interpreted by the regulatory authorities or the courts, and are open to a variety of interpretations and are subject to change without notice.
The scopes of coverage and payment policies vary among third-party private payors. For example, some payors will not reimburse a provider unless the provider has a contract with the payor, and in many instances such payors will not enter into such contracts without the approval of a third party “radiology benefit manager” (or RBM) that the payor compensates based on reducing the payor’s imaging expense. Other payors prohibit reimbursement unless physicians own or lease our cameras on a full-time basis, or meet certain accreditation or privileging standards. Such payor requirements and limitations can significantly restrict the types of business models we can successfully utilize.
Medicare reimbursement rules are subject to annual changes that may affect payment for services that our customers provide. For instance, (as of 02/12/12) only Congressional action has prevented the implementation of an over 30% cut in all Medicare reimbursements and this threat still lingers over the Medicare system and the potential cut grows larger every year.
In addition, Congress has passed healthcare reform proposals that are intended to expand the availability of healthcare coverage and reduce the growth in healthcare spending in the U.S. Many of these laws impact the services that our customers provide. For instance, the law has established an independent body that will have the power to recommend and mandate reimbursement levels for various healthcare services, including the imaging services we provide. An eventual outcome of these
8
healthcare reform laws is expected to be changes, currently unspecified, in reimbursements and we will have to adapt to these changes. We are unable at this time to predict the full impact of health care reform on the diagnostic radiology services that our customers provide.
Medicare reimbursement rules impose many standards and policies on the payment of services that our customers provide. For instance, starting in 2012, physicians billing for the technical component of nuclear imaging tests must be accredited by a government-approved independent accreditation body and many private payors are adopting similar requirements. We have made available to our customers a service to assist them in obtaining and maintaining the required accreditation. We believe we have structured our contracts in a manner that allows our customers to seek reimbursement from third-party payors in compliance with the law. Our physician customers typically bill for both the technical and professional components of the tests. Assuming they meet certain requirements including, but not limited to, performing and documenting bona fide interpretations and providing the requisite supervision of the non-physician personnel performing the tests, they may bill and be paid by Medicare. If the failure to comply is deemed to be “knowing” or “willful,” the government could seek to impose fines or penalties, and we may be required to restructure our agreements and/or respond to any resultant claims by such customers or the government. Our hospital customers typically seek reimbursement by Medicare for outpatient services under the Medicare Hospital Outpatient Prospective Payment System.
Employees
As of
December 31, 2011
, we had a total of 261 full time employees, of which 142 were employed in clinical and regulatory positions, 45 in operations roles, 40 in general and administrative functions, 23 in marketing and sales and 11 in research and development. We had a total of 229 employees in our DIS subsidiary. We have not experienced any work stoppages and consider our employee relations to be good.
Inflation
We believe that inflation has not had a material effect on our results of operations.
Availability of Public Reports
We file electronically with the Securities and Exchange Commission, or SEC, our annual reports on Form 10-K, quarterly reports on Form 10-Q, and current reports on Form 8-K pursuant to Section 13(a) or 15(d) of the Securities Exchange Act of 1934. The public may read or copy any materials we file with the SEC at the SEC’s Public Reference Room at 100 F Street, NE, Room 1580, Washington, DC 20549. The public may obtain information on the operation of the Public Reference Room by calling the SEC at 1-800-SEC-0330. The SEC maintains an Internet site that contains reports, proxy and information statements, and other information regarding issuers that file electronically with the SEC. The address of that site is
http://www.sec.gov.
You may obtain a copy of our annual reports on Form 10-K, quarterly reports on Form 10-Q, and current reports on Form 8-K and amendments to those reports on the day of filing with the SEC on our website at
http://www.digirad.com
, by contacting the Investor Relations Department at our corporate offices by calling 858-726-1600 or through our investor relations consultants at Allen & Caron, Inc. by calling 949-474-4300.
|
ITEM 1A.
|
RISK FACTORS
|
Risks Related to Our Business and Industry
Our revenues may decline further due to reductions in Medicare reimbursement rates.
The success of our business is largely dependent upon our medical professional customers' ability to provide diagnostic imaging care to their patients in an economically sustainable manner, either through the purchase of our imaging systems or using our lease services, or both. Our customers are directly impacted by changes (decreases and increases) in governmental and private payor reimbursements for diagnostic imaging. Although we are not directly impacted by changes in reimbursements, we make every effort to act as business partners with our physician customers, e.g., in 2010, we proactively adjusted the fair market value of our imaging services rate down due to the dramatic reimbursement declines that our customers faced from the Centers for Medicare & Medicaid Services. Although Medicare/Medicaid reimbursement for the imaging modalities that we offer increased slightly in 2011 in the physician office setting, this occurred only after significant declines in ultrasound and nuclear reimbursements. Reimbursements remain a source of concern for our customers and downward pressure on reimbursements cause greater pricing pressure on our lease services and influences the buying decisions of our individual physician Product customers. Although the gap is closing, hospital reimbursements remain higher than in-office reimbursements. Our newer Product business segment's imaging systems are targeted to serve the hospital market. Only a
9
small portion of our DIS business segment operates in the hospital market.
Further reductions in reimbursements could significantly impact the viability of in-office imaging performed by independent physicians. The uncertainty surrounding this issue and the historical decline in reimbursements has resulted in cancellations of imaging days in our imaging services business and the delay of purchase and lease decisions by our existing and prospective customers in our Product business segment. Additional declines in Medicare/Medicaid reimbursement for our relevant diagnostic imaging modalities are possible due to the many factors, including but not limited to the threatened implementation of the federal sustainable growth factor (SGR). The SGR is part of the relative value unit (RVU), a formula that was enacted by Congress as part of the Balanced Budget Act of 1997 to control the cost of the Medicare program. It applies to all health services paid for by Medicare, not just diagnostic imaging. The application of the SGR has been delayed by Congress for many years and most recently, Congressional action has delayed it again until February 2012. If Congress allows the SGR to go into effect in 2012, all Medicare codes could incur a reimbursement reduction of approximately 27%. Congressional leadership has continually stated that they will address this issue; however, to date this had not been done. There is no assurance that the issue will be timely or favorably resolved, and if not favorably resolved, it could have a material adverse impact on our business.
Our revenues may decline further due to changes in diagnostic imaging regulations and use of third parties by private payors to drive down imaging volumes.
Nuclear medicine is a “designated health service” under the federal physician self-referral prohibition law known as the “Stark Law,” which states that a physician may not refer designated health services to an entity with which the physician or an immediate family member has a financial relationship, unless a statutory exception applies. Our business model and lease agreements are structured to enable our physician customers to meet the statutory
in-office ancillary services
(IOAS) exception to the Stark Law allowing them to perform nuclear diagnostic imaging services on their patients in the convenience of their own office. From time-to-time, the Centers for Medicare and Medicaid Services and Congress have proposed to modify the IOAS to further limit or eliminate this exception. Various lobbying organizations are pushing for, and the Medicare Payment Advisory Commission (MedPAC) is actively discussing, limiting the availability of the IOAS exception in order to reduce federal healthcare costs. The outcome of these efforts and discussions is uncertain at this time; however, the limitation or elimination of the IOAS exception could significantly impact our DIS business segment as currently structured.
Our customers who perform imaging services in their office also experience the continuing efforts by some private insurance companies to reduce healthcare expenditures by hiring radiology benefit managers to help them manage and limit imaging. The federal government has also set aside monies in the 2009 recession recovery acts to hire radiology benefit managers to provide image management services to Medicare/Medicaid and MedPAC has recommended and the Centers for Medicare & Medicaid Services has proposed legislation requiring Medicare physicians who engage in a relatively high volume of medical imaging be required to obtain pre-authorization through a radiology benefit manager. A radiology benefit manager is an unregulated entity that performs various functions for private payors and managed care organizations. Radiology benefit manager activities can include pre-authorization for imaging procedures, setting and enforcing standards approving which contracted physicians can perform the services, such as requiring even the most experienced and highly qualified cardiologists to obtain additional board certifications or interfering with the financial decision of the private practitioner by requiring them to own their own imaging system and not allowing them to lease the system. The radiology benefit managers often do not provide written documentation of their decisions or an appeals process, leaving leasing physicians unable to challenge their decisions with the carrier or the state insurance department. Some efforts are being made to address certain radiology benefit manager issues, for example, the New York State Attorney General recently entered into a settlement requiring a radiology benefit manager (based and operating in New York State) to buy out its owners in the state who own imaging centers because it created a conflict of interest in their decisions to deny authorization for competing physicians to provide imaging services; and, New York is requiring the radiology benefit manager to establish an appeals process. However, unregulated radiology benefit manager activities have and could continue to adversely affect our physician customers' ability to receive reimbursement, therefore impacting our customers' decision to utilize our DIS leasing services.
Our manufacturing operations are highly dependent upon the availability of certain third-party suppliers, thereby making us vulnerable to supply problems that could harm our business.
We rely on a limited number of third parties to manufacture and supply certain key components of our products. Alternative sources of production and supply may not be readily available or may take several months to scale-up and develop effective production processes. If a disruption in the availability of parts or in the operations of our suppliers were to occur, such as with respect to components manufactured in Japan, our ability to build gamma cameras could be materially adversely affected. For this reason, we are developing backup plans and investigating alternative procedures that are designed to prevent delays in production. If these plans are unsuccessful, delays in the production of our gamma cameras for an extended period of time could cause a loss of revenue and/or higher production costs, which could significantly harm our business and results of operations.
10
In late 2010, the sole supplier of a key component of our new ergo™ gamma camera ceased production of a critical component. We had a limited supply of that key component and worked hard with several suppliers, who subsequently successfully provided the component. We are working with our new suppliers to improve the yield, cost and efficiency of the key component, which efforts are expected to continue through 2012. The process to qualify a supplier for this key component is long, complex and costly. If the key component is not available when we need it, it could adversely impact our production capability and therefore negatively impact our financial condition. Furthermore, lower yields on the manufacturing of the key component that we do receive from our supplier(s) can have a negative impact on our financial condition through higher purchase price variances, which impact current period gross margins.
Our imaging operations are highly dependent upon the availability of certain radiopharmaceuticals, thereby making us vulnerable to supply problems and price fluctuations that could harm our business.
Our imaging service business involves the use of radiopharmaceuticals. There were significant disruptions in the international supply of these radiopharmaceuticals in 2010, which caused us to cancel services that would have otherwise been provided and this adversely affected our customers, as well as our financial condition in 2010. We believe we now have sufficient supply. The two major nuclear reactors supplying medical radiopharmaceuticals worldwide came back on-line at the end of the third quarter of 2010. We have developed a strong relationship with a radiopharmaceutical company; however, there is no guarantee that the reactors will remain in good repair and our supplier will have continuing access to ample supply of our radiopharmaceutical product. If we are unable to obtain an adequate supply of the necessary radiopharmaceuticals, we may be unable to lease our personnel and equipment through our in-office service operations, or the volume of our services could decline and our business may be adversely affected. Shortages can also cause price increases that may not be accounted for in third party reimbursement rates, thereby causing us to lose margin or require us to pass increases on to our physician customers.
Our business is not widely diversified.
Although we have a strategic initiative to expand our product line into general nuclear imaging with our ergo™ imaging system, which is primarily geared toward the hospital marketplace, historically, we have sold our products and leased our imaging systems and personnel primarily into the cardiac nuclear and ultrasound imaging private practice and in-office markets. We may not be able to leverage our assets and technology to diversify our products and services in order to generate revenue beyond the cardiac nuclear and ultrasound imaging private practice markets. If we are unable to diversify our product and service offerings, our financial condition may suffer.
We compete against businesses that have greater resources and different competitive strengths.
The market for cardiac nuclear imaging cameras is limited and has been decreasing. Some of our competitors have greater resources and a more diverse product offering than we do. Some of our competitors also enjoy significant advantages over us, including greater name recognition, greater financial and technical resources, established relationships with healthcare professionals, larger distribution networks, and greater resources for product development, as well as more extensive marketing and sales resources. Additionally, certain companies have developed portable cameras that directly compete with our product offerings. If we are unable to expand our current market share, our revenues and related financial condition could decline.
In addition, our imaging services customers may switch to other service providers. Our DIS imaging services segment competes against small local, owner operated or regional businesses, some of whom have the advantage of a lower cost structure, and against imaging centers that install nuclear gamma cameras and make them available to physicians in their geographic vicinity. If these competitors are able to win significant portions of our business, our sales could decline significantly. Our financial condition could be adversely affected under such circumstances.
Our quarterly and annual financial results are difficult to predict and are likely to fluctuate from period to period.
We have historically experienced seasonality in our imaging services business, and recent volatility due to the changing health care environment, the variable supply of radiopharmaceuticals, and the downturn in the U.S. economy. While our physicians are obligated to pay us for all lease days to which they have committed, our contracts permit some flexibility in scheduling when services are to be performed. We cannot predict with certainty the degree to which seasonal circumstances such as the summer slowdown, winter holiday vacations and weather conditions may affect the results of our operations. We have also experienced fluctuations in demand of our cardiac nuclear gamma cameras due to economic conditions, capital budget availability, or other financial or business reasons. In addition, due to the way that customers in our target markets acquire our products, a large percentage of our camera orders are booked during the last month of each quarterly accounting period. As such, a delivery delay of only a few days may significantly impact our quarter-to-quarter comparisons. Moreover, the sales cycle in our Product segment for cameras is typically lengthy, particularly with our recent entry into the hospital market, which may cause us to experience significant revenue fluctuations. For these reasons, quarterly and annual sales and operating results may vary in the future. Therefore, period-to-period comparisons of our results of operations are not
11
necessarily meaningful and should not be relied upon as indicators of future performance.
Our common stock is thinly traded and our options plan could affect the trading price of our common stock.
Our common stock is thinly traded and any significant sales of our common stock may cause volatility in our common stock price. We also have registered shares of common stock that we may issue under our employee benefit plans or from our treasury stock. Accordingly, these shares can be freely sold in the public market upon issuance, subject to restrictions under the securities laws. If any of these stockholders, or other selling stockholders, cause a large number of securities to be sold in the public market without a corresponding demand, the sales could reduce the trading price of our common stock. Although we are only aware of two single stockholders owning more than 4.99% of our stock and no one owning more than 14.99% of our stock, one or more stockholders holding a significant amount of our common stock might be able to significantly influence matters requiring approval by our stockholders, possibly including the election of directors and the approval of mergers or other business combination transactions.
We spend considerable time and money complying with federal and state laws, regulations and other rules, and if we are unable to comply with such laws, regulations and other rules, we could face substantial penalties.
We are directly, or indirectly through our physician customers, subject to extensive regulation by both the federal government and the states in which we conduct our business, including: the federal Medicare and Medicaid anti-kickback laws and other Medicare laws, regulations, rules, manual provisions, and policies that prescribe the requirements for coverage and payment for services performed by us and our physician customers; the federal False Claims statutes; the federal Health Insurance Portability and Accountability Act of 1996, or HIPAA, as amended in 2009 under the HITECH Act that places direct legal obligations and higher liability on us with respect to the security and handling of personal health information; the Stark Law; the federal Food, Drug and Cosmetic Act; federal and state radioactive materials laws; state food and drug and pharmacy laws and regulations; state laws that prohibit the practice of medicine by non-physicians and fee-splitting arrangements between physicians and non-physicians; state scope-of-practice laws; and federal rules prohibiting the mark-up of diagnostic tests to Medicare under certain circumstances. If our physician customers are unable or unwilling to comply with these statutes, regulations, rules, and policies, utilization rates of our services and products could decline and our business could be harmed. Additionally, new government mandates will require us to provide a certain baseline of health benefits and premium contribution for our employees and their families or pay governmental penalties. Some of these costs are not tax deductible. We have opted to provide this coverage to our employee base in order to maintain retention of qualified medical technicians and other professionals rather than plan to pay penalties to the government. Either option will result in additional costs to us and could negatively impact our cash reserves.
We maintain a compliance program to identify and correct any compliance issues and remain in compliance with all applicable laws, to train employees, to audit and monitor our operations, and to achieve other compliance goals. Like most companies with compliance programs, we occasionally discover compliance concerns. In such cases, we take responsive action including corrective measures when necessary. There can be no assurance that our responsive actions will insulate us from liability associated with any detected compliance concerns.
If our past or present operations are found to be in violation of any of the laws, regulations, rules, or policies described above or the other laws or regulations to which we or our customers are subject, we may be subject to civil and criminal penalties, damages, fines, exclusion from federal or state health care programs, or the curtailment or restructuring of our operations. Similarly, if our physician customers are found to be non-compliant with applicable laws, they may be subject to sanctions which could have a negative impact on us. Any penalties, damages, fines, curtailment or restructuring of our operations could adversely affect our ability to operate our business and our financial results. Any action against us for violation of these laws, even if we successfully defend against it, could cause us to incur significant legal expenses, divert our management's attention from the operation of our business, and damage our reputation.
Our manufacturing operations and executive offices are located at a single facility that may be at risk from fire, earthquakes or other disasters.
Our manufacturing operations, research and development activities and executive offices are located in a single facility in Poway, California, near known fire areas and earthquake fault zones. Future natural disaster could cause substantial delays in our Product operations, damage to our manufacturing equipment, research and development efforts and inventory, and cause us to incur additional expenses. Although we have taken precautions to insure our facilities and continuing operations, as well as provide for offsite back-up of our information systems, this may not be adequate to cover our losses in any particular case. A disaster could significantly harm our business and results of operations.
The medical device industry is litigious, which could result in the diversion of our management's time and efforts, and require us to pay damages which may not be covered by our insurance.
12
Our operations entail risks of claims or litigation relating to product liability, radioactive contamination, patent infringement, trade secret disclosure, warranty claims, vendor disputes, product recalls, property damage, misdiagnosis, breach of contract, personal injury, and death. Any litigation or claims against us, or claims we bring against others, may cause us to incur substantial costs, could place a significant strain on our financial resources, divert the attention of our management from our core business and harm our reputation. We may incur significant liability in the event of any such litigation, regardless of the merit of the action. If we are unable to obtain insurance, or if our insurance is inadequate to cover claims, our cash reserves and other assets could be negatively impacted. Additionally, costs associated with maintaining our insurance could become prohibitively expensive, and our ability to become or remain profitable could be diminished.
Our ability to protect our intellectual property and proprietary technology through patents and other means is uncertain.
Our success depends, in part, on our ability to protect our proprietary rights to the technologies used in our products. Our pending United States patent applications, which include claims to material aspects of our products and procedures that are not currently protected by issued patents, may not issue as patents in a form that will be advantageous to us. Any patents we have obtained or do obtain may be challenged by re-examination or otherwise invalidated or eventually found unenforceable. Both the patent application process and the process of managing patent disputes can be time consuming and expensive. Competitors may attempt to challenge or invalidate our patents, or may be able to design alternative techniques or devices that avoid infringement of our patents, or develop products with functionalities that are comparable to ours. In the event a competitor infringes upon our patent or other intellectual property rights, litigation to enforce our intellectual property rights or to defend our patents against challenge, even if successful, could be expensive and time consuming and could require significant time and attention from our management. We may not have sufficient resources to enforce our intellectual property rights or to defend our patents against challenges from others.
Anti-takeover provisions in our organizational documents, our Stockholders Rights Plan and Delaware law may prevent or delay removal of current management or a change in control.
Our restated certificate of incorporation and restated bylaws contain provisions that may delay or prevent a change in control, discourage bids at a premium over the market price of our common stock, and adversely affect the market price of our common stock and the voting and other rights of the holders of our common stock. The rights issued pursuant to our Stockholder Rights Plan will become exercisable, subject to certain exceptions, the tenth day after a person or group announces acquisition of 20% or more of our common stock or announces commencement of a tender or exchange offer, the consummation of which would result in ownership by the person or group of 20% or more of our common stock. In addition, as a Delaware corporation, we are subject to Delaware law, including Section 203 of the Delaware General Corporation Law. In general, Section 203 prohibits a Delaware corporation from engaging in any business combination with any interested stockholder for a period of three years following the date that the stockholder became an interested stockholder unless certain specific requirements are met as set forth in Section 203. These provisions, alone or together, could have the effect of deterring or delaying changes in incumbent management, proxy contests or changes in control.
|
ITEM 1B.
|
UNRESOLVED STAFF COMMENTS
|
None.
|
ITEM 2.
|
PROPERTIES
|
Our DIS and Product segment operations are headquartered in an approximately 72,000 square foot facility in Poway, California that is leased to us until February 2016. We believe that our existing facility is adequate for our current needs. In addition, DIS leases approximately 30 small hub locations in the various states in which we operate, which primarily house our fleet of cameras and vans. The lease terms typically range between two and four years.
|
ITEM 3.
|
LEGAL PROCEEDINGS
|
In the normal course of business, we have been, and will likely continue to be, subject to litigation or administrative proceedings incidental to our business, such as claims related to customer disputes, employment practices, wage and hour disputes, product liability, professional liability, commercial disputes, licensure restrictions or denials, and warranty or patent infringement. Responding to litigation or administrative proceedings, regardless of whether they have merit, can be expensive and disruptive to normal business operations. As litigation and the administrative proceedings are inherently uncertain, we cannot predict the outcome of such matters. While the ultimate outcome of litigation is always uncertain, we do not believe that it will have a material adverse effect on our business or financial results.
13
|
ITEM 4.
|
MINE SAFETY DISCLOSURES
|
Not applicable
14
|
ITEM 5.
|
MARKET FOR REGISTRANT’S COMMON EQUITY, RELATED STOCKHOLDER MATTERS AND ISSUER PURCHASES OF EQUITY SECURITIES
|
Market Information
Our common stock is traded on the NASDAQ Global Market under the symbol "DRAD." The following table presents the high and low per share sale prices of our common stock during the periods indicated, as reported on NASDAQ.
|
Year ended December 31,
|
||||||||||||||||
|
2011
|
2010
|
|||||||||||||||
|
High
|
Low
|
High
|
Low
|
|||||||||||||
|
First Quarter
|
$
|
2.63
|
|
$
|
2.13
|
|
$
|
2.16
|
|
$
|
1.83
|
|
||||
|
Second Quarter
|
3.04
|
|
2.40
|
|
2.49
|
|
2.01
|
|
||||||||
|
Third Quarter
|
2.91
|
|
2.15
|
|
2.13
|
|
1.74
|
|
||||||||
|
Fourth Quarter
|
2.40
|
|
1.78
|
|
2.23
|
|
1.88
|
|
||||||||
As of January 31, 2012, there were approximately 210 holders of record of our common stock. We believe that the number of beneficial owners is substantially greater than the number of record holders because a large portion of our common stock is held of record through brokerage firms in "street name."
Dividend Policy
We have never declared or paid cash dividends on our capital stock. We currently intend to retain available funds and any future earnings for use in the operation and expansion of our business and do not anticipate paying any cash dividends in the foreseeable future.
Sales of Unregistered Securities
None.
Issuer Purchases of Equity Securities
Issuer purchases of equity securities during the fourth quarter of fiscal 2011 were:
|
Total Number of
Shares Purchased
During the Period
|
Average Price
Paid Per Share
for Period
Presented
|
Total Cumulative
Number of
Shares Purchased
as Part of Publicly
Announced Plan (1)
|
Maximum Dollar
Value of Shares
that May Yet
Be Purchased
Under the Plan
|
|||||||||||
|
October 1, 2011 – October 31, 2011
|
—
|
|
$
|
—
|
|
—
|
|
$
|
—
|
|
||||
|
November 1, 2011 – November 30, 2011
|
—
|
|
—
|
|
—
|
|
—
|
|
||||||
|
December 1, 2011 – December 31, 2011
|
9,607
|
|
2.01
|
|
582,825
|
|
957,261
|
|
||||||
|
As of December 31, 2011
|
9,607
|
|
582,825
|
|
$
|
957,261
|
|
|||||||
|
(1)
|
On February 4, 2009, our Board of Directors approved a stock repurchase program whereby we may, from time to time, purchase up to $2.0 million worth of our common stock in the open market, in privately negotiated transactions or otherwise, at prices that we deem appropriate. The plan has no expiration date. The timing of stock repurchases and the number of shares of common stock to be repurchased has been and will be made in compliance with Rule 10b-18 under the Securities Exchange Act of 1934. The timing and extent of the repurchase will depend upon market conditions, applicable legal and contractual requirements, and other factors.
|
15
Stock Performance Graph
Notwithstanding any statement to the contrary in any of our previous or future filings with the SEC, the following information relating to the price performance of our common stock shall not be deemed “filed” with the SEC or “Soliciting Material” under the Exchange Act, or subject to Regulation 14A or 14C, or to liabilities of Section 18 of the Exchange Act except to the extent we specifically request that such information be treated as soliciting material or to the extent we specifically incorporate this information by reference.
The graph below compares the cumulative total stockholder return on our common stock with the cumulative total return on the NASDAQ Stock Market Index and the NASDAQ Medical Equipment Index. The period shown commences on December 31, 2006 and ends on December 31, 2011, the end of our most recent fiscal year. The graph assumes an investment of $100 on December 31, 2006, and the reinvestment of any dividends, if any. The comparisons shown in the graph below are based upon historical data.
The comparisons in the graph below are required by the Securities and Exchange Commission and are not intended to forecast or be indicative of possible future performance of our common stock.
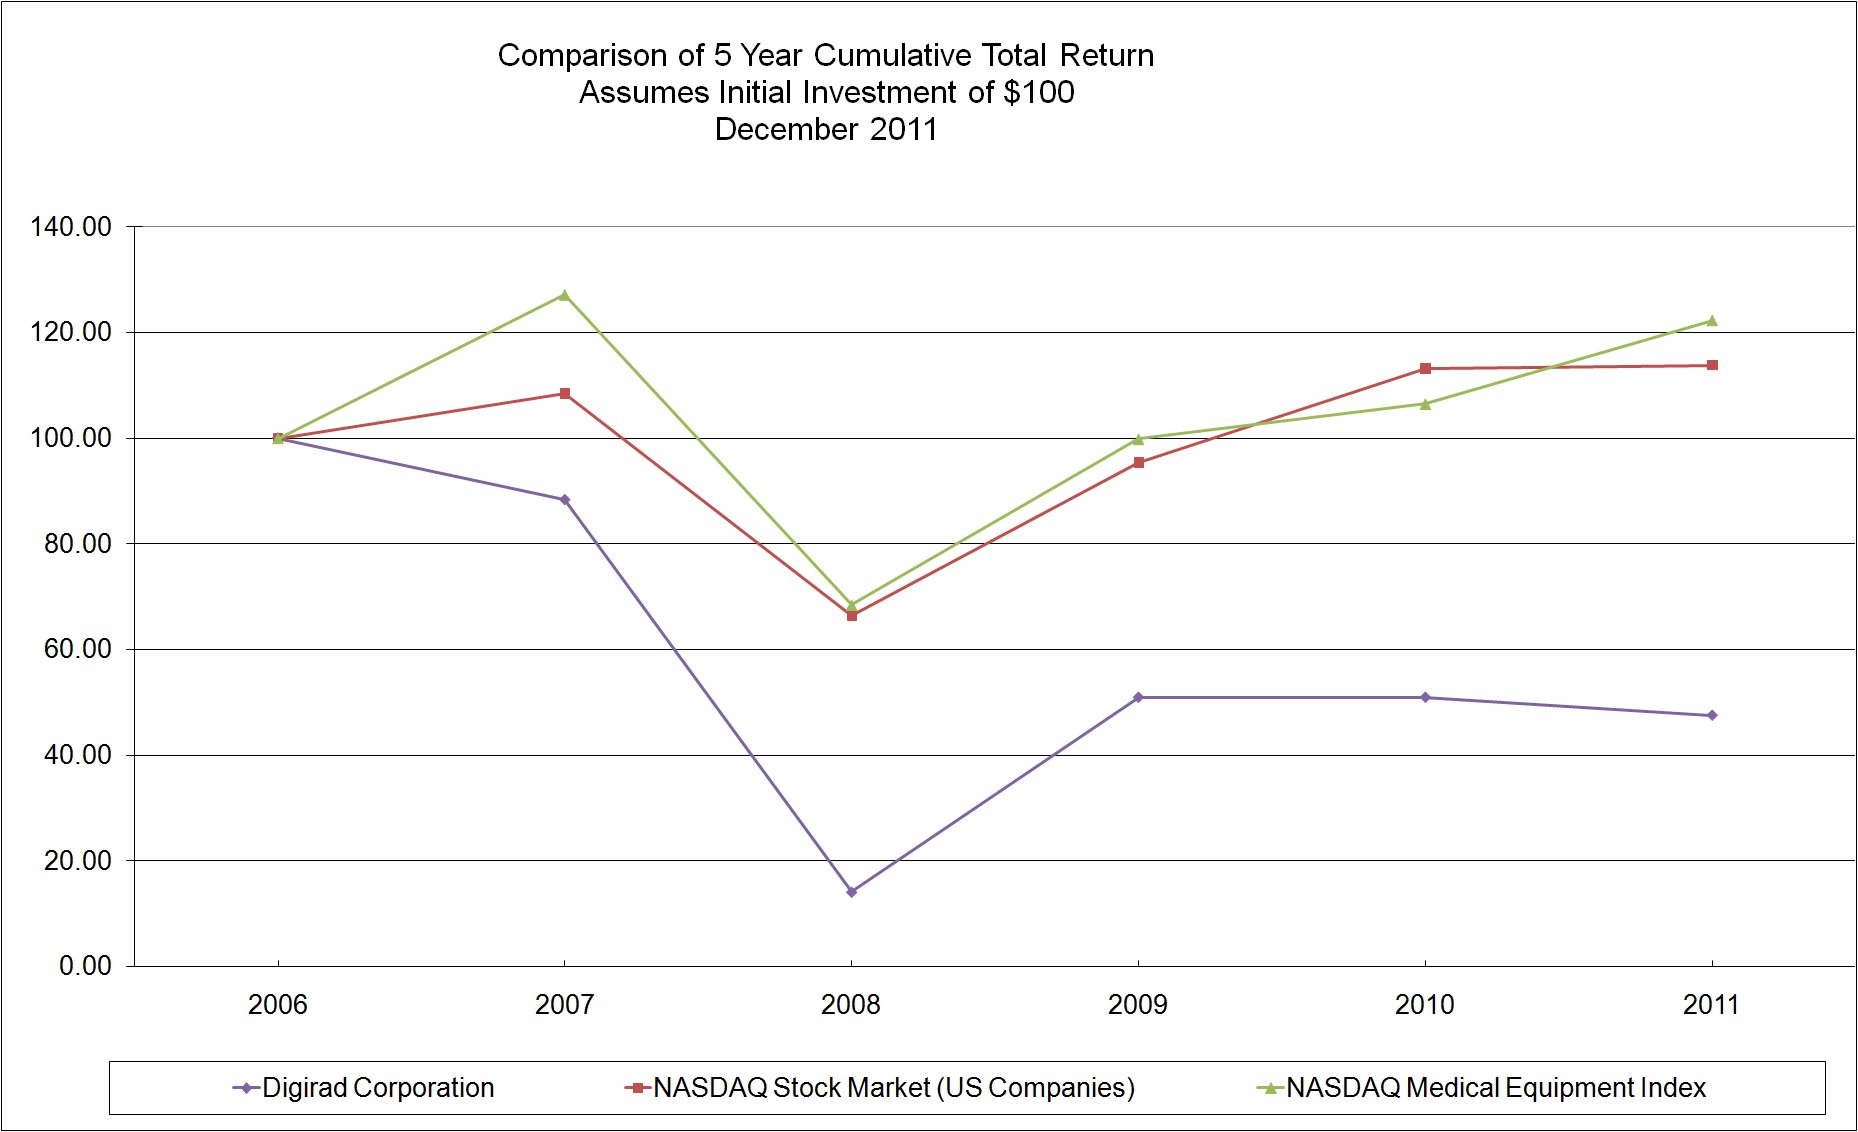
|
12/29/2006
|
12/31/2007
|
12/31/2008
|
12/31/2009
|
12/31/2010
|
12/30/2011
|
|||||||||||||
|
Digirad Corporation
|
$
|
100
|
|
$
|
88.35
|
|
$
|
14.08
|
|
$
|
50.97
|
|
$
|
50.97
|
|
$
|
47.58
|
|
|
NASDAQ Stock Market (US Companies)
|
$
|
100
|
|
$
|
108.47
|
|
$
|
66.35
|
|
$
|
95.38
|
|
$
|
113.2
|
|
$
|
113.81
|
|
|
NASDAQ Medical Equipment Index
|
$
|
100
|
|
$
|
127.15
|
|
$
|
68.47
|
|
$
|
99.85
|
|
$
|
106.48
|
|
$
|
122.33
|
|
16
|
ITEM 6.
|
SELECTED CONSOLIDATED FINANCIAL DATA
|
The following selected financial data should be read in conjunction with our Consolidated Financial Statements and related disclosures and Item 7, “Management’s Discussion and Analysis of Financial Condition and Results of Operations,” which are included elsewhere in this Form 10-K. Amounts are presented in thousands, except per share amounts.
|
|
Years Ended December 31,
|
|||||||||||||||||||
|
|
2011
|
2010
|
2009
|
2008
|
2007
|
|||||||||||||||
|
Statement of Operations Data:
|
||||||||||||||||||||
|
Revenues:
|
||||||||||||||||||||
|
DIS
|
$
|
37,794
|
|
$
|
39,542
|
|
$
|
52,318
|
|
$
|
56,204
|
|
$
|
52,440
|
|
|||||
|
Product
|
15,951
|
|
16,641
|
|
17,278
|
|
24,154
|
|
21,507
|
|
||||||||||
|
Total revenues
|
53,745
|
|
56,183
|
|
69,596
|
|
80,358
|
|
73,947
|
|
||||||||||
|
Cost of revenues:
|
||||||||||||||||||||
|
DIS
|
29,672
|
|
32,561
|
|
38,476
|
|
44,697
|
|
39,520
|
|
||||||||||
|
Product
|
9,315
|
|
11,618
|
|
10,895
|
|
15,590
|
|
13,909
|
|
||||||||||
|
Total cost of revenues
|
38,987
|
|
44,179
|
|
49,371
|
|
60,287
|
|
53,429
|
|
||||||||||
|
Gross profit
|
14,758
|
|
12,004
|
|
20,225
|
|
20,071
|
|
20,518
|
|
||||||||||
|
Operating expenses:
|
||||||||||||||||||||
|
Research and development
|
2,738
|
|
2,875
|
|
3,360
|
|
2,764
|
|
3,072
|
|
||||||||||
|
Marketing and sales
|
7,622
|
|
5,922
|
|
6,977
|
|
8,554
|
|
7,670
|
|
||||||||||
|
General and administrative
|
7,741
|
|
9,007
|
|
8,921
|
|
11,805
|
|
11,920
|
|
||||||||||
|
Amortization and impairment of intangible assets
|
331
|
|
435
|
|
590
|
|
798
|
|
697
|
|
||||||||||
|
Restructuring loss
|
(164
|
)
|
355
|
|
319
|
|
1,308
|
|
—
|
|
||||||||||
|
Goodwill impairment loss
|
—
|
|
—
|
|
—
|
|
2,466
|
|
—
|
|
||||||||||
|
Total operating expenses
|
18,268
|
|
18,594
|
|
20,167
|
|
27,695
|
|
23,359
|
|
||||||||||
|
Income (loss) from operations
|
(3,510
|
)
|
(6,590
|
)
|
58
|
|
(7,624
|
)
|
(2,841
|
)
|
||||||||||
|
Other income, net
|
168
|
|
376
|
|
550
|
|
759
|
|
1,465
|
|
||||||||||
|
Net income (loss)
|
$
|
(3,342
|
)
|
$
|
(6,214
|
)
|
$
|
608
|
|
$
|
(6,865
|
)
|
$
|
(1,376
|
)
|
|||||
|
Net income (loss) per share:
|
||||||||||||||||||||
|
Basic and diluted
|
$
|
(0.18
|
)
|
$
|
(0.33
|
)
|
$
|
0.03
|
|
$
|
(0.36
|
)
|
$
|
(0.07
|
)
|
|||||
|
Shares used in per share calculations:
|
||||||||||||||||||||
|
Basic
|
19,052
|
|
18,774
|
|
18,836
|
|
18,955
|
|
18,845
|
|
||||||||||
|
Diluted
|
19,052
|
|
18,774
|
|
19,320
|
|
18,955
|
|
18,845
|
|
||||||||||
|
|
As of December 31,
|
|||||||||||||||||||
|
|
2011
|
2010
|
2009
|
2008
|
2007
|
|||||||||||||||
|
Balance Sheet Data:
|
||||||||||||||||||||
|
Cash, cash equivalents and securities
|
$
|
30,452
|
|
$
|
30,247
|
|
$
|
31,810
|
|
$
|
28,284
|
|
$
|
31,662
|
|
|||||
|
Working capital
|
35,585
|
|
35,920
|
|
37,826
|
|
33,650
|
|
33,905
|
|
||||||||||
|
Total assets
|
50,027
|
|
52,244
|
|
58,689
|
|
61,195
|
|
69,015
|
|
||||||||||
|
Total debt
|
—
|
|
—
|
|
—
|
|
106
|
|
213
|
|
||||||||||
|
Total stockholders’ equity
|
41,487
|
|
43,959
|
|
49,389
|
|
48,959
|
|
55,247
|
|
||||||||||
17
|
ITEM 7.
|
MANAGEMENT’S DISCUSSION AND ANALYSIS OF FINANCIAL CONDITION AND RESULTS OF OPERATIONS
|
The following discussion contains forward-looking statements which involve risks and uncertainties. Our actual results could differ materially from those anticipated in these forward-looking statements as a result of various factors, including those set forth previously under the caption “Risk Factors.” This Management’s Discussion and Analysis of Financial Condition and Results of Operations should be read in conjunction with our consolidated financial statements and related notes included elsewhere in this report.
Overview
We are a leading developer and manufacturer of medical diagnostic imaging systems including solid-state gamma cameras for nuclear cardiology and general nuclear medicine applications. We also are one of the largest national providers of in-office nuclear cardiology imaging and ultrasound services to physician practices, hospitals and imaging centers through our Digirad Imaging Solutions (“DIS”) business segment. We designed and commercialized the first solid-state nuclear gamma camera for the detection of cardiovascular disease and other medical conditions. Our imaging systems are sold in both portable and fixed configurations, and provide enhanced operability, improved patient comfort and, in the case of our triple-headed Cardius
®
3 XPO system, shorter image acquisition time when compared to traditional vacuum tube cameras or our single or dual headed cameras. Our nuclear cameras fit easily into floor spaces as small as seven feet by eight feet and facilitate the delivery of nuclear medicine procedures in a physician’s office, an outpatient hospital setting or within multiple departments of a hospital, (e.g., emergency and operating rooms).
We generate revenues within two primary operating segments: DIS (our diagnostic imaging service business) and our Product segment. Through DIS, we offer a comprehensive diagnostic imaging services program as an alternative to purchasing a gamma camera or ultrasound equipment for physicians who wish to perform nuclear imaging, echocardiography, vascular ultrasound, or any combination of these procedures in their offices by leasing the imaging system, certified personnel and other support required to perform imaging in the physician’s office. The flexibility of our products and our DIS diagnostic imaging service allows physicians more control over the diagnosis and treatment of their patients in their offices and to retain revenue from procedures they would otherwise refer elsewhere. DIS diagnostic imaging services are primarily provided to cardiologists, internal medicine physicians and family practice doctors who enter into annual contracts for our diagnostic imaging services delivered on a per-day basis. Our typical contracts provide service coverage ranging from once per month to five times per week. We experience some seasonality in our DIS business related to vacations, holidays and inclement weather. We have been experiencing a significant market change due to the decline in reimbursements to our physicians and the uncertainty with healthcare legislation. This market change may require further adjustments to our business model in order for our physician customers and us to maintain a viable economic model. Our Product revenue results primarily from selling solid-state gamma cameras and camera maintenance contracts. We sell our imaging systems to physician offices, hospitals, and imaging centers primarily in the United States, although we have sold a small number of imaging systems internationally. In order to address an industry need for attenuation correction and as part of our Product roadmap, we introduced our Cardius
®
X-ACT camera, which is a rapid cardiac SPECT/VCT imager. The Cardius
®
X-ACT camera is positioned more toward the hospital and larger cardiology practices. Recently, we expanded our product line further and introduced our ergo
TM
general purpose portable imaging system, which is targeted to hospital customers.
Our Market
The target market for our products and services is comprised of cardiologists, internal medicine physicians, family practice physicians, and hospitals in the United States that perform or could perform nuclear and ultrasound diagnostic imaging procedures. At December 31,
2011
, we provided imaging services through DIS to more than 1,100 physicians and physician groups. We have sold over 690 cameras through our Product segment. More than half of our DIS nuclear and ultrasound diagnostic imaging customers are internal medicine physicians or other primary care practitioners, and the remainder are primarily cardiologists. Our market has been negatively affected, particularly in 2010, by lower physician reimbursements from CMS (“Center for Medicare and Medicaid Services”) and third party providers for the codes under which our physician customers bill for our services, pricing pressures, decreases in radiopharmaceutical isotope supplies and continuing efforts by some third party payers to reduce health care expenditures by requiring physicians to obtain specific accreditations or certifications. We have been and will continue to address these market pressures by introducing new products, such as our Cardius
®
X-ACT and ergo
TM
imaging systems and modifying our DIS business model. We anticipate introducing other new products and services in 2012 and beyond.
Trends and Drivers
The medical device industry, including the market for nuclear and ultrasound diagnostic imaging systems and services, is
18
highly competitive. Our business continues to be affected by many factors, including generally declining healthcare reimbursement rates for cardiac imaging procedures (although reimbursement for nuclear diagnostic imaging increased in 2011, it did not offset the declines in 2010), competition from alternative imaging modalities such as positron emission tomography (PET) and computed tomography (CT) angiography, competition from other small owner-operated mobile nuclear diagnostic imaging providers, declining average selling prices for our product offerings and general uncertainty in the healthcare marketplace. We expect most of these trends to continue in the foreseeable future. We continue to experience a decline in demand for our cameras, partially due to limited hospital and physician group capital budgets, in addition to uncertainties related to changes in healthcare regulations and economic conditions. We believe that this trend may continue throughout 2012.
Our physician customers incurred a significant decrease in reimbursement on January 1, 2010 from CMS and third party providers for the codes under which our physician customers bill for our services, which has impacted their businesses (reduced the profitability of our services) and our business (reduced the number of days that we scanned and reduced the price that we charge for a day of service). Furthermore, severe winter weather does affect our business by reducing the number of scan days that we can provide. In 2010, the worldwide medical radiopharmaceutical shortage reduced the number of scan days that we were able to provide and negatively impacted our business. Also, the uncertainty over the enactment of future legislation that may impact reimbursement rates continues to linger and cause concern with our physician customers. We are building and modifying our business model to adapt to environmental and regulatory changes in the healthcare marketplace.
In our Product segment, we continue to build on past achievements by introducing new products targeted specifically at the larger physician practices and hospital marketplace. Our Cardius
®
X-ACT imaging system is 510(k) approved by the U.S. Food and Drug Administration (FDA). Recently, we introduced our ergo
TM
general purpose portable imaging system, which is targeted to hospital customers. The ergo
TM
system is designed to image the inside of a patient’s body using radioactive isotopes. The ergo
TM
system can be moved around the hospital so patients who cannot be taken to a nuclear medicine department can still be scanned. It includes a detector with a 12.5-inch-by-15.5-inch field of view, which is large enough to scan lungs and other organs larger than the heart. It is our first nuclear diagnostic imaging camera not exclusively focused on cardiology. We believe that our ergo
TM
imaging system will allow us to expand into new and growing market segments by saving our physician and hospital customers time and money.
2011
Financial Highlights
Our consolidated revenues were
$53.7 million
for the year ended
December 31, 2011
. This was a decrease of $
2.4 million
, or
4.3%
, over the comparable prior year period primarily due to a decrease in revenue from our DIS segment. DIS revenue decreased
$1.7 million
, or
4.4%
, due to a reduction in our daily service fee combined with a reduction in the number of days we were able to scan for our physician customers. We reduced our daily lease fee in 2010 to provide more incentive to our physician customers to continue using our services, since CMS reduced reimbursement to the physicians for our diagnostic imaging procedures significantly at the beginning of 2010. We were only able to increase our daily lease fee slightly in 2011. Furthermore, our physician customers reduced the number of days they scanned their patients in 2011, in part due to the lack of patient volume as a result of the poor economy and in part due to the uncertainty in the healthcare marketplace. The worldwide shortage of radiopharmaceuticals, which significantly impacted our business in 2010, was not a factor in 2011, as full medical isotope supply was restored. Additionally, Product revenues for the year ended December 31,
2011
also decreased by
$0.7 million
, or
4.1%
, compared to the prior year period, primarily due to a reduction in the number of cameras which were sold to cardiology practices and hospitals. The number of cameras sold decreased to 27 from 34 during the year ended December 31,
2011
and
2010
, respectively.
We realized a loss from operations and a net loss for the year ended December 31,
2011
as a result of decreased DIS and Product segment sales, despite an improvement in gross margin and a reduction in our operating expenses. Our consolidated net loss for the year ended December 31,
2011
was
$3.3 million
, significantly lower than our net loss of
$6.2 million
during the prior year. The decline in loss in our DIS segment was primarily attributable to our effort to align clinical labor with revenue and reduce our radiopharmaceutical costs. The decline in loss in our Product segment was primarily attributable to lower manufacturing costs, a decrease in our excess and obsolete inventory reserves and the sale of certain previously reserved cameras.
Our DIS business currently operates in 19 states. For the year ended
December 31, 2011
, DIS operated 64 nuclear gamma cameras and 67 ultrasound imaging systems, compared to 67 nuclear gamma cameras and 66 ultrasound imaging systems during the same period in the prior year. The decrease in nuclear gamma cameras was primarily due to a decline in the number of days our customers needed our services and our desire to maximize utilization of our equipment. We are seeking to improve our overall profitability through more efficient utilization of our fleet of gamma cameras and ultrasound equipment. In some cases, we use cameras as “back-up” cameras (which reside at our various hub locations and are used when primary cameras are in need of repair); and in other cases, we sell or move our cameras to fixed site customer locations. We measure efficiency by tracking system utilization, which is measured based on the percentage of days that our nuclear gamma cameras and ultrasound equipment are used to deliver services to customers out of the total number of days that they are available to deliver such
19
services. System utilization decreased to 56.1% for the year ended
December 31, 2011
, compared to 60.7% in the prior year, primarily due to fewer scan days as discussed above.
Critical Accounting Policies
Management’s discussion and analysis of our financial condition and results of operations are based upon our consolidated financial statements which are prepared in accordance with United States generally accepted accounting principles. The preparation of these financial statements requires us to make estimates and judgments that affect the reported amounts of assets and liabilities, related disclosure of contingent assets and liabilities at the date of the financial statements, and the reported amounts of revenues and expenses during the reporting period. We evaluate our estimates and judgments, the most critical of which are those related to revenue recognition and inventory valuation. We base our estimates and judgments on historical experience and other factors that we believe to be reasonable under the circumstances. Materially different results can occur as circumstances change and additional information becomes known.
Revenue Recognition
We derive revenues primarily from providing in-office services to support the performance of cardiac diagnostic imaging procedures and from selling and servicing solid-state digital gamma cameras. We recognize revenue in accordance with the authoritative guidance for revenue recognition, when all of the following four criteria are met: (i) a contract or sales arrangement exists; (ii) products have been shipped and title has transferred or services have been rendered; (iii) the price of the products or services is fixed or determinable; and (iv) collectability is reasonably assured. The timing of revenue recognition is based upon factors such as passage of title and risk of loss, the need for installation, and customer acceptance. These factors are based on the specific terms of each contract or sales arrangement.
DIS revenue is derived from our ability to provide our physician customers with our services, which includes use of our imaging system, qualified personnel, and related items required to perform imaging in their own offices and bill Medicare, Medicaid and other payors for in-office nuclear and ultrasound diagnostic imaging procedures. Revenue related to diagnostic imaging services is recognized at the time services are performed and collection is reasonably assured. DIS diagnostic imaging services are generally billed on a per-day basis under annual contracts for nuclear diagnostic imaging, which specifies the number of days of service to be provided, or on a flat rate month-to-month basis for ultrasound imaging.
Product revenues are generated from the sales of gamma cameras and follow-on maintenance service contracts. We generally recognize revenue upon delivery to customers. The Company also provides installation and training for camera sales in the United States. Installation and training is generally performed shortly after delivery and represents a cost which the Company accrues at the time revenue is recognized. Neither service is essential to the functionality of the product. Maintenance services are sold beyond the term of the warranty, which is generally one year from the date of purchase. Revenue from these contracts is deferred and recognized ratably over the period of the obligation and is included in Product sales.
Reserves for Doubtful Accounts and Billing Adjustments
We provide reserves for billing adjustments and doubtful accounts. We review reserves on a quarterly basis and make adjustments based on our historical experience rate and known collectability issues and disputes. We also consider our bad debt write-off history. Our estimates of collectability could be impacted by material amounts due to changed circumstances, such as a higher number of defaults or material adverse changes in a payor’s ability to meet its obligations. Within DIS, we record adjustments and credit memos that represent billing adjustments within the first 90 days subsequent to the performance of service. A provision for billing adjustments is charged against DIS revenues and a provision for doubtful accounts is charged to general and administrative expenses. Our risk of material loss is mitigated as we only have a small number of customer accounts in both DIS and Product that have receivable balances in excess of $100,000.
Inventory
We state inventories at the lower of cost (first-in, first-out) or market (net realizable value) and review our inventory balances for excess and obsolete inventory levels on a quarterly basis. Costs include material, labor and manufacturing overhead and variance costs. We rely on historical information to support our reserve and utilize management’s business judgment. We generally reserve 100% of the cost of service inventory quantities in excess of a projected 36 month demand. We reserve 100% of the cost of production inventory quantities in excess of a projected 24 month demand. Once inventory is reserved, we do not adjust the reserve balance until the inventory is sold or disposed.
Fair-value of Financial Instruments
The authoritative guidance for fair value measurements defines fair value for accounting purposes, establishes a framework
20
for measuring fair value and provides disclosure requirements regarding fair value measurements. The guidance defines fair value as an exit price, which is the price that would be received upon sale of an asset or paid upon transfer of a liability in an orderly transaction between market participants at the measurement date. The degree of judgment utilized in measuring the fair value of assets and liabilities generally correlates to the level of pricing observability. Assets and liabilities with readily available, actively quoted prices or for which fair value can be measured from actively quoted prices in active markets generally have more pricing observability and require less judgment in measuring fair value. Conversely, assets and liabilities that are rarely traded or not quoted have less pricing observability and are generally measured at fair value using valuation models that require more judgment. These valuation techniques involve some level of management estimation and judgment, the degree of which is dependent on the price transparency of the asset, liability or market and the nature of the asset or liability. We have categorized our assets and liabilities measured at fair value into a three-level hierarchy in accordance with this guidance. See Note 4 for a further discussion regarding our measurement of assets and liabilities at fair value.
Valuation of Long-Lived Assets including Finite Lived Purchased Intangible Assets
Long-lived assets consist of property and equipment and finite lived intangible assets. We record property and equipment at cost, and record other intangible assets based on their fair values at the date of acquisition. We calculate depreciation on property and equipment using the straight-line method over the estimated useful life of the assets. We calculate amortization on other intangible assets using either the accelerated or the straight-line method over the estimated useful life of the assets, based on the nature of when we expect to receive cash inflows generated by the intangible assets.
Impairment losses on long-lived assets used in operations are recorded when indicators of impairment are present and the undiscounted cash flows estimated to be generated by those assets are less than the assets’ carrying amount. If such assets are considered to be impaired, the impairment to be recognized is measured by the amount by which the carrying amount of the assets exceeds the estimated fair value of the assets. When indicators of impairment exist, we perform an annual review of the carrying value of our long-lived assets to be held and used, including certain identifiable intangible assets, during the fourth quarter of each fiscal year. No impairment losses were recorded on long-lived assets during the years ended December 31, 2011 and 2010.
Valuation of Goodwill
On May 1, 2007, we completed the acquisition of substantially all of the assets and liabilities of Ultrascan, Inc. (“Ultrascan”), a provider of ultrasound imaging systems and services to physicians’ offices and hospitals. The acquisition of net assets from Ultrascan resulted in the recording of goodwill, which represented the excess between the purchase price and the net assets acquired. We review goodwill for impairment on an annual basis during the fourth quarter, as well as when events or changes in circumstances indicate that the carrying value may not be recoverable. We typically perform a two-step impairment test on goodwill. In the first step, we compare the fair value of the reporting unit with goodwill to the carrying value of its long-term assets. If the carrying value of the long-term assets exceeds the fair value of the reporting unit, then we must perform the second step of the impairment test, whereby the carrying value of the reporting unit’s goodwill is compared to its implied fair value. If the carrying value of the goodwill exceeds the implied fair value, an impairment loss equal to the difference would be recorded. No impairment losses were recorded on goodwill during the years ended December 31, 2011 and 2010.
Restructuring
Restructuring costs are included in our income (loss) from operations on our statement of operations. Restructuring gain for the year ended December 31, 2011 is comprised of a paid note receivable. In 2009, we financed a note receivable related to certain assets that we sold as part of our restructuring efforts. We fully reserved the note at that time and cost was included within the restructuring loss. The buyer paid the note in-full and we recognized a gain on the transaction in 2011. Restructuring loss for the year ended December 31, 2010 is comprised of one-time termination benefits for involuntarily terminated employees, write-offs of underutilized cameras and capital equipment and obligations pertaining to an abandoned property lease. Restructuring loss for the year ended December 31, 2009 is comprised of one-time termination benefits for involuntarily terminated employees. Losses on property and equipment were recorded consistent with the Company’s accounting policy related to long-lived assets. One-time termination benefits are recorded at the time they are communicated to the affected employees. Losses on property lease obligations are recorded when the lease is abandoned.
Share-Based Compensation
We grant options to purchase our common stock and restricted stock units (“RSUs”) to our employees and directors under our equity compensation plans. We estimate the fair value of the stock option awards using the Black-Scholes-Merton option-pricing model on the date of grant. The fair value of RSUs is based on the stock price on the date of grant. The fair value of equity instruments that are expected to vest are recognized using the straight-line method over the requisite service period. The
21
fair value of stock options is derived using the following assumptions, some of which are subjective by nature. The weighted-average assumptions used in the Black-Scholes-Merton model for the year ended December 31,
2011
were
6.5
years for the expected term,
62%
for the expected volatility,
1.9%
for the risk free rate and 0% for dividend yield. Expected volatilities are based on historical volatility of our stock. We estimated the forfeiture rate based on historical data for forfeitures and we are recognizing compensation costs only for those equity awards expected to vest. The risk-free rate for periods within the contractual life of the option is based on the U.S. Treasury yield in effect at the time of grant commensurate with the expected term of the option. We have never declared or paid dividends and have no plans to do so in the foreseeable future.
Warranty
We generally provide a 12 month warranty on our gamma cameras. We accrue the estimated cost of this warranty at the time revenue is recorded and charge warranty expense to Product cost of revenues. Warranty reserves are established based on historical experience with failure rates and repair costs and the number of systems covered by warranty. Warranty reserves are depleted as gamma cameras are repaired. The costs consist principally of materials, personnel, overhead and transportation. We review warranty reserves quarterly and, if necessary, make adjustments.
Results of Operations
The following table sets forth our results from operations, expressed as percentages of total revenues for the years ended
December 31, 2011
,
2010
and
2009
(in thousands, except percentages):
|
|
Years ended December 31,
|
Change from
Prior Year
|
|||||||||||||||||||
|
|
2011
|
% of 2011
Revenues
|
2010
|
% of 2010
Revenues
|
Dollars
|
Percent
|
|||||||||||||||
|
Revenues:
|
|||||||||||||||||||||
|
DIS
|
$
|
37,794
|
|
70.3
|
%
|
$
|
39,542
|
|
70.4
|
%
|
$
|
(1,748
|
)
|
(4.4
|
)%
|
||||||
|
Product
|
15,951
|
|
29.7
|
%
|
16,641
|
|
29.6
|
%
|
(690
|
)
|
(4.1
|
)%
|
|||||||||
|
Total revenues
|
53,745
|
|
100.0
|
%
|
56,183
|
|
100.0
|
%
|
(2,438
|
)
|
(4.3
|
)%
|
|||||||||
|
Total cost of revenues
|
38,987
|
|
72.5
|
%
|
44,179
|
|
78.6
|
%
|
(5,192
|
)
|
(11.8
|
)%
|
|||||||||
|
Gross profit
|
14,758
|
|
27.5
|
%
|
12,004
|
|
21.4
|
%
|
2,754
|
|
22.9
|
%
|
|||||||||
|
Operating expenses:
|
|||||||||||||||||||||
|
Research and development
|
2,738
|
|
5.1
|
%
|
2,875
|
|
5.1
|
%
|
(137
|
)
|
(4.8
|
)%
|
|||||||||
|
Marketing and sales
|
7,622
|
|
14.2
|
%
|
5,922
|
|
10.5
|
%
|
1,700
|
|
28.7
|
%
|
|||||||||
|
General and administrative
|
7,741
|
|
14.4
|
%
|
9,007
|
|
16.0
|
%
|
(1,266
|
)
|
(14.1
|
)%
|
|||||||||
|
Amortization of intangible assets
|
331
|
|
0.6
|
%
|
435
|
|
0.8
|
%
|
(104
|
)
|
(23.9
|
)%
|
|||||||||
|
Restructuring loss (gain)
|
(164
|
)
|
(0.3
|
)%
|
355
|
|
0.6
|
%
|
(519
|
)
|
(146.2
|
)%
|
|||||||||
|
Total operating expenses
|
18,268
|
|
34.0
|
%
|
18,594
|
|
33.1
|
%
|
(326
|
)
|
(1.8
|
)%
|
|||||||||
|
Income (loss) from operations
|
(3,510
|
)
|
(6.5
|
)%
|
(6,590
|
)
|
(11.7
|
)%
|
3,080
|
|
(46.7
|
)%
|
|||||||||
|
Other income
|
168
|
|
0.3
|
%
|
376
|
|
0.7
|
%
|
(208
|
)
|
(55.3
|
)%
|
|||||||||
|
Net income (loss)
|
$
|
(3,342
|
)
|
(6.2
|
)%
|
$
|
(6,214
|
)
|
(11.1
|
)%
|
$
|
2,872
|
|
(46.2
|
)%
|
||||||
22
|
|
Year Ended December 31,
|
Change from
Prior Year
|
|||||||||||||||||||
|
|
2010
|
% of 2010
Revenues
|
2009
|
% of 2009
Revenues
|
Dollars
|
Percent
|
|||||||||||||||
|
Revenues:
|
|||||||||||||||||||||
|
DIS
|
$
|
39,542
|
|
70.4
|
%
|
$
|
52,318
|
|
75.2
|
%
|
$
|
(12,776
|
)
|
(24.4
|
)%
|
||||||
|
Product
|
16,641
|
|
29.6
|
%
|
17,278
|
|
24.8
|
%
|
(637
|
)
|
(3.7
|
)%
|
|||||||||
|
Total revenues
|
56,183
|
|
100
|
%
|
69,596
|
|
100
|
%
|
(13,413
|
)
|
(19.3
|
)%
|
|||||||||
|
Total cost of revenues
|
44,179
|
|
78.6
|
%
|
49,371
|
|
70.9
|
%
|
(5,192
|
)
|
(10.5
|
)%
|
|||||||||
|
Gross profit
|
12,004
|
|
21.4
|
%
|
20,225
|
|
29.1
|
%
|
(8,221
|
)
|
(40.6
|
)%
|
|||||||||
|
Operating expenses:
|
|||||||||||||||||||||
|
Research and development
|
2,875
|
|
5.1
|
%
|
3,360
|
|
4.8
|
%
|
(485
|
)
|
(14.4
|
)%
|
|||||||||
|
Marketing and sales
|
5,922
|
|
10.5
|
%
|
6,977
|
|
10.0
|
%
|
(1,055
|
)
|
(15.1
|
)%
|
|||||||||
|
General and administrative
|
9,007
|
|
16.0
|
%
|
8,921
|
|
12.8
|
%
|
86
|
|
1.0
|
%
|
|||||||||
|
Amortization of intangible assets
|
435
|
|
0.8
|
%
|
590
|
|
0.8
|
%
|
(155
|
)
|
(26.3
|
)%
|
|||||||||
|
Restructuring loss
|
355
|
|
0.6
|
%
|
319
|
|
0.5
|
%
|
36
|
|
11.3
|
%
|
|||||||||
|
Total operating expenses
|
18,594
|
|
33.1
|
%
|
20,167
|
|
29.0
|
%
|
(1,573
|
)
|
(7.8
|
)%
|
|||||||||
|
Income (loss) from operations
|
(6,590
|
)
|
(11.7
|
)%
|
58
|
|
0.1
|
%
|
(6,648
|
)
|
(11,462.1
|
)%
|
|||||||||
|
Other income
|
376
|
|
0.7
|
%
|
550
|
|
0.8
|
%
|
(174
|
)
|
(31.6
|
)%
|
|||||||||
|
Net income (loss)
|
$
|
(6,214
|
)
|
(11.1
|
)%
|
$
|
608
|
|
0.9
|
%
|
$
|
(6,822
|
)
|
(1,122.0
|
)%
|
||||||
Comparison of Years Ended
December 31, 2011
and
2010
Revenues
Consolidated.
Consolidated revenue was
$53.7 million
for the year ended
December 31, 2011
, a decrease of
$2.4 million
, or
4.3%
, from the prior year period, primarily as a result of a reduction in our DIS business segment combined with lower camera sales in our Product business segment. DIS revenue accounted for
70.3%
of total revenues for the year ended
December 31, 2011
, compared to
70.4%
for prior year period. We expect DIS revenue to continue to represent the larger percentage of our consolidated revenue.
DIS.
Our DIS revenue was
$37.8 million
for the year ended
December 31, 2011
, a decrease of
$1.7 million
, or
4.4%
, from the prior year period. The decrease resulted from a reduction in our daily lease fee combined with a reduction in the number of days we were able to scan for our physician customers. We reduced our daily lease fee in 2010 to provide more incentive to our physician customers to continue using our services, since CMS reduced reimbursement to the physicians for our diagnostic imaging procedures significantly at the beginning of 2010. We were only able to increase our daily lease fee slightly in 2011. Furthermore, our physician customers reduced the number of days they scanned in 2011, in part due to the lack of patient volume as a result of the poor economy, in part due to the uncertainty in the healthcare marketplace, and in part due to other factors such as physician pre-certification requirements. The worldwide shortage of radiopharmaceuticals, which significantly impacted our business in 2010, was not a factor in 2011 as full medical isotope supply was restored.
Product.
Our Product revenue was
$16.0 million
for the year ended
December 31, 2011
, a decrease of
$0.7 million
, or
4.1%
, compared to the prior year period, primarily due to a reduction in the number of cameras which were sold to cardiology practices and hospitals. The number of cameras sold decreased to 27 from 34 during the year ended December 31,
2011
and
2010
, respectively. We believe that economic factors affected our customers' buying decisions, including the uncertainty in the credit markets, a slowing economy, and continued healthcare imaging reimbursement pressures.
Cost of Revenue and Gross Profit
Consolidated.
Consolidated gross profit was
$14.8 million
for the year ended
December 31, 2011
, an increase of
$2.8 million
, or
22.9%
, compared to the prior year period. The increase in consolidated gross profit is primarily the result of improving gross margins in our Product and DIS business segments. Consolidated gross profit as a percentage of revenue increased to
27.5%
for the year ended
December 31, 2011
from
21.4%
for the prior year.
DIS
. Cost of DIS revenue consists of labor, radiopharmaceuticals, equipment depreciation, and other costs associated with the provision of services. Cost of DIS revenue was
$29.7 million
for the year ended
December 31, 2011
, a decrease of
$2.9 million
, or
8.9%
, from the prior year period, primarily as a result of decreased expenses from fewer scans, more efficient utilization of labor and equipment, aligning labor and revenue by a shift from all full-time (fixed) labor to some part-time
23
(variable) labor, combining certain positions and changing the useful lives of our DIS camera fleet from five years to ten years. This change in lives resulted in a decrease to depreciation expense, included in cost of revenues, of approximately $0.4 million in the current year.
DIS gross profit was
$8.1 million
for the year ended
December 31, 2011
, an increase of
$1.1 million
, or
16.3%
as compared to the prior year period. DIS gross profit as a percentage of DIS revenue increased to
21.5%
for the year ended
December 31, 2011
from
17.7%
for the prior year due to improvement in operational performance primarily associated with the management of labor and equipment and the change of the useful lives of our DIS camera fleet.
Product
. Cost of Product revenue primarily consists of materials, labor and overhead costs associated with the manufacturing and warranty of our products. Cost of Product revenues was
$9.3 million
for the year ended
December 31, 2011
, a decrease of
$2.3 million
, or
19.8%
, over the prior year period. Product gross profit was
$6.6 million
for the year ended
December 31, 2011
, an increase of
$1.6 million
, or
32.1%
as compared to the prior year period. Product gross profit as a percentage of Product revenue increased to
41.6%
for the year ended
December 31, 2011
from
30.2%
for the prior year due to lower excess and obsolete inventory reserves and the sale of certain previously reserved cameras, partially offset by higher manufacturing variances due to a key component supply issue.
Operating Expenses
Research and Development.
Research and development expenses are associated with the design, development and enhancement of our products, and consist of salaries, development material costs, facility and overhead costs, consulting fees, and non-recurring engineering costs. We continue to invest in research and development with a focus on innovation as we seek to improve our existing technology. Research and development expenses were
$2.7 million
for the year ended
December 31, 2011
, representing an increase of
$0.1 million
, or
4.8%
, compared to the prior year period, primarily as a result of final development work on our ergo imaging system, beginning development of a new accessory for our ergo, clinical evaluation work on our XACT and sustaining engineering support of our legacy products. Research and development expenses were
17.2%
and
17.3%
of Product revenue for the years ended
December 31, 2011
and
2010
, respectively. We are investing in strategic marketing to determine how to best deploy our technology platform in order support new product introductions.
Marketing and Sales.
Marketing and sales expenses consist primarily of salaries, commissions, bonuses, recruiting costs, travel, marketing and collateral materials and trade show costs and market study. Marketing and sales expenses were
$7.6 million
for the year ended
December 31, 2011
, an increase of
$1.7 million
, or
28.7%
, compared to the prior year period. The increase in marketing spend was primarily a result of our decision to invest in a strategic marketing study with a premier healthcare consulting firm. Without that investment, marketing and sales expenses would have remained relatively flat for the years ended
December 31, 2011
and
2010
.
General and Administrative.
General and administrative expenses consist primarily of salaries and other related costs for accounting, human resources, information technology and executive personnel, legal related costs, professional fees, outside services, insurance, and costs related to our board of directors. General and administrative expenses were
$7.7 million
for the year ended
December 31, 2011
, a decrease of
$1.3 million
, or
14.1%
, compared to the prior year, primarily as a result of lower bad debt reserves and lower legal and consulting services compared to the prior year , as well as our continued efforts to reduce costs and improve efficiencies. General and administrative expenses were
14.4%
of total revenue for the year ended
December 31, 2011
compared to
16.0%
for the prior year.
Other Income
Other income consists primarily of interest income, net of other expenses. The decrease in other income of
$0.2 million
is attributable to a decrease in interest rates and a slight decrease in our average cash balance.
Comparison of Years Ended
December 31, 2010
and
2009
Revenues
Consolidated.
Consolidated revenue was
$56.2 million
for the year ended
December 31, 2010
, which represents a decrease of
$13.4 million
, or
19.3%
, from the prior year period, primarily as a result of a reduction in our daily lease fee, a reduction in the number of days we were able to scan for our physician customers and extremely limited isotope supply in our DIS business segment combined with lower camera sales in our Product business segment. DIS revenue accounted for
70.4%
of total revenues for the year ended
December 31, 2010
, compared to
75.2%
for prior year period. We expect DIS revenue to continue to represent the larger percentage of our consolidated revenue.
DIS.
Our DIS revenue was
$39.5 million
for the year ended
December 31, 2010
, which represents a decrease of
$12.8 million
, or
24.4%
, from the prior year period. The decrease resulted from our decision to reduce our daily lease rate at the end of the first quarter of 2010 to our physician customers in response to the anticipated decline in CMS and third party
24
reimbursements for nuclear imaging services, along with a decrease in patient service days during the periods where supplies of radiopharmaceuticals were not available or available in short supply during 2010.
Product.
Our Product revenue was
$16.6 million
for the year ended
December 31, 2010
, which represents a decrease of
$0.6 million
, or
3.7%
, compared to the prior year period. We believe that economic factors, including the uncertainty in the credit market and a slowing economy and continued healthcare imaging reimbursement pressures resulted in decreased gamma camera sales.
Cost of Revenue and Gross Profit
Consolidated.
Consolidated gross profit was
$12.0 million
for the year ended
December 31, 2010
, representing a decrease of
$8.2 million
, or
40.6%
, compared to the prior year period. The decrease in consolidated gross profit is primarily the result of the decline in DIS and Product revenues, our commitment to maintain as many of our full-time dedicated clinician-employees as possible, the resulting impact of lower camera sales on our standard cost variances as well as an increase in excess and obsolete inventory reserves compared to the prior year period. Consolidated gross profit as a percentage of revenue decreased to
21.4%
for the year ended
December 31, 2010
from
29.1%
for the prior year period.
DIS
. Cost of DIS revenue was
$32.6 million
for the year ended
December 31, 2010
, representing a decrease of
$5.9 million
, or
15.4%
, from the prior year period, primarily due to decreased labor costs, decreased radiopharmaceutical expenses from fewer scans, and a reduction in depreciation costs due to more cameras in 2010 being fully depreciated compared to the prior year period. DIS gross profit was
$7.0 million
for the year ended
December 31, 2010
, which represents a decrease of
$6.9 million
, or
49.6%
as compared to the prior year period. DIS gross profit as a percentage of DIS revenue decreased to
17.7%
for the year ended
December 31, 2010
from
26.5%
for the prior year period. The decline in operational performance is primarily associated with the reduction in service days, combined with some impact from the isotope shortage.
Product
. Cost of Product revenues was
$11.6 million
for the year ended
December 31, 2010
, representing an increase of
$0.7 million
, or
6.6%
, over the prior year period. Product gross profit decreased to
$5.0 million
for the year ended
December 31, 2010
, representing a decrease of
$1.4 million
, or
21.3%
, compared to the prior year period. Product gross profit as a percentage of Product revenue decreased to
30.2%
for the year ended
December 31, 2010
from
36.9%
for the prior year period primarily due to higher manufacturing variances from lower production volumes as well as an increase in excess and obsolete inventory reserves.
Operating Expenses
Research and Development.
We continue to invest in research and development with a focus on innovation as we seek to improve our existing technology. In 2009 and 2010, we received U.S. Food and Drug Administration 510(k) clearance for our new Cardius
®
X-ACT imaging system and our new ergo
TM
general purpose portable imaging system, respectively. Research and development expenses were
$2.9 million
for the year ended
December 31, 2010
, representing a decrease of
$0.5 million
, or
14.4%
, compared to the prior year period, primarily as a result of
2009
research and development clinical evaluation efforts for our Cardius
®
X-ACT imaging system, which did not reoccur in 2010. Research and development expenses were
17.3%
and
19.4%
of Product revenue for the years ended
December 31, 2010
and
2009
, respectively.
Marketing and Sales.
Marketing and sales expenses were
$5.9 million
for the year ended
December 31, 2010
, which represents a decrease of
$1.1 million
, or
15.1%
, compared to the prior year period, primarily as a result of lower personnel costs. Marketing and sales expenses have remained consistent as a percent of revenues at
10.5%
and
10.0%
for the years ended
December 31, 2010
and
2009
, respectively.
General and Administrative.
General and administrative expenses were
$9.0 million
for the year ended
December 31, 2010
, which are consistent with the prior year period. General and administrative expenses were
16.0%
of total revenue for the year ended
December 31, 2010
compared to
12.8%
for the prior year period. The increase in percentage of revenue was primarily due to the decline in DIS revenues.
Restructuring Loss.
Restructuring costs were
$0.4 million
and
$0.3 million
during the years ended
December 31, 2010
and
2009
, respectively. We initiated and substantially completed restructuring plans in the second quarter of 2010 and second and third quarters of 2009. During
2010
and
2009
, we experienced changing market conditions, which contributed to operating losses within our DIS and Product segments, including declines in reimbursements to our physician customers, worldwide isotope shortages and regulatory uncertainty in the healthcare system. In response, we reduced our workforce within both the DIS and Product segments in order to realign expenses to a lower level of sales. We also eliminated and consolidated certain DIS hub locations in order to focus on hubs that have stronger anticipated margin and growth potential.
Other Income
Other income consists primarily of interest income, net of interest paid and other associated expenses. The decrease in other income of
$0.2 million
is attributable to a decrease in interest rates and a slight decrease in our average cash balance.
25
Liquidity and Capital Resources
General
We require capital principally for capital expenditures and to finance accounts receivable and inventory, which we manage closely. Our working capital requirements vary from period to period depending on manufacturing volumes, the timing of deliveries and the payment cycles of our customers. Our capital expenditures consist primarily of nuclear cameras, ultrasound machines, vans, manufacturing and development equipment and computer hardware and software. As of
December 31, 2011
, we had cash, cash equivalents and securities available-for-sale of
$30.5 million
. We generally invest our cash reserves in money market funds, U.S. treasury and corporate debt securities. Based upon our current level of expenditures, we believe our working capital, together with cash flows from operating activities, will be adequate to meet our anticipated cash requirements for capital expenditures and working capital for at least the next 12 months.
Cash Flows
The following table shows cash flow information for the years ended
December 31, 2011
,
2010
and
2009
(in thousands):
|
|
Year Ended December 31,
|
|||||||||||
|
|
2011
|
2010
|
2009
|
|||||||||
|
Net cash provided by operating activities
|
$
|
965
|
|
$
|
229
|
|
$
|
4,806
|
|
|||
|
Net cash provided by (used in) investing activities
|
2,515
|
|
6,710
|
|
(3,764
|
)
|
||||||
|
Net cash provided by (used in) financing activities
|
$
|
100
|
|
$
|
(40
|
)
|
$
|
(1,007
|
)
|
|||
Operating Activities
Net cash provided by operating activities increased
$0.7 million
, or
321.4%
, for the year ended
December 31, 2011
compared to the prior year period. This increase was primarily attributable to the decreased net loss, increases related to changes in working capital accounts (particularly collection of accounts receivable), partially offset by increases in inventory and decreased non-cash charges related to depreciation, bad debt and other non-cash charges.
Net cash provided by operating activities decreased
$4.6 million
, or
95.2%
, for the year ended
December 31, 2010
compared to the prior year period. This decrease was primarily attributable to our net loss partially offset by changes in working capital.
Investing Activities
Net cash provided by investing activities decreased
$4.2 million
, or
62.5%
, for the year ended
December 31, 2011
compared to the prior year period. This decrease was primarily attributable to decreased net proceeds from maturing available-for-sale securities partially offset by lower purchases of property and equipment.
Net cash provided by investing activities increased
$10.5 million
, or
278.3%
, for the year ended
December 31, 2010
compared to the prior year. This increase was primarily attributable to decreased purchases of securities available-for-sale partially offset by lower proceeds from the sale of property and equipment and higher purchases of property and equipment.
Financing Activities
Net cash provided by financing activities increased by
$0.1 million
, or
350.0%
, for the year ended
December 31, 2011
compared to the prior year. This increase was primarily attributable to increased stock option exercises.
Net cash used in financing activities decreased by
$1.0 million
, or
96.0%
, for the year ended
December 31, 2010
compared to the prior year period. This increase was primarily attributable to decreased repurchases of common stock related to our stock buyback program partially offset by lower repayments on obligations under capital leases.
Contractual Obligations
We are committed to making future cash payments on capital leases (including interest) and operating leases. We have not guaranteed the debt of any other party. The following table summarizes our contractual obligations as of
December 31, 2011
(amounts in thousands):
26
|
|
Payments Due by Period
|
|||||||||||||||||||
|
Contractual obligations
|
Total
|
Less than 1
year
|
1-3 years
|
3-5 years
|
More than 5
years
|
|||||||||||||||
|
Operating lease obligations
|
$
|
3,323
|
|
$
|
1,231
|
|
$
|
1,408
|
|
$
|
684
|
|
$
|
—
|
|
|||||
|
ITEM 7A.
|
QUANTITATIVE AND QUALITATIVE DISCLOSURES ABOUT MARKET RISK
|
Our exposure to market risk due to changes in interest rates relates primarily to the increase or decrease in the value of debt securities in our investment portfolio. Our risk associated with fluctuating interest rates is limited to our investments in interest rate sensitive financial instruments. Under our current policies, we do not use interest rate derivative instruments to manage exposure to interest rate changes. We attempt to increase the safety and preservation of our invested principal funds by limiting default risk, market risk and reinvestment risk. We mitigate default risk by investing in investment grade securities. A 100 basis point adverse move in interest rates along the entire interest rate yield curve would not materially affect the fair value of our interest sensitive financial instruments. Changes in interest rates over time will increase or decrease our interest income.
27
|
ITEM 8.
|
FINANCIAL STATEMENTS AND SUPPLEMENTARY DATA
|
REPORT OF INDEPENDENT REGISTERED PUBLIC ACCOUNTING FIRM
The Board of Directors and Stockholders of Digirad Corporation
We have audited the accompanying consolidated balance sheets of Digirad Corporation as of
December 31, 2011
and
2010
, and the related statements of operations, stockholders’ equity, and cash flows for each of the three years in the period ended
December 31, 2011
. These financial statements are the responsibility of the Company’s management. Our responsibility is to express an opinion on these financial statements based on our audits.
We conducted our audits in accordance with the standards of the Public Company Accounting Oversight Board (United Sates). Those standards require that we plan and perform the audit to obtain reasonable assurance about whether the financial statements are free of material misstatement. We were not engaged to perform an audit of the Company’s internal control over financial reporting. Our audits included consideration of internal control over financial reporting as a basis for designing audit procedures that are appropriate in the circumstances, but not for the purpose of expressing an opinion on the effectiveness of the Company’s internal control over financial reporting. Accordingly, we express no such opinion. An audit also includes examining, on a test basis, evidence supporting the amounts and disclosures in the financial statements, assessing the accounting principles used and significant estimates made by management, and evaluating the overall financial statement presentation. We believe that our audits provide a reasonable basis for our opinion.
In our opinion, the financial statements referred to above present fairly, in all material respects, the consolidated financial position of Digirad Corporation at
December 31, 2011
and
2010
, and the consolidated results of its operations and its cash flows for each of the three years in the period ended
December 31, 2011
, in conformity with U.S. generally accepted accounting principles.
|
/s/ Ernst & Young LLP
|
|
|
San Diego, California
February 17, 2012
28
DIGIRAD CORPORATION
(In thousands, except share amounts)
|
|
As of December 31,
|
|||||||
|
|
2011
|
2010
|
||||||
|
Assets
|
||||||||
|
Current assets:
|
||||||||
|
Cash and cash equivalents
|
$
|
24,039
|
|
$
|
20,459
|
|
||
|
Securities available-for-sale
|
6,413
|
|
9,788
|
|
||||
|
Accounts receivable, net
|
6,320
|
|
7,527
|
|
||||
|
Inventories, net
|
6,178
|
|
5,432
|
|
||||
|
Other current assets
|
855
|
|
861
|
|
||||
|
Restricted cash
|
194
|
|
—
|
|
||||
|
Total current assets
|
43,999
|
|
44,067
|
|
||||
|
Property and equipment, net
|
5,367
|
|
7,185
|
|
||||
|
Intangible assets, net
|
477
|
|
808
|
|
||||
|
Goodwill
|
184
|
|
184
|
|
||||
|
Total assets
|
$
|
50,027
|
|
$
|
52,244
|
|
||
|
Liabilities and stockholders’ equity
|
||||||||
|
Accounts payable
|
$
|
1,330
|
|
$
|
1,694
|
|
||
|
Accrued compensation
|
2,291
|
|
1,600
|
|
||||
|
Accrued warranty
|
297
|
|
378
|
|
||||
|
Deferred revenue
|
2,099
|
|
2,379
|
|
||||
|
Other accrued liabilities
|
2,397
|
|
2,096
|
|
||||
|
Total current liabilities
|
8,414
|
|
8,147
|
|
||||
|
Deferred rent
|
126
|
|
138
|
|
||||
|
Total liabilities
|
8,540
|
|
8,285
|
|
||||
|
Commitments and contingencies (Note 6)
|
|
|
||||||
|
Stockholders’ equity:
|
||||||||
|
Preferred stock, $0.0001 par value: 10,000,000 shares authorized; no shares issued or outstanding
|
—
|
|
—
|
|
||||
|
Common stock, $0.0001 par value: 80,000,000 shares authorized; 18,901,160 and 18,597,311 shares issued and outstanding (net of treasury shares) at December 31, 2011 and 2010, respectively
|
2
|
|
2
|
|
||||
|
Treasury stock, at cost; 582,825 shares and 573,218 shares at December 31, 2011 and 2010, respectively
|
(1,058
|
)
|
(1,039
|
)
|
||||
|
Additional paid-in capital
|
155,704
|
|
154,785
|
|
||||
|
Accumulated other comprehensive income
|
33
|
|
63
|
|
||||
|
Accumulated deficit
|
(113,194
|
)
|
(109,852
|
)
|
||||
|
Total stockholders’ equity
|
41,487
|
|
43,959
|
|
||||
|
Total liabilities and stockholders’ equity
|
$
|
50,027
|
|
$
|
52,244
|
|
||
See accompanying notes to consolidated financial statements.
29
DIGIRAD CORPORATION
(In thousands, except per share amounts)
|
|
Years ended December 31,
|
|||||||||||
|
|
2011
|
2010
|
2009
|
|||||||||
|
Revenues:
|
||||||||||||
|
DIS
|
$
|
37,794
|
|
$
|
39,542
|
|
$
|
52,318
|
|
|||
|
Product
|
15,951
|
|
16,641
|
|
17,278
|
|
||||||
|
Total revenues
|
53,745
|
|
56,183
|
|
69,596
|
|
||||||
|
Cost of revenues:
|
||||||||||||
|
DIS
|
29,672
|
|
32,561
|
|
38,476
|
|
||||||
|
Product
|
9,315
|
|
11,618
|
|
10,895
|
|
||||||
|
Total cost of revenues
|
38,987
|
|
44,179
|
|
49,371
|
|
||||||
|
Gross profit
|
14,758
|
|
12,004
|
|
20,225
|
|
||||||
|
Operating expenses:
|
||||||||||||
|
Research and development
|
2,738
|
|
2,875
|
|
3,360
|
|
||||||
|
Marketing and sales
|
7,622
|
|
5,922
|
|
6,977
|
|
||||||
|
General and administrative
|
7,741
|
|
9,007
|
|
8,921
|
|
||||||
|
Amortization and impairment of intangible assets
|
331
|
|
435
|
|
590
|
|
||||||
|
Restructuring loss (gain)
|
(164
|
)
|
355
|
|
319
|
|
||||||
|
Total operating expenses
|
18,268
|
|
18,594
|
|
20,167
|
|
||||||
|
Income (loss) from operations
|
(3,510
|
)
|
(6,590
|
)
|
58
|
|
||||||
|
Other income (expense):
|
||||||||||||
|
Interest income
|
165
|
|
378
|
|
499
|
|
||||||
|
Other income (expense)
|
3
|
|
(2
|
)
|
51
|
|
||||||
|
Total other income
|
168
|
|
376
|
|
550
|
|
||||||
|
Net income (loss)
|
$
|
(3,342
|
)
|
$
|
(6,214
|
)
|
$
|
608
|
|
|||
|
Net income (loss) per share:
|
||||||||||||
|
Basic and diluted
|
$
|
(0.18
|
)
|
$
|
(0.33
|
)
|
$
|
0.03
|
|
|||
|
Shares used in per share computations:
|
||||||||||||
|
Weighted average shares outstanding—basic
|
19,052
|
|
18,774
|
|
18,836
|
|
||||||
|
Weighted average shares outstanding—diluted
|
19,052
|
|
18,774
|
|
19,320
|
|
||||||
See accompanying notes to consolidated financial statements.
30
DIGIRAD CORPORATION
(In thousands)
|
|
Years ended December 31,
|
|||||||||||
|
|
2011
|
2010
|
2009
|
|||||||||
|
Operating activities
|
||||||||||||
|
Net income (loss)
|
$
|
(3,342
|
)
|
$
|
(6,214
|
)
|
$
|
608
|
|
|||
|
Adjustments to reconcile net income (loss) to cash provided by operating activities:
|
||||||||||||
|
Depreciation
|
2,765
|
|
3,815
|
|
4,588
|
|
||||||
|
Amortization and impairment of intangible assets
|
331
|
|
435
|
|
590
|
|
||||||
|
Provision for bad debts
|
237
|
|
832
|
|
58
|
|
||||||
|
Stock-based compensation
|
800
|
|
891
|
|
606
|
|
||||||
|
Restructuring loss
|
—
|
|
355
|
|
319
|
|
||||||
|
(Gain) loss on disposal of assets
|
(103
|
)
|
154
|
|
(26
|
)
|
||||||
|
Amortization of premium on securities available-for-sale
|
286
|
|
285
|
|
454
|
|
||||||
|
Changes in operating assets and liabilities:
|
||||||||||||
|
Accounts receivable
|
970
|
|
(806
|
)
|
1,713
|
|
||||||
|
Inventories
|
(1,046
|
)
|
1,280
|
|
(1,565
|
)
|
||||||
|
Other assets
|
6
|
|
196
|
|
809
|
|
||||||
|
Accounts payable
|
(364
|
)
|
74
|
|
(400
|
)
|
||||||
|
Accrued compensation
|
691
|
|
(912
|
)
|
(1,295
|
)
|
||||||
|
Deferred revenue
|
(280
|
)
|
(215
|
)
|
(129
|
)
|
||||||
|
Other accrued liabilities
|
208
|
|
59
|
|
(1,524
|
)
|
||||||
|
Restricted cash
|
(194
|
)
|
—
|
|
—
|
|
||||||
|
Net cash provided by operating activities
|
965
|
|
229
|
|
4,806
|
|
||||||
|
Investing activities
|
||||||||||||
|
Purchases of property and equipment
|
(709
|
)
|
(1,437
|
)
|
(1,014
|
)
|
||||||
|
Proceeds from sale of property and equipment
|
165
|
|
55
|
|
1,024
|
|
||||||
|
Purchases of securities available-for-sale
|
(13,086
|
)
|
(5,477
|
)
|
(20,360
|
)
|
||||||
|
Sales and maturities of securities available-for-sale
|
16,145
|
|
13,569
|
|
16,586
|
|
||||||
|
Net cash provided by (used in) investing activities
|
2,515
|
|
6,710
|
|
(3,764
|
)
|
||||||
|
Financing activities
|
||||||||||||
|
Issuances of common stock
|
119
|
|
44
|
|
36
|
|
||||||
|
Repurchases of common stock
|
(19
|
)
|
(48
|
)
|
(991
|
)
|
||||||
|
Repayment of obligations under capital leases
|
—
|
|
(36
|
)
|
(52
|
)
|
||||||
|
Net cash provided by (used in) financing activities
|
100
|
|
(40
|
)
|
(1,007
|
)
|
||||||
|
Net increase in cash and cash equivalents
|
3,580
|
|
6,899
|
|
35
|
|
||||||
|
Cash and cash equivalents at beginning of year
|
20,459
|
|
13,560
|
|
13,525
|
|
||||||
|
Cash and cash equivalents at end of year
|
$
|
24,039
|
|
$
|
20,459
|
|
$
|
13,560
|
|
|||
|
Supplemental information:
|
||||||||||||
|
Cash paid during the period for interest
|
$
|
—
|
|
$
|
6
|
|
$
|
9
|
|
|||
|
Non-cash investing and financing activities:
|
||||||||||||
|
Purchase of assets under capital leases
|
$
|
—
|
|
$
|
—
|
|
$
|
113
|
|
|||
See accompanying notes to consolidated financial statements.
31
DIGIRAD CORPORATION
CONSOLIDATED STATEMENTS OF STOCKHOLDERS’ EQUITY
(In thousands)
|
|
Common stock
|
Treasury Stock
|
Additional
paid-in
capital
|
Accumulated
other
comprehensive
income (loss)
|
Accumulated
deficit
|
Total
stockholders’
equity
|
||||||||||||||||||||||||
|
|
Shares
|
Amount
|
Shares
|
Amount
|
||||||||||||||||||||||||||
|
Balance at December 31, 2008
|
18,944
|
|
$
|
2
|
|
—
|
|
$
|
—
|
|
$
|
153,225
|
|
$
|
(22
|
)
|
$
|
(104,246
|
)
|
$
|
48,959
|
|
||||||||
|
Stock-based compensation
|
—
|
|
—
|
|
—
|
|
—
|
|
606
|
|
—
|
|
—
|
|
606
|
|
||||||||||||||
|
Exercise of stock options
|
80
|
|
—
|
|
—
|
|
—
|
|
36
|
|
—
|
|
—
|
|
36
|
|
||||||||||||||
|
Repurchases of common stock
|
—
|
|
—
|
|
547
|
|
(991
|
)
|
—
|
|
—
|
|
—
|
|
(991
|
)
|
||||||||||||||
|
Comprehensive loss:
|
||||||||||||||||||||||||||||||
|
Net income
|
—
|
|
—
|
|
—
|
|
—
|
|
—
|
|
—
|
|
608
|
|
608
|
|
||||||||||||||
|
Unrealized gain on securities available-for-sale
|
—
|
|
—
|
|
—
|
|
—
|
|
—
|
|
171
|
|
—
|
|
171
|
|
||||||||||||||
|
Total comprehensive income
|
—
|
|
—
|
|
—
|
|
—
|
|
—
|
|
—
|
|
—
|
|
779
|
|
||||||||||||||
|
Balance at December 31, 2009
|
19,024
|
|
2
|
|
547
|
|
(991
|
)
|
153,867
|
|
149
|
|
(103,638
|
)
|
49,389
|
|
||||||||||||||
|
Stock-based compensation
|
—
|
|
—
|
|
—
|
|
—
|
|
874
|
|
—
|
|
—
|
|
874
|
|
||||||||||||||
|
Exercise of stock options and settlement of restricted stock awards
|
147
|
|
—
|
|
—
|
|
—
|
|
44
|
|
—
|
|
—
|
|
44
|
|
||||||||||||||
|
Repurchases of common stock
|
—
|
|
—
|
|
26
|
|
(48
|
)
|
—
|
|
—
|
|
—
|
|
(48
|
)
|
||||||||||||||
|
Comprehensive loss:
|
||||||||||||||||||||||||||||||
|
Net loss
|
—
|
|
—
|
|
—
|
|
—
|
|
—
|
|
—
|
|
(6,214
|
)
|
(6,214
|
)
|
||||||||||||||
|
Unrealized loss on securities available-for-sale
|
—
|
|
—
|
|
—
|
|
—
|
|
—
|
|
(86
|
)
|
—
|
|
(86
|
)
|
||||||||||||||
|
Total comprehensive loss
|
—
|
|
—
|
|
—
|
|
—
|
|
—
|
|
—
|
|
—
|
|
(6,300
|
)
|
||||||||||||||
|
Balance at December 31, 2010
|
19,171
|
|
2
|
|
573
|
|
(1,039
|
)
|
154,785
|
|
63
|
|
(109,852
|
)
|
43,959
|
|
||||||||||||||
|
Stock-based compensation
|
—
|
|
—
|
|
—
|
|
—
|
|
800
|
|
—
|
|
—
|
|
800
|
|
||||||||||||||
|
Exercise of stock options and settlement of restricted stock awards
|
313
|
|
—
|
|
—
|
|
—
|
|
119
|
|
—
|
|
—
|
|
119
|
|
||||||||||||||
|
Repurchases of common stock
|
—
|
|
—
|
|
10
|
|
(19
|
)
|
—
|
|
—
|
|
—
|
|
(19
|
)
|
||||||||||||||
|
Comprehensive loss:
|
||||||||||||||||||||||||||||||
|
Net loss
|
—
|
|
—
|
|
—
|
|
—
|
|
—
|
|
—
|
|
(3,342
|
)
|
(3,342
|
)
|
||||||||||||||
|
Unrealized loss on securities available-for-sale
|
—
|
|
—
|
|
—
|
|
—
|
|
—
|
|
(30
|
)
|
—
|
|
(30
|
)
|
||||||||||||||
|
Total comprehensive loss
|
—
|
|
—
|
|
—
|
|
—
|
|
—
|
|
—
|
|
—
|
|
(3,372
|
)
|
||||||||||||||
|
Balance at December 31, 2011
|
19,484
|
|
$
|
2
|
|
583
|
|
$
|
(1,058
|
)
|
$
|
155,704
|
|
$
|
33
|
|
$
|
(113,194
|
)
|
$
|
41,487
|
|
||||||||
See accompanying notes to consolidated financial statements.
32
DIGIRAD CORPORATION
NOTES TO CONSOLIDATED FINANCIAL STATEMENTS
|
NOTE 1.
|
The Company
|
Digirad Corporation (“Digirad”), a Delaware corporation, is a leading developer and manufacturer of medical diagnostic imaging systems including solid-state gamma cameras for nuclear cardiology and general nuclear medicine applications. Digirad is also one of the largest national providers of in-office nuclear cardiology imaging and ultrasound services to physician practices, hospitals and imaging centers through its Digirad Imaging Solutions (“DIS”) division. Digirad has two reportable segments, DIS and Product which are collectively referred to herein as the “Company”. The accompanying consolidated financial statements include the operations of both segments. Intercompany accounts and transactions are accounted for at cost and have been eliminated in consolidation. All the Company's long-lived assets are located in the United States. Substantially all of the Company’s revenue arises from sales activity in the United States. Through DIS, the Company provides in-office imaging services to physicians, offering certified personnel, required licensure, an imaging system and other support and supplies for the performance of nuclear and ultrasound imaging procedures under the supervision of its physician customers. DIS physician customers enter into annual lease contracts for imaging services generally delivered on a per-day basis. The Company’s Product segment sells solid-state gamma cameras and provides camera service and maintenance.
|
NOTE 2.
|
Basis of Presentation and Significant Accounting Policies
|
Basis of Presentation
The consolidated financial statements are prepared in conformity with United States generally accepted accounting principles ("GAAP") and include the financial statements of the Company and its wholly owned subsidiaries. GAAP requires management to make estimates and assumptions that affect the reported amounts of assets and liabilities, the disclosure of contingent assets and liabilities and the reported amounts of revenues and expenses. By their nature, estimates are subject to an inherent degree of uncertainty. Actual results could differ from management’s estimates. In addition certain reclassifications have been made to the prior year financial statements to conform to the current period presentation.
Revenue Recognition
The Company derives revenue primarily from providing in-office services to support the performance of cardiac imaging procedures and from selling and servicing solid-state digital gamma cameras. The Company recognizes revenue in accordance with the authoritative guidance for revenue recognition, when all of the following four criteria are met: (i) a contract or sales arrangement exists; (ii) products have been shipped and title has transferred or services have been rendered; (iii) the price of the products or services is fixed or determinable; and (iv) collectability is reasonably assured. The timing of revenue recognition is based upon factors such as passage of title and risk of loss, the need for installation, and customer acceptance. These factors are based on the specific terms of each contract or sales arrangement.
DIS revenue is derived from the service of personnel and equipment for in-office nuclear and ultrasound imaging procedures. Revenue related to imaging services is recognized at the time services are performed and collection is reasonably assured. DIS services are generally billed on a per-day basis under annual contracts, which specify the number of days of service to be provided, or on a flat rate month-to-month basis.
Product revenues are generated from the sales of gamma cameras and follow-on maintenance service contracts. The Company generally recognizes revenue upon delivery to customers. The Company also provides installation and training for camera sales in the United States. Installation and training is generally performed shortly after delivery and represents a cost, which the Company accrues at the time revenue is recognized. Neither service is essential to the functionality of the product. Maintenance services are sold beyond the term of the warranty, which is generally one year from the date of purchase. Revenue from these contracts is deferred, recognized ratably over the service period and is included in Product sales.
Use of Estimates
The preparation of financial statements in conformity with U.S. generally accepted accounting principles requires management to make estimates and assumptions that affect the amounts reported in the consolidated financial statements and disclosures made in the accompanying notes to the consolidated financial statements. The Company’s significant estimates include the valuation of goodwill, the valuation of long-lived assets, the reserve for doubtful accounts, revenue and billing adjustments, excess and obsolete inventories, warranty costs, the valuation allowance for deferred tax assets, and the assumptions used in estimating the fair value of stock options. Actual results could differ from those estimates.
33
Change of Estimate
During the third quarter of 2011, the Company completed a review of the estimated useful lives of its mobile camera fleet. After reviewing internal plans, analyzing and evaluating the historical useful life of its cameras and demand expectations, the useful life was extended from five to ten years. The extension of depreciable lives qualifies as a change in accounting estimate and was made on a prospective basis effective July 1, 2011. For the year ended December 31, 2011, depreciation expense, recorded in cost of revenues on the Company's consolidated statement of operations was $0.4 million less than it would have been had the depreciable lives not been extended. The effect of this change on basic and diluted earnings per share for the year was $0.02 per share.
Concentration of Credit Risk and Significant Customers
Financial instruments, which potentially subject the Company to concentrations of credit risk, consist primarily of cash and cash equivalents, short-term investments and accounts receivable. The Company limits its exposure to credit loss by placing its cash and investments with high credit quality financial institutions. Additionally, the Company has established guidelines regarding diversification of its investments and their maturities, which are designed to maintain principal and maximize liquidity. No single customer represented greater than ten percent of sales for any of the years presented.
Fair Value of Financial Instruments
The authoritative guidance for fair value measurements defines fair value for accounting purposes, establishes a framework for measuring fair value and provides disclosure requirements regarding fair value measurements. The guidance defines fair value as an exit price, which is the price that would be received upon sale of an asset or paid upon transfer of a liability in an orderly transaction between market participants at the measurement date. The degree of judgment utilized in measuring the fair value of assets and liabilities generally correlates to the level of pricing observability. The Company's financial instruments primarily consist of cash equivalents, securities available-for-sale, accounts receivable, other current assets, accounts payable, other current liabilities and restricted cash. The carrying amount of these financial instruments generally approximate fair value due to their short term nature. Securities available-for-sale are recorded at fair value.
Cash and Cash Equivalents
The Company considers all investments with a maturity of three months or less when acquired to be cash equivalents.
Securities Available-for-Sale
Securities available-for-sale primarily consist of investment grade corporate debt securities. The Company classifies all securities as available-for-sale and as current assets, as the sale of such securities may be required prior to maturity to implement management strategies. These securities are carried at fair value, with the unrealized gains and losses reported as a component of other comprehensive income (loss) in stockholders' equity until realized. Realized gains and losses from the sale of available-for-sale securities, if any, are determined on a specific identification basis. A decline in the market value of any available-for-sale security below cost that is determined to be other than temporary will result in an impairment charge to earnings and a new cost basis for the security is established. No such impairment charges were recorded for any period presented. It is not more likely than not that the Company will be required to sell its investments before recovery of their amortized costs. As of December 31, 2011, none of the Company’s investments have been in an unrealized loss position for more than 12 months. Premiums and discounts are amortized or accreted over the life of the related security as an adjustment to yield using the straight-line method and include in interest income. Interest income is recognized when earned. Realized gains and losses on investments in securities are included in other income within the consolidated statements of operations. The proceeds from the sales of available-for-sale securities and the realized gains and losses on these sales were minimal.
The following table sets forth the composition of securities available-for-sale as of
December 31, 2011
and
2010
(in thousands):
|
As of December 31, 2011
|
Maturity in
Years
|
Amortized Cost
|
Unrealized
|
Fair Value
|
||||||||||||||
|
Gains
|
Losses
|
|||||||||||||||||
|
Corporate debt securities
|
2 or less
|
$
|
6,380
|
|
$
|
33
|
|
$
|
—
|
|
$
|
6,413
|
|
|||||
34
|
As of December 31, 2010
|
Maturity in
Years
|
Amortized Cost
|
Unrealized
|
Fair Value
|
||||||||||||||
|
Gains
|
Losses
|
|||||||||||||||||
|
Corporate debt securities
|
3 or less
|
$
|
9,725
|
|
$
|
91
|
|
$
|
(28
|
)
|
$
|
9,788
|
|
|||||
The Company invests cash in accordance with guidelines which require its investments in marketable securities to meet minimum credit ratings assigned by established credit organizations. The Company also diversifies the investments through specifying maximum investments by instrument type and issuer. It is the Company’s policy to invest in instruments that have a final maturity of no longer than three years, with a portfolio weighted average maturity of no longer than 18 months.
Allowance for Doubtful Accounts and Billing Adjustments
Accounts receivable consist principally of trade receivables from customers and are generally unsecured and due within 30 days. Expected credit losses related to trade accounts receivable are recorded as an allowance for doubtful accounts within accounts receivables, net in the consolidated balance sheets.
The Company reviews reserves on a quarterly basis and makes adjustments based on their historical experience rate and known collectability issues and disputes. Within DIS, the Company provides reserves for adjustments and credit memos that represent billing adjustments that are normally adjusted within the first 90 days subsequent to the performance of service. A provision for billing adjustments is charged against DIS revenues and a provision for doubtful accounts is charged to general and administrative expenses. When internal collection efforts on accounts have been exhausted, the accounts are written off by reducing the allowance for doubtful accounts.
The following table summarizes the Company’s allowance for doubtful accounts and billing adjustments as of and for the years ended
December 31, 2011
,
2010
and
2009
(in thousands):
|
Allowance for Doubtful Accounts (1)
|
Reserves for Billing
Adjustments and
Contractual Allowances (2)
|
|||||||
|
Balance at December 31, 2008
|
$
|
837
|
|
$
|
408
|
|
||
|
Provision
|
58
|
|
1,280
|
|
||||
|
Write-offs and recoveries, net
|
(18
|
)
|
(1,275
|
)
|
||||
|
Balance at December 31, 2009
|
877
|
|
413
|
|
||||
|
Provision
|
832
|
|
1,127
|
|
||||
|
Write-offs and recoveries, net
|
(522
|
)
|
(1,128
|
)
|
||||
|
Balance at December 31, 2010
|
1,187
|
|
412
|
|
||||
|
Provision
|
237
|
|
868
|
|
||||
|
Write-offs and recoveries, net
|
(676
|
)
|
(924
|
)
|
||||
|
Balance at December 31, 2011
|
$
|
748
|
|
$
|
356
|
|
||
|
(1)
|
The provision was charged against general and administrative expenses.
|
|
(2)
|
The provision was charged against revenue.
|
Inventory
The Company states inventories at the lower of cost (first-in, first-out) or market (net realizable value) and reviews their inventory balances for excess and obsolete inventory levels on a quarterly basis. Costs include material, labor and manufacturing overhead costs. The Company relies on historical information to support their excess and obsolete reserves and utilize management’s business judgment with respect to estimated future demand. The Company generally reserved 100% of the cost of production inventory in excess of a projected 24 month demand and service inventory quantities in excess of a projected 36 month demand. Once inventory is reserved, the Company does not adjust the reserve balance until the inventory is sold or disposed.
35
The following table summarizes the Company’s reserves for excess and obsolete inventory as of and for the years ended
December 31, 2011
,
2010
and
2009
(in thousands):
|
|
Reserve for Excess and
Obsolete Inventories (1)
|
||
|
Balance at December 31, 2008
|
$
|
595
|
|
|
Provision
|
538
|
|
|
|
Write-offs and scrap
|
(336
|
)
|
|
|
Balance at December 31, 2009
|
797
|
|
|
|
Provision
|
1,411
|
|
|
|
Write-offs and scrap
|
(317
|
)
|
|
|
Balance at December 31, 2010
|
1,891
|
|
|
|
Provision
|
82
|
|
|
|
Write-offs and scrap
|
(379
|
)
|
|
|
Balance at December 31, 2011
|
$
|
1,594
|
|
|
(1)
|
The provision was charged against Product cost of revenues.
|
Valuation of Long-Lived Assets including Finite Lived Purchased Intangible Assets
Long-lived assets consist of property and equipment and finite lived intangible assets. The Company records property and equipment at cost, and records other intangible assets based on their fair values at the date of acquisition. The Company calculates depreciation on property and equipment using the straight-line method over the estimated useful life of the assets which average 6 years for machinery and equipment, 3 years for computer hardware and software and lower of the lease term or an average of 5 years for leasehold improvements. The Company calculates amortization on other intangible assets using either the accelerated or the straight-line method over the estimated useful life of the assets, based on when the Company expects to receive cash inflows generated by the intangible assets.
Impairment losses on long-lived assets used in operations are recorded when indicators of impairment are present and the undiscounted cash flows estimated to be generated by those assets are less than the assets’ carrying amount. If such assets are considered to be impaired, the impairment to be recognized is measured by the amount by which the carrying amount of the assets exceeds the estimated fair value of the assets. No impairment losses were recorded on long-lived assets during the years ended
December 31, 2011
,
2010
and
2009
.
Valuation of Goodwill
The Company reviews goodwill for impairment on an annual basis during the fourth quarter, as well as when events or changes in circumstances indicate that the carrying value may not be recoverable. The Company typically performs a two-step impairment test on goodwill. In the first step, the Company compares the fair value of the reporting unit with goodwill to the carrying value of its long-term assets. If the carrying value of the long-term assets exceeds the fair value of the reporting unit, then the Company must perform the second step of the impairment test, whereby the carrying value of the reporting unit’s goodwill is compared to its implied fair value. If the carrying value of the goodwill exceeds the implied fair value, an impairment loss equal to the difference would be recorded.
In September 2011, the FASB issued guidance that simplified how entities test for goodwill impairment. This guidance permits entities to first assess qualitative factors to determine whether it is more likely than not that the fair value of a reporting unit is less than its carrying amount as a basis for determining whether it is necessary to perform a two-step goodwill impairment test. This guidance is effective for annual and interim goodwill impairment tests performed for fiscal years beginning after December 15, 2011, and early adoption is permitted. The Company early adopted this guidance for its annual goodwill impairment test that was conducted in the fourth quarter of 2011. The adoption of this guidance did not have a material effect on the Company's financial condition or results of operations.
36
Restricted Cash
As of December 31, 2011, the Company has $0.2 million of money market funds that are restricted from withdrawal as they are held as collateral for a letter of credit related to an annual workers' compensation policy.
Restructuring
Restructuring costs are included in income (loss) from operations within the consolidated statements of operations. Losses on property and equipment are recorded consistent with the Company’s accounting policy related to long-lived assets. One-time termination benefits are recorded at the time they are communicated to the affected employees. Losses on property lease obligations are recorded when the lease is abandoned.
In response to its ongoing review of current market conditions and internal operations the Company had implemented restructuring activities during the years ended December 31, 2010 and 2009. The restructurings were complete prior to fiscal 2011 and no new restructuring activities were implemented during the year ended December 31, 2011.
Shipping and Handling Fees and Costs
The Company records all shipping and handling billings to a customer as revenue earned for the goods provided. Shipping and handling costs are included in cost of revenues and totaled $0.1 million, $0.3 million and $0.1 million for the years ended
December 31, 2011
,
2010
and
2009
, respectively.
Share-Based Compensation
The Company accounts for share-based awards exchanged for services in accordance with the authoritative guidance for share-based payments. Under this guidance, share-based compensation expense is measured at the grant date, based on the estimated fair value of the award, and is recognized as expense, net of estimated forfeitures, over the requisite service period.
Warranty
The Company generally provides a 12 month warranty on its gamma cameras. The Company accrues the estimated cost of this warranty at the time revenue is recorded and charges warranty expense to Product cost of revenues. Warranty reserves are established based on historical experience with failure rates and repair costs and the number of systems covered by warranty. Warranty reserves are depleted as gamma cameras are repaired. The costs consist principally of materials, personnel, overhead and transportation. The Company reviews warranty reserves quarterly and, if necessary, makes adjustments.
The activities in the Company’s warranty reserve for the years ended
December 31, 2011
,
2010
and
2009
are as follows (in thousands):
|
|
Years Ended December 31,
|
|||||||||||
|
|
2011
|
2010
|
2009
|
|||||||||
|
Balance at beginning of year
|
$
|
378
|
|
$
|
332
|
|
$
|
906
|
|
|||
|
Charges to Product cost of revenues
|
708
|
|
670
|
|
406
|
|
||||||
|
Applied to liability
|
(789
|
)
|
(624
|
)
|
(980
|
)
|
||||||
|
Balance at end of year
|
$
|
297
|
|
$
|
378
|
|
$
|
332
|
|
|||
Research and Development
Research and development costs are expensed as incurred.
Advertising Costs
Advertising costs are expensed as incurred. Total advertising costs for each of the years ended
December 31, 2011
,
2010
and
2009
were $0.6 million, $0.4 million and $0.6 million, respectively.
Net Income (Loss) Per Share
Basic earnings per share (EPS) is calculated by dividing net income or loss by the weighted average number of common shares and vested restricted stock units outstanding. Diluted EPS is computed by dividing net income or loss by the weighted average number of common shares and vested restricted stock units outstanding and the weighted average number of dilutive common stock equivalents, including stock options and non-vested restricted stock units under the treasury stock method. Common stock equivalents are only included in the diluted earnings per share calculation when their effect is dilutive. Shares
37
used to compute basic net income (loss) per share include 289,394 and 244,531 vested restricted stock units for the years ended December 31, 2011 and 2010, respectively.
The following table sets forth the computation of basic and diluted net income (loss) per share for the periods indicated (in thousands, except per share amounts):
|
|
Years Ended December 31,
|
|||||||||||
|
|
2011
|
2010
|
2009
|
|||||||||
|
Net income (loss)
|
$
|
(3,342
|
)
|
$
|
(6,214
|
)
|
$
|
608
|
|
|||
|
Shares used to compute basic net income (loss) per share
|
19,052
|
|
18,774
|
|
18,836
|
|
||||||
|
Dilutive potential common shares:
|
||||||||||||
|
Stock options
|
—
|
|
—
|
|
408
|
|
||||||
|
Restricted stock units
|
—
|
|
—
|
|
76
|
|
||||||
|
Shares used to compute diluted net income (loss) per share
|
19,052
|
|
18,774
|
|
19,320
|
|
||||||
|
Basic and diluted net income (loss) per share
|
$
|
(0.18
|
)
|
$
|
(0.33
|
)
|
$
|
0.03
|
|
|||
Since the Company incurred net losses for the years ended
December 31, 2011
and
2010
, 601,491 and 528,356 common share equivalents were excluded from the computation of diluted net income (loss) per share for years ended
December 31, 2011
and
2010
, respectively, as their effect would be antidilutive.
Comprehensive Income (Loss)
Comprehensive income (loss) is defined as the change in equity during a period from transactions and other events and circumstances from non-owner sources. Comprehensive income (loss) includes unrealized gains or losses on the Company's marketable securities. The Company has disclosed comprehensive income (loss) as a component of stockholders' equity.
Accounting Standards Updates
In June and December 2011, the Financial Accounting Standards Board (FASB) issued guidance on the presentation of comprehensive income. This guidance eliminates the option to present the components of other comprehensive income as part of the statement of changes in stockholders' equity, which is the Company's current presentation, and also requires presentation of reclassification adjustments from other comprehensive income to net income on the face of the financial statements. This guidance is effective for fiscal years and interim periods beginning after December 15, 2011, with the exception of the requirement to present reclassification adjustments from other comprehensive income to net income on the face of the financial statements, which has been deferred pending further deliberation by the FASB, and is not expected to have a material effect on the Company's financial condition or results of operations, though it will change financial statement presentation.
|
NOTE 3.
|
Supplementary Balance Sheet Information (in thousands):
|
|
December 31,
2011 |
December 31,
2010 |
|||||||
|
Inventories, net:
|
||||||||
|
Raw materials
|
$
|
2,899
|
|
$
|
3,050
|
|
||
|
Work-in-process
|
2,665
|
|
2,641
|
|
||||
|
Finished goods
|
2,207
|
|
1,632
|
|
||||
|
7,771
|
|
7,323
|
|
|||||
|
Less reserve for excess and obsolete inventories
|
(1,593
|
)
|
(1,891
|
)
|
||||
|
$
|
6,178
|
|
$
|
5,432
|
|
|||
38
|
December 31,
2011 |
December 31,
2010 |
|||||||
|
Property and equipment, net:
|
||||||||
|
Machinery and equipment
|
$
|
21,684
|
|
$
|
21,627
|
|
||
|
Computer hardware and software
|
2,712
|
|
2,417
|
|
||||
|
Leasehold improvements
|
813
|
|
807
|
|
||||
|
25,209
|
|
24,851
|
|
|||||
|
Accumulated depreciation
|
(19,842
|
)
|
(17,666
|
)
|
||||
|
$
|
5,367
|
|
$
|
7,185
|
|
|||
|
December 31,
2011 |
December 31,
2010 |
|||||||
|
Intangible assets, net (1):
|
||||||||
|
Customer relationships
|
$
|
2,600
|
|
$
|
2,600
|
|
||
|
Covenants not to compete
|
300
|
|
300
|
|
||||
|
Patents
|
141
|
|
141
|
|
||||
|
3,041
|
|
3,041
|
|
|||||
|
Accumulated amortization of customer relationships
|
(2,201
|
)
|
(1,942
|
)
|
||||
|
Accumulated amortization of covenants not to compete
|
(280
|
)
|
(220
|
)
|
||||
|
Accumulated amortization of patents
|
(83
|
)
|
(71
|
)
|
||||
|
$
|
477
|
|
$
|
808
|
|
|||
|
(1)
|
Amortization expense for intangible assets, net for the years ended
December 31, 2011
,
2010
and
2009
was $0.3 million, $0.4 million and $0.6 million, respectively. Estimated amortization expense for intangible assets for 2012 is $0.2 million, for 2013 is $0.2 million, for 2014 is $0.1 million, for 2015 and thereafter less than $0.1 million.
|
|
December 31,
2011 |
December 31,
2010 |
|||||||
|
Other accrued liabilities:
|
||||||||
|
Outside services and consulting
|
$
|
836
|
|
$
|
318
|
|
||
|
Sales and property taxes payable
|
473
|
|
464
|
|
||||
|
Professional fees
|
293
|
|
284
|
|
||||
|
Radiopharmaceuticals and consumable medical supplies
|
243
|
|
365
|
|
||||
|
Facilities and related costs
|
129
|
|
210
|
|
||||
|
Travel expenses
|
110
|
|
101
|
|
||||
|
Other accrued liabilities
|
313
|
|
354
|
|
||||
|
$
|
2,397
|
|
$
|
2,096
|
|
|||
|
NOTE 4.
|
Fair Value Measurements
|
The Company has categorized its assets and liabilities measured at fair value into a three-level hierarchy in accordance with the authoritative guidance for fair value measurements. Assets and liabilities presented at fair value in the Company’s consolidated balance sheets are generally categorized as follows:
|
Level 1:
|
Quoted prices in active markets for identical assets or liabilities.
|
|
Level 2:
|
Observable inputs other than Level 1 prices, such as quoted prices for similar assets or liabilities, quoted prices in markets that are not active or other inputs that are observable or can be corroborated by observable market data for substantially the full term of the assets or liabilities.
|
|
Level 3:
|
Unobservable inputs that are supported by little or no market activity and that are significant to the fair value of the assets or liabilities. Such assets and liabilities may have values determined using pricing models,
|
39
discounted cash flow methodologies, or similar techniques, and include instruments for which the determination of fair value requires significant management judgment or estimation.
As required by the authoritative guidance for fair value measurements, financial assets and liabilities are classified in their entirety based on the lowest level of input that is significant to the fair value measurement. Management’s assessment of the significance of a particular input to the fair value measurement requires judgment, which may affect the valuation of assets and liabilities and their placement within the fair value hierarchy levels. The following table sets forth by level within the fair value hierarchy the Company’s assets that were recorded at fair value as of
December 31, 2011
and
2010
(in thousands).
|
|
At Fair Value as of December 31, 2011
|
|||||||||||||||
|
|
Level 1
|
Level 2
|
Level 3
|
Total
|
||||||||||||
|
Assets:
|
||||||||||||||||
|
Corporate debt securities
|
$
|
—
|
|
$
|
6,413
|
|
$
|
—
|
|
$
|
6,413
|
|
||||
|
|
At Fair Value as of December 31, 2010
|
|||||||||||||||
|
|
Level 1
|
Level 2
|
Level 3
|
Total
|
||||||||||||
|
Assets:
|
||||||||||||||||
|
Corporate debt securities
|
$
|
—
|
|
$
|
9,788
|
|
$
|
—
|
|
$
|
9,788
|
|
||||
|
NOTE 5.
|
Goodwill
|
Goodwill has been recorded within a reporting unit of the Company’s DIS segment since the acquisition of net assets from Ultrascan. As a result of the Company’s annual impairment test during the fourth quarter of 2008, the Company recorded a $2.5 million impairment loss due to a significant decline in its market capitalization, adjusting goodwill to its current carrying value of $0.2 million. The Company determined the implied fair value of its goodwill utilizing the discounted cash flow method under the income approach. Under the income approach, the Company derived the fair value based on the present value of estimated future cash flows, which were based on historical data and assumptions pertaining to the market.
In performing the 2011 goodwill impairment test, the Company assessed the relevant qualitative factors and concluded that it is more likely than not that the fair values of our goodwill is greater than the carrying amount. After reaching this conclusion, no further testing was performed. The qualitative factors the Company considered included, but were not limited to, general economic conditions, the industry outlook, the Company's recent and forecasted financial performance and the price of the Company's common stock.
No impairment loss was recorded in
2011
,
2010
and
2009
.
|
NOTE 6.
|
Commitments and Contingencies
|
Leases
The Company is currently leasing its facility which has approximately 72,000 square feet of manufacturing and office space. The lease expires in August 2016. The minimum annual rent on the facility is subject to increases specified in the lease. The Company is also required to pay taxes, insurance and operating costs under the facility lease. The Company has the option to renew the lease for two additional three-year options to extend beyond its expiration, which is conditional on the Company occupying the entire facility.
The Company leases its facilities and certain automotive equipment under non-cancelable operating leases expiring from January 1, 2012 through December 31, 2016. Rent expense is recognized on a straight-line basis over the initial lease term and those renewal periods that are reasonably assured as determined at lease inception. The difference between rent expense and rent paid is recorded as deferred rent and is included in other liabilities. Rent expense was $1.3 million for the years ended
December 31, 2011
,
2010
and
2009
. The future minimum rental payments due under non-cancelable operating leases having initial or remaining lease terms in excess of one year as of
December 31, 2011
are as follows (in thousands):
40
|
|
Operating
Leases
|
||
|
2012
|
$
|
1,231
|
|
|
2013
|
809
|
|
|
|
2014
|
599
|
|
|
|
2015
|
586
|
|
|
|
2016
|
98
|
|
|
|
Thereafter
|
—
|
|
|
|
Total minimum lease payments
|
$
|
3,323
|
|
Legal Matters
In the normal course of business, the Company has been, and will likely continue to be, subject to litigation or administrative proceedings incidental to its business, such as claims related to customer disputes, employment practices, wage and hour disputes, product liability, professional liability, commercial disputes, licensure restrictions or denials, and warranty or patent infringement. Responding to litigation or administrative proceedings, regardless of whether they have merit, can be expensive and disruptive to normal business operations. As litigation and the administrative proceedings are inherently uncertain, the Company cannot predict the outcome of such matters. While the ultimate outcome of litigation is always uncertain, the Company does not believe that it will have a material adverse effect on its business or financial results.
|
NOTE 7.
|
Share-Based Compensation
|
At December 31, 2011, the Company has two active stock option plans, the 2004 Stock Incentive Plan (the “2004 Plan”) and the 2011 Inducement Stock Incentive Plan (the “2011 Plan”), (collectively the “Plans”), under which stock options and restricted stock units may be granted to employees and non-employees, including members of the Company's Board of Directors. Terms of any equity instruments granted under the Plans are approved by the Board of Directors. Stock options typically vest over the requisite service period of two to four years and have a contractual term of seven to ten years. Restricted stock units generally vest over one to three years and must be settled at the earlier of the recipients' termination date or 36 months after grant. Under the Plans, the Company is authorized to issue an aggregate of 2,750,000 shares of common stock. As of December 31, 2011, the Plans had
468,688
shares available for future issuance. The number of shares reserved for issuance under the 2004 Plan is subject to increase by any shares under the 1998 Stock Option/Stock Issuance Plan (the “1998 Plan”) that are forfeited, expire or are cancelled up to a maximum of 1,500,000 shares. As of December 31, 2011, the number of shares reserved for issuance under the Plans was
404,955
shares due to forfeited, expired and cancelled shares under the 1998 Plan.
Prior to the completion of the Company’s initial public offering in June 2004, the Company was authorized to issue options under its 1991 Stock Option Program, 1997 Stock Option/Stock Issuance Plan and 1998 Stock Option/Stock Issuance Plan; however, no additional awards may now be made under such plans.
Stock Options
The estimated fair value of the Company’s stock options is determined using the Black-Scholes model. All stock options were granted with an exercise price equal to the fair value of the common stock on the grant date. The weighted-average grant date fair value of employee stock options granted during the years ended December 31,
2011
,
2010
and
2009
was
$1.86
,
$1.14
and
$0.52
per share, respectively, which was estimated using the following weighted-average assumptions:
|
|
Years Ended December 31,
|
||||||||
|
|
2011
|
2010
|
2009
|
||||||
|
Expected volatility
|
62
|
%
|
65
|
%
|
65
|
%
|
|||
|
Expected term (in years)
|
6.5
|
|
6.1
|
|
6.0
|
|
|||
|
Risk-free interest rate
|
1.9
|
%
|
2.9
|
%
|
3.0
|
%
|
|||
|
Expected dividend yield
|
—
|
|
—
|
|
—
|
|
|||
The
determination of the fair value of stock options using an option valuation model is affected by the Company's stock price, as well as assumptions regarding a number of complex and subjective variables. The volatility assumption is based on the historical volatility of the Company's common stock over a period of time equal to the expected term of the stock options. The expected term of the Company's stock options is based on historical experience. The risk-free rate for periods within the
41
contractual life of the option is based on the U.S. Treasury yield in effect at the time of grant. The Company has never declared or paid dividends and has no plans to do so in the foreseeable future
.
A summary of the Company’s stock option award activity as of and for the year ended December 31,
2011
is as follows (in thousands, except per share data):
|
Number of
Shares
|
Weighted-
Average
Exercise
Price per
Share
|
Weighted-
Average
Remaining
Contractual
Term (In Years)
|
Aggregate
Intrinsic Value
|
|||||||||||
|
Options outstanding at December 31, 2010
|
1,997
|
|
$
|
2.11
|
|
|||||||||
|
Options exercisable at December 31, 2010
|
1,221
|
|
$
|
2.59
|
|
|||||||||
|
Options granted
|
70
|
|
$
|
2.82
|
|
|||||||||
|
Options forfeited
|
(57
|
)
|
1.63
|
|
||||||||||
|
Options expired
|
(8
|
)
|
47.82
|
|
||||||||||
|
Options exercised
|
(100
|
)
|
1.20
|
|
||||||||||
|
Options outstanding at December 31, 2011
|
1,902
|
|
$
|
2.01
|
|
4.90
|
|
$
|
1,259
|
|
||||
|
Options exercisable at December 31, 2011
|
1,468
|
|
$
|
2.13
|
|
4.53
|
|
$
|
1,054
|
|
||||
As share-based compensation expense under the authoritative guidance for share-based payments is based on awards ultimately expected to vest, it is reduced for estimated forfeitures. The guidance requires forfeitures to be estimated at the time of grant and revised, if necessary, in subsequent periods if actual forfeitures differ from those estimates.
At
December 31, 2011
, total unrecognized compensation cost related to unvested stock options was
$0.4 million
, which is expected to be recognized over a weighted-average period of
2.3
years.
Upon option exercise, the Company issues new shares of common stock. Cash received from stock option exercises was $0.1 million year ended December 31,
2011
and less than $0.1 million during the each of the years ended December 31,
2010
and
2009
, respectively. The Company did not recognize any income tax benefits from stock option exercises as it continues to record a valuation allowance on its deferred tax assets, as more fully described in Note 8. The total intrinsic value of stock options exercised was less than $0.1 million during the years ended December 31,
2011
,
2010
and
2009
, respectively.
Restricted Stock Units
Under guidance for share-based payments, the fair value of the Company’s restricted stock awards is based on the grant date fair value of the Company’s common stock. All restricted stock units were granted with no purchase price. The weighted-average grant date fair value of the restricted stock units was
$2.15
,
$2.00
and
$1.26
per share during the years ended December 31,
2011
,
2010
and
2009
, respectively.
A summary of the Company’s restricted stock unit activity as of and for the year ended December 31,
2011
is as follows (in thousands, except per share data):
|
Number of
Shares
|
Weighted-
Average
Grant Date
Fair Value
Per Share
|
||||||
|
Non-vested restricted stock units outstanding at December 31, 2010
|
455
|
|
$
|
2.00
|
|
||
|
Issued
|
95
|
|
$
|
2.80
|
|
||
|
Forfeited
|
(30
|
)
|
$
|
1.99
|
|
||
|
Vested
|
(236
|
)
|
$
|
2.15
|
|
||
|
Non-vested restricted stock units outstanding at December 31, 2011
|
284
|
|
$
|
2.15
|
|
||
42
The following table summarizes information about restricted stock units that vested during the years ended December 31,
2011
,
2010
and
2009
based on service conditions (in thousands):
|
|
Years Ended December 31,
|
|||||||||||
|
|
2011
|
2010
|
2009
|
|||||||||
|
Fair value on vesting date of vested restricted stock units
|
$
|
507
|
|
$
|
362
|
|
$
|
225
|
|
|||
At December 31,
2011
, total unrecognized compensation cost related to non-vested restricted stock units was $
0.5 million
, which is expected to be recognized over a weighted-average period of
1.6
years.
Allocation of Share-Based Compensation Expense
Total share-based compensation expense related to all of the Company’s share-based units for the years ended December 31,
2011
,
2010
and
2009
was allocated as follows (in thousands):
|
|
Years Ended December 31,
|
|||||||||||
|
Cost of revenues:
|
2011
|
2010
|
2009
|
|||||||||
|
DIS
|
$
|
13
|
|
$
|
26
|
|
$
|
27
|
|
|||
|
Product
|
99
|
|
60
|
|
56
|
|
||||||
|
Research and development
|
84
|
|
61
|
|
37
|
|
||||||
|
Marketing and sales
|
110
|
|
113
|
|
93
|
|
||||||
|
General and administrative
|
494
|
|
614
|
|
393
|
|
||||||
|
Share-based compensation expense
|
$
|
800
|
|
$
|
874
|
|
$
|
606
|
|
|||
Stock Repurchase Program
On February 4, 2009, the Company’s board of directors authorized a stock buyback program to repurchase up to an aggregate of $2.0 million of its issued and outstanding common shares. The timing and extent of the repurchase depends upon market conditions, applicable legal requirements, and other factors. During the years ended
December 31, 2011
,
2010
and
2009
, the Company repurchased 9,607; 25,800 and 547,418 shares of its common stock, respectively, under the stock buyback program. As of December 31, 2011, an aggregate of $1.0 million remains authorized for stock buyback under the program.
|
NOTE 8.
|
Income Taxes
|
As of
December 31, 2011
the Company had Federal and state income tax net operating loss carry forwards of $92.6 million and $91.5 million, respectively. Federal loss carry forwards of approximately $0.9 million expired in 2011 and approximately $2.4 million is set to expire in 2012, unless previously utilized. the remaining federal loss carry forwards begin to expire in 2018. No material state loss carry forwards will expire until 2016, unless previously utilized. The Company also has Federal and California research and other credit carry forwards of approximately $1.8 million and $1.9 million, as of
December 31, 2011
and
2010
, respectively. Approximately $0.2 million of the Federal credits are set to expire in 2012, unless previously utilized. The remaining Federal credit begin to expire in 2018. The California research credits have no expiration. Pursuant to Internal Revenue Code Sections 382 and 383, use of the Company’s net operating loss and credit carry forwards may be limited because of a cumulative change in ownership greater than 50% which may have occurred or which may occur in the future. A valuation allowance has been recognized to offset the deferred tax assets, as realization of such assets has not met the “more likely than not” threshold required under the authoritative guidance of accounting for income taxes.
43
The Company’s net deferred tax assets consisted of the following (in thousands):
|
|
As of December 31,
|
|||||||
|
|
2011
|
2010
|
||||||
|
Deferred tax assets:
|
||||||||
|
Net operating loss carry forwards
|
$
|
34,518
|
|
$
|
33,489
|
|
||
|
Research and development and other credits
|
1,878
|
|
1,889
|
|
||||
|
Reserves
|
1,282
|
|
1,744
|
|
||||
|
Intangibles
|
2,206
|
|
2,382
|
|
||||
|
Other, net
|
1,392
|
|
1,084
|
|
||||
|
Total deferred tax assets
|
41,276
|
|
40,588
|
|
||||
|
Deferred tax liabilities—depreciation
|
(391
|
)
|
(374
|
)
|
||||
|
Valuation allowance for deferred tax assets
|
(40,885
|
)
|
(40,214
|
)
|
||||
|
Net deferred tax assets
|
$
|
—
|
|
$
|
—
|
|
||
Income tax expense is less than $0.1 million during the years ended
December 31, 2011
,
2010
and
2009
, respectively, and is included as a component of General and administrative expense in the consolidated statements of operations.
Differences between the provision for income taxes and income taxes at the statutory federal income tax rate are as follows:
|
|
Years Ended December 31,
|
||||||||
|
|
2011
|
2010
|
2009
|
||||||
|
Income tax at statutory federal rate
|
35.0
|
%
|
35.0
|
%
|
35.0
|
%
|
|||
|
State income taxes, net of federal benefit
|
2.7
|
%
|
2.5
|
%
|
13.0
|
%
|
|||
|
Permanent differences, tax credits and other
|
2.0
|
%
|
(0.7
|
)%
|
4.9
|
%
|
|||
|
Change in effective state tax rates
|
(10.3
|
)%
|
—
|
%
|
—
|
%
|
|||
|
Expiration of net operating loss carryovers
|
(9.4
|
)%
|
—
|
%
|
—
|
%
|
|||
|
Stock compensation expense
|
0.9
|
%
|
(12.3
|
)%
|
—
|
%
|
|||
|
Reserve for uncertain tax positions and other reserves
|
(3.1
|
)%
|
(0.9
|
)%
|
(1.0
|
)%
|
|||
|
Change in valuation allowance
|
(20.3
|
)%
|
(24.6
|
)%
|
(45.6
|
)%
|
|||
|
Provision (benefit) for income taxes
|
(2.5
|
)%
|
(1.0
|
)%
|
6.3
|
%
|
|||
The following table summarizes the activity related to the Company’s unrecognized tax benefits (in thousands):
|
|
December 31,
|
|||||||
|
|
2011
|
2010
|
||||||
|
Balance at beginning of year
|
$
|
1,617
|
|
$
|
1,563
|
|
||
|
Increases related to prior year tax positions
|
30
|
|
50
|
|
||||
|
Increases related to current year tax positions
|
42
|
|
24
|
|
||||
|
Expiration of the statute of limitations for the assessment of taxes
|
(48
|
)
|
(28
|
)
|
||||
|
Change in valuation allowances
|
(20
|
)
|
8
|
|
||||
|
Balance at end of year
|
$
|
1,621
|
|
$
|
1,617
|
|
||
Included in the unrecognized tax benefits of $1.6 million at
December 31, 2011
was $1.4 million of tax benefits that, if recognized, would reduce the Company’s annual effective tax rate, subject to the valuation allowance. The Company does not expect its unrecognized tax benefits to change significantly over the next 12 months.
The Company files income tax returns in the U.S. and in various state jurisdictions with varying statutes of limitations. The Company is no longer subject to income tax examination by tax authorities for years prior to 2006; however, its net operating loss carryforward and research credit carryforwards arising prior to that year are subject to adjustment. The Company’s policy is to recognize interest expense and penalties related to income tax matters as a component of income tax expense. There were no accrued interest and penalties as of
December 31, 2011
and
2010
and no interest and penalties were recognized during the years ended
December 31, 2011
,
2010
and
2009
.
44
|
NOTE 9.
|
Employee Retirement Plan
|
The Company has two 401(k) retirement plans under which all full-time employees may contribute up to 100% of their annual salary, within IRS limits. The Company’s contributions to its retirement plans totaled $0.2 million, $0.2 million and $0.3 million the years ended
December 31, 2011
,
2010
and
2009
, respectively.
|
NOTE 10.
|
Segments
|
The Company’s reporting segments have been determined based on the nature of the products and/or services offered to customers or the nature of their function in the organization. The Company evaluates performance based on the operating income (loss) contributed by each segment. The accounting policies of the reportable segments are the same as those described in the summary of significant accounting policies. The majority of the Company’s capital expenditures arise at its DIS segment. Segment results are as follows (in thousands):
|
|
Years ended December 31,
|
|||||||||||
|
|
2011
|
2010
|
2009
|
|||||||||
|
Gross profit by segment:
|
||||||||||||
|
DIS
|
$
|
8,122
|
|
|
$
|
6,981
|
|
|
$
|
13,842
|
|
|
|
Product
|
6,636
|
|
|
5,023
|
|
|
6,383
|
|
||||
|
Consolidated gross profit
|
$
|
14,758
|
|
$
|
12,004
|
|
$
|
20,225
|
|
|||
|
Income (loss) from operations by segment:
|
||||||||||||
|
DIS
|
$
|
(535
|
)
|
$
|
(3,483
|
)
|
$
|
1,290
|
|
|||
|
Product
|
(2,975
|
)
|
(3,107
|
)
|
(1,232
|
)
|
||||||
|
Consolidated income (loss) from operations
|
$
|
(3,510
|
)
|
$
|
(6,590
|
)
|
$
|
58
|
|
|||
|
Depreciation and amortization of tangible and intangible assets by segment:
|
||||||||||||
|
DIS
|
$
|
2,765
|
|
$
|
3,763
|
|
$
|
4,464
|
|
|||
|
Product
|
331
|
|
453
|
|
714
|
|
||||||
|
Consolidated depreciation and amortization
|
$
|
3,096
|
|
$
|
4,216
|
|
$
|
5,178
|
|
|||
|
|
As of December 31,
|
|
||||||||||
|
|
2011
|
2010
|
|
|||||||||
|
Identifiable assets by segment:
|
||||||||||||
|
DIS
|
$
|
12,789
|
|
$
|
13,874
|
|
||||||
|
Product
|
37,238
|
|
38,370
|
|
||||||||
|
Consolidated assets
|
$
|
50,027
|
|
$
|
52,244
|
|
||||||
45
|
NOTE 11.
|
Quarterly Financial Information (Unaudited)
|
The following financial information reflects all normal recurring adjustments, which are, in the opinion of management, necessary for a fair statement of the results of the interim periods. Summarized quarterly data for fiscal
2011
and
2010
are as follows (in thousands, except per share data):
|
1st
Quarter
|
2nd
Quarter
|
3rd
Quarter
|
4th
Quarter
|
|||||||||||||
|
Fiscal 2011
|
||||||||||||||||
|
Revenues
|
$
|
14,175
|
|
$
|
14,249
|
|
$
|
13,439
|
|
$
|
11,882
|
|
||||
|
Gross profit
|
$
|
3,519
|
|
$
|
3,995
|
|
$
|
4,150
|
|
$
|
3,094
|
|
||||
|
Income (loss) from operations
|
$
|
(647
|
)
|
$
|
(284
|
)
|
$
|
(52
|
)
|
$
|
(2,527
|
)
|
||||
|
Net income (loss)
|
$
|
(387
|
)
|
$
|
(227
|
)
|
$
|
99
|
|
$
|
(2,827
|
)
|
||||
|
Net income (loss) per common share—basic and diluted (1)
|
$
|
(0.02
|
)
|
$
|
(0.01
|
)
|
$
|
0.01
|
|
$
|
(0.15
|
)
|
||||
|
Fiscal 2010
|
||||||||||||||||
|
Revenues
|
$
|
15,069
|
|
$
|
13,159
|
|
$
|
13,299
|
|
$
|
14,656
|
|
||||
|
Gross profit
|
$
|
3,372
|
|
$
|
1,908
|
|
$
|
3,114
|
|
$
|
3,610
|
|
||||
|
Loss from operations
|
$
|
(1,377
|
)
|
$
|
(3,111
|
)
|
$
|
(1,469
|
)
|
$
|
(633
|
)
|
||||
|
Net loss
|
$
|
(1,235
|
)
|
$
|
(3,084
|
)
|
$
|
(1,336
|
)
|
$
|
(559
|
)
|
||||
|
Net loss per common share—basic and diluted (1)
|
$
|
(0.06
|
)
|
$
|
(0.16
|
)
|
$
|
(0.07
|
)
|
$
|
(0.03
|
)
|
||||
|
(1)
|
Earnings per share are computed independently for each of the quarters presented. Therefore, the sum of the quarterly net earnings per share will not necessarily equal the total for the year.
|
For the quarter ended December 31, 2011, the Company recorded an adjustment to interest income related to prior quarters in 2011. The adjustment decreased interest income in the quarter ended December 31, 2011 by $250,000. Based on a quantitative and qualitative analysis of the adjustment, as required by authoritative guidance, management concluded that the adjustment had no material impact on any of the Company's previously issued Form 10-Q's in 2011.
|
ITEM 9.
|
CHANGES IN AND DISAGREEMENTS WITH ACCOUNTANTS ON ACCOUNTING AND FINANCIAL DISCLOSURES
|
None.
|
ITEM 9A.
|
CONTROLS AND PROCEDURES
|
|
(a)
|
Evaluation of Disclosure Controls and Procedures
|
The Company maintains disclosure controls and procedures that are designed to ensure that information required to be disclosed in its Securities and Exchange Commission Act of 1934 reports is recorded, processed, summarized and reported within the time periods specified in the Securities and Exchange Commission’s rules and forms and that such information is accumulated and communicated to the Company’s management, including its chief executive officer and chief financial officer, as appropriate, to allow for timely decisions regarding required disclosure. In designing and evaluating the disclosure controls and procedures, management recognizes that any controls and procedures, no matter how well designed and operated, can provide only reasonable assurance of achieving the desired control objectives, and management is required to apply its judgment in evaluating the cost-benefit relationship of possible controls and procedures.
As required by Securities and Exchange Commission Rule 13a-15(e) and 15d-15(e), the Company carried out an evaluation, under the supervision and with the participation of our management, including our chief executive officer and chief financial officer, of the effectiveness of the design and operation of our disclosure controls and procedures as of the end of the period covered by this report. Based on the foregoing, our chief executive officer and chief financial officer concluded that our disclosure controls and procedures were effective at the reasonable assurance level.
There has been no change in our internal controls over financial reporting during our most recent fiscal quarter that has materially affected, or is reasonably likely to materially affect, our internal controls over financial reporting.
|
(b)
|
Management’s Report on Internal Control over Financial Reporting
|
46
The Company’s management is responsible for establishing and maintaining adequate internal control over financial reporting, as such term is defined in Exchange Act Rules 13a-15(f) and 15d-15(f). Because of its inherent limitations, internal control over financial reporting may not prevent or detect all misstatements. Therefore, even those systems determined to be effective can provide only reasonable assurance with respect to financial statement preparation and presentation.
The Company conducted an evaluation of the effectiveness of our internal control over financial reporting based on the framework in
Internal Control—Integrated Framework
issued by the Committee of Sponsoring Organizations of the Treadway Commission. Based on our evaluation under the framework in
Internal Control—Integrated Framework
, our management concluded that our internal control over financial reporting was effective as of
December 31, 2011
.
This annual report does not include an attestation report of the Company’s independent registered public accounting firm regarding internal control over financial reporting. Management’s report was not subject to attestation by the Company’s independent registered public accounting firm pursuant to the rules of the SEC that permit the Company to provide only a management’s report in this report.
|
ITEM 9B.
|
OTHER INFORMATION
|
None.
47
|
ITEM 10.
|
DIRECTORS, EXECUTIVE OFFICERS AND CORPORATE GOVERNANCE
|
The information required by this item regarding directors and corporate governance is incorporated by reference to our definitive Proxy Statement to be filed with the Securities and Exchange Commission in connection with the Annual Meeting of Stockholders to be held in
2012
, or the “
2012
Proxy Statement,” under the headings “Election of Directors,” “Board of Directors and Board Committees” and “Section 16(a) Beneficial Ownership Reporting Compliance.” Information regarding executive officers is set forth in Item 1 of Part I of this Report under the caption “Executive Officers of the Registrant.” The Company has adopted a Code of Business Conduct and Ethics that applies to all directors, officers and employees, including our principal executive officer, principal financial officer and principal accounting officer. Our Code of Business Conduct and Ethics is posted on our website,
www.digirad.com.
|
ITEM 11.
|
EXECUTIVE COMPENSATION
|
The information required by Item 11 is incorporated by reference from the information set forth under the captions “Compensation of Non-Employee Directors” and “Executive Compensation,” in our
2012
Proxy Statement.
|
ITEM 12.
|
SECURITY OWNERSHIP OF CERTAIN BENEFICIAL OWNERS AND MANAGEMENT AND RELATED STOCKHOLDER MATTERS
|
The information required by Item 12 is incorporated by reference from the information set forth under the captions “Executive Compensation—Equity Compensation Plan Information” and “Security Ownership,” in our
2012
Proxy Statement.
|
ITEM 13.
|
CERTAIN RELATIONSHIPS AND RELATED TRANSACTIONS, AND DIRECTOR INDEPENDENCE
|
The information required by Item 13 is incorporated by reference from the information set forth under the captions “Corporate Governance and Board of Directors—Director Independence” and “Related Person Transactions and Section 16(a) Beneficial Ownership Reporting Compliance,” in our
2012
Proxy Statement.
|
ITEM 14.
|
PRINCIPAL ACCOUNTING FEES AND SERVICES
|
The information required by Item 14 is incorporated by reference from the information set forth under the caption “Proposal Number II—Ratification of Selection of Independent Registered Public Accounting Firm,” in our
2012
Proxy Statement.
48
|
ITEM 15.
|
EXHIBITS, FINANCIAL STATEMENT SCHEDULES
|
|
(a)
|
Financial Statements and Financial Statement Schedules
|
Documents filed as part of this report:
|
1.
|
Financial Statements:
|
The financial statements of Digirad Corporation listed below are set forth in Item 8 of this report for the year ended
December 31, 2011
:
Report of Independent Registered Public Accounting Firm
Consolidated Balance Sheets at
December 31, 2011
and
2010
Consolidated Statements of Operations for the years ended
December 31, 2011
,
2010
and
2009
Consolidated Statements of Cash Flows for the years ended
December 31, 2011
,
2010
and
2009
Consolidated Statements of Stockholders’ Equity for the years ended
December 31, 2011
,
2010
and
2009
Notes to Consolidated Financial Statements
|
2.
|
Financial Statement Schedules:
|
All other schedules are omitted because they are not applicable or the required information is shown in the consolidated financial statements or notes thereto.
(b) Exhibits
EXHIBIT INDEX
|
Exhibit
Number
|
|
Description
|
|
2.1(11)
|
|
Asset Purchase Agreement, by and between Digirad Corporation, Digirad Imaging Solutions, Inc., Digirad Ultrascan Solutions, Inc. and Ultrascan, Inc. dated May 1, 2007.
|
|
2.2(19)
|
|
Asset Purchase Agreement, dated February 2, 2009, by and among the Company, Digirad Imaging Solutions, Inc. and MD Office Solutions.
|
|
2.3(20)
|
|
Asset Purchase Agreement, dated as of March 2, 2009, by and among Digirad Imaging Solutions, Inc. Daniel D. Rice, Denise Nelson, Greg Nelson and Antigua Medical Services, LLC.
|
|
3.1(1)
|
|
Amended and Restated Certificate of Incorporation.
|
|
3.2(13)
|
|
Amended and Restated Bylaws.
|
|
4.1(2)
|
|
Form of Specimen Stock Certificate.
|
|
4.2(14)
|
|
Preferred Stock Rights Agreement, by and between Digirad Corporation and American Stock Transfer and Trust Company, dated November 22, 2005.
|
|
10.1(2)†
|
|
License Agreement, by and between Digirad Corporation and the Regents of the University of California dated May 19, 1999, as amended.
|
|
10.2(2)†
|
|
Amendment to License Agreement by and between Digirad Corporation and the Regents of the University of California, dated July 28, 2004, as amended.
|
|
10.3(2)†
|
|
License Agreement, by and between Digirad Corporation and Cedars-Sinai Health System, dated May 22, 2001, as amended.
|
|
10.4(2)†
|
|
License Agreement, by and between Digirad Corporation and Cedars-Sinai Health System, dated April 1, 2003, as amended.
|
|
10.7(10)#
|
|
Digirad Corporation 2004 Stock Incentive Plan, as Amended and Restated on August 2, 2007.
|
|
10.8(7)#
|
|
Form of Notice of Stock Option Award and Stock Option Award Agreement for 2004 Stock Incentive Plan.
|
49
|
Exhibit
Number
|
|
Description
|
|
10.9(2)#
|
|
2004 Non-Employee Director Option Program.
|
|
10.10(7)#
|
|
Form of Notice of Stock Option Award and Stock Option Award Agreement for 2004 Non-Employee Director Option Program.
|
|
10.11(2)#
|
|
Form of Indemnification Agreement.
|
|
10.12(12)+
|
|
Agreement for Services between the Registrant’s wholly-owned subsidiary, Digirad Imaging Solutions, Inc. and MBR and Associates, Inc., dated April 1, 2008.
|
|
10.15(15)#
|
|
Executive Employment Agreement, by and between Digirad Corporation and Todd Clyde, dated October 30, 2008.
|
|
10.16(16)#
|
|
Amendment to Employment Agreement, dated December 31, 2010, by and between the Company and Todd P. Clyde.
|
|
10.17(17)#
|
|
Executive Employment Agreement, by and between the Company and Richard B. Slansky, dated February 9, 2009.
|
|
10.18(16)#
|
|
Amendment to Employment Agreement, dated December 31, 2010, by and between the Company and Richard B. Slansky.
|
|
10.19(16)#
|
|
Severance Agreement, dated December 31, 2010, by and between the Company and Virgil Lott.
|
|
10.21(18)
|
|
Commercial Lease Agreement, dated August 1, 2009, by and between the Company and B. Young Properties, LLC.
|
|
10.23(21)#
|
Form of 2011 Inducement Stock Incentive Plan.
|
|
|
10.24(21)#
|
Form of 2011 Inducement Stock Incentive Plan Stock Option Agreement.
|
|
|
10.25(21)#
|
Form of 2011 Inducement Stock Incentive Plan Restricted Stock Unit Agreement.
|
|
|
10.26#
|
Offer Letter, dated July1, 2011, by and between the Company and Armando Jackson.
|
|
|
21.1(2)
|
|
Subsidiaries of Digirad Corporation.
|
|
23.1
|
|
Consent of Independent Registered Public Accounting Firm.
|
|
24.1
|
|
Power of Attorney (included on the signature page of this Form 10-K).
|
|
31.1
|
|
Certification of Principal Executive Officer pursuant to Section 302 of the Sarbanes-Oxley Act of 2002.
|
|
31.2
|
|
Certification of Principal Financial Officer pursuant to Section 302 of the Sarbanes-Oxley Act of 2002.
|
|
32.1(9)
|
|
Certification of Principal Executive Officer pursuant to Section 906 of the Sarbanes-Oxley Act of 2002.
|
|
32.2(9)
|
|
Certification of Principal Financial Officer pursuant to Section 906 of the Sarbanes-Oxley Act of 2002.
|
|
101****
|
The following financial information from the Company's Quarterly Report on Form 10-K for the annual period ended December 31, 2011, formatted in XBRL (eXtensible Business Reporting Language): (i) Consolidated Balance Sheets, (ii) Consolidated Statements of Operations, (iii) Consolidated Statements of Cash Flows, and (iv) the Notes to Consolidated Financial Statements, tagged as blocks of text.
|
|
|
(1)
|
This exhibit was previously filed as an exhibit to the Company’s current report on Form 8-K originally filed with the Commission on May 3, 2006, as amended thereafter, and is incorporated herein by reference.
|
|
(2)
|
This exhibit was previously filed as an exhibit to the Registration Statement on Form S-1 (File No. 333-113760) originally filed with the Securities and Exchange Commission on March 19, 2004, as amended thereafter, and is incorporated herein by reference.
|
|
(3)
|
Reserved.
|
|
(4)
|
Reserved.
|
|
(5)
|
Reserved.
|
|
(6)
|
Reserved.
|
|
(7)
|
This exhibit was previously filed as an exhibit to the Company’s annual report on Form 10-K filed with the Commission on March 3, 2005, and is incorporated herein by reference.
|
|
(8)
|
Reserved.
|
|
(9)
|
The certifications attached as Exhibits 32.1 and 32.2 that accompany this Annual Report on Form 10-K, are not
|
50
deemed filed with the Securities and Exchange Commission and are not to be incorporated by reference into any filing of Digirad Corporation under the Securities Exchange Act of 1933, as amended, or the Securities Exchange Act of 1934, as amended, whether made before or after the date of this Form 10-K, irrespective of any general incorporation language contained in such filing.
|
(10)
|
The exhibit was previously filed as an exhibit to the Company’s quarterly report on Form 10-Q filed with the Commission on August 7, 2007, and is incorporated herein by reference.
|
|
(11)
|
The exhibit was previously filed as an exhibit to the Company’s quarterly report on Form 10-Q filed with the Commission on May 7, 2007, and is incorporated herein by reference.
|
|
(12)
|
The exhibit was previously filed as an exhibit to the Company’s quarterly report on Form 10-K filed with the Commission on February 20, 2007, and is incorporated herein by reference.
|
|
(13)
|
The exhibit was previously filed as an exhibit to the Company’s quarterly report on Form 8-K filed with the Commission on May 9, 2007, and is incorporated herein by reference.
|
|
(14)
|
The exhibit was previously filed as an exhibit to the Registration Statement on Form 8-A originally filed with the Commission on November 29, 2005, and is incorporated herein by reference.
|
|
(15)
|
This exhibit was previously filed as an exhibit to the Company’s annual report on Form 10-K filed with the Commission on February 13, 2009, and is incorporated herein by reference.
|
|
(16)
|
This exhibit was previously filed as an exhibit to the Company’s current report on Form 8-K filed with the Commission on January 3, 2011, and is incorporated herein by reference.
|
|
(17)
|
This exhibit was previously filed as an exhibit to the Company’s current report on Form 8-K filed with the Commission on February 17, 2009, and is incorporated herein by reference.
|
|
(18)
|
This exhibit was previously filed as an exhibit to the Company’s current report on Form 8-K filed with the Commission September 4, 2009, and is incorporated herein by reference.
|
|
(19)
|
This exhibit was previously filed as an exhibit to the Company’s current report on Form 8-K filed with the Commission on February 6, 2009, and is incorporated herein by reference.
|
|
(20)
|
This exhibit was previously filed as an exhibit to the Company’s current report on Form 8-K filed with the Commission on March 4, 2009, and is incorporated herein by reference.
|
|
(21)
|
This exhibit was previously filed as an exhibit to the Company's current report on Form 8-K filed with the Commission on July 29, 2011, and is incorporated herein by reference.
|
|
†
|
Digirad Corporation has been granted confidential treatment with respect to certain portions of this exhibit (indicated by asterisks), which have been filed separately with the Commission.
|
|
+
|
Portions of this exhibit (indicated by asterisks) have been omitted pursuant to a request for confidential treatment and have been separately filed with the Commission.
|
|
#
|
Indicates management contract or compensatory plan.
|
|
****
|
Users of this data are advised that pursuant to Rule 406T of Regulation S-T, this XBRL information is being furnished and not filed herewith for purposes of Section 18 of the Securities Exchange Act of 1934, as amended, and Sections 11 or 12 of the Securities Act of 1933, as amended, and is not to be incorporated by reference into any filing, or part of any registration statement or prospectus, of Digirad Corporation, whether made before or after the date hereof, regardless of any general incorporation language in such filing.
|
51
SIGNATURES
Pursuant to the requirements of Section 13 or 15(d) of the Securities Exchange Act of 1934, the registrant has duly caused this report to be signed on its behalf by the undersigned, thereunto duly authorized.
|
|
DIGIRAD CORPORATION
|
|||
|
Dated: February 17, 2012
|
|
By:
|
|
/
S
/ T
ODD
P. C
LYDE
|
|
|
Name:
|
|
Todd P. Clyde
|
|
|
|
Title:
|
|
President and Chief Executive Officer
|
|
KNOW ALL PERSONS BY THESE PRESENTS, that each person whose signature appears below constitutes and appoints Todd P. Clyde and Richard B. Slansky, and each of them, his true and lawful attorneys-in-fact and agents, with full power of substitution and resubstitution, to sign any and all amendments (including post-effective amendments) to this Annual Report on Form 10-K and to file the same, with all exhibits thereto and other documents in connection therewith, with the Securities and Exchange Commission, granting unto each of said attorneys-in-fact and agents, full power and authority to do and perform each and every act and thing requisite and necessary to be done in connection therewith, as fully to all intents and purposes as he or she might or could do in person, hereby ratifying and confirming all that each of said attorneys-in-facts and agents, or his substitute or substitutes, or any of them, shall do or cause to be done by virtue hereof.
Pursuant to the requirements of the Securities Exchange Act of 1934, this report has been signed by the following persons on behalf of the registrant and in the capacities and on the dates indicated:
|
Name
|
|
Title
|
|
Date
|
|
/
S
/ T
ODD
P. C
LYDE
|
|
President and Chief Executive Officer
|
|
February 17, 2012
|
|
Todd P. Clyde
|
(Principal Executive Officer)
|
|||
|
/
S
/ R
ICHARD
B. S
LANSKY
|
|
Chief Financial Officer
|
|
February 17, 2012
|
|
Richard B. Slansky
|
(Principal Financial Officer)
|
|||
|
/
S
/ R. K
ING
N
ELSON
|
|
Director
|
|
February 17, 2012
|
|
R. King Nelson
|
(Chairman of the Board of Directors)
|
|||
|
/
S
/ G
ARY
F. B
URBACH
|
|
Director
|
|
February 17, 2012
|
|
Gary F. Burbach
|
||||
|
/
S
/ S
TEVE
C. M
ENDELL
|
|
Director
|
|
February 17, 2012
|
|
Steve C. Mendell
|
||||
|
/
S
/ J
OHN
W. S
AYWARD
|
|
Director
|
|
February 17, 2012
|
|
John W. Sayward
|
||||
|
/
S
/ K
ENNETH
O
LSON
|
|
Director
|
|
February 17, 2012
|
|
Kenneth Olson
|
||||
52
TABLE OF CONTENTS
Part IItem 1. BusinessItem 1A. Risk FactorsItem 1B. Unresolved Staff CommentsItem 2. PropertiesItem 3. Legal ProceedingsItem 4. Mine Safety DisclosuresPart IIItem 5. Market For Registrant S Common Equity, Related Stockholder Matters and Issuer Purchases Of Equity SecuritiesItem 6. Selected Consolidated Financial DataItem 7. Management S Discussion and Analysis Of Financial Condition and Results Of OperationsItem 7A. Quantitative and Qualitative Disclosures About Market RiskItem 8. Financial Statements and Supplementary DataNote 1. The CompanyNote 2. Basis Of Presentation and Significant Accounting PoliciesNote 3. Supplementary Balance Sheet Information (in Thousands):Note 4. Fair Value MeasurementsNote 5. GoodwillNote 6. Commitments and ContingenciesNote 7. Share-based CompensationNote 8. Income TaxesNote 9. Employee Retirement PlanNote 10. SegmentsNote 11. Quarterly Financial Information (unaudited)Item 9. Changes in and Disagreements with Accountants on Accounting and Financial DisclosuresItem 9A. Controls and ProceduresItem 9B. Other InformationPart IIIItem 10. Directors, Executive Officers and Corporate GovernanceItem 11. Executive CompensationItem 12. Security Ownership Of Certain Beneficial Owners and Management and Related Stockholder MattersItem 13. Certain Relationships and Related Transactions, and Director IndependenceItem 14. Principal Accounting Fees and ServicesPart IVItem 15. Exhibits, Financial Statement Schedules