STATE STREET CORP
10-Ks and 10-Qs
|
|
|
|
|
|
|
|
|
|
|
|
|
|
|
|
|
|
|
|
|
|
|
|
|
|
|
|
|
|
|
|
|
|
|
|
|
|
|
|
|
|
|
|
|
|
|
|
|
|
|
|
|
|
|
|
UNITED STATES
SECURITIES AND EXCHANGE COMMISSION
Washington, DC 20549
Form 10-K
|
x
|
ANNUAL REPORT PURSUANT TO SECTION 13 OR 15(d) OF THE SECURITIES EXCHANGE ACT OF 1934
|
For the fiscal year ended
December 31, 2014
OR
|
¨
|
TRANSITION REPORT PURSUANT TO SECTION 13 OR 15(d) OF THE SECURITIES EXCHANGE ACT OF 1934
|
For the transition period from to
Commission File No. 001-07511
STATE STREET CORPORATION
(Exact name of registrant as specified in its charter)
|
Massachusetts
|
|
04-2456637
|
|
(State or other jurisdiction of incorporation)
|
|
(I.R.S. Employer Identification No.)
|
|
One Lincoln Street
Boston, Massachusetts
|
|
02111
|
|
(Address of principal executive office)
|
|
(Zip Code)
|
|
617-786-3000
(Registrant’s telephone number, including area code)
|
||
|
Securities registered pursuant to Section 12(b) of the Act:
|
||
|
(Title of Each Class)
|
|
(Name of each exchange on which registered)
|
|
Common Stock, $1 par value per share
|
|
New York Stock Exchange
|
|
Depositary Shares, each representing a 1/4,000th ownership interest in a share of Non-Cumulative Perpetual Preferred Stock, Series C, without par value per share
|
New York Stock Exchange
|
|
|
Depositary Shares, each representing a 1/4,000th ownership interest in a share of Fixed-to-Floating Rate Non-Cumulative Perpetual Preferred Stock, Series D, without par value per share
|
New York Stock Exchange
|
|
|
Depositary Shares, each representing a 1/4,000th ownership interest in a share of Non-Cumulative Perpetual Preferred Stock, Series E, without par value per share
|
New York Stock Exchange
|
|
None
Indicate by check mark if the registrant is a well-known seasoned issuer, as defined in Rule 405 of the Securities Act. Yes x No ¨
Indicate by check mark if the registrant is not required to file reports pursuant to Section 13 or Section 15(d) of the Act. Yes ¨ No x
Indicate by check mark whether the registrant (1) has filed all reports required to be filed by Section 13 or 15(d) of the Securities Exchange Act of 1934 during the preceding 12 months (or for such shorter period that the registrant was required to file such reports) and (2) has been subject to such filing requirements for the past 90 days. Yes x No ¨
Indicate by check mark whether the registrant has submitted electronically and posted on its corporate Web site, if any, every Interactive Data File required to be submitted and posted pursuant to Rule 405 of Regulation S-T (§ 232.405 of this chapter) during the preceding 12 months (or for such shorter period that the registrant was required to submit and post such files). Yes x No ¨
Indicate by check mark if disclosure of delinquent filers pursuant to Item 405 of Regulation S-K (§ 229.405 of this chapter) is not contained herein, and will not be contained, to the best of registrant’s knowledge, in definitive proxy or information statements incorporated by reference in Part III of this Form 10-K or any amendment to this Form 10-K. x
Indicate by check mark whether the registrant is a large accelerated filer, an accelerated filer, a non-accelerated filer or a smaller reporting company. See the definitions of “large accelerated filer,” “accelerated filer” and “smaller reporting company” in Rule 12b-2 of the Exchange Act. (Check one):
|
Large accelerated filer x
|
Accelerated filer ¨
|
Non-accelerated filer ¨
|
Smaller reporting company ¨
|
|||
|
(Do not check if a smaller reporting company)
|
||||||
Indicate by check mark whether the registrant is a shell company (as defined in Rule 12b-2 of the Act). Yes ¨ No x
The aggregate market value of the voting and non-voting common equity held by non-affiliates computed by reference to the per share price ($67.26) at which the common equity was last sold as of the last business day of the registrant’s most recently completed second fiscal quarter (June 30, 2014) was approximately
$28.43 billion
.
The number of shares of the registrant’s common stock outstanding as of
January 31, 2015
was
412,280,622
.
Portions of the following documents are incorporated by reference into Parts of this Report on Form 10-K, to the extent noted in such Parts, as indicated below:
(1) The registrant’s definitive Proxy Statement for the 2015 Annual Meeting of Shareholders to be filed pursuant to Regulation 14A on or before April 30, 2015 (Part III).
STATE STREET CORPORATION
Table Of Contents
|
|
||
|
PART I
|
||
|
Item 1
|
||
|
Item 1A
|
||
|
Item 1B
|
||
|
Item 2
|
||
|
Item 3
|
||
|
Item 4
|
||
|
PART II
|
||
|
Item 5
|
||
|
Item 6
|
||
|
Item 7
|
||
|
Item 7A
|
||
|
Item 8
|
||
|
Item 9
|
||
|
Item 9A
|
||
|
Item 9B
|
||
|
PART III
|
||
|
Item 10
|
||
|
Item 11
|
||
|
Item 12
|
||
|
Item 13
|
||
|
Item 14
|
||
|
PART IV
|
||
|
Item 15
|
||
ITEM 1.
BUSINESS
GENERAL
State Street Corporation, the parent company, is a financial holding company organized in 1969 under the laws of the Commonwealth of Massachusetts. For purposes of this Form 10-K, unless the context requires otherwise, references to “State Street,” “we,” “us,” “our” or similar terms mean State Street Corporation and its subsidiaries on a consolidated basis. The parent company provides financial and managerial support to our legal and operating subsidiaries. Through our subsidiaries, including our principal banking subsidiary, State Street Bank and Trust Company, referred to as State Street Bank, we provide a broad range of financial products and services to institutional investors worldwide.
As of
December 31, 2014
, we had consolidated total assets of
$274.12 billion
, consolidated total deposits of
$209.04 billion
, consolidated total shareholders' equity of
$21.47 billion
and
29,970
employees. Our executive offices are located at One Lincoln Street, Boston, Massachusetts 02111 (telephone (617) 786-3000). We operate in more than 100 geographic markets worldwide, including the U.S., Canada, Europe, the Middle East and Asia.
We make available on the “Investor Relations” section of our corporate website at
www.statestreet.com\stockholder
, free of charge, all reports we electronically file with, or furnish to, the Securities and Exchange Commission, or SEC, including our Annual Reports on Form 10-K, Quarterly Reports on Form 10-Q and Current Reports on Form 8-K, as well as any amendments to those reports, as soon as reasonably practicable after those documents have been filed with, or furnished to, the SEC. These documents are also accessible on the SEC’s website at
www.sec.gov
. We have included the website addresses of State Street and the SEC in this report as inactive textual references only. Information on those websites is not part of this Form 10-K.
We have Corporate Governance Guidelines, as well as written charters for the Examining and Audit Committee, the Executive Committee, the Executive Compensation Committee, the Nominating and Corporate Governance Committee, the Risk Committee and the Technology Committee of our Board of Directors, or Board, and a Code of Ethics for senior financial officers, a Standard of Conduct for Directors and a Standard of Conduct for our employees. Each of these documents is posted on the "Investor Relations" section of our website under "Corporate Governance."
We provide additional disclosures required by applicable bank regulatory standards, including supplemental qualitative and quantitative information with respect to regulatory capital (including market risk associated with our trading activities), and summary results of semi-annual State Street-run stress tests which we conduct under the Dodd-Frank Wall Street Reform and Consumer Protection Act, or Dodd-Frank Act, on the “Investor Relations” section of our website under "Filings and Reports."
BUSINESS DESCRIPTION
Overview
We are a leader in providing financial services and products to meet the needs of institutional investors worldwide, with
$28.19 trillion
of assets under custody and administration and
$2.45 trillion
of assets under management as of
December 31, 2014
. Our clients include mutual funds, collective investment funds and other investment pools, corporate and public retirement plans, insurance companies, foundations, endowments and investment managers.
We conduct our business primarily through State Street Bank, which traces its beginnings to the founding of the Union Bank in 1792. State Street Bank's current charter was authorized by a special Act of the Massachusetts Legislature in 1891, and its present name was adopted in 1960. State Street Bank operates as a specialized bank, referred to as a trust and custody bank, that services and manages assets on behalf of its institutional clients.
Additional Information
Additional information about our business activities is provided in the sections that follow. For information about our management of credit and counterparty risk; liquidity risk; operational risk; market risk associated with our trading activities; market risk associated with our non-trading, or asset-and-liability management, activities, primarily composed of interest-rate risk; and capital, as well as other risks inherent in our businesses, refer to “Risk Factors” included under Item 1A, the “Financial Condition” section of Management's Discussion and Analysis of Financial Condition and Results of Operations, or Management's Discussion and Analysis, included under Item 7, and our consolidated financial statements and accompanying notes included under Item 8, of this Form 10-K.
LINES OF BUSINESS
We have two lines of business: Investment Servicing and Investment Management.
Investment Servicing
Our Investment Servicing line of business performs core custody and related value-added
3
functions, such as providing institutional investors with clearing, payment and settlement services. Our financial services and products allow our large institutional investor clients to execute financial transactions on a daily basis in markets across the globe. As most institutional investors cannot economically or efficiently build their own technology and operational processes necessary to facilitate their global securities settlement needs, our role as a global trust and custody bank is generally to aid our clients to efficiently perform services associated with the clearing, settlement and execution of securities transactions and related payments.
Our investment servicing products and services include: custody; product- and participant-level accounting; daily pricing and administration; master trust and master custody; record-keeping; cash management; foreign exchange, brokerage and other trading services; securities finance; deposit and short-term investment facilities; loans and lease financing; investment manager and alternative investment manager operations outsourcing; and performance, risk and compliance analytics.
We provide mutual fund custody and accounting services in the U.S. We offer clients a broad range of integrated products and services, including accounting, daily pricing and fund administration. We service U.S. tax-exempt assets for corporate and public pension funds, and we provide trust and valuation services for daily-priced portfolios.
We are a service provider outside of the U.S. as well. In Germany, Italy, France and Luxembourg, we provide depotbank services (a fund oversight role created by regulation) for retail and institutional fund assets, as well as custody and other services to pension plans and other institutional clients. In the U.K., we provide custody services for pension fund assets and administration services for mutual fund assets. As of
December 31, 2014
, we serviced approximately $1.43 trillion of offshore assets in funds located primarily in Luxembourg, Ireland and the Cayman Islands. As of
December 31, 2014
, we serviced $1.34 trillion of assets under administration in the Asia/Pacific region, and in Japan, we serviced approximately 94% of the trust assets serviced by non-domestic trust banks.
We are an alternative asset servicing provider worldwide, servicing hedge, private equity and real estate funds. As of
December 31, 2014
, we had approximately $1.32 trillion of alternative assets under administration.
Investment Management
We provide our Investment Management services through State Street Global Advisors, or SSGA. SSGA provides a broad array of investment management, investment research and investment advisory services to corporations, public funds and other sophisticated investors. SSGA offers active and passive asset management strategies across equity, fixed-income and cash asset classes. Products are distributed directly and through intermediaries using a variety of investment vehicles, including exchange-traded funds, or ETFs, such as the SPDR
®
ETF brand.
Additional information about our lines of business is provided under “Line of Business Information” in Management's Discussion and Analysis included under Item 7, and in note
24
to the consolidated financial statements included under Item 8, of this Form 10-K.
COMPETITION
We operate in a highly competitive environment and face global competition in all areas of our business. Our competitors include a broad range of financial institutions and servicing companies, including other custodial banks, deposit-taking institutions, investment management firms, insurance companies, mutual funds, broker/dealers, investment banks, benefits consultants, business service and software companies and information services firms. As our businesses grow and markets evolve, we may encounter increasing and new forms of competition around the world.
We believe that many key factors drive competition in the markets for our business. For Investment Servicing, quality of service, economies of scale, technological expertise, quality and scope of sales and marketing, required levels of capital and price drive competition, and are critical to our servicing business. For Investment Management, key competitive factors include expertise, experience, availability of related service offerings, quality of service and performance, and price.
Our competitive success may depend on our ability to develop and market new and innovative services, to adopt or develop new technologies, to bring new services to market in a timely fashion at competitive prices, to continue and expand our relationships with existing clients, and to attract new clients.
SUPERVISION AND REGULATION
State Street is registered with the Board of Governors of the Federal Reserve System, which we refer to as the Federal Reserve, as a bank holding company pursuant to the Bank Holding Company Act
4
of 1956. The Bank Holding Company Act limits the activities in which we and our non-banking subsidiaries may engage to those that the Federal Reserve considers to be closely related to banking, or to managing or controlling banks. These limits also apply to non-banking entities that we are deemed to “control” for purposes of the Bank Holding Company Act, which may include companies of which we own or control more than 5% of a class of voting shares. The Federal Reserve may order a bank holding company to terminate any activity, or its ownership or control of a non-banking subsidiary, if the Federal Reserve finds that the activity, ownership or control constitutes a serious risk to the financial safety, soundness or stability of a banking subsidiary or is inconsistent with sound banking principles or statutory purposes. The Bank Holding Company Act also requires a bank holding company to obtain prior approval of the Federal Reserve before it acquires substantially all the assets of any bank, or ownership or control of more than 5% of the voting shares of any bank.
The parent company is qualified as, and has elected to become, a financial holding company, which increases to some extent the scope of activities in which it may engage. A financial holding company and the entities under its control are permitted to engage in activities considered “financial in nature” as defined by the Bank Holding Company Act and the Federal Reserve’s implementing rules and interpretations, and therefore State Street may engage in a broader range of activities than permitted for bank holding companies and their subsidiaries that have not elected to become financial holding companies. Financial holding companies may engage directly or indirectly in activities that are defined to be financial in nature, either de novo or by acquisition, provided that the financial holding company gives the Federal Reserve after-the-fact notice of the new activities. Activities defined to be financial in nature include, but are not limited to, the following: providing financial or investment advice; underwriting; dealing in or making markets in securities; making merchant banking investments, subject to significant limitations; and any activities previously found by the Federal Reserve to be closely related to banking. In order to maintain our status as a financial holding company, we and each of our depository institution subsidiaries must be well capitalized and well managed, as defined in applicable regulations and determined in part by the results of regulatory examinations, and must comply with Community
Reinvestment Act obligations. Failure to maintain these standards may ultimately permit the Federal Reserve to take enforcement actions against us and restrict our ability to engage in activities defined to be financial in nature. Currently,
under the Bank Holding Company Act, we may not be able to engage in new activities or acquire shares or control of other businesses.
The Dodd-Frank Act, which became law in July 2010, has had, and will continue to have, a significant effect on the regulatory structure of the financial markets and supervision of bank holding companies, banks and other financial institutions. The Dodd-Frank Act, among other things: established the Financial Stability Oversight Council, or FSOC, to monitor systemic risk posed by financial institutions; enacted new restrictions on proprietary trading and private-fund investment activities by banks and their affiliates, commonly known as the “Volcker rule” (refer to our discussion of the Volcker rule provided below under “Regulatory Capital Adequacy and Liquidity Standards” in this “Supervision and Regulation” section); created a new framework for the regulation of derivatives and the entities that engage in derivatives trading; altered the regulatory capital treatment of trust preferred and other hybrid capital securities; revised the assessment base that is used by the Federal Deposit Insurance Corporation, or FDIC, to calculate deposit insurance premiums; and required large financial institutions to develop plans for their resolution under the U.S. Bankruptcy Code (or other specifically applicable insolvency regime) in the event of material financial distress or failure.
Another aspect of the Dodd-Frank Act is its adoption of capital planning and stress test requirements for large bank holding companies, including us. We are required by the Federal Reserve to conduct periodic stress testing of our business operations and to develop an annual capital plan as part of the Federal Reserve’s Comprehensive Capital Analysis and Review process. That process is used by the Federal Reserve to evaluate our management of capital, the adequacy of our regulatory capital and the potential requirement for us to maintain capital levels above regulatory minimums. Before making any capital distribution, including stock purchases and dividends, we must receive no objection to our capital plan from the Federal Reserve. This could require us to revise our stress-testing or capital management approaches, resubmit our capital plan or postpone, cancel or alter our planned capital actions. In addition, changes in our strategy, merger or acquisition activity or unanticipated uses of capital could result in a change in our capital plan and its associated capital actions, and may require resubmission of the capital plan to the Federal Reserve for its non-objection. For additional information regarding capital planning and stress test requirements and restrictions on dividends, refer to “”Capital Planning, Stress Tests and Dividends” in this “Supervision and Regulation” section and “Item 5. Market for Registrant’s Common
5
Equity, Related Stockholder Matters and Issuer Purchase of Equity Securities” in Part II of this Form 10-K.
In addition, regulatory change is being implemented internationally with respect to financial institutions, including, but not limited to, the implementation of the Basel III final rule (refer to “Regulatory Capital Adequacy and Liquidity Standards” below in this “Supervision and Regulation” section and “Financial Condition - Capital” in Management's Discussion and Analysis included under Item 7 of this Form 10-K for a discussion of Basel III) and the Alternative Investment Fund Managers Directive, or AIFMD, the European Market Infrastructure Resolution, or EMIR, revisions to the European collective investment fund, or UCITS, directive, revisions to the Markets in Financial Instruments Directive, or MIFID, and ongoing review of European Union data protection regulation.
Many aspects of our business are subject to regulation by other U.S. federal and state governmental and regulatory agencies and self-regulatory organizations (including securities exchanges), and by non-U.S. governmental and regulatory agencies and self-regulatory organizations. Some aspects of our public disclosure, corporate governance principles and internal control systems are subject to the Sarbanes-Oxley Act of 2002, the Dodd-Frank Act and regulations and rules of the SEC and the New York Stock Exchange.
Regulatory Capital Adequacy and Liquidity Standards
Like other U.S. bank holding companies, we and our depository institution subsidiaries are subject to the current U.S. minimum risk-based capital and leverage ratio guidelines, referred to as Basel III. As noted above, the status of our parent company as a financial holding company also requires that we and our depository institution subsidiaries maintain specified regulatory capital ratio levels. As of
December 31, 2014
, our regulatory capital levels on a consolidated basis, and the regulatory capital levels of State Street Bank, our principal banking subsidiary, exceeded the currently applicable minimum capital requirements under Basel III and the requirements we must meet for the parent company to qualify as a financial holding company.
The U.S. Basel III final rule replaced the Basel I- and Basel II-based capital regulations in the United States. As an “advanced approaches” banking organization (refer to the “Financial Condition - Capital” section of Management's Discussion and Analysis included under Item 7 of this Form 10-K for a discussion of advanced approaches), State Street became subject to the U.S. Basel III final rule beginning on January 1, 2014. However, certain
aspects of the U.S. Basel III final rule, including the new minimum risk-based and leverage capital ratios, capital buffers, regulatory adjustments and deductions and revisions to the calculation of risk-weighted assets under the so-called “standardized approach,” will commence at a later date or be phased in over several years.
Among other things, the U.S. Basel III final rule introduces a minimum common equity tier 1 risk-based capital ratio of 4.5%, raises the minimum tier 1 risk-based capital ratio from 4% to 6%, and, for advanced approaches banking organizations such as State Street, imposes a minimum supplementary tier 1 leverage ratio of 3%, the numerator of which is tier 1 capital and the denominator of which includes both on-balance sheet assets and certain off-balance sheet exposures. In addition to the supplementary leverage ratio, State Street is subject to a minimum tier 1 leverage ratio of 4%, which differs from the supplementary leverage ratio primarily in that the denominator of the tier 1 leverage ratio is quarterly average on-balance sheet assets.
The U.S. Basel III final rule also introduces a capital conservation buffer and a countercyclical capital buffer that add to the minimum risk-based capital ratios. Specifically, the final rule limits a banking organization’s ability to make capital distributions and discretionary bonus payments to executive officers if it fails to maintain a common equity tier 1 capital conservation buffer of more than 2.5% of total risk-weighted assets and, if deployed during periods of excessive credit growth, a common equity tier 1 countercyclical capital buffer of up to 2.5% of total risk-weighted assets, above each of the minimum common equity tier 1, and tier 1 and total risk-based capital ratios. Banking regulators have initially set the countercyclical capital buffer at zero.
To maintain the status of our parent company as a financial holding company, we and our insured depository institution subsidiaries are required to be “well-capitalized” by maintaining capital ratios above the minimum requirements. Effective on January 1, 2015, the “well-capitalized” standard for our banking subsidiaries was revised to reflect the higher capital requirements in the U.S. Basel III final rule.
In addition to introducing new capital ratios and buffers, the U.S. Basel III final rule revises the eligibility criteria for regulatory capital instruments and provides for the phase-out of existing capital instruments that do not satisfy the new criteria. For example, existing trust preferred capital securities are being phased out from tier 1 capital over a two-year period beginning on January 1, 2014 and ending on January 1, 2016, and subsequently, the qualification of these securities as tier 2 capital will be phased out over a multi-year transition period beginning on
6
January 1, 2016 and ending on January 1, 2022. We had trust preferred capital securities of
$475 million
outstanding as of
December 31, 2014
.
Under the U.S. Basel III final rule, certain new items are deducted from common equity tier 1 capital and certain regulatory capital deductions were modified as compared to the previously applicable capital regulations. Among other things, the final rule requires significant investments in the common stock of unconsolidated financial institutions, as defined, and certain deferred tax assets that exceed specified individual and aggregate thresholds to be deducted from common equity tier 1 capital. As an advanced approaches banking organization, after-tax unrealized gains and losses on investment securities classified as available for sale, which are excluded from tier 1 capital under Basel I and Basel II, flow through to and affect State Street’s and State Street Bank's common equity tier 1 capital, subject to a phase-in schedule.
On January 1, 2015, the U.S. Basel III final rule replaced the existing Basel I-based approach for calculating risk-weighted assets with the U.S. Basel III standardized approach that, among other things, modifies certain existing risk weights and introduces new methods for calculating risk-weighted assets for certain types of assets and exposures. The final rule also revised the Basel II-based advanced approaches capital rules to implement Basel III and certain provisions of the Dodd-Frank Act.
On February 21, 2014, we were notified by the Federal Reserve that we had completed our parallel run period. Consequently, since the second quarter of 2014, we are required to use the advanced approaches framework as provided in the Federal Reserve's July 2013 Basel III final rule in the determination of our risk-based capital requirements. The Dodd-Frank Act applies a "capital floor" to advanced approaches banking organizations, such as
State Street and State Street Bank. As of January 1, 2015, the Basel III standardized approach acts as that capital floor. As a result, we are required to calculate our risk-based capital ratios under both the Basel III advanced approach and the Basel III standardized approach, and we are subject to the more stringent of the risk-based capital ratios calculated under the standardized approach and those calculated under the advanced approach in the assessment of our capital adequacy under the prompt corrective action framework.
In addition to the U.S. Basel III final rule, the Dodd-Frank Act requires the Federal Reserve to establish more stringent capital requirements for large bank holding companies, including State Street. The Federal Reserve has addressed this requirement by, among other things, proposing to implement the Basel Committee’s capital surcharge for “global
systemically important banks,” or G-SIBs. Specifically, on December 9, 2014, the Federal Reserve issued a proposed rulemaking to establish a risk-based capital surcharge for U.S. G-SIBs, such as State Street. Under the proposed rule, a G-SIB’s capital conservation buffer would be increased by the amount of the capital surcharge, using the higher surcharge as determined under two proposed methods. The first proposed method would consider a G-SIB’s size, interconnectedness, cross-jurisdictional activity, substitutability, and complexity, whereas the second proposed method would replace substitutability with use of short-term wholesale funding. If the rulemaking is finalized as proposed,
the capital surcharge could be higher for U.S. G-SIB's than the capital surcharge as determined under the framework proposed by the Basel Committee. Under the proposed rule, the capital surcharge would be
phased in beginning in 2016 and would become fully effective on January 1, 2019. State Street is assessing the impact of the capital surcharge that would result if the proposed rule were implemented and the effects of maintaining capital levels necessary to meet the surcharge could be material.
In November 2014, the Financial Stability Board, or FSB, published a consultative document with a proposal to enhance the total loss-absorbing capacity, or TLAC, of G-SIBs in resolution. The proposal calls for G-SIBs to maintain TLAC in excess of prescribed minimum thresholds. TLAC would include regulatory capital and liabilities that can be written down or converted into equity during resolution. At a minimum, each G-SIB would need to hold TLAC in an amount equivalent to between 16% and 20% of its risk-weighted assets (plus applicable regulatory buffers) or at least twice the relevant Basel III tier 1 leverage ratio requirement. The proposal states that G-SIBs will not be expected to meet TLAC requirements before January 1, 2019. The FSB is expected to finalize its proposal in late 2015. U.S. banking regulators have not yet issued a proposal to implement TLAC requirements.
Supplementary Leverage Ratio Framework
On April 8, 2014, U.S. banking regulators issued a final rule enhancing the supplementary leverage ratio, or SLR, standards for U.S. G-SIB’s, such as State Street, and their insured depository institution subsidiaries, such as State Street Bank. We refer to this final rule as the eSLR final rule. Under the eSLR final rule, upon implementation on January 1, 2018, State Street Bank must maintain an SLR of at least 6% to be well capitalized under the U.S. banking regulators’ prompt corrective action provisions. The eSLR final rule also provides that if State Street maintains an SLR greater than 5%, it is not subject to limitations on distributions and discretionary bonus
7
payments under the eSLR final rule, but could continue to be under other provisions of the Basel III final rule, including risk-based capital ratio requirements.
On September 3, 2014, U.S. banking regulators issued a final rule modifying the definition of the denominator of the SLR in a manner consistent with recent changes agreed to by the Basel Committee. The revisions to the SLR apply to all banking organizations subject to the advanced approaches provisions of the Basel III final rule, such as State Street. Specifically, the SLR final rule modifies the methodology for including off-balance
sheet assets, including credit derivatives, repo-style transactions, and commitments and guarantees, in the denominator of the SLR, and requires banking organizations to calculate their total leverage exposure using daily averages for on-balance sheet assets and the average of three month-end calculations for off-balance sheet exposures. Certain
public disclosures required by the SLR final rule must be provided beginning with the first quarter of 2015, and the minimum SLR requirement using the SLR final rule’s denominator calculations is effective beginning on January 1, 2018.
Liquidity Coverage Ratio and Net Stable Funding Ratio
In addition to capital standards, the Basel III final rule introduced two quantitative liquidity standards: the liquidity coverage ratio, or LCR, and the net stable funding ratio, or NSFR.
The LCR requires banking organizations to maintain a minimum amount of liquid assets to withstand a short-term liquidity stress period of thirty days. It is intended to promote the short-term resilience of the liquidity risk profile of internationally active banking organizations, improve the banking industry's ability to absorb shocks arising from financial and economic stress, and improve the measurement and management of liquidity risk. On September 3, 2014, U.S. banking regulators issued a final rule to implement the Basel Committee's LCR in the U.S.
The LCR measures an institution's high-quality liquid assets, or HQLA, against its net cash outflows. The LCR will be phased in, as originally proposed, beginning on January 1, 2015, at 80%, with full implementation beginning on January 1, 2017.
Beginning with January 2015, State Street is required to report its LCR to the Federal Reserve on a monthly basis. Daily reporting of the LCR to the Federal Reserve will be required beginning with July 2015.
The LCR final rule is largely similar to the proposed rule issued by U.S. banking regulators in
October 2013; however, the final rule contains several changes and clarifications, including revisions to the definition of operational deposits and more favorable foreign exchange netting treatment, both of which we expect to benefit our LCR ratio, and the exclusion as operational deposits of deposits from non-regulated funds, which we expect to negatively affect our LCR ratio.
Compliance with the LCR has required that we maintain an investment portfolio that contains an adequate amount of HQLA. In general, HQLA investments generate a lower investment return than other the types of investments, resulting in a negative impact on our net interest revenue and our net interest margin. In addition, the level of HQLA we are required to maintain under the LCR is dependent upon our client relationships and the nature of services we provide, which may change over time. For example, if the percentage of our operational deposits relative to non-operational deposits increases, we would expect to require less HQLA in order to maintain our LCR. Conversely, if the percentage of non-operational deposits increases relative to our operational deposits, we would expect to require additional HQLA in order to maintain our LCR.
In October 2014, the Basel Committee issued final guidance with respect to the NSFR. The NSFR will require banking organizations to maintain a stable funding profile relative to the composition of their assets and off-balance sheet activities. The NSFR limits over-reliance on short-term wholesale funding, encourages better assessment of funding risk across all on- and off-balance sheet exposures, and promotes funding stability. The final guidance establishes a one-year liquidity standard representing the proportion of long-term assets funded by long-term stable funding, with the NSFR scheduled to become a minimum standard beginning on January 1, 2018.
We are reviewing the specifics of the final guidance and will evaluate the U.S. implementation of this standard to analyze its impact and develop strategies for compliance. U.S. banking regulators have not yet issued a proposal to implement the NSFR.
Failure to meet current and future regulatory capital requirements could subject us to a variety of enforcement actions, including the termination of State Street Bank's deposit insurance by the FDIC, and to certain restrictions on our business, including those that are described above in this “Supervision and Regulation” section.
For additional information about our regulatory capital position and our regulatory capital adequacy, as well as current and future regulatory capital
8
requirements, refer to “Financial Condition - Capital” in Management's Discussion and Analysis included under Item 7, and note
15
to the consolidated financial statements included under Item 8, of this Form 10-K.
Capital Planning, Stress Tests and Dividends
Pursuant to the Dodd-Frank Act, the Federal Reserve has adopted capital planning and stress test requirements for large bank holding companies, including us, which form part of the Federal Reserve’s annual Comprehensive Capital Analysis and Review, or CCAR, framework. Under the Federal Reserve’s capital plan final rule, we must submit an annual capital plan to the Federal Reserve, taking into account the results of separate stress tests designed by us and by the Federal Reserve.
The capital plan must include a description of all of our planned capital actions over a nine-quarter planning horizon, including any issuance of debt or equity capital instruments, any capital distribution, such as payments of dividends on, or purchases of, our stock, and any similar action that the Federal Reserve determines could affect our consolidated capital. The capital plan must include a discussion of how we will maintain capital above the minimum regulatory capital ratios, including the minimum ratios under the U.S. Basel III final rule that are phased in over the planning horizon, and serve as a source of strength to our U.S. depository institution subsidiaries under supervisory stress scenarios. The capital plan requirements mandate that we receive no objection to our plan from the Federal Reserve before making a capital distribution. In addition, even with a capital plan for which we have received no objection from the Federal Reserve, we must seek the approval of the Federal Reserve before making a capital distribution if, among other reasons, we would not meet our regulatory capital requirements after making the proposed capital distribution.
In addition to its capital planning requirements, the Federal Reserve has the authority to prohibit or to limit the payment of dividends by the banking organizations it supervises, including us and State Street Bank, if, in the Federal Reserve’s opinion, the payment of a dividend would constitute an unsafe or unsound practice in light of the financial condition of the banking organization. All of these policies and other requirements could affect our ability to pay dividends and purchase our stock, or require us to provide capital assistance to State Street Bank and any other banking subsidiary.
We expect that, by March 31, 2015, the Federal Reserve will either provide a notice of non-objection or object to our 2015 capital plan, which we submitted to the Federal Reserve in January 2015.
In October 2012, the Federal Reserve issued a final rule to implement its capital stress-testing requirements under the Dodd-Frank Act that require us to conduct semi-annual State Street-run stress tests. Under this rule, we are required to publicly disclose the summary results of our State Street-run stress tests under the severely adverse economic scenario. In September 2014, we provided summary results of our 2014 semi-annual State Street-run stress tests on the “Investor Relations” section of our corporate website. The rule also subjects us to an annual supervisory stress test conducted by the Federal Reserve.
The Dodd-Frank Act also requires State Street Bank to conduct an annual stress test. State Street Bank submitted its 2015 annual State Street Bank-run stress test to the Federal Reserve in January 2015.
The Volcker Rule
In December 2013, U.S. regulators issued final regulations to implement the Volcker rule. The Volcker rule will, over time, prohibit banking entities, including us and our affiliates, from engaging in certain prohibited proprietary trading activities, as defined in the final Volcker rule regulations, subject to exemptions for market making-related activities, risk-mitigating hedging, underwriting and certain other activities. The Volcker rule will also require banking entities to either restructure or divest certain ownership interests in, and relationships with, covered funds (as such terms are defined in the final Volcker rule regulations).
The Volcker rule became effective on July 21, 2012, and the final implementing regulations became effective on April 1, 2014. In the absence of an applicable extension of the Volcker rule’s general conformance period, a banking entity must bring its activities and investments into conformance with the Volcker rule and its final implementing regulations by July 21, 2015. In December 2014, the Federal Reserve issued an order, the 2016 conformance period extension, extending the Volcker rule’s general conformance period until July 21, 2016 for investments in and relationships with covered funds and certain foreign funds that were in place on or prior to December 31, 2013, referred to as legacy covered funds. Under the 2016 conformance period extension, all investments in and relationships related to investments in a covered fund made or entered into after that date by a banking entity and its affiliates, and all proprietary trading activities of those entities, must be in conformance with the Volcker rule and its final implementing regulations by July 21, 2015. The Federal Reserve stated in the 2016 conformance period extension that it intends to grant a final one-year extension of the general conformance period, to July 21, 2017, for banking
9
entities to conform ownership interests in and relationships with legacy covered funds.
Whether certain types of investment securities or structures, such as collateralized loan obligations, or CLOs, constitute covered funds, as defined in the final Volcker rule regulations, and do not benefit from the exemptions provided in the Volcker rule, and whether a banking organization's investments therein constitute ownership interests remain subject to (1) market, and ultimately regulatory, interpretation, and (2) the specific terms and other characteristics relevant to such investment securities and structures.
As of
December 31, 2014
, we held approximately
$4.54 billion
of investments in CLOs. As of the same date, these investments had an aggregate pre-tax net unrealized gain of approximately
$97 million
, composed of gross unrealized gains of
$105 million
and gross unrealized losses of
$8 million
. In the event that we or our banking regulators conclude that such investments in CLOs, or other investments, are covered funds, we may be required to divest of such investments. If other banking entities reach similar conclusions with respect to similar investments held by them, the prices of such investments could decline significantly, and we may be required to divest of such investments at a significant discount compared to the investments' book value. This could result in a material adverse effect on our consolidated results of operations in the period in which such a divestment occurs or on our consolidated financial condition.
We are reviewing our activities that are affected by the final Volcker rule regulations and are taking steps to bring those activities into conformity with the Volcker rule. The final Volcker rule regulations also require banking entities to establish extensive programs designed to ensure compliance with the restrictions of the Volcker rule. We are in the process of establishing the necessary compliance program to comply with the final Volcker rule regulations. Such compliance program will restrict our ability in the future to service certain types of funds, in particular covered funds for which SSGA acts as an advisor and certain types of trustee relationships. Consequently, Volcker rule compliance will entail both the cost of a compliance program and loss of certain revenue and future opportunities.
Enhanced Prudential Standards
The Dodd-Frank Act established a new regulatory framework to regulate banking organizations designated as “systemically important financial institutions,” or SIFIs, and has subjected them to heightened prudential standards, including heightened capital, leverage, liquidity and risk management requirements, single-counterparty credit limits and early remediation requirements. Bank
holding companies with $50 billion or more in consolidated assets, which includes us, became automatically subject to the systemic-risk regime in July 2010.
The FSOC, established by the Dodd-Frank Act as discussed earlier, can recommend prudential standards, reporting and disclosure requirements to the Federal Reserve for SIFIs, and must approve any finding by the Federal Reserve that a financial institution poses a grave threat to financial stability and must undertake mitigating actions. The FSOC is also empowered to designate systemically important payment, clearing and settlement activities of financial institutions, subjecting them to prudential supervision and regulation, and, assisted by the new Office of Financial Research within the U.S. Department of the Treasury, also established by the Dodd-Frank Act, can gather data and reports from financial institutions, including us.
In February 2014, the Federal Reserve approved a final rule implementing certain of the Dodd-Frank Act’s enhanced prudential standards for large bank holding companies such as State Street. Under the final rule, we will have to comply with various liquidity-related risk management standards and maintain a liquidity buffer of unencumbered highly liquid assets based on the results of internal liquidity stress testing. This liquidity buffer is in addition to other liquidity requirements, such as the LCR and, when implemented, the NSFR. The final rule also establishes requirements and responsibilities for our risk committee and mandates risk management standards. We became subject to these new standards on January 1, 2015. Final rules on single counterparty credit limits and an early termination framework have not yet been promulgated. Refer to the risk factor titled
“We assume significant credit risk to counterparties, many of which are major financial institutions. These financial institutions and other counterparties may also have substantial financial dependencies with other financial institutions and sovereign entities. This credit exposure and concentration could expose us to financial loss”
included under "Risk Factors" under Item 1A of this Form 10-K. In addition, the proposed rules would create a new early-remediation regime to address financial distress or material management weaknesses determined with reference to four levels of early remediation, including heightened supervisory review, initial remediation, recovery, and resolution assessment, with specific limitations and requirements tied to each level.
The systemic-risk regime also provides that, for institutions deemed to pose a grave threat to U.S. financial stability, the Federal Reserve, upon an FSOC vote, must limit that institution’s ability to
10
merge, restrict its ability to offer financial products, require it to terminate activities, impose conditions on activities or, as a last resort, require it to dispose of assets. Upon a grave-threat determination by the FSOC, the Federal Reserve must issue rules that require financial institutions subject to the systemic-risk regime to maintain a debt-to-equity ratio of no more than 15 to 1 if the FSOC considers it necessary to mitigate the risk of the grave threat. The Federal Reserve also has the ability to establish further standards, including those regarding contingent capital, enhanced public disclosures, and limits on short-term debt, including off-balance sheet exposures.
Resolution Planning
As required by the Dodd-Frank Act, the FDIC and the Federal Reserve jointly issued a final rule pursuant to which we are required to submit annually to the Federal Reserve and the FDIC a plan for our rapid and orderly resolution under the Bankruptcy Code (or other specifically applicable insolvency regime) in the event of material financial distress or failure, referred to as a resolution plan. The FDIC also issued a final rule pursuant to which State Street Bank is required to submit annually to the FDIC a plan for resolution in the event of its failure. We and State Street Bank submitted our most recent annual resolution plans to the Federal Reserve and the FDIC on July 1, 2014. In August 2014, the Federal Reserve and the FDIC announced the completion of their reviews of resolution plans submitted in 2013 by 11 large, complex banking organizations, including State Street, under the requirements of the Dodd-Frank Act, and informed each of these organizations of specific shortcomings with their respective 2013 resolution plans. If we fail to meet regulatory expectations to the satisfaction of the Federal Reserve and the FDIC in the submission of our 2015 resolution plan, we could be subject to more stringent capital, leverage or liquidity requirements, restrictions on our growth, activities or operations, or be required to divest certain of our assets or operations.
Orderly Liquidation Authority
Under the Dodd-Frank Act, certain financial companies, including bank holding companies such as State Street, and certain covered subsidiaries, can be subjected to a new orderly liquidation authority. The U.S. Treasury Secretary, in consultation with the President, must first make certain extraordinary financial distress and systemic risk determinations, and action must be recommended by two-thirds of the FDIC Board and two-thirds of the Federal Reserve Board. Absent such actions, we, as a bank holding company, would remain subject to the U.S. Bankruptcy Code.
The orderly liquidation authority went into effect in July 2010, and rulemaking is proceeding in stages, with some regulations now finalized and others planned but not yet proposed. If we were subject to the orderly liquidation authority, the FDIC would be appointed as our receiver, which would give the FDIC considerable powers to resolve us, including: (1) the power to remove officers and directors responsible for our failure and to appoint new directors and officers; (2) the power to assign assets and liabilities to a third party or bridge financial company without the need for creditor consent or prior court review; (3) the ability to differentiate among creditors, including by treating junior creditors better than senior creditors, subject to a minimum recovery right to receive at least what they would have received in bankruptcy liquidation; and (4) broad powers to administer the claims process to determine distributions from the assets of the receivership to creditors not transferred to a third party or bridge financial institution.
In December 2013, the FDIC released its proposed single-point-of-entry strategy for resolution of a SIFI under the orderly liquidation authority. The FDIC’s release outlines how it would use its powers under the orderly liquidation authority to resolve a SIFI by placing its top-tier U.S. holding company in receivership and keeping its operating subsidiaries open and out of insolvency proceedings by transferring the operating subsidiaries to a new bridge holding company, recapitalizing the operating subsidiaries and imposing losses on the shareholders and creditors of the holding company in receivership according to their statutory order of priority.
Derivatives
Title VII of the Dodd-Frank Act imposes a new regulatory structure on the over-the-counter derivatives market, including requirements for clearing, exchange trading, capital, margin, reporting and record-keeping. In addition, certain derivative activities are required to be pushed out of insured depository institutions and conducted in separately capitalized non-bank affiliates. Title VII also requires certain persons to register as a major swap participant, a swap dealer or a securities-based swap dealer. The Commodity Futures Trading Commission, or CFTC, the SEC and other U.S. regulators have adopted and are still in the process of adopting regulations to implement Title VII. Through this rulemaking process, these regulators collectively have adopted or proposed, among other things, regulations relating to reporting and record-keeping obligations, margin and capital requirements, the scope of registration and the central clearing and exchange trading requirements for certain over-the-counter derivatives. The CFTC has also issued rules to enhance the oversight of clearing and trading
11
entities. The CFTC, along with other regulators, including the Federal Reserve, are also in the process of proposing and finalizing additional rules, such as with respect to margin requirements for uncleared derivatives transactions.
State Street Bank has registered provisionally with the CFTC as a swap dealer. As a provisionally registered swap dealer, State Street Bank is subject to significant regulatory obligations regarding its swap activity and the supervision, examination and enforcement powers of the CFTC and other regulators. In December 2013, the CFTC granted State Street Bank a limited-purpose swap dealer designation. Under this limited-purpose designation, interest-rate swap activity engaged in by State Street Bank’s Global Treasury group is not subject to certain of the swap regulatory requirements otherwise applicable to swaps entered into by a registered swap dealer, subject to a number of conditions. For all other swap transactions, our swap activities remain subject to all applicable swap dealer regulations.
Money Market Funds
In July 2014, the SEC adopted amendments to the regulations governing money market funds to address potential systemic risks and improve transparency for money market fund investors. Among other things, the amendments require a floating net asset value for institutional prime money market funds (i.e., money market funds that are either not restricted to natural person investors or not restricted to investing primarily in U.S. government securities) and permit (and in some cases require) all money market funds to impose redemption fees and gates under certain circumstances. As a result of these reforms, money market funds may be required to take certain steps that will affect their structure and/or operations, which could in turn affect the liquidity, marketability and return potential of such funds. Full conformance with these amendments is required by October 14, 2016.
Money market reforms are also being considered in Europe. The timing and content of those regulations remains uncertain. The SEC's July 2014 amended regulations, and the potential reforms in Europe, could alter the business models of money market fund sponsors and asset managers, including many of our servicing clients and SSGA, and may result in reduced levels of investment in money market funds. As a result, these requirements may have an adverse impact on our business, our operations or our consolidated results of operations.
Subsidiaries
The Federal Reserve is the primary federal banking agency responsible for regulating us and our
subsidiaries, including State Street Bank, with respect to both our U.S. and non-U.S. operations.
Our banking subsidiaries are subject to supervision and examination by various regulatory authorities. State Street Bank is a member of the Federal Reserve System, its deposits are insured by the FDIC and it is subject to applicable federal and state banking laws and to supervision and examination by the Federal Reserve, as well as by the Massachusetts Commissioner of Banks, the FDIC, and the regulatory authorities of those states and countries in which State Street Bank operates a branch. Our other subsidiary trust companies are subject to supervision and examination by the Office of the Comptroller of the Currency, the Federal Reserve or by the appropriate state banking regulatory authorities of the states in which they are organized and operate. Our non-U.S. banking subsidiaries are subject to regulation by the regulatory authorities of the countries in which they operate. As of
December 31, 2014
, the capital of each of these banking subsidiaries exceeded the minimum legal capital requirements set by those regulatory authorities.
We and our subsidiaries that are not subsidiaries of State Street Bank are affiliates of State Street Bank under federal banking laws, which impose restrictions on various types of transactions, including loans, extensions of credit, investments or asset purchases by or from State Street Bank, on the one hand, to us and those of our subsidiaries, on the other. Transactions of this kind between State Street Bank and its affiliates are limited with respect to each affiliate to 10% of State Street Bank’s capital and surplus, as defined by the aforementioned banking laws, and to 20% in the aggregate for all affiliates, and in some cases are also subject to strict collateral requirements. Under the Dodd-Frank Act, effective in July 2012, derivatives, securities borrowing and securities lending transactions between State Street Bank and its affiliates became subject to these restrictions. The Dodd-Frank Act also expanded the scope of transactions required to be collateralized. In addition, the Volcker rule generally prohibits similar transactions between the parent company or any of its affiliates and covered funds for which we or any of our affiliates serve as the investment manager, investment adviser, commodity trading advisor or sponsor and other covered funds organized and offered pursuant to specific exemptions in the final Volcker rule regulations.
12
Federal law also requires that certain transactions with affiliates be on terms and under circumstances, including credit standards, that are substantially the same, or at least as favorable to the institution, as those prevailing at the time for comparable transactions involving other non-affiliated companies. Alternatively, in the absence of comparable transactions, the transactions must be on terms and under circumstances, including credit standards, that in good faith would be offered to, or would apply to, non-affiliated companies. State Street Bank is also prohibited from engaging in certain tie-in arrangements in connection with any extension of credit or lease or sale of property or furnishing of services. Federal law provides as well for a depositor preference on amounts realized from the liquidation or other resolution of any depository institution insured by the FDIC.
Our subsidiaries, SSGA Funds Management, Inc., or SSGA FM, and State Street Global Advisors Limited, or SSGA Ltd., act as investment advisers to investment companies registered under the Investment Company Act of 1940. SSGA FM, incorporated in Massachusetts in 2001 and headquartered in Boston, Massachusetts, is registered with the SEC as an investment adviser under the Investment Advisers Act of 1940 and is registered with the CFTC as a commodity trading adviser and pool operator. SSGA Ltd., incorporated in 1990 as a U.K. limited company and domiciled in the U.K., is also registered with the SEC as an investment adviser under the Investment Advisers Act of 1940. SSGA Ltd. is also authorized and regulated by the U.K. Financial Conduct Authority, or FCA, and is an investment firm under the Markets in Financial Instruments Directive. SSGA FM and SSGA Ltd. each offer a variety of investment management solutions, including active, enhanced and passive equity, active and passive fixed-income, cash management, multi-asset class solutions and real estate. In addition, a major portion of our investment management activities are conducted by State Street Bank, which is subject to supervision primarily by the Federal Reserve with respect to these activities.
Our U.S. broker/dealer subsidiary is registered as a broker/dealer with the SEC, is subject to regulation by the SEC (including the SEC’s net capital rule) and is a member of the Financial Industry Regulatory Authority, a self-regulatory organization. The U.K. broker/dealer business operates through our subsidiary, State Street Global Markets International Limited, which is registered in the U.K. as a regulated securities broker, is authorized and regulated by the FCA and is an investment firm under the Market in Financial Instruments Directive. It is also a member of the London Stock Exchange. In accordance with the rules of the FCA, the U.K.
broker/dealer publishes information on its risk management objectives and on policies associated with its regulatory capital requirements and resources. Many aspects of our investment management activities are subject to federal and state laws and regulations primarily intended to benefit the investment holder, rather than our shareholders.
Our activities as a futures commission merchant are subject to regulation by the CFTC in the U.S. and various regulatory authorities internationally, as well as the membership requirements of the applicable clearinghouses. In addition, we have a subsidiary registered with the CFTC as a swap execution facility, and our U.S. broker/dealer subsidiary also offers a U.S. equities alternative trading system registered with the SEC.
These laws and regulations generally grant supervisory agencies and bodies broad administrative powers, including the power to limit or restrict us from conducting our investment management activities in the event that we fail to comply with such laws and regulations, and examination authority. Our business related to investment management and trusteeship of collective trust funds and separate accounts offered to employee benefit plans is subject to the Employee Retirement Income Security Act, or ERISA, and is regulated by the U.S. Department of Labor.
Our businesses, including our investment management and securities and futures businesses, are also regulated extensively by non-U.S. governments, securities exchanges, self-regulatory organizations, central banks and regulatory bodies, especially in those jurisdictions in which we maintain an office. For instance, among others, the FCA, the Prudential Regulatory Authority and the Bank of England regulate our activities in the U.K.; the Central Bank of Ireland regulates our activities in Ireland; the Commission de Surveillance du Secteur Financier regulates our activities in Luxembourg; the Australian Prudential Regulation Authority and the Australian Securities and Investments Commission regulate our activities in Australia; and the Financial Services Agency and the Bank of Japan regulate our activities in Japan. We have established policies, procedures, and systems designed to comply with the requirements of these organizations. However, as a global financial services institution, we face complexity and costs related to regulation.
The majority of our non-U.S. asset servicing operations are conducted pursuant to the Federal Reserve's Regulation K through State Street Bank’s Edge Act subsidiary or through international branches of State Street Bank. An Edge Act corporation is a corporation organized under federal law that conducts foreign business activities. In general, banks may not
13
make investments in their Edge Act corporations (and similar state law corporations) that exceed 20% of their capital and surplus, as defined, and the investment of any amount in excess of 10% of capital and surplus requires the prior approval of the Federal Reserve.
In addition to our non-U.S. operations conducted pursuant to Regulation K, we also make new investments abroad directly (through us or through our non-banking subsidiaries) pursuant to the Federal Reserve's Regulation Y, or through international bank branch expansion, which are not subject to the investment limitations applicable to Edge Act subsidiaries.
Additionally, Massachusetts has its own bank holding company statute, under which State Street, among other things, may be required to obtain prior approval by the Massachusetts Board of Bank Incorporation for an acquisition of more than 5% of any additional bank's voting shares, or for other forms of bank acquisitions.
Anti-Money Laundering and Financial Transparency
We and certain of our subsidiaries are subject to the Bank Secrecy Act of 1970, as amended by the USA PATRIOT Act of 2001, which contains anti-money laundering, or AML, and financial transparency provisions and requires implementation of regulations applicable to financial services companies, including standards for verifying client identification and monitoring client transactions and detecting and reporting suspicious activities. AML laws outside the U.S. contain similar requirements. We have implemented policies, procedures and internal controls that are designed to comply with all applicable AML laws and regulations. Compliance with applicable AML and related requirements is a common area of review for financial regulators, and our level of compliance with these requirements could result in fines, penalties, lawsuits, regulatory sanctions or difficulties in obtaining approvals, restrictions on our business activities or harm to our reputation.
Deposit Insurance
FDIC-insured depository institutions are required to pay deposit insurance assessments to the FDIC. The Dodd-Frank Act made permanent the general $250,000 deposit insurance limit for insured deposits.
The FDIC’s Deposit Insurance Fund, or DIF, is funded by assessments on insured depository institutions. The FDIC assesses DIF premiums based on an insured depository institution's average consolidated total assets, less the average tangible equity of the insured depository institution during the
assessment period. For larger institutions, such as State Street Bank, assessments are determined based on regulatory ratings and forward-looking financial measures to calculate the assessment rate, which is subject to adjustments by the FDIC, and the assessment base.
The Dodd-Frank Act also directed the FDIC to determine whether and to what exten
t
adjustments to the assessment base are appropriate for “custody banks.” The FDIC has concluded that certain liquid assets could be excluded from the deposit insurance assessment base of custody banks that satisfy specified institutional eligibility criteria. This has the effect of reducing the amount of DIF insurance premiums due from custody banks. State Street Bank is a custody bank for this purpose. The custody bank assessment adjustment may not exceed total transaction account deposits identified by the institution as being directly linked to a fiduciary or custody and safekeeping asset.
Prompt Corrective Action
The FDIC Improvement Act of 1991 requires the appropriate federal banking regulator to take “prompt corrective action” with respect to a depository institution if that institution does not meet certain capital adequacy standards. While these regulations apply only to banks, such as State Street Bank, the Federal Reserve is authorized to take appropriate action against a parent bank holding company, such as our parent company, based on the under-capitalized status of any banking subsidiary. In certain instances, we would be required to guarantee the performance of the capital restoration plan for our under-capitalized banking subsidiary.
Support of Subsidiary Banks
Under Federal Reserve regulations, a bank holding company such as our parent company is required to act as a source of financial and managerial strength to its banking subsidiaries. This requirement was added to the Federal Deposit Insurance Act by the Dodd-Frank Act and means that we are expected to commit resources to State Street Bank and any other banking subsidiary in circumstances in which we otherwise might not do so absent such a requirement. In the event of bankruptcy, any commitment by us to a federal bank regulatory agency to maintain the capital of a banking subsidiary will be assumed by the bankruptcy trustee and will be entitled to a priority payment.
Insolvency of an Insured U.S. Subsidiary Depository Institution
If the FDIC is appointed the conservator or receiver of an FDIC-insured U.S. subsidiary depository institution, such as State Street Bank, upon its insolvency or certain other events, the FDIC
14
has the ability to transfer any of the depository institution’s assets and liabilities to a new obligor without the approval of the depository institution’s creditors, enforce the terms of the depository institution’s contracts pursuant to their terms or repudiate or disaffirm contracts or leases to which the depository institution is a party. Additionally, the claims of holders of deposit liabilities and certain claims for administrative expenses against an insured depository institution would be afforded priority over
other general unsecured claims against such an institution, including claims of debt holders of the institution and, under current interpretation, depositors in non-U.S. offices, in the liquidation or other resolution of such an institution by any receiver. As a result, such persons would be treated differently from and could receive, if anything, substantially less than the depositors in U.S. offices of the depository institution.
ECONOMIC CONDITIONS AND GOVERNMENT POLICIES
Economic policies of the U.S. government and its agencies influence our operating environment. Monetary policy conducted by the Federal Reserve directly affects the level of interest rates, which may affect overall credit conditions of the economy. Monetary policy is applied by the Federal Reserve through open market operations in U.S. government securities, changes in reserve requirements for depository institutions, and changes in the discount rate and availability of borrowing from the Federal Reserve. Government regulation of banks and bank holding companies is intended primarily for the protection of depositors of the banks, rather than for the shareholders of the institutions and therefore may, in some cases, be adverse to the interests of those shareholders. We are similarly affected by the economic policies of non-U.S. government agencies, such as the European Central Bank, or ECB.
STATISTICAL DISCLOSURE BY BANK HOLDING COMPANIES
The following information, included under Items 6, 7 and 8 of this Form 10-K, is incorporated by reference herein:
“Selected Financial Data” table (Item 6) - presents return on average common equity, return on average assets, common dividend payout and equity-to-assets ratios.
“Distribution of Average Assets, Liabilities and Shareholders’ Equity; Interest Rates and Interest Differential” table (Item 8) - presents consolidated average balance sheet amounts, related fully taxable-equivalent interest earned and paid, related average yields and rates paid and changes in fully taxable-equivalent interest revenue and interest expense for
each major category of interest-earning assets and interest-bearing liabilities.
“Investment Securities” section included in Management's Discussion and Analysis (Item 7) and note
3
, “Investment Securities,” to the consolidated financial statements (Item 8) - disclose information regarding book values, market values, maturities and weighted-average yields of securities (by category).
Note
4
, “Loans and Leases,” to the consolidated financial statements (Item 8) - discloses our policy for placing loans and leases on non-accrual status.
“Loans and Leases” section included in Management’s Discussion and Analysis (Item 7) and note
4
, “Loans and Leases,” to the consolidated financial statements (Item 8) - discloses distribution of loans, loan maturities and sensitivities of loans to changes in interest rates.
“Loans and Leases” and “Cross-Border Outstandings” sections of Management’s Discussion and Analysis (Item 7) - discloses information regarding cross-border outstandings and other loan concentrations of State Street.
“Credit Risk Management” section included in Management’s Discussion and Analysis (Item 7) and note
4
, “Loans and Leases,” to the consolidated financial statements (Item 8) - present the allocation of the allowance for loan losses, and a description of factors which influenced management’s judgment in determining amounts of additions or reductions to the allowance, if any, charged or credited to results of operations.
“Distribution of Average Assets, Liabilities and Shareholders’ Equity; Interest Rates and Interest Differential” table (Item 8) - discloses deposit information.
Note
8
, “Short-Term Borrowings,” to the consolidated financial statements (Item 8) - discloses information regarding short-term borrowings of State Street.
Forward-Looking Statements
This Form 10-K, as well as other reports submitted by us under the Securities Exchange Act of 1934, registration statements filed by us under the Securities Act of 1933, our annual report to shareholders and other public statements we may make, contain statements (including statements in the Management's Discussion and Analysis included under Item 7 of this Form 10-K) that are considered “forward-looking statements” within the meaning of U.S. securities laws, including statements about our goals and expectations regarding our business, financial and capital condition, results of operations,
15
strategies, financial portfolio performance, dividend and stock purchase programs, expected outcomes of legal proceedings, market growth, acquisitions, joint ventures and divestitures and new technologies, services and opportunities, as well as regarding industry, regulatory, economic and market trends, initiatives and developments, the business environment and other matters that do not relate strictly to historical facts.
Terminology such as “plan,” “expect,” “intend,” “objective,” “forecast,” “outlook,” “believe,” “anticipate,” “estimate,” “seek,” “may,” “will,” “trend,” “target,” “strategy” and “goal,” or similar statements or variations of such terms, are intended to identify forward-looking statements, although not all forward-looking statements contain such terms.
Forward-looking statements are subject to various risks and uncertainties, which change over time, are based on management's expectations and assumptions at the time the statements are made, and are not guarantees of future results. Management's expectations and assumptions, and the continued validity of the forward-looking statements, are subject to change due to a broad range of factors affecting the national and global economies, regulatory environment and the equity, debt, currency and other financial markets, as well as factors specific to State Street and its subsidiaries, including State Street Bank. Factors that could cause changes in the expectations or assumptions on which forward-looking statements are based cannot be foreseen with certainty and include, but are not limited to:
|
•
|
the financial strength and continuing viability of the counterparties with which we or our clients do business and to which we have investment, credit or financial exposure, including, for example, the direct and indirect effects on counterparties of the sovereign-debt risks in the U.S., Europe and other regions;
|
|
•
|
increases in the volatility of, or declines in the level of, our net interest revenue, changes in the composition or valuation of the assets recorded in our consolidated statement of condition (and our ability to measure the fair value of investment securities) and the possibility that we may change the manner in which we fund those assets;
|
|
•
|
the liquidity of the U.S. and international securities markets, particularly the markets for fixed-income securities and inter-bank credits, and the liquidity requirements of our clients;
|
|
•
|
the level and volatility of interest rates, the valuation of the U.S. dollar relative to other currencies in which we record revenue or accrue expenses and the performance and volatility of securities, credit, currency and other markets in the U.S. and internationally;
|
|
•
|
the credit quality, credit-agency ratings and fair values of the securities in our investment securities portfolio, a deterioration or downgrade of which could lead to other-than-temporary impairment of the respective securities and the recognition of an impairment loss in our consolidated statement of income;
|
|
•
|
our ability to attract deposits and other low-cost, short-term funding, the relative portion of our deposits that are determined to be operational under regulatory guidelines and our ability to deploy deposits in a profitable manner consistent with our liquidity requirements and risk profile;
|
|
•
|
the manner and timing with which the Federal Reserve and other U.S. and foreign regulators implement changes to the regulatory framework applicable to our operations, including implementation of the Dodd-Frank Act, the Basel III final rule and European legislation (such as the Alternative Investment Fund Managers Directive and Undertakings for Collective Investment in Transferable Securities Directives); among other consequences, these regulatory changes impact the levels of regulatory capital we must maintain, acceptable levels of credit exposure to third parties, margin requirements applicable to derivatives, and restrictions on banking and financial activities. In addition, our regulatory posture and related expenses have been and will continue to be affected by changes in regulatory expectations for global systemically important financial institutions applicable to, among other things, risk management, capital planning and compliance programs, and changes in governmental enforcement approaches to perceived failures to comply with regulatory or legal obligations;
|
|
•
|
adverse changes in the regulatory ratios that we are required or will be required to meet, whether arising under the Dodd-Frank Act or the Basel III final rule, or due to changes in regulatory positions, practices or regulations in jurisdictions in which we engage in banking activities, including changes in internal or external data, formulae, models, assumptions
|
16
or other advanced systems used in the calculation of our capital ratios that cause changes in those ratios as they are measured from period to period;
|
•
|
increasing requirements to obtain the prior approval of the Federal Reserve or our other U.S. and non-U.S. regulators for the use, allocation or distribution of our capital or other specific capital actions or programs, including acquisitions, dividends and stock purchases, without which our growth plans, distributions to shareholders, share repurchase programs or other capital initiatives may be restricted;
|
|
•
|
changes in law or regulation, or the enforcement of law or regulation, that may adversely affect our business activities or those of our clients or our counterparties, and the products or services that we sell, including additional or increased taxes or assessments thereon, capital adequacy requirements, margin requirements and changes that expose us to risks related to the adequacy of our controls or compliance programs;
|
|
•
|
financial market disruptions or economic recession, whether in the U.S., Europe, Asia or other regions;
|
|
•
|
our ability to promote a strong culture of risk management, operating controls, compliance oversight and governance that meet our expectations and those of our clients and our regulators;
|
|
•
|
the results of, and costs associated with, governmental or regulatory inquiries and investigations, litigation and similar claims, disputes, or proceedings;
|
|
•
|
the potential for losses arising from our investments in sponsored investment funds;
|
|
•
|
the possibility that our clients will incur substantial losses in investment pools for which we act as agent, and the possibility of significant reductions in the liquidity or valuation of assets underlying those pools;
|
|
•
|
our ability to anticipate and manage the level and timing of redemptions and withdrawals from our collateral pools and other collective investment products;
|
|
•
|
the credit agency ratings of our debt and depository obligations and investor and client perceptions of our financial strength;
|
|
•
|
adverse publicity, whether specific to State Street or regarding other industry participants or industry-wide factors, or other reputational harm;
|
|
•
|
our ability to control operational risks, data security breach risks and outsourcing risks, our ability to protect our intellectual property rights, the possibility of errors in the quantitative models we use to manage our business and the possibility that our controls will prove insufficient, fail or be circumvented;
|
|
•
|
our ability to expand our use of technology to enhance the efficiency, accuracy and reliability of our operations and our dependencies on information technology and our ability to control related risks, including cyber-crime and other threats to our information technology infrastructure and systems and their effective operation both independently and with external systems, and complexities and costs of protecting the security of our systems and data;
|
|
•
|
our ability to grow revenue, manage expenses, attract and retain highly skilled people and raise the capital necessary to achieve our business goals and comply with regulatory requirements and expectations;
|
|
•
|
changes or potential changes to the competitive environment, including changes due to regulatory and technological changes, the effects of industry consolidation and perceptions of State Street as a suitable service provider or counterparty;
|
|
•
|
changes or potential changes in the amount of compensation we receive from clients for our services, and the mix of services provided by us that clients choose;
|
|
•
|
our ability to complete acquisitions, joint ventures and divestitures, including the ability to obtain regulatory approvals, the ability to arrange financing as required and the ability to satisfy closing conditions;
|
|
•
|
the risks that our acquired businesses and joint ventures will not achieve their anticipated financial and operational benefits or will not be integrated successfully, or that the integration will take longer than anticipated, that expected synergies will not be achieved or unexpected negative synergies or liabilities will be experienced, that client and deposit retention goals will not be met, that other regulatory or operational challenges will be experienced, and that disruptions from the transaction will harm our relationships with our clients, our employees or regulators;
|
|
•
|
our ability to recognize emerging needs of our clients and to develop products that are responsive to such trends and profitable to
|
17
us, the performance of and demand for the products and services we offer, and the potential for new products and services to impose additional costs on us and expose us to increased operational risk;
|
•
|
changes in accounting standards and practices; and
|
|
•
|
changes in tax legislation and in the interpretation of existing tax laws by U.S. and non-U.S. tax authorities that affect the amount of taxes due.
|
Actual outcomes and results may differ materially from what is expressed in our forward-looking statements and from our historical financial results due to the factors discussed in this Item 1A Risk Factors and elsewhere in this Form 10-K (including in the Management's Discussion and Analysis included under Item 7 of this Form 10-K) or disclosed in our SEC filings. Forward-looking statements should not be relied on as representing our expectations or beliefs as of any date subsequent to the time this Form 10-K is filed with the SEC. We undertake no obligation to revise our forward-looking statements after the time they are made. The factors discussed in this Item 1A are not intended to be a complete statement of all risks and uncertainties that may affect our businesses. We cannot anticipate all developments that may adversely affect our business or operations or our consolidated results of operations or financial condition.
Forward-looking statements should not be viewed as predictions, and should not be the primary basis on which investors evaluate State Street. Any investor in State Street should consider all risks and uncertainties disclosed in our SEC filings, including our filings under the Securities Exchange Act of 1934, in particular our reports on Forms 10-K, 10-Q and 8-K, or registration statements filed under the Securities Act of 1933, all of which are accessible on the SEC's website at
www.sec.gov
or on the “Investor Relations” section of our corporate website at
www.statestreet.com
.
Risk Factors
In the normal course of our business activities, we are exposed to a variety of risks. The following is a discussion of various risk factors applicable to State Street. Additional information about our risk management framework is included under “Risk Management” in Management’s Discussion and Analysis included under Item 7 of this Form 10-K. Additional risks beyond those described in Management's Discussion and Analysis or in the following discussion may be inherent in our activities or operations as currently conducted, or as we may conduct them in the future, or in the markets in which we operate or may in the future operate.
Credit and Counterparty, Liquidity and Market Risks
We assume significant credit risk to counterparties, many of which are major financial institutions. These financial institutions and other counterparties may also have substantial financial dependencies with other financial institutions and sovereign entities. This credit exposure and concentration could expose us to financial loss.
The financial markets are characterized by extensive interdependencies among numerous parties, including banks, central banks, broker/dealers, insurance companies and other financial institutions. These financial institutions also include collective investment funds, such as mutual funds, UCITs and hedge funds that share these interdependencies. Many financial institutions, including collective investment funds also hold, or are exposed to, loans, sovereign debt, fixed-income securities, derivatives, counterparty and other forms of credit risk in amounts that are material to their financial condition. As a result of our own business practices and these interdependencies, we and many of our clients have concentrated counterparty exposure to other financial institutions and collective investment funds, particularly large and complex institutions, sovereign issuers, mutual funds and UCITs and hedge funds. Although we have procedures for monitoring both individual and aggregate counterparty risk, significant individual and aggregate counterparty exposure is inherent in our business, as our focus is on servicing large institutional investors
.
In the normal course of our business, we assume concentrated credit risk at the individual obligor, counterparty or group level. Such concentrations may be material and can often exceed 10%
of our consolidated total shareholders' equity. Our material counterparty exposures change daily, and the counterparties or groups of related counterparties to which our risk exposure exceeds
18
10% of our consolidated total shareholders' equity are also variable during any reported period; however, our largest exposures tend to be to other financial institutions.
Concentration of counterparty exposure presents significant risks to us and to our clients because the failure or perceived weakness of our counterparties (or in some cases of our clients' counterparties) has the potential to expose us to risk of financial loss. Changes in market perception of the financial strength of particular financial institutions or sovereign issuers can occur rapidly, are often based on a variety of factors and are difficult to predict.
Since mid-2007, a variety of economic, market and other factors have contributed to many financial institutions becoming significantly less creditworthy, as reflected in the credit downgrades of numerous large U.S. and non-U.S. financial institutions in recent years. Also, credit downgrades to several sovereign issuers (including the U.S., Austria, France, Greece, Italy, the Netherlands, Portugal and Spain) and other issuers have stressed the perceived creditworthiness of financial institutions, many of which invest in, accept collateral in the form of, or value other transactions based on the debt or other securities issued by sovereign or other issuers. Unemployment levels and deflationary and recessionary pressures in key global economies, while other economies including the U.S. and U.K. appear to be experiencing improving economic conditions, have resulted in substantial easing of monetary policy in Europe and Japan which contributed to economic and market uncertainty, low interest rates and pressures on currency exchange rates in 2014 and will likely have similar impacts in 2015. Substantial changes in commodity prices, particularly oil, and a slowing of demand in China, are also contributing to economic and market risks. Further economic, political or market turmoil or developments may lead to stress on sovereign issuers, and increase the potential for sovereign defaults or restructurings, additional credit-rating downgrades or the departure of sovereign issuers from common currencies or economic unions. These same factors may contribute to increased risk of default or downgrading for financial and corporate issuers or other market risk associated with excess levels of liquidity. As a result, we may be exposed to increased counterparty risks, either resulting from our role as principal or because of commitments we make in our capacity as agent for some of our clients.
The degree of client demand for short-term credit tends to increase during periods of market turbulence, which may expose us to further counterparty-related risks. For example, investors in collective investment vehicles for which we act as custodian may experience significant redemption
activity due to adverse market or economic news. Our relationship with our clients and the nature of the settlement process for some types of payments may result in the extension of short-term credit in such circumstances. For some types of clients, we provide credit to allow them to leverage their portfolios, which may expose us to potential loss if the client experiences investment losses or other credit difficulties.
In addition to our exposure to financial institutions, we are from time to time exposed to concentrated credit risk at an industry or country level, potentially exposing us to a single market or political event or a correlated set of events. This concentration risk also applies to groups of unrelated counterparties that may have similar investment strategies involving one or more particular industries, regions, or other characteristics. These unrelated counterparties may concurrently experience adverse effects to their performance, liquidity or reputation due to events or other factors affecting such investment strategies. Though potentially not material individually (relative to any one such counterparty), our aggregated credit exposures to such a group of counterparties could similarly expose us to a single market or political event or a correlated set of events.
We are also generally not able to net exposures across counterparties that are affiliated entities and may not be able in all circumstances to net exposures to the same legal entity across multiple products. As a consequence, we may incur a loss in relation to one entity or product even though our exposure to an entity's affiliates or across product types is over-collateralized.
Our use of unaffiliated subcustodians also exposes us to operational risk, credit risk and risks of the legal systems of the jurisdictions in which the subcustodians operate, each of which may be material. These risks are amplified due to changing regulatory requirements with respect to our financial exposures in the event those subcustodians are unable to return a client’s assets. We are also exposed to settlement risks, particularly in our payments and foreign exchange activities. Those activities may lead to losses in the event of a counterparty breach. Due to our membership in several industry clearing or settlement exchanges, we may be required to guarantee obligations and liabilities, or provide financial support, in the event that other members do not honor their obligations or default. Moreover, not all of our counterparty exposure is secured, and when our exposure is secured, the realizable value of the collateral may have declined by the time we exercise our rights against that collateral. This risk may be particularly
19
acute if we are required to sell the collateral into an illiquid or temporarily-impaired market.
On behalf of clients enrolled in our securities lending program, we lend securities to banks, broker/dealers and other institutions. In most circumstances, we indemnify our clients for the fair market value of those securities against a failure of the borrower to return such securities. Borrowers are generally required to provide collateral equal to a contractually-agreed percentage equal to or in excess of the fair value of the loaned securities. As the fair value of the loaned securities changes, additional collateral is provided by the borrower or collateral is returned to the borrower. In addition, our clients often purchase securities or other financial instruments from financial counterparties, including broker/dealers, under repurchase arrangements, frequently as a method of reinvesting the cash collateral they receive from lending their securities. Under these arrangements, the counterparty is obligated to repurchase these securities or financial instruments from the client at the same price (plus an agreed rate of return) at some point in the future. The value of the collateral is intended to exceed the counterparty's payment obligation, and collateral is adjusted daily to account for shortfall under, or excess over, the agreed-upon collateralization level. As with the securities lending program, we agree to indemnify our clients from any loss that would arise on a default by the counterparty under these repurchase arrangements if the proceeds from the disposition of the securities or other financial assets held as collateral are less than the amount of the repayment obligation by the client's counterparty. In such instances of counterparty default, for both securities lending and repurchase agreements,
we, rather than our client, are exposed to the risks associated with collateral value.
We also engage in certain off-balance sheet activities that involve risks. For example, we provide benefit-responsive contracts, known as wraps, to defined contribution plans that offer a stable value option to their participants. During the financial crisis, the book value of obligations under many of these contracts exceeded the market value of the underlying portfolio holdings. Concerns regarding the portfolio of investments protected by such contracts, or regarding the investment manager overseeing such an investment option, may result in redemption demands from stable value products covered by benefit-responsive contracts at a time when the portfolio's market value is less than its book value, potentially exposing us to risk of loss. Similarly, we provide credit facilities in connection with the remarketing of U.S. municipal obligations, potentially exposing us to credit exposure to the municipalities issuing such bonds and to their increased liquidity demands. In the current economic environment,
where municipalities are subject to increased investor concern, the risks associated with such businesses increase. Further, our off-balance sheet activities also include our agreement, described above, to indemnify our clients for the fair market value of those securities against a failure of the borrower to return such securities.
Under evolving regulatory restrictions on credit exposure, which are anticipated to include broader or more prescriptive measures of credit exposure, we may be required to limit our exposures to specific issuers or groups, including financial institutions and sovereign issuers, to levels that we may currently exceed. These credit exposure restrictions under such evolving regulations may adversely affect our businesses, may require that we expand our credit exposure to a broader range of issuers, including issuers that represent increased credit risk and may require that we modify our operating models or the policies and practices we use to manage our consolidated statement of condition. Although our overall business is subject to these interdependencies, several of our business units are particularly sensitive to them, including our Global Treasury group, that, among other responsibilities, manages our investment portfolio, our currency trading business, our securities finance business, and our investment management business. Given the limited number of strong counterparties in the current market, we are not able to mitigate all of our and our clients' counterparty credit risk.
Our investment securities portfolio, consolidated financial condition and consolidated results of operations could be adversely affected by changes in interest rate, market and credit risks.
Our investment securities portfolio represented approximately
41%
of our consolidated total assets as of
December 31, 2014
, and the gross interest revenue associated with our investment portfolio represented approximately
20%
of our consolidated total gross revenue for the year ended
December 31, 2014
and has represented as much as
30%
of our consolidated gross revenue in the fiscal years since 2007. As such, our consolidated financial condition and results of operations are materially exposed to the risks associated with our investment portfolio, including, without limitation, changes in interest rates, credit spreads, credit performance, credit ratings, our access to liquidity, foreign exchange markets, mark-to-market valuations, and our ability to profitably reinvest repayments of principal with respect to these securities. The low interest-rate environment that has persisted since the financial crisis began in mid-2007, and may continue in 2015 and beyond, limits our ability to achieve a net interest margin consistent with our historical averages.
20
Our investment securities portfolio represents a greater proportion of our consolidated statement of condition and our loan and lease portfolios represent a smaller proportion (approximately
7%
of our consolidated total assets as of
December 31, 2014
), in comparison to many other major financial institutions. In some respects, the accounting and regulatory treatment of our investment securities portfolio may be less favorable to us than a more traditional held-for-investment lending portfolio. For example, under the U.S. Basel III final rule issued in July 2013, after-tax changes in the fair value of investment securities classified as available for sale are included in tier 1 capital. Since loans held for investment are not subject to a fair-value accounting framework, changes in the fair value of loans (other than incurred credit losses) are not similarly included in the determination of tier 1 capital under the U.S. Basel III final rule. Due to this differing treatment, we may experience increased variability in our tier 1 capital relative to other major financial institutions whose loan-and-lease portfolios represent a larger proportion of their consolidated total assets than ours.
Our investment portfolio continues to have significant concentrations in certain classes of securities, including agency and non-agency residential mortgage-backed securities, commercial mortgage-backed securities and other asset-backed securities, and securities with concentrated exposure to consumers. These classes and types of securities experienced significant liquidity, valuation and credit quality deterioration during the financial disruption that began in mid-2007. We also hold non-U.S. mortgage-backed and asset-backed securities with exposures to European countries, whose sovereign-debt markets have experienced increased stress since 2011 and may continue to experience stress in the future. For further information, refer to the risk factor titled
“Our businesses have significant European operations, and disruptions in European economies could have a material adverse effect on our consolidated results of operations or financial condition.”
Further, we hold a portfolio of U.S. state and municipal bonds. In view of the budget deficits that a number of states and municipalities currently face, the risks associated with this portfolio are significant.
If market conditions similar to those experienced in 2007 and 2008 were to recur, our investment portfolio could experience a decline in liquidity and market value, regardless of our credit view of our portfolio holdings. For example, we recorded significant losses not related to credit in connection with the consolidation of our off-balance sheet asset-backed commercial paper conduits in 2009 and the repositioning of our investment portfolio in 2010 with
respect to these asset classes. In addition, in general, deterioration in credit quality, or changes in management's expectations regarding repayment timing or in management's investment intent to hold securities to maturity, in each case with respect to our portfolio holdings, could result in other-than-temporary impairment. Similarly, if a material portion of our investment portfolio were to experience credit deterioration below investment grade, our capital ratios as calculated pursuant to the Basel III final rule could be adversely affected. This risk is greater with portfolios of investment securities than with loans or holdings of U.S. Treasury securities
.
Our investment portfolio is further subject to changes in both U.S. and non-U.S. (primarily in Europe) interest rates, and could be negatively affected by changes in those rates, whether or not expected, particularly by a quicker-than-anticipated increase in interest rates or by monetary policy that results in persistently low or negative rates of interest. This has been the case, for example, with respect to recent ECB monetary policy, including negative interest rates in some jurisdictions, with associated negative effects on our net interest revenue and net interest margin. The effect on our net interest revenue has been exacerbated by the effects of the recent strong U.S. dollar relative to other currencies, particularly the Euro. If ECB monetary policy continues to pressure European interest rates downward and the U.S. dollar remains strong or strengthens, the negative effects on our net interest revenue likely will continue or increase.
Our business activities expose us to interest-rate risk.
In our business activities, we assume interest-rate risk by investing short-term deposits received from our clients in our investment portfolio of longer- and intermediate-term assets. Our net interest revenue and net interest margin are affected by the levels of interest rates in global markets, changes in the relationship between short- and long-term interest rates, the direction and speed of interest-rate changes, and the asset and liability spreads relative to the currency and geographic mix of our interest-earning assets and interest-bearing liabilities. These factors are influenced, among other things, by a variety of economic and market forces and expectations, including monetary and other policies and activities of central banks, such as the Federal Reserve, that we do not control. Our ability to anticipate changes in these factors or to hedge the related on- and off-balance sheet exposures can significantly influence the success of our asset-and-liability management activities and the resulting level of our net interest revenue and net interest margin. The impact of changes in interest rates and related factors will depend on the relative duration and fixed-
21
or floating-rate nature of our assets and liabilities. Sustained lower interest rates, a flat or inverted yield curve and narrow interest-rate spreads generally have a constraining effect on our net interest revenue. For additional information about the effects on interest rates on our business, refer to “Financial Condition - Market Risk Management - Asset-and-Liability Management Activities” in Management's Discussion and Analysis included under Item 7 of this Form 10-K
.
If we are unable to continuously attract deposits and other short-term funding, our consolidated financial condition, including our regulatory capital ratios, our consolidated results of operations and our business prospects, could be adversely affected.
Liquidity management, including on an intra-day basis, is critical to the management of our consolidated statement of condition and to our ability to service our client base. We generally use our liquidity to:
|
•
|
meet clients' demands for return of their deposits;
|
|
•
|
extend credit to our clients in connection with our custody business; and
|
|
•
|
fund the pool of long- and intermediate-term assets that are included in the investment securities carried in our consolidated statement of condition.
|
Because the demand for credit by our clients is difficult to predict and control, and may be at its peak at times of disruption in the securities markets, and because the average maturity of our investment securities portfolio is longer than the contractual maturity of our client deposit base, we need to continuously attract, and are dependent on access to, various sources of short-term funding. During periods of market disruption, the level of client deposits held by us has in recent years tended to increase; however, since such deposits are considered to be transitory, we have historically deposited so-called excess deposits with U.S. and non-U.S. central banks and in other highly liquid but low-yielding instruments. These levels of excess client deposits, as a consequence, have increased our net interest revenue but have adversely affected our net interest margin.
In managing our liquidity, our primary source of short-term funding is client deposits, which are predominantly transaction-based deposits by institutional investors. Our ability to continue to attract these deposits, and other short-term funding sources such as certificates of deposit and commercial paper, is subject to variability based on a number of factors, including volume and volatility in global financial markets, the relative interest rates
that we are prepared to pay for these deposits and the perception of safety of these deposits or short-term obligations relative to alternative short-term investments available to our clients, including the capital markets.
In addition, we may be exposed to liquidity or other risks in managing asset pools for third parties that are funded on a short-term basis, or for which the clients participating in these products have a right to the return of cash or assets on limited notice. These business activities include, among others, securities finance collateral pools, money market and other short-term investment funds and liquidity facilities utilized in connection with municipal bond programs. If clients demand a return of their cash or assets, particularly on limited notice, and these investment pools do not have the liquidity to support those demands, we could be forced to sell investment securities at unfavorable prices, damaging our reputation as an asset manager and potentially exposing us to claims related to our management of the pools.
The availability and cost of credit in short-term markets are highly dependent on the markets' perception of our liquidity and creditworthiness. Our efforts to monitor and manage our liquidity risk, including on an intra-day basis, may not be successful or sufficient to deal with dramatic or unanticipated changes in the global securities markets or other event-driven reductions in liquidity. As a result of such events, among other things, our cost of funds may increase, thereby reducing our net interest revenue, or we may need to dispose of a portion of our investment securities portfolio, which, depending on market conditions, could result in a loss from such sales of investment securities being recorded in our consolidated statement of income.
Our business and capital-related activities, including our ability to return capital to shareholders and purchase our capital stock, may be adversely affected by our implementation of the revised regulatory capital and liquidity standards that we must meet under the Basel III final rule, the Dodd-Frank Act and other regulatory initiatives, or in the event our capital plan or post-stress capital ratios are determined to be insufficient as a result of regulatory capital stress testing.
The U.S. Basel III final rule replaced the Basel I- and Basel II-based capital regulations. As a so-called “advanced approaches” banking organization, we became subject to the U.S. Basel III final rule on January 1, 2014.
On January 1, 2015, the U.S. Basel III final rule replaced the existing Basel I-based approach for calculating risk-weighted assets with the U.S. Basel
22
III standardized approach that, among other things, modifies certain existing risk weights and introduces new methods for calculating risk-weighted assets for certain types of assets and exposures. The final rule also revised the Basel II-based advanced approaches capital rules to implement Basel III and certain provisions of the Dodd-Frank Act.
On February 21, 2014, we were notified by the Federal Reserve that we had completed our parallel run period. Consequently, since the second quarter of 2014, we are required to use the advanced approaches framework as provided in the Federal Reserve's July 2013 Basel III final rule in the determination of our risk-based capital requirements. The Dodd-Frank Act applies a "capital floor" to advanced approaches banking organizations, such as
State Street and State Street Bank. As of January 1, 2015, the Basel III standardized approach acts as that capital floor. As a result, we are required to calculate our risk-based capital ratios under both the Basel III advanced approach and the Basel III standardized approach, and we are subject to the more stringent of the risk-based capital ratios calculated under the standardized approach and those calculated under the advanced approach in the assessment of our capital adequacy under the prompt corrective action framework.
In implementing certain aspects of these capital regulations, we are making interpretations of the regulatory intent. The Federal Reserve may determine that we are not in compliance with certain aspects of the advanced approaches capital rules and may require us to take certain actions to come into compliance that could adversely affect our business operations, our regulatory capital structure, our capital ratios or our financial performance, or otherwise restrict our growth plans or strategies. In addition, banking regulators could change the Basel III final rule or their interpretations as they apply to us, including changes to these standards or interpretations made in regulations implementing provisions of the Dodd-Frank Act, which could adversely affect us and our ability to comply with the Basel III final rule.
The U.S. Basel III final rule also contains additional new requirements, such as the SLR and LCR, and further capital and liquidity requirements are under consideration by U.S. and international banking regulators, such as an NSFR, each of which has the potential to have significant effects on our capital and liquidity planning and activities.
For example, the specification of the various elements of the U.S. LCR in the final rule, such as the eligibility of assets as high-quality liquid assets, the calculation of net outflows, including the treatment of operational deposits, and the timing of indeterminate
maturities, could have a material effect on our business activities, including the management and composition of our investment securities portfolio and our ability to extend committed contingent credit facilities to our clients. The full effects of the Basel III final rule, and of other regulatory initiatives related to capital or liquidity, on State Street and State Street Bank are therefore subject to further evaluation and also to further regulatory guidance, action or rule-making.
As a G-SIB, we generally expect to be held to the most stringent provisions under the U.S. Basel III final rule. For example, on December 9, 2014, the Federal Reserve issued a proposed rulemaking to establish a risk-based capital surcharge for U.S. G-SIBs, such as State Street. Under the proposed rule, a G-SIB’s capital conservation buffer would be increased by the amount of the capital surcharge, using the higher surcharge as determined under two proposed methods. The first proposed method would consider a G-SIB’s size, interconnectedness, cross-jurisdictional activity, substitutability, and complexity, whereas the second proposed method would replace substitutability with the use of short-term wholesale funding. If the rulemaking is finalized as proposed, the capital surcharge could be higher than the capital surcharge as determined under the framework proposed by the Basel Committee. Under the proposed rule, the capital surcharge would be phased in beginning in 2016 and would become fully effective on January 1, 2019. State Street is assessing the impact of the capital surcharge that would result if the proposed rule were implemented, and the effects of maintaining capital levels necessary to meet the surcharge could be material.
In addition, in November 2014, the FSB published a consultative document with a proposal to enhance the TLAC of G-SIBs in resolution. The proposal calls for G-SIBs to maintain TLAC in excess of prescribed minimum thresholds. TLAC would include regulatory capital and liabilities that can be written down or converted into equity during resolution. At a minimum, each G-SIB would need to hold TLAC in an amount equivalent to between 16% and 20% of its risk-weighted assets (plus applicable regulatory buffers) or at least twice the relevant Basel III tier 1 leverage ratio requirement. The proposal states that G-SIBs will not be expected to meet TLAC requirements before January 1, 2019. The FSB is expected to finalize its proposal in late 2015. U.S. banking regulators have not yet issued a proposal to implement TLAC requirements.
We are also required by the Federal Reserve to conduct periodic stress testing of our business operations and to develop an annual capital plan as part of the Federal Reserve's Comprehensive Capital
23
Analysis and Review process. That process is used by the Federal Reserve to evaluate our management of capital, the adequacy of our regulatory capital and the potential requirement for us to maintain capital levels above regulatory minimums. The planned capital actions in our capital plan, including stock purchases and dividends, may be objected to by the Federal Reserve, potentially requiring us to revise our stress-testing or capital management approaches, resubmit our capital plan or postpone, cancel or alter our planned capital actions. In addition, changes in our business strategy, merger or acquisition activity or unanticipated uses of capital could result in a change in our capital plan and its associated capital actions, and may require resubmission of the capital plan to the Federal Reserve for its non-objection. We are also subject to asset quality reviews and stress testing by the ECB and may in the future to be subject to similar reviews and testing by other regulators.
Our implementation of the new capital and liquidity requirements, including our capital plan, may not be approved or may be objected to by the Federal Reserve, and the Federal Reserve may impose capital requirements in excess of our expectations or require us to maintain levels of liquidity that are higher than we may expect, and which may adversely affect our consolidated revenues. In the event that our implementation of new capital and liquidity requirements under the Basel III final rule, the Dodd-Frank Act or other regulatory initiatives or our current capital structure are determined not to conform with current and future capital requirements, our ability to deploy capital in the operation of our business or our ability to distribute capital to shareholders or to purchase our capital stock may be constrained, and our business may be adversely affected. Likewise, in the event that regulators in other jurisdictions in which we have banking subsidiaries determine that our capital or liquidity levels do not conform with current and future regulatory requirements, our ability to deploy capital, our levels of liquidity or our business operations in those jurisdictions may be adversely affected.
For additional information about the above matters, refer to “Business - Supervision and Regulation - Regulatory Capital Adequacy and Liquidity Standards” included under Item 1, and “Financial Condition - Capital” in Management's Discussion and Analysis included under Item 7, of this Form 10-K.
Fee revenue represents a significant majority of our consolidated revenue and is subject to decline, among other things, in the event of a reduction in, or changes to, the level or type of investment activity by our clients.
We rely primarily on fee-based services to derive our revenue. This contrasts with commercial banks that may rely more heavily on interest-based sources of revenue, such as loans. During 2014, total fee revenue represented approximately
78%
of our total consolidated revenue. Fee revenue generated by our investment servicing and investment management businesses is augmented by trading services, securities finance and processing fees and other revenue.
The level of these fees is influenced by several factors, including the mix and volume of our assets under custody and administration and our assets under management, the value and type of securities positions held (with respect to assets under custody) and the volume of portfolio transactions, and the types of products and services used by our clients. For example, reductions in the level of economic and capital markets activity tend to have a negative effect on our fee revenue, as these often result in reduced asset valuations and transaction volumes. They may also result in investor preference trends towards asset classes and markets deemed more secure, such as cash or non-emerging markets, with respect to which our fee rates are often lower.
In addition, our clients include institutional investors, such as mutual funds, collective investment funds, hedge funds and other investment pools, corporate and public retirement plans, insurance companies, foundations, endowments and investment managers. Economic, market or other factors that reduce the level or rates of savings in or with those institutions, either through reductions in financial asset valuations or through changes in investor preferences, could materially reduce our fee revenue and have a material adverse effect on our consolidated results of operations.
Our businesses have significant European operations, and disruptions in European economies could have an adverse effect on our consolidated results of operations or financial condition.
Since 2011, Greece, Ireland, Italy, Portugal, Spain and other European economies have experienced, and in the future may experience, difficulties in financing their deficits and servicing their outstanding debt. Eurozone instability and sovereign debt concerns, and the downgraded credit ratings of associated sovereign debt and European financial institutions, have contributed to the volatility in the financial markets. This reduced confidence has led to support for Greece, Ireland, Portugal, and Spain by Eurozone countries and the International Monetary Fund. The ECB has purchased European sovereign debt to support these markets and to weaken the Euro relative to the currencies of significant trading
24
partners of the Eurozone economy and, in the second half of 2014
,
announced operational details of possible asset-backed securities and covered bond purchase programs. Numerous European governments, have adopted austerity and other measures in an attempt to contain the spread of sovereign-debt concerns and overall slow economic growth. Current political attitudes towards such economic support and the European Union in these and other European countries appear to be diverging, creating the potential for an increasingly complex political environment in which actions to support European economies need to be resolved. In mid-2014 geopolitical pressure also rose due to the conflict between the Ukraine and Russia, with governments globally imposing trade restrictions which affected the global and European economy, the Russian currency and Russian financial markets and financial institutions.
These political disagreements, along with the interdependencies among European economies and financial institutions and the substantial refinancing requirements of European sovereign issuers create ongoing concern regarding deflationary pressures in Europe, persistent high levels of unemployment in certain countries and the stability of the Euro, European financial markets generally and certain institutions in particular. Given the scope of our European operations, clients and counterparties, disruptions in the European financial markets, the failure to resolve fully and contain sovereign-debt concerns, continued recession in significant European economies, the possible attempt of a country to abandon the Euro, the failure of a significant European financial institution, even if not an immediate counterparty to us, or persistent weakness in the Euro and the consequences of prolonged negative interest rates, could have a material adverse impact on our consolidated results of operations or financial condition.
Recent conditions in the global economy and financial markets have adversely affected us, and they have increased the uncertainty and unpredictability we face in managing our businesses.
Global credit and other financial markets have recently suffered from substantial volatility, illiquidity and disruption. The resulting economic pressure and lack of confidence in the financial stability of certain countries, and in the financial markets generally, have adversely affected our business, as well as the businesses of our clients and our significant counterparties. This environment, the potential for continuing or additional disruptions, and the regulatory and enforcement environment that has subsequently arisen have also affected overall
confidence in financial institutions, have further exacerbated liquidity and pricing issues within the securities markets, have increased the uncertainty and unpredictability we face in managing our businesses, and have had an adverse effect on our consolidated results of operations and financial condition.
While global economies and financial markets showed some signs of stabilizing during 2013 and 2014, numerous global financial services firms and the sovereign debt of some nations experienced credit downgrades and recessionary issues. The occurrence of additional disruptions in global markets, continued uncertainty with respect to federal budget and federal debt-ceiling concerns in the U.S., continued economic or political uncertainty in Europe, or the worsening of economic conditions, could further adversely affect our businesses and the financial services industry in general, and also increase the difficulty and unpredictability of aligning our business strategies, our infrastructure and our operating costs in light of current and future market and economic conditions.
Market disruptions can adversely affect our consolidated results of operations if the value of assets under custody, administration or management decline, while the costs of providing the related services remain constant due to the high fixed costs associated with this business. These factors can reduce the profitability of our asset-based fee revenue and could also adversely affect our transaction-based revenue, such as revenues from securities finance and foreign exchange activities, and the volume of transactions that we execute for or with our clients. Further, the degree of volatility in foreign exchange rates can affect our foreign exchange trading revenue. In general, increased currency volatility tends to increase our market risk but also increases our foreign exchange revenue. Conversely, periods of lower currency volatility tend to decrease our market risk but also decrease our foreign exchange revenue.
In addition, as our business grows globally and a significant percentage of our revenue is earned (and of our expenses paid) in currencies other than U.S. dollars, our exposure to foreign currency volatility could affect our levels of consolidated revenue, our consolidated expenses and our consolidated results of operations, as well as the value of our investment in our non-U.S. operations and our investment portfolio holdings. For example, during the second half of 2014, the effects of a stronger U.S. dollar, particularly relative to the Euro, reduced our servicing fee and management fee revenue and also reduced our expenses. The extent to which changes in the strength of the U.S. dollar relative to other currencies
25
affects our consolidated results of operations, including the degree of any offset between increases or decreases to both revenue and expenses, will depend upon the nature and scope of our operations and activities in the relevant jurisdictions during the relevant periods, which may vary from period to period.
As our product offerings expand, in part as we seek to take advantage of perceived opportunities arising under various regulatory reforms and resulting market changes, the degree of our exposure to various market and credit risks will evolve, potentially resulting in greater revenue volatility. We also will need to make additional investments to develop the operational infrastructure and to enhance our compliance and risk management capabilities to support these businesses, which may increase the operating expenses of such businesses or, if our risk management resources fail to keep pace with product expansion, result in increased risk of loss from such businesses.
We may need to raise additional capital in the future, which may not be available to us or may only be available on unfavorable terms.
We may need to raise additional capital in order to maintain our credit ratings in response to regulatory changes, including capital rules, or for other purposes, including financing acquisitions and joint ventures. However, our ability to access the capital markets, if needed, will depend on a number of factors, including the state of the financial markets. In the event of rising interest rates, disruptions in financial markets, negative perceptions of our business or our financial strength, or other factors that would increase our cost of borrowing, we cannot be sure of our ability to raise additional capital, if needed, on terms acceptable to us. Any diminished ability to raise additional capital, if needed, could adversely affect our business and our ability to implement our business plan, capital plan and strategic goals, including the financing of acquisitions and joint ventures.
Any downgrades in our credit ratings, or an actual or perceived reduction in our financial strength, could adversely affect our borrowing costs, capital costs and liquidity and cause reputational harm.
Major independent rating agencies publish credit ratings for our debt obligations based on their evaluation of a number of factors, some of which relate to our performance and other corporate developments, including financings, acquisitions and joint ventures, and some of which relate to general industry conditions. We anticipate that the rating agencies will review our ratings regularly based on our consolidated results of operations and
developments in our businesses. One or more of the major independent credit rating agencies have in the past downgraded, and may in the future downgrade, our credit ratings, or have negatively revised their outlook for our credit ratings. In November 2013, Moody’s Investors Service downgraded the long-term senior and subordinated debt ratings for State Street Bank.
The current market environment and our exposure to financial institutions and other counterparties, including sovereign entities, increase the risk that we may not maintain our current ratings, and we cannot provide assurance that we will continue to maintain our current credit ratings. Downgrades in our credit ratings may adversely affect our borrowing costs, our capital costs and our ability to raise capital and, in turn, our liquidity. A failure to maintain an acceptable credit rating may also preclude us from being competitive in various products.
Additionally, our counterparties, as well as our clients, rely on our financial strength and stability and evaluate the risks of doing business with us. If we experience diminished financial strength or stability, actual or perceived, including the effects of market or regulatory developments, our announced or rumored business developments or consolidated results of operations, a decline in our stock price or a reduced credit rating, our counterparties may be less willing to enter into transactions, secured or unsecured, with us; our clients may reduce or place limits on the level of services we provide them or seek other service providers; or our prospective clients may select other service providers, all of which may have other adverse effects on our reputation.
The risk that we may be perceived as less creditworthy relative to other market participants is higher in the current market environment, in which the consolidation, and in some instances failure, of financial institutions, including major global financial institutions, have resulted in a smaller number of much larger counterparties and competitors. If our counterparties perceive us to be a less viable counterparty, our ability to enter into financial transactions on terms acceptable to us or our clients, on our or our clients' behalf, will be materially compromised. If our clients reduce their deposits with us or select other service providers for all or a portion of the services we provide to them, our revenues will decrease accordingly.
Operational, Business and Reputational Risks
We face extensive and changing government regulation in the U.S. and in foreign jurisdictions in which we operate, which may increase our costs and expose us to risks related to compliance.
26
Most of our businesses are subject to extensive regulation by multiple regulatory bodies, and many of the clients to which we provide services are themselves subject to a broad range of regulatory requirements. These regulations may affect the scope of, and the manner and terms of delivery of, our services. As a financial institution with substantial international operations, we are subject to extensive regulation and supervisory oversight, both in and outside of the U.S. This regulation and supervisory oversight affects, among other things, the scope of our activities and client services, our capital and organizational structure, our ability to fund the operations of our subsidiaries, our lending practices, our dividend policy, our common stock purchase actions, the manner in which we market our services, and our interactions with foreign regulatory agencies and officials.
In particular, State Street is registered with the Federal Reserve as a bank holding company pursuant to the Bank Holding Company Act of 1956. The Bank Holding Company Act limits the activities in which we (and non-banking entities that we are deemed to control under that Act) may engage in activities the Federal Reserve considers to be closely related to banking or to managing or controlling banks. Financial holding company status expands the activities permissible for a bank holding company to those that are deemed to be “financial in nature” by the Federal Reserve. State Street elected to become a financial holding company under the Bank Holding Company Act. Financial holding company status requires State Street and its banking subsidiaries to remain well capitalized and well managed and to comply with Community Reinvestment Act obligations. Currently, under the Bank Holding Company Act, we may not be able to engage in new activities or acquire shares or control of other businesses.
Several other aspects of the regulatory environment in which we operate, and related risks, are discussed below. Additional information is provided in “Business - Supervision and Regulation” included under Item 1 of this Form 10-K.
The Dodd-Frank Act, which became law in July 2010, has had, and will continue to have, a significant impact on the regulatory structure of the global financial markets and has imposed, and is expected to continue to impose, significant additional costs on us. While U.S. banking regulators have finalized many regulations to implement various provisions of the Dodd-Frank Act, they plan to propose or finalize additional implementing regulations in the future. In light of the further rule-making required to fully implement the Dodd-Frank Act, as well as the discretion afforded to federal regulators, the full
impact of this legislation on us, our business strategies and financial performance is not known at this time and may not be known for a number of years. Several elements of the Dodd-Frank Act, such as the Volcker rule and enhanced prudential standards for financial institutions designated as SIFIs, impose or are expected to impose significant additional operational, compliance and risk management costs both in the near-term, as we develop and integrate appropriate systems and procedures, and on a recurring basis thereafter, as we monitor, support and refine those systems and procedures.
A number of regulations implementing the Dodd-Frank Act that are not yet final are anticipated to be finalized in 2015 or 2016, with compliance dates soon thereafter, and, as a result of and together with regulatory change in Europe, the costs and impact on our operations of the post-financial crisis regulatory reform are accelerating. We may not anticipate completely all areas in which the Dodd-Frank Act or other regulatory initiatives could affect our business or influence our future activities or the full effects or extent of related operational, compliance, risk management or other costs.
The FDIC and the Federal Reserve jointly issued a final rule under the Dodd-Frank Act pursuant to which we are required to submit annually to the Federal Reserve and the FDIC a plan, known as a resolution plan, for our rapid and orderly resolution under the Bankruptcy Code (or other specifically applicable insolvency regime) in the event of material financial distress or failure. The FDIC also issued a final rule pursuant to which State Street Bank is required to submit annually to the FDIC a plan for resolution in the event of its failure. We and State Street Bank submitted our most recent annual resolution plan to the Federal Reserve and the FDIC on July 1, 2014. Subsequently, in August 2014, the Federal Reserve and the FDIC announced the completion of their reviews of resolution plans submitted in 2013 by 11 large, complex banking organizations, including State Street, under the requirements of the Dodd-Frank Act, and informed each of these organizations of specific shortcomings with their respective 2013 resolution plans. If the FDIC and the Federal Reserve should determine that one or more of our 2014, 2015 or any subsequent resolution plan is not credible or would not facilitate an orderly resolution under the Bankruptcy Code, or we otherwise fail to meet regulatory expectations to the satisfaction of the Federal Reserve or the FDIC with respect to one or more of such resolution plans, we could be subject to more stringent capital, leverage or liquidity requirements, restrictions on our growth, activities or operations, or be required to divest certain of our assets or operations.
27
Other provisions of the Dodd-Frank Act and its implementing regulations, such as new rules for swap market participants, additional regulation of financial system utilities, the designation of non-bank institutions as SIFIs, and further requirements to facilitate orderly liquidation of large institutions, could adversely affect our business operations and our competitive position, and could also negatively affect the operational and competitive positions of our clients. The final effects of the Dodd-Frank Act on our business will depend largely on the scope and timing of the implementation of the Dodd-Frank Act by regulatory bodies, which in many cases have been delayed, and the exercise of discretion by these regulatory bodies.
The breadth of our business activities, together with the scope of our global operations and varying business practices in relevant jurisdictions, increase the complexity and costs of meeting our regulatory compliance obligations, including in areas that are receiving significant regulatory scrutiny. We are, therefore, subject to related risks of non-compliance, including fines, penalties, lawsuits, regulatory sanctions or difficulties in obtaining approvals, limitations on our business activities, or reputational harm, any of which may be significant. For example, the global nature of our client base requires us to comply with complex regulations relating to money laundering and anti-terrorist monitoring of our clients. The same applies with respect to anti-corruption laws and related requirements. Regulatory scrutiny of compliance with these and other regulations is increasing and our operations are subject to regulations from multiple jurisdictions. The overall evolving regulatory landscape in each jurisdiction in which we operate, including requirements or restrictions on our service offerings or opportunities for new service offerings, particularly when applied on a cross-border basis, is not necessarily consistent with the requirements or regulatory objectives of other jurisdictions in which we have clients or operations. This evolving regulatory landscape may interfere with our ability to conduct our operations, with our pursuit of a common global operating model or with our ability to compete effectively with other financial institutions operating in those jurisdictions or which may be subject to different regulatory requirements than apply to us. In particular, non-U.S. regulation and initiatives may be inconsistent or conflict with current or proposed regulations in the U.S., which could create increased compliance and other costs that would adversely affect business, operations or profitability.
Our designation under the Dodd-Frank Act in the U.S. as a SIFI, and our identification by the FSB as a G-SIB, to which certain regulatory capital surcharges may apply, will subject us to incrementally higher
capital and prudential requirements, increased scrutiny of our activities and potential further regulatory requirements or increased regulatory expectations than those applicable to some of the financial institutions with which we compete as a custodian or asset manager. This increased scrutiny also has significantly increased, and may continue to increase, our expenses associated with regulatory compliance, including personnel and systems, as well as implementation and related costs to enhance our programs.
We are further affected by other regulatory initiatives, including, but not limited to, the implementation of the Basel III final rule, including the proposed NSFR and Basel III SLR, the implemented Alternative Investment Fund Managers Directive, or AIFMD, the European Market Infrastructure Resolution, or EMIR, which is currently in an implementation phase, proposed revisions to the European collective investment fund, or UCITS, proposed revisions to the Markets in Financial Instruments Directive and anticipated revisions to the European Union data protection regulation. Recent, proposed or potential regulations in the U.S. and Europe with respect to money market funds, short-term wholesale funding, such as repurchase agreements or securities lending, or other “shadow banking” activities, could also adversely affect not only our own operations but also the operations of the clients to which we provide services. In Europe, the AIFMD increases the responsibilities and potential liabilities of custodians to certain of their clients for asset losses, and proposed revisions to the regulations affecting UCITS are anticipated to incorporate similar, potentially more strict, standards.
EMIR requires the reporting of all derivatives to a trade repository, the mandatory clearing of certain derivatives trades via a central counterparty and risk mitigation techniques for derivatives not cleared via a central counterparty. EMIR will impact our business activities, and increase costs, in various ways, some of which may be adverse. Further, the European Commission's proposal to introduce a proposed financial transaction tax or similar proposals elsewhere, if adopted, could materially affect the location and volume of financial transactions or otherwise alter the conduct of financial activities, any of which could have a material adverse effect on our business and on our consolidated results of operations or financial condition.
The Dodd-Frank Act and these other international regulatory changes could limit our ability to pursue certain business opportunities, increase our regulatory capital requirements, alter the risk profile of certain of our core activities and impose additional costs on us, otherwise adversely affect our business,
28
our consolidated results of operations or financial condition and have other negative consequences, including a reduction of our credit ratings. Different countries may respond to the market and economic environment in different and potentially conflicting manners, which could increase the cost of compliance for us.
The evolving regulatory environment, including changes to existing regulations and the introduction of new regulations, may also contribute to decisions we may make to suspend, reduce or withdraw from existing businesses, activities or initiatives. In addition to potential lost revenue associated with any such suspensions, reductions or withdrawals, any such suspensions, reductions or withdrawals may result in significant restructuring or related costs or exposures.
If we do not comply with governmental regulations, we may be subject to fines, penalties, lawsuits, delays, or difficulties in obtaining regulatory approvals or restrictions on our business activities or harm to our reputation, which may significantly and adversely affect our business operations and, in turn, our consolidated results of operations. The willingness of regulatory authorities to impose meaningful sanctions, and the level of fines and penalties imposed in connection with regulatory violations, have increased substantially since the financial crisis. Regulatory agencies may, at times, limit our ability to disclose their findings, related actions or remedial measures. Similarly, many of our clients are subject to significant regulatory requirements and retain our services in order for us to assist them in complying with those legal requirements. Changes in these regulations can significantly affect the services that we are asked to provide, as well as our costs.
In addition, adverse publicity and damage to our reputation arising from the failure or perceived failure to comply with legal, regulatory or contractual requirements could affect our ability to attract and retain clients. If we cause clients to fail to comply with these regulatory requirements, we may be liable to them for losses and expenses that they incur. In recent years, regulatory oversight and enforcement have increased substantially, imposing additional costs and increasing the potential risks associated with our operations. If this regulatory trend continues, it could adversely affect our operations and, in turn, our consolidated results of operations and financial condition.
Our calculations of credit, market and operational risk exposures, total risk-weighted assets and capital ratios for regulatory purposes depend on data inputs, formulae, models, correlations, and assumptions that are subject to changes over
time, which changes, in addition to our consolidated financial results, could materially change our risk exposures, our total risk-weighted assets and our capital ratios from period to period.
To calculate our credit, market and operational risk exposures, our total risk-weighted assets and our capital ratios for regulatory purposes, the Basel III final rule involves the use of current and historical data, including our own loss data and claims experience and similar information from other industry participants, market volatility measures, interest rates and spreads, asset valuations, credit exposures, and the creditworthiness of our counterparties. These calculations also involve the use of quantitative formulae, statistical models, historical correlations and significant assumptions. We refer to the data, formulae, models, correlations, and assumptions, as well as our related internal processes, as our “advanced systems.” While our advanced systems are generally quantitative in nature, significant components involve the exercise of judgment based, among other factors, on our and the financial services industry's evolving experience. Any of these judgments or other elements of our advanced systems may not, individually or collectively, precisely represent or calculate the scenarios, circumstances, outputs or other results for which they are designed or intended.
In addition, our advanced systems are subject to update and periodic revalidation in response to changes in our business activities and our historical experiences, forces and events experienced by the market broadly or by individual financial institutions, changes in regulations and regulatory interpretations and other factors, and are also subject to continuing regulatory review and approval. For example, a significant operational loss experienced by another financial institution, even if we do not experience a related loss, could result in a material change in our advanced systems and a corresponding material change in our risk exposures, our total risk-weighted assets and our capital ratios compared to prior periods. Due to the influence of changes in our advanced systems, whether resulting from changes in data inputs, regulation or regulatory supervision or interpretation, State Street-specific or more general market, or individual financial institution-specific, activities or experiences, or other updates or factors, we expect that our advanced systems and our credit, market and operational risk exposures, our total risk-weighted assets and our capital ratios calculated under the Basel III final rule will change, and may be volatile, over time, and that those latter changes or volatility could be material as calculated and measured from period to period.
29
Our businesses may be adversely affected by regulatory enforcement and litigation.
In the ordinary course of our business, we are subject to various regulatory, governmental and law enforcement inquiries, investigations and subpoenas. These may be directed generally to participants in the businesses or markets in which we are involved or may be specifically directed at us. In regulatory enforcement matters, claims for disgorgement, the imposition of penalties and the imposition of other remedial sanctions are possible.
From time to time, our clients, or the government on their or its own behalf, make claims and take legal action relating to, among other things, our performance of our fiduciary or contractual responsibilities. Often, the announcement or other publication of such a claim or action, or of any related settlement, may spur the initiation of similar claims by other clients or governmental parties. In any such claims or actions, demands for substantial monetary damages may be asserted against us and may result in financial liability, changes in our business practices or an adverse effect on our reputation or on client demand for our products and services. In regulatory settlements since the financial crisis, the fines imposed by regulators have increased substantially and may exceed in some cases the profit earned or harm caused by the regulatory or other breach.
We are currently subject to both regulatory inquiries and civil litigation with respect to the provision of foreign exchange execution services to institutional investors that are also custody clients. We recorded total accruals of
$185 million
for 2014 with respect to certain of these matters, and these regulatory matters and litigation have the potential to have a material adverse effect on our consolidated results of operations for any future period in which the relevant matter is resolved or any additional accrual is determined to be required, on our consolidated financial condition or on our reputation. The potential exposure from such matters is difficult to estimate because the basis on which some claims may be brought remains uncertain or the legal theories being applied are untested in the courts. For additional information concerning these matters, refer to the risk factor titled “
We face litigation and governmental and client inquiries in connection with our execution of indirect foreign exchange trades with custody clients; these issues have adversely affected our revenue from such trading and may cause our revenue from such trading to decline in the future.”
In many cases, we are required to self-report inappropriate or non-compliant conduct to the authorities, and our failure to do so may represent an independent regulatory violation. Even when we promptly bring the matter to the attention of the
appropriate authorities, we may nonetheless experience regulatory fines, liabilities to clients, harm to our reputation or other adverse effects in connection with self-reported matters.
Our operations are subject to regular and ongoing inspection by our bank and other financial market regulators in the U.S. and internationally. As a result of such inspections, regulators may identify areas in which we may need to take actions, which may be significant, to enhance our regulatory compliance or risk management practices. Such remedial actions may entail significant cost, management attention, and systems development and such efforts may affect our ability to expand our business until such remedial actions are completed. Our failure to implement enhanced compliance and risk management procedures in a manner and in a timeframe deemed to be responsive by the applicable regulatory authority could adversely impact our relationship with such regulatory authority and could lead to restrictions on our activities or other sanctions.
Further, we may become subject to regulatory scrutiny, inquiries or investigations associated with broad, industry-wide concerns, and potentially client-related inquiries or claims, whether or not we engaged in the relevant activities, and could experience associated increased costs or harm to our reputation. For example, we are a major foreign exchange dealer and also publish a commonly used foreign exchange benchmark. Many participants in the foreign exchange industry have settled governmental allegations of manipulation in foreign exchange markets, particularly with respect to published benchmarks, and others are expected to be facing similar inquiries or related civil litigation. We are enhancing our monitoring with respect to foreign exchange transactions and communications by foreign exchange traders. We are also undertaking an internal review of communications and have been advising certain U.S. and non-U.S. government agencies of the results of such review. Our business may become subject to material governmental review, proceedings or actions or the assertion of material claims, and the industry may become subject to increased regulation, any of which could decrease the volume and profitability of our foreign exchange trading activities. Our revenue worldwide from direct foreign exchange sales and trading totaled
$361 million
in 2014,
$304 million
in 2013 and
$263 million
in 2012.
Separately, we are responding to subpoenas from the Department of Justice and the SEC for information regarding our solicitation of asset servicing business of public retirement plans. We have retained counsel to conduct a review of these matters, including our use of consultants and
30
lobbyists in our solicitation of business of public retirement plans and, in at least one instance, political contributions by one of our consultants during and after a public bidding process.
In view of the inherent difficulty of predicting the outcome of legal and regulatory matters, we cannot provide assurance as to the outcome of any pending or potential matter or, if determined adversely against us, the costs associated with any such matter, particularly where the claimant seeks very large or indeterminate damages or where the matter presents novel legal theories, involves a large number of parties or is at a preliminary stage. We may be unable to accurately estimate our exposure to litigation risk when we record reserves for probable and estimable loss contingencies. As a result, any reserves we establish to cover any settlements, judgments or regulatory fines may not be sufficient to cover our actual financial exposure. The resolution of certain pending or potential legal or regulatory matters could have a material adverse effect on our consolidated results of operations for the period in which the relevant matter is resolved or an accrual is determined to be required, on our consolidated financial condition or on our reputation.
We face litigation and governmental and client inquiries in connection with our execution of indirect foreign exchange trades with custody clients; these issues have adversely affected our revenue from such trading and may cause our revenue from such trading to decline in the future.
Our custody clients are not required to execute foreign exchange transactions with us. To the extent they execute foreign exchange trades with us, they generally execute a greater volume using our direct methods of execution at negotiated rates or spreads than they execute using our “indirect” methods at rates we establish. Where our clients or their investment managers choose to use our indirect foreign exchange execution methods, generally they elect that service for trades of smaller size or for currencies where regulatory or operational requirements cause trading in such currencies to present greater operational risk and costs for them. Given the nature of these trades and other features of the indirect foreign exchange trading in which we engage, we generally charge higher rates for indirect execution than we charge for other trades, including trades in the interbank currency market.
In October 2009, the Attorney General of the State of California commenced an action under the California False Claims Act and California Business and Professional Code related to services State Street provides to certain California state pension plans. The California Attorney General asserts that
the pricing of certain foreign exchange transactions for these pension plans was governed by the custody contracts for these plans and that our pricing was not consistent with the terms of those contracts and related disclosures to the plans, and that, as a result, State Street made false claims and engaged in unfair competition. The Attorney General asserts actual damages of approximately
$100 million
for periods from 2001 to 2009 and seeks additional penalties, including treble damages. This action is in the discovery phase.
We provide custody services to and engage in principal foreign exchange trading with government pension plans in other jurisdictions. Since the commencement of the litigation in California, attorneys general and other governmental authorities from a number of jurisdictions, as well as U.S. Attorney's offices, the U.S. Department of Labor and the SEC, have requested information or issued subpoenas in connection with inquiries into the pricing of our indirect foreign exchange trading. We continue to respond to such inquiries and subpoenas. Given that many of these inquiries are ongoing, we can provide no assurance that litigation or regulatory proceedings or actions will not be brought against us or as to the nature of the claims that might be alleged. Such litigation, proceedings or actions may be brought on theories similar to those advanced in California or on alternative theories of liability.
We engage in indirect foreign exchange trading with a broad range of custody clients in the U.S. and internationally. We have responded and are responding to information requests from a number of clients concerning our indirect foreign exchange rates. In February 2011, a putative class action was filed in federal court in Boston seeking unspecified damages, including treble damages, on behalf of all custodial clients that executed certain foreign exchange transactions with State Street from 1998 to 2009. The putative class action alleges, among other things, that the rates at which State Street executed foreign currency trades constituted an unfair and deceptive practice under Massachusetts law and a breach of the duty of loyalty. Two other putative class actions are currently pending in federal court in Boston alleging various violations of ERISA on behalf of all ERISA plans custodied with us that executed indirect foreign exchange trades with State Street from 1998 onward. The complaints allege that State Street caused class members to pay unfair and unreasonable rates for indirect foreign exchange trades with State Street. The complaints seek unspecified damages, disgorgement of profits, and other equitable relief. Other claims may be asserted in the future, including in response to developments in the actions discussed above or governmental proceedings.
31
We cannot provide any assurance as to the outcome of the pending proceedings, or whether other proceedings might be commenced against us by clients or government authorities. For example, the New York Attorney General and the United States Attorney for the Southern District of New York, each of which has brought indirect foreign exchange-related legal proceedings against one of our competitors, have made inquiries to us about our indirect foreign exchange execution methods. We expect that plaintiffs will seek to recover their share of all or a portion of the revenue that we have recorded from providing indirect foreign exchange trades.
The following table summarizes our estimated total revenue worldwide from indirect foreign exchange trading for the years ended December 31:
|
(In millions)
|
Revenue from indirect foreign exchange trading
|
|||
|
2008
|
$
|
462
|
|
|
|
2009
|
369
|
|
||
|
2010
|
336
|
|
||
|
2011
|
331
|
|
||
|
2012
|
248
|
|
||
|
2013
|
285
|
|
||
|
2014
|
246
|
|
||
We believe that the amount of our revenue from such trading has been of a similar or lesser order of magnitude for many years prior to 2008. Our revenue calculations related to indirect foreign exchange trading reflect a judgment concerning the relationship between the rates we charge for indirect foreign exchange execution and indicative interbank market rates near in time to execution. Our revenue from foreign exchange trading generally depends on the difference between the rates we set for those indirect trades and indicative interbank market rates at the time of settlement of the trade.
We cannot predict the outcome of any pending matters or whether a court, in the event of an adverse resolution, would consider our revenue to be the appropriate measure of damages. In each of the third and fourth quarters of 2014, we announced charges (due to legal accruals recorded in those quarters) reflecting our intention to seek to resolve some, but not all, of the outstanding and potential claims arising out of our indirect foreign exchange client activities. With respect to those legal accruals: (1) we are engaged in discussions with some, but not all, of the governmental agencies and civil litigants that we have described in connection with these matters regarding potential settlements of their outstanding or potential claims; (2) there can be no assurance that we will
reach a settlement in any of these matters, that the cost of such settlements would not materially exceed such accruals, or that other claims will not be asserted; and (3) we do not currently intend to seek to negotiate settlements with respect to all outstanding and potential claims, and our current efforts, even if successful, will not address all of our potential material legal exposure arising out of our indirect foreign exchange client activities. The resolution of pending matters or the resolution of any that may be initiated, filed or threatened could have a material adverse effect on our consolidated results of operations, our consolidated financial condition and our reputation.
The heightened regulatory and media scrutiny on indirect foreign exchange services has resulted in clients reducing the volume of indirect foreign exchange trades, which has had and is anticipated to continue to have an adverse impact on our revenue from, and the profitability of, our indirect foreign exchange trading. Some custody clients or their investment managers have elected to change the manner in which they execute foreign exchange with us or have decided not to use our foreign exchange execution methods. We do not expect the market, regulatory and other pressures on our indirect foreign exchange services to decrease in 2015. We intend to continue to offer our custody clients a range of execution options for their foreign exchange needs; however, the range of services, costs and profitability vary by execution option. We cannot provide assurance that clients or investment managers who choose to use less or none of our indirect foreign exchange trading, or to use alternatives to our existing indirect foreign exchange trading, will choose the alternatives offered by us. Accordingly, our revenue earned from providing these foreign exchange trading services may decline further.
We may incur losses arising from our investments in sponsored investment funds, which could be material to our consolidated results of operations in the periods incurred.
In the normal course of business, we manage various types of sponsored investment funds through SSGA. The services we provide to these sponsored investment funds generate management fee revenue, as well as servicing fees from our other businesses. From time to time, we may invest cash in the funds, which we refer to as seed capital, in order for the funds to establish a performance history for newly launched strategies. These funds may meet the definition of variable interest entities, as defined by GAAP, and if we are deemed to be the primary beneficiary of these funds, we may be required to consolidate these funds in our financial statements under GAAP. The funds follow specialized
32
investment company accounting rules which prescribe fair value for the underlying investment securities held by the funds.
In the aggregate, we expect any financial losses that we realize over time from these seed investments to be limited to the actual fair value of the amount invested in the consolidated fund, which is based on the fair value of the underlying investment securities held by the funds. However, in the event of a fund wind-down, gross gains and losses of the fund may be recognized for financial accounting purposes in different periods during the time the fund is consolidated but not wholly owned. Although we expect the actual economic loss to be limited to the amount invested, our losses in any period for financial accounting purposes could exceed the value of our economic interests in the fund and could exceed the value of our initial seed capital investment.
The net assets of any consolidated fund are solely available to settle the liabilities of the fund and to settle any investors’ ownership redemption requests, including any seed capital invested in the fund by State Street. We are not contractually required to provide financial or any other support to any of our sponsored investment funds and are subject to regulations that prohibit or limit our ability to do so. In addition, neither creditors nor equity investors in the sponsored investment funds have any recourse to State Street’s general credit.
In instances where we are not deemed to be the primary beneficiary of the sponsored investment fund, we do not include the funds in our consolidated financial statements. Our risk of loss associated with these unconsolidated funds primarily represents our seed capital investment, which could become realized as a result of poor investment performance. However, the amount of loss we may recognize during any period would be limited to the carrying amount of our investment.
Our reputation and business prospects may be damaged if our clients incur substantial losses in investment pools in which we act as agent or are restricted in redeeming their interests in these investment pools.
We manage assets on behalf of clients in several forms, including in collective investment pools, money market funds, securities finance collateral pools, cash collateral and other cash products and short-term investment funds. In addition to the impact on the market value of client portfolios, at various times since 2007, the illiquidity and volatility of both the global fixed-income and equity markets have negatively affected the investment performance of certain of our products and our ability to manage client inflows and outflows from our pooled investment vehicles.
Our management of collective investment pools on behalf of clients exposes us to reputational risk and operational losses. If our clients incur substantial investment losses in these pools, receive redemptions as in-kind distributions rather than in cash, or experience significant under-performance relative to the market or our competitors' products, our reputation could be significantly harmed, which harm could significantly and adversely affect the prospects of our associated business units. Because we often implement investment and operational decisions and actions over multiple investment pools to achieve scale, we face the risk that losses, even small losses, may have a significant effect in the aggregate.
Within our investment management business, we manage investment pools, such as mutual funds and collective investment funds that generally offer our clients the ability to withdraw their investments on short notice, generally daily or monthly. This feature requires that we manage those pools in a manner that takes into account both maximizing the long-term return on the investment pool and retaining sufficient liquidity to meet reasonably anticipated liquidity requirements of our clients. The importance of maintaining liquidity varies by product type, but it is a particularly important feature in money market funds and other products designed to maintain a constant net asset value of $1.00.
During the market disruption that accelerated following the bankruptcy of Lehman Brothers, the liquidity in many asset classes, particularly short- and long-term fixed-income securities, declined dramatically, and providing liquidity to meet all client demands in these investment pools without adversely affecting the return to non-withdrawing clients became more difficult. In 2008, we imposed restrictions on cash redemptions from the agency lending collateral pools, as the per-unit market value of those funds' assets had declined below the constant $1.00 the funds employ to effect purchase and redemption transactions. Both the decline of the funds' net asset value below $1.00 and the imposition of restrictions on redemptions had a significant client, reputational and regulatory impact on us, and the recurrence of such or similar circumstances in the future could adversely impact our consolidated results of operations and financial condition. During this period, we also continued to process purchase and redemption of units of the collateral pools at $1.00 although the fair market value of the collateral pools' assets were less than $1.00. Our willingness in the future to continue to process purchases and redemptions from collateral pools at $1.00 when the fair market value of our collateral pools' assets is less than $1.00 could expose us to significant liability. Our unwillingness in the future to continue to process
33
purchases and redemptions from collateral pools at $1.00 when the fair market value of the collateral pools' assets are less than $1.00 could similarly expose us to significant liability.
In the case of SSGA funds that engage in securities lending, we implemented limitations, which were terminated in 2010, on the portion of an investor's interest in such fund that may be withdrawn during any month.
If higher than normal demands for liquidity from our clients were to return to post-Lehman-Brothers-bankruptcy levels or increase, managing the liquidity requirements of our collective investment pools could become more difficult. If such liquidity problems were to recur, our relationships with our clients may be adversely affected, and, we could, in certain circumstances, be required to consolidate the investment pools into our consolidated statement of condition; levels of redemption activity could increase; and our consolidated results of operations and business prospects could be adversely affected. In addition, if a money market fund that we manage were to have unexpected liquidity demands from investors in the fund that exceeded available liquidity, the fund could be required to sell assets to meet those redemption requirements, and selling the assets held by the fund at a reasonable price, if at all, may then be difficult.
While it is currently not our intention, and we do not have contractual or other obligations to do so, we have in the past guaranteed, and may in the future guarantee, liquidity to investors desiring to make withdrawals from a fund or otherwise take actions to mitigate the impact of market conditions on our clients and if permitted by applicable laws. Making a significant amount of such guarantees could adversely affect our own consolidated liquidity and financial condition. Because of the size of the investment pools that we manage, we may not have the financial ability or regulatory authority to support the liquidity or other demands of our clients. The extreme volatility in the equity markets has led to the potential for the return on passive and quantitative products to deviate from their target returns.
Any decision by us to provide financial support to an investment pool to support our reputation in circumstances where we are not statutorily or contractually obligated to do so could result in the recognition of significant losses, could adversely affect the regulatory view of our capital levels or plans and could, in certain situations, require us to consolidate the investment pools into our consolidated statement of condition. Any failure of the pools to meet redemption requests, or under-performance of our pools relative to similar products
offered by our competitors, could harm our business and our reputation.
The potential reputational impact from any decision to support or not to support a fund, and from restrictions on redemptions, is most acute in connection with money market funds and other cash products that employ a constant net asset value of $1.00 for purposes of effecting subscriptions and redemptions. To some degree investors in such cash products rely upon an implicit assumption that the sponsors of the investment vehicle will support the $1.00 valuation of a cash fund. While there can be no assurance that we will not change our policy in the future, we have disclosed in the offering documents for such cash products that we do not intend to support the $1.00 valuation of such products. If such cash funds were in the future to have valuations of less than $1.00, such occurrence could have a material adverse effect on our reputation and our clients that invested in such funds.
Our businesses may be negatively affected by adverse publicity or other reputational harm.
Our relationship with many of our clients is predicated on our reputation as a fiduciary and a service provider that adheres to the highest standards of ethics, service quality and regulatory compliance. Adverse publicity, regulatory actions or fines, litigation, operational failures or the failure to meet client expectations or fiduciary or other obligations could materially and adversely affect our reputation, our ability to attract and retain clients or our sources of funding for the same or other businesses. For example, as discussed earlier in this “Risk Factors” section, we have experienced adverse publicity with respect to our indirect foreign exchange trading, and this adverse publicity has contributed to a shift of client volume to other foreign exchange execution methods. Similarly, regulatory and reputational issues in our transition management business in the U.K. in 2010 and 2011 adversely affected our revenue from that business in 2012, 2013 and 2014. Preserving and enhancing our reputation also depends on maintaining systems, procedures and controls that address known risks and regulatory requirements, as well as our ability to timely identify, understand and mitigate additional risks that arise due to changes in our businesses and the marketplaces in which we operate, the regulatory environment and client expectations.
Our controls and procedures may fail or be circumvented, our risk management policies and procedures may be inadequate, and operational risk could adversely affect our consolidated results of operations.
We may fail to identify and manage risks related to a variety of aspects of our business, including, but
34
not limited to, operational risk, interest-rate risk, foreign exchange risk, trading risk, fiduciary risk, legal and compliance risk, liquidity risk and credit risk. We have adopted various controls, procedures, policies and systems to monitor and manage risk. While we currently believe that our risk management process is effective, we cannot provide assurance that those controls, procedures, policies and systems will always be adequate to identify and manage the internal and external, including service provider, risks in our various businesses. Risks that individuals, either employees or contractors, consciously circumvent established control mechanisms to, for example, exceed trading or investment management limitations, or commit fraud, are particularly challenging to manage through a control framework. The financial and reputational impact of control failures can be significant. Persistent or repeated issues with respect to controls may raise concerns among regulators regarding our culture, governance and control environment. While we seek to contractually limit our financial exposure to operational risk, the degree of protection that we are able to achieve varies, and our potential exposure may be greater than the revenue we anticipate that we will earn from the client relationship.
In addition, our businesses and the markets in which we operate are continuously evolving. We may fail to identify or fully understand the implications of changes in our businesses or the financial markets and fail to adequately or timely enhance our risk framework to address those changes. If our risk framework is ineffective, either because it fails to keep pace with changes in the financial markets, regulatory or industry requirements, our businesses, our counterparties, clients or service providers or for other reasons, we could incur losses, suffer reputational damage or find ourselves out of compliance with applicable regulatory or contractual mandates or expectations.
Operational risk is inherent in all of our business activities. As a leading provider of services to institutional investors, we provide a broad array of services, including research, investment management, trading services and investment servicing that expose us to operational risk. In addition, these services generate a broad array of complex and specialized servicing, confidentiality and fiduciary requirements, many of which involve the opportunity for human, systems or process errors. We face the risk that the control policies, procedures and systems we have established to comply with our operational requirements will fail, will be inadequate or will become outdated. We also face the potential for loss resulting from inadequate or failed internal processes, employee supervision or monitoring mechanisms, service-provider processes or other
systems or controls, which could materially affect our future consolidated results of operations. Given the volume and magnitude of transactions we process on a daily basis, operational losses represent a potentially significant financial risk for our business. Operational errors that result in us remitting funds to a failing or bankrupt entity may be irreversible, and may subject us to losses.
We may also be subject to disruptions from external events that are wholly or partially beyond our control, which could cause delays or disruptions to operational functions, including information processing and financial market settlement functions. In addition, our clients, vendors and counterparties could suffer from such events. Should these events affect us, or the clients, vendors or counterparties with which we conduct business, our consolidated results of operations could be negatively affected. When we record balance sheet accruals for probable and estimable loss contingencies related to operational losses, we may be unable to accurately estimate our potential exposure, and any accruals we establish to cover operational losses may not be sufficient to cover our actual financial exposure, which could have a material adverse effect on our consolidated results of operations.
The quantitative models we use to manage our business may contain errors that result in inadequate risk assessments, inaccurate valuations or poor business decisions, and lapses in disclosure controls and procedures or internal control over financial reporting could occur, any of which could result in material harm
.
We use quantitative models to help manage many different aspects of our businesses. As an input to our overall assessment of capital adequacy, we use models to measure the amount of credit risk, market risk, operational risk, interest-rate risk and business risk we face. During the preparation of our consolidated financial statements, we sometimes use models to measure the value of asset and liability positions for which reliable market prices are not available. We also use models to support many different types of business decisions including trading activities, hedging, asset-and-liability management and whether to change business strategy. In all of these uses, the underlying model or model assumptions, or inadequate model assumptions, could result in unanticipated and adverse consequences, including material loss and material non-compliance with regulatory requirements or expectations. Because of our widespread usage of models, potential limitations in models pose an ongoing risk to us.
We also may fail to accurately quantify the magnitude of the risks we face. Our measurement
35
methodologies rely on many assumptions and historical analyses and correlations. These assumptions may be incorrect, and the historical correlations on which we rely may not continue to be relevant. Consequently, the measurements that we make for regulatory purposes may not adequately capture or express the true risk profiles of our businesses. Moreover, as businesses and markets evolve, our measurements may not accurately reflect this evolution. While our risk measures may indicate sufficient capitalization, they may underestimate the level of capital necessary to conduct our businesses.
Additionally, our disclosure
controls and procedures may not be effective in every
circumstance, and, similarly, it is possible we may identify a material weakness or significant deficiency in internal control over financial reporting. Any such lapses or deficiencies may materially and adversely affect our business and consolidated results of operations or consolidated financial condition, restrict our ability to access the capital markets, require us to expend significant resources to correct the lapses or deficiencies, expose us to regulatory or legal proceedings, subject us to fines, penalties or judgments or harm our reputation.
Cost shifting to non-U.S. jurisdictions may expose us to increased operational risk and reputational harm and may not result in expected cost savings.
We actively strive to achieve cost savings by shifting certain business processes and business support functions to lower-cost geographic locations, such as Poland, India and China. We may accomplish this shift by establishing operations in lower-cost locations, by outsourcing to vendors in various jurisdictions or through joint ventures. This effort exposes us to the risk that we may not maintain service quality, control or effective management within these operations. In addition, we are exposed to the relevant macroeconomic, political and similar risks generally involved in doing business in those jurisdictions. The increased elements of risk that arise from conducting certain operating processes in some jurisdictions could lead to an increase in reputational risk. During periods of transition, greater operational risk and client concern exist with respect to maintaining a high level of service delivery. The extent and pace at which we are able to move functions to lower-cost locations may also be affected by regulatory and client acceptance issues. Such relocation of functions also entails costs, such as technology, real estate and restructuring expenses, that may offset or exceed the expected financial benefits of the lower-cost locations. In addition, the financial benefits of lower-cost locations may diminish over time.
Development of new products and services may impose additional costs on us and may expose us to increased operational risk.
Our financial performance depends, in part, on our ability to develop and market new and innovative services and to adopt or develop new technologies that differentiate our products or provide cost efficiencies, while avoiding increased related expenses. The introduction of new products and services can entail significant time and resources, including regulatory approvals. Substantial risks and uncertainties are associated with the introduction of new products and services, including technical and control requirements that may need to be developed and implemented, rapid technological change in the industry, our ability to access technical and other information from our clients and the significant and ongoing investments required to bring new products and services to market in a timely manner at competitive prices. Our failure to manage these risks and uncertainties also exposes us to enhanced risk of operational lapses which may result in the recognition of financial statement liabilities. Regulatory and internal control requirements, capital requirements, competitive alternatives, vendor relationships and shifting market preferences may also determine if such initiatives can be brought to market in a manner that is timely and attractive to our clients. Failure to successfully manage these risks in the development and implementation of new products or services could have a material adverse effect on our business and reputation, as well as on our consolidated results of operations and financial condition.
We depend on information technology, and any failures of or damage to, attack on or unauthorized access to our information technology systems or facilities, or those of third parties with which we do business, including as a result of cyber-attacks, could result in significant limits on our ability to conduct our operations and activities, costs and reputational damage.
Our businesses depend on information technology infrastructure, both internal and external, to, among other things, record and process a large volume of increasingly complex transactions and other data, in many currencies, on a daily basis, across numerous and diverse markets and jurisdictions. Since 2012, several financial services firms have suffered successful cyber-attacks launched both domestically and from abroad, resulting in the disruption of services to clients, loss or misappropriation of sensitive or private data and reputational harm. We also have been subjected to cyber-attack, and although we have not suffered a material breach of our systems, it is possible that we could suffer such a breach in the future. We may not
36
implement effective systems and other measures to effectively prevent or mitigate the full diversity of cyber-threats or improve and adapt such systems and measures as such threats evolve and advance.
Our computer, communications, data processing, networks, backup, business continuity or other operating, information or technology systems and facilities, including those that we outsource to other providers, may fail to operate properly or become disabled, overloaded or damaged as a result of a number of factors, including events that are wholly or partially beyond our control, which could adversely affect our ability to process transactions, provide services or maintain systems availability, maintain compliance and internal controls or otherwise appropriately conduct our business activities. For example, there could be sudden increases in transaction or data volumes, electrical or telecommunications outages, cyber-attacks or employee or contractor error or malfeasance.
The third parties with which we do business, which facilitate our business activities or with whom we otherwise engage or interact, including financial intermediaries and technology infrastructure and service providers, are also susceptible to the foregoing risks (including regarding the third parties with which they are similarly interconnected or on which they otherwise rely), and our or their business operations and activities may therefore be adversely affected, perhaps materially, by failures, terminations, errors or malfeasance by, or attacks or constraints on, one or more financial, technology, infrastructure or government institutions or intermediaries with whom we or they are interconnected or conduct business.
In particular, we, like other financial services firms, will continue to face increasing cyber threats, including computer viruses, malicious code, distributed denial of service attacks, phishing attacks, information security breaches or employee or contractor error or malfeasance that could result in the unauthorized release, gathering, monitoring, misuse, loss or destruction of our, our clients' or other parties' confidential, personal, proprietary or other information or otherwise disrupt, compromise or damage our or our clients' or other parties' business assets, operations and activities. Our status as a global systemically important financial institution may enhance the risk that we are targeted by such cyber-security threats. We therefore could experience significant related costs and exposures, including lost or constrained ability to provide our services or maintain systems availability to clients, regulatory inquiries, enforcements, actions and fines, litigation, damage to our reputation or property and enhanced competition.
Due to our dependence on technology and the important role it plays in our business operations, we must persist in improving and updating our information technology infrastructure. Updating these systems and facilities can require significant resources and often involves implementation, integration and security risks that could cause financial, reputational and operational harm. However, failing to properly respond to and invest in changes and advancements in technology can limit our ability to attract and retain clients, prevent us from offering similar products and services as those offered by our competitors and inhibit our ability to meet regulatory requirements.
Any theft, loss or other misappropriation of the confidential information we possess could have an adverse impact on our business and could subject us to regulatory actions, litigation and other adverse effects.
Our businesses and relationships with clients are dependent on our ability to maintain the confidentiality of our and our clients' trade secrets and confidential information (including client transactional data and personal data about our employees, our clients and our clients' clients). Unauthorized access to such information may occur, resulting in its theft, loss or other misappropriation. Any theft, loss or other misappropriation of confidential information could have a material adverse impact on our competitive position, our relationships with our clients and our reputation and could subject us to regulatory inquiries, enforcement and fines, civil litigation and possible financial liability or costs.
We may not be able to protect our intellectual property, and we are subject to claims of third-party intellectual property rights.
Our potential inability to protect our intellectual property and proprietary technology effectively may allow competitors to duplicate our technology and products and may adversely affect our ability to compete with them. To the extent that we do not protect our intellectual property effectively through patents or other means, other parties, including former employees, with knowledge of our intellectual property may leave and seek to exploit our intellectual property for their own or others' advantage. In addition, we may infringe on claims of third-party patents, and we may face intellectual property challenges from other parties. We may not be successful in defending against any such challenges or in obtaining licenses to avoid or resolve any intellectual property disputes. Third-party intellectual rights, valid or not, may also impede our deployment of the full scope of our products and service capabilities in all jurisdictions in which we operate or
37
market our products and services. The intellectual property of an acquired business may be an important component of the value that we agree to pay for such a business. However, such acquisitions are subject to the risks that the acquired business may not own the intellectual property that we believe we are acquiring, that the intellectual property is dependent on licenses from third parties, that the acquired business infringes on the intellectual property rights of others, or that the technology does not have the acceptance in the marketplace that we anticipated.
Competition for our employees is intense, and we may not be able to attract and retain the highly skilled people we need to support our business.
Our success depends, in large part, on our ability to attract and retain key people. Competition for the best people in most activities in which we engage can be intense, and we may not be able to hire people or retain them, particularly in light of challenges associated with evolving compensation restrictions applicable, or which may become applicable, to banks and some asset managers and that potentially are not applicable to other financial services firms in all jurisdictions. The unexpected loss of services of key personnel, both in business units and control functions, could have a material adverse impact on our business because of their skills, their knowledge of our markets, operations and clients, their years of industry experience and, in some cases, the difficulty of promptly finding qualified replacement personnel. Similarly, the loss of key employees, either individually or as a group, could adversely affect our clients' perception of our ability to continue to manage certain types of investment management mandates or to provide other services to them.
We are subject to intense competition in all aspects of our business, which could negatively affect our ability to maintain or increase our profitability.
The markets in which we operate across all facets of our business are both highly competitive and global. These markets are changing as a result of new and evolving laws and regulations applicable to financial services institutions. Regulatory-driven market changes cannot always be anticipated, and may adversely affect the demand for, and profitability of, the products and services that we offer. In addition, new market entrants and competitors may address changes in the markets more rapidly than we do, or may provide clients with a more attractive offering of products and services, adversely affecting our business. We have also experienced, and anticipate that we will continue to experience, pricing pressure in many of our core businesses, particularly
our custodial and investment management services. Many of our businesses compete with other domestic and international banks and financial services companies, such as custody banks, investment advisors, broker/dealers, outsourcing companies and data processing companies. Further consolidation within the financial services industry could also pose challenges to us in the markets we serve, including potentially increased downward pricing pressure across our businesses.
Some of our competitors, including our competitors in core services, have substantially greater capital resources than we do or are not subject to as stringent capital or other regulatory requirements as are we. In some of our businesses, we are service providers to significant competitors. These competitors are in some instances significant clients, and the retention of these clients involves additional risks, such as the avoidance of actual or perceived conflicts of interest and the maintenance of high levels of service quality and intra-company confidentiality. The ability of a competitor to offer comparable or improved products or services at a lower price would likely negatively affect our ability to maintain or increase our profitability. Many of our core services are subject to contracts that have relatively short terms or may be terminated by our client after a short notice period. In addition, pricing pressures as a result of the activities of competitors, client pricing reviews, and rebids, as well as the introduction of new products, may result in a reduction in the prices we can charge for our products and services.
Acquisitions, strategic alliances, joint ventures and divestitures pose risks for our business.
As part of our business strategy, we acquire complementary businesses and technologies, enter into strategic alliances and joint ventures and divest portions of our business. We undertake transactions of varying sizes to, among other reasons, expand our geographic footprint, access new clients, technologies or services, develop closer or more collaborative relationships with our business partners, efficiently deploy capital or leverage cost savings or other business or financial opportunities. We may not achieve the expected benefits of these transactions, which could result in increased costs, lowered revenues, ineffective deployment of capital, regulatory concerns, exit costs or diminished competitive position or reputation.
Transactions of this nature also involve a number of risks and financial, accounting, tax, regulatory, managerial, operational, cultural and employment challenges, which could adversely affect our consolidated results of operations and financial condition. For example, the businesses that we
38
acquire or our strategic alliances or joint ventures may under-perform relative to the price paid or the resources committed by us; we may not achieve anticipated cost savings; or we may otherwise be adversely affected by acquisition-related charges. Further, past acquisitions have resulted in the recognition of goodwill and other significant intangible assets in our consolidated statement of condition. These assets are not eligible for inclusion in regulatory capital under applicable requirements. In addition, we may be required to record impairment in our consolidated statement of income in future periods if we determine that the value of these assets has declined. In the fourth quarter of 2014, we recorded a $9 million impairment for that reason.
Through our acquisitions or joint ventures, we may also assume unknown or undisclosed business, operational, tax, regulatory and other liabilities, fail to properly assess known contingent liabilities or assume businesses with internal control deficiencies. While in most of our transactions we seek to mitigate these risks through, among other things, due diligence and indemnification provisions, these or other risk-mitigating provisions we put in place may not be sufficient to address these liabilities and contingencies.
Various regulatory approvals or consents are generally required prior to closing of these transactions, which may include approvals of the Federal Reserve and other domestic and non-U.S. regulatory authorities. These regulatory authorities may impose conditions on the completion of the acquisition or require changes to its terms that materially affect the terms of the transaction or our ability to capture some of the opportunities presented by the transaction. Any such conditions, or any associated regulatory delays, could limit the benefits of the transaction. Acquisitions or joint ventures we announce may not be completed if we do not receive the required regulatory approvals, if regulatory approvals are significantly delayed or if other closing conditions are not satisfied.
The integration of our acquisitions results in risks to our business and other uncertainties.
The integration of acquisitions presents risks that differ from the risks associated with our ongoing operations. Integration activities are complicated and time consuming and can involve significant unforeseen costs. We may not be able to effectively assimilate services, technologies, key personnel or businesses of acquired companies into our business or service offerings as anticipated, alliances may not be successful, and we may not achieve related revenue growth or cost savings. We also face the risk of being unable to retain, or cross-sell our products or services to, the clients of acquired
companies or joint ventures. Acquisitions of investment servicing businesses entail information technology systems conversions, which involve operational risks and may result in client dissatisfaction and defection. Clients of investment servicing businesses that we have acquired may be competitors of our non-custody businesses. The loss of some of these clients or a significant reduction in the revenues generated from them, for competitive or other reasons, could adversely affect the benefits that we expect to achieve from these acquisitions or cause impairment to goodwill and other intangibles.
With any acquisition, the integration of the operations and resources of the businesses could result in the loss of key employees, the disruption of our and the acquired company's ongoing businesses or inconsistencies in standards, controls, procedures or policies that could adversely affect our ability to maintain relationships with clients or employees or to achieve the anticipated benefits of the acquisition. Integration efforts may also divert management attention and resources.
Long-term contracts expose us to pricing and performance risk.
We enter into long-term contracts to provide middle office or investment manager and alternative investment manager operations outsourcing services to clients, primarily for conversions, including services related but not limited to certain trading activities, cash reporting, settlement and reconciliation activities, collateral management and information technology development. We also enter into longer-term arrangements with respect to custody, fund administration and depository services. These arrangements generally set forth our fee schedule for the term of the contract and, absent a change in service requirements, do not permit us to re-price the contract for changes in our costs or for market pricing. The long-term contracts for these relationships require, in some cases, considerable up-front investment by us, including technology and conversion costs, and carry the risk that pricing for the products and services we provide might not prove adequate to generate expected operating margins over the term of the contracts.
The profitability of these contracts is largely a function of our ability to accurately calculate pricing for our services, efficiently assume our contractual responsibilities in a timely manner, control our costs and maintain the relationship with the client for an adequate period of time to recover our up-front investment. Our estimate of the profitability of these arrangements can be adversely affected by declines in the assets under the clients' management, whether due to general declines in the securities markets or client-specific issues. In addition, the profitability of
39
these arrangements may be based on our ability to cross-sell additional services to these clients, and we may be unable to do so.
Performance risk exists in each contract, given our dependence on successful conversion and implementation onto our own operating platforms of the service activities provided. Our failure to meet specified service levels or implementation timelines may also adversely affect our revenue from such arrangements, or permit early termination of the contracts by the client. If the demand for these types of services were to decline, we could see our revenue decline.
Changes in accounting standards may be difficult to predict and may adversely affect our consolidated financial statements.
New accounting standards, or changes to existing accounting standards, resulting both from initiatives of the Financial Accounting Standards Board, or FASB, or their convergence efforts with the International Accounting Standards Board, as well as changes in the interpretation of existing accounting standards, by the FASB or the SEC or otherwise reflected in GAAP, potentially could affect our consolidated results of operations, cash flows and financial condition. These changes are difficult to predict, and can materially affect how we record and report our consolidated results of operations, cash flows, financial condition and other financial information. In some cases, we could be required to apply a new or revised standard retroactively, resulting in the revised treatment of certain transactions or activities, and, in some cases, the restatement of our consolidated financial statements for prior periods.
Changes in tax laws, rules or regulations, challenges to our tax positions with respect to historical transactions, and changes in the composition of our pre-tax earnings may increase our effective tax rate and thus adversely affect our consolidated financial statements.
Our businesses can be directly or indirectly affected by new tax legislation, the expiration of existing tax laws or the interpretation of existing tax laws worldwide. The U.S. federal government, state governments, including Massachusetts, and jurisdictions around the world continue to review proposals to amend tax laws, rules and regulations applicable to our business that could have a negative impact on our after-tax earnings. For example, the expiration at the end of 2014 of provisions of the U.S. tax laws that favorably affected the taxation of our non-U.S. operations could negatively affect our effective tax rate beginning in 2015. Although these U.S. tax laws have previously expired and been re-
enacted, it is uncertain whether they will be re-enacted again.
In the normal course of our business, we are subject to review by U.S. and non-U.S. tax authorities. A review by any such authority could result in an increase in our recorded tax liability. In addition to the aforementioned risks, our effective tax rate is dependent on the nature and geographic composition of our pre-tax earnings and could be negatively affected by changes in these factors.
We may incur losses as a result of unforeseen events, including terrorist attacks, natural disasters, the emergence of a pandemic or acts of embezzlement.
Acts of terrorism, natural disasters or the emergence of a pandemic could significantly affect our business. We have instituted disaster recovery and continuity plans to address risks from terrorism, natural disasters and pandemic; however, anticipating or addressing all potential contingencies is not possible for events of this nature. Acts of terrorism, either targeted or broad in scope, or natural disasters could damage our physical facilities, harm our employees and disrupt our operations. A pandemic, or concern about a possible pandemic, could lead to operational difficulties and impair our ability to manage our business. Acts of terrorism, natural disasters and pandemics could also negatively affect our clients, counterparties and service providers, as well as result in disruptions in general economic activity and the financial markets.
None.
ITEM 2.
PROPERTIES
We occupy a total of approximately 7.8 million square feet of office space and related facilities worldwide, of which approximately 6.9 million square feet are leased. Of the total leased space, approximately 2.7 million square feet are located in eastern Massachusetts. An additional 1.7 million square feet are located elsewhere throughout the U.S. and in Canada. We lease approximately 1.8 million square feet in the U.K. and elsewhere in Europe, and approximately 700,000 square feet in the Asia/Pacific region.
Our headquarters is located at State Street Financial Center, One Lincoln Street, Boston, Massachusetts, a 36-story office building. Various divisions of our two lines of business, as well as support functions, occupy space in this building. We lease the entire 1,025,000 square feet of the building, and a related underground parking garage, at One Lincoln Street, under 20-year non-cancellable capital leases expiring in 2023. A portion of the lease
40
payments is offset by subleases for approximately
127,000
square feet of the building.
In 2014, construction completed on the Channel Center, a build-to-suit office building located in Boston, designed to consolidate our staff from various eastern Massachusetts locations. We began leasing space in February and the entire 500,000 square feet of this building was leased by mid September. We occupy three buildings located in Quincy, Massachusetts, one of which we own and two of which we lease. The buildings, containing a total of approximately 1.1 million square feet (720,000 square feet owned and 380,000 square feet leased), function as State Street Bank's principal operations facilities.
We occupy other principal properties located in Missouri, New Jersey, New York, California and Ontario, composed of five leased buildings containing a total of approximately 1.0 million square feet, under leases expiring from June 2015 to August 2025. Significant properties in the U.K. and Europe include eight buildings located in England, Scotland, Poland, Ireland, Luxembourg, Germany, and Italy, containing approximately 1.2 million square feet under leases expiring from January 2019 through August 2034.
Principal properties located in China and Australia consist of three buildings containing approximately 379,000 square feet under leases expiring from September 2020 through May 2021.
We believe that our owned and leased facilities are suitable and adequate for our business needs. Additional information about our occupancy costs, including our commitments under non-cancelable leases, is provided in note
20
to the consolidated financial statements included under Item 8 of this Form 10-K.
The information required by this Item is provided under "Legal and Regulatory Matters" in note 11 to the consolidated financial statements included under Item 8 of this Form 10-K, and is incorporated herein by reference.
Not applicable.
EXECUTIVE OFFICERS OF THE REGISTRANT
The following table presents certain information with respect to each of our executive officers as of
February 20, 2015
.
|
Name
|
Age
|
Position
|
|||
|
Joseph L. Hooley
|
57
|
|
Chairman and Chief Executive Officer
|
||
|
Joseph C. Antonellis
|
60
|
|
Vice Chairman
|
||
|
Michael W. Bell
|
51
|
|
Executive Vice President and Chief Financial Officer
|
||
|
Jeffrey N. Carp
|
58
|
|
Executive Vice President, Chief Legal Officer and Secretary
|
||
|
Gunjan Kedia
|
44
|
|
Executive Vice President
|
||
|
John L. Klinck, Jr.
|
51
|
|
Executive Vice President
|
||
|
Andrew Kuritzkes
|
54
|
|
Executive Vice President and Chief Risk Officer
|
||
|
Sean P. Newth
|
39
|
|
Senior Vice President, Chief Accounting Officer and Controller
|
||
|
Peter O'Neill
|
56
|
|
Executive Vice President
|
||
|
Christopher Perretta
|
57
|
|
Executive Vice President
|
||
|
James S. Phalen
|
64
|
|
Vice Chairman
|
||
|
Scott F. Powers
|
55
|
|
President and Chief Executive Officer of State Street Global Advisors
|
||
|
Alison A. Quirk
|
53
|
|
Executive Vice President
|
||
|
Michael F. Rogers
|
57
|
|
President and Chief Operating Officer
|
||
|
Wai-Kwong Seck
|
59
|
|
Executive Vice President
|
||
All executive officers are appointed by the Board and hold office at the discretion of the Board. No family relationships exist among any of our directors and executive officers.
Mr. Hooley joined State Street in 1986 and currently serves as Chairman and Chief Executive Officer. He was appointed Chief Executive Officer in March 2010 and Chairman of the Board in January
2011. He served as our President and Chief Operating Officer from April 2008 until December 2014. From 2002 to April 2008, Mr. Hooley served as Executive Vice President and head of Investor Services and, in 2006, was appointed Vice Chairman and Global Head of Investment Servicing and Investment Research and Trading. Mr. Hooley was elected to serve on the Board of Directors effective October 22, 2009.
41
Mr. Antonellis joined State Street in 1991 and has served as head of all Europe and Asia/Pacific Global Services and Global Markets businesses since March 2010. Prior to this, in 2003, he was named head of Information Technology and Global Securities Services. In 2006, he was appointed Vice Chairman with additional responsibility as head of Investor Services in North America and Global Investment Manager Outsourcing Services.
Mr. Bell joined State Street in 2013 as Executive Vice President and Chief Financial Officer. Prior to joining State Street, Mr. Bell served as executive vice president and chief financial officer of Manulife Financial Corporation, a leading Canada-based financial services group with principal operations in Asia, Canada and the U.S., from 2009 to 2012. From 2002 to 2009, he served as executive vice president and chief financial officer at Cigna Corporation, a global health services organization where he had previously served in several senior management positions, including as President of Cigna Group Insurance.
Mr. Carp joined State Street in 2006 as Executive Vice President and Chief Legal Officer. Later in 2006, he was also appointed Secretary. From 2004 to 2005, Mr. Carp served as executive vice president and general counsel of Massachusetts Financial Services, an investment management and research company. From 1989 until 2004, Mr. Carp was a senior partner at the law firm of Hale and Dorr LLP, where he was an attorney since 1982. Mr. Carp served as State Street's interim Chief Risk Officer from February 2010 until September 2010.
Ms. Kedia joined State Street in 2008 as an executive vice president and is responsible for the Investment Servicing business in the Americas for mutual funds, insurance and institutional clients. Prior to joining State Street, Ms. Kedia previously was an executive vice president, global product management at Bank of New York Mellon. Additionally, Ms. Kedia was a partner with McKinsey & Company focusing on financial institutions and an associate with PriceWaterhouseCoopers.
Mr. Klinck joined State Street in 2006 and has served as Executive Vice President and global head of Corporate Development and Global Relationship Management since March 2010, prior to which he served as Executive Vice President and global head of Alternative Investment Solutions. Prior to joining State Street, Mr. Klinck was with Mellon Financial Corporation, a global financial services company, from 1997 to 2006. During that time, he served as vice chairman and president of its Investment Manager Solutions group and before that as chairman for Mellon Europe, where he was
responsible for the company’s investor services business in the region.
Mr. Kuritzkes joined State Street in 2010 as Executive Vice President and Chief Risk Officer. Prior to joining State Street, Mr. Kuritzkes was a partner at Oliver, Wyman & Company, an international management consulting firm, and led the firm’s Public Policy practice in North America. He joined Oliver, Wyman & Company in 1988, was a managing director in the firm’s London office from 1993 to 1997, and served as vice chairman of Oliver, Wyman & Company globally from 2000 until the firm’s acquisition by MMC in 2003. From 1986 to 1988, he worked as an economist and lawyer for the Federal Reserve Bank of New York.
Mr. Newth joined State Street in 2005 and has served as Senior Vice President, Chief Accounting Officer and Corporate Controller since October 2014. Prior to that, he held several senior positions in State Street's Accounting Department, including Director of Accounting Policy from 2009 to 2014 and Deputy Controller beginning in April 2014. Before joining State Street, Mr. Newth served in various transaction services, accounting advisory and assurance roles at KPMG, from 1997 to 2005.
Mr. O'Neill has served as Executive Vice President and head of Global Markets and Global Services in Europe, the Middle East and Africa since November 2012 and prior to that he served as head of Global Markets and Global Services in the Asia/Pacific region. He joined State Street in 1985 and has held several senior positions during his tenure, including his appointment in January 2000 as managing director of State Street Global Markets in Europe. This role was expanded in June 2006 to include responsibility for Investor Services for the U.K., Middle East and Africa.
Mr. Perretta joined State Street in 2007 as Executive Vice President and Chief Information Officer. Prior to joining State Street, from 2002 to 2007, Mr. Perretta was the chief information officer for General Electric Commercial Finance, where he had previously served in several senior management positions. Prior to that, Mr. Perretta was an associate partner at Arthur Anderson Consulting (now Accenture).
Mr. Phalen joined State Street in 1992 and in 2014 began serving as head of the Office of Regulatory Initiatives. He was appointed Vice Chairman in March 2014. Mr. Phalen served as Executive Vice President and head of Global Operations, Technology and Product Development from 2010 to 2014. Prior to that, starting in 2000, he served as Chairman and Chief Executive Officer of CitiStreet, a global benefits provider and retirement plan record keeper. In February 2005, he was
42
appointed head of Investor Services in North America. In 2006, he was appointed head of international operations for Investment Servicing and Investment Research and Trading, based in Europe. From January 2008 until May 2008, he served on an interim basis as President and Chief Executive Officer of SSGA, following which he returned to his role as head of international operations for Investment Servicing and Investment Research and Trading.
Mr. Powers joined State Street in 2008 as President and Chief Executive Officer of State Street Global Advisors. Prior to joining State Street, Mr. Powers served as Chief Executive Officer of Old Mutual US, the U.S. operating unit of London-based Old Mutual plc, an international savings and wealth management company, from 2001 through 2008.
Ms. Quirk joined State Street in 2002, and since January 2012 has served as Chief Human Resources and Citizenship Officer. She has served as Executive Vice President and head of Global Human Resources since March 2010. Prior to that, Ms. Quirk served as Executive Vice President in Global Human Resources and held various senior roles in that group.
Mr. Rogers joined State Street in 2007 as part of our acquisition of Investors Financial Services Corp., and was appointed President and Chief Operating Officer in December 2014. In that role, he is responsible for State Street Global Markets, State Street Global Services Americas, Information Technology, Global Operations, and Global Exchange, State Street’s data and analytics business. Prior to that, Mr. Rogers served as head of Global Markets and Global Services - Americas since November 2011 and served as head of Global Services, including alternative investment solutions, for all of the Americas since March 2010. Mr. Rogers was previously head of the Relationship Management group, a role which he held beginning in 2009. From State Street's acquisition of Investors Financial Services Corp. in July 2007 to 2009, Mr. Rogers headed the post-acquisition Investors Financial
Services Corp. business and its integration into State Street. Before joining State Street at the time of the acquisition, Mr. Rogers spent 27 years at Investors Financial Services Corp. and its predecessors
in various capacities, most recently as President beginning in 2001.
Mr. Seck joined State Street in 2011 as executive vice president and head of Global Markets and Global Services across Asia Pacific. Prior to joining State Street, Mr. Seck was chief financial officer of the Singapore Exchange for eight years. Previously he held senior-level positions in the Monetary Authority of Singapore, the Government of Singapore Investment Corporation, Lehman Brothers and DBS Bank.
|
ITEM 5.
|
MARKET FOR REGISTRANT’S COMMON EQUITY, RELATED STOCKHOLDER MATTERS AND ISSUER PURCHASES OF EQUITY SECURITIES
|
MARKET FOR REGISTRANT'S COMMON EQUITY
Our common stock is listed on the New York Stock Exchange under the ticker symbol STT. There were 3,049 shareholders of record as of
January 31, 2015
. The information required by this item concerning the market prices of, and dividends on, our common stock during the past two years is provided under “Quarterly Summarized Financial Information (Unaudited)” included under Item 8 of this Form 10-K, and is incorporated herein by reference.
In March
2014
, our Board of Directors approved a new common stock purchase program authorizing the purchase by us of up to
$1.70 billion
of our common stock from April 1, 2014 through March 31, 2015. As of
December 31, 2014
, we had approximately
$470 million
remaining under that program.
43
The following table presents purchases of our common stock and related information for each of the months in the quarter ended
December 31, 2014
. All shares of our common stock purchased during the quarter ended
December 31, 2014
were
purchased under the above-described Board-approved program. We may employ third-party broker/dealers to acquire shares on the open market in connection with our common stock purchase programs.
|
(Dollars in millions, except per share amounts, shares in thousands)
|
Total Number of Shares Purchased Under Publicly Announced Program
|
Average Price Paid Per Share
|
Approximate Dollar Value of Shares Purchased Under Publicly Announced Program
|
Approximate Dollar Value of Shares Yet to be Purchased Under Publicly Announced Program
|
|||||||||||
|
Period:
|
|||||||||||||||
|
October 1 - October 31, 2014
|
2,786
|
|
$
|
70.35
|
|
$
|
196
|
|
$
|
684
|
|
||||
|
November 1 - November 30, 2014
|
2,108
|
|
76.64
|
|
162
|
|
522
|
|
|||||||
|
December 1 - December 31, 2014
|
668
|
|
78.48
|
|
52
|
|
470
|
|
|||||||
|
Total
|
5,562
|
|
$
|
73.71
|
|
$
|
410
|
|
$
|
470
|
|
||||
Additional information about our common stock, including Board authorization with respect to purchases by us of our common stock, is provided under “Capital” in Management's Discussion and Analysis included under Item 7, and in note
13
to the consolidated financial statements included under Item 8, of this Form 10-K, and is incorporated herein by reference.
RELATED STOCKHOLDER MATTERS
As a bank holding company, our parent company is a legal entity separate and distinct from its principal banking subsidiary, State Street Bank, and its non-banking subsidiaries. The right of the parent company to participate as a shareholder in any distribution of assets of State Street Bank upon its liquidation, reorganization or otherwise is subject to the prior claims by creditors of State Street Bank, including obligations for federal funds purchased and securities sold under repurchase agreements and deposit liabilities.
Payment of dividends by State Street Bank is subject to the provisions of the Massachusetts banking law, which provide that State Street Bank's Board of Directors may declare, from State Street Bank's "net profits," as defined below, cash dividends annually, semi-annually or quarterly (but not more frequently) and can declare non-cash dividends at any time. Under Massachusetts banking law, for purposes of determining the amount of cash dividends that are payable by State Street Bank, “net profits” is defined as an amount equal to the remainder of all earnings from current operations plus actual recoveries on loans and investments and other assets, after deducting from the total thereof all current operating expenses, actual losses, accrued dividends on preferred stock, if any, and all federal and state taxes.
No dividends may be declared, credited or paid so long as there is any impairment of State Street
Bank's capital stock. The approval of the Massachusetts Commissioner of Banks is required if the total of all dividends declared by State Street Bank in any calendar year would exceed the total of its net profits for that year combined with its retained net profits for the preceding two years, less any required transfer to surplus or to a fund for the retirement of any preferred stock.
Under the Federal Reserve Act's Regulation H: Membership of State Banking Institutions in the Federal Reserve System, the approval of the Federal Reserve would be required for the payment of dividends by State Street Bank if the total amount of all dividends declared by State Street Bank in any calendar year, including any proposed dividend, would exceed the total of its net income for such calendar year as reported in State Street Bank's
Consolidated Reports of Condition and Income for a Bank with Domestic and Foreign Offices Only - FFIEC 031
, commonly referred to as the “Call Report,” as submitted through the Federal Financial Institutions Examination Council and provided to the Federal Reserve, plus its “retained net income” for the preceding two calendar years. For these purposes, “retained net income,” as of any date of determination, is defined as an amount equal to State Street Bank's net income (as reported in its Call Reports for the calendar year in which retained net income is being determined) less any dividends declared during such year. In determining the amount of dividends that are payable, the total of State Street Bank's net income for the current year and its retained net income for the preceding two calendar years is reduced by any net losses incurred in the current or preceding two-year period and by any required transfers to surplus or to a fund for the retirement of preferred stock.
Prior Federal Reserve approval also must be obtained if a proposed dividend would exceed State Street Bank's “undivided profits” (retained earnings) as reported in its Call Reports. State Street Bank may
44
include in its undivided profits amounts contained in its surplus account, if the amounts reflect transfers of undivided profits made in prior periods and if the Federal Reserve's approval for the transfer back to undivided profits has been obtained.
Under the prompt corrective action, or PCA, provisions adopted pursuant to the FDIC Improvement Act of 1991, State Street Bank may not pay a dividend when it is deemed, under the PCA framework, to be under-capitalized, or when the payment of the dividend would cause State Street Bank to be under-capitalized. If State Street Bank is under-capitalized for purposes of the PCA framework, it must cease paying dividends for so long as it is deemed to be under-capitalized. Once earnings have begun to improve and an adequate capital position has been restored, dividend payments may resume in accordance with federal and state statutory limitations and guidelines.
In
2014
, our parent company declared aggregate quarterly common stock dividends to its shareholders of
$1.16
per share, totaling approximately
$490 million
. In
2013
, our parent company declared aggregate quarterly common stock dividends to its shareholders of
$1.04
per share, totaling approximately
$463 million
. Currently, any payment of future common stock dividends by our parent company to its shareholders is subject to the review of our capital plan by the Federal Reserve in connection with its CCAR process. Information about dividends declared by our parent company and dividends from our subsidiary banks is provided under “Capital” in Management's Discussion and Analysis included under Item 7, and in note 15 to the consolidated financial statements included under Item 8, of this Form 10-K, and is incorporated herein by reference. Future dividend payments of State Street Bank and our non-banking subsidiaries cannot be determined at this time. In addition, refer to “Business - Supervision and Regulation - Capital
Planning, Stress Tests and Dividends” included under Item 1 of this Form 10-K and the risk factor titled “
Our business and capital-related activities, including our ability to return capital to shareholders and purchase our capital stock, may be adversely affected by our implementation of the revised regulatory capital and liquidity standards that we must meet under the Basel III final rule, the Dodd-Frank Act and other regulatory initiatives, or in the event our capital plan or post-stress capital ratios are determined to be insufficient as a result of regulatory capital stress testing
” included under Item 1A of this Form 10-K.
Information about our equity compensation plans is included under Item 12, and in note
14
to the consolidated financial statements included under Item 8, of this Form 10-K, and is incorporated herein by reference.
SHAREHOLDER RETURN PERFORMANCE PRESENTATION
The graph presented below compares the cumulative total shareholder return on State Street's common stock to the cumulative total return of the S&P 500 Index, the S&P Financial Index and the KBW Bank Index over a five-year period. The cumulative total shareholder return assumes the investment of $100 in State Street common stock and in each index on December 31, 2009 at the closing price on the last trading day of 2009, and also assumes reinvestment of common stock dividends. The S&P Financial Index is a publicly available measure of 85 of the Standard & Poor's 500 companies, representing 25 diversified financial services companies, 21 insurance companies, 22 real estate companies and 17 banking companies. The KBW Bank Index seeks to reflect the performance of banks and thrifts that are publicly traded in the U.S., and is composed of 24 leading national money center and regional banks and thrifts.
45
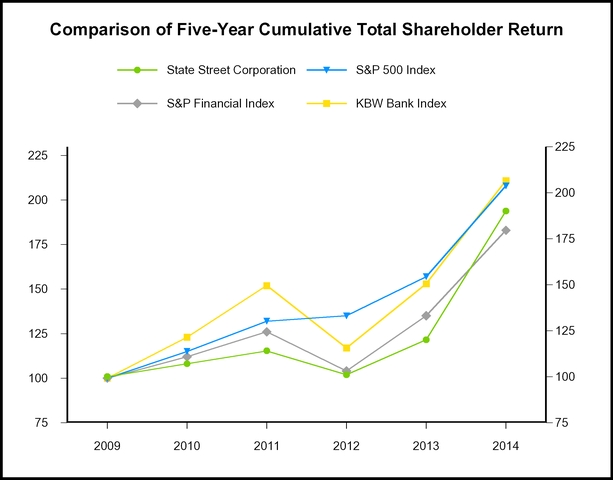
|
2009
|
2010
|
2011
|
2012
|
2013
|
2014
|
||||||||||||||||||
|
State Street Corporation
|
$
|
100
|
|
$
|
107
|
|
$
|
114
|
|
$
|
101
|
|
$
|
120
|
|
$
|
190
|
|
|||||
|
S&P 500 Index
|
100
|
|
115
|
|
132
|
|
135
|
|
157
|
|
208
|
|
|||||||||||
|
S&P Financial Index
|
100
|
|
112
|
|
126
|
|
104
|
|
135
|
|
183
|
|
|||||||||||
|
KBW Bank Index
|
100
|
|
123
|
|
152
|
|
117
|
|
153
|
|
211
|
|
|||||||||||
46
ITEM 6.
SELECTED FINANCIAL DATA
(Dollars in millions, except per share amounts or where otherwise noted)
|
FOR THE YEAR ENDED DECEMBER 31:
|
2014
|
2013
|
2012
|
2011
|
2010
|
||||||||||||||
|
Total fee revenue
|
$
|
8,031
|
|
$
|
7,590
|
|
$
|
7,088
|
|
$
|
7,194
|
|
$
|
6,540
|
|
||||
|
Net interest revenue
|
2,260
|
|
2,303
|
|
2,538
|
|
2,333
|
|
2,699
|
|
|||||||||
|
Gains (losses) related to investment securities, net
(1)
|
4
|
|
(9
|
)
|
23
|
|
67
|
|
(286
|
)
|
|||||||||
|
Total revenue
|
10,295
|
|
9,884
|
|
9,649
|
|
9,594
|
|
8,953
|
|
|||||||||
|
Provision for loan losses
|
10
|
|
6
|
|
(3
|
)
|
—
|
|
25
|
|
|||||||||
|
Expenses:
|
|
|
|||||||||||||||||
|
Compensation and employee benefits
|
4,060
|
|
3,800
|
|
3,837
|
|
3,820
|
|
3,524
|
|
|||||||||
|
Information systems and communications
|
976
|
|
935
|
|
844
|
|
776
|
|
713
|
|
|||||||||
|
Transaction processing services
|
784
|
|
733
|
|
702
|
|
732
|
|
653
|
|
|||||||||
|
Occupancy
|
461
|
|
467
|
|
470
|
|
455
|
|
463
|
|
|||||||||
|
Claims resolution
|
—
|
|
—
|
|
(362
|
)
|
—
|
|
—
|
|
|||||||||
|
Securities lending charge
|
—
|
|
—
|
|
—
|
|
—
|
|
414
|
|
|||||||||
|
Acquisition and restructuring costs, net
(2)
|
133
|
|
104
|
|
225
|
|
269
|
|
252
|
|
|||||||||
|
Other
|
1,413
|
|
1,153
|
|
1,170
|
|
1,006
|
|
823
|
|
|||||||||
|
Total expenses
|
7,827
|
|
7,192
|
|
6,886
|
|
7,058
|
|
6,842
|
|
|||||||||
|
Income before income tax expense
|
2,458
|
|
2,686
|
|
2,766
|
|
2,536
|
|
2,086
|
|
|||||||||
|
Income tax expense
(3)
|
421
|
|
550
|
|
705
|
|
616
|
|
530
|
|
|||||||||
|
Net income
|
$
|
2,037
|
|
$
|
2,136
|
|
$
|
2,061
|
|
$
|
1,920
|
|
$
|
1,556
|
|
||||
|
Adjustments to net income
(4)
|
(64
|
)
|
(34
|
)
|
(42
|
)
|
(38
|
)
|
(16
|
)
|
|||||||||
|
Net income available to common shareholders
|
$
|
1,973
|
|
$
|
2,102
|
|
$
|
2,019
|
|
$
|
1,882
|
|
$
|
1,540
|
|
||||
|
PER COMMON SHARE:
|
|||||||||||||||||||
|
Earnings per common share:
|
|||||||||||||||||||
|
Basic
|
$
|
4.65
|
|
$
|
4.71
|
|
$
|
4.25
|
|
$
|
3.82
|
|
$
|
3.11
|
|
||||
|
Diluted
|
4.57
|
|
4.62
|
|
4.20
|
|
3.79
|
|
3.09
|
|
|||||||||
|
Cash dividends declared
|
1.16
|
|
1.04
|
|
.96
|
|
.72
|
|
.04
|
|
|||||||||
|
Closing market price (at year end)
|
$
|
78.50
|
|
$
|
73.39
|
|
$
|
47.01
|
|
$
|
40.31
|
|
$
|
46.34
|
|
||||
|
AT YEAR END:
|
|||||||||||||||||||
|
Investment securities
|
$
|
112,636
|
|
$
|
116,914
|
|
$
|
121,061
|
|
$
|
109,153
|
|
$
|
94,130
|
|
||||
|
Average total interest-earning assets
|
209,054
|
|
178,101
|
|
167,615
|
|
147,657
|
|
126,256
|
|
|||||||||
|
Total assets
|
274,119
|
|
243,291
|
|
222,582
|
|
216,827
|
|
160,505
|
|
|||||||||
|
Deposits
|
209,040
|
|
182,268
|
|
164,181
|
|
157,287
|
|
98,345
|
|
|||||||||
|
Long-term debt
|
10,042
|
|
9,699
|
|
7,429
|
|
8,131
|
|
8,550
|
|
|||||||||
|
Total shareholders' equity
|
21,473
|
|
20,378
|
|
20,869
|
|
19,398
|
|
17,787
|
|
|||||||||
|
Assets under custody and administration (in billions)
|
28,188
|
|
27,427
|
|
24,371
|
|
21,807
|
|
21,527
|
|
|||||||||
|
Assets under management (in billions)
|
2,448
|
|
2,345
|
|
2,086
|
|
1,845
|
|
2,010
|
|
|||||||||
|
Number of employees
|
29,970
|
|
29,430
|
|
29,650
|
|
29,740
|
|
28,670
|
|
|||||||||
|
RATIOS:
|
|||||||||||||||||||
|
Return on average common shareholders' equity
|
9.8
|
%
|
10.5
|
%
|
10.3
|
%
|
10.0
|
%
|
9.5
|
%
|
|||||||||
|
Return on average assets
|
0.86
|
|
1.03
|
|
1.06
|
|
1.10
|
|
1.02
|
|
|||||||||
|
Common dividend payout
|
24.83
|
|
21.97
|
|
22.43
|
|
18.83
|
|
1.29
|
|
|||||||||
|
Average common equity to average total assets
|
8.5
|
|
9.7
|
|
10.1
|
|
10.9
|
|
10.8
|
|
|||||||||
|
Net interest margin, fully taxable-equivalent basis
|
1.16
|
|
1.37
|
|
1.59
|
|
1.67
|
|
2.24
|
|
|||||||||
|
Common equity tier 1 ratio
(5)
|
12.5
|
|
15.5
|
|
17.1
|
|
16.8
|
|
18.1
|
|
|||||||||
|
Tier 1 capital ratio
(5)
|
14.6
|
|
17.3
|
|
19.1
|
|
18.8
|
|
20.5
|
|
|||||||||
|
Total capital ratio
(5)
|
16.6
|
|
19.7
|
|
20.6
|
|
20.5
|
|
22.0
|
|
|||||||||
|
Tier 1 leverage ratio
(5)
|
6.4
|
|
6.9
|
|
7.1
|
|
7.3
|
|
8.2
|
|
|||||||||
(1)
Amount for
2012
reflected a $46 million loss from the sale of our Greek investment securities; amount for
2010
included a net loss of $344 million related to a repositioning of our investment portfolio.
(2)
Amounts for
2012
and
2011
reflected acquisition costs of $66 million and $71 million, respectively, offset by indemnification benefits of $40 million and $55 million, respectively, for the assumption of income tax liabilities related to the
2010
acquisition of the Intesa securities services business.
(3)
Amount for
2013
included a
$71 million
out-of-period benefit to adjust deferred taxes. Amounts for
2012
and
2011
reflected the net effects of certain tax matters (
$7 million
benefit and $55 million expense, respectively) associated with the
2010
Intesa acquisition. Amounts for
2011
and
2010
reflected discrete tax benefits of $103 million and $180 million, respectively, attributable to costs incurred in terminating former conduit asset structures.
(4)
Amounts for
2014
,
2013
,
2012
and
2011
represented preferred stock dividends and the allocation of earnings to participating securities using the two-class method. Amount for
2010
represented the allocation of earnings to participating securities using the two-class method.
(5)
Ratios for
2014
were calculated in conformity with the advanced approaches provisions of the Basel III final rule. Ratios for
2013
,
2012
,
2011
and
2010
were calculated in conformity with the provisions of Basel I. Ratios for
2014
are not directly comparable to ratios for prior years. Refer to note
15
to the consolidated financial statements included under Item 8 of this Form 10-K.
47
STATE STREET CORPORATION
MANAGEMENT'S DISCUSSION AND ANALYSIS OF FINANCIAL CONDITION
AND RESULTS OF OPERATIONS
Table Of Contents
48
|
ITEM 7.
|
MANAGEMENT’S DISCUSSION AND ANALYSIS OF FINANCIAL CONDITION AND RESULTS OF OPERATIONS
|
GENERAL
State Street Corporation, or the parent company, is a financial holding company headquartered in Boston, Massachusetts. Unless otherwise indicated or unless the context requires otherwise, all references in this Management's Discussion and Analysis to “State Street,” “we,” “us,” “our” or similar terms mean State Street Corporation and its subsidiaries on a consolidated basis. Our principal banking subsidiary is State Street Bank and Trust Company, or State Street Bank. As of
December 31, 2014
, we had consolidated total assets of
$274.12 billion
, consolidated total deposits of
$209.04 billion
, consolidated total shareholders' equity of
$21.47 billion
and
29,970
employees. With
$28.19 trillion
of assets under custody and administration and
$2.45 trillion
of assets under management as of
December 31, 2014
, we are a leading specialist in meeting the needs of institutional investors worldwide.
We have two lines of business:
Investment Servicing
provides services for mutual funds, collective investment funds and other investment pools, corporate and public retirement plans, insurance companies, foundations and endowments worldwide. Products include custody; product- and participant-level accounting; daily pricing and administration; master trust and master custody; record-keeping; cash management; foreign exchange, brokerage and other trading services; securities finance; deposit and short-term investment facilities; loans and lease financing; investment manager and alternative investment manager operations outsourcing; and performance, risk and compliance analytics to support institutional investors.
Investment Management
, through State Street Global Advisors, or SSGA, provides a broad array of investment management, investment research and investment advisory services to corporations, public funds and other sophisticated investors. SSGA offers active and passive asset management strategies across equity, fixed-income and cash asset classes. Products are distributed directly and through intermediaries using a variety of investment vehicles, including exchange-traded funds, or ETFs, such as the SPDR
®
ETF brand.
For financial and other information about our lines of business, refer to “Line of Business Information” included in this Management's Discussion and Analysis and note
24
to the consolidated financial statements included under Item 8 of this Form 10-K.
This Management's Discussion and Analysis should be read in conjunction with the consolidated financial statements and accompanying notes to consolidated financial statements included under Item 8 of this Form 10-K. Certain previously reported amounts presented in this Form 10-K have been reclassified to conform to current-year presentation.
We prepare our consolidated financial statements in conformity with accounting principles generally accepted in the U.S., referred to as GAAP. The preparation of financial statements in conformity with GAAP requires management to make estimates and assumptions in its application of certain accounting policies that materially affect the reported amounts of assets, liabilities, equity, revenue and expenses.
The significant accounting policies that require us to make judgments, estimates and assumptions that are difficult, subjective or complex about matters that are uncertain and may change in subsequent periods consist of accounting for fair value measurements; other-than-temporary impairment of investment securities; impairment of goodwill and other intangible assets; and contingencies. These significant accounting policies require the most subjective or complex judgments, and underlying estimates and assumptions could be subject to revision as new information becomes available. Additional information about these significant accounting policies is included under “Significant Accounting Estimates” in this Management's Discussion and Analysis.
Certain financial information provided in this Form 10-K, including this Management's Discussion and Analysis, is prepared on both a GAAP, or reported basis, and a non-GAAP, or operating basis, including certain non-GAAP measures used in the calculation of identified regulatory capital ratios. We measure and compare certain financial information on an operating basis, as we believe that this presentation supports meaningful comparisons from period to period and the analysis of comparable financial trends with respect to State Street's normal ongoing business operations. We believe that operating-basis financial information, which reports non-taxable revenue, such as interest revenue associated with tax-exempt investment securities, on a fully taxable-equivalent basis, facilitates an investor's understanding and analysis of State Street's underlying financial performance and trends in addition to financial information prepared and reported in conformity with GAAP.
We also believe that the use of certain non-GAAP measures in the calculation of identified regulatory capital ratios is useful in understanding State Street's capital position and is of interest to
49
MANAGEMENT’S DISCUSSION AND ANALYSIS OF FINANCIAL CONDITION
AND RESULTS OF OPERATIONS (Continued)
investors. Operating-basis financial information should be considered in addition to, not as a substitute for or superior to, financial information prepared in conformity with GAAP. Any non-GAAP, or operating-basis, financial information presented in this Form 10-K, including this Management’s Discussion and Analysis, is reconciled to its most directly comparable GAAP-basis measure.
This Management's Discussion and Analysis contains statements that are considered “forward-looking statements” within the meaning of U.S. securities laws. Forward-looking statements are based on our current expectations about financial performance, capital, market growth, acquisitions, joint ventures and divestitures, new technologies, services and opportunities and earnings, management's confidence in our strategies and other matters that do not relate strictly to historical facts. These forward-looking statements involve certain risks and uncertainties which could cause actual results to differ materially. We undertake no obligation to revise the forward-looking statements contained in this Management's Discussion and Analysis to reflect events after the time we file this Form 10-K with the SEC. Additional information about forward-looking statements and related risks and uncertainties is provided in “Risk Factors” included under Item 1A of this Form 10-K.
We provide additional disclosures required by applicable bank regulatory standards, including supplemental qualitative and quantitative information with respect to regulatory capital (including market risk associated with our trading activities), and summary results of semi-annual State Street-run stress tests which we conduct under the Dodd-Frank Wall Street Reform and Consumer Protection Act, or Dodd-Frank Act. These additional disclosures are accessible under "Filings and Reports" on the “Investor Relations” section of our corporate website at
www.statestreet.com/stockholder
. We have included our website address in this report as an inactive textual reference only. Information on our website is not incorporated by reference into this Form 10-K.
TABLE 1: OVERVIEW OF FINANCIAL RESULTS
|
Years Ended December 31,
|
2014
|
2013
|
2012
|
||||||||
|
(Dollars in millions, except per share amounts)
|
|||||||||||
|
Total fee revenue
|
$
|
8,031
|
|
$
|
7,590
|
|
$
|
7,088
|
|
||
|
Net interest revenue
|
2,260
|
|
2,303
|
|
2,538
|
|
|||||
|
Gains (losses) related to investment securities, net
|
4
|
|
(9
|
)
|
23
|
|
|||||
|
Total revenue
|
10,295
|
|
9,884
|
|
9,649
|
|
|||||
|
Provision for loan losses
|
10
|
|
6
|
|
(3
|
)
|
|||||
|
Total expenses
|
7,827
|
|
7,192
|
|
6,886
|
|
|||||
|
Income before income tax expense
|
2,458
|
|
2,686
|
|
2,766
|
|
|||||
|
Income tax expense
(1)
|
421
|
|
550
|
|
705
|
|
|||||
|
Net income
|
$
|
2,037
|
|
$
|
2,136
|
|
$
|
2,061
|
|
||
|
Adjustments to net income:
|
|||||||||||
|
Dividends on preferred stock
(2)
|
(61
|
)
|
(26
|
)
|
(29
|
)
|
|||||
|
Earnings allocated to participating securities
(3)
|
(3
|
)
|
(8
|
)
|
(13
|
)
|
|||||
|
Net income available to common shareholders
|
$
|
1,973
|
|
$
|
2,102
|
|
$
|
2,019
|
|
||
|
Earnings per common share:
|
|||||||||||
|
Basic
|
$
|
4.65
|
|
$
|
4.71
|
|
$
|
4.25
|
|
||
|
Diluted
|
4.57
|
|
4.62
|
|
4.20
|
|
|||||
|
Average common shares outstanding (in thousands):
|
|||||||||||
|
Basic
|
424,223
|
|
446,245
|
|
474,458
|
|
|||||
|
Diluted
|
432,007
|
|
455,155
|
|
481,129
|
|
|||||
|
Cash dividends declared per common share
|
$
|
1.16
|
|
$
|
1.04
|
|
$
|
.96
|
|
||
|
Return on average common equity
|
9.8
|
%
|
10.5
|
%
|
10.3
|
%
|
|||||
(1)
2013
included an out-of-period income tax benefit of
$71 million
to adjust deferred taxes.
Amount for
2012
reflected the net effect of certain tax matters ($7 million benefit) associated with the
2010
Intesa acquisition.
(2)
2014
included
$35 million
and
$26 million
related to Series D and Series C preferred stock, respectively. Amount for
2013
included
$26 million
related to Series C preferred stock. Amount for
2012
included $8 million related to Series C preferred stock and $21 million related to Series A preferred stock. Refer to note
13
to the consolidated financial statements included under Item 8 of this Form 10-K for additional information regarding our preferred stock dividends.
(3)
Refer to note
23
to the consolidated financial statements included under Item 8 of this Form 10-K.
The following “Highlights” and “Financial Results” sections provide information related to significant events, as well as highlights of our consolidated financial results for
2014
presented in
Table 1: Overview of Financial Results
. More detailed information about our consolidated financial results, including comparisons of our financial results for
2014
to those for
2013
, is provided under “Consolidated Results of Operations,” which follows these sections.
50
MANAGEMENT’S DISCUSSION AND ANALYSIS OF FINANCIAL CONDITION
AND RESULTS OF OPERATIONS (Continued)
Highlights
|
•
|
Total asset servicing and asset management fees increased
6%
and
9%
, respectively, in
2014
compared to
2013
, mainly the result of net new business installed and stronger global equity markets.
|
|
•
|
Diluted earnings per common share, EPS, decreased
1%
to
$4.57
in
2014
from
$4.62
in
2013
, primarily driven by increased fee revenue.
|
|
•
|
In
2014
, we purchased approximately
23.8 million
shares of our common stock at an average per-share cost of
$69.48
and an aggregate cost of approximately
$1.65 billion
. We have approximately
$470 million
under our current
$1.70 billion
common stock purchase program effective through March 2015.
|
Additional information with respect to our common stock purchase program is provided under "Financial Condition - Capital" in this Management's Discussion and Analysis.
|
•
|
We completed our Business Operations and Information Technology Transformation program at the end of
2014
, achieving, over the course of the program, greater than
$625 million
of total pre-tax savings on an annual basis with full effect in 2015, based on projected improvement from our total 2010 expenses from operations, all else being equal.
|
Additional information with respect to the program is provided under "Consolidated Results of Operations - Expenses" in this Management's Discussion and Analysis.
|
•
|
For the fourth quarter of 2014, we recorded a pre-tax charge of $115 million to increase our legal accrual associated with indirect foreign exchange matters. This accrual reflects a $65 million additional accrual that we announced on
February 20, 2015
. The effects of the additional accrual are reflected in the financial and other information reported in this Form 10-K. The additional accrual announced on
February 20, 2015
reflects continued negotiations in connection with our intention to seek to resolve some, but not all, of the outstanding and potential claims arising out of our indirect foreign exchange client activities. The total legal accrual associated with these matters as of the time of the filing of this Form 10-K is
$185 million
, all of which is included in the consolidated statement of income for the year ended
December 31, 2014
.
|
Financial Results
|
•
|
Total revenue increased
4%
in
2014
compared to
2013
, primarily due to the increase in fee revenue of
6%
compared to
2013
, partially offset by a decline in processing fees and other revenue and net interest revenue.
|
|
•
|
Total expenses in
2014
increased
9%
compared to
2013
, primarily driven by increases in other expenses, compensation and employee benefit expenses and transaction processing services.
|
|
•
|
In
2014
, we secured an estimated
$1.14 trillion
of new business in assets to be serviced; of that total, approximately
$767 billion
was installed prior to
December 31, 2014
, with the remaining balance expected to be installed in
2015
.
|
The new business not installed, totaling
$406 billion
by
December 31, 2014
, which consisted of $371 billion from 2014 and $35 billion from 2013, was not included in our assets under custody and administration as of that date, and had no impact on our servicing fee revenue in
2014
, as the assets are not included until their installation is complete and we begin to service them. Once installed, the assets generate servicing fee revenue in subsequent periods in which the assets are serviced.
|
•
|
We achieved net new assets to be managed of approximately
$28 billion
in
2014
, including
approximately
$15 billion
of new asset management business, that was awarded to SSGA but not installed as of
December 31, 2014
. This new business had no impact on our management fee revenue in 2014, but will be reflected in assets under management in future periods after installation and will generate management fee revenue in subsequent periods.
|
|
•
|
Return on average common shareholders' equity in
2014
decreased to
9.8%
from
10.5%
in
2013
. The decrease was primarily driven by an increase in preferred stock dividends in 2014 compared to 2013 as well as a decrease in net income in 2014 compared to 2013.
|
|
•
|
Our effective tax rate in
2014
was
17.2%
compared to
20.5%
in
2013
, which included the impact of an out-of-period income tax benefit. In addition to that out-of-period benefit, the decline was also attributable to the expansion of our tax-exempt investment securities portfolio, an increase in renewable
|
51
MANAGEMENT’S DISCUSSION AND ANALYSIS OF FINANCIAL CONDITION
AND RESULTS OF OPERATIONS (Continued)
energy investments and a greater benefit from our non-U.S. operations.
CONSOLIDATED RESULTS OF OPERATIONS
This section discusses our consolidated results of operations for
2014
compared to
2013
, as well as
2013
compared to
2012
, and should be read in conjunction with the consolidated financial statements and accompanying notes included under Item 8 of this Form 10-K.
Total Revenue
|
TABLE 2: TOTAL REVENUE
|
|||||||||||||||||
|
Years Ended December 31,
|
2014
|
2013
|
2012
|
% Change 2014 vs. 2013
|
% Change 2013 vs. 2012
|
||||||||||||
|
(Dollars in millions)
|
|||||||||||||||||
|
Fee revenue:
|
|||||||||||||||||
|
Servicing fees
|
$
|
5,129
|
|
$
|
4,819
|
|
$
|
4,414
|
|
6
|
%
|
9
|
%
|
||||
|
Management fees
|
1,207
|
|
1,106
|
|
993
|
|
9
|
|
11
|
|
|||||||
|
Trading services:
|
|
|
|||||||||||||||
|
Foreign exchange trading
|
607
|
|
589
|
|
511
|
|
3
|
|
15
|
|
|||||||
|
Brokerage and other trading services
|
477
|
|
505
|
|
525
|
|
(6
|
)
|
(4
|
)
|
|||||||
|
Total trading services
|
1,084
|
|
1,094
|
|
1,036
|
|
(1
|
)
|
6
|
|
|||||||
|
Securities finance
|
437
|
|
359
|
|
405
|
|
22
|
|
(11
|
)
|
|||||||
|
Processing fees and other
|
174
|
|
212
|
|
240
|
|
(18
|
)
|
(12
|
)
|
|||||||
|
Total fee revenue
|
8,031
|
|
7,590
|
|
7,088
|
|
6
|
|
7
|
|
|||||||
|
Net interest revenue:
|
|
||||||||||||||||
|
Interest revenue
|
2,652
|
|
2,714
|
|
3,014
|
|
(2
|
)
|
(10
|
)
|
|||||||
|
Interest expense
|
392
|
|
411
|
|
476
|
|
(5
|
)
|
(14
|
)
|
|||||||
|
Net interest revenue
|
2,260
|
|
2,303
|
|
2,538
|
|
(2
|
)
|
(9
|
)
|
|||||||
|
Gains (losses) related to investment securities, net
|
4
|
|
(9
|
)
|
23
|
|
|||||||||||
|
Total revenue
|
$
|
10,295
|
|
$
|
9,884
|
|
$
|
9,649
|
|
4
|
|
2
|
|
||||
Fee Revenue
Servicing and management fees collectively composed approximately
79%
of our total fee revenue in
2014
, compared to approximately
78%
in
2013
. The level of these fees is influenced by several factors, including the mix and volume of our assets under custody and administration and our assets under management, the value and type of securities positions held (with respect to assets under custody) and the volume of portfolio transactions, and the types of products and services used by our clients, and is generally affected by changes in worldwide equity and fixed-income security valuations and trends in market asset class preferences.
Generally, servicing fees are affected by changes in daily average valuations of assets under custody
and administration. Additional factors, such as the relative mix of assets serviced, the level of transaction volumes, changes in service level, the nature of services provided, balance credits, client minimum balances, pricing concessions, the geographical location in which services are provided and other factors, may have a significant effect on our servicing fee revenue.
Generally, management fees are affected by changes in month-end valuations of assets under management.
Management fees for certain components of managed assets, such as ETFs, are affected by daily average valuations of assets under management. Management fee revenue is more sensitive to market valuations than servicing fee revenue, since a higher proportion of the underlying services provided, and the associated management fees earned, are dependent on equity and fixed-income security valuations. Additional factors, such as the relative mix of assets managed and other factors, may have a significant effect on our management fee revenue. While certain management fees are directly determined by the values of assets under management and the investment strategies employed, management fees may reflect other factors as well, including performance fee arrangements, discussed later in this section, as well as our relationship pricing for clients using multiple services.
Asset-based management fees for actively-managed products are generally charged at a higher percentage of assets under management than for passive products. Actively-managed products may also include performance fee arrangements which are recorded when the performance period is complete. Performance fees are generated when the performance of certain managed portfolios exceeds benchmarks specified in the management agreements. Generally, we experience more volatility with performance fees than with more traditional management fees.
In light of the above, we estimate, using relevant information as of
December 31, 2014
and assuming that all other factors remain constant, that: (1) a
10%
increase or decrease in worldwide equity valuations, over the relevant periods on which our servicing and management fees are calculated, would result in a corresponding change in our total revenue of approximately
2%
; and (2) a
10%
increase or decrease in worldwide fixed income security valuations, over the relevant periods for or on which our servicing and management fees are calculated, would result in a corresponding change in our total revenue of approximately
1%
.
See
Table 3: Daily, Month-end and Year-end Indices
for selected equity market indices. While the specific indices presented are indicative of general market trends, the asset types and classes relevant to
52
MANAGEMENT’S DISCUSSION AND ANALYSIS OF FINANCIAL CONDITION
AND RESULTS OF OPERATIONS (Continued)
individual client portfolios can and do differ, and the performance of associated relevant indices can therefore differ from the performance of the indices presented.
Daily averages and the averages of month-end indices demonstrate worldwide changes in equity
markets that affect our servicing and management fee revenue. Year-end indices affect the values of assets under custody and administration and assets under management as of those dates. The index names listed in the table are service marks of their respective owners.
|
TABLE 3: DAILY, MONTH-END AND YEAR-END INDICES
|
||||||||||||||||||||||||||
|
|
Daily Averages of Indices
|
Averages of Month-End Indices
|
Year-End Indices
|
|||||||||||||||||||||||
|
|
2014
|
2013
|
% Change
|
2014
|
2013
|
% Change
|
2014
|
2013
|
% Change
|
|||||||||||||||||
|
S&P 500
®
|
1,931
|
|
1,644
|
|
17
|
%
|
1,944
|
|
1,652
|
|
18
|
%
|
2,059
|
|
1,848
|
|
11
|
%
|
||||||||
|
NASDAQ
®
|
4,375
|
|
3,541
|
|
24
|
|
4,415
|
|
3,575
|
|
23
|
|
4,736
|
|
4,177
|
|
13
|
|
||||||||
|
MSCI EAFE
®
|
1,888
|
|
1,746
|
|
8
|
|
1,891
|
|
1,754
|
|
8
|
|
1,775
|
|
1,916
|
|
(7
|
)
|
||||||||
FEE REVENUE
Table 2: Total Revenue
provides the breakout of fee revenue for the years ended
December 31, 2014
,
2013
and
2012
.
Servicing Fees
Servicing fees increased
6%
in
2014
compared to
2013
primarily as a result of stronger global equity markets and
the positive revenue impact of net new business (revenue added from new servicing business installed less revenue lost from the removal of assets serviced)
.
Servicing fees in
2013
increased
9%
from
2012
, mainly due to stronger equity markets, the impact of net new business and revenue added from acquired businesses, partially offset by the impacts of the weaker euro and client de-risking.
Servicing fees generated outside the U.S. were approximately
42%
of total servicing fees in
2014
,
2013
and
2012
.
The increases in total assets under custody and administration for year-end
2014
compared to year-end
2013
resulted primarily from stronger global equity markets and net shareholder subscriptions
experienced by our custody clients, partially offset by losses of assets serviced. Asset levels as of
December 31, 2014
did not reflect the estimated
$406 billion
of new business in assets to be serviced awarded to us in
2014
and prior periods but not installed prior to
December 31, 2014
. This new business will be reflected in assets under custody and administration in future periods after installation and will generate servicing fee revenue in subsequent periods.
With respect to these new assets, we will provide various services, including accounting, bank loan servicing, compliance reporting and monitoring, custody, depository banking services, foreign exchange, fund administration, hedge fund servicing, middle-office outsourcing, performance and analytics, private equity administration, real estate administration, securities finance, transfer agency, and wealth management services.
The value of assets under custody and administration is a broad measure of the relative size of various markets served. Changes in the values of assets under custody and administration from period to period do not necessarily result in proportional changes in our servicing fee revenue.
|
TABLE 4: COMPONENTS OF ASSETS UNDER CUSTODY AND ADMINISTRATION
|
||||||||||||||||||||||||||
|
As of December 31,
|
2014
|
2013
|
2012
|
2011
|
2010
|
2013-2014 Annual Growth Rate
|
2010-2014 Compound Annual Growth Rate
|
|||||||||||||||||||
|
(Dollars in billions)
|
||||||||||||||||||||||||||
|
Mutual funds
|
$
|
6,992
|
|
$
|
6,811
|
|
$
|
5,852
|
|
$
|
5,265
|
|
$
|
5,540
|
|
3
|
%
|
6
|
%
|
|||||||
|
Collective funds
|
6,949
|
|
6,428
|
|
5,363
|
|
4,437
|
|
4,350
|
|
8
|
|
12
|
|
||||||||||||
|
Pension products
|
5,746
|
|
5,851
|
|
5,339
|
|
4,837
|
|
4,726
|
|
(2
|
)
|
5
|
|
||||||||||||
|
Insurance and other products
|
8,501
|
|
8,337
|
|
7,817
|
|
7,268
|
|
6,911
|
|
2
|
|
5
|
|
||||||||||||
|
Total
|
$
|
28,188
|
|
$
|
27,427
|
|
$
|
24,371
|
|
$
|
21,807
|
|
$
|
21,527
|
|
3
|
|
7
|
|
|||||||
53
MANAGEMENT’S DISCUSSION AND ANALYSIS OF FINANCIAL CONDITION
AND RESULTS OF OPERATIONS (Continued)
|
TABLE 5: COMPOSITION OF ASSETS UNDER CUSTODY AND ADMINISTRATION
|
||||||||||||||||||||||||||
|
As of December 31,
|
2014
|
2013
|
2012
|
2011
|
2010
|
2013-2014 Annual Growth Rate
|
2010-2014 Compound Annual Growth Rate
|
|||||||||||||||||||
|
(Dollars in billions)
|
||||||||||||||||||||||||||
|
Equities
|
$
|
15,876
|
|
$
|
15,050
|
|
$
|
12,276
|
|
$
|
10,849
|
|
$
|
11,000
|
|
5
|
%
|
10
|
%
|
|||||||
|
Fixed-income
|
8,739
|
|
9,072
|
|
8,885
|
|
8,317
|
|
7,875
|
|
(4
|
)
|
3
|
|
||||||||||||
|
Short-term and other investments
|
3,573
|
|
3,305
|
|
3,210
|
|
2,641
|
|
2,652
|
|
8
|
|
8
|
|
||||||||||||
|
Total
|
$
|
28,188
|
|
$
|
27,427
|
|
$
|
24,371
|
|
$
|
21,807
|
|
$
|
21,527
|
|
3
|
|
7
|
|
|||||||
|
TABLE 6: GEORGRAPHIC MIX OF ASSETS UNDER CUSTODY AND ADMINISTRATION
(1)
|
||||||||||||||||||||
|
As of December 31,
|
2014
|
2013
|
2012
|
2011
|
2010
|
|||||||||||||||
|
(In billions)
|
||||||||||||||||||||
|
North America
|
$
|
21,217
|
|
$
|
20,764
|
|
$
|
18,463
|
|
$
|
16,368
|
|
$
|
16,486
|
|
|||||
|
Europe/Middle East/Africa
|
5,633
|
|
5,511
|
|
4,801
|
|
4,400
|
|
4,069
|
|
||||||||||
|
Asia/Pacific
|
1,338
|
|
1,152
|
|
1,107
|
|
1,039
|
|
972
|
|
||||||||||
|
Total
|
$
|
28,188
|
|
$
|
27,427
|
|
$
|
24,371
|
|
$
|
21,807
|
|
$
|
21,527
|
|
|||||
(1)
Geographic mix is based on the location in which the assets are serviced.
Management Fees
Through SSGA, we provide a broad range of investment management strategies, specialized investment management advisory services and other financial services for corporations, public funds, and other sophisticated investors. SSGA offers a broad array of investment management strategies, including passive and active, such as enhanced indexing, using quantitative and fundamental methods for both U.S. and global equity and fixed-income securities. SSGA also offers ETFs, such as the SPDR
®
ETF brand. While certain management fees are directly determined by the values of assets under management and the investment strategies employed, management fees reflect other factors as well, including our relationship pricing for clients who use multiple services, and the benchmarks specified
in the respective management agreements related to performance fees.
Management fees increased in
2014
compared to
2013
primarily as a result of stronger global equity markets, net inflows and the positive revenue impact of the excess of revenue added from newly installed assets to be managed over the revenue lost from liquidations of managed assets.
Management fees increased in
2013
compared to
2012
, primarily due to the impact of stronger equity markets, net new business and higher performance fees.
Management fees generated outside the U.S. were approximately
37%
of total management fees in
2014
,
2013
and
2012
.
54
MANAGEMENT’S DISCUSSION AND ANALYSIS OF FINANCIAL CONDITION
AND RESULTS OF OPERATIONS (Continued)
|
TABLE 7: ASSETS UNDER MANAGEMENT BY ASSET CLASS AND INVESTMENT APPROACH
(1)
|
||||||||||||||||||||||||||
|
As of December 31,
|
2014
|
2013
|
2012
|
2011
|
2010
|
2013-2014 Annual Growth Rate
|
2010-2014 Compound Annual Growth Rate
|
|||||||||||||||||||
|
(Dollars in billions)
|
||||||||||||||||||||||||||
|
Equity:
|
||||||||||||||||||||||||||
|
Active
|
$
|
39
|
|
$
|
42
|
|
$
|
45
|
|
$
|
46
|
|
$
|
54
|
|
(7
|
)%
|
(8
|
)%
|
|||||||
|
Passive
|
1,436
|
|
1,334
|
|
1,047
|
|
893
|
|
912
|
|
8
|
|
12
|
|
||||||||||||
|
Total Equity
|
1,475
|
|
1,376
|
|
1,092
|
|
939
|
|
966
|
|
7
|
|
11
|
|
||||||||||||
|
Fixed-Income:
|
|
|||||||||||||||||||||||||
|
Active
|
17
|
|
16
|
|
17
|
|
16
|
|
14
|
|
6
|
|
4
|
|
||||||||||||
|
Passive
|
302
|
|
311
|
|
325
|
|
271
|
|
373
|
|
(3
|
)
|
(5
|
)
|
||||||||||||
|
Total Fixed-Income
|
319
|
|
327
|
|
342
|
|
287
|
|
387
|
|
(2
|
)
|
(5
|
)
|
||||||||||||
|
Cash
(2)
|
399
|
|
385
|
|
369
|
|
380
|
|
422
|
|
4
|
|
(1
|
)
|
||||||||||||
|
Multi-Asset-Class Solutions:
|
|
|||||||||||||||||||||||||
|
Active
|
30
|
|
23
|
|
23
|
|
15
|
|
16
|
|
30
|
|
17
|
|
||||||||||||
|
Passive
|
97
|
|
110
|
|
94
|
|
70
|
|
70
|
|
(12
|
)
|
8
|
|
||||||||||||
|
Total Multi-Asset-Class Solutions
|
127
|
|
133
|
|
117
|
|
85
|
|
86
|
|
(5
|
)
|
10
|
|
||||||||||||
|
Alternative Investments
(3)
:
|
|
|||||||||||||||||||||||||
|
Active
|
17
|
|
14
|
|
18
|
|
17
|
|
12
|
|
21
|
|
8
|
|
||||||||||||
|
Passive
|
111
|
|
110
|
|
148
|
|
137
|
|
137
|
|
1
|
|
(5
|
)
|
||||||||||||
|
Total Alternative Investments
|
128
|
|
124
|
|
166
|
|
154
|
|
149
|
|
3
|
|
(4
|
)
|
||||||||||||
|
Total
|
$
|
2,448
|
|
$
|
2,345
|
|
$
|
2,086
|
|
$
|
1,845
|
|
$
|
2,010
|
|
4
|
|
5
|
|
|||||||
(1)
As of
December 31, 2013
, the presentation was changed to align with the reporting of core businesses, which were revised for comparative purposes for
2012
,
2011
and
2010
.
(2)
Includes both floating- and constant-net-asset-value portfolios held in commingled structures or separate accounts.
(3)
Includes real estate investment trusts, currency and commodities, including SPDR
®
Gold Fund, for which State Street is not the investment manager, but acts as distribution agent.
|
TABLE 8: EXCHANGE-TRADED FUNDS BY ASSET CLASS
(1)(2)
|
||||||||||||||||||||||||||
|
As of December 31,
|
2014
|
2013
|
2012
|
2011
|
2010
|
2013-2014 Annual Growth Rate
|
2010-2014 Compound Annual Growth Rate
|
|||||||||||||||||||
|
(Dollars in billions)
|
||||||||||||||||||||||||||
|
Alternative Investments
(3)
|
$
|
38
|
|
$
|
39
|
|
$
|
79
|
|
$
|
68
|
|
$
|
61
|
|
(3
|
)%
|
(11
|
)%
|
|||||||
|
Cash
|
1
|
|
1
|
|
1
|
|
2
|
|
1
|
|
—
|
|
—
|
|
||||||||||||
|
Equity
|
388
|
|
325
|
|
227
|
|
184
|
|
175
|
|
19
|
|
22
|
|
||||||||||||
|
Fixed-income
|
39
|
|
34
|
|
30
|
|
20
|
|
15
|
|
15
|
|
27
|
|
||||||||||||
|
Total Exchange-Traded Funds
|
$
|
466
|
|
$
|
399
|
|
$
|
337
|
|
$
|
274
|
|
$
|
252
|
|
17
|
|
17
|
|
|||||||
(1)
Exchange-traded funds are a component of assets under management presented in the preceding table
.
(2)
Includes SPDR
®
Gold Fund, for which State Street is not the investment manager, but acts as distribution agent.
(3)
Decline in alternative investments from 2012 to 2013 was mainly attributable to Gold exchange-traded fund outflows and market impact.
|
TABLE 9: GEOGRAPHIC MIX OF ASSETS UNDER MANAGEMENT
(1)
|
||||||||||||||||||||
|
As of December 31,
|
2014
|
2013
|
2012
|
2011
|
2010
|
|||||||||||||||
|
(In billions)
|
||||||||||||||||||||
|
North America
|
$
|
1,568
|
|
$
|
1,456
|
|
$
|
1,288
|
|
$
|
1,190
|
|
$
|
1,332
|
|
|||||
|
Europe/Middle East/Africa
|
559
|
|
560
|
|
480
|
|
428
|
|
452
|
|
||||||||||
|
Asia/Pacific
|
321
|
|
329
|
|
318
|
|
227
|
|
226
|
|
||||||||||
|
Total
|
$
|
2,448
|
|
$
|
2,345
|
|
$
|
2,086
|
|
$
|
1,845
|
|
$
|
2,010
|
|
|||||
(1)
Geographic mix is based on client location or fund management location.
As of
December 31, 2013
, the presentation was changed to align with the reporting of core businesses, which were revised for comparative purposes for
2012
,
2011
and
2010
.
55
MANAGEMENT’S DISCUSSION AND ANALYSIS OF FINANCIAL CONDITION
AND RESULTS OF OPERATIONS (Continued)
The increase in total assets under management as of
December 31, 2014
compared to
December 31, 2013
resulted primarily from net market appreciation in the values of the assets managed and net new business of approximately
$28 billion
, partially offset by the impact of the stronger U.S. dollar. The net new business of approximately
$28 billion
was primarily
composed of approximately
$34 billion
from ETFs and approximately
$19 billion
of net inflows into money market funds, primarily offset by net outflows of approximately
$25 billion
from long-term institutional portfolios.
|
TABLE 10: ACTIVITY IN ASSETS UNDER MANAGEMENT BY PRODUCT CATEGORY
|
|||||||||||||||||||||||
|
(In billions)
|
Equity
|
Fixed-Income
|
Cash
|
Multi-Asset-Class Solutions
|
Alternative Investments
|
Total
|
|||||||||||||||||
|
Balance as of December 31, 2011
|
$
|
939
|
|
$
|
287
|
|
$
|
380
|
|
$
|
85
|
|
$
|
154
|
|
$
|
1,845
|
|
|||||
|
Long-term institutional inflows
(1)
|
226
|
|
144
|
|
—
|
|
26
|
|
15
|
|
411
|
|
|||||||||||
|
Long-term institutional outflows
(1)
|
(216
|
)
|
(102
|
)
|
—
|
|
(31
|
)
|
(20
|
)
|
(369
|
)
|
|||||||||||
|
Long-term institutional flows, net
|
10
|
|
42
|
|
—
|
|
(5
|
)
|
(5
|
)
|
42
|
|
|||||||||||
|
ETF flows, net
|
22
|
|
9
|
|
—
|
|
—
|
|
10
|
|
41
|
|
|||||||||||
|
Cash fund flows, net
|
—
|
|
—
|
|
(3
|
)
|
—
|
|
—
|
|
(3
|
)
|
|||||||||||
|
Total flows, net
|
32
|
|
51
|
|
(3
|
)
|
(5
|
)
|
5
|
|
80
|
|
|||||||||||
|
Market appreciation
(2)
|
123
|
|
11
|
|
(9
|
)
|
36
|
|
6
|
|
167
|
|
|||||||||||
|
Foreign exchange impact
(2)
|
(2
|
)
|
(7
|
)
|
1
|
|
1
|
|
1
|
|
(6
|
)
|
|||||||||||
|
Total market/foreign exchange impact
|
121
|
|
4
|
|
(8
|
)
|
37
|
|
7
|
|
161
|
|
|||||||||||
|
Balance as of December 31, 2012
|
1,092
|
|
342
|
|
369
|
|
117
|
|
166
|
|
2,086
|
|
|||||||||||
|
Long-term institutional inflows
(1)
|
256
|
|
70
|
|
—
|
|
32
|
|
13
|
|
371
|
|
|||||||||||
|
Long-term institutional outflows
(1)
|
(283
|
)
|
(71
|
)
|
—
|
|
(28
|
)
|
(21
|
)
|
(403
|
)
|
|||||||||||
|
Long-term institutional flows, net
|
(27
|
)
|
(1
|
)
|
—
|
|
4
|
|
(8
|
)
|
(32
|
)
|
|||||||||||
|
ETF flows, net
|
33
|
|
4
|
|
—
|
|
—
|
|
(25
|
)
|
12
|
|
|||||||||||
|
Cash fund flows, net
|
—
|
|
—
|
|
17
|
|
—
|
|
—
|
|
17
|
|
|||||||||||
|
Total flows, net
|
6
|
|
3
|
|
17
|
|
4
|
|
(33
|
)
|
(3
|
)
|
|||||||||||
|
Market appreciation
(2)
|
291
|
|
(4
|
)
|
(1
|
)
|
12
|
|
(5
|
)
|
293
|
|
|||||||||||
|
Foreign exchange impact
(2)
|
(13
|
)
|
(14
|
)
|
—
|
|
—
|
|
(4
|
)
|
(31
|
)
|
|||||||||||
|
Total market/foreign exchange impact
|
278
|
|
(18
|
)
|
(1
|
)
|
12
|
|
(9
|
)
|
262
|
|
|||||||||||
|
Balance as of December 31, 2013
|
1,376
|
|
327
|
|
385
|
|
133
|
|
124
|
|
2,345
|
|
|||||||||||
|
Long-term institutional inflows
(1)
|
285
|
|
80
|
|
—
|
|
43
|
|
13
|
|
421
|
|
|||||||||||
|
Long-term institutional outflows
(1)
|
(297
|
)
|
(103
|
)
|
—
|
|
(35
|
)
|
(11
|
)
|
(446
|
)
|
|||||||||||
|
Long-term institutional flows, net
|
(12
|
)
|
(23
|
)
|
—
|
|
8
|
|
2
|
|
(25
|
)
|
|||||||||||
|
ETF flows, net
|
31
|
|
5
|
|
—
|
|
—
|
|
(2
|
)
|
34
|
|
|||||||||||
|
Cash fund flows, net
|
—
|
|
—
|
|
19
|
|
—
|
|
—
|
|
19
|
|
|||||||||||
|
Total flows, net
|
19
|
|
(18
|
)
|
19
|
|
8
|
|
—
|
|
28
|
|
|||||||||||
|
Market appreciation
(2)
|
113
|
|
27
|
|
—
|
|
(9
|
)
|
11
|
|
142
|
|
|||||||||||
|
Foreign exchange impact
(2)
|
(33
|
)
|
(17
|
)
|
(5
|
)
|
(5
|
)
|
(7
|
)
|
(67
|
)
|
|||||||||||
|
Total market/foreign exchange impact
|
80
|
|
10
|
|
(5
|
)
|
(14
|
)
|
4
|
|
75
|
|
|||||||||||
|
Balance as of December 31, 2014
|
$
|
1,475
|
|
$
|
319
|
|
$
|
399
|
|
$
|
127
|
|
$
|
128
|
|
$
|
2,448
|
|
|||||
(1)
Amounts represent long-term portfolios, excluding ETFs.
(2)
Amounts represent aggregate impact on each product category for the period.
The net new business of approximately
$28 billion
for
2014
presented in the preceding table did not include approximately
$15 billion
of new asset management business, which was awarded to SSGA, but not installed as of
December 31, 2014
. This new business will be reflected in assets under management
in future periods after installation, and will generate management fee revenue in subsequent periods.
Total assets under management as of
December 31, 2014
included managed assets lost but not yet liquidated. Lost business occurs from time to time and it is difficult to predict the timing of client
56
MANAGEMENT’S DISCUSSION AND ANALYSIS OF FINANCIAL CONDITION
AND RESULTS OF OPERATIONS (Continued)
behavior in transitioning these assets. This timing can vary significantly.
Trading Services
|
TABLE 11: TRADING SERVICES REVENUE
|
|||||||||||||||||
|
Years Ended December 31,
|
2014
|
2013
|
2012
|
% Change 2014 vs. 2013
|
% Change 2013 vs. 2012
|
||||||||||||
|
(Dollars in millions)
|
|||||||||||||||||
|
Foreign exchange trading:
|
|||||||||||||||||
|
Direct sales and trading
|
$
|
361
|
|
$
|
304
|
|
$
|
263
|
|
19
|
%
|
16
|
%
|
||||
|
Indirect foreign exchange trading
|
246
|
|
285
|
|
248
|
|
(14
|
)
|
15
|
|
|||||||
|
Total foreign exchange trading
|
607
|
|
589
|
|
511
|
|
3
|
|
15
|
|
|||||||
|
Brokerage and other trading services:
|
|||||||||||||||||
|
Electronic foreign exchange services
|
181
|
|
218
|
|
196
|
|
(17
|
)
|
11
|
|
|||||||
|
Other trading, transition management and brokerage
|
296
|
|
287
|
|
329
|
|
3
|
|
(13
|
)
|
|||||||
|
Total brokerage and other trading services
|
477
|
|
505
|
|
525
|
|
(6
|
)
|
(4
|
)
|
|||||||
|
Total trading services revenue
|
$
|
1,084
|
|
$
|
1,094
|
|
$
|
1,036
|
|
(1
|
)
|
6
|
|
||||
Trading services revenue is composed of revenue generated by foreign exchange, or FX, trading, as well as revenue generated by brokerage and other trading services. We primarily earn FX trading revenue by acting as a principal market maker. We offer a range of FX products, services and execution models. Most of our FX products and execution services can be grouped into three broad categories, which are further explained below: “direct sales and trading,” “indirect FX trading” and “electronic FX services.” With respect to electronic FX services, we provide an execution venue, but do not act as agent or principal.
We also offer a range of brokerage and other trading products tailored specifically to meet the needs of the global pension community, including transition management and commission recapture. In addition, we act as distribution agent for the SPDR
®
Gold ETF. These products and services are generally differentiated by our role as an agent of the institutional investor. Revenue earned from these services is recorded in other trading, transition management and brokerage revenue within brokerage and other trading services revenue.
FX trading revenue is influenced by three principal factors: the volume and type of client FX transactions and related spreads; currency volatility; and the management of market risk associated with currencies and interest rates. Revenue earned from direct sales and trading and indirect FX trading is recorded in FX trading revenue.
Total FX trading revenue increased
3%
compared to
2013
, primarily the result of higher client volumes. Total FX trading revenue increased
15%
in
2013
compared to
2012
, primarily the result of higher client volumes, currency volatility and spreads.
We enter into FX transactions with clients and investment managers that contact our trading desk directly. These trades are all executed at negotiated rates. We refer to this activity, and our principal market-making activities, as “direct sales and trading” and it includes many transactions for funds serviced by third party custodians or prime brokers, as well as those funds under custody at State Street.
Alternatively, clients or their investment managers may elect to route FX transactions to our FX desk through our asset-servicing operation; we refer to this activity as “indirect FX trading,” and, in all cases, State Street is the fund's custodian. We execute indirect FX trades as a principal at rates disclosed to our clients. We calculate revenue for indirect FX trading using an attribution methodology. This methodology takes into consideration estimated mark-ups/downs and observed client volumes. Direct sales and trading revenue is all other FX trading revenue other than the revenue attributed to indirect FX trading.
Our clients that utilize indirect FX trading can, in addition to executing their FX transactions through dealers not affiliated with us, transition from indirect FX trading to either direct sales and trading execution, including our “Street FX” service, or to one of our electronic trading platforms. Street FX, in which State Street continues to act as a principal market maker, enables our clients to define their FX execution strategy and automate the FX trade execution process, both for funds under custody at State Street as well as those under custody at another bank.
Our direct sales and trading revenue increased
19%
in
2014
compared to
2013
. The increase primarily resulted from higher client volumes, partially offset by lower currency volatility and spreads. Our estimated indirect FX trading revenue decreased
14%
in
2014
, compared to
2013
. The decline mainly resulted from lower client volumes and spreads.
We continue to expect that some clients may choose, over time, to reduce their level of indirect FX trading transactions in favor of other execution methods, including either direct sales and trading transactions or electronic FX services which we provide. To the extent that clients shift to other execution methods that we provide, our FX trading revenue may decrease, even if volumes remain consistent.
57
MANAGEMENT’S DISCUSSION AND ANALYSIS OF FINANCIAL CONDITION
AND RESULTS OF OPERATIONS (Continued)
Total brokerage and other trading services revenue declined
6%
for
2014
compared to
2013
. Our clients may choose to execute FX transactions through one of our electronic trading platforms. These transactions generate revenue through a “click” fee. Revenue from such electronic FX services declined
17%
in
2014
compared to
2013
, mainly due to declines in client volumes.
The
3%
increase in other trading, transition management and brokerage revenue for
2014
compared to
2013
was primarily due to an increase in currency management revenue, partially offset by declines in distribution fees associated with the SPDR
®
Gold ETF, which resulted from outflows as average gold prices declined during the period. With respect to the SPDR
®
Gold ETF, fees earned by us as distribution agent are recorded in other trading, transition management and brokerage revenue within brokerage and other trading services revenue, and not in management fee revenue.
Our revenue from transition management and related expenses in
2014
and
2013
were adversely affected by compliance issues in our U.K. business, the reputational and regulatory impact of which may continue to adversely affect our transition management revenue in future periods.
Trading services revenue increased
6%
in
2013
compared to
2012
, primarily the result of higher client volumes, currency volatility and spreads.
Securities Finance
Our securities finance business consists of three components: (1) an agency lending program for SSGA-managed investment funds with a broad range of investment objectives, which we refer to as the SSGA lending funds, (2) an agency lending program for third-party investment managers and asset owners, which we refer to as the agency lending funds and (3) security lending transactions which we enter into as principal, which we refer to as our enhanced custody business.
See
Table 2: Total Revenue
, for the comparison of securities finance revenue for the years ended
December 31, 2014
,
2013
and
2012
.
Securities finance revenue earned from our agency lending activities, which is composed of our split of both the spreads related to cash collateral and the fees related to non-cash collateral, is principally a function of the volume of securities on loan, the interest-rate spreads and fees earned on the underlying collateral, and our share of the fee split.
As principal, our enhanced custody business borrows securities from the lending client and then lends such securities to the subsequent borrower, either a State Street client or a broker/dealer. Our involvement as principal is utilized when the lending
client is unable to, or elects not to, transact directly with the market and requires us to execute the transaction and furnish the securities. In our role as principal, we provide support to the transaction through our credit rating. While we source a significant proportion of the securities furnished by us in our role as principal from third parties, we have the ability to source securities through our assets under custody and administration, from clients who have designated State Street as an eligible borrower.
Securities finance revenue increased
22%
in
2014
compared to
2013
. The increase was mainly the result of
growth in our enhanced custody business and the impact of
higher lending volumes associated with our agency lending program. Revenues from our enhanced custody business totaled approximately
$121 million
and
$61 million
, respectively, in
2014
and
2013
.
Securities finance revenue declined
11%
in
2013
from
2012
mainly a result of lower spreads and a slight decline in average lending volumes.
Market influences may continue to affect client demand for securities finance, and as a result our revenue from, and the profitability of, our securities lending activities in future periods. In addition, recently effective regulatory changes may affect the volume of our securities lending activity and related revenue and profitability in future periods.
Processing Fees and Other
Processing fees and other revenue includes diverse types of fees and revenue, including fees from our structured products business, fees from software licensing and maintenance, equity income from our joint venture investments, gains and losses on sales of leased equipment and other assets, and amortization of our tax-advantaged investments.
Processing fees and other revenue declined
18%
in
2014
compared to
2013
, as shown in
Table 2: Total Revenue
.
The decrease was mainly due to higher amortization of tax-advantaged investments, partially offset by higher revenue from our investment in bank-owned life insurance.
Processing fees and other revenue declined
12%
in
2013
compared to
2012
. The decline was primarily due to both the fair-value adjustments related to our withdrawal from our fixed-income trading initiative and the gain from the sale of a Lehman Brothers-related asset, both recorded in
2012
, as well as hedge ineffectiveness recorded in
2013
. The decline in processing fees and other revenue was partially offset by an increase in revenue associated with our investment in bank-owned life insurance for
2013
compared to
2012
.
58
MANAGEMENT’S DISCUSSION AND ANALYSIS OF FINANCIAL CONDITION
AND RESULTS OF OPERATIONS (Continued)
Net Interest Revenue
See
Table 2: Total Revenue
, for the breakout of interest revenue and interest expense for the years ended December 31, 2014, 2013 and 2012.
Net interest revenue is defined as interest revenue earned on interest-earning assets less interest expense incurred on interest-bearing liabilities. Interest-earning assets, which principally consist of investment securities, interest-bearing deposits with banks, repurchase agreements, loans and leases and other liquid assets, are financed
primarily by client deposits, short-term borrowings and long-term debt. Net interest margin represents the relationship between annualized fully taxable-equivalent net interest revenue and average total interest-earning assets for the period. Revenue that is exempt from income taxes, mainly that earned from certain investment securities (state and political subdivisions), is adjusted to a fully taxable-equivalent basis using a federal statutory income tax rate of 35%, adjusted for applicable state income taxes, net of the related federal tax benefit.
|
TABLE 12: AVERAGE BALANCES AND INTEREST RATES - FULLY TAXABLE-EQUIVALENT BASIS
|
||||||||||||||||||||||||||||||||
|
Years Ended December 31,
|
2014
|
2013
|
2012
|
|||||||||||||||||||||||||||||
|
Average
Balance
|
Interest
Revenue/
Expense
|
Rate
|
Average
Balance
|
Interest
Revenue/
Expense
|
Rate
|
Average
Balance |
Interest
Revenue/ Expense |
Rate
|
||||||||||||||||||||||||
|
(Dollars in millions; fully taxable-equivalent basis)
|
||||||||||||||||||||||||||||||||
|
Interest-bearing deposits with banks
|
$
|
55,353
|
|
$
|
196
|
|
.35
|
%
|
$
|
28,946
|
|
$
|
125
|
|
.43
|
%
|
$
|
26,823
|
|
$
|
141
|
|
.53
|
%
|
||||||||
|
Securities purchased under resale agreements
|
4,077
|
|
38
|
|
.94
|
|
5,766
|
|
45
|
|
.77
|
|
7,243
|
|
51
|
|
.71
|
|
||||||||||||||
|
Trading account assets
|
959
|
|
1
|
|
.13
|
|
748
|
|
—
|
|
—
|
|
651
|
|
—
|
|
—
|
|
||||||||||||||
|
Investment securities
|
116,809
|
|
2,317
|
|
1.98
|
|
117,696
|
|
2,429
|
|
2.06
|
|
113,910
|
|
2,689
|
|
2.36
|
|
||||||||||||||
|
Loans and leases
|
15,912
|
|
266
|
|
1.67
|
|
13,781
|
|
253
|
|
1.84
|
|
11,610
|
|
254
|
|
2.19
|
|
||||||||||||||
|
Other interest-earning assets
|
15,944
|
|
7
|
|
.05
|
|
11,164
|
|
4
|
|
.04
|
|
7,378
|
|
3
|
|
.04
|
|
||||||||||||||
|
Average total interest-earning assets
|
$
|
209,054
|
|
$
|
2,825
|
|
1.36
|
|
$
|
178,101
|
|
$
|
2,856
|
|
1.60
|
|
$
|
167,615
|
|
$
|
3,138
|
|
1.88
|
|
||||||||
|
Interest-bearing deposits:
|
||||||||||||||||||||||||||||||||
|
U.S.
|
$
|
21,296
|
|
$
|
21
|
|
.10
|
%
|
$
|
8,862
|
|
$
|
10
|
|
.12
|
%
|
$
|
9,333
|
|
$
|
19
|
|
.20
|
%
|
||||||||
|
Non-U.S.
|
109,003
|
|
78
|
|
.07
|
|
100,391
|
|
83
|
|
.08
|
|
89,059
|
|
147
|
|
.16
|
|
||||||||||||||
|
Securities sold under repurchase agreements
|
8,817
|
|
—
|
|
—
|
|
8,436
|
|
1
|
|
.01
|
|
7,697
|
|
1
|
|
.01
|
|
||||||||||||||
|
Federal funds purchased
|
20
|
|
—
|
|
—
|
|
298
|
|
—
|
|
—
|
|
784
|
|
1
|
|
.09
|
|
||||||||||||||
|
Other short-term borrowings
|
4,177
|
|
5
|
|
.12
|
|
3,785
|
|
59
|
|
1.57
|
|
4,676
|
|
71
|
|
1.52
|
|
||||||||||||||
|
Long-term debt
|
9,309
|
|
245
|
|
2.63
|
|
8,415
|
|
232
|
|
2.75
|
|
7,008
|
|
222
|
|
3.17
|
|
||||||||||||||
|
Other interest-bearing liabilities
|
7,351
|
|
43
|
|
.59
|
|
6,457
|
|
26
|
|
.40
|
|
5,898
|
|
15
|
|
.26
|
|
||||||||||||||
|
Average total interest-bearing liabilities
|
$
|
159,973
|
|
$
|
392
|
|
.25
|
|
$
|
136,644
|
|
$
|
411
|
|
.30
|
|
$
|
124,455
|
|
$
|
476
|
|
.39
|
|
||||||||
|
Interest-rate spread
|
1.11
|
%
|
1.30
|
%
|
1.49
|
%
|
||||||||||||||||||||||||||
|
Net interest revenue—fully taxable-equivalent basis
|
$
|
2,433
|
|
$
|
2,445
|
|
$
|
2,662
|
|
|||||||||||||||||||||||
|
Net interest margin—fully taxable-equivalent basis
|
1.16
|
%
|
1.37
|
%
|
1.59
|
%
|
||||||||||||||||||||||||||
|
Tax-equivalent adjustment
|
(173
|
)
|
(142
|
)
|
(124
|
)
|
||||||||||||||||||||||||||
|
Net interest revenue—GAAP basis
|
$
|
2,260
|
|
$
|
2,303
|
|
$
|
2,538
|
|
|||||||||||||||||||||||
Net interest revenue
decreased
2%
, and on a fully taxable-equivalent basis remained relatively
flat
, in
2014
compared to
2013
. The comparisons were generally the result of lower yields on interest-earning assets, as lower global interest rates affected our revenue from floating-rate assets, partially offset by the benefit of higher levels of interest-earning assets and lower rates on interest paid.
Net interest revenue declined
9%
in
2013
compared to
2012
. The overall decrease was primarily due to the impact of lower yields on interest-earning assets related to lower global interest rates, partially offset by lower funding costs.
Changes in the components of interest-earning assets and interest-bearing liabilities are discussed in more detail below. Additional detail about the components of interest revenue and interest expense
59
MANAGEMENT’S DISCUSSION AND ANALYSIS OF FINANCIAL CONDITION
AND RESULTS OF OPERATIONS (Continued)
is provided in note
18
to the consolidated financial statements included under Item 8 of this Form 10-K.
Average total interest-earning assets were higher for
2014
compared to
2013
, the result of our investment of elevated levels of client deposits invested in interest-bearing deposits with banks, higher levels of cash collateral (included in other interest-earning assets in
Table 12: Average Balances and Interest Rates - Fully Taxable-Equivalent Basis
) provided in connection with our enhanced custody business, and higher average loans and leases.
The higher level of investment in interest-bearing deposits with banks resulted from continued higher levels of client deposits, discussed further below, while the increase in average loans and leases resulted from growth in mutual fund lending and our continued investment in senior secured bank loans.
During the past year, our clients have continued to place elevated levels of deposits with us, as low global interest rates have made deposits attractive relative to other investment options. The portion of these client deposits characterized by us as transient in nature has generally been placed with various central banks globally, while deposits we characterize as more stable have generally been invested in our investment securities portfolio and used to support growth in other client-related activities.
A portion of the increase in client deposits in
2014
was driven by higher levels of Euro denominated deposits, as clients placed these deposits with us due to the negative interest rate environment in Europe. We have characterized these additional deposits as transient in nature and, accordingly, have generally invested these deposits with central banks. The effects of the recent stronger U.S. dollar relative to other currencies, particularly the Euro, has exacerbated the associated negative effect on our net interest revenue. If European Central Bank, or ECB, monetary policy continues to pressure European interest rates downward and the U.S. dollar remains strong or strengthens, the negative effects on our net interest revenue likely will continue or increase.
Our average other interest-earning assets, largely associated with the enhanced custody business, composed approximately
8%
of our average total interest-earning assets for
2014
, compared to approximately
6%
of our average total interest-earning assets for
2013
, as this business continued to grow. While the enhanced custody business supports our overall profitability by generating securities finance fee revenue, it puts downward pressure on our net interest margin, as interest on the cash collateral we provide is earned at a lower rate compared to our investment securities portfolio.
Subsequent to the commercial paper conduit consolidation in
2009
, we have recorded aggregate discount accretion in interest revenue of
$2.02 billion
(
$119 million
in
2014
,
$137 million
in
2013
,
$215 million
in
2012
,
$220 million
in
2011
,
$712 million
in
2010
, and
$621 million
in
2009
). The timing and ultimate recognition of any applicable discount accretion depends, in part, on factors that are outside of our control, including anticipated prepayment speeds and credit quality. The impact of these factors is uncertain and can be significantly influenced by general economic and financial market conditions. The timing and recognition of any applicable discount accretion can also be influenced by our ongoing management of the risks and other characteristics associated with our investment securities portfolio, including sales of securities which would otherwise generate interest revenue through accretion.
Depending on the factors discussed above, among others, we anticipate that, until the former conduit securities remaining in our investment portfolio mature or are sold, discount accretion will continue to contribute, though generally in declining amounts, to our net interest revenue. Assuming that we hold the remaining former conduit securities to maturity, all else being equal, we expect the remaining former conduit securities carried in our investment portfolio as of
December 31, 2014
to generate discount accretion in future periods of approximately
$387 million
over their remaining terms, with approximately half of this discount accretion to be recorded over the next four years.
Interest-bearing deposits with banks averaged
$55.35 billion
for the
year ended December 31, 2014
, compared to
$28.95 billion
for the
year ended December 31, 2013
. While these deposits reflected our maintenance of cash balances at the Federal Reserve, the ECB and other non-U.S. central banks to satisfy regulatory reserve requirements, the above-described amounts also reflect the additional impact of continued elevated levels of client deposits and our investment of the excess deposits with central banks.
Certain client deposits were characterized as transient in nature and were placed with various central banks globally. If client deposits remain at or close to current elevated levels, we expect to continue to invest them in either money market assets, including central bank deposits, or in investment securities, depending on our assessment of the underlying characteristics of the deposits.
Average investment securities
decreased
to
$116.81 billion
for the
year ended December 31, 2014
compared to
$117.70 billion
for
2013
as we continue to reposition our investment portfolio in light of the liquidity requirements of the liquidity coverage ratio.
60
MANAGEMENT’S DISCUSSION AND ANALYSIS OF FINANCIAL CONDITION
AND RESULTS OF OPERATIONS (Continued)
Detail with respect to our investment portfolio as of
December 31, 2014
and
2013
is provided in note
3
to the consolidated financial statements included under Item 8 of this Form 10-K.
Loans and leases averaged
$15.91 billion
for the
year ended
2014
, up from
$13.78 billion
in
2013
. The increase was mainly related to mutual fund lending and our continued investment in senior secured bank loans. Mutual fund lending and senior secured bank loans averaged approximately
$9.12 billion
and
$1.40 billion
, respectively, for the
year ended December 31, 2014
compared to
$8.16 billion
and
$170 million
for the year ended
December 31, 2013
, respectively.
Average loans and leases also include short-duration advances.
|
TABLE 13: U.S. AND NON-U.S. SHORT-DURATION ADVANCES
|
|||||||||||
|
Years Ended December 31,
|
|||||||||||
|
(In millions)
|
2014
|
2013
|
2012
|
||||||||
|
Average U.S. short-duration advances
|
$
|
2,355
|
|
$
|
2,356
|
|
$
|
1,972
|
|
||
|
Average non-U.S. short-duration advances
|
1,512
|
|
1,393
|
|
1,393
|
|
|||||
|
Average total short-duration advances
|
$
|
3,867
|
|
$
|
3,749
|
|
$
|
3,365
|
|
||
|
Average short-durance advances to average loans and leases
|
24
|
%
|
27
|
%
|
29
|
%
|
|||||
The decline in proportion of the average daily short-duration advances to average loans and leases is primarily due to growth in the other segments of the loan and lease portfolio. Short-duration advances provide liquidity to clients in support of their investment activities.
Although average short-duration advances for the
year ended December 31, 2014
increased compared to the
year ended December 31, 2013
, such average advances remained low relative to historical levels, mainly the result of clients continuing to hold higher levels of liquidity.
Average other interest-earning assets
increased
to
$15.94 billion
for the
year ended
December 31, 2014
from
$11.16 billion
for the
year ended
December 31, 2013
. The increased levels were primarily the result of higher levels of cash collateral provided in connection with our enhanced custody business.
Aggregate average interest-bearing deposits
increased
to
$130.30 billion
for the
year ended
December 31, 2014
from
$109.25 billion
for
year ended
2013
. The higher levels were primarily the result of increases in both U.S. and non-U.S. transaction accounts and time deposits. Future transaction account levels will be influenced by the underlying asset servicing business, as well as
market conditions, including the general levels of U.S. and non-U.S. interest rates.
Average other short-term borrowings
increased
to
$4.18 billion
for the
year ended
December 31, 2014
from
$3.79 billion
for the
year ended
2013
. The increase was the result of a higher level of client demand for our commercial paper. The decline in rates paid from
1.6%
in
2013
to
0.1%
in
2014
resulted from a reclassification of certain derivative contracts that hedge our interest-rate risk on certain assets and liabilities, which reduced interest revenue and interest expense.
Average long-term debt
increased
to
$9.31 billion
for the
year ended
December 31, 2014
from
$8.42 billion
for the
year ended
December 31, 2013
. The increase primarily reflected the issuance of
$1.5 billion
of senior and subordinated debt in May 2013, $1.0 billion of senior debt issued in November 2013, and $1.0 billion of senior debt issued in December 2014. This is partially offset by the maturities of
$500 million
of senior debt in May 2014 and
$250 million
of senior debt in March 2014.
Average other interest-bearing liabilities
increased
to
$7.35 billion
for the
year ended
December 31, 2014
from
$6.46 billion
for the
year ended
December 31, 2013
, primarily the result of higher levels of cash collateral received from clients in connection with our enhanced custody business.
Several factors could affect future levels of our net interest revenue and margin, including the mix of client liabilities; actions of various central banks; changes in U.S. and non-U.S. interest rates; changes in the various yield curves around the world; revised or proposed regulatory capital or liquidity standards, or interpretations of those standards; the amount of discount accretion generated by the former conduit securities that remain in our investment securities portfolio; and the yields earned on securities purchased compared to the yields earned on securities sold or matured.
Based on market conditions and other factors, we continue to reinvest the majority of the proceeds from pay-downs and maturities of investment securities in highly-rated securities, such as U.S. Treasury and agency securities, municipal securities, federal agency mortgage-backed securities and U.S. and non-U.S. mortgage- and asset-backed securities. The pace at which we continue to reinvest and the types of investment securities purchased will depend on the impact of market conditions and other factors over time. We expect these factors and the levels of global interest rates to influence what effect our reinvestment program will have on future levels of our net interest revenue and net interest margin.
61
MANAGEMENT’S DISCUSSION AND ANALYSIS OF FINANCIAL CONDITION
AND RESULTS OF OPERATIONS (Continued)
Gains (Losses) Related to Investment Securities, Net
We regularly review our investment securities portfolio to identify other-than-temporary impairment of individual securities. Additional information about investment securities, the gross gains and losses that compose the net gains from sales of securities and other-than-temporary impairment is provided in note
3
to the consolidated financial statements under Item 8 of this Form 10-K.
|
TABLE 14: INVESTMENT SECURITIES GAINS (LOSSES), NET
|
|||||||||||
|
Years Ended December 31,
|
2014
|
2013
|
2012
|
||||||||
|
(In millions)
|
|||||||||||
|
Net realized gains from sales of available-for-sale securities
|
$
|
15
|
|
$
|
14
|
|
$
|
55
|
|
||
|
Net impairment losses:
|
|||||||||||
|
Gross losses from other-than-temporary impairment
|
(1
|
)
|
(21
|
)
|
(53
|
)
|
|||||
|
Losses reclassified (from) to other comprehensive income
|
(10
|
)
|
(2
|
)
|
21
|
|
|||||
|
Net impairment losses
(1)
|
(11
|
)
|
(23
|
)
|
(32
|
)
|
|||||
|
Gains (losses) related to investment securities, net
|
$
|
4
|
|
$
|
(9
|
)
|
$
|
23
|
|
||
|
(1)
Net impairment losses, recognized in our consolidated statement of income, were composed of the following:
|
|||||||||||
|
Impairment associated with expected credit losses
|
$
|
(10
|
)
|
$
|
(11
|
)
|
$
|
(16
|
)
|
||
|
Impairment associated with management’s intent to sell impaired securities prior to recovery in value
|
—
|
|
(6
|
)
|
—
|
|
|||||
|
Impairment associated with adverse changes in timing of expected future cash flows
|
(1
|
)
|
(6
|
)
|
(16
|
)
|
|||||
|
Net impairment losses
|
$
|
(11
|
)
|
$
|
(23
|
)
|
$
|
(32
|
)
|
||
From time to time, in connection with our ongoing management of our investment securities portfolio, we sell available-for-sale securities to manage risk, to take advantage of favorable market conditions, or for other reasons. In
2014
, we sold approximately
$9.77 billion
of such investment securities, compared to approximately
$10.26 billion
in
2013
, and recorded net realized gains of
$15 million
and
$14 million
, respectively, as presented in the preceding table.
PROVISION FOR LOAN LOSSES
We recorded a provision for loan losses of
$10 million
in
2014
, compared to
$6 million
in
2013
and a negative provision of
$3 million
in
2012
. The provisions in
2014
and
2013
were recorded in connection with our exposure to non-investment-grade borrowers composed of senior secured bank loans, which we purchased in connection with our participation in loan syndications in the non-investment-grade lending market. The increase in the provision in the year-to-year comparison reflected growth of the portfolio. Additional information about these senior secured bank loans is provided under
“Financial Condition - Loans and Leases” in this Management's Discussion and Analysis, and in note
4
to the consolidated financial statements included under Item 8 of this Form 10-K.
EXPENSES
|
TABLE 15: EXPENSES
|
|||||||||||||||||
|
Years Ended December 31,
|
2014
|
2013
|
2012
|
% Change 2014 vs. 2013
|
% Change 2013 vs. 2012
|
||||||||||||
|
(Dollars in millions)
|
|||||||||||||||||
|
Compensation and employee benefits
|
$
|
4,060
|
|
$
|
3,800
|
|
$
|
3,837
|
|
7
|
%
|
(1
|
)%
|
||||
|
Information systems and communications
|
976
|
|
935
|
|
844
|
|
4
|
|
11
|
|
|||||||
|
Transaction processing services
|
784
|
|
733
|
|
702
|
|
7
|
|
4
|
|
|||||||
|
Occupancy
|
461
|
|
467
|
|
470
|
|
(1
|
)
|
(1
|
)
|
|||||||
|
Claims resolution
|
—
|
|
—
|
|
(362
|
)
|
|||||||||||
|
Acquisition costs
|
58
|
|
76
|
|
26
|
|
|
|
|||||||||
|
Restructuring charges, net
|
75
|
|
28
|
|
199
|
|
|
|
|||||||||
|
Other:
|
|
||||||||||||||||
|
Professional services
|
440
|
|
392
|
|
381
|
|
12
|
|
3
|
|
|||||||
|
Amortization of other intangible assets
|
222
|
|
214
|
|
198
|
|
4
|
|
8
|
|
|||||||
|
Securities processing costs
|
68
|
|
52
|
|
24
|
|
|
|
|||||||||
|
Regulatory fees and assessments
|
74
|
|
72
|
|
61
|
|
|
|
|||||||||
|
Other
(1)
|
609
|
|
423
|
|
506
|
|
44
|
|
(16
|
)
|
|||||||
|
Total other
|
1,413
|
|
1,153
|
|
1,170
|
|
23
|
|
(1
|
)
|
|||||||
|
Total expenses
|
$
|
7,827
|
|
$
|
7,192
|
|
$
|
6,886
|
|
9
|
|
4
|
|
||||
|
Number of employees at year-end
|
29,970
|
|
29,430
|
|
29,660
|
|
|||||||||||
(1)
Included in other for the year ended
December 31, 2014
was a
$185 million
legal accrual in connection with management's intention to seek to resolve some, but not all, of the outstanding and potential claims arising out of our indirect FX client activities. For additional information, refer to note
21
to the consolidated financial statements included under Item 8 of this Form 10-K.
Compensation and employee benefits expenses increased
7%
in
2014
compared to
2013
. The increase was primarily the result of costs for additional staffing to support new business, higher incentive compensation, the impact of merit increases and promotions, and higher regulatory compliance costs, partially offset by savings generated from the completion of our Business Operations and Information Technology Transformation program.
Compensation and employee benefits expenses in
2014
included approximately
$53 million
of costs related to our Business Operations and Information
62
MANAGEMENT’S DISCUSSION AND ANALYSIS OF FINANCIAL CONDITION
AND RESULTS OF OPERATIONS (Continued)
Technology Transformation program, which was completed at the end of 2014, compared to approximately
$84 million
in
2013
. The 2014 expenses also included
$84 million
of net severance costs associated with staffing realignment.
Compensation and employee benefits expenses declined
1%
in
2013
compared to
2012
, primarily the result of lower staffing levels, including savings related to the implementation of our Business Operations and Information Technology Transformation program, and lower benefit costs, partially offset by expenses to support new business and acquisitions and higher incentive compensation.
Information systems and communications expenses increased
4%
in
2014
compared to
2013
. The increase was mainly associated with higher infrastructure costs related to the completion of our Business Operations and Information Technology Transformation program.
Additional information with respect to the impact of the Business Operations and Information Technology Transformation program on future compensation and employee benefits and information systems and communications expenses is provided in the following “Restructuring Charges” section.
Expenses for transaction processing services increased
7%
in
2014
compared to
2013
. The increase primarily reflected higher equity market values and higher transaction volumes in the investment servicing business.
Transaction processing services expenses increased
4%
in
2013
compared to
2012
primarily as a result of higher equity market values and higher transaction volumes in the asset servicing business.
Other expenses increased
23%
in
2014
compared to
2013
, primarily due to a legal accrual of
$185 million
in connection with management's intention to seek to resolve some, but not all, of the outstanding and potential claims arising out of our indirect FX client activities, higher levels of professional services associated with regulatory compliance requirements, a charitable contribution to the State Street Foundation, as well as the impact of the Lehman Brothers-related gains and recoveries recorded in
2013
. The legal accrual is more fully discussed under "Legal and Regulatory Matters" in note
11
to the consolidated financial statements included under Item 8 of this Form 10-K.
The decline in other expenses for
2013
compared to
2012
was mainly the result of credits of
$85 million
related to gains and recoveries associated with Lehman Brothers-related assets in
2013
.
Excluding these recoveries from other expenses for
2013
, and excluding the credits of
$14 million
from
other expenses for
2012
, other expenses for
2013
of
$1.24 billion
(
$1.15 billion
plus
$85 million
) increased 5% compared to other expenses of
$1.18 billion
(
$1.17 billion
plus
$14 million
) for
2012
.
Our compliance obligations have increased significantly due to new regulations in the U.S. and internationally that have been adopted or proposed in response to the financial crisis. As a systemically important financial institution, we are subject to enhanced supervision and prudential standards. Our status as a G-SIB has also resulted in heightened prudential and conduct expectations of our U.S. and international regulators with respect to our capital and liquidity management and our compliance and risk oversight programs. These heightened expectations have increased our regulatory compliance costs, including personnel and systems, as well as significant additional implementation and related costs to enhance our programs. We anticipate that these evolving and increasing regulatory compliance requirements and expectations will continue to affect our expenses. Our employee compensation and benefits, information systems and other expenses could increase, as we further adjust our operations in response to new or proposed requirements and heightened expectations.
Claims Resolution
As a result of the 2008 Lehman Brothers bankruptcy, we had various claims against Lehman Brothers entities in bankruptcy proceedings in the U.S. and the U.K. We also had amounts asserted as owed, or return obligations, to Lehman Brothers entities. The various claims and amounts owed arose from transactions that existed at the time Lehman Brothers entered bankruptcy, including prime brokerage arrangements, foreign exchange transactions, securities lending arrangements and repurchase agreements.
In
2014
, we received distributions totaling approximately
$21 million
from the Lehman Brothers estates, compared to approximately
$186 million
from the Lehman Brothers estates in
2013
. Of the distributions received in both
2014
and
2013
, approximately
$11 million
and
$101 million
, respectively, was related to recoveries of specific claims and applied to reduce remaining Lehman Brothers-related assets, primarily prime brokerage claim-related receivables, recorded in our consolidated statement of condition; the remaining
$10 million
and
$85 million
received in
2014
and
2013
, respectively, was recorded as a credit to other expenses in our consolidated statement of income.
63
MANAGEMENT’S DISCUSSION AND ANALYSIS OF FINANCIAL CONDITION
AND RESULTS OF OPERATIONS (Continued)
Restructuring Charges
Information with respect to our Business Operations and Information Technology Transformation program and our 2012 expense control measures, including charges, employee reductions and related accruals, is provided in the following sections.
Business Operations and Information Technology Transformation Program
In November
2010
, we announced a global multi-year Business Operations and Information Technology Transformation program. The program included operational, information technology and targeted cost initiatives, including plans related to reductions in both staff and occupancy costs.
We completed our Business Operations and Information Technology Transformation program at the end of
2014
, achieving, over the course of the program, greater than
$625 million
of total pre-tax savings on an annual basis with full effect in 2015, based on projected improvement from our total
2010
expenses from operations, all else being equal.
The majority of the annual savings have affected compensation and employee benefits
expenses. These savings have been modestly offset by increases in information systems and communications expenses.
With respect to our business operations, we standardized certain core business processes, primarily through our execution of the State Street Lean methodology, and we drove automation of these business processes. We created a new technology platform, including transferring certain core software applications to a private cloud, and we expanded our use of third-party service providers associated with components of our information technology infrastructure and application maintenance and support.
We incurred aggregate pre-tax restructuring charges of approximately
$440 million
over the four-year period ending
December 31, 2014
and we have recorded these restructuring charges in our consolidated statement of income.
|
TABLE 16: PRE-TAX AGGREGATE RESTRUCTURING CHARGES - BUSINESS OPERATIONS AND INFORMATION TECHNOLOGY TRANSFORMATION PROGRAM
|
|||||||||||||||
|
(In millions)
|
Employee-Related
Costs
|
Real Estate
Consolidation
|
Information
Technology Costs
|
Total
|
|||||||||||
|
2010
|
$
|
105
|
|
$
|
51
|
|
$
|
—
|
|
$
|
156
|
|
|||
|
2011
|
85
|
|
7
|
|
41
|
|
133
|
|
|||||||
|
2012
|
27
|
|
20
|
|
20
|
|
67
|
|
|||||||
|
2013
|
13
|
|
13
|
|
(1
|
)
|
25
|
|
|||||||
|
2014
|
38
|
|
21
|
|
—
|
|
59
|
|
|||||||
|
Total
|
$
|
268
|
|
$
|
112
|
|
$
|
60
|
|
$
|
440
|
|
|||
Employee-related costs included severance, benefits and outplacement services. Real estate
consolidation costs resulted from actions taken to reduce our occupancy costs through the consolidation of leases and properties. Information technology costs included transition fees related to the above-described expansion of our use of third-party service providers.
We originally identified a total of
1,574
positions as part of this initiative. As of
December 31, 2014
, we substantially completed these reductions.
2012 Expense Control Measures
In December 2011, in connection with expense control measures designed to better align our expenses to our business strategy and related outlook for
2013
, we identified additional targeted staff reductions. As a result of these actions, we have
recorded aggregate pre-tax restructuring charges of
$133 million
in
2012
,
$3 million
in
2013
and
$16 million
in
2014
in our consolidated statement of income. Employee-related costs included severance, benefits and outplacement services. Costs for asset and other write-offs were primarily related to contract terminations. We originally identified involuntary terminations of 960 employees (630 positions after replacements). As of March 31, 2014, we substantially completed these reductions.
The restructuring charge accrual associated with the Business Operations and Information Technology Transformation program and the 2012 expense control measures as of
December 31, 2014
and
2013
was
$71 million
and
$106 million
, respectively.
64
MANAGEMENT’S DISCUSSION AND ANALYSIS OF FINANCIAL CONDITION
AND RESULTS OF OPERATIONS (Continued)
Income Tax Expense
Income tax expense was
$421 million
in
2014
compared to
$550 million
in
2013
. Our effective tax rate for
2014
was
17.2%
compared to
20.5%
in
2013
, which included the impact of an out-of-period income tax benefit. The decline in the 2014 effective tax rate was primarily attributable to an expansion of our municipal securities portfolio, increased investments in alternative energy projects and greater benefits from our non-U.S. operations, net of the
2013
out-of-period benefit.
Additional information regarding income tax expense, including unrecognized tax benefits, and tax contingencies are provided in notes
22
and
11
, to the consolidated financial statements under Item 8 of this Form 10-K.
LINE OF BUSINESS INFORMATION
We have two lines of business: Investment Servicing and Investment Management. Given our services and management organization, the results of operations for these lines of business are not necessarily comparable with those of other companies, including companies in the financial services industry. Information about our two lines of business, as well as the revenues, expenses and capital allocation methodologies associated with them, is provided in note
24
to the consolidated financial statements included under Item 8 of this Form 10-K.
The amounts in the “Other” columns were not allocated to our business lines. The “Other” column for
2014
included net costs of
$219 million
composed of the following -
|
•
|
Net acquisition and restructuring costs of
$133 million
;
|
|
•
|
Net severance costs associated with staffing realignment of
$84 million
; and
|
|
•
|
Net provisions for litigation exposure and other costs of
$2 million
.
|
The “Other” column for
2013
included costs of
$180 million
composed of the following -
|
•
|
Net acquisition and restructuring costs of
$104 million
;
|
|
•
|
Net provisions for litigation exposure and other costs of
$65 million
; and
|
|
•
|
Net severance costs associated with staffing realignment of
$11 million
.
|
The “Other” column for
2012
included net losses of
$27 million
composed of the following -
|
•
|
Net realized loss from the sale of all of our Greek investment securities of
$46 million
;
|
|
•
|
A benefit related to claims associated with the 2008 Lehman Brothers bankruptcy of
$362 million
;
|
|
•
|
Net acquisition and restructuring costs of
$225 million
; and
|
|
•
|
Net provisions for litigation exposure and other costs of
$118 million
.
|
Prior reported results reflect reclassifications, for comparative purposes, related to management changes in methodologies associated with allocations of revenue and expenses reflected in line-of-business results for
2014
.
65
MANAGEMENT’S DISCUSSION AND ANALYSIS OF FINANCIAL CONDITION
AND RESULTS OF OPERATIONS (Continued)
|
TABLE 17: INVESTMENT SERVICING LINE OF BUSINESS RESULTS
|
|||||||||||||
|
Investment
Servicing
|
|||||||||||||
|
Years Ended December 31,
|
2014
|
2013
|
2012
|
% Change 2014 vs. 2013
|
|||||||||
|
(Dollars in millions, except where otherwise noted)
|
|||||||||||||
|
Servicing fees
|
$
|
5,129
|
|
$
|
4,819
|
|
$
|
4,414
|
|
6%
|
|||
|
Trading services
|
1,039
|
|
1,027
|
|
938
|
|
1
|
||||||
|
Securities finance
|
437
|
|
359
|
|
405
|
|
22
|
||||||
|
Processing fees and other
|
179
|
|
206
|
|
235
|
|
(13)
|
||||||
|
Total fee revenue
|
6,784
|
|
6,411
|
|
5,992
|
|
6
|
||||||
|
Net interest revenue
|
2,188
|
|
2,221
|
|
2,464
|
|
(1)
|
||||||
|
Gains (losses) related to investment securities, net
|
4
|
|
(9
|
)
|
69
|
|
|||||||
|
Total revenue
|
8,976
|
|
8,623
|
|
8,525
|
|
4
|
||||||
|
Provision for loan losses
|
10
|
|
6
|
|
(3
|
)
|
|||||||
|
Total expenses
|
6,648
|
|
6,190
|
|
6,058
|
|
7
|
||||||
|
Income before income tax expense
|
$
|
2,318
|
|
$
|
2,427
|
|
$
|
2,470
|
|
(4)
|
|||
|
Pre-tax margin
|
26
|
%
|
28
|
%
|
29
|
%
|
|||||||
|
Average assets (in billions)
|
$
|
234.2
|
|
$
|
203.2
|
|
$
|
190.1
|
|
||||
Investment Servicing
Total revenue and total fee revenue in
2014
for our Investment Servicing line of business, presented in
Table 17: Investment Servicing Line of Business Results
,
increased
4%
and
6%
, respectively, compared to
2013
. The increase in total fee revenue primarily resulted from increases in servicing fees, securities finance revenue and trading services revenue, partially offset by a decline in processing fees and other revenue.
Servicing fees
increased
6%
in
2014
compared to
2013
, primarily the result of stronger global equity markets and the positive revenue impact of net new business (revenue added from new servicing business installed less revenue lost from the removal of assets serviced).
Trading services revenue increased
1%
in
2014
compared to
2013
, primarily as a result of higher client volumes in direct sales and trading, partially offset by a decline in client volumes in electronic foreign exchange trading services.
Securities finance revenue
increased
22%
in
2014
compared to
2013
, mainly the result of
growth in our enhanced custody business
and higher volumes.
Processing fees and other revenue
decreased
13%
in
2014
compared to
2013
, primarily due to higher amortization of tax-advantaged investments, partially offset by higher loan service fees due to higher average loan volumes and higher revenue from our investment in bank-owned life insurance.
Servicing fees, securities finance revenue and net gains (losses) related to investment securities for our Investment Servicing business line are consistent
with the respective consolidated results. Refer to “Servicing Fees,” "Securities Finance" and “Gains (Losses) Related to Investment Securities, Net” under “Total Revenue” in this Management’s Discussion and Analysis for a more in-depth discussion. A discussion of trading services revenue and processing fees and other revenue is provided under “Trading Services” and “Processing Fees and Other” in “Total Revenue.”
Net interest revenue decreased
1%
in
2014
compared to
2013
generally the result of lower yields on interest earning assets, as lower global interest rates affected our revenue from floating-rate assets, partially offset by the benefit of higher levels of interest-earning assets and lower rates on interest paid. A discussion of net interest revenue is provided under “Net Interest Revenue” in “Total Revenue.”
Total expenses
increased
7%
in
2014
compared to
2013
, primarily driven by increases in other expenses, compensation and employee benefit expenses and transaction processing services.
|
TABLE 18: INVESTMENT MANAGEMENT LINE OF BUSINESS RESULTS
|
|||||||||||||
|
Investment
Management |
|||||||||||||
|
Years Ended December 31,
|
2014
|
2013
|
2012
|
% Change 2014 vs. 2013
|
|||||||||
|
(Dollars in millions, except where otherwise noted)
|
|||||||||||||
|
Management fees
|
$
|
1,207
|
|
$
|
1,106
|
|
$
|
993
|
|
9%
|
|||
|
Trading services
|
45
|
|
67
|
|
98
|
|
(33)
|
||||||
|
Processing fees and other
|
(5
|
)
|
6
|
|
5
|
|
|||||||
|
Total fee revenue
|
1,247
|
|
1,179
|
|
1,096
|
|
6
|
||||||
|
Net interest revenue
|
72
|
|
82
|
|
74
|
|
(12)
|
||||||
|
Total revenue
|
1,319
|
|
1,261
|
|
1,170
|
|
5
|
||||||
|
Total expenses
|
960
|
|
822
|
|
847
|
|
17
|
||||||
|
Income before income tax expense
|
$
|
359
|
|
$
|
439
|
|
$
|
323
|
|
(18)
|
|||
|
Pre-tax margin
|
27
|
%
|
35
|
%
|
28
|
%
|
|||||||
|
Average assets (in billions)
|
$
|
3.9
|
|
$
|
3.8
|
|
$
|
3.7
|
|
||||
Investment Management
Total revenue for our Investment Management line of business, presented in
Table 18: Investment Management Line of Business Results
,
increased
5%
in
2014
compared to
2013
. Total fee revenue
increased
6%
compared to
2013
, primarily the result of increases in management fees, partially offset by decreases in trading services revenue.
Management fees
increased
9%
in
2014
compared to
2013
, primarily the result of
stronger global equity markets and net inflows.
Trading services revenue
declined
33%
in
2014
compared to
2013
, mainly due to lower distribution fees associated with the SPDR
®
Gold ETF, which resulted from outflows and a lower average gold price during the period.
Management fees for the Investment Management business line are consistent with the
66
MANAGEMENT’S DISCUSSION AND ANALYSIS OF FINANCIAL CONDITION
AND RESULTS OF OPERATIONS (Continued)
respective consolidated results. Refer to “Management Fees” in “Total Revenue” in this Management's Discussion and Analysis for a more in-depth discussion. A discussion of trading services revenue is provided under “Trading Services” in “Total Revenue.”
Total expenses increased
17%
in
2014
compared to
2013
. The increase primarily reflected
the impact of gains and recoveries associated with Lehman Brothers-related assets recorded in
2013
, as well as higher incentive compensation.
Pre-tax margin for Investment Management declined in
2014
compared to
2013
. The higher margin for the prior-year was mainly the result of the gains and recoveries associated with Lehman Brothers-related assets recorded in total expenses in
2013
.
FINANCIAL CONDITION
The structure of our consolidated statement of condition is primarily driven by the liabilities generated by our Investment Servicing and Investment Management lines of business. Our clients' needs and our operating objectives determine balance sheet volume, mix, and currency
denomination. As our clients execute their worldwide cash management and investment activities, they utilize deposits and short-term investments that constitute the majority of our liabilities. These liabilities are generally in the form of interest-bearing transaction account deposits, which are denominated in a variety of currencies; non-interest-bearing demand deposits; and repurchase agreements, which generally serve as short-term investment alternatives for our clients.
Deposits and other liabilities resulting from client initiated transactions are invested in assets that generally match the liquidity and interest-rate characteristics of the liabilities, although the weighted-average maturities of our assets are significantly longer than the contractual maturities of our liabilities. Our assets consist primarily of securities held in our available-for-sale or held-to-maturity portfolios and short-duration financial instruments, such as interest-bearing deposits with banks and securities purchased under resale agreements. The actual mix of assets is determined by the characteristics of the client liabilities and our desire to maintain a well-diversified portfolio of high-quality assets.
67
MANAGEMENT’S DISCUSSION AND ANALYSIS OF FINANCIAL CONDITION
AND RESULTS OF OPERATIONS (Continued)
|
TABLE 19: AVERAGE STATEMENT OF CONDITION
(1)
|
|||||||
|
Years Ended December 31,
|
2014
|
2013
|
|||||
|
(In millions)
|
Average Balance
|
Average Balance
|
|||||
|
Assets:
|
|||||||
|
Interest-bearing deposits with banks
|
$
|
55,353
|
|
$
|
28,946
|
|
|
|
Securities purchased under resale agreements
|
4,077
|
|
5,766
|
|
|||
|
Trading account assets
|
959
|
|
748
|
|
|||
|
Investment securities
|
116,809
|
|
117,696
|
|
|||
|
Loans and leases
|
15,912
|
|
13,781
|
|
|||
|
Other interest-earning assets
|
15,944
|
|
11,164
|
|
|||
|
Average total interest-earning assets
|
209,054
|
|
178,101
|
|
|||
|
Cash and due from banks
|
4,139
|
|
3,747
|
|
|||
|
Other noninterest-earning assets
|
24,935
|
|
25,182
|
|
|||
|
Average total assets
|
$
|
238,128
|
|
$
|
207,030
|
|
|
|
Liabilities and shareholders’ equity:
|
|||||||
|
Interest-bearing deposits:
|
|||||||
|
U.S.
|
$
|
21,296
|
|
$
|
8,862
|
|
|
|
Non-U.S.
|
109,003
|
|
100,391
|
|
|||
|
Total interest-bearing deposits
|
130,299
|
|
109,253
|
|
|||
|
Securities sold under repurchase agreements
|
8,817
|
|
8,436
|
|
|||
|
Federal funds purchased
|
20
|
|
298
|
|
|||
|
Other short-term borrowings
|
4,177
|
|
3,785
|
|
|||
|
Long-term debt
|
9,309
|
|
8,415
|
|
|||
|
Other interest-bearing liabilities
|
7,351
|
|
6,457
|
|
|||
|
Average total interest-bearing liabilities
|
159,973
|
|
136,644
|
|
|||
|
Noninterest-bearing deposits
|
44,041
|
|
36,294
|
|
|||
|
Other noninterest-bearing liabilities
|
12,797
|
|
13,561
|
|
|||
|
Preferred shareholders’ equity
|
1,181
|
|
490
|
|
|||
|
Common shareholders’ equity
|
20,136
|
|
20,041
|
|
|||
|
Average total liabilities and shareholders’ equity
|
$
|
238,128
|
|
$
|
207,030
|
|
|
(1)
Additional information about our average statement of condition, primarily our interest-earning assets and interest-bearing liabilities, is included under “Consolidated Results of Operations - Total Revenue - Net Interest Revenue” in this Management's Discussion and Analysis.
68
MANAGEMENT’S DISCUSSION AND ANALYSIS OF FINANCIAL CONDITION
AND RESULTS OF OPERATIONS (Continued)
Investment Securities
|
TABLE 20: CARRYING VALUES OF INVESTMENT SECURITIES
|
|||||||||||
|
As of December 31,
|
|||||||||||
|
(In millions)
|
2014
|
2013
|
2012
|
||||||||
|
Available for sale:
|
|||||||||||
|
U.S. Treasury and federal agencies:
|
|||||||||||
|
Direct obligations
|
$
|
10,655
|
|
$
|
709
|
|
$
|
841
|
|
||
|
Mortgage-backed securities
|
20,714
|
|
23,563
|
|
32,212
|
|
|||||
|
Asset-backed securities:
|
|||||||||||
|
Student loans
(1)
|
12,460
|
|
14,542
|
|
16,421
|
|
|||||
|
Credit cards
|
3,053
|
|
8,210
|
|
9,986
|
|
|||||
|
Sub-prime
|
951
|
|
1,203
|
|
1,399
|
|
|||||
|
Other
|
4,145
|
|
5,064
|
|
4,677
|
|
|||||
|
Total asset-backed securities
|
20,609
|
|
29,019
|
|
32,483
|
|
|||||
|
Non-U.S. debt securities:
|
|||||||||||
|
Mortgage-backed securities
|
9,606
|
|
11,029
|
|
11,405
|
|
|||||
|
Asset-backed securities
|
3,226
|
|
5,390
|
|
6,218
|
|
|||||
|
Government securities
|
3,909
|
|
3,761
|
|
3,199
|
|
|||||
|
Other
|
5,428
|
|
4,727
|
|
4,306
|
|
|||||
|
Total non-U.S. debt securities
|
22,169
|
|
24,907
|
|
25,128
|
|
|||||
|
State and political subdivisions
|
10,820
|
|
10,263
|
|
7,551
|
|
|||||
|
Collateralized mortgage obligations
|
5,339
|
|
5,269
|
|
4,954
|
|
|||||
|
Other U.S. debt securities
|
4,109
|
|
4,980
|
|
5,298
|
|
|||||
|
U.S. equity securities
|
39
|
|
34
|
|
31
|
|
|||||
|
Non-U.S. equity securities
|
2
|
|
1
|
|
1
|
|
|||||
|
U.S. money-market mutual funds
|
449
|
|
422
|
|
1,062
|
|
|||||
|
Non-U.S. money-market mutual funds
|
8
|
|
7
|
|
121
|
|
|||||
|
Total
|
$
|
94,913
|
|
$
|
99,174
|
|
$
|
109,682
|
|
||
|
Held to Maturity:
|
|||||||||||
|
U.S. Treasury and federal agencies:
|
|||||||||||
|
Direct obligations
|
$
|
5,114
|
|
$
|
5,041
|
|
$
|
5,000
|
|
||
|
Mortgage-backed securities
|
62
|
|
91
|
|
153
|
|
|||||
|
Asset-backed securities:
|
|||||||||||
|
Student loans
(1)
|
1,814
|
|
1,627
|
|
—
|
|
|||||
|
Credit cards
|
897
|
|
762
|
|
—
|
|
|||||
|
Other
|
577
|
|
782
|
|
16
|
|
|||||
|
Total asset-backed securities
|
3,288
|
|
3,171
|
|
16
|
|
|||||
|
Non-U.S. debt securities:
|
|||||||||||
|
Mortgage-backed securities
|
3,787
|
|
4,211
|
|
3,122
|
|
|||||
|
Asset-backed securities
|
2,868
|
|
2,202
|
|
434
|
|
|||||
|
Government securities
|
154
|
|
2
|
|
3
|
|
|||||
|
Other
|
72
|
|
192
|
|
167
|
|
|||||
|
Total non-U.S. debt securities
|
6,881
|
|
6,607
|
|
3,726
|
|
|||||
|
State and political subdivisions
|
9
|
|
24
|
|
74
|
|
|||||
|
Collateralized mortgage obligations
|
2,369
|
|
2,806
|
|
2,410
|
|
|||||
|
Total
|
$
|
17,723
|
|
$
|
17,740
|
|
$
|
11,379
|
|
||
(1)
Primarily composed of securities guaranteed by the federal government with respect to at least 97% of defaulted principal and accrued interest on the underlying loans.
The increase in U.S. Treasury direct obligations as of
December 31, 2014
compared to
December 31,
2013
, as well as decreases in certain of the mortgage- and asset-backed securities for the same periods, presented in
Table 20: Carrying Values of Investment Securities
, were associated with our repositioning of the portfolio in light of the liquidity requirements of the liquidity coverage ratio, or LCR.
Additional information about our investment securities portfolio is provided in note
3
to the consolidated financial statements included under Item 8 of this Form 10-K.
We manage our investment securities portfolio to align with the interest-rate and duration characteristics of our client liabilities and in the context of the overall structure of our consolidated statement of condition, in consideration of the global interest-rate environment. We consider a well-diversified, high-credit quality investment securities portfolio to be an important element in the management of our consolidated statement of condition.
Approximately
90%
of the carrying value of the portfolio rated “AAA” or “AA” as of
December 31, 2014
and
89%
as of
December 31, 2013
.
|
TABLE 21: INVESTMENT PORTFOLIO BY EXTENAL CREDIT RATING
|
|||||
|
As of December 31,
|
|||||
|
2014
|
2013
|
||||
|
AAA
(1)
|
73
|
%
|
70
|
%
|
|
|
AA
|
17
|
|
19
|
|
|
|
A
|
6
|
|
6
|
|
|
|
BBB
|
2
|
|
3
|
|
|
|
Below BBB
|
2
|
|
2
|
|
|
|
100
|
%
|
100
|
%
|
||
(1)
Includes U.S. Treasury and federal agency securities that are split-rated, “AAA” by Moody’s Investors Service and “AA+” by Standard & Poor’s.
As of
December 31, 2014
, the investment portfolio of
16,915
securities was diversified with respect to asset class. Approximately
64%
of the aggregate carrying value of the portfolio as of that date was composed of mortgage-backed and asset-backed securities, compared to
74%
as of
December 31, 2013
. The asset-backed securities portfolio, of which approximately
96%
and
97%
of the carrying value as of
December 31, 2014
and
2013
, respectively, was floating-rate, consisted primarily of student loan-backed and credit card-backed securities. Mortgage-backed securities were composed of securities issued by the Federal National Mortgage Association and Federal Home
69
MANAGEMENT’S DISCUSSION AND ANALYSIS OF FINANCIAL CONDITION
AND RESULTS OF OPERATIONS (Continued)
Loan Mortgage Corporation, as well as U.S. and non-U.S. large-issuer collateralized mortgage obligations.
In December 2013, U.S. regulators issued final regulations to implement the Volcker rule. The Volcker rule will, over time, prohibit banking entities, including us and our affiliates, from engaging in certain prohibited proprietary trading activities, as defined in the final Volcker rule regulations, subject to exemptions for market making-related activities, risk-mitigating hedging, underwriting and certain other activities. The Volcker rule will also require banking entities to either restructure or divest certain ownership interests in, and relationships with, covered funds (as such terms are defined in the final Volcker rule regulations).
The Volcker rule became effective on July 21, 2012, and the final implementing regulations became effective on April 1, 2014. In the absence of an applicable extension of the Volcker rule’s general conformance period, a banking entity must bring its activities and investments into conformance with the Volcker rule and its final Volcker rule regulations by July 21, 2015. In December 2014, the Federal Reserve issued an order, the 2016 conformance period extension, extending the Volcker rule’s general conformance period until July 21, 2016 for investments in and relationships with covered funds and certain foreign funds that were in place on or prior to December 31, 2013, referred to as legacy covered funds. Under the 2016 conformance period extension, all investments in and relationships related to investments in a covered fund made or entered into after that date by a banking entity and its affiliates, and all proprietary trading activities of those entities, must be in conformance with the Volcker rule and its final implementing regulations by July 21, 2015. The Federal Reserve stated in the 2016 conformance period extension that it intends to grant a final one-year extension of the general conformance period, to July 21, 2017, for banking entities to conform ownership interests in and relationships with legacy covered funds.
Whether certain types of investment securities or structures, such as collateralized loan obligations, or CLOs, constitute covered funds, as defined in the final Volcker rule regulations, and do not benefit from the exemptions provided in the Volcker rule, and whether a banking organization's investments therein constitute ownership interests remain subject to (1) market, and ultimately regulatory, interpretation, and (2) the specific terms and other characteristics relevant to such investment securities and structures.
As of
December 31, 2014
, we held approximately
$4.54 billion
of investments in CLOs. As of the same date, these investments had an aggregate pre-tax net unrealized gain of
approximately
$97 million
, composed of gross unrealized gains of
$105 million
and gross unrealized losses of
$8 million
. In the event that we or our banking regulators conclude that such investments in CLOs, or other investments, are covered funds, we may be required to divest of such investments. If other banking entities reach similar conclusions with respect to similar investments held by them, the prices of such investments could decline significantly, and we may be required to divest of such investments at a significant discount compared to the investments' book value. This could result in a material adverse effect on our consolidated results of operations in the period in which such a divestment occurs or on our consolidated financial condition.
We are reviewing our activities that are affected by the final Volcker rule regulations and are taking steps to bring those activities into conformity with the Volcker rule. The final Volcker rule regulations also require banking entities to establish extensive programs designed to ensure compliance with the restrictions of the Volcker rule. We are in the process of establishing the necessary compliance program to comply with the final Volcker rule regulations. Such compliance program will restrict our ability in the future to service certain types of funds, in particular covered funds for which SSGA acts as an advisor and certain types of trustee relationships. Consequently, Volcker rule compliance will entail both the cost of a compliance program and loss of certain revenue and future opportunities.
Non-U.S. Debt Securities
Approximately
26%
of the aggregate carrying value of our investment securities portfolio was composed of non-U.S. debt securities as of
December 31, 2014
compared to approximately
27%
in
2013
.
70
MANAGEMENT’S DISCUSSION AND ANALYSIS OF FINANCIAL CONDITION
AND RESULTS OF OPERATIONS (Continued)
|
TABLE 22: NON-U.S. DEBT SECURITIES
|
|||||||
|
As of December 31,
|
|||||||
|
(In millions)
|
2014
|
2013
|
|||||
|
Available for Sale:
|
|||||||
|
United Kingdom
|
$
|
6,925
|
|
$
|
9,357
|
|
|
|
Australia
|
3,401
|
|
3,551
|
|
|||
|
Netherlands
|
3,219
|
|
3,471
|
|
|||
|
Canada
|
2,711
|
|
2,549
|
|
|||
|
France
|
1,407
|
|
1,581
|
|
|||
|
South Korea
|
920
|
|
744
|
|
|||
|
Japan
|
860
|
|
971
|
|
|||
|
Germany
|
810
|
|
1,410
|
|
|||
|
Finland
|
513
|
|
397
|
|
|||
|
Italy
|
464
|
|
—
|
|
|||
|
Norway
|
438
|
|
369
|
|
|||
|
Belgium
|
120
|
|
—
|
|
|||
|
Sweden
|
103
|
|
142
|
|
|||
|
Austria
|
73
|
|
83
|
|
|||
|
Other
(1)
|
205
|
|
282
|
|
|||
|
Total
|
$
|
22,169
|
|
$
|
24,907
|
|
|
|
Held to Maturity:
|
|||||||
|
United Kingdom
|
$
|
1,779
|
|
$
|
1,474
|
|
|
|
Australia
|
1,712
|
|
2,216
|
|
|||
|
Germany
|
1,651
|
|
1,263
|
|
|||
|
Netherlands
|
1,128
|
|
934
|
|
|||
|
Spain
|
155
|
|
206
|
|
|||
|
Italy
|
79
|
|
270
|
|
|||
|
Ireland
|
68
|
|
86
|
|
|||
|
Other
(2)
|
309
|
|
158
|
|
|||
|
Total
|
$
|
6,881
|
|
$
|
6,607
|
|
|
(1)
Included approximately $66 and $133 million as of
December 31, 2014
and
2013
, respectively, related to Portugal, Ireland and Spain, all of which were mortgage-backed securities.
(2)
Included approximately $36 and $44 million as of
December 31, 2014
and
2013
, respectively, of securities related to Portugal, all of which were mortgage-backed securities.
Approximately
88%
and
89%
of the aggregate carrying value of these non-U.S. debt securities was rated “AAA” or “AA” as of
December 31, 2014
and
2013
, respectively. The majority of these securities comprise senior positions within the security structures; these positions have a level of protection provided through subordination and other forms of credit protection. As of
December 31, 2014
and
2013
, approximately
74%
and
72%
, respectively, of the aggregate carrying value of these non-U.S. debt securities was floating-rate, and accordingly, the securities are considered to have minimal interest-rate risk.
As of
December 31, 2014
, these non-U.S. debt securities had an average market-to-book ratio of
101.4%
, and an aggregate pre-tax net unrealized gain of approximately
$397 million
, composed of
gross unrealized gains of
$432 million
and gross unrealized losses of
$35 million
. These unrealized amounts included a pre-tax net unrealized gain of
$229 million
, composed of gross unrealized gains of
$241 million
and gross unrealized losses of
$12 million
, associated with non-U.S. debt securities available for sale.
As of
December 31, 2014
, the underlying collateral for non-U.S. mortgage- and asset-backed securities primarily included U.K. prime mortgages, Australian and Dutch mortgages and German automobile loans. The securities listed under “Canada” were composed of Canadian government securities and corporate debt and covered bonds. The securities listed under “France” were composed of automobile loans and corporate debt and covered bonds. The securities listed under “Japan” were substantially composed of Japanese government securities. The securities listed under “South Korea” were composed of South Korean government securities.
Additional information on our exposures relating to Spain, Italy, Ireland and Portugal as of
December 31, 2014
is provided under "Financial Condition - Cross-Border Outstandings" in this Management's Discussion and Analysis.
Municipal Securities
We carried approximately
$10.83 billion
of municipal securities classified as state and political subdivisions in our investment securities portfolio as of
December 31, 2014
as shown in
Table 20: Carrying Values of Investment Securities
. Substantially all of these securities were classified as available for sale, with the remainder classified as held to maturity. As of the same date, we also provided approximately
$7.61 billion
of credit and liquidity facilities to municipal issuers as a form of credit enhancement.
71
MANAGEMENT’S DISCUSSION AND ANALYSIS OF FINANCIAL CONDITION
AND RESULTS OF OPERATIONS (Continued)
|
TABLE 23: STATE AND MUNICIPAL OBLIGORS
(1)
|
||||||||||||||
|
(Dollars in millions)
|
Total Municipal
Securities
|
Credit and
Liquidity
Facilities
|
Total
|
% of Total Municipal
Exposure
|
||||||||||
|
December 31, 2014
|
||||||||||||||
|
State of Issuer:
|
||||||||||||||
|
Texas
|
$
|
1,326
|
|
$
|
1,405
|
|
$
|
2,731
|
|
15
|
%
|
|||
|
California
|
458
|
|
1,837
|
|
2,295
|
|
12
|
|
||||||
|
New York
|
920
|
|
996
|
|
1,916
|
|
10
|
|
||||||
|
Massachusetts
|
989
|
|
847
|
|
1,836
|
|
10
|
|
||||||
|
Maryland
|
446
|
|
416
|
|
862
|
|
5
|
|
||||||
|
Total
|
$
|
4,139
|
|
$
|
5,501
|
|
$
|
9,640
|
|
|||||
|
December 31, 2013
|
||||||||||||||
|
State of Issuer:
|
||||||||||||||
|
Texas
|
$
|
1,233
|
|
$
|
1,628
|
|
$
|
2,861
|
|
16
|
%
|
|||
|
New York
|
919
|
|
1,000
|
|
1,919
|
|
10
|
|
||||||
|
Massachusetts
|
967
|
|
759
|
|
1,726
|
|
9
|
|
||||||
|
California
|
373
|
|
1,266
|
|
1,639
|
|
9
|
|
||||||
|
Maryland
|
327
|
|
643
|
|
970
|
|
5
|
|
||||||
|
Total
|
$
|
3,819
|
|
$
|
5,296
|
|
$
|
9,115
|
|
|||||
(1)
Represented 5% or more of our aggregate municipal credit exposure of approximately
$18.44 billion
and
$18.45 billion
across our businesses as of
December 31, 2014
and
2013
, respectively.
Our aggregate municipal securities exposure presented in
Table 23: State and Municipal Obligors
, was concentrated primarily with highly-rated counterparties, with approximately
89%
of the obligors rated “AAA” or “AA” as of
December 31, 2014
. As of that date, approximately
60%
and
38%
of our aggregate exposure was associated with general obligation and revenue bonds, respectively. In addition, we had no exposures associated with industrial development or land development bonds. The portfolios are also diversified geographically, with the states that represent our largest exposures widely dispersed across the U.S.
Additional information with respect to our assessment of other-than-temporary impairment of our municipal securities is provided in note
3
to the consolidated financial statements included under Item 8 of this Form 10-K.
72
MANAGEMENT’S DISCUSSION AND ANALYSIS OF FINANCIAL CONDITION
AND RESULTS OF OPERATIONS (Continued)
|
TABLE 24: CONTRACTUAL MATURITIES AND YIELDS
|
|||||||||||||||||||||||||||
|
As of December 31, 2014
|
Under 1 Year
|
1 to 5 Years
|
6 to 10 Years
|
Over 10 Years
|
|||||||||||||||||||||||
|
(Dollars in millions)
|
Amount
|
Yield
|
Amount
|
Yield
|
Amount
|
Yield
|
Amount
|
Yield
|
|||||||||||||||||||
|
Available for sale
(1)
:
|
|||||||||||||||||||||||||||
|
U.S. Treasury and federal agencies:
|
|||||||||||||||||||||||||||
|
Direct obligations
|
$
|
—
|
|
—
|
%
|
$
|
6,841
|
|
1.11
|
%
|
$
|
3,287
|
|
2.61
|
%
|
$
|
527
|
|
2.04
|
%
|
|||||||
|
Mortgage-backed securities
|
107
|
|
2.75
|
|
2,389
|
|
3.20
|
|
4,421
|
|
3.07
|
|
13,797
|
|
3.01
|
|
|||||||||||
|
Asset-backed securities:
|
|||||||||||||||||||||||||||
|
Student loans
|
515
|
|
.90
|
|
6,100
|
|
.54
|
|
3,823
|
|
.66
|
|
2,022
|
|
.68
|
|
|||||||||||
|
Credit cards
|
381
|
|
.80
|
|
1,562
|
|
.76
|
|
1,110
|
|
1.65
|
|
—
|
|
—
|
|
|||||||||||
|
Sub-prime
|
3
|
|
4.86
|
|
13
|
|
1.30
|
|
1
|
|
6.15
|
|
934
|
|
.76
|
|
|||||||||||
|
Other
|
244
|
|
.51
|
|
961
|
|
.69
|
|
1,268
|
|
1.21
|
|
1,672
|
|
1.36
|
|
|||||||||||
|
Total asset-backed
|
1,143
|
|
8,636
|
|
6,202
|
|
4,628
|
|
|||||||||||||||||||
|
Non-U.S. debt securities:
|
|||||||||||||||||||||||||||
|
Mortgage-backed securities
|
2,315
|
|
1.52
|
|
3,463
|
|
1.54
|
|
576
|
|
1.19
|
|
3,252
|
|
2.93
|
|
|||||||||||
|
Asset-backed securities
|
272
|
|
1.01
|
|
2,698
|
|
.87
|
|
166
|
|
2.13
|
|
90
|
|
1.47
|
|
|||||||||||
|
Government securities
|
2,321
|
|
.48
|
|
1,588
|
|
1.41
|
|
—
|
|
—
|
|
—
|
|
—
|
|
|||||||||||
|
Other
|
1,757
|
|
2.81
|
|
2,801
|
|
1.80
|
|
870
|
|
.74
|
|
—
|
|
—
|
|
|||||||||||
|
Total non-U.S. debt securities
|
6,665
|
|
10,550
|
|
1,612
|
|
3,342
|
|
|||||||||||||||||||
|
State and political subdivisions
(2)
|
699
|
|
4.96
|
|
3,003
|
|
4.90
|
|
4,715
|
|
5.98
|
|
2,403
|
|
6.04
|
|
|||||||||||
|
Collateralized mortgage obligations
|
227
|
|
4.56
|
|
1,149
|
|
2.98
|
|
1,072
|
|
2.66
|
|
2,891
|
|
2.91
|
|
|||||||||||
|
Other U.S. debt securities
|
814
|
|
4.02
|
|
2,967
|
|
3.93
|
|
294
|
|
3.94
|
|
34
|
|
.78
|
|
|||||||||||
|
Total
|
$
|
9,655
|
|
$
|
35,535
|
|
$
|
21,603
|
|
$
|
27,622
|
|
|||||||||||||||
|
Held to maturity
(1)
:
|
|||||||||||||||||||||||||||
|
U.S. Treasury and federal agencies:
|
|||||||||||||||||||||||||||
|
Direct Obligations
|
$
|
—
|
|
—
|
%
|
$
|
—
|
|
—
|
%
|
$
|
5,000
|
|
2.09
|
%
|
$
|
114
|
|
.59
|
%
|
|||||||
|
Mortgage-backed securities
|
1
|
|
5.00
|
|
11
|
|
5.00
|
|
12
|
|
5.00
|
|
38
|
|
5.35
|
|
|||||||||||
|
Asset-backed securities
|
|||||||||||||||||||||||||||
|
Student loans
|
6
|
|
1.26
|
|
182
|
|
.81
|
|
375
|
|
.98
|
|
1,251
|
|
.73
|
|
|||||||||||
|
Credit cards
|
—
|
|
—
|
|
375
|
|
.61
|
|
522
|
|
.57
|
|
—
|
|
—
|
|
|||||||||||
|
Other
|
15
|
|
.57
|
|
367
|
|
.47
|
|
191
|
|
.62
|
|
4
|
|
.61
|
|
|||||||||||
|
Total asset-backed
|
21
|
|
924
|
|
1,088
|
|
1,255
|
|
|||||||||||||||||||
|
Non-U.S. debt securities:
|
|||||||||||||||||||||||||||
|
Mortgage-backed securities
|
503
|
|
1.30
|
|
1,102
|
|
1.06
|
|
157
|
|
3.74
|
|
2,025
|
|
1.59
|
|
|||||||||||
|
Asset-backed securities
|
105
|
|
1.58
|
|
2,567
|
|
.69
|
|
196
|
|
.97
|
|
—
|
|
—
|
|
|||||||||||
|
Government securities
|
154
|
|
.64
|
|
—
|
|
—
|
|
—
|
|
—
|
|
—
|
|
—
|
|
|||||||||||
|
Other
|
—
|
|
—
|
|
72
|
|
.44
|
|
—
|
|
—
|
|
—
|
|
—
|
|
|||||||||||
|
Total non-U.S. debt securities
|
762
|
|
3,741
|
|
353
|
|
2,025
|
|
|||||||||||||||||||
|
State and political subdivisions
(2)
|
7
|
|
5.78
|
|
2
|
|
6.38
|
|
—
|
|
—
|
|
—
|
|
—
|
|
|||||||||||
|
Collateralized mortgage obligations
|
574
|
|
2.62
|
|
460
|
|
3.72
|
|
498
|
|
1.41
|
|
837
|
|
2.08
|
|
|||||||||||
|
Total
|
$
|
1,365
|
|
$
|
5,138
|
|
$
|
6,951
|
|
$
|
4,269
|
|
|||||||||||||||
(1)
The maturities of mortgage-backed securities, asset-backed securities and collateralized mortgage obligations are based on expected principal payments.
(2)
Yields were calculated on a fully taxable-equivalent basis, using applicable federal and state income tax rates.
Impairment
Impairment exists when the fair value of an individual security is below its amortized cost basis. Impairment of a security is further assessed to determine whether such impairment is other-than-temporary. When the impairment is deemed to be other-than-temporary, we record the loss in our consolidated statement of income. In addition, for debt securities available for sale and held to maturity,
we record impairment in our consolidated statement of income when management intends to sell (or may be required to sell) the securities before they recover in value, or when management expects the present value of cash flows expected to be collected from the securities to be less than the amortized cost of the impaired security (a credit loss).
73
MANAGEMENT’S DISCUSSION AND ANALYSIS OF FINANCIAL CONDITION
AND RESULTS OF OPERATIONS (Continued)
The improvement to a net unrealized gain position as of
December 31, 2014
from a net unrealized loss position as of
December 31, 2013
, presented in
Table 25: Amortized Cost, Fair Value and Net Unrealized Gains (Losses) of Investment Securities
, was primarily attributable to narrowing spreads in
2014
.
|
TABLE 25: AMORTIZED COST, FAIR VALUE AND NET UNREALIZED GAINS (LOSSES) OF INVESTMENT SECURITIES
|
|||||||||||||||||||||||
|
As of December 31,
|
|||||||||||||||||||||||
|
2014
|
2013
|
||||||||||||||||||||||
|
(In millions)
|
Amortized Cost
|
Net Unrealized Gains(Losses)
|
Fair Value
|
Amortized Cost
|
Net Unrealized Gains(Losses)
|
Fair Value
|
|||||||||||||||||
|
Available for sale
(1)
|
$
|
94,108
|
|
$
|
805
|
|
$
|
94,913
|
|
$
|
99,159
|
|
$
|
15
|
|
$
|
99,174
|
|
|||||
|
Held to maturity
(1)
|
17,723
|
|
119
|
|
17,842
|
|
17,740
|
|
(180
|
)
|
17,560
|
|
|||||||||||
|
Total investment securities
|
$
|
111,831
|
|
$
|
924
|
|
$
|
112,755
|
|
$
|
116,899
|
|
$
|
(165
|
)
|
$
|
116,734
|
|
|||||
|
Net after-tax unrealized gain (loss)
|
$
|
554
|
|
$
|
(96
|
)
|
|||||||||||||||||
(1)
Securities available for sale are carried at fair value, with after-tax net unrealized gains and losses recorded in AOCI. Securities held to maturity are carried at cost, and unrealized gains and losses are not recorded in our consolidated financial statements.
We conduct periodic reviews of individual securities to assess whether other-than-temporary impairment exists. Our assessment of other-than-temporary impairment involves an evaluation of economic and security-specific factors. Such factors are based on estimates, derived by management, which contemplate current market conditions and security-specific performance. To the extent that market conditions are worse than management's expectations, other-than-temporary impairment could increase, in particular the credit-related component that would be recorded in our consolidated statement of income.
In the aggregate, we recorded net losses from other-than-temporary impairment of
$11 million
and
$23 million
in
2014
and
2013
, respectively. Additional information with respect to other-than-temporary impairments and net impairment losses, as well as information about our assessment of impairment, is provided in note
3
to the consolidated financial statements included under Item 8 of this Form 10-K.
Given our mortgage-backed securities exposure, our assessment of other-than-temporary impairment relies, in part, on our estimates of trends in the U.S. housing market in addition to trends in unemployment rates, interest rates and the timing of defaults. Overall, our evaluation of other-than-temporary impairment as of
December 31, 2014
continued to include an expectation of a U.S. housing recovery characterized by relatively modest growth in national housing prices over the next few years. The other-than-temporary impairment of our investment securities portfolio continues to be sensitive to our estimates of future cumulative losses. However, given our positive outlook for U.S. national housing
prices, our sensitivity analysis indicated, as of
December 31, 2014
, that our investment securities
portfolio was less exposed to the U.S. housing market outlook relative to other factors, including unemployment rates, interest rates and timing of default. The timeline to liquidate distressed loans continues to extend, but to a lesser degree as a result of strengthening in the national housing market. The timing of default may affect, among other things, the timing of cash flows or the credit quality associated with the mortgages collateralizing certain of our residential mortgage-backed securities which, accordingly, could result in the recognition of additional other-than-temporary impairment in future periods.
Our evaluation of potential other-than-temporary impairment of mortgage-backed securities with
collateral in countries with slow economic growth and government austerity measures takes into account government intervention in the corresponding mortgage markets and assumes a conservative baseline macroeconomic environment. Our baseline view assumes a recessionary period characterized by high unemployment and by additional declines in housing prices of between
5%
and
15%
. Our evaluation of other-than-temporary impairment in our base case does not assume a disorderly sovereign debt restructuring or a break-up of the Eurozone.
In addition, we perform stress testing and sensitivity analyses in order to assess the impact of more severe assumptions on potential other-than-temporary impairment. For example, we estimate, using relevant information as of
December 31, 2014
and
assuming that all other factors remain constant,
that in more stressful scenarios in which unemployment, gross domestic product and housing prices deteriorate over the relevant periods more than we expected as of
December 31, 2014
, other-than-temporary impairment could increase by a range of zero to $24 million. This sensitivity estimate is based
74
MANAGEMENT’S DISCUSSION AND ANALYSIS OF FINANCIAL CONDITION
AND RESULTS OF OPERATIONS (Continued)
on a number of factors, including, but not limited to, the level of housing prices and the timing of defaults. To the extent that such factors differ significantly from management's current expectations, resulting loss estimates may differ materially from those stated.
Excluding other-than-temporary impairment recorded in
2014
, management considers the aggregate decline in fair value of the remaining investment securities and the resulting gross unrealized losses as of
December 31, 2014
to be temporary and not the result of any material changes in the credit characteristics of the securities. Additional information about these gross unrealized losses is provided in note
3
to the consolidated financial statements included under Item 8 of this Form 10-K.
Loans and Leases
|
TABLE 26: U.S. AND NON- U.S. LOANS AND LEASES
|
|||||||||||||||||||
|
As of December 31,
|
|||||||||||||||||||
|
(In millions)
|
2014
|
2013
|
2012
|
2011
|
2010
|
||||||||||||||
|
Institutional:
|
|||||||||||||||||||
|
U.S.
|
$
|
14,908
|
|
$
|
10,623
|
|
$
|
9,645
|
|
$
|
7,115
|
|
$
|
7,001
|
|
||||
|
Non-U.S.
|
3,263
|
|
2,654
|
|
2,251
|
|
2,478
|
|
4,192
|
|
|||||||||
|
Commercial real estate:
|
|||||||||||||||||||
|
U.S.
|
28
|
|
209
|
|
411
|
|
460
|
|
764
|
|
|||||||||
|
Total loans and leases
|
$
|
18,199
|
|
$
|
13,486
|
|
$
|
12,307
|
|
$
|
10,053
|
|
$
|
11,957
|
|
||||
|
Average loans and leases
|
$
|
15,912
|
|
$
|
13,781
|
|
$
|
11,610
|
|
$
|
12,180
|
|
$
|
12,094
|
|
||||
The increase in loans in the institutional segment as of
December 31, 2014
as compared to
December 31, 2013
was primarily driven by higher levels of short-duration advances and increased investment in the non-investment-grade lending market through participations in loan syndications, specifically senior secured bank loans.
Short-duration advances to our clients included in the institutional segment were
$3.54 billion
and
$2.45 billion
as of
December 31, 2014
and
2013
, respectively. These short-duration advances provide liquidity to fund clients in support of their transaction flows associated with securities settlement activities.
As of
December 31, 2014
and
2013
, our investment in senior secured bank loans totaled approximately
$2.07 billion
and
$724 million
, respectively. In addition, we had binding unfunded commitments as of
December 31, 2014
totaling
$337 million
to participate in such syndications.
These senior secured bank loans, which we have rated “speculative” under our internal risk-rating framework (refer to note
4
to the consolidated financial statements included under Item 8 of this Form 10-K), are externally rated “BBB,” “BB” or “B,” with approximately
95%
of the loans rated “BB” or “B”
as of December 31, 2014
, compared to 94%
as of December 31, 2013
. Our investment strategy involves limiting our investment to larger, more liquid credits underwritten by major global financial institutions, applying our internal credit analysis process to each potential investment, and diversifying our exposure by counterparty and industry segment. However, these loans have significant exposure to credit losses relative to higher-rated loans. As of
December 31, 2014
, our allowance for loan losses included approximately
$26 million
related to these senior secured bank loans. As this portfolio grows and becomes more seasoned, our allowance for loan losses related to these loans may increase through additional provisions for credit losses.
As of
December 31, 2014
and
2013
, unearned income deducted from our investment in leveraged lease financing was
$109 million
and
$121 million
, respectively, for U.S. leases and
$261 million
and
$298 million
, respectively, for non-U.S. leases.
The commercial real estate, or CRE, loans are composed of the loans acquired in 2008 pursuant to indemnified repurchase agreements with an affiliate of Lehman as a result of the Lehman Brothers bankruptcy. Additional information about all of our loan-and-lease segments, as well as underlying classes, is provided in note
4
to the consolidated financial statements included under Item 8 of this Form 10-K.
The decrease in the CRE loans as of
December 31, 2014
compared to
December 31, 2013
resulted from one of the loans, acquired in 2008 pursuant to indemnified repurchase agreement with an affiliate of Lehman as a result of the Lehman Brothers bankruptcy being repaid.
As of
December 31, 2014
no CRE loans were modified in troubled debt restructurings. As of
December 31, 2013
, we held a CRE loan for approximately
$130 million
which had previously been modified in a troubled debt restructuring. No loans were modified in troubled debt restructurings in
2014
or
2013
.
75
MANAGEMENT’S DISCUSSION AND ANALYSIS OF FINANCIAL CONDITION
AND RESULTS OF OPERATIONS (Continued)
|
TABLE 27: CONTRACTUAL MATURITIES FOR LOANS AND LEASES
|
|||||||||||||||
|
As of December 31, 2014
|
|||||||||||||||
|
(In millions)
|
Total
|
Under 1 Year
|
1 to 5 Years
|
Over 5 Years
|
|||||||||||
|
Institutional:
|
|||||||||||||||
|
Investment funds:
|
|||||||||||||||
|
U.S.
|
$
|
11,388
|
|
$
|
9,045
|
|
$
|
2,326
|
|
$
|
17
|
|
|||
|
Non-U.S.
|
2,333
|
|
1,836
|
|
497
|
|
—
|
|
|||||||
|
Commercial and financial:
|
|||||||||||||||
|
U.S.
|
3,061
|
|
819
|
|
839
|
|
1,403
|
|
|||||||
|
Non-U.S.
|
256
|
|
171
|
|
66
|
|
19
|
|
|||||||
|
Purchased receivables:
|
|||||||||||||||
|
U.S.
|
124
|
|
—
|
|
77
|
|
47
|
|
|||||||
|
Non-U.S.
|
6
|
|
—
|
|
6
|
|
—
|
|
|||||||
|
Lease financing:
|
|||||||||||||||
|
U.S.
|
335
|
|
—
|
|
—
|
|
335
|
|
|||||||
|
Non-U.S.
|
668
|
|
88
|
|
225
|
|
355
|
|
|||||||
|
Total institutional
|
18,171
|
|
11,959
|
|
4,036
|
|
2,176
|
|
|||||||
|
Commercial real estate:
|
|||||||||||||||
|
U.S.
|
28
|
|
—
|
|
28
|
|
—
|
|
|||||||
|
Total loans and leases
|
$
|
18,199
|
|
$
|
11,959
|
|
$
|
4,064
|
|
$
|
2,176
|
|
|||
|
TABLE 28: CLASSIFICATION OF LOAN AND LEASE BALANCES DUE AFTER ONE YEAR
|
|||
|
As of December 31, 2014
|
|||
|
(In millions)
|
|
||
|
Loans and leases with predetermined interest rates
|
$
|
3,045
|
|
|
Loans and leases with floating or adjustable interest rates
|
3,195
|
|
|
|
Total
|
$
|
6,240
|
|
|
TABLE 29: ALLOWANCE FOR LOAN LOSSES
|
|||||||||||||||||||
|
For the Years ended December 31,
|
|||||||||||||||||||
|
2014
|
2013
|
2012
|
2011
|
2010
|
|||||||||||||||
|
(In millions)
|
|||||||||||||||||||
|
Allowance for loan losses:
|
|||||||||||||||||||
|
Beginning balance
|
$
|
28
|
|
$
|
22
|
|
$
|
22
|
|
$
|
100
|
|
$
|
79
|
|
||||
|
Provision for loan losses:
|
|||||||||||||||||||
|
Commercial real estate
|
—
|
|
—
|
|
(3
|
)
|
9
|
|
22
|
|
|||||||||
|
Institutional
|
10
|
|
6
|
|
—
|
|
(9
|
)
|
3
|
|
|||||||||
|
Charge-offs:
|
|||||||||||||||||||
|
Commercial real estate
|
—
|
|
—
|
|
—
|
|
(78
|
)
|
(4
|
)
|
|||||||||
|
Recoveries:
|
|||||||||||||||||||
|
Commercial real estate
|
—
|
|
—
|
|
3
|
|
—
|
|
—
|
|
|||||||||
|
Ending balance
|
$
|
38
|
|
$
|
28
|
|
$
|
22
|
|
$
|
22
|
|
$
|
100
|
|
||||
The provision of
$10 million
recorded in
2014
was composed of a provision of $20 million associated with senior secured bank loans, offset by a negative provision of $10 million associated with the pay-down of an unrelated commercial and financial loan with speculative-rated credit quality.
As of
December 31, 2014
, approximately
$26 million
of our allowance for loan losses was related to senior secured bank loans included in the institutional
segment; the remaining
$12 million
was related to other commercial and financial loans in the institutional segment.
76
MANAGEMENT’S DISCUSSION AND ANALYSIS OF FINANCIAL CONDITION
AND RESULTS OF OPERATIONS (Continued)
Cross-Border Outstandings
Cross-border outstandings are amounts payable to us by non-U.S. counterparties which are denominated in U.S. dollars or other non-local currency, as well as non-U.S. local currency claims not funded by local currency liabilities. Our cross-border outstandings consist primarily of deposits with banks; loans and lease financing, including short-duration advances; investment securities; amounts related to foreign exchange and interest-rate contracts; and securities finance.
In addition to credit risk, cross-border outstandings have the risk that, as a result of political or economic conditions in a country, borrowers may be unable to meet their contractual repayment obligations of principal and/or interest when due because of the unavailability of, or restrictions on, foreign exchange needed by borrowers to repay their obligations.
We place deposits with non-U.S. counterparties that have strong internal State Street risk ratings. Counterparties are approved and monitored by our Country Risk Committee. This process includes financial analysis of non-U.S. counterparties and the use of an internal risk-rating system. Each counterparty is reviewed at least annually and potentially more frequently based on deteriorating credit fundamentals or general market conditions. We also utilize risk mitigation and other facilities that may reduce our exposure through the use of cash collateral and/or balance sheet netting where we deem appropriate. In addition, the Country Risk Committee performs a country-risk analysis and monitors limits on country exposure.
The aggregate of the total cross-border outstandings presented in Table 30: Cross-border Outstandings represented approximately
17%
,
19%
, and
22%
of our consolidated total assets as of
December 31, 2014
,
2013
and
2012
respectively.
|
TABLE 30: CROSS-BORDER OUTSTANDINGS
(1)
|
|||||||||||
|
(In millions)
|
Investment Securities and Other Assets
|
Derivatives and Securities on Loan
|
Total Cross-Border Outstandings
|
||||||||
|
December 31, 2014
|
|
|
|
||||||||
|
United Kingdom
|
$
|
15,288
|
|
$
|
1,769
|
|
$
|
17,057
|
|
||
|
Japan
|
9,465
|
|
644
|
|
10,109
|
|
|||||
|
Australia
|
5,981
|
|
1,039
|
|
7,020
|
|
|||||
|
Netherlands
|
4,425
|
|
330
|
|
4,755
|
|
|||||
|
Canada
|
3,227
|
|
974
|
|
4,201
|
|
|||||
|
Germany
|
3,075
|
|
792
|
|
3,867
|
|
|||||
|
December 31, 2013
|
|
|
|
|
|
|
|||||
|
United Kingdom
|
$
|
15,422
|
|
$
|
1,697
|
|
$
|
17,119
|
|
||
|
Australia
|
7,309
|
|
672
|
|
7,981
|
|
|||||
|
Netherlands
|
4,542
|
|
277
|
|
4,819
|
|
|||||
|
Canada
|
3,675
|
|
620
|
|
4,295
|
|
|||||
|
Germany
|
4,062
|
|
147
|
|
4,209
|
|
|||||
|
France
|
2,887
|
|
735
|
|
3,622
|
|
|||||
|
Japan
|
2,445
|
|
605
|
|
3,050
|
|
|||||
|
December 31, 2012
|
|||||||||||
|
United Kingdom
|
$
|
18,046
|
|
$
|
1,033
|
|
$
|
19,079
|
|
||
|
Australia
|
7,585
|
|
328
|
|
7,913
|
|
|||||
|
Japan
|
6,625
|
|
1,041
|
|
7,666
|
|
|||||
|
Germany
|
7,426
|
|
220
|
|
7,646
|
|
|||||
|
Netherlands
|
3,130
|
|
188
|
|
3,318
|
|
|||||
|
Canada
|
2,730
|
|
500
|
|
3,230
|
|
|||||
(1)
Cross-border outstandings included countries in which we do business, and which amounted to at least 1% of our consolidated total assets as of the dates indicated.
As of
December 31, 2014
there were no countries whose aggregate cross-border outstandings amounted to between 0.75% and 1% of our consolidated total assets. As of
December 31, 2013
, aggregate cross-border outstandings in countries which amounted to between 0.75% and 1% of our total consolidated assets totaled approximately
$1.85 billion
to China. As of
December 31, 2012
, aggregate cross-border outstandings in countries which amounted to between 0.75% and 1% of our total consolidated assets totaled approximately
$1.81
billion to France.
77
MANAGEMENT’S DISCUSSION AND ANALYSIS OF FINANCIAL CONDITION
AND RESULTS OF OPERATIONS (Continued)
|
TABLE 31: CROSS-BORDER OUTSTANDINGS (ITALY, IRELAND, SPAIN AND PORTUGAL)
|
|||||||||||
|
(In millions)
|
Investment
Securities and
Other Assets
|
Derivatives and Securities on Loan
|
Total Cross-Border Outstandings
|
||||||||
|
December 31, 2014
|
|
|
|
||||||||
|
Ireland
|
$
|
510
|
|
$
|
1,253
|
|
$
|
1,763
|
|
||
|
Italy
|
907
|
|
11
|
|
918
|
|
|||||
|
Spain
|
155
|
|
71
|
|
226
|
|
|||||
|
Portugal
|
69
|
|
—
|
|
69
|
|
|||||
|
December 31, 2013
|
|
|
|
|
|
|
|||||
|
Italy
|
$
|
763
|
|
$
|
2
|
|
$
|
765
|
|
||
|
Ireland
|
369
|
|
304
|
|
673
|
|
|||||
|
Spain
|
271
|
|
11
|
|
282
|
|
|||||
|
Portugal
|
78
|
|
—
|
|
78
|
|
|||||
|
December 31, 2012
|
|||||||||||
|
Italy
|
$
|
937
|
|
$
|
1
|
|
$
|
938
|
|
||
|
Ireland
|
342
|
|
277
|
|
619
|
|
|||||
|
Spain
|
277
|
|
16
|
|
293
|
|
|||||
|
Portugal
|
76
|
|
—
|
|
76
|
|
|||||
The aggregate cross-border exposures presented in
Table 31: Cross-Border Outstandings (Italy, Ireland, Spain and Portugal)
, consisted primarily of interest-bearing deposits, investment securities, loans, including short-duration advances, and foreign exchange contracts. We had not recorded any provisions for loan losses with respect to any of our exposure in these countries as of
December 31, 2014
.
Our aggregate exposure to Spain, Italy, Ireland and Portugal as of
December 31, 2014
did not include any direct sovereign debt exposure to any of these countries. Our indirect exposure to these countries totaled approximately
$860 million
of mortgage- and asset-backed securities composed of
$146 million
in Spain,
$543 million
in Italy,
$102 million
in Ireland and
$69 million
in Portugal as of
December 31, 2014
. These mortgage- and asset-backed securities had an aggregate pre-tax net unrealized gain of approximately
$118 million
, composed of gross unrealized gains of
$119 million
and gross unrealized losses of
$1 million
as of
December 31, 2014
. We recorded no other-than-temporary impairment on these mortgage- and asset-backed securities in our consolidated statement of income in
2014
. We recorded other-than-temporary impairment of
$6 million
on one of these securities in our consolidated statement of income in
2013
, all of which was associated with management's intent to sell an impaired security prior to its recovery in value.
Throughout the sovereign debt crisis, the major independent credit rating agencies have downgraded U.S. and non-U.S. financial institutions and sovereign issuers which have been, and may in the future be, significant counterparties to us, or whose financial
instruments serve as collateral on which we rely for credit risk mitigation purposes, and may do so again in the future. As a result, we may be exposed to increased counterparty risk, leading to negative ratings volatility.
Risk Management
General
In the normal course of our global business activities, we are exposed to a variety of risks, some inherent in the financial services industry, others more specific to our business activities. Our risk management framework focuses on material risks, which include the following:
|
•
|
credit and counterparty risk;
|
|
•
|
liquidity risk, funding and management;
|
|
•
|
operational risk;
|
|
•
|
market risk associated with our trading activities;
|
|
•
|
market risk associated with our non-trading activities, which we refer to as asset-and-
|
liability management, and which consists primarily of interest-rate risk; and
|
•
|
business risk, including reputational, fiduciary and business conduct risk.
|
Many of these risks, as well as certain of the factors underlying each of these risks that could affect our businesses and our consolidated financial statements, are discussed in detail under Item 1A, “Risk Factors,” included in this Form 10-K.
The scope of our business requires that we balance these risks with a comprehensive and well-integrated risk management function. The identification, assessment, monitoring, mitigation and reporting of risks are essential to our financial performance and successful management of our businesses. These risks, if not effectively managed, can result in losses to State Street as well as erosion of our capital and damage to our reputation. Our systematic approach allows for an assessment of risks within a framework for evaluating opportunities for the prudent use of capital that appropriately balances risk and return.
Our objective is to optimize our return while operating at a prudent level of risk. In support of this objective, we have instituted a risk appetite framework that aligns our business strategy and financial objectives with the level of risk that we are willing to incur.
Our risk management is based on the following major goals:
|
▪
|
A culture of risk awareness that extends across all of our business activities;
|
|
▪
|
The identification, classification and quantification of State Street's material risks;
|
78
MANAGEMENT’S DISCUSSION AND ANALYSIS OF FINANCIAL CONDITION
AND RESULTS OF OPERATIONS (Continued)
|
▪
|
The establishment of our risk appetite and associated limits and policies, and our compliance with these limits;
|
|
▪
|
The establishment of a risk management structure at the “top of the house” that
|
enables the control and coordination of risk-taking across the business lines;
|
▪
|
The implementation of stress testing practices and a dynamic risk-assessment capability; and
|
|
▪
|
The overall flexibility to adapt to the ever-changing business and market conditions.
|
Our risk appetite framework outlines the quantitative limits and qualitative goals that define our risk appetite, as well as the responsibilities for measuring and monitoring risk against limits, and for reporting, escalating, approving and addressing exceptions. Our risk appetite framework is established by management with the guidance of Enterprise Risk Management, or ERM, a corporate risk oversight group, in conjunction with our Board of Directors. The Board formally reviews and approves our risk appetite statement annually.
The risk appetite framework describes the level and types of risk that we are willing to accommodate in executing our business strategy, and also serves as a guide in setting risk limits across our business units. In addition to our risk appetite framework, we use stress testing as another important tool in our risk management practice. Additional information with respect to our stress testing process and practices is provided under “Capital” in Management's Discussion and Analysis included under Item 7 in this Form 10-K.
Disclosures about our management of significant risks can be found on the following pages within this Form 10-K.
Governance and Structure
We have an approach to risk management that involves all levels of management, from the Board and its committees, including its Risk Committee, referred to as the RC, its Examining and Audit Committee, referred to as the E&A Committee, the Executive Compensation Committee, or ECC, and its Technology Committee, to each business unit and each employee. We allocate responsibility for risk oversight so that risk/return decisions are made at an appropriate level, and are subject to robust and effective review and challenge. Risk management is the responsibility of each employee, and is implemented through three lines of defense: the business units, which own and manage the risks inherent in their business, are considered the first line of defense; ERM and other support functions, such as Legal, Compliance, Finance and Vendor Management, provide the second line of defense; and Corporate Audit, which assesses the effectiveness of the first two lines of defense.
The responsibilities for effective review and challenge reside with senior managers, management oversight committees, Corporate Audit and, ultimately, the Board and its committees. While we believe that our risk management program is effective in managing the risks in our businesses, internal and external factors may create risks that cannot always be identified or anticipated.
Corporate-level risk committees provide focused oversight, and establish corporate standards and policies for specific risks, including credit, sovereign exposure, market, liquidity, operational information technology as well as new business products, regulatory compliance and ethics, vendor risk and model risks. These committees have been delegated the responsibility to develop recommendations and remediation strategies to address issues that affect or have the potential to affect State Street.
We maintain a risk governance committee structure which serves as the formal governance mechanism through which we seek to undertake the consistent identification, management and mitigation of various risks facing State Street in connection with its business activities. This governance structure is enhanced and integrated through multi-disciplinary involvement, particularly through ERM, as illustrated below.
79
MANAGEMENT’S DISCUSSION AND ANALYSIS OF FINANCIAL CONDITION
AND RESULTS OF OPERATIONS (Continued)
|
Management Risk Governance Committee Structure
|
||||||||||||
|
Executive Management Committees:
|
||||||||||||
|
Management Risk and Capital Committee
|
Business Conduct Risk Committee
|
Technology and Operational Risk Committee
|
||||||||||
|
Risk Committees:
|
||||||||||||
|
Asset-Liability Committee
|
Credit Risk and Policy Committee
|
Fiduciary Review Committee
|
Operational Risk Committee
|
Technology Risk Governance Committee
|
||||||||
|
Trading and Markets Risk Committee
|
Basel Oversight Committee
|
New Business and Product Committee
|
Executive Continuity Steering Committee
|
Executive Information Steering Committee
|
||||||||
|
Country Risk Committee
|
Securities Finance Risk Management Committee
|
Compliance and Ethics Committee
|
Vendor Management Steering Committee
|
Access Control Board
|
||||||||
|
Recovery and Resolution Planning Executive Steering Group
|
Model Risk Committee
|
|||||||||||
|
CCAR Steering Committee
|
||||||||||||
Enterprise Risk Management
The goal of ERM is to ensure that risks are proactively identified, well-understood and prudently managed in support of our business strategy. ERM provides risk oversight, support and coordination to allow for the consistent identification, measurement and management of risks across business units separate from the business units' activities, and is responsible for the formulation and maintenance of corporate-wide risk management policies and guidelines. In addition, ERM establishes and reviews limits and, in collaboration with business unit management, monitors key risks. Ultimately, ERM works to validate that risk-taking occurs within the risk appetite statement approved by the Board and conforms to associated risk policies, limits and guidelines.
The Chief Risk Officer, or CRO, is responsible for State Street’s risk management globally, leads ERM and has a dual reporting line to State Street’s Chief Executive Officer and the Board’s RC. ERM
manages its responsibilities globally through a three-dimensional organization structure:
|
•
|
“Vertical” business unit-aligned risk groups that support business managers with risk management, measurement and monitoring activities;
|
|
•
|
“Horizontal” risk groups that monitor the risks that cross all of our business units (for example, credit and operational risk); and
|
|
•
|
Risk oversight for international activities, which adds important regional and legal entity perspectives to global vertical and horizontal risk management.
|
Sitting on top of this three-dimensional organization structure is a centralized group responsible for the aggregation of risk exposures across the vertical, horizontal and regional dimensions, for consolidated reporting, for setting the corporate-level risk appetite framework and
80
MANAGEMENT’S DISCUSSION AND ANALYSIS OF FINANCIAL CONDITION
AND RESULTS OF OPERATIONS (Continued)
associated limits and policies, and for dynamic risk assessment across State Street.
Board Committees
The Board of Directors has four committees which assist it in discharging its responsibilities with respect to risk management: the Risk Committee, or RC, the Examining and Audit Committee, or the E&A Committee, the ECC, and the Technology Committee.
The RC is responsible for oversight related to the operation of our global risk management framework, including policies and procedures establishing risk management governance and processes, and risk control infrastructure for our global operations. The RC is responsible for reviewing and discussing with management our assessment and management of all risk applicable to our operations, including credit, market, interest rate, liquidity, operational and business risks, as well as compliance and reputational risk and related policies. In addition, the RC provides oversight on strategic capital governance principles and controls, and monitors capital adequacy in relation to risk. The RC is also responsible for discharging the duties and obligations of the Board under applicable Basel and other regulatory requirements.
The E&A Committee oversees the operation of our system of internal controls covering the integrity of our consolidated financial statements and reports, compliance with laws, regulations and corporate policies. The E&A Committee acts on behalf of the Board in monitoring and overseeing the performance of Corporate Audit and in reviewing certain communications with banking regulators. The E&A Committee has direct responsibility for the appointment, compensation, retention, evaluation and oversight of the work of our independent registered public accounting firm, including sole authority for the establishment of pre-approval policies and procedures for all audit engagements and any non-audit engagements.
The ECC has direct responsibility for the oversight of all compensation plans, policies, and programs of State Street in which executive officers participate and incentive, retirement, welfare as well as equity plans in which certain other employees of State Street participate. In addition, the ECC oversees the alignment of our incentive compensation arrangements with our safety and soundness, including the integration of risk management objectives, and related policies, arrangements and control processes, consistent with applicable related regulatory rules and guidance.
The Technology Committee leads and assists in the Board’s oversight of the role of technology in executing State Street’s strategy and supporting
State Street’s global business and operational requirements. The Technology Committee reviews the use of technology in our activities and operations, as well as significant technology and technology-related strategies, investments and policies. In addition, the Technology Committee reviews and approves technology and technology-related risk matters, including information and cyber security.
Executive Management Committees
The Management Risk and Capital Committee, referred to as MRAC, is the senior management decision-making body for risk and capital issues, and oversees our financial risks, our consolidated statement of condition, and our capital adequacy, liquidity and recovery and resolution planning. Its responsibilities include:
|
•
|
The approval of our risk appetite framework and top level risk limits and policies;
|
|
•
|
The monitoring and assessment of our capital adequacy based on regulatory requirements and internal policies; and
|
|
•
|
The ongoing monitoring and review of risks undertaken within the businesses, and our senior management oversight and approval of risk strategies and tactics.
|
MRAC, which is co-chaired by our CRO and CFO, regularly presents a report to the RC outlining developments in the risk environment and performance trends in our key business areas.
The Business Conduct Risk Committee, referred to as the BCRC, provides additional risk governance and leadership, by overseeing our business practices in terms of our compliance with law, regulation and our standards of business conduct, our commitments to clients and others with whom we do business, and potential reputational risks. Management considers adherence to high ethical standards to be critical to the success of our business and to our reputation. The BCRC is co-chaired by our CRO and our Chief Legal Officer.
The Technology and Operational Risk Committee, referred to as TORC, oversees and assesses the effectiveness of corporate-wide technology and operational risk management programs, to manage and control technology and operational risk consistently across the organization. TORC is co-chaired by our Vice Chairman and our Head of Global Operations and Technology. TORC may meet jointly with MRAC periodically to review or approve common areas of interest such as risk frameworks and policies.
Risk Committees
The following risk committees, under the oversight of the respective executive management
81
MANAGEMENT’S DISCUSSION AND ANALYSIS OF FINANCIAL CONDITION
AND RESULTS OF OPERATIONS (Continued)
committees, have focused responsibilities for oversight of specific areas of risk management:
MRAC
|
•
|
The Asset-Liability Committee, referred to as ALCO, oversees the management of our consolidated statement of condition and the management of our global liquidity, our interest-rate risk, and our non-traded market risk positions, as well as the business activities of our Global Treasury group and the risks associated with the generation of net interest revenue and overall balance sheet management. ALCO’s roles and responsibilities are designed to work complementary to, and be coordinated with, MRAC, which approves our corporate risk appetite and associated balance sheet strategy;
|
|
•
|
The Credit Risk and Policy Committee has primary responsibility for the oversight and review of credit and counterparty risk across business units, as well as oversight, review and approval of the credit risk policies and guidelines; the Committee consists of senior executives within ERM, including the CRO, and reviews policies and guidelines related to all aspects of our business which give rise to credit risk; our business units are also represented on the Credit Risk and Policy Committee; credit risk policies and guidelines are reviewed periodically, but at least annually;
|
|
•
|
The Trading and Markets Risk Committee, referred to as the TMRC, reviews the effectiveness of, and approves, the market risk framework at least annually; it is the senior oversight and decision-making committee for risk management within our global markets and trading-and-clearing businesses; the TMRC is responsible for the formulation of guidelines, strategies and workflows with respect to the measurement, monitoring and control of our trading market risk, and also approves market risk tolerance limits and dealing authorities; the TMRC meets regularly to monitor the management of our trading market risk activities;
|
|
•
|
The Basel Oversight Committee provides oversight and governance over Basel related regulatory requirements, assesses compliance with respect to Basel regulations and approves all material methodologies and changes, policies and reporting;
|
|
•
|
The Country Risk Committee oversees the identification, assessment, monitoring,
|
reporting and mitigation, where necessary, of country risks;
|
•
|
The Securities Finance Risk Management Committee oversees the risks in our securities finance business, including collateral and margin policies;
|
|
•
|
The Recovery and Resolution Planning Executive Steering Group oversees the development of recovery and resolution plans as required by banking regulators;
|
|
•
|
The Model Risk Committee, referred to as the MRC, monitors the overall level of model risk and provides oversight of the model governance process pertaining to financial models, including the validation of key models and the ongoing monitoring of model performance. The MRC may also, as appropriate, mandate remedial actions and compensating controls to be applied to models to address modeling deficiencies as well as other issues identified; and
|
|
•
|
The CCAR Steering Committee provides primary supervision of the stress tests performed in conformity with the Federal Reserve's CCAR process and the Dodd-Frank Act, and is responsible for the overall management, review, and approval of all material assumptions, methodologies, and results of each stress scenario.
|
BCRC
|
•
|
The Fiduciary Review Committee reviews and assesses the risk management programs of those units in which we serve in a fiduciary capacity;
|
|
•
|
The New Business and Product Committee provides oversight of the evaluation of the risk inherent in proposed new products or services and new business, and extensions of existing products or services, evaluations including economic justification, material risk, compliance, regulatory and legal considerations, and capital and liquidity analyses; and
|
|
•
|
The Compliance and Ethics Committee provides review and oversight of our compliance programs, including its culture of compliance and high standards of ethical behavior.
|
TORC
|
•
|
The Technology Risk Governance Committee provides regular reporting to TORC and escalates technology risk issues to TORC, as appropriate;
|
82
MANAGEMENT’S DISCUSSION AND ANALYSIS OF FINANCIAL CONDITION
AND RESULTS OF OPERATIONS (Continued)
|
•
|
The Executive Continuity Steering Committee reviews overall business continuity program performance, provides for executive accountability for compliance with the business continuity program and standards, and reviews and approves major changes or exceptions to program policy and standards;
|
|
•
|
The Executive Information Steering Committee is responsible for managing the Enterprise Information Security posture and program, provides enterprise-wide oversight of the Information Security Program to provide that controls are measured and managed, and serves as an escalation point for issues identified during the execution of information technology activities and risk mitigation;
|
|
•
|
The Vendor Management Steering Committee provides oversight over the vendor management program, approves policies, and serves as an escalation path for program compliance exceptions;
|
|
•
|
The Access Control Board establishes and provides appropriate governance and controls over our access control security framework; and
|
|
•
|
The Operational Risk Committee, which functions under the oversight of both the BCRC and TORC, provides cross-business oversight of operational risk and reviews and approves operational risk guidelines that implement the corporate operational risk policy; these guidelines and other operational risk methodologies are used to identify, measure, manage and control operational risk in a consistent manner across State Street.
|
Credit Risk Management
Core Policies and Principles
We define credit risk as the risk of financial loss if a counterparty, borrower or obligor, collectively referred to as counterparty, is either unable or unwilling to repay borrowings or settle a transaction in accordance with underlying contractual terms. We assume credit risk in our traditional non-trading lending activities, such as loans and contingent commitments, in our investment securities portfolio, where recourse to a counterparty exists, and in our direct and indirect trading activities, such as principal securities lending and foreign exchange and indemnified agency securities lending. We also assume credit risk in our day-to-day treasury and securities
and other settlement operations, in the form of deposit placements and other cash balances, with central banks or private sector institutions.
We distinguish between three major types of credit risk:
|
▪
|
Default risk - the risk that a counterparty fails to meet its contractual payment obligations;
|
|
▪
|
Country risk - the risk that we may suffer a loss, in any given country, due to any of the following reasons: deterioration of economic conditions, political and social upheaval, nationalization and appropriation of assets, government repudiation of indebtedness, exchange controls, and disruptive currency depreciation or devaluation; and
|
|
▪
|
Settlement risk - the risk that the settlement or clearance of transactions will fail, which arises whenever the exchange of cash, securities and/or other assets is not simultaneous.
|
The acceptance of credit risk is governed by corporate policies and guidelines, which include standardized procedures applied across the entire organization. These policies and guidelines include specific requirements related to each counterparty's risk profile; the markets served; counterparty, industry and country concentrations; and regulatory compliance. These policies and procedures also implement a number of core principles, which include the following:
|
•
|
We measure and consolidate all credit risks to each counterparty, or group of counterparties, in accordance with a “one-obligor” principle that aggregates risks across all of our business units;
|
|
•
|
ERM reviews and approves all extensions of credit, or material changes to extensions of credit (such as changes in term, collateral structure or covenants), in accordance with assigned credit-approval authorities;
|
|
•
|
Credit-approval authorities are assigned to individuals according to their qualifications, experience and training, and these authorities are periodically reviewed. Our largest exposures require approval by the Credit Committee, a sub-committee of the Credit Risk and Policy Committee. With respect to small and low-risk extensions of credit to certain types of counterparties, approval authority is granted to individuals outside of ERM;
|
|
•
|
We seek to avoid or limit undue concentrations of risk. Counterparty (or groups of counterparties), industry, country and product-specific concentrations of risk are subject to frequent review and approval in accordance with our risk appetite;
|
83
MANAGEMENT’S DISCUSSION AND ANALYSIS OF FINANCIAL CONDITION
AND RESULTS OF OPERATIONS (Continued)
|
•
|
We determine the creditworthiness of all counterparties through a detailed risk assessment, including the use of comprehensive internal risk-rating methodologies;
|
|
•
|
We review all extensions of credit and the creditworthiness of all counterparties at least annually. The nature and extent of these reviews are determined by the size, nature and term of the extensions of credit and the creditworthiness of the counterparty; and
|
|
•
|
We subject all core policies and principles to annual review as an integral part of our periodic assessment of our risk appetite.
|
Our corporate policies and guidelines require that the business units which engage in activities that give rise to credit and counterparty risk comply with procedures that promote the extension of credit for legitimate business purposes; are consistent with the maintenance of proper credit standards; limit credit-related losses; and are consistent with our goal of maintaining a strong financial condition.
Structure and Organization
The Credit Risk Management group, an integral part of ERM, is responsible for the assessment, approval and monitoring of all types of credit risk across State Street. The group is managed centrally, and has dedicated teams in a number of locations worldwide, across our businesses. The Credit Risk Management group is responsible for all requisite policies and procedures, and for our advanced internal credit-rating systems and methodologies. In addition, the group, in conjunction with the appropriate business units, establishes appropriate measurements and limits to control the amount of credit risk accepted across its various business activities, both at the portfolio level and for each individual counterparty or group of counterparties, to individual industries, and also to counterparties by product and country of risk. These measurements and limits are reviewed periodically, but at least annually.
In conjunction with other groups in ERM, Credit Risk Management is jointly responsible for the design, implementation and oversight of our credit risk measurement and management systems, including data and assessment systems, quantification systems and the reporting framework.
Various key committees within State Street are responsible for the oversight of credit risk and associated credit risk policies, systems and models. All credit-related activities are governed by our risk appetite framework and our credit risk guidelines, which define our general philosophy with respect to
credit risk and the manner in which we control, manage and monitor such risks.
The previously described Credit Risk and Policy Committee (refer to "Risk Committees" in this Management's Discussion and Analysis) has primary responsibility for the oversight, review and approval of the credit risk guidelines and policies. Credit risk guidelines and policies are reviewed periodically, but at least annually.
The Credit Committee, a sub-committee of the Credit Risk and Policy Committee, has responsibility for assigning credit authority and approving the largest and higher-risk extensions of credit to individual counterparties or groups of counterparties.
Both the Credit Risk and Policy Committee and the Credit Committee provide periodic updates to MRAC and the Board's RC.
Credit Ratings
We seek to limit credit risk arising from transactions with our counterparties by performing initial and ongoing due diligence on their creditworthiness when conducting any business with them or approving any credit limits.
This due diligence process includes the assignment of an internal credit rating, which is determined by the use of internally developed and validated methodologies, scorecards and a 15-grade rating scale. This risk-rating process incorporates the use of risk-rating tools in conjunction with management judgment; qualitative and quantitative inputs are captured in a replicable manner and, following a formal review and approval process, an internal credit rating based on our rating scale is assigned. All credit ratings are reviewed and approved by the Credit Risk Management group or designees within ERM. To facilitate comparability across the portfolio, counterparties within a given sector are rated using a risk-rating tool developed for that sector.
All risk-rating methodologies are approved by the Credit Risk and Policy Committee, after completion of internal model validation processes, and are subject to an annual review, including re-validation.
We generally rate our counterparties individually, although certain portfolios defined by us as low-risk are rated on a pooled basis. We evaluate and rate the credit risk of our counterparties on an ongoing basis.
Risk Parameter Estimates
Our internal risk-rating system promotes a clear and consistent approach to the determination of appropriate credit risk classifications for all of our credit counterparties and exposures, tracking the
84
MANAGEMENT’S DISCUSSION AND ANALYSIS OF FINANCIAL CONDITION
AND RESULTS OF OPERATIONS (Continued)
changes in risk associated with these counterparties and exposures over time. This capability enhances our ability to more accurately calculate both risk exposures and capital, enabling better strategic decision making across the organization.
We use credit risk parameter estimates for the following purposes:
|
•
|
The assessment of the creditworthiness of new counterparties and, in conjunction with our risk appetite statement, the development of appropriate credit limits for all products and services, including loans, foreign exchange, securities finance, placements and repurchase agreements;
|
|
•
|
The use of an automated process for limit approvals for certain low-risk counterparties, as defined in our credit risk guidelines, based on the counterparty’s probability-of-default, or PD, rating class;
|
|
•
|
The development of approval authority matrices based on PD; riskier counterparties with higher ratings require higher levels of approval for a comparable PD and limit size compared to less risky counterparties with lower ratings;
|
|
•
|
The analysis of risk concentration trends using historical PD and exposure-at-default, or EAD, data;
|
|
•
|
The standardization of rating integrity testing by the Global Counterparty Review group using rating parameters;
|
|
•
|
The determination of the level of management review of short-duration advances depending on PD; riskier counterparties with higher rating class values generally trigger higher levels of management escalation for comparable short-duration advances compared to less risky counterparties with lower rating-class values;
|
|
•
|
The monitoring of credit facility utilization levels using EAD values and the identification of instances where counterparties have exceeded limits;
|
|
•
|
The aggregation and comparison of counterparty exposures with risk appetite levels to determine if businesses are maintaining appropriate risk levels; and
|
|
•
|
The determination of our regulatory capital requirements for the advanced internal ratings-based approach provided in the Basel framework.
|
Credit Risk Mitigation
We seek to limit our credit exposure and reduce our potential credit losses through various types of risk mitigation. In our day-to-day management of credit risks, we utilize and recognize the following types of risk mitigation.
|
•
|
Collateral.
In many parts of our business, we regularly require or agree for collateral to be received from or provided to clients and counterparties in connection with contracts that incur credit risk. In our trading businesses, this collateral is typically in the form of cash and securities (government securities and other bonds or equity securities). Credit risks in our non-trading and securities finance businesses are also often secured by bonds and equity securities and by other types of assets. In all instances, collateral serves to reduce the risk of loss inherent in an exposure by improving the prospect of recovery in the event of a counterparty default. While collateral is often an alternative source of repayment, it generally does not replace the requirement within our policies and guidelines for high-quality underwriting standards.
|
Our credit risk guidelines require that the collateral we accept for risk mitigation purposes is of high quality, can be reliably valued and can be liquidated if or when required. Generally, when collateral is of lower quality, more difficult to value or more challenging to liquidate, higher discounts to market values are applied for the purposes of measuring credit risk. For certain less liquid collateral, longer liquidation periods are assumed when determining the credit exposure.
All types of collateral are assessed regularly by ERM, as is the basis on which the collateral is valued. Our assessment of collateral, including the ability to liquidate collateral in the event of a counterparty default, is an integral component of our assessment of risk and approval of credit limits. We also seek to identify, limit and monitor instances of "wrong-way" risk, where a counterparty’s risk of default is positively correlated with the risk of our collateral eroding in value.
We maintain policies and procedures requiring that all documentation used to collateralize a transaction is legal, valid, binding and enforceable in the relevant jurisdictions. We also conduct legal reviews to assess whether our documentation meets these standards on an ongoing basis.
|
•
|
Netting.
Netting is a mechanism that allows institutions and counterparties to net offsetting exposures and payment obligations against one another through the
|
85
MANAGEMENT’S DISCUSSION AND ANALYSIS OF FINANCIAL CONDITION
AND RESULTS OF OPERATIONS (Continued)
use of qualifying master netting agreements. A master netting agreement allows the netting of rights and obligations arising under derivative or other transactions that have been entered into under such an agreement upon the counterparty’s default, resulting in a single net claim owed by, or to, the counterparty. This is commonly referred to as "close-out netting,” and is pursued wherever possible. We may also enter into master agreements that allow for the netting of amounts payable on a given day and in the same currency, reducing our settlement risk. This is commonly referred to as “payment netting,” and is widely used in our foreign exchange activities.
As with collateral, we have policies and procedures in place to apply close-out and payment netting only to the extent that we have verified legal validity and enforceability of the master agreement. In the case of payment netting, operational constraints with our counterparties may preclude us from reducing settlement risk, notwithstanding the legal right to require the same under the master netting agreement.
Generally, given the nature of our operations and our risk profile, we do not employ risk mitigation in the form of guarantees and credit derivatives as extensively as traditional commercial and investment banks. Accordingly, while we may benefit from third-party guarantees in some instances, we do not currently recognize the full potential benefit of related risk reduction in our measurement or risk-weighting of our credit exposure. We have established systematic processes to allow only eligible collateral and permitted netting, as defined in the Basel framework, to be recognized in our measurement of credit risk.
Credit Limits
Central to our philosophy for our management of credit risk is the approval and imposition of credit limits, against which we monitor the actual and potential future credit exposure arising from our business activities with counterparties or groups of counterparties. Credit limits are a reflection of our risk appetite, which may be determined by the creditworthiness of the counterparty, the nature of the risk inherent in the business undertaken with the counterparty, or a combination of relevant credit factors. Our risk appetite for certain sectors and certain countries and geographic regions may also influence the level of risk we are willing to assume to certain counterparties.
The analysis and approval of credit limits is undertaken in a consistent manner across all of our businesses, although the nature and extent of the analysis may vary, based on the type, term and
magnitude of the risk being assumed. Credit limits and underlying trading-related exposures are assessed and measured on both a gross and net basis, with net exposure determined by deducting the value of collateral. In nearly all instances, credit limit approvals, for all our business units and products, are undertaken by the Credit Risk Management group, by individuals to whom credit authority has been delegated, or by the Credit Committee.
Credit limits are re-evaluated annually, or more frequently as needed, and are revised periodically on prevailing and anticipated market conditions, changes in counterparty or country-specific credit ratings and outlook, changes in our risk appetite for certain counterparties, sectors or countries, and enhancements to the measurement of credit utilization.
Reporting
Ongoing active monitoring and management of our credit risk is an integral part of our credit risk management framework. We maintain management information systems to identify, measure, monitor and report credit risk across businesses and legal entities, enabling ERM and our businesses to have timely access to accurate information on all credit limits and exposures. Monitoring is performed along the dimensions of counterparty, industry, country and product-specific risks to facilitate the identification of concentrations of risk and emerging trends.
Key aspects of this credit risk reporting structure include governance and oversight groups, policies that define standards for the reporting of credit risk, data aggregation and sourcing systems, and separate testing of relevant risk reporting functions by Corporate Audit.
The Credit Portfolio Management group routinely assesses the composition of our overall credit risk portfolio for alignment with our stated risk appetite. This assessment includes routine analysis and reporting of the portfolio, monitoring of market-based indicators, the assessment of industry trends and developments, and regular reviews of concentrated risks. The Credit Portfolio Management group is also responsible, in conjunction with the business units, for defining the appetite for credit risk in the major sectors in which we have a concentration of business activities. These sector-level risk appetite statements, which include counterparty selection criteria and granular underwriting guidelines, are reviewed periodically and approved by the Credit Risk and Policy Committee.
Monitoring
Regular surveillance of credit and counterparty risks is undertaken by our business units, the Credit Risk Management group and designees with ERM,
86
MANAGEMENT’S DISCUSSION AND ANALYSIS OF FINANCIAL CONDITION
AND RESULTS OF OPERATIONS (Continued)
allowing for frequent and extensive oversight. This surveillance process includes, but is not limited to, the following components:
|
•
|
Annual Reviews.
A formal review is conducted at least annually on all counterparties, and includes a thorough review of operating performance, primary risk factors and our internal credit risk rating. This annual review also includes a review of current and proposed credit limits, an assessment of our ongoing risk appetite and verification that supporting legal documentation remains effective.
|
|
•
|
Interim Monitoring.
Periodic monitoring of our largest and riskiest counterparties is undertaken more frequently, utilizing financial information, market indicators and other relevant credit and performance measures. The nature and extent of this interim monitoring is individually tailored to certain counterparties and/or industry sectors to identify material changes to the risk profile of a counterparty (or group of counterparties) and assign an updated internal risk rating in a timely manner.
|
We maintain an active "watch list" for all counterparties where we have identified a concern that the actual or potential risk of default has increased. The watch-list status denotes a concern with some aspect of a counterparty's risk profile that warrants closer monitoring of the counterparty's financial performance and related risk factors. Our ongoing monitoring processes are designed to facilitate the early identification of counterparties whose creditworthiness is deteriorating; any counterparty may be placed on the watch list by ERM at its sole discretion.
Counterparties that receive an internal risk rating within a certain range on our rating scale are eligible for watch list designation. These risk ratings generally correspond with the non-investment grade or near non-investment grade ratings established by the major independent credit-rating agencies, and also include the regulatory classifications of “Special Mention,” “Substandard,” “Doubtful” and “Loss.” Counterparties whose internal ratings are outside this range may also be placed on the watch list.
The Global Credit Review group, referred to as GCR, maintains primary responsibility for our watch list processes, and generates a monthly report of all watch list counterparties. The watch list is reviewed monthly in recurring meetings conducted by GCR with participation from the business units, senior ERM staff, and representatives from our corporate finance and legal groups as appropriate. These meetings include a review of all individual watch list
counterparties, together with credit limits and prevailing exposures, and are focused on actions to contain, reduce or eliminate the risk of loss to State Street. Identified actions are documented and monitored.
Controls
GCR provides a separate level of surveillance and oversight over the integrity of our internal risk-rating system, by providing a separate review of all ratings processes. As a critical function, GCR is subject to oversight by the Credit Risk and Policy Committee, and provides periodic updates to the Board’s RC. GCR reviews all counterparty credit ratings for all sectors on an ongoing basis.
Specific activities of GCR include the following:
|
•
|
Separate and objective assessments of our credit and counterparty exposures to determine the nature and extent of risk undertaken by the business units;
|
|
•
|
Periodic business unit reviews, focusing on the assessment of credit analysis, policy compliance, prudent transaction structure and underwriting standards, administration and documentation, risk-rating integrity, and relevant trends;
|
|
•
|
Identification and monitoring of developing counterparty, market and/or industry sector trends to limit risk of loss and protect capital;
|
|
•
|
Regular and formal reporting of reviews, including findings and requisite actions to remedy identified deficiencies;
|
|
•
|
Allocation of resources for specialized risk assessments (on an as-needed basis);
|
|
•
|
Assessment of the appropriate level of the allowance for loan and lease losses; and
|
|
•
|
Liaison with auditors and regulatory personnel on matters relating to risk rating, reporting, and measurement.
|
Reserve for Credit Losses
We maintain an allowance for loan losses to support our on-balance sheet credit exposures. We also maintain a reserve for unfunded commitments and letters of credit to support our off-balance credit exposure. The two components together represent the reserve for credit losses. Review and evaluation of the adequacy of the reserve for credit losses is ongoing throughout the year, but occurs at least quarterly, and is based, among other factors, on our evaluation of the level of risk in the portfolio, the volume of adversely classified loans, previous loss experience, current trends, and economic conditions and their effect on our counterparties. Additional information about the allowance for loan losses is
87
MANAGEMENT’S DISCUSSION AND ANALYSIS OF FINANCIAL CONDITION
AND RESULTS OF OPERATIONS (Continued)
provided in note
4
to the consolidated financial statements included under Item 8 of this Form 10-K.
Liquidity Risk Management
Liquidity risk is defined as the potential that our financial condition or overall viability could be adversely affected by an actual or perceived inability to meet cash and collateral obligations. The goal of liquidity risk management is to maintain, even in the event of stress, our ability to meet our cash and collateral obligations.
Liquidity is managed to meet our financial obligations in a timely and cost-effective manner, as well as maintain sufficient flexibility to fund strategic corporate initiatives as they arise. Our effective management of liquidity involves the assessment of the potential mismatch between the future cash demands of our clients and our available sources of cash under both normal and adverse economic and business conditions.
We manage our liquidity on a global, consolidated basis. We also manage liquidity on a stand-alone basis at the parent company, as well as at certain branches and subsidiaries of State Street Bank. State Street Bank generally has access to markets and funding sources limited to banks, such as the federal funds market and the Federal Reserve's discount window. Our parent company is managed to a more conservative liquidity profile, reflecting narrower market access. Our parent company typically holds enough cash, primarily in the form of overnight interest-bearing deposits with its banking subsidiaries, to meet its current debt maturities and cash needs, as well as those projected over the next one-year period. As of
December 31, 2014
, the value of the parent company's net liquid assets totaled
$6.03 billion
, compared with
$4.42 billion
as of
December 31, 2013
.
Based on our level of consolidated liquid assets and our ability to access the capital markets for additional funding when necessary, including our ability to issue debt and equity securities under our current universal shelf registration, management considers our overall liquidity as of
December 31, 2014
to be sufficient to meet its current commitments and business needs, including accommodating the transaction and cash management needs of its clients.
Governance
Global Treasury is responsible for our management of liquidity. This includes the day-to-day management of our global liquidity position, the development and monitoring of early warning indicators, key liquidity risk metrics, the creation and execution of stress tests, the evaluation and implementation of regulatory requirements, the
maintenance and execution of our liquidity guidelines and contingency funding plan, and routine management reporting to ALCO, MRAC and the Board's RC.
Global Treasury Risk Management, part of ERM, provides separate oversight over the identification, communication, and management of Global Treasury’s risks in support of our business strategy. Global Treasury Risk Management reports to the CRO. Global Treasury Risk Management’s responsibilities relative to liquidity risk management include the development and review of policies and guidelines; the monitoring of limits related to adherence to the liquidity risk guidelines and associated reporting.
Liquidity Framework
Our liquidity framework contemplates areas of potential risk based on our activities, size, and other appropriate risk-related factors. In managing liquidity risk we employ limits, maintain established metrics and early warning indicators, and perform routine stress testing to identify potential liquidity needs. This process involves the evaluation of a combination of internal and external scenarios which assist us in measuring our liquidity position and in identifying potential increases in cash needs or decreases in available sources of cash, as well as the potential impairment of our ability to access the global capital markets.
We manage liquidity according to several principles that are equally important to our overall liquidity risk management framework:
|
•
|
Structural liquidity management addresses liquidity by monitoring and directing the composition of our consolidated statement of condition. Structural liquidity is measured by metrics such as the percentage of total wholesale funds to consolidated total assets, and the percentage of non-government investment securities to client deposits. In addition, on a regular basis and as described below, our structural liquidity is evaluated under various stress scenarios.
|
|
•
|
Tactical liquidity management addresses our day-to-day funding requirements and is largely driven by changes in our primary source of funding, which are client deposits. Fluctuations in client deposits may be supplemented with short-term borrowings, which generally include commercial paper and certificates of deposit.
|
|
•
|
Stress testing and contingent funding planning are longer-term strategic liquidity risk management practices. Regular and ad hoc liquidity stress testing are performed
|
88
MANAGEMENT’S DISCUSSION AND ANALYSIS OF FINANCIAL CONDITION
AND RESULTS OF OPERATIONS (Continued)
under various severe but plausible scenarios at the consolidated level and at significant subsidiaries, including State Street Bank. These tests contemplate severe market and State Street-specific events under various time horizons and severities. Tests contemplate the impact of material changes in key funding sources, credit ratings, additional collateral requirements, contingent uses of funding, systemic shocks to the financial markets, and operational failures based on market and State Street-specific assumptions. The stress tests evaluate the required level of funding versus available sources in an adverse environment. As stress testing contemplates potential forward-looking scenarios, results also serve as a trigger to activate specific liquidity stress levels and contingent funding actions.
Contingency Funding Plans, or CFPs, are designed to assist senior management with decision-making associated with any contingency funding response to a possible or actual crisis scenario. The CFPs define roles, responsibilities and management actions to be taken in the event of deterioration of our liquidity profile caused by either a State Street-specific event or a broader disruption in the capital markets. Specific actions are linked to the level of stress indicated by these measures or by management judgment of market conditions.
Liquidity Risk Metrics
In managing our liquidity, we employ early warning indicators and metrics. Early warning indicators are intended to detect situations which may result in a liquidity stress, including changes in our common stock price and the spread on our long-term debt. Additional metrics that are critical to the management of our consolidated statement of condition and monitored as part of our routine liquidity management include measures of our fungible cash position, purchased wholesale funds, unencumbered liquid assets, deposits, and the total of investment securities and loans as a percentage of total client deposits.
Asset Liquidity
Central to the management of our liquidity is asset liquidity, which generally consists of unencumbered highly liquid securities, cash and cash equivalents carried in our consolidated statement of condition. We restrict the eligibility of securities of asset liquidity to U.S. Government and federal agency securities (including mortgage-backed securities), selected non-U.S. Government and supranational securities as well as certain other high- quality securities which generally are more liquid than other types of assets even in times of stress. Our
asset liquidity metric is similar to the high-quality liquid assets under the U.S. liquidity coverage ratio, and for comparison purposes our high-quality liquid assets, under the LCR final rule definition, are estimated to be
$115.56 billion
as of
December 31, 2014
.
|
TABLE 32: COMPONENTS OF ASSET LIQUIDITY
|
||||||||
|
(In millions)
|
December 31, 2014
|
December 31, 2013
|
||||||
|
Asset Liquidity:
|
||||||||
|
Highly liquid short-term investments
(1)
|
$
|
93,523
|
|
$
|
64,257
|
|
||
|
Investment securities
|
26,670
|
|
22,322
|
|
||||
|
Total
|
$
|
120,193
|
|
$
|
86,579
|
|
||
|
Twelve Months Ended December 31,
|
||||||||
|
(In millions)
|
2014
|
2013
|
||||||
|
Average Asset Liquidity:
|
||||||||
|
Highly liquid short-term investments
(1)
|
$
|
55,229
|
|
$
|
28,946
|
|
||
|
Investment securities
|
23,577
|
|
22,032
|
|
||||
|
Total
|
$
|
78,806
|
|
$
|
50,978
|
|
||
(1)
Composed of interest-bearing deposits with banks.
With respect to highly liquid short-term investments presented in the preceding table, due to the continued elevated level of client deposits as of
December 31, 2014
, we maintained cash balances in excess of regulatory requirements governing deposits with the Federal Reserve of approximately
$83.40 billion
at the Federal Reserve, the ECB and other non-U.S. central banks, compared to
$51.03 billion
as of
December 31, 2013
.
The increase in investment securities as of
December 31, 2014
compared to
December 31, 2013
, presented in the table, was mainly associated with our repositioning of the investment portfolio in light of the liquidity requirements of the LCR.
Liquid securities carried in our asset liquidity include securities pledged without corresponding advances from the Federal Reserve Bank of Boston, or FRB, the Federal Home Loan Bank of Boston, or FHLB, and other non-U.S. central banks. State Street Bank is a member of the FHLB. This membership allows for advances of liquidity in varying terms against high-quality collateral, which helps facilitate asset-and-liability management.
Access to primary, intra-day and contingent liquidity provided by these utilities is an important source of contingent liquidity with utilization subject to underlying conditions. As of
December 31, 2014
and
2013
, we had no outstanding primary credit borrowings from the FRB discount window or any other central bank facility, and as of the same dates, no FHLB advances were outstanding.
89
MANAGEMENT’S DISCUSSION AND ANALYSIS OF FINANCIAL CONDITION
AND RESULTS OF OPERATIONS (Continued)
In addition to the securities included in our asset liquidity, we have significant amounts of other high-quality, unencumbered investment securities. The aggregate fair value of those securities was
$60.06 billion
as of
December 31, 2014
, compared to
$66.16 billion
as of
December 31, 2013
. These securities are available sources of liquidity, although not as rapidly deployed as those included in our asset liquidity.
Liquidity Coverage Ratio
On September 3, 2014, U.S. banking regulators issued a final rule to implement the Basel Committee's LCR in the U.S. The LCR is intended to promote the short-term resilience of internationally active banking organizations, like State Street, to improve the banking industry's ability to absorb shocks arising from idiosyncratic or market stress, and improve the measurement and management of liquidity risk.
The LCR measures an institution’s high-quality liquid assets, or HQLA, against its net cash outflows. The LCR will be phased in, beginning on January 1, 2015, at 80%, with full implementation beginning on January 1, 2017.
Beginning with January 2015, State Street is required to report its LCR to the Federal Reserve on a monthly basis. Daily reporting of the LCR to the Federal Reserve will be required beginning with July 2015.
The LCR final rule is largely similar to the proposed rule issued by U.S. banking regulators in October 2013; however, the final rule contains several changes and clarifications, including revisions to the definition of operational deposits and more favorable foreign exchange netting treatment, both of which we expect to benefit our LCR ratio, and the exclusion as operational deposits of deposits from non-regulated funds, which we expect to negatively affect our LCR ratio.
Compliance with the LCR has required that we maintain an investment portfolio that contains an adequate amount of HQLA. In general, HQLA investments generate a lower investment return than other the types of investments, resulting in a negative impact on our net interest revenue and our net interest margin. In addition, the level of HQLA we are required to maintain under the LCR is dependent upon our client relationships and the nature of services we provide, which may change over time. For example, if the percentage of our operational deposits relative to non-operational deposits increases, we would expect to require less HQLA in order to maintain our LCR. Conversely, if the percentage of non-operational deposits increases relative to our operational deposits, we would expect
to require additional HQLA in order to maintain our LCR.
Net Stable Funding Ratio
In October 2014, the Basel Committee issued final guidance with respect to the Net Stable Funding Ratio, or NSFR. The NSFR will require banking organizations to maintain a stable funding profile relative to the composition of their assets and off-balance sheet activities. The NSFR limits over-reliance on short-term wholesale funding, encourages better assessment of funding risk across all on- and off-balance sheet exposures, and promotes funding stability. The final guidance establishes a one-year liquidity standard representing the proportion of long-term assets funded by long-term stable funding, with the NSFR scheduled to become a minimum standard beginning on January 1, 2018.
We are reviewing the specifics of the final guidance and will evaluate the U.S. implementation of this standard to analyze the impact and develop strategies for compliance. U.S. banking regulators have not yet issued a proposal to implement the NSFR.
Uses of Liquidity
Significant uses of our liquidity could result from the following: withdrawals of client deposits; draw-downs of unfunded commitments to extend credit or to purchase securities, generally provided through lines of credit; and short-duration advance facilities. Such circumstances would generally arise under stress conditions including deterioration in credit ratings. We had unfunded commitments to extend credit with gross contractual amounts totaling
$24.25 billion
and
$21.30 billion
as of
December 31, 2014
and
2013
, respectively. These amounts do not reflect the value of any collateral. As of
December 31, 2014
, approximately
76%
of our unfunded commitments to extend credit expire within one year. Since many of our commitments are expected to expire or renew without being drawn upon, the gross contractual amounts do not necessarily represent our future cash requirements.
90
MANAGEMENT’S DISCUSSION AND ANALYSIS OF FINANCIAL CONDITION
AND RESULTS OF OPERATIONS (Continued)
Funding
Deposits:
We provide products and services including custody, accounting, administration, daily pricing, foreign exchange services, cash management, financial asset management, securities finance and investment advisory services. As a provider of these products and services, we generate client deposits, which have generally provided a stable, low-cost source of funds. As a global custodian, clients place deposits with State Street entities in various currencies. We invest these client deposits in a combination of investment securities and short-duration financial instruments whose mix is determined by the characteristics of the deposits.
For the past several years, we have experienced higher client deposit inflows toward the end of the quarter or the end of the year. As a result, we believe average client deposit balances are more reflective of ongoing funding than period-end balances.
|
TABLE 33: CLIENT DEPOSITS
|
|||||||||||||||
|
Average Balance
|
|||||||||||||||
|
December 31,
|
Year Ended December 31,
|
||||||||||||||
|
(In millions)
|
2014
|
2013
|
2014
|
2013
|
|||||||||||
|
Client deposits
(1)
|
$
|
195,276
|
|
$
|
182,268
|
|
$
|
167,470
|
|
$
|
143,043
|
|
|||
(1)
Balance as of
December 31, 2014
excluded term wholesale certificates of deposit, or CDs, of
$13.76 billion
; average balances for the
year ended
December 31, 2014
and
2013
excluded average CDs of
$6.87 billion
and
$2.50 billion
, respectively
.
Short-Term Funding:
Our corporate commercial paper program, under which we can issue up to
$3.0 billion
of commercial paper with original maturities of up to 270 days from the date of issuance, had
$2.48 billion
and
$1.82 billion
of commercial paper outstanding as of
December 31, 2014
and
2013
, respectively.
Our on-balance sheet liquid assets are also an integral component of our liquidity management strategy. These assets provide liquidity through maturities of the assets, but more importantly, they provide us with the ability to raise funds by pledging the securities as collateral for borrowings or through outright sales. In addition, our access to the global capital markets gives us the ability to source incremental funding at reasonable rates of interest from wholesale investors. As discussed earlier under “Asset Liquidity,” State Street Bank's membership in the FHLB allows for advances of liquidity with varying terms against high-quality collateral.
Short-term secured funding also comes in the form of securities lent or sold under agreements to repurchase. These transactions are short-term in
nature, generally overnight, and are collateralized by high-quality investment securities. These balances were
$8.93 billion
and
$7.95 billion
as of
December 31, 2014
and
2013
, respectively.
State Street Bank currently maintains a line of credit with a financial institution of CAD
$800 million
, or approximately
$690 million
as of
December 31, 2014
, to support its Canadian securities processing operations. The line of credit has no stated termination date and is cancelable by either party with prior notice. As of
December 31, 2014
, there was no balance outstanding on this line of credit.
Long-Term Funding:
As of
December 31, 2014
, State Street Bank had Board authority to issue unsecured senior debt securities from time to time, provided that the aggregate principal amount of such unsecured senior debt outstanding at any one time does not exceed
$5 billion
. As of
December 31, 2014
,
$4.1 billion
was available for issuance pursuant to this authority. As of
December 31, 2014
, State Street Bank also had Board authority to issue an additional
$500 million
of subordinated debt.
We maintain an effective universal shelf registration that allows for the public offering and sale of debt securities, capital securities, common stock, depositary shares and preferred stock, and warrants to purchase such securities, including any shares into which the preferred stock and depositary shares may be convertible, or any combination thereof. We have issued in the past, and we may issue in the future, securities pursuant to our shelf registration. The issuance of debt or equity securities will depend on future market conditions, funding needs and other factors.
Agency Credit Ratings
Our ability to maintain consistent access to liquidity is fostered by the maintenance of high investment-grade ratings as measured by the major independent credit rating agencies. Factors essential to maintaining high credit ratings include diverse and stable core earnings; relative market position; strong risk management; strong capital ratios; diverse liquidity sources, including the global capital markets and client deposits; strong liquidity monitoring procedures; and preparedness for current or future regulatory developments. High ratings limit borrowing costs and enhance our liquidity by providing assurance for unsecured funding and depositors, increasing the potential market for our debt and improving our ability to offer products, serve markets, and engage in transactions in which clients value high credit ratings. A downgrade or reduction of our credit ratings could have a material adverse effect on our liquidity by restricting our ability to access the capital
91
MANAGEMENT’S DISCUSSION AND ANALYSIS OF FINANCIAL CONDITION
AND RESULTS OF OPERATIONS (Continued)
markets, which could increase the related cost of funds. In turn, this could cause the sudden and large-scale withdrawal of unsecured deposits by our clients, which could lead to draw-downs of unfunded commitments to extend credit or trigger requirements under securities purchase commitments; or require additional collateral or force terminations of certain trading derivative contracts.
A majority of our derivative contracts have been entered into under bilateral agreements with counterparties who may require us to post collateral or terminate the transactions based on changes in our credit ratings. We assess the impact of these arrangements by determining the collateral or termination payments that would be required assuming a downgrade by all rating agencies. The following table presents the additional collateral or termination payments related to our net derivative liabilities under these arrangements that could have been called as of the dates indicated by counterparties in the event of a one-notch or two-notch downgrade in our credit ratings. Other funding sources, such as secured financing transactions and other margin requirements, for which there are no explicit triggers, could also be adversely affected.
|
TABLE 34: ADDITIONAL COLLATERAL OR TERMINATION PAYMENTS RELATED TO NET DERIVATIVE LIABILITIES
|
|||||||
|
(In millions)
|
December 31, 2014
|
December 31, 2013
|
|||||
|
Additional collateral or termination payments for a one- or two-notch downgrade
|
$
|
19
|
|
$
|
7
|
|
|
|
TABLE 35: CREDIT RATINGS
|
|||||||
|
As of February 20, 2015
|
|||||||
|
|
Standard &
Poor’s
|
Moody’s
Investors
Service
|
Fitch
|
Dominion Bond Rating Service
|
|||
|
State Street:
|
|||||||
|
Short-term commercial paper
|
A-1
|
P-1
|
F1+
|
R-1 (Middle)
|
|||
|
Senior debt
|
A+
|
A1
|
AA-
|
AA (Low)
|
|||
|
Subordinated debt
|
A
|
A2
|
A+
|
A (High)
|
|||
|
Trust preferred capital securities
|
BBB
|
A3
|
BBB+
|
A (High)
|
|||
|
Preferred stock
|
BBB
|
Baa2
|
BBB
|
A (Low)
|
|||
|
Outlook
|
Negative
|
Stable
|
Stable
|
Stable
|
|||
|
State Street Bank:
|
|||||||
|
Short-term deposits
|
A-1+
|
P-1
|
F1+
|
R-1 (High)
|
|||
|
Short-term letters of credit
|
-
|
P-1
|
-
|
-
|
|||
|
Long-term deposits
|
AA-
|
Aa3
|
AA
|
AA
|
|||
|
Long-term letters of credit
|
-
|
Aa3
|
-
|
-
|
|||
|
Senior debt
|
AA-
|
Aa3
|
AA-
|
AA
|
|||
|
Long-term counterparty/issuer
|
AA-
|
Aa3
|
AA-
|
-
|
|||
|
Subordinated debt
|
A+
|
A1
|
A+
|
AA (Low)
|
|||
|
Financial strength
|
-
|
B-
|
-
|
-
|
|||
|
Outlook
|
Stable
|
Stable
|
Stable
|
Stable
|
|||
92
MANAGEMENT’S DISCUSSION AND ANALYSIS OF FINANCIAL CONDITION
AND RESULTS OF OPERATIONS (Continued)
Contractual Cash Obligations and Other Commitments
The long-term contractual cash obligations included within
Table 36: Long-Term Contractual Cash Obligations
, and other commercial commitments included in
Table 37: Other Commercial Commitments
, were recorded in our consolidated statement of condition as of
December 31, 2014
, except for operating leases and the interest portions of long-term debt and capital leases.
|
TABLE 36: LONG-TERM CONTRACTUAL CASH OBLIGATIONS
|
|||||||||||||||||||
|
|
PAYMENTS DUE BY PERIOD
|
||||||||||||||||||
|
As of December 31, 2014
(In millions)
|
Total
|
Less than 1
year
|
1-3
years
|
4-5
years
|
Over 5
years
|
||||||||||||||
|
Long-term debt
(1) (2)
|
$
|
10,763
|
|
$
|
454
|
|
$
|
3,223
|
|
$
|
1,749
|
|
$
|
5,337
|
|
||||
|
Operating leases
|
935
|
|
179
|
|
286
|
|
205
|
|
265
|
|
|||||||||
|
Capital lease obligations
(2)
|
962
|
|
105
|
|
173
|
|
164
|
|
520
|
|
|||||||||
|
Total contractual cash obligations
|
$
|
12,660
|
|
$
|
738
|
|
$
|
3,682
|
|
$
|
2,118
|
|
$
|
6,122
|
|
||||
(1)
Long-term debt excludes capital lease obligations (presented as a separate line item) and the effect of interest-rate swaps. Interest payments were calculated at the stated rate with the exception of floating-rate debt, for which payments were calculated using the indexed rate in effect as of
December 31, 2014
.
(2)
Additional information about contractual cash obligations related to long-term debt and operating and capital leases is provided in notes 9 and 20 to the consolidated financial statements included under Item 8 of this Form 10-K. Our consolidated statement of cash flows, also included under Item 8 of this Form 10-K, provides additional liquidity information.
Total contractual cash obligations shown in
Table 36: Long-Term Contractual Cash Obligations
, do not include:
|
•
|
Obligations which will be settled in cash, primarily in less than one year, such as client deposits, federal funds purchased, securities sold under repurchase agreements and other short-term borrowings.
|
Additional information about deposits, federal funds purchased, securities sold under repurchase agreements and other short-term borrowings is provided in notes 8 and 9 to the consolidated financial statements included under Item 8 of this Form 10-K.
|
•
|
Obligations related to derivative instruments because the derivative-related amounts
|
recorded in our consolidated statement of condition as of
December 31, 2014
did not represent the amounts that may ultimately be paid under the contracts upon settlement.
Additional information about our derivative instruments is provided in note 16 to the consolidated financial statements included under Item 8 of this Form 10-K. We have obligations under pension and other post-retirement benefit plans, more fully described in note 19 to the consolidated financial statements included under Item 8 of this Form 10-K, which are not included in
Table 36: Long-Term Contractual Cash Obligations
.
|
TABLE 37: OTHER COMMERCIAL COMMITMENTS
|
|||||||||||||||||||
|
|
DURATION OF COMMITMENT
|
||||||||||||||||||
|
As of December 31, 2014
(In millions)
|
Total
amounts
committed
(1)
|
Less than
1 year
|
1-3
years
|
4-5
years
|
Over 5
years
|
||||||||||||||
|
Indemnified securities financing
|
$
|
349,766
|
|
$
|
349,766
|
|
$
|
—
|
|
$
|
—
|
|
$
|
—
|
|
||||
|
Unfunded commitments to extend credit
|
24,247
|
|
18,529
|
|
1,852
|
|
3,351
|
|
515
|
|
|||||||||
|
Asset purchase agreements
|
4,107
|
|
1,385
|
|
2,212
|
|
510
|
|
—
|
|
|||||||||
|
Standby letters of credit
|
4,720
|
|
894
|
|
1,840
|
|
1,960
|
|
26
|
|
|||||||||
|
Purchase obligations
(2)
|
285
|
|
61
|
|
57
|
|
46
|
|
121
|
|
|||||||||
|
Total commercial commitments
|
$
|
383,125
|
|
$
|
370,635
|
|
$
|
5,961
|
|
$
|
5,867
|
|
$
|
662
|
|
||||
(1)
Total amounts committed reflect participations to independent third parties, if any.
(2)
Amounts represent obligations pursuant to legally binding agreements, where we have agreed to purchase products or services with a specific minimum quantity defined at a fixed, minimum or variable price over a specified period of time.
93
MANAGEMENT’S DISCUSSION AND ANALYSIS OF FINANCIAL CONDITION
AND RESULTS OF OPERATIONS (Continued)
Additional information about the commitments presented in
Table 37: Other Commercial Commitments
, except for purchase obligations, is provided in note
10
to the consolidated financial statements included under Item 8 of this Form 10-K.
Operational Risk Management
Overview
We consider operational risk to be the risk of loss resulting from inadequate or failed internal processes and systems, human error, or from external events. This encompasses legal risk and fiduciary risk. We consider legal risk to be the risk of loss resulting from failure to comply with laws, contractual obligations or prudent business practices, often in the form of litigation or fines. We consider fiduciary risk to be the failure to properly exercise discretion when acting on behalf of our clients, or not properly monitoring or controlling the exercise of discretion by a third party.
Operational risk is inherent in the performance of investment servicing and investment management activities on behalf of our clients. Whether it be fiduciary risk, risk associated with execution and processing or other types of operational risk, a consistent, transparent and effective operational risk framework is key to identifying, monitoring and managing operational risk.
We have established an operational risk framework that is based on three major goals:
•
Strong, active governance;
•
Ownership and accountability; and
•
Consistency and transparency.
Governance
Our Board is responsible for the approval and oversight of our overall operational risk framework. It does so through its RC, which reviews our operational risk framework and approves our operational risk policy annually.
The policy identifies the responsibilities of individuals and committees charged with oversight of the management of operational risk, and articulates a broad mandate that supports implementation of the operational risk framework.
ERM and other control groups provide the oversight, validation and verification of the management and measurement of operational risk. Our CRO, who leads ERM, manages the day-to-day oversight.
Executive management actively manages and oversees our operational risk framework through membership on various risk management committees, including MRAC, the BCRC, TORC, the Operational Risk Committee and the Fiduciary
Review Committee, all of which ultimately report to the RC.
The Operational Risk Committee, chaired by the global head of Operational Risk, provides cross-business oversight of operational risk and reviews and approves operational risk guidelines intended to maintain a consistent implementation of our corporate operational risk policy and framework.
Ownership and Accountability
We have implemented our operational risk framework to support the broad mandate established by our operational risk policy. This framework represents an integrated set of processes and tools that assists us in the management and measurement of operational risk, including our calculation of required capital and risk-weighted assets.
The framework takes a holistic view and integrates the methods and tools used to manage and measure operational risk. The framework utilizes aspects of the Committee of Sponsoring Organizations of the Treadway Commission, or COSO, framework and other industry leading practices, and is designed foremost to address our risk management needs while complying with regulatory requirements. The operational risk framework is intended to provide a number of important benefits, including:
|
•
|
A common understanding of operational risk management and its supporting processes;
|
|
•
|
The clarification of responsibilities for the management of operational risk across State Street;
|
|
•
|
The alignment of business priorities with risk management objectives;
|
|
•
|
The active management of risk and early identification of emerging risks;
|
|
•
|
The consistent application of policies and the collection of data for risk management and measurement; and
|
|
•
|
The estimation of our operational risk capital requirement.
|
The operational risk framework employs a distributed risk management infrastructure executed by ERM groups aligned with the business units, which are responsible for the implementation of the operational risk framework at the business unit level.
As with other risks, senior business unit management is responsible for the day-to-day operational risk management of their respective businesses. It is business unit management's responsibility to provide oversight of the implementation and ongoing execution of the operational risk framework within their respective
94
MANAGEMENT’S DISCUSSION AND ANALYSIS OF FINANCIAL CONDITION
AND RESULTS OF OPERATIONS (Continued)
organizations, as well as coordination and communication with ERM.
Consistency and Transparency
A number of corporate control functions are directly responsible for implementing and assessing various aspects of our operational risk framework, with the overarching goal of consistency and transparency to meet the evolving needs of the business:
|
•
|
The global head of Operational Risk, a member of the CRO’s executive management team, leads ERM’s corporate Operational Risk Management group, referred to as ORM. ORM is responsible for the strategy, evolution and consistent implementation of our operational risk guidelines, framework and supporting tools across State Street. ORM reviews and analyzes operational key risk information, events, metrics and indicators at the business unit and corporate level for purposes of risk management, reporting and escalation to the CRO, senior management and governance committees;
|
|
•
|
ERM’s Corporate Risk Analytics group develops and maintains operational risk capital estimation models, and ERM's Operations group calculates our required capital for operational risk;
|
|
•
|
ERM’s Model Validation Group, referred to as MVG, separately validates the quantitative models used to measure operational risk, and ORM performs validation checks on the output of the model; and
|
|
•
|
Corporate Audit performs separate reviews of the application of operational risk management practices and methodologies utilized across State Street.
|
Our operational risk framework consists of five components, each described below, which provide a working structure that integrates distinct risk programs into a continuous process focused on managing and measuring operational risk in a coordinated and consistent manner.
Risk Identification, Assessment and
Measurement
The objective of risk identification, assessment and measurement is to understand business unit strategy, risk profile and potential exposures. It is achieved through a series of risk assessments across State Street using techniques for the identification, assessment and measurement of risk across a spectrum of potential frequency and severity combinations. Three primary risk assessment
programs, which occur annually, augmented by other business-specific programs, are the core of this component:
|
•
|
The Risk and Control Self-Assessment program, referred to as the RCSA, seeks to understand the risks associated with day-to-day activities, and the effectiveness of controls intended to manage potential exposures arising from these activities. These risks are typically frequent in nature but generally not severe in terms of exposure;
|
|
•
|
The Material Risk Identification process utilizes a bottom-up approach to identify State Street’s most significant risk exposures across all on- and off-balance sheet risk-taking activities. The program is specifically designed to consider risks that could have a material impact irrespective of their likelihood or frequency. This can include risks that may have an impact on longer-term business objectives, such as significant change management activities or long-term strategic initiatives;
|
|
•
|
The Scenario Analysis program focuses on the set of risks with the highest severity and most relevance from a capital perspective. These are generally referred to as “tail risks," and serve as important benchmarks for our loss distribution approach model (see below); they also provide inputs into stress testing; and
|
|
•
|
Business-specific programs to identify, assess and measure risk, including new business and product review and approval, new client screening, and, as deemed appropriate, targeted risk assessments.
|
The primary measurement tool used is an internally developed loss distribution approach model, referred to as the LDA model. We use the LDA model to quantify required operational risk capital, from which we calculate risk-weighted assets related to operational risk. Such risk-weighted assets totaled
$35.87 billion
as of December 31, 2014; refer to the "Capital" section of this Management's Discussion and Analysis.
The LDA model incorporates the four required operational risk elements described below:
|
•
|
Internal loss event data is collected from across State Street in conformity with our operating loss policy that establishes the requirements for collecting and reporting individual loss events. We categorize the data into seven Basel-defined event types and further subdivide the data by business
|
95
MANAGEMENT’S DISCUSSION AND ANALYSIS OF FINANCIAL CONDITION
AND RESULTS OF OPERATIONS (Continued)
unit, as deemed appropriate. Each of these loss events are represented in a Unit of Measure, referred to as a UOM, which is used to estimate a specific amount of capital required for the types of loss events that fall into each specific category. Some UOMs are measured at the corporate level because they are not “business specific,” such as damage to physical assets, where the cause of an event is not primarily driven by the behavior of a single business unit. Internal losses of $500 or greater are captured, analyzed and included in the modeling approach. Loss event data is collected using a corporate-wide data collection tool, which stores the data in a Loss Event Data Repository, referred to as the LEDR, to support processes related to analysis, management reporting and the calculation of required capital. Internal loss event data provides State Street-specific frequency and severity information to our capital calculation process for historical loss events experienced by State Street.
|
•
|
External loss event data provides information with respect to loss event severity from other financial institutions to inform our capital estimation process of events in similar business units at other banking organizations. This information supplements the data pool available for use in our LDA model. Assessments of the sufficiency of internal data and the relevance of external data are completed before pooling the two data sources for use in our LDA model.
|
|
•
|
Scenario analysis workshops are conducted annually across State Street to inform management of the less frequent but most severe, or “tail,” risks that the organization faces. The workshops are attended by senior business unit managers, other support and control partners and business-aligned risk-management staff. The workshops are designed to capture information about the significant risks and to estimate potential exposures for individual risks should a loss event occur. Workshops are aligned with specific UOMs and business units where appropriate. The results of these workshops are used to benchmark our LDA model results to determine that our calculation of required capital considers relevant risk-related information.
|
|
•
|
Business environment and internal control factors, referred to as BEICFs, are gathered as part of our scenario analysis program to
|
inform the scenario analysis workshop participants of internal loss event data and business-relevant metrics, such as RCSA results, along with industry loss event data and case studies where appropriate. BEICFs are those characteristics of a bank’s internal and external operating environment that bear an exposure to operational risk. The use of this information indirectly influences our calculation of required capital by providing additional relevant data to workshop participants when reviewing specific UOM risks.
Monitoring
The objective of risk monitoring is to proactively monitor the changing business environment and corresponding operational risk exposure. It is achieved through a series of quantitative and qualitative monitoring tools that are designed to allow us to understand changes in the business environment, internal control factors, risk metrics, risk assessments, exposures and operating effectiveness, as well as details of loss events and progress on risk initiatives implemented to mitigate potential risk exposures.
Effectiveness and Testing
The objective of effectiveness and testing is to verify that internal controls are designed appropriately, are consistent with corporate and regulatory standards, and are operating effectively. It is achieved through a series of assessments by both internal and external parties, including Corporate Audit, independent registered public accounting firms, business self-assessments and other control function reviews, such as a Sarbanes-Oxley testing program.
Consistent with our standard model validation process, the operational risk LDA model is subject to a detailed review, overseen by the MRC. In addition, the model is subject to a rigorous internal governance process. All changes to the model or input parameters, and the deployment of model updates, are reviewed and approved by the Operational Risk Committee, which has oversight responsibility for the model, with technical input from the MRC.
Reporting
Operational risk reporting is intended to provide transparency, thereby enabling management to manage risk, provide oversight and escalate issues in a timely manner. It is designed to allow the business units, executive management, and the Board's control functions and committees to gain insight into activities that may result in risks and potential exposures. Reports are intended to identify business activities that are experiencing processing issues, whether or not they result in actual loss events. Reporting
96
MANAGEMENT’S DISCUSSION AND ANALYSIS OF FINANCIAL CONDITION
AND RESULTS OF OPERATIONS (Continued)
includes results of monitoring activities, internal and external examinations, regulatory reviews, and control assessments. These elements combine in a manner designed to provide a view of potential and emerging risks facing State Street and information that details its progress on managing risks.
Documentation and Guidelines
Documentation and guidelines allow for consistency and repeatability of the various processes that support the operational risk framework across State Street.
Operational risk guidelines document our practices and describe the key elements in a business unit's operational risk management program. The purpose of the guidelines is to set forth and define key operational risk terms, provide further detail on State Street's operational risk programs, and detail the business units' responsibilities to identify, assess, measure, monitor and report operational risk. The guideline supports our operational risk policy.
Data standards have been established to maintain consistent data repositories and systems that are controlled, accurate and available on a timely basis to support operational risk management.
Market Risk Management
Market risk is defined by U.S. banking regulators as the risk of loss that could result from broad market movements, such as changes in the general level of interest rates, credit spreads, foreign exchange rates or commodity prices. We are exposed to market risk in both our trading and certain of our non-trading, or asset-and-liability management, activities.
Information about the market risk associated with our trading activities is provided below under “Trading Activities.” Information about the market risk associated with our non-trading activities, which consists primarily of interest-rate risk, is provided below under “Asset-and-Liability Management Activities.”
Trading Activities
In the conduct of our trading activities, we assume market risk, the level of which is a function of our overall risk appetite, business objectives and liquidity needs, our clients' requirements and market volatility, and our execution against those factors.
We engage in trading activities primarily to support our clients' needs and to contribute to our overall corporate earnings and liquidity. In connection with certain of these trading activities, we enter into a variety of derivative financial instruments to support our clients' needs and to manage our interest-rate and currency risk. These activities are generally intended to generate trading services revenue and to manage potential earnings volatility. In addition, we
provide services related to derivatives in our role as both a manager and a servicer of financial assets.
Our clients use derivatives to manage the financial risks associated with their investment goals and business activities. With the growth of cross-border investing, our clients often enter into foreign exchange forward contracts to convert currency for international investments and to manage the currency risk in their international investment portfolios. As an active participant in the foreign exchange markets, we provide foreign exchange forward and option contracts in support of these client needs, and also act as a dealer in the currency markets.
As part of our trading activities, we assume positions in the foreign exchange and interest-rate markets by buying and selling cash instruments and entering into derivative instruments, including foreign exchange forward contracts, foreign exchange and interest-rate options and interest-rate swaps, interest-rate forward contracts, and interest-rate futures. As of
December 31, 2014
, the notional amount of these derivative contracts was
$1.24 trillion
, of which
$1.23 trillion
was composed of foreign exchange forward, swap and spot contracts. We seek to match positions closely with the objective of minimizing related currency and interest-rate risk. All foreign exchange contracts are valued daily at current market rates.
Governance
Our assumption of market risk in our trading activities is an integral part of our corporate risk appetite. Our Board reviews and oversees our management of market risk, including the approval of key market risk policies and the receipt and review of regular market risk reporting, as well as periodic updates on selected market risk topics.
The previously described TMRC (refer to "Risk Committees" in this Management's Discussion and Analysis) oversees all market risk-taking activities across State Street associated with trading. The TMRC, which reports to MRAC, is composed of members of ERM, our global markets business and our Global Treasury group, as well as our senior executives who manage our trading businesses and other members of management who possess specialized knowledge and expertise. The TMRC meets regularly to monitor the management of our trading market risk activities.
Our business units identify, actively manage and are responsible for the market risks inherent in their businesses. A dedicated market risk management group within ERM, and other groups within ERM, work with those business units to assist them in the identification, assessment, monitoring, management and control of market risk, and assist business unit managers with their market risk management and
97
MANAGEMENT’S DISCUSSION AND ANALYSIS OF FINANCIAL CONDITION
AND RESULTS OF OPERATIONS (Continued)
measurement activities. ERM provides an additional line of oversight, support and coordination designed to promote the consistent identification, measurement and management of market risk across business units, separate from those business units' discrete activities.
The ERM market risk management group is responsible for the management of corporate-wide market risk, the monitoring of key market risks and the development and maintenance of market risk management policies, guidelines, and standards aligned with our corporate risk appetite. This group also establishes and approves market risk tolerance limits and dealing authorities based on, but not limited to, measures of notional amounts, sensitivity, VaR and stress. Such limits and authorities are specified in our trading and market risk guidelines which govern our management of trading market risk.
Covered Positions
Our trading positions are subject to regulatory market risk capital requirements if they meet the regulatory definition of a “covered position.” A covered position is generally defined by U.S. banking regulators as an on- or off-balance sheet position associated with the organization's trading activities that is free of any restrictions on its tradability, including foreign exchange or commodity positions, and excluding intangible assets, certain credit derivatives recognized as guarantees and certain equity positions not publicly traded. The identification of covered positions for inclusion in our market risk capital framework is governed by our covered positions policy, which outlines the standards we use to determine whether a trading position is a covered position.
Our covered positions consist primarily of the trading portfolios held by our global markets business. They also arise from certain positions held by our Global Treasury group. These trading positions include products such as spot foreign exchange, foreign exchange forwards, non-deliverable forwards, foreign exchange options, foreign exchange funding swaps, currency futures, financial futures, and interest rate futures. Any new activities are analyzed to determine if the positions arising from such new activities meet the definition of a covered position and conform to our covered positions policy. This documented analysis, including any decisions with respect to market risk treatments, must receive approval from the TMRC.
Value-at-Risk, Stress Testing and Stressed VaR
As noted above, we use a variety of risk measurement tools and methodologies, including VaR, which is an estimate of potential loss for a given period within a stated statistical confidence interval.
We use a risk measurement methodology to measure trading-related VaR daily. We have adopted standards for measuring trading-related VaR, and we maintain regulatory capital for market risk associated with our trading activities in conformity with currently applicable bank regulatory market risk requirements.
We utilize an internal VaR model to calculate our regulatory market risk capital requirements. We use a historical simulation model to calculate daily VaR- and stressed VaR-based measures for our covered positions in conformity with regulatory requirements. Our VaR model seeks to capture identified material risk factors associated with our covered positions, including risks arising from market movements such as changes in foreign exchange rates, interest rates and option-implied volatilities.
We have adopted standards and guidelines to value our covered positions which govern our VaR- and stressed VaR-based measures. Our regulatory VaR-based measure is calculated based on historical volatilities of market risk factors during a two-year observation period calibrated to a one-tail, 99% confidence interval and a ten-business-day holding period. We also use the same platform to calculate a one-tail, 99% confidence interval, one-business-day VaR for internal risk management purposes. A 99% one-tail confidence interval implies that daily trading losses are not expected to exceed the estimated VaR more than 1% of the time, or less than three business days out of a year.
Our market risk models, including our VaR model, are subject to change in connection with the governance, validation and back-testing processes described below. These models can change as a result of changes in our business activities, our historical experiences, market forces and events, regulations and regulatory interpretations and other factors. In addition, the models are subject to continuing regulatory review and approval. Changes in our models may result in changes in our measurements of our market risk exposures, including VaR, and related measures, including regulatory capital. These changes could result in material changes in those risk measurements and related measures as calculated and compared from period to period.
Value-at-Risk
VaR measures are based on the most recent two years of historical price movements for instruments and related risk factors to which we have exposure. The instruments in question are limited to foreign exchange spot, forward and options contracts and interest-rate contracts, including futures and interest-rate swaps. Historically, these instruments have exhibited a higher degree of liquidity relative to other available capital markets instruments. As a result, the
98
MANAGEMENT’S DISCUSSION AND ANALYSIS OF FINANCIAL CONDITION
AND RESULTS OF OPERATIONS (Continued)
VaR measures shown reflect our ability to rapidly adjust exposures in highly dynamic markets. For this reason, risk inventory, in the form of net open positions, across all currencies is typically limited. In addition, long and short positions in major, as well as minor, currencies provide risk offsets that limit our potential downside exposure.
Our VaR methodology uses a historical simulation approach based on market-observed changes in foreign exchange rates, U.S. and non-U.S. interest rates and implied volatilities, and incorporates the resulting diversification benefits provided from the mix of our trading positions. Our VaR model incorporates approximately 5,000 risk factors and includes correlations among currency, interest rates, and other market rates.
Stress Testing and Stressed VaR
We have a corporate-wide stress-testing program in place that incorporates an array of techniques to measure the potential loss we could suffer in a hypothetical scenario of adverse economic and financial conditions. We also monitor concentrations of risk such as concentration by branch, risk component, and currency pairs. We conduct stress testing on a daily basis based on selected historical stress events that are relevant to our positions in order to estimate the potential impact to our current portfolio should similar market conditions recur, and we also perform stress testing as part of the Federal Reserve's CCAR process. Stress testing is conducted, analyzed and reported at the corporate, trading desk, division and risk-factor level (for example, exchange risk, interest-rate risk and volatility risk).
We calculate a stressed VaR-based measure using the same model we use to calculate VaR, but with model inputs calibrated to historical data from a range of continuous twelve-month periods that reflect significant financial stress. The stressed VaR model identifies the second-worst outcome occurring in the worst continuous one-year rolling period since July 2007. This stressed VaR meets the regulatory requirement as the rolling ten-day period with an outcome that is worse than 99% of other outcomes during that twelve-month period of financial stress. For each portfolio, the stress period is determined algorithmically by seeking the one-year time horizon that produces the largest ten-business-day VaR from within the available historical data. This historical data set includes the financial crisis of 2008, the highly volatile period surrounding the Eurozone sovereign debt crisis and the Standard & Poor's downgrade of U.S. Treasury debt in August 2011. As the historical data set used to determine the stress period expands over time, future market stress events will be automatically incorporated.
The sixty-day moving average of our stressed VaR-based measure was approximately
$69 million
for the twelve months ended
December 31, 2014
, compared to a sixty-day moving average of
$28 million
for the twelve months ended
December 31, 2013
.
The increase in the sixty-day moving average of our stressed VaR-based measure for the twelve months ended
December 31, 2014
compared to the twelve months ended
December 31, 2013
was primarily the result of an extension of the tenor of FX swaps by Global Treasury designed to improve our liquidity position. The tenor extension gives rise to additional market risk in our stressed VaR calculation.
Stress-testing results and limits are actively monitored on a daily basis by ERM and reported to the TMRC. Limit breaches are addressed by ERM risk managers in conjunction with the business units, escalated as appropriate, and reviewed by the TMRC if material. In addition, we have established several action triggers that prompt immediate review by management and the implementation of a remediation plan.
Validation and Back-Testing
We perform daily back-testing to assess the accuracy of our VaR-based model in estimating loss at the stated confidence level. This back-testing involves the comparison of estimated VaR model outputs to actual Profit-and-Loss outcomes, referred to as P&L, observed from daily market movements. We back-test our VaR model using “clean” P&L, which excludes non-trading revenue such as fees, commissions and net interest revenue, as well as estimated revenue from intra-day trading. Our VaR definition of trading losses excludes items that are not specific to the price movement of the trading assets and liabilities themselves, such as fees, commissions, changes to reserves and gains or losses from intra-day activity.
We experienced no back-testing exceptions in
2014
. We experienced one back-testing exception in 2013, which occurred in the third quarter. The trading P&L that day exceeded the VaR based on the prior day’s closing positions, following larger-than-usual moves in several emerging market currencies and U.S. interest rates.
Our market risk models are governed by our model risk governance guidelines, in conformity with our model risk governance policy, which outline the standards we use to assess the conceptual soundness and effectiveness of our models. Our market risk models are subject to regular review and validation by MVG within ERM and overseen by the MRC. The MRC includes members with expertise in modeling methodologies and has representation from
99
MANAGEMENT’S DISCUSSION AND ANALYSIS OF FINANCIAL CONDITION
AND RESULTS OF OPERATIONS (Continued)
the various business units throughout State Street. Additional information about the MRC and MVG is provided under “Model Risk Management” in this Disclosure.
Our model validation process also evaluates the integrity of our VaR models through the use of regular outcome analysis. Such outcome analysis includes back-testing, which compares the VaR model's predictions to actual outcomes using out-of-sample information. MVG examined back-testing results for
the market risk regulatory capital model used for 2012. Consistent with regulatory guidance, the back-testing compared “clean” P&L, defined above, with the one-day VaR produced by the model. The back-testing was performed for a time period not used for model development. The number of occurrences where “clean” trading-book P&L exceeded the one-day VaR was within our expected VaR tolerance level.
The following tables present VaR and stressed VaR associated with our trading activities for covered positions held during the years ended and as of
December 31, 2014
and
2013
, as measured by our VaR methodology.
|
TABLE 38: TEN-DAY VaR ASSOCIATED WITH TRADING ACTIVITIES FOR COVERED POSITIONS
|
|||||||||||||||||||||||||||||||
|
Year Ended December 31, 2014
|
Year Ended December 31, 2013
|
As of December 31, 2014
|
As of December 31, 2013
|
||||||||||||||||||||||||||||
|
(In thousands)
|
Average
|
Maximum
|
Minimum
|
Average
|
Maximum
|
Minimum
|
VaR
|
VaR
|
|||||||||||||||||||||||
|
Global Markets
|
$
|
6,365
|
|
$
|
12,327
|
|
$
|
2,273
|
|
$
|
6,386
|
|
$
|
22,835
|
|
$
|
1,626
|
|
$
|
4,566
|
|
$
|
5,463
|
|
|||||||
|
Global Treasury
|
4,027
|
|
6,467
|
|
683
|
|
97
|
|
559
|
|
24
|
|
4,759
|
|
58
|
|
|||||||||||||||
|
Total VaR
|
$
|
8,100
|
|
$
|
12,278
|
|
$
|
3,244
|
|
$
|
6,361
|
|
$
|
22,834
|
|
$
|
1,641
|
|
$
|
8,281
|
|
$
|
5,441
|
|
|||||||
|
TABLE 39: TEN-DAY STRESSED VaR ASSOCIATED WITH TRADING ACTIVITIES FOR COVERED POSITIONS
|
|||||||||||||||||||||||||||||||
|
|
Year Ended December 31, 2014
|
Year Ended December 31, 2013
|
As of December 31, 2014
|
As of December 31, 2013
|
|||||||||||||||||||||||||||
|
(In thousands)
|
Average
|
Maximum
|
Minimum
|
Average
|
Maximum
|
Minimum
|
Stressed VaR
|
Stressed VaR
|
|||||||||||||||||||||||
|
Global Markets
|
$
|
32,639
|
|
$
|
64,510
|
|
$
|
15,625
|
|
$
|
22,907
|
|
$
|
47,531
|
|
$
|
4,933
|
|
$
|
30,255
|
|
$
|
30,338
|
|
|||||||
|
Global Treasury
|
36,344
|
|
59,253
|
|
10,454
|
|
291
|
|
1,075
|
|
56
|
|
39,050
|
|
280
|
|
|||||||||||||||
|
Total Stressed VaR
|
$
|
61,874
|
|
$
|
89,053
|
|
$
|
29,689
|
|
$
|
22,815
|
|
$
|
47,514
|
|
$
|
4,889
|
|
$
|
58,945
|
|
$
|
30,403
|
|
|||||||
The VaR-based measures presented in the preceding tables are primarily a reflection of the overall level of market volatility and our appetite for trading market risk. Overall levels of volatility have been low both on an absolute basis and relative to the historical information observed at the beginning of the period used for the calculations. Both the ten-day VaR-based measures and the stressed VaR-based measures are based on historical changes observed during rolling ten-day periods for the portfolios as of the close of business each day over the past one-year period.
The decline in the maximum ten-day VaR-based measure for foreign exchange was caused by reduced exposure to certain emerging market currencies (
Table 38: Ten-day VaR Associated with Trading Activities for Covered Positions
). The increase seen in ten-day stressed VaR-based measure for foreign exchange was mainly due to our businesses maintaining slightly larger exposures, as
compared to a year ago, in what was a predominantly trending market in 2014 (
Table 39: Ten-day Stressed VaR Associated with Trading Activities for Covered Positions
).
The increases in the average ten-day VaR-based and stressed VaR-based measures for the twelve months ended
December 31, 2014
compared to the twelve months ended
December 31, 2013
were primarily the result of an extension of the tenor of FX swaps by Global Treasury designed to improve our liquidity position. The tenor extension gives rise to additional market risk in our ten-day VaR-based and stressed VaR-based calculations.
We may in the future modify and adjust our models and methodologies used to calculate VaR and stressed VaR, subject to regulatory review and approval, and these modifications and adjustments may result in changes in our VaR-based and stressed VaR-based measures.
100
MANAGEMENT’S DISCUSSION AND ANALYSIS OF FINANCIAL CONDITION
AND RESULTS OF OPERATIONS (Continued)
The following tables present the VaR and stressed VaR associated with our trading activities attributable to foreign exchange risk, interest rate risk and volatility risk as of
December 31, 2014
and
2013
. The totals of the VaR-based and stressed VaR-based measures for the three attributes for each VaR and stressed-VaR component exceeded the related total VaR and total stressed VaR presented in the foregoing tables as of each period-end, primarily due to the benefits of diversification across risk types.
|
TABLE 40: TEN-DAY VaR ASSOCIATED WITH TRADING ACTIVITIES BY RISK FACTOR
(1)
|
|||||||||||||||||||||||
|
As of December 31, 2014
|
As of December 31, 2013
|
||||||||||||||||||||||
|
(In thousands)
|
Foreign Exchange Risk
|
Interest Rate Risk
|
Volatility Risk
|
Foreign Exchange Risk
|
Interest Rate Risk
|
Volatility Risk
|
|||||||||||||||||
|
By component:
|
|||||||||||||||||||||||
|
Global Markets
|
$
|
5,584
|
|
$
|
3,230
|
|
$
|
349
|
|
$
|
3,492
|
|
$
|
4,561
|
|
$
|
306
|
|
|||||
|
Global Treasury
|
—
|
|
4,759
|
|
—
|
|
46
|
|
52
|
|
—
|
|
|||||||||||
|
Total VaR
|
$
|
5,584
|
|
$
|
5,892
|
|
$
|
349
|
|
$
|
3,457
|
|
$
|
4,577
|
|
$
|
306
|
|
|||||
|
TABLE 41: TEN-DAY STRESSED VaR ASSOCIATED WITH TRADING ACTIVITIES BY RISK FACTOR
(1)
|
|||||||||||||||||||||||
|
As of December 31, 2014
|
As of December 31, 2013
|
||||||||||||||||||||||
|
(In thousands)
|
Foreign Exchange Risk
|
Interest Rate Risk
|
Volatility Risk
|
Foreign Exchange Risk
|
Interest Rate Risk
|
Volatility Risk
|
|||||||||||||||||
|
By component:
|
|||||||||||||||||||||||
|
Global Markets
|
$
|
8,305
|
|
$
|
39,220
|
|
$
|
468
|
|
$
|
8,788
|
|
$
|
37,030
|
|
$
|
345
|
|
|||||
|
Global Treasury
|
—
|
|
39,050
|
|
—
|
|
119
|
|
299
|
|
—
|
|
|||||||||||
|
Total Stressed VaR
|
$
|
8,305
|
|
$
|
62,923
|
|
$
|
468
|
|
$
|
8,845
|
|
$
|
36,949
|
|
$
|
345
|
|
|||||
(1)
For purposes of risk attribution by component in both Tables
40
and
41
, foreign exchange risk refers only to the risk from market movements in period-end rates. Forwards, futures, options and swaps with maturities greater than period-end have embedded interest-rate risk that is captured by the measures used for interest-rate risk. Accordingly, the interest-rate risk embedded in these foreign exchange instruments is included in the interest-rate risk component.
Total stressed VaR as of
December 31, 2014
increased compared to
December 31, 2013
, as presented in
Table 41: Ten-day Stressed VaR Associated with Trading Activities by Risk Factor
. The increase was primarily the result of an extension of the tenor of FX swaps by Global Treasury designed to improve our liquidity position. Additionally, the stressed VaR attributable to foreign exchange exposures also increased as we maintained risk positions in a predominantly trending market environment.
Asset-and-Liability Management Activities
The primary objective of asset-and-liability management is to provide sustainable net interest revenue, referred to as NIR, under varying economic conditions, while protecting the economic value of the assets and liabilities carried in our consolidated statement of condition from the adverse effects of changes in interest rates. While many market factors affect the level of NIR and the economic value of our assets and liabilities, one of the most significant factors is our exposure to movements in interest rates. Most of our NIR is earned from the investment of client deposits generated by our businesses. We invest these client deposits in assets that conform generally to the characteristics of our balance sheet liabilities, including the currency composition of our
significant non-U.S. dollar denominated client liabilities, but we manage our overall interest-rate risk position in the context of current and anticipated market conditions and within internally-approved risk guidelines.
Our overall interest-rate risk position is maintained within a series of policies approved by the Board and guidelines established and monitored by ALCO. Our Global Treasury group has responsibility for managing our day-to-day interest-rate risk. To effectively manage our consolidated statement of condition and related NIR, Global Treasury has the authority to assume a limited amount of interest-rate risk based on market conditions and its views about the direction of global interest rates over both short-term and long-term time horizons. Global Treasury manages our exposure to changes in interest rates on a consolidated basis organized into three regional treasury units, North America, Europe and Asia/Pacific, to reflect the growing, global nature of our exposures and to capture the impact of changes in regional market environments on our total risk position.
The economic value of our consolidated statement of condition is a metric designed to estimate the fair value of assets and liabilities which could be garnered if those assets and liabilities were
101
MANAGEMENT’S DISCUSSION AND ANALYSIS OF FINANCIAL CONDITION
AND RESULTS OF OPERATIONS (Continued)
sold today. The economic values represent discounted cash flows from all financial instruments; therefore, changes in the yield curves, which are used to discount the cash flows, affect the values of these instruments.
Our investment activities and our use of derivative financial instruments are the primary tools used in managing interest-rate risk. We invest in financial instruments with currency, repricing, and maturity characteristics we consider appropriate to manage our overall interest-rate risk position. In addition, we use certain derivative instruments, primarily interest-rate swaps, to alter the interest-rate characteristics of specific balance sheet assets or liabilities.
Because no one individual measure can accurately assess all of our exposures to changes in interest rates, we use several quantitative measures in our assessment of current and potential future exposures to changes in interest rates and their impact on NIR and balance sheet values. NIR simulation is the primary tool used in our evaluation of the potential range of possible NIR results that could occur under a variety of interest-rate environments. We also use market valuation and duration analysis to assess changes in the economic value of balance sheet assets and liabilities caused by assumed changes in interest rates.
To measure, monitor, and report on our interest-rate risk position, we use NIR simulation, referred to as NIR-at-risk, and Economic Value of Equity, referred to as EVE, sensitivity. NIR-at-risk measures the impact on NIR over the next twelve months to immediate, or “rate shock,” and gradual, or “rate ramp,” changes in market interest rates. EVE sensitivity is a total return view of interest-rate risk, which measures the impact on the present value of all NIR-related principal and interest cash flows of an immediate change in interest rates. Although NIR-at-risk and EVE sensitivity measure interest-rate risk over different time horizons, both utilize consistent assumptions when modeling the positions currently held by State Street; however, NIR-at-risk also incorporates future actions planned by management over the time horizons being modeled.
In estimating our NIR-at-risk, we start with a base amount of NIR that is projected over the next twelve months, assuming our forecast yield curve over the period. Our existing balance sheet assets and liabilities are adjusted by the amount and timing of transactions that are forecast to occur over the next twelve months. That yield curve is then “shocked,” or moved immediately, +/-100 basis points in a parallel fashion, or at all points along the yield curve. Two new twelve-month NIR projections are then developed using the same balance sheet and
forecast transactions, but with the new yield curves, and compared to the base scenario. We also perform the calculations using interest-rate ramps, which are +/-100-basis-point changes in interest rates that are assumed to occur gradually over the next twelve months, rather than immediately as we do with interest-rate shocks.
EVE is based on the change in the present value of all NIR-related principal and interest cash flows for changes in market rates of interest. The present value of existing cash flows with a then-current yield curve serves as the base case. We then apply an immediate parallel shock to that yield curve of +/-200 basis points and recalculate the cash flows and related present values. A large shock is used to better capture the embedded option risk in our mortgage-backed securities that results from borrowers' prepayment opportunities.
Key assumptions used in the models, described in more detail below, along with changes in market conditions, are inherently uncertain. Actual results necessarily differ from model results as market conditions differ from assumptions. As such, management performs back-testing, stress testing, and model integrity analyses to validate that the modeled results produce predictive NIR-at-risk and EVE sensitivity estimates which can be used in our management of interest-rate risk. Primary factors affecting the actual results are changes in our balance sheet size and mix; the timing, magnitude and frequency of changes in interest rates, including the slope and the relationship between the interest-rate level of U.S. dollar and non-U.S. dollar yield curves; changes in market conditions; and management actions taken in response to the preceding conditions.
Both NIR-at-risk and EVE sensitivity results are managed against ALCO-approved limits and guidelines and are monitored regularly, along with other relevant simulations, scenario analyses and stress tests, by both Global Treasury and ALCO. Our ALCO-approved guidelines are, we believe, in line with industry standards and are periodically examined by the Federal Reserve.
As a result of differences in measurement between NIR-at-risk and EVE with respect to certain assumptions, such as the reinvestment of our interest-earning assets, reported results of NIR-at-risk could present an increase in NIR from an increase in rates while EVE presents a loss. Changes in assumptions may result in different outcomes under both NIR-at-risk and EVE. NIR-at-risk depicts the change in the nominal (un-discounted) dollar net interest flows which are generated from the forecast statement of condition over the next twelve months. As interest rates increase, the interest expense
102
MANAGEMENT’S DISCUSSION AND ANALYSIS OF FINANCIAL CONDITION
AND RESULTS OF OPERATIONS (Continued)
associated with our client deposit liabilities is assumed to increase at a slower pace than the investment returns derived from our current balance sheet or the associated reinvestment of our interest-earning assets, resulting in an overall increase to NIR. EVE, on the other hand, measures the present value change of both principal and interest cash flows based on the current period-end balance sheet. As a result, EVE does not contemplate reinvestment of our assets associated with a change in the interest-rate environment.
Although NIR in both NIR-at-risk and EVE sensitivity is higher in response to increased interest rates, the future principal flows from fixed-rate investments are discounted at higher rates for EVE, which results in lower asset values and a corresponding reduction or loss in EVE. As noted above, NIR-at-risk does not analyze changes in the value of principal cash flows and therefore does not experience the same reduction experienced by EVE sensitivity associated with discounting principal cash flows at higher rates.
Net Interest Revenue at Risk
NIR-at-risk is designed to estimate the potential impact of changes in global market interest rates on NIR in the short term. The impact of changes in market rates on NIR is measured against a baseline NIR which encompasses management's expectations regarding the evolving balance sheet volumes and interest rates in the near-term. The goal is to achieve an acceptable level of NIR under various interest-rate environments. Assumptions regarding levels of client deposits and our ability to price these deposits under various rate environments have a significant impact on the results of the NIR simulations. Similarly, the timing of cash flows from our investment portfolio, especially option-embedded financial instruments like mortgage-backed securities, and our ability to replace these cash flows in line with management's expectations, can affect the results of NIR simulations.
The following table presents the estimated exposure of our NIR for the next twelve months, calculated as of the dates indicated, due to an immediate +/-100-basis-point shift to our internal forecast of global interest rates. We manage our NIR sensitivity to limit declines to 15% or less from baseline NIR. Estimated incremental exposures presented below are dependent on management's assumptions, and do not reflect any additional actions management may undertake in order to mitigate some of the adverse effects of changes in interest rates on our financial performance.
|
TABLE 42: NIR ESTIMATED EXPOSURE
|
|||||||||||||
|
|
Estimated Exposure to
Net Interest Revenue
|
||||||||||||
|
(Dollars in millions)
|
December 31,
2014 |
December 31,
2013 |
|||||||||||
|
Rate change:
|
Exposure
|
% of Base NIR
|
Exposure
|
% of Base NIR
|
|||||||||
|
+100 bps shock
|
$
|
384
|
|
16.6
|
%
|
$
|
334
|
|
14.0
|
%
|
|||
|
–100 bps shock
|
(328
|
)
|
(14.2
|
)
|
(261
|
)
|
(10.9
|
)
|
|||||
|
+100 bps ramp
|
149
|
|
6.5
|
|
126
|
|
5.3
|
|
|||||
|
–100 bps ramp
|
(192
|
)
|
(8.3
|
)
|
(124
|
)
|
(5.2
|
)
|
|||||
As of
December 31, 2014
, NIR sensitivity to an upward-100-basis-point shock in global interest rates was higher compared to such sensitivity as of
December 31, 2013
, due to a higher level of forecast client deposits. The benefit to NIR of an upward-100-basis-point ramp is less significant than a shock, since interest rates are assumed to increase gradually.
NIR sensitivity to a downward-100-basis-point shock in global interest rates as of
December 31, 2014
increased compared to such sensitivity as of
December 31, 2013
, due to higher levels of forecast client deposits. Increased levels of forecast client deposits, while beneficial to baseline NIR, do not provide relief in the downward shock scenario, as the deposits have no room to fully re-price from current levels as their pricing basis falls. A downward-100-basis-point shock in global interest rates places pressure on NIR, as deposit rates reach their implicit floors due to the exceptionally low global interest-rate environment, and provide little funding relief on the liability side, while assets re-price into the lower-rate environment. The adverse impact on projected NIR due to a downward-100-basis-point ramp is less significant than a shock since interest rates are assumed to decrease gradually, thereby reducing the level of projected spread compression experienced between assets and liabilities over a twelve-month horizon.
Our baseline NIR incorporates an expectation that short-term interest rates will begin to rise in anticipation of central bank tightening of current monetary policies. While this rise in rates benefits our baseline NIR, it is detrimental to our NIR sensitivity to a downward-100-basis-point shock, as rising short-term interest rates allow asset yields to re-price lower in a downward shock scenario than previously, while deposits are still priced close to natural floors.
Other important factors which affect the levels of NIR are the size and mix of assets carried in our consolidated statement of condition; interest-rate spreads; the slope and interest-rate level of U.S. and non-U.S. dollar yield curves and the relationship between them; the pace of change in global market
103
MANAGEMENT’S DISCUSSION AND ANALYSIS OF FINANCIAL CONDITION
AND RESULTS OF OPERATIONS (Continued)
interest rates; and management actions taken in response to the preceding conditions.
Economic Value of Equity
EVE sensitivity measures changes in the market value of equity to quantify potential losses to shareholders due to an immediate +/-200-basis-point rate shock compared to current interest-rate levels if the balance sheet were liquidated immediately. Management compares the change in EVE sensitivity against State Street's aggregate tier 1 and tier 2 risk-based capital, calculated in conformity with currently applicable regulatory requirements, to evaluate whether the magnitude of the exposure to interest rates is acceptable. Generally, a change resulting from a +/-200-basis-point rate shock that is less than 20% of aggregate tier 1 and tier 2 capital is an exposure that management deems acceptable. To
the extent that we manage changes in EVE sensitivity within the 20% threshold, we would seek to take action to remain below the threshold if the magnitude of our exposure to interest rates approached that limit.
Similar to NIR-at-risk measures, the timing of cash flows affects EVE sensitivity, as changes in asset and liability values under different rate scenarios are dependent on when interest and principal payments are received. In contrast to NIR simulations, however, EVE sensitivity does not incorporate assumptions regarding reinvestment of these cash flows. In addition, our ability to price client deposits has a much smaller impact on EVE sensitivity, as EVE sensitivity does not consider the ongoing benefit of investing client deposits.
The following table presents estimated EVE exposures, calculated as of the dates indicated, assuming an immediate and prolonged shift in global interest rates, the impact of which would be spread over a number of years.
|
TABLE 43: ESTIMATED EVE EXPOSURES
|
|||||||||||||
|
|
Estimated Sensitivity of
Economic Value of Equity
|
||||||||||||
|
(Dollars in millions)
|
December 31,
2014 |
December 31,
2013 |
|||||||||||
|
Rate change:
|
Exposure
|
% of Tier 1/Tier 2 Capital
|
Exposure
|
% of Tier 1/Tier 2 Capital
|
|||||||||
|
+200 bps shock
|
$
|
(2,291
|
)
|
(12.8
|
)%
|
$
|
(2,359
|
)
|
(14.9
|
)%
|
|||
|
–200 bps shock
|
942
|
|
5.3
|
|
1,149
|
|
7.2
|
|
|||||
The dollar measure of EVE sensitivity to an upward-200-basis-point shock as of
December 31, 2014
improved compared to
December 31, 2013
, and the dollar measure of EVE sensitivity to a downward-200-basis-point shock as of
December 31, 2014
declined compared to
December 31, 2013
, with both comparisons due primarily to portfolio decay and lower rates as of
December 31, 2014
compared to
December 31, 2013
.
EVE sensitivity to an upward-200-basis-point shock as of
December 31, 2014
, as a percentage of the total of tier 1 and tier 2 regulatory capital, declined compared to
December 31, 2013
. EVE sensitivity to a downward-200-basis-point shock as of
December 31, 2014
, as a percentage of the total of tier 1 and tier 2 regulatory capital, declined compared to
December 31, 2013
. These improvements were primarily due to the above changes in the dollar measures of EVE sensitivity as well as an increase in the total of tier 1 and tier 2 capital as of
December 31, 2014
compared to
December 31, 2013
(refer to the "Capital - Regulatory Capital" section of this Management's Discussion and Analysis).
Business Risk Management
We define business risk as the risk of adverse changes in our earnings related to business factors, including changes in the competitive environment, changes in the operational economics of our business activities and the potential effect of strategic and reputation risks, not already captured as trading market, interest-rate, credit, operational or liquidity risks. We incorporate business risk into our assessment of our strategic plans and capital management processes. Active management of business risk is an integral component of all aspects of our business, and responsibility for the management of business risk lies with every employee at State Street.
Separating the effects of a potential material adverse event into operational and business risk is sometimes difficult. For instance, the direct financial impact of an unfavorable event in the form of fines or penalties would be classified as an operational risk loss, while the impact on our reputation and consequently the potential loss of clients and corresponding decline in revenue would be classified as a business risk loss. An additional example of business risk is the integration of a major acquisition. Failure to successfully integrate the operations of an
104
MANAGEMENT’S DISCUSSION AND ANALYSIS OF FINANCIAL CONDITION
AND RESULTS OF OPERATIONS (Continued)
acquired business, and the resultant inability to retain clients and the associated revenue, would be classified as a loss due to business risk.
Business risk is managed with a long-term focus. Techniques for its assessment and management include the development of business plans and appropriate management oversight. The potential impact of the various elements of business risk is difficult to quantify with any degree of precision. We use a combination of historical earnings volatility, scenario analysis, stress-testing and management judgment to help assess the potential effect on State Street attributable to business risk. Management and control of business risks are generally the responsibility of the business units as part of their overall strategic planning and internal risk management processes.
Model Risk Management
The use of quantitative models is widespread throughout the financial services industry, with large and complex organizations relying on sophisticated models to support numerous aspects of their financial decision making. The models contemporaneously represent both a significant advancement in financial management and a new source of risk. In large banking organizations like ours, model results influence business decisions, and model failure could have a harmful effect on our financial performance. As a result, we manage model risk within a comprehensive model risk management framework.
Our model risk management program has three principal components:
|
•
|
A model risk governance program that defines roles and responsibilities, including the authority to restrict model usage, provides policies and guidance, and evaluates the models’ key assumptions, limitations and overall degree of risk;
|
|
•
|
A model development process which focuses on sound design and computational accuracy, and includes ongoing model integrity activities designed to test for robustness, stability, and sensitivity to assumptions; and
|
|
•
|
A separate model validation function designed to verify that models are theoretically sound, performing as expected, and are in line with their design objectives.
|
Governance
Model risk is overseen at the corporate level by our Board and senior management. Models used in the regulatory capital calculation can only be deployed for use after receiving a satisfactory validation review and being granted approval by the appropriate corporate oversight committee.
The MRC, which is composed of senior staff with technical expertise, reports to MRAC, and formally recommends proposed findings with respect to modeling weaknesses or deficiencies. Proposed findings are brought to the MRC by MVG for discussion. MVG is part of Model Risk Management within ERM. The most material findings may preclude a model’s deployment and use; other findings may require resolution by specified deadlines.
ERM’s Model Risk Management group is responsible for defining the corporate-wide model risk governance framework, and maintains policies that achieve the framework’s objectives. The team is responsible for overall model risk governance capabilities, with particular emphasis in the areas of model risk reporting, model performance monitoring, tracking of new model development status, and committee-level review and challenge.
Model Development and Usage
Models are developed under standards governing data sourcing, methodology selection and model integrity testing. Model development includes a clear statement of purpose to align development with intended use. It also includes a comparison of alternative approaches to implement a sound modeling approach.
Model developers conduct an assessment of data quality and relevance. The development teams conduct a variety of tests of the accuracy, robustness and stability of each model.
Model owners monitor model performance, update model reference data and/or functionality as appropriate, and submit models to MVG for validation on a regular basis, as described below.
Model Validation
MVG separately validates models through a review that assesses the soundness and suitability of data inputs, methodologies, assumptions, coding and model outputs. Model validation also encompasses an assessment of a model’s potential limitations given its particular assumptions or deficiencies. MVG maintains a model risk-rating system, which assigns a risk rating to each model based on the severity of review findings. These ratings aid in the understanding and reporting of model risk across the model portfolio, and enable the triaging of needs for remediation.
Although model validation is the primary method of subjecting models to separate review and challenge, in practice, a multi-step governance process provides the opportunity for challenge by multiple parties. First, MVG conducts model validation and prepares findings. These proposed
105
MANAGEMENT’S DISCUSSION AND ANALYSIS OF FINANCIAL CONDITION
AND RESULTS OF OPERATIONS (Continued)
findings are then discussed with and formally recommended by the MRC. Finally, model usage decisions, made by the appropriate corporate oversight committee, are influenced by the model findings.
Capital
The management of our capital involves key metrics evaluated by management to assess whether our actual and projected levels of capital are commensurate with our risk profile, are in compliance with all applicable regulatory requirements, and are sufficient to provide us with the financial flexibility to undertake future strategic business initiatives. We assess capital based on relevant regulatory capital adequacy requirements, as well as our own internal capital targets.
Framework
Our objective with respect to management of our capital is to maintain a strong capital base in order to provide financial flexibility for our business needs, including funding corporate growth and supporting clients’ cash management needs, and to provide protection against loss to depositors and creditors. We strive to maintain an appropriate level of capital, commensurate with our risk profile, on which an attractive return to shareholders is expected to be realized over both the short and long term, while protecting our obligations to depositors and creditors and complying with regulatory capital adequacy requirements.
Our capital management process focuses on our risk exposures, the regulatory requirements applicable to us with respect to capital adequacy, the evaluations and resulting credit ratings of the major independent credit rating agencies, our return on capital at both the consolidated and line-of-business level, and our capital position relative to our peers.
Our evaluation of capital includes the comparison of capital sources with capital uses, as well as the consideration of the quality and quantity of the various components of capital, as two of several inputs in our overall assessment of our capital adequacy. The goals of the capital adequacy process are to determine the optimal level of capital and composition of capital instruments to satisfy all constituents of capital, with the lowest overall cost to shareholders. Other factors considered in our capital adequacy process are strategic and contingency planning, stress testing and planned capital actions.
Capital Adequacy Process
Our primary federal banking regulator is the Federal Reserve. Both State Street and State Street Bank are subject to the minimum regulatory capital requirements established by the Federal Reserve and
defined in the Federal Deposit Insurance Corporation Improvement Act of 1991, or FDICIA. State Street Bank must exceed the regulatory capital thresholds for “well capitalized” in order for our parent company to maintain its status as a financial holding company. Accordingly, one of our primary goals with respect to capital adequacy is to exceed all applicable minimum regulatory capital requirements and to be “well-capitalized” under the Prompt Corrective Action guidelines established by the FDIC. Our capital management activities include our Capital Adequacy Process, or CAP, and associated Capital Policy and guidelines.
We consider capital adequacy to be a key element of our financial well-being, which affects our ability to attract and maintain client relationships; operate effectively in the global capital markets; and satisfy regulatory, security holder and shareholder needs. Capital is one of several elements that affect our debt ratings and the ratings of our principal subsidiaries.
In conformity with our Capital Policy and guidelines, we strive to maintain adequate capital, not just at a point in time, but over time and during periods of stress, to account for changes in our strategic direction, evolving economic conditions, and financial and market volatility. We have developed and implemented a corporate-wide CAP to assess our overall capital in relation to our risk profile and to provide a comprehensive strategy for maintaining appropriate capital levels. The CAP considers material risks under multiple scenarios, with an emphasis on stress scenarios. The CAP builds on and leverages existing processes and systems used to measure our capital adequacy. Our Capital Policy is reviewed and approved by the Board’s RC.
Capital Contingency Planning
Contingency planning is an integral component of our capital management program. The objective of our contingency planning process is to monitor current and forecast levels of select measures that serve as early indicators of a potentially adverse capital or liquidity adequacy situation. These measures are one of the inputs used to set our capital adequacy level. We review these measures annually for appropriateness and relevance in relation to our financial budget and capital plan.
Stress Testing
We administer a robust State Street-wide stress-testing program that executes multiple stress tests each year to assess the institution’s capital adequacy and/or future performance under adverse conditions. Our stress testing program is structured around what we determine to be the key risks incurred by State Street, as assessed through a recurring material risk
106
MANAGEMENT’S DISCUSSION AND ANALYSIS OF FINANCIAL CONDITION
AND RESULTS OF OPERATIONS (Continued)
identification process. The material risk identification process represents a bottom-up approach to identifying the institution’s most significant risk exposures across all on- and off-balance sheet risk-taking activities, including credit, market, liquidity, interest rate, operational, fiduciary, business, reputation, and regulatory risks. These key risks serve as an organizing principle for much of our risk management framework, as well as reporting, including the “risk dashboard” provided to the Board. Over the past few years, stress scenarios have included a deep recession in the U.S., a break-up of the Eurozone, a severe recession in China and an oil shock precipitated by turmoil in the Middle East/North Africa region.
In connection with the focus on our key risks, each stress test incorporates idiosyncratic loss events tailored to State Street‘s unique risk profile and business activities. Due to the nature of our business model and our consolidated statement of condition, our risks differ from those of a traditional commercial bank.
The Federal Reserve requires bank holding companies with total consolidated assets of $50 billion or more, which includes State Street, to submit a capital plan on an annual basis. The Federal Reserve uses its annual CCAR process, which incorporates hypothetical financial and economic stress scenarios, to review those capital plans and assess whether banking organizations have capital planning processes that account for idiosyncratic risks and provide for sufficient capital to continue operations throughout times of economic and financial stress. As part of its CCAR process, the Federal Reserve assesses each organization’s capital adequacy, capital planning process, and plans to distribute capital, such as dividend payments or stock purchase programs. Management and Board risk committees review, challenge, and approve CCAR results and assumptions before submission to the Federal Reserve.
Through the evaluation of State Street’s capital adequacy and/or future performance under adverse conditions, the stress testing processes provide important insights for capital planning, risk management, and strategic decision-making at State Street.
Governance
In order to support integrated decision making, we have identified three management elements to aid in the compatibility and coordination of our capital adequacy strategies and processes:
|
•
|
Risk Management - identification, measurement, monitoring and forecasting of different types of risk and their combined impact on capital adequacy;
|
|
•
|
Capital Management - determination of optimal capital levels; and
|
|
•
|
Business Management - strategic planning, budgeting, forecasting, and performance management.
|
We have a hierarchical structure supporting appropriate committee review of relevant risk and capital information. The ongoing responsibility for capital management rests with our Treasurer. The Capital Planning group within Global Treasury is responsible for the Capital Policy and guidelines, development of the Capital Plan, the management of global capital, capital optimization, and business unit capital management.
MRAC provides oversight of our capital management, our capital adequacy, our internal targets and the expectations of the major independent credit rating agencies. In addition, MRAC approves our balance sheet strategy and related activities. The Board’s RC assists the Board in fulfilling its oversight responsibilities related to the assessment and management of risk and capital.
Regulatory Capital
We are subject to risk-based regulatory capital requirements issued by the Federal Reserve. With the adoption of the Basel III rules by U.S. regulators, we became subject to the U.S. Basel III final rule as of January 1, 2014. The Basel III final rule incorporates several multi-year transition provisions for capital components and minimum ratio requirements for common equity tier 1 capital, tier 1 capital and total capital. The transition period started in January 2014 and is completed by January 1, 2019 which is concurrent with the full implementation of the Basel III final rule in the U.S.
The U.S. Basel III final rule replaced the Basel I- and Basel II-based capital regulations in the United States. As an “advanced approaches” banking organization, we became subject to the U.S. Basel III final rule beginning on January 1, 2014. However, certain aspects of the U.S. Basel III final rule, including the new minimum risk-based and leverage capital ratios, capital buffers, regulatory adjustments and deductions and revisions to the calculation of risk-weighted assets under the so-called “standardized approach,” will commence at a later date or be phased in over several years.
Among other things, the U.S. Basel III final rule introduces a minimum common equity tier 1 risk-based capital ratio of 4.5%, raises the minimum tier 1
107
MANAGEMENT’S DISCUSSION AND ANALYSIS OF FINANCIAL CONDITION
AND RESULTS OF OPERATIONS (Continued)
risk-based capital ratio from 4% to 6%, and, for advanced approaches banking organizations such as State Street, imposes a minimum supplementary tier 1 leverage ratio of 3%, the numerator of which is tier 1 capital and the denominator of which includes both on-balance sheet assets and certain off-balance sheet exposures. In addition to the supplementary leverage ratio, we are subject to a minimum tier 1 leverage ratio of 4%, which differs from the supplementary leverage ratio primarily in that the denominator of the tier 1 leverage ratio is quarterly average on-balance sheet assets.
To maintain the status of our parent company as a financial holding company, we and our insured depository institution subsidiaries are required to be “well-capitalized” by maintaining capital ratios above the minimum requirements. Effective on January 1, 2015, the “well-capitalized” standard for our banking subsidiaries was revised to reflect the higher capital requirements in the U.S. Basel III final rule.
In addition to introducing new capital ratios and buffers, the U.S. Basel III final rule revises the eligibility criteria for regulatory capital instruments and provides for the phase-out of existing capital instruments that do not satisfy the new criteria. For example, existing trust preferred capital securities are being phased out from tier 1 capital over a two-year period beginning on January 1, 2014 and ending on January 1, 2016, and subsequently, the qualification of these securities as tier 2 capital will be phased out over a multi-year transition period beginning on January 1, 2016 and ending on January 1, 2022. We had trust preferred capital securities of
$475 million
outstanding as of
December 31, 2014
.
Under the U.S. Basel III final rule, certain new items are deducted from common equity tier 1 capital and certain regulatory capital deductions were modified as compared to the previously applicable capital regulations. Among other things, the final rule requires significant investments in the common stock of unconsolidated financial institutions, as defined, and certain deferred tax assets that exceed specified individual and aggregate thresholds to be deducted from common equity tier 1 capital. As an advanced approaches banking organization, after-tax unrealized gains and losses on investment securities classified as available for sale, which are excluded from tier 1 capital under Basel I and Basel II, flow through to and affect State Street’s and State Street Bank's common equity tier 1 capital, subject to a phase-in schedule.
On February 21, 2014, we were notified by the Federal Reserve that we had completed our parallel run period. Beginning with the three months ended June 30, 2014 and ending with December 31, 2014, the lower of our regulatory capital ratios calculated under the advanced approaches provisions of the
Basel III final rule and those ratios calculated under the transitional provisions of Basel III (capital calculated in conformity with Basel III and risk-weighted assets calculated in conformity with Basel I) applied in the assessment of our capital adequacy for regulatory purposes.
On January 1, 2015, the U.S. Basel III final rule replaced the existing Basel I-based approach for calculating risk-weighted assets with the U.S. Basel III standardized approach that, among other things, modifies certain existing risk weights and introduces new methods for calculating risk-weighted assets for certain types of assets and exposures. The final rule also revised the Basel II-based advanced approaches capital rules to implement Basel III and certain provisions of the Dodd-Frank Act. The Dodd-Frank Act applies a "capital floor" to advanced approaches banking organizations such as State Street and State Street Bank. Beginning on January 1, 2015, the Basel III standardized approach acts as that capital floor, and we are subject to the more stringent of the risk-based capital ratios calculated under the standardized approach and those calculated under the advanced approaches in the assessment of our capital adequacy under the prompt corrective action framework.
The U.S. Basel III final rule also introduces a capital conservation buffer and a countercyclical capital buffer that add to the minimum risk-based capital ratios. Specifically, the final rule limits a banking organization’s ability to make capital distributions and discretionary bonus payments to executive officers if it fails to maintain a common equity tier 1 capital conservation buffer of more than 2.5% of total risk-weighted assets and, if deployed during periods of excessive credit growth, a common equity tier 1 countercyclical capital buffer of up to 2.5% of total risk-weighted assets, above each of the minimum common equity tier 1, and tier 1 and total risk-based capital ratios. Banking regulators have initially set the countercyclical capital buffer at zero.
The following table sets forth the transition to full implementation and the minimum risk-based capital ratio requirements under the Basel III final rule. This does not include the potential imposition of an additional countercyclical capital buffer discussed above.
108
MANAGEMENT’S DISCUSSION AND ANALYSIS OF FINANCIAL CONDITION
AND RESULTS OF OPERATIONS (Continued)
|
TABLE 44: BASEL III FINAL RULES TRANSITION ARRANGEMENTS AND MINIMUM RISK-BASED CAPITAL RATIOS
|
||||||||||||||||||
|
2014
|
2015
|
2016
|
2017
|
2018
|
2019
|
|||||||||||||
|
Capital conservation buffer (CET1)
|
—
|
%
|
—
|
%
|
0.625
|
%
|
1.250
|
%
|
1.875
|
%
|
2.500
|
%
|
||||||
|
Minimum common equity tier 1
|
4.0
|
|
4.5
|
|
5.125
|
|
5.750
|
|
6.375
|
|
7.000
|
|
||||||
|
Minimum tier 1 capital
|
5.5
|
|
6.0
|
|
6.625
|
|
7.250
|
|
7.875
|
|
8.500
|
|
||||||
|
Minimum total capital
|
8.0
|
|
8.0
|
|
8.625
|
|
9.250
|
|
9.875
|
|
10.500
|
|
||||||
Note: Minimum ratios described above do not incorporate any proposed G-SIB surcharge, based on the December 9, 2014 Federal Reserve proposal, the surcharge is currently estimated at 1.5% for State Street. Including the 1.5% surcharge, State Street's minimum risk-based capital ratio requirements as of January 1, 2019 would be 8.5% for common equity tier 1 capital, 10.0% for tier 1 capital and 12.0% for total capital.
The specific calculation of State Street's and State Street Bank's risk-based capital ratios will change as the provisions of the Basel III final rule related to the numerator (capital) and denominator (risk-weighted assets) are phased in, and as our risk-weighted assets calculated using the advanced approaches change due to potential changes in methodology. These ongoing methodological changes will result in differences in our reported capital ratios from one reporting period to the next that are independent of applicable changes to our capital base, our asset composition, our off-balance sheet exposures or our risk profile.
109
MANAGEMENT’S DISCUSSION AND ANALYSIS OF FINANCIAL CONDITION
AND RESULTS OF OPERATIONS (Continued)
The following table presents the regulatory capital structure and related regulatory capital ratios for State Street and State Street Bank as of the dates indicated. As a result of changes in the methodologies used to calculate our regulatory capital ratios from period to period, as the provisions of the Basel III final rule are phased in, the ratios presented in the table for each period are not directly comparable. Refer to the footnotes following the table.
|
TABLE 45: REGULATORY CAPITAL STRUCTURE AND RELATED REGULATORY CAPITAL RATIOS
|
|||||||||||||||||||||||||||
|
State Street
|
State Street Bank
|
||||||||||||||||||||||||||
|
(Dollars in millions)
|
Basel III Advanced Approaches December 31, 2014
(1)
|
Basel III Transitional Approach December 31, 2014
(2)
|
December 31, 2013
(3)
|
Basel III Advanced Approaches December 31, 2014
(1)
|
Basel III Transitional Approach December 31, 2014
(2)
|
December 31, 2013
(3)
|
|||||||||||||||||||||
|
Common shareholders' equity:
|
|||||||||||||||||||||||||||
|
Common stock and related surplus
|
$
|
10,295
|
|
$
|
10,295
|
|
$
|
10,280
|
|
$
|
10,867
|
|
$
|
10,867
|
|
$
|
10,786
|
|
|||||||||
|
Retained earnings
|
14,882
|
|
14,882
|
|
13,395
|
|
9,416
|
|
9,416
|
|
9,064
|
|
|||||||||||||||
|
Accumulated other comprehensive income (loss)
|
(641
|
)
|
(641
|
)
|
215
|
|
(535
|
)
|
(535
|
)
|
209
|
|
|||||||||||||||
|
Treasury stock, at cost
|
(5,158
|
)
|
(5,158
|
)
|
(3,693
|
)
|
—
|
|
—
|
|
—
|
|
|||||||||||||||
|
Total
|
19,378
|
|
19,378
|
|
20,197
|
|
19,748
|
|
19,748
|
|
20,059
|
|
|||||||||||||||
|
Regulatory capital adjustments:
|
|||||||||||||||||||||||||||
|
Goodwill and other intangible assets, net of associated deferred tax liabilities
(4)
|
(5,869
|
)
|
(5,869
|
)
|
(7,743
|
)
|
(5,577
|
)
|
(5,577
|
)
|
(7,341
|
)
|
|||||||||||||||
|
Other adjustments
|
(36
|
)
|
(36
|
)
|
—
|
|
(128
|
)
|
(128
|
)
|
—
|
|
|||||||||||||||
|
Common equity tier 1 capital
|
13,473
|
|
13,473
|
|
12,454
|
|
14,043
|
|
14,043
|
|
12,718
|
|
|||||||||||||||
|
Preferred stock
|
1,961
|
|
1,961
|
|
491
|
|
—
|
|
—
|
|
—
|
|
|||||||||||||||
|
Trust preferred capital securities subject to phase-out from tier 1 capital
|
475
|
|
475
|
|
950
|
|
—
|
|
—
|
|
—
|
|
|||||||||||||||
|
Other adjustments
|
(145
|
)
|
(145
|
)
|
—
|
|
—
|
|
—
|
|
—
|
|
|||||||||||||||
|
Tier 1 capital
|
15,764
|
|
15,764
|
|
13,895
|
|
14,043
|
|
14,043
|
|
12,718
|
|
|||||||||||||||
|
Qualifying subordinated long-term debt
|
1,618
|
|
1,618
|
|
1,918
|
|
1,634
|
|
1,634
|
|
1,936
|
|
|||||||||||||||
|
Trust preferred capital securities phased out of tier 1 capital
|
475
|
|
475
|
|
NA
|
—
|
|
—
|
|
NA
|
|||||||||||||||||
|
Other adjustments
|
4
|
|
4
|
|
(26
|
)
|
—
|
|
—
|
|
45
|
|
|||||||||||||||
|
Total capital
|
$
|
17,861
|
|
$
|
17,861
|
|
$
|
15,787
|
|
$
|
15,677
|
|
$
|
15,677
|
|
$
|
14,699
|
|
|||||||||
|
Risk-weighted assets:
|
|||||||||||||||||||||||||||
|
Credit risk
|
$
|
66,874
|
|
$
|
87,502
|
|
$
|
78,864
|
|
$
|
59,836
|
|
$
|
84,433
|
|
$
|
76,197
|
|
|||||||||
|
Operational risk
|
35,866
|
|
NA
|
NA
|
35,449
|
|
NA
|
NA
|
|||||||||||||||||||
|
Market risk
(5)
|
5,087
|
|
2,910
|
|
1,262
|
|
5,048
|
|
2,909
|
|
1,262
|
|
|||||||||||||||
|
Total risk-weighted assets
|
$
|
107,827
|
|
$
|
90,412
|
|
$
|
80,126
|
|
$
|
100,333
|
|
$
|
87,342
|
|
$
|
77,459
|
|
|||||||||
|
Adjusted quarterly average assets
|
$
|
247,740
|
|
$
|
247,740
|
|
$
|
202,801
|
|
$
|
243,549
|
|
$
|
243,549
|
|
$
|
199,301
|
|
|||||||||
|
Capital Ratios:
|
Minimum Requirements
(6)
2014
|
Minimum Requirements
(7)
2013
|
|||||||||||||||||||||||||
|
Common equity tier 1 capital
|
4.0
|
%
|
NA
|
|
12.5
|
%
|
14.9
|
%
|
15.5
|
%
|
14.0
|
%
|
16.1
|
%
|
16.4
|
%
|
|||||||||||
|
Tier 1 capital
|
5.5
|
|
4.0
|
%
|
14.6
|
|
17.4
|
|
17.3
|
|
14.0
|
|
16.1
|
|
16.4
|
|
|||||||||||
|
Total capital
|
8.0
|
|
8.0
|
|
16.6
|
|
19.8
|
|
19.7
|
|
15.6
|
|
17.9
|
|
19.0
|
|
|||||||||||
|
Tier 1 leverage
|
4.0
|
|
4.0
|
|
6.4
|
|
6.4
|
|
6.9
|
|
5.8
|
|
5.8
|
|
6.4
|
|
|||||||||||
(1)
Common equity tier 1 capital, tier 1 capital and total capital ratios as of
December 31, 2014
were calculated in conformity with the advanced approaches provisions of the Basel III final rule. Tier 1 leverage ratio as of
December 31, 2014
was calculated in conformity with the Basel III final rule.
(2)
Common equity tier 1 capital, tier 1 capital, total capital and tier 1 leverage ratios as of
December 31, 2014
were calculated in conformity with the transitional provisions of the Basel III final rule. Specifically, these ratios reflect common equity tier 1, tier 1 and total capital (the numerator) calculated in conformity with the provisions of the Basel III final rule, and total risk-weighted assets or, with respect to the tier 1 leverage ratio, quarterly average assets (in both cases, the denominator), calculated in conformity with the provisions of Basel I.
(3)
Common equity tier 1 capital, tier 1 capital, total capital and tier 1 leverage ratios as of
December 31, 2013
were calculated in conformity with the provisions of Basel I.
(4)
Amounts for State Street and State Street Bank as of
December 31, 2014
consisted of goodwill, net of associated deferred tax liabilities, and 20% of other intangible assets, net of associated deferred tax liabilities, the latter phased in as a deduction from capital, in conformity with the Basel III final rule.
(5)
Market risk risk-weighted assets reported in conformity with the Basel III advanced approaches included a credit valuation adjustment, referred to as the CVA, which reflected the risk of potential fair-value adjustments for credit risk reflected in our valuation of over-the-counter derivative contracts. The CVA was not provided for in the final market risk capital rule; however, it was required by the advanced approaches provisions of the Basel III final rule. State Street used the simple CVA approach in conformity with the Basel III advanced approaches.
(6)
Minimum requirements will be phased in up to full implementation beginning on January 1, 2019; minimum requirements listed are as of
December 31, 2014
.
(7)
Minimum requirements listed, governed by Basel I, are as of
December 31, 2013
.
110
MANAGEMENT’S DISCUSSION AND ANALYSIS OF FINANCIAL CONDITION
AND RESULTS OF OPERATIONS (Continued)
The increases in State Street's tier 1 and total capital as of
December 31, 2014
compared to
December 31, 2013
were the result of the first-quarter 2014 and fourth-quarter 2014 issuances of preferred stock, the impact of the phase-in provisions of the Basel III final rule related to other intangible assets and the positive effect of year-to-date net income, partially offset by declarations of common and preferred stock dividends and purchases by us of our common stock in
2014
. State Street Bank's tier 1 and total capital increased as of
December 31, 2014
compared to
December 31, 2013
, the result of the previously-described phase-in provisions of the Basel III final rule related to other intangible assets and the positive effect of year-to-date net income, partially offset by the payment of dividends by State Street Bank to its parent company in
2014
.
The increases in State Street's total risk-weighted assets under the transitional approach as of
December 31, 2014
compared to
December 31, 2013
was primarily associated with higher off-balance sheet and market risk-equivalent assets, mainly associated with an increase in exposure associated with our participation in principal securities finance transactions, an increase in foreign exchange contracts due to an increase in contract volumes as well as an increase in market risk-equivalent risk-weighted assets, primarily due to an increase in the sixty-day moving average of our stressed VaR-based measure. Our stressed VaR-based measure was impacted by the extension of the tenor of FX swaps by Global Treasury designed to improve our liquidity position.
The regulatory capital ratios for State Street and State Street Bank as of
December 31, 2014
, presented in
Table 45: Regulatory Capital Structure and Related Regulatory Capital Ratios
, differ from such ratios as of
December 31, 2013
. These differences are independent of applicable changes to our capital base, our asset composition, our off-balance sheet exposures or our risk profile, and resulted from changes in the methodologies, required by applicable regulatory requirements, used to calculate capital and total risk-weighted assets. As a result, the ratios presented in the table for each period are not directly comparable. Beginning with the second quarter of 2014, we used both the advanced approaches provisions in the Basel III final rule, and the provisions of Basel I, to calculate our risk-weighted assets. For
2013
, we used the provisions of Basel I to calculate our risk-weighted assets.
The table below presents a roll-forward of common equity tier 1 capital, tier 1 capital and total capital for the years ended
December 31, 2014
and
2013
.
|
TABLE 46: CAPITAL ROLL-FORWARD
|
|||||||
|
State Street
|
|||||||
|
(Dollars in millions)
|
Year ended December 31, 2014
|
Year ended December 31, 2013
|
|||||
|
Common equity tier 1 capital:
|
|||||||
|
Common equity tier 1 capital balance, beginning of period
|
$
|
12,454
|
|
$
|
12,322
|
|
|
|
Net income
|
2,037
|
|
2,136
|
|
|||
|
Changes in treasury stock, at cost
|
(1,465
|
)
|
(1,791
|
)
|
|||
|
Dividends declared
|
(551
|
)
|
(489
|
)
|
|||
|
Goodwill and other intangible assets, net of associated deferred tax liabilities
|
1,874
|
|
74
|
|
|||
|
Effect of certain items in accumulated other comprehensive income (loss)
|
(857
|
)
|
84
|
|
|||
|
Other adjustments
|
(19
|
)
|
118
|
|
|||
|
Changes in common equity tier 1 capital
|
1,019
|
|
132
|
|
|||
|
Common equity tier 1 capital balance, end of period
|
13,473
|
|
12,454
|
|
|||
|
Additional tier 1 capital:
|
|||||||
|
Tier 1 capital balance, beginning of period
|
13,895
|
|
13,760
|
|
|||
|
Change in common equity tier 1 capital
|
1,019
|
|
132
|
|
|||
|
Net issuance of preferred stock
|
1,470
|
|
—
|
|
|||
|
Trust preferred capital securities phased out of tier 1 capital
|
(475
|
)
|
—
|
|
|||
|
Other adjustments
|
(145
|
)
|
3
|
|
|||
|
Changes in tier 1 capital
|
1,869
|
|
135
|
|
|||
|
Tier 1 capital balance, end of period
|
15,764
|
|
13,895
|
|
|||
|
Tier 2 capital:
|
|||||||
|
Tier 2 capital balance, beginning of period
|
1,892
|
|
1,069
|
|
|||
|
Net issuance and changes in long-term debt qualifying as tier 2
|
(300
|
)
|
699
|
|
|||
|
Trust preferred capital securities phased into tier 2 capital
|
475
|
|
—
|
|
|||
|
Change in other adjustments
|
30
|
|
124
|
|
|||
|
Changes in tier 2 capital
|
205
|
|
823
|
|
|||
|
Tier 2 capital balance, end of period
|
2,097
|
|
1,892
|
|
|||
|
Total capital:
|
|||||||
|
Total capital balance, beginning of period
|
15,787
|
|
14,829
|
|
|||
|
Changes in tier 1 capital
|
1,869
|
|
135
|
|
|||
|
Changes in tier 2 capital
|
205
|
|
823
|
|
|||
|
Total capital balance, end of period
|
$
|
17,861
|
|
$
|
15,787
|
|
|
Beginning in the second quarter of 2014 we calculated risk-weighted assets under the advanced approaches provision of the Basel III final rule. The following table presents a roll-forward of the Basel III advanced approaches risk-weighted assets for the three and six months ended
December 31, 2014
.
111
MANAGEMENT’S DISCUSSION AND ANALYSIS OF FINANCIAL CONDITION
AND RESULTS OF OPERATIONS (Continued)
|
TABLE 47: RWA ROLL-FORWARD
|
|||||||
|
State Street
|
|||||||
|
(Dollars in millions)
|
Three Months Ended December 31, 2014
|
Six Months Ended December 31, 2014
|
|||||
|
Total risk-weighted assets, beginning of period
|
$
|
108,078
|
|
$
|
111,015
|
|
|
|
Changes in credit risk-weighted assets
|
|||||||
|
Net increase (decrease) in investment securities- wholesale
|
(209
|
)
|
(1,082
|
)
|
|||
|
Net increase (decrease) in loans and leases
|
1,209
|
|
1,381
|
|
|||
|
Net increase (decrease) in securitization exposures
|
(1,223
|
)
|
(5,949
|
)
|
|||
|
Net increase (decrease) in all other
(1)
|
(818
|
)
|
1,431
|
|
|||
|
Net increase (decrease) in credit risk-weighted assets
|
(1,041
|
)
|
(4,219
|
)
|
|||
|
Net increase (decrease) in credit valuation adjustment
|
(603
|
)
|
(80
|
)
|
|||
|
Net increase (decrease) in market risk-weighted assets
|
1,487
|
|
1,230
|
|
|||
|
Net increase (decrease) in operational risk-weighted assets
|
(94
|
)
|
(119
|
)
|
|||
|
Total risk-weighted assets, end of period
|
$
|
107,827
|
|
$
|
107,827
|
|
|
(1)
Includes assets not in a definable category, non-material portfolio, cleared transactions, other wholesale, cash and due from, and interest-bearing deposits with, banks, repo-style exposures, equity exposures, over-the-counter derivative exposures, and 6% credit risk supervisory charge.
For the three and six months ended
December 31, 2014
, total risk-weighted assets decreased from beginning of period balances primarily due to lower credit risk-weighted assets, partially offset by an increase in market risk-equivalent risk-weighted assets, primarily due to an increase in the sixty-day moving average of our stressed VaR-based measure. Our stressed VaR-based measure was impacted by the extension of the tenor of FX swaps by Global Treasury designed to improve our liquidity position. The decrease in credit risk-weighted assets primarily related to sales, maturities and pay-downs of both wholesale and securitized investments, partially offset by an increase in loan activity.
The regulatory capital ratios as of
December 31, 2014
, presented in
Table 45: Regulatory Capital Structure and Related Regulatory Capital Ratios
, calculated under the advanced approaches in conformity with the Basel III final rule, reflect calculations and determinations with respect to our
capital and related matters as of
December 31, 2014
, based on State Street and external data, quantitative formulae, statistical models, historical correlations and assumptions, collectively referred to as “advanced systems,” in effect and used by State Street for those purposes as of the time we filed this Form 10-K. Significant components of these advanced systems involve the exercise of judgment by us and our regulators, and our advanced systems may not accurately represent or calculate the scenarios, circumstances, outputs or other results for which they are designed or intended.
Due to the influence of changes in these advanced systems, whether resulting from changes in data inputs, regulation or regulatory supervision or interpretation, State Street-specific or market activities or experiences or other updates or factors, we expect that our advanced systems and our capital ratios calculated in conformity with the Basel III final rule will change and may be volatile over time, and that those latter changes or volatility could be material as calculated and measured from period to period. Models implemented under the Basel III final rule, particularly those implementing the advanced approaches, remain subject to regulatory review and approval. The full effects of the Basel III final rule on State Street and State Street Bank are therefore subject to further evaluation and also to further regulatory guidance, action or rule-making.
Estimated Basel III Standardized Approach and Fully Phased-in Capital Ratios
Table 48: Regulatory Capital Structure and Related Regulatory Capital Ratios - State Street
and
Table 49: Regulatory Capital Structure and Related Regulatory Capital Ratios - State Street Bank
present our capital ratios for State Street and State Street Bank as of
December 31, 2014
, calculated in conformity with the advanced approaches provisions of the Basel III final rule, our estimated ratios as of
December 31, 2014
, calculated in conformity with the Basel III standardized approach, and pro-forma estimates of our fully phased-in capital ratios as of
December 31, 2014
. The Basel III capital ratios, calculated in conformity with the standardized approach in the Basel III final rule and on a pro-forma fully phased-in basis are preliminary estimates, based on our present interpretations of the Basel III final rule.
112
MANAGEMENT’S DISCUSSION AND ANALYSIS OF FINANCIAL CONDITION
AND RESULTS OF OPERATIONS (Continued)
|
TABLE 48: REGULATORY CAPITAL STRUCTURE AND RELATED REGULATORY CAPITAL RATIOS - STATE STREET
|
||||||||||||||||||||||||||||||
|
December 31, 2014 (Dollars in millions)
|
Basel III Advanced Approaches
(1)
|
Phase-In Provisions
|
Basel III Advanced Approaches Fully Phased-In Pro-Forma Estimate
(3)
|
Basel III Standardized Approach Estimate
(2)
|
Phase-In Provisions
|
Basel III Standardized Approach Fully Phased-In Pro-Forma Estimate
(3)
|
||||||||||||||||||||||||
|
Total common shareholders' equity
|
$
|
19,378
|
|
$
|
133
|
|
$
|
19,511
|
|
$
|
19,378
|
|
$
|
133
|
|
$
|
19,511
|
|
||||||||||||
|
Regulatory capital adjustments:
|
||||||||||||||||||||||||||||||
|
Goodwill and other intangible assets, net of associated deferred tax liabilities
|
(5,869
|
)
|
(1,160
|
)
|
(7,029
|
)
|
(5,869
|
)
|
(1,160
|
)
|
(7,029
|
)
|
||||||||||||||||||
|
Other adjustments
|
(36
|
)
|
(146
|
)
|
(182
|
)
|
(36
|
)
|
(146
|
)
|
(182
|
)
|
||||||||||||||||||
|
Common equity tier 1 capital
|
13,473
|
|
(1,173
|
)
|
12,300
|
|
13,473
|
|
(1,173
|
)
|
12,300
|
|
||||||||||||||||||
|
Additional tier 1 capital:
|
||||||||||||||||||||||||||||||
|
Preferred stock
|
1,961
|
|
—
|
|
1,961
|
|
1,961
|
|
—
|
|
1,961
|
|
||||||||||||||||||
|
Trust preferred capital securities
|
475
|
|
(475
|
)
|
—
|
|
475
|
|
(475
|
)
|
—
|
|
||||||||||||||||||
|
Other adjustments
|
(145
|
)
|
145
|
|
—
|
|
(145
|
)
|
145
|
|
—
|
|
||||||||||||||||||
|
Additional tier 1 capital
|
2,291
|
|
(330
|
)
|
1,961
|
|
2,291
|
|
(330
|
)
|
1,961
|
|
||||||||||||||||||
|
Tier 1 capital
|
15,764
|
|
(1,503
|
)
|
14,261
|
|
15,764
|
|
(1,503
|
)
|
14,261
|
|
||||||||||||||||||
|
Tier 2 capital:
|
||||||||||||||||||||||||||||||
|
Qualifying subordinated long-term debt
|
1,618
|
|
—
|
|
1,618
|
|
1,618
|
|
—
|
|
1,618
|
|
||||||||||||||||||
|
Trust preferred capital securities
|
475
|
|
370
|
|
845
|
|
475
|
|
370
|
|
845
|
|
||||||||||||||||||
|
Other
|
4
|
|
(4
|
)
|
—
|
|
4
|
|
(4
|
)
|
—
|
|
||||||||||||||||||
|
Tier 2 capital
|
2,097
|
|
366
|
|
2,463
|
|
2,097
|
|
366
|
|
2,463
|
|
||||||||||||||||||
|
Total capital
|
$
|
17,861
|
|
$
|
(1,137
|
)
|
$
|
16,724
|
|
$
|
17,861
|
|
$
|
(1,137
|
)
|
$
|
16,724
|
|
||||||||||||
|
Risk weighted assets
(4)
|
$
|
107,827
|
|
$
|
(1,010
|
)
|
$
|
106,817
|
|
$
|
125,011
|
|
$
|
(953
|
)
|
$
|
124,058
|
|
||||||||||||
|
Adjusted average assets
|
247,740
|
|
(433
|
)
|
247,307
|
|
247,740
|
|
(433
|
)
|
247,307
|
|
||||||||||||||||||
|
Total assets for SLR
|
278,690
|
|
(1,161
|
)
|
277,529
|
|
278,690
|
|
(1,161
|
)
|
277,529
|
|
||||||||||||||||||
|
Capital ratios
(5)
:
|
Minimum Requirement 2014
|
Minimum Requirement 2019
|
Minimum Requirement Including Capital Conservation Buffer of 2.5% 2019
|
|||||||||||||||||||||||||||
|
Common equity tier 1 capital
|
4.0
|
%
|
4.5
|
%
|
7.0
|
%
|
12.5
|
%
|
|
11.5
|
%
|
10.8
|
%
|
|
9.9
|
%
|
||||||||||||||
|
Tier 1 capital
|
5.5
|
|
6.0
|
|
8.5
|
|
14.6
|
|
|
13.4
|
|
12.6
|
|
|
11.5
|
|
||||||||||||||
|
Total capital
|
8.0
|
|
8.0
|
|
10.5
|
|
16.6
|
|
|
15.7
|
|
14.3
|
|
|
13.5
|
|
||||||||||||||
|
Tier 1 leverage
|
4.0
|
|
4.0
|
|
NA
|
|
6.4
|
|
|
5.8
|
|
6.4
|
|
|
5.8
|
|
||||||||||||||
|
Supplementary leverage
|
NA
|
|
5.0
|
|
NA
|
|
5.7
|
|
|
5.1
|
|
5.7
|
|
|
5.1
|
|
||||||||||||||
NA: Not applicable.
(1)
The common equity tier 1 ratio was calculated in conformity with the provisions of the Basel III final rule; refer to
Table 45: Regulatory Capital Structure and Related Regulatory Capital Ratios
.
(2)
As of
December 31, 2014
, for purposes of the calculations completed in conformity with the Basel III final rule, total risk-weighted assets under the standardized approach were calculated using State Street's estimates, based on our current interpretations of Basel III final rule.
(3)
As of
December 31, 2014
, represents State Street's estimates calculated in conformity with the fully phased-in provisions of the Basel III Final rule for both Basel III advanced and standardized approaches, based on our current interpretations of the Basel III final rule.
(4)
As of
December 31, 2014
, State Street's estimated risk-weighted assets calculated in conformity with the standardized approach of the Basel III final rule exceeded risk-weighted assets calculated in conformity with the advanced approaches provisions of the Basel III final rule by $17.2 million ($125.0 million minus $107.8 million).
(5)
Common equity tier 1 ratio is calculated by dividing common equity tier 1 capital (numerator) by risk-weighted assets (denominator); tier 1 capital ratio is calculated by dividing tier 1 capital (numerator) by risk-weighted assets (denominator); total capital ratio is calculated by dividing total capital (numerator) by risk-weighted assets (denominator); tier 1 leverage ratio is calculated by dividing tier 1 capital (numerator) by adjusted average assets (denominator); and supplementary leverage ratio is calculated by dividing tier 1 capital (numerator) by total assets for SLR (denominator).
113
MANAGEMENT’S DISCUSSION AND ANALYSIS OF FINANCIAL CONDITION
AND RESULTS OF OPERATIONS (Continued)
|
TABLE 49: REGULATORY CAPITAL STRUCTURE AND RELATED REGULATORY CAPITAL RATIOS - STATE STREET BANK
|
||||||||||||||||||||||||||||||
|
December 31, 2014 (Dollars in millions)
|
Basel III Advanced Approaches
(1)
|
Phase-In Provisions
|
Basel III Advanced Approaches Fully Phased-In Pro-Forma Estimate
(3)
|
Basel III Standardized Approach Estimate
(2)
|
Phase-In Provisions
|
Basel III Standardized Approach Fully Phased-In Pro-Forma Estimate
(3)
|
||||||||||||||||||||||||
|
Total common shareholders' equity
|
$
|
19,748
|
|
$
|
144
|
|
$
|
19,892
|
|
$
|
19,748
|
|
$
|
144
|
|
$
|
19,892
|
|
||||||||||||
|
Regulatory capital adjustments:
|
||||||||||||||||||||||||||||||
|
Goodwill and other intangible assets, net of associated deferred tax liabilities
|
(5,577
|
)
|
(1,085
|
)
|
(6,662
|
)
|
(5,577
|
)
|
(1,085
|
)
|
(6,662
|
)
|
||||||||||||||||||
|
Other adjustments
|
(128
|
)
|
—
|
|
(128
|
)
|
(128
|
)
|
—
|
|
(128
|
)
|
||||||||||||||||||
|
Common equity tier 1 capital
|
14,043
|
|
(941
|
)
|
13,102
|
|
14,043
|
|
(941
|
)
|
13,102
|
|
||||||||||||||||||
|
Additional tier 1 capital:
|
||||||||||||||||||||||||||||||
|
Preferred stock
|
—
|
|
—
|
|
—
|
|
—
|
|
—
|
|
—
|
|
||||||||||||||||||
|
Trust preferred capital securities
|
—
|
|
—
|
|
—
|
|
—
|
|
—
|
|
—
|
|
||||||||||||||||||
|
Other adjustments
|
—
|
|
—
|
|
—
|
|
—
|
|
—
|
|
—
|
|
||||||||||||||||||
|
Additional tier 1 capital
|
—
|
|
—
|
|
—
|
|
—
|
|
—
|
|
—
|
|
||||||||||||||||||
|
Tier 1 capital
|
14,043
|
|
(941
|
)
|
13,102
|
|
14,043
|
|
(941
|
)
|
13,102
|
|
||||||||||||||||||
|
Tier 2 capital:
|
||||||||||||||||||||||||||||||
|
Qualifying subordinated long-term debt
|
1,634
|
|
—
|
|
1,634
|
|
1,634
|
|
—
|
|
1,634
|
|
||||||||||||||||||
|
Trust preferred capital securities
|
—
|
|
—
|
|
—
|
|
—
|
|
—
|
|
—
|
|
||||||||||||||||||
|
Other
|
—
|
|
—
|
|
—
|
|
—
|
|
—
|
|
—
|
|
||||||||||||||||||
|
Tier 2 capital
|
1,634
|
|
—
|
|
1,634
|
|
1,634
|
|
—
|
|
1,634
|
|
||||||||||||||||||
|
Total capital
|
$
|
15,677
|
|
$
|
(941
|
)
|
$
|
14,736
|
|
$
|
15,677
|
|
$
|
(941
|
)
|
$
|
14,736
|
|
||||||||||||
|
Risk weighted assets
(4)
|
$
|
100,333
|
|
$
|
(1,409
|
)
|
$
|
98,924
|
|
$
|
118,147
|
|
$
|
(1,328
|
)
|
$
|
116,819
|
|
||||||||||||
|
Adjusted average assets
|
243,549
|
|
(365
|
)
|
243,184
|
|
243,549
|
|
(365
|
)
|
243,184
|
|
||||||||||||||||||
|
Total assets for SLR
|
274,331
|
|
(1,085
|
)
|
273,246
|
|
274,331
|
|
(1,085
|
)
|
273,246
|
|
||||||||||||||||||
|
Capital ratios
(5)
:
|
Minimum Requirement 2014
|
Minimum Requirement 2019
|
Minimum Requirement Including Capital Conservation Buffer of 2.5% 2019
|
|||||||||||||||||||||||||||
|
Common equity tier 1 capital
|
4.0
|
%
|
4.5
|
%
|
7.0
|
%
|
14.0
|
%
|
|
13.2
|
%
|
11.9
|
%
|
|
11.2
|
%
|
||||||||||||||
|
Tier 1 capital
|
5.5
|
|
6.0
|
|
8.5
|
|
14.0
|
|
|
13.2
|
|
11.9
|
|
|
11.2
|
|
||||||||||||||
|
Total capital
|
8.0
|
|
8.0
|
|
10.5
|
|
15.6
|
|
|
14.9
|
|
13.3
|
|
|
12.6
|
|
||||||||||||||
|
Tier 1 leverage
|
4.0
|
|
4.0
|
|
NA
|
|
5.8
|
|
|
5.4
|
|
5.8
|
|
|
5.4
|
|
||||||||||||||
|
Supplementary leverage
|
NA
|
|
5.0
|
|
NA
|
|
5.1
|
|
|
4.8
|
|
5.1
|
|
|
4.8
|
|
||||||||||||||
NA: Not applicable.
(1)
The common equity tier 1 ratio was calculated in conformity with the provisions of the Basel III final rule; refer to
Table 45: Regulatory Capital Structure and Related Regulatory Capital Ratios
.
(2)
As of
December 31, 2014
, for purposes of the calculations completed in conformity with the Basel III final rule, total risk-weighted assets under the standardized approach were calculated using State Street Bank's estimates, based on our current interpretations of Basel III final rule.
(3)
As of
December 31, 2014
, represents State Street Bank's estimates calculated in conformity with the fully phased-in provisions of the Basel III Final rule for both Basel III advanced and standardized approaches, based on our current interpretations of the Basel III final rule.
(4)
As of
December 31, 2014
, State Street Bank's estimated risk-weighted assets calculated in conformity with the standardized approach of the Basel III final rule exceeded risk-weighted assets calculated in conformity with the advanced approaches provisions of the Basel III final rule by $17.8 million ($118.1 million minus $100.3 million).
(5)
Common equity tier 1 ratio is calculated by dividing common equity tier 1 capital (numerator) by risk-weighted assets (denominator); tier 1 capital ratio is calculated by dividing tier 1 capital (numerator) by risk-weighted assets (denominator); total capital ratio is calculated by dividing total capital (numerator) by risk-weighted assets (denominator); tier 1 leverage ratio is calculated by dividing tier 1 capital (numerator) by adjusted average assets (denominator); and supplementary leverage ratio is calculated by dividing tier 1 capital (numerator) by total assets for SLR (denominator).
114
MANAGEMENT’S DISCUSSION AND ANALYSIS OF FINANCIAL CONDITION
AND RESULTS OF OPERATIONS (Continued)
Fully phased-in pro-forma estimates of common shareholders' equity include 100% of accumulated other comprehensive income, including accumulated other comprehensive income attributable to available-for-sale securities, cash flow hedges and defined benefit pension plans. Fully phased-in pro-forma estimates of common equity tier 1 capital reflect 100% of applicable deductions, including but not limited to, intangible assets net of deferred tax liabilities. For 2014, tier 1 capital and tier 2 capital each include 50% of trust preferred capital securities. Fully phased-in tier 1 capital reflects the transition of trust preferred capital securities from tier 1 capital to tier 2 capital. For both Basel III advanced and standardized approaches, fully phased-in pro-forma estimates of risk-weighted assets reflect the exclusion of intangible assets, offset by additions related to non-significant equity exposures and deferred tax assets related to temporary differences.
Global Systemically Important Bank
We are designated as a large bank holding company subject to enhanced supervision and prudential standards, commonly referred to as a “systemically important financial institution,” or SIFI, and we are one among a group of 30 institutions worldwide that have been identified by the Financial Stability Board, or FSB, and the Basel Committee as “global systemically important banks,” or G-SIBs. Our designation as a G-SIB will require us to maintain an additional capital buffer above the Basel III final rule minimum common equity tier 1 capital ratio of 4.5%, based on a number of factors, as evaluated by banking regulators. Factors in this evaluation will include our size, interconnectedness, substitutability, complexity and cross-jurisdictional activities. In November 2014, the FSB designated us as a category-1 organization, with a capital surcharge of 1%, although this designation and the associated additional capital buffer are subject to change.
On December 9, 2014, the Federal Reserve released a proposal on the implementation of capital requirements for U.S. G-SIBs. For most firms, the proposal would require a higher G-SIB buffer than would the earlier Basel Committee on Banking Supervision, or BCBS, proposal. The proposal would be phased in beginning on January 1, 2016 and be fully effective on January 1, 2019. The eight U.S. banks deemed to be G-SIBs would be required to calculate the G-SIB buffer according to two methods and be bound by the higher of the two:
|
•
|
Method 1: Same methodology as proposed by the BCBS, assessing systemic importance based upon five equally-weighted components: size, interconnectedness, complexity, cross-jurisdictional activity and substitutability
|
|
•
|
Method 2: Alters the calculation from method 1 by factoring in a wholesale funding score in place of substitutability and applying a 2x multiplier to the sum of the five components
|
We preliminarily estimate, based on our relevant metrics as of December 31, 2014, that Method 2 would be the binding methodology for State Street and that our G-SIB buffer may increase from the 1% proposed under the FSB designation to 1.5% under the Federal Reserve's December 2014 proposal. The actual buffer applicable will depend on the final rules implemented by the Federal Reserve, including the treatment of excess deposits we invest with U.S. and non-U.S. central banks. Assuming completion of the phase-in period for the capital conservation buffer, and no countercyclical buffer, the minimum capital ratios as of January 1, 2019, including a capital conservation buffer and an estimated G-SIB capital surcharge of 1.5%, would be 10.0% for tier 1 risk-based capital, 12.0% for total risk-based capital, and 8.5% for common equity tier 1 capital, in order for State Street to make capital distributions and discretionary bonus payments without limitation. Not all of our competitors have similarly been designated as systemically important, and therefore some of our competitors may not be subject to the same additional capital requirements.
Supplementary Leverage Ratio
On April 8, 2014, U.S. banking regulators issued a final rule enhancing the supplementary leverage ratio, or SLR, standards for certain bank holding companies, like State Street, and their insured depository institution subsidiaries, like State Street Bank. We refer to this final rule as the eSLR final rule. Under the eSLR final rule, upon implementation as of January 1, 2018, State Street Bank must maintain a supplementary leverage ratio of at least 6% to be well capitalized under the U.S. banking regulators’ Prompt Corrective Action framework. The eSLR final rule also provides that if State Street maintains an SLR of at least 5%, it is not subject to limitations on distribution and discretionary bonus payments under the eSLR final rule.
On September 3, 2014, U.S. banking regulators issued a final rule modifying the definition of the denominator of the SLR in a manner consistent with the final rule issued by the Basel Committee on Banking Supervision on January 12, 2014. The revisions to the SLR apply to all banking organizations subject to the advanced approaches provisions of the Basel III final rule, like State Street and State Street Bank. Specifically, the SLR final rule modifies the methodology for including off-balance sheet assets, including credit derivatives, repo-style transactions, and lines of credit, in the denominator of the SLR, and requires banking organizations to
115
MANAGEMENT’S DISCUSSION AND ANALYSIS OF FINANCIAL CONDITION
AND RESULTS OF OPERATIONS (Continued)
calculate their total leverage exposure using daily averages for on-balance sheet assets and the average of three month-end calculations for off-balance sheet exposures. Certain public disclosures required by the SLR final rule must be provided beginning with the first quarter of 2015, and the minimum SLR requirement using the SLR final rule’s denominator calculations is effective beginning on January 1, 2018.
Estimated pro-forma fully phased-in supplementary leverage ratios as of December 31, 2014 are preliminary estimates by State Street (in each case, fully phased-in as of January 1, 2018, as per the phase-in requirements of the SLR final rule), calculated based on our interpretations of the SLR final rule as of the time this Form 10-K is filed with the SEC and as applied to our businesses and operations as of December 31, 2014.
|
TABLE 50: SUPPLEMENTARY LEVERAGE RATIO
|
||||||||
|
December 31, 2014
|
Transitional SLR
|
Fully Phased-in SLR
|
||||||
|
(Dollars in millions)
|
||||||||
|
State Street:
|
||||||||
|
Tier 1 capital
|
$
|
15,764
|
|
$
|
14,261
|
|
||
|
On- and off-balance sheet leverage exposure
|
284,740
|
|
284,740
|
|
||||
|
Less: regulatory deductions
|
(6,050
|
)
|
(7,211
|
)
|
||||
|
Total assets for SLR
|
278,690
|
|
277,529
|
|
||||
|
Supplementary leverage ratio
|
5.7
|
%
|
5.1
|
%
|
||||
|
State Street Bank:
|
||||||||
|
Tier 1 capital
|
$
|
14,043
|
|
$
|
13,102
|
|
||
|
On- and off-balance sheet leverage exposure
|
280,036
|
|
280,036
|
|
||||
|
Less: regulatory deductions
|
(5,705
|
)
|
(6,790
|
)
|
||||
|
Total assets for SLR
|
274,331
|
|
273,246
|
|
||||
|
Supplementary leverage ratio
|
5.1
|
%
|
4.8
|
%
|
||||
Capital Actions
Preferred Stock
In November 2014, we issued
30 million
depositary shares, each representing a
1/4,000th
ownership interest in a share of State Street’s non-cumulative perpetual preferred stock, Series E, without par value per share, with a liquidation preference of
$100,000
per share (equivalent to
$25
per depositary share), which we refer to as our Series E preferred stock, in a public offering. The aggregate proceeds from the offering, net of underwriting discounts, commissions and other issuance costs, were approximately
$728 million
.
In January 2015, we declared dividends on our Series E preferred stock of
$1,833
per share, or approximately
$0.46
per depositary share, totaling approximately
$14 million
, which will be paid in March 2015.
In February 2014, we issued
30 million
depositary shares, each representing a
1/4,000th
ownership interest in a share of State Street’s fixed-to-floating-rate non-cumulative perpetual preferred stock, Series D, without par value per share, with a liquidation preference of
$100,000
per share (equivalent to
$25
per depositary share), which we refer to as our Series D preferred stock, in a public offering. The aggregate proceeds from the offering, net of underwriting discounts, commissions and other issuance costs, were approximately
$742 million
.
In
2014
, we declared aggregate dividends on our Series D preferred stock of
$4,605
per share, or approximately
$1.15
per depository share, totaling approximately
$35 million
. In January 2015, we declared dividends on our Series D preferred stock of
$1,475
per share, or approximately
$0.37
per depositary share, totaling approximately
$11 million
, which will be paid in March 2015.
In
2014
, we declared aggregate dividends on our non-cumulative perpetual preferred stock, Series C (represented by depositary shares, each representing a
1/4,000th
ownership interest in a share of State Street’s non-cumulative perpetual preferred stock, Series C), or Series C preferred stock, of
$5,252
per share, or approximately
$1.32
per depositary share, totaling approximately
$26 million
. In
2013
, dividends on our Series C preferred stock totaled approximately
$26 million
. In January 2015, we declared dividends on our Series C preferred stock of
$1,313
per share, or approximately
$0.33
per depositary share, totaling approximately
$7 million
, which will be paid in March 2015.
Common Stock
In
2014
, under a purchase program approved by our Board of Directors in
March 2014
which authorizes us to purchase up to
$1.70 billion
of our common stock through
March 31, 2015
, we purchased approximately
17.7 million
shares of our common stock at an average cost of
$69.59
per share and an aggregate cost of approximately
$1.23 billion
under that program. As of
December 31, 2014
, approximately
$470 million
remained available for purchases of our common stock under the
March 2014
program.
In the first quarter of
2014
, we completed the
$2.10 billion
program authorized by the Board in
March 2013
by purchasing approximately
6.1 million
shares of our common stock, at an average price of
$69.14
per share and an aggregate cost of approximately
$420 million
.
Under both programs, in
2014
, we purchased in the aggregate approximately
23.8 million
shares of our common stock at an average per-share cost of
$69.48
and an aggregate cost of approximately
$1.65
116
MANAGEMENT’S DISCUSSION AND ANALYSIS OF FINANCIAL CONDITION
AND RESULTS OF OPERATIONS (Continued)
billion
. Shares acquired under the March 2014 common stock purchase program which remained unissued as of
December 31, 2014
were recorded as treasury stock in our consolidated statement of condition as of
December 31, 2014
.
In 2013, under common stock purchase programs approved by the Board in March 2012 and March 2013, we purchased an aggregate of
31.2 million
shares of our common stock at an average price of
$65.30
per share and an aggregate cost of
$2.04 billion
.
In
2014
, we declared aggregate quarterly common stock dividends of
$1.16
per share, totaling approximately
$490 million
, compared to aggregate common stock dividends of
$1.04
per share, totaling approximately
$463 million
, declared in
2013
.
Federal and state banking regulations place certain restrictions on dividends paid by subsidiary banks to the parent holding company. In addition, banking regulators have the authority to prohibit bank holding companies from paying dividends. Information concerning limitations on dividends from our subsidiary banks is provided in “Related Stockholder Matters” included under Item 5, and in note 13 to the consolidated financial statements, included under Item 8 of this Form 10-K.
Economic Capital
We define economic capital as the capital required to protect holders of our senior debt, and obligations higher in priority, against unexpected economic losses over a one-year period. Economic capital is one of several measures used by us to assess the adequacy of our capital levels in relation to our risk profile; the relative importance of this measure to our capital requirements has declined as new regulatory metrics, including the Basel III advanced and standardized ratios; the G-SIB buffer, and the Supplementary Leverage Ratio, have been introduced, and our enterprise-wide stress testing framework has evolved. Due to the evolving nature of quantification techniques, we expect to periodically refine the methodologies, assumptions, and information used to estimate our capital requirements under different scenarios and stress environments, which could result in a different amount of capital needed to support our business activities.
OFF-BALANCE SHEET ARRANGEMENTS
On behalf of clients enrolled in our securities lending program, we lend securities to banks, broker/dealers and other institutions. In most circumstances, we indemnify our clients for the fair market value of those securities against a failure of the borrower to return such securities. Though these transactions are collateralized, the substantial volume of these activities necessitates detailed credit-based
underwriting and monitoring processes. The aggregate amount of indemnified securities on loan totaled
$349.77 billion
as of
December 31, 2014
, compared to
$320.08 billion
as of
December 31, 2013
. We require the borrower to provide collateral in an amount in excess of 100% of the fair market value of the securities borrowed. We hold the collateral received in connection with these securities lending services as agent, and the collateral is not recorded in our consolidated statement of condition. We revalue the securities on loan and the collateral daily to determine if additional collateral is necessary or if excess collateral is required to be returned to the borrower. We held, as agent, cash and securities totaling
$364.41 billion
and
$331.73 billion
as collateral for indemnified securities on loan as of
December 31, 2014
and
2013
, respectively.
The cash collateral held by us as agent is invested on behalf of our clients. In certain cases, the cash collateral is invested in third-party repurchase agreements, for which we indemnify the client against loss of the principal invested. We require the counterparty to the indemnified repurchase agreement to provide collateral in an amount in excess of 100% of the amount of the repurchase agreement. In our role as agent, the indemnified repurchase agreements and the related collateral held by us are not recorded in our consolidated statement of condition. Of the collateral of
$364.41 billion
and
$331.73 billion
, referenced above,
$85.31 billion
and
$85.37 billion
was invested in indemnified repurchase agreements as of
December 31, 2014
and
2013
, respectively. We or our agents held
$90.82 billion
and
$91.10 billion
as collateral for indemnified investments in repurchase agreements as of
December 31, 2014
and
2013
, respectively.
Additional information about our securities finance activities and other off-balance sheet arrangements is provided in notes
10
and
16
to the consolidated financial statements included under Item 8 of this Form 10-K.
SIGNIFICANT ACCOUNTING ESTIMATES
Our consolidated financial statements are prepared in conformity with GAAP, and we apply accounting policies that affect the determination of amounts reported in these consolidated financial statements. Additional information on our significant accounting policies, including references to applicable footnotes, is provided in note
1
to the consolidated financial statements included under Item 8 of this Form 10-K.
Certain of our accounting policies, by their nature, require management to make judgments, involving significant estimates and assumptions, about the effects of matters that are inherently
117
MANAGEMENT’S DISCUSSION AND ANALYSIS OF FINANCIAL CONDITION
AND RESULTS OF OPERATIONS (Continued)
uncertain. These estimates and assumptions are based on information available as of the date of the consolidated financial statements, and changes in this information over time could materially affect the amounts of assets, liabilities, equity, revenue and expenses reported in subsequent consolidated financial statements.
Based on the sensitivity of reported financial statement amounts to the underlying estimates and assumptions, the relatively more significant accounting policies applied by State Street have been identified by management as those associated with recurring fair-value measurements, other-than-temporary impairment of investment securities, impairment of goodwill and other intangible assets, and contingencies. These accounting policies require the most subjective or complex judgments, and underlying estimates and assumptions could be most subject to revision as new information becomes available. An understanding of the judgments, estimates and assumptions underlying these accounting policies is essential in order to understand our reported consolidated results of operations and financial condition.
The following is a brief discussion of the above-mentioned significant accounting estimates. Management has discussed these significant accounting estimates with the E&A Committee of the Board.
Fair-Value Measurements
We carry certain of our financial assets and liabilities at fair value in our consolidated financial statements on a recurring basis, including trading account assets, investment securities available for sale and derivative instruments.
Changes in the fair value of these financial assets and liabilities are recorded either as components of our consolidated statement of income, or as components of other comprehensive income within shareholders' equity in our consolidated statement of condition. In addition to those financial assets and liabilities that we carry at fair value in our consolidated financial statements on a recurring basis, we estimate the fair values of other financial assets and liabilities that we carry at amortized cost in our consolidated statement of condition, and we disclose these fair value estimates in the notes to our consolidated financial statements. We estimate the fair values of these financial assets and liabilities using the definition of fair value described below.
As of
December 31, 2014
, approximately
$103.77 billion
of our financial assets and approximately
$6.31 billion
of our financial liabilities were carried at fair value on a recurring basis, compared to
$105.59 billion
and
$6.36 billion
,
respectively, as of
December 31, 2013
. The amounts as of
December 31, 2014
represented approximately
38%
of our consolidated total assets and approximately
2%
of our consolidated total liabilities, compared to
43%
and
3%
, respectively, as of
December 31, 2013
. The decrease in the relative percentage of consolidated total assets as of
December 31, 2014
compared to
2013
mainly reflects a decline in the investment securities portfolio, associated with a lower level of purchases in 2014 compared to 2013, and an increase in interest-bearing deposits with banks, the result of the continued elevated level of client deposits. Additional information with respect to the assets and liabilities carried by us at fair value on a recurring basis is provided in note
2
to the consolidated financial statements included under Item 8 of this Form 10-K.
GAAP defines fair value as the price that would be received to sell an asset or paid to transfer a liability in the principal or most advantageous market for an asset or liability in an orderly transaction between market participants on the measurement date. When we measure fair value for our financial assets and liabilities, we consider the principal or the most advantageous market in which we would transact; we also consider assumptions that market participants would use when pricing the asset or liability. When possible, we look to active and observable markets to measure the fair value of identical, or similar, financial assets and liabilities. When identical financial assets and liabilities are not traded in active markets, we look to market-observable data for similar assets and liabilities. In some instances, certain assets and liabilities are not actively traded in observable markets; as a result, we use alternate valuation techniques to measure their fair value.
We categorize the financial assets and liabilities that we carry at fair value in our consolidated statement of condition on a recurring basis based on GAAP's prescribed three-level valuation hierarchy. The hierarchy gives the highest priority to quoted prices in active markets for identical assets or liabilities (level 1) and the lowest priority to valuation methods using significant unobservable inputs (level 3). As of
December 31, 2014
, including the effect of netting, we categorized approximately
10%
of our financial assets carried at fair value in level 1, approximately
85%
of our financial assets carried at fair value in level 2, and approximately
5%
of our financial assets carried at fair value in level 3 of the fair value hierarchy. As of
December 31, 2013
, including the effect of netting, we categorized less than
1%
of our financial assets carried at fair value in level 1, approximately
92%
of our financial assets carried at fair value in level 2, and approximately
7%
of our financial assets carried at fair value in level 3 of
118
MANAGEMENT’S DISCUSSION AND ANALYSIS OF FINANCIAL CONDITION
AND RESULTS OF OPERATIONS (Continued)
the fair value hierarchy. As of
December 31, 2014
, on the same basis, we categorized approximately
99%
of our financial liabilities carried at fair value in level 2, and approximately
1%
of our financial liabilities carried at fair value in level 3 of the fair value hierarchy. As of
December 31, 2013
, on the same basis, we categorized approximately
2%
of our financial liabilities carried at fair value in level 1, approximately
98%
of our financial liabilities carried at fair value in level 2, and less than
1%
of our financial liabilities carried at fair value in level 3 of the fair value hierarchy.
The assets categorized in level 1 were substantially composed of trading account assets. Fair value for these securities was measured by management using unadjusted quoted prices in active markets for identical securities.
The assets categorized in level 2 were composed of investment securities available for sale and derivative instruments. Fair value for the investment securities was measured by management primarily using information obtained from independent third parties. Information obtained from third parties is subject to review by management as part of a validation process. Management utilizes a process to verify the information provided, including an understanding of underlying assumptions and the level of market-participant information used to support those assumptions. In addition, management compares significant assumptions used by third parties to available market information. Such information may include known trades or, to the extent that trading activity is limited, comparisons to market research information pertaining to credit expectations, execution prices and the timing of cash flows and, where information is available, back-testing.
The derivative instruments categorized in level 2 predominantly represented foreign exchange and interest-rate contracts used in our trading activities, for which fair value was measured by management using discounted cash flow techniques, with inputs consisting of observable spot and forward points, as well as observable interest rate curves.
The substantial majority of our financial assets categorized in level 3 were composed of asset-backed and mortgage-backed securities available for sale. Level-3 assets also included foreign exchange derivative contracts. The aggregate fair value of our financial assets and liabilities categorized in level 3 as of
December 31, 2014
decreased approximately
27%
compared to
2013
, primarily the result of transfers out of level 3 and paydowns of asset-backed and non-U.S. debt securities.
With respect to derivative instruments, we evaluated the impact on valuation of the credit risk of
our counterparties and of our own credit. We considered such factors as the market-based probability of default by us and our counterparties, and our current and expected potential future net exposures by remaining maturities, in determining the appropriate measurements of fair value. Valuation adjustments associated with derivative instruments were not significant to our consolidated financial performance in
2014
,
2013
or
2012
.
Other-Than-Temporary Impairment of Investment Securities
Our portfolio of fixed-income investment securities constitutes a significant portion of the assets carried in our consolidated statement of condition. GAAP requires the use of expected future cash flows to evaluate other-than-temporary impairment of these investment securities. The amount and timing of these expected future cash flows are significant estimates used in our evaluation of other-than-temporary impairment. An other-than-temporary impairment is triggered if the intent is to sell the security, the security will more likely than not have to be sold before maturity or the amortized cost basis is not expected to be recovered. Additional information with respect to management's assessment of other-than-temporary impairment is provided in note
3
to the consolidated financial statements included under Item 8 of this Form 10-K.
Expectations of defaults and prepayments are the most significant assumptions underlying our estimates of future cash flows. In determining these estimates, management relies on relevant and reliable information, including but not limited to deal structure, including optional and mandatory calls, market interest-rate curves, industry standard asset-class-specific prepayment models, recent prepayment history, independent credit ratings, and recent actual and projected credit losses. Management considers this information based on its relevance and uses its best judgment in order to determine its assumptions for underlying cash-flow expectations and resulting estimates. Management reviews its underlying assumptions and develops expected future cash-flow estimates at least quarterly. Additional detail with respect to the sensitivity of these default and prepayment assumptions is provided under “Financial Condition - Investment Securities” in this Management's Discussion and Analysis.
119
MANAGEMENT’S DISCUSSION AND ANALYSIS OF FINANCIAL CONDITION
AND RESULTS OF OPERATIONS (Continued)
Impairment of Goodwill and Other Intangible Assets
Goodwill represents the excess of the cost of an acquisition over the fair value of the net tangible and other intangible assets acquired. Other intangible assets represent purchased assets that can be distinguished from goodwill because of contractual rights or because the asset can be exchanged on its own or in combination with a related contract, asset or liability. Goodwill is not amortized, while other intangible assets are amortized over their estimated useful lives.
Goodwill is ultimately supported by revenue from our Investment Servicing and Investment Management lines of business. A decline in earnings as a result of a lack of growth, or our inability to deliver cost-effective services over sustained periods, could lead to a perceived impairment of goodwill, which would be evaluated and, if necessary, be recorded as a write-down of the reported amount of goodwill through a charge to other expenses in our consolidated statement of income.
On an annual basis, or more frequently if circumstances arise, management reviews goodwill and evaluates events or other developments that may indicate impairment of the carrying amount. We perform this evaluation at the reporting unit level, which is one level below our two major lines of business. The evaluation methodology for potential impairment is inherently complex and involves significant management judgment in the use of estimates and assumptions.
We evaluate goodwill for impairment using a two-step process. First, we compare the aggregate fair value of the reporting unit to its carrying amount, including goodwill. If the fair value exceeds the carrying amount, no impairment exists. If the carrying amount of the reporting unit exceeds the fair value, then we compare the “implied” fair value of the reporting unit's goodwill to its carrying amount. If the carrying amount of the goodwill exceeds the implied fair value, then goodwill impairment is recognized by writing the goodwill down to the implied fair value. The implied fair value of the goodwill is determined by allocating the fair value of the reporting unit to all of the assets and liabilities of that unit, as if the unit had been acquired in a business combination and the overall fair value of the unit was the purchase price.
To determine the aggregate fair value of the reporting unit being evaluated for goodwill impairment, we use one of two principal methodologies: a market approach, based on a comparison of the reporting unit to publicly-traded companies in similar lines of business; or an income approach, based on the value of the cash flows that
the business can be expected to generate in the future.
Events that may indicate impairment include significant or adverse changes in the business, economic or political climate; an adverse action or assessment by a regulator; unanticipated competition; and a more-likely-than-not expectation that we will sell or otherwise dispose of a business to which the goodwill or other intangible assets relate. Additional information about goodwill and other intangible assets, including information by line of business, is provided in note
5
to the consolidated financial statements included under Item 8 of this Form 10-K.
Our evaluation of goodwill and other intangible assets indicated that no significant impairment occurred in
2014
,
2013
or
2012
. Goodwill and other intangible assets recorded in our consolidated statement of condition as of
December 31, 2014
totaled approximately
$5.83 billion
and
$2.03 billion
, respectively, compared to
$6.04 billion
and
$2.36 billion
, respectively, as of
December 31, 2013
.
Contingencies
The significant estimates and judgments related with establishing litigation reserves are discussed in note 11 of the consolidated financial statements included under Item 8 of this Form 10-K.
RECENT ACCOUNTING DEVELOPMENTS
Information with respect to recent accounting developments is provided in note
1
to the consolidated financial statements included under Item 8 of this Form 10-K.
120
The information provided under “Financial Condition - Market Risk Management” in Management’s Discussion and Analysis, included under Item 7 of this Form 10-K, is incorporated by reference herein.
ITEM 8.
FINANCIAL STATEMENTS AND SUPPLEMENTARY DATA
Additional information about restrictions on the transfer of funds from State Street Bank to the parent company is provided under Item 5, and in “Financial Condition - Capital” in Management’s Discussion and Analysis included under Item 7, of this Form 10-K.
121
Report of Independent Registered Public Accounting Firm
The Shareholders and Board of Directors of
State Street Corporation
We have audited the accompanying consolidated statement of condition of State Street Corporation (the “Corporation”) as of
December 31, 2014
and
2013
, and the related consolidated statements of income, comprehensive income, changes in shareholders' equity, and cash flows for each of the three years in the period ended
December 31, 2014
. These financial statements are the responsibility of the Corporation's management. Our responsibility is to express an opinion on these financial statements based on our audits.
We conducted our audits in accordance with the standards of the Public Company Accounting Oversight Board (United States). Those standards require that we plan and perform the audit to obtain reasonable assurance about whether the financial statements are free of material misstatement. An audit includes examining, on a test basis, evidence supporting the amounts and disclosures in the financial statements. An audit also includes assessing the accounting principles used and significant estimates made by management, as well as evaluating the overall financial statement presentation. We believe that our audits provide a reasonable basis for our opinion.
In our opinion, the financial statements referred to above present fairly, in all material respects, the consolidated financial position of State Street Corporation at
December 31, 2014
and
2013
, and the consolidated results of its operations and its cash flows for each of the three years in the period ended
December 31, 2014
, in conformity with U.S. generally accepted accounting principles.
We also have audited, in accordance with the standards of the Public Company Accounting Oversight Board (United States), State Street Corporation’s internal control over financial reporting as of
December 31, 2014
, based on criteria established in Internal Control-Integrated Framework issued by the Committee of Sponsoring Organizations of the Treadway Commission (2013 framework) and our report dated
February 20, 2015
expressed an unqualified opinion thereon.
/s/ Ernst & Young LLP
Boston, Massachusetts
February 20, 2015
122
STATE STREET CORPORATION
CONSOLIDATED FINANCIAL STATEMENTS
|
Years Ended December 31,
|
2014
|
2013
|
2012
|
||||||||
|
(Dollars in millions, except per share amounts)
|
|||||||||||
|
Fee revenue:
|
|||||||||||
|
Servicing fees
|
$
|
5,129
|
|
$
|
4,819
|
|
$
|
4,414
|
|
||
|
Management fees
|
1,207
|
|
1,106
|
|
993
|
|
|||||
|
Trading services
|
1,084
|
|
1,094
|
|
1,036
|
|
|||||
|
Securities finance
|
437
|
|
359
|
|
405
|
|
|||||
|
Processing fees and other
|
174
|
|
212
|
|
240
|
|
|||||
|
Total fee revenue
|
8,031
|
|
7,590
|
|
7,088
|
|
|||||
|
Net interest revenue:
|
|||||||||||
|
Interest revenue
|
2,652
|
|
2,714
|
|
3,014
|
|
|||||
|
Interest expense
|
392
|
|
411
|
|
476
|
|
|||||
|
Net interest revenue
|
2,260
|
|
2,303
|
|
2,538
|
|
|||||
|
Gains (losses) related to investment securities, net:
|
|||||||||||
|
Net gains (losses) from sales of available-for-sale securities
|
15
|
|
14
|
|
55
|
|
|||||
|
Losses from other-than-temporary impairment
|
(1
|
)
|
(21
|
)
|
(53
|
)
|
|||||
|
Losses reclassified (from) to other comprehensive income
|
(10
|
)
|
(2
|
)
|
21
|
|
|||||
|
Gains (losses) related to investment securities, net
|
4
|
|
(9
|
)
|
23
|
|
|||||
|
Total revenue
|
10,295
|
|
9,884
|
|
9,649
|
|
|||||
|
Provision for loan losses
|
10
|
|
6
|
|
(3
|
)
|
|||||
|
Expenses:
|
|||||||||||
|
Compensation and employee benefits
|
4,060
|
|
3,800
|
|
3,837
|
|
|||||
|
Information systems and communications
|
976
|
|
935
|
|
844
|
|
|||||
|
Transaction processing services
|
784
|
|
733
|
|
702
|
|
|||||
|
Occupancy
|
461
|
|
467
|
|
470
|
|
|||||
|
Claims resolution
|
—
|
|
—
|
|
(362
|
)
|
|||||
|
Acquisition and restructuring costs
|
133
|
|
104
|
|
225
|
|
|||||
|
Professional services
|
440
|
|
392
|
|
381
|
|
|||||
|
Amortization of other intangible assets
|
222
|
|
214
|
|
198
|
|
|||||
|
Other
|
751
|
|
547
|
|
591
|
|
|||||
|
Total expenses
|
7,827
|
|
7,192
|
|
6,886
|
|
|||||
|
Income before income tax expense
|
2,458
|
|
2,686
|
|
2,766
|
|
|||||
|
Income tax expense
|
421
|
|
550
|
|
705
|
|
|||||
|
Net income
|
$
|
2,037
|
|
$
|
2,136
|
|
$
|
2,061
|
|
||
|
Net income available to common shareholders
|
$
|
1,973
|
|
$
|
2,102
|
|
$
|
2,019
|
|
||
|
Earnings per common share:
|
|||||||||||
|
Basic
|
$
|
4.65
|
|
$
|
4.71
|
|
$
|
4.25
|
|
||
|
Diluted
|
4.57
|
|
4.62
|
|
$
|
4.20
|
|
||||
|
Average common shares outstanding (in thousands):
|
|||||||||||
|
Basic
|
424,223
|
|
446,245
|
|
474,458
|
|
|||||
|
Diluted
|
432,007
|
|
455,155
|
|
481,129
|
|
|||||
|
Cash dividends declared per common share
|
$
|
1.16
|
|
$
|
1.04
|
|
$
|
.96
|
|
||
The accompanying notes are an integral part of these consolidated financial statements.
123
Consolidated Statement Of Comprehensive Income
|
Years Ended December 31,
|
2014
|
2013
|
2012
|
||||||||
|
(In millions)
|
|||||||||||
|
Net income
|
$
|
2,037
|
|
$
|
2,136
|
|
$
|
2,061
|
|
||
|
Other comprehensive income (loss), net of related taxes:
|
|||||||||||
|
Foreign currency translation, net of related taxes of ($94), ($20) and $45, respectively
|
(889
|
)
|
95
|
|
134
|
|
|||||
|
Net unrealized gains (losses) on available-for-sale securities, net of reclassification adjustment and net of related taxes of ($269), ($521) and $469, respectively
|
437
|
|
(826
|
)
|
798
|
|
|||||
|
Net unrealized gains (losses) on available-for-sale securities designated in fair value hedges, net of related taxes of ($15), $56 and $17, respectively
|
(24
|
)
|
86
|
|
27
|
|
|||||
|
Other-than-temporary impairment on held-to-maturity securities related to factors other than credit, net of related taxes of $12, $11 and $13, respectively
|
18
|
|
18
|
|
21
|
|
|||||
|
Net unrealized gains (losses) on cash flow hedges, net of related taxes of $74, $62 and $52, respectively
|
115
|
|
92
|
|
74
|
|
|||||
|
Net unrealized gains (losses) on retirement plans, net of related taxes of ($50), $71 and ($36), respectively
|
(69
|
)
|
80
|
|
(35
|
)
|
|||||
|
Other comprehensive income (loss)
|
(412
|
)
|
(455
|
)
|
1,019
|
|
|||||
|
Total comprehensive income
|
$
|
1,625
|
|
$
|
1,681
|
|
$
|
3,080
|
|
||
The accompanying notes are an integral part of these consolidated financial statements.
124
Consolidated Statement Of Condition
|
As of December 31,
|
2014
|
2013
|
|||||
|
(Dollars in millions, except per share amounts)
|
|
||||||
|
Assets:
|
|||||||
|
Cash and due from banks
|
$
|
1,855
|
|
$
|
3,220
|
|
|
|
Interest-bearing deposits with banks
|
93,523
|
|
64,257
|
|
|||
|
Securities purchased under resale agreements
|
2,390
|
|
6,230
|
|
|||
|
Trading account assets
|
924
|
|
843
|
|
|||
|
Investment securities available for sale
|
94,913
|
|
99,174
|
|
|||
|
Investment securities held to maturity (fair value of $17,842 and $17,560)
|
17,723
|
|
17,740
|
|
|||
|
Loans and leases (less allowance for losses of $38 and $28)
|
18,161
|
|
13,458
|
|
|||
|
Premises and equipment (net of accumulated depreciation of $4,599 and $4,417)
|
1,937
|
|
1,860
|
|
|||
|
Accrued interest and fees receivable
|
2,242
|
|
2,123
|
|
|||
|
Goodwill
|
5,826
|
|
6,036
|
|
|||
|
Other intangible assets
|
2,025
|
|
2,360
|
|
|||
|
Other assets
|
32,600
|
|
25,990
|
|
|||
|
Total assets
|
$
|
274,119
|
|
$
|
243,291
|
|
|
|
Liabilities:
|
|||||||
|
Deposits:
|
|||||||
|
Noninterest-bearing
|
$
|
70,490
|
|
$
|
65,614
|
|
|
|
Interest-bearing—U.S.
|
33,012
|
|
13,392
|
|
|||
|
Interest-bearing—non-U.S.
|
105,538
|
|
103,262
|
|
|||
|
Total deposits
|
209,040
|
|
182,268
|
|
|||
|
Securities sold under repurchase agreements
|
8,925
|
|
7,953
|
|
|||
|
Federal funds purchased
|
21
|
|
19
|
|
|||
|
Other short-term borrowings
|
4,381
|
|
3,780
|
|
|||
|
Accrued expenses and other liabilities
|
20,237
|
|
19,194
|
|
|||
|
Long-term debt
|
10,042
|
|
9,699
|
|
|||
|
Total liabilities
|
252,646
|
|
222,913
|
|
|||
|
Commitments, guarantees and contingencies (notes 10 and 11)
|
|
|
|||||
|
Shareholders’ equity:
|
|||||||
|
Preferred stock, no par, 3,500,000 shares authorized:
|
|||||||
|
Series C, 5,000 shares issued and outstanding
|
491
|
|
491
|
|
|||
|
Series D, 7,500 shares issued and outstanding
|
742
|
|
—
|
|
|||
|
Series E, 7,500 shares issued and outstanding
|
728
|
|
—
|
|
|||
|
Common stock, $1 par, 750,000,000 shares authorized:
|
|||||||
|
503,880,120 and 503,882,841 shares issued
|
504
|
|
504
|
|
|||
|
Surplus
|
9,791
|
|
9,776
|
|
|||
|
Retained earnings
|
14,882
|
|
13,395
|
|
|||
|
Accumulated other comprehensive income (loss)
|
(507
|
)
|
(95
|
)
|
|||
|
Treasury stock, at cost (88,684,969 and 69,754,255 shares)
|
(5,158
|
)
|
(3,693
|
)
|
|||
|
Total shareholders’ equity
|
21,473
|
|
20,378
|
|
|||
|
Total liabilities and shareholders’ equity
|
$
|
274,119
|
|
$
|
243,291
|
|
|
The accompanying notes are an integral part of these consolidated financial statements.
125
Consolidated Statement Of Changes In Shareholders' Equity
|
(Dollars in millions, except per share amounts, shares in thousands)
|
PREFERRED
STOCK
|
COMMON STOCK
|
Surplus
|
Retained
Earnings
|
Accumulated
Other
Comprehensive
Income (Loss)
|
TREASURY STOCK
|
Total
|
||||||||||||||||||||||||||
|
Shares
|
Amount
|
Shares
|
Amount
|
||||||||||||||||||||||||||||||
|
Balance as of December 31, 2011
|
$
|
500
|
|
503,966
|
|
$
|
504
|
|
$
|
9,557
|
|
$
|
10,176
|
|
$
|
(659
|
)
|
16,542
|
|
$
|
(680
|
)
|
$
|
19,398
|
|
||||||||
|
Net income
|
2,061
|
|
2,061
|
|
|||||||||||||||||||||||||||||
|
Other comprehensive income
|
1,019
|
|
1,019
|
|
|||||||||||||||||||||||||||||
|
Redemption of preferred stock
|
(500
|
)
|
(500
|
)
|
|||||||||||||||||||||||||||||
|
Preferred stock issued
|
488
|
|
488
|
|
|||||||||||||||||||||||||||||
|
Accretion of issuance costs
|
1
|
|
(1
|
)
|
—
|
|
|||||||||||||||||||||||||||
|
Cash dividends declared:
|
|||||||||||||||||||||||||||||||||
|
Common stock - $.96 per share
|
(456
|
)
|
(456
|
)
|
|||||||||||||||||||||||||||||
|
Preferred stock
|
(29
|
)
|
(29
|
)
|
|||||||||||||||||||||||||||||
|
Common stock acquired
|
33,408
|
|
(1,440
|
)
|
(1,440
|
)
|
|||||||||||||||||||||||||||
|
Common stock awards and options exercised, including related taxes of $(6)
|
(66
|
)
|
110
|
|
(4,693
|
)
|
217
|
|
327
|
|
|||||||||||||||||||||||
|
Other
|
(19
|
)
|
1
|
|
1
|
|
|||||||||||||||||||||||||||
|
Balance as of December 31, 2012
|
489
|
|
503,900
|
|
504
|
|
9,667
|
|
11,751
|
|
360
|
|
45,238
|
|
(1,902
|
)
|
20,869
|
|
|||||||||||||||
|
Net income
|
2,136
|
|
2,136
|
|
|||||||||||||||||||||||||||||
|
Other comprehensive loss
|
(455
|
)
|
(455
|
)
|
|||||||||||||||||||||||||||||
|
Accretion of issuance costs
|
2
|
|
(2
|
)
|
—
|
|
|||||||||||||||||||||||||||
|
Cash dividends declared:
|
|
|
|||||||||||||||||||||||||||||||
|
Common stock - $1.04 per share
|
(463
|
)
|
(463
|
)
|
|||||||||||||||||||||||||||||
|
Preferred stock
|
(26
|
)
|
(26
|
)
|
|||||||||||||||||||||||||||||
|
Common stock acquired
|
31,237
|
|
(2,040
|
)
|
(2,040
|
)
|
|||||||||||||||||||||||||||
|
Common stock awards and options exercised, including income tax benefit of $51
|
(17
|
)
|
113
|
|
(6,709
|
)
|
249
|
|
362
|
|
|||||||||||||||||||||||
|
Other
|
(4
|
)
|
(1
|
)
|
(12
|
)
|
(5
|
)
|
|||||||||||||||||||||||||
|
Balance as of December 31, 2013
|
491
|
|
503,883
|
|
504
|
|
9,776
|
|
13,395
|
|
(95
|
)
|
69,754
|
|
(3,693
|
)
|
20,378
|
|
|||||||||||||||
|
Net income
|
2,037
|
|
2,037
|
|
|||||||||||||||||||||||||||||
|
Other comprehensive loss
|
(412
|
)
|
(412
|
)
|
|||||||||||||||||||||||||||||
|
Preferred stock issued
|
1,470
|
|
1,470
|
|
|||||||||||||||||||||||||||||
|
Cash dividends declared:
|
|||||||||||||||||||||||||||||||||
|
Common stock - $1.16 per share
|
(490
|
)
|
(490
|
)
|
|||||||||||||||||||||||||||||
|
Preferred stock
|
(61
|
)
|
(61
|
)
|
|||||||||||||||||||||||||||||
|
Common stock acquired
|
23,749
|
|
(1,650
|
)
|
(1,650
|
)
|
|||||||||||||||||||||||||||
|
Common stock awards and options exercised, including income tax benefit of $72
|
(3
|
)
|
17
|
|
(4,805
|
)
|
185
|
|
202
|
|
|||||||||||||||||||||||
|
Other
|
(2
|
)
|
1
|
|
(13
|
)
|
(1
|
)
|
|||||||||||||||||||||||||
|
Balance as of December 31, 2014
|
$
|
1,961
|
|
503,880
|
|
$
|
504
|
|
$
|
9,791
|
|
$
|
14,882
|
|
$
|
(507
|
)
|
88,685
|
|
$
|
(5,158
|
)
|
$
|
21,473
|
|
||||||||
The accompanying condensed notes are an integral part of these consolidated financial statements.
126
|
Years Ended December 31,
|
2014
|
2013
|
2012
|
||||||||
|
(In millions)
|
|||||||||||
|
Operating Activities:
|
|||||||||||
|
Net income
|
$
|
2,037
|
|
$
|
2,136
|
|
$
|
2,061
|
|
||
|
Adjustments to reconcile net income to net cash (used in) provided by operating activities:
|
|||||||||||
|
Deferred income tax expense
|
79
|
|
62
|
|
231
|
|
|||||
|
Amortization of other intangible assets
|
222
|
|
214
|
|
198
|
|
|||||
|
Other non-cash adjustments for depreciation, amortization and accretion, net
|
477
|
|
461
|
|
291
|
|
|||||
|
(Gains) losses related to investment securities, net
|
(4
|
)
|
9
|
|
(23
|
)
|
|||||
|
Change in trading account assets, net
|
(81
|
)
|
(206
|
)
|
70
|
|
|||||
|
Change in accrued interest and fees receivable, net
|
(119
|
)
|
(153
|
)
|
(148
|
)
|
|||||
|
Change in collateral deposits, net
|
(4,362
|
)
|
(4,046
|
)
|
(1,443
|
)
|
|||||
|
Change in unrealized (gains) losses on foreign exchange derivatives, net
|
(2,042
|
)
|
(128
|
)
|
982
|
|
|||||
|
Change in other assets, net
|
3,612
|
|
(819
|
)
|
(360
|
)
|
|||||
|
Change in accrued expenses and other liabilities, net
|
(669
|
)
|
113
|
|
(250
|
)
|
|||||
|
Other, net
|
289
|
|
333
|
|
324
|
|
|||||
|
Net cash (used in) provided by operating activities
|
(561
|
)
|
(2,024
|
)
|
1,933
|
|
|||||
|
Investing Activities:
|
|||||||||||
|
Net (increase) decrease in interest-bearing deposits with banks
|
(29,266
|
)
|
(13,494
|
)
|
8,123
|
|
|||||
|
Net decrease (increase) in securities purchased under resale agreements
|
3,840
|
|
(1,214
|
)
|
2,029
|
|
|||||
|
Proceeds from sales of available-for-sale securities
|
9,766
|
|
10,261
|
|
5,399
|
|
|||||
|
Proceeds from maturities of available-for-sale securities
|
36,120
|
|
37,529
|
|
44,375
|
|
|||||
|
Purchases of available-for-sale securities
|
(43,146
|
)
|
(39,097
|
)
|
(60,812
|
)
|
|||||
|
Proceeds from maturities of held-to-maturity securities
|
3,217
|
|
2,080
|
|
3,176
|
|
|||||
|
Purchases of held-to-maturity securities
|
(3,778
|
)
|
(8,415
|
)
|
(3,577
|
)
|
|||||
|
Net increase in loans
|
(4,785
|
)
|
(1,214
|
)
|
(2,303
|
)
|
|||||
|
Business acquisitions, net of cash acquired
|
—
|
|
—
|
|
(511
|
)
|
|||||
|
Purchases of equity investments and other long-term assets
|
(182
|
)
|
(272
|
)
|
(251
|
)
|
|||||
|
Purchases of premises and equipment
|
(427
|
)
|
(388
|
)
|
(355
|
)
|
|||||
|
Other, net
|
149
|
|
139
|
|
116
|
|
|||||
|
Net cash used in investing activities
|
(28,492
|
)
|
(14,085
|
)
|
(4,591
|
)
|
|||||
|
Financing Activities:
|
|||||||||||
|
Net increase (decrease) in time deposits
|
54,404
|
|
(14,507
|
)
|
7,627
|
|
|||||
|
Net (decrease) increase in all other deposits
|
(27,632
|
)
|
32,594
|
|
(733
|
)
|
|||||
|
Net increase (decrease) in short-term borrowings
|
1,575
|
|
(1,155
|
)
|
(1,587
|
)
|
|||||
|
Proceeds from issuance of long-term debt, net of issuance costs
|
994
|
|
2,485
|
|
998
|
|
|||||
|
Payments for long-term debt and obligations under capital leases
|
(788
|
)
|
(134
|
)
|
(1,781
|
)
|
|||||
|
Proceeds from issuance of preferred stock
|
1,470
|
|
—
|
|
488
|
|
|||||
|
Proceeds from exercises of common stock options
|
14
|
|
121
|
|
53
|
|
|||||
|
Purchases of common stock
|
(1,650
|
)
|
(2,040
|
)
|
(1,440
|
)
|
|||||
|
Excess tax benefit (expense) related to stock-based compensation
|
72
|
|
50
|
|
(6
|
)
|
|||||
|
Repurchases of common stock for employee tax withholding
|
(232
|
)
|
(189
|
)
|
(101
|
)
|
|||||
|
Payments for cash dividends
|
(539
|
)
|
(486
|
)
|
(463
|
)
|
|||||
|
Net cash provided by financing activities
|
27,688
|
|
16,739
|
|
3,055
|
|
|||||
|
Net (decrease) increase
|
(1,365
|
)
|
630
|
|
397
|
|
|||||
|
Cash and due from banks at beginning of period
|
3,220
|
|
2,590
|
|
2,193
|
|
|||||
|
Cash and due from banks at end of period
|
$
|
1,855
|
|
$
|
3,220
|
|
$
|
2,590
|
|
||
|
Supplemental disclosure:
|
|||||||||||
|
Interest paid
|
$
|
398
|
|
$
|
416
|
|
$
|
516
|
|
||
|
Income taxes paid (refunded), net
|
358
|
|
406
|
|
(186
|
)
|
|||||
The accompanying notes are an integral part of these consolidated financial statements.
127
STATE STREET CORPORATION
NOTES TO CONSOLIDATED FINANCIAL STATEMENTS
Note
1
. Summary of Significant Accounting Policies
The accounting and financial reporting policies of State Street Corporation conform to U.S. generally accepted accounting principles, referred to as GAAP. State Street Corporation, the parent company, is a financial holding company headquartered in Boston, Massachusetts. Unless otherwise indicated or unless the context requires otherwise, all references in these notes to consolidated financial statements to “State Street,” “we,” “us,” “our” or similar references mean State Street Corporation and its subsidiaries on a consolidated basis. Our principal banking subsidiary is State Street Bank and Trust Company, or State Street Bank.
We have
two
lines of business:
Investment Servicing
provides services for mutual funds, collective investment funds and other investment pools, corporate and public retirement plans, insurance companies, foundations and endowments worldwide. Products include custody; product- and participant-level accounting; daily pricing and administration; master trust and master custody; record-keeping; cash management; foreign exchange, brokerage and other trading services; securities finance; deposit and short-term investment facilities; loans and lease financing; investment manager and alternative investment manager operations outsourcing; and performance, risk and compliance analytics to support institutional investors.
Investment Management
, through State Street Global Advisors, or SSGA, provides a broad array of investment management, investment research and investment advisory services to corporations, public funds and other sophisticated investors. SSGA offers active and passive asset management strategies across equity, fixed-income and cash asset classes. Products are distributed directly and through intermediaries using a variety of investment vehicles, including exchange-traded funds, or ETFs, such as the SPDR
®
ETF brand.
Basis of Presentation:
Our consolidated financial statements include the accounts of the parent company and its majority- and wholly-owned and otherwise controlled subsidiaries, including State Street Bank. All material inter-company transactions and balances have been eliminated. Certain previously reported amounts have been reclassified to conform to current-year presentation.
We consolidate subsidiaries in which we exercise control. Investments in unconsolidated
subsidiaries, recorded in other assets, generally are accounted for under the equity method of accounting if we have the ability to exercise significant influence over the operations of the investee. For investments accounted for under the equity method, our share of income or loss is recorded in processing fees and other revenue in our consolidated statement of income. Investments not meeting the criteria for equity-method treatment are accounted for under the cost method of accounting.
The preparation of consolidated financial statements in conformity with GAAP requires management to make estimates and assumptions in the application of certain of our significant accounting policies that may materially affect the reported amounts of assets, liabilities, equity, revenue, and expenses. As a result of unanticipated events or circumstances, actual results could differ from those estimates.
Foreign Currency Translation:
The assets and liabilities of our operations with functional currencies other than the U.S. dollar are translated at month-end exchange rates, and revenue and expenses are translated at rates that approximate average monthly exchange rates. Gains or losses from the translation of the net assets of subsidiaries with functional currencies other than the U.S. dollar, net of related taxes, are recorded in accumulated other comprehensive income, or AOCI, a component of shareholders’ equity.
Cash and Cash Equivalents:
For purposes of the consolidated statement of cash flows, cash and cash equivalents are defined as cash and due from banks.
Interest-Bearing Deposits with Banks:
Interest-bearing deposits with banks generally consist of highly liquid, short-term investments maintained at the Federal Reserve Bank and other non-U.S. central banks with original maturities at the time of purchase of one month or less.
Securities Purchased Under Resale Agreements and Securities Sold Under Repurchase Agreements:
Securities purchased under resale agreements and sold under repurchase agreements are treated as collateralized financing transactions, and are recorded in our consolidated statement of condition at the amounts at which the securities will be subsequently resold or repurchased, plus accrued interest. Our policy is to take possession or control of securities underlying resale agreements either
128
directly or through agent banks, allowing borrowers the right of collateral substitution and/or short-notice termination. We revalue these securities daily to determine if additional collateral is necessary from the borrower to protect us against credit exposure. We can use these securities as collateral for repurchase agreements.
For securities sold under repurchase agreements collateralized by our investment securities portfolio, the dollar value of the securities remains in investment securities in our consolidated statement of condition. Where a master netting agreement exists or both parties are members of a common clearing organization, resale and repurchase agreements with the same counterparty or clearing house and maturity date are recorded on a net basis.
Fee and Net Interest Revenue:
Fees from investment servicing, investment management, securities finance, trading services and certain types of processing fees and other revenue are recorded in our consolidated statement of income based on estimates or specific contractual terms, including mutually agreed changes to terms, as transactions occur or services are rendered, provided that persuasive evidence exists, the price to the client is fixed or determinable and collectibility is reasonably assured. Amounts accrued at period-end are recorded in accrued interest and fees receivable in our consolidated statement of condition. Performance fees generated by our investment management activities are recorded when earned, based on predetermined benchmarks associated with the applicable fund’s performance.
Interest revenue on interest-earning assets and interest expense on interest-bearing liabilities are recorded in our consolidated statement of income as components of net interest revenue, and are generally based on the effective yield of the related financial asset or liability.
Recent Accounting Developments:
In February 2015, the FASB issued an amendment to GAAP that updates the considerations on whether an entity should consolidate certain legal entities. All legal entities are subject to reevaluation under the revised consolidation model. The amendment is effective for State Street beginning on January 1, 2016, and may be applied retrospectively or via a modified retrospective approach. Early adoption is permitted. We are currently assessing the potential impact of this amendment on our consolidated financial statements.
In November 2014, the FASB issued an amendment to GAAP that allows, but does not
require, an acquired entity to apply pushdown accounting in its stand-alone financial statements upon acquisition by a new parent. The decision to apply pushdown accounting may be made independently for each change-in-control event. The new guidance was effective on November 18, 2014 and can be applied retrospectively. We will assess the need to apply pushdown accounting for future acquisitions on an individual basis, when necessary.
In November 2014, the FASB issued an amendment to GAAP that requires entities that issue or invest in hybrid instruments in the form of a share to determine the nature of the host contract by considering all stated and implied substantive terms and features of the hybrid financial instrument, including the potential outcomes of the hybrid financial instrument. Classifying the host contract as equity or debt may result in substantially different answers on whether certain features must be accounted for separately. The new guidance will require a modified retrospective application to all existing hybrid financial instruments in the form of a share, with the option of retrospective application. The amendment is effective for State Street, for the annual and interim period beginning on January 1, 2016. We have not issued and we do not currently hold any hybrid instruments within the scope of this guidance. We will assess its impact in conjunction with new transactions, as applicable.
In August 2014, the FASB issued an amendment to GAAP that requires management to evaluate whether there is substantial doubt about the entity’s ability to continue as a going concern and, if so, disclose that fact. The amendment is effective for our annual consolidated financial statements as of December 31, 2016 and interim periods thereafter. Our adoption of this amendment will not have a material effect on our consolidated financial statements.
In June 2014, the FASB issued an amendment to GAAP for “repo-to-maturity” transactions and repurchase agreements executed as repurchase financings. The amendment requires enhanced disclosure for repurchase agreements and securities lending transactions accounted for as secured borrowings and for certain transfers of financial assets. The amendment is effective for State Street beginning on January 1, 2015. Our adoption of this amendment will not have a material effect on our consolidated financial statements.
In May 2014, the FASB issued an amendment to GAAP that provides for a single comprehensive model to be applied in the accounting for revenue arising from contracts with clients. In applying this
129
model, an entity would recognize revenue that represents the transfer of promised goods or services to clients in an amount that reflects the consideration to which the entity expects to be entitled in exchange for those goods or services. The amendment supersedes most current GAAP related to revenue recognition, including industry-specific guidance. The amendment is effective for State Street beginning on January 1, 2017, and must be applied retrospectively. Early adoption is prohibited. We are currently assessing the potential impact of this amendment on our consolidated financial statements.
In April 2014, the FASB issued an amendment to GAAP that revises the criteria for the treatment and disclosure of discontinued operations. The amendment allows entities to have significant continuing involvement and continuing cash flows with the discontinued operation, but requires additional disclosure for discontinued operations and disclosure for disposals deemed to be material that do not meet the definition of a discontinued operation. The presentation and disclosure requirements are effective for State Street beginning on January 1, 2015, and are required to be applied prospectively to discontinued operations occurring after that date. We did not have any transactions that qualified as discontinued operations during the periods presented in our consolidated financial statements.
In January 2014, the FASB issued an amendment to GAAP that allows an investor in an affordable housing project, if the project meets certain defined conditions, to amortize the cost of their investment in proportion to the tax credits and other tax benefits they receive, and reflect it as part of income tax expense rather than as revenue from operations. The amendment is effective, for State Street, for interim and annual periods beginning January 1, 2015, and will not have a material effect on our consolidated financial statements.
Other Significant Policies:
The following table identifies our other significant accounting policies and the note and page where a detailed description of each policy can be found.
|
Note
|
2
|
Page
|
|||
|
Note
|
3
|
Page
|
|||
|
Note
|
4
|
Page
|
|||
|
Note
|
5
|
Page
|
|||
|
Note
|
11
|
Page
|
|||
|
Note
|
12
|
Page
|
|||
|
Note
|
14
|
Page
|
|||
|
Note
|
15
|
Page
|
|||
|
Note
|
16
|
Page
|
|||
|
Note
|
22
|
Page
|
|||
|
Note
|
23
|
Page
|
|||
Note
2
. Fair Value
Fair-Value Measurements:
We carry trading account assets, investment securities available for sale and various types of derivative financial instruments at fair value in our consolidated statement of condition on a recurring basis. Changes in the fair values of these financial assets and liabilities are recorded either as components of our consolidated statement of income or as components of accumulated other comprehensive income, or AOCI, within shareholders' equity in our consolidated statement of condition.
We measure fair value for the above-described financial assets and liabilities in conformity with GAAP that governs the measurement of the fair value of financial instruments. Management believes that its valuation techniques and underlying assumptions used to measure fair value conform to the provisions of GAAP. We categorize the financial assets and liabilities that we carry at fair value based on a prescribed three-level valuation hierarchy. The hierarchy gives the highest priority to quoted prices in active markets for identical assets or liabilities (level 1) and the lowest priority to valuation methods using significant unobservable inputs (level 3). If the inputs used to measure a financial asset or liability cross different levels of the hierarchy, categorization is based on the lowest-level input that is significant to the fair-value measurement. Management's assessment of the significance of a particular input to the overall fair-value measurement of a financial asset or liability requires judgment, and considers factors specific to that asset or liability. The three levels of the valuation hierarchy are described below.
130
Level 1. Financial assets and liabilities with values based on unadjusted quoted prices for identical assets or liabilities in an active market.
Our level-1 financial assets and liabilities primarily include positions in U.S. government securities and highly liquid U.S. and non-U.S. government fixed-income securities carried in trading account assets. We may carry U.S. government securities in our available-for-sale portfolio in connection with our asset-and-liability management activities. Our level-1 financial assets also include active exchange-traded equity securities and non-cash collateral received from counterparties in connection with our enhanced custody business.
Level 2. Financial assets and liabilities with values based on quoted prices for similar assets and liabilities in active markets, and inputs that are observable for the asset or liability, either directly or indirectly, for substantially the full term of the asset or liability.
Level-2 inputs include the following:
|
•
|
Quoted prices for similar assets or liabilities in active markets;
|
|
•
|
Quoted prices for identical or similar assets or liabilities in non-active markets;
|
|
•
|
Pricing models whose inputs are observable for substantially the full term of the asset or liability; and
|
|
•
|
Pricing models whose inputs are derived principally from, or corroborated by, observable market information through correlation or other means for substantially the full term of the asset or liability.
|
Our level-2 financial assets and liabilities primarily include non-U.S. debt securities carried in trading account assets and various types of fixed-income investment securities available-for-sale, as well as various types of foreign exchange and interest-rate derivative instruments.
Fair value for our investment securities available-for-sale categorized in level 2 is measured primarily using information obtained from independent third parties. This third-party information is subject to review by management as part of a validation process, which includes obtaining an understanding of the underlying assumptions and the level of market participant information used to support those assumptions. In addition, management compares significant assumptions used by third parties to available market information. Such information may include known trades or, to the extent that trading activity is limited, comparisons to market research information pertaining to credit expectations, execution prices and the timing of cash flows, and where information is available, back-testing.
Derivative instruments categorized in level 2 predominantly represent foreign exchange contracts used in our trading activities, for which fair value is measured using discounted cash-flow techniques, with inputs consisting of observable spot and forward points, as well as observable interest-rate curves. With respect to derivative instruments, we evaluate the impact on valuation of the credit risk of our counterparties and our own credit risk. We consider factors such as the likelihood of default by us and our counterparties, our current and potential future net exposures and remaining maturities in determining the fair value. Valuation adjustments associated with derivative instruments were not material to those instruments for the
years ended December 31, 2014, 2013 or 2012
.
Level 3. Financial assets and liabilities with values based on prices or valuation techniques that require inputs that are both unobservable in the market and significant to the overall measurement of fair value.
These inputs reflect management's judgment about the assumptions that a market participant would use in pricing the financial asset or liability, and are based on the best available information, some of which is internally developed. The following provides a more detailed discussion of our financial assets and liabilities that we may categorize in level 3 and the related valuation methodology.
|
•
|
The fair value of our investment securities categorized in level 3 is measured using information obtained from third-party sources, typically non-binding broker or dealer quotes, or through the use of internally-developed pricing models. Management has evaluated its methodologies used to measure fair value, but has considered the level of observable market information to be insufficient to categorize the securities in level 2.
|
|
•
|
The fair value of foreign exchange contracts, primarily options, is measured using an option-pricing model. Because of a limited number of observable transactions, certain model inputs are not observable, such as implied volatility surface, but are derived from observable market information.
|
|
•
|
The fair value of certain interest-rate caps with long-dated maturities is measured using a matrix-pricing approach. Observable market prices are not available for these derivatives, so extrapolation is necessary to value these instruments, since they have a strike and/or maturity outside of the matrix.
|
131
Our level-3 financial assets and liabilities are similar in structure and profile to our level-1 and level-2 financial instruments, but they trade in less liquid markets, and the measurement of their fair value is inherently more difficult. As of
December 31, 2014
, on a gross basis, we categorized in level 3 approximately
5%
of our financial assets carried at fair value on a recurring basis. As of the same date and on the same basis, the percentage of our financial liabilities categorized in level 3 to our financial liabilities carried at fair value on a recurring basis was de minimis. The fair value of investment securities categorized in level 3 that was measured using non-binding quotes and internally-developed pricing-model inputs was approximately
98%
and
2%
, respectively, of the total fair value of our investment securities categorized in level 3 as of
December 31, 2014
.
The process used to measure the fair value of our level-3 financial assets and liabilities is overseen by a valuation group within Corporate Finance, separate from the business units that manage the assets and liabilities. This function, which develops and manages the valuation process, reports to State Street's Valuation Committee. The Valuation Committee comprises senior management from separate business units, Enterprise Risk Management, a corporate risk oversight group, and Corporate Finance, and oversees adherence to State Street's valuation policies.
The valuation group performs validation of the pricing information obtained from third-party sources in order to evaluate reasonableness and consistency with market experience in similar asset classes. Monthly analyses include a review of price changes relative to overall trends, credit analysis and other relevant procedures (discussed below). In addition, prices for level-3 securities carried in our investment portfolio are tested on a sample basis based on unexpected pricing movements. These sample prices are then corroborated through price recalculations, when applicable, using available market information, which is obtained separately from the third-party pricing source. The recalculated prices are compared to market-research information pertaining to credit expectations, execution prices and the timing of cash flows, and where information is available, back-testing. If a difference is identified and it is determined that there is a significant impact requiring an adjustment, the adjustment is presented
to the Valuation Committee for review and consideration.
Validation is also performed on fair-value measurements determined using internally-developed pricing models. The pricing models are subject to validation through our Model Assessment Committee, a corporate risk oversight committee that provides technical support and input to the Valuation Committee. This validation process incorporates a review of a diverse set of model and trade parameters across a broad range of values in order to evaluate the model's suitability for valuation of a particular financial instrument type, as well as the model's accuracy in reflecting the characteristics of the related financial asset or liability and its significant risks. Inputs and assumptions, including any price-valuation adjustments, are developed by the business units and separately reviewed by the valuation group. Model valuations are compared to available market information including appropriate proxy instruments and other benchmarks to highlight abnormalities for further investigation.
Measuring fair value requires the exercise of management judgment. The level of subjectivity and the degree of management judgment required is more significant for financial instruments whose fair value is measured using inputs that are not observable. The areas requiring significant judgment are identified, documented and reported to the Valuation Committee as part of the valuation control framework. We believe that our valuation methods are appropriate; however, the use of different methodologies or assumptions, particularly as they apply to level-3 financial assets and liabilities, could materially affect our fair-value measurements as of the reporting date.
The following tables present information with respect to our financial assets and liabilities carried at fair value in our consolidated statement of condition on a recurring basis as of the dates indicated.
No
transfers of financial assets or liabilities between levels 1 and 2 occurred during
2014
or
2013
.
132
|
Fair-Value Measurements on a Recurring Basis
|
|||||||||||||||||||
|
as of December 31, 2014
|
|||||||||||||||||||
|
(In millions)
|
Quoted Market
Prices in Active
Markets
(Level 1)
|
Pricing Methods
with Significant
Observable
Market Inputs
(Level 2)
|
Pricing Methods
with Significant
Unobservable
Market Inputs
(Level 3)
|
Impact of Netting
(1)
|
Total Net
Carrying Value
in Consolidated
Statement of
Condition
|
||||||||||||||
|
Assets:
|
|||||||||||||||||||
|
Trading account assets:
|
|||||||||||||||||||
|
U.S. government securities
|
$
|
20
|
|
$
|
—
|
|
$
|
—
|
|
$
|
20
|
|
|||||||
|
Non-U.S. government securities
|
378
|
|
—
|
|
—
|
|
378
|
|
|||||||||||
|
Other
|
20
|
|
506
|
|
—
|
|
526
|
|
|||||||||||
|
Total trading account assets
|
418
|
|
506
|
|
—
|
|
924
|
|
|||||||||||
|
Investment securities available for sale:
|
|||||||||||||||||||
|
U.S. Treasury and federal agencies:
|
|||||||||||||||||||
|
Direct obligations
|
10,056
|
|
599
|
|
—
|
|
10,655
|
|
|||||||||||
|
Mortgage-backed securities
|
—
|
|
20,714
|
|
—
|
|
20,714
|
|
|||||||||||
|
Asset-backed securities:
|
|||||||||||||||||||
|
Student loans
|
—
|
|
12,201
|
|
259
|
|
12,460
|
|
|||||||||||
|
Credit cards
|
—
|
|
3,053
|
|
—
|
|
3,053
|
|
|||||||||||
|
Sub-prime
|
—
|
|
951
|
|
—
|
|
951
|
|
|||||||||||
|
Other
(2)
|
—
|
|
365
|
|
3,780
|
|
4,145
|
|
|||||||||||
|
Total asset-backed securities
|
—
|
|
16,570
|
|
4,039
|
|
|
20,609
|
|
||||||||||
|
Non-U.S. debt securities:
|
|||||||||||||||||||
|
Mortgage-backed securities
|
—
|
|
9,606
|
|
—
|
|
9,606
|
|
|||||||||||
|
Asset-backed securities
|
—
|
|
2,931
|
|
295
|
|
3,226
|
|
|||||||||||
|
Government securities
|
—
|
|
3,909
|
|
—
|
|
3,909
|
|
|||||||||||
|
Other
(3)
|
—
|
|
5,057
|
|
371
|
|
5,428
|
|
|||||||||||
|
Total non-U.S. debt securities
|
—
|
|
21,503
|
|
666
|
|
22,169
|
|
|||||||||||
|
State and political subdivisions
|
—
|
|
10,782
|
|
38
|
|
10,820
|
|
|||||||||||
|
Collateralized mortgage obligations
|
—
|
|
4,725
|
|
614
|
|
5,339
|
|
|||||||||||
|
Other U.S. debt securities
|
—
|
|
4,100
|
|
9
|
|
4,109
|
|
|||||||||||
|
U.S. equity securities
|
—
|
|
39
|
|
—
|
|
39
|
|
|||||||||||
|
Non-U.S. equity securities
|
—
|
|
2
|
|
—
|
|
2
|
|
|||||||||||
|
U.S. money-market mutual funds
|
—
|
|
449
|
|
—
|
|
449
|
|
|||||||||||
|
Non-U.S. money-market mutual funds
|
—
|
|
8
|
|
—
|
|
8
|
|
|||||||||||
|
Total investment securities available for sale
|
10,056
|
|
79,491
|
|
5,366
|
|
|
94,913
|
|
||||||||||
|
Other assets:
|
|||||||||||||||||||
|
Derivative instruments:
|
|||||||||||||||||||
|
Foreign exchange contracts
|
—
|
|
15,054
|
|
81
|
|
$
|
(7,211
|
)
|
7,924
|
|
||||||||
|
Interest-rate contracts
|
—
|
|
77
|
|
—
|
|
(68
|
)
|
9
|
|
|||||||||
|
Other derivative contracts
|
—
|
|
2
|
|
—
|
|
(1
|
)
|
1
|
|
|||||||||
|
Total derivative instruments
|
—
|
|
15,133
|
|
81
|
|
(7,280
|
)
|
7,934
|
|
|||||||||
|
Total assets carried at fair value
|
$
|
10,474
|
|
$
|
95,130
|
|
$
|
5,447
|
|
$
|
(7,280
|
)
|
$
|
103,771
|
|
||||
|
Liabilities:
|
|||||||||||||||||||
|
Accrued expenses and other liabilities:
|
|||||||||||||||||||
|
Derivative instruments:
|
|||||||||||||||||||
|
Foreign exchange contracts
|
—
|
|
14,851
|
|
74
|
|
(8,879
|
)
|
$
|
6,046
|
|
||||||||
|
Interest-rate contracts
|
—
|
|
239
|
|
—
|
|
(46
|
)
|
193
|
|
|||||||||
|
Other derivative contracts
|
—
|
|
61
|
|
9
|
|
(1
|
)
|
69
|
|
|||||||||
|
Total derivative instruments
|
—
|
|
15,151
|
|
83
|
|
(8,926
|
)
|
6,308
|
|
|||||||||
|
Total liabilities carried at fair value
|
$
|
—
|
|
$
|
15,151
|
|
$
|
83
|
|
$
|
(8,926
|
)
|
$
|
6,308
|
|
||||
(1)
Represents counterparty netting against level-2 financial assets and liabilities, where a legally enforceable master netting agreement exists between State Street and the counterparty. Netting also reflects asset and liability reductions of
$983 million
and
$2.63 billion
, respectively, for cash collateral received from and provided to derivative counterparties.
(2)
As of
December 31, 2014
the fair value of other asset-backed securities was composed primarily of
$3.8 billion
of collateralized loan obligations and approximately
$315 million
of automobile loan securities.
(3)
As of
December 31, 2014
the fair value of other non-U.S. debt securities was composed primarily of
$3.3 billion
of covered bonds and
$1.2 billion
of corporate bonds.
133
|
Fair-Value Measurements on a Recurring Basis
|
|||||||||||||||||||
|
as of December 31, 2013
|
|||||||||||||||||||
|
(In millions)
|
Quoted Market
Prices in Active
Markets
(Level 1)
|
Pricing Methods
with Significant
Observable
Market Inputs
(Level 2)
|
Pricing Methods
with Significant
Unobservable
Market Inputs
(Level 3)
|
Impact of Netting
(1)
|
Total Net
Carrying Value
in Consolidated
Statement of
Condition
|
||||||||||||||
|
Assets:
|
|||||||||||||||||||
|
Trading account assets:
|
|||||||||||||||||||
|
U.S. government securities
|
$
|
20
|
|
$
|
—
|
|
$
|
—
|
|
$
|
20
|
|
|||||||
|
Non-U.S. government securities
|
399
|
|
—
|
|
—
|
|
399
|
|
|||||||||||
|
Other
|
67
|
|
357
|
|
—
|
|
424
|
|
|||||||||||
|
Total trading account assets
|
486
|
|
357
|
|
—
|
|
843
|
|
|||||||||||
|
Investment securities available for sale:
|
|||||||||||||||||||
|
U.S. Treasury and federal agencies:
|
|||||||||||||||||||
|
Direct obligations
|
—
|
|
709
|
|
—
|
|
709
|
|
|||||||||||
|
Mortgage-backed securities
|
—
|
|
22,847
|
|
716
|
|
23,563
|
|
|||||||||||
|
Asset-backed securities:
|
|||||||||||||||||||
|
Student loans
|
—
|
|
14,119
|
|
423
|
|
14,542
|
|
|||||||||||
|
Credit cards
|
—
|
|
8,186
|
|
24
|
|
8,210
|
|
|||||||||||
|
Sub-prime
|
—
|
|
1,203
|
|
—
|
|
1,203
|
|
|||||||||||
|
Other
(2)
|
—
|
|
532
|
|
4,532
|
|
5,064
|
|
|||||||||||
|
Total asset-backed securities
|
—
|
|
24,040
|
|
4,979
|
|
29,019
|
|
|||||||||||
|
Non-U.S. debt securities:
|
|||||||||||||||||||
|
Mortgage-backed securities
|
—
|
|
10,654
|
|
375
|
|
11,029
|
|
|||||||||||
|
Asset-backed securities
|
—
|
|
4,592
|
|
798
|
|
5,390
|
|
|||||||||||
|
Government securities
|
—
|
|
3,761
|
|
—
|
|
3,761
|
|
|||||||||||
|
Other
(3)
|
—
|
|
4,263
|
|
464
|
|
4,727
|
|
|||||||||||
|
Total non-U.S. debt securities
|
—
|
|
23,270
|
|
1,637
|
|
24,907
|
|
|||||||||||
|
State and political subdivisions
|
—
|
|
10,220
|
|
43
|
|
10,263
|
|
|||||||||||
|
Collateralized mortgage obligations
|
—
|
|
5,107
|
|
162
|
|
5,269
|
|
|||||||||||
|
Other U.S. debt securities
|
—
|
|
4,972
|
|
8
|
|
4,980
|
|
|||||||||||
|
U.S. equity securities
|
—
|
|
34
|
|
—
|
|
34
|
|
|||||||||||
|
Non-U.S. equity securities
|
—
|
|
1
|
|
—
|
|
1
|
|
|||||||||||
|
U.S. money-market mutual funds
|
—
|
|
422
|
|
—
|
|
422
|
|
|||||||||||
|
Non-U.S. money-market mutual funds
|
—
|
|
7
|
|
—
|
|
7
|
|
|||||||||||
|
Total investment securities available for sale
|
—
|
|
91,629
|
|
7,545
|
|
99,174
|
|
|||||||||||
|
Other assets:
|
|||||||||||||||||||
|
Derivatives instruments:
|
|||||||||||||||||||
|
Foreign exchange contracts
|
—
|
|
11,892
|
|
19
|
|
$
|
(6,442
|
)
|
5,469
|
|
||||||||
|
Interest-rate contracts
|
—
|
|
65
|
|
—
|
|
(59
|
)
|
6
|
|
|||||||||
|
Other derivative contracts
|
—
|
|
1
|
|
—
|
|
—
|
|
1
|
|
|||||||||
|
Total derivative instruments
|
—
|
|
11,958
|
|
19
|
|
(6,501
|
)
|
5,476
|
|
|||||||||
|
Other
|
97
|
|
—
|
|
—
|
|
—
|
|
97
|
|
|||||||||
|
Total assets carried at fair value
|
$
|
583
|
|
$
|
103,944
|
|
$
|
7,564
|
|
$
|
(6,501
|
)
|
$
|
105,590
|
|
||||
|
Liabilities:
|
|||||||||||||||||||
|
Accrued expenses and other liabilities:
|
|||||||||||||||||||
|
Derivative instruments:
|
|||||||||||||||||||
|
Foreign exchange contracts
|
$
|
—
|
|
$
|
11,454
|
|
$
|
17
|
|
$
|
(5,458
|
)
|
$
|
6,013
|
|
||||
|
Interest-rate contracts
|
—
|
|
331
|
|
—
|
|
(94
|
)
|
237
|
|
|||||||||
|
Other derivative contracts
|
—
|
|
—
|
|
9
|
|
—
|
|
9
|
|
|||||||||
|
Total derivative instruments
|
—
|
|
11,785
|
|
26
|
|
(5,552
|
)
|
6,259
|
|
|||||||||
|
Other
|
97
|
|
—
|
|
—
|
|
—
|
|
97
|
|
|||||||||
|
Total liabilities carried at fair value
|
$
|
97
|
|
$
|
11,785
|
|
$
|
26
|
|
$
|
(5,552
|
)
|
$
|
6,356
|
|
||||
(1)
Represents counterparty netting against level-2 financial assets and liabilities, where a legally enforceable master netting agreement exists between State Street and the counterparty. Netting also reflects asset and liability reductions of
$1.93 billion
and
$979 million
, respectively, for cash collateral received from and provided to derivative counterparties.
(2)
As of
December 31, 2013
, the fair value of other asset-backed securities was composed primarily of
$4.5 billion
of collateralized loan obligations and approximately
$470 million
of automobile loan securities.
(3)
As of
December 31, 2013
, the fair value of other non-U.S. debt securities was composed primarily of
$2.3 billion
of covered bonds and
$1.4 billion
of corporate bonds.
134
The following tables present activity related to our level-3 financial assets and liabilities during the
years ended
December 31, 2014
and
2013
, respectively. Transfers into and out of level 3 are reported as of the beginning of the period presented. During the
years ended
December 31, 2014
and
2013
, transfers out of level 3 were mainly related to certain mortgage- and asset-backed securities, including non-U.S. debt securities, for which fair value was measured using prices for which observable market information became available.
|
Fair Value Measurements Using Significant Unobservable Inputs
|
|||||||||||||||||||||||||||||||||||||||
|
|
Year Ended December 31, 2014
|
||||||||||||||||||||||||||||||||||||||
|
|
Fair Value as of
December 31, 2013 |
Total Realized and
Unrealized Gains (Losses) |
Purchases
|
Sales
|
Settlements
|
Transfers
into Level 3 |
Transfers
out of Level 3 |
Fair Value as of
December 31, 2014 |
Change in
Unrealized Gains (Losses) Related to Financial Instruments Held as of December 31, 2014 |
||||||||||||||||||||||||||||||
|
(In millions)
|
Recorded
in
Revenue
|
Recorded
in Other
Comprehensive
Income
|
|||||||||||||||||||||||||||||||||||||
|
Assets:
|
|||||||||||||||||||||||||||||||||||||||
|
Investment securities available for sale:
|
|||||||||||||||||||||||||||||||||||||||
|
U.S. Treasury and federal agencies, mortgage-backed securities
|
$
|
716
|
|
$
|
—
|
|
$
|
—
|
|
$
|
168
|
|
$
|
—
|
|
$
|
(14
|
)
|
$
|
—
|
|
$
|
(870
|
)
|
$
|
—
|
|
||||||||||||
|
Asset-backed securities:
|
|||||||||||||||||||||||||||||||||||||||
|
Student loans
|
423
|
|
2
|
|
1
|
|
24
|
|
(75
|
)
|
(37
|
)
|
—
|
|
(79
|
)
|
259
|
|
|||||||||||||||||||||
|
Credit cards
|
24
|
|
—
|
|
—
|
|
—
|
|
—
|
|
(24
|
)
|
—
|
|
—
|
|
—
|
|
|||||||||||||||||||||
|
Other
|
4,532
|
|
65
|
|
(28
|
)
|
282
|
|
—
|
|
(1,071
|
)
|
—
|
|
—
|
|
3,780
|
|
|||||||||||||||||||||
|
Total asset-backed securities
|
4,979
|
|
67
|
|
(27
|
)
|
306
|
|
(75
|
)
|
(1,132
|
)
|
—
|
|
(79
|
)
|
4,039
|
|
|||||||||||||||||||||
|
Non-U.S. debt securities:
|
|||||||||||||||||||||||||||||||||||||||
|
Mortgage-backed securities
|
375
|
|
—
|
|
—
|
|
—
|
|
—
|
|
—
|
|
—
|
|
(375
|
)
|
—
|
|
|||||||||||||||||||||
|
Asset-backed securities
|
798
|
|
6
|
|
(1
|
)
|
—
|
|
—
|
|
(272
|
)
|
76
|
|
(312
|
)
|
295
|
|
|||||||||||||||||||||
|
Other
|
464
|
|
—
|
|
1
|
|
55
|
|
(1
|
)
|
(41
|
)
|
85
|
|
(192
|
)
|
371
|
|
|||||||||||||||||||||
|
Total non-U.S. debt securities
|
1,637
|
|
6
|
|
—
|
|
55
|
|
(1
|
)
|
(313
|
)
|
161
|
|
(879
|
)
|
666
|
|
|||||||||||||||||||||
|
State and political subdivisions
|
43
|
|
1
|
|
(3
|
)
|
—
|
|
—
|
|
(3
|
)
|
—
|
|
—
|
|
38
|
|
|||||||||||||||||||||
|
Collateralized mortgage obligations
|
162
|
|
—
|
|
1
|
|
633
|
|
(6
|
)
|
(32
|
)
|
—
|
|
(144
|
)
|
614
|
|
|||||||||||||||||||||
|
Other U.S. debt securities
|
8
|
|
—
|
|
1
|
|
—
|
|
—
|
|
—
|
|
—
|
|
—
|
|
9
|
|
|||||||||||||||||||||
|
Total investment securities available for sale
|
7,545
|
|
74
|
|
(28
|
)
|
1,162
|
|
(82
|
)
|
(1,494
|
)
|
161
|
|
(1,972
|
)
|
5,366
|
|
|||||||||||||||||||||
|
Other assets:
|
|||||||||||||||||||||||||||||||||||||||
|
Derivative instruments:
|
|||||||||||||||||||||||||||||||||||||||
|
Derivative instruments, Foreign exchange contracts
|
19
|
|
36
|
|
—
|
|
36
|
|
—
|
|
(10
|
)
|
—
|
|
—
|
|
81
|
|
$
|
44
|
|
||||||||||||||||||
|
Total derivative instruments
|
19
|
|
36
|
|
—
|
|
36
|
|
—
|
|
(10
|
)
|
—
|
|
—
|
|
81
|
|
44
|
|
|||||||||||||||||||
|
Total assets carried at fair value
|
$
|
7,564
|
|
$
|
110
|
|
$
|
(28
|
)
|
$
|
1,198
|
|
$
|
(82
|
)
|
$
|
(1,504
|
)
|
$
|
161
|
|
$
|
(1,972
|
)
|
$
|
5,447
|
|
$
|
44
|
|
|||||||||
|
Fair-Value Measurements Using Significant Unobservable Inputs
|
|||||||||||||||||||||||
|
|
Year Ended December 31, 2014
|
||||||||||||||||||||||
|
|
Fair Value as of
December 31, 2013 |
Total Realized and
Unrealized (Gains) Losses |
Issuances
|
Settlements
|
Fair Value as of
December 31, 2014 (1) |
Change in
Unrealized (Gains) Losses Related to Financial Instruments Held as of December 31, 2014 |
|||||||||||||||||
|
(In millions)
|
Recorded
in Revenue |
||||||||||||||||||||||
|
Liabilities:
|
|||||||||||||||||||||||
|
Accrued expenses and other liabilities:
|
|||||||||||||||||||||||
|
Derivative instruments:
|
|||||||||||||||||||||||
|
Foreign exchange contracts
|
$
|
17
|
|
$
|
25
|
|
$
|
39
|
|
$
|
(7
|
)
|
$
|
74
|
|
$
|
35
|
|
|||||
|
Other
|
9
|
|
—
|
|
—
|
|
—
|
|
9
|
|
—
|
|
|||||||||||
|
Total derivative instruments
|
26
|
|
25
|
|
39
|
|
(7
|
)
|
83
|
|
35
|
|
|||||||||||
|
Total liabilities carried at fair value
|
$
|
26
|
|
$
|
25
|
|
$
|
39
|
|
$
|
(7
|
)
|
$
|
83
|
|
$
|
35
|
|
|||||
135
(1)
There were no transfers of liabilities into or out of level 3 during the
year ended December 31, 2014
.
|
Fair-Value Measurements Using Significant Unobservable Inputs
|
|||||||||||||||||||||||||||||||||||||||
|
|
Year Ended December 31, 2013
|
||||||||||||||||||||||||||||||||||||||
|
|
Fair Value as of December 31,
2012 |
Total Realized and
Unrealized Gains (Losses) |
Purchases
|
Sales
|
Settlements
|
Transfers
into Level 3 |
Transfers
out of Level 3 |
Fair Value as of
December 31, 2013 |
Change in
Unrealized Gains (Losses) Related to Financial Instruments Held as of December 31, 2013 |
||||||||||||||||||||||||||||||
|
(In millions)
|
Recorded
in
Revenue
|
Recorded
in Other
Comprehensive
Income
|
|||||||||||||||||||||||||||||||||||||
|
Assets:
|
|||||||||||||||||||||||||||||||||||||||
|
Investment securities available for sale:
|
|||||||||||||||||||||||||||||||||||||||
|
U.S. Treasury and federal agencies, mortgage-backed securities
|
$
|
825
|
|
$
|
—
|
|
$
|
—
|
|
$
|
92
|
|
$
|
—
|
|
$
|
(109
|
)
|
$
|
—
|
|
$
|
(92
|
)
|
$
|
716
|
|
||||||||||||
|
Asset-backed securities:
|
|||||||||||||||||||||||||||||||||||||||
|
Student loans
|
588
|
|
2
|
|
12
|
|
79
|
|
(26
|
)
|
(31
|
)
|
—
|
|
(201
|
)
|
423
|
|
|||||||||||||||||||||
|
Credit cards
|
67
|
|
—
|
|
—
|
|
—
|
|
—
|
|
(43
|
)
|
—
|
|
—
|
|
24
|
|
|||||||||||||||||||||
|
Other
|
3,994
|
|
53
|
|
9
|
|
1,721
|
|
(34
|
)
|
(1,188
|
)
|
—
|
|
(23
|
)
|
4,532
|
|
|||||||||||||||||||||
|
Total asset-backed securities
|
4,649
|
|
55
|
|
21
|
|
1,800
|
|
(60
|
)
|
(1,262
|
)
|
—
|
|
(224
|
)
|
4,979
|
|
|||||||||||||||||||||
|
Non-U.S. debt securities:
|
|||||||||||||||||||||||||||||||||||||||
|
Mortgage-backed securities
|
555
|
|
—
|
|
(1
|
)
|
33
|
|
—
|
|
(4
|
)
|
—
|
|
(208
|
)
|
375
|
|
|||||||||||||||||||||
|
Asset-backed securities
|
524
|
|
5
|
|
3
|
|
531
|
|
—
|
|
(142
|
)
|
160
|
|
(283
|
)
|
798
|
|
|||||||||||||||||||||
|
Other
|
140
|
|
—
|
|
1
|
|
397
|
|
—
|
|
20
|
|
—
|
|
(94
|
)
|
464
|
|
|||||||||||||||||||||
|
Total non-U.S. debt securities
|
1,219
|
|
5
|
|
|
3
|
|
|
961
|
|
|
—
|
|
|
(126
|
)
|
|
160
|
|
(585
|
)
|
1,637
|
|
||||||||||||||||
|
State and political subdivisions
|
48
|
|
1
|
|
(2
|
)
|
—
|
|
—
|
|
(4
|
)
|
—
|
|
—
|
|
43
|
|
|||||||||||||||||||||
|
Collateralized mortgage obligations
|
117
|
|
1
|
|
(5
|
)
|
218
|
|
—
|
|
(39
|
)
|
14
|
|
(144
|
)
|
162
|
|
|||||||||||||||||||||
|
Other U.S. debt securities
|
9
|
|
—
|
|
(1
|
)
|
—
|
|
—
|
|
—
|
|
—
|
|
—
|
|
8
|
|
|||||||||||||||||||||
|
Total investment securities available for sale
|
6,867
|
|
62
|
|
16
|
|
3,071
|
|
(60
|
)
|
(1,540
|
)
|
174
|
|
(1,045
|
)
|
7,545
|
|
|||||||||||||||||||||
|
Other assets:
|
|||||||||||||||||||||||||||||||||||||||
|
Derivative instruments:
|
|||||||||||||||||||||||||||||||||||||||
|
Derivative instruments, Foreign exchange contracts
|
113
|
|
103
|
|
—
|
|
20
|
|
—
|
|
(217
|
)
|
—
|
|
—
|
|
19
|
|
$
|
(2
|
)
|
||||||||||||||||||
|
Total derivative instruments
|
113
|
|
103
|
|
—
|
|
20
|
|
—
|
|
(217
|
)
|
—
|
|
—
|
|
19
|
|
(2
|
)
|
|||||||||||||||||||
|
Total assets carried at fair value
|
$
|
6,980
|
|
$
|
165
|
|
$
|
16
|
|
$
|
3,091
|
|
$
|
(60
|
)
|
$
|
(1,757
|
)
|
$
|
174
|
|
$
|
(1,045
|
)
|
$
|
7,564
|
|
$
|
(2
|
)
|
|||||||||
|
Fair-Value Measurements Using Significant Unobservable Inputs
|
|||||||||||||||||||||||
|
|
Year Ended December 31, 2013
|
||||||||||||||||||||||
|
|
Fair Value as of December 31,
2012 |
Total Realized and
Unrealized (Gains) Losses |
Issuances
|
Settlements
|
Fair Value as of
December 31, 2013 (1) |
Change in
Unrealized (Gains) Losses Related to Financial Instruments Held as of December 31, 2013 |
|||||||||||||||||
|
(In millions)
|
Recorded
in Revenue |
||||||||||||||||||||||
|
Liabilities:
|
|||||||||||||||||||||||
|
Accrued expenses and other liabilities:
|
|||||||||||||||||||||||
|
Derivative instruments:
|
|||||||||||||||||||||||
|
Foreign exchange contracts
|
$
|
106
|
|
$
|
40
|
|
$
|
18
|
|
$
|
(147
|
)
|
$
|
17
|
|
$
|
(1
|
)
|
|||||
|
Other
|
9
|
|
—
|
|
—
|
|
—
|
|
9
|
|
—
|
|
|||||||||||
|
Total derivative instruments
|
115
|
|
40
|
|
18
|
|
(147
|
)
|
26
|
|
(1
|
)
|
|||||||||||
|
Total liabilities carried at fair value
|
$
|
115
|
|
$
|
40
|
|
$
|
18
|
|
$
|
(147
|
)
|
$
|
26
|
|
$
|
(1
|
)
|
|||||
(1)
There were no transfers of liabilities into or out of level 3 during the
year ended December 31, 2013
.
The following table presents total realized and unrealized gains and losses for our level-3 financial assets and liabilities and where they are presented in our consolidated statement of income for the years indicated:
136
|
|
Years Ended December 31,
|
||||||||||||||||||||||
|
Total Realized and
Unrealized Gains (Losses) Recorded in Revenue |
Change in
Unrealized Gains (Losses) Related to Financial Instruments Held as of December 31, |
||||||||||||||||||||||
|
(In millions)
|
2014
|
2013
|
2012
|
2014
|
2013
|
2012
|
|||||||||||||||||
|
Fee revenue:
|
|||||||||||||||||||||||
|
Trading services
|
$
|
11
|
|
$
|
63
|
|
$
|
9
|
|
$
|
9
|
|
$
|
(1
|
)
|
$
|
3
|
|
|||||
|
Total fee revenue
|
11
|
|
63
|
|
9
|
|
9
|
|
(1
|
)
|
3
|
|
|||||||||||
|
Net interest revenue
|
74
|
|
62
|
|
420
|
|
—
|
|
—
|
|
—
|
|
|||||||||||
|
Total revenue
|
$
|
85
|
|
$
|
125
|
|
$
|
429
|
|
$
|
9
|
|
$
|
(1
|
)
|
$
|
3
|
|
|||||
137
The following table presents quantitative information, as of the dates indicated, about the valuation techniques and significant unobservable inputs used in the valuation of our level-3 financial assets and liabilities measured at fair value on a recurring basis for which we use internally-developed pricing models. The significant unobservable inputs for our level-3 financial assets and liabilities whose fair value is measured using pricing information from non-binding broker or dealer quotes are not included in the table, as the specific inputs applied are not provided by the broker/dealer.
|
|
Quantitative Information about Level-3 Fair-Value Measurements
|
|||||||||||||||||
|
Fair Value
|
Weighted-Average
|
|||||||||||||||||
|
(Dollars in millions)
|
As of December 31, 2014
|
As of December 31, 2013
|
Valuation Technique
|
Significant
Unobservable Input (2) |
As of December 31, 2014
|
As of December 31, 2013
|
||||||||||||
|
Significant unobservable inputs readily available to State Street:
|
||||||||||||||||||
|
Assets:
|
|
|
|
|
||||||||||||||
|
Asset-backed securities, student loans
|
$
|
—
|
|
$
|
13
|
|
Discounted cash flows
|
Credit spread
|
—
|
%
|
3.5
|
%
|
||||||
|
Asset-backed securities, credit cards
|
—
|
|
24
|
|
Discounted cash flows
|
Credit spread
|
—
|
|
2.0
|
|
||||||||
|
Asset-backed securities, other
|
59
|
|
92
|
|
Discounted cash flows
|
Credit spread
|
0.2
|
|
1.5
|
|
||||||||
|
State and political subdivisions
|
38
|
|
43
|
|
Discounted cash flows
|
Credit spread
|
2.1
|
|
1.7
|
|
||||||||
|
Derivative instruments, foreign exchange contracts
|
81
|
|
19
|
|
Option model
|
Volatility
|
9.1
|
|
11.4
|
|
||||||||
|
Total
|
$
|
178
|
|
$
|
191
|
|
||||||||||||
|
Liabilities:
|
||||||||||||||||||
|
Derivative instruments, foreign exchange contracts
|
$
|
74
|
|
$
|
17
|
|
Option model
|
Volatility
|
9.0
|
|
11.2
|
|
||||||
|
Derivative instruments, other
(1)
|
9
|
|
9
|
|
Discounted cash flows
|
Participant redemptions
|
5.2
|
|
7.5
|
|
||||||||
|
Total
|
$
|
83
|
|
$
|
26
|
|
||||||||||||
(1)
Relates to stable value wrap contracts; refer to the sensitivity discussion following the tables presented below, and to note
10
.
(2)
Significant changes in these unobservable inputs would result in significant changes in fair value measure.
The following tables present information with respect to the composition of our level-3 financial assets and liabilities, by availability of significant unobservable inputs, as of the dates indicated:
|
December 31, 2014
|
Significant Unobservable Inputs Readily Available to State Street
(1)
|
Significant Unobservable Inputs Not Developed by State Street and Not Readily Available
(2)
|
Total Assets and Liabilities with Significant Unobservable Inputs
|
|||||||||
|
(In millions)
|
||||||||||||
|
Assets:
|
||||||||||||
|
Asset-backed securities, student loans
|
$
|
—
|
|
$
|
259
|
|
$
|
259
|
|
|||
|
Asset-backed securities, other
|
59
|
|
3,721
|
|
3,780
|
|
||||||
|
Non-U.S. debt securities, asset-backed securities
|
—
|
|
295
|
|
295
|
|
||||||
|
Non-U.S. debt securities, other
|
—
|
|
371
|
|
371
|
|
||||||
|
State and political subdivisions
|
38
|
|
—
|
|
38
|
|
||||||
|
Collateralized mortgage obligations
|
—
|
|
614
|
|
614
|
|
||||||
|
Other U.S. debt securities
|
—
|
|
9
|
|
9
|
|
||||||
|
Derivative instruments, foreign exchange contracts
|
81
|
|
—
|
|
81
|
|
||||||
|
Total
|
$
|
178
|
|
$
|
5,269
|
|
$
|
5,447
|
|
|||
|
Liabilities:
|
||||||||||||
|
Derivative instruments, foreign exchange contracts
|
$
|
74
|
|
$
|
—
|
|
$
|
74
|
|
|||
|
Derivative instruments, other
|
9
|
|
—
|
|
9
|
|
||||||
|
Total
|
$
|
83
|
|
$
|
—
|
|
$
|
83
|
|
|||
(1)
Information with respect to these model-priced financial assets and liabilities is provided above in a separate table.
(2)
Fair value for these financial assets is measured using non-binding broker or dealer quotes.
138
|
December 31, 2013
|
Significant Unobservable Inputs Readily Available to State Street
(1)
|
Significant Unobservable Inputs Not Developed by State Street and Not Readily Available
(2)
|
Total Assets and Liabilities with Significant Unobservable Inputs
|
|||||||||
|
(In millions)
|
||||||||||||
|
Assets:
|
||||||||||||
|
U.S. Treasury and federal agencies, mortgage-backed securities
|
$
|
—
|
|
$
|
716
|
|
$
|
716
|
|
|||
|
Asset-backed securities, student loans
|
13
|
|
410
|
|
423
|
|
||||||
|
Asset-backed securities, credit cards
|
24
|
|
—
|
|
24
|
|
||||||
|
Asset-backed securities, other
|
92
|
|
4,440
|
|
4,532
|
|
||||||
|
Non-U.S. debt securities, mortgage-backed securities
|
—
|
|
375
|
|
375
|
|
||||||
|
Non-U.S. debt securities, asset-backed securities
|
—
|
|
798
|
|
798
|
|
||||||
|
Non-U.S. debt securities, other
|
—
|
|
464
|
|
464
|
|
||||||
|
State and political subdivisions
|
43
|
|
—
|
|
43
|
|
||||||
|
Collateralized mortgage obligations
|
—
|
|
162
|
|
162
|
|
||||||
|
Other U.S. debt securities
|
—
|
|
8
|
|
8
|
|
||||||
|
Derivative instruments, foreign exchange contracts
|
19
|
|
—
|
|
19
|
|
||||||
|
Total
|
$
|
191
|
|
$
|
7,373
|
|
$
|
7,564
|
|
|||
|
Liabilities:
|
||||||||||||
|
Derivative instruments, foreign exchange contracts
|
$
|
17
|
|
$
|
—
|
|
$
|
17
|
|
|||
|
Derivative instruments, other
|
9
|
|
—
|
|
9
|
|
||||||
|
Total
|
$
|
26
|
|
$
|
—
|
|
$
|
26
|
|
|||
(1)
Information with respect to these model-priced financial assets and liabilities is provided above in a separate table.
(2)
Fair value for these financial assets is measured using non-binding broker or dealer quotes.
We use internally-developed pricing models that incorporate discounted cash flow and option model techniques to measure the fair value of our level-3 financial assets and liabilities. Use of these techniques requires the determination of relevant inputs and assumptions, some of which represent significant unobservable inputs as indicated in the preceding table. Accordingly, changes in these unobservable inputs may have a significant impact on fair value.
Certain of these unobservable inputs will, in isolation, have a directionally consistent impact on the fair value of the instrument for a given change in that input. Alternatively, the fair value of the instrument may move in an opposite direction for a given change in another input. Where multiple inputs are used within the valuation technique of an asset or liability, a change in one input in a certain direction may be offset by an opposite change in another input, resulting in a potentially muted impact on the overall fair value of that particular instrument. Additionally, a change in one unobservable input may result in a change to another unobservable input (that is, changes in certain inputs are interrelated to one another), which may counteract or magnify the fair-value impact.
Fair Value Estimates:
Estimates of fair value for financial instruments not carried at fair value on a recurring basis in our consolidated statement of condition are generally subjective in nature, and are determined as of a specific point in time based on the characteristics of the financial instruments and relevant market information. Disclosure of fair-value estimates is not required by GAAP for certain items, such as lease financing, equity-method investments, obligations for pension and other post-retirement plans, premises and equipment, other intangible assets and income-tax assets and liabilities. Accordingly, aggregate fair-value estimates presented do not purport to represent, and should not be considered representative of, our underlying “market” or franchise value. In addition, because of potential differences in methodologies and assumptions used to estimate fair values, our estimates of fair value should not be compared to those of other financial institutions.
We use the following methods to estimate the fair values of our financial instruments:
|
•
|
For financial instruments that have quoted market prices, those quoted prices are used to estimate fair value.
|
|
•
|
For financial instruments that have no defined maturity, have a remaining maturity of 180 days or less, or reprice frequently to a market rate, we assume that the fair value of these
|
139
instruments approximates their reported value, after taking into consideration any applicable credit risk.
|
•
|
For financial instruments for which no quoted market prices are available, fair value is estimated using information obtained from independent third parties, or by discounting the expected cash flows using an estimated current market interest rate for the financial instrument.
|
The generally short duration of certain of our assets and liabilities results in a significant number of financial instruments for which fair value equals or closely approximates the amount recorded in our consolidated statement of condition. These financial instruments are reported in the following captions in our consolidated statement of condition: cash and due from banks; interest-bearing deposits with banks; securities purchased under resale agreements; accrued interest and fees receivable; deposits; securities sold under repurchase agreements; federal funds purchased; and other short-term borrowings.
In addition, due to the relatively short duration of certain of our net loans (excluding leases), we consider fair value for these loans to approximate their reported value. The fair value of other types of loans, such as senior secured bank loans, commercial real estate loans, purchased receivables and municipal loans is estimated using information obtained from independent third parties or by discounting expected future cash flows using current rates at which similar loans would be made to borrowers with similar credit ratings for the same remaining maturities. Commitments to lend have no reported value because their terms are at prevailing market rates.
The following tables present the reported amounts and estimated fair values of the financial assets and liabilities not carried at fair value on a recurring basis, as they would be categorized within the fair-value hierarchy, as of the dates indicated.
|
|
Fair-Value Hierarchy
|
|||||||||||||||||||
|
December 31, 2014
|
Reported Amount
|
Estimated Fair Value
|
Quoted Market Prices in Active Markets (Level 1)
|
Pricing Methods with Significant Observable Market Inputs (Level 2)
|
Pricing Methods with Significant Unobservable Market Inputs (Level 3)
|
|||||||||||||||
|
(In millions)
|
||||||||||||||||||||
|
Financial Assets:
|
|
|
|
|
||||||||||||||||
|
Cash and due from banks
|
$
|
1,855
|
|
$
|
1,855
|
|
$
|
1,855
|
|
$
|
—
|
|
$
|
—
|
|
|||||
|
Interest-bearing deposits with banks
|
93,523
|
|
93,523
|
|
—
|
|
93,523
|
|
—
|
|
||||||||||
|
Securities purchased under resale agreements
|
2,390
|
|
2,390
|
|
—
|
|
2,390
|
|
—
|
|
||||||||||
|
Investment securities held to maturity
|
17,723
|
|
17,842
|
|
—
|
|
17,842
|
|
—
|
|
||||||||||
|
Net loans (excluding leases)
|
17,158
|
|
17,131
|
|
—
|
|
16,964
|
|
167
|
|
||||||||||
|
Financial Liabilities:
|
||||||||||||||||||||
|
Deposits:
|
||||||||||||||||||||
|
Noninterest-bearing
|
$
|
70,490
|
|
$
|
70,490
|
|
$
|
—
|
|
$
|
70,490
|
|
$
|
—
|
|
|||||
|
Interest-bearing - U.S.
|
33,012
|
|
33,012
|
|
—
|
|
33,012
|
|
—
|
|
||||||||||
|
Interest-bearing - non-U.S.
|
105,538
|
|
105,538
|
|
—
|
|
105,538
|
|
—
|
|
||||||||||
|
Securities sold under repurchase agreements
|
8,925
|
|
8,925
|
|
—
|
|
8,925
|
|
—
|
|
||||||||||
|
Federal funds purchased
|
21
|
|
21
|
|
—
|
|
21
|
|
—
|
|
||||||||||
|
Other short-term borrowings
|
4,381
|
|
4,381
|
|
—
|
|
4,381
|
|
—
|
|
||||||||||
|
Long-term debt
|
10,042
|
|
10,229
|
|
—
|
|
9,382
|
|
847
|
|
||||||||||
140
|
Fair-Value Hierarchy
|
||||||||||||||||||||
|
December 31, 2013
|
Reported Amount
|
Estimated Fair Value
|
Quoted Market Prices in Active Markets (Level 1)
|
Pricing Methods with Significant Observable Market Inputs (Level 2)
|
Pricing Methods with Significant Unobservable Market Inputs (Level 3)
|
|||||||||||||||
|
(In millions)
|
||||||||||||||||||||
|
Financial Assets:
|
||||||||||||||||||||
|
Cash and due from banks
|
$
|
3,220
|
|
$
|
3,220
|
|
$
|
3,220
|
|
$
|
—
|
|
$
|
—
|
|
|||||
|
Interest-bearing deposits with banks
|
64,257
|
|
64,257
|
|
—
|
|
64,257
|
|
—
|
|
||||||||||
|
Securities purchased under resale agreements
|
6,230
|
|
6,230
|
|
—
|
|
6,230
|
|
—
|
|
||||||||||
|
Investment securities held to maturity
|
17,740
|
|
17,560
|
|
—
|
|
17,560
|
|
—
|
|
||||||||||
|
Net loans (excluding leases)
|
12,363
|
|
12,355
|
|
—
|
|
11,908
|
|
447
|
|
||||||||||
|
Financial Liabilities:
|
||||||||||||||||||||
|
Deposits:
|
||||||||||||||||||||
|
Noninterest-bearing
|
$
|
65,614
|
|
$
|
65,614
|
|
$
|
—
|
|
$
|
65,614
|
|
$
|
—
|
|
|||||
|
Interest-bearing - U.S.
|
13,392
|
|
13,392
|
|
—
|
|
13,392
|
|
—
|
|
||||||||||
|
Interest-bearing - non-U.S.
|
103,262
|
|
103,262
|
|
—
|
|
103,262
|
|
—
|
|
||||||||||
|
Securities sold under repurchase agreements
|
7,953
|
|
7,953
|
|
—
|
|
7,953
|
|
—
|
|
||||||||||
|
Federal funds purchased
|
19
|
|
19
|
|
—
|
|
19
|
|
—
|
|
||||||||||
|
Other short-term borrowings
|
3,780
|
|
3,780
|
|
—
|
|
3,780
|
|
—
|
|
||||||||||
|
Long-term debt
|
9,699
|
|
9,809
|
|
—
|
|
8,956
|
|
853
|
|
||||||||||
141
Note
3
. Investment Securities
Investment securities held by us are classified as either trading, available-for-sale or held-to-maturity at the time of purchase, based on management’s intent.
Generally, trading assets are debt and equity securities purchased in connection with our trading activities and, as such, are expected to be sold in the near term. Our trading activities typically involve active and frequent buying and selling with the objective of generating profits on short-term movements. Securities available-for-sale are those securities that we intend to hold for an indefinite period of time. Available-for-sale securities include securities utilized as part of our asset-and-liability management activities that may be sold in response to changes in interest rates, prepayment risk, liquidity
needs or other factors. Securities held to maturity are debt securities that management has the intent and the ability to hold to maturity.
Trading assets are carried at fair value. Both realized and unrealized gains and losses on trading assets are recorded in trading services revenue in our consolidated statement of income. Debt and marketable equity securities classified as available for sale are carried at fair value, and after-tax net unrealized gains and losses are recorded in AOCI. Gains or losses realized on sales of available-for-sale securities are computed using the specific identification method and are recorded in gains (losses) related to investment securities, net, in our consolidated statement of income. Securities held to maturity are carried at cost, adjusted for amortization of premiums and accretion of discounts.
142
The following table presents the amortized cost and fair value, and associated unrealized gains and losses, of investment securities as of the dates indicated:
|
|
December 31, 2014
|
December 31, 2013
|
|||||||||||||||||||||||||||||
|
|
Amortized
Cost
|
Gross
Unrealized
|
Fair
Value
|
Amortized
Cost
|
Gross
Unrealized
|
Fair
Value
|
|||||||||||||||||||||||||
|
(In millions)
|
Gains
|
Losses
|
Gains
|
Losses
|
|||||||||||||||||||||||||||
|
Available for sale:
|
|||||||||||||||||||||||||||||||
|
U.S. Treasury and federal agencies:
|
|||||||||||||||||||||||||||||||
|
Direct obligations
|
$
|
10,573
|
|
$
|
83
|
|
$
|
1
|
|
$
|
10,655
|
|
$
|
702
|
|
$
|
9
|
|
$
|
2
|
|
$
|
709
|
|
|||||||
|
Mortgage-backed securities
|
20,648
|
|
193
|
|
127
|
|
20,714
|
|
23,744
|
|
211
|
|
392
|
|
23,563
|
|
|||||||||||||||
|
Asset-backed securities:
|
|||||||||||||||||||||||||||||||
|
Student loans
(1)
|
12,478
|
|
106
|
|
124
|
|
12,460
|
|
14,718
|
|
92
|
|
268
|
|
14,542
|
|
|||||||||||||||
|
Credit cards
|
3,077
|
|
10
|
|
34
|
|
3,053
|
|
8,230
|
|
21
|
|
41
|
|
8,210
|
|
|||||||||||||||
|
Sub-prime
|
1,005
|
|
2
|
|
56
|
|
951
|
|
1,291
|
|
3
|
|
91
|
|
1,203
|
|
|||||||||||||||
|
Other
(2)
|
4,055
|
|
100
|
|
10
|
|
4,145
|
|
4,949
|
|
138
|
|
23
|
|
5,064
|
|
|||||||||||||||
|
Total asset-backed securities
|
20,615
|
|
218
|
|
224
|
|
20,609
|
|
29,188
|
|
254
|
|
423
|
|
29,019
|
|
|||||||||||||||
|
Non-U.S. debt securities:
|
|||||||||||||||||||||||||||||||
|
Mortgage-backed securities
|
9,442
|
|
168
|
|
4
|
|
9,606
|
|
10,808
|
|
230
|
|
9
|
|
11,029
|
|
|||||||||||||||
|
Asset-backed securities
|
3,215
|
|
11
|
|
—
|
|
3,226
|
|
5,369
|
|
23
|
|
2
|
|
5,390
|
|
|||||||||||||||
|
Government securities
|
3,899
|
|
10
|
|
—
|
|
3,909
|
|
3,759
|
|
2
|
|
—
|
|
3,761
|
|
|||||||||||||||
|
Other
(3)
|
5,383
|
|
52
|
|
7
|
|
5,428
|
|
4,679
|
|
59
|
|
11
|
|
4,727
|
|
|||||||||||||||
|
Total non-U.S. debt securities
|
21,939
|
|
241
|
|
11
|
|
22,169
|
|
24,615
|
|
314
|
|
22
|
|
24,907
|
|
|||||||||||||||
|
State and political subdivisions
|
10,532
|
|
325
|
|
37
|
|
10,820
|
|
10,301
|
|
160
|
|
198
|
|
10,263
|
|
|||||||||||||||
|
Collateralized mortgage obligations
|
5,280
|
|
71
|
|
12
|
|
5,339
|
|
5,275
|
|
70
|
|
76
|
|
5,269
|
|
|||||||||||||||
|
Other U.S. debt securities
|
4,033
|
|
88
|
|
12
|
|
4,109
|
|
4,876
|
|
138
|
|
34
|
|
4,980
|
|
|||||||||||||||
|
U.S. equity securities
|
29
|
|
10
|
|
—
|
|
39
|
|
28
|
|
6
|
|
—
|
|
34
|
|
|||||||||||||||
|
Non-U.S. equity securities
|
2
|
|
—
|
|
—
|
|
2
|
|
1
|
|
—
|
|
—
|
|
1
|
|
|||||||||||||||
|
U.S. money-market mutual funds
|
449
|
|
—
|
|
—
|
|
449
|
|
422
|
|
—
|
|
—
|
|
422
|
|
|||||||||||||||
|
Non-U.S. money-market mutual funds
|
8
|
|
—
|
|
—
|
|
8
|
|
7
|
|
—
|
|
—
|
|
7
|
|
|||||||||||||||
|
Total
|
$
|
94,108
|
|
$
|
1,229
|
|
$
|
424
|
|
$
|
94,913
|
|
$
|
99,159
|
|
$
|
1,162
|
|
$
|
1,147
|
|
$
|
99,174
|
|
|||||||
|
Held to maturity:
|
|||||||||||||||||||||||||||||||
|
U.S. Treasury and federal agencies:
|
|||||||||||||||||||||||||||||||
|
Direct obligations
|
$
|
5,114
|
|
$
|
—
|
|
$
|
147
|
|
$
|
4,967
|
|
$
|
5,041
|
|
$
|
—
|
|
$
|
448
|
|
$
|
4,593
|
|
|||||||
|
Mortgage-backed securities
|
62
|
|
4
|
|
—
|
|
66
|
|
91
|
|
6
|
|
—
|
|
97
|
|
|||||||||||||||
|
Asset-backed securities:
|
|||||||||||||||||||||||||||||||
|
Student loans
(1)
|
1,814
|
|
2
|
|
4
|
|
1,812
|
|
1,627
|
|
—
|
|
10
|
|
1,617
|
|
|||||||||||||||
|
Credit cards
|
897
|
|
2
|
|
—
|
|
899
|
|
762
|
|
1
|
|
—
|
|
763
|
|
|||||||||||||||
|
Other
|
577
|
|
3
|
|
1
|
|
579
|
|
782
|
|
1
|
|
2
|
|
781
|
|
|||||||||||||||
|
Total asset-backed securities
|
3,288
|
|
7
|
|
5
|
|
3,290
|
|
3,171
|
|
2
|
|
12
|
|
3,161
|
|
|||||||||||||||
|
Non-U.S. debt securities:
|
|||||||||||||||||||||||||||||||
|
Mortgage-backed securities
|
3,787
|
|
177
|
|
22
|
|
3,942
|
|
4,211
|
|
150
|
|
48
|
|
4,313
|
|
|||||||||||||||
|
Asset-backed securities
|
2,868
|
|
14
|
|
1
|
|
2,881
|
|
2,202
|
|
19
|
|
—
|
|
2,221
|
|
|||||||||||||||
|
Government securities
|
154
|
|
—
|
|
—
|
|
154
|
|
2
|
|
—
|
|
—
|
|
2
|
|
|||||||||||||||
|
Other
|
72
|
|
—
|
|
—
|
|
72
|
|
192
|
|
—
|
|
—
|
|
192
|
|
|||||||||||||||
|
Total non-U.S. debt securities
|
6,881
|
|
191
|
|
23
|
|
7,049
|
|
6,607
|
|
169
|
|
48
|
|
6,728
|
|
|||||||||||||||
|
State and political subdivisions
|
9
|
|
—
|
|
—
|
|
9
|
|
24
|
|
1
|
|
—
|
|
25
|
|
|||||||||||||||
|
Collateralized mortgage obligations
|
2,369
|
|
107
|
|
15
|
|
2,461
|
|
2,806
|
|
176
|
|
26
|
|
2,956
|
|
|||||||||||||||
|
Total
|
$
|
17,723
|
|
$
|
309
|
|
$
|
190
|
|
$
|
17,842
|
|
$
|
17,740
|
|
$
|
354
|
|
$
|
534
|
|
$
|
17,560
|
|
|||||||
(1)
Substantially composed of securities guaranteed by the federal government with respect to at least
97%
of defaulted principal and accrued interest on the underlying loans.
(2)
As of
December 31, 2014
and
2013
, the fair value of other asset-backed securities was composed primarily of
$3.8 billion
and
$4.5 billion
, respectively, of collateralized loan obligations and approximately
$315 million
and approximately
$470 million
, respectively, of automobile loan securities.
(3)
As of
December 31, 2014
and
2013
, the fair value of other non-U.S. debt securities was composed primarily of
$3.3 billion
and
$2.3 billion
, respectively, of covered bonds and
$1.2 billion
and
$1.4 billion
, respectively, of corporate bonds.
143
Aggregate investment securities with carrying values of
$44.02 billion
and
$46.99 billion
as of
December 31, 2014
and
2013
, respectively, were designated as pledged for public and trust deposits,
short-term borrowings and for other purposes as provided by law.
The following tables present the aggregate fair values of investment securities that have been in a continuous unrealized loss position for less than
12 months
, and those that have been in a continuous unrealized loss position for
12 months
or longer, as of the dates indicated:
|
|
Less than 12 months
|
12 months or longer
|
Total
|
||||||||||||||||||||
|
December 31, 2014
|
Fair
Value
|
Gross
Unrealized
Losses
|
Fair
Value
|
Gross
Unrealized
Losses
|
Fair
Value
|
Gross
Unrealized
Losses
|
|||||||||||||||||
|
(In millions)
|
|||||||||||||||||||||||
|
Available for sale:
|
|||||||||||||||||||||||
|
U.S. Treasury and federal agencies:
|
|||||||||||||||||||||||
|
Direct obligations
|
$
|
—
|
|
$
|
—
|
|
$
|
167
|
|
$
|
1
|
|
$
|
167
|
|
$
|
1
|
|
|||||
|
Mortgage-backed securities
|
2,569
|
|
9
|
|
6,466
|
|
118
|
|
9,035
|
|
127
|
|
|||||||||||
|
Asset-backed securities:
|
|||||||||||||||||||||||
|
Student loans
|
1,473
|
|
15
|
|
5,025
|
|
109
|
|
6,498
|
|
124
|
|
|||||||||||
|
Credit cards
|
344
|
|
1
|
|
1,270
|
|
33
|
|
1,614
|
|
34
|
|
|||||||||||
|
Sub-prime
|
—
|
|
—
|
|
896
|
|
56
|
|
896
|
|
56
|
|
|||||||||||
|
Other
|
547
|
|
1
|
|
791
|
|
9
|
|
1,338
|
|
10
|
|
|||||||||||
|
Total asset-backed securities
|
2,364
|
|
17
|
|
7,982
|
|
207
|
|
10,346
|
|
224
|
|
|||||||||||
|
Non-U.S. debt securities:
|
|||||||||||||||||||||||
|
Mortgage-backed securities
|
1,350
|
|
2
|
|
170
|
|
2
|
|
1,520
|
|
4
|
|
|||||||||||
|
Other
|
581
|
|
4
|
|
328
|
|
3
|
|
909
|
|
7
|
|
|||||||||||
|
Total non-U.S. debt securities
|
1,931
|
|
6
|
|
498
|
|
5
|
|
2,429
|
|
11
|
|
|||||||||||
|
State and political subdivisions
|
610
|
|
3
|
|
1,315
|
|
34
|
|
1,925
|
|
37
|
|
|||||||||||
|
Collateralized mortgage obligations
|
731
|
|
2
|
|
311
|
|
10
|
|
1,042
|
|
12
|
|
|||||||||||
|
Other U.S. debt securities
|
327
|
|
2
|
|
244
|
|
10
|
|
571
|
|
12
|
|
|||||||||||
|
Total
|
$
|
8,532
|
|
$
|
39
|
|
$
|
16,983
|
|
$
|
385
|
|
$
|
25,515
|
|
$
|
424
|
|
|||||
|
Held to maturity:
|
|||||||||||||||||||||||
|
U.S. Treasury and federal agencies:
|
|||||||||||||||||||||||
|
Direct obligations
|
$
|
76
|
|
$
|
1
|
|
$
|
4,891
|
|
$
|
146
|
|
$
|
4,967
|
|
$
|
147
|
|
|||||
|
Asset-backed securities:
|
|||||||||||||||||||||||
|
Student loans
|
780
|
|
3
|
|
192
|
|
1
|
|
972
|
|
4
|
|
|||||||||||
|
Other
|
124
|
|
1
|
|
—
|
|
—
|
|
124
|
|
1
|
|
|||||||||||
|
Total asset-backed securities
|
904
|
|
4
|
|
192
|
|
1
|
|
1,096
|
|
5
|
|
|||||||||||
|
Non-U.S. mortgage-backed securities:
|
|||||||||||||||||||||||
|
Mortgage-backed securities
|
507
|
|
3
|
|
590
|
|
19
|
|
1,097
|
|
22
|
|
|||||||||||
|
Asset-backed securities
|
699
|
|
1
|
|
—
|
|
—
|
|
699
|
|
1
|
|
|||||||||||
|
Total non-U.S. debt securities
|
1,206
|
|
4
|
|
590
|
|
19
|
|
1,796
|
|
23
|
|
|||||||||||
|
Collateralized mortgage obligations
|
422
|
|
4
|
|
547
|
|
11
|
|
969
|
|
15
|
|
|||||||||||
|
Total
|
$
|
2,608
|
|
$
|
13
|
|
$
|
6,220
|
|
$
|
177
|
|
$
|
8,828
|
|
$
|
190
|
|
|||||
144
|
|
Less than 12 months
|
12 months or longer
|
Total
|
||||||||||||||||||||
|
December 31, 2013
|
Fair
Value
|
Gross
Unrealized
Losses
|
Fair
Value
|
Gross
Unrealized
Losses
|
Fair
Value
|
Gross
Unrealized
Losses
|
|||||||||||||||||
|
(In millions)
|
|||||||||||||||||||||||
|
Available for sale:
|
|||||||||||||||||||||||
|
U.S. Treasury and federal agencies:
|
|||||||||||||||||||||||
|
Direct obligations
|
$
|
182
|
|
$
|
1
|
|
$
|
113
|
|
$
|
1
|
|
$
|
295
|
|
$
|
2
|
|
|||||
|
Mortgage-backed securities
|
10,562
|
|
316
|
|
2,389
|
|
76
|
|
12,951
|
|
392
|
|
|||||||||||
|
Asset-backed securities:
|
|||||||||||||||||||||||
|
Student loans
|
1,930
|
|
16
|
|
7,252
|
|
252
|
|
9,182
|
|
268
|
|
|||||||||||
|
Credit cards
|
3,714
|
|
30
|
|
161
|
|
11
|
|
3,875
|
|
41
|
|
|||||||||||
|
Sub-prime
|
—
|
|
—
|
|
1,150
|
|
91
|
|
1,150
|
|
91
|
|
|||||||||||
|
Other
|
1,896
|
|
12
|
|
439
|
|
11
|
|
2,335
|
|
23
|
|
|||||||||||
|
Total asset-backed securities
|
7,540
|
|
58
|
|
9,002
|
|
365
|
|
16,542
|
|
423
|
|
|||||||||||
|
Non-U.S. debt securities:
|
|||||||||||||||||||||||
|
Mortgage-backed securities
|
868
|
|
2
|
|
258
|
|
7
|
|
1,126
|
|
9
|
|
|||||||||||
|
Asset-backed securities
|
551
|
|
1
|
|
16
|
|
1
|
|
567
|
|
2
|
|
|||||||||||
|
Other
|
1,655
|
|
9
|
|
150
|
|
2
|
|
1,805
|
|
11
|
|
|||||||||||
|
Total non-U.S. debt securities
|
3,074
|
|
12
|
|
424
|
|
10
|
|
3,498
|
|
22
|
|
|||||||||||
|
State and political subdivisions
|
3,242
|
|
113
|
|
1,268
|
|
85
|
|
4,510
|
|
198
|
|
|||||||||||
|
Collateralized mortgage obligations
|
1,581
|
|
55
|
|
510
|
|
21
|
|
2,091
|
|
76
|
|
|||||||||||
|
Other U.S. debt securities
|
1,039
|
|
25
|
|
58
|
|
9
|
|
1,097
|
|
34
|
|
|||||||||||
|
Total
|
$
|
27,220
|
|
$
|
580
|
|
$
|
13,764
|
|
$
|
567
|
|
$
|
40,984
|
|
$
|
1,147
|
|
|||||
|
Held to maturity:
|
|||||||||||||||||||||||
|
U.S. Treasury and federal agencies:
|
|||||||||||||||||||||||
|
Direct obligations
|
$
|
4,571
|
|
$
|
448
|
|
$
|
—
|
|
$
|
—
|
|
$
|
4,571
|
|
$
|
448
|
|
|||||
|
Asset-backed securities:
|
|||||||||||||||||||||||
|
Student Loans
|
1,352
|
|
10
|
|
—
|
|
—
|
|
1,352
|
|
10
|
|
|||||||||||
|
Other
|
297
|
|
1
|
|
29
|
|
1
|
|
326
|
|
2
|
|
|||||||||||
|
Total asset-backed securities
|
1,649
|
|
11
|
|
29
|
|
1
|
|
1,678
|
|
12
|
|
|||||||||||
|
Non-U.S. mortgage-backed securities
|
834
|
|
3
|
|
878
|
|
45
|
|
1,712
|
|
48
|
|
|||||||||||
|
Collateralized mortgage obligations
|
759
|
|
18
|
|
161
|
|
8
|
|
920
|
|
26
|
|
|||||||||||
|
Total
|
$
|
7,813
|
|
$
|
480
|
|
$
|
1,068
|
|
$
|
54
|
|
$
|
8,881
|
|
$
|
534
|
|
|||||
145
The following table presents contractual maturities of debt investment securities as of
December 31, 2014
:
|
(In millions)
|
Under 1
Year
|
1 to 5
Years
|
6 to 10
Years
|
Over 10
Years
|
|||||||||||
|
Available for sale:
|
|||||||||||||||
|
U.S. Treasury and federal agencies:
|
|||||||||||||||
|
Direct obligations
|
$
|
—
|
|
$
|
6,841
|
|
$
|
3,287
|
|
$
|
527
|
|
|||
|
Mortgage-backed securities
|
107
|
|
2,389
|
|
4,421
|
|
13,797
|
|
|||||||
|
Asset-backed securities:
|
|||||||||||||||
|
Student loans
|
515
|
|
6,100
|
|
3,823
|
|
2,022
|
|
|||||||
|
Credit cards
|
381
|
|
1,562
|
|
1,110
|
|
—
|
|
|||||||
|
Sub-prime
|
3
|
|
13
|
|
1
|
|
934
|
|
|||||||
|
Other
|
244
|
|
961
|
|
1,268
|
|
1,672
|
|
|||||||
|
Total asset-backed securities
|
1,143
|
|
8,636
|
|
6,202
|
|
4,628
|
|
|||||||
|
Non-U.S. debt securities:
|
|||||||||||||||
|
Mortgage-backed securities
|
2,315
|
|
3,463
|
|
576
|
|
3,252
|
|
|||||||
|
Asset-backed securities
|
272
|
|
2,698
|
|
166
|
|
90
|
|
|||||||
|
Government securities
|
2,321
|
|
1,588
|
|
—
|
|
—
|
|
|||||||
|
Other
|
1,757
|
|
2,801
|
|
870
|
|
—
|
|
|||||||
|
Total non-U.S. debt securities
|
6,665
|
|
10,550
|
|
1,612
|
|
3,342
|
|
|||||||
|
State and political subdivisions
|
699
|
|
3,003
|
|
4,715
|
|
2,403
|
|
|||||||
|
Collateralized mortgage obligations
|
227
|
|
1,149
|
|
1,072
|
|
2,891
|
|
|||||||
|
Other U.S. debt securities
|
814
|
|
2,967
|
|
294
|
|
34
|
|
|||||||
|
Total
|
$
|
9,655
|
|
$
|
35,535
|
|
$
|
21,603
|
|
$
|
27,622
|
|
|||
|
Held to maturity:
|
|||||||||||||||
|
U.S. Treasury and federal agencies:
|
|||||||||||||||
|
Direct obligations
|
$
|
—
|
|
$
|
—
|
|
$
|
5,000
|
|
$
|
114
|
|
|||
|
Mortgage-backed securities
|
1
|
|
11
|
|
12
|
|
38
|
|
|||||||
|
Asset-backed securities:
|
|||||||||||||||
|
Student loans
|
6
|
|
182
|
|
375
|
|
1,251
|
|
|||||||
|
Credit cards
|
—
|
|
375
|
|
522
|
|
—
|
|
|||||||
|
Other
|
15
|
|
367
|
|
191
|
|
4
|
|
|||||||
|
Total asset-backed securities
|
21
|
|
924
|
|
1,088
|
|
1,255
|
|
|||||||
|
Non-U.S. debt securities:
|
|||||||||||||||
|
Mortgage-backed securities
|
503
|
|
1,102
|
|
157
|
|
2,025
|
|
|||||||
|
Asset-backed securities
|
105
|
|
2,567
|
|
196
|
|
—
|
|
|||||||
|
Government securities
|
154
|
|
—
|
|
—
|
|
—
|
|
|||||||
|
Other
|
—
|
|
72
|
|
—
|
|
—
|
|
|||||||
|
Total non-U.S. debt securities
|
762
|
|
3,741
|
|
353
|
|
2,025
|
|
|||||||
|
State and political subdivisions
|
7
|
|
2
|
|
—
|
|
—
|
|
|||||||
|
Collateralized mortgage obligations
|
574
|
|
460
|
|
498
|
|
837
|
|
|||||||
|
Total
|
$
|
1,365
|
|
$
|
5,138
|
|
$
|
6,951
|
|
$
|
4,269
|
|
|||
The maturities of asset-backed securities, mortgage-backed securities, and collateralized mortgage obligations are based on expected principal payments.
146
The following tables present gross realized gains and losses from sales of available-for-sale securities, and the components of net impairment losses included in net gains and losses related to investment securities, for the
years ended December 31
:
|
(In millions)
|
2014
|
2013
|
2012
|
||||||||
|
Gross realized gains from sales of available-for-sale securities
|
$
|
64
|
|
$
|
104
|
|
$
|
101
|
|
||
|
Gross realized losses from sales of available-for-sale securities
(1)
|
(49
|
)
|
(90
|
)
|
(46
|
)
|
|||||
|
Net impairment losses:
|
|||||||||||
|
Gross losses from other-than-temporary impairment
|
(1
|
)
|
(21
|
)
|
(53
|
)
|
|||||
|
Losses reclassified (from) to other comprehensive income
|
(10
|
)
|
(2
|
)
|
21
|
|
|||||
|
Net impairment losses
(2)
|
(11
|
)
|
(23
|
)
|
(32
|
)
|
|||||
|
Gains related to investment securities, net
|
$
|
4
|
|
$
|
(9
|
)
|
$
|
23
|
|
||
|
(2)
Net impairment losses, recognized in our consolidated statement of income, were composed of the following:
|
|||||||||||
|
Impairment associated with expected credit losses
|
$
|
(10
|
)
|
$
|
(11
|
)
|
$
|
(16
|
)
|
||
|
Impairment associated with management's intent to sell impaired securities prior to recovery in value
|
|
|
(6
|
)
|
—
|
|
|||||
|
Impairment associated with adverse changes in timing of expected future cash flows
|
(1
|
)
|
(6
|
)
|
(16
|
)
|
|||||
|
Net impairment losses
|
$
|
(11
|
)
|
$
|
(23
|
)
|
$
|
(32
|
)
|
||
(1)
Amount for the
year ended
December 31, 2012
represented a pre-tax loss from the sale of all of our Greek investment securities, which had an aggregate carrying value of approximately
$91 million
.
The following table presents a roll-forward with respect to net impairment losses that have been recognized in income for the
years ended December 31
:
|
(In millions)
|
2014
|
2013
|
2012
|
||||||||
|
Balance, beginning of period
|
$
|
122
|
|
$
|
124
|
|
$
|
113
|
|
||
|
Additions:
|
|||||||||||
|
Losses for which other-than-temporary impairment was not previously recognized
|
—
|
|
14
|
|
4
|
|
|||||
|
Losses for which other-than-temporary impairment was previously recognized
|
11
|
|
9
|
|
28
|
|
|||||
|
Reductions:
|
|||||||||||
|
Previously recognized losses related to securities sold or matured
|
(12
|
)
|
(25
|
)
|
(21
|
)
|
|||||
|
Losses related to securities intended or required to be sold
|
(6
|
)
|
—
|
|
—
|
|
|||||
|
Balance, end of period
|
$
|
115
|
|
$
|
122
|
|
$
|
124
|
|
||
Interest revenue related to debt securities is recognized in our consolidated statement of income
using the interest method, or on a basis approximating a level rate of return over the contractual or estimated life of the security. The level rate of return considers any nonrefundable fees or costs, as well as purchase premiums or discounts, resulting in amortization or accretion, accordingly.
For debt securities acquired for which we consider it probable as of the date of acquisition that we will be unable to collect all contractually required principal, interest and other payments, the excess of our estimate of undiscounted future cash flows from these securities over their initial recorded investment is accreted into interest revenue on a level-yield basis over the securities’ estimated remaining terms. Subsequent decreases in these securities’ expected future cash flows are either recognized prospectively through an adjustment of the yields on the securities over their remaining terms, or are evaluated for other-than-temporary impairment. Increases in expected future cash flows are recognized prospectively over the securities’ estimated remaining terms through the recalculation of their yields.
For certain debt securities acquired which are considered to be beneficial interests in securitized financial assets, the excess of our estimate of undiscounted future cash flows from these securities over their initial recorded investment is accreted into interest revenue on a level-yield basis over the securities’ estimated remaining terms. Subsequent decreases in these securities’ expected future cash flows are either recognized prospectively through an adjustment of the yields on the securities over their remaining terms, or are evaluated for other-than-temporary impairment. Increases in expected future cash flows are recognized prospectively over the securities’ estimated remaining terms through the recalculation of their yields.
Impairment:
We conduct periodic reviews of individual securities to assess whether other-than-temporary impairment exists. Impairment exists when the current fair value of an individual security is below its amortized cost basis. When the decline in the security's fair value is deemed to be other than temporary, the loss is recorded in our consolidated statement of income. In addition, for debt securities available for sale and held to maturity, impairment is recorded in our consolidated statement of income when management intends to sell (or may be required to sell) the securities before they recover in value, or when management expects the present value of cash flows expected to be collected from the securities to be less than the amortized cost of the impaired security (a credit loss).
147
Our review of impaired securities generally includes:
|
•
|
the identification and evaluation of securities that have indications of potential other-than-temporary impairment, such as issuer-specific concerns, including deteriorating financial condition or bankruptcy;
|
|
•
|
the analysis of expected future cash flows of securities, based on quantitative and qualitative factors;
|
|
•
|
the analysis of the collectibility of those future cash flows, including information about past events, current conditions, and reasonable and supportable forecasts;
|
|
•
|
the analysis of the underlying collateral for mortgage- and asset-backed securities;
|
|
•
|
the analysis of individual impaired securities, including consideration of the length of time the security has been in an unrealized loss position, the anticipated recovery period, and the magnitude of the overall price decline;
|
|
•
|
evaluation of factors or triggers that could cause individual securities to be deemed other-than-temporarily impaired and those that would not support other-than-temporary impairment; and
|
|
•
|
documentation of the results of these analyses.
|
Factors considered in determining whether impairment is other than temporary include:
|
•
|
certain macroeconomic drivers;
|
|
•
|
certain industry-specific drivers;
|
|
•
|
the length of time the security has been impaired;
|
|
•
|
the severity of the impairment;
|
|
•
|
the cause of the impairment and the financial condition and near-term prospects of the issuer;
|
|
•
|
activity in the market with respect to the issuer's securities, which may indicate adverse credit conditions; and
|
|
•
|
our intention not to sell, and the likelihood that we will not be required to sell, the security for a period of time sufficient to allow for its recovery in value.
|
Substantially all of our investment securities portfolio is composed of debt securities. A critical component of our assessment of other-than-temporary impairment of these debt securities is the identification of credit-impaired securities for which
management does not expect to receive cash flows sufficient to recover the entire amortized cost basis of the security.
Debt securities that are not deemed to be credit-impaired are subject to additional management analysis to assess whether management intends to sell, or, more likely than not, would be required to sell, the security before the expected recovery of its amortized cost basis.
The following provides a description of our process for the identification and assessment of other-than-temporary impairment, as well as information about other-than-temporary impairment recorded in the years ended
2014
and
2013
and changes in period-end unrealized losses, for major security types as of
December 31, 2014
.
U.S. Agency Securities
Our portfolio of U.S. agency direct obligations and mortgage-backed securities receives the implicit or explicit backing of the U.S. government in conjunction with specified financial support of the U.S. Treasury. We recorded no other-than-temporary impairment on these securities in the
years ended
2014
or
2013
. The overall improvement in the unrealized losses on these securities as of
December 31, 2014
was primarily attributable to narrowing spreads in
2014
.
Asset-Backed Securities - Student Loans
Asset-backed securities collateralized by student loans are primarily composed of securities collateralized by Federal Family Education Loan Program, or FFELP, loans. FFELP loans benefit from a federal government guarantee of at least
97%
of defaulted principal and accrued interest, with additional credit support provided in the form of over-collateralization, subordination and excess spread, which collectively total in excess of
100%
. Accordingly, the vast majority of FFELP loan-backed securities are protected from traditional consumer credit risk.
We recorded no other-than-temporary impairment on these securities in
2014
or
2013
. The gross unrealized losses in our FFELP loan-backed securities portfolio as of
December 31, 2014
were primarily attributable to the lower spreads on these securities relative to those associated with more current issuances.
Our assessment of other-than-temporary
impairment of these securities considers, among many other factors, the strength of the U.S. government guarantee, the performance of the underlying collateral, and the remaining average term
148
of the FFELP loan-backed securities portfolio, which was approximately
4.4 years
as of
December 31, 2014
.
Our total exposure to private student loan-backed securities was less than
$700 million
as of
December 31, 2014
. Our assessment of other-than-temporary impairment of private student loan-backed securities considers, among other factors, the impact of high unemployment rates on the collateral performance of private student loans. We recorded no other-than-temporary impairment on these securities in
2014
or
2013
.
Non-U.S. Mortgage- and Asset-Backed Securities
Non-U.S. mortgage- and asset-backed securities are primarily composed of U.K., Australian and Dutch securities collateralized by residential mortgages and German securities collateralized by automobile loans and leases. Our assessment of impairment with respect to these securities considers the location of the underlying collateral, collateral enhancement and structural features, expected credit losses under base-case and stressed conditions and the macroeconomic outlook for the country in which the collateral is located, including housing prices and unemployment. Where appropriate, any potential loss after consideration of the above-referenced factors is further evaluated to determine whether any other-than-temporary impairment exists.
We recorded other-than-temporary impairment of
$1 million
and
$6 million
for the years ended
December 31, 2014
and
2013
, respectively, on non-U.S. residential mortgage-backed securities in our consolidated statement of income associated with adverse changes in the timing of expected future cash flows from the securities.
In addition, in the
year ended
December 31, 2013
, we recorded other-than-temporary impairment of
$6 million
on these securities in our consolidated statement of income associated with management's intent to sell the impaired security prior to its recovery in value.
Our assessment of other-than-temporary impairment of these securities takes into account government intervention in the corresponding mortgage markets and assumes a conservative baseline macroeconomic environment for this region, factoring in slower economic growth and continued government austerity measures. Our baseline view assumes a recessionary period characterized by high unemployment and by additional housing price declines of between
5%
and
15%
across these
four
countries. Our evaluation of other-than-temporary impairment in our base case does not assume a
disorderly sovereign-debt restructuring or a break-up of the Eurozone. In addition, we perform stress testing and sensitivity analysis in order to understand the impact of more severe assumptions on potential other-than-temporary impairment.
State and Political Subdivisions and Other U.S. Debt Securities
Our municipal securities portfolio primarily includes securities issued by U.S. states and their municipalities. A portion of this portfolio is held in connection with our tax-exempt investment program, more fully described in note
12
. Our portfolio of other U.S. debt securities is primarily composed of securities issued by U.S. corporations.
Our assessment of other-than-temporary impairment of these portfolios considers, among other factors, adverse conditions specifically related to the industry, geographic area or financial condition of the issuer; the structure of the security, including collateral, if any, and payment schedule; rating agency changes to the security's credit rating; the volatility of the fair value changes; and our intent and ability to hold the security until its recovery in value. If the impairment of the security is credit-related, we estimate the future cash flows from the security, tailored to the security and considering the above-described factors, and any resulting impairment deemed to be other-than-temporary is recorded in our consolidated statement of income.
We recorded no other-than-temporary impairment on these securities in
2014
or
2013
. The decline in the unrealized losses on these securities as of
December 31, 2014
was primarily attributable to the narrowing of spreads and U.S. Treasury rates in
2014
.
U.S. Non-Agency Residential Mortgage-Backed Securities
We assess other-than-temporary impairment of our portfolio of U.S. non-agency residential mortgage-backed securities using cash flow models, tailored for each security, that estimate the future cash flows from the underlying mortgages, using the security-specific collateral and transaction structure. Estimates of future cash flows are subject to management judgment. The future cash flows and performance of our portfolio of U.S. non-agency residential mortgage-backed securities are a function of a number of factors, including, but not limited to, the condition of the U.S. economy, the condition of the U.S. residential mortgage markets, and the level of loan defaults, prepayments and loss severities. Management's estimates of future losses for each security also consider the underwriting and historical
149
performance of each specific security, the underlying collateral type, vintage, borrower profile, third-party guarantees, current levels of subordination, geography and other factors.
We recorded no other-than-temporary impairment on these securities in
2014
or
2013
.
U.S. Non-Agency Commercial Mortgage-Backed Securities
With respect to our portfolio of U.S. non-agency commercial mortgage-backed securities, other-than-temporary impairment is assessed by considering a number of factors, including, but not limited to, the condition of the U.S. economy and the condition of the U.S. commercial real estate market, as well as capitalization rates. Management estimates of future losses for each security also consider the underlying collateral type, property location, vintage, debt-service coverage ratios, expected property income, servicer advances and estimated property values, as well as current levels of subordination. We recorded
$10 million
of other-than-temporary impairment on these securities in the
year ended
December 31, 2014
, all associated with expected credit losses. In the
year ended
December 31, 2013
, we recorded
$11 million
of other than temporary impairment on these securities, all associated with expected credit losses.
*****
The estimates, assumptions and other risk factors utilized in our assessment of impairment as described above are used by management to identify securities which are subject to further analysis of potential credit losses. Additional analyses are performed using more stressful assumptions to further evaluate the sensitivity of losses relative to the above-described factors. However, since the assumptions are based on the unique characteristics of each security, management uses a range of estimates for prepayment speeds, default, and loss severity forecasts that reflect the collateral profile of the securities within each asset class. In addition, in measuring expected credit losses, the individual characteristics of each security are examined to determine whether any additional factors would increase or mitigate the expected loss. Once losses are determined, the timing of the loss will also affect the ultimate other-than-temporary impairment, since the loss is ultimately subject to a discount commensurate with the purchase yield of the security.
After a review of the investment portfolio, taking into consideration current economic conditions, adverse situations that might affect our ability to fully collect principal and interest, the timing of future payments, the credit quality and performance of the
collateral underlying mortgage- and asset-backed securities and other relevant factors, and excluding other-than-temporary impairment recorded in the
year ended
December 31, 2014
, management considers the aggregate decline in fair value of the investment securities portfolio and the resulting gross pre-tax unrealized losses of
$614 million
as of
December 31, 2014
, related to
1,482
securities, to be temporary, and not the result of any material changes in the credit characteristics of the securities.
Note
4
. Loans and Leases
Loans are generally recorded at their principal amount outstanding, net of the allowance for loan losses, unearned income, and any net unamortized deferred loan origination fees. Acquired loans have been initially recorded at fair value based on management’s expectation with respect to future principal and interest collection as of the date of acquisition. Acquired loans are held for investment, and as such their initial fair value is not adjusted subsequent to acquisition.
Interest revenue related to loans is recognized in our consolidated statement of income using the interest method, or on a basis approximating a level rate of return over the term of the loan. Fees received for providing loan commitments and letters of credit that we anticipate will result in loans typically are deferred and amortized to interest revenue over the term of the related loan, beginning with the initial borrowing. Fees on commitments and letters of credit are amortized to processing fees and other revenue over the commitment period when funding is not known or expected.
Leveraged-lease investments are reported at the aggregate of lease payments receivable and estimated residual values, net of non-recourse debt and unearned income. Lease residual values are reviewed regularly for other-than-temporary impairment, with valuation adjustments recorded against processing fees and other revenue. Unearned income is recognized to yield a level rate of return on the net investment in the leases. Gains and losses on residual values of leased equipment sold are recorded in processing fees and other revenue.
150
The following table presents our recorded investment in loans and leases, by segment and class, as of
December 31
:
|
(In millions)
|
2014
|
2013
|
|||||
|
Institutional:
|
|||||||
|
Investment funds:
|
|||||||
|
U.S.
|
$
|
11,388
|
|
$
|
8,695
|
|
|
|
Non-U.S.
|
2,333
|
|
1,718
|
|
|||
|
Commercial and financial:
|
|||||||
|
U.S.
|
3,061
|
|
1,372
|
|
|||
|
Non-U.S.
|
256
|
|
154
|
|
|||
|
Purchased receivables:
|
|||||||
|
U.S.
|
124
|
|
217
|
|
|||
|
Non-U.S.
|
6
|
|
26
|
|
|||
|
Lease financing:
|
|||||||
|
U.S.
|
335
|
|
339
|
|
|||
|
Non-U.S.
|
668
|
|
756
|
|
|||
|
Total institutional
|
18,171
|
|
13,277
|
|
|||
|
Commercial real estate:
|
|||||||
|
U.S.
|
28
|
|
209
|
|
|||
|
Total loans and leases
|
18,199
|
|
13,486
|
|
|||
|
Allowance for loan losses
|
(38
|
)
|
(28
|
)
|
|||
|
Loans and leases, net of allowance for loan losses
|
$
|
18,161
|
|
$
|
13,458
|
|
|
The components of our net investment in leveraged lease financing, included in the institutional segment in the preceding table, were as follows as of
December 31
:
|
(In millions)
|
2014
|
2013
|
|||||
|
Net rental income receivable
|
$
|
1,284
|
|
$
|
1,404
|
|
|
|
Estimated residual values
|
89
|
|
110
|
|
|||
|
Unearned income
|
(370
|
)
|
(419
|
)
|
|||
|
Investment in leveraged lease financing
|
1,003
|
|
1,095
|
|
|||
|
Less related deferred income tax liabilities
|
(326
|
)
|
(359
|
)
|
|||
|
Net investment in leveraged lease financing
|
$
|
677
|
|
$
|
736
|
|
|
We segregate our loans and leases into two segments: institutional and commercial real estate, or CRE. Within the institutional and CRE segments, we further segregate the receivables into classes based on their risk characteristics, their initial measurement attributes and the methods we use to monitor and assess credit risk.
The institutional segment is composed of the following classes: investment funds, commercial-and- financial, purchased receivables and lease financing. The investment funds class includes lending to mutual and other collective investment funds. The commercial-and-financial class includes lending to corporate borrowers, including broker/dealers, as well as purchased loans composed of senior secured bank loans. These senior secured bank loans, which are more fully described below, are carried in connection with our participation in loan syndications in the non-investment-grade lending market. The purchased receivables class represents undivided interests in securitized pools of underlying third-party receivables added in connection with the commercial paper conduit consolidation in 2009. The lease financing class includes our investment in leveraged lease financing.
Short-duration advances to our clients included in the institutional segment were
$3.54 billion
and
$2.45 billion
as of
December 31, 2014
and
2013
, respectively. These short-duration advances provide liquidity to fund clients in support of their transaction flows associated with securities settlement activities.
The commercial-and-financial class in the institutional segment presented in the preceding table included approximately
$2.07 billion
and
$724 million
of senior secured bank loans as of
December 31, 2014
and
2013
, respectively. These senior secured bank loans are included in the “speculative” category in the credit-quality-indicator tables presented below. As of
December 31, 2014
, our allowance for loan losses included approximately
$26 million
related to these loans.
The CRE segment is composed of the loans acquired in 2008 pursuant to indemnified repurchase agreements with an affiliate of Lehman as a result of the Lehman Brothers bankruptcy. The CRE loans, are primarily collateralized by direct and indirect interests in commercial real estate, were recorded at their then-current fair value, based on management’s expectations with respect to future cash flows from the loans using appropriate market discount rates as of the date of acquisition. These cash flow estimates are updated quarterly to reflect changes in management’s expectations, which consider market conditions and other factors.
151
The following tables present our recorded investment in each class of loans and leases by credit quality indicator as of the dates indicated:
|
|
Institutional
|
Commercial Real Estate
|
|
||||||||||||||||||||||||
|
December 31, 2014
|
Investment
Funds
|
Commercial and Financial
|
Purchased
Receivables
|
Lease
Financing
|
Property Development
|
Other
|
Total
Loans and
Leases
|
||||||||||||||||||||
|
(In millions)
|
|||||||||||||||||||||||||||
|
Investment grade
(1)
|
$
|
13,304
|
|
$
|
1,011
|
|
$
|
130
|
|
$
|
976
|
|
$
|
—
|
|
$
|
—
|
|
$
|
15,421
|
|
||||||
|
Speculative
(2)
|
417
|
|
2,306
|
|
—
|
|
27
|
|
—
|
|
28
|
|
2,778
|
|
|||||||||||||
|
Total
|
$
|
13,721
|
|
$
|
3,317
|
|
$
|
130
|
|
$
|
1,003
|
|
$
|
—
|
|
$
|
28
|
|
$
|
18,199
|
|
||||||
|
|
Institutional
|
Commercial Real Estate
|
|
||||||||||||||||||||||||
|
December 31, 2013
|
Investment
Funds
|
Commercial and Financial
|
Purchased
Receivables
|
Lease
Financing
|
Property Development
|
Other
|
Total
Loans and
Leases
|
||||||||||||||||||||
|
(In millions)
|
|||||||||||||||||||||||||||
|
Investment grade
(1)
|
$
|
10,282
|
|
$
|
740
|
|
$
|
243
|
|
$
|
1,068
|
|
$
|
—
|
|
$
|
29
|
|
$
|
12,362
|
|
||||||
|
Speculative
(2)
|
131
|
|
770
|
|
—
|
|
27
|
|
180
|
|
—
|
|
1,108
|
|
|||||||||||||
|
Special mention
(3)
|
—
|
|
16
|
|
—
|
|
—
|
|
—
|
|
—
|
|
16
|
|
|||||||||||||
|
Total
|
$
|
10,413
|
|
$
|
1,526
|
|
$
|
243
|
|
$
|
1,095
|
|
$
|
180
|
|
$
|
29
|
|
$
|
13,486
|
|
||||||
(1)
Investment-grade loans and leases consist of counterparties with strong credit quality and low expected credit risk and probability of default. Ratings apply to counterparties with a strong capacity to support the timely repayment of any financial commitment.
(2)
Speculative loans and leases consist of counterparties that face ongoing uncertainties or exposure to business, financial, or economic downturns. However, these counterparties may have financial flexibility or access to financial alternatives, which allow for financial commitments to be met.
(3)
Special mention loans and leases consist of counterparties with potential weaknesses that, if uncorrected, may result in deterioration of repayment prospects.
We use an internal risk-rating system to assess our risk of credit loss for each loan or lease. This risk-rating process incorporates the use of risk-rating tools in conjunction with management judgment. Qualitative and quantitative inputs are captured in a systematic manner, and following a formal review and approval process, an internal credit rating based on our credit scale is assigned.
In assessing the risk rating assigned to each individual loan or lease, among the factors considered are the borrower's debt capacity, collateral coverage, payment history and delinquency
experience, financial flexibility and earnings strength, the expected amounts and sources of repayment, the level and nature of contingencies, if any, and the industry and geography in which the borrower operates. These factors are based on an evaluation of historical and current information, and involve subjective assessment and interpretation. Credit counterparties are evaluated and risk-rated on an
individual basis at least annually. Management considers the ratings to be current as of
December 31, 2014
.
The following table presents our recorded investment in loans and leases, disaggregated based on our impairment methodology, as of the dates indicated:
|
December 31, 2014
|
December 31, 2013
|
||||||||||||||||||||||
|
(In millions)
|
Institutional
|
Commercial Real Estate
|
Total Loans and Leases
|
Institutional
|
Commercial Real Estate
|
Total Loans and Leases
|
|||||||||||||||||
|
Loans and leases:
|
|||||||||||||||||||||||
|
Individually evaluated for impairment
|
$
|
—
|
|
$
|
—
|
|
$
|
—
|
|
$
|
26
|
|
$
|
180
|
|
$
|
206
|
|
|||||
|
Collectively evaluated for impairment
(1)
|
18,171
|
|
28
|
|
18,199
|
|
13,251
|
|
29
|
|
13,280
|
|
|||||||||||
|
Total
|
$
|
18,171
|
|
$
|
28
|
|
$
|
18,199
|
|
$
|
13,277
|
|
$
|
209
|
|
$
|
13,486
|
|
|||||
(1)
For those portfolios where there are a small number of loans each with a large balance, we review each loan annually for indicators of impairment. For those loans where no such indicators are identified, the loans are collectively evaluated for impairment. As of
December 31, 2014
and
2013
, all of the allowance for loan losses of
$38 million
and
$28 million
, respectively, related to institutional loans collectively evaluated for impairment.
152
The following tables present information related to our recorded investment in impaired loans and leases as of the dates indicated:
|
December 31, 2014
|
December 31, 2013
|
||||||||||||||
|
(In millions)
|
Recorded Investment
|
Unpaid
Principal
Balance
(1)
|
Recorded Investment
|
Unpaid
Principal
Balance
(1)
|
|||||||||||
|
With no related allowance recorded:
|
|||||||||||||||
|
CRE—property development
(2)
|
$
|
—
|
|
$
|
—
|
|
$
|
130
|
|
$
|
143
|
|
|||
|
CRE—property development—acquired credit-impaired
|
—
|
|
34
|
|
—
|
|
34
|
|
|||||||
|
CRE—other—acquired credit-impaired
|
—
|
|
22
|
|
—
|
|
21
|
|
|||||||
|
Total CRE
|
$
|
—
|
|
$
|
56
|
|
$
|
130
|
|
$
|
198
|
|
|||
(1)
As of
December 31, 2014
and
2013
, all of the allowance for loan losses of
$38 million
and
$28 million
,
respectively,
related to institutional loans collectively evaluated for impairment.
(2)
Represents loans that were previously modified in troubled debt restructurings and that were repaid in 2014.
In certain circumstances, we restructure troubled loans by granting concessions to borrowers experiencing financial difficulty. Once restructured, the loans are generally considered impaired until their maturity, regardless of whether the borrowers perform under the modified terms of the loans.
No
loans were modified in troubled debt restructurings during the years ended
December 31, 2014
and
2013
.
We generally place loans on non-accrual status once principal or interest payments are 60 days contractually past due, or earlier if management determines that full collection is not probable. Loans 60 days past due, but considered both well-secured and in the process of collection, may be excluded from non-accrual status. When we place a loan on non-accrual status, the accrual of interest is
discontinued and previously recorded but unpaid interest is reversed and generally charged against interest revenue. For loans on non-accrual status, revenue is recognized on a cash basis after recovery of principal, if and when interest payments are received. Loans may be removed from non-accrual status when repayment is reasonably assured and performance under the terms of the loan has been demonstrated.
As of
December 31, 2014
and
2013
,
no
institutional loans or leases and
no
CRE loans were on non-accrual status or 90 days or more contractually past due.
The allowance for loan losses, recorded as a reduction of loans and leases in our consolidated statement of condition, represents management’s estimate of incurred credit losses in our loan-and-lease portfolio as of the balance sheet date. The allowance is evaluated on a regular basis by management. Factors considered in evaluating the appropriate level of the allowance for both the institutional and commercial real estate segments of
our loan-and-lease portfolio include loss experience, the probability of default reflected in our internal risk rating of the counterparty's creditworthiness, current economic conditions and adverse situations that may affect the borrower’s ability to repay, the estimated value of the underlying collateral, if any, the performance of individual credits in relation to contract terms, and other relevant factors.
Loans are charged off to the allowance for loan losses in the reporting period in which either an event occurs that confirms the existence of a loss on a loan or a portion of a loan is determined to be uncollectible. In addition, any impaired loan that is determined to be collateral-dependent is reduced to an amount equal to the fair value of the collateral less costs to sell. A loan is identified as collateral-dependent when management determines that it is probable that the underlying collateral will be the sole source of repayment. Recoveries are recorded on a cash basis as adjustments to the allowance.
The reserve for off-balance sheet credit exposures, recorded in accrued expenses and other liabilities in our consolidated statement of condition, represents management’s estimate of probable credit losses in outstanding letters and lines of credit and other credit-enhancement facilities provided to our clients and outstanding as of the balance sheet date. The reserve is evaluated on a regular basis by management. Factors considered in evaluating the appropriate level of this reserve are similar to those considered with respect to the allowance for loan losses. Provisions to maintain the reserve at a level considered by us to be appropriate to absorb estimated incurred credit losses in outstanding facilities are recorded in other expenses in our consolidated statement of income.
153
The following tables present activity in the allowance for loan losses for the periods indicated:
|
|
Years Ended December 31,
|
||||||||||
|
|
2014
|
2013
|
2012
|
||||||||
|
(In millions)
|
Total Loans and Leases
|
Total Loans and Leases
|
Total Loans and Leases
|
||||||||
|
Allowance for loan losses
(1)
:
|
|||||||||||
|
Beginning balance
|
$
|
28
|
|
$
|
22
|
|
$
|
22
|
|
||
|
Provisions
|
10
|
|
6
|
|
(3
|
)
|
|||||
|
Recoveries
|
—
|
|
—
|
|
3
|
|
|||||
|
Ending balance
|
$
|
38
|
|
$
|
28
|
|
$
|
22
|
|
||
(1)
As of
December 31, 2014
, approximately
$26 million
of our allowance for loan losses was related to senior secured bank loans included in the institutional segment; the remaining
$12 million
was related to other commercial-and-financial loans in the institutional segment.
The provision of
$10 million
recorded in the
year ended
December 31, 2014
was composed of a provision of
$20 million
associated with the senior
secured bank loans, as the portfolio continued to grow and become more seasoned, offset by a negative provision of
$10 million
associated with the pay-down of an unrelated commercial and financial loan with speculative-rated credit quality. The senior secured bank loans are held in connection with our participation in loan syndications in the non-investment-grade lending market.
The provision of
$6 million
recorded in the year ended
December 31, 2013
resulted from our estimate of credit losses incurred on our portfolio of senior secured bank loans.
Loans and leases are reviewed on a regular basis, and any provisions for loan losses that are recorded reflect management's estimate of the amount necessary to maintain the allowance for loan losses at a level considered appropriate to absorb estimated incurred losses in the loan-and-lease portfolio.
Note
5
. Goodwill and Other Intangible Assets
Goodwill represents the excess of the cost of an acquisition over the fair value of the net tangible and other intangible assets acquired. Other intangible assets represent purchased assets that can be distinguished from goodwill because of contractual rights or because the asset can be exchanged on its own or in combination with a related contract, asset or liability. Goodwill is not amortized, but is subject to annual evaluation for impairment. Other intangible assets, which are also subject to annual evaluation for impairment, are mainly related to client relationships, which are amortized on a straight-line basis over periods ranging from
five
to
twenty
years, and core deposit intangible assets, which are amortized over periods ranging from
sixteen
to
twenty-two
years, with such amortization recorded in
other expenses in our consolidated statement of income.
Impairment of goodwill is deemed to exist if the carrying value of a reporting unit, including its allocation of goodwill and other intangible assets, exceeds its estimated fair value. Impairment of other intangible assets is deemed to exist if the balance of the other intangible asset exceeds the cumulative expected net cash inflows related to the asset over its remaining estimated useful life. If these reviews determine that goodwill or other intangible assets are impaired, the value of the goodwill or the other intangible asset is written down through a charge to other expenses in our consolidated statement of income.
The following table presents changes in the carrying amount of goodwill during the periods indicated:
|
Years Ended December 31,
|
|||||||||||||||||||||||
|
|
2014
|
2013
|
|||||||||||||||||||||
|
(In millions)
|
Investment
Servicing
|
Investment
Management
|
Total
|
Investment
Servicing
|
Investment
Management
|
Total
|
|||||||||||||||||
|
Goodwill:
|
|||||||||||||||||||||||
|
Beginning balance
|
$
|
5,999
|
|
$
|
37
|
|
$
|
6,036
|
|
$
|
5,941
|
|
$
|
36
|
|
$
|
5,977
|
|
|||||
|
Foreign currency translation and other, net
|
(206
|
)
|
(4
|
)
|
(210
|
)
|
58
|
|
1
|
|
59
|
|
|||||||||||
|
Ending balance
|
$
|
5,793
|
|
$
|
33
|
|
$
|
5,826
|
|
$
|
5,999
|
|
$
|
37
|
|
$
|
6,036
|
|
|||||
154
The following table presents changes in the net carrying amount of other intangible assets during the periods indicated:
|
Years Ended December 31,
|
|||||||||||||||||||||||
|
|
2014
|
2013
|
|||||||||||||||||||||
|
(In millions)
|
Investment
Servicing
|
Investment
Management
|
Total
|
Investment
Servicing
|
Investment
Management
|
Total
|
|||||||||||||||||
|
Other intangible assets:
|
|||||||||||||||||||||||
|
Beginning balance
|
$
|
2,321
|
|
$
|
39
|
|
$
|
2,360
|
|
$
|
2,492
|
|
$
|
47
|
|
$
|
2,539
|
|
|||||
|
Amortization
|
(213
|
)
|
(9
|
)
|
(222
|
)
|
(205
|
)
|
(9
|
)
|
(214
|
)
|
|||||||||||
|
Foreign currency translation and other, net
|
(110
|
)
|
(3
|
)
|
(113
|
)
|
34
|
|
1
|
|
35
|
|
|||||||||||
|
Ending balance
|
$
|
1,998
|
|
$
|
27
|
|
$
|
2,025
|
|
$
|
2,321
|
|
$
|
39
|
|
$
|
2,360
|
|
|||||
The following table presents the gross carrying amount, accumulated amortization and net carrying amount of other intangible assets by type as of the dates indicated:
|
|
December 31, 2014
|
December 31, 2013
|
|||||||||||||||||||||
|
(In millions)
|
Gross
Carrying
Amount
|
Accumulated
Amortization
|
Net
Carrying
Amount
|
Gross
Carrying
Amount
|
Accumulated
Amortization
|
Net
Carrying
Amount
|
|||||||||||||||||
|
Client relationships
|
$
|
2,569
|
|
$
|
(1,088
|
)
|
$
|
1,481
|
|
$
|
2,706
|
|
$
|
(975
|
)
|
$
|
1,731
|
|
|||||
|
Core deposits
|
688
|
|
(219
|
)
|
469
|
|
717
|
|
(191
|
)
|
526
|
|
|||||||||||
|
Other
|
214
|
|
(139
|
)
|
75
|
|
234
|
|
(131
|
)
|
103
|
|
|||||||||||
|
Total
|
$
|
3,471
|
|
$
|
(1,446
|
)
|
$
|
2,025
|
|
$
|
3,657
|
|
$
|
(1,297
|
)
|
$
|
2,360
|
|
|||||
Amortization expense related to other intangible assets was
$222 million
,
$214 million
and
$198 million
for the years ended
December 31, 2014
,
2013
and
2012
, respectively. An impairment of approximately
$9 million
associated with intangible assets was included in amortization expense in 2014. Expected future amortization expense for other intangible assets recorded as of
December 31, 2014
is
$203 million
for 2015,
$199 million
for 2016,
$192 million
for 2017,
$166 million
for 2018 and
$151 million
for 2019.
Note
6
. Other Assets
The following table presents the components of other assets as of the dates indicated:
|
(In millions)
|
December 31, 2014
|
December 31, 2013
|
|||||
|
Collateral deposits, net
|
$
|
18,134
|
|
$
|
13,706
|
|
|
|
Unrealized gains on derivative financial instruments, net
|
7,934
|
|
5,476
|
|
|||
|
Bank-owned life insurance
|
2,402
|
|
2,343
|
|
|||
|
Investments in joint ventures and other unconsolidated entities
|
1,798
|
|
1,644
|
|
|||
|
Accounts receivable
|
513
|
|
950
|
|
|||
|
Income taxes receivable
|
396
|
|
337
|
|
|||
|
Prepaid expenses
|
259
|
|
286
|
|
|||
|
Receivable for securities settlement
|
218
|
|
195
|
|
|||
|
Deferred tax assets, net of valuation allowance
(1)
|
214
|
|
263
|
|
|||
|
Deposits with clearing organizations
|
197
|
|
177
|
|
|||
|
Other
(2)
|
535
|
|
613
|
|
|||
|
Total
|
$
|
32,600
|
|
$
|
25,990
|
|
|
|
(1)
|
Deferred tax assets and liabilities recorded in our consolidated statement of condition are netted within the same tax jurisdiction. Gross deferred tax assets and liabilities are presented in note
22
.
|
|
(2)
|
Includes other real estate owned of approximately
$62 million
and
$59 million
as of
December 31, 2014
and
2013
, respectively.
|
155
|
Note 7.
|
Deposits
|
As of
December 31, 2014
, we had
$56.42 billion
of time deposits outstanding, of which
$660 million
were non-U.S. and all of which are scheduled to mature in 2015. As of
December 31, 2013
, we had
$2.02 billion
of time deposits outstanding, all of which were non-U.S. As of
December 31, 2014
and
2013
, substantially all U.S. and non-U.S. time deposits were in amounts of
$100,000
or more.
|
Note
8
.
|
Short-Term Borrowings
|
Our short-term borrowings include securities sold under repurchase agreements, federal funds
purchased and other short-term borrowings; other short-term borrowings include borrowings associated with our tax-exempt investment program, more fully described in note
12
, and commercial paper issued in connection with our corporate program, under which we can issue up to
$3 billion
of commercial paper with original maturities of up to
270
days from the date of issuance. Collectively, short-term borrowings had weighted-average interest rates of
0.04%
and
0.48%
for the years ended
December 31, 2014
and
2013
, respectively.
The following tables present information with respect to the amounts outstanding and weighted-average interest rates of the primary components of our short-term borrowings as of and for the years ended
December 31
:
|
|
Securities Sold Under
Repurchase Agreements
|
Federal Funds Purchased
|
|||||||||||||||||||||
|
(Dollars in millions)
|
2014
|
2013
|
2012
|
2014
|
2013
|
2012
|
|||||||||||||||||
|
Balance as of December 31
|
$
|
8,925
|
|
$
|
7,953
|
|
$
|
8,006
|
|
$
|
21
|
|
$
|
19
|
|
$
|
399
|
|
|||||
|
Maximum outstanding as of any month-end
|
10,955
|
|
11,538
|
|
9,306
|
|
29
|
|
570
|
|
1,145
|
|
|||||||||||
|
Average outstanding during the year
|
8,817
|
|
8,436
|
|
7,697
|
|
20
|
|
298
|
|
784
|
|
|||||||||||
|
Weighted-average interest rate as of year-end
|
.005
|
%
|
.003
|
%
|
.06
|
%
|
.01
|
%
|
.13
|
%
|
.13
|
%
|
|||||||||||
|
Weighted-average interest rate for the year
|
—
|
|
.01
|
|
.01
|
|
—
|
|
—
|
|
.09
|
|
|||||||||||
|
|
Tax-Exempt
Investment Program
|
Corporate Commercial Paper
Program
|
|||||||||||||||||||||
|
(Dollars in millions)
|
2014
|
2013
|
2012
|
2014
|
2013
|
2012
|
|||||||||||||||||
|
Balance as of December 31
|
$
|
1,870
|
|
$
|
1,948
|
|
$
|
2,148
|
|
$
|
2,485
|
|
$
|
1,819
|
|
$
|
2,318
|
|
|||||
|
Maximum outstanding as of any month-end
|
1,938
|
|
2,135
|
|
2,274
|
|
2,485
|
|
2,535
|
|
2,503
|
|
|||||||||||
|
Average outstanding during the year
|
1,903
|
|
2,030
|
|
2,214
|
|
2,136
|
|
1,632
|
|
2,382
|
|
|||||||||||
|
Weighted-average interest rate as of year-end
|
.06
|
%
|
.09
|
%
|
.17
|
%
|
.16
|
%
|
.14
|
%
|
.22
|
%
|
|||||||||||
|
Weighted-average interest rate for the year
|
.08
|
|
.13
|
|
.21
|
|
.17
|
|
.18
|
|
.23
|
|
|||||||||||
The following table presents the components of securities sold under repurchase agreements by underlying collateral as of
December 31, 2014
:
|
(In millions)
|
|
||
|
Collateralized by securities purchased under resale agreements
|
$
|
2
|
|
|
Collateralized by investment securities
|
8,923
|
|
|
|
Total
|
$
|
8,925
|
|
Obligations to repurchase securities sold are recorded as a liability in our consolidated statement of condition. U.S. government securities with a fair value of
$9.23 billion
underlying the repurchase agreements remained in our investment securities portfolio as of
December 31, 2014
. The following table presents information about these U.S. government securities and the related repurchase agreements, including accrued interest, as of
December 31, 2014
. The table excludes repurchase agreements collateralized by securities purchased under resale agreements.
|
|
U.S. Government
Securities Sold
|
Repurchase
Agreements
|
||||||||||||
|
(Dollars in millions)
|
Amortized
Cost
|
Fair Value
|
Amortized
Cost
|
Rate
|
||||||||||
|
Overnight maturity
|
$
|
9,316
|
|
$
|
9,228
|
|
$
|
8,923
|
|
.004
|
%
|
|||
We maintain an agreement with a clearing organization that enables us to net all securities purchased under resale agreements and sold under repurchase agreements with counterparties that are also members of the clearing organization. As a result of this netting, the average balances of securities purchased under resale agreements and securities sold under repurchase agreements were reduced by
$28.82 billion
for
2014
and by
$27.81 billion
for
2013
.
State Street Bank currently maintains a line of credit of CAD
$800 million
, or approximately
$690 million
as of
December 31, 2014
, to support its Canadian securities processing operations. The line of credit has no stated termination date and is cancelable by either party with prior notice. As of
156
December 31, 2014
and
2013
, there was
no
balance outstanding on this line of credit.
Note
9
. Long-Term Debt
|
As of December 31,
|
2014
|
2013
|
|||||
|
(In millions)
|
|||||||
|
Statutory business trusts:
|
|||||||
|
Floating-rate subordinated notes due to State Street Capital Trust IV in 2037
|
$
|
800
|
|
$
|
800
|
|
|
|
Floating-rate subordinated notes due to State Street Capital Trust I in 2028
|
155
|
|
155
|
|
|||
|
Parent company and non-banking subsidiary issuances:
|
|||||||
|
3.70% notes due in 2023
(1)
|
1,043
|
|
974
|
|
|||
|
2.875% notes due 2016
|
1,005
|
|
1,010
|
|
|||
|
3.30% notes due 2024
(1)
|
999
|
|
—
|
|
|||
|
3.10% subordinated notes due 2023
(1)
|
983
|
|
918
|
|
|||
|
Long-term capital leases
|
769
|
|
788
|
|
|||
|
4.375% notes due 2021
|
730
|
|
727
|
|
|||
|
4.956% junior subordinated debentures due 2018
|
528
|
|
537
|
|
|||
|
4.30% notes due 2014
|
—
|
|
502
|
|
|||
|
1.35% notes due 2018
(1)
|
492
|
|
487
|
|
|||
|
5.375% notes due 2017
|
450
|
|
450
|
|
|||
|
Floating-rate notes due 2014
|
—
|
|
250
|
|
|||
|
7.35% notes due 2026
|
150
|
|
150
|
|
|||
|
State Street Bank issuances:
|
|||||||
|
Floating-rate extendible notes due 2016
|
900
|
|
900
|
|
|||
|
5.25% subordinated notes due 2018
|
433
|
|
442
|
|
|||
|
5.30% subordinated notes due 2016
|
405
|
|
409
|
|
|||
|
Floating-rate subordinated notes due 2015
|
200
|
|
200
|
|
|||
|
Total long-term debt
|
$
|
10,042
|
|
$
|
9,699
|
|
|
|
(1)
|
We have entered into interest-rate swap agreements, recorded as fair value hedges, to modify our interest expense on these senior and subordinated notes from a fixed rate to a floating rate. As of
December 31, 2014
, the carrying value of long-term debt associated with these fair value hedges increased
$76 million
. As of
December 31, 2013
, the carrying value of long-term debt associated with these fair value hedges decreased
$35 million
. Refer to note
16
for additional information about fair value hedges.
|
We maintain an effective universal shelf registration that allows for the offering and sale of debt securities, capital securities, common stock, depositary shares and preferred stock, and warrants to purchase such securities, including any shares into which the preferred stock and depositary shares may be convertible, or any combination thereof.
As of
December 31, 2014
, State Street Bank had Board authority to issue unsecured senior debt securities from time to time, provided that the aggregate principal amount of such unsecured senior debt outstanding at any one time does not exceed
$5 billion
. As of
December 31, 2014
,
$4.1 billion
was available for issuance pursuant to this authority. As of
December 31, 2014
, State Street Bank also had Board authority to issue an additional
$500 million
of subordinated debt.
Statutory Business Trusts:
As of
December 31, 2014
, we had
two
statutory business trusts, State Street Capital Trusts I and IV, which as of
December 31, 2014
had collectively issued
$955 million
of trust preferred capital securities. Proceeds received by each of the trusts from their capitalization and from their capital securities issuances are invested in junior subordinated debentures issued by the parent company. The junior subordinated debentures are the sole assets of Capital Trusts I and IV. Each of the trusts is wholly-owned by us; however, in conformity with GAAP, we do not record the trusts in our consolidated financial statements.
Payments made by the trusts to holders of the capital securities are dependent on our payments made to the trusts on the junior subordinated debentures. Our fulfillment of these commitments has the effect of providing a full, irrevocable and unconditional guarantee of the trusts’ obligations
157
under the capital securities. While the capital securities issued by the trusts are not recorded in our consolidated statement of condition, the junior subordinated debentures qualify for inclusion in tier 1 regulatory capital under current federal regulatory capital guidelines. Information about restrictions on our ability to obtain funds from our subsidiary banks is provided in note
15
.
Interest paid by the parent company on the debentures is recorded in interest expense. Distributions to holders of the capital securities by the trusts are payable from interest payments received on the debentures and are due quarterly by State Street Capital Trusts I and IV, subject to deferral for up to
five
years under certain conditions. The capital securities are subject to mandatory redemption in whole at the stated maturity upon repayment of the debentures, with an option by us to redeem the debentures at any time. Such optional redemption is subject to federal regulatory approval.
Parent Company and Non-Banking Subsidiary Issuances:
Interest on the
2.875%
senior notes and the
4.375%
senior notes is payable semi-annually in arrears on March 7 and September 7 of each year.
In December 2014, we issued
$1.0 billion
of
3.30%
senior notes due
December 16, 2024
. Interest on the senior notes is payable semi-annually in arrears on June 16 and December 16 of each year, beginning on June 16, 2015.
Interest on the
3.70%
senior notes is payable semi-annually in arrears on May 20 and November 20 of each year.
Interest on the
3.10%
subordinated notes is payable semi-annually in arrears on May 15 and November 15 of each year. The
3.10%
subordinated notes qualify for inclusion in tier 2 regulatory capital under current federal regulatory capital guidelines.
As of
December 31, 2014
and
2013
, long-term capital leases included
$336 million
and
$363 million
, respectively, related to our One Lincoln Street headquarters building and related underground parking garage;
$241 million
and
$267 million
, respectively, related to an office building in the U.K.; and
$191 million
and
$158 million
, respectively, related to obligations associated with the completed construction of the Channel Center, a build-to-suit office building located in Boston, and other premises and equipment. Refer to note
20
for additional information.
Interest on the
4.956%
junior subordinated debentures is payable semi-annually in arrears on March 15 and September 15 of each year. The debentures mature on
March 15, 2018
, and we do not
have the right to redeem the debentures prior to maturity other than upon the occurrence of specified events. Such redemption is subject to federal regulatory approval. The junior subordinated debentures qualify for inclusion in tier 2 regulatory capital under current federal regulatory capital guidelines.
Interest on the
1.35%
senior notes is payable semi-annually in arrears on May 15 and November 15 of each year.
Interest on the
5.375%
senior notes is payable semi-annually in arrears on April 30 and October 30 of each year.
Interest on the
7.35%
senior notes is payable semi-annually in arrears on June 15 and December 15 of each year. We may not redeem the notes prior to their maturity.
State Street Bank Issuances:
Each of the floating-rate extendible notes, issued in 2012, had an initial maturity date of
January 13, 2014
; on the 18th day of each month, holders are entitled to extend the maturity date of their notes for successive one-month periods in accordance with defined procedures. In no event may the maturity of any note be extended beyond
January 15, 2016
, the final maturity date. Beginning on
January 15, 2015
, State Street Bank may redeem some or all of the notes at
100%
of the principal amount of the notes to be redeemed, plus accrued interest to the redemption date, and on February 17, 2015, State Street Bank issued a notice of redemption for 100% of the principal amount of the notes. The redemption will occur on February 26, 2015.
State Street Bank is required to make semi-annual interest payments on the outstanding principal balance of the
5.25%
subordinated bank notes on April 15 and October 15 of each year, and the notes qualify for inclusion in tier 2 regulatory capital under current federal regulatory capital guidelines.
State Street Bank is required to make semi-annual interest payments on the outstanding principal balance of the
5.30%
subordinated notes on January 15 and July 15 of each year, and quarterly interest payments on the outstanding principal balance of the floating-rate notes on March 8, June 8, September 8 and December 8 of each year. Each of the subordinated notes qualifies for inclusion in tier 2 regulatory capital under current federal regulatory capital guidelines.
158
Note
10
. Commitments and Guarantees
Commitments:
We had unfunded off-balance sheet commitments to extend credit totaling
$24.25 billion
and
$21.30 billion
as of
December 31, 2014
and
2013
, respectively. The potential losses associated with these commitments equal the gross contractual amounts, and do not consider the value of any collateral. As of
December 31, 2014
, approximately
76%
of our unfunded commitments to extend credit expire within
one
year. Since many of these commitments are expected to expire or renew without being drawn upon, the gross contractual amounts do not necessarily represent our future cash requirements.
Guarantees:
Off-balance sheet guarantees comprise indemnified securities financing, stable value protection, unfunded commitments to purchase assets, and standby letters of credit. The potential losses associated with these guarantees equal the gross contractual amounts, and do not consider the value of any collateral. The following table presents the aggregate gross contractual amounts of our off-balance sheet guarantees as of the dates indicated. Amounts presented do not reflect participations to independent third parties.
|
(In millions)
|
December 31, 2014
|
December 31, 2013
|
|||||
|
Indemnified securities financing
|
$
|
349,766
|
|
$
|
320,078
|
|
|
|
Stable value protection
|
23,409
|
|
24,906
|
|
|||
|
Asset purchase agreements
|
4,107
|
|
4,685
|
|
|||
|
Standby letters of credit
|
4,720
|
|
4,612
|
|
|||
Indemnified Securities Financing
On behalf of our clients, we lend their securities, as agent, to brokers and other institutions. In most circumstances, we indemnify our clients for the fair market value of those securities against a failure of the borrower to return such securities. We require the borrowers to maintain collateral in an amount in excess of
100%
of the fair market value of the securities borrowed. Securities on loan and the collateral are revalued daily to determine if additional collateral is necessary or if excess collateral is required to be returned to the borrower. Collateral received in connection with our securities lending services is held by us as agent and is not recorded in our consolidated statement of condition.
The cash collateral held by us as agent is invested on behalf of our clients. In certain cases, the cash collateral is invested in third-party repurchase agreements, for which we indemnify the client against
loss of the principal invested. We require the counterparty to the indemnified repurchase agreement to provide collateral in an amount in excess of
100%
of the amount of the repurchase agreement. In our role as agent, the indemnified repurchase agreements and the related collateral held by us are not recorded in our consolidated statement of condition.
The following table summarizes the aggregate fair values of indemnified securities financing and related collateral, as well as collateral invested in indemnified repurchase agreements, as of the dates indicated:
|
(In millions)
|
December 31, 2014
|
December 31, 2013
|
|||||
|
Fair value of indemnified securities financing
|
$
|
349,766
|
|
$
|
320,078
|
|
|
|
Fair value of cash and securities held by us, as agent, as collateral for indemnified securities financing
|
364,411
|
|
331,732
|
|
|||
|
Fair value of collateral for indemnified securities financing invested in indemnified repurchase agreements
|
85,309
|
|
85,374
|
|
|||
|
Fair value of cash and securities held by us or our agents as collateral for investments in indemnified repurchase agreements
|
90,819
|
|
91,097
|
|
|||
In certain cases, we participate in securities finance transactions as a principal. As a principal, we borrow securities from the lending client and then lend such securities to the subsequent borrower, either a State Street client or a broker/dealer. Collateral provided and received in connection with such transactions is recorded in other assets and accrued expenses and other liabilities, respectively, in our consolidated statement of condition. As of
December 31, 2014
and
2013
, we had approximately
$15.94 billion
and
$11.29 billion
, respectively, of collateral provided and approximately
$6.48 billion
and
$6.62 billion
, respectively, of collateral received from clients in connection with our participation in principal securities finance transactions.
Stable Value Protection
In the normal course of our business, we offer products that provide book-value protection, primarily to plan participants in stable value funds managed by non-affiliated investment managers of post-retirement defined contribution benefit plans, particularly 401(k) plans. The book-value protection is provided on portfolios of intermediate investment grade fixed-income securities, and is intended to provide safety and stable growth of principal invested. The protection is intended to cover any shortfall in the
159
event that a significant number of plan participants withdraw funds when book value exceeds market value and the liquidation of the assets is not sufficient to redeem the participants. The investment parameters of the underlying portfolios, combined with structural protections, are designed to provide cushion and guard against payments even under extreme stress scenarios.
These contingencies are individually accounted for as derivative financial instruments. The notional amounts of the stable value contracts are presented as “derivatives not designated as hedging instruments” in the table of aggregate notional amounts of derivative financial instruments provided in note
16
. We have not made a payment under these contingencies that we consider material to our consolidated financial condition, and management believes that the probability of payment under these contingencies in the future, that we would consider material to our consolidated financial condition, is remote.
Note
11
. Contingencies
Legal and Regulatory Matters:
In the ordinary course of business, we and our subsidiaries are involved in disputes, litigation, and governmental or regulatory inquiries and investigations, both pending and threatened. These matters, if resolved adversely against us or settled, may result in monetary damages, fines and penalties or require changes in our business practices. The resolution or settlement of these matters is inherently difficult to predict. Based on our assessment of these pending matters, we do not believe that the amount of any judgment, settlement or other action arising from any pending matter is likely to have a material adverse effect on our consolidated financial condition. However, an adverse outcome in certain of the matters described below could have a material adverse effect on our consolidated results of operations for the period in which such matter is resolved, or an accrual is determined to be required on our consolidated financial condition, or on our reputation.
We evaluate our needs for accruals of loss contingencies related to legal proceedings on a case-by-case basis. When we have a liability that we deem probable and that we deem can be reasonably estimated as of the date of our consolidated financial statements, we accrue for our estimate of the loss. We also consider a loss probable and establish an accrual when we make or intend to make an offer of settlement. Once established, an accrual is subject to subsequent adjustment as a result of additional information. The resolution of proceedings and the
reasonably estimable loss (or range thereof) are inherently difficult to predict, especially in the early stages of proceedings. Even if a loss is probable, due to many complex factors, such as speed of discovery and the timing of court decisions or rulings, a loss or range of loss might not be reasonably estimated until the later stages of the proceeding.
As of
December 31, 2014
, our aggregate accruals for legal loss contingencies and regulatory matters, net of anticipated insurance recoveries, totaled approximately
$224 million
. To the extent that we have established accruals in our consolidated statement of condition for probable loss contingencies, such accruals may not be sufficient to cover our ultimate financial exposure associated with any settlements or judgments. We may be subject to proceedings in the future that, if adversely resolved, would have a material adverse effect on our businesses or on our future consolidated financial statements. Except where otherwise noted below, we have not established accruals with respect to the claims discussed and do not believe that potential exposure is probable and can be reasonably estimated.
The following discussion provides information with respect to significant legal and regulatory matters.
Securities Finance
Two
related participants in our agency securities lending program have brought suit against us challenging actions taken by us in response to their withdrawal from the program. We believe that certain withdrawals by these participants were inconsistent with the redemption policy applicable to the agency lending collateral pools and, consequently, redeemed their remaining interests through an in-kind distribution that reflected the assets these participants would have received had they acted in accordance with the collateral pools' redemption policy. In taking these actions, we believe that we acted in the best interests of all participants in the collateral pools. The
two
participants have asserted damages of
$125 million
, an amount that plaintiffs attribute to alleged deficiencies in the methodology that State Street used to construct the in-kind distribution and alleged errors in the pricing of the securities that plaintiffs received on or about August 2009. While management does not believe that such difference is an appropriate measure of damages, we have been informed that the participants liquidated these securities in June 2013, and we estimate the loss on those sales to be approximately
$11 million
. Discovery with respect to this matter is expected to be completed in 2015. As of
December 31, 2014
, we
160
had
$10 million
accrued in connection with this matter.
Foreign Exchange
We offer our custody clients and their investment managers the option to route foreign exchange transactions to our foreign exchange desk through our asset servicing operation. We record as revenue an amount approximately equal to the difference between the rates we set for those trades and indicative interbank market rates at the time of settlement of the trade.
As discussed more fully below, claims have been asserted on behalf of certain current and former custody clients, and future claims may be asserted, alleging that our indirect foreign exchange rates (including the differences between those rates and indicative interbank market rates at the time we executed the trades) were not adequately disclosed or were otherwise improper, and seeking to recover, among other things, the full amount of the revenue we obtained from our indirect foreign exchange trading with them.
In October 2009, the Attorney General of the State of California commenced an action under the California False Claims Act and California Business and Professional Code related to services State Street provides to California state pension plans. The California Attorney General asserts that the pricing of certain foreign exchange trades for these pension plans was governed by the custody contracts for these plans and that our pricing was not consistent with the terms of those contracts and related disclosures to the plans, and that, as a result, State Street made false claims and engaged in unfair competition. The Attorney General asserts actual damages of approximately
$100 million
for periods from 2001 to 2009 and seeks additional penalties, including treble damages. This action is in the discovery phase.
We provide custody services to and engage in principal foreign exchange trading with government pension plans in other jurisdictions. Since the commencement of the litigation in California, attorneys general and other government authorities from a number of jurisdictions, as well as U.S.
Attorney's offices, the U.S. Department of Labor and the SEC, have requested information or issued subpoenas in connection with inquiries into the pricing of our indirect foreign exchange trading. We continue to respond to such inquiries and subpoenas.
We engage in indirect foreign exchange trading with a broad range of custody clients in the U.S. and internationally. We have responded and are responding to information requests from a number of
clients concerning our indirect foreign exchange rates. In February 2011, a putative class action was filed in federal court in Boston seeking unspecified damages, including treble damages, on behalf of all custodial clients that executed certain foreign exchange transactions with State Street from 1998 to 2009. The putative class action alleges, among other things, that the rates at which State Street executed foreign currency trades constituted an unfair and deceptive practice under Massachusetts law and a breach of the duty of loyalty.
Two
other putative class actions are currently pending in federal court in Boston alleging various violations of ERISA on behalf of all ERISA plans custodied with us that executed indirect foreign exchange trades with State Street from 1998 onward. The complaints allege that State Street caused class members to pay unfair and unreasonable rates on indirect foreign exchange trades with State Street. The complaints seek unspecified damages, disgorgement of profits, and other equitable relief. Other claims may be asserted in the future, including in response to developments in the actions discussed above or governmental proceedings.
We expect that plaintiffs will seek to recover their share of all or a portion of the revenue that we have recorded from indirect foreign exchange trades. We cannot predict whether a court, in the event of an adverse resolution, would consider our revenue to be the appropriate measure of damages.
The following table summarizes our estimated total revenue worldwide from indirect foreign exchange trading for the years ended December 31:
|
(In millions)
|
Revenue from indirect foreign exchange trading
|
|||
|
2008
|
$
|
462
|
|
|
|
2009
|
369
|
|
||
|
2010
|
336
|
|
||
|
2011
|
331
|
|
||
|
2012
|
248
|
|
||
|
2013
|
285
|
|
||
|
2014
|
246
|
|
||
We believe that the amount of our revenue from such trading has been of a similar or lesser order of magnitude for many years prior to 2008. Our revenue calculations related to indirect foreign exchange trading reflect a judgment concerning the relationship between the rates we charge for indirect foreign exchange execution and indicative interbank market rates near in time to execution. Our revenue from foreign exchange trading generally depends on the
161
difference between the rates we set for those indirect trades and indicative interbank market rates at the time of settlement of the trade.
In the third quarter of 2014, we recorded an accrual of
$70 million
reflecting our intention to seek to resolve some, but not all, of the outstanding and potential claims arising out of our indirect foreign exchange client activities. We increased this accrual to
$185 million
as of
December 31, 2014
. We are engaged in discussions with some, but not all, of the governmental agencies and civil litigants discussed above regarding potential settlements of their outstanding or potential claims. There can be no assurance that we will reach a settlement in any of these matters, that the cost of such settlements will not materially exceed our accrued reserve, or that other claims will not be asserted. We do not currently intend to seek to negotiate settlements with respect to all outstanding and potential claims, and our current efforts, even if successful, will not address all of our potential material legal exposure arising out of our indirect foreign exchange client activities.
Transition Management
In January 2014, we entered into a settlement with the U.K. Financial Conduct Authority, or FCA, pursuant to which we paid a fine of
£22.9 million
(approximately
$37.8 million
), as a result of our having charged
six
clients of our U.K. transition management business during 2010 and 2011 amounts in excess of the contractual terms. The SEC and the U.S. Attorney are conducting separate investigations into this matter. As of
December 31, 2014
, we had remaining accruals of approximately
$3.0 million
for indemnification costs associated with this matter.
Investment Servicing
State Street has been named as a defendant in related complaints by investment management clients of TAG Virgin Islands, Inc., or TAG, who hold or held custodial accounts with State Street. The complaints collectively have alleged various claims in connection with certain assets managed by TAG. As of
December 31, 2014
,
one
action remains pending. As of
December 31, 2014
, we had
$4.3 million
accrued with respect to these matters.
Income Taxes:
In determining our provision for income taxes, we make certain judgments and interpretations with respect to tax laws in jurisdictions in which we have business operations. Because of the complex nature of these laws, in the normal course of our business, we are subject to challenges from U.S. and non-U.S. income tax authorities regarding the amount of
income taxes due. These challenges may result in adjustments to the timing or amount of taxable income or deductions or the allocation of taxable income among tax jurisdictions. We recognize a tax benefit when it is more likely than not that our position will result in a tax deduction or credit. Additional information with respect to our provision for income taxes and tax benefits, including unrecognized tax benefits, is provided in note
22
.
We are presently under audit by a number of tax authorities. The earliest tax year open to examination in jurisdictions where we have material operations is 2009. The Internal Revenue Service, or IRS, completed their audit field procedures for the current audit related to our U.S. income tax returns for the tax years 2010 and 2011.
Note
12
. Variable Interest Entities
Asset-Backed Investment Securities:
We are involved, in the normal course of our business, with various types of special purpose entities, some of which meet the definition of variable interest entities, or VIEs. We are required by GAAP to consolidate a VIE when we are deemed to be the primary beneficiary. This determination is evaluated periodically as facts and circumstances change.
We invest in various forms of asset-backed securities, which we carry in our investment securities portfolio. These asset-backed securities meet the GAAP definition of asset securitization entities, which are considered to be VIEs. We are not considered to be the primary beneficiary of these VIEs since we do not have control over their activities. Additional information about our asset-backed securities is provided in note
3
.
162
Tax-Exempt Investment Program:
In the normal course of our business, we structure and sell certificated interests in pools of tax-exempt investment-grade assets, principally to our mutual fund clients. We structure these pools as partnership trusts, and the assets and liabilities of the trusts are recorded in our consolidated statement of condition as investment securities available for sale and other short-term borrowings. We may also provide liquidity and re-marketing services to the trusts. As of
December 31, 2014
and
2013
, we carried investment securities available for sale, composed of securities related to state and political subdivisions, with a fair value of
$2.27 billion
and
$2.33 billion
, respectively, and other short-term borrowings of
$1.87 billion
and
$1.95 billion
, respectively, in our consolidated statement of condition in connection with these trusts. The interest revenue and interest expense generated by the investments and certificated interests, respectively, are recorded as components of net interest revenue when earned or incurred.
We transfer assets to the trusts from our investment securities portfolio at adjusted book value, and the trusts finance the acquisition of these assets by selling certificated interests issued by the trusts to third-party investors and to State Street as residual holder. These transfers do not meet the de-recognition criteria defined by GAAP
,
and therefore, the assets continue to be recorded in our consolidated financial statements. The trusts had a weighted-average life of approximately
5.9
years as of
December 31, 2014
, compared to approximately
6.5
years as of
December 31, 2013
.
Under separate legal agreements, we provide standby bond-purchase agreements to these trusts and, with respect to certain securities, letters of credit. Our commitments to the trusts under these standby bond-purchase agreements and letters of credit totaled
$1.91 billion
and
$674 million
, respectively, as of
December 31, 2014
,
none
of which was utilized as of that date. In the event that our obligations under these agreements are triggered, no material impact to our consolidated results of operations or financial condition is expected to occur, because the securities are already recorded at fair value in our consolidated statement of condition.
Interests in Sponsored Investment Funds:
In the normal course of business, we manage various types of sponsored investment funds through SSGA. The services we provide to these sponsored investment funds generate management fee revenue. From time to time, we may invest cash in the funds, which we refer to as seed capital, in order for the
funds to establish a performance history for newly-launched strategies.
With respect to our interests in sponsored investment funds that meet the definition of a VIE, a primary beneficiary assessment is performed to determine if our variable interest (or combination of variable interests, including those of related parties) absorbs the majority of the entity’s expected losses, receives a majority of the entity’s expected residual returns, or both. As part of our assessment, we consider all the facts and circumstances regarding the terms and characteristics of the variable interest(s), the design and characteristics of the fund and the other involvements of the enterprise with the fund. Upon consolidation of certain sponsored investment funds, we retain the specialized investment company accounting rules followed by the underlying funds.
All of the underlying investments held by such consolidated sponsored investment funds are carried at fair value, with corresponding changes in the investments’ fair values reflected in trading services revenue in our consolidated statement of income. When we no longer control these funds due to a reduced ownership interest or other reasons, the funds are de-consolidated and accounted for under another accounting method if we continue to maintain an investment in the fund.
As of
December 31, 2014
, we were an investor in a sponsored investment fund, considered to be a VIE, which was initially launched on
December 31, 2013
. Given the extent of our exposure to the variability of the net assets of the fund, we were deemed to be the fund’s primary beneficiary, and as a result we include the fund in our consolidated financial statements. The fund's activities consist primarily of active trading in various equity, fixed-income, currency, commodity and futures markets. Such activities are included in our consolidated financial statements.
As of
December 31, 2014
, the aggregate assets and liabilities of this consolidated sponsored investment fund totaled
$65 million
and
$13 million
, respectively. As of
December 31, 2013
, the fund’s assets consisted solely of
$50 million
in cash.
As of
December 31, 2014
our potential maximum total exposure associated with the consolidated sponsored investment fund totaled
$52 million
and represented the value of our economic ownership interest in the fund. We expect any financial losses that we realize over time from these seed investments to be limited to the actual fair value of the amount invested in the consolidated fund, which is based on the fair value of the underlying
163
investment securities held by the funds. However, in the event of a fund wind-down, gross gains and losses of the fund may be recognized for financial accounting purposes in different periods during the time the fund is consolidated but not wholly owned. Although we expect the actual economic loss to be limited to the amount invested, our losses in any period could exceed the value of our economic interests in the fund and could exceed the value of our initial seed capital investment.
Our conclusion to consolidate a sponsored investment fund may vary from period to period, most commonly as a result of fluctuation in our ownership interest as a result of changes in the number of fund shares held by either us or by third parties. Given that the funds follow specialized investment company accounting rules which prescribe fair value, a de-consolidation generally would not result in gains or losses for us.
The net assets of any consolidated fund are solely available to settle the liabilities of the fund and to settle any investors’ ownership redemption requests, including any seed capital invested in the fund by State Street. We are not contractually required to provide financial or any other support to any of our sponsored investment funds. In addition, neither creditors nor equity investors in the sponsored investment funds have any recourse to State Street’s general credit.
As of
December 31, 2014
and
2013
, we managed certain sponsored investment funds, considered VIEs, in which we held a variable interest but for which we were not deemed to be the primary beneficiary. Our potential maximum loss exposure related to these unconsolidated funds totaled
$45 million
and
$18 million
as of
December 31, 2014
and
2013
, respectively, and represented the carrying value of our seed capital investment, which is recorded in either investment securities available for sale or other assets in our consolidated statement of condition. The amount of loss we may recognize during any period is limited to the carrying amount of our seed capital investment in the unconsolidated fund.
Note
13
. Shareholders’ Equity
Preferred Stock:
Preferred Stock, Series E
In November 2014, we issued
30 million
depositary shares, each representing a
1/4,000th
ownership interest in a share of State Street’s non-cumulative perpetual preferred stock, Series E, without par value per share, with a liquidation preference of
$100,000
per share (equivalent to
$25
per depositary share), which we refer to as our Series E preferred stock, in a public offering. The aggregate proceeds from the offering, net of underwriting discounts, commissions and other issuance costs, were approximately
$728 million
.
On December 15, 2019, or any dividend payment date thereafter, the Series E preferred stock and corresponding depositary shares may be redeemed by us, in whole or in part, at a redemption price equal to
$100,000
per share (equivalent to
$25
per depositary share) plus any declared and unpaid dividends, without accumulation of any undeclared dividends. The Series E preferred stock and corresponding depositary shares may be redeemed at our option in whole, but not in part, prior to December 15, 2019, upon the occurrence of a regulatory capital treatment event, as defined in the certificate of designation with respect to the Series E preferred stock, at a redemption price equal to
$100,000
per share (equivalent to
$25
per depositary share) plus any declared and unpaid dividends, without accumulation of any undeclared dividends.
In January 2015, we declared dividends on our Series E preferred stock of
$1,833
per share, or approximately
$0.46
per depositary share, totaling approximately
$14 million
, which will be paid in March 2015.
Preferred Stock, Series D
In February 2014, we issued
30 million
depositary shares, each representing a
1/4,000th
ownership interest in a share of State Street’s fixed-to-floating-rate non-cumulative perpetual preferred stock, Series D, without par value per share, with a liquidation preference of
$100,000
per share (equivalent to
$25
per depositary share), which we refer to as our Series D preferred stock, in a public offering. The aggregate proceeds from the offering, net of underwriting discounts, commissions and other issuance costs, were approximately
$742 million
.
On
March 15, 2024
, or any dividend payment date thereafter, the Series D preferred stock and corresponding depositary shares may be redeemed by us, in whole or in part, at a redemption price equal to
$100,000
per share (equivalent to
$25
per depositary share) plus any declared and unpaid dividends, without accumulation of any undeclared dividends. The Series D preferred stock and corresponding depositary shares may be redeemed at our option in whole, but not in part, prior to
March 15, 2024
, upon the occurrence of a regulatory capital treatment event, as defined in the certificate of designation with respect to the Series D preferred stock, at a redemption price equal to
$100,000
per share (equivalent to
$25
per depositary share) plus
164
any declared and unpaid dividends, without accumulation of any undeclared dividends.
In
2014
, we declared aggregate dividends on our Series D preferred stock of
$4,605
per share, or approximately
$1.15
per depositary share, totaling approximately
$35 million
. In January 2015, we declared dividends on our Series D preferred stock of
$1,475
per share, or approximately
$0.37
per depositary share, totaling approximately
$11 million
, which will be paid in March 2015.
Preferred Stock, Series C
In
2014
, we declared aggregate dividends on our Series C preferred stock of
$5,252
per share, or approximately
$1.32
per depositary share, totaling approximately
$26 million
. In
2013
, we declared aggregate dividends on our Series C preferred stock of
$5,250
per share, or approximately
$1.31
per depositary share, totaling approximately
$26 million
. In January 2015, we declared dividends on our Series C preferred stock of
$1,313
per share, or approximately
$0.33
per depositary share, totaling approximately
$7 million
, which will be paid in March 2015.
On
September 15, 2017
, or any dividend payment date thereafter, the Series C preferred stock and corresponding depositary shares may be redeemed by us, in whole or in part, at a redemption price equal to
$100,000
per share (equivalent to
$25
per depositary share) plus any declared and unpaid dividends, without accumulation of any undeclared dividends. The Series C preferred stock and corresponding depositary shares may be redeemed at our option, in whole but not in part, prior to
September 15, 2017
, upon the occurrence of a regulatory capital treatment event, as defined in the certificate of designation with respect to the Series C preferred stock, at a redemption price equal to
$100,000
per share (equivalent to
$25
per depositary share) plus any declared and unpaid dividends, without accumulation of any undeclared dividends.
Dividends on shares of our Series C, Series D and Series E preferred stock are not mandatory and are not cumulative. If declared, dividends will be payable on the liquidation preference of
$100,000
per share quarterly in arrears on March 15, June 15, September 15 or December 15 of each year at annual rates of
5.25%
,
5.90%
and
6.00%
, respectively. If we issue additional shares of our Series C, Series D or Series E preferred stock after the original issue date, dividend rights with respect to such shares will commence from the original issue date of such additional shares. Dividends on our Series C, Series D and Series E preferred stock will not be declared to the extent that such declaration
would cause us to fail to comply with applicable laws and regulations, including applicable federal regulatory capital guidelines.
Common Stock:
In
March 2014
, our Board of Directors approved a common stock purchase program authorizing the purchase of up to
$1.70 billion
of our common stock through
March 31, 2015
. In
2014
, we purchased approximately
17.7 million
shares of our common stock at an average per-share cost of
$69.59
and an aggregate cost of approximately
$1.23 billion
under the program. As of
December 31, 2014
, approximately
$470 million
remained available for purchases of our common stock under the program. Shares acquired under the program which remained unissued as of
December 31, 2014
were recorded as treasury stock in our consolidated statement of condition as of
December 31, 2014
.
In
2014
, we completed a previous Board-authorized common stock purchase program with the purchase of approximately
6.1 million
shares of our common stock at an average cost of
$69.14
per share and an aggregate cost of approximately
$420 million
.
In
2014
, in the aggregate under both programs, we purchased approximately
23.8 million
shares of our common stock at an average per-share cost of
$69.48
and an aggregate cost of approximately
$1.65 billion
.
In
2014
, we declared aggregate common stock dividends of
$1.16
per share, totaling approximately
$490 million
, compared to aggregate common stock dividends of
$1.04
per share, totaling approximately
$463 million
, declared in
2013
.
165
Accumulated Other Comprehensive Income (Loss):
The following table presents the after-tax components of AOCI as of December 31:
|
(In millions)
|
2014
|
2013
|
2012
|
||||||||
|
Net unrealized gains on cash flow hedges
|
$
|
276
|
|
$
|
161
|
|
$
|
69
|
|
||
|
Net unrealized gains (losses) on available-for-sale securities portfolio
|
273
|
|
(56
|
)
|
815
|
|
|||||
|
Net unrealized gains (losses) related to reclassified available-for-sale securities
|
39
|
|
(72
|
)
|
(110
|
)
|
|||||
|
Net unrealized gains (losses) on available-for-sale securities
|
312
|
|
(128
|
)
|
705
|
|
|||||
|
Net unrealized losses on available-for-sale securities designated in fair value hedges
|
(121
|
)
|
(97
|
)
|
(183
|
)
|
|||||
|
Other-than-temporary impairment on available-for-sale securities related to factors other than credit
|
1
|
|
4
|
|
(3
|
)
|
|||||
|
Net unrealized losses on hedges of net investments in non-U.S. subsidiaries
|
(14
|
)
|
(14
|
)
|
(14
|
)
|
|||||
|
Other-than-temporary impairment on held-to-maturity securities related to factors other than credit
|
(29
|
)
|
(47
|
)
|
(65
|
)
|
|||||
|
Net unrealized losses on retirement plans
|
(272
|
)
|
(203
|
)
|
(283
|
)
|
|||||
|
Foreign currency translation
|
(660
|
)
|
229
|
|
134
|
|
|||||
|
Total
|
$
|
(507
|
)
|
$
|
(95
|
)
|
$
|
360
|
|
||
In the
year ended December 31, 2014
, we realized net gains of
$15 million
, or
$9 million
net of related taxes from sales of available-for-sale securities. Unrealized pre-tax losses of
$43 million
were included in AOCI as of
December 31, 2013
, net of deferred tax benefits of
$17 million
, related to these sales. In the
year ended
December 31, 2013
, we
realized net gains of
$14 million
, or
$9 million
net of related taxes, from sales of available-for-sale securities. Unrealized pre-tax gains of
$25 million
were included in AOCI as of
December 31, 2012
, net of deferred taxes of
$10 million
, related to these sales.
The following tables present changes in AOCI by component, net of related taxes, for the periods indicated:
|
Year Ended December 31, 2014
|
|||||||||||||||||||||||||||
|
(In millions)
|
Net Unrealized Gains (Losses) on Cash Flow Hedges
|
Net Unrealized Gains (Losses) on Available-for-Sale Securities
|
Net Unrealized Losses on Hedges of Net Investments in Non-U.S. Subsidiaries
|
Other-Than-Temporary Impairment on Held-to-Maturity Securities
|
Net Unrealized Losses on Retirement Plans
|
Foreign Currency Translation
|
Total
|
||||||||||||||||||||
|
Balance as of December 31, 2012
|
$
|
69
|
|
$
|
519
|
|
$
|
(14
|
)
|
$
|
(65
|
)
|
$
|
(283
|
)
|
$
|
134
|
|
$
|
360
|
|
||||||
|
Other comprehensive income (loss) before reclassifications
|
89
|
|
(735
|
)
|
—
|
|
15
|
|
60
|
|
96
|
|
(475
|
)
|
|||||||||||||
|
Amounts reclassified into earnings
|
3
|
|
(5
|
)
|
—
|
|
3
|
|
20
|
|
(1
|
)
|
20
|
|
|||||||||||||
|
Other comprehensive income (loss)
|
92
|
|
(740
|
)
|
—
|
|
18
|
|
80
|
|
95
|
|
(455
|
)
|
|||||||||||||
|
Balance as of December 31, 2013
|
161
|
|
(221
|
)
|
(14
|
)
|
(47
|
)
|
(203
|
)
|
229
|
|
(95
|
)
|
|||||||||||||
|
Other comprehensive income (loss) before reclassifications
|
112
|
|
422
|
|
—
|
|
17
|
|
—
|
|
(889
|
)
|
(338
|
)
|
|||||||||||||
|
Amounts reclassified into earnings
|
3
|
|
(9
|
)
|
—
|
|
1
|
|
(69
|
)
|
—
|
|
(74
|
)
|
|||||||||||||
|
Other comprehensive income (loss)
|
115
|
|
413
|
|
—
|
|
18
|
|
(69
|
)
|
(889
|
)
|
(412
|
)
|
|||||||||||||
|
Balance as of December 31, 2014
|
$
|
276
|
|
$
|
192
|
|
$
|
(14
|
)
|
$
|
(29
|
)
|
$
|
(272
|
)
|
$
|
(660
|
)
|
$
|
(507
|
)
|
||||||
166
The following tables present after-tax reclassifications into earnings for the periods indicated:
|
Years Ended December 31,
|
|||||||||
|
2014
|
2013
|
||||||||
|
(In millions)
|
Amounts Reclassified into Earnings
|
Affected Line Item in Consolidated Statement of Income
|
|||||||
|
Cash flow hedges:
|
|||||||||
|
Interest-rate contracts, net of related tax benefit of $2 and $2, respectively
|
$
|
3
|
|
$
|
3
|
|
Net interest revenue
|
||
|
Available-for-sale securities:
|
|||||||||
|
Net realized gains from sales of available-for-sale securities, net of related taxes of ($6) and ($5), respectively
|
(9
|
)
|
(9
|
)
|
Net gains (losses) from sales of available-for-sale securities
|
||||
|
Other-than-temporary impairment on available-for-sale securities related to factors other than credit, net of related tax benefit of $2
|
—
|
|
4
|
|
Losses reclassified (from) to other comprehensive income
|
||||
|
Held-to-maturity securities:
|
|||||||||
|
Other-than-temporary impairment on held-to-maturity securities related to factors other than credit, net of related tax benefit of $3 for 2013
|
1
|
|
3
|
|
Losses reclassified (from) to other comprehensive income
|
||||
|
Retirement plans:
|
|||||||||
|
Amortization of actuarial losses, net of related taxes of ($50) and tax benefits of $13, respectively
|
(69
|
)
|
20
|
|
Compensation and employee benefits expenses
|
||||
|
Foreign currency translation:
|
|||||||||
|
Sales of non-U.S. entities, net of related taxes of ($1)
|
—
|
|
(1
|
)
|
Processing fees and other revenue
|
||||
|
Total reclassifications out of AOCI
|
$
|
(74
|
)
|
$
|
20
|
|
|||
167
Note
14
. Equity-Based Compensation
We record compensation expense for equity-based awards, such as restricted stock, deferred stock and performance awards, based on the closing price of our common stock on the date of grant, adjusted if appropriate based on the award’s eligibility to receive dividends. The fair value of stock options and stock appreciation rights is determined using the Black-Scholes valuation model.
Compensation expense related to equity-based awards with service-only conditions and terms that provide for a graded vesting schedule is recognized on a straight-line basis over the required service period for the entire award. Compensation expense related to equity-based awards with performance conditions and terms that provide for a graded vesting schedule is recognized over the requisite service period for each separately vesting tranche of the award, and is based on the probable outcome of the performance conditions at each reporting date. Compensation expense is adjusted for assumptions with respect to the estimated amount of awards that will be forfeited prior to vesting, and for employees who have met certain retirement eligibility criteria.
Dividend equivalents for certain equity-based awards are paid on stock units on a current basis prior to vesting and distribution. Compensation expense for common stock awards granted to employees meeting early retirement eligibility criteria is fully expensed and accrued on the grant date.
As of
December 31, 2014
, a cumulative total of
56.9 million
shares had been awarded under the 2006 Equity Incentive Plan, the 2006 Plan, compared with cumulative totals of
52.4 million
shares and
45.3 million
shares as of
December 31, 2013
and
2012
, respectively. The 2006 Plan allows for shares withheld in payment of the exercise price of an award or in satisfaction of tax withholding requirements, shares forfeited due to employee termination, shares expired under options awards, or shares not delivered when performance conditions have not been met, to be added back to the pool of shares available for awards. As of
December 31, 2014
,
17.8 million
shares had been awarded under the 2006 Plan but not delivered, and have become available for reissue. A total of
60.5 million
shares is available for issuance under the 2006 Plan.
The exercise price of non-qualified and incentive stock options and stock appreciation rights may not be less than the fair value of such shares on the date of grant. Stock options and stock appreciation rights granted under the 1997 Equity Incentive Plan, the 1997 Plan, and the 2006 Plan, collectively the Plans,
generally vest over
four
years and expire no later than
ten
years from the date of grant. No common stock options or stock appreciation rights have been granted since 2009. For restricted stock awards granted under the Plans, common stock is issued at the time of grant and recipients have dividend and voting rights. In general, these grants vest over
three
to
four
years. No restricted stock awards have been granted since 2010.
For deferred stock awards granted under the Plans, no common stock is issued at the time of grant and the stock does not have dividend and voting rights. Generally, these grants vest over
one
to
four
years. Performance awards granted are earned over a performance period based on the achievement of defined goals, generally over
one
to
four
years. Payment for performance awards is made in shares of our common stock equal to its fair market value per share, based on certain financial ratios, after the conclusion of each performance period.
Beginning with 2012, malus-based forfeiture provisions were included in deferred stock awards granted to employees identified as “material risk-takers,” as defined by management. These malus-based forfeiture provisions provide for the reduction or cancellation of unvested deferred compensation, such as deferred stock awards, if it is determined that a material risk-taker made risk-based decisions that exposed State Street to inappropriate risks that resulted in a material unexpected loss at the business-unit, line-of-business or corporate level.
Compensation expense related to stock options, stock appreciation rights, restricted stock awards, deferred stock awards and performance awards, which we record as a component of compensation and employee benefits expense in our consolidated statement of income, was
$329 million
,
$355 million
and
$353 million
for the years ended
December 31, 2014
,
2013
and
2012
, respectively. Such expense for
2014
,
2013
and
2012
excluded
$20 million
,
$3 million
and
$26 million
, respectively, associated with acceleration of expense in connection with the staff reductions discussed in note
21
. This expense was included in the severance-related portion of the associated restructuring charges recorded in each respective year. The aggregate income tax benefit recorded in our consolidated statement of income related to compensation expense recorded as a component of compensation and employee benefits expense was
$130 million
,
$140 million
and
$139 million
for the years ended
December 31, 2014
,
2013
and
2012
, respectively.
168
The following table presents information about the Plans as of
December 31, 2014
, and related activity during the years indicated:
|
Shares
(in thousands)
|
Weighted-Average
Exercise
Price
|
Weighted-Average
Remaining
Contractual
Term
(in years)
|
Total
Intrinsic
Value
(in millions)
|
|||||||||
|
Stock Options and Stock Appreciation Rights:
|
||||||||||||
|
Outstanding as of December 31, 2012
|
5,638
|
|
$
|
57.58
|
|
|||||||
|
Exercised
|
(2,725
|
)
|
45.93
|
|
||||||||
|
Forfeited or expired
|
(249
|
)
|
68.80
|
|
||||||||
|
Outstanding as of December 31, 2013
|
2,664
|
|
68.45
|
|
||||||||
|
Exercised
|
(801
|
)
|
55.33
|
|
||||||||
|
Forfeited or expired
|
(2
|
)
|
52.78
|
|
||||||||
|
Outstanding as of December 31, 2014
|
1,861
|
|
$
|
74.12
|
|
1.9
|
$
|
11
|
|
|||
|
Exercisable as of December 31, 2014
|
1,861
|
|
$
|
74.12
|
|
1.9
|
$
|
11
|
|
|||
The total intrinsic value of options and stock appreciation rights exercised during the years ended
December 31, 2014
,
2013
and
2012
was
$14 million
,
$42 million
and
$8 million
, respectively. As of
December 31, 2014
, there was no unrecognized compensation cost related to stock options and stock appreciation rights.
The following tables present activity related to other common stock awards during the years indicated:
|
Shares
(in thousands)
|
Weighted-Average
Grant Date Fair
Value
|
|||||
|
Restricted Stock Awards:
|
||||||
|
Outstanding as of December 31, 2012
|
2,602
|
|
$
|
43.44
|
|
|
|
Vested
|
(1,339
|
)
|
42.47
|
|
||
|
Forfeited
|
(18
|
)
|
43.98
|
|
||
|
Outstanding as of December 31, 2013
|
1,245
|
|
44.47
|
|
||
|
Vested
|
(1,211
|
)
|
44.56
|
|
||
|
Forfeited
|
(3
|
)
|
42.57
|
|
||
|
Outstanding as of December 31, 2014
|
31
|
|
$
|
41.27
|
|
|
The total fair value of restricted stock awards vested was
$54 million
,
$57 million
, and
$64 million
for the years ended
December 31, 2014
,
2013
and
2012
, respectively. As of
December 31, 2014
, total unrecognized compensation cost related to restricted stock, net of estimated forfeitures, was
$0.1 million
, which is expected to be recognized over a weighted-average period of two months.
|
Shares
(in thousands)
|
Weighted-Average
Grant Date Fair
Value
|
|||||
|
Deferred Stock Awards:
|
||||||
|
Outstanding as of December 31, 2012
|
14,814
|
|
$
|
39.08
|
|
|
|
Granted
|
6,906
|
|
54.16
|
|
||
|
Vested
|
(6,332
|
)
|
40.97
|
|
||
|
Forfeited
|
(294
|
)
|
44.48
|
|
||
|
Outstanding as of December 31, 2013
|
15,094
|
|
45.07
|
|
||
|
Granted
|
4,282
|
|
65.40
|
|
||
|
Vested
|
(6,730
|
)
|
46.03
|
|
||
|
Forfeited
|
(215
|
)
|
49.87
|
|
||
|
Outstanding as of December 31, 2014
|
12,431
|
|
$
|
51.47
|
|
|
The weighted-average grant date fair value of deferred stock awards granted in
2012
was
$38.48
per share. The total fair value of deferred stock awards vested was
$310 million
,
$259 million
and
$223 million
for the years ended
December 31, 2014
,
2013
and
2012
, respectively. As of
December 31, 2014
, total unrecognized compensation cost related to deferred stock awards, net of estimated forfeitures, was
$360 million
, which is expected to be recognized over a weighted-average period of
2.3
years.
169
|
Shares
(in thousands)
|
Weighted-Average
Grant Date Fair
Value
|
|||||
|
Performance Awards:
|
||||||
|
Outstanding as of December 31, 2012
|
2,547
|
|
$
|
40.7
|
|
|
|
Granted
|
494
|
|
53.6
|
|
||
|
Forfeited
|
(4
|
)
|
41.62
|
|
||
|
Paid out
|
(813
|
)
|
41.62
|
|
||
|
Outstanding as of December 31, 2013
|
2,224
|
|
43.24
|
|
||
|
Granted
|
437
|
|
64.56
|
|
||
|
Forfeited
|
(1
|
)
|
53.16
|
|
||
|
Paid out
|
(1,033
|
)
|
42.48
|
|
||
|
Outstanding as of December 31, 2014
|
1,627
|
|
$
|
49.46
|
|
|
The weighted-average grant date fair value of performance awards granted in
2012
was
$37.78
per share. The total fair value of performance awards paid out was
$44 million
,
$34 million
and
$28 million
for the years ended
December 31, 2014
,
2013
and
2012
, respectively. As of
December 31, 2014
, total unrecognized compensation cost related to performance awards, net of estimated forfeitures, was
$5 million
, which is expected to be recognized over a weighted-average period of
2.3
years.
We utilize either treasury shares or authorized but unissued shares to satisfy the issuance of common stock under our equity incentive plans. We do not have a specific policy concerning purchases of our common stock to satisfy stock issuances, including exercises of stock options. We have a general policy concerning purchases of our common stock to meet issuances under our employee benefit plans, including option exercises and other corporate purposes. Various factors determine the amount and timing of our purchases of our common stock, including regulatory reviews, our regulatory capital requirements, the number of shares we expect to issue under employee benefit plans, market conditions (including the trading price of our common stock), and legal considerations. These factors can change at any time, and the number of shares of common stock we will purchase or when we will purchase them cannot be assured.
Note
15
. Regulatory Capital
We are subject to various regulatory capital requirements administered by federal banking agencies. Failure to meet minimum regulatory capital requirements can initiate certain mandatory and discretionary actions by regulators that, if undertaken, could have a direct material effect on our consolidated financial condition. Under current regulatory capital adequacy guidelines, we must meet
specified capital requirements that involve quantitative measures of our consolidated assets, liabilities and off-balance sheet exposures calculated in conformity with regulatory accounting practices. Our capital components and their classifications are subject to qualitative judgments by regulators about components, risk weightings and other factors.
As of December 31, 2013, we were subject to the generally applicable minimum regulatory capital requirements enforced by U.S. banking regulators, referred to as Basel I. These requirements were based on a 1988 international accord developed by the Basel Committee on Banking Supervision, or Basel Committee.
In July 2013, U.S. banking regulators jointly issued a final rule to implement the Basel III framework in the U.S., referred to as the Basel III final rule, provisions of which become effective under a transition timetable which began on January 1, 2014, with full implementation required beginning on January 1, 2019. As provided in the Basel III final rule, banking organizations in their Basel II qualification period, or parallel run, were required to complete a superseding parallel run under Basel III.
We were notified by the Federal Reserve on February 21, 2014 that we completed our parallel run and would be required to begin using the advanced approaches framework in the Basel III final rule in the determination of our risk-based capital requirements. Pursuant to this notification, we began to use the advanced approaches to calculate and disclose our risk-based capital ratios starting with the three months ended June 30, 2014.
As required by the Dodd-Frank Wall Street Reform and Consumer Protection Act, or Dodd-Frank Act, enacted in 2010, State Street and State Street Bank, as advanced approaches banking organizations, are subject to a permanent "capital floor" in the calculation and assessment of their regulatory capital adequacy by U.S. banking regulators. Beginning on January 1, 2014, this capital floor is based on the provisions of Basel I, as adjusted by the final market risk capital rule issued by U.S. banking regulators in 2012.
Beginning on January 1, 2014, we became subject to the provisions of the Basel III final rule that govern our calculation of regulatory capital, including transitional, or phase-in, provisions. Beginning with the three months ended June 30, 2014 and ending with December 31, 2014, the lower of our regulatory capital ratios calculated under the advanced approaches provisions of the Basel III final rule and those ratios calculated under the transitional provisions of Basel III (capital calculated in conformity with Basel III and risk-weighted assets calculated in conformity with Basel I as described above) applied in
170
the assessment of our capital adequacy for regulatory purposes.
As of
December 31, 2014
, the minimum required regulatory capital ratios are as follows:
|
•
|
common equity tier 1 risk-based capital -
4%
;
|
|
•
|
tier 1 risk-based capital -
5.5%
;
|
|
•
|
total risk-based capital -
8%
; and
|
|
•
|
tier 1 leverage -
4%
|
The methods for the calculation of our and State Street Bank's risk-based capital ratios will change as the provisions of the Basel III final rule related to the numerator (capital) and denominator (risk-weighted assets) are phased in, and as we begin calculating our risk-weighted assets using the advanced approaches. These ongoing methodological changes
will result in differences in our reported capital ratios from one reporting period to the next that are independent of applicable changes to our capital base, our asset composition, our off-balance sheet exposures or our risk profile.
As of
December 31, 2014
, State Street and State Street Bank exceeded all regulatory capital adequacy requirements to which they were subject. As of
December 31, 2014
, State Street Bank was categorized as “well capitalized” under the applicable regulatory capital adequacy framework, and exceeded all “well capitalized” ratio guidelines to which it was subject. Management believes that no conditions or events have occurred since
December 31, 2014
that have changed the capital categorization of State Street Bank.
171
The following table presents the regulatory capital structure, total risk-weighted assets and related regulatory capital ratios for State Street and State Street Bank as of the dates indicated. As a result of changes in the methodologies used to calculate our regulatory capital ratios from period to period as the provisions of the Basel III final rule are phased in, the ratios presented in the table for each period-end are not directly comparable. Refer to the footnotes following the table.
|
State Street
|
State Street Bank
|
|||||||||||||||||||||||||||
|
(Dollars in millions)
|
Basel III Advanced Approaches December 31, 2014
(1)
|
Basel III Transitional Provisions December 31, 2014
(2)
|
Basel I December 31, 2013
(3)
|
Basel III Advanced Approaches December 31, 2014
(1)
|
Basel III Transitional Provisions December 31, 2014
(2)
|
Basel I December 31, 2013
(3)
|
||||||||||||||||||||||
|
Common shareholders' equity:
|
||||||||||||||||||||||||||||
|
Common stock and related surplus
|
$
|
10,295
|
|
$
|
10,295
|
|
$
|
10,280
|
|
$
|
10,867
|
|
$
|
10,867
|
|
$
|
10,786
|
|
||||||||||
|
Retained earnings
|
14,882
|
|
14,882
|
|
13,395
|
|
9,416
|
|
9,416
|
|
9,064
|
|
||||||||||||||||
|
Accumulated other comprehensive income (loss)
|
(641
|
)
|
(641
|
)
|
215
|
|
(535
|
)
|
(535
|
)
|
209
|
|
||||||||||||||||
|
Treasury stock, at cost
|
(5,158
|
)
|
(5,158
|
)
|
(3,693
|
)
|
—
|
|
—
|
|
—
|
|
||||||||||||||||
|
Total
|
19,378
|
|
19,378
|
|
20,197
|
|
19,748
|
|
19,748
|
|
20,059
|
|
||||||||||||||||
|
Regulatory capital adjustments:
|
||||||||||||||||||||||||||||
|
Goodwill and other intangible assets, net of associated deferred tax liabilities
(4)
|
(5,869
|
)
|
(5,869
|
)
|
(7,743
|
)
|
(5,577
|
)
|
(5,577
|
)
|
(7,341
|
)
|
||||||||||||||||
|
Other adjustments
|
(36
|
)
|
(36
|
)
|
—
|
|
(128
|
)
|
(128
|
)
|
—
|
|
||||||||||||||||
|
Common equity tier 1 capital
|
13,473
|
|
13,473
|
|
12,454
|
|
14,043
|
|
14,043
|
|
12,718
|
|
||||||||||||||||
|
Preferred stock
|
1,961
|
|
1,961
|
|
491
|
|
—
|
|
—
|
|
—
|
|
||||||||||||||||
|
Trust preferred capital securities subject to phase-out from tier 1 capital
|
475
|
|
475
|
|
950
|
|
—
|
|
—
|
|
—
|
|
||||||||||||||||
|
Other adjustments
|
(145
|
)
|
(145
|
)
|
—
|
|
—
|
|
—
|
|
—
|
|
||||||||||||||||
|
Tier 1 capital
|
15,764
|
|
15,764
|
|
13,895
|
|
14,043
|
|
14,043
|
|
12,718
|
|
||||||||||||||||
|
Qualifying subordinated long-term debt
|
1,618
|
|
1,618
|
|
1,918
|
|
1,634
|
|
1,634
|
|
1,936
|
|
||||||||||||||||
|
Trust preferred capital securities phased out of tier 1 capital
|
475
|
|
475
|
|
NA
|
—
|
|
—
|
|
NA
|
||||||||||||||||||
|
Other adjustments
|
4
|
|
4
|
|
(26
|
)
|
—
|
|
—
|
|
45
|
|
||||||||||||||||
|
Total capital
|
$
|
17,861
|
|
$
|
17,861
|
|
$
|
15,787
|
|
$
|
15,677
|
|
$
|
15,677
|
|
$
|
14,699
|
|
||||||||||
|
Risk-weighted assets:
|
||||||||||||||||||||||||||||
|
Credit risk
|
$
|
66,874
|
|
$
|
87,502
|
|
$
|
78,864
|
|
$
|
59,836
|
|
$
|
84,433
|
|
$
|
76,197
|
|
||||||||||
|
Operational risk
|
35,866
|
|
NA
|
NA
|
35,449
|
|
NA
|
NA
|
||||||||||||||||||||
|
Market risk
(5)
|
5,087
|
|
2,910
|
|
1,262
|
|
5,048
|
|
2,909
|
|
1,262
|
|
||||||||||||||||
|
Total risk-weighted assets
|
$
|
107,827
|
|
$
|
90,412
|
|
$
|
80,126
|
|
$
|
100,333
|
|
$
|
87,342
|
|
$
|
77,459
|
|
||||||||||
|
Adjusted quarterly average assets
|
$
|
247,740
|
|
$
|
247,740
|
|
$
|
202,801
|
|
$
|
243,549
|
|
$
|
243,549
|
|
$
|
199,301
|
|
||||||||||
|
Capital Ratios:
|
Minimum Requirements
(6)
2014
|
Minimum Requirements
(7)
2013
|
||||||||||||||||||||||||||
|
Common equity tier 1 capital
|
4.0
|
%
|
NA
|
|
12.5
|
%
|
14.9
|
%
|
15.5
|
%
|
14.0
|
%
|
16.1
|
%
|
16.4
|
%
|
||||||||||||
|
Tier 1 capital
|
5.5
|
|
4.0
|
%
|
14.6
|
|
17.4
|
|
17.3
|
|
14.0
|
|
16.1
|
|
16.4
|
|
||||||||||||
|
Total capital
|
8.0
|
|
8.0
|
|
16.6
|
|
19.8
|
|
19.7
|
|
15.6
|
|
17.9
|
|
19.0
|
|
||||||||||||
|
Tier 1 leverage
|
4.0
|
|
4.0
|
|
6.4
|
|
6.4
|
|
6.9
|
|
5.8
|
|
5.8
|
|
6.4
|
|
||||||||||||
NA: Not applicable.
(1)
Common equity tier 1 capital, tier 1 capital and total capital ratios as of
December 31, 2014
were calculated in conformity with the advanced approaches provisions of the Basel III final rule. Tier 1 leverage ratio as of
December 31, 2014
was calculated in conformity with the Basel III final rule.
(2)
Common equity tier 1 capital, tier 1 capital, total capital and tier 1 leverage ratios as of
December 31, 2014
were calculated in conformity with the transitional provisions of the Basel III final rule. Specifically, these ratios reflect common equity tier 1, tier 1 and total capital (the numerator) calculated in conformity with the provisions of the Basel III final rule, and total risk-weighted assets or, with respect to the tier 1 leverage ratio, quarterly average assets (in both cases, the denominator), calculated in conformity with the provisions of Basel I.
(3)
Common equity tier 1 capital, tier 1 capital, total capital and tier 1 leverage ratios as of
December 31, 2013
were calculated in conformity with the provisions of Basel I.
(4)
Amounts for State Street and State Street Bank as of
December 31, 2014
consisted of goodwill, net of associated deferred tax liabilities, and 20% of other intangible assets, net of associated deferred tax liabilities, the latter phased in as a deduction from capital, in conformity with the Basel III final rule.
(5)
Market risk risk-weighted assets reported in conformity with the Basel III advanced approaches included a credit valuation adjustment, referred to as the CVA, which reflected the risk of potential fair-value adjustments for credit risk reflected in our valuation of over-the-counter derivative contracts. The CVA was not provided for in the final market risk capital rule; however, it was required by the advanced approaches provisions of the Basel III final rule. State Street used the simple CVA approach in conformity with the Basel III advanced approaches.
(6)
Minimum requirements will be phased in up to full implementation beginning on January 1, 2019; minimum requirements listed are as of
December 31, 2014
.
(7)
Minimum requirements listed, governed by Basel I, were as of
December 31, 2013
.
172
Cash, Dividend, Loan and Other Restrictions:
In
2014
, our banking subsidiaries were required by the Federal Reserve to maintain average aggregate cash balances of approximately
$5.72 billion
to satisfy reserve requirements. Federal and state banking regulations place certain restrictions on dividends paid by banking subsidiaries to a parent company. For
2015
, aggregate dividend payments by State Street Bank to the parent company without prior regulatory approval are limited to approximately
$663 million
of its undistributed earnings as of
December 31, 2014
, plus an additional amount equal to its net profits, as defined by the aforementioned banking regulations, for
2015
up to the date of any dividend payment. Currently, the payment of future common stock dividends by the parent company to its shareholders is subject to the review of our capital plan by the Federal Reserve in connection with its Comprehensive Capital Analysis and Review process.
The Federal Reserve Act requires that extensions of credit by State Street Bank to certain affiliates, including the parent company, be secured by specific collateral, that the extension of credit to any one affiliate be limited to 10% of State Street Bank’s capital and surplus, as defined, and that extensions of credit to all such affiliates be limited to 20% of State Street Bank’s capital and surplus.
As of
December 31, 2014
, our consolidated retained earnings included
$492 million
representing undistributed earnings of unconsolidated entities that are accounted for under the equity method of accounting.
Note
16
. Derivative Financial Instruments
A derivative financial instrument is a financial instrument or other contract which has one or more referenced indices and one or more notional amounts, either no initial net investment or a smaller initial net investment than would be expected for similar types of contracts, and which requires or permits net settlement.
We use derivative financial instruments to support our clients' needs and to manage our interest-rate and currency risk. In undertaking these activities, we assume positions in both the foreign exchange and interest-rate markets by buying and selling cash instruments and using derivative financial instruments, including foreign exchange forward contracts, foreign exchange and interest-rate options and interest-rate swaps, interest-rate forward contracts and interest-rate futures. Our derivative positions include derivative contracts held by a consolidated sponsored investment fund (refer to
note
12
). We record derivatives in our consolidated statement of condition at their fair value on a recurring basis.
Interest-rate contracts involve an agreement with a counterparty to exchange cash flows based on the movement of an underlying interest-rate index. An interest-rate swap agreement involves the exchange of a series of interest payments, at either a fixed or variable rate, based on the notional amount without the exchange of the underlying principal amount. An interest-rate option contract provides the purchaser, for a premium, the right, but not the obligation, to receive an interest rate based upon a predetermined notional amount during a specified period. An interest-rate futures contract is a commitment to buy or sell, at a future date, a financial instrument at a contracted price; it may be settled in cash or through the delivery of the contracted instrument.
Foreign exchange contracts involve an agreement to exchange one currency for another currency at an agreed-upon rate and settlement date. Foreign exchange contracts generally consist of foreign exchange forward and spot contracts, option contracts and cross-currency swaps. Future cash requirements, if any, related to foreign exchange contracts are represented by the gross amount of currencies to be exchanged under each contract unless we and the counterparty have agreed to pay or to receive the net contractual settlement amount on the settlement date.
Derivative financial instruments involve the management of interest-rate and foreign currency risk, and involve, to varying degrees, market risk and credit and counterparty risk (risk related to repayment). Market risk is defined by U.S. banking regulators as the risk of loss that could result from broad market movements, such as changes in the general level of interest rates, credit spreads, foreign exchange rates or commodity prices. We use a variety of risk management tools and methodologies to measure, monitor and manage the market risk associated with our trading activities, which include our use of derivative financial instruments. One such risk-management measure is Value-at-Risk, or VaR. VaR is an estimate of potential loss for a given period within a stated statistical confidence interval. We use a risk-measurement system to measure VaR daily. We have adopted standards for measuring VaR, and we maintain regulatory capital for market risk in accordance with currently applicable regulatory market risk requirements.
Derivative financial instruments are also subject to credit and counterparty risk, which is defined as the
173
risk of financial loss if a borrower or counterparty is either unable or unwilling to repay borrowings or settle a transaction in accordance with the underlying contractual terms. We manage credit and counterparty risk by performing credit reviews, maintaining individual counterparty limits, entering into netting arrangements and requiring the receipt of collateral. Collateral requirements are determined after a review of the creditworthiness of each counterparty, and these requirements are monitored and adjusted daily. Collateral is generally held in the form of cash or highly liquid U.S. government securities. We may be required to provide collateral to the counterparty in connection with our entry into derivative financial instruments. Cash collateral received from and provided to counterparties in connection with derivative financial instruments is recorded in accrued expenses and other liabilities and other assets, respectively, in our consolidated statement of condition. As of
December 31, 2014
and
2013
, we had recorded approximately
$1.79 billion
and
$2.58 billion
, respectively, of cash collateral received from counterparties and approximately
$4.79 billion
and
$3.36 billion
, respectively, of cash collateral provided to counterparties in connection with derivative financial instruments in our consolidated statement of condition.
We enter into master netting agreements with many of our derivative counterparties, and we have elected to net derivative assets and liabilities, including cash collateral received or deposited, which are subject to those agreements. Certain of these agreements contain credit risk-related contingent features in which the counterparty has the right to declare State Street in default and accelerate cash settlement of our net derivative liabilities with the counterparty in the event that our credit rating falls below specified levels. The aggregate fair value of all derivative instruments with credit risk-related contingent features that were in a net liability position as of
December 31, 2014
totaled approximately
$2.54 billion
, against which we posted aggregate collateral of approximately
$105 million
. If State Street’s credit rating were downgraded below levels specified in the agreements, the maximum additional amount of payments related to termination events that could have been required pursuant to these contingent features as of
December 31, 2014
was approximately
$2.43 billion
. Such accelerated settlement would not affect our consolidated results of operations.
On the date a derivative contract is entered into, we designate the derivative as: (1) a hedge of the fair value of a recognized fixed-rate asset or liability or of an unrecognized firm commitment (a “fair-value” hedge); (2) a hedge of a forecast transaction or of the variability of cash flows to be received or paid related to a recognized variable-rate asset or liability (a
“cash-flow” hedge); (3) a foreign currency fair value or cash flow hedge (a “foreign currency” hedge); (4) a hedge of a net investment in a non-U.S. operation; or (5) a derivative utilized in either our trading activities or in our asset-and-liability management activities that is not designated as a hedge of an asset or liability.
At both the inception of the hedge and on an ongoing basis, we formally assess and document the effectiveness of a derivative designated as a hedge in offsetting changes in the fair value of hedged items and the likelihood that the derivative will be an effective hedge in future periods. We discontinue hedge accounting prospectively when we determine that the derivative is no longer highly effective in offsetting changes in fair value or cash flows of the underlying risk being hedged, the derivative expires, terminates or is sold, or management discontinues the hedge designation.
Unrealized gains and losses on foreign exchange and interest-rate contracts are reported at fair value in our consolidated statement of condition as a component of other assets and accrued expenses and other liabilities, respectively, on a gross basis, except where such gains and losses arise from contracts covered by qualifying master netting agreements.
Derivatives Not Designated as Hedging Instruments:
In connection with our trading activities, we use derivative financial instruments in our role as a financial intermediary and as both a manager and servicer of financial assets, in order to accommodate our clients' investment and risk management needs. In addition, we use derivative financial instruments for risk management purposes as economic hedges, which are not formally designated as accounting hedges, in order to contribute to our overall corporate earnings and liquidity. These activities are designed to generate trading services revenue and to manage volatility in our net interest revenue. The level of market risk that we assume is a function of our overall objectives and liquidity needs, our clients' requirements and market volatility.
With respect to cross-border investing, our clients often enter into foreign exchange forward contracts to convert currency for international investments and to manage the currency risk in their international investment portfolios. As an active participant in the foreign exchange markets, we provide foreign exchange forward contracts and options in support of these client needs, and also act as a dealer in the currency markets. As part of our trading activities, we assume positions in both the foreign exchange and interest-rate markets by buying and selling cash instruments and using derivative
174
financial instruments, including foreign exchange forward contracts, foreign exchange and interest-rate options and interest-rate swaps, interest-rate forward contracts, and interest-rate futures. In the aggregate, we seek to match positions closely with the objective of minimizing related currency and interest-rate risk. We also use foreign currency swap contracts to manage the foreign exchange risk associated with certain foreign currency-denominated liabilities. The foreign exchange swap contracts are entered into for periods generally consistent with foreign currency exposure of the underlying transactions.
We offer products that provide book-value protection primarily to plan participants in stable value funds managed by non-affiliated investment managers of post-retirement defined contribution benefit plans, particularly 401(k) plans. We account for the associated contingencies, more fully described in note
10
, individually as derivative financial instruments. These contracts are valued quarterly and unrealized losses, if any, are recorded in other expenses in our consolidated statement of income.
In 2013 and 2014, we granted deferred cash awards to certain of our employees as part of our employee incentive compensation plans. We account for these awards as derivative financial instruments, as the underlying referenced shares are not equity instruments of State Street. The fair value of these derivatives is referenced to the value of units in State Street-sponsored investment funds or funds sponsored by other unrelated entities. We re-measure these derivatives to fair value quarterly, and record the change in value in compensation and employee benefits expenses in our consolidated statement of income.
Derivatives Designated as Hedging Instruments:
In connection with our asset-and-liability management activities, we use derivative financial instruments to manage our interest-rate risk. Interest-rate risk, defined as the sensitivity of income or financial condition to variations in interest rates, is a significant non-trading market risk to which our assets and liabilities are exposed. We manage our interest-rate risk by identifying, quantifying and hedging our exposures, using fixed-rate portfolio securities and a variety of derivative financial instruments, most frequently interest-rate swaps and options (for example, interest-rate caps and floors). Interest-rate swap agreements alter the interest-rate characteristics of specific balance sheet assets or liabilities. When appropriate, forward-rate agreements, options on swaps, and exchange-traded futures and options are also used. Our hedging relationships are formally designated, and qualify for hedge accounting, as fair value or cash flow hedges.
Fair value hedges
Derivatives designated as fair value hedges are utilized to mitigate the risk of changes in the fair values of recognized assets and liabilities. Differences between the gains and losses on fair value hedges and the gains and losses on the asset or liability attributable to the hedged risk represent hedge ineffectiveness. We use interest-rate or foreign exchange contracts in this manner to manage our exposure to changes in the fair value of hedged items caused by changes in interest rates or foreign exchange rates. Changes in the fair value of a derivative that is highly effective, and that is designated and qualifies as a fair-value hedge, are recorded in processing fees and other revenue, along with the changes in fair value of the hedged asset or liability attributable to the hedged risk.
We have entered into interest-rate swap agreements to modify our interest revenue from certain available-for-sale investment securities from a fixed rate to a floating rate. The hedged trusts had a weighted-average life of approximately
5.9
years as of
December 31, 2014
, compared to
6.5 years
as of
December 31, 2013
. These trusts are hedged with interest-rate swap contracts of similar maturity, repricing and fixed-rate coupons. The interest-rate swap contracts convert the interest revenue from a fixed rate to a floating rate indexed to LIBOR, thereby mitigating our exposure to fluctuations in the fair value of the securities attributable to changes in the benchmark interest rate.
We have entered into interest-rate swap agreements to modify our interest expense on
three
senior notes and
one
subordinated note from fixed rates to floating rates. The senior notes mature in
2018
,
2023
and 2024 and pay fixed interest at annual rates of
1.35%
,
3.70%
and
3.30%
, respectively. The subordinated note matures in
2023
and pays fixed interest at a
3.10%
annual rate. The senior and subordinated notes are hedged with interest-rate swap contracts with notional amounts, maturities and fixed-rate coupon terms that align with the hedged notes. The interest-rate swap contracts convert the fixed-rate coupons to floating rates indexed to LIBOR, thereby mitigating our exposure to fluctuations in the fair values of the senior and subordinated notes stemming from changes in the benchmark interest rates.
We have entered into forward foreign exchange contracts to hedge the change in fair value attributable to foreign exchange movements in the funding of non-functional currency-denominated investment securities. These forward contracts convert the foreign currency risk to U.S. dollars, thereby mitigating our exposure to fluctuations in the fair value of the securities attributable to changes in
175
foreign exchange rates. Generally, no ineffectiveness is recorded in earnings, since the notional amount of the hedging instruments is aligned with the carrying value of the hedged securities. The forward points on the hedging instruments are considered to be a hedging cost, and accordingly are excluded from the evaluation of hedge effectiveness and recorded in net interest revenue.
Cash flow hedges
Derivatives categorized as cash flow hedges are utilized to offset the variability of cash flows to be received from or paid on a floating-rate asset or liability. Ineffectiveness of cash flow hedges is defined as the extent to which the changes in fair value of the derivative exceed the variability of cash flows of the forecast transaction.
We had entered into an interest-rate swap agreement to modify our interest revenue from an available-for-sale debt security from a floating rate to a fixed rate. The hedged security matured in October 2014 and had a remaining life of approximately
10
months as of
December 31, 2013
. The security was hedged with an interest-rate swap contract of similar maturity, repricing and other characteristics. The interest-rate swap contract converted the interest revenue from a floating rate to a fixed rate, thereby mitigating our exposure to fluctuations in the cash flows of the security attributable to changes in the benchmark interest rate.
We have entered into foreign exchange contracts to hedge the change in cash flows attributable to foreign exchange movements in the funding of non-functional currency-denominated investment securities. These foreign exchange contracts convert the foreign currency risk to U.S. dollars, thereby mitigating our exposure to fluctuations in the cash flows of the securities attributable to changes in foreign exchange rates. Generally, no ineffectiveness is recorded in earnings, since the critical terms of the hedging instruments and the hedged securities are aligned.
Changes in the fair value of a derivative that are highly effective, and that are designated and qualify as a foreign currency hedge, are recorded either in processing fees and other revenue or in other comprehensive income, net of taxes, depending on whether the hedge transaction meets the criteria for a fair-value or a cash-flow hedge. If, however, a derivative is used as a hedge of a net investment in a non-U.S. operation, its changes in fair value, to the extent effective as a hedge, are recorded, net of taxes, in the foreign currency translation component of other comprehensive income. Lastly, entire changes in the fair value of derivatives utilized in our trading activities are recorded in trading services revenue, and entire changes in the fair value of
derivatives utilized in our asset-and-liability management activities are recorded in processing fees and other revenue.
The following table presents the aggregate contractual, or notional, amounts of derivative financial instruments entered into in connection with our trading and asset-and-liability management activities as of the dates indicated:
|
(In millions)
|
December 31,
2014 |
December 31,
2013 |
|||||
|
Derivatives not designated as hedging instruments:
|
|||||||
|
Interest-rate contracts:
|
|||||||
|
Swap agreements and forwards
|
$
|
645
|
|
$
|
1,023
|
|
|
|
Options and caps purchased
|
7
|
|
27
|
|
|||
|
Options and caps written
|
7
|
|
27
|
|
|||
|
Futures
|
3,939
|
|
3,282
|
|
|||
|
Foreign exchange contracts:
|
|||||||
|
Forward, swap and spot
|
1,231,344
|
|
1,124,355
|
|
|||
|
Options purchased
|
2,767
|
|
1,666
|
|
|||
|
Options written
|
2,404
|
|
1,423
|
|
|||
|
Credit derivative contracts:
|
|||||||
|
Credit swap agreements
|
191
|
|
141
|
|
|||
|
Commodity and equity contracts:
|
|||||||
|
Commodity
(1)
|
26
|
|
2
|
|
|||
|
Equity
(1)
|
2
|
|
1
|
|
|||
|
Other:
|
|||||||
|
Stable value contracts
|
23,409
|
|
24,906
|
|
|||
|
Deferred value awards
(2)
|
210
|
|
42
|
|
|||
|
Derivatives designated as hedging instruments:
|
|||||||
|
Interest-rate contracts:
|
|||||||
|
Swap agreements
|
6,077
|
|
5,221
|
|
|||
|
Foreign exchange contracts:
|
|||||||
|
Forward and swap
|
2,705
|
|
2,783
|
|
|||
(1)
Primarily composed of positions held by a consolidated sponsored investment fund, more fully described in note
12
.
(2)
Represents grants of deferred value awards to employees; refer to discussion in this note under "Derivatives Not Designated as Hedging Instruments."
176
In connection with our asset-and-liability management activities, we have entered into interest-rate contracts designated as fair value and cash flow hedges to manage our interest-rate risk. The following table presents the aggregate notional amounts of these interest-rate contracts and the related assets or liabilities being hedged as of the dates indicated:
|
|
December 31, 2014
(1)
|
||
|
(In millions)
|
Fair
Value
Hedges
|
||
|
Investment securities available for sale
|
$
|
2,577
|
|
|
Long-term debt
(2)
|
3,500
|
|
|
|
Total
|
$
|
6,077
|
|
|
|
December 31, 2013
|
||||||||||
|
(In millions)
|
Fair
Value Hedges |
Cash
Flow Hedges |
Total
|
||||||||
|
Investment securities available for sale
|
$
|
2,589
|
|
$
|
132
|
|
$
|
2,721
|
|
||
|
Long-term debt
(2)
|
2,500
|
|
—
|
|
2,500
|
|
|||||
|
Total
|
$
|
5,089
|
|
$
|
132
|
|
$
|
5,221
|
|
||
(2)
As of
December 31, 2014
, these fair value hedges increased the carrying value of long-term debt presented in our consolidated statement of condition by
$76 million
. As of
December 31, 2013
, these fair value hedges decreased the carrying value of long-term debt presented in our consolidated statement of condition by
$35 million
.
The following tables present the contractual and weighted-average interest rates for long-term debt, which include the effects of the fair value hedges presented in the table above, for the periods indicated:
|
|
Years Ended December 31,
|
||||||||||
|
|
2014
|
2013
|
|||||||||
|
|
Contractual
Rates
|
Rate
Including
Impact of Hedges
|
Contractual
Rates
|
Rate
Including
Impact of Hedges
|
|||||||
|
Long-term debt
|
3.44
|
%
|
2.63
|
%
|
3.46
|
%
|
2.75
|
%
|
|||
The following tables present the fair value of derivative financial instruments, excluding the impact of master netting agreements, recorded in our consolidated statement of condition as of the dates indicated. The impact of master netting agreements is disclosed in note
2
.
|
Derivative Assets
(1)
|
|||||||
|
Fair Value
|
|||||||
|
(In millions)
|
December 31, 2014
|
December 31, 2013
|
|||||
|
Derivatives not designated as hedging instruments:
|
|||||||
|
Foreign exchange contracts
|
$
|
14,626
|
|
$
|
11,552
|
|
|
|
Interest-rate contracts
|
15
|
|
29
|
|
|||
|
Other derivative contracts
|
2
|
|
1
|
|
|||
|
Total
|
$
|
14,643
|
|
$
|
11,582
|
|
|
|
Derivatives designated as hedging instruments:
|
|||||||
|
Foreign exchange contracts
|
$
|
509
|
|
$
|
359
|
|
|
|
Interest-rate contracts
|
62
|
|
36
|
|
|||
|
Total
|
$
|
571
|
|
$
|
395
|
|
|
(1)
Derivative assets are included within Other assets in our consolidated statement of condition.
|
Derivative Liabilities
(1)
|
|||||||
|
Fair Value
|
|||||||
|
(In millions)
|
December 31, 2014
|
December 31, 2013
|
|||||
|
Derivatives not designated as hedging instruments:
|
|||||||
|
Foreign exchange contracts
|
$
|
14,922
|
|
$
|
11,428
|
|
|
|
Other derivative contracts
|
70
|
|
23
|
|
|||
|
Interest-rate contracts
|
16
|
|
29
|
|
|||
|
Total
|
$
|
15,008
|
|
$
|
11,480
|
|
|
|
Derivatives designated as hedging instruments:
|
|||||||
|
Interest-rate contracts
|
$
|
223
|
|
$
|
302
|
|
|
|
Foreign exchange contracts
|
3
|
|
43
|
|
|||
|
Total
|
$
|
226
|
|
$
|
345
|
|
|
(1)
Derivative liabilities are included within other liabilities in our consolidated statement of condition.
177
The following tables present the impact of our use of derivative financial instruments on our consolidated statement of income for the periods indicated:
|
Location of Gain (Loss) on
Derivative in Consolidated
Statement of Income
|
Amount of Gain (Loss) on Derivative Recognized
in Consolidated Statement of Income
|
||||||||||||
|
Years Ended December 31,
|
|||||||||||||
|
(In millions)
|
|
2014
|
2013
|
2012
|
|||||||||
|
Derivatives not designated as hedging instruments:
|
|||||||||||||
|
Foreign exchange contracts
|
Trading services revenue
|
$
|
612
|
|
$
|
586
|
|
$
|
576
|
|
|||
|
Foreign exchange contracts
|
Processing fees and other revenue
|
—
|
|
—
|
|
(2
|
)
|
||||||
|
Interest-rate contracts
|
Trading services revenue
|
1
|
|
2
|
|
(86
|
)
|
||||||
|
Interest-rate contracts
|
Processing fees and other revenue
|
—
|
|
—
|
|
6
|
|
||||||
|
Credit derivative contracts
|
Trading services revenue
|
1
|
|
—
|
|
—
|
|
||||||
|
Credit derivative contracts
|
Processing fees and other revenue
|
(1
|
)
|
1
|
|
—
|
|
||||||
|
Other derivative contracts
|
Trading services revenue
|
(2
|
)
|
—
|
|
—
|
|
||||||
|
Total
|
$
|
611
|
|
$
|
589
|
|
$
|
494
|
|
||||
|
Location of (Gain) Loss on
Derivative in Consolidated
Statement of Income
|
Amount of (Gain) Loss on Derivative Recognized
in Consolidated Statement of Income
|
||||||||||||
|
Years Ended December 31,
|
|||||||||||||
|
(In millions)
|
|
2014
|
2013
|
2012
|
|||||||||
|
Derivatives not designated as hedging instruments:
|
|||||||||||||
|
Other derivative contracts
|
Compensation and employee benefits
|
$
|
106
|
|
$
|
14
|
|
—
|
|
||||
|
Total
|
$
|
106
|
|
$
|
14
|
|
$
|
—
|
|
||||
|
Location of Gain (Loss) on Derivative in Consolidated Statement of Income
|
Amount of Gain
(Loss) on Derivative
Recognized in
Consolidated
Statement of Income
|
Hedged Item in Fair Value Hedging Relationship
|
Location of Gain (Loss) on Hedged Item in Consolidated Statement of Income
|
Amount of Gain
(Loss) on Hedged
Consolidated
Statement of Income
|
|||||||||||||||||||||||||
|
Years Ended December 31,
|
Years Ended December 31,
|
||||||||||||||||||||||||||||
|
(In millions)
|
2014
|
2013
|
2012
|
2014
|
2013
|
2012
|
|||||||||||||||||||||||
|
Derivatives designated as fair value hedges:
|
|||||||||||||||||||||||||||||
|
Foreign exchange contracts
|
Processing fees and
other revenue |
$
|
(92
|
)
|
(183
|
)
|
34
|
|
Investment securities
|
Processing fees and
other revenue |
$
|
92
|
|
$
|
183
|
|
$
|
(34
|
)
|
||||||||||
|
Interest-rate contracts
|
Processing fees and
other revenue
|
(44
|
)
|
32
|
|
11
|
|
Available-for-sale securities
|
Processing fees and
other revenue
(1)
|
39
|
|
(30
|
)
|
(17
|
)
|
||||||||||||||
|
Interest-rate contracts
|
Processing fees and
other revenue |
150
|
|
(192
|
)
|
50
|
|
Long-term debt
|
Processing fees and
other revenue |
(138
|
)
|
175
|
|
(45
|
)
|
||||||||||||||
|
Total
|
$
|
14
|
|
$
|
(343
|
)
|
$
|
95
|
|
$
|
(7
|
)
|
$
|
328
|
|
$
|
(96
|
)
|
|||||||||||
(1)
Represents amounts reclassified out of or into other comprehensive income, or OCI. For the
year ended
December 31, 2014
,
$24 million
of unrealized losses on available-for-sale securities designated in fair value hedges were recognized in OCI. For the
year ended
December 31, 2013
and
2012
,
$86 million
and
$27 million
, respectively, of unrealized gains on available-for-sale securities designated in fair value hedges were recognized in OCI.
178
Differences between the gains (losses) on the derivative and the gains (losses) on the hedged item, excluding any amounts recorded in net interest revenue, represent hedge ineffectiveness.
|
Amount of Gain
(Loss) on Derivative
Recognized in Other
Comprehensive
Income
|
Location of Gain (Loss) Reclassified from OCI to Consolidated Statement of Income
|
Amount of Gain
(Loss) Reclassified
from OCI to
Consolidated
Statement of Income
|
Location of Gain (Loss) on Derivative Recognized in Consolidated Statement of Income
|
Amount of Gain
(Loss) on Derivative
Recognized in
Consolidated
Statement of Income
|
|||||||||||||||||||||||||||||||||||
|
Years Ended December 31,
|
Years Ended December 31,
|
Years Ended December 31,
|
|||||||||||||||||||||||||||||||||||||
|
2014
|
2013
|
2012
|
2014
|
2013
|
2012
|
2014
|
2013
|
2012
|
|||||||||||||||||||||||||||||||
|
(In millions)
|
|||||||||||||||||||||||||||||||||||||||
|
Derivatives designated as cash flow hedges:
|
|||||||||||||||||||||||||||||||||||||||
|
Interest-rate contracts
|
$
|
(2
|
)
|
$
|
9
|
|
$
|
4
|
|
Net interest revenue
|
$
|
(4
|
)
|
$
|
(4
|
)
|
$
|
(5
|
)
|
Net interest revenue
|
$
|
3
|
|
$
|
3
|
|
$
|
3
|
|
||||||||||
|
Foreign exchange contracts
|
126
|
|
153
|
|
122
|
|
Net interest revenue
|
—
|
|
—
|
|
—
|
|
Net interest revenue
|
6
|
|
6
|
|
6
|
|
|||||||||||||||||||
|
Total
|
$
|
124
|
|
$
|
162
|
|
$
|
126
|
|
$
|
(4
|
)
|
$
|
(4
|
)
|
$
|
(5
|
)
|
$
|
9
|
|
$
|
9
|
|
$
|
9
|
|
||||||||||||
Note
17
. Offsetting Arrangements
We manage credit and counterparty risk by entering into enforceable netting agreements and other collateral arrangements with counterparties to derivative contracts and secured financing transactions, including resale and repurchase agreements, and principal securities borrowing and lending agreements. These netting agreements mitigate our counterparty credit risk by providing for a single net settlement with a counterparty of all financial transactions covered by the agreement in an event of default as defined under such agreement. In limited cases, a netting agreement may also provide for the periodic netting of settlement payments with respect to multiple different transaction types in the normal course of business.
Certain of our derivative contracts are executed under either standardized netting agreements or, for exchange-traded derivatives, the relevant contracts for a particular exchange which contain enforceable netting provisions. In certain cases, we may have cross-product netting arrangements which allow for netting and set-off of a variety of types of derivatives with a single counterparty. A derivative netting arrangement creates an enforceable right of set-off that becomes effective, and effects the realization or settlement of individual financial assets and liabilities, only following a specified event of default. Collateral requirements associated with our derivative contracts are determined after a review of the creditworthiness of each counterparty, and the requirements are monitored and adjusted daily, typically based on net exposure by counterparty. Collateral is generally in the form of cash or highly liquid U.S. government securities.
In connection with secured financing transactions, we enter into netting agreements and other collateral arrangements with counterparties,
which provide for the right to liquidate collateral in the event of default. Collateral is generally required in the form of cash, equity securities or fixed-income securities. Default events may include the failure to make payments or deliver securities timely, material adverse changes in financial condition or insolvency, the breach of minimum regulatory capital requirements, or loss of license, charter or other legal authorization necessary to perform under the contract.
In order for an arrangement to be eligible for netting, we must have a reasonable basis to conclude that such netting arrangements are legally enforceable. The analysis of the legal enforceability of an arrangement differs by jurisdiction, depending on the laws of that jurisdiction. In many jurisdictions, specific legislation exists that provides for the enforceability in bankruptcy of close-out netting under a netting agreement, typically by way of specific exception from more general prohibitions on the exercise of creditor rights.
When we have a basis to conclude that a legally enforceable netting arrangement exists between us and the derivative counterparty and the relevant transaction is the type of transaction that is recorded in our consolidated statement of condition, we offset derivative assets and liabilities, and the related collateral received and provided, in our consolidated statement of condition. We also offset assets and liabilities related to secured financing transactions with the same counterparty or clearinghouse which have the same maturity date and are settled in the normal course of business on a net basis.
Collateral that we receive in the form of securities in connection with secured financing transactions and derivative contracts can be transferred or re-pledged as collateral in many
179
instances to enter into repurchase agreements or securities finance or derivative transactions. The securities collateral received in connection with our securities finance activities is recorded at fair value in other assets in our consolidated statement of condition, with a related liability to return the collateral, if we have the right to transfer or re-pledge the collateral. As of
December 31, 2014
and
2013
,
the fair value of securities received as collateral where we are permitted to transfer or re-pledge the securities totaled
$2.60 billion
and
$5.64 billion
, respectively, and the fair value of the portion that had been transferred or re-pledged as of the same date was
$125 million
and
$1.77 billion
, respectively.
The following tables present information about the offsetting of assets related to derivative contracts and secured financing transactions, as of the dates indicated:
|
Assets:
|
December 31, 2014
|
December 31, 2013
|
||||||||||||||||||||||
|
(In millions)
|
Gross Amounts of Recognized Assets
(1)
|
Gross Amounts Offset in Statement of Condition
(2)
|
Net Amounts of Assets Presented in Statement of Condition
|
Gross Amounts of Recognized Assets
(1)
|
Gross Amounts Offset in Statement of Condition
(2)
|
Net Amounts of Assets Presented in Statement of Condition
|
||||||||||||||||||
|
Derivatives:
|
||||||||||||||||||||||||
|
Foreign exchange contracts
|
$
|
15,135
|
|
$
|
(6,275
|
)
|
$
|
8,860
|
|
$
|
11,911
|
|
$
|
(4,514
|
)
|
$
|
7,397
|
|
||||||
|
Interest-rate contracts
|
77
|
|
(21
|
)
|
56
|
|
65
|
|
(59
|
)
|
6
|
|
||||||||||||
|
Other derivative contracts
|
2
|
|
(1
|
)
|
1
|
|
1
|
|
—
|
|
1
|
|
||||||||||||
|
Cash collateral netting
|
—
|
|
(983
|
)
|
(983
|
)
|
—
|
|
(1,928
|
)
|
(1,928
|
)
|
||||||||||||
|
Total derivatives
|
$
|
15,214
|
|
$
|
(7,280
|
)
|
$
|
7,934
|
|
$
|
11,977
|
|
$
|
(6,501
|
)
|
$
|
5,476
|
|
||||||
|
Other financial instruments:
|
||||||||||||||||||||||||
|
Resale agreements and securities borrowing
(3)
|
$
|
47,488
|
|
$
|
(29,157
|
)
|
$
|
18,331
|
|
$
|
48,221
|
|
$
|
(30,700
|
)
|
$
|
17,521
|
|
||||||
|
Total derivatives and other financial instruments
|
$
|
62,702
|
|
$
|
(36,437
|
)
|
$
|
26,265
|
|
$
|
60,198
|
|
$
|
(37,201
|
)
|
$
|
22,997
|
|
||||||
(1)
Amounts include all transactions regardless of whether or not they are subject to an enforceable netting arrangement.
(2)
Amounts subject to netting arrangements which have been determined to be legally enforceable.
(3)
Included in the
$18,331 million
as of
December 31, 2014
were
$2,390 million
of resale agreements and
$15,941 million
of collateral provided related to securities borrowing. Included in the
$17,521 million
as of
December 31, 2013
were
$6,230 million
of resale agreements and
$11,291 million
of collateral provided related to securities borrowing. Resale agreements and collateral provided related to securities borrowing were recorded in securities purchased under resale agreements and other assets, respectively, in our consolidated statement of condition. Refer to note
10
for additional information with respect to principal securities finance transactions.
|
December 31, 2014
|
December 31, 2013
|
|||||||||||||||||||||||||||||||
|
Gross Amounts Not Offset in Statement of Condition
(1)
|
Gross Amounts Not Offset in Statement of Condition
(1)
|
|||||||||||||||||||||||||||||||
|
(In millions)
|
Net Amount of Assets Presented in Statement of Condition
|
Counterparty Netting
|
Collateral Received
|
Net Amount
(2)
|
Net Amount of Assets Presented in Statement of Condition
|
Counterparty Netting
|
Collateral Received
|
Net Amount
(2)
|
||||||||||||||||||||||||
|
Derivatives
|
$
|
7,934
|
|
$
|
—
|
|
$
|
(1,490
|
)
|
$
|
6,444
|
|
$
|
5,476
|
|
$
|
—
|
|
$
|
(181
|
)
|
$
|
5,295
|
|
||||||||
|
Resale agreements and securities borrowing
|
18,331
|
|
(128
|
)
|
(18,157
|
)
|
46
|
|
17,521
|
|
(131
|
)
|
(14,983
|
)
|
2,407
|
|
||||||||||||||||
|
Total
|
$
|
26,265
|
|
$
|
(128
|
)
|
$
|
(19,647
|
)
|
$
|
6,490
|
|
$
|
22,997
|
|
$
|
(131
|
)
|
$
|
(15,164
|
)
|
$
|
7,702
|
|
||||||||
(1)
Amounts subject to netting arrangements which have been determined to be legally enforceable.
(2)
Includes amounts secured by collateral not determined to be subject to enforceable netting arrangements.
180
The following tables present information about the offsetting of liabilities related to derivative contracts and secured financing transactions, as of the dates indicated:
|
Liabilities:
|
December 31, 2014
|
December 31, 2013
|
||||||||||||||||||||||
|
(In millions)
|
Gross Amounts of Recognized Liabilities
(1)
|
Gross Amounts Offset in Statement of Condition
(2)
|
Net Amounts of Liabilities Presented in Statement of Condition
|
Gross Amounts of Recognized Liabilities
(1)
|
Gross Amounts Offset in Statement of Condition
(2)
|
Net Amounts of Liabilities Presented in Statement of Condition
|
||||||||||||||||||
|
Derivatives:
|
||||||||||||||||||||||||
|
Foreign exchange contracts
|
$
|
14,925
|
|
$
|
(6,275
|
)
|
$
|
8,650
|
|
$
|
11,471
|
|
$
|
(4,514
|
)
|
$
|
6,957
|
|
||||||
|
Interest-rate contracts
|
239
|
|
(20
|
)
|
219
|
|
331
|
|
(59
|
)
|
272
|
|
||||||||||||
|
Other derivative contracts
|
70
|
|
(1
|
)
|
69
|
|
9
|
|
—
|
|
9
|
|
||||||||||||
|
Cash collateral netting
|
—
|
|
(2,630
|
)
|
(2,630
|
)
|
—
|
|
(979
|
)
|
(979
|
)
|
||||||||||||
|
Total derivatives
|
$
|
15,234
|
|
$
|
(8,926
|
)
|
$
|
6,308
|
|
$
|
11,811
|
|
$
|
(5,552
|
)
|
$
|
6,259
|
|
||||||
|
Other financial instruments:
|
||||||||||||||||||||||||
|
Repurchase agreements and securities lending
(3)
|
$
|
44,562
|
|
$
|
(29,157
|
)
|
$
|
15,405
|
|
$
|
45,273
|
|
$
|
(30,700
|
)
|
$
|
14,573
|
|
||||||
|
Total derivatives and other financial instruments
|
$
|
59,796
|
|
$
|
(38,083
|
)
|
$
|
21,713
|
|
$
|
57,084
|
|
$
|
(36,252
|
)
|
$
|
20,832
|
|
||||||
(1)
Amounts include all transactions regardless of whether or not they are subject to an enforceable netting arrangement.
(2)
Amounts subject to netting arrangements which have been determined to be legally enforceable.
(3)
Included in the
$15,405 million
as of
December 31, 2014
were
$8,925 million
of repurchase agreements and
$6,480 million
of collateral received related to securities lending. Included in the
$14,573 million
as of
December 31, 2013
were
$7,953 million
of repurchase agreements and
$6,620 million
of collateral received related to securities lending. Repurchase agreements and collateral received related to securities lending were recorded in securities sold under repurchase agreements and accrued expenses and other liabilities, respectively, in our consolidated statement of condition. Refer to note
10
for additional information with respect to principal securities finance transactions.
|
December 31, 2014
|
December 31, 2013
|
|||||||||||||||||||||||||||||||
|
Gross Amounts Not Offset in Statement of Condition
(1)
|
Gross Amounts Not Offset in Statement of Condition
(1)
|
|||||||||||||||||||||||||||||||
|
(In millions)
|
Net Amount of Liabilities Presented in Statement of Condition
|
Counterparty Netting
|
Collateral Provided
|
Net Amount
(2)
|
Net Amount of Liabilities Presented in Statement of Condition
|
Counterparty Netting
|
Collateral Provided
|
Net Amount
(2)
|
||||||||||||||||||||||||
|
Derivatives
|
$
|
6,308
|
|
$
|
—
|
|
$
|
(19
|
)
|
$
|
6,289
|
|
$
|
6,259
|
|
$
|
—
|
|
$
|
(6
|
)
|
$
|
6,253
|
|
||||||||
|
Repurchase agreements and securities lending
|
15,405
|
|
(128
|
)
|
(13,872
|
)
|
1,405
|
|
14,573
|
|
(131
|
)
|
(13,036
|
)
|
1,406
|
|
||||||||||||||||
|
Total
|
$
|
21,713
|
|
$
|
(128
|
)
|
$
|
(13,891
|
)
|
$
|
7,694
|
|
$
|
20,832
|
|
$
|
(131
|
)
|
$
|
(13,042
|
)
|
$
|
7,659
|
|
||||||||
(1)
Amounts subject to netting arrangements which have been determined to be legally enforceable.
(2)
Includes amounts secured by collateral not determined to be subject to enforceable netting arrangements.
181
Note
18
. Net Interest Revenue
The following table presents the components of interest revenue and interest expense, and related net interest revenue, for the periods indicated:
|
Twelve Months Ended December 31,
|
|||||||||||
|
(In millions)
|
2014
|
2013
|
2012
|
||||||||
|
Interest revenue:
|
|||||||||||
|
Deposits with banks
|
$
|
196
|
|
$
|
125
|
|
$
|
141
|
|
||
|
Investment securities:
|
|||||||||||
|
U.S. Treasury and federal agencies
|
672
|
|
707
|
|
799
|
|
|||||
|
State and political subdivisions
|
231
|
|
249
|
|
214
|
|
|||||
|
Other investments
|
1,241
|
|
1,331
|
|
1,552
|
|
|||||
|
Securities purchased under resale agreements
|
38
|
|
45
|
|
51
|
|
|||||
|
Trading account assets
|
1
|
|
—
|
|
—
|
|
|||||
|
Loans and leases
|
266
|
|
253
|
|
254
|
|
|||||
|
Other interest-earning assets
|
7
|
|
4
|
|
3
|
|
|||||
|
Total interest revenue
|
2,652
|
|
2,714
|
|
3,014
|
|
|||||
|
Interest expense:
|
|||||||||||
|
Deposits
|
99
|
|
93
|
|
166
|
|
|||||
|
Short-term borrowings
|
5
|
|
60
|
|
73
|
|
|||||
|
Long-term debt
|
245
|
|
232
|
|
222
|
|
|||||
|
Other interest-bearing liabilities
|
43
|
|
26
|
|
15
|
|
|||||
|
Total interest expense
|
392
|
|
411
|
|
476
|
|
|||||
|
Net interest revenue
|
$
|
2,260
|
|
$
|
2,303
|
|
$
|
2,538
|
|
||
Note
19
. Employee Benefits
Defined Benefit Pension and Other Post-Retirement Benefit Plans
State Street Bank and certain of its U.S. subsidiaries participate in a non-contributory, tax-qualified defined benefit pension plan. The U.S. defined benefit pension plan was frozen as of December 31, 2007 and no new employees were eligible to participate after that date. State Street has agreed to contribute sufficient amounts as necessary to meet the benefits paid to plan participants and to fund the plan’s service cost, plus interest. U.S. employee account balances earn annual interest credits until the employee’s retirement. Non-U.S. employees participate in local defined benefit plans which are funded as required in each local jurisdiction. In addition to the defined benefit pension plans, we have non-qualified unfunded supplemental retirement plans, referred to as SERPs, that provide certain officers with defined pension benefits in excess of allowable qualified plan limits. State Street Bank and certain of its U.S. subsidiaries also participate in a post-retirement plan that provides health care and insurance benefits for certain retired employees. The total expense for these tax-qualified and non-qualified plans was
$32 million
,
$42 million
and
$44 million
for the years ended December 31, 2014, 2013 and 2012, respectively.
We recognize the funded status of our defined benefit pension plans and other post-retirement benefit plans, measured as the difference between the fair value of the plan assets and the projected benefit obligation, in the consolidated statement of position. The assets held by the defined benefit pension plans are largely made up of common, collective funds that are liquid and invest principally in U.S. equities and high-quality fixed income investments. The majority of these assets fall within Level 2 of the fair value hierarchy. The benefit obligations associated with our primary U.S. and non-U.S. defined benefit plans, non-qualified unfunded supplemental retirement plans and post-retirement plans were
$1.26 billion
,
$168 million
and
$120 million
, respectively, as of
December 31, 2014
and
$1.08 billion
,
$154 million
and
$108 million
, respectively, as of
December 31, 2013
. As the primary defined benefit plans are frozen, the benefit obligation will only vary over time as a result of changes in market interest rates, the life expectancy of the plan participants and payments made from the plans. The primary U.S. and non-U.S. defined benefit pension plans were underfunded
$50 million
at
December 31, 2014
and overfunded
$40 million
at
December 31, 2013
. The non-qualified supplemental retirement plans were underfunded by
$168 million
and
$154 million
at
December 31, 2014
and
2013
, respectively. The other post-retirement benefit plans were underfunded by
$120 million
and
$108 million
at
December 31, 2014
and
2013
, respectively. The funded status is included in other assets (overfunded) and in other liabilities (underfunded).
Defined Contribution Retirement Plans
We contribute to employer-sponsored U.S. and non-U.S. defined contribution plans. Our contribution to these plans was
$147 million
for
2014
,
$134 million
for
2013
and
$146 million
for
2012
.
Note
20
. Occupancy Expense and Information Systems and Communications Expense
Occupancy expense and information systems and communications expense include depreciation of buildings, leasehold improvements, computer hardware and software, equipment, and furniture and fixtures. Total depreciation expense for the years ended
December 31, 2014
,
2013
and
2012
was
$417 million
,
$401 million
and
$407 million
, respectively.
We lease
1,025,000
square feet at One Lincoln Street, our headquarters building located in Boston, Massachusetts, and a related underground parking garage, under
20
-year, non-cancelable capital leases
182
expiring in
September 2023
. A portion of the lease payments is offset by subleases for approximately
127,000
square feet of the building. In 2014, we began leasing approximately
500,000
square feet at the Channel Center in Boston, Massachusetts under a
16
-year capital lease expiring in
December 2029
. In addition, we lease approximately
362,000
square feet at 20 Churchill Place, an office building located in the U.K., under a
20
-year capital lease expiring in
December 2028
. As of
December 31, 2014
and
2013
, an aggregate net book value of
$624 million
and
$646 million
, respectively, related to the above-described capital leases was recorded in premises and equipment, with the related liability recorded in long-term debt, in our consolidated statement of condition.
Capital lease asset amortization is recorded in occupancy expense in our consolidated statement of income over the respective lease term. Lease payments are recorded as a reduction of the liability, with a portion recorded as imputed interest expense. For the years ended
December 31, 2014
,
2013
and
2012
, interest expense related to these capital lease obligations, reflected in net interest revenue, was
$38 million
,
$40 million
and
$42 million
, respectively. As of
December 31, 2014
and
2013
, accumulated amortization of capital lease assets was
$426 million
and
$369 million
, respectively.
We have entered into non-cancelable operating leases for premises and equipment. Nearly all of these leases include renewal options. Costs related to operating leases for office space are recorded in occupancy expense. Costs related to operating leases for equipment are recorded in information systems and communications expense.
Total rental expense, net of sublease revenue, amounted to
$204 million
,
$224 million
and
$227 million
for the years ended
December 31, 2014
,
2013
and
2012
, respectively. Total rental expense was reduced by sublease revenue of
$6 million
for both years ended
December 31, 2014
, and
2013
and
$4 million
for the year ended
December 31, 2012
.
The following table presents a summary of future minimum lease payments under non-cancelable capital and operating leases as of
December 31, 2014
. Aggregate future minimum rental commitments have been reduced by aggregate sublease rental commitments of
$55 million
for capital leases and
$15 million
for operating leases.
|
(In millions)
|
Capital
Leases
|
Operating
Leases
|
Total
|
||||||||
|
2015
|
$
|
105
|
|
$
|
179
|
|
$
|
284
|
|
||
|
2016
|
91
|
|
141
|
|
232
|
|
|||||
|
2017
|
82
|
|
145
|
|
227
|
|
|||||
|
2018
|
82
|
|
119
|
|
201
|
|
|||||
|
2019
|
82
|
|
86
|
|
168
|
|
|||||
|
Thereafter
|
520
|
|
265
|
|
785
|
|
|||||
|
Total minimum lease payments
|
962
|
|
$
|
935
|
|
$
|
1,897
|
|
|||
|
Less amount representing interest payments
|
(248
|
)
|
|||||||||
|
Present value of minimum lease payments
|
$
|
714
|
|
||||||||
Note
21
. Expenses
Severance Costs:
We recorded
$84 million
and
$11 million
of net severance costs in the years ended
December 31, 2014
and
2013
, respectively. These severance costs were the result of staff reductions associated with the realignment of our cost base, and were recorded in compensation and employee benefits expenses in our consolidated statement of income.
Acquisition and Restructuring Costs:
The following table presents net acquisition and restructuring costs recorded in the periods indicated:
|
Years Ended December 31,
|
||||||||||||
|
(In millions)
|
2014
|
2013
|
2012
|
|||||||||
|
Acquisition costs
|
$
|
58
|
|
$
|
76
|
|
$
|
26
|
|
|||
|
Restructuring charges, net
|
75
|
|
28
|
|
199
|
|
||||||
|
Total acquisition and restructuring costs
|
$
|
133
|
|
$
|
104
|
|
$
|
225
|
|
|||
183
Acquisition Costs
Acquisition costs recorded in the years ended
December 31, 2014
,
2013
and
2012
were related to previously disclosed acquisitions.
Restructuring Charges
Information with respect to our Business Operations and Information Technology Transformation program and our 2012 expense control measures, including charges, employee reductions and related accruals, is provided in the following sections.
Business Operations and Information Technology Transformation Program
In
November 2010
, we announced a global multi-year Business Operations and Information Technology Transformation program which we completed in the fourth quarter of
2014
. The program included operational, information technology and targeted cost initiatives, including reductions in both staff and occupancy costs.
The majority of the annual savings have affected compensation and employee benefits expenses. These savings have been modestly offset by increases in information systems and communications expenses.
We recorded aggregate restructuring charges of
$440 million
in our consolidated statement of income, composed of
$156 million
in
2010
,
$133 million
in
2011
,
$67 million
in
2012
,
$25 million
in
2013
and
$59 million
in
2014
.
The charges related to the program included costs related to severance, benefits and outplacement services, as well as costs which resulted from actions taken to reduce our occupancy costs through the consolidation of leases and properties. The charges also included costs related to information technology, including transition fees associated with the expansion of our use of third-party service providers associated with components of our information technology infrastructure and application maintenance and support.
In
2010
, in connection with the program, we initiated the involuntary termination of
1,400
employees, or approximately
5%
of our global workforce, which we completed by the end of
2011
. In addition, in connection with our announcement in
2011
of the expansion of our use of third-party service providers associated with our information technology infrastructure and application maintenance and support, as well as the continued execution of the business operations transformation component of the program, we identified
1,574
additional involuntary terminations. As of
December 31, 2014
, we substantially completed these reductions.
Aggregate Restructuring-Related Accrual Activity
The following table presents aggregate activity associated with accruals that resulted from the charges associated with the Business Operations and Information Technology Transformation program and 2012 expense control measures:
|
(In millions)
|
Employee-
Related
Costs
|
Real Estate Consolidation
|
Asset and Other Write-Offs
|
Total
|
|||||||||||
|
Balance as of December 31, 2013
|
$
|
50
|
|
$
|
49
|
|
$
|
7
|
|
$
|
106
|
|
|||
|
Additional accruals for Business Operations and Information Technology Transformation program
|
38
|
|
21
|
|
—
|
|
59
|
|
|||||||
|
Additional accruals for 2012 expense control measures
|
(2
|
)
|
—
|
|
18
|
|
16
|
|
|||||||
|
Payments and adjustments
|
(46
|
)
|
(46
|
)
|
(18
|
)
|
(110
|
)
|
|||||||
|
Balance as of December 31, 2014
|
$
|
40
|
|
$
|
24
|
|
$
|
7
|
|
$
|
71
|
|
|||
184
Other Expenses:
Other expenses of
$751 million
in 2014 included a legal accrual of
$185 million
in connection with management's intention to seek to resolve some, but not all, of the outstanding and potential claims arising out of our indirect FX client activities. These matters are more fully discussed under "Legal and Regulatory Matters" in note
11
to the consolidated financial statements.
As a result of the 2008 Lehman Brothers bankruptcy, we had various claims against Lehman Brothers entities in bankruptcy proceedings in the U.S. and the U.K. We also had amounts asserted as owed, or return obligations, to Lehman Brothers entities. The various claims and amounts owed arose from transactions that existed at the time Lehman Brothers entered bankruptcy, including prime brokerage arrangements, foreign exchange transactions, securities lending arrangements and repurchase agreements. In 2011, we reached an agreement with certain Lehman Brothers estates in the U.S. to resolve the value of deficiency claims arising out of indemnified repurchase transactions in the U.S., and the bankruptcy court allowed those claims in the amount of
$400 million
.
In 2012, we reached an agreement to settle the claims against the Lehman Brothers estate in the U.K. related to the close-out of securities lending and repurchase arrangements.
In connection with our resolution of the indemnified repurchase and securities lending claims in the U.S. and the U.K., we recognized a credit of approximately
$362 million
in our consolidated statement of income in 2012. Both certified claims retained as part of the settlement agreements were subsequently sold at their respective fair values, resulting in an additional gain of approximately
$10 million
, which was also recorded in our consolidated statement of income in 2012.
In 2014, we received aggregate distributions totaling approximately
$21 million
from the Lehman Brothers estates, compared to approximately
$186 million
from the Lehman Brothers estates in 2013. Of the aggregate distributions received in both 2014 and 2013, approximately
$11 million
and
$101 million
was applied to reduce remaining Lehman Brothers-related assets, primarily prime brokerage claim-related receivables, recorded in our consolidated statement of condition; the remaining
$10 million
and
$85 million
, respectively, was recorded as an aggregate credit to other expenses in our consolidated statement of income.
Note
22
. Income Taxes
We use an asset-and-liability approach to account for income taxes. Our objective is to recognize the amount of taxes payable or refundable for the current year through charges or credits to the current tax provision, and to recognize deferred tax assets and deferred tax liabilities for the future tax consequences resulting from temporary differences between the amounts reported in our consolidated financial statements and their respective tax bases. The measurement of tax assets and liabilities is based on enacted tax laws and applicable tax rates. The effects of a tax position on our consolidated financial statements are recognized when we believe it is more likely than not that the position will be sustained. A deferred-tax-asset valuation allowance is established if it is considered more likely than not that all or a portion of the deferred tax assets will not be realized. Deferred tax assets and deferred tax liabilities recorded in our consolidated statement of condition are netted within the same tax jurisdiction.
The following table presents the components of income tax expense for the years ended
December 31
:
|
(In millions)
|
2014
|
2013
|
2012
|
||||||||
|
Current:
|
|||||||||||
|
Federal
|
$
|
59
|
|
$
|
193
|
|
$
|
148
|
|
||
|
State
|
39
|
|
47
|
|
64
|
|
|||||
|
Non-U.S.
|
257
|
|
248
|
|
262
|
|
|||||
|
Total current expense
|
355
|
|
488
|
|
474
|
|
|||||
|
Deferred:
|
|||||||||||
|
Federal
|
42
|
|
28
|
|
267
|
|
|||||
|
State
|
11
|
|
17
|
|
27
|
|
|||||
|
Non-U.S.
|
13
|
|
17
|
|
(63
|
)
|
|||||
|
Total deferred expense
|
66
|
|
62
|
|
231
|
|
|||||
|
Total income tax expense
|
$
|
421
|
|
$
|
550
|
|
$
|
705
|
|
||
In 2014 we expanded our municipal securities portfolio, increased our investments in alternative energy projects and realized greater benefits from our non-U.S. operations.
In
2013
, we completed a multi-year tax data enhancement process, the final stages of which identified a reconciliation difference in our deferred tax accounts, and we determined that our deferred tax liabilities were overstated by
$50 million
and our deferred tax assets were understated by
$21 million
, which resulted in an out-of-period income tax benefit of
$71 million
. This income tax benefit is reflected in the table above as a reduction of total deferred income tax expense for
2013
.
185
The amount for
2012
presented in the table included income tax expense of
$40 million
associated with indemnification benefits, recorded as offsets to acquisition costs, for the assumption of income tax liabilities related to the
2010
Intesa acquisition.
The amount of income tax expense (benefit) related to net gains (losses) from sales of investment securities was
$5 million
,
$6 million
and
$22 million
in
2014
,
2013
and
2012
, respectively. Pre-tax income attributable to our operations located outside the U.S. was approximately
$1.33 billion
,
$1.25 billion
and
$1.11 billion
for
2014
,
2013
and
2012
, respectively.
Pre-tax earnings of our non-U.S. subsidiaries are subject to U.S. income tax when effectively repatriated. As of
December 31, 2014
, we have chosen to indefinitely reinvest approximately
$4.2 billion
of earnings of certain of our non-U.S. subsidiaries.
No
provision has been recorded for U.S. income taxes that could be incurred upon repatriation. As of
December 31, 2014
, if such earnings had been repatriated to the U.S., we would have provided for approximately
$876 million
of additional income tax expense.
The following table presents significant components of our gross deferred tax assets and gross deferred tax liabilities as of
December 31
:
(1)
Amount as of
December 31, 2013
includes an increase of
$21
|
(In millions)
|
2014
|
2013
|
|||||
|
Deferred tax assets:
|
|||||||
|
Unrealized losses on investment securities, net
|
$
|
—
|
|
$
|
421
|
|
|
|
Deferred compensation
(1)
|
168
|
|
209
|
|
|||
|
Defined benefit pension plan
|
193
|
|
97
|
|
|||
|
Restructuring charges and other reserves
|
160
|
|
126
|
|
|||
|
Foreign currency translation
|
56
|
|
—
|
|
|||
|
Real estate
|
9
|
|
18
|
|
|||
|
Other
|
68
|
|
57
|
|
|||
|
Total deferred tax assets
|
654
|
|
928
|
|
|||
|
Valuation allowance for deferred tax assets
|
(54
|
)
|
(33
|
)
|
|||
|
Deferred tax assets, net of valuation allowance
|
$
|
600
|
|
$
|
895
|
|
|
|
Deferred tax liabilities:
|
|||||||
|
Unrealized gains on securities, net
|
$
|
5
|
|
$
|
—
|
|
|
|
Leveraged lease financing
|
326
|
|
359
|
|
|||
|
Fixed and intangible assets
|
1,006
|
|
1,073
|
|
|||
|
Non-U.S. earnings
|
167
|
|
105
|
|
|||
|
Foreign currency translation
|
—
|
|
35
|
|
|||
|
Other
(2)
|
83
|
|
44
|
|
|||
|
Total deferred tax liabilities
|
$
|
1,587
|
|
$
|
1,616
|
|
|
million
associated with an out-of-period income tax benefit recorded in
2013
.
(2)
Amount as of
December 31, 2013
was adjusted to reflect a decrease of
$50 million
associated with an out-of-period income tax benefit recorded in
2013
.
Management considers the valuation allowance adequate to reduce the total deferred tax assets to an aggregate amount that will more likely than not be realized. Management has determined that a valuation allowance is not required for the remaining deferred tax assets because it is more likely than not that there is sufficient taxable income of the appropriate nature within the carryback and carryforward periods to realize these assets.
As of
December 31, 2014
and
2013
, we had deferred tax assets associated with tax credit carryforwards of
$2 million
and
$3 million
, respectively, which are presented in the table. The tax credit carryforwards expire in
2033
. As of
December 31, 2014
and
2013
, we had deferred tax assets associated with non-U.S. and state loss carryforwards of
$53 million
and
$50 million
, respectively, included in “other” in the table. Of the total loss carryforwards of
$53 million
as of
December 31, 2014
,
$41 million
do not expire, and the remaining
$12 million
expire through
2033
. The loss carryforwards have a valuation allowance of
$45 million
and
$30 million
for the years ending
December 31, 2014
and
2013
.
The following table presents a reconciliation of the U.S. statutory income tax rate to our effective tax rate based on income before income tax expense for the years ended
December 31
:
|
2014
|
2013
|
2012
|
||||||
|
U.S. federal income tax rate
|
35.0
|
%
|
35.0
|
%
|
35.0
|
%
|
||
|
Changes from statutory rate:
|
||||||||
|
State taxes, net of federal benefit
|
1.5
|
|
1.6
|
|
1.8
|
|
||
|
Tax-exempt income
|
(5.0
|
)
|
(3.7
|
)
|
(2.6
|
)
|
||
|
Tax credits
|
(6.7
|
)
|
(3.6
|
)
|
(2.8
|
)
|
||
|
Foreign tax differential
|
(8.5
|
)
|
(5.9
|
)
|
(5.5
|
)
|
||
|
Out-of-period income tax benefit
(1)
|
—
|
|
(2.7
|
)
|
—
|
|
||
|
Other, net
|
.9
|
|
(.2
|
)
|
(.4
|
)
|
||
|
Effective tax rate
|
17.2
|
%
|
20.5
|
%
|
25.5
|
%
|
||
|
(1)
|
Excluding the impact of the out-of-period income tax benefit of
$71 million
described earlier in this note, our effective tax rate for 2013 would have been
23.2%
.
|
186
The following table presents activity related to unrecognized tax benefits as of
December 31
:
|
(In millions)
|
2014
|
2013
|
|||||
|
Beginning balance
|
$
|
158
|
|
$
|
95
|
|
|
|
Decrease related to agreements with tax authorities
|
(9
|
)
|
(4
|
)
|
|||
|
Increase related to tax positions taken during current year
|
8
|
|
10
|
|
|||
|
Increase related to tax positions taken during prior year
|
6
|
|
57
|
|
|||
|
Ending balance
|
$
|
163
|
|
$
|
158
|
|
|
The amount of unrecognized tax benefits that, if recognized, would reduce income tax expense and our effective tax rate was
$96 million
as of
December 31, 2014
. Unrecognized tax benefits do not include accrued interest of approximately
$9 million
and
$7 million
as of
December 31, 2014
and
2013
, respectively.
We recorded interest and penalties related to income taxes as a component of income tax expense. Income tax expense included related interest and penalties of approximately
$3 million
for the years ended
December 31, 2014
and
2013
.
It is reasonably possible that the unrecognized tax benefits could decrease by up to
$120 million
within the next 12 months due to the resolution of an audit, of which
$61 million
would reduce our income tax expense and our effective tax rate. Management believes that we have sufficient accrued liabilities as of
December 31, 2014
for tax exposures and related interest expense.
Note
23
. Earnings Per Common Share
Basic earnings per share, or EPS, is calculated pursuant to the “two-class” method, by dividing net income available to common shareholders by the weighted-average common shares outstanding during the period. Diluted EPS is calculated pursuant to the two-class method, by dividing net income available to common shareholders by the total weighted-average number of common shares outstanding for the period plus the shares representing the dilutive effect of common stock options and other equity-based awards. The effect of common stock options and other equity-based awards is excluded from the calculation of diluted EPS in periods in which their effect would be anti-dilutive.
The two-class method requires the allocation of undistributed net income between common and participating shareholders. Net income available to common shareholders, presented separately in our consolidated statement of income, is the basis for the calculation of both basic and diluted EPS. Participating securities are composed of unvested restricted stock and fully vested deferred director
stock awards, which are equity-based awards that contain non-forfeitable rights to dividends, and are considered to participate with common shareholders in undistributed earnings.
The following tables present the computation of basic and diluted earnings per common share for the
years ended December 31
:
|
(Dollars in millions, except per share amounts)
|
2014
|
2013
|
2012
|
||||||||
|
Net income
|
$
|
2,037
|
|
$
|
2,136
|
|
$
|
2,061
|
|
||
|
Less:
|
|||||||||||
|
Preferred stock dividends
|
(61
|
)
|
(26
|
)
|
(29
|
)
|
|||||
|
Dividends and undistributed earnings allocated to participating securities
(1)
|
(3
|
)
|
(8
|
)
|
(13
|
)
|
|||||
|
Net income available to common shareholders
|
$
|
1,973
|
|
$
|
2,102
|
|
$
|
2,019
|
|
||
|
Average common shares outstanding (in thousands):
|
|||||||||||
|
Basic average common shares
|
424,223
|
|
446,245
|
|
474,458
|
|
|||||
|
Effect of dilutive securities: common stock options and common stock awards
|
7,784
|
|
8,910
|
|
6,671
|
|
|||||
|
Diluted average common shares
|
432,007
|
|
455,155
|
|
481,129
|
|
|||||
|
Anti-dilutive securities
(2)
|
1,498
|
|
1,855
|
|
5,619
|
|
|||||
|
Earnings per Common Share:
|
|||||||||||
|
Basic
|
$
|
4.65
|
|
$
|
4.71
|
|
$
|
4.25
|
|
||
|
Diluted
(3)
|
4.57
|
|
4.62
|
|
4.20
|
|
|||||
(1)
Represents the portion of net income available to common equity allocated to participating securities, composed of fully vested deferred director stock and unvested restricted stock that contain non-forfeitable rights to dividends during the vesting period on a basis equivalent to dividends paid to common shareholders.
(2)
Represents common stock options and other equity-based awards outstanding but not included in the computation of diluted average common shares, because their effect was anti-dilutive.
(3)
Calculations reflect allocation of earnings to participating securities using the two-class method, as this computation is more dilutive than the treasury stock method.
Note
24
. Line of Business Information
We have
two
lines of business: Investment Servicing and Investment Management. Given our services and management organization, the results of operations for these lines of business are not necessarily comparable with those of other companies, including companies in the financial services industry.
Investment Servicing provides services for U.S. mutual funds, collective investment funds and other investment pools, corporate and public retirement plans, insurance companies, foundations and endowments worldwide. Products include custody; product- and participant-level accounting; daily pricing and administration; master trust and master custody; record-keeping; cash management; foreign exchange, brokerage and other trading services;
187
securities finance; deposit and short-term investment facilities; loans and lease financing; investment manager and alternative investment manager operations outsourcing; and performance, risk and compliance analytics to support institutional investors. We provide shareholder services, which include mutual fund and collective investment fund shareholder accounting, through 50%-owned affiliates, Boston Financial Data Services, Inc. and the International Financial Data Services group of companies.
Investment Management, through SSGA, provides a broad array of investment management, investment research and investment advisory services to corporations, public funds and other sophisticated investors. SSGA offers active and passive asset management strategies across equity, fixed-income and cash asset classes. Products are distributed directly and through intermediaries using a variety of investment vehicles, including exchange-traded funds, or ETFs, such as the SPDR
®
ETF brand.
Our investment servicing strategy is to focus on total client relationships and the full integration of our products and services across our client base through cross-selling opportunities. In general, our clients will use a combination of services, depending on their needs, rather than one product or service. For instance, a custody client may purchase securities finance and cash management services from different business units. Products and services that we provide to our clients are parts of an integrated offering to these clients. We price our products and services on the basis of overall client relationships and other factors; as a result, revenue may not necessarily reflect the stand-alone market price of these products and services within the business lines in the same way it would for separate business entities.
Generally, approximately
70%
to
75%
of our consolidated total revenue (fee revenue from investment servicing and investment management, as well as trading services and securities finance activities) is generated by these
two
business lines. The remaining
25%
to
30%
is composed of processing fees and other revenue, net interest revenue, which is largely generated by our investment of client deposits, short-term borrowings and long-term debt in a variety of assets, and net gains (losses) related to investment securities. These other revenue types are generally fully allocated to, or reside in, Investment Servicing and Investment Management.
Revenue and expenses are directly charged or allocated to our lines of business through management information systems. Assets and liabilities are allocated according to policies that support management’s strategic and tactical goals. Capital is allocated based on the relative risks and capital requirements inherent in each business line, along with management judgment. Capital allocations may not be representative of the capital that might be required if these lines of business were separate business entities.
The following is a summary of our line-of-business results for the periods indicated.
The “Other” column for the
year ended December 31, 2014
included net costs
$219 million
composed of the following -
|
•
|
Net acquisition and restructuring costs of
$133 million
;
|
|
•
|
Net severance costs associated with staffing realignment of
$84 million
; and
|
|
•
|
Net provisions for litigation exposure and other costs of
$2 million
.
|
The “Other” column for the
year ended December 31, 2013
included net costs of
$180 million
composed of the following -
|
•
|
Net acquisition and restructuring costs of
$104 million
;
|
|
•
|
Net provisions for litigation exposure and other costs of
$65 million
; and
|
|
•
|
Net severance costs associated with staffing realignment of
$11 million
; and
|
The “Other” column for the
year ended
December 31, 2012
included net losses of
$27 million
composed of the following -
|
•
|
Net realized loss from the sale of all of our Greek investment securities of
$46 million
;
|
|
•
|
A benefit related to claims associated with the 2008 Lehman Brothers bankruptcy of
$362 million
;
|
|
•
|
Net acquisition and restructuring costs of
$225 million
; and
|
|
•
|
Net provisions for litigation exposure and other costs of
$118 million
.
|
The amounts in the “Other” columns were not allocated to State Street's business lines. Prior reported results reflect reclassifications, for comparative purposes, related to management changes in methodologies associated with allocations of revenue and expenses to lines-of-business in
2014
.
188
|
Years Ended December 31,
|
|||||||||||||||||||||||||||||||||||||||||||||||
|
Investment
Servicing
|
Investment
Management
|
Other
|
Total
|
||||||||||||||||||||||||||||||||||||||||||||
|
2014
|
2013
|
2012
|
2014
|
2013
|
2012
|
2014
|
2013
|
2012
|
2014
|
2013
|
2012
|
||||||||||||||||||||||||||||||||||||
|
(Dollars in millions,
except where otherwise noted)
|
|||||||||||||||||||||||||||||||||||||||||||||||
|
Servicing fees
|
$
|
5,129
|
|
$
|
4,819
|
|
$
|
4,414
|
|
$
|
—
|
|
$
|
—
|
|
$
|
—
|
|
$
|
—
|
|
$
|
—
|
|
$
|
—
|
|
$
|
5,129
|
|
$
|
4,819
|
|
$
|
4,414
|
|
|||||||||||
|
Management fees
|
—
|
|
—
|
|
—
|
|
1,207
|
|
1,106
|
|
993
|
|
—
|
|
—
|
|
—
|
|
1,207
|
|
1,106
|
|
993
|
|
|||||||||||||||||||||||
|
Trading services
|
1,039
|
|
1,027
|
|
938
|
|
45
|
|
67
|
|
98
|
|
—
|
|
—
|
|
—
|
|
1,084
|
|
1,094
|
|
1,036
|
|
|||||||||||||||||||||||
|
Securities finance
|
437
|
|
359
|
|
405
|
|
—
|
|
—
|
|
—
|
|
—
|
|
—
|
|
—
|
|
437
|
|
359
|
|
405
|
|
|||||||||||||||||||||||
|
Processing fees and other
|
179
|
|
206
|
|
235
|
|
(5
|
)
|
6
|
|
5
|
|
—
|
|
—
|
|
—
|
|
174
|
|
212
|
|
240
|
|
|||||||||||||||||||||||
|
Total fee revenue
|
6,784
|
|
6,411
|
|
5,992
|
|
1,247
|
|
1,179
|
|
1,096
|
|
—
|
|
—
|
|
—
|
|
8,031
|
|
7,590
|
|
7,088
|
|
|||||||||||||||||||||||
|
Net interest revenue
|
2,188
|
|
2,221
|
|
2,464
|
|
72
|
|
82
|
|
74
|
|
—
|
|
—
|
|
—
|
|
2,260
|
|
2,303
|
|
2,538
|
|
|||||||||||||||||||||||
|
Gains (losses) related to investment securities, net
|
4
|
|
(9
|
)
|
69
|
|
—
|
|
—
|
|
—
|
|
—
|
|
—
|
|
(46
|
)
|
4
|
|
(9
|
)
|
23
|
|
|||||||||||||||||||||||
|
Total revenue
|
8,976
|
|
8,623
|
|
8,525
|
|
1,319
|
|
1,261
|
|
1,170
|
|
—
|
|
—
|
|
(46
|
)
|
10,295
|
|
9,884
|
|
9,649
|
|
|||||||||||||||||||||||
|
Provision for loan losses
|
10
|
|
6
|
|
(3
|
)
|
—
|
|
—
|
|
—
|
|
—
|
|
—
|
|
—
|
|
10
|
|
6
|
|
(3
|
)
|
|||||||||||||||||||||||
|
Total expenses
|
6,648
|
|
6,190
|
|
6,058
|
|
960
|
|
822
|
|
847
|
|
219
|
|
180
|
|
(19
|
)
|
7,827
|
|
7,192
|
|
6,886
|
|
|||||||||||||||||||||||
|
Income before income tax expense
|
$
|
2,318
|
|
$
|
2,427
|
|
$
|
2,470
|
|
$
|
359
|
|
$
|
439
|
|
$
|
323
|
|
$
|
(219
|
)
|
$
|
(180
|
)
|
$
|
(27
|
)
|
$
|
2,458
|
|
$
|
2,686
|
|
$
|
2,766
|
|
|||||||||||
|
Pre-tax margin
|
26
|
%
|
28
|
%
|
29
|
%
|
27
|
%
|
35
|
%
|
28
|
%
|
24
|
%
|
27
|
%
|
29
|
%
|
|||||||||||||||||||||||||||||
|
Average assets (in billions)
|
$
|
234.2
|
|
$
|
203.2
|
|
$
|
190.1
|
|
$
|
3.9
|
|
$
|
3.8
|
|
$
|
3.7
|
|
$
|
238.1
|
|
$
|
207.0
|
|
$
|
193.8
|
|
||||||||||||||||||||
Note
25
. Non-U.S. Activities
We generally define our non-U.S. activities as those revenue-producing business activities that arise from clients domiciled outside the U.S. Due to the integrated nature of our business, precise segregation of our U.S. and non-U.S. activities is not possible. Subjective estimates and other judgments are applied to quantify the financial results and assets related to our non-U.S. activities, including our application of funds transfer pricing, our asset-and-liability management policies and our allocation of certain indirect corporate expenses. Interest expense allocations are based on our internal funds transfer pricing methodology.
The following table presents our non-U.S. financial results for the years ended
December 31
:
|
(In millions)
|
2014
|
2013
|
2012
|
||||||||
|
Total fee revenue
|
$
|
3,364
|
|
$
|
3,119
|
|
$
|
2,917
|
|
||
|
Net interest revenue
|
1,236
|
|
1,191
|
|
953
|
|
|||||
|
Gains (losses) related to investment securities, net
|
6
|
|
(11
|
)
|
(40
|
)
|
|||||
|
Total revenue
|
4,606
|
|
4,299
|
|
3,830
|
|
|||||
|
Expenses
|
3,272
|
|
3,130
|
|
3,013
|
|
|||||
|
Income before income taxes
|
1,334
|
|
1,169
|
|
817
|
|
|||||
|
Income tax expense
|
319
|
|
289
|
|
204
|
|
|||||
|
Net income
|
$
|
1,015
|
|
$
|
880
|
|
$
|
613
|
|
||
Gain (losses) related to investment securities, net, for the year ended
December 31, 2012
included a loss of
$46 million
from the sale of all of our Greek investment securities. Non-U.S. revenue for the year ended
December 31
,
2014
included
$1.02 billion
in the U.K., primarily from our London operations.
The following table presents the significant components of our non-U.S. assets as of
December 31
, based on the domicile of the underlying counterparties:
|
(In millions)
|
2014
|
2013
|
|||||
|
Interest-bearing deposits with banks
|
$
|
17,382
|
|
$
|
9,584
|
|
|
|
Investment securities
|
29,060
|
|
31,522
|
|
|||
|
Other assets
|
13,577
|
|
16,778
|
|
|||
|
Total non-U.S. assets
|
$
|
60,019
|
|
$
|
57,884
|
|
|
189
On
February 20, 2015
, we announced an increase from
$50 million
to
$115 million
of the fourth-quarter 2014 legal accrual associated with indirect foreign exchange matters that we announced on
January 23, 2015
, when we initially reported on our results for the fourth-quarter and year-ended
December 31, 2014
. See our Current Report on Form 8-K dated, and filed with the SEC on,
February 20, 2015
for additional information regarding this additional accrual. The effects of the additional accrual are reflected in the financial and other information reported in this Form 10-K.
|
Note 27.
|
Parent Company Financial Statements
|
The following tables present the financial statements of the parent company without consolidation of its banking and non-banking subsidiaries, as of and for the
years ended December 31
:
STATEMENT OF INCOME - PARENT COMPANY
|
Years Ended December 31,
|
2014
|
2013
|
2012
|
||||||||
|
(In millions)
|
|
|
|
||||||||
|
Cash dividends from consolidated banking subsidiary
|
$
|
1,470
|
|
$
|
1,694
|
|
$
|
1,785
|
|
||
|
Cash dividends from consolidated non-banking subsidiaries and unconsolidated entities
|
138
|
|
250
|
|
68
|
|
|||||
|
Other, net
|
63
|
|
35
|
|
38
|
|
|||||
|
Total revenue
|
1,671
|
|
1,979
|
|
1,891
|
|
|||||
|
Interest expense
|
193
|
|
169
|
|
163
|
|
|||||
|
Other expenses
|
55
|
|
88
|
|
85
|
|
|||||
|
Total expenses
|
248
|
|
257
|
|
248
|
|
|||||
|
Income tax benefit
|
(83
|
)
|
(84
|
)
|
(63
|
)
|
|||||
|
Income (loss) before equity in undistributed income of consolidated subsidiaries and unconsolidated entities
|
1,506
|
|
1,806
|
|
1,706
|
|
|||||
|
Equity in undistributed income of consolidated subsidiaries and unconsolidated entities:
|
|||||||||||
|
Consolidated banking subsidiary
|
375
|
|
237
|
|
173
|
|
|||||
|
Consolidated non-banking subsidiaries and unconsolidated entities
|
156
|
|
93
|
|
182
|
|
|||||
|
Net income
|
$
|
2,037
|
|
$
|
2,136
|
|
$
|
2,061
|
|
||
190
STATEMENT OF CONDITION - PARENT COMPANY
|
As of December 31,
|
2014
|
2013
|
|||||
|
(In millions)
|
|
|
|||||
|
Assets:
|
|||||||
|
Interest-bearing deposits with consolidated banking subsidiary
|
$
|
6,030
|
|
$
|
4,419
|
|
|
|
Trading account assets
|
279
|
|
216
|
|
|||
|
Investment securities available for sale
|
35
|
|
31
|
|
|||
|
Investments in subsidiaries:
|
|||||||
|
Consolidated banking subsidiary
|
20,123
|
|
19,985
|
|
|||
|
Consolidated non-banking subsidiaries
|
2,739
|
|
2,617
|
|
|||
|
Unconsolidated entities
|
288
|
|
272
|
|
|||
|
Notes and other receivables from:
|
|||||||
|
Consolidated banking subsidiary
|
1,526
|
|
1,528
|
|
|||
|
Consolidated non-banking subsidiaries and unconsolidated entities
|
331
|
|
256
|
|
|||
|
Other assets
|
447
|
|
327
|
|
|||
|
Total assets
|
$
|
31,798
|
|
$
|
29,651
|
|
|
|
Liabilities:
|
|||||||
|
Commercial paper
|
$
|
2,485
|
|
$
|
1,819
|
|
|
|
Accrued expenses and other liabilities
|
514
|
|
447
|
|
|||
|
Long-term debt
|
7,326
|
|
7,007
|
|
|||
|
Total liabilities
|
10,325
|
|
9,273
|
|
|||
|
Shareholders’ equity
|
21,473
|
|
20,378
|
|
|||
|
Total liabilities and shareholders’ equity
|
$
|
31,798
|
|
$
|
29,651
|
|
|
191
STATEMENT OF CASH FLOWS - PARENT COMPANY
|
Years Ended December 31,
|
2014
|
2013
|
2012
|
||||||||
|
(In millions)
|
|
|
|
||||||||
|
Net cash provided by (used in) operating activities
|
$
|
1,767
|
|
$
|
2,296
|
|
$
|
2,706
|
|
||
|
Investing Activities:
|
|||||||||||
|
Net decrease (increase) in interest-bearing deposits with consolidated banking subsidiary
|
(1,610
|
)
|
(620
|
)
|
1,115
|
|
|||||
|
Investments in consolidated banking and non-banking subsidiaries
|
(1,142
|
)
|
(1,100
|
)
|
(68
|
)
|
|||||
|
Sale or repayment of investment in consolidated banking and non-banking subsidiaries
|
1,011
|
|
32
|
|
28
|
|
|||||
|
Business acquisitions
|
—
|
|
—
|
|
(2
|
)
|
|||||
|
Net cash provided by (used in) investing activities
|
(1,741
|
)
|
(1,688
|
)
|
1,073
|
|
|||||
|
Financing Activities:
|
|||||||||||
|
Net decrease in short-term borrowings
|
—
|
|
—
|
|
(500
|
)
|
|||||
|
Net decrease in commercial paper
|
667
|
|
(499
|
)
|
(66
|
)
|
|||||
|
Proceeds from issuance of long-term debt, net of issuance costs
|
994
|
|
2,485
|
|
—
|
|
|||||
|
Payments for long-term debt
|
(750
|
)
|
—
|
|
(1,750
|
)
|
|||||
|
Proceeds from issuance of preferred stock, net of issuance costs
|
1,470
|
|
—
|
|
488
|
|
|||||
|
Proceeds from exercises of common stock options
|
14
|
|
121
|
|
53
|
|
|||||
|
Purchases of common stock
|
(1,650
|
)
|
(2,040
|
)
|
(1,440
|
)
|
|||||
|
Repurchases of common stock for employee tax withholding
|
(232
|
)
|
(189
|
)
|
(101
|
)
|
|||||
|
Payments for cash dividends
|
(539
|
)
|
(486
|
)
|
(463
|
)
|
|||||
|
Net cash provided by (used in) financing activities
|
(26
|
)
|
(608
|
)
|
(3,779
|
)
|
|||||
|
Net change
|
—
|
|
—
|
|
—
|
|
|||||
|
Cash and due from banks at beginning of year
|
—
|
|
—
|
|
—
|
|
|||||
|
Cash and due from banks at end of year
|
$
|
—
|
|
$
|
—
|
|
$
|
—
|
|
||
192
STATISTICAL DISCLOSURE BY BANK HOLDING COMPANIES
Distribution of Average Assets, Liabilities and Shareholders’ Equity; Interest Rates and Interest Differential (Unaudited)
The following table presents consolidated average statements of condition and net interest revenue for the years indicated.
|
Years Ended December 31,
|
2014
|
2013
|
2012
|
|||||||||||||||||||||||||||||
|
(Dollars in millions; fully
taxable-equivalent basis)
|
Average
Balance
|
Interest
|
Average
Rate
|
Average
Balance
|
Interest
|
Average
Rate
|
Average
Balance
|
Interest
|
Average
Rate
|
|||||||||||||||||||||||
|
Assets:
|
||||||||||||||||||||||||||||||||
|
Interest-bearing deposits with U.S. banks
|
$
|
45,158
|
|
$
|
115
|
|
.25
|
%
|
$
|
15,858
|
|
$
|
40
|
|
.25
|
%
|
$
|
9,305
|
|
$
|
25
|
|
.26
|
%
|
||||||||
|
Interest-bearing deposits with non-U.S. banks
|
10,195
|
|
81
|
|
.80
|
|
13,088
|
|
85
|
|
.65
|
|
17,518
|
|
116
|
|
.66
|
|
||||||||||||||
|
Securities purchased under resale agreements
|
4,077
|
|
38
|
|
.94
|
|
5,766
|
|
45
|
|
.77
|
|
7,243
|
|
51
|
|
.71
|
|
||||||||||||||
|
Trading account assets
|
959
|
|
1
|
|
.13
|
|
748
|
|
—
|
|
—
|
|
651
|
|
—
|
|
—
|
|
||||||||||||||
|
Investment securities:
|
||||||||||||||||||||||||||||||||
|
U.S. Treasury and federal agencies
(1)
|
32,481
|
|
672
|
|
2.07
|
|
33,003
|
|
707
|
|
2.14
|
|
34,576
|
|
799
|
|
2.31
|
|
||||||||||||||
|
State and political subdivisions
(1)
|
10,619
|
|
404
|
|
3.81
|
|
8,637
|
|
391
|
|
4.53
|
|
7,346
|
|
338
|
|
4.60
|
|
||||||||||||||
|
Other investments
|
73,709
|
|
1,241
|
|
1.68
|
|
76,056
|
|
1,331
|
|
1.75
|
|
71,988
|
|
1,552
|
|
2.16
|
|
||||||||||||||
|
Loans
|
14,838
|
|
231
|
|
1.56
|
|
12,660
|
|
215
|
|
1.70
|
|
10,404
|
|
212
|
|
2.03
|
|
||||||||||||||
|
Lease financing
(1)
|
1,074
|
|
35
|
|
3.26
|
|
1,121
|
|
38
|
|
3.43
|
|
1,206
|
|
42
|
|
3.54
|
|
||||||||||||||
|
Other interest-earning assets
|
15,944
|
|
7
|
|
.05
|
|
11,164
|
|
4
|
|
.04
|
|
7,378
|
|
3
|
|
.04
|
|
||||||||||||||
|
Total interest-earning assets
(1)
|
209,054
|
|
2,825
|
|
1.36
|
|
178,101
|
|
2,856
|
|
1.60
|
|
167,615
|
|
3,138
|
|
1.88
|
|
||||||||||||||
|
Cash and due from banks
|
4,139
|
|
3,747
|
|
3,811
|
|
||||||||||||||||||||||||||
|
Other assets
|
24,935
|
|
25,182
|
|
22,384
|
|
||||||||||||||||||||||||||
|
Total assets
|
$
|
238,128
|
|
$
|
207,030
|
|
$
|
193,810
|
|
|||||||||||||||||||||||
|
Liabilities and shareholders’ equity:
|
||||||||||||||||||||||||||||||||
|
Interest-bearing deposits:
|
||||||||||||||||||||||||||||||||
|
Time
|
$
|
7,254
|
|
$
|
15
|
|
.20
|
%
|
$
|
2,504
|
|
$
|
6
|
|
.23
|
%
|
$
|
7,245
|
|
$
|
16
|
|
.17
|
%
|
||||||||
|
Savings
|
14,042
|
|
6
|
|
.04
|
|
6,358
|
|
4
|
|
.07
|
|
2,088
|
|
3
|
|
.15
|
|
||||||||||||||
|
Non-U.S.
|
109,003
|
|
78
|
|
.07
|
|
100,391
|
|
83
|
|
.08
|
|
89,059
|
|
147
|
|
.16
|
|
||||||||||||||
|
Total interest-bearing deposits
|
130,299
|
|
99
|
|
.08
|
|
109,253
|
|
93
|
|
.14
|
|
98,392
|
|
166
|
|
.17
|
|
||||||||||||||
|
Securities sold under repurchase agreements
|
8,817
|
|
—
|
|
—
|
|
8,436
|
|
1
|
|
.01
|
|
7,697
|
|
1
|
|
.01
|
|
||||||||||||||
|
Federal funds purchased
|
20
|
|
—
|
|
—
|
|
298
|
|
—
|
|
—
|
|
784
|
|
1
|
|
.09
|
|
||||||||||||||
|
Other short-term borrowings
|
4,177
|
|
5
|
|
.12
|
|
3,785
|
|
59
|
|
1.57
|
|
4,676
|
|
71
|
|
1.52
|
|
||||||||||||||
|
Long-term debt
|
9,309
|
|
245
|
|
2.63
|
|
8,415
|
|
232
|
|
2.75
|
|
7,008
|
|
222
|
|
3.17
|
|
||||||||||||||
|
Other interest-bearing liabilities
|
7,351
|
|
43
|
|
.59
|
|
6,457
|
|
26
|
|
.40
|
|
5,898
|
|
15
|
|
.26
|
|
||||||||||||||
|
Total interest-bearing liabilities
|
159,973
|
|
392
|
|
.25
|
|
136,644
|
|
411
|
|
.30
|
|
124,455
|
|
476
|
|
.39
|
|
||||||||||||||
|
Noninterest-bearing deposits:
|
||||||||||||||||||||||||||||||||
|
Special time
|
5,862
|
|
769
|
|
1,203
|
|
||||||||||||||||||||||||||
|
Demand
|
37,900
|
|
34,725
|
|
34,850
|
|
||||||||||||||||||||||||||
|
Non-U.S.
(2)
|
279
|
|
800
|
|
459
|
|
||||||||||||||||||||||||||
|
Other liabilities
|
12,797
|
|
13,561
|
|
12,660
|
|
||||||||||||||||||||||||||
|
Shareholders’ equity
|
21,317
|
|
20,531
|
|
20,183
|
|
||||||||||||||||||||||||||
|
Total liabilities and shareholders’ equity
|
$
|
238,128
|
|
$
|
207,030
|
|
$
|
193,810
|
|
|||||||||||||||||||||||
|
Net interest revenue
|
$
|
2,433
|
|
$
|
2,445
|
|
$
|
2,662
|
|
|||||||||||||||||||||||
|
Excess of rate earned over rate paid
|
1.11
|
%
|
1.30
|
%
|
1.49
|
%
|
||||||||||||||||||||||||||
|
Net interest margin
(3)
|
1.16
|
|
1.37
|
|
1.59
|
|
||||||||||||||||||||||||||
|
(1)
|
Fully taxable-equivalent revenue is a method of presentation in which the tax savings achieved by investing in tax-exempt investment securities and certain leases are included in interest revenue with a corresponding charge to income tax expense. This method facilitates the comparison of the performance of these assets. The adjustments are computed using a federal income tax rate of 35%, adjusted for applicable state income taxes, net of the related federal tax benefit. The fully taxable-equivalent adjustments included in interest revenue presented above were
$173 million
,
$142 million
and
$124 million
for the years ended
December 31, 2014
,
2013
and
2012
, respectively, and were substantially related to tax-exempt securities (state and political subdivisions).
|
|
(2)
|
Non-U.S. noninterest-bearing deposits were
$180 million
,
$714 million
and
$330 million
as of
December 31, 2014
,
2013
and
2012
, respectively.
|
|
(3)
|
Net interest margin is calculated by dividing fully taxable-equivalent net interest revenue by average total interest-earning assets.
|
193
The following table summarizes changes in fully taxable-equivalent interest revenue and interest expense due to changes in volume of interest-earning assets and interest-bearing liabilities, and due to changes in interest rates. Changes attributed to both volumes and rates have been allocated based on the proportion of change in each category.
|
Years Ended December 31,
|
2014 Compared to 2013
|
2013 Compared to 2012
|
|||||||||||||||||||||
|
(In millions; fully
taxable-equivalent basis)
|
Change in
Volume |
Change in
Rate |
Net (Decrease)
Increase |
Change in
Volume
|
Change in
Rate
|
Net (Decrease)
Increase
|
|||||||||||||||||
|
Interest revenue related to:
|
|||||||||||||||||||||||
|
Interest-bearing deposits with U.S. banks
|
$
|
73
|
|
$
|
2
|
|
$
|
75
|
|
$
|
17
|
|
$
|
(2
|
)
|
$
|
15
|
|
|||||
|
Interest-bearing deposits with non-U.S. banks
|
(19
|
)
|
15
|
|
(4
|
)
|
(29
|
)
|
(2
|
)
|
(31
|
)
|
|||||||||||
|
Securities purchased under resale agreements
|
(13
|
)
|
6
|
|
(7
|
)
|
(10
|
)
|
4
|
|
(6
|
)
|
|||||||||||
|
Trading account assets
|
—
|
|
1
|
|
1
|
|
—
|
|
—
|
|
—
|
|
|||||||||||
|
Investment securities:
|
|||||||||||||||||||||||
|
U.S. Treasury and federal agencies
|
(11
|
)
|
(24
|
)
|
(35
|
)
|
(36
|
)
|
(56
|
)
|
(92
|
)
|
|||||||||||
|
State and political subdivisions
|
90
|
|
(77
|
)
|
13
|
|
59
|
|
(6
|
)
|
53
|
|
|||||||||||
|
Other investments
|
(41
|
)
|
(49
|
)
|
(90
|
)
|
88
|
|
(309
|
)
|
(221
|
)
|
|||||||||||
|
Loans
|
37
|
|
(21
|
)
|
16
|
|
46
|
|
(43
|
)
|
3
|
|
|||||||||||
|
Lease financing
|
(2
|
)
|
(1
|
)
|
(3
|
)
|
(3
|
)
|
(1
|
)
|
(4
|
)
|
|||||||||||
|
Other interest-earning assets
|
2
|
|
1
|
|
3
|
|
2
|
|
(1
|
)
|
1
|
|
|||||||||||
|
Total interest-earning assets
|
116
|
|
(147
|
)
|
(31
|
)
|
134
|
|
(416
|
)
|
(282
|
)
|
|||||||||||
|
Interest expense related to:
|
|||||||||||||||||||||||
|
Deposits:
|
|||||||||||||||||||||||
|
Time
|
11
|
|
(2
|
)
|
9
|
|
(8
|
)
|
(2
|
)
|
(10
|
)
|
|||||||||||
|
Savings
|
5
|
|
(3
|
)
|
2
|
|
6
|
|
(5
|
)
|
1
|
|
|||||||||||
|
Non-U.S.
|
7
|
|
(12
|
)
|
(5
|
)
|
18
|
|
(82
|
)
|
(64
|
)
|
|||||||||||
|
Securities sold under repurchase agreements
|
—
|
|
(1
|
)
|
(1
|
)
|
—
|
|
—
|
|
—
|
|
|||||||||||
|
Federal funds purchased
|
—
|
|
—
|
|
—
|
|
—
|
|
(1
|
)
|
(1
|
)
|
|||||||||||
|
Other short-term borrowings
|
6
|
|
(60
|
)
|
(54
|
)
|
(14
|
)
|
2
|
|
(12
|
)
|
|||||||||||
|
Long-term debt
|
25
|
|
(12
|
)
|
13
|
|
45
|
|
(35
|
)
|
10
|
|
|||||||||||
|
Other interest-bearing liabilities
|
4
|
|
13
|
|
17
|
|
1
|
|
10
|
|
11
|
|
|||||||||||
|
Total interest-bearing liabilities
|
58
|
|
(77
|
)
|
(19
|
)
|
48
|
|
(113
|
)
|
(65
|
)
|
|||||||||||
|
Net interest revenue
|
$
|
58
|
|
$
|
(70
|
)
|
$
|
(12
|
)
|
$
|
86
|
|
$
|
(303
|
)
|
$
|
(217
|
)
|
|||||
194
Quarterly Summarized Financial Information (Unaudited)
|
2014 Quarters
|
2013 Quarters
|
||||||||||||||||||||||||||||||
|
(Dollars and shares in millions,
except per share amounts)
|
Fourth
|
Third
|
Second
|
First
|
Fourth
|
Third
|
Second
|
First
|
|||||||||||||||||||||||
|
Total fee revenue
|
$
|
2,056
|
|
$
|
2,012
|
|
$
|
2,039
|
|
$
|
1,924
|
|
$
|
1,879
|
|
$
|
1,883
|
|
$
|
1,971
|
|
$
|
1,857
|
|
|||||||
|
Interest revenue
|
676
|
|
671
|
|
650
|
|
655
|
|
684
|
|
643
|
|
700
|
|
687
|
|
|||||||||||||||
|
Interest expense
|
102
|
|
101
|
|
89
|
|
100
|
|
99
|
|
97
|
|
104
|
|
111
|
|
|||||||||||||||
|
Net interest revenue
|
574
|
|
570
|
|
561
|
|
555
|
|
585
|
|
546
|
|
596
|
|
576
|
|
|||||||||||||||
|
Gains (losses) related to investment securities, net
|
—
|
|
—
|
|
(2
|
)
|
6
|
|
—
|
|
(4
|
)
|
(7
|
)
|
2
|
|
|||||||||||||||
|
Total revenue
|
2,630
|
|
2,582
|
|
2,598
|
|
2,485
|
|
2,464
|
|
2,425
|
|
2,560
|
|
2,435
|
|
|||||||||||||||
|
Provision for loan losses
|
4
|
|
2
|
|
2
|
|
2
|
|
6
|
|
—
|
|
—
|
|
—
|
|
|||||||||||||||
|
Total expenses
|
2,057
|
|
1,892
|
|
1,850
|
|
2,028
|
|
1,846
|
|
1,722
|
|
1,798
|
|
1,826
|
|
|||||||||||||||
|
Income before income tax expense
|
569
|
|
688
|
|
746
|
|
455
|
|
612
|
|
703
|
|
762
|
|
609
|
|
|||||||||||||||
|
Income tax expense
|
77
|
|
128
|
|
124
|
|
92
|
|
59
|
|
163
|
|
183
|
|
145
|
|
|||||||||||||||
|
Net income
|
$
|
492
|
|
$
|
560
|
|
$
|
622
|
|
$
|
363
|
|
$
|
553
|
|
$
|
540
|
|
$
|
579
|
|
$
|
464
|
|
|||||||
|
Net income available to common shareholders
|
$
|
473
|
|
$
|
542
|
|
$
|
602
|
|
$
|
356
|
|
$
|
545
|
|
$
|
531
|
|
$
|
571
|
|
$
|
455
|
|
|||||||
|
Earnings per common share
(1)
:
|
|||||||||||||||||||||||||||||||
|
Basic
|
$
|
1.14
|
|
$
|
1.28
|
|
$
|
1.41
|
|
$
|
.83
|
|
$
|
1.25
|
|
$
|
1.20
|
|
$
|
1.26
|
|
$
|
1.00
|
|
|||||||
|
Diluted
|
1.12
|
|
1.26
|
|
1.38
|
|
.81
|
|
1.22
|
|
1.17
|
|
1.24
|
|
.98
|
|
|||||||||||||||
|
Average common shares outstanding:
|
|||||||||||||||||||||||||||||||
|
Basic
|
417
|
|
422
|
|
428
|
|
431
|
|
436
|
|
443
|
|
452
|
|
454
|
|
|||||||||||||||
|
Diluted
|
424
|
|
430
|
|
435
|
|
439
|
|
445
|
|
452
|
|
461
|
|
463
|
|
|||||||||||||||
|
Dividends per common share
|
$
|
.30
|
|
$
|
.30
|
|
$
|
.30
|
|
$
|
.26
|
|
$
|
.26
|
|
$
|
.26
|
|
$
|
.26
|
|
$
|
.26
|
|
|||||||
|
Common stock price:
|
|||||||||||||||||||||||||||||||
|
High
|
$
|
80.92
|
|
$
|
76.78
|
|
$
|
70.20
|
|
$
|
76.24
|
|
$
|
73.63
|
|
$
|
71.27
|
|
$
|
68.18
|
|
$
|
60.65
|
|
|||||||
|
Low
|
64.21
|
|
66.42
|
|
62.67
|
|
64.21
|
|
64.25
|
|
64.92
|
|
54.57
|
|
47.71
|
|
|||||||||||||||
|
Closing
|
78.50
|
|
73.61
|
|
67.26
|
|
69.55
|
|
73.39
|
|
65.75
|
|
65.21
|
|
59.09
|
|
|||||||||||||||
|
(1)
|
Basic earnings per common share for full-year 2014 do not equal the sum of the four quarters for the year. Diluted earnings per common share for full-year 2013 do not equal the sum of the four quarters for the year.
|
None.
|
ITEM 9A.
|
CONTROLS AND PROCEDURES
|
DISCLOSURE CONTROLS AND PROCEDURES; CHANGES IN INTERNAL CONTROL OVER FINANCIAL REPORTING
State Street has established and maintains disclosure controls and procedures that are designed to ensure that material information related to State Street and its subsidiaries on a consolidated basis required to be disclosed in its reports filed or submitted under the Securities Exchange Act of 1934 is recorded, processed, summarized, and reported within the time periods specified in the SEC's rules and forms, and that such information is accumulated and communicated to State Street's management, including its Chief Executive Officer and Chief Financial Officer, as appropriate, to allow timely decisions regarding required disclosure. For the quarter ended
December 31, 2014
, State Street's management carried out an evaluation, with the participation of the Chief Executive Officer and Chief Financial Officer, of the effectiveness of the design and operation of State Street's disclosure controls and procedures. Based on the evaluation of these disclosure controls and procedures, the Chief Executive Officer and Chief Financial Officer concluded that State Street's disclosure controls and procedures were effective as of
December 31, 2014
.
State Street has also established and maintains internal control over financial reporting as a process designed to provide reasonable assurance regarding the reliability of financial reporting and the preparation of consolidated
195
financial statements for external purposes in conformity with GAAP. In the ordinary course of business, State Street routinely enhances its internal controls and procedures for financial reporting by either upgrading its current systems or implementing new systems. Changes have been made and may be made to State Street's internal controls and procedures for financial reporting as a result of these efforts. During the quarter ended
December 31, 2014
, no change occurred in State Street's internal control over financial reporting that has materially affected, or is reasonably likely to materially affect, State Street's internal control over financial reporting.
INTERNAL CONTROL OVER FINANCIAL REPORTING
Management’s Report on Internal Control Over Financial Reporting
The management of State Street is responsible for the preparation and fair presentation of the financial statements and other financial information contained in this Form 10-K. Management is also responsible for establishing and maintaining adequate internal control over financial reporting. Management has designed business processes and internal controls and has also established and is responsible for maintaining a business culture that fosters financial integrity and accurate reporting. To these ends, management maintains a comprehensive system of internal controls intended to provide reasonable assurances regarding the reliability of financial reporting and the preparation of the consolidated financial statements of State Street in conformity with GAAP. State Street's accounting policies and internal control over financial reporting, established and maintained by management, are under the general oversight of State Street's Board of Directors, including the Board's Examining and Audit Committee.
Management has made a comprehensive review, evaluation and assessment of State Street's internal control over financial reporting as of
December 31, 2014
. The standard measures adopted by management in making its evaluation are the measures in the Internal Control - Integrated Framework issued by the Committee of Sponsoring Organizations of the Treadway Commission (2013 framework) (the “COSO criteria”).
Based on its review and evaluation, management concluded that State Street's internal control over financial reporting was effective as of
December 31, 2014
, and that State Street's internal control over financial reporting as of that date had no material weaknesses.
Ernst & Young LLP, an independent registered public accounting firm, which has audited and reported on the consolidated financial statements contained in this Form 10-K, has issued its written attestation report on its assessment of State Street's internal control over financial reporting, which follows this report.
196
Report of Independent Registered Public Accounting Firm
The Shareholders and Board of Directors of
State Street Corporation
We have audited State Street Corporation’s (the “Corporation”) internal control over financial reporting as of
December 31, 2014
, based on criteria established in Internal Control - Integrated Framework issued by the Committee of Sponsoring Organizations of the Treadway Commission (2013 framework) (the “COSO criteria”). State Street Corporation management is responsible for maintaining effective internal control over financial reporting and for its assessment of the effectiveness of internal control over financial reporting included in the accompanying Management’s Report on Internal Control Over Financial Reporting. Our responsibility is to express an opinion on the Corporation’s internal control over financial reporting based on our audit.
We conducted our audit in accordance with the standards of the Public Company Accounting Oversight Board (United States). Those standards require that we plan and perform the audit to obtain reasonable assurance about whether effective internal control over financial reporting was maintained in all material respects. Our audit included obtaining an understanding of internal control over financial reporting, assessing the risk that a material weakness exists, testing and evaluating the design and operating effectiveness of internal control based on the assessed risk, and performing such other procedures as we considered necessary in the circumstances. We believe that our audit provides a reasonable basis for our opinion.
A company’s internal control over financial reporting is a process designed to provide reasonable assurance regarding the reliability of financial reporting and the preparation of financial statements for external purposes in accordance with generally accepted accounting principles. A company’s internal control over financial reporting includes those policies and procedures that (1) pertain to the maintenance of records that, in reasonable detail, accurately and fairly reflect the transactions and dispositions of the assets of the company; (2) provide reasonable assurance that transactions are recorded as necessary to permit preparation of financial statements in accordance with generally accepted accounting principles and that receipts and expenditures of the company are being made only in accordance with authorizations of management and directors of the company; and (3) provide reasonable assurance regarding prevention or timely detection of unauthorized acquisition, use, or disposition of the company’s assets that could have a material effect on the financial statements.
Because of its inherent limitations, internal control over financial reporting may not prevent or detect misstatements. Also, projections of any evaluation of effectiveness to future periods are subject to the risk that controls may become inadequate because of changes in conditions, or that the degree of compliance with the policies or procedures may deteriorate.
In our opinion, State Street Corporation maintained, in all material respects, effective internal control over financial reporting as of
December 31, 2014
, based on the COSO criteria.
We also have audited, in accordance with the standards of the Public Company Accounting Oversight Board (United States), the consolidated statement of condition of State Street Corporation as of
December 31, 2014
and
2013
, and the related consolidated statements of income, comprehensive income, changes in shareholders’ equity and cash flows for each of the three years in the period ended
December 31, 2014
and our report dated
February 20, 2015
expressed an unqualified opinion thereon.
/s/ Ernst & Young LLP
Boston, Massachusetts
February 20, 2015
197
Not applicable.
|
ITEM 10.
|
DIRECTORS, EXECUTIVE OFFICERS AND CORPORATE GOVERNANCE
|
Information concerning our directors will appear in our Proxy Statement for the 2015 Annual Meeting of Shareholders, to be filed pursuant to Regulation 14A on or before April 30, 2015, referred to as the 2015 Proxy Statement, under the caption “Election of Directors.” Information concerning compliance with Section 16(a) of the Exchange Act will appear in our 2015 Proxy Statement under the caption “Section 16(a) Beneficial Ownership Reporting Compliance.” Information concerning our Code of Ethics for Senior Financial Officers and our Examining and Audit Committee will appear in our 2015 Proxy Statement under the caption “Corporate Governance at State Street.” Such information is incorporated herein by reference.
Information about our executive officers is included under Part I.
|
ITEM 11.
|
EXECUTIVE COMPENSATION
|
Information in response to this item will appear in our 2015 Proxy Statement under the caption
“Executive Compensation.” Such information is incorporated herein by reference.
Information concerning security ownership of certain beneficial owners and management will appear in our 2015 Proxy Statement under the caption “Security Ownership of Certain Beneficial Owners and Management.” Such information is incorporated herein by reference.
RELATED STOCKHOLDER MATTERS
The following table presents the number of outstanding common stock awards, options, warrants and rights granted by State Street to participants in our equity compensation plans, as well as the number of securities available for future issuance under these plans, as of
December 31, 2014
. The table provides this information separately for equity compensation plans that have and have not been approved by shareholders. Shares presented in the table and in the footnotes following the table are stated in thousands of shares.
|
(Shares in thousands)
|
(a)
Number of securities
to be issued
upon exercise of
outstanding
options,
warrants and rights
|
(b)
Weighted-average
exercise price of
outstanding
options,
warrants and rights
(1)
|
(c)
Number of securities
remaining available for
future issuance under
equity compensation
plans (excluding
securities reflected
in column (a))
|
||||||
|
Plan category:
|
|||||||||
|
Equity compensation plans approved by shareholders
|
15,919
|
|
(2)
|
$
|
74.12
|
|
21,309
|
|
|
|
Equity compensation plans not approved by shareholders
|
24
|
|
(3)
|
|
|
—
|
|
||
|
Total
|
15,943
|
|
|
|
21,309
|
|
|||
(1)
Excludes deferred stock awards and performance awards for which there is no exercise price.
(2)
Consists of 12,431 shares subject to deferred stock awards, 60 shares subject to stock options, 1,801 stock appreciation rights, or SARs, and 1,627 shares subject to performance awards (assuming payout at 100% for all awards regarding which performance is uncertain).
(3)
Consists of shares subject to deferred stock awards.
Individual directors who are not our employees have received stock awards and cash retainers, both of which may be deferred. Directors may elect to receive shares of our common stock in place of cash. If payment is in the form of common stock, the number of shares is determined by dividing the approved cash amount by the closing price on the date of the annual shareholders' meeting or date of grant, if different. All deferred shares, whether stock awards or common stock received in place of cash retainers, are increased to reflect dividends paid on the common stock and, for certain directors, may
include share amounts in respect of an accrual under a terminated retirement plan. Directors may elect to defer 50% or 100% of cash or stock awards until a date that they specify, usually after termination of service on the Board. The deferral may also be paid in either a lump sum or in installments over a two- to ten-year period. Stock awards totaling
206,868
shares of common stock were outstanding as of
December 31, 2014
; awards made through June 30, 2003, totaling
23,606
shares outstanding as of
December 31, 2014
, have not been approved by shareholders. There are no other equity
198
compensation plans under which our equity securities are authorized for issuance that have been adopted without shareholder approval. Awards of stock made or retainer shares paid to individual directors after June 30, 2003 have been or will be made under our 1997 or 2006 Equity Incentive Plan, both of which were approved by shareholders.
Information concerning certain relationships and related transactions and director independence will
appear in our 2015 Proxy Statement under the caption “Corporate Governance at State Street.” Such information is incorporated herein by reference.
Information concerning principal accounting fees and services and the Examining and Audit Committee's pre-approval policies and procedures will appear in our 2015 Proxy Statement under the caption “Examining and Audit Committee Matters.” Such information is incorporated herein by reference.
(A)(1) FINANCIAL STATEMENTS
The following consolidated financial statements of State Street are included in Item 8 hereof:
Report of Independent Registered Public Accounting Firm
Consolidated Statement of Income - Years ended
December 31, 2014
,
2013
and
2012
Consolidated Statement of Comprehensive Income - Years ended
December 31, 2014
,
2013
and
2012
Consolidated Statement of Condition - As of
December 31, 2014
and
2013
Consolidated Statement of Changes in Shareholders' Equity - Years ended
December 31, 2014
,
2013
and
2012
Consolidated Statement of Cash Flows - Years ended
December 31, 2014
,
2013
and
2012
Notes to Consolidated Financial Statements
(A)(2) FINANCIAL STATEMENT SCHEDULES
Certain schedules to the consolidated financial statements have been omitted if they were not required by Article 9 of Regulation S-X or if, under the related instructions, they were inapplicable, or the information was contained elsewhere herein.
(A)(3) EXHIBITS
The exhibits listed in the Exhibit Index following the signature page of this Form 10-K are filed herewith or are incorporated herein by reference to other SEC filings.
199
SIGNATURES
Pursuant to the requirement of Section 13 or 15(d) of the Securities Exchange Act of 1934, the registrant has duly caused this report to be signed on its behalf by the undersigned, on
February 20, 2015
, hereunto duly authorized.
|
STATE STREET CORPORATION
|
||
|
By
|
/s/ M
ICHAEL
W. B
ELL
|
|
|
MICHAEL W. BELL,
|
||
|
Executive Vice President and
Chief Financial Officer
|
||
|
By
|
/s/ S
EAN
P. N
EWTH
|
|
|
SEAN P. NEWTH
|
||
|
Senior Vice President, Chief Accounting Officer and Controller
|
||
Pursuant to the requirements of the Securities Exchange Act of 1934, this report has been signed below on
February 20, 2015
by the following persons on behalf of the registrant and in the capacities indicated.
OFFICERS:
|
/s/ J
OSEPH
L. H
OOLEY
|
|
/s/ M
ICHAEL
W. B
ELL
|
|
|
JOSEPH L. HOOLEY,
|
|
MICHAEL W. BELL,
|
|
|
Chairman and Chief Executive Officer; Director
|
|
Executive Vice President and
Chief Financial Officer
|
|
|
|
|
/s/ S
EAN
P. N
EWTH
|
|
|
|
SEAN P. NEWTH
|
||
|
|
Senior Vice President, Chief Accounting Officer and Controller
|
||
DIRECTORS:
|
/s/ J
OSEPH
L. H
OOLEY
|
|
|
|
|
JOSEPH L. HOOLEY
|
|
||
|
/s/ J
OSE
E. A
LMEIDA
|
/s/ L
INDA
A. H
ILL
|
||
|
JOSE E. ALMEIDA
|
LINDA A. HILL
|
||
|
/s/ K
ENNETT
F. B
URNES
|
|
/s/ R
OBERT
S. K
APLAN
|
|
|
KENNETT F. BURNES
|
|
ROBERT S. KAPLAN
|
|
|
/s/ P
ETER
C
OYM
|
|
/s/ R
ICHARD
P. S
ERGEL
|
|
|
PETER COYM
|
|
RICHARD P. SERGEL
|
|
|
/s/ P
ATRICK
de
S
AINT
-A
IGNAN
|
|
/s/ R
ONALD
L. S
KATES
|
|
|
PATRICK de SAINT-AIGNAN
|
|
RONALD L. SKATES
|
|
|
/s/ A
MELIA
C. F
AWCETT
|
|
/s/ G
REGORY
L. S
UMME
|
|
|
AMELIA C. FAWCETT
|
|
GREGORY L. SUMME
|
|
|
/s/ W
ILLIAM
C. F
REDA
|
|
/s/ T
HOMAS
J. W
ILSON
|
|
|
WILLIAM C. FREDA
|
|
THOMAS J. WILSON
|
|
200
EXHIBIT INDEX
|
3.1
|
Restated Articles of Organization, as amended
|
||
|
3.2
|
By-Laws, as amended
|
||
|
4.1
|
The description of State Street’s Common Stock is included in State Street’s Registration Statement on Form 8-A (File No. 001-07511), as filed on January 18, 1995 and March 7, 1995 (filed with the SEC on January 18, 1995 and March 7, 1995 and incorporated herein by reference)
|
||
|
4.2
|
Deposit Agreement, dated August 21, 2012, among State Street Corporation, American Stock Transfer & Trust Company, LLC (as depositary), and the holders from time to time of depositary receipts (filed as Exhibit 4.1 to State Street's Current Report on Form 8-K (File No. 001-07511) filed with the SEC on August 21, 2012 and incorporated herein by reference)
|
||
|
4.3
|
Deposit Agreement, dated March 4, 2014, among State Street Corporation, American Stock Transfer & Trust Company, LLC (as depositary), and the holders from time to time of depositary receipts (filed as Exhibit 4.1 to State Street's Current Report on Form 8-K (File No. 001-07511) dated March 4, 2014 filed with the SEC on March 4, 2014 and incorporated herein by reference)
|
||
|
4.4
|
Deposit Agreement, dated November 25, 2014, among State Street Corporation, American Stock Transfer & Trust Company, LLC (as depositary) and the holders from time to time of depositary receipts (filed as Exhibit 4.1 to State Street's Current Report on Form 8-K (File No. 001-07511) dated November 25, 2014 filed with the SEC on November 25, 2014 and incorporated herein by reference)
|
||
|
(Note: None of the instruments defining the rights of holders of State Street’s outstanding long-term debt are in respect of indebtedness in excess of 10% of the total assets of State Street and its subsidiaries on a consolidated basis. State Street hereby agrees to furnish to the SEC upon request a copy of any other instrument with respect to long-term debt of State Street and its subsidiaries.)
|
|||
|
10.1†
|
State Street's Management Supplemental Retirement Plan Amended and Restated, as amended (filed as Exhibit 10.1 to State Street's Annual Report on Form 10-K (File No. 001-07511) for the year ended December 31, 2012 filed with the SEC on February 22, 2013 and incorporated herein by reference)
|
||
|
10.2†
|
State Street's Executive Supplemental Retirement Plan (formerly “State Street Supplemental Defined Benefit Pension Plan for Executive Officers”) Amended and Restated, as amended
|
||
|
10.3†
|
Supplemental Cash Incentive Plan, as amended, and form of award and agreement thereunder
|
||
|
10.4†
|
Form of Amended and Restated Employment Agreement entered into with each of Joseph L. Hooley, Joseph C. Antonellis, James S. Phalen and Michael Rogers (filed as Exhibit 10.3 to State Street's Annual Report on Form 10-K (File No. 001-07511) for the year ended December 31, 2009 filed with the SEC on February 22, 2010 and incorporated herein by reference) and Form of Amendment dated March 26, 2014 to Employment Agreement (filed as Exhibit 99.1 to State Street's Current Report on Form 8-K (File No. 001-07511) dated March 26, 2014 filed with the SEC on March 31, 2014 and incorporated herein by reference)
|
||
|
10.5†
|
Employment Agreement entered into with Michael W. Bell dated June 17, 2013 (filed as Exhibit 10.5 to State Street's Annual Report on Form 10-K (File No. 001-07511) for the year ended December 31, 2013 filed with the SEC on February 21, 2014 and incorporated herein by reference) and Form of Amendment dated March 26, 2014 to Employment Agreement (filed as Exhibit 99.1 to State Street's Current Report on Form 8-K (File No. 001-07511) dated March 26, 2014 filed with the SEC on March 31, 2014 and incorporated herein by reference)
|
||
|
10.6†
|
State Street’s Executive Compensation Trust Agreement dated December 6, 1996 (Rabbi Trust) (filed as Exhibit 10.5 to State Street's Annual Report on Form 10-K (File No. 001-07511) for the year ended December 31, 2008 filed with the SEC on February 27, 2009 and incorporated herein by reference)
|
||
|
10.7†
|
State Street’s 1997 Equity Incentive Plan, as amended, and forms of award agreements thereunder (filed as Exhibit 10.6 to State Street's Annual Report on Form 10-K (File No. 001-07511) for the year ended December 31, 2008 filed with the SEC on February 27, 2009 and incorporated herein by reference)
|
||
|
10.8†
|
State Street’s 2006 Equity Incentive Plan, as amended, and forms of award agreements thereunder
|
||
201
|
10.9
|
[Reserved]
|
||
|
10.10†
|
State Street’s Management Supplemental Savings Plan, Amended and Restated, as amended(filed as Exhibit 10.1 to State Street's Quarterly Report on Form 10-Q (File No. 001-07511) for the quarter ended September 30, 2014 filed with the SEC on November 10, 2014 and incorporated herein by reference)
|
||
|
10.11†
|
Deferred Compensation Plan for Directors of State Street Corporation, Restated January 1, 2008, as amended (filed as Exhibit 10.11 to State Street's Annual Report on Form 10-K (File No. 001-07511) for the year ended December 31, 2012 filed with the SEC on February 22, 2013 and incorporated herein by reference)
|
||
|
10.12†
|
Deferred Compensation Plan for Directors of State Street Corporation, Restated January 1, 2007, as amended (filed as Exhibit 10.12 to State Street's Annual Report on Form 10-K (File No. 001-07511) for the year ended December 31, 2011 filed with the SEC on February 27, 2012 and incorporated herein by reference)
|
||
|
10.13†
|
Description of compensation arrangements for non-employee directors
|
||
|
10.14
|
[Reserved]
|
||
|
10.15†
|
Letter Agreement with Joseph C. Antonellis dated April 26, 2010 (filed as Exhibit 10.16 to State Street's Annual Report on Form 10-K (File No. 001-07511) for the year ended December 31, 2010 filed with the SEC on February 28, 2011 and incorporated herein by reference)
|
||
|
10.16†
|
Letter Agreement with Michael W. Bell dated May 23, 2013 (filed as Exhibit 10.1 to State Street's Quarterly Report on Form 10-Q (File No. 001-07511) for the quarter ended June 30, 2013 filed with the SEC on August 6, 2013 and incorporated herein by reference)
|
||
|
10.17A†
|
Form of Indemnification Agreement between State Street Corporation and each of its directors (filed as Exhibit 10.18A to State Street's Annual Report on Form 10-K (File No. 001-07511) for the year ended December 31, 2013 filed with the SEC on February 21, 2014 and incorporated herein by reference)
|
||
|
10.17B†
|
Form of Indemnification Agreement between State Street Corporation and each of its executive officers (filed as Exhibit 10.18B to State Street's Annual Report on Form 10-K (File No. 001-07511) for the year ended December 31, 2013 filed with the SEC on February 21, 2014 and incorporated herein by reference)
|
||
|
10.17C†
|
Form of Indemnification Agreement between State Street Bank and Trust Company and each of its directors (filed as Exhibit 10.18C to State Street's Annual Report on Form 10-K (File No. 001-07511) for the year ended December 31, 2013 filed with the SEC on February 21, 2014 and incorporated herein by reference)
|
||
|
10.17D†
|
Form of Indemnification Agreement between State Street Bank and Trust Company and each of its executive officers (filed as Exhibit 10.18D to State Street's Annual Report on Form 10-K (File No. 001-07511) for the year ended December 31, 2013 filed with the SEC on February 21, 2014 and incorporated herein by reference)
|
||
|
10.18†
|
2011 Senior Executive Annual Incentive Plan (filed as Exhibit 99.2 to State Street's Current Report on Form 8-K (File No. 001-07511) filed with the SEC on May 24, 2011 and incorporated herein by reference)
|
||
|
12
|
Statement of Ratios of Earnings to Fixed Charges
|
||
|
21
|
Subsidiaries of State Street Corporation
|
||
|
23
|
Consent of Independent Registered Public Accounting Firm
|
||
|
31.1
|
Rule 13a-14(a)/15d-14(a) Certification of Chairman, President and Chief Executive Officer
|
||
|
31.2
|
Rule 13a-14(a)/15d-14(a) Certification of Chief Financial Officer
|
||
|
32
|
Section 1350 Certifications
|
||
|
*
|
101.INS
|
XBRL Instance Document
|
|
|
*
|
101.SCH
|
XBRL Taxonomy Extension Schema Document
|
|
202
|
*
|
101.CAL
|
XBRL Taxonomy Calculation Linkbase Document
|
|
|
*
|
101.DEF
|
XBRL Taxonomy Extension Definition Linkbase Document
|
|
|
*
|
101.LAB
|
XBRL Taxonomy Label Linkbase Document
|
|
|
*
|
101.PRE
|
XBRL Taxonomy Presentation Linkbase Document
|
|
|
†
|
Denotes management contract or compensatory plan or arrangement
|
|
|
*
|
Submitted electronically herewith
|
|
Attached as Exhibit 101 to this report are the following formatted in XBRL (Extensible Business Reporting Language): (i) consolidated statement of income for the
years ended
December 31, 2014
,
2013
and 2012, (ii) consolidated statement of comprehensive income for the
years ended
December 31, 2014
,
2013
and 2012, (iii) consolidated statement of condition as of
December 31, 2014
and
December 31, 2013
, (iv) consolidated statement of changes in shareholders' equity for the
years ended
December 31, 2014
,
2013
and 2012, (v) consolidated statement of cash flows for the
years ended
December 31, 2014
,
2013
and 2012, and (vi) notes to consolidated financial statements.
203
TABLE OF CONTENTS
Part IItem 1. BusinessItem 1A. Risk FactorsItem 1B. Unresolved Staff CommentsItem 2. PropertiesItem 3. Legal ProceedingsItem 4. Mine Safety DisclosuresPart IIItem 5. Market For Registrant S Common Equity, Related Stockholder Matters and Issuer Purchases Of Equity SecuritiesItem 6. Selected Financial DataItem 7. Management S Discussion and Analysis Of Financial Condition and Results Of OperationsItem 7A. Quantitative and Qualitative Disclosures About Market RiskItem 8. Financial Statements and Supplementary DataNote 1 . Summary Of Significant Accounting PoliciesNote 2 . Fair ValueNote 3 . Investment SecuritiesNote 4 . Loans and LeasesNote 5 . Goodwill and Other Intangible AssetsNote 6 . Other AssetsNote 7. DepositsNote 8 . Short-term BorrowingsNote 9 . Long-term DebtNote 10 . Commitments and GuaranteesNote 11 . ContingenciesNote 12 . Variable Interest EntitiesNote 13 . Shareholders EquityNote 14 . Equity-based CompensationNote 15 . Regulatory CapitalNote 16 . Derivative Financial InstrumentsNote 12 ). We Record Derivatives in Our Consolidated Statement Of Condition At Their Fair Value on A Recurring BasisItem Recognized inNote 17 . Offsetting ArrangementsNote 18 . Net Interest RevenueNote 19 . Employee BenefitsNote 20 . Occupancy Expense and Information Systems and Communications ExpenseNote 21 . ExpensesNote 22 . Income TaxesNote 23 . Earnings Per Common ShareNote 24 . Line Of Business InformationNote 25 . Non-u.s. ActivitiesNote 26. Subsequent EventNote 27. Parent Company Financial StatementsItem 9. Changes in and Disagreements with Accountants on Accounting and Financial DisclosureItem 9A. Controls and ProceduresItem 9B. Other InformationPart IIIItem 10. Directors, Executive Officers and Corporate GovernanceItem 11. Executive CompensationItem 12. Security Ownership Of Certain Beneficial Owners and Management and Related Stockholder MattersItem 13. Certain Relationships and Related Transactions, and Director IndependenceItem 14. Principal Accounting Fees and ServicesPart IVItem 15. Exhibits, Financial Statement Schedules