SUN COMMUNITIES INC
10-Ks and 10-Qs
|
|
|
|
|
|
|
|
|
|
|
|
|
|
|
|
|
|
|
|
|
|
|
|
|
|
|
|
|
|
|
|
|
|
|
|
|
|
|
|
|
|
|
|
|
|
|
|
|
|
|
|
|
|
|
|
|
|
|
|
|
|
UNITED STATES
SECURITIES AND EXCHANGE COMMISSION
Washington, D.C. 20549
FORM
10-K
ANNUAL REPORT PURSUANT TO SECTION 13 OR 15(D) OF THE SECURITIES EXCHANGE ACT OF 1934
For the fiscal year ended
December 31, 2020
Commission file number
1-12616
(Exact Name of Registrant as Specified in its Charter)
|
|
|
|
||||||
| (State of Incorporation) | Commission file number | (I.R.S. Employer Identification No.) | ||||||
|
|
|
|
|
|
|||||||||||||
| (Address of Principal Executive Offices) | (Zip Code) | ||||||||||||||||
(
248
)
208-2500
(Registrant’s telephone number, including area code)
Securities registered pursuant to Section 12(b) of the Act:
| Title of each class | Trading Symbol(s) | Name of each exchange on which registered | ||||||||||||
|
|
|
|
||||||||||||
Indicate by check mark if the registrant is a well-known seasoned issuer, as defined in Rule 405 of the Securities Act.
Yes
☒
No
☐
Indicate by check mark if the registrant is not required to file reports pursuant to Section 13 or 15(d) of the Exchange Act. Yes
☐
No
☒
Indicate by check mark whether the Registrant (1) has filed all reports required to be filed by Section 13 or 15(d) of the Securities Exchange Act of 1934 during the preceding 12 months (or for such shorter period that the Registrant was required to file such reports), and (2) has been subject to such filing requirements for the past 90 days.
Yes
☒
No
☐
Indicate by check mark whether the registrant has submitted electronically, if any, every Interactive Data File required to be submitted pursuant to Rule 405 of Regulation S-T (§232.405 of this chapter) during the preceding 12 months (or for such shorter period that the registrant was required to submit and post such files).
Yes
☒
No
☐
Indicate by check mark whether the Registrant is a large accelerated filer, an accelerated filer, a non-accelerated filer, a smaller reporting company or an emerging growth company. (Check one):
|
|
Accelerated filer | Non-accelerated filer | Smaller reporting company | Emerging growth company | ||||||||||
| ☒ | ☐ | ☐ |
|
|
||||||||||
If an emerging growth company, indicate by check mark if the registrant has elected not to use the extended transition period for complying with any new or revised financial accounting standards provided pursuant to Section 13(a) of the Exchange Act.
☐
Indicate by check mark whether the registrant has filed a report on and attestation to its management’s assessment of the effectiveness of its internal control over financial reporting under Section 404(b) of the Sarbanes-Oxley Act (15 U.S.C. 7262(b)) by the registered public accounting firm that prepared or issued its audit report.
☒
Indicate by check mark whether the Registrant is a shell company (as defined in Rule 12b-2 of the Exchange Act). Yes
☐
No
☒
As of June 30, 2020, the aggregate market value of the Registrant’s stock held by non-affiliates was $
13,075,882,670
(computed by reference to the closing sales price of the Registrant’s common stock as of June 30, 2020). For this computation, the Registrant has excluded the market value of all shares of common stock reported as beneficially owned by executive officers and directors of the Registrant; such exclusion shall not be deemed to constitute an admission that any such person is an affiliate of the Registrant.
Number of shares of common stock, $0.01 par value per share, outstanding as of February 11, 2021:
107,616,246
Documents Incorporated By Reference
SUN COMMUNITIES, INC.
Table of Contents
| Item | Description | Page | ||||||
| Part I. | ||||||||
| Item 1. | Business | |||||||
| Item 1A. | Risk Factors | |||||||
| Item 1B. | Unresolved Staff Comments | |||||||
| Item 2. | Properties | |||||||
| Item 3. | Legal Proceedings | |||||||
| Item 4. | Mine Safety Disclosures | |||||||
| Part II. | ||||||||
| Item 5. | Market for the Registrant’s Common Equity, Related Stockholder Matters and Issuer Purchases of Equity Securities | |||||||
| Item 6. | Selected Financial Data | |||||||
| Item 7. | Management’s Discussion and Analysis of Financial Condition and Results of Operations | |||||||
| Item 7A. | Quantitative and Qualitative Disclosures about Market Risk | |||||||
| Item 8. | Financial Statements and Supplementary Data | |||||||
| Item 9. | Changes in and Disagreements with Accountants on Accounting and Financial Disclosure | |||||||
| Item 9A. | Controls and Procedures | |||||||
| Item 9B. | Other Information | |||||||
| Part III. | ||||||||
| Item 10. | Directors, Executive Officers and Corporate Governance | |||||||
| Item 11. | Executive Compensation | |||||||
| Item 12. | Security Ownership of Certain Beneficial Owners and Management and Related Stockholder Matters | |||||||
| Item 13. | Certain Relationships and Related Transactions, and Director Independence | |||||||
| Item 14. | Principal Accountant Fees and Services | |||||||
| Part IV. | ||||||||
| Item 15. | Exhibits and Financial Statement Schedules | |||||||
| Item 16. | Form 10-K Summary | |||||||
| Exhibits | ||||||||
| Signatures | ||||||||
| Index to the Consolidated Financial Statements and Financial Statement Schedule |
F-
1
|
|||||||
SUN COMMUNITIES, INC.
PART I
ITEM 1. BUSINESS
GENERAL OVERVIEW
Sun Communities, Inc., a Maryland corporation, and all wholly-owned or majority-owned and controlled subsidiaries, including Sun Communities Operating Limited Partnership, a Michigan limited partnership (the “Operating Partnership”), Sun Home Services, Inc., a Michigan corporation (“SHS”) and Safe Harbor Marinas, LLC (“Safe Harbor”) are referred to herein as the “Company,” “us,” “we,” and “our.”
We are a fully integrated, self-administered and self-managed real estate investment trust (“REIT”). We own, operate and develop manufactured housing (“MH”) communities and recreational vehicle (“RV”) resorts throughout the United States and Ontario, Canada. We acquired Safe Harbor and its portfolio of marinas in October 2020. Through Safe Harbor, we own, operate, develop and manage marinas throughout the United States, with the majority of such marinas concentrated in coastal regions and others located in various inland regions. We are a fully-integrated real estate company which, together with our affiliates and predecessors, has been in the business of acquiring, operating, developing and expanding MH communities and RV resorts since 1975 and marinas since 2020. We lease individual parcels of land, or sites, with utility access for placement of manufactured homes and RVs to our MH and RV customers. The MH communities are designed to offer affordable housing to individuals and families, while also providing certain amenities. The RV resorts are designed to offer affordable vacation opportunities to individuals and families complemented by a diverse selection of amenities. The marina offerings to its members include wet slip rentals, dry storage space leases, end-to-end service (such as routine maintenance, repair and winterization), fuel sales and other high-end amenities. These services and amenities offer convenience and resort-quality experiences to our members.
As of December 31, 2020, we owned and operated or had an interest in a portfolio of 552 MH communities, RV resorts, and marinas (collectively, the “properties”) located in 39 states throughout the United States and Ontario, Canada, including 276 MH communities, 136 RV resorts, 34 properties containing both MH and RV sites, and 106 marinas. As of December 31, 2020, the properties contained an aggregate of 188,176 developed sites comprised of 96,688 developed MH sites, 27,564 annual RV sites (inclusive of both annual and seasonal usage rights), 25,043 transient RV sites, and 38,881 wet slips and dry storage spaces. Additionally, there are 10,025 additional MH and RV sites suitable for development.
We are engaged through SHS, a taxable REIT subsidiary, in the marketing, selling, and leasing of new and pre-owned homes to current and future residents in our communities. The operations of SHS support and enhance our occupancy levels, property performance and cash flows.
Our executive and principal property management office is located at 27777 Franklin Road, Suite 200, Southfield, Michigan 48034 and our telephone number is (248) 208-2500. We have regional property management offices located in Austin and Dallas, Texas, Newport, Rhode Island; Grand Rapids, Michigan; Denver, Colorado; Ft. Myers, Florida; and Orlando, Florida. Safe Harbor’s primary office is located in Dallas, Texas. We employed an aggregate of 4,872 full and part time employees as of December 31, 2020.
Our website address is www.suncommunities.com and we make available, free of charge, on or through our website all of our periodic reports, including our Annual Reports on Form 10-K, Quarterly Reports on Form 10-Q, and current reports on Form 8-K, as soon as reasonably practicable after we file such reports with the Securities and Exchange Commission (the “SEC”). Additionally, the SEC maintains a website at https://www.sec.gov, that contains reports, proxy information statements and other information about Sun.
1
SUN COMMUNITIES, INC.
STRUCTURE OF THE COMPANY
The Operating Partnership is structured as an umbrella partnership REIT, or UPREIT. We conduct substantially all of our operations through the Operating Partnership. The Operating Partnership owns, either directly or indirectly through other subsidiaries, all of our assets. This UPREIT structure enables us to comply with certain complex requirements under the federal tax rules and regulations applicable to REITs, and to acquire MH communities, RV resorts and marinas in transactions that defer some or all of the sellers’ tax consequences. The financial results of the Operating Partnership and our other subsidiaries are consolidated in our Consolidated Financial Statements. The financial results include certain activities that do not necessarily qualify as REIT activities under the Internal Revenue Code of 1986, as amended (the “Code”). We have formed taxable REIT subsidiaries, as defined in the Code, to engage in such activities. We use taxable REIT subsidiaries to offer certain services to our residents and engage in activities that would not otherwise be permitted under the REIT rules if provided directly by us or by the Operating Partnership. The taxable REIT subsidiaries include our home sales business, SHS, which provides manufactured home sales, leasing, and other services to current and prospective tenants of the properties.
Under the partnership agreement, the Operating Partnership is structured to make distributions with respect to certain of the Operating Partnership units (“OP units”) at the same time that distributions are made to our common stockholders. The Operating Partnership is structured to permit limited partners holding certain classes or series of OP units to exchange those OP units for shares of our common stock (in a taxable transaction) and achieve liquidity for their investment.
As the sole general partner of the Operating Partnership, we generally have the power to manage and have complete control over the conduct of the Operating Partnership’s affairs and all decisions or actions made or taken by us as the general partner pursuant to the partnership agreement are generally binding upon all of the partners and the Operating Partnership.
2
SUN COMMUNITIES, INC.
We do not own all of the OP units.
The following table sets forth:
•
the various series of OP units and the number of units of each series outstanding as of December 31, 2020;
•
the relative ranking of the various series of OP units with respect to rights to the payment of distributions and the distribution of assets in the event of any voluntary or involuntary liquidation, dissolution or winding up of the Operating Partnership;
•
the number of shares of our common stock issuable upon the exchange of each OP unit of the applicable series;
•
the annual distribution rate on each series of OP Units; and
•
information regarding the terms of redemption rights for each series of OP units, as applicable.
| Ranking | Description |
OP Units Outstanding at December 31, 2020
|
Exchange Rate
(1)
|
Annual Distribution Rate
(2)
|
Cash Redemption
(3)
|
Redemption Period | ||||||||||||||||||||||||||||||||
| 1 | Preferred OP units (or “Aspen preferred OP units”) |
1,283,819
(4)
|
Variable
(5)
|
Variable
(6)
|
Mandatory |
Variable
(7)
|
||||||||||||||||||||||||||||||||
| 1 | Series A-1 preferred OP units | 294,734 | 2.4390 | 6.00 | % | N/A | N/A | |||||||||||||||||||||||||||||||
| 2 | Series C preferred OP units | 306,303 | 1.1100 |
Variable
(8)
|
N/A | N/A | ||||||||||||||||||||||||||||||||
| 3 | Series D preferred OP units | 488,958 | 0.8000 |
Variable
(9)
|
Holder’s Option | Any time after earlier of January 31, 2024 or death of holder | ||||||||||||||||||||||||||||||||
| 4 | Series E preferred OP units | 90,000 | 0.6897 |
Variable
(10)
|
N/A | N/A | ||||||||||||||||||||||||||||||||
| 5 | Series F preferred OP units | 90,000 | 0.6250 | 3.00 | % | Holder’s Option | Any time after earlier of May 14, 2025 or death of holder | |||||||||||||||||||||||||||||||
| 6 | Series G preferred OP units | 240,710 | 0.6452 | 3.20 | % | Holder’s Option | Any time after earlier of September 30, 2025 or death of holder | |||||||||||||||||||||||||||||||
| 7 | Series H preferred OP units | 581,407 | 0.6098 | 3.00 | % | Holder’s Option | Any time after earlier of October 30, 2025 or death of holder | |||||||||||||||||||||||||||||||
| 8 | Series I preferred OP units | 922,000 | 0.6098 | 3.00 | % | Holder’s Option | Any time after earlier of December 31, 2025 or death of holder | |||||||||||||||||||||||||||||||
| 9 | Series A-3 preferred OP units | 40,268 | 1.8605 | 4.50 | % | N/A | N/A | |||||||||||||||||||||||||||||||
| 10 | Common OP units |
110,232,973
(11)
|
1.0000 | Same distribution rate for common stock and common OP units | N/A | N/A | ||||||||||||||||||||||||||||||||
(1)
Exchange rates are subject to adjustment upon stock splits, recapitalizations and similar events. The exchange rates of certain series of OP units are approximated to four decimal places.
(2)
Except for common OP units, distributions are payable on the issue price of each OP unit, which is $27.00 per unit for all Aspen preferred OP units and $100.00 per unit for all other preferred OP units.
(3)
The redemption price for each OP unit redeemed will be equal to its issue price plus all accrued but unpaid distributions.
(4)
Of the outstanding Aspen preferred OP units, 270,000 are designated as “Aspen 2034 Units.”
(5)
At any time prior to January 1, 2024 (or prior to January 1, 2034 with respect to the Aspen 2034 Units), at the holder’s option, each Aspen preferred OP unit may be exchanged into: (a) if the average closing price of our common stock for the preceding ten trading days is $68.00 per share or less, 0.397 common OP units, or (b) if the average closing price of our common stock for the preceding ten trading days is greater than $68.00 per share, the number of common OP units determined by dividing (i) the sum of (A) $27.00 plus (B) 25 percent of the amount by which the average closing price of our common stock for the preceding ten trading days exceeds $68.00 per share, by (ii) the average closing price of our common stock for the preceding ten trading days.
(6)
The annual distribution rate for Aspen 2034 Units is 3.80%. The annual distribution rate on all other Aspen preferred OP units is equal to the 10-year U.S. Treasury bond yield plus 239 basis points; provided, however, that such aggregate distribution rate shall not be less than 6.5 % nor more than 9.0 %.
(7)
We are required to redeem all outstanding Aspen preferred OP units other than the Aspen 2034 Units on January 2, 2024. We are required to redeem all outstanding Aspen 2034 Units on January 2, 2034. In addition, we are required to redeem the Aspen preferred OP units (including Aspen 2034 Units) of any holder thereof within five days after receipt of a written demand during the existence of certain uncured Aspen preferred OP unit defaults, including our failure to pay distributions on the Aspen preferred OP units when due and our failure to provide certain security for the payment of distributions on the Aspen preferred OP units.
(8)
4.50% until April 1, 2020 and 5.00% thereafter.
(9)
3.75% until January 31, 2021 and 4.00% thereafter.
(10)
5.25% until January 9, 2022 and 5.50% thereafter.
(11)
Of the 110,232,973 common OP units, 107,626,361, or 97.6 percent were held by us, and 2,606,612, or 2.4 percent were owned by the limited partners.
3
SUN COMMUNITIES, INC.
REAL PROPERTY OPERATIONS
The majority of our MH and RV properties are designed and improved for several home and RV options of various sizes and designs. The m
arinas are designed and improved to provide storage solutions for the boating community in the water and on land.
An MH community is a residential subdivision designed and improved with sites for the placement of manufactured homes, related improvements, and amenities. Manufactured homes are detached, single‑family homes which are produced off‑site by manufacturers and installed on site within the community. Manufactured homes are available in a wide array of designs, providing owners with a level of customization generally unavailable in multi-family housing developments. Modern MH communities contain improvements similar to other garden‑style residential developments, including centralized entrances, paved streets, curbs, gutters, and parkways. In addition, these communities also often provide a number of amenities, such as a clubhouse, a swimming pool, basketball courts, shuffleboard courts, tennis courts, and laundry facilities.
An RV resort is a resort or park designed and improved with sites for the placement of RVs for varied lengths of time. Properties may also provide vacation rental homes. RV resorts may include a number of amenities such as restaurants, golf courses, swimming pools, water parks, tennis courts, fitness centers, planned activities, and spacious social facilities.
Renters at our MH and RV properties lease the site on which a manufactured home, vacation rental home, or RV is located. We typically own the underlying land, utility connections, streets, lighting, driveways, common area amenities, and other capital improvements and are responsible for enforcement of community guidelines and maintenance. In eight of our 446 MH and RV properties, we do not own all of the underlying land and operate the communities pursuant to ground leases. Certain of the properties provide water and sewer service through public or private utilities, while others provide these services to residents from on-site facilities. Each owner of a home within our properties is responsible for the maintenance of the home and leased site. As a result, our capital expenditure needs tend to be less significant relative to multi-family rental apartment complexes.
A marina is designed and improved with wet slips on rivers, lakes, bays and oceans and dry storage systems that provide storage solutions for the placement of vessels ranging in size from small boats to super yachts for varied lengths of time. Dry storage systems also allow for the required maintenance to the vessels that we store. Marinas may also provide ancillary businesses, such as fuel stations, ship stores, restaurants, swimming pools, cabin and lodging rentals, boat rentals, tennis courts, fitness centers, shower and laundry facilities, planned activities and other services to create a robust member experience.
Renters at our marinas lease the wet slip or dry storage space on which the vessel is stored. We typically own the underlying land, building improvements, dock improvements, site improvements and other on-site amenity structures. Because we own the facilities and improvements on the land or submerged land at those marinas, we are responsible for the capital improvements and maintenance. In 25 of our 106 marinas, we do not own all of the underlying land and operate the marinas pursuant to ground leases.
We compete with other available MH communities and RV resorts, and alternative forms of housing (such as on-site constructed homes, apartments, condominiums and townhouses) as they provide housing alternatives to potential tenants of MH communities and RV resorts. In the marina business, we compete with other available marinas in the U.S.
PROPERTY MANAGEMENT
Our property management strategy emphasizes intensive, detail-oriented, hands-on management by dedicated, on-site community, resort, and marina general managers. We believe our focus on creating an exceptional resident and guest experience creates a competitive advantage. It enables us to continually monitor and address concerns, the performance of competitive properties, and local market conditions.
Our MH and RV property managers are overseen by John B. McLaren, our President and Chief Operating Officer, who has been in the MH industry since 1995, Bruce Thelen, our Executive Vice President of Operations and Sales, who has led our manufactured home sales and leasing subsidiary, Sun Home Services, Inc., since January 2018, three Senior Vice Presidents of Operations and Sales, 11 Divisional Vice Presidents and 39 Regional Vice Presidents. Each Regional Vice President is responsible for regular property inspections, oversight of property operations and sales functions, semi-annual market surveys of competitive communities, and interaction with local manufactured home dealers for eight to 15 properties.
4
SUN COMMUNITIES, INC.
Each property manager performs regular inspections in order to regularly monitor the physical condition of properties and to effectively address tenant concerns. In addition to a district or community manager, each district or property has on-site maintenance personnel and management support staff. We hold mandatory training sessions for all new property management personnel to ensure that policies and procedures are executed effectively and professionally. All of our property management personnel participate in on-going training to ensure that changes to policies and procedures are implemented consistently. Our internal training program has led to increased knowledge and accountability for daily operations and policies and procedures.
Our marina business is overseen by Baxter Underwood, the Chief Executive Officer of Safe Harbor, who has been in the marina business since 2006, two Chief Operating Officers and 14 Regional Vice Presidents that are responsible for regular marina inspections and oversight of operations.
HUMAN CAPITAL
Together as one team, we embrace the following core success attributes that make Sun Communities a great place to work.
•
Commitment: At Sun Communities, we are committed to be the best in the industry. We work hard to keep team members motivated and rewarded. Committed team members are the key to success.
•
Intensity: The work environment at Sun Communities is intense and full of positive energy. We work hard to increase confidence and determination of our team members to prepare them to meet the day-to-day challenges of the job.
•
Empowerment: We provide team members with the skills, resources, opportunities and motivation to succeed in their career.
•
Accountability: Every team member, no matter what role they hold, is equally responsible for contributing to the success of our company.
•
Service: We have built our culture around a simple customer service philosophy: The Golden Rule. We treat others the way we want to be treated.
DIVERSITY
We make it a priority to recognize and appreciate the variety of characteristics that make individuals unique in an atmosphere that promotes and celebrates individual and collective achievement. We embrace diversity and create a culture surrounded by empowerment used to foster new ideas and economic growth. We believe it’s not just about gender or race, but being diverse in thoughts, life, and work experiences. We take pride in being different; it’s what sets us apart. We look to create an inclusive environment that challenges, inspires, rewards, and transforms our team to be the best of the best. We do not tolerate harassing, discriminatory, or retaliatory conduct that interferes unreasonably with an individual's work performance or that creates an intimidating, hostile, or offensive work environment because of any protected trait. Such discrimination or harassment is prohibited and is inconsistent with our policies, practices, and philosophy. Protected traits include race, color, religion, gender, sexual orientation, gender identity or expression, national origin, age, genetic information, disability, veteran status or any other trait protected under state or federal laws.
As of December 31, 2020, we employed 4,872 full and part time employees, of which 4,320 were located on-site as property managers, support staff, or maintenance personnel. Of those, approximately 83 percent were full-time, and 17 percent were part-time. Forty-three percent of our team members were female, and 57 percent were male. Fifty-one percent of our workers are age 50 and older, with approximately 20 percent being age 60 and older.
ENVIRONMENTAL, SOCIAL AND GOVERNANCE (ESG)
We uphold a company-wide commitment to ESG goals through various programs and everyday business practices. We are fully committed to reducing our environmental impact across the scope of our operations and through the services we deliver to our residents and guests. We continue to identify opportunities to invest in energy-efficient technology, water efficiency, and waste reduction strategies throughout our communities, resorts, and corporate headquarters. By conserving natural resources, reducing our carbon footprint, and participating in efforts to protect the environment through our Sun Unity program, we are striving to achieve our environmental sustainability goals.
We recognize the important opportunity of providing access to affordable and sustainable housing. Our business contributes to a vitally important function in our economy by providing high-quality, yet affordable, housing for both all-age and age-restricted needs.
5
SUN COMMUNITIES, INC.
Manufactured homes cost up to 50 percent less per square foot than conventional site-built homes, expanding the opportunity for residents to own their home, despite an ever-increasing housing affordability gap. Our homes provide more space at less cost per square foot compared to other options.
As a nationwide provider of affordable housing, we believe we have a responsibility not only to our employees and residents, but also to the communities in which we live and work. These social responsibility efforts are initiated through our Sun Unity program, so we can join together as a team and give back to these communities to achieve goals like promotion, education and waste reduction.
TRAINING AND DEVELOPMENT
Our internal training program, Sun University, offers over 200 courses (including books, online courses, webinars, and live sessions) to our MH and RV team members on a range of topics, including leadership, communications, software, and operations. All new hires are required to complete information security training, and safety and compliance-related training, with routine refresher training annually on critical topics. In 2020, 100 percent of our team members received safety training.
Our human resources team, learning and development group and team relations specialists are aligned to support the attraction, development, and retention of our talent. Given the peak hiring demands during the summer at many of our RV and marina resorts, we focus operations efforts on ensuring the returning team member pipeline each year is robust. For salaried positions, our annual talent management processes focus on professional development in both soft-skill development and training. Our compensation philosophy is designed to attract and retain top talent. For eligible team members, we offer competitive salary, health, welfare, retirement and pet insurance benefits, in addition to tuition reimbursement and rent/vacation discounts at our properties.
COVID-19 RELIEF AND SUPPORT
The health and safety of our residents, guests and team members is our top priority. As we navigated the COVID-19 pandemic during 2020, we instituted our COVID-19 Response and Action Plan which established guidelines for safe operations of our communities, resorts, and the Main Office. Content contained within this plan include:
•
Methods for preventing and reducing exposure and transmission of COVID-19 among individuals;
•
Methods for identification and isolation of sick persons;
•
Operational protocols for social distancing, including reduced occupancy requirements;
•
Sanitation policies and procedures, including cleaning, disinfecting, and decontamination;
•
Communications and training for team members and leaders that are necessary to implement the plan; and
•
Procedures to ensure effective ongoing implementation of the plan.
Several temporary relief measures were extended to residents and guests including:
•
Temporary suspensions of month-to-month fees, late fees, and rent increases.
•
Temporary elimination of cancellation fees related to COVID-19, and extending this for future bookings in 2020.
•
Enhanced cleaning procedures were put in place, as well as additional signage, and changes to policies and procedures further promoting social distancing.
•
Amenity kits are being provided to guests upon check-in which include hand sanitizer, face masks and sanitation wipes.
•
Contactless processes were put in place for rent collection, lease renewals, reservations and guest check-ins.
•
Free housing was offered to frontline health care workers at various locations.
•
Large quantities of personal protection equipment (PPE) and cleaning products were centrally procured and distributed to all of Sun’s locations.
6
SUN COMMUNITIES, INC.
To support the health and well-being of our team members and their families, we provide a variety of resources to assist in navigating the challenges of the COVID-19 pandemic. The resources touch on many of our well-being pillars including Social, Emotional, Community, and Financial. Examples include:
•
Individuals who enter our facilities are required to complete a self health questionnaire no sooner than two hours prior to the start of each shift and are required to use no-contact infrared thermometers for temperature checks.
•
We closed our offices for non-essential functions and added remote work flexibility.
•
We have frequent communication regarding impacts of COVID-19 on our properties and our residents, guests and team members.
•
Free COVID-19 testing.
•
No copays on telemedicine consultations, including behavioral health services.
•
Free virtual fitness classes, and access to a library of online resources for of yoga, meditation, and stress management.
•
Free care packages for those diagnosed with COVID-19 that include personal care items and household supplies.
•
Free educational assistance and tutoring programs through our “Back to School with Sun” initiative.
HOME SALES AND RENTALS
SHS is engaged in the marketing, selling and leasing of new and pre-owned homes to residents in our communities. Because tenants often purchase a home already on-site within a community, such services enhance occupancy and property performance. Additionally, because many of the homes on the properties are sold through SHS, better control of home quality in our communities can be maintained than if sales services were conducted solely through third-party brokers.
SHS also leases homes to prospective tenants. At December 31, 2020, SHS had 11,752 occupied leased homes in its portfolio. New and pre-owned homes are purchased for the Rental Program. Leases associated with the Rental Program generally have a term of one year. The Rental Program requires intensive management of costs associated with repair and refurbishment of these homes as the tenants vacate and the homes are re-leased, similar to apartment rentals. We received approximately 49,200 applications during 2020 to live in our MH and RV properties, providing a significant “resident boarding” system that allows us to market the purchase of a home to the qualified applicants. Through the Rental Program we demonstrate our product and lifestyle to the renters, while monitoring their payment history and converting qualified renters to owners.
Our home sales and leasing operations compete with other local and national MH dealers and MH community owners.
MARINA MEMBER BASE
We are engaged in the marketing and leasing of wet slips and dry storage spaces and have approximately 40,000 members throughout our marina network.
REGULATIONS AND INSURANCE
General
MH, RV and marina properties are subject to various laws, ordinances and regulations, including regulations relating to recreational facilities such as swimming pools, clubhouses, and other common areas. Each property has the necessary operating permits and approvals.
Insurance
Our management believes that the properties are covered by adequate fire, property, business interruption, general liability, and (where appropriate) flood and earthquake insurance provided by reputable companies with commercially reasonable deductibles and limits. We maintain a blanket policy that covers all of our properties. We have obtained title insurance insuring fee title to the properties in an aggregate amount which we believe to be adequate. Claims made to our insurance carriers that are determined to be recoverable are classified in other receivables as incurred.
7
SUN COMMUNITIES, INC.
SITE LEASES OR USAGE RIGHTS
Typical tenant leases for MH sites are year-to-year or month-to-month, renewable upon the consent of both parties, or, in some instances, as provided by statute. Certain of our leases, mainly at our Florida and California properties, are tied to the consumer price index or other indices as they relate to rent increases. Generally, market rate adjustments are made on an annual basis. These leases are cancellable for non-payment of rent, violation of community rules and regulations or other specified defaults. Typical resident agreements for RV sites are year-to-year or from move-in date until the end of the current calendar year. Generally, increases and market rate adjustments are made on an annual basis. These agreements are cancellable for non-payment of rent, violation of resort rules and regulations or other specified defaults.
During the five calendar years ended December 31, 2020, on average 2.8 percent of the homes in our MH and RV properties have been removed by their owners and 6.7 percent of the homes have been sold by their owners to a new owner who then assumes rental obligations as a community resident. The average cost to move a home is approximately $7,000. On average, our residents remain in our communities for approximately 11 years, while homes, which give rise to the rental stream, remain for over 42 years.
Leases for wet slips and dry storage spaces are year-to-year, season-to-season, month-to-month, or transient by night, renewable upon the consent of both parties. On average, our members maintain leases in our marinas for approximately eight years.
Please see the Risk Factors in Item 1A, and our accompanying Consolidated Financial Statements and related notes thereto beginning on page F-1 of this Annual Report on Form 10-K for more detailed information.
ACQUISITIONS
For the year ended December 31, 2020, we acquired 24 MH communities and RV resorts, totaling 6,919 sites and 106 marinas totaling over 38,800 wet slips and dry storage spaces for a total purchase price of approximately $3.0 billion.
EXPANSION / DEVELOPMENT
For the year ended December 31, 2020, we completed the construction of over 1,000 MH and RV sites in five ground-up and re-development properties and over 300 MH and RV expansion sites in eight properties.
8
SUN COMMUNITIES, INC.
CAUTIONARY STATEMENT REGARDING FORWARD-LOOKING STATEMENTS
This Annual Report on Form 10-K contains various “forward-looking statements” within the meaning of the Securities Act of 1933, as amended (the “Securities Act”), and the Securities Exchange Act of 1934, as amended (the “Exchange Act”), and we intend that such forward-looking statements will be subject to the safe harbors created thereby. For this purpose, any statements contained in this filing that relate to expectations, beliefs, projections, future plans and strategies, trends or prospective events or developments and similar expressions concerning matters that are not historical facts are deemed to be forward-looking statements. Words such as “forecasts,” “intends,” “intend,” “intended,” “goal,” “estimate,” “estimates,” “expects,” “expect,” “expected,” “project,” “projected,” “projections,” “plans,” “predicts,” “potential,” “seeks,” “anticipates,” “anticipated,” “should,” “could,” “may,” “will,” “designed to,” “foreseeable future,” “believe,” “believes,” “scheduled,” “guidance” and similar expressions are intended to identify forward-looking statements, although not all forward-looking statements contain these words. These forward-looking statements reflect our current views with respect to future events and financial performance, but involve known and unknown risks and uncertainties, both general and specific to the matters discussed in this filing. These risks and uncertainties may cause our actual results to be materially different from any future results expressed or implied by such forward-looking statements. In addition to the risks disclosed under “Risk Factors” in this Annual Report on Form 10-K and our other filings with the SEC, such risks and uncertainties include, but are not limited to:
•
outbreaks of disease, including the COVID-19 pandemic, and related stay-at-home orders, quarantine policies and restrictions on travel, trade and business operations;
•
changes in general economic conditions, the real estate industry, and the markets in which we operate;
•
difficulties in our ability to evaluate, finance, complete and integrate acquisitions (including the Safe Harbor acquisition), developments and expansions successfully;
•
our liquidity and refinancing demands;
•
our ability to obtain or refinance maturing debt;
•
our ability to maintain compliance with covenants contained in our debt facilities;
•
availability of capital;
•
changes in foreign currency exchange rates, including between the U.S. dollar and each of the Canadian dollar and the Australian dollar;
•
our ability to maintain rental rates and occupancy levels;
•
our ability to maintain effective internal control over financial reporting and disclosure controls and procedures;
•
increases in interest rates and operating costs, including insurance premiums and real property taxes;
•
risks related to natural disasters such as hurricanes, earthquakes, floods and wildfires;
•
general volatility of the capital markets and the market price of shares of our capital stock;
•
our ability to maintain our status as a REIT;
•
changes in real estate and zoning laws and regulations;
•
legislative or regulatory changes, including changes to laws governing the taxation of REITs;
•
litigation, judgments or settlements;
•
competitive market forces;
•
the ability of purchasers of manufactured homes and boats to obtain financing; and
•
the level of repossessions by manufactured home and boat lenders.
Readers are cautioned not to place undue reliance on these forward-looking statements, which speak only as of the date the statement was made. We undertake no obligation to publicly update or revise any forward-looking statements included or incorporated by reference into this filing, whether as a result of new information, future events, changes in our expectations or otherwise, except as required by law.
Although we believe that the expectations reflected in the forward-looking statements are reasonable, we cannot guarantee future results, levels of activity, performance or achievements. All written and oral forward-looking statements attributable to us or persons acting on our behalf are qualified in their entirety by these cautionary statements.
9
SUN COMMUNITIES, INC.
ITEM 1A. RISK FACTORS
Our prospects are subject to certain uncertainties and risks. Our future results could differ materially from current results, and our actual results could differ materially from those projected in forward-looking statements as a result of certain risk factors. These risk factors include, but are not limited to, those set forth below, other one-time events, and important factors disclosed previously and from time to time in our other filings with the SEC.
MATERIAL RISKS RELATING TO OUR MH, RV AND MARINA BUSINESSES
General economic conditions and the concentration of our MH, RV and Marina properties in certain geographic areas may affect our ability to generate sufficient revenue.
The market and economic conditions in our current markets generally, and specifically in metropolitan areas of our current markets, may significantly affect occupancy or rental rates. Occupancy and rental rates, in turn, may significantly affect our revenues, and if our properties do not generate revenues sufficient to meet our operating expenses, including debt service and capital expenditures, our cash flow and ability to pay or refinance our debt obligations could be adversely affected.
As of December 31, 2020, 142 MH and RV properties, representing 26.3 percent of developed sites, are located in Florida; 79 properties, representing 18.1 percent of developed sites, are located in Michigan; 27 properties, representing 6.3 percent of developed sites, are located in Texas; and 40 properties, representing 6.0 percent of developed sites, are located in California. As of December 31, 2020, we have revenue concentrations of marinas in Florida, Rhode Island, and Connecticut of approximately 29.0 percent, 13.0 percent and 8.0 percent, respectively. As a result of the geographic concentration of our MH and RV properties in Florida, Michigan, Texas and California, and geographic concentration of our marinas in Florida, Rhode Island, and Connecticut, we are exposed to the risks of downturns in local economies or other local real estate market conditions which could adversely affect occupancy rates, rental rates, and property values in these markets.
Our revenue would also be adversely affected if tenants were unable to pay rent or if sites were unable to be rented on favorable terms. If we were unable to promptly relet or renew the leases for a significant number of the sites, or if the rental rates upon such renewal or reletting were significantly lower than expected rates, then our business and results of operations could be adversely affected. In addition, certain expenditures associated with each property (such as real estate taxes and maintenance costs) generally are not reduced when circumstances cause a reduction in income from the property. Furthermore, real estate investments are relatively illiquid and, therefore, will tend to limit our ability to vary our portfolio promptly in response to changes in economic or other conditions.
The following factors, among others, may adversely affect the revenues generated by our properties:
•
outbreaks of disease, including the COVID-19 pandemic, and related stay-at-home orders, quarantine policies and restrictions on travel, trade and business operation;
•
the national and local economic climate which may be adversely impacted by, among other factors, plant closings, and industry slowdowns;
•
local real estate market conditions such as the oversupply of MH and RV sites or a reduction in demand for MH and RV sites in an area;
•
a decrease in the number of people interested in the RV lifestyle or boating;
•
changes in foreign currency exchange rates, including between the U.S. dollar and each of the Canadian dollar and Australian dollar;
•
the number of repossessed homes in a particular market;
•
an oversupply of, or a reduced demand for, manufactured homes;
•
the difficulty facing potential purchasers in obtaining affordable financing as a result of heightened lending criteria;
•
an increase or decrease in the rate of manufactured home repossessions which provide aggressively priced competition to new manufactured home sales;
•
the lack of an established MH dealer network;
•
the housing rental market which may limit the extent to which rents may be increased to meet increased expenses without decreasing occupancy rates;
•
the perceptions by prospective tenants of the safety, convenience and attractiveness of our MH properties and the neighborhoods where they are located;
10
SUN COMMUNITIES, INC.
•
zoning or other environmental regulatory restrictions;
•
competition from other available MH communities and RV resorts and alternative forms of housing (such as apartment buildings and site-built single-family homes) and from other marinas;
•
our ability to effectively manage, maintain and insure our properties;
•
increased operating costs, including insurance premiums, real estate taxes, and utilities; and
•
the enactment of rent control laws or laws taxing the owners of manufactured homes.
We may not be able to integrate or finance our expansion and development activities.
We build and develop new MH communities, RV resorts and marinas and we expand existing communities and marinas. Our construction and development pipeline may be exposed to the following risks which are in addition to those risks associated with the ownership and operation of established MH communities, RV resorts and marinas:
•
we may not be able to obtain financing with favorable terms for development which may make us unable to proceed with the development;
•
we may be unable to obtain, or face delays in obtaining, necessary zoning, building and other governmental permits and authorizations, which could result in increased costs and delays, and even require us to abandon development of the property entirely if we are unable to obtain such permits or authorizations;
•
we may abandon development opportunities that we have already begun to explore and as a result we may not recover expenses already incurred in connection with exploring such development opportunities;
•
we may be unable to complete construction and lease-up of a property on schedule resulting in increased debt service expense and construction costs;
•
we may incur construction and development costs for a property which exceed our original estimates due to increased materials, labor or other costs, which could make completing the development uneconomical and we may not be able to increase rents to compensate for the increase in development costs which may impact our profitability;
•
we may be unable to secure long-term financing on completion of development resulting in increased debt service and lower profitability;
•
occupancy rates and rents at a newly developed property may fluctuate depending on several factors, including market and economic conditions, which may result in the property not being profitable; and
•
climate change may cause new marina developments to be paused or restricted.
If any of the above risks occur, our business and results of operations could be adversely affected.
Competition affects occupancy levels and rents, which could adversely affect our revenues.
The MH, RV and marina industries are highly-fragmented. There is competition within the MH, RV and marina markets we currently serve and in new markets that we may enter. We have both national and regional competitors in the MH, RV and marina markets. Our properties are located in developed areas that include other MH communities, RV resorts and marinas. The number of competitive MH communities, RV resorts and marinas in a particular area could have a material adverse effect on our ability to lease sites and increase rents charged at our properties or at any newly acquired properties. We may be competing with others with greater resources. In addition, other forms of multi‑family residential properties, such as private and federally funded or assisted multi-family housing projects and single‑family housing, provide housing alternatives to potential tenants of MH communities and RV resorts.
The cyclical and seasonal nature of the RV and marina industries may lead to fluctuations in our operating results
.
The RV and marina industries can experience cycles of growth and downturn due to seasonality patterns. Results of operations in any one period may not be indicative of results in future periods. In the RV market, certain properties maintain higher occupancy during the summer months, while other properties maintain higher occupancy during the winter months. The RV market typically shows a decline in demand over the winter months, yet usually produces higher growth in the spring and summer months due to higher use by vacationers. In the marina market, demand for wet slip storage increases during the summer months as customers contract for the summer boating season, which also drives non-storage revenue streams such as service, fuel and on-premise restaurants or convenience storage. Demand for dry storage increases during the winter season as seasonal weather patterns require boat owners to store their vessels on dry docks and within covered racks. Our results on a quarterly basis can fluctuate due to this cyclicality and seasonality.
11
SUN COMMUNITIES, INC.
We may not be able to integrate or finance our acquisitions and our acquisitions may not perform as expected.
We have acquired and intend to continue to selectively acquire MH, RV and marina properties. Our acquisition activities and their success are subject to the following risks:
•
we may be unable to acquire a desired property because of competition from other well-capitalized real estate investors, including both publicly traded REITs and institutional investment funds;
•
even if we enter into an acquisition agreement for a property, it is usually subject to customary conditions to closing, including completion of due diligence investigations to our satisfaction, which may not be satisfied;
•
even if we are able to acquire a desired property, competition from other real estate investors may significantly increase the purchase price;
•
we may be unable to finance acquisitions on favorable terms;
•
acquired properties may fail to perform as expected;
•
acquired properties may be located in new markets where we face risks associated with a lack of market knowledge or understanding of the local economy, lack of business relationships in the area, and unfamiliarity with local governmental and permitting procedures; and
•
we may be unable to quickly and efficiently integrate new acquisitions, particularly acquisitions of portfolios of properties, into our existing operations.
If any of the above risks occur, our business and results of operations could be adversely affected.
In addition, we may acquire properties subject to liabilities and we may be left with no, or limited, recourse, with respect to unknown liabilities. As a result, we may have to pay substantial sums to settle any liabilities asserted against us based upon ownership of newly acquired properties, which could adversely affect our cash flow.
We depend on Safe Harbor’s management to operate our recently-acquired marina business, and our acquisition of Safe Harbor presents us with new risks.
Before we acquired Safe Harbor in October 2020, we did not own or operate any marinas. Safe Harbor’s operations are separate from our other operations and we may experience inefficiencies in incorporating Safe Harbor’s financial reporting and coordinating information technology systems and controls with those of the Company as a whole. In addition, the successful operation of our marinas depends on our ability to retain key employees with experience in the marina business, including Baxter R. Underwood, who is the Chief Executive Officer of Safe Harbor. The loss of services of Mr. Underwood or other key employees could have a materially adverse effect on our ability to operate Safe Harbor. Although Mr. Underwood has entered into an employment and non-competition agreement, upon certain events he will have the option to eliminate the non-competition covenant by foregoing certain compensation and other benefits.
We do not currently maintain or contemplate obtaining any “key-man” life insurance on any of the key employees of Safe Harbor. Our entry into the marina business also subjects us to new laws and regulations and may lead to increased litigation and regulatory risk including but not limited to statutes and government regulations that govern the use of, and construction on, rivers, lakes and other waterways. Exposure to the marina industry may expose us to certain weather events and risks to which we have not previously been exposed. Additionally, the marina business may be affected in different ways or to a greater extent than our existing MH and RV business by the COVID-19 pandemic with respect to infection control, facility and work-site access, or other related issues.
Investments through joint ventures involve risks not present for properties in which we are the sole owner.
We have invested and may continue to invest as a joint venture partner in joint ventures. These investments involve risks, including, but not limited to, the possibility the other joint venture partner may have business goals which are inconsistent with ours, possess the ability to take or force action or withhold consent contrary to our requests, fail to provide capital or fulfill its obligations, or become insolvent and require us to assume and fulfill the joint venture’s financial obligations. Conflicts arising between us and our joint venture partners may be difficult to manage or resolve and it could be difficult to manage or otherwise monitor the existing business arrangements.
We and our joint venture partners may each have the right to initiate a buy-sell arrangement, which could cause us to sell our interest, or acquire a joint venture partner’s interest, at a time when we otherwise would not have entered into such a transaction. Each joint venture agreement is individually negotiated, and our ability to operate, finance, or dispose of a property in our sole discretion may be limited to varying degrees depending on the terms of the applicable joint venture agreement.
12
SUN COMMUNITIES, INC.
Many of our properties are located in areas that experience extreme weather conditions and natural disasters and climate change may adversely affect our business.
Extreme weather or weather-related conditions and other natural disasters, including hurricanes, flash floods, sea-level rise, tornadoes, wildfires or earthquakes, may interrupt our operations, damage our properties and reduce the number of customers who utilize our properties in the affected areas. Many of our properties are on coastlines that are subject to hurricane seasons, flash flooding and sea-level rise; in areas adversely affected by wildfires, such as the western United States; and in earthquake-prone areas, such as the West Coast. If there are prolonged disruptions at our properties due to extreme weather or natural disasters, our results of operations and financial condition could be materially adversely affected.
While we maintain insurance coverage that may cover certain of the costs and loss of revenue associated with the effect of extreme weather and natural disasters at our properties, our coverage is subject to deductibles and limits on maximum benefits. We cannot assure you that we will be able to fully collect, if at all, on any claims resulting from extreme weather or natural disasters.
If any of our properties are damaged or if their operations are disrupted as a result of extreme weather or natural disasters, or if extreme weather or natural disasters adversely impact general economic or other conditions in the areas in which our properties are located or from which they draw their tenants and customers, our business, financial condition and results of operations could be materially adversely affected.
Significant changes in the climate could exacerbate extreme weather conditions or natural disasters that may occur in areas where our properties are located, all of which may result in additional physical damage to or a decrease in demand for properties located in these areas or affected by these conditions. If the impact of climate change is material in nature, including significant property damage to or destruction of our properties, or occur for lengthy periods of time, our financial condition or results of operations may be adversely affected. In addition, changes in federal, state and local legislation and regulation based on concerns about climate change could result in increased capital expenditures on our properties (for example, to improve their energy efficiency and / or resistance to inclement weather) without a corresponding increase in revenue, resulting in adverse impacts to our net income.
Marinas may not be readily adaptable to other uses.
Marinas are specific-use properties and may contain features or assets that have limited alternative uses. These properties may also have distinct operational functions that involve specific procedures and training. If the operations of any of our marinas become unprofitable due to industry competition, operational execution or otherwise, then it may not be feasible to operate the property for another use, and the value of certain features or assets used at the property, or the property itself, may be impaired. Should any of these events occur, our financial condition, results of operations and cash flows could be adversely impacted.
We may be unable to obtain, renew or maintain permits, licenses and approvals necessary for the operation of our marinas.
The U.S. Army Corps of Engineers, the Coast Guard and other governmental bodies control much of the land located beneath and surrounding many of our marinas and lease such land to Safe Harbor under leases that typically range from five to 50 years. As a result, it is unlikely that we can obtain fee-simple title to the land on or near these marinas. If these governmental authorities terminate, fail to renew, or interpret in ways that are materially less favorable any of the permits, licenses and approvals necessary for operation of these properties, then our financial condition, results of operations and cash flows could be adversely impacted.
Some marinas must be dredged from time to time to remove silt and mud that collect in harbor-areas in order to assure that boat traffic can safely enter the harbor. Dredging and disposing of the dredged material can be very costly and require permits from various governmental authorities. If the permits necessary to dredge marinas or dispose of the dredged material cannot be timely obtained after the acquisition of a marina, or if dredging is not practical or is exceedingly expensive, the operations of such property would be materially and adversely affected.
13
SUN COMMUNITIES, INC.
Our significant amount of debt could limit our operational flexibility or otherwise adversely affect our financial condition, and we may incur more debt in the future
.
We have a significant amount of debt. As of December 31, 2020, we had approximately $4.8 billion of total debt outstanding, consisting of approximately $3.4 billion in debt that is collateralized by mortgage liens on 192 of the properties, $1.2 billion on our lines of credit, $35.2 million of mandatorily redeemable preferred equity, and $34.7 million of preferred OP units that are mandatorily redeemable. If we fail to meet our obligations under our secured debt, the lenders would be entitled to foreclose on all or some of the collateral securing such debt which could have a material adverse effect on us and our ability to make expected distributions, and could threaten our continued viability.
We are subject to the risks normally associated with debt financing, including the following risks:
•
our cash flow may be insufficient to meet required debt payments, or we may need to dedicate a substantial portion of our cash flow to pay our debt rather than to other areas of our business;
•
our existing indebtedness may limit our operating flexibility due to financial and other restrictive covenants, including restrictions on incurring additional debt;
•
it may be more difficult for us to obtain additional financing for our operations, working capital requirements, capital expenditures, debt service or other general requirements;
•
we may be more vulnerable in the event of adverse economic and industry conditions or a downturn in our business;
•
we may be placed at a competitive disadvantage compared to our competitors that have less debt; and
•
we may not be able to refinance at all or on favorable terms, as our debt matures.
If any of the above risks occurred, our financial condition and results of operations could be materially adversely affected.
Despite our current indebtedness levels, we may incur substantially more debt in the future. If new debt is added to our current debt levels, an even greater portion of our cash flow will be needed to satisfy our debt service obligations. As a result, the related risks that we now face could intensify and increase the risk of a default on our indebtedness.
We may incur liability under environmental laws arising from conditions at properties we acquire or operations at the properties we own and operate.
Under various federal, state and local laws, ordinances and regulations, an owner or operator of real estate is liable for the costs of removal or remediation of certain hazardous substances at, on, under, or in such property. Such hazardous substances may be used at or located on our properties, especially our marinas. Such laws often impose liability without regard to whether the owner knew of, or was responsible for, the presence of such hazardous substances. The presence of such substances, or the failure to properly remediate such substances, may adversely affect the owner’s ability to sell or rent the property, to borrow using the property as collateral or to develop the property. Persons who arrange for the disposal or treatment of hazardous substances also may be liable for the costs of removal or remediation of such substances at a disposal or treatment facility owned or operated by another person. In addition, certain environmental laws impose liability for the management and disposal of asbestos-containing materials and for the release of such materials into the air. These laws may result in fines or penalties and may permit third parties to seek recovery from owners or operators of real properties for personal injury associated with asbestos-containing materials.
As the purchaser of properties we acquire or in connection with the operation of properties we own or manage, we may be liable for removal or remediation costs, governmental fines and injuries to persons and property. When we arrange for the treatment or disposal of hazardous substances at landfills or other facilities owned by other persons, we may be liable for the removal or remediation costs at such facilities.
We subject our properties to a Phase I or similar environmental assessment as well as limited compliance evaluations (which involve general inspections without soil sampling or ground water analysis) completed by independent environmental and engineering consultants. In some cases, where these evaluations have recommended further, invasive investigations, those have also been conducted. These environmental evaluations have not revealed any significant environmental liability that would have a material adverse effect on our business. These audits cannot reflect conditions arising after the studies were completed, and no assurances can be given that existing environmental studies reveal all environmental liabilities, that any prior owner or operator of a property or neighboring owner or operator did not create any material environmental condition not known to us, or that a material environmental condition does not otherwise exist as to any one or more properties.
14
SUN COMMUNITIES, INC.
Moreover, we cannot be sure that: (a) future laws, ordinances or regulations will not impose any material environmental liability; or (b) the current environmental condition of our properties will not be affected by tenants and occupants of the properties, by the condition of land or operations in the vicinity of our properties (such as the presence of underground storage tanks), or by unrelated third parties. Environmental liabilities that we may incur could have an adverse effect on our financial condition, results of operations and cash flows.
The current pandemic of the coronavirus, or COVID-19, has materially and adversely impacted and disrupted our financial condition, results of operations, cash flows and performance, and we expect it could continue to do so.
The COVID-19 pandemic has had, and it could continue to have, or a future pandemic could have, material and adverse effects on our ability to successfully operate, and on our financial condition, results of operations and cash flows, including in the following possible ways, among others:
•
A downturn in the economy may affect the ability of the residents or customers in our MH communities and marinas to pay their rent.
•
Travel restrictions may affect the ability of potential guests to travel to and use our RV resorts and marinas. A downturn in the economy may independently reduce demand for our RV resorts and marinas, and our RV revenue may decrease if we cannot convert as many transient RV sites to annual RV sites as planned.
•
RV resorts may be subject to government restrictions which limit the ability to operate or provide certain amenities.
•
We may have difficulty accessing debt and equity capital on attractive terms, or at all, and a severe disruption and instability in the global financial markets or deterioration in credit and financing conditions may result in insufficient liquidity or affect our access to capital necessary to fund and grow our business and address maturing liabilities on a timely basis. As of December 31, 2020, we had drawn $40.4 million on our unsecured senior credit facility of which the total capacity, excluding the unexercised accordion feature, is $750.0 million, and approximately $1.2 billion on our Safe Harbor secured credit facility of which the total capacity is $1.8 billion.
•
The financial impact of the COVID-19 pandemic could negatively impact our future compliance with financial covenants of our debt agreements and result in a default and potentially an acceleration of indebtedness, which non-compliance could negatively impact our ability to make additional borrowings under our senior credit facility and our Safe Harbor credit facility.
•
Our ground up development and expansion activities, and conversions of transient RV sites to annual RV sites may be disrupted, and we may be delayed in our current projects and timelines, the magnitude of which will depend, in part, on the length and severity of the current governmental restrictions or limitations implemented in the future.
•
Our revenue from home sales and brokerage fees may decrease as a result of stay-at-home orders and travel restrictions.
•
The ancillary revenue from amenities at our properties, such as restaurants, golf courses, resort and marina activities, may decrease.
•
The operation of our marinas may be disrupted by the COVID-19 pandemic with respect to infection control, facility and work-site access, or other related issues. As result, we may experience delays in our current projects and timelines, the magnitude of which will depend on governmental restrictions or limitations implemented in the future.
•
Negative impacts on our results of operations and our access to capital could cause us to eliminate or reduce the amount of our distributions to stockholders, or to pay some or all of our distributions in common stock rather than cash.
•
A general decline in business activity and demand for real estate transactions could adversely affect our ability or desire to acquire additional properties.
•
A recession or additional market corrections resulting from the spread of COVID-19 could further affect the value of our common stock, which is still the below the pre-COVID-19 value. We expect our stock price to continue to be volatile.
•
Governmental agencies that permit and approve our projects, suppliers, homebuilders, and other business partners and third parties may be prevented from conducting business activities in the ordinary course for an indefinite period of time, which could in turn negatively affect our business.
•
We may have to furlough team members to reflect operating levels. Furloughed team members may not be available if we later desire to hire them back. Furloughs and reductions in pay and hours may negatively affect the morale of our team members.
•
We may experience disruptions or inefficiencies in our ability to effectively operate our business because the vast majority of our team members, including at our Main Office in Southfield, Michigan, are working virtually from their homes.
15
SUN COMMUNITIES, INC.
The extent to which the COVID-19 pandemic impacts our operations, financial condition and financial results will depend on future developments, which are highly uncertain and cannot be predicted with confidence, including the scope, severity and duration of the pandemic, the actions taken to contain the pandemic or mitigate its impact, and the direct and indirect economic effects of the pandemic and containment measures, among others. The rapid development and fluidity of this situation precludes any prediction as to the full adverse impact of the COVID-19 pandemic. Nevertheless, the COVID-19 pandemic presents material uncertainty and risk with respect to our performance, financial condition, results of operations, cash flows and performance. Moreover, many risk factors set forth in this Annual Report on Form 10-K should be interpreted as heightened risks as a result of the impact of the COVID-19 pandemic.
Rent control legislation may harm our ability to increase rents.
State and local rent control laws in certain jurisdictions may limit our ability to increase rents at our MH properties to recover increases in operating expenses and the costs of capital improvements. Enactment of such laws has been considered from time to time in other jurisdictions. Certain properties are located, and we may purchase additional properties, in markets that are either subject to rent control or in which rent-limiting legislation exists or may be enacted.
TAX RISKS RELATED TO OUR STATUS AS A REIT
We may suffer adverse tax consequences and be unable to attract capital if we fail to qualify as a REIT.
We believe that since our taxable year ended December 31, 1994, we have been organized and operated, and intend to continue to operate, so as to qualify for taxation as a REIT under the Code. Although we believe that we have been and will continue to be organized and have operated and will continue to operate so as to qualify for taxation as a REIT, we cannot be assured that we have been or will continue to qualify as a REIT. Qualification as a REIT involves the satisfaction of numerous requirements (some on an annual and quarterly basis) established under highly technical and complex Code provisions for which there are only limited judicial or administrative interpretations and involves the determination of various factual matters and circumstances not entirely within our control. In addition, frequent changes occur in the area of REIT taxation, which require us to monitor our tax status continually.
If we fail to qualify as a REIT in any taxable year, our taxable income could be subject to U.S. federal income tax at regular corporate rates. Moreover, unless entitled to relief under certain statutory provisions, we also would be disqualified from treatment as a REIT for the four taxable years following the year during which qualification was lost. This treatment would reduce our net earnings available for investment or distribution to stockholders because of the additional tax liability to us for the years involved. In addition, distributions to stockholders would no longer be required to be made.
Federal, state and foreign income tax laws governing REITs and related interpretations may change at any time, and any such legislative or other actions affecting REITs could have a negative effect on us.
Federal, state and foreign income tax laws governing REITs, or the administrative interpretations of those laws may be amended at any time. Federal, state, and foreign tax laws are under constant review by persons involved in the legislative process, at the Internal Revenue Service and the U.S. Department of the Treasury, and at various state and foreign tax authorities. Changes to tax laws, regulations, or administrative interpretations, which may be applied retroactively, could adversely affect us. We cannot predict whether, when, in what forms, or with what effective dates, the tax laws, regulations, and administrative interpretations applicable to us may be changed. Accordingly, we cannot assert that any such change will not significantly affect either our ability to qualify for taxation as a REIT or the income tax consequences to us.
We intend for the Operating Partnership to be taxed as a partnership, but we cannot guarantee that it will qualify.
We believe that the Operating Partnership has been organized as a partnership and will qualify for treatment as such under the Code. However, if the Operating Partnership is deemed to be a “publicly traded partnership,” it will be treated as a corporation instead of a partnership for federal income tax purposes unless at least 90 percent of its income is qualifying income as defined in the Code. The income requirements applicable to REITs and the definition of “qualifying income” for purposes of this 90 percent test are similar in most respects. Qualifying income for the 90 percent test generally includes passive income, such as specified types of real property rents, dividends, and interest. We believe that the Operating Partnership has and will continue to meet this 90 percent test, but we cannot guarantee that it has or will. If the Operating Partnership were to be taxed as a regular corporation, it would incur substantial tax liabilities, we would fail to qualify as a REIT for federal income tax purposes, and our ability to raise additional capital could be significantly impaired.
16
SUN COMMUNITIES, INC.
Partnership tax audit rules could have a material adverse effect on us.
The Bipartisan Budget Act of 2015 changed the rules applicable to U.S. federal income tax audits of partnerships. Under the rules, effective for taxable years beginning in 2018, among other changes and subject to certain exceptions, any audit adjustment to items of income, gain, loss, deduction, or credit of a partnership (and a partner’s allocable share thereof) is determined, and taxes, interest, and penalties attributable thereto are assessed and collected, at the partnership level. Unless the partnership makes an election permitted under the new law or takes certain steps to require the partners to pay their tax on their allocable shares of the adjustment, it is possible that partnerships in which we directly or indirectly invest, including the Operating Partnership, would be required to pay additional taxes, interest and penalties as a result of an audit adjustment. We, as a direct or indirect partner of the Operating Partnership and other partnerships, could be required to bear the economic burden of those taxes, interest, and penalties even though the Company, as a REIT, may not otherwise have been required to pay additional corporate-level tax. The changes created by these rules are significant for collecting tax in partnership audits and, accordingly, there can be no assurance that these rules will not have a material adverse effect on us.
Our ability to accumulate cash may be restricted due to certain REIT distribution requirements.
In order to qualify as a REIT, we must distribute to our stockholders at least 90 percent of our REIT taxable income (calculated without any deduction for dividends paid and excluding net capital gain) and to avoid federal income taxation, our distributions must not be less than 100 percent of our REIT taxable income, including capital gains. As a result of the distribution requirements, we do not expect to accumulate significant amounts of cash. Accordingly, these distributions could significantly reduce the cash available to us in subsequent periods to fund our operations and future growth.
Our taxable REIT subsidiaries, or TRSs, are subject to special rules that may result in increased taxes.
As a REIT, we must pay a 100 percent penalty tax on certain payments that we receive if the economic arrangements between us and any of our TRSs are not comparable to similar arrangements between unrelated parties. The Internal Revenue Service may successfully assert that the economic arrangements of any of our inter-company transactions are not comparable to similar arrangements between unrelated parties. This would result in unexpected tax liability which would adversely affect our cash flows.
Dividends payable by REITs do not qualify for the reduced tax rates applicable to certain dividends.
The maximum federal tax rate for certain qualified dividends payable to domestic stockholders that are individuals, trusts and estates is 20 percent. Dividends payable by REITs, however, are generally not eligible for this reduced rate, although the Tax Cut and Jobs Act permits a 20 percent deduction equal to the amount of qualifying REIT dividends received, thus bringing the maximum federal tax rate on qualifying REIT dividends to 29.6 percent. While this rule does not adversely affect the taxation of REITs or dividends paid by REITs, the more favorable rates applicable to regular qualified corporate dividends could cause investors who are individuals, trusts and estates to perceive investments in REITs to be relatively less competitive than investments in stock of non-REIT corporations that pay dividends, which could adversely affect the comparative value of the stock of REITs, including our common stock and preferred stock.
Prospective investors should consult their own tax advisors regarding the effect of this change on their effective tax rate with respect to REIT dividends.
Complying with REIT requirements may cause us to forego otherwise attractive opportunities.
To remain qualified as a REIT for federal income tax purposes, we must continually satisfy requirements and tests under the tax law concerning, among other things, the sources of our income, the nature and diversification of our assets, the amounts we distribute to our stockholders and the ownership of our stock. In order to meet these tests, we may be required to forego or limit attractive business or investment opportunities and distribute all of our net earnings rather than invest in attractive opportunities or hold larger liquid reserves. Therefore, compliance with the REIT requirements may hinder our ability to operate solely to maximize profits.
17
SUN COMMUNITIES, INC.
Our ability to use net operating loss carryforwards to reduce future tax payments may be limited if we experience a change in ownership, or if taxable income does not reach sufficient levels.
Under Section 382 of the Code, if a corporation undergoes an “ownership change” (generally defined as a greater than 50 percent change (by value) in its equity ownership over a rolling three-year period), the corporation’s ability to use its pre-ownership-change net operating loss carryforwards to offset its post-ownership-change income may be limited. We may experience ownership changes in the future. If an ownership change were to occur, we would be limited in the portion of net operating loss carryforwards that we could use in the future to offset taxable income for U.S. federal income tax purposes.
RISKS RELATED TO RELATED PARTY TRANSACTIONS AND OUR STRUCTURE
Some of our directors and officers may have conflicts of interest with respect to certain related party transactions and other business interests.
Lease of Executive Offices -
Gary A. Shiffman, together with certain of his family members, indirectly owns an equity interest of approximately 28.1 percent in American Center LLC, the entity from which we lease office space for our principal executive offices. Each of Brian M. Hermelin, Ronald A. Klein and Arthur A. Weiss indirectly
owns less than one percent interest in American Center LLC. Mr. Shiffman is our Chief Executive Officer and Chairman of the Board. Each of Mr. Hermelin, Mr. Klein and Mr. Weiss is a director of the Company. Under this agreement, we lease approximately 103,100 rentable square feet of permanent space. We subsequently entered into an additional office space operating lease which commenced in January 2020. Under this agreement, we lease approximately 20,087 rentable square feet of permanent space. The initial term of each lease is until October 31, 2026 and the average gross base rent is $18.95 per square foot until October 31, 2020 with graduated rent increases thereafter. As of December 31, 2020, the average gross base rent was $19.45 per square foot. Each of Mr. Shiffman, Mr. Hermelin, Mr. Klein and Mr. Weiss may have a conflict of interest with respect to his obligations as our officer and / or director and his ownership interest in American Center LLC.
Use of Airplane
- Gary A. Shiffman is the beneficial owner of an airplane that we use from time to time for business purposes. During the years ended December 31, 2020 and 2019, we paid $0.3 million and $0.4 million for the use of the airplane, respectively. Mr. Shiffman may have a conflict of interest with respect to his obligations as our officer and director and his ownership interest in the airplane.
Telephone Services
- Brian M. Hermelin is a principal and a beneficial owner of an entity that installs and maintains emergency telephone systems at our properties. During the years ended December 31, 2020 and 2019, we paid $0.2 million for these services, respectively. Mr. Hermelin may have a conflict of interest with respect to his obligations as our director and his position with and ownership interest in the provider of these services.
Legal Counsel
- During 2017-2020, Jaffe, Raitt, Heuer, & Weiss, Professional Corporation acted as our general counsel and represented us in various matters. Arthur A. Weiss is the Chairman of the Board of Directors and a shareholder of such firm. We incurred legal fees and expenses owed to Jaffe, Raitt, Heuer, & Weiss of approximately $13.3 million, $11.1 million and $7.1 million in the years ended December 31, 2020, 2019 and 2018, respectively.
Tax Consequences Upon Sale of Properties
- Gary A. Shiffman holds limited partnership interests in the Operating Partnership which were received in connection with the contribution of properties from partnerships previously affiliated with him. Prior to any redemption of these limited partnership interests for our common stock, Mr. Shiffman will have tax consequences different from those on us and our public stockholders upon the sale of any of these partnerships. Therefore, we and Mr. Shiffman may have different objectives regarding the appropriate pricing and timing of any sale of those properties.
Certain provisions in our governing documents may make it difficult for a third-party to acquire us.
9.8 percent Ownership Limit.
In order to qualify and maintain our qualification as a REIT, not more than 50 percent of the outstanding shares of our capital stock may be owned, directly or indirectly, by five or fewer individuals. Thus, ownership of more than 9.8 percent, in number of shares or value, of the issued and outstanding shares of our capital stock by any single stockholder has been restricted, with certain exceptions, for the purpose of maintaining our qualification as a REIT under the Code. Such restrictions in our charter do not apply to Milton M. Shiffman, Gary A. Shiffman, and Robert B. Bayer; trustees, personal representatives and agents to the extent acting for them or their respective estates; or certain of their respective relatives.
18
SUN COMMUNITIES, INC.
The 9.8 percent ownership limit, as well as our ability to issue additional shares of common stock or shares of other stock (which may have rights and preferences over the common stock), may discourage a change of control of the Company and may also: (a) deter tender offers for the common stock, which offers may be advantageous to stockholders; and (b) limit the opportunity for stockholders to receive a premium for their common stock that might otherwise exist if an investor were attempting to assemble a block of common stock in excess of 9.8 percent of our outstanding shares or otherwise effect a change of control of the Company.
Preferred Stock.
Our charter authorizes the Board of Directors to issue up to 20,000,000 shares of preferred stock, none of which is currently outstanding, and to establish the preferences and rights (including the right to vote and the right to convert into shares of common stock) of any shares issued. The power to issue preferred stock could have the effect of delaying or preventing a change in control of the Company even if a change in control were in the stockholders’ interest.
Certain provisions of Maryland law could inhibit changes in control, which may discourage third parties from conducting a tender offer or seeking other change of control transactions that could involve a premium price for our common stock or that our stockholders otherwise believe to be in their best interest.
Certain provisions of the Maryland General Corporation Law (“MGCL”) may have the effect of inhibiting a third-party from making a proposal to acquire us or of impeding a change of control under circumstances that otherwise could provide the holders of shares of our capital stock with the opportunity to realize a premium over the then-prevailing market price of such shares, including:
•
“business combination” provisions that, subject to limitations, prohibit certain business combinations between us and an “interested stockholder” (defined generally as any person who beneficially owns 10 percent or more of the voting power of our shares or an affiliate thereof or an affiliate or associate of ours who was the beneficial owner, directly or indirectly, of 10 percent or more of the voting power of our then outstanding voting stock at any time within the two-year period immediately prior to the date in question) for five years after the most recent date on which the stockholder becomes an interested stockholder, and thereafter impose fair price and / or supermajority and stockholder voting requirements on these combinations; and
•
“control share” provisions that provide that “control shares” of our company (defined as shares that, when aggregated with other shares controlled by the stockholder, entitle the stockholder to exercise one of three increasing ranges of voting power in electing directors) acquired in a “control share acquisition” (defined as the direct or indirect acquisition of ownership or control of issued and outstanding “control shares”) have no voting rights except to the extent approved by our stockholders by the affirmative vote of at least two-thirds of all the votes entitled to be cast on the matter, excluding all interested shares.
The provisions of the MGCL relating to business combinations do not apply, however, to business combinations that are approved or exempted by our Board of Directors prior to the time that the interested stockholder becomes an interested stockholder. As permitted by the statute, our Board of Directors has by resolution exempted Milton M. Shiffman, Robert B. Bayer, and Gary A. Shiffman, their affiliates and all persons acting in concert or as a group with the foregoing, from the business combination provisions of the MGCL and, consequently, the five-year prohibition and the supermajority vote requirements will not apply to business combinations between us and these persons. As a result, these persons may be able to enter into business combinations with us that may not be in the best interests of our stockholders without compliance by our company with the supermajority vote requirements and the other provisions of the statute.
Also, pursuant to a provision in our bylaws, we have exempted any acquisition of our stock from the control share provisions of the MGCL. However, our Board of Directors may by amendment to our bylaws opt into the control share provisions of the MGCL at any time in the future.
19
SUN COMMUNITIES, INC.
Additionally, Subtitle 8 of Title 3 of the MGCL permits our Board of Directors, without stockholder approval and regardless of what is currently provided in our charter or bylaws, to elect to be subject to certain provisions relating to corporate governance that may have the effect of delaying, deferring or preventing a transaction or a change of control of our company that might involve a premium to the market price of our common stock or otherwise be in our stockholders’ best interests. These provisions include a classified board; two-thirds vote to remove a director; that the number of directors may only be fixed by the Board of Directors; that vacancies on the board as a result of an increase in the size of the board or due to death, resignation or removal can only be filled by the board, and the director appointed to fill the vacancy serves for the remainder of the full term of the class of director in which the vacancy occurred; and a majority requirement for the calling by stockholders of special meetings. Other than a classified board, the filling of vacancies as a result of the removal of a director and a majority requirement for the calling by stockholders of special meetings, we are already subject to these provisions, either by provisions of our charter and bylaws unrelated to Subtitle 8 or by reason of an election to be subject to certain provisions of Subtitle 8. In the future, our Board of Directors may elect, without stockholder approval, to make us subject to the provisions of Subtitle 8 to which we are not currently subject.
Our Board of Directors has power to adopt, alter or repeal any provision of our bylaws or make new bylaws, provided, however, that our stockholders may alter or repeal any provision of our bylaws and adopt new bylaws if any such alteration, repeal or adoption is approved by the affirmative vote of a majority of all votes entitled to be cast on the matter.
GENERAL RISK FACTORS
Our share price could be volatile and could decline, resulting in a substantial or complete loss on our stockholders’ investment.
The stock markets, including the New York Stock Exchange (“NYSE”), on which we list our common stock, have experienced significant price and volume fluctuations. As a result, the market price of our common stock and preferred stock could be similarly volatile, and investors in our common stock and preferred stock may experience a decrease in the value of their shares, including decreases unrelated to our operating performance or prospects. The price of our common stock and preferred stock could be subject to wide fluctuations in response to a number of factors, including:
•
outbreaks of disease, including the COVID-19 pandemic, and related stay-at-home orders, quarantine policies and restrictions on travel, trade and business operation;
•
issuances of other equity securities in the future, including new series or classes of preferred stock;
•
our operating performance and the performance of other similar companies;
•
our ability to maintain compliance with covenants contained in our debt facilities;
•
actual or anticipated variations in our operating results, funds from operations, cash flows or liquidity;
•
changes in expectations of future financial performance or changes in our earnings estimates or those of analysts;
•
changes in our distribution policy;
•
publication of research reports about us or the real estate industry generally;
•
increases in market interest rates that lead purchasers of our common stock and preferred stock to demand a higher dividend yield;
•
changes in foreign currency exchange rates, including between the U.S. dollar and each of the Canadian dollar and the Australian dollar;
•
changes in market valuations of similar companies;
•
adverse market reaction to the amount of our debt outstanding at any time, the amount of our debt maturing in the near-term and medium-term and our ability to refinance our debt, or our plans to incur additional debt in the future;
•
additions or departures of key management personnel;
•
speculation in the press or investment community;
•
equity issuances by us, or share resales by our stockholders or the perception that such issuances or resales may occur;
•
actions by institutional stockholders; and
•
general market and economic conditions.
20
SUN COMMUNITIES, INC.
Many of the factors listed above are beyond our control. Those factors may cause the market price of our common stock or preferred stock to decline significantly, regardless of our financial condition, results of operations and prospects. It is impossible to provide any assurance that the market price of our common stock or preferred stock will not fall in the future, and it may be difficult for holders to resell shares of our common stock or preferred stock at prices they find attractive, or at all. In the past, securities class action litigation has often been instituted against companies following periods of volatility in their stock price. This type of litigation could result in substantial costs and divert our management’s attention and resources.
Substantial sales or issuances of our common or preferred stock could cause our stock price to fall
.
The sale or issuance of substantial amounts of our common stock or preferred stock, whether directly by us or in the secondary market, the perception that such sales could occur or the availability of future issuances of shares of our common stock, preferred stock, OP units or other securities convertible into or exchangeable or exercisable for our common stock or preferred stock, could materially and adversely affect the market price of our common stock or preferred stock and our ability to raise capital through future offerings of equity or equity-related securities. In addition, we may issue capital stock that is senior to our common stock in the future for a number of reasons, including to finance our operations and business strategy, to adjust our ratio of debt to equity or for other reasons.
Based on the applicable conversion ratios then in effect, as of February 11, 2021, in the future we may issue to the limited partners of the Operating Partnership, up to approximately 5.7 million shares of our common stock in exchange for their OP units. The limited partners may sell such shares pursuant to registration rights, if available, or an available exemption from registration. As of February 11, 2021, options to purchase 1,500 shares of our common stock were outstanding under our equity incentive plans, and we currently have the authority to issue restricted stock awards or options to purchase up to an additional 899,254 shares of our common stock pursuant to our equity incentive plans. In addition, we have entered into an At-the-Market Offering Sales Agreement to issue and sell shares of common stock. As of February 11, 2021, our Board of Directors had authorized us to sell an additional $286.3 million of common stock under this agreement. No prediction can be made regarding the effect that future sales of shares of our common stock or our other securities will have on the market price of shares.
Our business operations may not generate the cash needed to make distributions on our capital stock or to service our indebtedness, and we may adjust our common stock distribution policy.
Our ability to make distributions on our common stock and preferred stock, and payments on our indebtedness and to fund planned capital expenditures will depend on our ability to generate cash in the future. We cannot assure you that our business will generate sufficient cash flow from operations or that future borrowings will be available to us in an amount sufficient to enable us to make distributions on our common stock or preferred stock, to pay our indebtedness or to fund our other liquidity needs.
The decision to declare and pay distributions on shares of our common stock in the future, as well as the timing, amount and composition of any such future distributions, will be at the sole discretion of our Board of Directors in light of conditions then existing, including our earnings, financial condition, capital requirements, debt maturities, the availability of debt and equity capital, applicable REIT and legal restrictions, general overall economic conditions and other factors. Any change in our distribution policy could have a material adverse effect on the market price of our common stock.
We rely on key management
.
We depend on the efforts of our executive officers, Gary A. Shiffman, John B. McLaren, Karen J. Dearing, Bruce Thelen, and Baxter R. Underwood. The loss of services of one or more of these executive officers could have a temporary adverse effect on our operations. We do not currently maintain or contemplate obtaining any “key-man” life insurance on our executive officers.
The phase out of the London Interbank Offered Rate (LIBOR), or the replacement of LIBOR with a different reference rate, may adversely affect interest rates.
The Financial Conduct Authority (the authority that regulates LIBOR) has announced that it plans on phasing out LIBOR by the end of 2021. Many of our property-level real estate loans have fixed interest rates which will not be impacted by any change in LIBOR. Certain of our other loans, including a majority of the borrowings under our $750.0 million senior credit facility and our borrowings under Safe Harbor’s $1.8 billion credit facility, have interest rates based on LIBOR. Each of our senior credit facility and Safe Harbor’s credit facility provides that the administrative agent in consultation with us will endeavor to determine an interest rate to replace the current LIBOR rate, and until the parties agree on a successor LIBOR rate we can continue to borrow under the credit facilities using the prime rate. The replacement of LIBOR with an alternative rate or benchmark may adversely affect our interest rates and result in higher borrowing costs. This could materially and adversely affect our results of operations, cash flows and liquidity.
21
SUN COMMUNITIES, INC.
Cybersecurity breaches and other disruptions could compromise our information and expose us to liability, which would cause our business and reputation to suffer.
We rely intensively on information technology to account for tenant transactions, manage the privacy of tenant data, communicate internally and externally, and analyze our financial and operating results. In the ordinary course of our business, we collect and store sensitive data, including our proprietary business information and that of our tenants, clients, vendors and employees in our facilities and on our network. In addition, we engage third party service providers that may have access to such information in connection with providing necessary information technology and security and other business services to us. This information may include personally identifiable information such as social security numbers, banking information and credit card information.
We address potential breaches or disclosure of this confidential information by implementing a variety of security measures intended to protect the confidentiality and security of this information including (among others) engaging reputable, recognized firms to help us design and maintain our information technology and data security systems, including testing and verification of their proper and secure operations on a periodic basis. We also maintain cyber risk insurance to provide some coverage for certain risks arising out of data and network breaches. Our senior leadership regularly updates the Board of Directors on security matters and meets at least annually to review program progress and plans, incidents if any, and emerging risks.
Despite our security measures, our information technology and infrastructure, as well as that of our third-party vendors, may be vulnerable to attacks by hackers (including through malware, ransomware, computer viruses, and email phishing schemes) or breached due to employee error, malfeasance, fire, flood or other physical event, or other disruptions. Any such breach or disruption could compromise our or a third-party vendor’s network and the information stored there could be accessed, publicly disclosed, lost or stolen. Any such access, disclosure or other loss of information could:
•
result in legal claims or proceedings,
•
disrupt our operations, including our ability to service our tenants and our ability to analyze and report our financial and operating results,
•
decrease our revenues,
•
damage our reputation,
•
cause a loss of confidence,
•
increase our insurance premiums, or
•
have other material adverse effects on our business.
We depend on continuous access to the internet to use our cloud-based applications. Damage to, or failure of our information technology systems, including as a result of any of the reasons described above, could adversely affect our results of operations as we may incur significant costs or data loss. We continually assess new and enhanced information technology solutions to manage the risk of system failure or interruption.
Losses in excess of our insurance coverage or uninsured losses could adversely affect our operating results and cash flow.
We have a significant concentration of MH and RV properties in Florida and California and marinas on coastlines, where natural disasters or other catastrophic events such as hurricanes, flash floods, sea-level rise, tornadoes, wildfires and earthquakes
could negatively impact our operating results and cash flows. We maintain comprehensive liability, fire, property, business interruption, general liability, and (where appropriate) flood and earthquake insurance, and other lines of insurance we have determined to be appropriate for our business, provided by reputable companies with commercially reasonable deductibles and limits. We believe the policy specifications and insured limits are appropriate and adequate given the relative risk of loss, the cost of the coverage and industry practice. However, certain types of losses including, but not limited to, riots or acts of war, may be either uninsurable or not economically insurable. In the event an uninsured loss occurs, we could lose both our investment in and anticipated profits and cash flow from the affected property. We would also continue to be obligated to repay any mortgage indebtedness or other obligations related to the community. If an uninsured liability to a third party were to occur, we would incur the cost of defense and settlement with, or court ordered damages to, that third party. A significant uninsured property or liability loss could have a material adverse effect on our business and our financial condition and results of operations.
22
SUN COMMUNITIES, INC.
Expanding social media platforms present new challenges.
Social media outlets continue to grow and expand, which presents us with new risks. Adverse content about us and our properties on social media platforms could result in damage to our reputation or brand. Improper posts by employees or others could result in disclosure of confidential or proprietary information regarding our operations.
Our operations are subject to regulation under various federal, state, and local laws and regulations that may expose us to significant costs and liabilities.
Our properties and the operations at them are subject to regulation under various federal, state and local laws and regulations. Compliance with laws and regulations that govern our operations may require expenditures and modifications of development plans and operations that could have a detrimental effect on the operations of our properties and our financial condition, results of operations and cash flows. There can be no assurance that the application of laws, regulations or policies, or changes in such laws, regulations and policies, will not occur in a manner that could have a detrimental effect on any property.
We may be adversely impacted by fluctuations in foreign currency exchange rates.
Our current and future investments in and operations of Canadian and Australian properties are or will be exposed to the effects of changes in the Canadian dollar and Australian dollar, respectively, against the U.S. dollar. Changes in foreign currency exchange rates cannot always be predicted; as a result, substantial unfavorable changes in exchange rates could have a material adverse effect on our financial condition and results of operations.
ITEM 1B. UNRESOLVED STAFF COMMENTS
None.
23
SUN COMMUNITIES, INC.
ITEM 2. PROPERTIES
As of December 31, 2020, our properties were located throughout the US and in Ontario, Canada and consisted of 276 MH communities, 136 RV resorts, 34 properties containing both MH and RV sites, and 106 marinas.
As of December 31, 2020, our properties contained an aggregate of 188,176 developed sites comprised of 96,688 developed MH sites, 27,564 annual RV sites (inclusive of both annual and seasonal usage rights), 25,043 transient RV sites and 38,881 wet slips and dry storage spaces. There are 10,025 additional MH and RV sites suitable for development. Most of our properties include amenities oriented toward family and retirement living. Of our 552 properties, 185 each have 300 or more developed sites, with the largest having 2,341 developed MH and RV sites. See “Real Estate and Accumulated Depreciation, Schedule III,” included in our Consolidated Financial Statements, for detail on properties that are encumbered.
As of December 31, 2020, our MH and RV properties had an occupancy rate of 97.3 percent excluding transient RV sites. Since January 1, 2020, the MH and RV properties have averaged an aggregate annual turnover of homes (where the home is moved out of the community) of approximately 2.8 percent and an average annual turnover of residents (where the resident-owned home is sold and remains within the community, typically without interruption of rental income) of approximately 6.7 percent. The average renewal rate for residents in our Rental Program was 69.5 percent for the year ended December 31, 2020.
We believe that our properties’ high amenity levels, customer service loyalty, and customer retention program contribute to low turnover and generally high occupancy rates. All of the properties provide residents with attractive amenities with most offering a clubhouse, a swimming pool, and laundry facilities. Many of the properties offer additional amenities such as sauna / whirlpool spas, tennis courts, shuffleboard, basketball courts, and / or exercise rooms. Many RV resorts offer incremental amenities including golf, pro shops, restaurants, zip lines, waterparks, watersports, and thematic experiences.
Our MH and RV properties are principally located in the mid-western, southern and Southeastern regions of the U.S., and Ontario, Canada. Our marinas are principally located in the northeastern, southern, mid-Atlantic, western and mid-western regions of the U.S, with the majority of such marinas concentrated in coastal regions and others located in various inland regions. We believe that geographic diversification helps to insulate the portfolio from regional economic influences. We have concentrated our properties within certain areas of the regions in order to achieve economies of scale in management and operation.
The following tables set forth certain information relating to our MH and RV properties as of December 31, 2020. The occupancy percentage includes MH sites and annual RV sites and excludes transient RV sites.
| Property Name | MH/RV | City | State |
MH and Annual RV Sites as of 12/31/2020
|
Transient RV Sites as of 12/31/2020
|
Occupancy as of 12/31/2020
|
Occupancy as of 12/31/2019
|
||||||||||||||||||||||
| UNITED STATES | |||||||||||||||||||||||||||||
| MIDWEST | |||||||||||||||||||||||||||||
| Michigan | |||||||||||||||||||||||||||||
| Academy / West Point | MH | Canton | MI | 441 | — | 98.0 | % | 98.2 | % | ||||||||||||||||||||
| Allendale Meadows Mobile Village | MH | Allendale | MI | 352 | — | 99.1 | % | 98.9 | % | ||||||||||||||||||||
| Alpine Meadows Mobile Village | MH | Grand Rapids | MI | 403 | — | 97.3 | % | 98.3 | % | ||||||||||||||||||||
| Apple Carr Village | MH | Muskegon | MI | 713 | — | 86.5 | % |
(1)
|
78.5 | % |
(1)
|
||||||||||||||||||
| Arbor Woods | MH | Ypsilanti | MI | 458 | — | 99.1 | % | 99.1 | % | ||||||||||||||||||||
| Brentwood Mobile Village | MH | Kentwood | MI | 195 | — | 99.5 | % | 97.4 | % | ||||||||||||||||||||
| Broadview Estates | MH | Davison | MI | 474 | — | 87.1 | % | 82.3 | % | ||||||||||||||||||||
| Brookside Village | MH | Kentwood | MI | 196 | — | 100.0 | % | 100.0 | % | ||||||||||||||||||||
| Byron Center Mobile Village | MH | Kentwood | MI | 143 | — | 98.6 | % | 97.9 | % | ||||||||||||||||||||
| Camelot Villa | MH | Macomb | MI | 712 | — | 98.6 | % | 99.0 | % | ||||||||||||||||||||
| Cider Mill Crossings | MH | Fenton | MI | 621 | — | 87.6 | % |
(1)
|
74.6 | % |
(1)
|
||||||||||||||||||
| Cider Mill Village | MH | Middleville | MI | 258 | — | 98.4 | % | 98.4 | % | ||||||||||||||||||||
| Country Acres Mobile Village | MH | Cadillac | MI | 182 | — | 95.1 | % | 95.1 | % | ||||||||||||||||||||
| Country Hills Village | MH | Hudsonville | MI | 239 | — | 99.6 | % | 99.6 | % | ||||||||||||||||||||
| Country Meadows Mobile Village | MH | Flat Rock | MI | 577 | — | 98.8 | % | 97.7 | % | ||||||||||||||||||||
| Country Meadows Village | MH | Caledonia | MI | 395 | — | 100.0 | % | 99.5 | % | ||||||||||||||||||||
| Creekwood Meadows | MH | Burton | MI | 336 | — | 99.1 | % | 94.0 | % | ||||||||||||||||||||
24
SUN COMMUNITIES, INC.
| Property Name | MH/RV | City | State |
MH and Annual RV Sites as of 12/31/2020
|
Transient RV Sites as of 12/31/2020
|
Occupancy as of 12/31/2020
|
Occupancy as of 12/31/2019
|
||||||||||||||||||||||
| Cutler Estates Mobile Village | MH | Grand Rapids | MI | 259 | — | 98.8 | % | 98.8 | % | ||||||||||||||||||||
| Dutton Mill Village | MH | Caledonia | MI | 307 | — | 99.3 | % | 99.7 | % | ||||||||||||||||||||
| East Village Estates | MH | Washington Twp. | MI | 708 | — | 99.9 | % | 98.6 | % | ||||||||||||||||||||
| Egelcraft | MH | Muskegon | MI | 458 | — | 97.8 | % | 97.4 | % | ||||||||||||||||||||
| Fisherman's Cove | MH | Flint Twp. | MI | 162 | — | 98.1 | % | 97.5 | % | ||||||||||||||||||||
| Frenchtown Villa / Elizabeth Woods | MH | Newport | MI | 1,140 | — | 99.2 | % | 94.6 | % | ||||||||||||||||||||
| Grand Mobile Estates | MH | Grand Rapids | MI | 219 | — | 98.2 | % | 96.8 | % | ||||||||||||||||||||
| Hamlin | MH | Webberville | MI | 230 | — | 98.7 | % | 95.7 | % | ||||||||||||||||||||
| Hickory Hills Village | MH | Battle Creek | MI | 283 | — | 99.6 | % | 97.5 | % | ||||||||||||||||||||
|
Hidden Ridge RV Resort
(2)
|
RV | Hopkins | MI | 196 | 139 | 100.0 | % | 100.0 | % | ||||||||||||||||||||
|
Highland Green Estates
|
MH | Highland | MI | 879 | — | 56.5 | % | N/A |
(4)
|
||||||||||||||||||||
| Holiday West Village | MH | Holland | MI | 341 | — | 99.7 | % | 100.0 | % | ||||||||||||||||||||
| Holly Village / Hawaiian Gardens | MH | Holly | MI | 425 | — | 97.9 | % | 96.2 | % | ||||||||||||||||||||
| Hunters Crossing | MH | Capac | MI | 114 | — | 100.0 | % | 98.2 | % | ||||||||||||||||||||
| Hunters Glen | MH | Wayland | MI | 396 | — | 98.7 | % | 97.2 | % | ||||||||||||||||||||
| Kensington Meadows | MH | Lansing | MI | 290 | — | 96.2 | % | 94.8 | % | ||||||||||||||||||||
| Kimberly Estates | MH | Newport | MI | 387 | — | 98.2 | % | 98.4 | % | ||||||||||||||||||||
| King's Court Mobile Village | MH | Traverse City | MI | 802 | — | 99.0 | % | 90.6 | % | ||||||||||||||||||||
| Knollwood Estates | MH | Allendale | MI | 161 | — | 96.9 | % | 97.5 | % | ||||||||||||||||||||
| Lafayette Place | MH | Warren | MI | 254 | — | 99.2 | % | 96.9 | % | ||||||||||||||||||||
| Lakeview | MH | Ypsilanti | MI | 392 | — | 99.0 | % | 98.5 | % | ||||||||||||||||||||
| Leisure Village | MH | Belmont | MI | 256 | — | 99.6 | % | 98.4 | % | ||||||||||||||||||||
| Lincoln Estates | MH | Holland | MI | 191 | — | 98.4 | % | 99.5 | % | ||||||||||||||||||||
| Meadow Lake Estates | MH | White Lake | MI | 425 | — | 99.3 | % | 98.6 | % | ||||||||||||||||||||
| Meadowbrook Estates | MH | Monroe | MI | 453 | — | 99.1 | % | 96.5 | % | ||||||||||||||||||||
| Meadowlands of Gibraltar | MH | Gibraltar | MI | 320 | — | 99.4 | % | 100.0 | % | ||||||||||||||||||||
| Northville Crossing | MH | Northville | MI | 756 | — | 99.7 | % | 99.1 | % | ||||||||||||||||||||
| Oak Island Village | MH | East Lansing | MI | 250 | — | 100.0 | % | 97.6 | % | ||||||||||||||||||||
|
Petoskey KOA RV Resort
(2)
|
RV | Petoskey | MI | 52 | 156 | 100.0 | % | 100.0 | % | ||||||||||||||||||||
|
Petoskey RV Resort
(2)
|
RV | Petoskey | MI | 9 | 144 | 100.0 | % | 100.0 | % | ||||||||||||||||||||
| Pinebrook Village | MH | Kentwood | MI | 185 | — | 98.9 | % | 97.8 | % | ||||||||||||||||||||
| Presidential Estates Mobile Village | MH | Hudsonville | MI | 364 | — | 99.2 | % | 97.8 | % | ||||||||||||||||||||
| Richmond Place | MH | Richmond | MI | 117 | — | 100.0 | % | 94.9 | % | ||||||||||||||||||||
| River Haven Village | MH | Grand Haven | MI | 721 | — | 96.1 | % | 90.7 | % | ||||||||||||||||||||
| Rudgate Clinton | MH | Clinton Township | MI | 667 | — | 99.3 | % | 98.4 | % | ||||||||||||||||||||
| Rudgate Manor | MH | Sterling Heights | MI | 931 | — | 98.8 | % | 97.6 | % | ||||||||||||||||||||
| Scio Farms Estates | MH | Ann Arbor | MI | 913 | — | 99.1 | % | 98.9 | % | ||||||||||||||||||||
| Sheffield Estates | MH | Auburn Hills | MI | 228 | — | 99.1 | % | 98.2 | % | ||||||||||||||||||||
| Shelby Forest | MH | Shelby Twp. | MI | 664 | — | 99.5 | % | 99.1 | % | ||||||||||||||||||||
| Shelby West | MH | Shelby Twp. | MI | 644 | — | 99.7 | % | 98.9 | % | ||||||||||||||||||||
|
Silver Creek RV Resort
(2)
|
RV | Mears | MI | 160 | 104 | 100.0 | % | 100.0 | % | ||||||||||||||||||||
| Silver Springs | MH | Clinton Township | MI | 547 | — | 100.0 | % | 98.7 | % | ||||||||||||||||||||
| Southwood Village | MH | Grand Rapids | MI | 394 | — | 99.7 | % | 99.0 | % | ||||||||||||||||||||
| St. Clair Place | MH | St. Clair | MI | 100 | — | 97.0 | % | 90.0 | % | ||||||||||||||||||||
| Sunset Ridge | MH | Portland | MI | 388 | — | 87.6 | % |
(1)
|
78.1 | % |
(1)
|
||||||||||||||||||
| Sycamore Village | MH | Mason | MI | 396 | — | 99.0 | % | 98.7 | % | ||||||||||||||||||||
| Tamarac Village | MH | Ludington | MI | 302 | — | 98.3 | % | 99.7 | % | ||||||||||||||||||||
|
Tamarac Village RV Resort
(2)
|
RV | Ludington | MI | 110 | 3 | 100.0 | % | 100.0 | % | ||||||||||||||||||||
| Timberline Estates | MH | Coopersville | MI | 296 | — | 98.3 | % | 96.6 | % | ||||||||||||||||||||
| Town & Country Mobile Village | MH | Traverse City | MI | 192 | — | 99.0 | % | 99.0 | % | ||||||||||||||||||||
| Troy Villa | MH | Troy | MI | 282 | — | 86.9 | % | N/A |
(4)
|
||||||||||||||||||||
25
SUN COMMUNITIES, INC.
| Property Name | MH/RV | City | State |
MH and Annual RV Sites as of 12/31/2020
|
Transient RV Sites as of 12/31/2020
|
Occupancy as of 12/31/2020
|
Occupancy as of 12/31/2019
|
||||||||||||||||||||||
| Warren Dunes Village | MH | Bridgman | MI | 314 | — | 98.7 | % | 89.2 | % |
(1)
|
|||||||||||||||||||
| Waverly Shores Village | MH | Holland | MI | 415 | — | 100.0 | % | 100.0 | % | ||||||||||||||||||||
| West Village Estates | MH | Romulus | MI | 628 | — | 98.9 | % | 99.0 | % | ||||||||||||||||||||
| White Lake Mobile Home Village | MH | White Lake | MI | 315 | — | 98.4 | % | 98.7 | % | ||||||||||||||||||||
| Windham Hills Estates | MH | Jackson | MI | 469 | — | 98.3 | % | 95.5 | % | ||||||||||||||||||||
| Windsor Woods Village | MH | Wayland | MI | 314 | — | 99.7 | % | 99.7 | % | ||||||||||||||||||||
| Woodhaven Place | MH | Woodhaven | MI | 220 | — | 100.0 | % | 98.6 | % | ||||||||||||||||||||
| Michigan Total | 29,086 | 546 | 96.6 | % | 96.0 | % | |||||||||||||||||||||||
| Indiana | |||||||||||||||||||||||||||||
| Brookside Mobile Home Village | MH | Goshen | IN | 570 | — | 97.2 | % | 95.6 | % | ||||||||||||||||||||
| Carrington Pointe | MH | Fort Wayne | IN | 468 | — | 85.5 | % |
(1)
|
83.3 | % |
(1)
|
||||||||||||||||||
| Clear Water Mobile Village | MH | South Bend | IN | 227 | — | 97.4 | % | 95.2 | % | ||||||||||||||||||||
| Cobus Green Mobile Home Park | MH | Osceola | IN | 386 | — | 98.2 | % | 96.6 | % | ||||||||||||||||||||
| Deerfield Run | MH | Anderson | IN | 175 | — | 93.1 | % | 93.7 | % | ||||||||||||||||||||
| Four Seasons | MH | Elkhart | IN | 218 | — | 98.2 | % | 95.0 | % | ||||||||||||||||||||
|
Jellystone Park™ at Barton Lake
(2)
|
RV | Fremont | IN | — | 555 | N/A | N/A |
(4)
|
|||||||||||||||||||||
|
Lake Rudolph Campground & RV Resort
(2)
|
RV | Santa Claus | IN | — | 534 | N/A | N/A | ||||||||||||||||||||||
| Liberty Farm | MH | Valparaiso | IN | 220 | — | 95.9 | % | 95.9 | % | ||||||||||||||||||||
| Pebble Creek | MH | Greenwood | IN | 296 | — | 98.6 | % | 93.2 | % | ||||||||||||||||||||
| Pine Hills | MH | Middlebury | IN | 129 | — | 98.4 | % | 98.4 | % | ||||||||||||||||||||
| Roxbury Park | MH | Goshen | IN | 398 | — | 97.7 | % | 98.2 | % | ||||||||||||||||||||
| Indiana Total | 3,087 | 1,089 | 95.6 | % | 93.9 | % | |||||||||||||||||||||||
| Ohio | |||||||||||||||||||||||||||||
| Apple Creek | MH | Amelia | OH | 176 | — | 99.4 | % | 98.3 | % | ||||||||||||||||||||
| East Fork Crossing | MH | Batavia | OH | 350 | — | 99.7 | % | 99.4 | % | ||||||||||||||||||||
|
Indian Creek RV & Camping Resort
(2)
|
RV | Geneva on the Lake | OH | 445 | 135 | 100.0 | % | 100.0 | % | ||||||||||||||||||||
| Oakwood Village | MH | Miamisburg | OH | 511 | — | 98.6 | % | 98.2 | % | ||||||||||||||||||||
| Orchard Lake | MH | Milford | OH | 147 | — | 97.3 | % | 97.3 | % | ||||||||||||||||||||
| Westbrook Senior Village | MH | Toledo | OH | 112 | — | 100.0 | % | 100.0 | % | ||||||||||||||||||||
| Westbrook Village | MH | Toledo | OH | 344 | — | 98.3 | % | 98.8 | % | ||||||||||||||||||||
| Willowbrook Place | MH | Toledo | OH | 266 | — | 99.2 | % | 98.1 | % | ||||||||||||||||||||
| Woodside Terrace | MH | Holland | OH | 439 | — | 96.8 | % | 93.8 | % | ||||||||||||||||||||
| Ohio Total | 2,790 | 135 | 98.7 | % | 98.1 | % | |||||||||||||||||||||||
| SOUTH | |||||||||||||||||||||||||||||
| Texas | |||||||||||||||||||||||||||||
|
Austin Lone Star RV Resort
(2)
|
RV | Austin | TX | 55 | 102 | 100.0 | % | 100.0 | % | ||||||||||||||||||||
|
Blazing Star
(2)
|
RV | San Antonio | TX | 117 | 145 | 100.0 | % | 100.0 | % | ||||||||||||||||||||
| Boulder Ridge | MH | Pflugerville | TX | 1,220 | — | 97.1 | % |
(1)
|
78.9 | % |
(1)
|
||||||||||||||||||
| Branch Creek Estates | MH | Austin | TX | 400 | — | 100.0 | % | 98.0 | % | ||||||||||||||||||||
| Chisholm Point Estates | MH | Pflugerville | TX | 427 | — | 99.3 | % | 97.7 | % | ||||||||||||||||||||
| Comal Farms | MH | New Braunfels | TX | 367 | — | 98.6 | % | 99.7 | % | ||||||||||||||||||||
|
Hill Country Cottage and RV Resort
(2)
|
RV | New Braunfels | TX | 67 | 302 | 100.0 | % |
|
100.0 | % | |||||||||||||||||||
|
Jellystone Park™ at Guadalupe River
(2)
|
RV | Kerrville | TX | — | 251 | N/A | N/A | ||||||||||||||||||||||
|
Jellystone Park™ at Hill Country
(2)
|
RV | Canyon Lake | TX | — | 167 | N/A | N/A | ||||||||||||||||||||||
|
La Hacienda RV Resort
(2)
|
RV | Austin | TX | 48 | 196 | N/A | N/A | ||||||||||||||||||||||
|
Lone Star Jellystone Park
(2)
|
RV | Waller | TX | — | 345 | N/A | N/A |
(4)
|
|||||||||||||||||||||
| Oak Crest | MH | Austin | TX | 654 | — | 94.2 | % | 76.3 | % |
(1)
|
|||||||||||||||||||
| Pecan Branch | MH | Georgetown | TX | 229 | — | 86.0 | % |
(1)
|
78.6 | % |
(1)
|
||||||||||||||||||
26
SUN COMMUNITIES, INC.
| Property Name | MH/RV | City | State |
MH and Annual RV Sites as of 12/31/2020
|
Transient RV Sites as of 12/31/2020
|
Occupancy as of 12/31/2020
|
Occupancy as of 12/31/2019
|
||||||||||||||||||||||
| Pine Trace | MH | Houston | TX | 680 | — | 98.5 | % | 98.4 | % | ||||||||||||||||||||
| River Ranch | MH | Austin | TX | 848 | — | 97.6 | % | 98.5 | % | ||||||||||||||||||||
| River Ridge Estates | MH | Austin | TX | 515 | — | 99.2 | % | 99.4 | % | ||||||||||||||||||||
| Saddlebrook | MH | San Marcos | TX | 562 | — | 99.1 | % | 97.9 | % | ||||||||||||||||||||
| Sandy Lake | MH | Carrollton | TX | 54 | — | 100.0 | % | 98.1 | % | ||||||||||||||||||||
|
Sandy Lake RV Resort
(2)
|
RV | Carrollton | TX | 155 | 65 | 100.0 | % | 100.0 | % | ||||||||||||||||||||
| Stonebridge | MH | San Antonio | TX | 335 | — | 99.1 | % | 96.7 | % | ||||||||||||||||||||
| Summit Ridge | MH | Converse | TX | 446 | — | 99.1 | % | 96.2 | % | ||||||||||||||||||||
| Sunset Ridge | MH | Kyle | TX | 171 | — | 97.1 | % | 98.2 | % | ||||||||||||||||||||
| Travelers World | MH | San Antonio | TX | 8 | — | 100.0 | % | 100.0 | % | ||||||||||||||||||||
|
Travelers World RV Resort
(2)
|
RV | San Antonio | TX | 22 | 133 | 100.0 | % | 100.0 | % | ||||||||||||||||||||
|
Treetops RV Resort
(2)
|
RV | Arlington | TX | 70 | 104 | 100.0 | % | 100.0 | % | ||||||||||||||||||||
| Woodlake Trails | MH | San Antonio | TX | 316 | — | 90.5 | % |
(1)
|
82.0 | % |
(1)
|
||||||||||||||||||
| Texas Total | 7,766 | 1,810 | 97.5 | % | 92.0 | % | |||||||||||||||||||||||
| SOUTHEAST | |||||||||||||||||||||||||||||
| Florida | |||||||||||||||||||||||||||||
|
Arbor Terrace RV Park
(2)
|
RV | Brandenton | FL | 250 | 111 | 100.0 | % | 100.0 | % | ||||||||||||||||||||
| Ariana Village | MH | Lakeland | FL | 207 | — | 98.6 | % | 98.6 | % | ||||||||||||||||||||
| Bahia Vista Estates | MH | Sarasota | FL | 251 | — | 99.6 | % | 99.6 | % | ||||||||||||||||||||
|
Baker Acres RV Resort
(2)
|
RV | Zephyrhills | FL | 281 | 71 | 100.0 | % | 100.0 | % | ||||||||||||||||||||
|
Big Tree RV Resort
(2)
|
RV | Arcadia | FL | 344 | 67 | 100.0 | % | 100.0 | % | ||||||||||||||||||||
| Blue Heron Pines | MH | Punta Gorda | FL | 408 | — | 98.3 | % | 97.1 | % | ||||||||||||||||||||
| Blue Jay | MH | Dade City | FL | 206 | — | 99.5 | % | 99.5 | % | ||||||||||||||||||||
|
Blue Jay RV Resort
(2)
|
RV | Dade City | FL | 32 | 21 | 100.0 | % | 100.0 | % | ||||||||||||||||||||
|
Blueberry Hill
(2)
|
RV | Bushnell | FL | 310 | 95 | 100.0 | % | 100.0 | % | ||||||||||||||||||||
| Brentwood Estates | MH | Hudson | FL | 191 | — | 98.4 | % | 99.0 | % | ||||||||||||||||||||
| Buttonwood Bay | MH | Sebring | FL | 407 | — | 99.0 | % | 99.5 | % | ||||||||||||||||||||
|
Buttonwood Bay RV Resort
(2)
|
RV | Sebring | FL | 361 | 171 | 100.0 | % | 100.0 | % | ||||||||||||||||||||
| Candlelight Manor | MH | South Daytona | FL | 128 | — | 99.2 | % | 96.1 | % | ||||||||||||||||||||
| Carriage Cove | MH | Sanford | FL | 467 | — | 100.0 | % | 99.6 | % | ||||||||||||||||||||
| Central Park | MH | Haines City | FL | 114 | — | 90.4 | % | 90.3 | % | ||||||||||||||||||||
|
Central Park Resort RV Resort
(2)
|
RV | Haines City | FL | 193 | 171 | 100.0 | % | 100.0 | % | ||||||||||||||||||||
|
Citrus Hill RV Resort
(2)
|
RV | Dade City | FL | 134 | 48 | 100.0 | % | 100.0 | % | ||||||||||||||||||||
|
Club Naples
(2)
|
RV | Naples | FL | 219 | 85 | 100.0 | % | 100.0 | % | ||||||||||||||||||||
| Club Wildwood | MH | Hudson | FL | 478 | — | 100.0 | % | 99.8 | % | ||||||||||||||||||||
| Colony in the Wood | MH | Port Orange | FL | 383 | — | 99.0 | % | 98.4 | % | ||||||||||||||||||||
|
Compass RV Resort
(2)
|
RV | St. Augustine | FL | — | 175 | N/A | N/A | ||||||||||||||||||||||
| Country Squire | MH | Paisley | FL | 97 | — | 99.0 | % | 97.9 | % | ||||||||||||||||||||
|
Country Squire RV Resort
(2)
|
RV | Paisley | FL | 23 | 2 | 100.0 | % | 100.0 | % | ||||||||||||||||||||
| Cypress Greens | MH | Lake Alfred | FL | 259 | — | 98.5 | % | 98.1 | % | ||||||||||||||||||||
|
Daytona Beach RV Resort
(2)
|
RV | Port Orange | FL | 135 | 97 | 100.0 | % | 100.0 | % | ||||||||||||||||||||
| Deerwood | MH | Orlando | FL | 569 | — | 98.1 | % | 99.5 | % | ||||||||||||||||||||
|
Dunedin RV Resort
(2)
|
RV | Dunedin | FL | 194 | 45 | 100.0 | % | 100.0 | % | ||||||||||||||||||||
|
Ellenton Gardens RV Resort
(2)
|
RV | Ellenton | FL | 151 | 43 | 100.0 | % | 100.0 | % | ||||||||||||||||||||
| Emerald Coast | MH | Panama City Beach | FL | 42 | — | 95.2 | % | 92.9 | % | ||||||||||||||||||||
|
Emerald Coast RV Resort
(2)
|
RV | Panama City Beach | FL | — | 159 | 100.0 | % | 100.0 | % | ||||||||||||||||||||
| Fairfield Village | MH | Ocala | FL | 293 | — | 99.7 | % | 98.6 | % | ||||||||||||||||||||
|
Flamingo Lake RV Resort
(2)
|
RV | Jacksonville | FL | — | 422 | N/A | N/A |
(4)
|
|||||||||||||||||||||
| Forest View | MH | Homosassa | FL | 300 | — | 98.7 | % | 98.7 | % | ||||||||||||||||||||
| Glen Haven | MH | Zephyrhills | FL | 52 | — | 100.0 | % | 98.1 | % | ||||||||||||||||||||
27
SUN COMMUNITIES, INC.
| Property Name | MH/RV | City | State |
MH and Annual RV Sites as of 12/31/2020
|
Transient RV Sites as of 12/31/2020
|
Occupancy as of 12/31/2020
|
Occupancy as of 12/31/2019
|
||||||||||||||||||||||
|
Glen Haven RV Resort
(2)
|
RV | Zephyrhills | FL | 165 | 53 | 100.0 | % | 100.0 | % | ||||||||||||||||||||
| Goldcoaster | MH | Homestead | FL | 527 | — | 99.6 | % | 99.8 | % | ||||||||||||||||||||
|
Goldcoaster RV Resort
(2)
|
RV | Homestead | FL | 9 | 9 | 100.0 | % | 100.0 | % | ||||||||||||||||||||
| Grand Bay | MH | Dunedin | FL | 134 | — | 100.0 | % | 99.3 | % | ||||||||||||||||||||
|
Grand Lakes RV Resort
(2)
|
RV | Citra | FL | 304 | 104 | 100.0 | % | 100.0 | % | ||||||||||||||||||||
|
Grove Ridge RV Resort
(2)
|
RV | Dade City | FL | 163 | 83 | 100.0 | % | 100.0 | % | ||||||||||||||||||||
|
Groves RV Resort
(2)
|
RV | Fort Myers | FL | 234 | 35 | 100.0 | % | 100.0 | % | ||||||||||||||||||||
| Gulfstream Harbor | MH | Orlando | FL | 974 | — | 99.6 | % | 99.2 | % | ||||||||||||||||||||
| Hacienda Del Rio | MH | Edgewater | FL | 730 | — | 98.8 | % | 98.9 | % | ||||||||||||||||||||
|
Hidden River RV Resort
(2)
|
RV | Riverview | FL | 188 | 125 | 100.0 | % | 100.0 | % | ||||||||||||||||||||
| Holly Forest Estates | MH | Holly Hill | FL | 402 | — | 100.0 | % | 100.0 | % | ||||||||||||||||||||
|
Homosassa River RV Resort
(2)
|
RV | Homosassa Springs | FL | 126 | 98 | 100.0 | % | 100.0 | % | ||||||||||||||||||||
|
Horseshoe Cove RV Resort
(2)
|
RV | Bradenton | FL | 340 | 136 | 100.0 | % | 100.0 | % | ||||||||||||||||||||
| Indian Creek Park | MH | Ft. Myers Beach | FL | 353 | — | 100.0 | % | 99.7 | % | ||||||||||||||||||||
|
Indian Creek RV Park
(2)
|
RV | Ft. Myers Beach | FL | 957 | 120 | 100.0 | % | 100.0 | % | ||||||||||||||||||||
| Island Lakes | MH | Merrit Island | FL | 301 | — | 100.0 | % | 100.0 | % | ||||||||||||||||||||
| King’s Lake | MH | DeBary | FL | 245 | — | 100.0 | % | 100.0 | % | ||||||||||||||||||||
| Kings Manor | MH | Lakeland | FL | 239 | — | 96.7 | % | 95.8 | % | ||||||||||||||||||||
| King’s Pointe | MH | Lake Alfred | FL | 226 | — | 99.6 | % | 98.7 | % | ||||||||||||||||||||
| Kissimmee Gardens | MH | Kissimmee | FL | 239 | — | 100.0 | % | 100.0 | % | ||||||||||||||||||||
| Kissimmee South | MH | Davenport | FL | 142 | — | 90.8 | % | 91.5 | % | ||||||||||||||||||||
|
Kissimmee South RV Resort
(2)
|
RV | Davenport | FL | 130 | 71 | 100.0 | % | 100.0 | % | ||||||||||||||||||||
| La Costa Village | MH | Port Orange | FL | 658 | — | 100.0 | % | 100.0 | % | ||||||||||||||||||||
|
Lake Josephine RV Resort
(2)
|
RV | Sebring | FL | 120 | 58 | 100.0 | % | 100.0 | % | ||||||||||||||||||||
| Lake Juliana Landings | MH | Auburndale | FL | 274 | — | 98.2 | % | 98.2 | % | ||||||||||||||||||||
| Lake Pointe Village | MH | Mulberry | FL | 362 | — | 99.4 | % | 99.4 | % | ||||||||||||||||||||
|
Lake San Marino RV Park
(2)
|
RV | Naples | FL | 244 | 163 | 100.0 | % | 100.0 | % | ||||||||||||||||||||
|
Lakeland RV Resort
(2)
|
RV | Lakeland | FL | 202 | 29 | 100.0 | % | 100.0 | % | ||||||||||||||||||||
| Lakeshore Landings | MH | Orlando | FL | 306 | — | 100.0 | % | 99.3 | % | ||||||||||||||||||||
| Lakeshore Villas | MH | Tampa | FL | 280 | — | 98.6 | % | 99.6 | % | ||||||||||||||||||||
| Lamplighter | MH | Port Orange | FL | 259 | — | 100.0 | % | 99.2 | % | ||||||||||||||||||||
|
Majestic Oaks RV Resort
(2)
|
RV | Zephyrhills | FL | 219 | 35 | 100.0 | % | 100.0 | % | ||||||||||||||||||||
|
Marco Naples RV Resort
(2)
|
RV | Naples | FL | 187 | 114 | 100.0 | % | 100.0 | % | ||||||||||||||||||||
| Meadowbrook Village | MH | Tampa | FL | 257 | — | 100.0 | % | 100.0 | % | ||||||||||||||||||||
| Mill Creek | MH | Kissimmee | FL | 34 | — | 88.2 | % | 91.2 | % | ||||||||||||||||||||
|
Mill Creek RV Resort
(2)
|
RV | Kissimmee | FL | 136 | 20 | 100.0 | % | 100.0 | % | ||||||||||||||||||||
| Mouse Mountain Resort | MH | Davenport | FL | 44 | — | 97.7 | % | N/A |
(4)
|
||||||||||||||||||||
|
Mouse Mountain RV Resort
(2)
|
RV | Davenport | FL | 116 | 144 | 100.0 | % | N/A |
(4)
|
||||||||||||||||||||
|
Naples RV Resort
(2)
|
RV | Naples | FL | 106 | 61 | 100.0 | % | 100.0 | % | ||||||||||||||||||||
| New Ranch | MH | Clearwater | FL | 94 | — | 97.9 | % | 97.9 | % | ||||||||||||||||||||
|
North Lake Estates
(2)
|
RV | Moor Haven | FL | 191 | 81 | 100.0 | % | 100.0 | % | ||||||||||||||||||||
| Oakview Estates | MH | Arcatia | FL | 119 | — | 100.0 | % | 100.0 | % | ||||||||||||||||||||
| Ocean Breeze | MH | Marathon | FL | 47 | — | 31.9 | % |
(1)(5)
|
8.5 | % |
(1)(5)
|
||||||||||||||||||
| Ocean Breeze RV Resort | RV | Marathon | FL | — | — | — | % |
(5)
|
— | % |
(5)
|
||||||||||||||||||
| Ocean Breeze - Jensen Beach | MH | Jensen Beach | FL | 284 | — | 73.6 | % |
(1)
|
76.2 | % |
(1)
|
||||||||||||||||||
|
Ocean Breeze - Jensen Beach RV Resort
(2)
|
RV | Jensen Beach | FL | 95 | 110 | 100.0 | % | 100.0 | % | ||||||||||||||||||||
| Orange City | MH | Orange City | FL | 4 | — | 100.0 | % | 100.0 | % | ||||||||||||||||||||
|
Orange City RV Resort
(2)
|
RV | Orange City | FL | 409 | 112 | 100.0 | % | 100.0 | % | ||||||||||||||||||||
| Orange Tree Village | MH | Orange City | FL | 246 | — | 99.2 | % | 100.0 | % | ||||||||||||||||||||
| Paddock Park South | MH | Ocala | FL | 188 | — | 79.8 | % | 79.3 | % | ||||||||||||||||||||
| Palm Key Village | MH | Davenport | FL | 204 | — | 100.0 | % | 100.0 | % | ||||||||||||||||||||
28
SUN COMMUNITIES, INC.
| Property Name | MH/RV | City | State |
MH and Annual RV Sites as of 12/31/2020
|
Transient RV Sites as of 12/31/2020
|
Occupancy as of 12/31/2020
|
Occupancy as of 12/31/2019
|
||||||||||||||||||||||
| Palm Village | MH | Bradenton | FL | 146 | — | 100.0 | % | 100.0 | % | ||||||||||||||||||||
| Park Place | MH | Sebastian | FL | 475 | — | 96.2 | % | 94.9 | % | ||||||||||||||||||||
| Park Royale | MH | Pinellas Park | FL | 309 | — | 100.0 | % | 100.0 | % | ||||||||||||||||||||
|
Pecan Park RV Resort
(2)
|
RV | Jacksonville | FL | 45 | 296 | 100.0 | % | 100.0 | % | ||||||||||||||||||||
| Pelican Bay | MH | Micco | FL | 216 | — | 99.1 | % | 98.6 | % | ||||||||||||||||||||
|
Pelican RV Resort & Marina
(2)
|
RV | Marathon | FL | 62 | 23 | 100.0 | % | 100.0 | % | ||||||||||||||||||||
|
Pleasant Lake RV Resort
(2)
|
RV | Jacksonville | FL | 292 | 49 | 100.0 | % | 100.0 | % | ||||||||||||||||||||
| Rainbow | MH | Frostproof | FL | 37 | — | 100.0 | % | 100.0 | % | ||||||||||||||||||||
|
Rainbow RV Resort
(2)
|
RV | Frostproof | FL | 401 | 61 | 100.0 | % | 100.0 | % | ||||||||||||||||||||
|
Rainbow Village of Largo
(2)
|
RV | Largo | FL | 251 | 58 | 100.0 | % | 100.0 | % | ||||||||||||||||||||
|
Rainbow Village of Zephyrhills
(2)
|
RV | Zephyrhills | FL | 344 | 38 | 100.0 | % | 100.0 | % | ||||||||||||||||||||
| Red Oaks | MH | Bushnell | FL | 103 | — | 93.2 | % | 92.2 | % | ||||||||||||||||||||
|
Red Oaks RV Resort
(2)
|
RV | Bushnell | FL | 507 | 410 | 100.0 | % | 100.0 | % | ||||||||||||||||||||
| Regency Heights | MH | Clearwater | FL | 391 | — | 99.0 | % | 98.2 | % | ||||||||||||||||||||
|
Riptide RV Resort & Marina
(2)
|
RV | Key Largo | FL | 21 | 17 | 100.0 | % | 100.0 | % | ||||||||||||||||||||
| Riverside Club | MH | Ruskin | FL | 728 | — | 86.4 | % | 84.2 | % | ||||||||||||||||||||
|
Rock Crusher Canyon RV Resort
(2)
|
RV | Crystal River | FL | 202 | 193 | 100.0 | % | 100.0 | % | ||||||||||||||||||||
| Royal Country | MH | Miami | FL | 864 | — | 99.9 | % | 99.9 | % | ||||||||||||||||||||
| Royal Palm Village | MH | Haines City | FL | 395 | — | 86.1 | % | 84.3 | % | ||||||||||||||||||||
| Saddle Oak Club | MH | Ocala | FL | 376 | — | 99.7 | % | 99.7 | % | ||||||||||||||||||||
| San Pedro Marina | MH | Islamorada | FL | — | — | — | % |
(5)
|
— | % |
(5)
|
||||||||||||||||||
|
San Pedro RV Resort & Marina
(2)
|
RV | Islamorada | FL | — | — | — | % |
(5)
|
— | % |
(5)
|
||||||||||||||||||
| Saralake Estates | MH | Sarasota | FL | 202 | — | 99.5 | % | 100.0 | % | ||||||||||||||||||||
| Savanna Club | MH | Port St. Lucie | FL | 1,069 | — | 98.5 | % | 98.4 | % | ||||||||||||||||||||
| Seabreeze | MH | Islamorada | FL | — | — | — | % |
(5)
|
— | % |
(5)
|
||||||||||||||||||
|
Seabreeze RV Resort
(2)
|
RV | Islamorada | FL | — | — | — | % |
(5)
|
— | % |
(5)
|
||||||||||||||||||
| Serendipity | MH | North Fort Myers | FL | 338 | — | 97.9 | % | 97.9 | % | ||||||||||||||||||||
|
Settler's Rest RV Resort
(2)
|
RV | Zephyrhills | FL | 296 | 82 | 100.0 | % | 100.0 | % | ||||||||||||||||||||
| Shadow Wood Village | MH | Hudson | FL | 215 | — | 87.0 | % |
(1)
|
73.0 | % |
(1)
|
||||||||||||||||||
| Shady Road Villas | MH | Ocala | FL | 130 | — | 85.4 | % | 70.0 | % | ||||||||||||||||||||
| Shell Creek Marina | MH | Punta Gorda | FL | 54 | — | 98.1 | % | 98.1 | % | ||||||||||||||||||||
|
Shell Creek RV Resort & Marina
(2)
|
RV | Punta Gorda | FL | 150 | 35 | 100.0 | % | 100.0 | % | ||||||||||||||||||||
|
Siesta Bay RV Park
(2)
|
RV | Fort Myers | FL | 738 | 59 | 100.0 | % | 100.0 | % | ||||||||||||||||||||
| Southern Charm | MH | Zephyrhills | FL | 1 | — | 100.0 | % | 100.0 | % | ||||||||||||||||||||
|
Southern Charm RV Resort
(2)
|
RV | Zephyrhills | FL | 400 | 96 | 100.0 | % | 100.0 | % | ||||||||||||||||||||
| Southern Pines | MH | Bradenton | FL | 107 | — | 96.3 | % | 97.2 | % | ||||||||||||||||||||
| Southport Springs Golf & Country Club | MH | Zephyrhills | FL | 547 | — | 99.3 | % | 98.9 | % | ||||||||||||||||||||
| Spanish Main | MH | Thontosassa | FL | 56 | — | 87.5 | % | 87.5 | % | ||||||||||||||||||||
|
Spanish Main RV Resort
(2)
|
RV | Thontosassa | FL | 235 | 44 | 100.0 | % | 100.0 | % | ||||||||||||||||||||
| Stonebrook | MH | Homosassa | FL | 215 | — | 93.5 | % | 92.1 | % | ||||||||||||||||||||
|
Sun N Fun RV Resort
(2)
|
RV | Sarasota | FL | 1,026 | 493 | 100.0 | % | 100.0 | % | ||||||||||||||||||||
| Suncoast Gateway | MH | Port Richey | FL | 173 | — | 98.8 | % | 98.8 | % | ||||||||||||||||||||
| Sundance | MH | Zephyrhills | FL | 332 | — | 100.0 | % | 100.0 | % | ||||||||||||||||||||
| Sunlake Estates | MH | Grand Island | FL | 408 | — | 97.1 | % | 96.1 | % | ||||||||||||||||||||
| Sunset Harbor at Cow Key Marina | MH | Key West | FL | 77 | — | 98.7 | % | 98.7 | % | ||||||||||||||||||||
|
Sweetwater RV Resort
(2)
|
RV | Zephyrhills | FL | 207 | 84 | 100.0 | % | 100.0 | % | ||||||||||||||||||||
| Tallowwood Isle | MH | Coconut Creek | FL | 274 | — | 95.6 | % | 95.6 | % | ||||||||||||||||||||
| Tampa East | MH | Dover | FL | 31 | — | 100.0 | % | 100.0 | % | ||||||||||||||||||||
|
Tampa East RV Resort
(2)
|
RV | Dover | FL | 502 | 167 | 100.0 | % | 100.0 | % | ||||||||||||||||||||
| The Hamptons Golf & Country Club | MH | Auburndale | FL | 829 | — | 99.0 | % | 98.6 | % | ||||||||||||||||||||
| The Hideaway | MH | Key West | FL | 13 | — | 92.3 | % | 84.6 | % | ||||||||||||||||||||
29
SUN COMMUNITIES, INC.
| Property Name | MH/RV | City | State |
MH and Annual RV Sites as of 12/31/2020
|
Transient RV Sites as of 12/31/2020
|
Occupancy as of 12/31/2020
|
Occupancy as of 12/31/2019
|
||||||||||||||||||||||
| The Hills | MH | Apopka | FL | 97 | — | 100.0 | % | 100.0 | % | ||||||||||||||||||||
| The Landings at Lake Henry | MH | Haines City | FL | 394 | — | 99.7 | % | 99.2 | % | ||||||||||||||||||||
| The Ridge | MH | Davenport | FL | 481 | — | 99.4 | % | 99.0 | % | ||||||||||||||||||||
| The Valley | MH | Apopka | FL | 148 | — | 100.0 | % | 100.0 | % | ||||||||||||||||||||
|
Three Lakes
(2)
|
RV | Hudson | FL | 245 | 62 | 100.0 | % | 100.0 | % | ||||||||||||||||||||
| Vista del Lago | MH | Bradenton | FL | 136 | — | 99.3 | % | 97.8 | % | ||||||||||||||||||||
|
Vista del Lago RV Resort
(2)
|
RV | Bradenton | FL | 35 | 5 | 100.0 | % | 100.0 | % | ||||||||||||||||||||
| Vizcaya Lakes | MH | Port Charlotte | FL | 108 | — | 92.6 | % | 91.7 | % | ||||||||||||||||||||
| Walden Woods | MH | Homosassa | FL | 213 | — | 100.0 | % | 100.0 | % | ||||||||||||||||||||
| Walden Woods II | MH | Homosassa | FL | 213 | — | 100.0 | % | 99.1 | % | ||||||||||||||||||||
| Water Oak Country Club Estates | MH | Lady Lake | FL | 1,310 | — | 93.6 | % | 91.9 | % |
(1)
|
|||||||||||||||||||
|
Waters Edge RV Resort
(2)
|
RV | Zephyrhills | FL | 141 | 76 | 100.0 | % | 100.0 | % | ||||||||||||||||||||
| Westside Ridge | MH | Auburndale | FL | 219 | — | 99.1 | % | 99.5 | % | ||||||||||||||||||||
| Windmill Village | MH | Davenport | FL | 509 | — | 99.6 | % | 99.6 | % | ||||||||||||||||||||
| Woodlands at Church Lake | MH | Groveland | FL | 291 | — | 81.8 | % | 78.4 | % | ||||||||||||||||||||
|
Woodsmoke Camping Resort
(2)
|
RV | Fort Myers | FL | 181 | 119 | 100.0 | % | N/A |
(4)
|
||||||||||||||||||||
| Florida Total | 39,803 | 6,011 | 98.1 | % | 97.7 | % | |||||||||||||||||||||||
| SOUTHWEST | |||||||||||||||||||||||||||||
| California | |||||||||||||||||||||||||||||
|
49'er Village RV Resort
(2)
|
RV | Plymouth | CA | 61 | 266 | 100.0 | % | 100.0 | % | ||||||||||||||||||||
| Alta Laguna | MH | Rancho Cucamonga | CA | 296 | — | 99.7 | % | 99.3 | % | ||||||||||||||||||||
| Caliente Sands | MH | Cathedral City | CA | 118 | — | 98.3 | % | 98.3 | % | ||||||||||||||||||||
|
Cava Robles RV Resort
(2)
|
RV | Paso Robles | CA | — | 332 | N/A | N/A | ||||||||||||||||||||||
|
Chula Vista RV Resort
(2)
|
RV | San Diego | CA | — | 237 | N/A | N/A | ||||||||||||||||||||||
|
El Capitan Canyon
(2)
|
RV | Goleta | CA | — | 163 | N/A | N/A |
(4)
|
|||||||||||||||||||||
| Friendly Village of La Habra | MH | La Habra | CA | 330 | — | 100.0 | % | 99.7 | % | ||||||||||||||||||||
| Friendly Village of Modesto | MH | Modesto | CA | 289 | — | 99.0 | % | 98.6 | % | ||||||||||||||||||||
| Friendly Village of Simi | MH | Simi Valley | CA | 222 | — | 100.0 | % | 100.0 | % | ||||||||||||||||||||
| Friendly Village of West Covina | MH | West Covina | CA | 157 | — | 100.0 | % | 100.0 | % | ||||||||||||||||||||
| Forest Springs | MH | Grass Valley | CA | 373 | 86.6 | % |
(1)
|
N/A |
(4)
|
||||||||||||||||||||
| Heritage | MH | Temecula | CA | 196 | — | 99.5 | % | 100.0 | % | ||||||||||||||||||||
|
Indian Wells RV Resort
(2)
|
RV | Indio | CA | 163 | 175 | 100.0 | % | 100.0 | % | ||||||||||||||||||||
|
Jellystone Park™ at Tower Park
(2)
|
RV | Lodi | CA | — | 360 | N/A | N/A | ||||||||||||||||||||||
| Lakefront | MH | Lakeside | CA | 295 | — | 100.0 | % | 100.0 | % | ||||||||||||||||||||
| Lakeview Mobile Estates | MH | Yucaipa | CA | 296 | — | 100.0 | % | N/A |
(4)
|
||||||||||||||||||||
| Lazy J Ranch | MH | Arcata | CA | 220 | — | 99.5 | % | 98.6 | % | ||||||||||||||||||||
| Lemon Wood | MH | Ventura | CA | 231 | — | 99.1 | % | 99.6 | % | ||||||||||||||||||||
| Napa Valley | MH | Napa | CA | 257 | — | 99.6 | % | 100.0 | % | ||||||||||||||||||||
| Oak Creek | MH | Coarsegold | CA | 198 | — | 100.0 | % | 98.0 | % | ||||||||||||||||||||
|
Ocean Mesa
(2)
|
RV | Goleta | CA | — | 104 | N/A | N/A |
(4)
|
|||||||||||||||||||||
| Ocean West | MH | McKinleyville | CA | 130 | — | 99.2 | % | 99.2 | % | ||||||||||||||||||||
| Palos Verdes Shores MH & Golf Community | MH | San Pedro | CA | 242 | — | 100.0 | % | 100.0 | % | ||||||||||||||||||||
| Pembroke Downs | MH | Chino | CA | 163 | — | 100.0 | % | 100.0 | % | ||||||||||||||||||||
|
Pismo Dunes RV Resort
(2)
|
RV | Pismo Beach | CA | 330 | 1 | 100.0 | % | 100.0 | % | ||||||||||||||||||||
| Rancho Alipaz | MH | San Juan Capistrano | CA | 132 | — | 100.0 | % | 100.0 | % | ||||||||||||||||||||
| Rancho Caballero | MH | Riverside | CA | 303 | — | 100.0 | % | 100.0 | % | ||||||||||||||||||||
| Royal Palms | MH | Cathedral City | CA | 439 | — | 97.7 | % | 95.7 | % | ||||||||||||||||||||
|
Royal Palms RV Resort
(2)
|
RV | Cathedral City | CA | 38 | — | 100.0 | % | 100.0 | % | ||||||||||||||||||||
| The Colony | MH | Oxnard | CA | 150 | — | 100.0 | % | 100.0 | % | ||||||||||||||||||||
|
The Sands RV & Golf Resort
(2)
|
RV | Desert Hot Springs | CA | 254 | 260 | 100.0 | % | 100.0 | % | ||||||||||||||||||||
30
SUN COMMUNITIES, INC.
| Property Name | MH/RV | City | State |
MH and Annual RV Sites as of 12/31/2020
|
Transient RV Sites as of 12/31/2020
|
Occupancy as of 12/31/2020
|
Occupancy as of 12/31/2019
|
||||||||||||||||||||||
| Vallecito | MH | Newbury Park | CA | 303 | — | 100.0 | % | 100.0 | % | ||||||||||||||||||||
| Victor Villa | MH | Victorville | CA | 287 | — | 100.0 | % | 99.0 | % | ||||||||||||||||||||
|
Vines RV Resort
(2)
|
RV | Paso Robles | CA | — | 130 | N/A | N/A | ||||||||||||||||||||||
| Vista del Lago | MH | Scotts Valley | CA | 202 | — | 99.5 | % | 100.0 | % | ||||||||||||||||||||
|
Wine Country RV Resort
(2)
|
RV | Paso Robles | CA | — | 203 | N/A | N/A | ||||||||||||||||||||||
| California Total | 6,675 | 2,231 | 98.9 | % | 99.3 | % | |||||||||||||||||||||||
| Arizona | |||||||||||||||||||||||||||||
| Blue Star | MH | Apache Junction | AZ | 4 | — | 100.0 | % | N/A | |||||||||||||||||||||
|
Blue Star
(2)
|
RV | Apache Junction | AZ | 88 | 57 | 100.0 | % | N/A | |||||||||||||||||||||
| Brentwood West | MH | Mesa | AZ | 350 | — | 99.1 | % | 99.1 | % | ||||||||||||||||||||
| Buena Vista | MH | Buckeye | AZ | 400 | — | 84.8 | % | 75.5 | % | ||||||||||||||||||||
| Desert Harbor | MH | Apache Junction | AZ | 205 | — | 100.0 | % | 99.5 | % | ||||||||||||||||||||
| Fiesta Village | MH | Mesa | AZ | 153 | — | 83.0 | % | 85.1 | % | ||||||||||||||||||||
|
Fiesta Village RV Resort
(2)
|
RV | Mesa | AZ | 7 | 4 | 100.0 | % | 100.0 | % | ||||||||||||||||||||
| La Casa Blanca | MH | Apache Junction | AZ | 198 | — | 100.0 | % | 100.0 | % | ||||||||||||||||||||
|
Leaf Verde RV Resort
(2)
|
RV | Buckeye | AZ | 30 | 347 | 100.0 | % | N/A | |||||||||||||||||||||
| Lost Dutchman | MH | Apache Junction | AZ | 177 | — | 98.9 | % | 96.6 | % | ||||||||||||||||||||
|
Lost Dutchman RV Resort
(2)
|
RV | Apache Junction | AZ | 7 | 42 | 100.0 | % | 100.0 | % | ||||||||||||||||||||
| Mountain View | MH | Mesa | AZ | 170 | — | 98.8 | % | 97.6 | % | ||||||||||||||||||||
| Palm Creek Golf | MH | Casa Grande | AZ | 506 | — | 66.6 | % |
(1)
|
60.7 | % |
(1)
|
||||||||||||||||||
|
Palm Creek Golf & RV Resort
(2)
|
RV | Casa Grande | AZ | 948 | 887 | 100.0 | % | 100.0 | % | ||||||||||||||||||||
| Rancho Mirage | MH | Apache Junction | AZ | 312 | — | 100.0 | % | 100.0 | % | ||||||||||||||||||||
| Reserve at Fox Creek | MH | Bullhead City | AZ | 311 | — | 99.7 | % | 99.0 | % | ||||||||||||||||||||
| Sun Valley | MH | Apache Junction | AZ | 268 | — | 97.4 | % | 95.9 | % | ||||||||||||||||||||
| Verde Plaza | MH | Tucson | AZ | 189 | — | 88.4 | % | 87.8 | % | ||||||||||||||||||||
| Arizona Total | 4,323 | 1,337 | 93.2 | % | 91.3 | % | |||||||||||||||||||||||
| Colorado | |||||||||||||||||||||||||||||
| Cave Creek | MH | Evans | CO | 447 | — | 99.3 | % | 98.9 | % | ||||||||||||||||||||
| Eagle Crest | MH | Firestone | CO | 441 | — | 99.5 | % | 99.5 | % | ||||||||||||||||||||
|
Jellystone Park™ at Larkspur
(2)
|
RV | Lakespur | CO | — | 536 | N/A | N/A | ||||||||||||||||||||||
| North Point Estates | MH | Pueblo | CO | 108 | — | 100.0 | % | 99.1 | % | ||||||||||||||||||||
| River Run Ranch | MH | Granby | CO | 36 | — | 55.6 | % |
(1)
|
2.8 | % |
(1)
|
||||||||||||||||||
|
River Run Ranch RV Resort
(2)
|
RV | Granby | CO | — | 426 | N/A | N/A | ||||||||||||||||||||||
| Skyline | MH | Fort Collins | CO | 170 | — | 99.4 | % | 97.6 | % | ||||||||||||||||||||
| Smith Creek Crossing | MH | Granby | CO | 82 | — | 42.7 | % |
(1)
|
5.8 | % |
(1)
|
||||||||||||||||||
| Swan Meadow Village | MH | Dillon | CO | 175 | — | 99.4 | % | 100.0 | % | ||||||||||||||||||||
| The Grove at Alta Ridge | MH | Thornton | CO | 409 | — | 100.0 | % | 99.5 | % | ||||||||||||||||||||
| Timber Ridge | MH | Fort Collins | CO | 585 | — | 99.5 | % | 99.5 | % | ||||||||||||||||||||
| Colorado Total | 2,453 | 962 | 97.0 | % | 95.8 | % | |||||||||||||||||||||||
| NORTHEAST | |||||||||||||||||||||||||||||
| Connecticut | |||||||||||||||||||||||||||||
| Beechwood | MH | Killingworth | CT | 297 | — | 97.3 | % | 98.7 | % | ||||||||||||||||||||
| Cedar Springs | MH | Southington | CT | 190 | — | 93.2 | % | 90.0 | % | ||||||||||||||||||||
| Forest Hill | MH | Southington | CT | 188 | — | 98.4 | % | 97.9 | % | ||||||||||||||||||||
| Grove Beach | MH | Westbrook | CT | 136 | — | 98.5 | % | 97.8 | % | ||||||||||||||||||||
| Hillcrest | MH | Uncasville | CT | 208 | — | 99.5 | % | 98.1 | % | ||||||||||||||||||||
| Lakeside | MH | Terryville | CT | 76 | — | 97.4 | % | 93.4 | % | ||||||||||||||||||||
| Lakeview CT | MH | Danbury | CT | 179 | — | 90.5 | % | 86.6 | % | ||||||||||||||||||||
31
SUN COMMUNITIES, INC.
| Property Name | MH/RV | City | State |
MH and Annual RV Sites as of 12/31/2020
|
Transient RV Sites as of 12/31/2020
|
Occupancy as of 12/31/2020
|
Occupancy as of 12/31/2019
|
||||||||||||||||||||||
| Laurel Heights | MH | Uncasville | CT | 49 | — | 95.9 | % | 98.0 | % | ||||||||||||||||||||
| Marina Cove | MH | Uncasville | CT | 25 | — | 76.0 | % | 80.0 | % | ||||||||||||||||||||
| Millwood | MH | Uncasville | CT | 45 | — | — | % |
(1)
|
— | % |
(1)
|
||||||||||||||||||
| New England Village | MH | Westbrook | CT | 60 | — | 100.0 | % | 100.0 | % | ||||||||||||||||||||
| Oak Grove | MH | Plainville | CT | 45 | — | 97.8 | % | 100.0 | % | ||||||||||||||||||||
| Rolling Hills | MH | Storrs | CT | 200 | — | 77.5 | % | 79.5 | % | ||||||||||||||||||||
|
Seaport RV Resort
(2)
|
RV | Old Mystic | CT | 41 | 108 | 100.0 | % | 100.0 | % | ||||||||||||||||||||
| Three Gardens | MH | Southington | CT | 135 | — | 90.4 | % | 89.6 | % | ||||||||||||||||||||
| Yankee Village | MH | Old Saybrook | CT | 23 | — | 100.0 | % | 100.0 | % | ||||||||||||||||||||
| Connecticut Total | 1,897 | 108 | 91.7 | % | 91.1 | % | |||||||||||||||||||||||
| Maine | |||||||||||||||||||||||||||||
| Augusta Village | MH | Augusta | ME | 59 | — | 89.8 | % | N/A |
(4)
|
||||||||||||||||||||
| Birch Hill Estates | MH | Bangor | ME | 376 | — | 98.7 | % | N/A |
(4)
|
||||||||||||||||||||
| Cedar Haven | MH | Holden | ME | 155 | — | 92.9 | % | N/A |
(4)
|
||||||||||||||||||||
| Hancock Heights Estates | MH | Hancock | ME | 113 | — | 100.0 | % | N/A |
(4)
|
||||||||||||||||||||
|
Hid'n Pines RV Resort
(2)
|
RV | Old Orchard Beach | ME | 76 | 245 | 100.0 | % | 100.0 | % | ||||||||||||||||||||
| Holiday Park Estates | MH | Bangor | ME | 218 | — | 91.3 | % | N/A |
(4)
|
||||||||||||||||||||
| Maplewood Manor | MH | Brunswick | ME | 296 | — | 99.3 | % | 98.3 | % | ||||||||||||||||||||
| Merrymeeting | MH | Brunswick | ME | 43 | — | 100.0 | % | 100.0 | % | ||||||||||||||||||||
| Riverside Drive Park | MH | Augusta | ME | 163 | — | 85.3 | % | N/A |
(4)
|
||||||||||||||||||||
|
Saco / Old Orchard Beach KOA
(2)
|
RV | Saco | ME | — | 191 | N/A | N/A | ||||||||||||||||||||||
| Town & Country Village | MH | Lisbon | ME | 144 | — | 98.6 | % | 97.9 | % | ||||||||||||||||||||
|
Wagon Wheel RV Resort & Campground
(2)
|
RV | Old Orchard Beach | ME | 232 | 54 | 100.0 | % | 100.0 | % | ||||||||||||||||||||
|
Wild Acres RV Resort & Campground
(2)
|
RV | Old Orchard Beach | ME | 315 | 315 | 100.0 | % | 100.0 | % | ||||||||||||||||||||
| Maine Total | 2,190 | 805 | 96.8 | % | 99.3 | % | |||||||||||||||||||||||
| New Hampshire | |||||||||||||||||||||||||||||
| Brook Ridge | MH | Hooksett | NH | 91 | — | 100.0 | % | 100.0 | % | ||||||||||||||||||||
| Crestwood | MH | Concord | NH | 320 | — | 98.8 | % | 98.4 | % | ||||||||||||||||||||
| Farmwood Village | MH | Dover | NH | 159 | — | 100.0 | % | 98.7 | % | ||||||||||||||||||||
|
Glen Ellis Family Campground
(2)
|
RV | Glen | NH | 29 | 249 | 100.0 | % | 100.0 | % | ||||||||||||||||||||
| Hannah Village | MH | Lebanon | NH | 81 | — | 100.0 | % | 100.0 | % | ||||||||||||||||||||
| Hemlocks | MH | Tilton | NH | 103 | — | 99.0 | % | 99.0 | % | ||||||||||||||||||||
|
Mi-Te-Jo Campground
(2)
|
RV | Milton | NH | 85 | 140 | 100.0 | % | 100.0 | % | ||||||||||||||||||||
| River Pines | MH | Nashua | NH | 480 | — | 99.0 | % | 98.8 | % | ||||||||||||||||||||
|
Strafford / Lake Winnipesaukee South KOA
(3)
|
RV | Strafford | NH | — | — | N/A | N/A | ||||||||||||||||||||||
|
Westward Shores Cottages & RV Resort
(2)
|
RV | West Ossipee | NH | 429 | 71 | 100.0 | % | 100.0 | % | ||||||||||||||||||||
| New Hampshire Total | 1,777 | 460 | 99.4 | % | 99.2 | % | |||||||||||||||||||||||
| New Jersey | |||||||||||||||||||||||||||||
|
Big Timber Lake RV Camping Resort
(2)
|
RV | Cape May Court House | NJ | 332 | 196 | 100.0 | % | 100.0 | % | ||||||||||||||||||||
| Cape May Crossing | MH | Cape May | NJ | 28 | — | 100.0 | % | 100.0 | % | ||||||||||||||||||||
| Deep Run | MH | Cream Ridge | NJ | 243 | — | 100.0 | % | 100.0 | % | ||||||||||||||||||||
|
Driftwood RV Resort & Campground
(2)
|
RV | Clemont | NJ | 634 | 73 | 100.0 | % | 100.0 | % | ||||||||||||||||||||
|
Lake Laurie RV and Camping Resort
(2)
|
RV | Cape May | NJ | 407 | 224 | 100.0 | % | 100.0 | % | ||||||||||||||||||||
|
Long Beach RV Resort & Campground
(2)
|
RV | Barnegat | NJ | 173 | 41 | 100.0 | % | 100.0 | % | ||||||||||||||||||||
|
Seashore Campsites & RV Resort
(2)
|
RV | Cape May | NJ | 434 | 241 | 100.0 | % | 100.0 | % | ||||||||||||||||||||
| Shady Pines | MH | Galloway Twp. | NJ | 39 | — | 100.0 | % | 100.0 | % | ||||||||||||||||||||
|
Shady Pines RV Resort
(2)
|
RV | Galloway Twp. | NJ | 57 | 38 | 100.0 | % | 100.0 | % | ||||||||||||||||||||
32
SUN COMMUNITIES, INC.
| Property Name | MH/RV | City | State |
MH and Annual RV Sites as of 12/31/2020
|
Transient RV Sites as of 12/31/2020
|
Occupancy as of 12/31/2020
|
Occupancy as of 12/31/2019
|
||||||||||||||||||||||
| New Jersey Total | 2,347 | 813 | 100.0 | % | 100.0 | % | |||||||||||||||||||||||
| New York | |||||||||||||||||||||||||||||
|
Adirondack Gateway RV Resort & Campground
(2)
|
RV | Gansevoort | NY | 318 | 24 | 100.0 | % | 100.0 | % | ||||||||||||||||||||
| Cherrywood | MH | Clinton | NY | 176 | — | 83.5 | % | 80.7 | % | ||||||||||||||||||||
| Jellystone Park™ at Birchwood Acres | MH | Greenfield Park | NY | 1 | — | 100.0 | % | 100.0 | % | ||||||||||||||||||||
|
Jellystone Park™ at Birchwood Acres RV Resort
(2)
|
RV | Greenfield Park | NY | 111 | 193 | 100.0 | % | 100.0 | % | ||||||||||||||||||||
|
Jellystone Park™ at Gardiner
(2)
|
RV | Gardiner | NY | — | 338 | N/A | N/A | ||||||||||||||||||||||
|
Jellystone Park™ of Western New York
(2)
|
RV | North Java | NY | 19 | 340 | 100.0 | % | 100.0 | % | ||||||||||||||||||||
|
Kittatinny Campground & RV Resort
(2)
|
RV | Barryville | NY | — | 527 | N/A | N/A |
(4)
|
|||||||||||||||||||||
| Parkside Village | MH | Cheektowaga | NY | 156 | — | 100.0 | % | 100.0 | % | ||||||||||||||||||||
| Sky Harbor | MH | Cheektowaga | NY | 522 | — | 98.1 | % | 98.3 | % | ||||||||||||||||||||
| The Villas at Calla Pointe | MH | Cheektowaga | NY | 116 | — | 100.0 | % | 100.0 | % | ||||||||||||||||||||
| New York Total | 1,419 | 1,422 | 97.3 | % | 96.9 | % | |||||||||||||||||||||||
| OTHER | |||||||||||||||||||||||||||||
|
Pandion Ridge RV Resort
(2)
|
RV | Orange Beach | AL | — | 142 | N/A | N/A | ||||||||||||||||||||||
| High Point Park | MH | Frederica | DE | 409 | — | 99.3 | % | 97.3 | % | ||||||||||||||||||||
| Leisure Point Resort | MH | Millsboro | DE | 202 | — | 90.6 | % | 90.0 | % | ||||||||||||||||||||
|
Leisure Point RV Resort
(2)
|
RV | Millsboro | DE | 293 | 7 | 100.0 | % | 100.0 | % | ||||||||||||||||||||
|
Massey’s Landing RV Resort
(2)
|
RV | Millsboro | DE | — | 291 | N/A | N/A | ||||||||||||||||||||||
| Sea Air Village | MH | Rehoboth Beach | DE | 373 | — | 99.2 | % | 99.2 | % | ||||||||||||||||||||
|
Sea Air Village RV Resort
(2)
|
RV | Rehoboth Beach | DE | 116 | 18 | 100.0 | % | 100.0 | % | ||||||||||||||||||||
| Countryside Village of Atlanta | MH | Lawrenceville | GA | 261 | — | 99.6 | % | 100.0 | % | ||||||||||||||||||||
| Countryside Village of Gwinnett | MH | Buford | GA | 331 | — | 99.7 | % | 99.1 | % | ||||||||||||||||||||
| Countryside Village of Lake Lanier | MH | Buford | GA | 548 | — | 99.1 | % | 99.8 | % | ||||||||||||||||||||
| Wymberly | MH | Martinez | GA | 215 | — | 100.0 | % | 99.5 | % | ||||||||||||||||||||
| Autumn Ridge | MH | Ankeny | IA | 413 | — | 98.1 | % | 97.1 | % | ||||||||||||||||||||
| Candlelight Village | MH | Sauk Village | IL | 310 | — | 97.7 | % | 92.2 | % | ||||||||||||||||||||
| Maple Brook | MH | Matteson | IL | 441 | — | 99.8 | % | 99.3 | % | ||||||||||||||||||||
| Oak Ridge | MH | Manteno | IL | 426 | — | 96.0 | % | 95.1 | % | ||||||||||||||||||||
|
Sunset Lakes RV Resort
(2)
|
RV | Hillsdale | IL | 230 | 268 | 100.0 | % | 100.0 | % | ||||||||||||||||||||
| Wildwood Community | MH | Sandwich | IL | 476 | — | 98.9 | % | 98.7 | % | ||||||||||||||||||||
|
Reunion Lake RV Resort
(2)
|
RV | Ponchatoula | LA | — | 226 | N/A | N/A | ||||||||||||||||||||||
|
Campers Haven RV Resort
(2)
|
RV | Dennisport | MA | 224 | 42 | 100.0 | % | 100.0 | % | ||||||||||||||||||||
|
Cape Cod RV Resort
(2)
|
RV | East Falmouth | MA | 49 | 207 | 100.0 | % | N/A |
(4)
|
||||||||||||||||||||
|
Peter's Pond RV Resort
(2)
|
RV | Sandwich | MA | 330 | 76 | 100.0 | % | 100.0 | % | ||||||||||||||||||||
|
Castaways RV Resort & Campground
(2)
|
RV | Berlin | MD | 1 | 392 | 100.0 | % | 100.0 | % | ||||||||||||||||||||
|
Fort Whaley RV Resort & Campground
(2)
|
RV | Whaleyville | MD | — | 210 | N/A | N/A | ||||||||||||||||||||||
|
Frontier Town RV Resort & Campground
(2)
|
RV | Berlin | MD | — | 685 | N/A | N/A | ||||||||||||||||||||||
| Hyde Park | MH | Easton | MD | 240 | — | 99.2 | % | 98.3 | % | ||||||||||||||||||||
|
Jellystone Park™ at Maryland
(2)
|
RV | Williamsport | MD | — | 228 | N/A | N/A | ||||||||||||||||||||||
| Southside Landing | MH | Cambridge | MD | 96 | — | 88.5 | % | 81.3 | % | ||||||||||||||||||||
| Southern Hills / Northridge Place | MH | Stewartville | MN | 475 | — | 98.9 | % | 98.5 | % | ||||||||||||||||||||
| Pin Oak Parc | MH | O'Fallon | MO | 502 | — | 98.2 | % | 99.2 | % | ||||||||||||||||||||
| Southfork | MH | Belton | MO | 474 | — | 71.1 | % | 67.7 | % | ||||||||||||||||||||
|
Jellystone Park™ at Memphis
(2)
|
RV | Horn Lake | MS | — | 155 | N/A | N/A | ||||||||||||||||||||||
| Coastal Estates | MH | Hampstead | NC | 154 | — | 65.6 | % |
(1)
|
100.0 | % | |||||||||||||||||||
|
Fort Tatham RV Resort & Campground
(2)
|
RV | Sylva | NC | 54 | 36 | 100.0 | % | 100.0 | % | ||||||||||||||||||||
| Glen Laurel | MH | Concord | NC | 260 | — | 100.0 | % | 100.0 | % | ||||||||||||||||||||
|
Jellystone Park™ at Golden Valley
(2)
|
RV | Bostic | NC | — | 258 | N/A | N/A | ||||||||||||||||||||||
33
SUN COMMUNITIES, INC.
| Property Name | MH/RV | City | State |
MH and Annual RV Sites as of 12/31/2020
|
Transient RV Sites as of 12/31/2020
|
Occupancy as of 12/31/2020
|
Occupancy as of 12/31/2019
|
||||||||||||||||||||||
| Meadowbrook | MH | Charlotte | NC | 321 | — | 99.7 | % | 100.0 | % | ||||||||||||||||||||
| Sun Villa Estates | MH | Reno | NV | 324 | — | 100.0 | % | 99.7 | % | ||||||||||||||||||||
| Country Village Estates | MH | Oregon City | OR | 518 | — | 99.8 | % | 99.8 | % | ||||||||||||||||||||
| Crown Villa RV Resort | RV | Bend | OR | — | 123 | N/A | N/A |
(4)
|
|||||||||||||||||||||
| Forest Meadows | MH | Philomath | OR | 75 | — | 100.0 | % | 100.0 | % | ||||||||||||||||||||
|
Oceanside RV Resort & Campground
(2)
|
RV | Coos Bay | OR | — | 86 | N/A | N/A | ||||||||||||||||||||||
| Woodland Park Estates | MH | Eugene | OR | 398 | — | 100.0 | % | 100.0 | % | ||||||||||||||||||||
| Countryside Estates | MH | Mckean | PA | 304 | — | 96.4 | % | 95.4 | % | ||||||||||||||||||||
|
Jellystone Park™ at Quarryville
(2)
|
RV | Quarryville | PA | — | 256 | N/A | N/A | ||||||||||||||||||||||
|
River Beach Campsites & RV
(2)
|
RV | Milford | PA | — | — | N/A | N/A |
(4)
|
|||||||||||||||||||||
|
Lake in Wood RV Resort
(2)
|
RV | Narvon | PA | 278 | 144 | 100.0 | % | 100.0 | % | ||||||||||||||||||||
| Pheasant Ridge | MH | Lancaster | PA | 553 | — | 100.0 | % | 100.0 | % | ||||||||||||||||||||
|
Carolina Pines RV Resort
(2)
|
RV | Conway | SC | 149 | 562 | 100.0 | % | 100.0 | % | ||||||||||||||||||||
| Country Lakes | MH | Little River | SC | 136 | — | 95.6 | % | 95.6 | % | ||||||||||||||||||||
| Crossroads | MH | Aiken | SC | 171 | — | 60.8 | % |
(1)
|
25.7 | % |
(1)
|
||||||||||||||||||
|
Crossroads RV Resort
(2)
|
RV | Aiken | SC | 22 | — | 100.0 | % | 100.0 | % | ||||||||||||||||||||
| Lakeside Crossing | MH | Conway | SC | 690 | — | 82.9 | % |
(1)
|
76.6 | % |
(1)
|
||||||||||||||||||
| Ocean Pines | MH | Garden City | SC | 579 | — | 99.5 | % | 99.5 | % | ||||||||||||||||||||
| Southern Palms | MH | Ladson | SC | 194 | — | 100.0 | % |
|
100.0 | % | |||||||||||||||||||
| Bell Crossing | MH | Clarksville | TN | 237 | — | 99.6 | % | 98.7 | % | ||||||||||||||||||||
|
Sun Outdoors Sevierville Pigeon Forge
(2)
|
RV | Sevierville | TN | 70 | 238 | 100.0 | % | N/A | |||||||||||||||||||||
|
Archview RV Resort & Campground
(2)
|
RV | Moab | UT | — | 113 | N/A | N/A | ||||||||||||||||||||||
|
Canyonlands RV Resort & Campground
(2)
|
RV | Moab | UT | — | 131 | N/A | N/A | ||||||||||||||||||||||
|
Moab Valley RV Resort & Campground
(2)
|
RV | Moab | UT | — | 131 | N/A | N/A | ||||||||||||||||||||||
|
Pony Express RV Resort & Campground
(2)
|
RV | North Salt Lake | UT | — | 185 | N/A | N/A | ||||||||||||||||||||||
|
Slickrock RV Resort & Campground
(2)
|
RV | Moab | UT | — | 190 | N/A | N/A | ||||||||||||||||||||||
|
Chincoteague Island KOA RV Resort
(3)
|
RV | Chincoteague | VA | — | — | N/A | N/A | ||||||||||||||||||||||
|
Gwynn's Island RV Resort & Campground
(2)
|
RV | Gwynn | VA | 106 | 23 | 100.0 | % | 100.0 | % | ||||||||||||||||||||
|
Jellystone Park™ at Luray
(2)
|
RV | East Luray | VA | — | 255 | N/A | N/A | ||||||||||||||||||||||
|
Jellystone Park™ at Natural Bridge
(2)
|
RV | Natural Bridge Station | VA | 62 | 237 | 100.0 | % | N/A |
(4)
|
||||||||||||||||||||
|
New Point RV Resort
(2)
|
RV | New Point | VA | 292 | 32 | 100.0 | % | 100.0 | % | ||||||||||||||||||||
| Pine Ridge | MH | Prince George | VA | 376 | — | 98.9 | % | 90.2 | % |
(1)
|
|||||||||||||||||||
|
Shenandoah Acres Family Campground
(2)
|
RV |
Stuarts Draft
|
VA | 302 | 190 | 100.0 | % | N/A |
(4)
|
||||||||||||||||||||
|
Sunset Beach RV Resort
(3)
|
RV | Cape Charles | VA | — | — | N/A | N/A | ||||||||||||||||||||||
|
Gig Harbor RV Resort
(2)
|
RV | Gig Harbor | WA | — | 112 | N/A | N/A |
(4)
|
|||||||||||||||||||||
| Thunderhill Estates | MH | Sturgeon Bay | WI | 266 | — | 97.0 | % | 98.5 | % | ||||||||||||||||||||
|
Westward Ho RV Resort & Campground
(2)
|
RV | Glenbeulah | WI | 223 | 99 | 100.0 | % | 100.0 | % | ||||||||||||||||||||
| Other Total | 14,549 | 6,348 | 96.5 | % | 95.3 | % | |||||||||||||||||||||||
| US TOTAL / AVERAGE | 120,162 | 24,077 | 97.3 | % | 96.3 | % | |||||||||||||||||||||||
| CANADA | |||||||||||||||||||||||||||||
|
Arran Lake RV Resort & Campground
(2)
|
RV | Allenford | ON | 178 | 11 | 100.0 | % | 100.0 | % | ||||||||||||||||||||
|
Craigleith RV Resort & Campground
(2)
|
RV | Clarksburg | ON | 82 | 29 | 100.0 | % | 100.0 | % | ||||||||||||||||||||
|
Deer Lake RV Resort & Campground
(2)
|
RV | Huntsville | ON | 198 | 43 | 100.0 | % | 100.0 | % | ||||||||||||||||||||
|
Grand Oaks RV Resort & Campground
(2)
|
RV | Cayuga | ON | 237 | 42 | 100.0 | % | 100.0 | % | ||||||||||||||||||||
|
Gulliver's Lake RV Resort & Campground
(2)
|
RV | Millgrove | ON | 198 | — | 100.0 | % | 100.0 | % | ||||||||||||||||||||
|
Hidden Valley RV Resort & Campground
(2)
|
RV | Normandale | ON | 206 | 39 | 100.0 | % | 100.0 | % | ||||||||||||||||||||
|
Lafontaine RV Resort & Campground
(2)
|
RV | Tiny | ON | 215 | 48 | 100.0 | % | 100.0 | % | ||||||||||||||||||||
|
Lake Avenue RV Resort & Campground
(2)
|
RV | Cherry Valley | ON | 125 | 11 | 100.0 | % | 100.0 | % | ||||||||||||||||||||
34
SUN COMMUNITIES, INC.
| Property Name | MH/RV | City | State |
MH and Annual RV Sites as of 12/31/2020
|
Transient RV Sites as of 12/31/2020
|
Occupancy as of 12/31/2020
|
Occupancy as of 12/31/2019
|
||||||||||||||||||||||
|
Pickerel Park RV Resort & Campground
(2)
|
RV | Napanee | ON | 146 | 63 | 100.0 | % | 100.0 | % | ||||||||||||||||||||
|
Sherkston Shores Beach Resort & Campground
(2)
|
RV | Sherkston | ON | 1,491 | 375 | 100.0 | % | 100.0 | % | ||||||||||||||||||||
|
Silver Birches RV Resort & Campground
(2)
|
RV | Lambton Shores | ON | 137 | 25 | 100.0 | % | 100.0 | % | ||||||||||||||||||||
|
Trailside RV Resort & Campground
(2)
|
RV | Seguin | ON | 205 | 32 | 100.0 | % | 100.0 | % | ||||||||||||||||||||
|
Willow Lake RV Resort & Campground
(2)
|
RV | Scotland | ON | 370 | 3 | 100.0 | % | 100.0 | % | ||||||||||||||||||||
|
Willowood RV Resort & Campground
(2)
|
RV | Amherstburg | ON | 117 | 210 | 100.0 | % | 100.0 | % | ||||||||||||||||||||
|
Woodland Lake RV Resort & Campground
(2)
|
RV | Bornholm | ON | 185 | 35 | 100.0 | % | 100.0 | % | ||||||||||||||||||||
| CANADA TOTAL / AVERAGE | 4,090 | 966 | 100.0 | % | 100.0 | % | |||||||||||||||||||||||
| COMPANY TOTAL / AVERAGE | 124,252 | 25,043 | 97.3 | % | 96.4 | % | |||||||||||||||||||||||
(1)
Occupancy in these properties reflects the fact that these properties are in a lease-up phase following an expansion, redevelopment or initial construction.
(2)
Occupancy percentage excludes transient RV sites. Percentage calculated by dividing revenue producing sites by developed sites. A revenue producing site is defined as a site that is occupied by a paying resident or reserved by a customer with annual or seasonal usage rights. A developed site is defined as an adequate sized parcel of land that has road and utility access which is zoned and licensed (if required) for use as a home site.
(3)
We have an ownership interest in Sunset Beach, Strafford, and Chincoteague Island, but do not maintain and operate the property.
(4)
No occupancy in these properties for the year ended December 31, 2019 as properties were acquired during the year ended December 31, 2020.
(5)
Occupancy in these properties at December 31, 2020 reflects the redevelopment following asset impairments resulting from Hurricane Irma in September 2017.
35
SUN COMMUNITIES, INC.
The following tables set forth certain information relating to our Safe Harbor branded marinas as of December 31, 2020.
| Marina Property Name | City | State |
Wet Slips and Dry Storage Spaces
as of 12/31/2020
|
||||||||
| UNITED STATES | |||||||||||
| NORTHEAST | |||||||||||
| Connecticut | |||||||||||
| Bruce & Johnsons | Branford | CT | 663 | ||||||||
|
Dauntless
(1)
|
Essex | CT | 335 | ||||||||
|
Dauntless Shipyard
(1)
|
Essex | CT | — | ||||||||
| Deep River | Deep River | CT | 305 | ||||||||
|
Essex Island
(1)
|
Essex | CT | — | ||||||||
| Ferry Point | Old Saybrook | CT | 137 | ||||||||
|
Harbor House
(2)
|
Stamford | CT | — | ||||||||
| Mystic | Mystic | CT | 254 | ||||||||
| Pilots Point | Westbrook | CT | 873 | ||||||||
| Stratford | Stratford | CT | 183 | ||||||||
|
Yacht Haven
(2)
|
Stamford | CT | 504 | ||||||||
| Connecticut Total | 3,254 | ||||||||||
| Rhode Island | |||||||||||
| Cove Haven | Barrington | RI | 340 | ||||||||
| Cowesett | Warwick | RI | 706 | ||||||||
| Greenwich Bay | Warwick | RI | 511 | ||||||||
|
Island Park
(3)
|
Portsmouth | RI | — | ||||||||
| Jamestown Boatyard | Jamestown | RI | 87 | ||||||||
| New England Boatworks | Portsmouth | RI | 294 | ||||||||
| Newport Shipyard | Newport | RI | 45 | ||||||||
|
Sakonnet
(3)
|
Portsmouth | RI | 369 | ||||||||
| Silver Spring | South Kingstown | RI | 86 | ||||||||
|
Wickford
(4)
|
North Kingstown | RI | — | ||||||||
|
Wickford Cove
(4)
|
North Kingstown | RI | 252 | ||||||||
| Rhode Island Total | 2,690 | ||||||||||
| New York | |||||||||||
| Capri | Port Washington | NY | 332 | ||||||||
| Gaines | Rouses Point | NY | 281 | ||||||||
| Glen Cove | Glen Cove | NY | 497 | ||||||||
|
Greenport
(5)
|
Greenport | NY | 381 | ||||||||
| Haverstraw | West Haverstraw | NY | 873 | ||||||||
| Post Road | Mamaroneck | NY | 49 | ||||||||
|
Stirling
(5)
|
Greenport | NY | — | ||||||||
| Willsboro Bay | Willsboro | NY | 207 | ||||||||
| New York Total | 2,620 | ||||||||||
| Massachusetts | |||||||||||
| Fiddler's Cove | North Falmouth | MA | 227 | ||||||||
| Green Harbor | Marshfield | MA | 202 | ||||||||
| Hawthorne Cove | Salem | MA | 364 | ||||||||
| Marina Bay | Quincy | MA | 678 | ||||||||
| Onset Bay | Buzzards Bay | MA | 230 | ||||||||
| Plymouth | Plymouth | MA | 186 | ||||||||
| Sunset Bay | Hull | MA | 306 | ||||||||
36
SUN COMMUNITIES, INC.
| Marina Property Name | City | State |
Wet Slips and Dry Storage Spaces
as of 12/31/2020
|
||||||||
| Massachusetts Total | 2,193 | ||||||||||
| Maryland | |||||||||||
| Annapolis | Annapolis | MD | 184 | ||||||||
| Bohemia Vista | Chesapeake Bay | MD | 127 | ||||||||
| Carroll Island | Baltimore | MD | 380 | ||||||||
| Great Oak Landing | Chestertown | MD | 427 | ||||||||
| Hacks Point | Earleville | MD | 85 | ||||||||
| Narrows Point | Grasonville | MD | 503 | ||||||||
| Oxford | Oxford | MD | 136 | ||||||||
| Zahnisers | Solomons | MD | 227 | ||||||||
| Maryland Total | 2,069 | ||||||||||
| New Jersey | |||||||||||
| Crystal Point | Point Pleasant | NJ | 157 | ||||||||
| Manasquan River | Brick Township | NJ | 235 | ||||||||
| New Jersey Total | 392 | ||||||||||
| Maine | |||||||||||
| Great Island | Harpswell | ME | 330 | ||||||||
| Rockland | Rockland | ME | 173 | ||||||||
| Maine Total | 503 | ||||||||||
| Vermont | |||||||||||
| Shelburne Shipyard | Shelburne | VT | 116 | ||||||||
| Vermont Total | 116 | ||||||||||
| SOUTH | |||||||||||
| Georgia | |||||||||||
| Aqualand | Flowery Branch | GA | 1,610 | ||||||||
| Bahia Bleu | Thunderbolt | GA | 263 | ||||||||
| Hideaway Bay | Flowery Branch | GA | 628 | ||||||||
| Trade Winds | Appling | GA | 333 | ||||||||
| Georgia Total | 2,834 | ||||||||||
| Kentucky | |||||||||||
| Beaver Creek | Monticello | KY | 257 | ||||||||
| Burnside | Somerset | KY | 344 | ||||||||
| Grider Hill | Albany | KY | 810 | ||||||||
| Jamestown | Jamestown | KY | 694 | ||||||||
| Wisdom Dock | Albany | KY | 290 | ||||||||
| Kentucky Total | 2,395 | ||||||||||
| Texas | |||||||||||
| Emerald Point | Austin | TX | 519 | ||||||||
| Pier 121 | Lewisville | TX | 1,310 | ||||||||
| Walden | Montgomery | TX | 353 | ||||||||
| Texas Total | 2,182 | ||||||||||
| Arkansas | |||||||||||
| Brady Mountain | Royal | AR | 578 | ||||||||
37
SUN COMMUNITIES, INC.
| Marina Property Name | City | State |
Wet Slips and Dry Storage Spaces
as of 12/31/2020
|
||||||||
| Arkansas Total | 578 | ||||||||||
| Tennessee | |||||||||||
| Eagle Cove | Byrdstown | TN | 69 | ||||||||
| Holly Creek | Celina | TN | 297 | ||||||||
| Tennessee Total | 366 | ||||||||||
| Mississippi | |||||||||||
| Aqua Yacht | Iuka | MS | 432 | ||||||||
| Mississippi Total | 432 | ||||||||||
| Alabama | |||||||||||
| Sportsman | Orange Beach | AL | 697 | ||||||||
| Alabama Total | 697 | ||||||||||
| Oklahoma | |||||||||||
| Harbors View | Afton | OK | 132 | ||||||||
| Oklahoma Total | 132 | ||||||||||
| SOUTHEAST | |||||||||||
| Florida | |||||||||||
| Burnt Store | Punta Gorda | FL | 697 | ||||||||
| Calusa Island | Goodland | FL | 548 | ||||||||
| Cape Harbour | Cape Coral | FL | 231 | ||||||||
| Harbortown | Fort Pierce | FL | 354 | ||||||||
| New Port Cove | Riviera Beach | FL | 328 | ||||||||
| North Palm Beach | North Palm Beach | FL | 101 | ||||||||
| Old Port Cove | North Palm Beach | FL | 210 | ||||||||
| Pier 77 | Bradenton | FL | 185 | ||||||||
| Pineland | Bokeelia | FL | 241 | ||||||||
| Regatta Pointe | Palmetto | FL | 348 | ||||||||
| Riviera Beach | Riviera Beach | FL | 8 | ||||||||
| Siesta Key | Sarasota | FL | 252 | ||||||||
|
South Fork
(6)
|
Fort Lauderdale | FL | — | ||||||||
| West Palm Beach | West Palm Beach | FL | 70 | ||||||||
| Florida Total | 3,573 | ||||||||||
| South Carolina | |||||||||||
| Beaufort | Beaufort | SC | 120 | ||||||||
| Bristol | Charleston | SC | 146 | ||||||||
| Charleston City | Charleston | SC | 255 | ||||||||
| City Boatyard | Charleston | SC | 194 | ||||||||
| Port Royal | Port Royal | SC | 161 | ||||||||
| Reserve Harbor | Pawleys Island | SC | 228 | ||||||||
| Skull Creek | Hilton Head | SC | 184 | ||||||||
| South Carolina Total | 1,288 | ||||||||||
| North Carolina | |||||||||||
| Kings Point | Cornelius | NC | 785 | ||||||||
| Peninsula Yacht Club | Cornelius | NC | 403 | ||||||||
| Skippers Landing | Troutman | NC | 440 | ||||||||
38
SUN COMMUNITIES, INC.
| Marina Property Name | City | State |
Wet Slips and Dry Storage Spaces
as of 12/31/2020
|
||||||||
| South Harbour Village | Southport | NC | 124 | ||||||||
| Westport | Denver | NC | 628 | ||||||||
| North Carolina Total | 2,380 | ||||||||||
| MIDWEST | |||||||||||
| Michigan | |||||||||||
| Belle Maer | Harrison Township | MI | 723 | ||||||||
| Grand Isle | Grand Haven | MI | 763 | ||||||||
| Great Lakes | Muskegon | MI | 648 | ||||||||
| Jefferson Beach | St. Clair Shores | MI | 1,368 | ||||||||
| Toledo Beach | La Salle Township | MI | 966 | ||||||||
| Michigan Total | 4,468 | ||||||||||
| Ohio | |||||||||||
| Lakefront | Port Clinton | OH | 623 | ||||||||
| Sandusky | Sandusky | OH | 793 | ||||||||
| Ohio Total | 1,416 | ||||||||||
| SOUTHWEST | |||||||||||
| California | |||||||||||
| Anacapa Isle | Oxnard | CA | 453 | ||||||||
| Ballena Isle | Alameda | CA | 356 | ||||||||
| Emeryville | Emeryville | CA | 432 | ||||||||
| Loch Lomond | San Rafael | CA | 525 | ||||||||
| Ventura Isle | Ventura | CA | 537 | ||||||||
| California Total | 2,303 | ||||||||||
| US TOTAL / AVERAGE | 38,881 | ||||||||||
(1)
Wet slips and dry storage spaces from Dauntless Shipyard and Essex Island are grouped into Dauntless.
(2)
Wet slips and dry storage spaces from Harbor House are grouped into Yacht Haven.
(3)
Wet slips and dry storage spaces from Island Park are grouped into Sakonnet.
(4)
Wet slips and dry storage spaces from Wickford are grouped into Wickford Cove.
(5)
Wet slips and dry storage spaces from Stirling are grouped into Greenport.
(6)
Property currently under development.
39
SUN COMMUNITIES, INC.
ITEM 3. LEGAL PROCEEDINGS
We are involved in various legal proceedings arising in the ordinary course of business. All such proceedings, taken together, are not expected to have a material adverse impact on our results of operations or financial condition.
ITEM 4. MINE SAFETY DISCLOSURES
None.
40
SUN COMMUNITIES, INC.
PART II
ITEM 5. MARKET FOR REGISTRANT’S COMMON EQUITY, RELATED STOCKHOLDER MATTERS AND ISSUER PURCHASES OF EQUITY SECURITIES
Market Information
Our common stock has been listed on the NYSE since December 8, 1993, and traded under the symbol “SUI.” On February 11, 2021, the closing share price of our common stock was $147.19 per share on the NYSE, and there were 278 holders of record for the 107,616,246 outstanding shares of common stock.
On February 11, 2021, the following OP units of the Operating Partnership were outstanding:
| OP Units |
OP Units
Issued and Outstanding |
Exchangeable
Shares of Common Stock |
||||||||||||
| Aspen preferred OP units | 1,283,819 | 407,840 | ||||||||||||
| Series A-1 preferred OP units | 294,734 | 718,863 | ||||||||||||
| Series C preferred OP units | 306,303 | 339,996 | ||||||||||||
| Series D preferred OP units | 488,958 | 391,166 | ||||||||||||
| Series E preferred OP units | 90,000 | 62,069 | ||||||||||||
| Series F preferred OP units | 90,000 | 56,250 | ||||||||||||
| Series G preferred OP units | 240,710 | 155,297 | ||||||||||||
| Series H preferred OP units | 581,407 | 354,516 | ||||||||||||
| Series I preferred OP units | 922,000 | 562,195 | ||||||||||||
| Series A-3 preferred OP units | 40,268 | 74,917 | ||||||||||||
| Common OP units | 2,589,760 | 2,589,760 | ||||||||||||
| Total | 6,927,959 | 5,712,869 | ||||||||||||
We have historically paid regular quarterly distributions to holders of our common stock and common OP units. In addition, we are obligated to make distributions to holders of shares of Aspen preferred OP units, Series A-1 preferred OP units, Series C preferred OP units, Series D preferred OP units, Series E preferred OP units, Series F preferred OP units, Series G preferred OP units, Series H preferred OP units, Series I preferred OP units, and Series A-3 preferred OP units. See “Structure of the Company” under Part I, Item 1 of this Annual Report on Form 10-K. Our ability to make distributions on our common stock and preferred OP units, payments on our indebtedness and to fund planned capital expenditures will depend on our ability to generate cash in the future. The decision to declare and pay distributions on shares of our common stock and common OP units in the future, as well as the timing, amount, and composition of any such future distributions, will be at the sole discretion of our Board of Directors in light of conditions then existing, including our earnings, financial condition, capital requirements, debt maturities, the availability of debt and equity capital, applicable REIT and legal restrictions, general overall economic conditions and other factors.
Securities Authorized for Issuance Under Equity Compensation Plans
The following table reflects information about the securities authorized for issuance under our equity compensation plans as of December 31, 2020:
| Number of securities to be issued upon exercise of outstanding options, warrants and rights | Weighted-average exercise price of outstanding options, warrants and rights | Number of shares of common stock remaining available for future issuance under equity compensation plans (excluding securities reflected in column a) | ||||||||||||||||||
| Plan Category | (a) | (b) | (c) | |||||||||||||||||
| Equity compensation plans approved by stockholders | 1,500 | $ | 37.35 | 909,085 | ||||||||||||||||
| Equity compensation plans not approved by stockholders | — | — | — | |||||||||||||||||
|
Total
|
1,500 | — | 909,085 | |||||||||||||||||
41
SUN COMMUNITIES, INC.
Recent Sales of Unregistered Securities
From time to time, we may issue shares of common stock in exchange for OP units that may be tendered to the Operating Partnership for redemption in accordance with the terms and provisions of the limited partnership agreement of the Operating Partnership. Such shares are issued based on the exchange ratios and formulas described in “Structure of the Company” under Part I, Item 1 of this Annual Report on Form 10-K. Below is the activity of conversions for the quarter and year ended December 31, 2020:
|
Three Months Ended December 31, 2020
|
Year Ended December 31, 2020 | |||||||||||||||||||||||||
| OP Units | Conversion Rate | Units / Shares | Common Stock | Units / Shares | Common Stock | |||||||||||||||||||||
| Common OP units | 1.0000 | 51,959 | 51,959 | 81,845 | 81,845 | |||||||||||||||||||||
| Series A-1 preferred OP units | 2.4390 | 3,886 | 9,478 | 14,500 | 35,359 | |||||||||||||||||||||
| Series C preferred OP units | 1.1100 | 2,636 | 2,926 | 4,121 | 4,573 | |||||||||||||||||||||
All of the securities described above were issued in private placements in reliance on Section 4(a)(2) of the Securities Act, including Regulation D promulgated thereunder, based on certain investment representations made by the parties to whom the securities were issued. No underwriters were used in connection with any of such issuances.
Performance Graph
Set forth below is a line graph comparing the yearly percentage change in the cumulative total shareholder return on our common stock against the cumulative total return of a broad market index composed of all issuers listed on the NYSE and an industry index comprised of 13 publicly traded REITs, for the five year period ending on December 31, 2020. This line graph assumes a $100 investment on December 31, 2015, a reinvestment of distributions and actual increase of the market value of our common stock relative to an initial investment of $100. The comparisons in this table are required by the SEC and are not intended to forecast or be indicative of possible future performance of our common stock.
Peer Group
We utilize peer group data for quantitative benchmarking against external market participants. We select our peer group based on a number of quantitative and qualitative factors including, but not limited to, revenues, total assets, market capitalization, industry, sub-industry, location, total shareholder return history, executive compensation components, and peer decisions made by other companies. From time to time, we update our peer group based on analysis of the aforementioned factors and application of judgment.
42
SUN COMMUNITIES, INC.
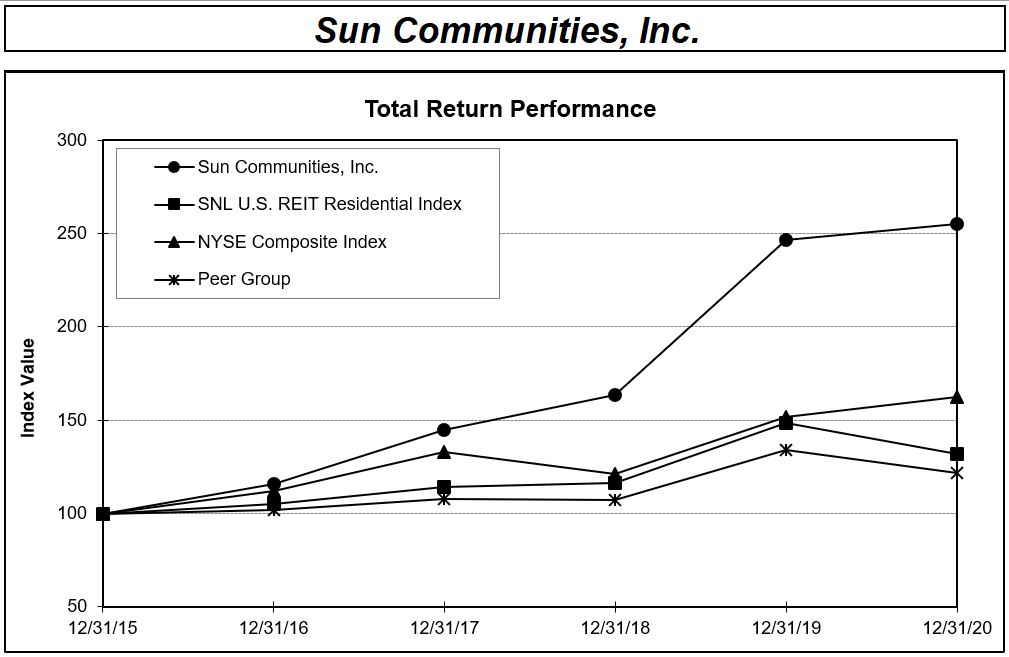
| Year Ended | ||||||||||||||||||||||||||||||||||||||
| Index | December 31, 2015 | December 31, 2016 | December 31, 2017 | December 31, 2018 | December 31, 2019 | December 31, 2020 | ||||||||||||||||||||||||||||||||
| Sun Communities, Inc. | $ | 100.00 | $ | 115.79 | $ | 144.67 | $ | 163.33 | $ | 246.48 | $ | 255.31 | ||||||||||||||||||||||||||
| SNL U.S. REIT Residential Index | $ | 100.00 | $ | 104.99 | $ | 114.20 | $ | 116.24 | $ | 148.35 | $ | 131.90 | ||||||||||||||||||||||||||
| NYSE Composite Index | $ | 100.00 | $ | 111.94 | $ | 132.90 | $ | 121.01 | $ | 151.87 | $ | 162.49 | ||||||||||||||||||||||||||
|
SUI Peer Group
(1)
|
$ | 100.00 | $ | 101.69 | $ | 108.03 | $ | 107.07 | $ | 133.81 | $ | 121.69 | ||||||||||||||||||||||||||
(1)
SUI peer group includes: American Campus Communities, Inc., Apartment Investment and Management Company, AvalonBay Communities, Inc., Camden Property Trust, CubeSmart, Equity Lifestyles Properties, Inc., Essex Property Trust, Inc., Extra Space Storage Inc., Federal Realty Investment Trust, Invitation Homes, Inc., Mid-America Apartment Communities, Inc., The Macerich Company, and UDR, Inc.
The information included under the heading “Performance Graph” is not to be treated as “soliciting material” or as “filed” with the SEC, and is not incorporated by reference into any filing by the Company under the Securities Act or the Exchange Act that is made on, before or after the date of filing of this Annual Report on Form 10-K.
43
SUN COMMUNITIES, INC.
ITEM 6. SELECTED FINANCIAL DATA
The following table sets forth selected financial information on a historical basis. The historical financial data has been derived from our historical financial statements. The following information should be read in conjunction with the information included in “Management’s Discussion and Analysis of Financial Condition and Results of Operations,” and the Consolidated Financial Statements and the Notes thereto. In addition to the results presented in accordance with GAAP below, we have provided funds from operations (“FFO”) as a supplemental performance measure. Refer to
Non-GAAP Financial Measures
in Item 7 below for additional information.
| Year Ended | |||||||||||||||||||||||||||||
| December 31, 2020 |
December 31, 2019
(1)
|
December 31, 2018
(1)
|
December 31, 2017
(1)
|
December 31, 2016
(1)
|
|||||||||||||||||||||||||
| (In thousands, except for share related data) | |||||||||||||||||||||||||||||
| Financial Information | |||||||||||||||||||||||||||||
| Total revenues | $ | 1,398,347 | $ | 1,264,037 | $ | 1,126,825 | $ | 982,570 | $ | 833,778 | |||||||||||||||||||
| Net income | $ | 147,451 | $ | 177,379 | $ | 120,158 | $ | 81,819 | $ | 31,471 | |||||||||||||||||||
| Net income attributable to Sun Communities Inc. common stockholders | $ | 131,614 | $ | 160,265 | $ | 105,493 | $ | 65,021 | $ | 17,369 | |||||||||||||||||||
| Basic earnings per share | $ | 1.34 | $ | 1.80 | $ | 1.29 | $ | 0.85 | $ | 0.27 | |||||||||||||||||||
| Diluted earnings per share | $ | 1.34 | $ | 1.80 | $ | 1.29 | $ | 0.85 | $ | 0.26 | |||||||||||||||||||
| Cash distributions declared per common share | $ | 3.16 | $ | 3.00 | $ | 2.84 | $ | 2.68 | $ | 2.60 | |||||||||||||||||||
| FFO attributable to Sun Communities, Inc. common stockholders and dilutive convertible securities | $ | 489,668 | $ | 440,687 | $ | 385,615 | $ | 320,119 | $ | 225,653 | |||||||||||||||||||
| Core FFO attributable to Sun Communities, Inc. common stockholders and dilutive convertible securities | $ | 515,560 | $ | 456,932 | $ | 394,369 | $ | 337,384 | $ | 266,131 | |||||||||||||||||||
| FFO attributable to Sun Communities, Inc. common stockholders and dilutive convertible securities per share - fully diluted | $ | 4.83 | $ | 4.75 | $ | 4.48 | $ | 3.95 | $ | 3.22 | |||||||||||||||||||
| Core FFO attributable to Sun Communities, Inc. common stockholders and dilutive convertible securities per share - fully diluted | $ | 5.09 | $ | 4.92 | $ | 4.58 | $ | 4.17 | $ | 3.79 | |||||||||||||||||||
| Balance Sheets | |||||||||||||||||||||||||||||
| Total assets | $ | 11,206,586 | $ | 7,802,060 | $ | 6,710,026 | $ | 6,111,957 | $ | 5,870,776 | |||||||||||||||||||
| Total debt | $ | 4,757,076 | $ | 3,434,402 | $ | 3,124,303 | $ | 3,079,238 | $ | 3,110,042 | |||||||||||||||||||
| Total liabilities | $ | 5,314,879 | $ | 3,848,104 | $ | 3,479,112 | $ | 3,405,204 | $ | 3,441,605 | |||||||||||||||||||
(1)
Financial information has been revised to reflect certain reclassifications in prior periods to conform to current period presentation.
44
SUN COMMUNITIES, INC.
ITEM 7. MANAGEMENT’S DISCUSSION AND ANALYSIS OF FINANCIAL CONDITION AND RESULTS OF OPERATIONS
The following discussion and analysis of the consolidated financial condition and results of operations should be read in conjunction with the Consolidated Financial Statements and accompanying footnotes thereto included in this Annual Report on Form 10-K. In addition to the results presented in accordance with GAAP below, we have provided NOI and FFO as supplemental performance measures. Refer to
Non-GAAP Financial Measures
in this Item 7 for additional information.
OVERVIEW
We are a fully integrated, self-administered and self-managed REIT. As of December 31, 2020, we owned and operated or held an interest in a portfolio of 552 developed properties located in 39 states throughout the United States and one province in Canada, including 276 MH communities, 136 RV resorts, 34 properties containing both MH and RV sites, and 106 marinas. We have been in the business of acquiring, operating, developing, and expanding MH communities and RV resorts since 1975, and marinas since 2020. We lease individual sites with utility access for placement of manufactured homes, RVs or boats to our customers. We are also engaged through SHS in the marketing, selling, and leasing of new and pre-owned homes to current and future residents in our communities. The operations of SHS support and enhance our occupancy levels, property performance and cash flows.
COVID-19 IMPACT
The execution of our operational and financial plans has helped to mitigate the impact of COVID-19 on our business. As of December 31, 2020, only certain properties in California were subject to COVID-19 operating restrictions.
We continue to provide essential services using social distancing techniques and minimal contact. To promote social distancing, we are encouraging our residents to use our online rent payment portals and other payment methods. We have instituted numerous health and safety measures at our communities and our Main Office to keep team members safe. These measures include infrared thermometers at entrances to monitor team members’ temperatures, increased cleaning and sanitation of shared spaces and social distancing protocols throughout our footprint. We closely monitor and track orders by federal, state and local authorities and hold regular status calls with our operations and Main Office leadership teams. We have implemented and continue to encourage remote working arrangements, wherever possible, to keep our team members safe and to do our part to promote social distancing.
We are experiencing more traffic at our properties as would be expected with the lifting of shelter-in-place mandates and other travel restrictions and are receiving more applications to live in our MH communities than in the prior year. Demand for short term RV sites has increased as travelers seek drive-to vacation destinations where they have more control over their personal accommodations and are able to enjoy outdoor, socially distanced activities.
We provided a temporary hardship program to those residents who have been economically disadvantaged as a result of COVID-19 for the months of April and May. This hardship program deferred the payment of April and May rent over 12 months, with collections commencing on July 1, 2020. When the program ended in June, we had provided deferred relief of $4.4 million to approximately 4.0 percent of residents in our communities, including owner occupied sites and rental home sites. We accounted for these lease concessions consistent with ASC 842 as if those concessions had already existed in the lease, recognizing rental income and increasing resident lease receivables as the payments accrue. The deferrals impacted the timing, not the overall amount of lease payments due.
We halted increases to our monthly rental rates for a period of time but have resumed our rent increase process.
We remain committed to assisting individuals who are in the process of leasing a site, a wet slip, a dry storage space, or purchasing a home, while maintaining health and safety protocols including following strict social distancing. Virtual viewings of homes are being utilized to avoid or minimize contact.
The extent to which the COVID-19 pandemic impacts our operations, financial condition and financial results will depend on future developments, which are highly uncertain and cannot be predicted with confidence, including the scope, severity and duration of the pandemic, the actions taken to contain the pandemic or mitigate its impact, and the direct and indirect economic effects of the pandemic and containment measures, among others. The uncertainty of this situation precludes any prediction as to the full impact of the COVID-19 pandemic.
45
SUN COMMUNITIES, INC.
EXECUTIVE SUMMARY
2020 General Overview
•
Total revenues for 2020 increased 10.6 percent to $1.4 billion.
•
In October 2020, we acquired Safe Harbor for $2.0 billion, our largest acquisition to date. The Safe Harbor portfolio was comprised of 99 properties located in prime coastal markets with over 38,800 total wet slips and dry storage spaces.
•
Including Safe Harbor, we acquired 130 properties, totaling over 45,800 MH and RV sites and marina wet slips and dry storage spaces for a total purchase price of $3.0 billion.
•
Core FFO for 2020 was $5.09 per diluted share and OP unit, an increase of 3.5 percent over 2019.
•
Achieved Same Community NOI growth of 4.0 percent.
•
Attained Same Community occupancy of 98.8 percent.
•
Gained 2,505 revenue producing sites.
•
Brokered homes sales increased by 14.6 percent to 2,557 in 2020 as compared to 2,231 in 2019.
•
Achieved 1-year, 3-year and 5-year total shareholder return of 3.6 percent, 76.5 percent and 155.1 percent, respectively, outperforming the MSCI US REIT, Russell 1000, U.S. REIT Residential, and S&P 500 indexes.
•
Delivered over 300 total expansion sites in eight MH and RV properties.
•
Completed the construction of over 1,000 total sites at four ground-up developments and one re-development property.
•
Closed two underwritten registered public offerings for proceeds net of offering related expenses totaling approximately $1.9 billion.
•
Our successful execution of our operational and financial plans has helped us mitigate the impact of COVID-19.
Property Operations
Occupancy in our MH and annual RV properties, as well as our ability to increase rental rates, directly affect revenues. Our revenue streams are predominantly derived from customers renting our sites on a long-term basis. Our Same Community properties continue to achieve revenue and occupancy increases which drive continued NOI growth. We continue to sell homes at a high level in our communities and expect this trend to continue.
| Year Ended | ||||||||||||||||||||
| Portfolio Information: | December 31, 2020 | December 31, 2019 | December 31, 2018 | |||||||||||||||||
|
Occupancy % - Total Portfolio - MH and Annual RV blended
(1)
|
98.3 | % | 98.3 | % | 96.1 | % | ||||||||||||||
|
Occupancy % - Same Community - MH and Annual RV blended
(1)(2)(3)
|
98.8 | % | 98.4 | % | 98.0 | % | ||||||||||||||
| Core FFO | $ | 5.09 | $ | 4.92 | $ | 4.58 | ||||||||||||||
|
NOI - Total Portfolio
(in thousands)
|
$ | 649,233 | $ | 586,649 | $ | 524,178 | ||||||||||||||
|
NOI - Same Community
(in thousands)
|
$ | 592,772 | $ | 551,492 | $ | 512,357 | ||||||||||||||
| Homes Sold | 2,866 | 3,439 | 3,629 | |||||||||||||||||
| Number of Occupied Rental Homes | 11,752 | 11,325 | 10,994 | |||||||||||||||||
(1)
Occupancy percent includes annual RV sites and excludes transient RV sites.
(2)
Occupancy percent excludes recently completed but vacant expansion sites.
(3)
Same community is based on the as reported year end same community count for each respective year.
46
SUN COMMUNITIES, INC.
Acquisition Activity
During the past three years, we have completed acquisitions of over 190 properties with over 24,200 sites and over 38,800 wet slips and dry storage spaces located in high growth areas and retirement and vacation destinations such as California, Florida, Texas, Arizona and the Eastern United States coastal areas.
During 2020, we acquired 24
(1)
MH communities and RV resorts, and 106
(1)
marinas, as detailed below:
| MH & RV Property Name | Property Type | Sites | Development Sites | State | Month Acquired | |||||||||||||||||||||||||||
| Cape Cod | RV | 230 | — | MA | January | |||||||||||||||||||||||||||
| Jellystone Natural Bridge | RV | 299 | — | VA | February | |||||||||||||||||||||||||||
| Forest Springs | MH | 372 | — | CA | May | |||||||||||||||||||||||||||
| Crown Villa | RV | 123 | — | OR | June | |||||||||||||||||||||||||||
| Flamingo Lake | RV | 421 | — | FL | July | |||||||||||||||||||||||||||
| Woodsmoke | RV | 300 | — | FL | September | |||||||||||||||||||||||||||
| Jellystone Lone Star | RV | 344 | — | TX | September | |||||||||||||||||||||||||||
| El Capitan & Ocean Mesa | RV | 266 | 109 | CA | September | |||||||||||||||||||||||||||
| Highland Green Estates & Troy Villa | MH | 1,162 | — | MI | September | |||||||||||||||||||||||||||
| Gig Harbor | RV | 115 | — | WA | November | |||||||||||||||||||||||||||
| Maine MH Portfolio | MH | 1,083 | — | ME | November | |||||||||||||||||||||||||||
| Mouse Mountain | MH / RV | 304 | — | FL | December | |||||||||||||||||||||||||||
| Lakeview Mobile Estates | MH | 296 | — | CA | December | |||||||||||||||||||||||||||
| Shenandoah Acres | RV | 522 | — | VA | December | |||||||||||||||||||||||||||
| Jellystone at Barton Lake | RV | 555 | — | IN | December | |||||||||||||||||||||||||||
| Kittatinny Portfolio | RV | 527 | — | NY & PA | December | |||||||||||||||||||||||||||
| Total | 6,919 | 109 | ||||||||||||||||||||||||||||||
| Marina Property Name | Property Type | Wet Slips & Dry Storage | State | Month Acquired | ||||||||||||||||||||||
| Safe Harbor Marinas | Marina | 37,305 | Various | October | ||||||||||||||||||||||
| Safe Harbor Hideaway Bay | Marina | 628 | GA | November | ||||||||||||||||||||||
| Safe Harbor Anacapa Isle | Marina | 453 | CA | December | ||||||||||||||||||||||
| Annapolis | Marina | 184 | MD | December | ||||||||||||||||||||||
| Wickford | Marina | 60 | RI | December | ||||||||||||||||||||||
| Rybovich Portfolio | Marina | 78 | FL | December | ||||||||||||||||||||||
| Rockland | Marina | 173 | ME | December | ||||||||||||||||||||||
| 38,881 | ||||||||||||||||||||||||||
(1)
Refer to Note 3, “Real Estate Acquisitions and Dispositions,” for information on the acquisition of the Southfield office space not included in the table above, and additional detail on the acquisition of MH, RV and marina.
Disposition Activity
On July 1, 2020, we sold a manufactured home community located in Montana, containing 226 sites, for $12.6 million. The gain from the sale of the property was $5.6 million.
Construction Activity
There are 10,025 additional MH and RV sites suitable for development. In 2021, we expect to construct and expand between 1,150 - 1,600 additional sites.
Ground-up Developments -
During the year ended December 31, 2020, we constructed over 1,000 total sites at four ground-up development properties and one re-development located in Colorado, North Carolina and South Carolina.
47
SUN COMMUNITIES, INC.
Expansions -
We have been focused on expansion opportunities adjacent to our existing properties, and we have developed over 2,800 sites within the past three years. We have expanded over 300 total sites at eight MH and RV properties in 2020. We continue to expand our properties utilizing our inventory of owned and entitled land (approximately 10,000 sites available for development in 82 communities).
Markets
Our MH and RV properties are largely concentrated in Florida, Michigan, Texas and California. We have expanded our market share in multiple states through recent acquisitions and increased our property holdings in high growth areas of the U.S. including retirement and vacation destinations.
We have also experienced strong revenue growth through recent acquisitions of RV resorts. The age demographic of RV resorts is attractive, as the population of retirement age baby boomers in the U.S. is growing. RV resorts have become a trending vacation opportunity not only for the retiree population, but as an affordable vacation alternative for families and millennials.
The following table identifies our MH and RV markets by total sites:
| December 31, 2020 | December 31, 2019 | |||||||||||||||||||||||||||||||||||||
| Major Market | Number of Properties | Total Sites | % of Total Sites | Number of Properties | Total Sites | % of Total Sites | ||||||||||||||||||||||||||||||||
| Florida | 128 | 45,814 | 30.7 | % | 125 | 44,695 | 31.6 | % | ||||||||||||||||||||||||||||||
| Michigan | 74 | 29,632 | 19.8 | % | 72 | 28,475 | 20.2 | % | ||||||||||||||||||||||||||||||
| Texas | 24 | 9,576 | 6.4 | % | 23 | 9,238 | 6.5 | % | ||||||||||||||||||||||||||||||
| California | 35 | 8,906 | 6.0 | % | 31 | 7,933 | 5.6 | % | ||||||||||||||||||||||||||||||
| Arizona | 14 | 5,660 | 3.8 | % | 13 | 5,660 | 4.0 | % | ||||||||||||||||||||||||||||||
| New York | 9 | 2,841 | 1.9 | % | 8 | 2,314 | 1.6 | % | ||||||||||||||||||||||||||||||
| Connecticut | 16 | 2,005 | 1.3 | % | 16 | 2,005 | 1.4 | % | ||||||||||||||||||||||||||||||
| Ontario, Canada | 15 | 5,056 | 3.4 | % | 15 | 4,970 | 3.5 | % | ||||||||||||||||||||||||||||||
| Ohio | 9 | 2,925 | 2.0 | % | 9 | 2,920 | 2.1 | % | ||||||||||||||||||||||||||||||
| Indiana | 12 | 4,176 | 2.8 | % | 11 | 3,621 | 2.6 | % | ||||||||||||||||||||||||||||||
| Georgia | 4 | 1,355 | 0.9 | % | 4 | 1,355 | 1.0 | % | ||||||||||||||||||||||||||||||
| Maryland | 6 | 1,852 | 1.2 | % | 6 | 1,825 | 1.3 | % | ||||||||||||||||||||||||||||||
| South Carolina | 6 | 2,503 | 1.7 | % | 6 | 2,285 | 1.6 | % | ||||||||||||||||||||||||||||||
| New Jersey | 8 | 3,160 | 2.1 | % | 8 | 3,159 | 2.2 | % | ||||||||||||||||||||||||||||||
| North Carolina | 5 | 1,083 | 0.7 | % | 5 | 954 | 0.7 | % | ||||||||||||||||||||||||||||||
| Colorado | 10 | 3,415 | 2.3 | % | 10 | 2,714 | 1.9 | % | ||||||||||||||||||||||||||||||
| Maine | 13 | 2,995 | 2.0 | % | 7 | 1,911 | 1.4 | % | ||||||||||||||||||||||||||||||
| Massachusetts | 3 | 928 | 0.6 | % | 2 | 671 | 0.5 | % | ||||||||||||||||||||||||||||||
| New Hampshire | 10 | 2,237 | 1.5 | % | 10 | 2,236 | 1.6 | % | ||||||||||||||||||||||||||||||
| Illinois | 5 | 2,151 | 1.4 | % | 5 | 2,150 | 1.5 | % | ||||||||||||||||||||||||||||||
| Virginia | 8 | 1,875 | 1.3 | % | 6 | 1,084 | 0.8 | % | ||||||||||||||||||||||||||||||
| Delaware | 4 | 1,709 | 1.1 | % | 4 | 1,709 | 1.2 | % | ||||||||||||||||||||||||||||||
| Pennsylvania | 5 | 1,535 | 1.0 | % | 4 | 1,534 | 1.1 | % | ||||||||||||||||||||||||||||||
| Tennessee | 2 | 545 | 0.4 | % | 3 | 700 | 0.5 | % | ||||||||||||||||||||||||||||||
| Oregon | 5 | 1,200 | 0.8 | % | 4 | 1,077 | 0.8 | % | ||||||||||||||||||||||||||||||
| Missouri | 2 | 976 | 0.7 | % | 2 | 976 | 0.7 | % | ||||||||||||||||||||||||||||||
| Alabama | 1 | 142 | 0.1 | % | 1 | 142 | 0.1 | % | ||||||||||||||||||||||||||||||
| Utah | 5 | 750 | 0.5 | % | 5 | 753 | 0.5 | % | ||||||||||||||||||||||||||||||
| Wisconsin | 2 | 588 | 0.4 | % | 2 | 588 | 0.4 | % | ||||||||||||||||||||||||||||||
| Minnesota | 1 | 475 | 0.3 | % | 1 | 475 | 0.3 | % | ||||||||||||||||||||||||||||||
48
SUN COMMUNITIES, INC.
| December 31, 2020 | December 31, 2019 | |||||||||||||||||||||||||||||||||||||
| Major Market | Number of Properties | Total Sites | % of Total Sites | Number of Properties | Total Sites | % of Total Sites | ||||||||||||||||||||||||||||||||
| Mississippi | 1 | 155 | 0.1 | % | N/A | N/A | N/A | |||||||||||||||||||||||||||||||
| Iowa | 1 | 413 | 0.3 | % | 1 | 413 | 0.3 | % | ||||||||||||||||||||||||||||||
| Nevada | 1 | 324 | 0.2 | % | 1 | 324 | 0.2 | % | ||||||||||||||||||||||||||||||
| Louisiana | 1 | 226 | 0.2 | % | 1 | 201 | 0.1 | % | ||||||||||||||||||||||||||||||
| Washington | 1 | 112 | 0.1 | % | N/A | N/A | N/A | |||||||||||||||||||||||||||||||
| Montana | — | — | — | % | 1 | 226 | 0.2 | % | ||||||||||||||||||||||||||||||
| 446 | 149,295 | 422 | 141,293 | |||||||||||||||||||||||||||||||||||
Our marinas are largely concentrated in Florida, Connecticut, Rhode Island and New York.
The following table identifies our marina markets by total wet slips and dry storage spaces:
| December 31, 2020 | ||||||||||||||||||||||||||||||||
| Major Market | Number of Properties | Wet Slips |
Dry Storage
|
Total Wet Slips / Dry Storages
|
% Wet Slips / Dry Storages
|
|||||||||||||||||||||||||||
| Florida | 14 | 1,936 | 1,637 | 3,573 | 9.2 | % | ||||||||||||||||||||||||||
| Connecticut | 11 | 3,254 | — | 3,254 | 8.4 | % | ||||||||||||||||||||||||||
| Rhode Island | 11 | 2,690 | — | 2,690 | 6.9 | % | ||||||||||||||||||||||||||
| New York | 8 | 2,556 | 64 | 2,620 | 6.7 | % | ||||||||||||||||||||||||||
| Maryland | 8 | 1,881 | 188 | 2,069 | 5.3 | % | ||||||||||||||||||||||||||
| Other | 54 | 17,213 | 7,462 | 24,675 | 63.5 | % | ||||||||||||||||||||||||||
| 106 | 29,530 | 9,351 | 38,881 | |||||||||||||||||||||||||||||
49
SUN COMMUNITIES, INC.
NON-GAAP FINANCIAL MEASURES
In addition to the results reported in accordance with GAAP in our “Results of Operations” below, we have provided information regarding net operating income (“NOI”) and funds from operations (“FFO”) as supplemental performance measures. We believe NOI and FFO are appropriate measures given their wide use by and relevance to investors and analysts following the real estate industry. NOI provides a measure of rental operations and does not factor in depreciation, amortization and non-property specific expenses such as general and administrative expenses. FFO, reflecting the assumption that real estate values rise or fall with market conditions, principally adjusts for the effects of GAAP depreciation / amortization of real estate assets. In addition, NOI and FFO are commonly used in various ratios, pricing multiples / yields and returns and valuation calculations used to measure financial position, performance and value.
NOI is derived from revenues minus property operating expenses and real estate taxes. NOI is a non-GAAP financial measure that we believe is helpful to investors as a supplemental measure of operating performance because it is an indicator of the return on property investment and provides a method of comparing property performance over time. We use NOI as a key measure when evaluating performance and growth of particular properties and / or groups of properties. The principal limitation of NOI is that it excludes depreciation, amortization, interest expense and non-property specific expenses such as general and administrative expenses, all of which are significant costs. Therefore, NOI is a measure of the operating performance of our properties rather than of the Company overall.
We believe that GAAP net income (loss) is the most directly comparable measure to NOI. NOI should not be considered to be an alternative to GAAP net income (loss) as an indication of our financial performance or GAAP cash flow from operating activities as a measure of our liquidity; nor is it indicative of funds available for our cash needs, including our ability to make cash distributions. Because of the inclusion of items such as interest, depreciation and amortization, the use of GAAP net income (loss) as a performance measure is limited as these items may not accurately reflect the actual change in market value of a property, in the case of depreciation and in the case of interest, may not necessarily be linked to the operating performance of a real estate asset, as it is often incurred at a parent company level and not at a property level.
FFO is defined by the National Association of Real Estate Investment Trusts (“NAREIT”) as GAAP net income (loss), excluding gains (or losses) from sales of depreciable operating property, plus real estate related depreciation and amortization, real estate related impairments, and after adjustments for unconsolidated partnerships and joint ventures. FFO is a non-GAAP financial measure that management believes is a useful supplemental measure of our operating performance. By excluding gains and losses related to sales of previously depreciated operating real estate assets, impairment and excluding real estate asset depreciation and amortization (which can vary among owners of identical assets in similar condition based on historical cost accounting and useful life estimates), FFO provides a performance measure that, when compared period-over-period, reflects the impact to operations from trends in occupancy rates, rental rates, and operating costs, providing perspective not readily apparent from GAAP net income (loss). Management believes the use of FFO has been beneficial in improving the understanding of operating results of REITs among the investing public and making comparisons of REIT operating results more meaningful. We also use FFO excluding certain gain and loss items that management considers unrelated to the operational and financial performance of our core business (“Core FFO”). We believe that Core FFO provides enhanced comparability for investor evaluations of period-over-period results.
We believe that GAAP net income (loss) is the most directly comparable measure to FFO. The principal limitation of FFO is that it does not replace GAAP net income (loss) as a performance measure or GAAP cash flow from operations as a liquidity measure. Because FFO excludes significant economic components of GAAP net income (loss) including depreciation and amortization, FFO should be used as a supplement to GAAP net income (loss) and not as an alternative to it. Further, FFO is not intended as a measure of a REIT’s ability to meet debt principal repayments and other cash requirements, nor as a measure of working capital. FFO is calculated in accordance with our interpretation of standards established by NAREIT, which may not be comparable to FFO reported by other REITs that interpret the NAREIT definition differently.
50
SUN COMMUNITIES, INC.
RESULTS OF OPERATIONS
We report operating results under two segments: Real Property Operations and Home Sales and Rentals. The Real Property Operations segment owns, operates, develops, or has an interest in, a portfolio of MH communities, RV resorts and marinas throughout the U.S. and in Canada, and is in the business of acquiring, operating, and expanding MH communities, RV resorts and marinas. The Home Sales and Rentals segment offers MH and RV park model sales and leasing services to tenants and prospective tenants of our communities. We evaluate segment operating performance based on NOI and gross profit. Refer to Note 11, “Segment Reporting,” in our accompanying Consolidated Financial Statements for additional information.
Summary Statements of Operations
The following tables reconcile the Net income attributable to Sun Communities, Inc. common stockholders to NOI and summarize our consolidated financial results for the years ended December 31, 2020, 2019, and 2018 (in thousands):
| Year Ended | ||||||||||||||||||||
| December 31, 2020 | December 31, 2019 | December 31, 2018 | ||||||||||||||||||
| Net Income Attributable to Sun Communities, Inc. Common Stockholders | $ | 131,614 | $ | 160,265 | $ | 105,493 | ||||||||||||||
| Interest income | (10,119) | (17,857) | (20,852) | |||||||||||||||||
| Brokerage commissions and other revenues, net | (17,230) | (14,127) | (6,205) | |||||||||||||||||
| Home selling expenses | 15,134 | 14,690 | 15,722 | |||||||||||||||||
| General and administrative expenses | 111,288 | 93,964 | 81,429 | |||||||||||||||||
| Catastrophic weather-related charges, net | 885 | 1,737 | 92 | |||||||||||||||||
| Business combination expense | 23,008 | — | — | |||||||||||||||||
| Depreciation and amortization | 376,876 | 328,067 | 287,262 | |||||||||||||||||
|
Loss on extinguishment of debt (see Note 8)
|
5,209 | 16,505 | 1,190 | |||||||||||||||||
| Interest expense | 129,071 | 133,153 | 130,556 | |||||||||||||||||
| Interest on mandatorily redeemable preferred OP units / equity | 4,177 | 4,698 | 3,694 | |||||||||||||||||
| (Gain) / loss on remeasurement of marketable securities | (6,129) | (34,240) | 3,639 | |||||||||||||||||
| (Gain) / loss on foreign currency translation | (8,039) | (4,557) | 8,234 | |||||||||||||||||
| Gain on disposition of property | (5,595) | — | — | |||||||||||||||||
| Other (income) / expense, net | 3,768 | 1,100 | (1,781) | |||||||||||||||||
|
Loss on remeasurement of notes receivable (see Note 4)
|
3,275 | — | — | |||||||||||||||||
|
Income from nonconsolidated affiliates (see Note 6)
|
(1,740) | (1,374) | (790) | |||||||||||||||||
|
Loss on remeasurement of investment in nonconsolidated affiliates (see Note 6)
|
1,608 | — | — | |||||||||||||||||
|
Current tax expense (see Note 12)
|
790 | 1,095 | 595 | |||||||||||||||||
|
Deferred tax benefit (see Note 12)
|
(1,565) | (222) | (507) | |||||||||||||||||
| Preferred return to preferred OP units / equity | 6,935 | 6,058 | 4,486 | |||||||||||||||||
| Income attributable to noncontrolling interests | 8,902 | 9,768 | 8,443 | |||||||||||||||||
| Preferred stock distribution | — | 1,288 | 1,736 | |||||||||||||||||
| NOI / Gross Profit | $ | 772,123 | $ | 700,011 | $ | 622,436 | ||||||||||||||
| Year Ended | ||||||||||||||||||||
| December 31, 2020 | December 31, 2019 | December 31, 2018 | ||||||||||||||||||
| Real Property NOI | $ | 649,233 | $ | 586,649 | $ | 524,178 | ||||||||||||||
| Home Sales NOI / Gross Profit | 43,815 | 47,579 | 42,698 | |||||||||||||||||
| Rental Program NOI | 115,283 | 104,382 | 95,968 | |||||||||||||||||
| Ancillary NOI / Gross Profit | 38,615 | 30,206 | 25,207 | |||||||||||||||||
|
Site rent from Rental Program (included in Real Property NOI)
(1)
|
(74,823) | (68,805) | (65,615) | |||||||||||||||||
| NOI / Gross Profit | $ | 772,123 | $ | 700,011 | $ | 622,436 | ||||||||||||||
(1)
The renter’s monthly payment includes the site rent and an amount attributable to the home lease. The site rent is reflected in Real Property Operations’ segment revenue. For purposes of management analysis, site rent is included in Rental Program revenue to evaluate the incremental revenue gains associated with the implementation of the Rental Program, and to assess the overall growth and performance of the Rental Program and the financial impact on our operations.
51
SUN COMMUNITIES, INC.
Comparison of the Years Ended December 31, 2020
,
2019 and 2018
Real Property Operations - Total Portfolio
The following tables reflect certain financial and other information for our Total Portfolio as of and for the years ended December 31, 2020, 2019 and 2018:
| Year Ended | Year Ended | ||||||||||||||||||||||||||||||||||||||||||||||
|
Financial Information
(in thousands) |
December 31, 2020 |
December 31, 2019
(1)
|
Change | % Change |
December 31, 2019
(1)
|
December 31, 2018
(1)
|
Change | % Change | |||||||||||||||||||||||||||||||||||||||
| Income from real property | $ | 1,030,636 | $ | 914,907 | $ | 115,729 | 12.6 | % | $ | 914,907 | $ | 816,830 | $ | 98,077 | 12.0 | % | |||||||||||||||||||||||||||||||
| Property operating expenses | |||||||||||||||||||||||||||||||||||||||||||||||
| Payroll and benefits | 101,245 | 88,085 | 13,160 | 14.9 | % | 88,085 | 74,653 | 13,432 | 18.0 | % | |||||||||||||||||||||||||||||||||||||
| Legal, taxes, and insurance | 12,704 | 10,778 | 1,926 | 17.9 | % | 10,778 | 9,524 | 1,254 | 13.2 | % | |||||||||||||||||||||||||||||||||||||
| Utilities | 116,182 | 101,910 | 14,272 | 14.0 | % | 101,910 | 93,205 | 8,705 | 9.3 | % | |||||||||||||||||||||||||||||||||||||
| Supplies and repairs | 39,692 | 34,663 | 5,029 | 14.5 | % | 34,663 | 28,594 | 6,069 | 21.2 | % | |||||||||||||||||||||||||||||||||||||
|
Other
(2)
|
38,974 | 30,942 | 8,032 | 26.0 | % | 30,942 | 30,121 | 821 | 2.7 | % | |||||||||||||||||||||||||||||||||||||
| Real estate taxes | 72,606 | 61,880 | 10,726 | 17.3 | % | 61,880 | 56,555 | 5,325 | 9.4 | % | |||||||||||||||||||||||||||||||||||||
| Property operating expenses | 381,403 | 328,258 | 53,145 | 16.2 | % | 328,258 | 292,652 | 35,606 | 12.2 | % | |||||||||||||||||||||||||||||||||||||
| Real Property NOI | $ | 649,233 | $ | 586,649 | $ | 62,584 | 10.7 | % | $ | 586,649 | $ | 524,178 | $ | 62,471 | 11.9 | % | |||||||||||||||||||||||||||||||
(1)
Canadian currency figures included within the year ended December 31, 2019 and 2018 have been translated at 2020 and 2019 average exchange rates, respectively.
(2)
Includes COVID-19 personal protective equipment expense of $2.9 million for the year ended December 31, 2020.
| As of | As of | |||||||||||||||||||||||||||||||||||||||||||
| Other Information | December 31, 2020 | December 31, 2019 | Change | December 31, 2019 | December 31, 2018 | Change | ||||||||||||||||||||||||||||||||||||||
|
Number of properties
(1)
|
552 | 422 | 130 | 422 | 371 | 51 | ||||||||||||||||||||||||||||||||||||||
| MH occupancy | 96.6 | % | 95.5 | % | ||||||||||||||||||||||||||||||||||||||||
|
RV occupancy
(2)
|
100.0 | % | 100.0 | % | ||||||||||||||||||||||||||||||||||||||||
|
MH & RV blended occupancy
(3)
|
97.3 | % | 96.4 | % | 0.9 | % | 96.4 | % | 96.1 | % | 0.3 | % | ||||||||||||||||||||||||||||||||
|
Adjusted MH occupancy
(4)
|
97.8 | % | 97.8 | % | ||||||||||||||||||||||||||||||||||||||||
|
Adjusted RV occupancy
(5)
|
100.0 | % | 100.0 | % | ||||||||||||||||||||||||||||||||||||||||
|
Adjusted MH & RV blended occupancy
(6)
|
98.3 | % | 98.3 | % | — | % | 98.3 | % | 98.0 | % | 0.3 | % | ||||||||||||||||||||||||||||||||
| Sites available for MH & RV development | 10,025 | 10,293 | (268) | 10,293 | 11,258 | (965) | ||||||||||||||||||||||||||||||||||||||
| Monthly base rent per site - MH | $ | 588 | $ | 571 |
(8)
|
$ | 17 | $ | 571 | $ | 554 |
(8)
|
$ | 17 | ||||||||||||||||||||||||||||||
|
Monthly base rent per site - RV
(7)
|
$ | 513 | $ | 486 |
(8)
|
$ | 27 | $ | 485 | $ | 458 |
(8)
|
$ | 27 | ||||||||||||||||||||||||||||||
| Monthly base rent per site - Total | $ | 571 | $ | 552 |
(8)
|
$ | 19 | $ | 551 | $ | 432 |
(8)
|
$ | 119 | ||||||||||||||||||||||||||||||
(1)
Include MH communities, RV resorts and marinas.
(2)
Occupancy percentages include annual RV sites and exclude transient RV sites.
(3)
Occupancy percentages include MH and annual RV sites, and exclude transient RV sites.
(4)
Adjusted occupancy percentages include MH and exclude recently completed but vacant expansion sites.
(5)
Adjusted occupancy percentages include annual RV sites, and exclude transient RV sites and recently completed but vacant expansion sites.
(6)
Adjusted occupancy percentages include MH and annual RV sites, and exclude transient RV sites and recently completed but vacant expansion sites.
(7)
Monthly base rent pertains to annual RV sites and excludes transient RV sites.
(8)
Canadian currency figures included within the year ended December 31, 2019 and 2018 have been translated at 2020 and 2019 average exchange rates, respectively.
The $62.6 million increase in Real Property NOI from 2019 to 2020 consists of $22.6 million from Same Communities as detailed below and $40.0 million from recently acquired properties in the year ended December 31, 2020 as compared to 2019.
52
SUN COMMUNITIES, INC.
The $62.5 million increase in Real Property NOI from 2018 to 2019 consists of $37.7 million from Same Communities as detailed below and $24.8 million from recently acquired properties in the years ended December 31, 2019 as compared to 2018.
Real Property Operations - Same Communities
A key management tool used when evaluating performance and growth of our properties is a comparison of Same Communities. Same communities refer to properties that we have owned for at least the preceding year. The Same Community data may change from time-to-time depending on acquisitions, dispositions, management discretion, significant transactions, or unique situations. In order to evaluate the growth of the Same Communities, management has classified certain items differently than our GAAP statements. The reclassification difference between our GAAP statements and our Same Community portfolio is the reclassification of water and sewer revenues from income from real property to utilities. A significant portion of our utility charges are re-billed to our residents. For the years ended December 31, 2020 and 2019, Canadian currency figures included within the year ended December 31, 2019 have been translated at 2020 average exchange rates. For the years ended December 31, 2019 and 2018, Canadian currency figures included within the year ended December 31, 2018 have been translated at 2019 average exchange rates.
| Year Ended | Year Ended | ||||||||||||||||||||||||||||||||||||||||||||||
|
Financial Information
(in thousands) |
December 31, 2020 | December 31, 2019 | Change | % Change | December 31, 2019 | December 31, 2018 | Change | % Change | |||||||||||||||||||||||||||||||||||||||
|
Income from real property
(1)
|
$ | 876,981 | $ | 846,231 | $ | 30,750 | 3.6 | % | $ | 799,178 | $ | 752,324 | $ | 46,854 | 6.2 | % | |||||||||||||||||||||||||||||||
| Property operating expenses | |||||||||||||||||||||||||||||||||||||||||||||||
| Payroll and benefits | 81,897 | 82,727 | (830) | (1.0) | % | 72,519 | 68,630 | 3,889 | 5.7 | % | |||||||||||||||||||||||||||||||||||||
| Legal, taxes, and insurance | 10,860 | 10,351 | 509 | 4.9 | % | 9,579 | 9,212 | 367 | 4.0 | % | |||||||||||||||||||||||||||||||||||||
| Utilities | 66,214 | 63,410 | 2,804 | 4.4 | % | 58,044 | 57,309 | 735 | 1.3 | % | |||||||||||||||||||||||||||||||||||||
|
Supplies and repairs
(2)
|
33,616 | 33,153 | 463 | 1.4 | % | 30,025 | 27,158 | 2,867 | 10.6 | % | |||||||||||||||||||||||||||||||||||||
|
Other
(3)
|
27,916 | 26,738 | 1,178 | 4.4 | % | 19,966 | 20,535 | (569) | (2.8) | % | |||||||||||||||||||||||||||||||||||||
| Real estate taxes | 63,706 | 59,649 | 4,057 | 6.8 | % | 57,553 | 55,667 | 1,886 | 3.4 | % | |||||||||||||||||||||||||||||||||||||
| Property operating expenses | 284,209 | 276,028 | 8,181 | 3.0 | % | 247,686 | 238,511 | 9,175 | 3.8 | % | |||||||||||||||||||||||||||||||||||||
| Real Property NOI | $ | 592,772 | $ | 570,203 | $ | 22,569 | 4.0 | % | $ | 551,492 | $ | 513,813 | $ | 37,679 | 7.3 | % | |||||||||||||||||||||||||||||||
(1)
We adopted ASC 842, the new lease accounting standard, as of January 1, 2019 which required the reclassification of bad debt expense from Property operating expense to Income from real property. To assist with comparability within Same Community results, bad debt expense has been reclassified to be shown as a reduction of Income from real property for all periods presented.
(2)
For the comparative periods December 31, 2020 and 2019, the year ended 2019 excludes less than $0.1 million of expenses incurred for recently acquired properties to bring the properties up to our operating standards. For the comparative periods December 31, 2019 and 2018, the year ended 2018 excludes $0.7 million of expenses incurred for recently acquired properties to bring the properties up to our operating standards. These costs did not meet our capitalization policy.
(3)
Includes COVID-19 personal protective equipment expense of $2.4 million for the year ended December 31, 2020.
53
SUN COMMUNITIES, INC.
| As of | As of | |||||||||||||||||||||||||||||||||||||
| Other Information | December 31, 2020 | December 31, 2019 | Change | December 31, 2019 | December 31, 2018 | Change | ||||||||||||||||||||||||||||||||
| Number of properties | 367 | 367 | — | 345 | 345 | — | ||||||||||||||||||||||||||||||||
| MH occupancy | 97.4 | % | 95.8 | % | ||||||||||||||||||||||||||||||||||
|
RV occupancy
(1)
|
100.0 | % | 100.0 | % | ||||||||||||||||||||||||||||||||||
|
MH & RV blended occupancy
(2)
|
98.0 | % | 96.7 | % | ||||||||||||||||||||||||||||||||||
|
Adjusted MH occupancy
(3)
|
98.5 | % | 97.9 | % | ||||||||||||||||||||||||||||||||||
|
Adjusted RV occupancy
(4)
|
100.0 | % | 100.0 | % | ||||||||||||||||||||||||||||||||||
|
Adjusted MH & RV blended occupancy
(5)
|
98.8 | % | 97.0 | % |
(66)
|
1.8 | % | 98.4 | % | 96.2 | % |
(6)
|
2.2 | % | ||||||||||||||||||||||||
| Sites available for development | 6,682 | 6,314 | 368 | 6,314 | 7,348 | (1,034) | ||||||||||||||||||||||||||||||||
| Monthly base rent per site - MH | $ | 600 | $ | 580 |
(8)
|
$ | 20 | $ | 577 | $ | 554 |
(8)
|
$ | 23 | ||||||||||||||||||||||||
|
Monthly base rent per site - RV
(7)
|
$ | 514 | $ | 488 |
(8)
|
$ | 26 | $ | 489 | $ | 461 |
(8)
|
$ | 28 | ||||||||||||||||||||||||
| Monthly base rent per site - Total | $ | 579 | $ | 558 |
(8)
|
$ | 21 | $ | 557 | $ | 533 |
(8)
|
$ | 24 | ||||||||||||||||||||||||
(1)
Occupancy percentages include annual RV sites and exclude transient RV sites.
(2)
Occupancy percentages include MH and annual RV sites, and exclude transient RV sites.
(3)
Adjusted occupancy percentages include MH and exclude recently completed but vacant expansion sites.
(4)
Adjusted occupancy percentages include annual RV sites, and exclude transient RV sites and recently completed but vacant expansion sites.
(5)
Adjusted occupancy percentages include MH and annual RV sites, and exclude transient RV sites and recently completed but vacant expansion sites.
(6)
The occupancy percentages for 2019 and 2018 have been adjusted to reflect incremental growth period-over-period from filled MH expansion sites and the conversion of transient RV sites to annual RV sites.
(7)
Monthly base rent pertains to annual RV sites and excludes transient RV sites.
(8)
Canadian currency figures included within the year ended December 31, 2019 and 2018 have been translated at 2020 and 2019 average exchange rates, respectively.
Year ended December 31, 2020 and 2019
The Same Communities data includes all properties which we have owned and operated continuously since January 1, 2019, exclusive of properties recently completed or under construction, and other properties as determined by management. We have reclassified $37.7 million and $34.7 million for the years ended December 31, 2020 and 2019, respectively, from Income form real property to Utilities to reflect the utility expenses associated with our Same Community portfolio net of recovery.
The 4.0 percent growth in NOI is primarily due to increased Income from real property of $30.8 million, or 3.6 percent. The 3.6 percent increase is primarily attributable to a 1.8 percent increase in MH & RV blended occupancy and a 3.8 percent increase in total monthly base rent per site when compared to 2019, offset by discounts and bad debt expense. The increase in Income from real property was partially offset by a $8.2 million, or 3.0 percent, increase in Property operating expenses, primarily attributable to increases in payroll and benefits, supplies and repairs and real estate taxes.
Year ended December 31, 2019 and 2018
The Same Communities data includes all properties which we have owned and operated continuously since January 1, 2018, exclusive of properties recently completed or under construction, and other properties as determined by management. We have reclassified $34.7 million and $32.7 million for the years ended December 31, 2019 and 2018, respectively, from Income from real property to Utilities to reflect the utility expenses associated with our Same Community portfolio net of recovery.
The 7.3 percent growth in NOI is primarily due to increased Income from real property of $46.9 million, or 6.2 percent The 6.2 percent increase is primarily attributable to a 2.2 percent increase in MH & RV blended occupancy and a 4.5 percent increase in total monthly base rent per site when compared to 2018. The increase in Income from real property was partially offset by a $9.2 million, or 3.8 percent, increase in Property operating expenses, primarily attributable to increases in payroll and benefits, supplies and repairs and legal, taxes and insurance expenses.
54
SUN COMMUNITIES, INC.
Home Sales Summary
We purchase new homes and acquire pre-owned and repossessed manufactured homes, generally located within our communities, from lenders, dealers, and former residents to lease or sell to current and prospective residents.
The following table reflects certain financial and statistical information for our Home Sales Program for the years ended December 31, 2020, 2019 and 2018 (in thousands, except for average selling prices and statistical information):
| Year Ended | Year Ended | ||||||||||||||||||||||||||||||||||||||||||||||
| Financial Information | December 31, 2020 | December 31, 2019 | Change | % Change | December 31, 2019 | December 31, 2018 | Change | % Change | |||||||||||||||||||||||||||||||||||||||
| New homes | |||||||||||||||||||||||||||||||||||||||||||||||
| New home sales | $ | 79,728 | $ | 71,760 | $ | 7,968 | 11.1 | % | $ | 71,760 | $ | 59,578 | $ | 12,182 | 20.4 | % | |||||||||||||||||||||||||||||||
| New home cost of sales | 65,533 | 61,557 | 3,976 | 6.5 | % | 61,557 | 51,913 | 9,644 | 18.6 | % | |||||||||||||||||||||||||||||||||||||
|
NOI / Gross Profit –
new homes |
$ | 14,195 | $ | 10,203 | $ | 3,992 | 39.1 | % | $ | 10,203 | $ | 7,665 | $ | 2,538 | 33.1 | % | |||||||||||||||||||||||||||||||
|
Gross margin % –
new homes |
17.8 | % | 14.2 | % | 3.6 | % | 14.2 | % | 12.9 | % | 1.3 | % | |||||||||||||||||||||||||||||||||||
| Average selling price – new homes | $ | 139,874 | $ | 125,674 | $ | 14,200 | 11.3 | % | $ | 125,674 | $ | 113,266 | $ | 12,408 | 11.0 | % | |||||||||||||||||||||||||||||||
| Pre-owned homes | |||||||||||||||||||||||||||||||||||||||||||||||
| Pre-owned home sales | $ | 95,971 | $ | 110,176 | $ | (14,205) | (12.9) | % | $ | 110,176 | $ | 106,453 | $ | 3,723 | 3.5 | % | |||||||||||||||||||||||||||||||
| Pre-owned home cost of sales | 66,351 | 72,800 | (6,449) | (8.9) | % | 72,800 | 71,420 | 1,380 | 1.9 | % | |||||||||||||||||||||||||||||||||||||
|
NOI / Gross Profit –
pre-owned homes |
$ | 29,620 | $ | 37,376 | $ | (7,756) | (20.8) | % | $ | 37,376 | $ | 35,033 | $ | 2,343 | 6.7 | % | |||||||||||||||||||||||||||||||
|
Gross margin % –
pre-owned homes |
30.9 | % | 33.9 | % | (3.0) | % | 33.9 | % | 32.9 | % | 1.0 | % | |||||||||||||||||||||||||||||||||||
| Average selling price – pre-owned homes | $ | 41,799 | $ | 38,416 | $ | 3,383 | 8.8 | % | $ | 38,416 | $ | 34,306 | $ | 4,110 | 12.0 | % | |||||||||||||||||||||||||||||||
| Total home sales | |||||||||||||||||||||||||||||||||||||||||||||||
| Revenue from home sales | $ | 175,699 | $ | 181,936 | $ | (6,237) | (3.4) | % | $ | 181,936 | $ | 166,031 | $ | 15,905 | 9.6 | % | |||||||||||||||||||||||||||||||
| Cost of home sales | 131,884 | 134,357 | (2,473) | (1.8) | % | 134,357 | 123,333 | 11,024 | 8.9 | % | |||||||||||||||||||||||||||||||||||||
|
NOI / Gross Profit –
home sales |
$ | 43,815 | $ | 47,579 | $ | (3,764) | (7.9) | % | $ | 47,579 | $ | 42,698 | $ | 4,881 | 11.4 | % | |||||||||||||||||||||||||||||||
| Statistical Information | |||||||||||||||||||||||||||||||||||||||||||||||
| New home sales volume | 570 | 571 | (1) | (0.2) | % | 571 | 526 | 45 | 8.6 | % | |||||||||||||||||||||||||||||||||||||
| Pre-owned home sales volume | 2,296 | 2,868 | (572) | (19.9) | % | 2,868 | 3,103 | (235) | (7.6) | % | |||||||||||||||||||||||||||||||||||||
| Total home sales volume | 2,866 | 3,439 | (573) | (16.7) | % | 3,439 | 3,629 | (190) | (5.2) | % | |||||||||||||||||||||||||||||||||||||
NOI / Gross Profit - new homes -
For the year ended December 31, 2020, the $4.0 million, or 39.1 percent, increase in gross profit is primarily the result of a 11.3 percent increase in the average selling price, partially offset by an increase in the average cost of homes sold, as compared to 2019.
For the year ended December 31, 2019, the $2.5 million, or 33.1 percent, increase in gross profit is primarily the result of a 8.6 percent increase in new home sales volume coupled with a 11.0 percent increase in the average selling price, as compared to 2018.
NOI / Gross Profit - pre-owned homes -
For the year ended December 31, 2020, the $7.8 million, or 20.8 percent, decrease in gross profit is primarily the result of a 19.9 percent decrease in pre-owned home sales volume, as compared to 2019.
For the year ended December 31, 2019, the $2.3 million, or 6.7 percent, increase in gross profit is primarily the result of a 12.0 percent increase in the average selling price, which is partially offset by a 7.6 percent decrease in pre-owned home sales volume, as compared to 2018.
55
SUN COMMUNITIES, INC.
Rental Program Summary
The following table reflects certain financial and other information for our Rental Program for the years ended December 31, 2020, 2019 and 2018 (in thousands, except for statistical information):
| Year Ended | Year Ended | ||||||||||||||||||||||||||||||||||||||||||||||
| Financial Information | December 31, 2020 | December 31, 2019 | Change | % Change | December 31, 2019 | December 31, 2018 | Change | % Change | |||||||||||||||||||||||||||||||||||||||
| Revenues | |||||||||||||||||||||||||||||||||||||||||||||||
| Rental home revenue | $ | 62,646 | $ | 57,572 | $ | 5,074 | 8.8 | % | $ | 57,572 | $ | 53,657 | $ | 3,915 | 7.3 | % | |||||||||||||||||||||||||||||||
|
Site rent from Rental Program
(1)
|
74,823 | 68,805 | 6,018 | 8.7 | % | 68,805 | 65,615 | 3,190 | 4.9 | % | |||||||||||||||||||||||||||||||||||||
| Rental Program revenue | 137,469 | 126,377 | 11,092 | 8.8 | % | 126,377 | 119,272 | 7,105 | 6.0 | % | |||||||||||||||||||||||||||||||||||||
| Expenses | |||||||||||||||||||||||||||||||||||||||||||||||
| Repairs and refurbishment | 11,886 | 12,591 | (705) | (5.6) | % | 12,591 | 10,456 | 2,135 | 20.4 | % | |||||||||||||||||||||||||||||||||||||
| Taxes and insurance | 8,460 | 7,488 | 972 | 13.0 | % | 7,488 | 6,425 | 1,063 | 16.5 | % | |||||||||||||||||||||||||||||||||||||
| Other | 1,840 | 1,916 | (76) | (4.0) | % | 1,916 | 6,423 | (4,507) | (70.2) | % | |||||||||||||||||||||||||||||||||||||
| Rental Program operating and maintenance | 22,186 | 21,995 | 191 | 0.9 | % | 21,995 | 23,304 | (1,309) | (5.6) | % | |||||||||||||||||||||||||||||||||||||
| Rental Program NOI | $ | 115,283 | $ | 104,382 | $ | 10,901 | 10.4 | % | $ | 104,382 | $ | 95,968 | $ | 8,414 | 8.8 | % | |||||||||||||||||||||||||||||||
| Other Information | |||||||||||||||||||||||||||||||||||||||||||||||
| Number of sold rental homes | 850 | 1,140 | (290) | (25.4) | % | 1,140 | 1,122 | 18 | 1.6 | % | |||||||||||||||||||||||||||||||||||||
|
Number of occupied rentals,
end of period |
11,752 | 11,325 | 427 | 3.8 | % | 11,325 | 10,994 | 331 | 3.0 | % | |||||||||||||||||||||||||||||||||||||
| Investment in occupied rental homes, end of period | $ | 629,162 | $ | 584,771 | $ | 44,391 | 7.6 | % | $ | 584,771 | $ | 530,006 | $ | 54,765 | 10.3 | % | |||||||||||||||||||||||||||||||
| Weighted average monthly rental rate, end of period | $ | 1,042 | $ | 997 | $ | 45 | 4.5 | % | $ | 997 | $ | 949 | $ | 48 | 5.1 | % | |||||||||||||||||||||||||||||||
(1)
The renter’s monthly payment includes the site rent and an amount attributable to the home lease. The site rent is reflected in Real Property Operations’ segment revenue. For purposes of management analysis, site rent is included in Rental Program revenue to evaluate the incremental revenue gains associated with the implementation of the Rental Program, and to assess the overall growth and performance of the Rental Program and the financial impact on our operations.
For the year ended December 31, 2020, Rental Program NOI increased $10.9 million, or 10.4 percent, as compared to 2019. The increase is primarily due to an increase in Rental Program revenue of $11.1 million, or 8.8 percent, primarily attributable to a 4.5 percent increase in the weighted average monthly rental rate and a 3.8 percent increase in the number of occupied rentals.
For the year ended December 31, 2019, Rental Program NOI increased $8.4 million, or 8.8 percent, as compared to 2018. The increase is primarily due to (a) an increase in Rental Program revenue of $7.1 million, or 6.0 percent, primarily attributable to a 5.1 percent increase in weighted average monthly rental rate, and a 3.0 percent increase in the number of occupied rentals, and (b) a decrease in Rental Program operating and maintenance expenses of $1.3 million, or 5.6 percent, resulting primarily from the capitalization of commission expenses under ASC 842 in the year ended December 31, 2019 as compared to 2018.
56
SUN COMMUNITIES, INC.
Other Items - Statements of Operations
(1)
The following table summarizes other income and expenses for the years ended December 31, 2020, 2019 and 2018 (amounts in thousands):
| Year Ended | Year Ended | ||||||||||||||||||||||||||||||||||||||||||||||
| December 31, 2020 | December 31, 2019 | Change | % Change | December 31, 2019 | December 31, 2018 | Change | % Change | ||||||||||||||||||||||||||||||||||||||||
| Ancillary revenues, net | $ | 38,615 | $ | 30,206 | $ | 8,409 | 27.8 | % | $ | 30,206 | $ | 25,207 | $ | 4,999 | 19.8 | % | |||||||||||||||||||||||||||||||
| Interest income | $ | 10,119 | $ | 17,857 | $ | (7,738) | (43.3) | % | $ | 17,857 | $ | 20,852 | $ | (2,995) | (14.4) | % | |||||||||||||||||||||||||||||||
| Brokerage commissions and other revenues, net | $ | 17,230 | $ | 14,127 | $ | 3,103 | 22.0 | % | $ | 14,127 | $ | 6,205 | $ | 7,922 | 127.7 | % | |||||||||||||||||||||||||||||||
| Home selling expenses | $ | 15,134 | $ | 14,690 | $ | 444 | 3.0 | % | $ | 14,690 | $ | 15,722 | $ | (1,032) | (6.6) | % | |||||||||||||||||||||||||||||||
| General and administrative expenses | $ | 111,288 | $ | 93,964 | $ | 17,324 | 18.4 | % | $ | 93,964 | $ | 81,429 | $ | 12,535 | 15.4 | % | |||||||||||||||||||||||||||||||
| Catastrophic weather-related charges, net | $ | 885 | $ | 1,737 | $ | (852) | (49.1) | % | $ | 1,737 | $ | 92 | $ | 1,645 | 1,788.0 | % | |||||||||||||||||||||||||||||||
| Business combination expense | $ | 23,008 | $ | — | $ | 23,008 | N/A | $ | — | $ | — | $ | — | N/A | |||||||||||||||||||||||||||||||||
| Depreciation and amortization | $ | 376,876 | $ | 328,067 | $ | 48,809 | 14.9 | % | $ | 328,067 | $ | 287,262 | $ | 40,805 | 14.2 | % | |||||||||||||||||||||||||||||||
|
Loss on extinguishment of debt (see Note 8)
|
$ | 5,209 | $ | 16,505 | $ | (11,296) | (68.4) | % | $ | 16,505 | $ | 1,190 | $ | 15,315 | 1,287.0 | % | |||||||||||||||||||||||||||||||
| Interest expense | $ | 129,071 | $ | 133,153 | $ | (4,082) | (3.1) | % | $ | 133,153 | $ | 130,556 | $ | 2,597 | 2.0 | % | |||||||||||||||||||||||||||||||
| Interest on mandatorily redeemable preferred OP units / equity | $ | 4,177 | $ | 4,698 | $ | (521) | (11.1) | % | $ | 4,698 | $ | 3,694 | $ | 1,004 | 27.2 | % | |||||||||||||||||||||||||||||||
|
Gain / (loss) on remeasurement of marketable securities (see Note 15)
|
$ | 6,129 | $ | 34,240 | $ | (28,111) | (82.1) | % | $ | 34,240 | $ | (3,639) | $ | 37,879 | (1,040.9) | % | |||||||||||||||||||||||||||||||
| Gain / (loss) on foreign currency translation | $ | 8,039 | $ | 4,557 | $ | 3,482 | 76.4 | % | $ | 4,557 | $ | (8,234) | $ | 12,791 | (155.3) | % | |||||||||||||||||||||||||||||||
| Gain on disposition of property | $ | 5,595 | $ | — | $ | 5,595 | N/A | $ | — | $ | — | $ | — | N/A | |||||||||||||||||||||||||||||||||
| Other income / (expense), net | $ | (3,768) | $ | (1,100) | $ | (2,668) | 242.5 | % | $ | (1,100) | $ | 1,781 | $ | (2,881) | (161.8) | % | |||||||||||||||||||||||||||||||
|
Loss on remeasurement of notes receivable (see Note 4)
|
$ | (3,275) | $ | — | $ | (3,275) | N/A | $ | — | $ | — | $ | — | N/A | |||||||||||||||||||||||||||||||||
|
Income from nonconsolidated affiliates (see Note 6)
|
$ | 1,740 | $ | 1,374 | $ | 366 | 26.6 | % | $ | 1,374 | $ | 790 | $ | 584 | 73.9 | % | |||||||||||||||||||||||||||||||
|
Loss on remeasurement of investment in nonconsolidated affiliates (see Note 6)
|
$ | (1,608) | $ | — | $ | (1,608) | N/A | $ | — | $ | — | $ | — | N/A | |||||||||||||||||||||||||||||||||
|
Current tax expense (see Note 12)
|
$ | (790) | $ | (1,095) | $ | 305 | (27.9) | % | $ | (1,095) | $ | (595) | $ | (500) | 84.0 | % | |||||||||||||||||||||||||||||||
|
Deferred tax benefit (see Note 12)
|
$ | 1,565 | $ | 222 | $ | 1,343 | 605.0 | % | $ | 222 | $ | 507 | $ | (285) | (56.2) | % | |||||||||||||||||||||||||||||||
| Preferred return to preferred OP units / equity | $ | 6,935 | $ | 6,058 | $ | 877 | 14.5 | % | $ | 6,058 | $ | 4,486 | $ | 1,572 | 35.0 | % | |||||||||||||||||||||||||||||||
| Income attributable to noncontrolling interests | $ | 8,902 | $ | 9,768 | $ | (866) | (8.9) | % | $ | 9,768 | $ | 8,443 | $ | 1,325 | 15.7 | % | |||||||||||||||||||||||||||||||
| Preferred stock distribution | $ | — | $ | 1,288 | $ | (1,288) | N/M | $ | 1,288 | $ | 1,736 | $ | (448) | (25.8) | % | ||||||||||||||||||||||||||||||||
(1)
Only items determined by management to be material, of interest, or unique to the periods disclosed above are explained below.
N/M = Percentage change is not meaningful.
Ancillary revenues, net -
for the year ended December 31, 2020, increased primarily due to the addition of boat rental and service revenue and increases in RV resort activity revenues as compared to 2019. For the year ended December 31, 2019, the increase was primarily due to increases in golf course, restaurant, and RV resort activity revenues as compared to 2018.
Interest income -
for the year ended December 31, 2020 and 2019, decreased primarily due to lower balances on our notes receivable and derecognition of collateralized notes receivable in the fourth quarter of 2019. For the year ended December 31, 2019, the decrease was primarily due to lower balances on our notes receivable and derecognition of collateralized notes receivable in 2019 as we satisfied the criteria of paragraph ASC 860-10-40-5 to be accounted for as a sale.
57
SUN COMMUNITIES, INC.
Brokerage commissions and other revenues, net -
for the year ended December 31, 2020, increased primarily due to a $1.6 million increase in brokerage commissions, and a $0.8 million increase in ground lease income, as compared to 2019. For the year ended December 31, 2019, the increase was primarily due to a $3.1 million increase in brokerage commissions, and a $1.8 million increase in dividend income from our investment in marketable securities, as compared to 2018.
General and administrative expenses -
for the year ended December 31, 2020, increased due to an increase in wages and incentives driven by growth in acquisition activity as compared to the same period in 2019, and COVID-19 personal protective equipment expense that did not exist in 2019. For the year ended December 31, 2019, increased primarily due to an increase in wages and incentives driven by growth in acquisitions and our performance as compared to 2018.
Catastrophic weather related charges, net -
for the
year ended December 31, 2020, decreased primarily due to changes in estimates related to damage losses for recent weather events. For the year ended December 31, 2019, increased primarily due to estimated damage losses for recent weather events.
Business combination expenses
- for the year ended December 31, 2020,were incurred as a result of our recent acquisitions of marinas. Refer to Note 3, “Real Estate Acquisitions and Dispositions” of our accompanying Consolidated Financial Statements for additional information.
Depreciation and amortization -
for the year ended December 31, 2020, increased as a result of our recent property acquisitions and ongoing expansion and development activities. Refer to Note 3, “Real Estate Acquisitions and Dispositions” of our accompanying Consolidated Financial Statements for additional information.
Loss on extinguishment of debt -
for the year ended December 31, 2020, decreased primarily due to fewer prepayment penalties related to debt and financing activity as compared to 2019. For the year ended December 31, 2019, the increase is primarily due to higher prepayment penalties related to debt and financing activity as compared to 2018. Refer to Note 8, “Debt and Lines of Credit,” in our accompanying Consolidated Financial Statements for additional information.
Gain / (loss) on remeasurement of marketable securities -
for the year ended December 31, 2020, decreased due to lower gain on the remeasurement of our investment in marketable securities as compared to 2019. For the year ended December 31, 2019, increased primarily due to a $34.2 million gain on the remeasurement of our investment in marketable securities as compared to a $3.6 million remeasurement loss in 2018. Refer to Note 15, Fair Value of Financial Instruments,” in our accompanying Consolidated Financial Statements for additional information.
Gain / (loss) on foreign currency translation -
for the year ended December 31, 2020, increased as compared to same period in 2019, primarily due to favorable fluctuations in exchange rate on Canadian and Australian denominated currencies. For the year ended December 31, 2019, there was a $4.6 million gain as compared to a $8.2 million loss in the same period in 2018.
Gain on disposition of property -
for the year ended December 31, 2020, there was a $5.6 million gain resulting from the sale of a MH community in Montana. There were no property dispositions during the years ended December 30, 2019 and 2018. Refer to Note 3, “Real Estate Acquisitions and Dispositions,” in our accompanying Consolidated Financial Statements for additional information.
Loss on remeasurement of notes receivable -
represents the adjustment of our in-house financing notes receivable portfolio, for which we elected the fair value option on January 1, 2020. Refer to Note 4, “Notes and Other Receivables,” and Note 15, “Fair Value of Financial Instruments,” in our accompanying Consolidated Financial Statements for additional information
.
Loss on remeasurement of investment in nonconsolidated affiliates -
represents the adjustment of our equity investment in GTSC LLC (“GTSC”), for which we elected the fair value option on January 1, 2020. Refer to Note 6, “Investments in Nonconsolidated Affiliates,” in our accompanying Consolidated Financial Statements for additional information.
Preferred return to preferred OP units / equity -
for the year ended December 31, 2020 increased primarily as a result of preferred OP units issued in conjunction with various acquisitions. For the year ended December 31, 2019 the increase was primarily the result of issuing the Series D Preferred OP units in conjunction with an acquisition in January 2019. Refer to Note 3, “Real Estate Acquisitions and Dispositions,” and Note
9, “Equity and Temporary Equity,” of our accompanying Consolidated Financial Statements for additional information.
58
SUN COMMUNITIES, INC.
RECONCILIATION OF NET INCOME ATTRIBUTABLE TO SUN COMMUNITIES, INC. COMMON STOCKHOLDERS TO FFO
The following table reconciles Net income attributable to Sun Communities, Inc. common stockholders to FFO for the years ended December 31, 2020, 2019, and 2018 (in thousands, except per share amounts):
| Year Ended | ||||||||||||||||||||
| December 31, 2020 | December 31, 2019 | December 31, 2018 | ||||||||||||||||||
| Net Income Attributable to Sun Communities, Inc. Common Stockholders | $ | 131,614 | $ | 160,265 | $ | 105,493 | ||||||||||||||
| Adjustments | ||||||||||||||||||||
| Depreciation and amortization | 376,897 | 328,646 | 288,206 | |||||||||||||||||
| Depreciation on nonconsolidated affiliates | 66 | — | — | |||||||||||||||||
|
Gain / (loss) on remeasurement of marketable securities
|
(6,129) | (34,240) | 3,639 | |||||||||||||||||
| Loss on remeasurement of investment in nonconsolidated affiliates | 1,608 | — | — | |||||||||||||||||
| Loss on remeasurement of notes receivable | 3,275 | — | — | |||||||||||||||||
| Income attributable to noncontrolling interests | 7,881 | 8,474 | 7,740 | |||||||||||||||||
| Preferred return to preferred OP units | 2,231 | 2,610 | 2,206 | |||||||||||||||||
| Preferred distribution to Series A-4 preferred stock | — | 1,288 | 1,737 | |||||||||||||||||
| Gain on disposition of properties | (5,595) | — | — | |||||||||||||||||
| Gain on disposition of assets, net | (22,180) | (26,356) | (23,406) | |||||||||||||||||
|
FFO Attributable To Sun Communities, Inc. Common Stockholders And Dilutive Convertible Securities
(1)
|
$ | 489,668 | $ | 440,687 | $ | 385,615 | ||||||||||||||
| Adjustments | ||||||||||||||||||||
| Business combination expense | 23,008 | — | — | |||||||||||||||||
|
Other acquisition related costs
(2)
|
2,326 | 1,146 | 1,001 | |||||||||||||||||
| Loss on extinguishment of debt | 5,209 | 16,505 | 1,190 | |||||||||||||||||
| Catastrophic weather-related charges, net | 885 | 1,737 | 92 | |||||||||||||||||
|
Loss of earnings - catastrophic weather related
(3)
|
— | — | (292) | |||||||||||||||||
| (Gain) / loss on foreign currency translation | (8,039) | (4,557) | 8,234 | |||||||||||||||||
| Other (income) / expense, net | 3,768 | 1,100 | (1,781) | |||||||||||||||||
|
Other adjustments
(4)
|
(1,265) | 314 | 310 | |||||||||||||||||
|
Core FFO Attributable To Sun Communities, Inc. Common Stockholders And Dilutive Convertible Securities
(1)
|
$ | 515,560 | $ | 456,932 | $ | 394,369 | ||||||||||||||
| Weighted average common shares outstanding - basic | 97,521 | 88,460 | 81,387 | |||||||||||||||||
| Add | ||||||||||||||||||||
| Common stock issuable upon conversion of stock options | 1 | 1 | 2 | |||||||||||||||||
| Restricted stock | 455 | 454 | 651 | |||||||||||||||||
| Common OP units | 2,458 | 2,448 | 2,733 | |||||||||||||||||
| Common stock issuable upon conversion of certain preferred OP units | 907 | 1,454 | 1,368 | |||||||||||||||||
| Weighted Average Common Shares Outstanding - Fully Diluted | 101,342 | 92,817 | 86,141 | |||||||||||||||||
| FFO Attributable To Sun Communities, Inc. Common Stockholders And Dilutive Convertible Securities Per Share - Fully Diluted | $ | 4.83 | $ | 4.75 | $ | 4.48 | ||||||||||||||
| Core FFO Attributable To Sun Communities, Inc. Common Stockholders And Dilutive Convertible Securities Per Share - Fully Diluted | $ | 5.09 | $ | 4.92 | $ | 4.58 | ||||||||||||||
(1)
The effect of certain anti-dilutive convertible securities is excluded from these items.
(2)
These costs represent the expense incurred to bring recently acquired properties up to our operating standards, including items such as tree trimming and painting costs that do not meet our capitalization policy.
(3)
Adjustment represents estimated loss of earnings in excess of the applicable business interruption deductible in relation to our three Florida Keys communities that were impaired by Hurricane Irma which had not yet been received from our insurer.
(4)
Adjustments include accelerated deferred compensation amortization upon retirement and deferred tax (benefit) / expense.
59
SUN COMMUNITIES, INC.
LIQUIDITY AND CAPITAL RESOURCES
Our principal liquidity demands have historically been, and are expected to continue to be, distributions to our stockholders and the unit holders of the Operating Partnership, capital improvement of properties, the purchase of new and pre-owned homes, property acquisitions, development and expansion of properties, and debt repayment.
Subject to market conditions, we intend to continue to identify opportunities to expand our development pipeline and acquire existing properties. We finance acquisitions through available cash, secured financing, draws on our lines of credit, the assumption of existing debt on properties, and the issuance of equity securities. We will continue to evaluate acquisition opportunities that meet our criteria. Refer to Note 3, “Real Estate Acquisitions and Dispositions,” in our accompanying Consolidated Financial Statements for information regarding recent property acquisitions.
We also intend to continue to strengthen our capital and liquidity positions by focusing on our core fundamentals, which are generating positive cash flows from operations, maintaining appropriate debt levels and leverage ratios, and controlling overhead costs. We intend to meet our liquidity requirements through available cash balances, cash flows generated from operations, draws on our lines of credit, and the use of debt and equity offerings under our shelf registration statement. Refer to Note 8, “Debt and Lines of Credit,” and Note 9, “Equity and Temporary Equity,” in our accompanying Consolidated Financial Statements for additional information.
Capital Expenditures - MH and RV
Our MH and RV capital expenditures include expansion sites and development construction costs, lot modifications, recurring capital expenditures and rental home purchases.
For the years ended December 31, 2020 and 2019, expansion and development activities of $246.5 million and $281.8 million, respectively, related to costs consisting primarily of construction of sites and other costs necessary to complete home site improvements.
For the years ended December 31, 2020 and 2019, lot modification expenditures were $29.8 million and $31.1 million, respectively. These expenditures improve asset quality in our communities and are incurred when an existing home is removed and the site is prepared for a new home (more often than not, a multi-sectional home). These activities, which are mandated by strict manufacturer’s installation requirements and state building codes, include items such as new foundations, driveways, and utility upgrades.
For the years ended December 31, 2020 and 2019, recurring capital expenditures were $31.4 million and $30.4 million, respectively, related to our continued commitment to the upkeep of our properties.
For the years ended December 31, 2020 and 2019, revenue producing sites expenditure were $23.7 million and $9.6 million, respectively. These expenditures relate to revenue generating activities which consist primarily of garages, sheds, sub-metering of water, sewer and electricity. Revenue generating attractions at our RV resorts are also included here and, occasionally, a special capital project requested by residents and accompanied by an extra rental increase will be classified as revenue producing.
We invest in the acquisition of homes intended for the Rental Program. Expenditures for these investments depend upon the condition of the markets for repossessions and new home sales, as well as rental homes. We finance certain of our new home purchases with a $12.0 million manufactured home floor plan facility. Our ability to purchase homes for sale or rent may be limited by cash received from third-party financing of our home sales, available manufactured home floor plan financing and working capital available on our lines of credit.
Capital Expenditures - Marinas
For the year ended December 31, 2020, our marina capital expenditures (exclusive of acquisitions) were $14.1 million for the period since acquisition, and comprise capital improvements at recently acquired properties, recurring capital expenditures, revenue producing capital expenditures and expansion and development costs.
60
SUN COMMUNITIES, INC.
Cash Flow Activities
Our cash flow activities are summarized as follows (in thousands):
| Year Ended | ||||||||||||||||||||
| December 31, 2020 | December 31, 2019 | December 31, 2018 | ||||||||||||||||||
| Net Cash Provided by Operating Activities | $ | 548,948 | $ | 476,734 | $ | 363,114 | ||||||||||||||
| Net Cash Used for Investing Activities | $ | (2,486,517) | $ | (1,010,457) | $ | (733,743) | ||||||||||||||
| Net Cash Provided by Financing Activities | $ | 2,000,844 | $ | 505,880 | $ | 409,905 | ||||||||||||||
| Effect of Exchange Rate Changes on Cash, Cash Equivalents and Restricted Cash | $ | 189 | $ | 411 | $ | (523) | ||||||||||||||
Cash, cash equivalents, and restricted cash increased by approximately by $63.5 million from $34.8 million as of December 31, 2019, to $98.3 million as of December 31, 2020.
Operating Activities
- Net cash provided by operating activities increased by $72.2 million from $476.7 million for the year ended December 31, 2019 to $548.9 million for the year ended December 31, 2020.
Our net cash flows provided by operating activities from continuing operations may be adversely impacted by, among other things: (a) the market and economic conditions in our current markets generally, and specifically in metropolitan areas of our current markets; (b) lower occupancy and rental rates of our properties; (c) increased operating costs, such as wage and benefit costs, insurance premiums, real estate taxes and utilities, that cannot be passed on to our tenants; (d) decreased sales of manufactured homes; (e) current volatility in economic conditions and the financial markets; and (f) the effects of the COVID-19 pandemic. See “Risk Factors” in Part I, Item 1A in this Annual Report on Form 10-K.
Investing Activities
- Net cash used for investing activities was $2.5 billion for the year ended December 31, 2020, compared to $1.0 billion for year ended December 31, 2019. Refer to Note 3, “Real Estate Acquisitions and Dispositions,” in our accompanying Consolidated Financial Statements for additional information.
Financing Activities
- Net cash provided by financing activities was $2.0 billion for the year ended December 31, 2020, compared to $505.9 million for the year ended December 31, 2019. Refer to Note 8, “Debt and Lines of Credit,” and Note 9, “Equity and Temporary Equity,” in our accompanying Consolidated Financial Statements for additional information.
Financial Flexibility
On September 30, 2020 and October 1, 2020, we entered into two forward sale agreements (the “Forward Sale Agreements”) relating to an underwritten registered public offering of 9,200,000 shares of our common stock at a public offering price of $139.50 per share. The offering closed on October 5, 2020. We did not initially receive any proceeds from the sale of shares of our common stock in the offering. On October 26, 2020, we physically settled the Forward Sale Agreements (by the delivery of shares of our common stock) and received net proceeds of approximately $1.2 billion. We used approximately $1.1 billion of the net proceeds to fund the cash portion of the Safe Harbor purchase price, and the remainder for working capital and general corporate purposes.
In May 2020, we closed an underwritten registered public offering of 4,968,000 shares of common stock. Proceeds from the offering were $633.1 million after deducting expenses related to the offering. We used the net proceeds of this offering to repay borrowings outstanding under the revolving loan under our senior credit facility.
In July 2017, we entered into an at the market offering sales agreement (as amended, the “Sales Agreement”) with certain sales agents (collectively, the “Sales Agents”), whereby we may offer and sell shares of our common stock, having an aggregate offering price of up to $450.0 million, from time to time through the Sales Agents. The Sales Agents are entitled to compensation in an agreed amount not to exceed 2.0 percent of the gross price per share for any shares sold under the Sales Agreement. Through December 31, 2020, we have sold shares of our common stock for gross proceeds of $163.8 million under the Sales Agreement. There were no issuances of common stock under the Sales Agreement during the years ended December 31, 2020 and 2019.
In October 2019, we assumed a term loan facility with Citibank, N.A. (“Citibank”), in the amount of $58.0 million in relation to an acquisition. The term loan has a four-year term ending October 29, 2023, and bears interest at a floating rate based on the Eurodollar rate or Prime rate. The outstanding balance as of the years ended December 31, 2020 and 2019, was $45.0 million and $57.0 million respectively.
61
SUN COMMUNITIES, INC.
In May 2019, we amended and restated our credit agreement with Citibank and certain other lenders. Pursuant to the credit agreement, we entered into an unsecured senior credit facility with Citibank and certain lenders in the amount of $750.0 million, comprised of a $650.0 million revolving loan, with the ability to use up to $100.0 million for advances in Australian dollars, and a $100.0 million term loan (the “A&R Facility”). The A&R Credit Agreement has a four-year term ending May 21, 2023, which can be extended for two additional six-month periods, subject to the satisfaction of certain conditions as defined in the credit agreement. The credit agreement also provides for additional commitments in an amount not to exceed $350.0 million. The funding of these additional commitments is subject to certain conditions, including obtaining the consent of the lenders, some of which are outside of our control. If additional borrowings are made pursuant to any such additional commitments, the aggregate borrowing limit under the A&R Facility may be increased up to $1.1 billion.
The A&R Facility bears interest at a floating rate based on the Eurodollar rate or Bank Bill Swap Bid Rate plus a margin that is determined based on our leverage ratio calculated in accordance with the credit agreement, which margin can range from 1.20 percent to 2.10 percent for the revolving loan and 1.20 percent to 2.05 percent for the term loan. As of December 31, 2020, the margin based on our leverage ratio was 1.20 percent on the revolving loan and 1.20 percent on the term loan. We had $40.4 million and no borrowings on the revolving loan and the term loan, respectively, as of December 31, 2020. We had $123.6 million of borrowings on the revolving loan and no borrowings on the term loan, as of December 31, 2019.
The A&R Facility provides us with the ability to issue letters of credit. Our issuance of letters of credit does not increase our borrowings outstanding under our line of credit with Citibank, N.A. (“Citibank”), but does reduce the borrowing amount available. At December 31, 2020 and 2019, we had approximately $2.1 million and $2.8 million of outstanding letters of credit, respectively.
Pursuant to the terms of the A&R Facility, we are subject to various financial and other covenants. As of December 31, 2020, we were in compliance with these covenants and do not anticipate that we will be unable to meet these covenants in the near term as a result of COVID-19’s impact on our business. The most restrictive financial covenants for the A&R Facility are as follows:
| Covenant | Requirement | As of December 31, 2020 | ||||||||||||
| Maximum leverage ratio | <65.0% | 29.2% | ||||||||||||
| Minimum fixed charge coverage ratio | >1.40 | 3.29 | ||||||||||||
| Minimum tangible net worth | >$3,731,946 | $7,322,394 | ||||||||||||
| Maximum dividend payout ratio | <95.0% | 57.9% | ||||||||||||
| Maximum variable rate indebtedness | <50.0% | 7.4% | ||||||||||||
On October 30, 2020, in relation to the acquisition of Safe Harbor, we indirectly assumed approximately $829.0 million of Safe Harbor’s debt owed to Citizens Bank N.A. (“Citizens”). On December 22, 2020, the Safe Harbor facility was amended to, among other things, (a) increase the size of the revolving commitments available to Safe Harbor from $500 million to $1.3 billion, subject to borrowing base availability, (b) modify certain provisions relating to the determination of the borrowing base, (c) increase the cap on the incremental borrowing capacity from $350.0 million to $500.0 million, which allows Safe Harbor to request an increase to the revolving commitments and / or to establish additional term loans subject to the higher cap and the satisfaction of certain conditions, and (d) modify certain financial covenants. The revolving loan and term loan under the Safe Harbor facility both expire on October 11, 2024. The term loan component of the Safe Harbor facility can be extended for two additional 12-month periods, subject to the satisfaction of certain conditions set forth in the facility. The revolving commitments do not have an extension option.
The Safe Harbor facility bears interest at a floating rate based on an adjusted LIBOR rate or a base rate, plus a margin that is determined based on Safe Harbor’s ratio of consolidated funded debt to total asset value, calculated in accordance with the credit agreement, which margin can range from 1.375 percent to 2.250 percent for adjusted LIBOR rate loans and 0.375 percent to 1.250 percent for base rate loans. As of December 31, 2020, based on Safe Harbor’s ratio of consolidated funded debt to total asset value, the margin was 2.000 percent on any adjusted LIBOR rate loans and 1.000 percent on any base rate loans. The Safe Harbor facility is secured by the personal property of Safe Harbor and certain related entities and subsidiaries and a pledge of the equity interests in certain subsidiaries of Safe Harbor and related entities and subsidiaries, subject to customary exceptions. At the lenders’ option, the Safe Harbor facility will become immediately due and payable upon an event of default that is continuing under the credit agreement. Safe Harbor had $652.0 million and $500.0 million of borrowings under the revolving loan and term loan respectively, as of December 31, 2020.
The Safe Harbor facility provides Safe Harbor with the ability to issue letters of credit. Its issuance of letters of credit does not increase its borrowings outstanding under its line of credit with Citizens, but does reduce the borrowing amount available. At December 31, 2020, Safe Harbor had approximately $0.3 million of outstanding letters of credit.
62
SUN COMMUNITIES, INC.
Pursuant to the terms of the Safe Harbor facility, we are subject to various financial and other covenants. As of December 31, 2020, we were in compliance with these covenants and do not anticipate that we will be unable to meet these covenants in the near term as a result of COVID-19’s impact on our marina business. The most restrictive financial covenants for the Safe Harbor facility are as follows:
| Covenant | Requirement | As of December 31, 2020 | ||||||||||||
| Maximum leverage ratio | <60.0% | 47.3% | ||||||||||||
| Minimum fixed charge coverage ratio (pre-distribution) | >1.35 | 3.67 | ||||||||||||
| Minimum fixed charge coverage ratio (post-distribution) | >1.00 | 1.87 | ||||||||||||
| Minimum borrowing base coverage ratio | >1.00 | 1.26 | ||||||||||||
We anticipate meeting our long-term liquidity requirements, such as scheduled debt maturities, large property acquisitions, expansion and development of properties, and Operating Partnership unit redemptions through the issuance of certain debt or equity securities and / or the collateralization of our properties.
We had unrestricted cash on hand as of December 31, 2020 of approximately $83.0 million. As of December 31, 2020, there is approximately $1.355 billion of remaining capacity on the Citibank and Citizens lines of credit. At December 31, 2020 we had a total of 254 unencumbered MH and RV properties, of which 61 support the borrowing base for the $750.0 million revolving loan under our senior credit facility and 31 support the borrowing base for a term loan facility. The remaining 162 unencumbered MH and RV properties, with an estimated asset value of approximately $2.7 billion as of December 31, 2020 are available to secure potential mortgage debt. At December 31, 2020 we had a total of 106 unencumbered marinas, of which 102 support the borrowing base for our Safe Harbor facility.
From time to time, we may also issue shares of our capital stock, issue equity units in our Operating Partnership, obtain debt financing, or sell selected assets. Our ability to finance our long-term liquidity requirements in such a manner will be affected by numerous economic factors affecting the MH, RV and marina industries at the time, including the effects of the COVID-19 pandemic, the availability and cost of mortgage debt, our financial condition, the operating history of the properties, the state of the debt and equity markets, and the general national, regional, and local economic conditions. When it becomes necessary for us to approach the credit markets, the volatility in those markets could make borrowing more difficult to secure, more expensive, or effectively unavailable. See “Risk Factors” in Part I, Item 1A of this Annual Report on Form 10-K. If we are unable to obtain additional debt or equity financing on acceptable terms, our business, results of operations and financial condition would be adversely impacted.
As of December 31, 2020, our net debt to enterprise value was approximately 21.4 percent (assuming conversion of all common OP units, Series A-1 preferred OP units, Series A-3 preferred OP units, Series C preferred OP units, Series D preferred OP units, Series E preferred OP units, Series F preferred OP units, Series G preferred OP units, Series H preferred OP units, and Series I preferred OP units to shares of common stock). Our debt has a weighted average maturity of approximately 9.4 years and a weighted average interest rate of 3.4 percent.
Off-Balance Sheet Arrangements
Our off-balance sheet investments include nonconsolidated affiliates. These investments all have varying ownership structures. Substantially all of our nonconsolidated affiliates are accounted for under the equity method of accounting as we have the ability to exercise significant influence, but not control, over the operating and financial decisions of these joint venture arrangements. Refer to Note 6, "Investments in Nonconsolidated Affiliates," and Note 8, "Debt and Lines of Credit," in the accompanying Consolidated Financial Statements, for additional information on our off-balance sheet investments.
Nonconsolidated Affiliate Indebtedness
GTSC
- During September 2019, GTSC entered into a warehouse line of credit with a maximum loan amount of $125.0 million. During September 2020, the maximum amount was increased to $180.0 million. As of December 31, 2020, the aggregate carrying amount of debt, including both our and our partners’ share, incurred by GTSC was approximately $167.7 million (of which our proportionate share is $67.1 million). The debt bears interest at a variable rate based on LIBOR plus 1.65 percent per annum and matures on September 15, 2023. Refer to Note 6, "Investments in Nonconsolidated Affiliates," for additional information on our nonconsolidated affiliates.
63
SUN COMMUNITIES, INC.
Sungenia Joint Venture
- During May 2020, Sungenia joint venture (“Sungenia JV”) entered into a debt facility agreement with a maximum loan amount of $27.0 million Australian dollars, or $20.8 million converted at the December 31, 2020 exchange rate. As of December 31, 2020, the aggregate carrying amount of debt, including both our and our partners’ share, incurred by Sungenia JV was $6.7 million (of which our proportionate share is $3.3 million). The debt bears interest at a variable rate based on Australian BBSY plus 2.05 percent per annum and is available for a minimum of three years. Refer to Note 6, "Investments in Nonconsolidated Affiliates," for additional information on our nonconsolidated affiliates.
Contractual Cash Obligations
Our primary long-term liquidity needs are principal payments on outstanding indebtedness. As of December 31, 2020, our outstanding contractual obligations, including interest expense, were as follows:
| Payments Due By Period | ||||||||||||||||||||||||||||||||
| (In thousands) | ||||||||||||||||||||||||||||||||
|
Contractual Cash Obligations
(1)
|
Total Due | <1 Year | 1-3 Years | 3-5 Years | After 5 Years | |||||||||||||||||||||||||||
| Collateralized term loans - Life Companies | $ | 1,664,922 | $ | 37,275 | $ | 79,318 | $ | 96,002 | $ | 1,452,327 | ||||||||||||||||||||||
| Collateralized term loans - FNMA | 1,156,688 | 9,794 | 97,113 | 26,767 | 1,023,014 | |||||||||||||||||||||||||||
| Collateralized term loans - CMBS | 267,280 | 5,713 | 81,618 | 179,949 | — | |||||||||||||||||||||||||||
| Collateralized term loans - FMCC | 369,971 | 6,803 | 131,827 | 174,312 | 57,029 | |||||||||||||||||||||||||||
| Preferred equity - Sun NG Resorts - mandatory redeemable | 35,249 | — | — | 35,249 | — | |||||||||||||||||||||||||||
| Preferred OP units - mandatorily redeemable | 34,663 | — | — | 27,373 | 7,290 | |||||||||||||||||||||||||||
| Lines of credit and other debt | 1,242,197 | 10,000 | 80,197 | 1,152,000 | — | |||||||||||||||||||||||||||
| Total Principal Payments | $ | 4,770,970 | $ | 69,585 | $ | 470,073 | $ | 1,691,652 | $ | 2,539,660 | ||||||||||||||||||||||
|
Interest expense
(2)
|
$ | 1,284,756 | $ | 146,079 | $ | 277,762 | $ | 218,594 | $ | 642,321 | ||||||||||||||||||||||
| Operating leases | 86,671 | 4,967 | 9,775 | 10,532 | 61,397 | |||||||||||||||||||||||||||
| Finance lease | 4,694 | 217 | 409 | 4,068 | — | |||||||||||||||||||||||||||
| Total Contractual Cash Obligations | $ | 6,147,091 | $ | 220,848 | $ | 758,019 | $ | 1,924,846 | $ | 3,243,378 | ||||||||||||||||||||||
(1)
Contractual cash obligations in this table exclude debt premiums, discounts and deferred financing costs, as applicable.
(2)
Our contractual cash obligations related to interest expense are calculated based on the current debt levels, rates and maturities as of December 31, 2020 (including finance leases), and actual payments required in future periods may be different than the amounts included above. Perpetual securities include one year of interest expense in the “After 5 Years” category.
SIGNIFICANT ACCOUNTING POLICIES AND CRITICAL ACCOUNTING ESTIMATES
Our Consolidated Financial Statements are prepared in accordance with United States of America generally accepted accounting principles (“GAAP”), which require the use of estimates, judgments and assumptions that affect the reported amounts of assets and liabilities, the disclosure of contingent assets and liabilities at the date of the financial statements, and the reported amounts of revenues and expenses in the periods presented. We believe that the accounting estimates employed are appropriate and resulting balances are reasonable; however, due to inherent uncertainties in making estimates, actual results could differ from the original estimates, requiring adjustments to these balances in future periods. Our significant accounting estimates include acquisitions, impairment, fair value of installment notes receivable on manufactured homes and notes receivable from real estate developers, and share based compensation. Refer to Note 1, “Significant Accounting Policies,” in our accompanying Consolidated Financial Statements for information regarding our critical accounting estimates that affect the Consolidated Financial Statements and that use judgments and assumptions. In addition, the likelihood that materially different amounts could be reported under varied conditions and assumptions is discussed.
Impact of New Accounting Standards
Refer to Note 19, “Recent Accounting Pronouncements,” in our accompanying Consolidated Financial Statements for information regarding new accounting pronouncements.
64
SUN COMMUNITIES, INC.
ITEM 7A. QUANTITATIVE AND QUALITATIVE DISCLOSURES ABOUT MARKET RISK
Market risk is the exposure to loss resulting from changes in market factors such as interest rates, foreign currency exchange rates, commodity prices, and equity prices.
Interest Rate Risk
Our principal market risk exposure is interest rate risk. We mitigate this risk by maintaining prudent amounts of leverage, minimizing capital costs, and interest expense while continuously evaluating all available debt and equity resources and following established risk management policies and procedures, which include the periodic use of derivatives. Our primary strategy in entering into derivative contracts is to minimize the variability that interest rate changes could have on our future cash flows. From time to time, we employ derivative instruments that effectively convert a portion of our variable rate debt to fixed rate debt. We do not enter into derivative instruments for speculative purposes.
Our variable rate debt totaled $1.2 billion and $183.9 million as of December 31, 2020 and 2019, respectively, and bears interest at Prime or various LIBOR rates. If Prime or LIBOR increased or decreased by 1.0 percent, our interest expense would have increased or decreased by approximately $3.4 million and $2.6 million for the years ended December 31, 2020 and 2019, respectively, based on the $339.5 million and $259.4 million average balances outstanding under our variable rate debt facilities, respectively.
Foreign Currency Exchange Rate Risk
Foreign currency exchange rate risk is the risk that fluctuations in currencies against the U.S. dollar will negatively impact our results of operations. We are exposed to foreign currency exchange rate risk as a result of remeasurement and translation of the assets and liabilities of our Canadian properties, and our Australian equity investment and joint venture into U.S. dollars. Fluctuations in foreign currency exchange rates can therefore create volatility in our results of operations and may adversely affect our financial condition.
At December 31, 2020 and 2019, our stockholder’s equity included $250.8 million and $202.5 million from our Canadian subsidiaries and Australian equity investments, respectively, which represented 4.5 percent and 5.2 percent of total stockholder’s equity, respectively. Based on our sensitivity analysis, a 10.0 percent strengthening of the U.S. dollar against the Canadian and Australian dollar would have caused a reduction of $25.1 million and $20.2 million to our total stockholder’s equity at December 31, 2020 and 2019, respectively.
65
SUN COMMUNITIES, INC.
ITEM 8. FINANCIAL STATEMENTS AND SUPPLEMENTARY DATA
Financial statements and supplementary data are filed herewith under Item 15.
ITEM 9. CHANGES IN AND DISAGREEMENTS WITH ACCOUNTANTS ON ACCOUNTING AND FINANCIAL DISCLOSURE
None.
ITEM 9A. CONTROLS AND PROCEDURES
Disclosure controls and procedures
We maintain disclosure controls and procedures designed to provide reasonable assurance that information required to be disclosed in reports filed under the Exchange Act is recorded, processed, summarized and reported within the specified time periods and accumulated and communicated to our management, including our principal executive officer and principal financial officer, as appropriate to allow timely decisions regarding required disclosure.
Our management, with the participation of our CEO and CFO, evaluated the effectiveness of our disclosure controls and procedures (pursuant to Rules 13a-15(e) or 15d-15(e) of the Exchange Act) at December 31, 2020. Based upon this evaluation, our CEO and CFO concluded that our disclosure controls and procedures were effective as of December 31, 2020.
Management’s report on internal control over financial reporting
Our management is responsible for establishing and maintaining effective internal control over financial reporting as defined in Rules 13a-15(f) and 15d-15(f) under the Exchange Act. This system is designed to provide reasonable assurance regarding the reliability of financial reporting and the preparation of consolidated financial statements for external purposes in accordance with GAAP. Because of the inherent limitations of internal control over financial reporting, including the possibility of collusion or improper management override of controls, misstatements due to error or fraud may not be prevented or detected on a timely basis.
Our management performed an assessment of the effectiveness of our internal control over financial reporting at December 31, 2020, utilizing the criteria discussed in the “
Internal Control - Integrated Framework (2013)
” issued by the Committee of Sponsoring Organizations of the Treadway Commission. The objective of this assessment was to determine whether our internal control over financial reporting was effective at December 31, 2020. Based on management’s assessment, we have concluded that our internal control over financial reporting was effective at December 31, 2020.
The effectiveness of our internal control over financial reporting has been audited by Grant Thornton LLP, an independent registered public accounting firm, as stated in its report which is included herein.
In October 2020, we completed the acquisition of Safe Harbor and are currently integrating Safe Harbor into our operations, compliance program and internal control processes. Safe Harbor constituted approximately 23 percent of our total assets as of December 31, 2020, including the goodwill and other intangible assets recorded as part of the purchase price allocation, and 3 percent of our revenues for the year ended December 31, 2020. SEC regulations allow companies to exclude acquisitions from their assessment of internal control over financial reporting during the first year following an acquisition. We have excluded the acquired operation of Safe Harbor from our assessment of our internal control over financial reporting.
Changes in internal control over financial reporting
There were no material changes in our internal control over financial reporting during the quarter ended December 31, 2020.
ITEM 9B. OTHER INFORMATION
None.
66
SUN COMMUNITIES, INC.
PART III
ITEM 10.
DIRECTORS, EXECUTIVE OFFICERS AND CORPORATE GOVERNANCE
Pursuant to the general instructions of Item 401 of Regulation S-K, certain information regarding our executive officers is contained in Part I of this Form 10-K. Unless provided in an amendment to this Annual Report on Form 10-K, the other information required by this Item is incorporated herein by reference to the applicable information in the proxy statement for our 2021 annual meeting (the “Proxy Statement,”) including the information set forth under the captions “Proposal No.1 Election of Directors - Consideration of Director Nominees,” “Corporate Governance - Board of Directors,” “Corporate Governance - Committees of the Board of Directors,” “Security Ownership Information - Security Ownership of Directors and Executive Officers,” and “Information About Executive Officers - Executive Officers Biography.”
ITEM 11. EXECUTIVE COMPENSATION
Unless provided in an amendment to this Annual Report on Form 10-K, the information required by this Item is incorporated by reference to the applicable information in the Proxy Statement, including the information set forth under the captions “Proposal No.1 Election of Directors - Director Compensation,” “Corporate Governance - Compensation Committee Interlocks and Insider Participation,” and “Executive Compensation.” The information in the section captioned “Executive Compensation - Compensation Committee Report” in the Proxy Statement or an amendment to this Annual Report on Form 10-K is incorporated by reference herein but shall be deemed furnished, not filed, and shall not be deemed to be incorporated by reference into any filing we make under the Securities Act or the Exchange Act.
ITEM 12. SECURITY OWNERSHIP OF CERTAIN BENEFICIAL OWNERS AND MANAGEMENT AND RELATED STOCKHOLDER MATTERS
Unless provided in an amendment to this Annual Report on Form 10-K, the information required by this Item is incorporated by reference to the applicable information in the Proxy Statement, including the information set forth under the captions “Security Ownership Information.”
ITEM 13. CERTAIN RELATIONSHIPS AND RELATED TRANSACTIONS, AND DIRECTOR INDEPENDENCE
Unless provided in an amendment to this Annual Report on Form 10-K, the information required by this Item is incorporated by reference to the Proxy Statement, including the information set forth under the captions “Corporate Governance - Board of Directors,” “Corporate Governance - Committees of the Board of Directors,” “Corporate Governance - Board Leadership Structure and Independence of Non-Employee Directors,” and “Corporate Governance - Certain Relationships and Related Party Transactions.”
ITEM 14. PRINCIPAL ACCOUNTANT FEES AND SERVICES
Unless provided in an amendment to this Annual Report on Form 10-K, the information required by this Item is incorporated by reference to the Proxy Statement, including the information set forth under the caption for the proposal related to “Ratification of Selection of Grant Thornton LLP.”
67
SUN COMMUNITIES, INC.
PART IV
ITEM 15. EXHIBITS AND FINANCIAL STATEMENT SCHEDULES
The following documents are filed herewith as part of this Form 10-K:
1. Financial Statements
A list of the financial statements required to be filed as a part of this Annual Report on Form 10‑K is shown in the “Index to the Consolidated Financial Statements and Financial Statement Schedules” filed herewith.
2. Financial Schedule
The financial statement schedule required to be filed as a part of this Annual Report on Form 10‑K is shown in the “Index to the Consolidated Financial Statements and Financial Statement Schedules” filed herewith.
3. Exhibits
A list of the exhibits required by Item 601 of Regulation S‑K to be filed as a part of this Annual Report on Form 10-K is filed herewith.
ITEM 16. FORM 10-K SUMMARY
None.
68
SUN COMMUNITIES, INC.
EXHIBITS
| Exhibit Number | Description | Method of Filing | ||||||
| 2.1* | Incorporated by reference to Sun Communities, Inc.’s Current Report on Form 8-K filed on September 29, 2020 | |||||||
| 3.1 | Incorporated by reference to Sun Communities, Inc.’s Annual Report on Form 10-K filed on February 22, 2018 | |||||||
| 3.2 | Incorporated by reference to Sun Communities, Inc.’s Current Report on Form 8-K filed on May 12, 2017 | |||||||
| 4.1 | Incorporated by reference to Sun Communities, Inc.’s Annual Report on Form 10-K filed for the year ended December 31, 2019 | |||||||
| 4.2 | Incorporated by reference to Sun Communities, Inc.’s Current Report on Form 8-K filed on September 29, 2020 | |||||||
| 10.1 | Incorporated by reference to Sun Communities, Inc.’s Annual Report on Form 10-K for the year ended December 31, 2002, as amended | |||||||
| 10.2 | Incorporated by reference to Sun Communities, Inc.’s Annual Report on Form 10-K filed on February 21, 2019 | |||||||
| 10.3* | Incorporated by reference to Sun Communities, Inc.’s Current Report on Form 8-K filed February 5, 2019 | |||||||
| 10.4* | Incorporated by reference to Sun Communities, Inc.’s Current Report on Form 8-K filed January 13, 2020 | |||||||
| 10.5* | Incorporated by reference to Sun Communities, Inc.’s Current Report on Form 8-K filed January 14, 2020 | |||||||
| 10.6* | Incorporated by reference to Sun Communities, Inc.’s Current Report on Form 8-K filed May 18, 2020 | |||||||
| 10.7* | Incorporated by reference to Sun Communities, Inc.’s Current Report on Form 8-K filed October 6, 2020 | |||||||
| 10.8* | Incorporated by reference to Sun Communities, Inc.’s Current Report on Form 8-K filed November 5, 2020 | |||||||
| 10.9* | Incorporated by reference to Sun Communities, Inc.’s Current Report on Form 8-K filed January 4, 2021 | |||||||
| 10.10 | Incorporated by reference to Sun Communities, Inc.’s Current Report on Form 8-K filed July 25, 2012 | |||||||
| 10.11 | Incorporate by reference to Exhibit A to Sun Communities, Inc.’s Definitive Proxy Statement filed on March 29, 2018 | |||||||
| 10.12 | Incorporated by reference to Sun Communities, Inc.’s Proxy Statement dated April 29, 2015 for the Annual meeting of Stockholders held July 20, 2015 | |||||||
| 10.13 | Incorporated by reference to Sun Communities, Inc.’s Registration Statement No. 33 69340 | |||||||
| 10.14 | Incorporated by reference to Sun Communities, Inc.’s Registration Statement No. 33 80972 | |||||||
| 10.15 | Incorporated by reference to Sun Communities, Inc.’s Annual Report on Form 10-K for the year ended December 31, 2004 | |||||||
| 10.16 | Incorporated by reference to Sun Communities, Inc.’s Current Report on Form 8-K filed July 15, 2014 | |||||||
| 10.17 | Incorporated by reference to Sun Communities, Inc.’s Current Report on Form 8-K filed June 24, 2013 | |||||||
| 10.18 | Incorporated by reference to Sun Communities, Inc.’s Current Report on Form 8-K filed July 15, 2014 | |||||||
| 10.19 | Incorporated by reference to Sun Communities, Inc.’s Current Report on Form 8-K filed on March 8, 2017 | |||||||
| 10.20 | Incorporated by reference to Sun Communities, Inc.’s Current Report on Form 8-K filed May 20, 2015 | |||||||
| 10.21 | Incorporated by reference to Sun Communities, Inc.’s Current Report on Form 8-K filed on March 8, 2017 | |||||||
| 10.22 | Incorporated by reference to Sun Communities, Inc.’s Current Report on Form 8-K filed July 17, 2015 | |||||||
69
SUN COMMUNITIES, INC.
| 10.23 | Incorporated by reference to Sun Communities, Inc.’s Current Report on Form 8-K filed on March 8, 2017 | |||||||
| 10.24* | Incorporated by reference to Sun Communities, Inc.’s Current Report on Form 8-K filed on November 5, 2020 | |||||||
| 10.25 | Incorporated by reference to Sun Communities, Inc.’s Current Report on Form 8-K filed July 15, 2014 | |||||||
| 10.26* |
Incorporated by reference to Sun Communities, Inc.’s Current Report on Form 8-K filed on May 24, 2019
|
|||||||
| 10.27* |
Credit Agreement dated September 14, 2018, and the Third Amendment thereto dated
De
c
ember 22, 2020, among Safe Harbor Marinas, LLC as borrower; SHM TRS, LLC and certain subsidiaries of Safe Harbor Marinas, LLC and SHM TRS, LLC from time to time as guarantors; the lenders that are party thereto; and Citizens Bank, N.A., as Administrative Agent and Collateral Agent
|
Incorporated by reference to Sun Communities, Inc.’s Current Report on Form 8-K filed on December 29, 2020 | ||||||
| 21.1 | Filed herewith | |||||||
| 23.1 | Filed herewith | |||||||
| 31.1 | Filed herewith | |||||||
| 31.2 | Filed herewith | |||||||
| 32.1 | Furnished herewith | |||||||
| 101.INS | XBRL Instance Document | The instance document does not appear in the Interactive Data File because its XBRL tags are embedded within the Inline XBRL document. | ||||||
| 101.SCH | XBRL Taxonomy Extension Schema Document | Filed herewith | ||||||
| 101.CAL | XBRL Taxonomy Extension Calculation Linkbase Document | Filed herewith | ||||||
| 101.DEF | XBRL Taxonomy Extension Definition Linkbase Document | Filed herewith | ||||||
| 101.LAB | XBRL Taxonomy Extension Label Linkbase Document | Filed herewith | ||||||
| 101.PRE | XBRL Taxonomy Extension Presentation Linkbase Document | Filed herewith | ||||||
#
Management contract or compensatory plan or arrangement
* Certain schedules and exhibits have been omitted pursuant to Item 601(a)(5) of Regulation S-K because such schedules and exhibits do not contain information which is material to an investment decision or which is not otherwise disclosed in the filed agreements. We will furnish the omitted schedules and exhibits to the SEC upon request by the SEC.
70
SUN COMMUNITIES, INC.
SIGNATURES
Pursuant to the requirements of Section 13 or 15(d) of the Securities Exchange Act of 1934, the registrant has duly caused this report to be signed on its behalf by the undersigned, thereunto duly authorized.
|
SUN COMMUNITIES, INC.
(Registrant)
|
|||||||||||
| Dated: February 18, 2021 | By | /s/ | Gary A. Shiffman | ||||||||
|
Gary A. Shiffman
Chief Executive Officer |
|||||||||||
Pursuant to the requirements of the Securities Exchange Act of 1934, this Annual Report on Form 10-K has been signed by the following persons on behalf of the registrant and in the capacities and on the dates indicated.
| Name | Capacity | Date | |||||||||||||||
| /s/ | Gary A. Shiffman | Chief Executive Officer and Chairman of the Board of Directors (Principal Executive Officer) | February 18, 2021 | ||||||||||||||
| Gary A. Shiffman | |||||||||||||||||
| /s/ | Karen J. Dearing | Executive Vice President, Chief Financial Officer, Treasurer and Secretary (Principal Financial Officer and Principal Accounting Officer) | February 18, 2021 | ||||||||||||||
| Karen J. Dearing | |||||||||||||||||
| /s/ | Meghan G. Baivier | Director | February 18, 2021 | ||||||||||||||
| Meghan G. Baivier | |||||||||||||||||
| /s/ | Stephanie W. Bergeron | Director | February 18, 2021 | ||||||||||||||
| Stephanie W. Bergeron | |||||||||||||||||
| /s/ | Brian M. Hermelin | Director | February 18, 2021 | ||||||||||||||
| Brian M. Hermelin | |||||||||||||||||
| /s/ | Ronald A. Klein | Director | February 18, 2021 | ||||||||||||||
| Ronald A. Klein | |||||||||||||||||
| /s/ | Clunet R. Lewis | Director | February 18, 2021 | ||||||||||||||
| Clunet R. Lewis | |||||||||||||||||
| /s/ | Arthur A. Weiss | Director | February 18, 2021 | ||||||||||||||
| Arthur A. Weiss | |||||||||||||||||
71
SUN COMMUNITIES, INC.
INDEX TO THE CONSOLIDATED FINANCIAL STATEMENTS AND
FINANCIAL STATEMENT SCHEDULE
| Page | |||||
| Reports of Independent Registered Public Accounting Firm |
F-
2
|
||||
| Financial Statements: | |||||
|
Consolidated Balance Sheets as of December 31, 2020 and 2019
|
F-
5
|
||||
|
Consolidated Statements of Operations for the Years Ended 2020, 2019 and 2018
|
F-
6
|
||||
|
Consolidated Statements of Comprehensive Income for the Years Ended December 31, 2020, 2019 and 2018
|
F-
7
|
||||
|
Consolidated Statements of Cash Flows for the Years Ended December 31, 2020, 2019 and 2018
|
F-
8
|
||||
|
Consolidated Statements of Stockholders’ Equity for the Years Ended December 31, 2020, 2019 and 2018
|
F-
10
|
||||
| Notes to Consolidated Financial Statements |
F-
11
|
||||
| Real Estate and Accumulated Depreciation, Schedule III |
F-
54
|
||||
F - 1
SUN COMMUNITIES, INC.
REPORT OF INDEPENDENT REGISTERED PUBLIC ACCOUNTING FIRM
Board of Directors and Stockholders
Sun Communities, Inc.
Opinion on the financial statements
We have audited the accompanying consolidated balance sheets of Sun Communities, Inc. (a Maryland corporation) and subsidiaries (the “Company”) as of December 31, 2020 and 2019, the related consolidated statements of operations, comprehensive income, stockholders’ equity, and cash flows for each of the three years in the period ended December 31, 2020, and the related notes and schedule included under Item 15(a) (collectively referred to as the “financial statements”). In our opinion, the financial statements present fairly, in all material respects, the financial position of the Company as of December 31, 2020 and 2019, and the results of its operations and its cash flows for each of the three years in the period ended December 31, 2020, in conformity with accounting principles generally accepted in the United States of America.
We also have audited, in accordance with the standards of the Public Company Accounting Oversight Board (United States) (“PCAOB”), the Company’s internal control over financial reporting as of December 31, 2020, based on criteria established in the 2013
Internal Control—Integrated Framework
issued by the Committee of Sponsoring Organizations of the Treadway Commission (“COSO”), and our report dated February 18, 2021 expressed an unqualified opinion.
Basis for opinion
These financial statements are the responsibility of the Company’s management. Our responsibility is to express an opinion on the Company’s financial statements based on our audits. We are a public accounting firm registered with the PCAOB and are required to be independent with respect to the Company in accordance with the U.S. federal securities laws and the applicable rules and regulations of the Securities and Exchange Commission and the PCAOB.
We conducted our audits in accordance with the standards of the PCAOB. Those standards require that we plan and perform the audit to obtain reasonable assurance about whether the financial statements are free of material misstatement, whether due to error or fraud. Our audits included performing procedures to assess the risks of material misstatement of the financial statements, whether due to error or fraud, and performing procedures that respond to those risks. Such procedures included examining, on a test basis, evidence regarding the amounts and disclosures in the financial statements. Our audits also included evaluating the accounting principles used and significant estimates made by management, as well as evaluating the overall presentation of the financial statements. We believe that our audits provide a reasonable basis for our opinion.
Critical audit matters
The critical audit matters communicated below are matters arising from the current period audit of the financial statements that were communicated or required to be communicated to the audit committee and that: (1) relate to accounts or disclosures that are material to the financial statements and (2) involved our especially challenging, subjective, or complex judgments. The communication of critical audit matters does not alter in any way our opinion on the financial statements, taken as a whole, and we are not, by communicating the critical audit matters below, providing separate opinions on the critical audit matters or on the accounts or disclosures to which they relate.
Accounting for Acquisitions
The Company's strategy includes growth by acquisition. As described in footnote 3, during 2020, the Company acquired 24 MH communities and RV resorts and 106 marinas for a total purchase price of approximately $3.0 billion.
The principal considerations for our determination that the accounting for acquisitions is a critical audit matter is that it involves a high degree of subjectivity in evaluating the reasonableness of management's estimates and related assumptions related to the recognition and measurement of assets acquired and liabilities assumed. We performed the following procedures, among others, in connection with forming our overall opinion on the financial statements. We tested management’s controls over the accounting for acquisitions, such as controls over the recognition and measurement of assets acquired, liabilities assumed, and consideration paid. For each of the acquisitions, we read the purchase agreements, evaluated the significant assumptions and methods used in developing the fair value estimates and tested the recognition of the assets acquired and liabilities assumed at fair value.
F - 2
SUN COMMUNITIES, INC.
For each acquisition, we assessed, through the use of our internal valuation specialist, whether (1) the values assigned to the tangible assets appeared reasonable based on a cost or market approach for similar properties in each geographic area, (2) intangible assets were properly considered and identified, and (3) the significant assumptions used in valuing the assets and liabilities were reasonable and (4) if applicable, the value assigned to and accounting for, equity interests in the Company or its subsidiaries that was issued as consideration in the transaction.
Impairment of Investment Properties
As described in footnote 1, the Company reviews the carrying value of investment properties on a quarterly basis or whenever events or changes in circumstances indicate a possible impairment. Events or circumstances that may prompt a review of the carrying value of investment properties may include a significant decrease in the anticipated market price of the investment property, an adverse change to the extent or manner in which an asset may be used, or a significant change in its physical condition or damage due to catastrophic event.
The Company reviews its investment properties for potential impairment through an analysis of net operating income trends period over period. In the event that any impairment indicators are present, the Company undertakes additional analyses utilizing expected undiscounted future cash flows and expected disposition proceeds for a given asset. Forecasting of cash flows requires management to make estimates and assumptions about such variables as the anticipated holding period, rental revenues and operating expenses during the holding period, capital expenditures and rates of return. In 2020, the Company’s net operating income trend analysis resulted in 18 properties requiring additional analysis. No impairments were identified in 2020 as a result of the Company’s analysis.
The principal consideration for our determination that the impairment of investment properties is a critical audit matter is that it involves a high degree of subjectivity in evaluating management's estimates used in determining the undiscounted cash flow estimates. We performed the following procedures, among others, in connection with forming our overall opinion on the financial statements. We tested management’s internal controls over the identification of potential investment property impairments, such as controls over the Company’s quarterly analysis of net operating income trends, as well management review controls to identify potential events which could indicate impairment. We examined and evaluated the Company’s net operating income trend analysis and its assessment of other events, and if additional analysis was necessary, we evaluated the significant assumptions and methods used in developing the undiscounted cash flow estimates.
When the net operating income analysis indicated that additional analysis was required, we assessed whether the significant assumptions, including estimated holding period, rental revenues and operating expenses during the holding period, capital expenditures and rates of return used in determining the future undiscounted cash flows were reasonable.
/s/GRANT THORNTON LLP
We have served as the Company’s auditor since 2003.
Philadelphia, Pennsylvania
February 18, 2021
F - 3
SUN COMMUNITIES, INC.
REPORT OF INDEPENDENT REGISTERED PUBLIC ACCOUNTING FIRM
Board of Directors and Stockholders
Sun Communities, Inc.
Opinion on internal control over financial reporting
We have audited the internal control over financial reporting of Sun Communities, Inc. (a Maryland corporation) and subsidiaries (the “Company”) as of December 31, 2020, based on criteria established in the 2013 Internal Control—Integrated Framework issued by the Committee of Sponsoring Organizations of the Treadway Commission (“COSO”). In our opinion, the Company maintained, in all material respects, effective internal control over financial reporting as of December 31, 2020, based on criteria established in the 2013 Internal Control—Integrated Framework issued by COSO.
We also have audited, in accordance with the standards of the Public Company Accounting Oversight Board (United States) (“PCAOB”), the consolidated financial statements of the Company as of and for the year ended December 31, 2020, and our report dated February 18, 2021 expressed an unqualified opinion on those financial statements.
Basis for opinion
The Company’s management is responsible for maintaining effective internal control over financial reporting and for its assessment of the effectiveness of internal control over financial reporting, included in the accompanying Management’s Report on Internal Control over Financial Reporting. Our responsibility is to express an opinion on the Company’s internal control over financial reporting based on our audit. We are a public accounting firm registered with the PCAOB and are required to be independent with respect to the Company in accordance with the U.S. federal securities laws and the applicable rules and regulations of the Securities and Exchange Commission and the PCAOB.
We conducted our audit in accordance with the standards of the PCAOB. Those standards require that we plan and perform the audit to obtain reasonable assurance about whether effective internal control over financial reporting was maintained in all material respects. Our audit included obtaining an understanding of internal control over financial reporting, assessing the risk that a material weakness exists, testing and evaluating the design and operating effectiveness of internal control based on the assessed risk, and performing such other procedures as we considered necessary in the circumstances. We believe that our audit provides a reasonable basis for our opinion.
Definition and limitations of internal control over financial reporting
A company’s internal control over financial reporting is a process designed to provide reasonable assurance regarding the reliability of financial reporting and the preparation of financial statements for external purposes in accordance with generally accepted accounting principles. A company’s internal control over financial reporting includes those policies and procedures that (1) pertain to the maintenance of records that, in reasonable detail, accurately and fairly reflect the transactions and dispositions of the assets of the company; (2) provide reasonable assurance that transactions are recorded as necessary to permit preparation of financial statements in accordance with generally accepted accounting principles, and that receipts and expenditures of the company are being made only in accordance with authorizations of management and directors of the company; and (3) provide reasonable assurance regarding prevention or timely detection of unauthorized acquisition, use, or disposition of the company’s assets that could have a material effect on the financial statements.
Because of its inherent limitations, internal control over financial reporting may not prevent or detect misstatements. Also, projections of any evaluation of effectiveness to future periods are subject to the risk that controls may become inadequate because of changes in conditions, or that the degree of compliance with the policies or procedures may deteriorate.
Other information
Our audit of, and opinion on, the Company’s internal control over financial reporting does not include the internal control over financial reporting of Safe Harbor Marinas, a wholly owned subsidiary, whose financial statements reflect approximately 23 percent of total assets and approximately 3 percent of revenues of the related consolidated financial statement amounts as of and for the year ended December 31, 2020. As indicated in Management’s Report, Safe Harbor Marinas was acquired in October 2020. Management’s assertion on the effectiveness of the Company’s internal control over financial reporting excluded internal control over financial reporting of Safe Harbor Marinas.
/s/ GRANT THORNTON LLP
Philadelphia, Pennsylvania
February 18, 2021
F - 4
SUN COMMUNITIES, INC.
CONSOLIDATED BALANCE SHEETS
(In thousands, except per share amounts)
| As of | |||||||||||
| December 31, 2020 | December 31, 2019 | ||||||||||
| Assets | |||||||||||
| Land | $ |
|
$ |
|
|||||||
| Land improvements and buildings |
|
|
|||||||||
| Rental homes and improvements |
|
|
|||||||||
| Furniture, fixtures and equipment |
|
|
|||||||||
| Investment property |
|
|
|||||||||
| Accumulated depreciation |
(
|
(
|
|||||||||
|
Investment property, net (including $
|
|
|
|||||||||
| Cash, cash equivalents and restricted cash |
|
|
|||||||||
|
Marketable securities; (see Note 15)
|
|
|
|||||||||
| Inventory of manufactured homes |
|
|
|||||||||
| Notes and other receivables, net |
|
|
|||||||||
| Goodwill |
|
|
|||||||||
| Other intangible assets, net |
|
|
|||||||||
|
Other assets, net (including $
|
|
|
|||||||||
| Total Assets | $ |
|
$ |
|
|||||||
| Liabilities | |||||||||||
|
Mortgage loans payable (including $
|
$ |
|
$ |
|
|||||||
| Preferred Equity - Sun NG RV Resorts LLC - mandatorily redeemable (fully attributable to consolidated VIEs; see Note 7) |
|
|
|||||||||
| Preferred OP units - mandatorily redeemable |
|
|
|||||||||
| Lines of credit and other debt |
|
|
|||||||||
| Distributions payable |
|
|
|||||||||
| Advanced reservation deposits and rent |
|
|
|||||||||
| Accrued expenses and accounts payable |
|
|
|||||||||
|
Other liabilities (including $
|
|
|
|||||||||
| Total Liabilities |
|
|
|||||||||
| Commitments and contingencies (see Note 16) | |||||||||||
| Series D preferred OP units |
|
|
|||||||||
| Series F preferred OP units |
|
|
|||||||||
| Series G preferred OP units |
|
|
|||||||||
| Series H preferred OP units |
|
|
|||||||||
| Series I preferred OP units |
|
|
|||||||||
|
Other redeemable noncontrolling interests (fully attributable to consolidated VIEs; see Note 7)
|
|
|
|||||||||
| Stockholders' Equity | |||||||||||
|
Common stock, $
|
|
|
|||||||||
| Additional paid-in capital |
|
|
|||||||||
| Accumulated other comprehensive loss |
|
(
|
|||||||||
| Distributions in excess of accumulated earnings |
(
|
(
|
|||||||||
| Total Sun Communities, Inc. stockholders' equity |
|
|
|||||||||
| Noncontrolling interests | |||||||||||
| Common and preferred OP units |
|
|
|||||||||
|
Consolidated VIEs (fully attributable to consolidated VIEs; see Note 7)
|
|
|
|||||||||
| Total noncontrolling interests |
|
|
|||||||||
| Total Stockholders' Equity |
|
|
|||||||||
| Total Liabilities, Temporary Equity and Stockholders' Equity | $ |
|
$ |
|
|||||||
See accompanying Notes to Consolidated Financial Statements.
F - 5
SUN COMMUNITIES, INC.
CONSOLIDATED STATEMENTS OF OPERATIONS
(In thousands, except per share amounts)
| Year Ended | ||||||||||||||||||||
| December 31, 2020 | December 31, 2019 | December 31, 2018 | ||||||||||||||||||
| Revenues | ||||||||||||||||||||
| Income from real property | $ |
|
$ |
|
$ |
|
||||||||||||||
| Revenue from home sales |
|
|
|
|||||||||||||||||
| Rental home revenue |
|
|
|
|||||||||||||||||
| Ancillary revenue |
|
|
|
|||||||||||||||||
| Interest income |
|
|
|
|||||||||||||||||
| Brokerage commissions and other revenues, net |
|
|
|
|||||||||||||||||
| Total Revenues |
|
|
|
|||||||||||||||||
| Expenses | ||||||||||||||||||||
| Property operating and maintenance |
|
|
|
|||||||||||||||||
| Real estate taxes |
|
|
|
|||||||||||||||||
| Cost of home sales |
|
|
|
|||||||||||||||||
| Rental home operating and maintenance |
|
|
|
|||||||||||||||||
| Ancillary expenses |
|
|
|
|||||||||||||||||
| Home selling expenses |
|
|
|
|||||||||||||||||
| General and administrative expenses |
|
|
|
|||||||||||||||||
| Catastrophic weather-related charges, net |
|
|
|
|||||||||||||||||
| Business combination expense |
|
|
|
|||||||||||||||||
| Depreciation and amortization |
|
|
|
|||||||||||||||||
|
Loss on extinguishment of debt (see Note 8)
|
|
|
|
|||||||||||||||||
| Interest expense |
|
|
|
|||||||||||||||||
| Interest on mandatorily redeemable preferred OP units / equity |
|
|
|
|||||||||||||||||
| Total Expenses |
|
|
|
|||||||||||||||||
| Income Before Other Items |
|
|
|
|||||||||||||||||
|
Gain / (loss) on remeasurement of marketable securities (see Note 15)
|
|
|
(
|
|||||||||||||||||
| Gain / (loss) on foreign currency translation |
|
|
(
|
|||||||||||||||||
| Gain on disposition of property |
|
|
|
|||||||||||||||||
| Other income / (expense), net |
(
|
(
|
|
|||||||||||||||||
|
Loss on remeasurement of notes receivable (see Note 4)
|
(
|
|
|
|||||||||||||||||
|
Income from nonconsolidated affiliates (see Note 6)
|
|
|
|
|||||||||||||||||
|
Loss on remeasurement of investment in nonconsolidated affiliates (see Note 6)
|
(
|
|
|
|||||||||||||||||
|
Current tax expense (see Note 12)
|
(
|
(
|
(
|
|||||||||||||||||
|
Deferred tax benefit (see Note 12)
|
|
|
|
|||||||||||||||||
| Net Income |
|
|
|
|||||||||||||||||
| Less: Preferred return to preferred OP units / equity |
|
|
|
|||||||||||||||||
| Less: Income attributable to noncontrolling interests |
|
|
|
|||||||||||||||||
| Net Income Attributable to Sun Communities, Inc. |
|
|
|
|||||||||||||||||
| Less: Preferred stock distribution |
|
|
|
|||||||||||||||||
| Net Income Attributable to Sun Communities, Inc. Common Stockholders | $ |
|
$ |
|
$ |
|
||||||||||||||
| Weighted average common shares outstanding - basic |
|
|
|
|||||||||||||||||
| Weighted average common shares outstanding - diluted |
|
|
|
|||||||||||||||||
|
Basic earnings per share (see Note 13)
|
$ |
|
$ |
|
$ |
|
||||||||||||||
|
Diluted earnings per share (see Note 13)
|
$ |
|
$ |
|
$ |
|
||||||||||||||
See accompanying Notes to Consolidated Financial Statements.
F - 6
SUN COMMUNITIES, INC.
CONSOLIDATED STATEMENTS OF COMPREHENSIVE INCOME
(In thousands)
| Year Ended | |||||||||||||||||
| December 31, 2020 | December 31, 2019 | December 31, 2018 | |||||||||||||||
| Net Income | $ |
|
$ |
|
$ |
|
|||||||||||
| Foreign currency translation gain / (loss) adjustment |
|
|
(
|
||||||||||||||
| Total Comprehensive Income |
|
|
|
||||||||||||||
| Less: Comprehensive Income attributable to noncontrolling interests |
(
|
(
|
(
|
||||||||||||||
| Comprehensive Income attributable to Sun Communities, Inc. | $ |
|
$ |
|
$ |
|
|||||||||||
See accompanying Notes to Consolidated Financial Statements.
F - 7
SUN COMMUNITIES, INC.
CONSOLIDATED STATEMENTS OF CASH FLOWS
(In thousands)
| Year Ended | |||||||||||||||||
| December 31, 2020 | December 31, 2019 | December 31, 2018 | |||||||||||||||
| Operating Activities | |||||||||||||||||
| Net income | $ |
|
$ |
|
$ |
|
|||||||||||
| Adjustments to reconcile net income to net cash provided by operating activities: | |||||||||||||||||
| Gain on disposition of assets |
(
|
(
|
(
|
||||||||||||||
| Gain on disposition of property |
(
|
|
|
||||||||||||||
| (Gain) / loss on foreign currency translation |
(
|
(
|
|
||||||||||||||
| (Gain) / loss on remeasurement of marketable securities (see Note 15) |
(
|
(
|
|
||||||||||||||
| (Gain) / loss on remeasurement of contingent liabilities |
|
|
(
|
||||||||||||||
| Share-based compensation |
|
|
|
||||||||||||||
| Depreciation and amortization |
|
|
|
||||||||||||||
| Deferred tax benefit (see Note 12) |
(
|
(
|
(
|
||||||||||||||
| Amortization of below market lease |
(
|
(
|
(
|
||||||||||||||
| Amortization of debt premium |
(
|
(
|
(
|
||||||||||||||
| Amortization of deferred financing costs |
|
|
|
||||||||||||||
| Amortization of ground lease intangibles |
|
|
|
||||||||||||||
| Loss on extinguishment of debt (see Note 8) |
|
|
|
||||||||||||||
| Loss on remeasurement of notes receivable (see Note 4) |
|
|
|
||||||||||||||
|
Loss on remeasurement of investment in nonconsolidated affiliates (see
Note 6) |
|
|
|
||||||||||||||
| Income from nonconsolidated affiliates (see Note 6) |
(
|
(
|
(
|
||||||||||||||
| Distributions from nonconsolidated affiliates |
|
|
|
||||||||||||||
| Change in notes receivable from financed sales of inventory homes, net of repayments |
(
|
|
(
|
||||||||||||||
| Change in inventory, other assets and other receivables, net |
|
(
|
(
|
||||||||||||||
| Change in other liabilities |
|
|
|
||||||||||||||
| Net Cash Provided By Operating Activities |
|
|
|
||||||||||||||
| Investing Activities | |||||||||||||||||
| Investment in properties |
(
|
(
|
(
|
||||||||||||||
| Acquisitions of properties, net of cash acquired |
(
|
(
|
(
|
||||||||||||||
| Proceeds from dispositions of assets and depreciated homes, net |
|
|
|
||||||||||||||
| Proceeds from disposition of properties |
|
|
|
||||||||||||||
| Issuance of notes and other receivables |
(
|
(
|
(
|
||||||||||||||
| Repayments of notes and other receivables |
|
|
|
||||||||||||||
| Investments in nonconsolidated affiliates |
(
|
(
|
(
|
||||||||||||||
| Distributions from nonconsolidated affiliates |
|
|
|
||||||||||||||
| Net Cash Used For Investing Activities |
(
|
(
|
(
|
||||||||||||||
| Financing Activities | |||||||||||||||||
| Issuance of common stock, OP units, and preferred OP units, net |
|
|
|
||||||||||||||
| Redemption of Series G preferred OP units |
(
|
|
|
||||||||||||||
| Redemption of Series B-3 preferred OP units |
|
(
|
(
|
||||||||||||||
| Borrowings on lines of credit |
|
|
|
||||||||||||||
| Payments on lines of credit |
(
|
(
|
(
|
||||||||||||||
| Proceeds from issuance of other debt |
|
|
|
||||||||||||||
| Payments on other debt |
(
|
(
|
(
|
||||||||||||||
| Prepayment penalty on collateralized term loans |
(
|
(
|
(
|
||||||||||||||
| Proceeds received from return of prepaid deferred financing costs |
|
|
|
||||||||||||||
| Distributions to stockholders, OP unit holders, and preferred OP unit holders |
(
|
(
|
(
|
||||||||||||||
| Payments for deferred financing costs |
(
|
(
|
(
|
||||||||||||||
| Net Cash Provided By Financing Activities |
|
|
|
||||||||||||||
| Effect of exchange rate changes on cash, cash equivalents and restricted cash |
|
|
(
|
||||||||||||||
| Net change in cash, cash equivalents and restricted cash |
|
(
|
|
||||||||||||||
| Cash, cash equivalents and restricted cash, beginning of period |
|
|
|
||||||||||||||
| Cash, Cash Equivalents and Restricted Cash, End of Period | $ |
|
$ |
|
$ |
|
|||||||||||
F - 8
| Year Ended | |||||||||||||||||
| December 31, 2020 | December 31, 2019 | December 31, 2018 | |||||||||||||||
| Supplemental Information | |||||||||||||||||
| Cash paid for interest (net of capitalized interest of $9,424, $7,943 and $4,328 respectively) | $ |
|
$ |
|
$ |
|
|||||||||||
| Cash paid for interest on mandatorily redeemable debt | $ |
|
$ |
|
$ |
|
|||||||||||
| Cash paid for income taxes | $ |
|
$ |
|
$ |
|
|||||||||||
| Noncash investing and financing activities | |||||||||||||||||
| Reduction in secured borrowing balance | $ |
|
$ |
|
$ |
|
|||||||||||
| Change in distributions declared and outstanding | $ |
|
$ |
|
$ |
|
|||||||||||
| Conversion of common and preferred OP units | $ |
|
$ |
|
$ |
|
|||||||||||
| Asset held for sale | $ |
|
$ |
|
$ |
|
|||||||||||
| Conversion of Series A-4 preferred stock | $ |
|
$ |
|
$ |
|
|||||||||||
| Noncash investing and financing activities at the date of acquisition | |||||||||||||||||
| Acquisitions - Common stock and OP units issued | $ |
|
$ |
|
$ |
|
|||||||||||
|
Acquisitions - Equity Interests - NG Sun LLC (see Note 7)
|
$ |
|
$ |
|
$ |
|
|||||||||||
|
Acquisitions - Preferred Equity - Sun NG RV Resorts LLC (see Note 7)
|
$ |
|
$ |
|
$ |
|
|||||||||||
| Acquisitions - Debt | $ |
|
$ |
|
$ |
|
|||||||||||
| Acquisitions - Series D preferred interest | $ |
|
$ |
|
$ |
|
|||||||||||
| Acquisitions - Series E preferred interest | $ |
|
$ |
|
$ |
|
|||||||||||
| Acquisitions - Series F preferred interest | $ |
|
$ |
|
$ |
|
|||||||||||
| Acquisitions - Series G preferred interest | $ |
|
$ |
|
$ |
|
|||||||||||
| Acquisitions - Series H preferred interest | $ |
|
$ |
|
$ |
|
|||||||||||
| Acquisitions - Series I preferred interest | $ |
|
$ |
|
$ |
|
|||||||||||
| Acquisitions - Escrow | $ |
|
$ |
|
$ |
|
|||||||||||
| Acquisitions - Contingent consideration liability | $ |
|
$ |
|
$ |
|
|||||||||||
See accompanying Notes to Consolidated Financial Statements.
F - 9
SUN COMMUNITIES, INC.
CONSOLIDATED STATEMENTS OF STOCKHOLDERS’ EQUITY
(In thousands)
| Stockholders’ Equity | |||||||||||||||||||||||||||||||||||||||||||||||
| Temporary Equity | Common Stock | Additional Paid-in Capital | Distributions in Excess of Accumulated Earnings | Accumulated Other Comprehensive Income / (Loss) | Non-controlling Interests | Total Stockholders’ Equity | Total Equity | ||||||||||||||||||||||||||||||||||||||||
| Balance at December 31, 2017 | $ |
|
$ |
|
$ |
|
$ |
(
|
$ |
|
$ |
|
$ |
|
$ |
|
|||||||||||||||||||||||||||||||
| Issuance of common stock and common OP units, net | — |
|
|
— | — | — |
|
|
|||||||||||||||||||||||||||||||||||||||
| Conversion of OP units |
(
|
|
|
— | — |
(
|
|
|
|||||||||||||||||||||||||||||||||||||||
| Conversion of series A-4 preferred stock |
(
|
— |
|
— | — | — |
|
|
|||||||||||||||||||||||||||||||||||||||
| Other redeemable noncontrolling interests |
|
— | — | — | — | — | — |
|
|||||||||||||||||||||||||||||||||||||||
| Share-based compensation - amortization and forfeitures | — | — |
|
|
— | — |
|
|
|||||||||||||||||||||||||||||||||||||||
| Foreign currency translation | — | — | — | — |
(
|
(
|
(
|
(
|
|||||||||||||||||||||||||||||||||||||||
| Net income |
|
— | — |
|
— |
|
|
|
|||||||||||||||||||||||||||||||||||||||
| Distributions |
(
|
— | — |
(
|
— |
(
|
(
|
(
|
|||||||||||||||||||||||||||||||||||||||
| Balance at December 31, 2018 | $ |
|
$ |
|
$ |
|
$ |
(
|
$ |
(
|
$ |
|
$ |
|
$ |
|
|||||||||||||||||||||||||||||||
| Issuance of common stock and common OP units, net | — |
|
|
— | — |
|
|
|
|||||||||||||||||||||||||||||||||||||||
| Conversion of OP units |
(
|
|
|
— | — |
(
|
|
|
|||||||||||||||||||||||||||||||||||||||
| Conversion of Series A-4 preferred stock |
(
|
|
|
— | — | — |
|
|
|||||||||||||||||||||||||||||||||||||||
| Other redeemable noncontrolling interests |
|
— | — |
(
|
— | — |
(
|
|
|||||||||||||||||||||||||||||||||||||||
| Share-based compensation - amortization and forfeitures | — | — |
|
|
— | — |
|
|
|||||||||||||||||||||||||||||||||||||||
| Issuance of Series D OP units |
|
— | — | — | — | — | — |
|
|||||||||||||||||||||||||||||||||||||||
| Foreign currency translation | — | — | — | — |
|
|
|
|
|||||||||||||||||||||||||||||||||||||||
| Net income |
|
— | — |
|
— |
|
|
|
|||||||||||||||||||||||||||||||||||||||
| Distributions |
(
|
— | — |
(
|
— |
(
|
(
|
(
|
|||||||||||||||||||||||||||||||||||||||
| Balance at December 31, 2019 | $ |
|
$ |
|
$ |
|
$ |
(
|
$ |
(
|
$ |
|
$ |
|
$ |
|
|||||||||||||||||||||||||||||||
| Issuance of common stock and common OP units, net | — |
|
|
— | — |
|
|
|
|||||||||||||||||||||||||||||||||||||||
| Conversion of OP units | — |
|
|
— | — |
(
|
— |
|
|||||||||||||||||||||||||||||||||||||||
| Other redeemable noncontrolling interests |
|
— | — |
(
|
— | — |
(
|
|
|||||||||||||||||||||||||||||||||||||||
| Share-based compensation - amortization and forfeitures | — | — |
|
|
— | — |
|
|
|||||||||||||||||||||||||||||||||||||||
| Issuance of Series preferred E OP units | — | — |
|
— | — |
|
|
|
|||||||||||||||||||||||||||||||||||||||
| Issuance of Series preferred F OP units |
|
— | — | — | — | — | — |
|
|||||||||||||||||||||||||||||||||||||||
| Issuance of Series preferred G OP units |
|
— | — | — | — | — | — |
|
|||||||||||||||||||||||||||||||||||||||
| Redemption of Series G OP Units |
(
|
— | — | — | — | — | — |
(
|
|||||||||||||||||||||||||||||||||||||||
| Issuance of Series preferred H OP units |
|
— |
(
|
— | — |
|
|
|
|||||||||||||||||||||||||||||||||||||||
| Issuance of Series preferred I OP units |
|
— | — | — | — | — | — |
|
|||||||||||||||||||||||||||||||||||||||
| Foreign currency translation | — | — | — | — |
|
(
|
|
|
|||||||||||||||||||||||||||||||||||||||
| Remeasurement of notes receivable and equity method investment (see Note 19) | — | — | — |
|
— | — |
|
|
|||||||||||||||||||||||||||||||||||||||
| Net income |
|
— | — |
|
— |
|
|
|
|||||||||||||||||||||||||||||||||||||||
| Distributions |
(
|
— | — |
(
|
— |
(
|
(
|
(
|
|||||||||||||||||||||||||||||||||||||||
| Balance at December 31, 2020 | $ |
|
$ |
|
$ |
|
$ |
(
|
$ |
|
$ |
|
$ |
|
$ |
|
|||||||||||||||||||||||||||||||
See accompanying Notes to Consolidated Financial Statements.
F - 10
SUN COMMUNITIES, INC.
NOTES TO CONSOLIDATED FINANCIAL STATEMENTS
1. Significant Accounting Policies
Business
Sun Communities, I
nc., a Maryland corporation, and all wholly-owned or majority-owned and controlled subsidiaries, including Sun Communities Operating Limited Partnership, a Michigan limited partnership (the “Operating Partnership”), Sun Home Services, Inc., a Michigan corporation (“SHS”), and Safe Harbor Marinas, LLC (“Safe Harbor”) are referred to herein as the “Company,” “us,” “we,” and “our.”
We are a fully integrated, self-administered and self-managed real estate investment trust (“REIT”). As of December 31, 2020, we owned and operated or had an interest in a portfolio of
552
MH communities, RV resorts, and marinas (collectively, the “properties”) located in
39
states throughout the United States and Ontario, Canada, including
276
MH communities,
136
RV resorts,
34
properties containing both MH and RV sites, and
106
marinas. As of December 31, 2020, the properties contained an aggregate of
188,176
developed sites comprised of
96,688
developed MH sites,
27,564
annual RV sites (inclusive of both annual and seasonal usage rights),
25,043
transient RV sites, and
38,881
wet slips and dry storage spaces.
Certain prior period amounts have been reclassified on our Consolidated Financial Statements to conform with current year presentation.
Estimates inherent in the current financial reporting process inevitably involve assumptions about future events. Since December 2019, a novel strain of coronavirus, referred to as the COVID-19 virus, has spread to countries in which we operate. COVID-19 has become a global pandemic. Commencing in March 2020, authorities in jurisdictions where our properties are located have issued restrictions on travel and the types of businesses that may continue to operate. Those restrictions were relaxed throughout the year leading to all properties being able to open, however government regulations may limit the amenities available at any given property. The extent and duration of the business restrictions will have an effect on estimates used in the preparation of financial statements. This includes the net operating income (“NOI”) assumptions in our long-lived asset impairment testing, the ultimate collectability of rent payments from residents and guests due to the effects of COVID-19 on their financial position, and fair value measurement changes for financial assets that we have elected to measure at fair value.
Use of Estimates
The preparation of financial statements in conformity with accounting principles generally accepted in the United States of America (“GAAP”) requires management to make estimates and assumptions related to the reported amounts included in our Consolidated Financial Statements and accompanying footnotes thereto. Actual results could differ from those estimates.
Segment Information
ASC Topic 280, “
Segment Reporting
” (“ASC 280”), establishes standards for the way the business enterprises report information about operating segments in its financial statements. In accordance with ASC 280, management has determined that we have
two
operating segments, Real Property Operations and Home Sales and Rentals. The Real Property Operations segment owns, operates, develops, or has an interest in, a portfolio of MH communities, RV resorts and marinas throughout the U.S. and in Canada, and is in the business of acquiring, operating, and expanding MH, RV and marinas. The Home Sales and Rentals segment offers MH and RV park model sales and leasing services to tenants and prospective tenants of our communities and resorts. We evaluate segment operating performance based on NOI and gross profit. Refer to Note 20, “Subsequent Events,” for information regarding segment reporting after December 31, 2020.
F - 11
SUN COMMUNITIES, INC.
NOTES TO CONSOLIDATED FINANCIAL STATEMENTS
Investment Property
Investment property is recorded at cost, less accumulated depreciation.
Impairment of long-lived assets -
We estimate the fair value of our long-lived assets based on discounted future cash flows and any potential disposition proceeds for a given asset. Forecasting cash flows requires management to make estimates and assumptions about such variables as the estimated holding period, rental rates, occupancy, development, and operating expenses during the holding period, as well as disposition proceeds. Management uses its best judgment when developing these estimates and assumptions, but the development of the projected future cash flows is based on subjective variables. Future events could occur which would cause us to conclude that impairment indicators exist, and significant adverse changes in national, regional, or local market conditions or trends may cause us to change the estimates and assumptions used in our impairment analysis. The results of an impairment analysis could be material to our financial statements.
We review the carrying value of long-lived assets to be held and used for impairment quarterly or whenever events or changes in circumstances indicate a possible impairment. Our primary indicator for potential impairment is based on NOI trends period over period. Circumstances that may prompt a test of recoverability may include a significant decrease in the anticipated market price, an adverse change to the extent or manner in which an asset may be used or in its physical condition or other events that may significantly change the value of the long-lived asset. An impairment loss is recognized when a long-lived asset’s carrying value is not recoverable and exceeds estimated fair value.
Real Estate Held For Sale -
We periodically classify real estate as “held for sale.” An asset is classified as held for sale after an active program to sell an asset has commenced and when the sale is probable. Subsequent to the classification of assets as held for sale, no further depreciation expense is recorded. Within Other Assets, net on the Consolidated Balance Sheets is $
32.1
million of real estate held for sale which is the carrying value of
four
properties as of December 31, 2020.
Acquisitions
- We evaluate acquisitions pursuant to ASC 805 “
Business Combinations
” to determine whether the acquisition should be classified as either an asset acquisition or a business combination.
Acquisitions for which substantially all of the fair value of the gross assets acquired are concentrated in a single identifiable asset or a group of similar identifiable assets are accounted for as an asset acquisition. Most of our property acquisitions are accounted for as asset acquisitions. For asset acquisitions, we allocate the purchase price of these properties on a relative fair value basis and capitalize direct acquisition related costs as part of the purchase price. Acquisition costs that do not meet the criteria to be capitalized are expensed as incurred and presented as General and administrative costs in our Consolidated Statements of Operations.
Acquisitions that meet the definition of a business combination are recorded at fair value using a fair value model under which the assets and liabilities are generally recognized at their fair values and the difference between the consideration transferred, excluding transaction costs, and the fair values of the assets and liabilities is recognized as goodwill. For acquisitions that meet the definition of a business combination, we allocate the purchase price of those properties on a fair value basis and expense the acquisitions related transaction costs as incurred. Transaction costs are presented as Business combination expense in our Consolidated Statements of Operations.
For asset acquisitions and business combinations, we allocate the purchase price to net tangible and identified intangible assets acquired based on their fair values. In making estimates of fair values for purposes of allocating purchase price, we utilize an independent third-party to value the net tangible and identified intangible assets in connection with the acquisition of the respective property. We provide historical and pro forma financial information obtained about each property, as well as any other information needed in order for the third-party to ascertain the fair value of the tangible and intangible assets (including in-place leases) acquired.
Capitalized Costs
We capitalize certain costs incurred in connection with the development, redevelopment, capital enhancement and leasing of our properties. Management is required to use professional judgment in determining whether such costs meet the criteria for capitalization or immediate expense. The amounts are dependent on the volume and timing of such activities, and the costs associated with such activities:
Maintenance, repairs, and minor improvements to properties are expensed when incurred.
F - 12
SUN COMMUNITIES, INC.
NOTES TO CONSOLIDATED FINANCIAL STATEMENTS
Renovations and improvements to our properties are capitalized and depreciated over their estimated useful lives and real estate project costs related to the development of new community or expansion sites are capitalized until the property is substantially complete and available for occupancy. Costs incurred to initially renovate pre-owned and repossessed homes that we acquire for our Rental Program are capitalized, and the majority of costs incurred to refurbish the homes at turnover and repair the homes while occupied, are expensed unless they extend the life of the home. Renovations and improvements to marinas are capitalized and depreciated over their estimated useful lives. Improvements made to docks, buildings, systems, equipment, shorelines and site improvements are capitalized until the project is substantially complete and available for use.
Certain expenditures to dealers and residents related to obtaining lessees in our communities are capitalized and amortized based on the anticipated term of occupancy of a resident.
Costs associated with implementing our software are capitalized and amortized over the estimated useful lives of the related software and hardware.
Costs associated with purchases of furniture, fixtures and equipment, major replacements and improvements are capitalized and subsequently depreciated over their respective underlying assets estimated useful lives.
Costs incurred to obtain new debt financing (i.e. deferred financing costs)
are capitalized and amortized over the terms of the underlying loan agreement using the straight-line method (which approximates the effective interest method). Deferred financing costs include fees and costs incurred to obtain long-term financing. Unamortized deferred financing costs are written off when debt is retired before the maturity date. Upon amendment of the lines of credit or refinancing of mortgage debt, unamortized deferred financing costs and any related discounts or premiums are accounted for in accordance with FASB Accounting Standards Codification (“ASC”) 470-50-40, “
Modifications and Extinguishments
.” At December 31, 2020 and 2019, $
11.7
million and $
4.5
million of lines of credit deferred financing costs, respectively, were presented as a component of Other assets, net on the Consolidated Balance Sheets. At December 31, 2020 and 2019, $
13.9
million and $
7.9
million of deferred financing costs and discounts and premiums, respectively, were netted and presented as a component of Mortgage loans payable on the Consolidated Balance Sheets.
Cash and Cash Equivalents
We consider all highly liquid investments with a maturity of three months or less from the date of purchase to be cash and cash equivalents. At December 31, 2020 and 2019, $
83.0
million and $
22.1
million of Cash and Cash Equivalents, respectively, was included as a component of Cash, cash equivalents and restricted cash on the Consolidated Balance Sheets. The maximum amount of credit risk arising from cash deposits in excess of federally insured amounts was approximately $
74.5
million and $
22.9
million as of December 31, 2020 and 2019, respectively.
Restricted Cash
Restricted cash consists primarily of cash deposited in acquisition escrow accounts held by title companies in relation to certain future acquisitions, amounts held in deposit for tax, insurance, and repair escrows held by lenders in accordance with certain debt agreements. At December 31, 2020 and 2019, $
15.3
million and $
12.7
million of restricted cash, respectively, was included as a component of Cash, cash equivalents and restricted cash on the Consolidated Balance Sheets. Changes in the restricted cash are reported in our Consolidated Statements of Cash Flows as operating, investing or financing activities based on the nature of the underlying activity. Restricted cash and restricted cash equivalents are included with cash and cash equivalents in the reconciliation of the beginning-of-period and the end-of-period cash balance on the Consolidated Statements of Cash Flows.
F - 13
SUN COMMUNITIES, INC.
NOTES TO CONSOLIDATED FINANCIAL STATEMENTS
Inventory
Inventory of manufactured homes is stated at lower of specific cost or net realizable value based on the specific identification method and the balance is separately disclosed on our Consolidated Balance Sheet. Other inventory at our MH and RV properties consists primarily of service and merchandise related items, grocery, food and beverage products and are stated at the lower of cost or net realizable value. Physical inventory counts are performed where inventory exists. Inventory records are adjusted accordingly to reflect actual inventory counts and any resulting shortage is recognized. The inventory balance is included in Other assets, net on our Consolidated Balance Sheet.
Investments in Nonconsolidated Affiliates
We apply the equity method of accounting to entities in which we do not have a direct or indirect controlling interest or for variable interest entities where we are not considered the primary beneficiary but can exercise influence over the entity with respect to its operations and major decisions. Under the equity method of accounting, the cost of an investment is adjusted for our share of the equity in net income or loss from the date of acquisition, reduced by distributions received and increased by contributions made. The income or loss of each entity is allocated in accordance with the provisions of the applicable operating agreements. The allocation provisions in these agreements may differ from the ownership interests held by each investor. The cost method is applied when (a) the investment is minimal (typically less than
5.0
percent) and (b) our investment is passive. Our exposure to losses associated with nonconsolidated joint ventures is primarily limited to the carrying value of these investments. Accordingly, distributions from a joint venture in excess of our carrying value are recognized in earnings. We review the carrying value of our investments in nonconsolidated affiliates for other than temporary impairment whenever events or changes in circumstances indicate a possible impairment. Financial condition, operational performance, and other economic trends are among the factors we consider when we evaluate the existence of impairment indicators. Refer to Note 6, “Investments in Nonconsolidated Affiliates,” for additional information.
Notes and Other Receivables
Notes receivable
- include installment loans for manufactured homes purchased by us and notes receivable from real estate developers.
Installment Notes Receivable on Manufactured Homes
- represent notes receivable for the purchase of manufactured homes primarily located in our communities, which are collateralized by the underlying manufactured home sold. Interest income is accrued based upon the unpaid principal balance of the loans. Past due status of our notes receivable is determined based upon the contractual terms of the note. When a note receivable becomes 60 days delinquent, we stop accruing interest on the note receivable. The interest on nonaccrual loans is accounted for on the cash basis until qualifying for return to accrual.
Due to the election of the fair value option upon adoption of ASU 2016-13, “Financial Instruments - Credit Losses (Topic 326) Measurement of Credit Losses on Financial Instruments,” (“CECL”) effective January 1, 2020, our installment notes receivable on manufactured homes are measured at fair value pursuant to FASB ASC 820, “
Fair Value Measurements and Disclosures
.”
At adoption, we recorded a fair value adjustment to retained earnings. Subsequent to the adoption, the fair value is evaluated quarterly, and the fair value adjustments are recorded in Loss on remeasurement of notes receivable on the Consolidated Statement of Operations. Refer to Note 15, “Fair Value of Financial Instruments,” for additional information regarding the estimates and assumptions used to estimate the fair value of each financial instrument class.
For the period prior to the adoption of CECL, installment notes receivable are reported at their outstanding unpaid principal balance adjusted for an allowance for loan loss.
F - 14
SUN COMMUNITIES, INC.
NOTES TO CONSOLIDATED FINANCIAL STATEMENTS
Notes Receivable from Real Estate Developers -
represent short term construction loans provided to real estate developers. We elected the fair value option for notes receivable from our real estate developers as of January 1, 2020 pursuant to FASB ASC 820, “
Fair Value Measurements and Disclosures
.” The adoption of fair value did not result in any opening balance adjustments as the carrying values of these notes generally approximate their fair market values either due to the short-term nature of the loan and / or the note being secured by underlying collateral and / or personal guarantees. Subsequent to the adoption, the fair value is evaluated quarterly, and any fair value adjustments are recorded in Loss on remeasurement of notes receivable on the Consolidated Statement of Operations. Refer to Note 15, “Fair Value of Financial Instruments,” for additional information regarding the estimates and assumptions used to estimate the fair value of each financial instrument class. Refer to Note 15, “Fair Value of Financial Instruments,” for additional information regarding the estimates and assumptions used to estimate the fair value of each financial instrument class.
Other receivables
- are generally comprised of amounts due from residents for rent and related charges (utility charges, fees and other pass through charges), home sale proceeds receivable from sales near year end, amounts due from marina customers for storage service and lease payments, and various other miscellaneous receivables. Adoption of CECL did not require incremental CECL reserves as we believe that the risk of future expected loss on those accounts is immaterial due to the short-term nature of the accounts, history of collectability, past relationships and various other mitigating factors. Accounts receivable from residents are typically due within 30 days and stated at amounts due from residents net of an allowance for doubtful accounts. Accounts receivable from marina customers are stated at amounts due from marina customer net of an allowance for doubtful accounts. Accounts outstanding longer than the contractual payment terms are considered past due. We evaluate the recoverability of our receivables whenever events occur or there are changes in circumstances such that management believes it is probable that it will be unable to collect all amounts due according to the contractual terms of the loan and lease agreements. Receivables related to community rents are reserved when we believe that collection is less than probable, which is generally after a resident balance reaches
60
to
90
days past due. Receivables related to our marina rents are reserved when we believe that collection is less than probable, which is generally 50 percent for Dockmaster receivable balances over 180 days, and 60 percent after the balance reaches 60 days past due for all other receivables.
Refer to Note 4, “Notes and Other Receivables,” for additional detail on receivables.
Refer to Note 19, “Recent Accounting Pronouncements,” for additional detail on the adoption of CECL.
Goodwill
Goodwill is deductible for income tax purposes. As such, the goodwill portion allocated to our taxable REIT subsidiary entities will reduce their taxable income. Given that REITs do not customarily report any taxable income (due to the dividends paid deduction), we do not expect any significant tax benefits arising from the goodwill allocable to the REIT.
The carrying amount of goodwill is separately disclosed on our Consolidated Balance Sheets. Refer to Note 5, “Goodwill and Other Intangible Assets,” for additional information on goodwill.
Other Intangible Assets
Intangible assets with finite lives
- we amortize identified intangible assets that are determined to have finite lives over the period the assets are expected to contribute directly or indirectly to the future cash flows of the property or business.
F - 15
SUN COMMUNITIES, INC.
NOTES TO CONSOLIDATED FINANCIAL STATEMENTS
Trademarks and trade names -
we account for trademarks and trade names pursuant to ASC 350, “
Intangibles-Goodwill and Other.
”
All trademarks and trade names have an indefinite useful life except for one that has a finite useful life. Trademarks and trade names with finite lives are amortized over their useful life. Trademarks and trade names with indefinite-lives are not amortized. Trademarks and Trade names are reviewed for impairment on an annual basis or more frequently if indicators of impairment are identified. We first review qualitative factors to determine if a quantitative impairment test is necessary. If the qualitative assessment reveals that it’s “more likely than not” that the asset is impaired, a calculation of the fair value is performed and the asset is written down to its implied fair value, if it is lower than its carrying amount. As of December 31, 2020, we recognized $
99.8
million of trademarks and trade names in relation to the acquisition of Safe Harbor and other marinas accounted for as business combinations.
The carrying amounts of the other identified intangible assets are included in Other intangible assets, net on our Consolidated Balance Sheets. Refer to Note 5, “Goodwill and Other Intangible Assets,” for additional information on other intangibles.
Deferred Taxes
We are subject to certain state taxes that are considered to be income taxes and have certain subsidiaries that are taxed as regular corporations for U.S. (i.e., federal, state, local, etc.) and non-U.S. income tax purposes. Deferred tax assets or liabilities are recognized for temporary differences between the tax basis of assets and liabilities and their carrying amounts in the financial statements and net operating loss carryforwards in certain subsidiaries, including those domiciled in foreign jurisdictions, which may be realized in future periods if the respective subsidiary generates sufficient taxable income. Deferred tax assets and liabilities are measured using currently enacted tax rates. A valuation allowance is established if, based on the available evidence, it is considered more likely than not that some portion or all of the deferred tax assets will not be realized. Refer to Note 12, “Income Taxes,” for additional information.
Temporary Equity
Temporary equity includes preferred securities that are redeemable for cash at the option of the holder or upon the occurrence of an event that is not solely within our control based on a fixed or determinable price. These preferred securities are not mandatorily redeemable for cash nor do they contain a fixed maturity date. Temporary equity is classified between Liabilities and Stockholders’ Equity on the Consolidated Balance Sheets.
Share-Based Compensation
Share-based compensation cost for service vesting restricted stock awards is measured based on the closing share price of our common stock on the date of grant. We measure the fair value of awards with performance conditions based on an estimate of shares expected to vest using the closing price of our common stock as of the grant date. If it is not probable that the performance conditions will be satisfied, we do not recognize compensation expense. We estimate the fair value of share-based compensation for restricted stock with market conditions using a Monte Carlo simulation. We recognize compensation cost ratably over each tranche of shares based on the fair value estimated by the model. Refer to Note 10, “Share-Based Compensation,” for additional information.
Fair Value of Financial Instruments
Our financial instruments consist of cash, cash equivalents and restricted cash, accounts and notes receivable, marketable securities, accounts payable, debt, and contingent consideration liability. We utilize fair value measurements to record fair value adjustments to certain assets and liabilities and to determine fair value disclosures, pursuant to FASB ASC 820, “Fair Value Measurements and Disclosures.”
ASC 820 requires disclosure regarding determination of fair value for assets and liabilities and establishes a three-tiered fair value hierarchy under which these assets and liabilities must be grouped, based on significant levels of observable or unobservable inputs. Observable inputs reflect market data obtained from independent sources, while unobservable inputs reflect our market assumption. This hierarchy requires the use of observable market data when available. These two types of inputs have created the following fair value hierarchy:
Level 1 - Quoted unadjusted prices for identical instruments in active markets that we have the ability to access;
Level 2 - Quoted prices for similar instruments in active markets, quoted prices for identical or similar instruments in markets that are not active and model-derived valuations in which all significant inputs and significant value drivers are observable (e.g., interest rates, yield curves, prepayment speeds, default rates, loss severity, etc.) in active markets or can be corroborated by observable market data; and
F - 16
SUN COMMUNITIES, INC.
NOTES TO CONSOLIDATED FINANCIAL STATEMENTS
Level 3 - Valuations derived from valuation techniques in which one or more significant inputs or significant value drivers are unobservable. The unobservable inputs reflect our assumptions about the assumptions that market participants would use.
Refer to Note 15, “Fair Value of Financial Instruments,” for additional information on methods and assumptions used to estimate the fair value of each financial instrument class.
Revenue Recognition
As a real estate owner and operator, the majority of our revenue is derived from site and home leases that are accounted for pursuant to ASC 842 “
Leases.
” We account for all revenue from contracts with customers following ASC 606, “
Revenue from Contracts with Customers
” except for those that are within the scope of other topics in the FASB accounting standards codification. The core principle of ASC 606 is that an entity should recognize revenue to depict the transfer of promised goods or services to customers in an amount that reflects the consideration to which the entity expects to be entitled in exchange for those goods or services. A five-step transactional analysis is required to determine how and when to recognize revenue. For transactions in the scope of ASC 606, we recognize revenue when control of goods or services transfers to the customer, in the amount that we expect to receive for the transfer of goods or provision of services. Refer to Note 2, “Revenue,” for additional information.
Income from real property
at our MH and RV properties is revenue from residents and guests in our communities who lease the site on which their home or RV is located, and either own or lease their home. Resident leases are generally for one-year, but may range from month-to-month to two year terms and are renewable by mutual agreement between the parties, or in some cases, as provided by statute.
Revenue from site and home leases
falls under the scope of ASC 842, and is accounted for as operating leases with straight-line recognition. Income from real property includes income from site leases for annual MH residents, site leases for annual RV residents and site rentals to transient RV residents. Non-lease components of our site lease contracts, which are primarily provision of utility services, are accounted for with the site lease as a single lease under ASC 842. Additionally, we include collections of real estate taxes from residents within Income from real property.
Revenue from home sales
- our taxable REIT subsidiary, SHS, sells manufactured homes to current and prospective residents in our communities. We recognize revenue for home sales pursuant to ASC 606 as manufactured homes are tangible personal property that can be located on any land parcel. Manufactured homes are not permanent fixtures or improvements to the underlying real estate and we therefore do not consider them to be subject to the guidance in ASC 360-20 “
Real Estate Sales.
” In accordance with the core principle of ASC 606, we recognize revenue from home sales at the time of closing when control of the home transfers to the customer. After closing of the sale transaction, we have no remaining performance obligation. As of December 31, 2020, and December 31, 2019, we had $
23.6
million and $
20.9
million, respectively, of receivables from contracts with customers, which consists of home sales proceeds, and are presented as a component of Notes and other receivables, net on our Consolidated Balance Sheets. These receivables represent balances owed to us for previously completed performance obligations for sales of manufactured homes. We report real estate taxes collected from residents and remitted to taxing authorities in revenue.
Rental home revenue
- is comprised of rental agreements whereby we lease homes to residents in our communities. We account for these revenues under ASC 842.
F - 17
SUN COMMUNITIES, INC.
NOTES TO CONSOLIDATED FINANCIAL STATEMENTS
Ancillary revenue
- is primarily composed of proceeds from restaurant, golf, merchandise, retail, fuel, service and other activities at our RV resorts and marinas, and is included in the scope of ASC 606. Revenues are recognized at the point of sale when control of the good or service transfers to the customer and our performance obligation has been satisfied. In addition, leasing of short-term vacation home rentals is included within ancillary revenue and falls within the scope of ASC 842. Marina rental income, which includes boat rentals, is included in ancillary revenue, and is earned when the customer takes control of good or service. Sales and other taxes that we collect concurrent with revenue-producing activities are excluded from the transaction price.
Interest income
- is earned primarily on our notes receivable, which include installment notes receivables on manufactured homes purchased by us from loan originators and notes receivable from real estate developers. Interest income on these receivables is accrued based on the unpaid principal balances of the underlying loans on a level yield basis over the life of the loans. Interest income is not in the scope of ASC 606. Refer to Note 4, “Notes and Other Receivables,” for additional information.
Brokerage commissions and other revenues -
comprise (a) brokerage commissions at our marinas, and (b) brokerage commissions for sales of manufactured homes at our MH and RV properties, where we act as agent and arrange for a third party to transfer a manufactured home, a park model or a boat to a customer within one of our properties. Brokerage commission revenues are recognized on a net basis at closing, when the transaction is completed and our performance obligations have been fulfilled. Other revenues primarily include management fee revenue earned from managing third party owned marinas.
Advertising Costs
Advertising costs are expensed as incurred. As of December 31, 2020, 2019 and 2018, we had advertising costs of $
8.3
million, $
6.7
million and $
6.2
million, respectively.
Depreciation and Amortization
Depreciation and amortization are computed on a straight-line basis over the estimated useful lives of the assets, ranging from
three months
to
40
years depending upon the asset classification.
| Asset lives | Useful Life | |||||||||||||
| Land improvement and building |
|
- |
|
|||||||||||
| Rental homes |
|
|||||||||||||
| Furniture, fixtures and equipment |
|
- |
|
|||||||||||
| Computer hardware and software |
|
- |
|
|||||||||||
| Dock improvements |
|
- |
|
|||||||||||
| Site improvements |
|
- |
|
|||||||||||
| Leasehold improvement | Lesser of lease term or useful life of assets | |||||||||||||
| In-place leases |
|
- |
|
|||||||||||
| Slip in-place leases |
|
- |
|
|||||||||||
| Goodwill | Indefinite | |||||||||||||
| Non - competition agreements |
|
|||||||||||||
| Trademarks and trade names |
Various
(1)
|
|||||||||||||
| Customer Relationships |
|
- |
|
|||||||||||
| Franchise agreements and other intangible assets |
|
- |
|
|||||||||||
(1)
All trademarks and trade names have an indefinite useful life except for one that has a two and a half year useful life.
Foreign Currency
The assets and liabilities of our Australian and Canadian operations, where the functional currency is the Australian dollar and Canadian dollar, are translated into U.S. dollars using the exchange rate in effect as of the balance sheet date. Income statement amounts are translated at the average exchange rate prevailing during the period. The resulting translation adjustments are recorded as a component of accumulated other comprehensive income (loss). Foreign currency exchange gains and losses arising from fluctuations in currency exchange rates on transactions and the effects of remeasurement of monetary balances denominated in currencies other than the functional currency are recorded in earnings.
F - 18
SUN COMMUNITIES, INC.
NOTES TO CONSOLIDATED FINANCIAL STATEMENTS
For the year ended December 31, 2020, we recorded a foreign currency translation gain of $
8.0
million as compared to a foreign currency translation gain of $
4.6
million for the year ended December 31, 2019 and $
8.2
million foreign currency translation loss for the year ended December 31, 2018 on our Consolidated Statements of Operations.
Accounting for leases
In February 2016, the FASB issued ASC 2016-02 codified in ASC Topic 842, “Leases,” which amends the guidance in former ASC Topic 840, Leases. On January 1, 2019, we adopted ASC 2016-02. The new standard increases transparency and comparability most significantly by requiring the recognition by lessees of right of-use (“ROU”) assets and lease liabilities on the balance sheets for those leases classified as operating leases and disclose key information about leasing arrangements. At adoption, we elected the package of practical expedients, which permits us not to reassess expired or existing contracts containing a lease, the lease classification for expired or existing contracts, initial direct costs for any existing leases. We elected not to allocate lease obligation between lease and non-lease components of our agreements for both leases where we are a lessor and leases where we are a lessee. We did not elect the hindsight practical expedient, which permits us to use hindsight in determining the lease terms and impairment implications. We did not elect to use a portfolio approach in the valuation of ROU assets and corresponding liabilities. Some ROU assets include an extension option, which is included in the ROU assets and liabilities only if we are reasonably certain to exercise the option.
Lessee Accounting
We determine if an arrangement is a lease at inception. Our operating lease agreements are primarily for land and submerged land under non-cancelable operating leases at certain properties, executive office spaces, and certain equipment leases. The ROU asset and liabilities are included within Other assets, net and Other liabilities on the Consolidated Balance Sheets.
For operating leases with a term greater than one year, we recognize the ROU assets and liabilities related to the lease payments on the Consolidated Balance Sheets. The lease liabilities are initially and subsequently measured at the present value of the unpaid lease payments at the lease commencement date. The ROU assets represent our right to use the underlying assets for the term of the lease and the lease liabilities represent our obligation to make lease payments arising for the agreements. The ROU asset is initially measured at cost, which comprises the initial amount of the lease liability adjusted for lease payments made at or before the lease commencement date, plus any initial direct costs incurred less any lease incentives received. The ROU asset is subsequently measured throughout the lease term at the carrying amount of the lease liability, plus unamortized initial direct costs, plus (minus) any prepaid (accrued) lease payments, less the unamortized balance of lease incentives received. Lease expense for lease payments is recognized on a straight-line basis over the lease term. The ROU asset is periodically reduced by impairment losses. As of December 31, 2020, we have not encountered any impairment losses. Variable lease payments, except for the ones that depend on index or rate, are excluded from the calculation of the ROU assets and lease liabilities and are recognized as variable lease expense in the Consolidated Statements of Operations in the period in which they are incurred. As most of our leases do not provide an implicit rate, we use our incremental borrowing rate based on the information available at commencement date in determining the present value of lease payments. Many of our lessee agreements include options to extend the lease, which we do not include in our minimum lease terms unless they are reasonably certain to be exercised. The lease liability costs are amortized over the straight-line method over the term of the lease. Operating leases with a term of less than one year are recognized as a lease expense over the term of the lease, with no asset or liability recognized on the Consolidated Balance Sheets.
Finance leases where we are the lessee are included in Other assets, net and Other liabilities on our Consolidated Balance Sheets. The lease liabilities are initially measured in the same manner as operating leases and are subsequently measured at amortized cost using the effective interest method. The ROU asset is initially measured at cost, which comprises the initial amount of the lease liability adjusted for lease payments made at or before the lease commencement date, plus any initial direct costs incurred less any lease incentives received. For finance leases the ROU asset is subsequently amortized using the straight-line method from the lease commencement date to the earlier of the end of its useful life or the end of the lease term unless the lease transfers ownership of the underlying asset to us, or we are reasonably certain to exercise an option to purchase the underlying asset. In those cases, the ROU asset is amortized over the useful life of the underlying asset. Amortization of the ROU asset is recognized and presented separately from interest expense on the lease liability. ROU assets are periodically reduced by impairment losses. As of December 31, 2020, we have had no impairment losses. Refer to Note 17, “Leases,” for information regarding leasing activities.
F - 19
SUN COMMUNITIES, INC.
NOTES TO CONSOLIDATED FINANCIAL STATEMENTS
Lessor Accounting
Our income from real property and rental home revenue at our MH and RV properties is derived from rental agreements where we are the lessor. Our recognition of rental revenue remains mainly consistent with previous guidance, apart from the narrower definition of initial direct costs that can be capitalized. ASC 842 limits the definition of initial direct costs to only the incremental costs of signing a lease. Internal sales employees’ compensation, payroll-related fringe benefits, certain legal fees rendered prior to the execution of a lease, negotiation costs, advertising and other origination effort costs no longer meet the definition of initial direct costs under the new standard, and therefore are accounted for as general and administrative expense in our Consolidated Statements of Operations. ASC 842 permits the capitalization of direct commission costs.
Our MH and RV sites are typically leased to customers on an annual basis. Seasonal RV sites are generally leased to customers for a period less than one year. Transient RV sites are leased to customers on a short-term basis. In addition, customers may lease homes that are located in our MH communities.
Our MH and RV leases with customers are classified as operating leases. Lease income from tenants is recognized on a straight-line basis over the terms of the relevant lease agreement and is included within Income from real property, Rental home revenue and Ancillary revenue on the Consolidated Statements of Operations. When collectability is not reasonably assured, the resident is placed on non-accrual status and revenue is recognized when cash payments are received.
Rental income from customers for wet slips and dry storage spaces at our marinas, is accounted for pursuant to ASC 842. Wet slips and dry storage spaces are typically leased to customers on an annual basis. Seasonal wet slips and dry storage spaces are generally leased to customers for a period less than one year. Transient wet slips and dry storage spaces are leased to customers on a short-term basis. Our wet slips and dry storage space leases are classified as operating leases with lease income recognized over the term of the respective operating lease or the length of a customer's stay.
F - 20
SUN COMMUNITIES, INC.
NOTES TO CONSOLIDATED FINANCIAL STATEMENTS
2.
Revenue
Disaggregation of Revenue
The following table disaggregates our revenue by major source (in thousands):
| Year Ended | |||||||||||||||||||||||||||||||||||||||||||||||||||||
| December 31, 2020 | December 31, 2019 | December 31, 2018 | |||||||||||||||||||||||||||||||||||||||||||||||||||
| Real Property Operations | Home Sales and Rentals | Consolidated | Real Property Operations | Home Sales and Rentals | Consolidated | Real Property Operations | Home Sales and Rentals | Consolidated | |||||||||||||||||||||||||||||||||||||||||||||
| Revenues | |||||||||||||||||||||||||||||||||||||||||||||||||||||
| Income from real property | $ |
|
$ |
|
$ |
|
$ |
|
$ |
|
$ |
|
$ |
|
$ |
|
$ |
|
|||||||||||||||||||||||||||||||||||
| Revenue from home sales |
|
|
|
|
|
|
|
|
|
||||||||||||||||||||||||||||||||||||||||||||
| Rental home revenue |
|
|
|
|
|
|
|
|
|
||||||||||||||||||||||||||||||||||||||||||||
| Ancillary revenue |
|
|
|
|
|
|
|
|
|
||||||||||||||||||||||||||||||||||||||||||||
| Interest income |
|
|
|
|
|
|
|
|
|
||||||||||||||||||||||||||||||||||||||||||||
| Brokerage commissions and other revenues, net |
|
|
|
|
|
|
|
|
|
||||||||||||||||||||||||||||||||||||||||||||
| Total Revenues | $ |
|
$ |
|
$ |
|
$ |
|
$ |
|
$ |
|
$ |
|
$ |
|
$ |
|
|||||||||||||||||||||||||||||||||||
Our revenue consists primarily of income from real property at our MH, RV and marinas properties, revenue from home sales, rental home revenue, ancillary revenue, interest income, brokerage commissions and other revenue.
The majority of our revenue is derived from site and home leases that are accounted for pursuant to ASC 842. We account for all revenue from contracts with customers following ASC 606, “
Revenue from Contracts with Customers
” except for those that are within the scope of other topics in the FASB accounting standards codification. Refer to Note 1, “Significant Accounting Policies,” for additional information.
F - 21
SUN COMMUNITIES, INC.
NOTES TO CONSOLIDATED FINANCIAL STATEMENTS
3.
Real Estate Acquisitions and Dispositions
2020 Acquisitions and dispositions
Communities
For the year ended December 31, 2020, we acquired the following MH communities and RV resorts and portfolios:
| Property Name | Acquisition Type | Property Type | Sites | State | Month Acquired | |||||||||||||||||||||||||||
|
Cape Cod
(1)
|
Asset acquisition | RV |
|
MA | January | |||||||||||||||||||||||||||
| Jellystone Natural Bridge | Asset acquisition | RV |
|
VA | February | |||||||||||||||||||||||||||
|
Forest Springs
(2)
|
Asset acquisition | MH |
|
CA | May | |||||||||||||||||||||||||||
| Crown Villa | Asset acquisition | RV |
|
OR | June | |||||||||||||||||||||||||||
| Flamingo Lake | Asset acquisition | RV |
|
FL | July | |||||||||||||||||||||||||||
| Woodsmoke | Asset acquisition | RV |
|
FL | September | |||||||||||||||||||||||||||
| Jellystone Lone Star | Asset acquisition | RV |
|
TX | September | |||||||||||||||||||||||||||
|
El Capitan & Ocean Mesa
(3)(4)
|
Asset acquisition | RV |
|
CA | September | |||||||||||||||||||||||||||
|
Highland Green Estates & Troy Villa
(4)
|
Asset acquisition | MH |
|
MI | September | |||||||||||||||||||||||||||
| Gig Harbor | Asset acquisition | RV |
|
WA | November | |||||||||||||||||||||||||||
|
Maine MH Portfolio
(5)
|
Asset acquisition | MH |
|
ME | November | |||||||||||||||||||||||||||
| Mouse Mountain | Asset acquisition | MH / RV |
|
FL | December | |||||||||||||||||||||||||||
| Lakeview Mobile Estates | Asset acquisition | MH |
|
CA | December | |||||||||||||||||||||||||||
| Shenandoah Acres | Asset acquisition | RV |
|
VA | December | |||||||||||||||||||||||||||
| Jellystone at Barton Lake | Asset acquisition | RV |
|
IN | December | |||||||||||||||||||||||||||
|
Kittatinny
(4)
|
Asset acquisition | RV |
|
NY & PA | December | |||||||||||||||||||||||||||
| Total |
|
|||||||||||||||||||||||||||||||
(1)
In conjunction with the acquisition, we issued Series E preferred OP units. As of December 31, 2020,
90,000
Series E preferred OP units were outstanding.
(2)
In conjunction with the acquisition, we issued Series F preferred OP units and common OP units. As of December 31, 2020,
90,000
Series F preferred OP units, specific to this acquisition, were outstanding.
(3)
In conjunction with the acquisition, we issued Series G preferred OP units. As of December 31, 2020,
240,710
Series G preferred OP units were outstanding.
(4)
Includes two communities.
(5)
Includes six communities.
For the year ended December 31, 2020, we acquired the following marinas and portfolios:
| Property Name | Acquisition Type | Property Type |
Wet Slips &
Dry Storage Spaces |
State | Month Acquired | |||||||||||||||||||||||||||
|
Safe Harbor Marinas
(1)
|
Business combination | Marina |
|
Various | October | |||||||||||||||||||||||||||
|
Hideaway Bay
(2)
|
Business combination | Marina |
|
GA | November | |||||||||||||||||||||||||||
|
Anacapa Isle
(2)
|
Business combination | Marina |
|
CA | December | |||||||||||||||||||||||||||
| Annapolis | Asset acquisition | Marina |
|
MD | December | |||||||||||||||||||||||||||
| Wickford | Asset acquisition | Marina |
|
RI | December | |||||||||||||||||||||||||||
|
Rybovich Portfolio
(3)
|
Business combination | Marina |
|
FL | December | |||||||||||||||||||||||||||
| Rockland | Asset acquisition | Marina |
|
ME | December | |||||||||||||||||||||||||||
| Total |
|
|||||||||||||||||||||||||||||||
(1)
Includes
99
owned marinas located in
22
states. In conjunction with the acquisition, we issued Series H preferred OP units. As of December 31, 2020,
581,407
Series H preferred OP units were outstanding.
(2)
Acquired in connection with Safe Harbor Marinas acquisition. Transfer of marinas was contingent on receiving third party consents.
(3)
Includes two marinas. In conjunction with the acquisition, we issued Series I preferred OP units. As of December 31, 2020,
922,000
Series I preferred OP units were outstanding.
F - 22
SUN COMMUNITIES, INC.
NOTES TO CONSOLIDATED FINANCIAL STATEMENTS
The following table summarizes the amounts of assets acquired net of liabilities assumed at the acquisition date and the consideration paid for the acquisitions completed for the year ended December 31, 2020 (in thousands):
| At Acquisition Date | Consideration | ||||||||||||||||||||||||||||||||||||||||||||||||||||
| Investment in property | Inventory of manufactured homes | Intangible assets, net | Other assets (liabilities), net | Total identifiable assets acquired net of liabilities assumed | Cash and escrow | Debt assumed | Temporary and permanent equity | Total consider - ation | |||||||||||||||||||||||||||||||||||||||||||||
| Cape Cod | $ |
|
$ |
|
$ |
|
$ |
(
|
$ |
|
$ |
|
$ |
|
$ |
|
$ |
|
|||||||||||||||||||||||||||||||||||
| Jellystone Natural Bridge |
|
|
|
(
|
|
|
|
|
|
||||||||||||||||||||||||||||||||||||||||||||
| Forest Springs |
|
|
|
(
|
|
|
|
|
|
||||||||||||||||||||||||||||||||||||||||||||
| Crown Villa |
|
|
|
(
|
|
|
|
|
|
||||||||||||||||||||||||||||||||||||||||||||
| Flamingo Lake |
|
|
|
(
|
|
|
|
|
|
||||||||||||||||||||||||||||||||||||||||||||
| Woodsmoke |
|
|
|
(
|
|
|
|
|
|
||||||||||||||||||||||||||||||||||||||||||||
| Jellystone Lone Star |
|
|
|
(
|
|
|
|
|
|
||||||||||||||||||||||||||||||||||||||||||||
| El Capitan & Ocean Mesa |
|
|
|
(
|
|
|
|
|
|
||||||||||||||||||||||||||||||||||||||||||||
| Highland Green Estates & Troy Villa |
|
|
|
(
|
|
|
|
|
|
||||||||||||||||||||||||||||||||||||||||||||
| Gig Harbor |
|
|
|
(
|
|
|
|
|
|
||||||||||||||||||||||||||||||||||||||||||||
| Maine MH Portfolio |
|
|
|
|
|
|
|
|
|
||||||||||||||||||||||||||||||||||||||||||||
| Mouse Mountain |
|
|
|
(
|
|
|
|
|
|
||||||||||||||||||||||||||||||||||||||||||||
| Lakeview Mobile Estates |
|
|
|
(
|
|
|
|
|
|
||||||||||||||||||||||||||||||||||||||||||||
| Shenandoah Acres |
|
|
|
(
|
|
|
|
|
|
||||||||||||||||||||||||||||||||||||||||||||
| Jellystone at Barton Lake |
|
|
|
(
|
|
|
|
|
|
||||||||||||||||||||||||||||||||||||||||||||
| Kittatinny Portfolio |
|
|
|
|
|
|
|
|
|
||||||||||||||||||||||||||||||||||||||||||||
| Total | $ |
|
$ |
|
$ |
|
$ |
(
|
$ |
|
$ |
|
$ |
|
$ |
|
$ |
|
|||||||||||||||||||||||||||||||||||
F - 23
SUN COMMUNITIES, INC.
NOTES TO CONSOLIDATED FINANCIAL STATEMENTS
The following table summarizes the amount of assets net of liabilities assumed at the acquisition date, and the consideration paid for the acquisitions completed at our marina for the year ended December 31, 2020 (in thousands):
| At Acquisition Date | Consideration | ||||||||||||||||||||||||||||||||||||||||||||||||||||
| Investment in property | Inventory of Boats parts and retail related Items | Goodwill and other intangible assets, net | Other assets (liabilities), net | Total identifiable assets acquired net of liabilities assumed | Cash and escrow | Debt assumed | Temporary and permanent equity | Total consideration | |||||||||||||||||||||||||||||||||||||||||||||
| Asset Acquisition | |||||||||||||||||||||||||||||||||||||||||||||||||||||
| Mears Annapolis |
|
|
|
(
|
|
|
|
|
|
||||||||||||||||||||||||||||||||||||||||||||
| Wickford |
|
|
|
(
|
|
|
|
|
|
||||||||||||||||||||||||||||||||||||||||||||
|
Rockland
(1)
|
|
|
|
(
|
|
|
|
|
|
||||||||||||||||||||||||||||||||||||||||||||
|
Business Combination
(2)
|
|||||||||||||||||||||||||||||||||||||||||||||||||||||
|
Safe Harbor Marinas
(1)
|
$ |
|
$ |
|
$ |
|
$ |
(
|
$ |
|
$ |
|
$ |
|
$ |
|
$ |
|
|||||||||||||||||||||||||||||||||||
|
Hideaway Bay
(1)
|
|
|
|
(
|
|
|
|
|
|
||||||||||||||||||||||||||||||||||||||||||||
|
Anacapa Isle
(1)
|
|
|
|
|
|
|
|
|
|
||||||||||||||||||||||||||||||||||||||||||||
|
Rybovich Portfolio
(1)
|
|
|
|
(
|
|
|
|
|
|
||||||||||||||||||||||||||||||||||||||||||||
| Total | $ |
|
$ |
|
$ |
|
$ |
(
|
$ |
|
$ |
|
$ |
|
$ |
|
$ |
|
|||||||||||||||||||||||||||||||||||
(1)
Purchase price allocations are preliminary as of December 31, 2020, subject to revision based on final purchase price allocations.
(2)
Refer to Note 5, “Goodwill and Other Intangible Assets,” for additional detail on goodwill and other intangible assets.
As of December 31, 2020, we have incurred $
23.0
million of expensed business combination transaction cost (in relation to the acquisition Safe Harbor, Hideaway Bay, Anacapa Isle, and the Safe Harbor Rybovich Portfolio, as each such acquisition meets the criteria to be accounted for as business combination), and $
13.4
million of capitalized transaction costs for asset acquisitions which have been allocated among the various categories above.
Refer to Note 20, “Subsequent Events,” for information regarding real estate acquisition activity after December 31, 2020.
The total amount of Revenues and Net income (loss) included in the Consolidated Statements of Operations for the year ended December 31, 2020, related to business combinations completed in 2020 are set forth in the following table (in thousands):
| Year Ended | ||||||||
| December 31, 2020 | ||||||||
| Total revenues | $ |
|
||||||
| Net income / (loss) | $ |
(
|
||||||
The following unaudited pro forma financial information presents the results of our operations for the years ended December 31, 2020 and 2019, as if the properties acquired in 2020 had been acquired on January 1, 2019, for our 2020 acquisitions that meet the definition of business combination. The unaudited pro forma results reflect certain adjustments for items that are not expected to have a continuing impact, such as adjustments for transaction costs incurred, management fees, and purchase accounting.
F - 24
SUN COMMUNITIES, INC.
NOTES TO CONSOLIDATED FINANCIAL STATEMENTS
The information presented below has been prepared for comparative purposes only and does not purport to be indicative of either future results of operations or the results of operations that would have actually occurred had the acquisition been consummated on January 1, 2019 (in thousands, except per-share data):
| Year Ended (unaudited) | ||||||||||||||
| December 31, 2020 | December 31, 2019 | |||||||||||||
| Total revenues | $ |
|
$ |
|
||||||||||
| Net income attributable to Sun Communities, Inc. common stockholders | $ |
|
$ |
|
||||||||||
| Net income per share attributable to Sun Communities, Inc. common stockholders - basic | $ |
|
$ |
|
||||||||||
| Net income per share attributable to Sun Communities, Inc. common stockholders - diluted | $ |
|
$ |
|
||||||||||
Land for Expansion / Development
During the year ended December 31, 2020, we acquired
eight
land parcels which are located in Orange Beach, Alabama; Jensen Beach, Florida; Citra Lakes, Florida; Comal County, Texas and Menifee, California for total consideration of $
9.7
million.
Seven
of the land parcels are adjacent to existing communities.
Dispositions
On July 1, 2020, we sold a manufactured housing community located in Montana, containing
226
sites, for $
12.6
million. The gain from the sale of the property was approximately $
5.6
million.
2019 Acquisitions
For the year ended December 31, 2019 we acquired the following communities:
| Property Name |
Acquisition
Type |
Type | Sites | Development Sites | State | Month Acquired | ||||||||||||||||||||||||||||||||
| Slickrock Campground | Asset acquisition | RV |
|
|
UT | December | ||||||||||||||||||||||||||||||||
| Pandion Ridge | Asset acquisition | RV |
|
|
AL | November | ||||||||||||||||||||||||||||||||
|
Jensen Portfolio
(1)
|
Asset acquisition | MH |
|
|
Various | October | ||||||||||||||||||||||||||||||||
| Glen Ellis | Asset acquisition | RV |
|
|
NH | September | ||||||||||||||||||||||||||||||||
|
Leisure Point Resort
(2)
|
Asset acquisition | MH / RV |
|
|
DE | September | ||||||||||||||||||||||||||||||||
| Reunion Lake | Asset acquisition | RV |
|
|
LA | July | ||||||||||||||||||||||||||||||||
| Sun Outdoors Sevierville Pigeon Forge | Asset acquisition | RV |
|
|
TN | May | ||||||||||||||||||||||||||||||||
| Massey’s Landing RV | Asset acquisition | RV |
|
|
DE | February | ||||||||||||||||||||||||||||||||
|
Shelby Properties
(3)
|
Asset acquisition | MH |
|
|
MI | February | ||||||||||||||||||||||||||||||||
| Buena Vista | Asset acquisition | MH |
|
|
AZ | February | ||||||||||||||||||||||||||||||||
|
Country Village Estates
(4)
|
Asset acquisition | MH |
|
|
OR | January | ||||||||||||||||||||||||||||||||
| Hid’n Pines RV | Asset acquisition | RV |
|
|
ME | January | ||||||||||||||||||||||||||||||||
| Hacienda del Rio | Asset acquisition | MH (Age-Restricted) |
|
|
FL | January | ||||||||||||||||||||||||||||||||
| Total |
|
|
||||||||||||||||||||||||||||||||||||
(1)
Contains
31
communities located in CT, GA, MD, NH, NJ, NY, NC and SC. In conjunction with the acquisition, we issued
1,972,876
shares of common stock, net of fractional shares paid in cash.
(2)
Contains
201
MH sites and
301
RV sites.
(3)
Contains
two
MH communities.
(4)
In conjunction with the acquisition, we issued Series D preferred OP Units. As of December 31, 2019,
488,958
Series D Preferred OP Units were outstanding.
F - 25
SUN COMMUNITIES, INC.
NOTES TO CONSOLIDATED FINANCIAL STATEMENTS
The following table summarizes the amounts of assets acquired net of liabilities assumed at the acquisition date and the consideration paid for the acquisitions completed in 2019 (in thousands):
| At Acquisition Date | Consideration | ||||||||||||||||||||||||||||||||||||||||||||||||||||
| Investment in property | Inventory of manufactured homes | Intangible assets, net | Other assets (liabilities), net | Total identifiable assets acquired net of liabilities assumed | Cash and escrow | Debt assumed | Temporary and permanent equity | Total consideration | |||||||||||||||||||||||||||||||||||||||||||||
| Slickrock Campground | $ |
|
$ |
|
$ |
|
$ |
|
$ |
|
$ |
|
$ |
|
$ |
|
$ |
|
|||||||||||||||||||||||||||||||||||
| Pandion Ridge |
|
|
|
(
|
|
|
|
|
|
||||||||||||||||||||||||||||||||||||||||||||
| Jensen Portfolio |
|
|
|
|
|
|
|
|
|
||||||||||||||||||||||||||||||||||||||||||||
| Glen Ellis |
|
|
|
(
|
|
|
|
|
|
||||||||||||||||||||||||||||||||||||||||||||
| Leisure Point Resort |
|
|
|
(
|
|
|
|
|
|
||||||||||||||||||||||||||||||||||||||||||||
| Reunion Lake |
|
|
|
(
|
|
|
|
|
|
||||||||||||||||||||||||||||||||||||||||||||
| Sun Outdoors Sevierville Pigeon Forge |
|
|
|
|
|
|
|
|
|
||||||||||||||||||||||||||||||||||||||||||||
| Massey's Landing |
|
|
|
(
|
|
|
|
|
|
||||||||||||||||||||||||||||||||||||||||||||
| Shelby Properties |
|
|
|
(
|
|
|
|
|
|
||||||||||||||||||||||||||||||||||||||||||||
| Buena Vista |
|
|
|
(
|
|
|
|
|
|
||||||||||||||||||||||||||||||||||||||||||||
| Country Village |
|
|
|
|
|
|
|
|
|
||||||||||||||||||||||||||||||||||||||||||||
| Hid'n Pines |
|
|
|
(
|
|
|
|
|
|
||||||||||||||||||||||||||||||||||||||||||||
| Hacienda del Rio |
|
|
|
(
|
|
|
|
|
|
||||||||||||||||||||||||||||||||||||||||||||
| Total | $ |
|
$ |
|
$ |
|
$ |
(
|
$ |
|
$ |
|
$ |
|
$ |
|
$ |
|
|||||||||||||||||||||||||||||||||||
As of December 31, 2019, we incurred $
19.3
million of transaction costs which have been capitalized and allocated among the various categories above.
Land for Expansion / Development
During the year ended December 31, 2019, we acquired four land parcels which are located in New Braunfels, Texas; Petoskey, Michigan; Uhland, Texas and Hudson, Florida for total consideration of $
7.7
million. Two of the land parcels are adjacent to existing communities.
Ground Leases
In September 2019, we entered into a
66-year
Temporary Occupancy and Use Permit with the Port of San Diego to construct and operate a new RV resort in Chula Vista. Refer to Note 17, “ Leases,” for disclosures on accounting treatment.
In August 2019, we acquired Chincoteague Island KOA RV Resort (“Chincoteague”), in Chincoteague Island, Virginia for total consideration of $
19.5
million. The sellers of Chincoteague continue to operate the property. Refer to Note 17, “Leases,” for disclosures on accounting treatment.
In April 2019, we acquired Strafford / Lake Winnipesaukee South KOA RV Resort ("Strafford") in Strafford, New Hampshire for total consideration of $
2.7
million. The sellers of Strafford continue to operate the property. Refer to Note 17, “Leases,” for disclosures on accounting treatment.
In March 2019, we entered into a four-year Temporary Occupancy and Use Permit with the Port of San Diego to operate a RV resort located in Chula Vista, CA until such time as the Company constructs a new RV resort in the area. Concurrent with the transaction, we purchased tangible personal property from the prior owner of the RV resort for $
0.3
million. Refer to Note 17, “Leases,” for disclosures on accounting treatment.
F - 26
SUN COMMUNITIES, INC.
NOTES TO CONSOLIDATED FINANCIAL STATEMENTS
4.
Notes and Other Receivables
The following table sets forth certain information regarding notes and other receivables (in thousands):
| December 31, 2020 | December 31, 2019 | ||||||||||
| Installment notes receivable on manufactured homes, net | $ |
|
$ |
|
|||||||
| Notes receivable from real estate developers |
|
|
|||||||||
| Other receivables, net |
|
|
|||||||||
| Total Notes and Other Receivables, net | $ |
|
$ |
|
|||||||
Installment Notes Receivable on Manufactured Homes
Due to the adoption of ASU 2016-13, “
Financial Instruments - Credit Losses (Topic 326) Measurement of Credit Losses on Financial Instruments
,” effective January 1, 2020, installment notes receivable are measured at fair value pursuant to us electing the fair value option. The balances of installment notes receivable of $
85.9
million (net of fair value adjustment of $
1.3
million) and $
95.6
million (net of allowance of $
0.6
million) as of December 31, 2020 and December 31, 2019, respectively, are collateralized by manufactured homes. The notes represent financing to purchasers of manufactured homes primarily located in our communities and require monthly principal and interest payments. The notes had a net weighted average interest rate (net of servicing costs) and maturity of
7.8
percent and
15.2
years as of December 31, 2020, and
8.0
percent and
15.8
years as of December 31, 2019, respectively. Refer to Note 15, “Fair Value of Financial Instruments,” and Note 19, “Recent Accounting Pronouncements,” for additional detail.
| Year Ended | |||||||||||
| December 31, 2020 | December 31, 2019 | ||||||||||
| Beginning balance of gross installment notes receivable | $ |
|
$ |
|
|||||||
| Financed sale of manufactured homes |
|
|
|||||||||
| Adjustment for notes receivable related to assets held for sale |
(
|
|
|||||||||
| Principal payments and payoffs from our customers |
(
|
(
|
|||||||||
| Principal reduction from repossessed homes |
(
|
(
|
|||||||||
| Ending balance of gross installment notes receivable |
|
|
|||||||||
| Beginning balance of allowance for losses on installment notes receivables |
(
|
(
|
|||||||||
| Adjustment to allowance for losses |
|
|
|||||||||
|
Initial fair value option adjustment (see Note 19)
|
|
|
|||||||||
| Ending balance of allowance for losses on installment notes receivables |
|
(
|
|||||||||
| Initial fair value option adjustment (see Note 19) |
|
|
|||||||||
| Adjustment for notes receivable related to assets held for sale |
|
|
|||||||||
| Fair value adjustment |
(
|
|
|||||||||
| Fair value adjustments on gross installment notes receivable |
(
|
|
|||||||||
| Ending balance of installment notes receivable, net | $ |
|
$ |
|
|||||||
Notes Receivable from Real Estate Developers
As of December 31, 2020 and 2019, the notes receivable balances of $
52.6
million and $
19.0
million, respectively, are primarily comprised of construction loans provided to real estate developers. The carrying values of the notes generally approximate their fair market values either due to the nature of the loan and / or note being secured by underlying collateral and / or personal guarantees. The notes receivable from real estate developers have a net weighted average interest rate and maturity of
6.2
percent and
1.8
years as of December 31, 2020, and
7.0
percent and
1.3
years as of December 31, 2019, respectively. As of December 31, 2020, real estate developers collectively have $
17.0
million of undrawn funds on their loans. There were no adjustments to the fair value of notes receivable from the real estate developers for the years ended December 31, 2020 and 2019. Refer to Note 15, “Fair Value of Financial Instruments,” and Note 19, “Recent Accounting Pronouncements,” for additional detail.
F - 27
SUN COMMUNITIES, INC.
NOTES TO CONSOLIDATED FINANCIAL STATEMENTS
Other Receivables, net
As of December 31, 2020, other receivables were comprised of amounts due from: residents for rent, utility charges, fees and other pass through charges of $
7.1
million (net of allowance of $
7.2
million), home sale proceeds of $
23.6
million, insurance receivables of $
13.6
million, marina customers for storage service and lease payments of $
19.2
million (net of allowance of $
1.4
million), and other receivables of $
19.6
million. As of December 31, 2019, other receivables were comprised of amounts due from: residents for rent, utility charges, fees and other pass through charges of $
7.8
million (net of allowance of $
2.2
million), home sale proceeds of $
20.9
million, insurance and other receivables of $
9.9
million and other receivables of $
4.8
million.
During June 2020, we executed a convertible secured promissory note with RezPlot Systems LLC, a nonconsolidated affiliate in which we have a
50
percent ownership interest. The note allows for a principal amount of up to $
10.0
million to be drawn down over a period of three years, bears an interest rate of
3.0
percent and is secured by all the assets of RezPlot Systems LLC. The outstanding balance was $
2.0
million as of December 31, 2020 and is included in the Notes and other receivables, net on the Consolidated Balance Sheets. Refer to Note 6, “Investments in Nonconsolidated Affiliates,” for additional information on our nonconsolidated affiliates.
5.
Goodwill and Other Intangible Assets
Our intangible assets include goodwill, in-place leases, slip in-place leases, non-competition agreements, trademarks and trade names, customer relationships, and franchise agreements and other intangible assets. These intangible assets are recorded in Goodwill and Other Intangible Assets, net on the Consolidated Balance Sheets. In accordance with FASB ASC Topic 842, below market leases are now classified as a right of use asset.
Goodwill impairment - Upon review of the qualitative factors in accordance with FASB ASC 350-20, “Goodwill and Other,” we determined that no impairment indicators existed as of December 31, 2020. As a result, there was no impairment of goodwill during the year ended December 31, 2020. There was no goodwill for the years ended December 31, 2019 and 2018.
The gross carrying amounts and accumulated amortization of our intangible assets are as follows (in thousands):
| December 31, 2020 | December 31, 2019 | |||||||||||||||||||||||||||||||
| Intangible Asset | Useful Life | Gross Carrying Amount | Accumulated Amortization | Gross Carrying Amount | Accumulated Amortization | |||||||||||||||||||||||||||
| Goodwill | Indefinite | $ |
|
n/a | $ |
|
n/a | |||||||||||||||||||||||||
| In-place leases |
|
|
(
|
|
(
|
|||||||||||||||||||||||||||
|
Slip in-place leases
|
|
|
(
|
|
|
|||||||||||||||||||||||||||
| Non-competition agreements |
|
|
|
|
|
|||||||||||||||||||||||||||
| Trademarks and trade names |
Various
(1)
|
|
— |
|
— | |||||||||||||||||||||||||||
| Customer relationships |
|
|
(
|
|
|
|||||||||||||||||||||||||||
| Franchise agreements and other intangible assets |
|
|
(
|
|
(
|
|||||||||||||||||||||||||||
| Total | $ |
|
$ |
(
|
$ |
|
$ |
(
|
||||||||||||||||||||||||
(1)
All trademarks and trade names have an indefinite useful life except for one that has a two and a half year useful life.
Total amortization expense related to the intangible assets are as follows (in thousands):
| Year Ended | ||||||||||||||||||||
|
Intangible Asset Amortization Expense
|
December 31, 2020 | December 31, 2019 | December 31, 2018 | |||||||||||||||||
| In-place leases | $ |
|
$ |
|
$ |
|
||||||||||||||
| Slip in-place leases |
|
|
|
|||||||||||||||||
| Franchise fees and other intangible assets |
|
|
|
|||||||||||||||||
| Total | $ |
|
$ |
|
$ |
|
||||||||||||||
F - 28
SUN COMMUNITIES, INC.
NOTES TO CONSOLIDATED FINANCIAL STATEMENTS
We anticipate amortization expense for our intangible assets to be as follows for the next five years (in thousands):
| 2021 | 2022 | 2023 | 2024 | 2025 | ||||||||||||||||||||||||||||
| In-place leases | $ |
|
$ |
|
$ |
|
$ |
|
$ |
|
||||||||||||||||||||||
| Slip in-place leases |
|
|
|
|
|
|||||||||||||||||||||||||||
| Non-competition agreements |
|
|
|
|
|
|||||||||||||||||||||||||||
| Trademarks and trade names |
|
|
|
|
|
|||||||||||||||||||||||||||
| Customer Relationships |
|
|
|
|
|
|||||||||||||||||||||||||||
| Franchise agreements and other intangible assets |
|
|
|
|
|
|||||||||||||||||||||||||||
| Total | $ |
|
$ |
|
$ |
|
$ |
|
$ |
|
||||||||||||||||||||||
6.
Investments in Nonconsolidated Affiliates
Investments in joint ventures that are not consolidated, nor recorded at cost, are accounted for using the equity method of accounting as prescribed in FASB ASC Topic 323, “
Investments - Equity Method and Joint Ventures
.” Investments in nonconsolidated affiliates are recorded within Other assets, net on the Consolidated Balance Sheets. Equity income and loss are recorded in Income / (loss) from nonconsolidated affiliates on the Consolidated Statements of Operations.
RezPlot Systems LLC (“Rezplot”)
At December 31, 2020 and 2019, we had a
50
percent ownership interest in RezPlot, a RV reservation software technology company, acquired in January 2019.
Sungenia joint venture (“Sungenia JV”)
At December 31, 2020 and December 31, 2019, we had a
50
percent ownership interest in Sungenia JV, a joint venture formed between us and Ingenia Communities Group in November 2018, to establish and grow a manufactured housing community development program in Australia.
GTSC LLC
(
“GTSC”
)
At December 31, 2020 and December 31, 2019, we had a
40
percent ownership interest in GTSC, which engages in acquiring, holding and selling loans secured, directly or indirectly, by manufactured homes located in our communities.
Origen Financial Services, LLC (“OFS”)
At December 31, 2020 and December 31, 2019, we had a
22.9
percent ownership interest in OFS, an end-to-end online resident screening and document management suite.
SV Lift, LLC (“SV Lift”)
At December 31, 2020 and December 31, 2019, we had a
50
percent ownership interest in SV Lift, which owns, operates and leases an aircraft.
The investment balance in each nonconsolidated affiliate is as follows (in thousands):
| Investment | December 31, 2020 | December 31, 2019 | ||||||||||||
| Investment in RezPlot | $ |
|
$ |
|
||||||||||
| Investment in Sungenia JV |
|
|
||||||||||||
| Investment in GTSC |
|
|
||||||||||||
| Investment in OFS |
|
|
||||||||||||
| Investment in SV Lift |
|
|
||||||||||||
| Total | $ |
|
$ |
|
||||||||||
F - 29
SUN COMMUNITIES, INC.
NOTES TO CONSOLIDATED FINANCIAL STATEMENTS
The year to date equity income / (loss) from each nonconsolidated affiliate is as follows (in thousands):
| Equity income | December 31, 2020 | December 31, 2019 | December 31, 2018 | |||||||||||||||||
| RezPlot equity loss | $ |
(
|
$ |
(
|
$ |
|
||||||||||||||
| Sungenia JV equity income / (loss) |
|
(
|
|
|||||||||||||||||
| GTSC equity income |
|
|
|
|||||||||||||||||
| OFS equity income |
|
|
|
|||||||||||||||||
| SV Lift equity loss |
(
|
|
|
|||||||||||||||||
| Total equity income | $ |
|
$ |
|
$ |
|
||||||||||||||
The change in the GTSC investment balance is as follows (in thousands):
| Year Ended | ||||||||||||||
| December 31, 2020 | December 31, 2019 | |||||||||||||
| Beginning balance | $ |
|
$ |
|
||||||||||
| Adjustment of allowance for losses |
|
|
||||||||||||
|
Initial fair value option adjustment (see Note 19
)
|
|
|
||||||||||||
| Contributions |
|
|
||||||||||||
| Distributions |
(
|
(
|
||||||||||||
| Equity earnings |
|
|
||||||||||||
| Fair value adjustment |
(
|
|
||||||||||||
| Ending Balance | $ |
|
$ |
|
||||||||||
The change in the Sungenia JV investment balance is as follows (in thousands):
| Year Ended | ||||||||||||||
| December 31, 2020 | December 31, 2019 | |||||||||||||
| Beginning balance | $ |
|
$ |
|
||||||||||
| Cumulative translation adjustment |
|
(
|
||||||||||||
| Contributions |
|
|
||||||||||||
| Equity earnings |
|
(
|
||||||||||||
| Ending Balance | $ |
|
$ |
|
||||||||||
7.
Consolidated Variable Interest Entities
The Operating Partnership
We consolidate the Operating Partnership under the guidance set forth in FASB ASC Topic 810 “
Consolidation.
” ASU 2015-02 modified the evaluation of whether limited partnerships and similar legal entities are variable interest entities (“VIEs”) or, alternatively, voting interest entities. We evaluated the application of ASU 2015-02 and concluded that the Operating Partnership met the criteria of a VIE. Our significant asset is our investment in the Operating Partnership, and consequently, substantially all of our assets and liabilities represent those assets and liabilities of the Operating Partnership. We are the sole general partner and generally have the power to manage and have complete control over the Operating Partnership and the obligation to absorb its losses or the right to receive its benefits.
Sun NG RV Resorts LLC (“Sun NG Resorts”); Rudgate Village SPE, LLC, Rudgate Clinton SPE, LLC, and Rudgate Clinton Estates SPE, LLC (collectively, “Rudgate”); Sun NG Whitewater RV Resorts LLC; FPG Sun Menifee 80 LLC, SHM South Fork JV, LLC.
We consolidate Sun NG Resorts, Rudgate, Sun NG Whitewater RV Resorts LLC, FPG Sun Menifee 80 LLC, and SHM South Fork JV, LLC under the guidance set forth in FASB ASC Topic 810 “
Consolidation
.” We concluded that each entity is a VIE where we are the primary beneficiary, as we have the power to direct the significant activities of, and absorb the significant losses and receive the significant benefits from each entity. Refer to Note 8, “Debt and Lines of Credit,” for additional information on Sun NG Resorts and Note 9, “Equity and Temporary Equity,” for additional information on Sun NG Resorts, Sun NG Whitewater RV Resorts LLC, FPG Sun Menifee 80 LLC and SHM South Fork JV, LLC.
F - 30
SUN COMMUNITIES, INC.
NOTES TO CONSOLIDATED FINANCIAL STATEMENTS
The following table summarizes the assets and liabilities of Sun NG Resorts, Rudgate, Sun NG Whitewater RV Resorts LLC, FPG Sun Menifee 80 LLC and SHM South Fork JV, LLC included in our Consolidated Balance Sheets after eliminations (in thousands):
| December 31, 2020 | December 31, 2019 | ||||||||||
| Assets | |||||||||||
| Investment property, net | $ |
|
$ |
|
|||||||
| Other assets, net |
|
|
|||||||||
| Total Assets | $ |
|
$ |
|
|||||||
| Liabilities and Other Equity | |||||||||||
| Debt | $ |
|
$ |
|
|||||||
| Preferred Equity - Sun NG Resorts - mandatorily redeemable |
|
|
|||||||||
| Other liabilities |
|
|
|||||||||
| Total Liabilities |
|
|
|||||||||
|
Other redeemable noncontrolling interests
|
|
|
|||||||||
|
Noncontrolling interests (including SHM South Fork JV, LLC)
|
|
|
|||||||||
| Total Liabilities and Other Equity | $ |
|
$ |
|
|||||||
Investment property, net and Other assets, net related to the consolidated VIEs, with the exception of Operating Partnership, comprised
4.1
percent and
4.7
percent of our consolidated total assets at December 31, 2020 and December 31, 2019, respectively. Debt, Preferred Equity and Other liabilities comprised
2.0
percent and
2.5
percent of our consolidated total liabilities at December 31, 2020 and December 31, 2019, respectively. Equity Interests and Noncontrolling interests related to the consolidated VIEs, on an absolute basis, comprised less than
1.0
percent of our consolidated total equity at December 31, 2020 and at December 31, 2019, respectively.
8.
Debt and Lines of Credit
The following table sets forth certain information regarding debt including premiums, discounts and deferred financing costs (in thousands except statistical information):
| Carrying Amount |
Weighted Average
Years to Maturity |
Weighted Average
Interest Rates |
|||||||||||||||||||||||||||||||||
| December 31, 2020 | December 31, 2019 | December 31, 2020 | December 31, 2019 | December 31, 2020 | December 31, 2019 | ||||||||||||||||||||||||||||||
| Collateralized term loans - Life Companies | $ |
|
$ |
|
|
|
|
% |
|
% | |||||||||||||||||||||||||
| Collateralized term loans - FNMA |
|
|
|
|
|
% |
|
% | |||||||||||||||||||||||||||
| Collateralized term loans - CMBS |
|
|
|
|
|
% |
|
% | |||||||||||||||||||||||||||
| Collateralized term loans - FMCC |
|
|
|
|
|
% |
|
% | |||||||||||||||||||||||||||
| Total Collateralized Term Loans |
|
|
|||||||||||||||||||||||||||||||||
| Preferred equity - Sun NG Resorts - mandatorily redeemable |
|
|
|
|
|
% |
|
% | |||||||||||||||||||||||||||
| Preferred OP units - mandatorily redeemable |
|
|
|
|
|
% |
|
% | |||||||||||||||||||||||||||
| Lines of credit and other debt |
|
|
|
|
|
% |
|
% | |||||||||||||||||||||||||||
| Total Debt | $ |
|
$ |
|
|
|
|
% |
|
% | |||||||||||||||||||||||||
F - 31
SUN COMMUNITIES, INC.
NOTES TO CONSOLIDATED FINANCIAL STATEMENTS
Collateralized Term Loans
During the years ended December 31, 2020 and 2019, we repaid the following collateralized term loans (in thousands except statistical information):
| Three Months Ended | Repayment Amount |
Fixed
Interest Rate |
Maturity
Date |
(Gain) / Loss on Extinguishment of Debt | ||||||||||||||||||||||
| June 30, 2020 | $ |
|
(1)
|
|
% |
(4)
|
March 1, 2021
July 11, 2021 December 1, 2021 |
$ |
|
|||||||||||||||||
| March 31, 2020 | $ |
|
|
% | March 1, 2021 | $ |
|
|||||||||||||||||||
| $ |
|
(2)
|
|
% |
(4)
|
July 1, 2020 | $ |
(
|
||||||||||||||||||
| December 31, 2019 | $ |
|
|
% | March 1, 2020 | $ |
(
|
|||||||||||||||||||
| $ |
|
|
% | November 1, 2021 | $ |
|
||||||||||||||||||||
| $ |
|
(3)
|
|
% |
(4)
|
March 1, 2020
April 1, 2020 |
$ |
(
|
||||||||||||||||||
| September 30, 2019 | $ |
|
|
% | May 1, 2023 | $ |
|
|||||||||||||||||||
| March 31, 2019 | $ |
|
|
% | January 1, 2030 | $ |
|
|||||||||||||||||||
(1)
Includes four collateralized term loans, two due to mature on March 1, 2021, one due to mature on July 11, 2021, and the other due to mature on December 1, 2021.
(2)
Includes four collateralized term loans due to mature on July 1, 2020.
(3)
Includes four collateralized term loans, three due to mature on March 1, 2020 and one due to mature on April 1, 2020.
(4)
The interest rate represents the weighted average interest rate on collateralized term loans.
During the years ended December 31, 2020 and 2019, we entered into the following collateralized term loans (in thousands except statistical information):
| Three Months Ended | Loan Amount |
Term
(in years) |
Interest Rate | Maturity Date | ||||||||||||||||||||||
| December 31, 2020 | $ |
|
(1)
|
|
|
% |
(3)
|
May 1, 2030
November 1, 2032 |
||||||||||||||||||
| March 31, 2020 | $ |
|
|
|
% | April 1, 2035 | ||||||||||||||||||||
| December 31, 2019 | $ |
|
(2)
|
|
|
% |
(3)
|
December 15, 2039
December 15, 2041 |
||||||||||||||||||
| September 30, 2019 | $ |
|
|
|
% | October 1, 2029 | ||||||||||||||||||||
| March 31, 2019 | $ |
|
|
|
% | January 15, 2044 | ||||||||||||||||||||
(1)
Includes three collateralized term loans, one for $
8.8
million assumed as part of the acquisition of the Maine MH Portfolio, due to mature on May 1, 2030 and two for $
39.5
million and $
220.5
million, respectively, due to mature on November 1, 2032.
(2)
Includes two collateralized term loans, one for $
196.3
million due to mature on December 15, 2039 and the other for $
203.7
million due to mature on December 15, 2041.
(3)
The interest rate represents the weighted average interest rate on collateralized term loans.
The collateralized term loans totaling $
3.4
billion as of December 31, 2020, are secured by
192
properties comprised of
76,296
sites representing approximately $
3.2
billion of net book value.
Preferred Equity - Sun NG Resorts - mandatorily redeemable
In connection with the investment in Sun NG Resorts, $
35.3
million of mandatorily redeemable Preferred Equity (“Preferred Equity - Sun NG Resorts”) was purchased by unrelated third parties. The Preferred Equity - Sun NG Resorts carries a preferred rate of return of
6.0
percent per annum. The Preferred Equity - Sun NG Resorts has a seven-year term ending June 1, 2025 and $33.4 can be redeemed in the fourth quarter of 2024 at the holders’ option. The Preferred Equity - Sun NG Resorts as of December 31, 2020 was $
35.2
million. Refer to Note 7, “Consolidated Variable Interest Entities,” and Note 9, “Equity and Temporary Equity,” for additional information.
F - 32
SUN COMMUNITIES, INC.
NOTES TO CONSOLIDATED FINANCIAL STATEMENTS
Preferred OP Units - mandatorily redeemable
Preferred OP units at December 31, 2020 and December 31, 2019 include $
34.7
million of Aspen preferred OP units issued by the Operating Partnership. As of December 31, 2020, these units are convertible indirectly into
407,677
shares of our common stock.
In January 2020, we amended the Operating Partnership’s partnership agreement at the election of certain Aspen preferred OP unit holders. The amendment extended the automatic redemption date and reduced the annual distribution rate for
270,000
of the Aspen preferred OP units (the “Extended Units”). Subject to certain limitations, at any time prior to January 1, 2024 (or prior to January 1, 2034 with respect to the Extended Units), the holder of each Aspen preferred OP unit at its option may convert such Aspen preferred OP unit into: (a) if the average closing price of our common stock for the preceding ten trading days is $
68.00
per share or less,
0.397
common OP units; or (b) if the ten-day average closing price is greater than $
68.00
per share, the number of common OP units is determined by dividing (i) the sum of (A) $
27.00
plus (B)
25
percent of the amount by which the ten-day average closing price exceeds $
68.00
per share, by (ii) the ten-day average closing price. The current preferred distribution rate is
3.8
percent on the Extended Units and
6.5
percent on all other Aspen preferred OP units. On January 2, 2024 (or January 2, 2034 with respect to the Extended Units), we are required to redeem for cash all Aspen preferred OP units that have not been converted to common OP units. As of December 31, 2020,
270,000
of Extended Units and
1,013,819
other Aspen preferred units were outstanding.
Lines of Credit and Other Debt
Credit Agreement
- In May 2019, we amended and restated our credit agreement with Citibank, N.A. (“Citibank”) and certain other lenders. Pursuant to the credit agreement, we entered into an unsecured senior credit facility with Citibank and certain lenders in the amount of
$
750.0
million, comprised of a $
650.0
million revolving loan, with the ability to use up to $
100.0
million for advances in Australian dollars, and a $
100.0
million term loan (the “A&R Facility”). The A&R Credit Agreement has a four-year term ending May 21, 2023, which can be extended for two additional six-month periods, subject to the satisfaction of certain conditions as defined in the credit agreement. The credit agreement also provides for additional commitments in an amount not to exceed $
350.0
million. The funding of these additional commitments is subject to certain conditions, including obtaining the consent of the lenders, some of which are outside of our control. If additional borrowings are made pursuant to any such additional commitments, the aggregate borrowing limit under the A&R Facility may be increased up to $
1.1
billion.
The A&R Facility bears interest at a floating rate based on the Eurodollar rate or Bank Bill Swap Bid Rate plus a margin that is determined based on our leverage ratio calculated in accordance with the credit agreement, which margin can range from
1.20
percent to
2.10
percent for the revolving loan and
1.20
percent to
2.05
percent for the term loan. As of December 31, 2020, the margin based on our leverage ratio was
1.20
percent on the revolving loan and
1.20
percent on the term loan. We had $
40.4
million and no borrowings on the revolving loan and the term loan, respectively, as of December 31, 2020. We had $
123.6
million of borrowings on the revolving loan and no borrowings on the term loan, as of December 31, 2019.
The A&R Facility provides us with the ability to issue letters of credit. Our issuance of letters of credit does not increase our borrowings outstanding under our line of credit with Citibank, but does reduce the borrowing amount available. At December 31, 2020 and December 31, 2019, we had approximately $
2.1
million and $
2.8
million of outstanding letters of credit, respectively.
Safe Harbor Facility
- On October 30, 2020, in relation to the acquisition of Safe Harbor, we indirectly assumed approximately $
829.0
million of Safe Harbor’s debt owed to Citizens Bank N.A. (“Citizens”). On December 22, 2020, this facility was amended to, among other things, (a) increase the size of the revolving commitments available to Safe Harbor from $
500
million to $
1.3
billion, subject to borrowing base availability, (b) modify certain provisions relating to the determination of the borrowing base, (c) increase the cap on the incremental borrowing capacity from $
350.0
million to $
500.0
million, which allows Safe Harbor to request an increase to the revolving commitments and / or to establish additional term loans subject to the higher cap and the satisfaction of certain conditions, and (d) modify certain financial covenants. The revolving loan and term loan under the Safe Harbor facility both expire on October 11, 2024. The term loan component of the Safe Harbor facility can be extended for two additional 12-month periods, subject to the satisfaction of certain conditions set forth in the credit agreement. The revolving commitments do not have an extension option.
F - 33
SUN COMMUNITIES, INC.
NOTES TO CONSOLIDATED FINANCIAL STATEMENTS
The Safe Harbor facility bears interest at a floating rate based on an adjusted LIBOR rate or a base rate, plus a margin that is determined based on Safe Harbor’s ratio of consolidated funded debt to total asset value, calculated in accordance with the credit agreement, which margin can range from
1.375
percent to
2.250
percent for adjusted LIBOR rate loans and
0.375
percent to
1.250
percent for base rate loans. As of December 31, 2020, based on Safe Harbor’s ratio of consolidated funded debt to total asset value, the margin was
2.000
percent on any adjusted LIBOR rate loans and
1.000
percent on any base rate loans. The Safe Harbor facility is secured by the personal property of Safe Harbor and certain related entities and subsidiaries and a pledge of the equity interests in certain subsidiaries of Safe Harbor and related entities and subsidiaries, subject to customary exceptions. At the lenders’ option, the Safe Harbor facility will become immediately due and payable upon an event of default that is continuing under the credit agreement. Safe Harbor had $
652.0
million and $
500.0
million of borrowings under the revolving loan and term loan respectively, as of December 31, 2020.
The Safe Harbor facility provides Safe Harbor with the ability to issue letters of credit. Its issuance of letters of credit does not increase its borrowings outstanding under its line of credit with Citizens, but does reduce the borrowing amount available. At December 31, 2020, Safe Harbor had approximately $
0.3
million of outstanding letters of credit.
Floor Plan
- We have a $
12.0
million manufactured home floor plan facility renewable indefinitely until our lender provides us at least a 12-month notice of their intent to terminate the agreement. The interest rate is
100
basis points over the greater of the prime rate as quoted in the
Wall Street Journal
on the first business day of each month or
5.0
percent. At December 31, 2020, the effective interest rate was
6.0
percent. The outstanding balance was $
4.8
million as of December 31, 2020 and $
3.3
million as of December 31, 2019. These balances are included in the “Lines of credit and other debt,” on the Consolidated Balance Sheets.
Other
- In October 2019, we assumed a term loan facility with Citibank, in the amount of $
58.0
million in relation to an acquisition. The term loan has a four-year term ending October 29, 2023, and bears interest at a floating rate based on the Eurodollar rate or Prime rate plus a margin ranging from
1.20
percent to
2.05
percent. As of December 31, 2020, the margin based on our leverage ratio was
1.20
percent. The outstanding balance was $
45.0
million at December 31, 2020 and $
57.0
million at December 31, 2019, respectively. These balances are included in the “Lines of credit and other debt,” on the Consolidated Balance Sheets.
Covenants
The Collateralized term loans and Lines of credit are subject to various financial and other covenants. The most restrictive covenants are pursuant to (a) the terms of the A&R Facility, which contains minimum fixed charge coverage ratio and net worth requirements, and maximum leverage, distribution ratios and variable rate indebtedness covenants, and (b) the terms of the Safe Harbor facility, which contains a minimum fixed charge coverage ratio pre-distribution, a minimum fixed charge coverage ratio post-distribution, a minimum borrowing base coverage ratio, and a maximum leverage ratio. At December 31, 2020, we were in compliance with all covenants.
In addition, certain of our subsidiary borrowers own properties that secure loans. These subsidiaries are consolidated within our accompanying Consolidated Financial Statements, however, each of these subsidiaries’ assets and credit are not available to satisfy our debts and other obligations, any of our other subsidiaries or any other person or entity.
Long-term Debt Maturities
As of December 31, 2020, the total of maturities and amortization of our debt (excluding premiums and discounts) and lines of credit during the next five years were as follows (in thousands):
| Maturities and Amortization By Year | |||||||||||||||||||||||||||||||||||||||||
| Total Due | 2021 | 2022 | 2023 | 2024 | 2025 | Thereafter | |||||||||||||||||||||||||||||||||||
| Mortgage loans payable | |||||||||||||||||||||||||||||||||||||||||
| Maturities | $ |
|
$ |
|
$ |
|
$ |
|
$ |
|
$ |
|
$ |
|
|||||||||||||||||||||||||||
| Principal amortization |
|
|
|
|
|
|
|
||||||||||||||||||||||||||||||||||
| Preferred Equity - Sun NG Resorts - mandatorily redeemable |
|
|
|
|
|
|
|
||||||||||||||||||||||||||||||||||
| Preferred OP units - mandatorily redeemable |
|
|
|
|
|
|
|
||||||||||||||||||||||||||||||||||
|
Lines of credit and other debt
|
|
|
|
|
|
|
|
||||||||||||||||||||||||||||||||||
| Total | $ |
|
$ |
|
$ |
|
$ |
|
$ |
|
$ |
|
$ |
|
|||||||||||||||||||||||||||
F - 34
SUN COMMUNITIES, INC.
NOTES TO CONSOLIDATED FINANCIAL STATEMENTS
Off-Balance Sheet Arrangements - Nonconsolidated Affiliate Indebtedness
GTSC
- During September 2019, GTSC, a nonconsolidated affiliate in which we have a
40
percent ownership interest, entered into a warehouse line of credit with a maximum loan amount of $
125.0
million. During September 2020, the maximum amount was increased to $
180.0
million. As of December 31, 2020, the aggregate carrying amount of debt, including both our and our partners’ share, incurred by GTSC was $
167.7
million (of which our proportionate share is $
67.1
million). The debt bears interest at a variable rate based on LIBOR plus
1.65
percent per annum and matures on September 15, 2023. As of December 31, 2019, the aggregate carrying amount of debt, including both our and our partner’s share, incurred by GTSC was approximately $
123.4
million (of which our proportionate share is approximately $
49.4
million).
Sungenia JV
- During May 2020, Sungenia JV, a nonconsolidated affiliate in which we have a
50
percent ownership interest, entered into a debt facility agreement with a maximum loan amount of $
27.0
million Australian dollars, or $
20.8
million converted at the December 31, 2020 exchange rate. As of December 31, 2020, the aggregate carrying amount of debt, including both our and our partners’ share, incurred by Sungenia JV was $
6.7
million (of which our proportionate share is $
3.3
million). The debt bears interest at a variable rate based on Australian Bank Bill Swap Bid Rate (BBSY) plus 2.05 percent per annum and is available for a minimum of three years.
9.
Equity and Temporary Equity
Public Equity Offerings
On September 30, 2020, we entered into two forward sale agreements (the “Forward Sale Agreements”) relating to an underwritten registered public offering of
9,200,000
shares of our common stock at a public offering price of $
139.50
per share. The offering closed on October 5, 2020. We did not initially receive any proceeds from the sale of shares of our common stock in the offering. On October 26, 2020, we physically settled the Forward Sale Agreements (by the delivery of shares of our common stock). Proceeds from the offering were approximately $
1.2
billion after deducting expenses related to the offering. We used the net proceeds of this offering to fund the cash portion of the acquisition of Safe Harbor, and for working capital and general corporate purposes.
In May 2020, we closed an underwritten registered public offering of
4,968,000
shares of common stock. Proceeds from the offering were $
633.1
million after deducting expenses related to the offering. We used the net proceeds of this offering to repay borrowings outstanding under the revolving loan under our senior credit facility.
In May 2019, we closed an underwritten registered public offering of
3,737,500
shares of common stock. Proceeds from the offering were $
452.1
million after deducting expenses related to the offering. We used the net proceeds of this offering to repay borrowings outstanding under the revolving loan under our senior credit facility.
At the Market Offering Sales Agreement
In July 2017, we entered into an at the market offering sales agreement (the “Sales Agreement”) with certain sales agents (collectively, the “Sales Agents”), whereby we may offer and sell shares of our common stock, having an aggregate offering price of up to $
450.0
million, from time to time through the Sales Agents. The Sales Agents are entitled to compensation in an agreed amount not to exceed
2.0
percent of the gross price per share for any shares sold under the Sales Agreement. Through December 31, 2020, we have sold shares of our common stock for gross proceeds of $
163.8
million under the Sales Agreement.
There were no issuances of common stock under the Sales Agreement during the years ended December 31, 2020 and 2019. Issuances of common stock under the Sales Agreement during year ended December 31, 2018 were as shown in the table below:
| Quarter Ended |
Common Stock
Issued |
Weighted Average
Sales Price |
Net Proceeds
(in Millions) |
|||||||||||||||||
| September 30, 2018 |
|
$ |
|
$ |
|
|||||||||||||||
| June 30, 2018 |
|
$ |
|
$ |
|
|||||||||||||||
Issuances of Common Stock and Common OP Units
In December 2020, in connection with the acquisition of Safe Harbor Rybovich, we issued
130,475
Common OP units.
In October 2020, in connection with the acquisition of Safe Harbor, we issued
55,403
Common OP units.
F - 35
SUN COMMUNITIES, INC.
NOTES TO CONSOLIDATED FINANCIAL STATEMENTS
In May 2020, in connection with the acquisition of the Forest Springs community, we issued
82,420
Common OP units.
In October 2019, in connection with the acquisition of the Jensen Portfolio, we issued
1,972,876
shares of common stock, net of fractional shares paid in cash.
Equity Interests - SHM South Fork JV, LLC
In October 2020, in conjunction with the acquisition of Safe Harbor, we indirectly acquired $
4.3
million of Safe Harbor’s equity interest in SHM South Fork JV, LLC, a joint venture created for the purpose of acquiring land and constructing a marina in Fort Lauderdale, Florida. The Safe Harbor Equity Interests - SHM South Fork JV, LLC balance was $
4.3
million of at December 31, 2020. Refer to Note 7, “Consolidated Variable Interest Entities,” for additional information.
Issuance of Series E Preferred OP Units
In January 2020, we issued
90,000
Series E preferred OP units in connection with the acquisition of Cape Cod RV Resort. The Series E preferred OP units have a stated issuance price of $
100.00
per OP unit and carry a preferred return of
5.25
percent until the second anniversary of the issuance date. Commencing with the second anniversary of the issuance date, the Series E Preferred OP Units carry a preferred return of
5.50
percent. Commencing the first anniversary of the issuance date, subject to certain limitations, each Series E Preferred OP Unit can be exchanged for our common stock equal to the quotient obtained by dividing $
100.00
by $
145.00
(as such ratio is subject to adjustments for certain capital events). As of December 31, 2020,
90,000
Series E preferred OP units were outstanding. Refer to Note 3, “Real Estate Acquisitions and Dispositions,” for additional information.
Temporary Equity
Issuance of Series I Preferred OP Units
- In December 2020, we issued
922,000
Series I preferred OP units in connection with the acquisition of the Safe Harbor Rybovich portfolio. The Series I preferred OP units have a stated issuance price of $
100.00
per OP unit and carry a preferred return of
3.0
percent. Subject to certain limitations, at any time after the Series I issuance date, each Series I preferred OP unit can be exchanged for a number of shares of our common stock equal to the quotient obtained by dividing $
100.00
by $
164.00
(as such ratio is subject to adjustments for certain capital events) at the holder’s option. Each holder may require redemption in cash after the fifth anniversary of the Series I issuance date or upon the holder’s death. As of December 31, 2020,
922,000
Series I preferred OP units were outstanding. Refer to Note 3, “Real Estate Acquisitions and Dispositions,” for additional information.
Issuance of Series H Preferred OP Units
- In October 2020, we issued
581,407
Series H preferred OP units in connection with the acquisition of Safe Harbor. The Series H preferred OP units have a stated issuance price of $
100.00
per OP unit and carry a preferred return of
3.0
percent. Subject to certain limitations, at any time after the Series H issuance date, each Series H preferred OP unit can be exchanged for a number of shares of our common stock equal to the quotient obtained by dividing $
100.00
by $
164.00
(as such ratio is subject to adjustments for certain capital events) at the holder’s option. Each holder may require redemption in cash after the fifth anniversary of the Series H issuance date or upon the holder’s death. As of December 31, 2020,
581,407
Series H preferred OP units were outstanding. Refer to Note 3, “Real Estate Acquisitions and Dispositions,” for additional information.
Equity Interests - FPG Sun Menifee 80 LLC
- In October 2020, in connection with investment in land for future development in the city of Menifee in California, at the property known as FPG Sun Menifee 80, LLC, Foremost Pacific Group, LLC, “FPG,” purchased $
0.1
million of common equity interest in the land (referred to as “Equity Interests - FPG Sun Menifee 80 LLC). The Equity Interests - FPG Sun Menifee 80 LLC do not have a fixed maturity date. Upon the occurrence of certain events, either FPG or Sun FPG Venture LLC, our subsidiary, can trigger a process under which we may be required to purchase the Equity Interests - FPG Sun Menifee 80 LLC from FPG. The Equity Interests - FPG Sun Menifee 80 LLC balance was $
0.1
million at December 31, 2020. Refer to Note 7, “Consolidated Variable Interest Entities,” for additional information.
Issuance of Series G Preferred OP Units
- In September 2020, we issued
260,710
Series G preferred OP units in connection with the acquisition of El Capitan & Ocean Mesa Resorts. The Series G preferred OP units have a stated issuance price of $
100.00
per OP unit and carry a preferred return of
3.2
percent. Subject to certain limitations, at any time after the Series G issuance date, each Series G preferred OP unit can be exchanged for a number of shares of our common stock equal to the quotient obtained by dividing $
100.00
by $
155.00
(as such ratio is subject to adjustments for certain capital events) at the holder’s option. Each holder may require redemption in cash after the fifth anniversary of the Series G issuance date or upon the holder’s death. As of December 31, 2020,
240,710
Series G preferred OP units were outstanding. Refer to Note 3, “Real Estate Acquisitions and Dispositions,” for additional information.
F - 36
SUN COMMUNITIES, INC.
NOTES TO CONSOLIDATED FINANCIAL STATEMENTS
Issuance of Series F Preferred OP Units
- In May 2020, we issued
90,000
Series F preferred OP units in connection with the acquisition of Forest Springs. The Series F preferred OP units have a stated issuance price of $
100.00
per OP unit and carry a preferred return of
3.0
percent. Subject to certain limitations, at any time after the Series F issuance date, each Series F preferred OP unit can be exchanged for a number of shares of our common stock equal to the quotient obtained by dividing $
100.00
by $
160.00
(as such ratio is subject to adjustments for certain capital events) at the holder’s option. Each holder may require redemption in cash after the fifth anniversary of the Series F issuance date or upon the holder’s death. As of December 31, 2020,
90,000
Series F preferred OP units were outstanding. Refer to Note 3, “Real Estate Acquisitions and Dispositions,” for additional information.
Equity Interests - NG Sun Whitewater LLC
- In August 2019, in connection with the investment in land at the property known as Whitewater, NG Sun Whitewater LLC purchased $
2.4
million of common equity interest in Sun NG Whitewater RV Resorts LLC (referred to as “Equity Interests - NG Sun Whitewater LLC”). The Equity Interests - NG Sun Whitewater LLC do not have a fixed maturity date. Upon the occurrence of certain events, either NG Sun Whitewater LLC or Sun NG LLC, our subsidiary, can trigger a process under which we may be required to purchase the Equity Interests - NG Sun Whitewater LLC from NG Sun Whitewater LLC. The Equity Interests - NG Sun Whitewater LLC balance was $
1.1
million and $
3.9
million at December 31, 2020 and December 31, 2019. Refer to Note 7, “Consolidated Variable Interest Entities,” for additional information.
Issuance of Series D Preferred OP Units -
In February 2019, we issued
488,958
Series D Preferred OP units in connection with the acquisition of Country Village Estates. The Series D preferred OP units have a stated issuance price of $
100.00
per OP Unit and carry a preferred return of
3.75
percent until the second anniversary of the issuance date. Commencing with the second anniversary of the issuance date, the Series D Preferred OP Units carry a preferred return of
4.0
percent. Commencing with the first anniversary of the issuance date, each Series D Preferred OP Unit can be exchanged for our common stock equal to the quotient obtained by dividing $
100.00
by $
125.00
(as such ratio is subject to adjustments for certain capital events) at the holder’s option. The holders may require redemption in cash after the fifth anniversary of the Series D issuance date or upon the holder’s death. As of December 31, 2020,
488,958
Series D preferred OP units were outstanding. Refer to Note 3, “Real Estate Acquisitions and Dispositions,” for additional information.
Equity Interests - NG Sun LLC
- In June 2018, in connection with the investment in Sun NG Resorts, unrelated third parties purchased $
6.5
million of Series B preferred equity interests and $
15.4
million of common equity interest in Sun NG Resorts (herein jointly referred to as “Equity Interest - NG Sun LLC”). In April and September 2020, in connection with the acquisitions of Glen Ellis RV Park and Lone Star RV Park, $
3.0
million of Series B preferred equity interests were converted to common equity interests. The Series B preferred equity interests carry a preferred return at a rate that, at any time, is equal to the interest rate on Sun NG Resorts’ indebtedness at such time. The current rate of return is
5.0
percent. The Equity Interests - NG Sun LLC do not have a fixed maturity date and can be redeemed in the fourth quarters of 2024, 2025 and 2026 at the holders’ option. Sun NG LLC, our subsidiary, has the right during certain periods each year, with or without cause, or for cause at any time, to elect to buy NG Sun LLC’s interest. During a limited period in 2022, NG Sun LLC has the right to put its interest to Sun NG LLC. If either party exercises their option, the property management agreement will be terminated, and we are required to purchase the remaining interests of NG Sun LLC and the property management agreement at fair value. Refer to Note 7, “Consolidated Variable Interest Entities,” and Note 8, “Debt and Lines of Credit,” for additional information.
Series A-4 Preferred OP Units
- On December 13, 2019, all outstanding shares of our
6.5
percent Series A-4 Cumulative Convertible Preferred Stock, and all of the Operating Partnership’s Series A-4 Preferred OP Units were converted into common stock and common OP units, respectively. All
1,031,747
shares of Series A-4 preferred stock were converted into
458,541
shares of common stock (net of fractional shares paid in cash). All
405,656
Series A-4 preferred OP units were converted into
180,277
common OP units (net of fractional units paid in cash). The Series A-4 preferred shares and units were issued to the sellers of the American Land Lease portfolio which we acquired in 2014 and 2015.
F - 37
SUN COMMUNITIES, INC.
NOTES TO CONSOLIDATED FINANCIAL STATEMENTS
Conversions
Conversions to Common Stock
- Subject to certain limitations, holders can convert certain series of stock and OP units to shares of our common stock at any time.
Below is the activity of conversions during the years ended December 31, 2020 and 2019:
| Year Ended | ||||||||||||||||||||||||||
| December 31, 2020 | December 31, 2019 | |||||||||||||||||||||||||
| Series | Conversion Rate | Units / Shares Converted |
Common Stock
(1)
|
Units / Shares Converted |
Common Stock
(1)
|
|||||||||||||||||||||
| Common OP unit |
|
|
|
|
|
|||||||||||||||||||||
| Series A-1 preferred OP unit |
|
|
|
|
|
|||||||||||||||||||||
| Series A-4 preferred OP unit |
|
|
|
|
|
|||||||||||||||||||||
| Series A-4 preferred stock |
|
|
|
|
|
|||||||||||||||||||||
| Series C preferred OP unit |
|
|
|
|
|
|||||||||||||||||||||
(1)
Calculation may yield minor differences due to fractional shares paid in cash to the stockholder at conversion.
Conversions to Common OP Units
- Subject to certain limitations, holders can convert certain series of preferred OP units to common OP units. There were no such conversions in 2020. Below is the activity of such conversions during 2019:
| Year Ended | |||||||||||
| December 31, 2019 | |||||||||||
| Series | Units / Shares | Common OP Units | |||||||||
| Series A-4 preferred OP units |
|
|
|||||||||
Redemption OP Units
- Subject to certain limitations, holders can redeem certain series OP units for cash, provided that the requirements are met. On November 4, 2020,
20,000
Series G preferred OP units were redeemed for a net cash payment of $
2.0
million, inclusive of all distributions on the redeemed units that were accrued and unpaid as of the redemption date, in accordance with the terms and conditions set for in the redemption agreement. There was no redemption of series OP units during 2019.
Distributions
Distributions declared for the quarter ended December 31, 2020 were as follows:
| Distribution | Record Date | Payment Date | Distribution Per Share | Total Distribution (in Thousands) | |||||||||||||
| Common Stock, Common OP units and Restricted Stock | 12/31/2020 | 1/15/2021 | $ |
|
$ |
|
|||||||||||
F - 38
SUN COMMUNITIES, INC.
NOTES TO CONSOLIDATED FINANCIAL STATEMENTS
10. Share-Based Compensation
As of December 31, 2020, we had two share-based compensation plans; the Sun Communities, Inc. 2015 Equity Incentive Plan (“2015 Equity Incentive Plan”) and the First Amended and Restated 2004 Non-Employee Director Option Plan (“2004 Non-Employee Director Option Plan”). We believe granting equity awards will provide certain executives, key employees and directors additional incentives to promote our financial success and promote employee and director retention by providing an opportunity to acquire or increase the direct proprietary interest of those individuals in our operations and future.
Restricted Stock
The majority of our share-based compensation is awarded as service vesting restricted stock grants to executives and key employees. We have also awarded restricted stock to our non-employee directors. We measure the fair value associated with these awards using the closing price of our common stock as of the grant date to calculate compensation cost. Employee awards typically vest over several years and are subject to continued employment by the employee. Award recipients receive distribution payments on unvested shares of restricted stock.
2015 Equity Incentive Plan
At the Annual Meeting of Stockholders held on July 20, 2015, the stockholders approved the 2015 Equity Plan. The 2015 Equity Plan had been adopted by the Board and was effective upon approval by our stockholders. The maximum number of shares of common stock that may be issued under the 2015 Equity Plan is
1,750,000
shares of our common stock, with
729,011
as of December 31, 2020 shares remaining for future issuance.
2004 Non-Employee Director Option Plan
The director plan was approved by our stockholders at the Annual Meeting of Stockholders held on July 19, 2012. The director plan amended and restated in its entirety our 2004 Non-Employee Director Stock Option Plan. At the Annual Meeting of the Stockholders held on May 17, 2018, the stockholders approved the First Amendment to Sun Communities, Inc. First Amended and Restated 2004 Non-Employee Director Option Plan to increase the number of authorized shares under the plan by
200,000
shares.
The types of awards that may be granted under the director plan are options, restricted stock and OP units. Only non-employee directors are eligible to participate in the director plan. The maximum number of options, restricted stock and OP units that may be issued under the Director Plan is
375,000
shares, with
181,574
as of December 31, 2020 shares remaining for future issuance.
During the years ended December 31, 2020 and 2019, shares were granted as follows:
| Grant Period | Type | Plan | Shares Granted | Grant Date Fair Value Per Share | Vesting Type | Vesting Anniversary | Percentage | |||||||||||||||||||||||||||||||||||||
| 2020 | Key Employees | 2015 Equity Incentive Plan |
|
$ |
|
(1)
|
Time Based |
|
||||||||||||||||||||||||||||||||||||
| 2020 | Executive Officers | 2015 Equity Incentive Plan |
|
$ |
|
(1)
|
Time Based |
|
||||||||||||||||||||||||||||||||||||
| 2020 | Key Employees | 2015 Equity Incentive Plan |
|
$ |
|
(1)
|
Time Based |
|
||||||||||||||||||||||||||||||||||||
| 2020 | Key Employees | 2015 Equity Incentive Plan |
|
$ |
|
(1)
|
Time Based |
|
||||||||||||||||||||||||||||||||||||
| 2020 | Executive Officers | 2015 Equity Incentive Plan |
|
$ |
|
(1)
|
Time Based |
|
||||||||||||||||||||||||||||||||||||
| 2020 | Executive Officers | 2015 Equity Incentive Plan |
|
(2)
|
$ |
|
(2)
|
Market Condition | 3rd |
|
% | |||||||||||||||||||||||||||||||||
| 2020 | Directors | 2004 Non-Employee Director Option Plan |
|
$ |
|
(1)
|
Time Based | 3rd |
|
% | ||||||||||||||||||||||||||||||||||
| 2019 | Executive Officers | 2015 Equity Incentive Plan |
|
$ |
|
(1)
|
Time Based |
|
||||||||||||||||||||||||||||||||||||
| 2019 | Executive Officers | 2015 Equity Incentive Plan |
|
(3)
|
$ |
|
(3)
|
Market Condition | 3rd |
|
% | |||||||||||||||||||||||||||||||||
| 2019 | Directors | 2004 Non-Employee Director Option Plan |
|
$ |
|
(1)
|
Time Based | 3rd |
|
% | ||||||||||||||||||||||||||||||||||
| 2019 | Key Employees | 2015 Equity Incentive Plan |
|
$ |
|
(1)
|
Time Based |
|
||||||||||||||||||||||||||||||||||||
| 2019 | Key Employees | 2015 Equity Incentive Plan |
|
$ |
|
(1)
|
Time Based |
|
||||||||||||||||||||||||||||||||||||
(1)
The fair values of the grants were determined by using the average closing price of our common stock on the dates the shares were issued.
(2)
Share-based compensation for restricted stock awards with market conditions is measured based on an estimate of shares expected to vest. We estimate the fair value of share-based compensation for restricted stock with market conditions using a Monte Carlo simulation. At the grant date our common stock price was $
165.97
. Based on the Monte Carlo simulation we expect
75.6
percent of the
69,000
shares to vest.
(3)
Share-based compensation for restricted stock awards with market conditions is measured based on an estimate of shares expected to vest. We estimate the fair value of share-based compensation for restricted stock with market conditions using a Monte Carlo simulation. At the grant date our common stock price was $
115.39
. Based on the Monte Carlo simulation we expect
75.1
percent of the
66,000
shares to vest.
F - 39
SUN COMMUNITIES, INC.
NOTES TO CONSOLIDATED FINANCIAL STATEMENTS
The following table summarizes our restricted stock activity for the years ended December 31, 2020, 2019, and 2018:
| Number of Shares | Weighted Average Grant Date Fair Value | ||||||||||
| Unvested restricted shares at January 1, 2018 |
|
$ |
|
||||||||
| Granted |
|
$ |
|
||||||||
| Vested |
(
|
$ |
|
||||||||
| Forfeited |
(
|
$ |
|
||||||||
| Unvested restricted shares at December 31, 2018 |
|
$ |
|
||||||||
| Granted |
|
$ |
|
||||||||
| Vested |
(
|
$ |
|
||||||||
| Forfeited |
(
|
$ |
|
||||||||
| Unvested restricted shares at December 31, 2019 |
|
$ |
|
||||||||
| Granted |
|
$ |
|
||||||||
| Vested |
(
|
$ |
|
||||||||
| Forfeited |
(
|
$ |
|
||||||||
| Unvested restricted shares at December 31, 2020 |
|
$ |
|
||||||||
Total compensation cost recognized for restricted stock was $
22.7
million, $
17.5
million, and $
15.1
million for the years ended December 31, 2020, 2019, and 2018, respectively. The total fair value of shares vested was $
19.0
million, $
15.3
million, and $
11.7
million for the years ended December 31, 2020, 2019 and 2018, respectively.
The remaining share-based compensation cost, net related to our unvested restricted shares outstanding as of December 31, 2020 is approximately $
52.6
million. The following table summarizes our expected share-based compensation cost, net related to our unvested restricted shares, in thousands:
| 2021 | 2022 | 2023 | Thereafter | ||||||||||||||||||||
| Expected share-based compensation costs, net | $ |
|
$ |
|
$ |
|
$ |
|
|||||||||||||||
11. Segment Reporting
We group our operating segments into reportable segments that provide similar products and services. Each operating segment has discrete financial information evaluated regularly by our chief operating decision maker in evaluating and assessing performance. We have two reportable segments: (a) Real Property Operations and (b) Home Sales and Rentals. The Real Property Operations segment owns, operates, has an interest in a portfolio, and develops MH communities, RV resorts and marinas, and is in the business of acquiring, operating, and expanding MH, RV and marina properties. The Home Sales and Rentals segment offers manufactured home sales and leasing services to tenants and prospective tenants of our communities.
Transactions between our segments are eliminated in consolidation. Transient RV revenue is included in the Real Property Operations segment revenues and is approximately $
134.7
million and $
121.5
million for the year ended December 31, 2020 and 2019, respectively. In 2020, transient RV revenue was recognized
18.8
percent in the first quarter,
15.6
percent in the second quarter,
44.9
percent in the third quarter, and
20.7
percent in the fourth quarter. In 2019, transient RV revenue was recognized
20.1
percent in the first quarter,
23.2
percent in the second quarter,
40.3
percent in the third quarter, and
16.4
percent in the fourth quarter.
Refer to Note 20, “Subsequent Events,” for information regarding segment activity after December 31, 2020.
F - 40
SUN COMMUNITIES, INC.
NOTES TO CONSOLIDATED FINANCIAL STATEMENTS
A presentation of our segment financial information is summarized as follows (amounts in thousands):
| Year Ended | |||||||||||||||||||||||||||||||||||||||||||||||||||||
| December 31, 2020 | December 31, 2019 | December 31, 2018 | |||||||||||||||||||||||||||||||||||||||||||||||||||
| Real Property Operations |
Home Sales
and Rentals |
Consolidated | Real Property Operations |
Home Sales
and Rentals |
Consolidated | Real Property Operations |
Home Sales
and Rentals |
Consolidated | |||||||||||||||||||||||||||||||||||||||||||||
| Revenues | $ |
|
$ |
|
$ |
|
$ |
|
$ |
|
$ |
|
$ |
|
$ |
|
$ |
|
|||||||||||||||||||||||||||||||||||
| Operating expenses / Cost of sales |
|
|
|
|
|
|
|
|
|
||||||||||||||||||||||||||||||||||||||||||||
| Net operating income / Gross profit |
|
|
|
|
|
|
|
|
|
||||||||||||||||||||||||||||||||||||||||||||
| Adjustments to arrive at net income / (loss) | |||||||||||||||||||||||||||||||||||||||||||||||||||||
| Interest income |
|
|
|
|
|
|
|
|
|
||||||||||||||||||||||||||||||||||||||||||||
| Brokerage commissions and other revenues, net |
|
|
|
|
|
|
|
|
|
||||||||||||||||||||||||||||||||||||||||||||
| Home selling expenses |
|
(
|
(
|
|
(
|
(
|
|
(
|
(
|
||||||||||||||||||||||||||||||||||||||||||||
| General and administrative expenses |
(
|
(
|
(
|
(
|
(
|
(
|
(
|
(
|
(
|
||||||||||||||||||||||||||||||||||||||||||||
| Catastrophic weather-related charges, net |
(
|
|
(
|
(
|
(
|
(
|
|
(
|
(
|
||||||||||||||||||||||||||||||||||||||||||||
| Business combination expense |
(
|
|
(
|
|
|
|
|
|
|
||||||||||||||||||||||||||||||||||||||||||||
| Depreciation and amortization |
(
|
(
|
(
|
(
|
(
|
(
|
(
|
(
|
(
|
||||||||||||||||||||||||||||||||||||||||||||
|
Loss on extinguishment of debt (see Note 8)
|
(
|
|
(
|
(
|
|
(
|
(
|
|
(
|
||||||||||||||||||||||||||||||||||||||||||||
| Interest expense |
(
|
(
|
(
|
(
|
(
|
(
|
(
|
(
|
(
|
||||||||||||||||||||||||||||||||||||||||||||
| Interest on mandatorily redeemable preferred OP units / equity |
(
|
|
(
|
(
|
|
(
|
(
|
|
(
|
||||||||||||||||||||||||||||||||||||||||||||
| Gain / (loss) on remeasurement of marketable securities |
|
|
|
|
|
|
(
|
|
(
|
||||||||||||||||||||||||||||||||||||||||||||
| Gain / (loss) on foreign currency translation |
|
|
|
|
|
|
(
|
(
|
(
|
||||||||||||||||||||||||||||||||||||||||||||
| Gain on disposition of property |
|
|
|
|
|
|
|
|
|
||||||||||||||||||||||||||||||||||||||||||||
| Other income / (expense), net |
(
|
|
(
|
(
|
(
|
(
|
|
(
|
|
||||||||||||||||||||||||||||||||||||||||||||
| Loss on remeasurement of notes receivable |
(
|
|
(
|
|
|
|
|
|
|
||||||||||||||||||||||||||||||||||||||||||||
|
Income from nonconsolidated affiliates (see Note 6)
|
|
|
|
|
|
|
|
|
|
||||||||||||||||||||||||||||||||||||||||||||
| Loss on remeasurement of investment in nonconsolidated affiliate |
|
(
|
(
|
|
|
|
|
|
|
||||||||||||||||||||||||||||||||||||||||||||
| Current tax expense |
(
|
(
|
(
|
(
|
(
|
(
|
(
|
(
|
(
|
||||||||||||||||||||||||||||||||||||||||||||
|
Deferred tax benefit (see Note 12)
|
|
|
|
|
|
|
|
|
|
||||||||||||||||||||||||||||||||||||||||||||
| Net Income / (Loss) |
|
(
|
|
|
(
|
|
|
(
|
|
||||||||||||||||||||||||||||||||||||||||||||
| Less: Preferred return to preferred OP units / equity |
|
|
|
|
|
|
|
|
|
||||||||||||||||||||||||||||||||||||||||||||
| Less: Income / (Loss) attributable to noncontrolling interests |
|
(
|
|
|
(
|
|
|
(
|
|
||||||||||||||||||||||||||||||||||||||||||||
| Net Income / (Loss) Attributable to Sun Communities, Inc. |
|
(
|
|
|
(
|
|
|
(
|
|
||||||||||||||||||||||||||||||||||||||||||||
| Less: Preferred stock distribution |
|
|
|
|
|
|
|
|
|
||||||||||||||||||||||||||||||||||||||||||||
| Net Income / (Loss) Attributable to Sun Communities, Inc. Common Stockholders | $ |
|
$ |
(
|
$ |
|
$ |
|
$ |
(
|
$ |
|
$ |
|
$ |
(
|
$ |
|
|||||||||||||||||||||||||||||||||||
F - 41
SUN COMMUNITIES, INC.
NOTES TO CONSOLIDATED FINANCIAL STATEMENTS
| December 31, 2020 | December 31, 2019 | ||||||||||||||||||||||||||||||||||
| Real Property Operations | Home Sales and Rentals | Consolidated | Real Property Operations | Home Sales and Rentals | Consolidated | ||||||||||||||||||||||||||||||
| Identifiable assets | |||||||||||||||||||||||||||||||||||
| Investment property, net | $ |
|
$ |
|
$ |
|
$ |
|
$ |
|
$ |
|
|||||||||||||||||||||||
| Cash, cash equivalents and restricted cash |
(
|
|
|
(
|
|
|
|||||||||||||||||||||||||||||
| Marketable securities |
|
|
|
|
|
|
|||||||||||||||||||||||||||||
| Inventory of manufactured homes |
|
|
|
|
|
|
|||||||||||||||||||||||||||||
| Notes and other receivables, net |
|
|
|
|
|
|
|||||||||||||||||||||||||||||
| Goodwill |
|
|
|
|
|
|
|||||||||||||||||||||||||||||
| Other intangible assets, net |
|
|
|
|
|
|
|||||||||||||||||||||||||||||
| Other assets, net |
|
|
|
|
|
|
|||||||||||||||||||||||||||||
| Total assets | $ |
|
$ |
|
$ |
|
$ |
|
$ |
|
$ |
|
|||||||||||||||||||||||
12.
Income Taxes
We have elected to be taxed as a REIT pursuant to Section 856(c) of the Internal Revenue Code of 1986, as amended (“Code”). In order for us to qualify as a REIT, at least
95.0
percent of our gross income in any year must be derived from qualifying sources. In addition, a REIT must distribute annually at least
90.0
percent of its REIT taxable income (calculated without any deduction for dividends paid and excluding capital gain) to its stockholders and meet other tests.
Qualification as a REIT involves the satisfaction of numerous requirements (on an annual and quarterly basis) established under highly technical and complex Code provisions for which there are limited judicial or administrative interpretations and involves the determination of various factual matters and circumstances not entirely within our control. In addition, frequent changes occur in the area of REIT taxation, which requires us to continually monitor our tax status. We analyzed the various REIT tests and confirmed that we continued to qualify as a REIT for the year ended December 31, 2020.
As a REIT, we generally will not be subject to United States (“U.S.”) federal income taxes at the corporate level on the ordinary taxable income we distribute to our stockholders as dividends. If we fail to qualify as a REIT in any taxable year, our taxable income could be subject to U.S. federal income tax at regular corporate rates. Even if we qualify as a REIT, we may be subject to certain state and local income taxes as well as U.S. federal income and excise taxes on our undistributed income. In addition, taxable income from non-REIT activities managed through taxable REIT subsidiaries is subject to federal, state, and local income taxes. We are also subject to local income taxes in Canada as a result of the acquisition in 2016 of certain properties located in Canada. We do not provide for withholding taxes on our undistributed earnings from our Canadian subsidiaries as they are reinvested and will continue to be reinvested indefinitely outside of the U.S. However, we are subject to Australian withholding taxes on distributions from our investment in Ingenia Communities Group.
For income tax purposes, distributions paid to common stockholders consist of ordinary income, capital gains, and return of capital.
For the years ended December 31, 2020, 2019, and 2018, distributions paid per share were taxable as follows (unaudited / rounded):
| Year Ended | |||||||||||||||||||||||||||||||||||
| December 31, 2020 | December 31, 2019 | December 31, 2018 | |||||||||||||||||||||||||||||||||
| Amount | Percentage | Amount | Percentage | Amount | Percentage | ||||||||||||||||||||||||||||||
|
Ordinary income
(1)
|
$ |
|
|
% | $ |
|
|
% | $ |
|
|
% | |||||||||||||||||||||||
| Capital gain |
|
|
% |
|
|
% |
|
|
% | ||||||||||||||||||||||||||
| Return of capital |
|
|
% |
|
|
% |
|
|
% | ||||||||||||||||||||||||||
|
Total distributions declared
|
$ |
|
|
% | $ |
|
|
% | $ |
|
|
% | |||||||||||||||||||||||
(1)
99.0364
percent of the ordinary taxable dividend qualifies as Section 199A dividend for 2020 and
0.9636
percent percent of the ordinary taxable dividend qualifies as a Qualified Dividend for 2020.
F - 42
SUN COMMUNITIES, INC.
NOTES TO CONSOLIDATED FINANCIAL STATEMENTS
The components of our provision / (benefit) for income taxes attributable to continuing operations for the year ended December 31, 2020 and 2019 are as follows (amounts in thousands):
| Year Ended | ||||||||||||||||||||
| December 31, 2020 | December 31, 2019 | December 31, 2018 | ||||||||||||||||||
| Federal | ||||||||||||||||||||
| Current | $ |
(
|
$ |
(
|
$ |
(
|
||||||||||||||
| Deferred |
(
|
|
|
|||||||||||||||||
| State and Local | ||||||||||||||||||||
| Current |
|
|
|
|||||||||||||||||
| Deferred |
(
|
|
|
|||||||||||||||||
| Foreign | ||||||||||||||||||||
| Current |
|
|
(
|
|||||||||||||||||
| Deferred |
(
|
(
|
(
|
|||||||||||||||||
| Total provision / (benefit) | $ |
(
|
$ |
|
$ |
|
||||||||||||||
A reconciliation of the provision / (benefit) for income taxes with the amount computed by applying the statutory federal income tax rate to income before provision for income taxes for the year ended December 31, 2020 and 2019 is as follows (amounts in thousands):
| Year Ended | ||||||||||||||||||||||||||||||||||||||
| December 31, 2020 | December 31, 2019 | December 31, 2018 | ||||||||||||||||||||||||||||||||||||
| Pre-tax income attributable to taxable subsidiaries | $ |
|
$ |
(
|
$ |
(
|
||||||||||||||||||||||||||||||||
| Federal benefit at statutory tax rate |
(
|
|
% |
(
|
|
% |
(
|
|
% | |||||||||||||||||||||||||||||
| State and local taxes, net of federal benefit |
|
(
|
% |
|
(
|
% |
|
|
% | |||||||||||||||||||||||||||||
| Rate differential |
(
|
|
% |
(
|
|
% |
(
|
|
% | |||||||||||||||||||||||||||||
| Change in valuation allowance |
|
(
|
% |
|
(
|
% |
|
(
|
% | |||||||||||||||||||||||||||||
| Others |
(
|
|
% |
|
(
|
% |
(
|
|
% | |||||||||||||||||||||||||||||
| Tax provision / (benefit) - taxable subsidiaries |
(
|
|
% |
|
(
|
% |
(
|
|
% | |||||||||||||||||||||||||||||
| Other state taxes - flow through subsidiaries |
|
|
|
|||||||||||||||||||||||||||||||||||
| Total provision / (benefit) | $ |
(
|
$ |
|
$ |
|
||||||||||||||||||||||||||||||||
Our deferred tax assets and liabilities reflect the impact of temporary differences between the amounts of assets and liabilities for financial reporting purposes and the basis of such assets and liabilities as measured by tax laws. Deferred tax assets are reduced, if necessary, by a valuation allowance to the amount where realization is more likely than not assured after considering all available evidence. Our temporary differences primarily relate to net operating loss carryforwards, and depreciation and basis differences between tax and GAAP. Our deferred tax assets that have a full valuation allowance relate to our taxable REIT subsidiaries.
F - 43
SUN COMMUNITIES, INC.
NOTES TO CONSOLIDATED FINANCIAL STATEMENTS
The deferred tax assets and liabilities included in the Consolidated Balance Sheets are comprised of the following tax effects of temporary differences and based on the (amounts in thousands):
| As of | |||||||||||||||||
| December 31, 2020 | December 31, 2019 | December 31, 2018 | |||||||||||||||
| Deferred Tax Assets | |||||||||||||||||
| NOL carryforwards | $ |
|
$ |
|
$ |
|
|||||||||||
| Depreciation and basis differences |
|
|
|
||||||||||||||
| Other |
(
|
|
|
||||||||||||||
| Gross deferred tax assets |
|
|
|
||||||||||||||
| Valuation allowance |
(
|
(
|
(
|
||||||||||||||
| Net deferred tax assets |
|
|
|
||||||||||||||
| Deferred Tax Liabilities | |||||||||||||||||
| Basis differences - US assets |
(
|
|
|
||||||||||||||
| Basis differences - foreign investment |
(
|
(
|
(
|
||||||||||||||
| Gross deferred tax liabilities |
(
|
(
|
(
|
||||||||||||||
|
Net Deferred Tax Liability
(1)
|
$ |
(
|
$ |
(
|
$ |
(
|
|||||||||||
(1)
Net deferred tax liability is included within Other liabilities in our Consolidated Balance Sheets.
Our U.S. taxable REIT subsidiaries operating loss carryforwards are $
80.2
million, or $
16.7
million after tax, including SHS loss carryforwards of $
77.1
million, or $
16.2
million after tax, as of December 31, 2020. The loss carryforwards will begin to expire in 2023 through 2035 if not offset by future taxable income. In addition, our Canadian subsidiaries have operating loss carryforwards of $
10.7
million, or $
2.8
million after tax, as of December 31, 2020. The loss carryforwards will begin to expire in 2033 through 2038 if not offset by future taxable income.
We had
no
unrecognized tax benefits as of December 31, 2020 and 2019. We expect
no
significant increases or decreases in unrecognized tax benefits due to changes in tax positions within one year of December 31, 2020.
We classify certain state taxes as income taxes for financial reporting purposes. We recorded a provision for state income taxes of $
1.5
million for the year ended December 31, 2020, $
0.9
million for the year ended December 31, 2019, and $
0.7
million for the year ended December 31, 2018.
Our policy is to report income tax penalties and income tax related interest expense as a component of income tax expense. No interest or penalty associated with any unrecognized income tax provision or benefit was accrued, nor was any income tax related interest or penalty recognized during the years ended December 31, 2020, 2019 and 2018.
F - 44
SUN COMMUNITIES, INC.
NOTES TO CONSOLIDATED FINANCIAL STATEMENTS
13.
Earnings Per Share
Earnings per share is computed by dividing net income by the weighted average number of common shares outstanding during the period on a basic and diluted basis. We calculate diluted earnings per share using the more dilutive of the treasury stock method and the two-class method.
Our potentially dilutive securities include our outstanding stock options, our unvested restricted common shares, and our Operating Partnership outstanding common OP units, Series A-1 preferred OP units, Series A-3 preferred OP units, Series C preferred OP units, Series D preferred OP units, Series E preferred OP units, Series F preferred OP units, Series G preferred OP units, Series H preferred OP units, Series I preferred OP units and Aspen preferred OP Units, which, if converted or exercised, may impact dilution.
Diluted earnings per share considers the impact of potentially dilutive securities except when the potential common shares have an antidilutive effect. Our unvested restricted stock common shares contain rights to receive non-forfeitable dividends and participate equally with common stock with respect to dividends issued or declared, and thus, are participating securities, requiring the two-class method of computing earnings per share. The two-class method determines earnings per share by dividing the sum of distributed earnings to common stockholders and undistributed earnings allocated to common stockholders by the weighted average number of shares of common stock outstanding for the period. In calculating the two-class method, undistributed earnings are allocated to both common shares and participating securities based on the weighted average number of shares outstanding during the period. The remaining potential dilutive common shares do not contain rights to dividends and are included in the computation of diluted earnings per share.
Computations of basic and diluted earnings per share were as follows (in thousands, except per share data):
| Year Ended | ||||||||||||||||||||
| December 31, 2020 | December 31, 2019 | December 31, 2018 | ||||||||||||||||||
| Numerator | ||||||||||||||||||||
| Net Income Attributable to Sun Communities, Inc. Common Stockholders | $ |
|
$ |
|
$ |
|
||||||||||||||
| Less: allocation to restricted stock awards |
|
|
|
|||||||||||||||||
| Basic earnings - Net income attributable to common stockholders after allocation to restricted stock awards | $ |
|
$ |
|
$ |
|
||||||||||||||
| Add allocation to restricted stock awards |
|
|
|
|||||||||||||||||
|
Diluted earnings - Net income attributable to common stockholders after allocation to restricted stock awards
(1)
|
$ |
|
$ |
|
$ |
|
||||||||||||||
| Denominator | ||||||||||||||||||||
| Weighted average common shares outstanding |
|
|
|
|||||||||||||||||
| Add: dilutive stock options |
|
|
|
|||||||||||||||||
| Add: dilutive restricted stock |
|
|
|
|||||||||||||||||
|
Diluted weighted average common shares and securities
(1)
|
|
|
|
|||||||||||||||||
| Earnings Per Share Available to Common Stockholders After Allocation | ||||||||||||||||||||
| Basic earnings per share | $ |
|
$ |
|
$ |
|
||||||||||||||
|
Diluted earnings per share
(1)
|
$ |
|
$ |
|
$ |
|
||||||||||||||
(1)
For the year ended December 31, 2020, diluted earnings per share was calculated using the two-class method. The application of this method resulted in a more dilutive earnings per share for the year. Diluted earnings per share for the years ended December 31, 2019 and 2018 were calculated using the treasury stock method as the application of this method resulted in a more dilutive earnings per share for that period.
F - 45
SUN COMMUNITIES, INC.
NOTES TO CONSOLIDATED FINANCIAL STATEMENTS
We have excluded certain securities from the computation of diluted earnings per share because the inclusion of these securities would have been anti-dilutive for the periods presented.
The following table presents the outstanding securities that were excluded from the computation of diluted earnings per share for the years ended December 31, 2020, 2019 and 2018 (amounts in thousands):
| Year Ended | ||||||||||||||||||||
| December 31, 2020 | December 31, 2019 | December 31, 2018 | ||||||||||||||||||
| Common OP units |
|
|
|
|||||||||||||||||
| Series A-4 preferred stock |
|
|
|
|||||||||||||||||
| A-3 preferred OP units |
|
|
|
|||||||||||||||||
| A-1 preferred OP units |
|
|
|
|||||||||||||||||
| A-4 preferred OP units |
|
|
|
|||||||||||||||||
| Aspen preferred OP units |
|
|
|
|||||||||||||||||
| Series C preferred OP units |
|
|
|
|||||||||||||||||
| Series D preferred OP units |
|
|
|
|||||||||||||||||
| Series E preferred OP units |
|
|
|
|||||||||||||||||
| Series F preferred OP units |
|
|
|
|||||||||||||||||
| Series G preferred OP units |
|
|
|
|||||||||||||||||
| Series H preferred OP units |
|
|
|
|||||||||||||||||
| Series I preferred OP units |
|
|
|
|||||||||||||||||
| Total Securities |
|
|
|
|||||||||||||||||
14.
Selected Quarterly Financial Information (Unaudited)
The following is a condensed summary of our unaudited quarterly results for years ended 2020 and 2019 (in thousands, except per share data):
|
2020 Quarters
|
2019 Quarters
|
||||||||||||||||||||||||||||||||||||||||||||||
| March 31, 2020 | June 30, 2020 | September 30, 2020 | December 31, 2020 |
March 31, 2019
|
June 30, 2019
|
September 30, 2019
|
December 31, 2019
|
||||||||||||||||||||||||||||||||||||||||
| Total Revenues | $ |
|
$ |
|
$ |
|
$ |
|
$ |
|
$ |
|
$ |
|
$ |
|
|||||||||||||||||||||||||||||||
| Total Expenses |
|
|
|
|
|
|
|
|
|||||||||||||||||||||||||||||||||||||||
| Income / (Loss) Before Other Items | $ |
|
$ |
|
$ |
|
$ |
(
|
$ |
|
$ |
|
$ |
|
$ |
|
|||||||||||||||||||||||||||||||
| Net Income / (loss) Attributable to Sun Communities, Inc. Common Stockholders | $ |
(
|
$ |
|
$ |
|
$ |
|
$ |
|
$ |
|
$ |
|
$ |
|
|||||||||||||||||||||||||||||||
|
Earnings per share
(1)
|
|||||||||||||||||||||||||||||||||||||||||||||||
| Basic earnings / (loss) per share | $ |
(
|
$ |
|
$ |
|
$ |
|
$ |
|
$ |
|
$ |
|
$ |
|
|||||||||||||||||||||||||||||||
| Diluted earnings / (loss) per share | $ |
(
|
$ |
|
$ |
|
$ |
|
$ |
|
$ |
|
$ |
|
$ |
|
|||||||||||||||||||||||||||||||
(1)
Earnings per share for the year may not equal the sum of the fiscal quarters’ earnings per share due to changes in basic and diluted shares outstanding.
F - 46
SUN COMMUNITIES, INC.
NOTES TO CONSOLIDATED FINANCIAL STATEMENTS
15.
Fair Value of Financial Instruments
Our financial instruments consist primarily of cash, cash equivalents and restricted cash, marketable securities, notes and other receivables, accounts payable
,
and debt. We utilize fair value measurements to record fair value adjustments to certain assets and liabilities and to determine fair value disclosures, pursuant to FASB ASC 820, “Fair Value Measurements and Disclosures.” The following methods and assumptions were used in order to estimate the fair value of each class of financial instruments for which it is practicable to estimate that value:
Marketable Securities
Marketable securities held by us and accounted for under the ASC 321 “
Investment Equity Securities
” are measured at fair value. Any change in fair value is recognized in the Consolidated Statement of Operations in Remeasurement of marketable securities in accordance with ASU 2016-01 “
Financial Instruments - Overall (Subtopic 825-10): Recognition and measurement of financial assets and financial liabilities
.” The fair value is measured by the quoted unadjusted share price which is readily available in active markets (Level 1).
The change in the marketable securities balance is as follows (in thousands):
| Year Ended | ||||||||||||||
| December 31, 2020 | December 31, 2019 | |||||||||||||
| Beginning Balance | $ |
|
$ |
|
||||||||||
| Additional purchase |
|
|
||||||||||||
| Change in fair value measurement |
|
|
||||||||||||
| Foreign currency translation adjustment |
|
|
||||||||||||
| Dividend reinvestment, net of tax |
|
|
||||||||||||
| Ending Balance | $ |
|
$ |
|
||||||||||
Installment Notes Receivable on Manufactured Homes
Installment notes receivable on manufactured homes are recorded at fair value and are measured using model-derived indicative pricing using observable inputs, inclusive of default rates, interest rates and recovery rates (Level 2). Refer to Note 4, “Notes and Other Receivables,” and Note 19, “Recent Accounting Pronouncements,” for additional detail.
Notes Receivable from Real Estate Developers
Notes receivable from real estate developers are recorded at fair market value. We evaluate the loans using valuation models that incorporate significant unobservable inputs (Level 2) such as market interest rates and timing of related cash flows. The carrying values of the notes generally approximate their fair market values either due to the nature of the note and / or the note being secured by underlying collateral and / or personal guarantees.
Long-Term Debt and Lines of Credit
The fair value of long-term debt is based on the estimates of management and on rates currently quoted, rates currently prevailing for comparable loans, and instruments of comparable maturities (Level 2). Refer to Note 8, “Debt and Lines of Credit,” for additional information.
We have variable rates on our credit facilities and the revolving loans under our senior credit facility and the Safe Harbor credit facility. The fair value of the debt with variable rates approximates carrying value as the interest rates of these amounts approximate market rates. The estimated fair value of our indebtedness as of December 31, 2020, approximated its gross carrying value.
Financial Liabilities
We estimate the fair value of our contingent consideration liability based on valuation models using significant unobservable inputs that generally consider discounting of future cash flows using market interest rates and adjusting for non-performance risk over the remaining term of the liability (Level 3).
F - 47
SUN COMMUNITIES, INC.
NOTES TO CONSOLIDATED FINANCIAL STATEMENTS
Other Financial Instruments
The carrying values of cash and cash equivalents, other receivables, and accounts payable approximate their fair market values due to the short-term nature of those instruments. These are classified as Level 1 in the hierarchy.
The table below sets forth our financial assets and liabilities (in thousands) that required disclosure of fair value on a recurring basis as of December 31, 2020.
The table presents the carrying values and fair values of our financial instruments as of December 31, 2020 and December 31, 2019, that were measured using the valuation techniques described above. The table excludes other financial instruments such as cash and cash equivalents, other receivables, and accounts payable as the carrying values associated with these instruments approximate their fair value since their maturities are less than one year.
| Year Ended | ||||||||||||||||||||||||||
| December 31, 2020 | December 31, 2019 | |||||||||||||||||||||||||
| Financial Assets | Carrying Value | Fair Value | Carrying Value | Fair Value | ||||||||||||||||||||||
| Marketable securities | $ |
|
$ |
|
$ |
|
$ |
|
||||||||||||||||||
| Installment notes receivable on manufactured homes, net |
|
|
|
|
||||||||||||||||||||||
| Notes receivable from real estate developers |
|
|
|
|
||||||||||||||||||||||
| Total assets measured at fair value | $ |
|
$ |
|
$ |
|
$ |
|
||||||||||||||||||
| Financial Liabilities | ||||||||||||||||||||||||||
| Debt | $ |
|
$ |
|
$ |
|
$ |
|
||||||||||||||||||
| Lines of credit and other debt |
|
|
|
|
||||||||||||||||||||||
| Other liabilities (contingent consideration) |
|
|
|
|
||||||||||||||||||||||
| Total liabilities measured at fair value | $ |
|
$ |
|
$ |
|
$ |
|
||||||||||||||||||
Although we have determined the estimated fair value amounts using available market information and commonly accepted valuation methodologies, considerable judgment is required in interpreting market data to develop fair value estimates. The fair value estimates are based on information available at December 31, 2020. As such, our estimates of fair value could differ significantly from the actual carrying value.
16.
Commitments and Contingencies
Legal Proceedings
We are involved in various legal proceedings arising in the ordinary course of business. All such proceedings, taken together, are not expected to have a material adverse impact on our results of operations or financial condition.
F - 48
SUN COMMUNITIES, INC.
NOTES TO CONSOLIDATED FINANCIAL STATEMENTS
17.
Leases
We lease land under non-cancelable operating leases at
33
properties expiring at various dates through year 2085. The majority of the leases have terms requiring fixed payments plus additional rents based on a percentage of revenues at those properties. We also have other operating leases, primarily office space and equipment expiring at various dates through 2026.
Lessee accounting
Future minimum lease payments under non-cancellable leases as of the year ended December 31, 2020 where we are the lessee include:
| Maturity of Lease Liabilities (in thousands) | Operating Leases | Finance Leases | Total | |||||||||||||||||
| 2021 | $ |
|
$ |
|
$ |
|
||||||||||||||
| 2022 |
|
|
|
|||||||||||||||||
| 2023 |
|
|
|
|||||||||||||||||
| 2024 |
|
|
|
|||||||||||||||||
| 2025 |
|
|
|
|||||||||||||||||
| Thereafter |
|
|
|
|||||||||||||||||
| Total Lease Payments | $ |
|
$ |
|
$ |
|
||||||||||||||
| Less: Imputed interest |
(
|
(
|
(
|
|||||||||||||||||
| Present Value of Lease Liabilities | $ |
|
$ |
|
$ |
|
||||||||||||||
Right-of-use (
ROU) assets and lease liabilities for finance and operating leases as included in our Consolidated Balance Sheets are as follows (in thousands):
| Description | Financial Statement Classification | December 31, 2020 | December 31, 2019 | |||||||||||||||||
| Lease Assets | ||||||||||||||||||||
| ROU asset obtained in exchange for new finance lease liabilities | Investment property, net | $ |
|
$ |
|
|||||||||||||||
| ROU asset obtained in exchange for new operating lease liabilities | Other assets, net | $ |
|
$ |
|
|||||||||||||||
| ROU asset obtained relative to below market operating lease | Other assets, net | $ |
|
$ |
|
|||||||||||||||
| Lease Liabilities | ||||||||||||||||||||
| Finance lease liabilities | Other liabilities | $ |
|
$ |
|
|||||||||||||||
| Operating lease liabilities | Other liabilities | $ |
|
$ |
|
|||||||||||||||
Lease expense for finance and operating leases as included in our Consolidated Statements of Operations are as follows (in thousands):
| Year Ended | ||||||||||||||||||||
| Description | Financial Statement Classification | December 31, 2020 | December 31, 2019 | |||||||||||||||||
| Finance Lease Expense | ||||||||||||||||||||
| Amortization of ROU assets | Interest expense | $ |
|
$ |
|
|||||||||||||||
| Interest on lease liabilities | Interest expense |
|
|
|||||||||||||||||
| Operating lease cost | General and administrative expense, Property operating and maintenance |
|
|
|||||||||||||||||
| Variable lease cost | Property operating and maintenance |
|
|
|||||||||||||||||
| Total Lease Expense | $ |
|
$ |
|
||||||||||||||||
| Year Ended | ||||||||||||||
| Description | Financial Statement Classification | December 31, 2018 | ||||||||||||
| Capital Lease Expense | ||||||||||||||
| Amortization of lease | Interest expense | $ |
|
|||||||||||
| Interest on lease liabilities | Interest expense |
|
||||||||||||
| Operating lease expense | General and administrative expense, Property operating and maintenance |
|
||||||||||||
| Below market ground lease amortization expense | Property operating and maintenance |
|
||||||||||||
| Total Lease Expense | $ |
|
||||||||||||
F - 49
SUN COMMUNITIES, INC.
NOTES TO CONSOLIDATED FINANCIAL STATEMENTS
Lease term, discount rates and additional information for finance and operating leases are as follows:
| Lease Term and Discount Rate | December 31, 2020 | |||||||
| Weighted-average Remaining Lease Terms (years) | ||||||||
| Finance lease |
|
|||||||
| Operating lease |
|
|||||||
| Weighted-average Discount Rate | ||||||||
| Finance lease |
|
% | ||||||
| Operating lease |
|
% | ||||||
|
|
Year Ended | |||||||||||||||||||
| Other Information (in thousands) | December 31, 2020 | December 31, 2019 | December 31, 2018 | |||||||||||||||||
| Cash Paid For Amounts Included In The Measurement of Lease Liabilities | ||||||||||||||||||||
| Operating cash flow from operating leases | $ |
|
$ |
|
$ |
|
||||||||||||||
| Financing cash flow from finance leases |
|
|
|
|||||||||||||||||
| Total Cash Paid On Lease Liabilities | $ |
|
$ |
|
$ |
|
||||||||||||||
Lessor Accounting
We are not the lessor for any finance leases at our MH, RV or marina properties as of December 31, 2020.
Over
95
percent of our operating leases at our MH and RV properties, where we are the lessor are either month to month or for a time period not to exceed one year. As of the reporting date, future minimum lease payments would not exceed 12 months.
Future minimum lease payments under non-cancellable leases at our marinas at year ended December 31, 2020 where we are the lessor include:
| Maturity of Lease Liabilities (in thousands) | Operating Leases | |||||||
| 2021 | $ |
|
||||||
| 2022 |
|
|||||||
| 2023 |
|
|||||||
| 2024 |
|
|||||||
| 2025 |
|
|||||||
| Thereafter |
|
|||||||
| Total Undiscounted Cash Flows | $ |
|
||||||
The components of lease income were as follows (in thousands):
| Year Ended | ||||||||
| Description | December 31, 2020 | |||||||
| Operating Leases | ||||||||
| Lease income related to lease payments | $ |
|
||||||
| Variable Lease Income | $ | 423 | ||||||
F - 50
SUN COMMUNITIES, INC.
NOTES TO CONSOLIDATED FINANCIAL STATEMENTS
18.
Related Party Transactions
Lease of Executive Offices -
Gary A. Shiffman, together with certain of his family members, indirectly owns an equity interest of approximately
28.1
percent in American Center LLC, the entity from which we lease office space for our principal executive offices. Each of Brian M. Hermelin, Ronald A. Klein and Arthur A. Weiss indirectly
owns less than
one
percent interest in American Center LLC. Mr. Shiffman is our Chief Executive Officer and Chairman of the Board. Each of Mr. Hermelin, Mr. Klein and Mr. Weiss is a director of the Company. Under this agreement, we lease approximately
103,100
rentable square feet of permanent space. We subsequently entered into an additional office space operating lease which commenced in January 2020. Under this agreement, we lease approximately
20,087
rentable square feet of permanent space. The initial term of each lease is until October 31, 2026 and the average gross base rent is $
18.95
per square foot until October 31, 2020 with graduated rent increases thereafter. As of December 31, 2020, the average gross base rent was $
19.45
per square foot. Each of Mr. Shiffman, Mr. Hermelin, Mr. Klein and Mr. Weiss may have a conflict of interest with respect to his obligations as our officer and / or director and his ownership interest in American Center LLC.
Use of Airplane -
Gary A. Shiffman is the beneficial owner of an airplane that we use from time to time for business purposes. During the years ended December 31, 2020 and 2019, we paid $
0.3
million and $
0.4
million for the use of the airplane, respectively. Mr. Shiffman may have a conflict of interest with respect to his obligations as our officer and director and his ownership interest in the airplane.
Telephone Services -
Brian M. Hermelin is a principal and a beneficial owner of an entity that installs and maintains emergency telephone systems at our properties. During the years ended December 31, 2020 and 2019, we paid $
0.2
million for these services, respectively. Mr. Hermelin may have a conflict of interest with respect to his obligations as our director and his position with and ownership interest in the provider of these services.
Legal Counsel -
During 2018-2020, Jaffe, Raitt, Heuer, & Weiss, Professional Corporation acted as our general counsel and represented us in various matters. Arthur A. Weiss is the Chairman of the Board of Directors and a shareholder of such firm. We incurred legal fees and expenses owed to Jaffe, Raitt, Heuer, & Weiss of approximately $
13.3
million, $
11.1
million and $
7.1
million in the years ended December 31, 2020, 2019 and 2018, respectively.
Tax Consequences Upon Sale of Properties -
Gary A. Shiffman holds limited partnership interests in the Operating Partnership which were received in connection with the contribution of properties from partnerships previously affiliated with him. Prior to any redemption of these limited partnership interests for our common stock, Mr. Shiffman will have tax consequences different from those on us and our public stockholders upon the sale of any of these partnerships. Therefore, we and Mr. Shiffman may have different objectives regarding the appropriate pricing and timing of any sale of those properties.
F - 51
SUN COMMUNITIES, INC.
NOTES TO CONSOLIDATED FINANCIAL STATEMENTS
19.
Recent Accounting Pronouncements
Recent Accounting Pronouncements - Adopted
In April 2020, the FASB issued a Staff Question-and-Answer (Q&A) to clarify whether lease concessions related to the effects of COVID-19 require the application of lease modification guidance under ASC Topic 842 “
Leases
.” The Q&A allows companies not to apply the lease modification guidance to rent concessions that result in deferred rent where the total cash flows required by the modified lease agreement are materially the same as the cash flows required under the original lease and the change to the lease did not result in a substantial increase to the rights of the lessor or the obligations of the lessee. We adopted the guidance during the three months ended June 30, 2020 for eligible residential lease concessions. The lease concessions that meet the criteria of the Q&A are treated as if they were part of the enforceable rights and obligations of the parties under the existing lease contract. The amount of rent concessions subject to the Q&A was $
4.4
million.
In June 2016, the FASB issued ASU 2016-13 “
Financial Instruments - Credit Losses (Topic 326): Measurement of Credit Losses on Financial Instruments
”
(
“
CECL
”
)
. This update replaces the incurred loss impairment methodology in previous GAAP with a methodology that reflects expected credit losses and requires consideration of a broader range of reasonable and supportable information to inform credit loss estimates. The amendments in this update are effective for fiscal years beginning after December 15, 2019, including interim periods within those fiscal years. As of January 1, 2020, we adopted the fair value option for our installment notes receivable on manufactured homes and the notes receivable within the GTSC joint venture which resulted in fair value adjustments of $
1.6
million and $
0.3
million, respectively. We also adopted the fair value option on notes receivable from real estate developers. The carrying values of those notes generally approximate their fair market values either due to the short-term nature of the loan and / or the note being secured by underlying collateral and / or personal guarantees. The adoption of CECL had an immaterial impact on our remaining financial instruments within the CECL scope. Refer to Note 4, “Notes and Other Receivables,” and Note 6, “Investments in Nonconsolidated Affiliates,” for additional detail.
In August 2018, the FASB issued ASU 2018-15, “
Intangibles—Goodwill and Other—Internal-Use Software (Subtopic 350-40)- Customer’s Accounting for Implementation Costs Incurred in a Cloud Computing Arrangement that Is a Service Contract”—
The amendments in this update align requirements for capitalizing implementation costs in a hosting arrangement as a service contract with internally developed software, and expense capitalized costs of the hosting arrangement over the term of the arrangement. Current GAAP does not specifically address the accounting for implementation costs of a hosting arrangement that is a service contract. Amendments in this update improve current GAAP as they clarify and align the accounting for implementation costs for hosting arrangements, regardless of whether they convey a license to the hosted software. We adopted this guidance as of January 1, 2020. The adoption of this ASU did not have a material impact on our financial statements.
Recent Accounting Pronouncements - Not Yet Adopted
In March 2020, the FASB issued ASU No. 2020-04 “
Reference Rate Reform” (Topic 848) - Facilitation of the Effects of Reference Rate Reform on Financial Reporting
,
which provides optional guidance for accounting for contracts, hedging relationships, and other transactions affected by the reference rate reform, if certain criteria are met. The provisions of this standard are available for election through December 31, 2022. We are currently evaluating the impact that ASU 2020-04 may have on our Consolidated Financial Statements and related disclosures.
In August 2020, the FASB issued ASU 2020-06,
Debt - “Debt with Conversion and Other Options” (Subtopic 470- 20) and “Derivatives and Hedging - Contracts in Entity’s Own Equity
”
(Subtopic 815-40):
“
Accounting for Convertible Instruments and Contracts in an Entity’s Own Equit
y” (“ASU 2020-06”), which simplifies the accounting for certain financial instruments with characteristics of liabilities and equity. This ASU (1) simplifies the accounting for convertible debt instruments and convertible preferred stock by removing the existing guidance in ASC 470-20,
“
Debt: Debt with Conversion and Other Options
,” which requires entities to account for beneficial conversion features and cash conversion features in equity, separately from the host convertible debt or preferred stock; (2) revises the scope exception from derivative accounting in ASC 815-40 for freestanding financial instruments and embedded features that are both indexed to the issuer’s own stock and classified in stockholders’ equity, by removing certain criteria required for equity classification; and (3) revises the guidance in ASC 260, “
Earnings Per Share
,” to require entities to calculate diluted earnings per share (EPS) for convertible instruments by using the if-converted method. In addition, entities must presume share settlement for purposes of calculating diluted EPS when an instrument may be settled in cash or shares. ASU 2020-06 is effective for fiscal years beginning after December 15, 2021, including interim periods within those fiscal years. Early adoption is permitted, but no earlier than fiscal years beginning after December 15, 2020. We are currently evaluating the impact that ASU 2020-06 may have on our Consolidated Financial Statements and related disclosures.
F - 52
SUN COMMUNITIES, INC.
NOTES TO CONSOLIDATED FINANCIAL STATEMENTS
20
. Subsequent Events
Acquisition
Subsequent to the year ended December 31, 2020, we acquired a RV resort in Henderson, NY with
294
developed sites for a total purchase price of $
15.0
million.
Subsequent to the year ended December 31, 2020, we acquired a RV resort in Garden City, UT with
177
developed sites for a total purchase price of $
9.0
million.
Subsequent to the year ended December 31, 2020, we acquired an MH community for re-development in Bushnell, FL with
25
developed sites for a total purchase price of $
1.3
million.
Subsequent to the year ended December 31, 2020, we acquired
two
marinas in Islamorado, FL with
251
wet slips and dry storage spaces for a total purchase price of $
18.0
million.
Reportable Segments
Effective January 1, 2021, we transitioned from a two-segment to a three-segment structure as a result of the recent acquisition of Safe Harbor and its internal organization. The new structure will reflect how the chief operating decision maker manages the business, makes operating decisions, allocates resources and evaluates operating performance. This structure will increase management efficiency and better align our operations with our strategic initiatives. The reportable segments are Manufactured Homes, RV Resorts and Safe Harbor Marinas. Beginning with the quarter ending March 31, 2021, our segment results will reflect the new segment structure for all periods presented.
We have evaluated our Consolidated Financial Statements for subsequent events through the date that this Form 10-K was issued.
F - 53
SUN COMMUNITIES, INC.
REAL ESTATE AND ACCUMULATED DEPRECIATION, SCHEDULE III
DECEMBER 31, 2020
(amounts in thousands)
The following tables set forth real estate and accumulated depreciation relating to our MH and RV properties.
| Encumbrance | Initial Cost to Company | Costs Capitalized Subsequent to Acquisition (Improvements) |
Gross Amount Carried at
December 31, 2020
|
|||||||||||||||||||||||||||||||||||||||||||||||||||||||||||||||||||||||||||||
| Property Name | Location | Group | Amount | Land | Depreciable Assets | Land | Depreciable Assets | Land | Depreciable Assets | Total | Accumulated Depreciation | Date | Acquired (A) or Constructed (C) | |||||||||||||||||||||||||||||||||||||||||||||||||||||||||||||||||||
| 49’er Village RV Resort | Plymouth, CA | C | $ |
|
$ |
|
$ |
|
$ |
|
$ |
|
$ |
|
$ |
|
$ |
|
$ |
(
|
2017 | (A) | ||||||||||||||||||||||||||||||||||||||||||||||||||||||||||
| Academy / West Point | Canton, MI | B |
|
|
|
|
|
|
|
|
(
|
2000 | (A) | |||||||||||||||||||||||||||||||||||||||||||||||||||||||||||||||||||
| Adirondack Gateway RV Resort & Campground | Gansevoort, NY | — |
|
|
|
|
|
|
|
|
(
|
2016 | (A) | |||||||||||||||||||||||||||||||||||||||||||||||||||||||||||||||||||
| Allendale Meadows Mobile Village | Allendale, MI | B |
|
|
|
|
|
|
|
|
(
|
1996 | (A) | |||||||||||||||||||||||||||||||||||||||||||||||||||||||||||||||||||
| Alpine Meadows Mobile Village | Grand Rapids, MI | A |
|
|
|
|
|
|
|
|
(
|
1996 | (A&C) | |||||||||||||||||||||||||||||||||||||||||||||||||||||||||||||||||||
| Alta Laguna | Rancho Cucamonga, CA | D |
|
|
|
|
|
|
|
|
(
|
2016 | (A) | |||||||||||||||||||||||||||||||||||||||||||||||||||||||||||||||||||
| Apple Carr Village | Muskegon, MI | — |
|
|
|
|
|
|
|
|
(
|
2011 | (A&C) | |||||||||||||||||||||||||||||||||||||||||||||||||||||||||||||||||||
| Apple Creek | Amelia, OH | B |
|
|
|
|
|
|
|
|
(
|
1999 | (A) | |||||||||||||||||||||||||||||||||||||||||||||||||||||||||||||||||||
| Arbor Terrace RV Park | Bradenton, FL | B |
|
|
|
|
|
|
|
|
(
|
1996 | (A) | |||||||||||||||||||||||||||||||||||||||||||||||||||||||||||||||||||
| Arbor Woods | Ypsilanti, MI | — |
|
|
|
|
|
|
|
|
(
|
2017 | (A) | |||||||||||||||||||||||||||||||||||||||||||||||||||||||||||||||||||
| Archview RV Resort & Campground | Moab, UT | — |
|
|
|
|
|
|
|
|
(
|
2018 | (A) | |||||||||||||||||||||||||||||||||||||||||||||||||||||||||||||||||||
| Ariana Village | Lakeland, FL | D |
|
|
|
|
|
|
|
|
(
|
1994 | (A) | |||||||||||||||||||||||||||||||||||||||||||||||||||||||||||||||||||
| Arran Lake RV Resort & Campground | Allenford, ON | — |
|
|
|
(
|
(1)
|
|
|
|
|
(
|
2016 | (A) | ||||||||||||||||||||||||||||||||||||||||||||||||||||||||||||||||||
|
Augusta Village
(4)
|
Augusta, ME | — |
|
|
|
|
|
|
|
|
(
|
2020 | (A) | |||||||||||||||||||||||||||||||||||||||||||||||||||||||||||||||||||
| Austin Lone Star RV Resort | Austin, TX | C |
|
|
|
|
|
|
|
|
(
|
2016 | (A) | |||||||||||||||||||||||||||||||||||||||||||||||||||||||||||||||||||
| Autumn Ridge | Ankeny, IA | D |
|
|
|
(
|
(3)
|
|
|
|
|
(
|
1996 | (A) | ||||||||||||||||||||||||||||||||||||||||||||||||||||||||||||||||||
| Bahia Vista Estates | Sarasota, FL | — |
|
|
|
|
|
|
|
|
(
|
2016 | (A) | |||||||||||||||||||||||||||||||||||||||||||||||||||||||||||||||||||
| Baker Acres RV Resort | Zephyrhills, FL | E |
|
|
|
|
|
|
|
|
(
|
2016 | (A) | |||||||||||||||||||||||||||||||||||||||||||||||||||||||||||||||||||
|
Beechwood
|
Killingworth, CT | C |
|
|
|
|
|
|
|
|
(
|
2019 | (A) | |||||||||||||||||||||||||||||||||||||||||||||||||||||||||||||||||||
| Bell Crossing | Clarksville, TN | B |
|
|
|
(
|
(3)
|
|
|
|
|
(
|
1999 | (A&C) | ||||||||||||||||||||||||||||||||||||||||||||||||||||||||||||||||||
| Big Timber Lake RV Camping Resort | Cape May Court House, NJ | A |
|
|
|
|
|
|
|
|
(
|
2013 | (A) | |||||||||||||||||||||||||||||||||||||||||||||||||||||||||||||||||||
| Big Tree RV Resort | Arcadia, FL | — |
|
|
|
|
|
|
|
|
(
|
2016 | (A) | |||||||||||||||||||||||||||||||||||||||||||||||||||||||||||||||||||
|
Birch Hill Estates
(4)
|
Bangor, ME | — |
|
|
|
|
|
|
|
|
(
|
2020 | (A) | |||||||||||||||||||||||||||||||||||||||||||||||||||||||||||||||||||
| Blazing Star | San Antonio, TX | C |
|
|
|
|
|
|
|
|
(
|
2012 | (A) | |||||||||||||||||||||||||||||||||||||||||||||||||||||||||||||||||||
| Blue Heron Pines | Punta Gorda, FL | E |
|
|
|
|
|
|
|
|
(
|
2015 | (A&C) | |||||||||||||||||||||||||||||||||||||||||||||||||||||||||||||||||||
| Blue Jay MH & RV Resort | Dade City, FL | — |
|
|
|
|
|
|
|
|
(
|
2016 | (A) | |||||||||||||||||||||||||||||||||||||||||||||||||||||||||||||||||||
|
Blue Star
(8)
|
Apache Junction, AZ | E |
|
|
|
(
|
(8)
|
(
|
|
|
|
(
|
2014 | (A) | ||||||||||||||||||||||||||||||||||||||||||||||||||||||||||||||||||
| Blueberry Hill | Bushnell, FL | B |
|
|
|
|
|
|
|
|
(
|
2012 | (A) | |||||||||||||||||||||||||||||||||||||||||||||||||||||||||||||||||||
| Boulder Ridge | Pflugerville, TX | B |
|
|
|
|
|
|
|
|
(
|
1998 | (C) | |||||||||||||||||||||||||||||||||||||||||||||||||||||||||||||||||||
F - 54
SUN COMMUNITIES, INC.
REAL ESTATE AND ACCUMULATED DEPRECIATION, SCHEDULE III
DECEMBER 31, 2020
(amounts in thousands)
| Encumbrance | Initial Cost to Company | Costs Capitalized Subsequent to Acquisition (Improvements) |
Gross Amount Carried at
December 31, 2020
|
|||||||||||||||||||||||||||||||||||||||||||||||||||||||||||||||||||||||||||||
| Property Name | Location | Group | Amount | Land | Depreciable Assets | Land | Depreciable Assets | Land | Depreciable Assets | Total | Accumulated Depreciation | Date | Acquired (A) or Constructed (C) | |||||||||||||||||||||||||||||||||||||||||||||||||||||||||||||||||||
| Branch Creek Estates | Austin, TX | D |
|
|
|
|
|
|
|
|
(
|
1995 | (A&C) | |||||||||||||||||||||||||||||||||||||||||||||||||||||||||||||||||||
| Brentwood Estates | Hudson, FL | E |
|
|
|
|
|
|
|
|
(
|
2015 | (A) | |||||||||||||||||||||||||||||||||||||||||||||||||||||||||||||||||||
| Brentwood Mobile Village | Kentwood, MI | E |
|
|
|
|
|
|
|
|
(
|
1996 | (A) | |||||||||||||||||||||||||||||||||||||||||||||||||||||||||||||||||||
| Brentwood West | Mesa, AZ | D |
|
|
|
|
|
|
|
|
(
|
2014 | (A) | |||||||||||||||||||||||||||||||||||||||||||||||||||||||||||||||||||
| Broadview Estates | Davison, MI | A |
|
|
|
|
|
|
|
|
(
|
1996 | (A&C) | |||||||||||||||||||||||||||||||||||||||||||||||||||||||||||||||||||
| Brook Ridge | Hooksett, NH | C |
|
|
|
|
|
|
|
|
(
|
2019 | (A) | |||||||||||||||||||||||||||||||||||||||||||||||||||||||||||||||||||
| Brookside Mobile Home Village | Goshen, IN | — |
|
|
|
|
|
|
|
|
(
|
1985 | (A&C) | |||||||||||||||||||||||||||||||||||||||||||||||||||||||||||||||||||
| Brookside Village | Kentwood, MI | D |
|
|
|
|
|
|
|
|
(
|
2011 | (A) | |||||||||||||||||||||||||||||||||||||||||||||||||||||||||||||||||||
|
Buena Vista
|
Buckeye, AZ | — |
|
|
|
|
|
|
|
|
(
|
2019 | (A) | |||||||||||||||||||||||||||||||||||||||||||||||||||||||||||||||||||
| Buttonwood Bay MH & RV Resort | Sebring, FL | D |
|
|
|
|
|
|
|
|
(
|
2001 | (A) | |||||||||||||||||||||||||||||||||||||||||||||||||||||||||||||||||||
| Byron Center Mobile Village | Byron Center, MI | A |
|
|
|
|
|
|
|
|
(
|
1996 | (A) | |||||||||||||||||||||||||||||||||||||||||||||||||||||||||||||||||||
| Caliente Sands | Cathedral City, CA | — |
|
|
|
|
|
|
|
|
(
|
2017 | (A) | |||||||||||||||||||||||||||||||||||||||||||||||||||||||||||||||||||
| Camelot Villa | Macomb, MI | A |
|
|
|
|
|
|
|
|
(
|
2013 | (A) | |||||||||||||||||||||||||||||||||||||||||||||||||||||||||||||||||||
| Campers Haven RV Resort | Dennisport, MA | D |
|
|
|
|
|
|
|
|
(
|
2016 | (A) | |||||||||||||||||||||||||||||||||||||||||||||||||||||||||||||||||||
| Candlelight Manor | South Daytona, FL | — |
|
|
|
|
|
|
|
|
(
|
2016 | (A) | |||||||||||||||||||||||||||||||||||||||||||||||||||||||||||||||||||
| Canyonlands RV Resort & Campground | Moab, UT | — |
|
|
|
|
|
|
|
|
(
|
2018 | (A) | |||||||||||||||||||||||||||||||||||||||||||||||||||||||||||||||||||
|
Cape Cod RV Resort
(4)
|
East Falmouth, MA | — |
|
|
|
|
|
|
|
|
(
|
2020 | (A) | |||||||||||||||||||||||||||||||||||||||||||||||||||||||||||||||||||
| Cape May Crossing | Cape May, NJ | — |
|
|
|
|
|
|
|
|
(
|
2016 | (A) | |||||||||||||||||||||||||||||||||||||||||||||||||||||||||||||||||||
| Cape May KOA | Cape May, NJ | C |
|
|
|
|
|
|
|
|
(
|
2013 | (A) | |||||||||||||||||||||||||||||||||||||||||||||||||||||||||||||||||||
| Carolina Pines RV Resort | Longs, SC | — |
|
|
|
|
|
|
|
|
(
|
2017 | (A&C) | |||||||||||||||||||||||||||||||||||||||||||||||||||||||||||||||||||
| Carriage Cove | Sanford, FL | E |
|
|
|
|
|
|
|
|
(
|
2014 | (A) | |||||||||||||||||||||||||||||||||||||||||||||||||||||||||||||||||||
| Carrington Pointe | Ft. Wayne, IN | B |
|
|
|
(
|
(3)
|
|
|
|
|
(
|
1997 | (A&C) | ||||||||||||||||||||||||||||||||||||||||||||||||||||||||||||||||||
| Castaways RV Resort & Campground | Berlin, MD | A |
|
|
|
|
|
|
|
|
(
|
2014 | (A&C) | |||||||||||||||||||||||||||||||||||||||||||||||||||||||||||||||||||
| Cava Robles RV Resort | Paso Robles, CA | — |
|
|
|
|
|
|
|
|
(
|
2014 | (C) | |||||||||||||||||||||||||||||||||||||||||||||||||||||||||||||||||||
| Cave Creek | Evans, CO | B |
|
|
|
|
|
|
|
|
(
|
2004 | (C) | |||||||||||||||||||||||||||||||||||||||||||||||||||||||||||||||||||
|
Cedar Haven
(4)
|
Holden, ME | — |
|
|
|
|
|
|
|
|
(
|
2020 | (A) | |||||||||||||||||||||||||||||||||||||||||||||||||||||||||||||||||||
| Cedar Springs | Southington, CT | C |
|
|
|
|
|
|
|
|
(
|
2019 | (A) | |||||||||||||||||||||||||||||||||||||||||||||||||||||||||||||||||||
| Central Park MH & RV Resort | Haines City, FL | C |
|
|
|
|
|
|
|
|
(
|
2016 | (A) | |||||||||||||||||||||||||||||||||||||||||||||||||||||||||||||||||||
| Cherrywood | Clinton, NY | C |
|
|
|
(
|
(3)
|
|
|
|
|
(
|
2019 | (A) | ||||||||||||||||||||||||||||||||||||||||||||||||||||||||||||||||||
|
Chincoteague Island KOA RV Resort
(2)
|
Chincoteague, VA | — |
|
|
|
|
|
|
|
|
(
|
2019 | (A) | |||||||||||||||||||||||||||||||||||||||||||||||||||||||||||||||||||
F - 55
SUN COMMUNITIES, INC.
REAL ESTATE AND ACCUMULATED DEPRECIATION, SCHEDULE III
DECEMBER 31, 2020
(amounts in thousands)
| Encumbrance | Initial Cost to Company | Costs Capitalized Subsequent to Acquisition (Improvements) |
Gross Amount Carried at
December 31, 2020
|
|||||||||||||||||||||||||||||||||||||||||||||||||||||||||||||||||||||||||||||
| Property Name | Location | Group | Amount | Land | Depreciable Assets | Land | Depreciable Assets | Land | Depreciable Assets | Total | Accumulated Depreciation | Date | Acquired (A) or Constructed (C) | |||||||||||||||||||||||||||||||||||||||||||||||||||||||||||||||||||
| Chisholm Point Estates | Pflugerville, TX | D |
|
|
|
|
|
|
|
|
(
|
1995 | (A&C) | |||||||||||||||||||||||||||||||||||||||||||||||||||||||||||||||||||
|
Chula Vista RV Resort
(2)
|
Chula Vista, CA | — |
|
|
|
|
|
|
|
|
(
|
2019 | (A&C) | |||||||||||||||||||||||||||||||||||||||||||||||||||||||||||||||||||
| Cider Mill Crossings | Fenton, MI | C |
|
|
|
|
|
|
|
|
(
|
2011 | (A&C) | |||||||||||||||||||||||||||||||||||||||||||||||||||||||||||||||||||
| Cider Mill Village | Middleville, MI | A |
|
|
|
|
|
|
|
|
(
|
2011 | (A) | |||||||||||||||||||||||||||||||||||||||||||||||||||||||||||||||||||
| Citrus Hill RV Resort | Dade City, FL | C |
|
|
|
|
|
|
|
|
(
|
2016 | (A) | |||||||||||||||||||||||||||||||||||||||||||||||||||||||||||||||||||
| Clear Water Mobile Village | South Bend, IN | B |
|
|
|
|
|
|
|
|
(
|
1986 | (A) | |||||||||||||||||||||||||||||||||||||||||||||||||||||||||||||||||||
| Club Naples | Naples, FL | C |
|
|
|
|
|
|
|
|
(
|
2011 | (A) | |||||||||||||||||||||||||||||||||||||||||||||||||||||||||||||||||||
| Club Wildwood | Hudson, FL | E |
|
|
|
|
|
|
|
|
(
|
2016 | (A) | |||||||||||||||||||||||||||||||||||||||||||||||||||||||||||||||||||
|
Coastal Estates
(9)
|
Hampstead, NC | C |
|
|
|
|
|
|
|
|
(
|
2019 | (A) | |||||||||||||||||||||||||||||||||||||||||||||||||||||||||||||||||||
| Cobus Green Mobile Home Park | Osceola, IN | A |
|
|
|
|
|
|
|
|
(
|
1993 | (A) | |||||||||||||||||||||||||||||||||||||||||||||||||||||||||||||||||||
| Colony in the Wood | Port Orange, FL | — |
|
|
|
|
|
|
|
|
(
|
2017 | (A&C) | |||||||||||||||||||||||||||||||||||||||||||||||||||||||||||||||||||
| Comal Farms | New Braunfels, TX | C |
|
|
|
|
|
|
|
|
(
|
2000 | (A&C) | |||||||||||||||||||||||||||||||||||||||||||||||||||||||||||||||||||
| Compass RV Resort | St. Augustine, FL | — |
|
|
|
|
|
|
|
|
(
|
2018 | (A) | |||||||||||||||||||||||||||||||||||||||||||||||||||||||||||||||||||
|
Costa Vista
(2)
|
San Diego, CA | — |
|
|
|
|
|
|
|
|
(
|
2019 | (A) | |||||||||||||||||||||||||||||||||||||||||||||||||||||||||||||||||||
| Country Acres Mobile Village | Cadillac, MI | A |
|
|
|
|
|
|
|
|
(
|
1996 | (A) | |||||||||||||||||||||||||||||||||||||||||||||||||||||||||||||||||||
| Country Hills Village | Hudsonville, MI | A |
|
|
|
|
|
|
|
|
(
|
2011 | (A) | |||||||||||||||||||||||||||||||||||||||||||||||||||||||||||||||||||
|
Country Lakes
|
Little River, SC | C |
|
|
|
|
|
|
|
|
(
|
2019 | (A) | |||||||||||||||||||||||||||||||||||||||||||||||||||||||||||||||||||
| Country Meadows Mobile Village | Flat Rock, MI | B |
|
|
|
|
|
|
|
|
(
|
1994 | (A&C) | |||||||||||||||||||||||||||||||||||||||||||||||||||||||||||||||||||
| Country Meadows Village | Caledonia, MI | C |
|
|
|
|
|
|
|
|
(
|
2011 | (A&C) | |||||||||||||||||||||||||||||||||||||||||||||||||||||||||||||||||||
| Country Squire MH & RV Resort | Paisley, FL | — |
|
|
|
|
|
|
|
|
(
|
2016 | (A) | |||||||||||||||||||||||||||||||||||||||||||||||||||||||||||||||||||
|
Country Village Estates
|
Oregon City, OR | — |
|
|
|
|
|
|
|
|
(
|
2019 | (A) | |||||||||||||||||||||||||||||||||||||||||||||||||||||||||||||||||||
| Countryside Estates | Mckean, PA | E |
|
|
|
|
|
|
|
|
(
|
2014 | (A) | |||||||||||||||||||||||||||||||||||||||||||||||||||||||||||||||||||
| Countryside Village of Atlanta | Lawrenceville, GA | C |
|
|
|
|
|
|
|
|
(
|
2004 | (A&C) | |||||||||||||||||||||||||||||||||||||||||||||||||||||||||||||||||||
| Countryside Village of Gwinnett | Buford, GA | B |
|
|
|
|
|
|
|
|
(
|
2004 | (A) | |||||||||||||||||||||||||||||||||||||||||||||||||||||||||||||||||||
| Countryside Village of Lake Lanier | Buford, GA | B |
|
|
|
|
|
|
|
|
(
|
2004 | (A) | |||||||||||||||||||||||||||||||||||||||||||||||||||||||||||||||||||
| Craigleith RV Resort & Campground | Clarksburg, ON | — |
|
|
|
(
|
(1)
|
|
|
|
|
(
|
2016 | (A) | ||||||||||||||||||||||||||||||||||||||||||||||||||||||||||||||||||
|
Creeks Crossing
(5)
|
Uhland, TX | — |
|
|
|
|
|
|
|
|
|
2019 | (C) | |||||||||||||||||||||||||||||||||||||||||||||||||||||||||||||||||||
| Creekwood Meadows | Burton, MI | B |
|
|
|
|
|
|
|
|
(
|
1997 | (C) | |||||||||||||||||||||||||||||||||||||||||||||||||||||||||||||||||||
|
Crestwood
|
Concord, NH | C |
|
|
|
|
|
|
|
|
(
|
2019 | (A) | |||||||||||||||||||||||||||||||||||||||||||||||||||||||||||||||||||
|
Crossroads
|
Aiken, SC | C |
|
|
|
|
|
|
|
|
(
|
2019 | (A&C) | |||||||||||||||||||||||||||||||||||||||||||||||||||||||||||||||||||
|
Crown Villa RV Resort
(4)
|
Bend, OR | — |
|
|
|
|
|
|
|
|
(
|
2020 | (A) | |||||||||||||||||||||||||||||||||||||||||||||||||||||||||||||||||||
| Cutler Estates Mobile Village | Grand Rapids, MI | B |
|
|
|
|
|
|
|
|
(
|
1996 | (A) | |||||||||||||||||||||||||||||||||||||||||||||||||||||||||||||||||||
F - 56
SUN COMMUNITIES, INC.
REAL ESTATE AND ACCUMULATED DEPRECIATION, SCHEDULE III
DECEMBER 31, 2020
(amounts in thousands)
| Encumbrance | Initial Cost to Company | Costs Capitalized Subsequent to Acquisition (Improvements) |
Gross Amount Carried at
December 31, 2020
|
|||||||||||||||||||||||||||||||||||||||||||||||||||||||||||||||||||||||||||||
| Property Name | Location | Group | Amount | Land | Depreciable Assets | Land | Depreciable Assets | Land | Depreciable Assets | Total | Accumulated Depreciation | Date | Acquired (A) or Constructed (C) | |||||||||||||||||||||||||||||||||||||||||||||||||||||||||||||||||||
| Cypress Greens | Lake Alfred, FL | E |
|
|
|
|
|
|
|
|
(
|
2015 | (A) | |||||||||||||||||||||||||||||||||||||||||||||||||||||||||||||||||||
| Daytona Beach RV Resort | Port Orange, FL | C |
|
|
|
|
|
|
|
|
(
|
2016 | (A) | |||||||||||||||||||||||||||||||||||||||||||||||||||||||||||||||||||
|
Deep Run
|
Cream Ridge, NJ | C |
|
|
|
|
|
|
|
|
(
|
2019 | (A) | |||||||||||||||||||||||||||||||||||||||||||||||||||||||||||||||||||
| Deer Lake RV Resort & Campground | Huntsville, ON | — |
|
|
|
(
|
(1)
|
|
|
|
|
(
|
2016 | (A) | ||||||||||||||||||||||||||||||||||||||||||||||||||||||||||||||||||
| Deerfield Run | Anderson, IN | — |
|
|
|
|
|
|
|
|
(
|
1999 | (A&C) | |||||||||||||||||||||||||||||||||||||||||||||||||||||||||||||||||||
| Deerwood | Orlando, FL | D |
|
|
|
|
|
|
|
|
(
|
2015 | (A) | |||||||||||||||||||||||||||||||||||||||||||||||||||||||||||||||||||
| Desert Harbor | Apache Junction, AZ | E |
|
|
|
|
|
|
|
|
(
|
2014 | (A) | |||||||||||||||||||||||||||||||||||||||||||||||||||||||||||||||||||
| Driftwood RV Resort & Campground | Clermont, NJ | D |
|
|
|
|
|
|
|
|
(
|
2014 | (A) | |||||||||||||||||||||||||||||||||||||||||||||||||||||||||||||||||||
| Dunedin RV Resort | Dunedin, FL | E |
|
|
|
|
|
|
|
|
(
|
2016 | (A) | |||||||||||||||||||||||||||||||||||||||||||||||||||||||||||||||||||
| Dutton Mill Village | Caledonia, MI | A |
|
|
|
|
|
|
|
|
(
|
2011 | (A) | |||||||||||||||||||||||||||||||||||||||||||||||||||||||||||||||||||
| Eagle Crest | Firestone, CO | D |
|
|
|
|
|
|
|
|
(
|
1998 | (C) | |||||||||||||||||||||||||||||||||||||||||||||||||||||||||||||||||||
| East Fork Crossing | Batavia, OH | C |
|
|
|
|
|
|
|
|
(
|
2000 | (A&C) | |||||||||||||||||||||||||||||||||||||||||||||||||||||||||||||||||||
| East Village Estates | Washington Twp, MI | A |
|
|
|
|
|
|
|
|
(
|
2012 | (A) | |||||||||||||||||||||||||||||||||||||||||||||||||||||||||||||||||||
| Egelcraft | Muskegon, MI | D |
|
|
|
|
|
|
|
|
(
|
2014 | (A) | |||||||||||||||||||||||||||||||||||||||||||||||||||||||||||||||||||
|
El Capitan Canyon
(4)
|
Goleta, CA | — |
|
|
|
|
|
|
|
|
(
|
2020 | (A) | |||||||||||||||||||||||||||||||||||||||||||||||||||||||||||||||||||
| Ellenton Gardens RV Resort | Ellenton, FL | E |
|
|
|
|
|
|
|
|
(
|
2016 | (A) | |||||||||||||||||||||||||||||||||||||||||||||||||||||||||||||||||||
|
Emerald Coast MH & RV Resort
(2)
|
Panama City Beach, FL | D |
|
|
|
|
|
|
|
|
(
|
2017 | (A) | |||||||||||||||||||||||||||||||||||||||||||||||||||||||||||||||||||
| Fairfield Village | Ocala, FL | B |
|
|
|
|
|
|
|
|
(
|
2015 | (A) | |||||||||||||||||||||||||||||||||||||||||||||||||||||||||||||||||||
|
Farmwood Village
|
Dover, NH | C |
|
|
|
|
|
|
|
|
(
|
2019 | (A) | |||||||||||||||||||||||||||||||||||||||||||||||||||||||||||||||||||
| Fisherman’s Cove | Flint Twp, MI | A |
|
|
|
|
|
|
|
|
(
|
1993 | (A) | |||||||||||||||||||||||||||||||||||||||||||||||||||||||||||||||||||
|
Flamingo Lake RV Resort
(4)
|
Jacksonville, FL | — |
|
|
|
|
|
|
|
36551 |
|
(
|
2020 | (A) | ||||||||||||||||||||||||||||||||||||||||||||||||||||||||||||||||||
|
Forest Hill
|
Southington, CT | C |
|
|
|
|
|
|
|
|
(
|
2019 | (A) | |||||||||||||||||||||||||||||||||||||||||||||||||||||||||||||||||||
| Forest Meadows | Philomath, OR | A |
|
|
|
|
|
|
|
|
(
|
1999 | (A) | |||||||||||||||||||||||||||||||||||||||||||||||||||||||||||||||||||
|
Forest Springs
(4)
|
Grass Valley, CA | — |
|
|
|
|
|
|
|
|
(
|
2020 | (A) | |||||||||||||||||||||||||||||||||||||||||||||||||||||||||||||||||||
| Forest View | Homosassa, FL | — |
|
|
|
|
|
|
|
|
(
|
2015 | (A) | |||||||||||||||||||||||||||||||||||||||||||||||||||||||||||||||||||
| Fort Tatham RV Resort & Campground | Sylva, NC | — |
|
|
|
|
|
|
|
|
(
|
2016 | (A) | |||||||||||||||||||||||||||||||||||||||||||||||||||||||||||||||||||
| Fort Whaley RV Resort & Campground | Whaleyville, MD | C |
|
|
|
|
|
|
|
|
(
|
2015 | (A) | |||||||||||||||||||||||||||||||||||||||||||||||||||||||||||||||||||
| Four Seasons | Elkhart, IN | B |
|
|
|
|
|
|
|
|
(
|
2000 | (A) | |||||||||||||||||||||||||||||||||||||||||||||||||||||||||||||||||||
| Frenchtown Villa / Elizabeth Woods | Newport, MI | E |
|
|
|
|
|
|
|
|
(
|
2014 | (A&C) | |||||||||||||||||||||||||||||||||||||||||||||||||||||||||||||||||||
| Friendly Village of La Habra | La Habra, CA | D |
|
|
|
|
|
|
|
|
(
|
2016 | (A) | |||||||||||||||||||||||||||||||||||||||||||||||||||||||||||||||||||
| Friendly Village of Modesto | Modesto, CA | D |
|
|
|
|
|
|
|
|
(
|
2016 | (A) | |||||||||||||||||||||||||||||||||||||||||||||||||||||||||||||||||||
F - 57
SUN COMMUNITIES, INC.
REAL ESTATE AND ACCUMULATED DEPRECIATION, SCHEDULE III
DECEMBER 31, 2020
(amounts in thousands)
| Encumbrance | Initial Cost to Company | Costs Capitalized Subsequent to Acquisition (Improvements) |
Gross Amount Carried at
December 31, 2020
|
|||||||||||||||||||||||||||||||||||||||||||||||||||||||||||||||||||||||||||||
| Property Name | Location | Group | Amount | Land | Depreciable Assets | Land | Depreciable Assets | Land | Depreciable Assets | Total | Accumulated Depreciation | Date | Acquired (A) or Constructed (C) | |||||||||||||||||||||||||||||||||||||||||||||||||||||||||||||||||||
| Friendly Village of Simi | Simi Valley, CA | D |
|
|
|
|
|
|
|
|
(
|
2016 | (A) | |||||||||||||||||||||||||||||||||||||||||||||||||||||||||||||||||||
| Friendly Village of West Covina | West Covina, CA | D |
|
|
|
|
|
|
|
|
(
|
2016 | (A) | |||||||||||||||||||||||||||||||||||||||||||||||||||||||||||||||||||
| Frontier Town RV Resort & Campground | Berlin, MD | C |
|
|
|
|
|
|
|
|
(
|
2015 | (A) | |||||||||||||||||||||||||||||||||||||||||||||||||||||||||||||||||||
|
Gig Harbor RV Resort
(4)
|
Gig Harbor, WA | — |
|
|
|
|
|
|
|
|
(
|
2020 | (A) | |||||||||||||||||||||||||||||||||||||||||||||||||||||||||||||||||||
|
Glen Ellis Family Campground
|
Glen, NH | D |
|
|
|
|
|
|
|
|
(
|
2019 | (A) | |||||||||||||||||||||||||||||||||||||||||||||||||||||||||||||||||||
| Glen Haven RV Resort | Zephyrhills, FL | E |
|
|
|
|
|
|
|
|
(
|
2016 | (A) | |||||||||||||||||||||||||||||||||||||||||||||||||||||||||||||||||||
| Glen Laurel | Concord, NC | C |
|
|
|
|
|
|
|
|
(
|
2001 | (A&C) | |||||||||||||||||||||||||||||||||||||||||||||||||||||||||||||||||||
| Gold Coaster MH & RV Resort | Homestead, FL | A |
|
|
|
|
|
|
|
|
(
|
1997 | (A) | |||||||||||||||||||||||||||||||||||||||||||||||||||||||||||||||||||
| Grand Bay | Dunedin, FL | — |
|
|
|
(
|
(3)
|
|
|
|
|
(
|
2016 | (A) | ||||||||||||||||||||||||||||||||||||||||||||||||||||||||||||||||||
| Grand Lakes RV Resort | Citra, FL | C |
|
|
|
(
|
(3)
|
|
|
|
|
(
|
2012 | (A) | ||||||||||||||||||||||||||||||||||||||||||||||||||||||||||||||||||
| Grand Mobile Estates | Grand Rapids, MI | B |
|
|
|
|
|
|
|
|
(
|
1996 | (A) | |||||||||||||||||||||||||||||||||||||||||||||||||||||||||||||||||||
| Grand Oaks RV Resort & Campground | Cayuga, ON | — |
|
|
|
(
|
(1)
|
|
|
|
|
(
|
2016 | (A) | ||||||||||||||||||||||||||||||||||||||||||||||||||||||||||||||||||
|
Grove Beach
|
Westbrook, CT | C |
|
|
|
|
|
|
|
|
(
|
2019 | (A) | |||||||||||||||||||||||||||||||||||||||||||||||||||||||||||||||||||
| Grove Ridge RV Resort | Dade City, FL | E |
|
|
|
|
|
|
|
|
(
|
2016 | (A) | |||||||||||||||||||||||||||||||||||||||||||||||||||||||||||||||||||
| Groves RV Resort | Ft. Myers, FL | B |
|
|
|
|
|
|
|
|
(
|
1997 | (A) | |||||||||||||||||||||||||||||||||||||||||||||||||||||||||||||||||||
| Gulfstream Harbor | Orlando, FL | — |
|
|
|
|
|
|
|
|
(
|
2015 | (A) | |||||||||||||||||||||||||||||||||||||||||||||||||||||||||||||||||||
| Gulliver’s Lake RV Resort & Campground | Millgrove, ON | — |
|
|
|
(
|
(1)
|
|
|
|
|
(
|
2016 | (A) | ||||||||||||||||||||||||||||||||||||||||||||||||||||||||||||||||||
| Gwynn’s Island RV Resort & Campground | Gwynn, VA | C |
|
|
|
|
|
|
|
|
(
|
2013 | (A) | |||||||||||||||||||||||||||||||||||||||||||||||||||||||||||||||||||
|
Hacienda Del Rio
|
Edgewater, FL | — |
|
|
|
|
|
|
|
|
(
|
2019 | (A) | |||||||||||||||||||||||||||||||||||||||||||||||||||||||||||||||||||
| Hamlin | Webberville, MI | B |
|
|
|
|
|
|
|
|
(
|
1984 | (A&C) | |||||||||||||||||||||||||||||||||||||||||||||||||||||||||||||||||||
|
Hancock Heights Estates
(4)
|
Hancock, ME | — |
|
|
|
|
|
|
|
|
(
|
2020 | (A) | |||||||||||||||||||||||||||||||||||||||||||||||||||||||||||||||||||
| Hannah Village | Lebanon, NH | C |
|
|
|
|
|
|
|
|
(
|
2019 | (A) | |||||||||||||||||||||||||||||||||||||||||||||||||||||||||||||||||||
|
Hemlocks
|
Tilton, NH | C |
|
|
|
|
|
|
|
|
(
|
2019 | (A) | |||||||||||||||||||||||||||||||||||||||||||||||||||||||||||||||||||
| Heritage | Temecula, CA | D |
|
|
|
|
|
|
|
|
(
|
2016 | (A) | |||||||||||||||||||||||||||||||||||||||||||||||||||||||||||||||||||
| Hickory Hills Village | Battle Creek, MI | — |
|
|
|
|
|
|
|
|
(
|
2011 | (A) | |||||||||||||||||||||||||||||||||||||||||||||||||||||||||||||||||||
|
Hid'n Pines RV Resort
|
Old Orchard Beach, ME | — |
|
|
|
|
|
|
|
|
(
|
2019 | (A) | |||||||||||||||||||||||||||||||||||||||||||||||||||||||||||||||||||
| Hidden Ridge RV Resort | Hopkins, MI | C |
|
|
|
|
|
|
|
|
(
|
2011 | (A) | |||||||||||||||||||||||||||||||||||||||||||||||||||||||||||||||||||
| Hidden River RV Resort | Riverview, FL | C |
|
|
|
|
|
|
|
|
(
|
2016 | (A) | |||||||||||||||||||||||||||||||||||||||||||||||||||||||||||||||||||
| Hidden Valley RV Resort & Campground | Normandale, ON | — |
|
|
|
(
|
(1)
|
|
|
|
|
(
|
2016 | (A) | ||||||||||||||||||||||||||||||||||||||||||||||||||||||||||||||||||
| High Point Park | Frederica, DE | — |
|
|
|
(
|
(3)
|
|
|
|
|
(
|
1997 | (A) | ||||||||||||||||||||||||||||||||||||||||||||||||||||||||||||||||||
F - 58
SUN COMMUNITIES, INC.
REAL ESTATE AND ACCUMULATED DEPRECIATION, SCHEDULE III
DECEMBER 31, 2020
(amounts in thousands)
| Encumbrance | Initial Cost to Company | Costs Capitalized Subsequent to Acquisition (Improvements) |
Gross Amount Carried at
December 31, 2020
|
|||||||||||||||||||||||||||||||||||||||||||||||||||||||||||||||||||||||||||||
| Property Name | Location | Group | Amount | Land | Depreciable Assets | Land | Depreciable Assets | Land | Depreciable Assets | Total | Accumulated Depreciation | Date | Acquired (A) or Constructed (C) | |||||||||||||||||||||||||||||||||||||||||||||||||||||||||||||||||||
|
Highland Green Estates
(4)
|
Highland, MI | — |
|
|
|
|
|
|
|
|
(
|
2020 | (A) | |||||||||||||||||||||||||||||||||||||||||||||||||||||||||||||||||||
| Hill Country Cottage and RV Resort | New Braunfels, TX | C |
|
|
|
|
|
|
|
|
(
|
2016 | (A&C) | |||||||||||||||||||||||||||||||||||||||||||||||||||||||||||||||||||
|
Hillcrest
|
Uncasville, CT | C |
|
|
|
|
|
|
|
|
(
|
2019 | (A) | |||||||||||||||||||||||||||||||||||||||||||||||||||||||||||||||||||
|
Holiday Park Estates
(4)
|
Bangor, ME | B |
|
|
|
|
|
|
|
|
(
|
2020 | (A) | |||||||||||||||||||||||||||||||||||||||||||||||||||||||||||||||||||
| Holiday West Village | Holland, MI | B |
|
|
|
|
|
|
|
|
(
|
2011 | (A) | |||||||||||||||||||||||||||||||||||||||||||||||||||||||||||||||||||
| Holly Forest Estates | Holly Hill, FL | D |
|
|
|
|
|
|
|
|
(
|
1997 | (A) | |||||||||||||||||||||||||||||||||||||||||||||||||||||||||||||||||||
| Holly Village / Hawaiian Gardens | Holly, MI | B |
|
|
|
|
|
|
|
|
(
|
2004 | (A) | |||||||||||||||||||||||||||||||||||||||||||||||||||||||||||||||||||
| Homosassa River RV Resort | Homosassa Springs, FL | C |
|
|
|
|
|
|
|
|
(
|
2016 | (A) | |||||||||||||||||||||||||||||||||||||||||||||||||||||||||||||||||||
| Horseshoe Cove RV Resort | Bradenton, FL | E |
|
|
|
|
|
|
|
|
(
|
2016 | (A) | |||||||||||||||||||||||||||||||||||||||||||||||||||||||||||||||||||
| Hunters Crossing | Capac, MI | C |
|
|
|
|
|
|
|
|
(
|
2012 | (A) | |||||||||||||||||||||||||||||||||||||||||||||||||||||||||||||||||||
| Hunters Glen | Wayland, MI | C |
|
|
|
|
|
|
|
|
(
|
2004 | (C) | |||||||||||||||||||||||||||||||||||||||||||||||||||||||||||||||||||
|
Hyde Park
|
Easton, MD | C |
|
|
|
|
|
|
|
|
(
|
2019 | (A) | |||||||||||||||||||||||||||||||||||||||||||||||||||||||||||||||||||
| Indian Creek Park | Ft. Myers Beach, FL | D |
|
|
|
|
|
|
|
|
(
|
1996 | (A) | |||||||||||||||||||||||||||||||||||||||||||||||||||||||||||||||||||
| Indian Creek RV & Camping Resort | Geneva on the Lake, OH | C |
|
|
|
(
|
(3)
|
|
|
|
|
(
|
2013 | (A&C) | ||||||||||||||||||||||||||||||||||||||||||||||||||||||||||||||||||
| Indian Wells RV Resort | Indio, CA | D |
|
|
|
|
|
|
|
|
(
|
2016 | (A) | |||||||||||||||||||||||||||||||||||||||||||||||||||||||||||||||||||
| Island Lakes | Merritt Island, FL | D |
|
|
|
|
|
|
|
|
(
|
1995 | (A) | |||||||||||||||||||||||||||||||||||||||||||||||||||||||||||||||||||
|
Jellystone Park™ at Barton Lake
(4)
|
Fremont, IN | — |
|
|
|
|
|
|
|
|
(
|
2020 | (A) | |||||||||||||||||||||||||||||||||||||||||||||||||||||||||||||||||||
| Jellystone Park™ at Birchwood Acres MH & RV Resort | Greenfield Park, NY | A |
|
|
|
|
|
|
|
|
(
|
2013 | (A) | |||||||||||||||||||||||||||||||||||||||||||||||||||||||||||||||||||
| Jellystone Park™ at Gardiner | Gardiner, NY | — |
|
|
|
|
|
|
|
|
(
|
2018 | (A) | |||||||||||||||||||||||||||||||||||||||||||||||||||||||||||||||||||
| Jellystone Park™ at Golden Valley | Bostic, NC | — |
|
|
|
(
|
(3)
|
|
|
|
|
(
|
2018 | (A&C) | ||||||||||||||||||||||||||||||||||||||||||||||||||||||||||||||||||
| Jellystone Park™ at Guadalupe River | Kerrville, TX | — |
|
|
|
(
|
(3)
|
|
|
|
|
(
|
2018 | (A) | ||||||||||||||||||||||||||||||||||||||||||||||||||||||||||||||||||
| Jellystone Park™ at Hill Country | Canyon Lake, TX | — |
|
|
|
|
|
|
|
|
(
|
2018 | (A) | |||||||||||||||||||||||||||||||||||||||||||||||||||||||||||||||||||
| Jellystone Park™ at Larkspur | Larkspur, CO | — |
|
|
|
|
|
|
|
|
(
|
2016 | (A&C) | |||||||||||||||||||||||||||||||||||||||||||||||||||||||||||||||||||
| Jellystone Park™ at Luray | East Luray, VA | — |
|
|
|
(
|
(3)
|
|
|
|
|
(
|
2018 | (A) | ||||||||||||||||||||||||||||||||||||||||||||||||||||||||||||||||||
| Jellystone Park™ at Maryland | Williamsport, MD | — |
|
|
|
|
|
|
|
|
(
|
2018 | (A) | |||||||||||||||||||||||||||||||||||||||||||||||||||||||||||||||||||
| Jellystone Park™ at Memphis | Horn Lake, MS | A |
|
|
|
|
|
|
|
|
(
|
2018 | (A) | |||||||||||||||||||||||||||||||||||||||||||||||||||||||||||||||||||
|
Jellystone Park™ at Natural Bridge
(4)
|
Natural Bridge Station, VA | — |
|
|
|
|
|
|
|
|
(
|
2020 | (A) | |||||||||||||||||||||||||||||||||||||||||||||||||||||||||||||||||||
| Jellystone Park™ at Quarryville | Quarryville, PA | — |
|
|
|
|
|
|
|
|
(
|
2018 | (A) | |||||||||||||||||||||||||||||||||||||||||||||||||||||||||||||||||||
|
Jellystone Park™ at Tower Park
(2)
|
Lodi, CA | — |
|
|
|
(
|
(3)
|
|
|
|
|
(
|
2018 | (A) | ||||||||||||||||||||||||||||||||||||||||||||||||||||||||||||||||||
F - 59
SUN COMMUNITIES, INC.
REAL ESTATE AND ACCUMULATED DEPRECIATION, SCHEDULE III
DECEMBER 31, 2020
(amounts in thousands)
| Encumbrance | Initial Cost to Company | Costs Capitalized Subsequent to Acquisition (Improvements) |
Gross Amount Carried at
December 31, 2020
|
|||||||||||||||||||||||||||||||||||||||||||||||||||||||||||||||||||||||||||||
| Property Name | Location | Group | Amount | Land | Depreciable Assets | Land | Depreciable Assets | Land | Depreciable Assets | Total | Accumulated Depreciation | Date | Acquired (A) or Constructed (C) | |||||||||||||||||||||||||||||||||||||||||||||||||||||||||||||||||||
| Jellystone Park™ of Western New York | North Java, NY | A |
|
|
|
|
|
|
|
|
(
|
2013 | (A) | |||||||||||||||||||||||||||||||||||||||||||||||||||||||||||||||||||
| Kensington Meadows | Lansing, MI | B |
|
|
|
|
|
|
|
|
(
|
1995 | (A&C) | |||||||||||||||||||||||||||||||||||||||||||||||||||||||||||||||||||
| Kimberly Estates | Newport, MI | C |
|
|
|
|
|
|
|
|
(
|
2016 | (A) | |||||||||||||||||||||||||||||||||||||||||||||||||||||||||||||||||||
| King’s Court Mobile Village | Traverse City, MI | B |
|
|
|
|
|
|
|
|
(
|
1996 | (A&C) | |||||||||||||||||||||||||||||||||||||||||||||||||||||||||||||||||||
| King’s Lake | DeBary, FL | D |
|
|
|
|
|
|
|
|
(
|
1994 | (A) | |||||||||||||||||||||||||||||||||||||||||||||||||||||||||||||||||||
| Kings Manor | Lakeland, FL | — |
|
|
|
|
|
|
|
|
(
|
2016 | (A) | |||||||||||||||||||||||||||||||||||||||||||||||||||||||||||||||||||
| King’s Pointe | Lake Alfred, FL | B |
|
|
|
|
|
|
|
|
(
|
2015 | (A) | |||||||||||||||||||||||||||||||||||||||||||||||||||||||||||||||||||
| Kissimmee Gardens | Kissimmee, FL | — |
|
|
|
|
|
|
|
|
(
|
2016 | (A) | |||||||||||||||||||||||||||||||||||||||||||||||||||||||||||||||||||
| Kissimmee South MH & RV Resort | Davenport, FL | — |
|
|
|
|
|
|
|
|
(
|
2016 | (A) | |||||||||||||||||||||||||||||||||||||||||||||||||||||||||||||||||||
|
Kittatinny Campground & RV Resort
(4)
|
Barryville, NY | — |
|
|
|
|
|
|
|
|
(
|
2020 | (A) | |||||||||||||||||||||||||||||||||||||||||||||||||||||||||||||||||||
| Knollwood Estates | Allendale, MI | B |
|
|
|
|
|
|
|
|
(
|
2001 | (A) | |||||||||||||||||||||||||||||||||||||||||||||||||||||||||||||||||||
| La Casa Blanca | Apache Junction, AZ | — |
|
|
|
|
|
|
|
|
(
|
2014 | (A) | |||||||||||||||||||||||||||||||||||||||||||||||||||||||||||||||||||
| La Costa Village | Port Orange, FL | D |
|
|
|
|
|
|
|
|
(
|
2015 | (A) | |||||||||||||||||||||||||||||||||||||||||||||||||||||||||||||||||||
| La Hacienda RV Resort | Austin, TX | C |
|
|
|
|
|
|
|
|
(
|
2015 | (A) | |||||||||||||||||||||||||||||||||||||||||||||||||||||||||||||||||||
| Lafayette Place | Warren, MI | A |
|
|
|
|
|
|
|
|
(
|
1998 | (A) | |||||||||||||||||||||||||||||||||||||||||||||||||||||||||||||||||||
| Lafontaine RV Resort & Campground | Tiny, ON | — |
|
|
|
(
|
(1)
|
|
|
|
|
(
|
2016 | (A) | ||||||||||||||||||||||||||||||||||||||||||||||||||||||||||||||||||
| Lake Avenue RV Resort & Campground | Cherry Valley, ON | — |
|
|
|
(
|
(1)
|
|
|
|
|
(
|
2016 | (A) | ||||||||||||||||||||||||||||||||||||||||||||||||||||||||||||||||||
| Lake in Wood RV Resort | Narvon, PA | A |
|
|
|
|
|
|
|
|
(
|
2012 | (A) | |||||||||||||||||||||||||||||||||||||||||||||||||||||||||||||||||||
| Lake Josephine RV Resort | Sebring, FL | C |
|
|
|
|
|
|
|
|
(
|
2016 | (A) | |||||||||||||||||||||||||||||||||||||||||||||||||||||||||||||||||||
| Lake Juliana Landings | Auburndale, FL | — |
|
|
|
|
|
|
|
|
(
|
1994 | (A) | |||||||||||||||||||||||||||||||||||||||||||||||||||||||||||||||||||
| Lake Pointe Village | Mulberry, FL | D |
|
|
|
|
|
|
|
|
(
|
2015 | (A) | |||||||||||||||||||||||||||||||||||||||||||||||||||||||||||||||||||
| Lake Rudolph Campground & RV Resort | Santa Claus, IN | A |
|
|
|
|
|
|
|
|
(
|
2014 | (A&C) | |||||||||||||||||||||||||||||||||||||||||||||||||||||||||||||||||||
| Lake San Marino RV Park | Naples, FL | B |
|
|
|
|
|
|
|
|
(
|
1996 | (A) | |||||||||||||||||||||||||||||||||||||||||||||||||||||||||||||||||||
| Lakefront | Lakeside, CA | D |
|
|
|
|
|
|
|
|
(
|
2016 | (A) | |||||||||||||||||||||||||||||||||||||||||||||||||||||||||||||||||||
| Lakeland RV Resort | Lakeland, FL | C |
|
|
|
|
|
|
|
|
(
|
2016 | (A) | |||||||||||||||||||||||||||||||||||||||||||||||||||||||||||||||||||
| Lakeshore Landings | Orlando, FL | D |
|
|
|
|
|
|
|
|
(
|
2014 | (A) | |||||||||||||||||||||||||||||||||||||||||||||||||||||||||||||||||||
| Lakeshore Villas | Tampa, FL | — |
|
|
|
|
|
|
|
|
(
|
2015 | (A) | |||||||||||||||||||||||||||||||||||||||||||||||||||||||||||||||||||
|
Lakeside
|
Terryville, CT | C |
|
|
|
|
|
|
|
|
(
|
2019 | (A) | |||||||||||||||||||||||||||||||||||||||||||||||||||||||||||||||||||
| Lakeside Crossing | Conway, SC | D |
|
|
|
|
|
|
|
|
(
|
2015 | (A&C) | |||||||||||||||||||||||||||||||||||||||||||||||||||||||||||||||||||
| Lakeview | Ypsilanti, MI | — |
|
|
|
(
|
(3)
|
|
|
|
|
(
|
2004 | (A) | ||||||||||||||||||||||||||||||||||||||||||||||||||||||||||||||||||
|
Lakeview CT
|
Danbury, CT | C |
|
|
|
|
|
|
|
|
(
|
2019 | (A) | |||||||||||||||||||||||||||||||||||||||||||||||||||||||||||||||||||
F - 60
SUN COMMUNITIES, INC.
REAL ESTATE AND ACCUMULATED DEPRECIATION, SCHEDULE III
DECEMBER 31, 2020
(amounts in thousands)
| Encumbrance | Initial Cost to Company | Costs Capitalized Subsequent to Acquisition (Improvements) |
Gross Amount Carried at
December 31, 2020
|
|||||||||||||||||||||||||||||||||||||||||||||||||||||||||||||||||||||||||||||
| Property Name | Location | Group | Amount | Land | Depreciable Assets | Land | Depreciable Assets | Land | Depreciable Assets | Total | Accumulated Depreciation | Date | Acquired (A) or Constructed (C) | |||||||||||||||||||||||||||||||||||||||||||||||||||||||||||||||||||
|
Lakeview Mobile Estates
(4)
|
Yucaipa, CA | — |
|
|
|
|
|
|
|
|
(
|
2020 | (A) | |||||||||||||||||||||||||||||||||||||||||||||||||||||||||||||||||||
| Lamplighter | Port Orange, FL | B |
|
|
|
|
|
|
|
|
(
|
2015 | (A) | |||||||||||||||||||||||||||||||||||||||||||||||||||||||||||||||||||
|
Laurel Heights
|
Uncasville, CT | C |
|
|
|
|
|
|
|
|
(
|
2019 | (A) | |||||||||||||||||||||||||||||||||||||||||||||||||||||||||||||||||||
| Lazy J Ranch | Arcata, CA | — |
|
|
|
|
|
|
|
|
(
|
2017 | (A) | |||||||||||||||||||||||||||||||||||||||||||||||||||||||||||||||||||
| Leaf Verde RV Resort | Buckeye, AZ | — |
|
|
|
|
|
|
|
|
(
|
2018 | (A) | |||||||||||||||||||||||||||||||||||||||||||||||||||||||||||||||||||
|
Leisure Point Resort
|
Millsboro, DE | — |
|
|
|
|
|
|
|
|
(
|
2019 | (A) | |||||||||||||||||||||||||||||||||||||||||||||||||||||||||||||||||||
| Leisure Village | Belmont, MI | — |
|
|
|
|
|
|
|
|
(
|
2011 | (A) | |||||||||||||||||||||||||||||||||||||||||||||||||||||||||||||||||||
| Lemon Wood | Ventura, CA | D |
|
|
|
|
|
|
|
|
(
|
2016 | (A) | |||||||||||||||||||||||||||||||||||||||||||||||||||||||||||||||||||
| Liberty Farm | Valparaiso, IN | C |
|
|
|
|
|
|
|
|
(
|
1985 | (A&C) | |||||||||||||||||||||||||||||||||||||||||||||||||||||||||||||||||||
| Lincoln Estates | Holland, MI | — |
|
|
|
|
|
|
|
|
(
|
1996 | (A) | |||||||||||||||||||||||||||||||||||||||||||||||||||||||||||||||||||
|
Lone Star Jellystone Park
(4)
|
Waller, TX | — |
|
|
|
|
|
|
|
|
(
|
2020 | (A) | |||||||||||||||||||||||||||||||||||||||||||||||||||||||||||||||||||
| Long Beach RV Resort & Campground | Barnegat, NJ | — |
|
|
|
|
|
|
|
|
(
|
2016 | (A) | |||||||||||||||||||||||||||||||||||||||||||||||||||||||||||||||||||
|
Lost Dutchman
(8)
|
Apache Junction, AZ | E |
|
|
|
|
|
|
|
|
(
|
2014 | (A) | |||||||||||||||||||||||||||||||||||||||||||||||||||||||||||||||||||
| Majestic Oaks RV Resort | Zephyrhills, FL | E |
|
|
|
|
|
|
|
|
(
|
2016 | (A) | |||||||||||||||||||||||||||||||||||||||||||||||||||||||||||||||||||
| Maple Brook | Matteson, IL | D |
|
|
|
|
|
|
|
|
(
|
2014 | (A) | |||||||||||||||||||||||||||||||||||||||||||||||||||||||||||||||||||
| Maplewood Manor | Brunswick, ME | E |
|
|
|
|
|
|
|
|
(
|
2014 | (A) | |||||||||||||||||||||||||||||||||||||||||||||||||||||||||||||||||||
| Marco Naples RV Resort | Naples, FL | — |
|
|
|
|
|
|
|
|
(
|
2016 | (A) | |||||||||||||||||||||||||||||||||||||||||||||||||||||||||||||||||||
| Marina Cove | Uncasville, CT | C |
|
|
|
|
|
|
|
|
(
|
2019 | (A) | |||||||||||||||||||||||||||||||||||||||||||||||||||||||||||||||||||
|
Massey's Landing RV Resort
|
Millsboro, DE | — |
|
|
|
|
|
|
|
|
(
|
2019 | (A) | |||||||||||||||||||||||||||||||||||||||||||||||||||||||||||||||||||
| Meadow Lake Estates | White Lake, MI | — |
|
|
|
|
|
|
|
|
(
|
1994 | (A) | |||||||||||||||||||||||||||||||||||||||||||||||||||||||||||||||||||
| Meadowbrook | Charlotte, NC | C |
|
|
|
|
|
|
|
|
(
|
2000 | (A&C) | |||||||||||||||||||||||||||||||||||||||||||||||||||||||||||||||||||
| Meadowbrook Estates | Monroe, MI | A |
|
|
|
|
|
|
|
|
(
|
1986 | (A) | |||||||||||||||||||||||||||||||||||||||||||||||||||||||||||||||||||
| Meadowbrook Village | Tampa, FL | B |
|
|
|
|
|
|
|
|
(
|
1994 | (A) | |||||||||||||||||||||||||||||||||||||||||||||||||||||||||||||||||||
| Meadowlands of Gibraltar | Gibraltar, MI | B |
|
|
|
|
|
|
|
|
(
|
2015 | (A) | |||||||||||||||||||||||||||||||||||||||||||||||||||||||||||||||||||
|
Menifee Development
(5)
|
Menifee, CA | — |
|
|
|
|
|
|
|
|
|
2020 | (C) | |||||||||||||||||||||||||||||||||||||||||||||||||||||||||||||||||||
| Merrymeeting | Brunswick, ME | C |
|
|
|
|
|
|
|
|
(
|
2014 | (A) | |||||||||||||||||||||||||||||||||||||||||||||||||||||||||||||||||||
| Mi-Te-Jo Campground | Milton, NH | — |
|
|
|
|
|
|
|
|
(
|
2018 | (A) | |||||||||||||||||||||||||||||||||||||||||||||||||||||||||||||||||||
| Mill Creek MH & RV Resort | Kissimmee, FL | — |
|
|
|
|
|
|
|
|
(
|
2016 | (A) | |||||||||||||||||||||||||||||||||||||||||||||||||||||||||||||||||||
|
Millwood
|
Uncasville, CT | C |
|
|
|
|
|
|
|
|
(
|
2019 | (A&C) | |||||||||||||||||||||||||||||||||||||||||||||||||||||||||||||||||||
| Moab Valley RV Resort & Campground | Moab, UT | — |
|
|
|
|
|
|
|
|
(
|
2018 | (A) | |||||||||||||||||||||||||||||||||||||||||||||||||||||||||||||||||||
| Mountain View | Mesa, AZ | B |
|
|
|
|
|
|
|
|
(
|
2014 | (A) | |||||||||||||||||||||||||||||||||||||||||||||||||||||||||||||||||||
|
Mouse Mountain RV Resort
(4)
|
Davenport, FL | — |
|
|
|
|
|
|
|
|
(
|
2020 | (A) | |||||||||||||||||||||||||||||||||||||||||||||||||||||||||||||||||||
F - 61
SUN COMMUNITIES, INC.
REAL ESTATE AND ACCUMULATED DEPRECIATION, SCHEDULE III
DECEMBER 31, 2020
(amounts in thousands)
| Encumbrance | Initial Cost to Company | Costs Capitalized Subsequent to Acquisition (Improvements) |
Gross Amount Carried at
December 31, 2020
|
|||||||||||||||||||||||||||||||||||||||||||||||||||||||||||||||||||||||||||||
| Property Name | Location | Group | Amount | Land | Depreciable Assets | Land | Depreciable Assets | Land | Depreciable Assets | Total | Accumulated Depreciation | Date | Acquired (A) or Constructed (C) | |||||||||||||||||||||||||||||||||||||||||||||||||||||||||||||||||||
| Napa Valley | Napa, CA | D |
|
|
|
|
|
|
|
|
(
|
2016 | (A) | |||||||||||||||||||||||||||||||||||||||||||||||||||||||||||||||||||
| Naples RV Resort | Naples, FL | B |
|
|
|
|
|
|
|
|
(
|
2011 | (A) | |||||||||||||||||||||||||||||||||||||||||||||||||||||||||||||||||||
|
New England Village
|
Westbrook, CT | C |
|
|
|
|
|
|
|
|
(
|
2019 | (A) | |||||||||||||||||||||||||||||||||||||||||||||||||||||||||||||||||||
| New Point RV Resort | New Point, VA | C |
|
|
|
|
|
|
|
|
(
|
2013 | (A) | |||||||||||||||||||||||||||||||||||||||||||||||||||||||||||||||||||
| New Ranch | Clearwater, FL | — |
|
|
|
|
|
|
|
|
(
|
2016 | (A) | |||||||||||||||||||||||||||||||||||||||||||||||||||||||||||||||||||
| North Lake Estates | Moore Haven, FL | C |
|
|
|
|
|
|
|
|
(
|
2011 | (A) | |||||||||||||||||||||||||||||||||||||||||||||||||||||||||||||||||||
| North Point Estates | Pueblo, CO | — |
|
|
|
|
|
|
|
|
(
|
2001 | (C) | |||||||||||||||||||||||||||||||||||||||||||||||||||||||||||||||||||
| Northville Crossing | Northville, MI | B |
|
|
|
|
|
|
|
|
(
|
2012 | (A) | |||||||||||||||||||||||||||||||||||||||||||||||||||||||||||||||||||
| Oak Creek | Coarsegold, CA | B |
|
|
|
|
|
|
|
|
(
|
2014 | (A) | |||||||||||||||||||||||||||||||||||||||||||||||||||||||||||||||||||
| Oak Crest | Austin, TX | B |
|
|
|
|
|
|
|
|
(
|
2002 | (C) | |||||||||||||||||||||||||||||||||||||||||||||||||||||||||||||||||||
|
Oak Grove
|
Plainville, CT | C |
|
|
|
|
|
|
|
|
(
|
2019 | (A) | |||||||||||||||||||||||||||||||||||||||||||||||||||||||||||||||||||
| Oak Island Village | East Lansing, MI | B |
|
|
|
|
|
|
|
|
(
|
2011 | (A) | |||||||||||||||||||||||||||||||||||||||||||||||||||||||||||||||||||
| Oak Ridge | Manteno, IL | D |
|
|
|
|
|
|
|
|
(
|
2014 | (A) | |||||||||||||||||||||||||||||||||||||||||||||||||||||||||||||||||||
| Oakview Estates | Arcadia, FL | — |
|
|
|
|
|
|
|
|
(
|
2016 | (A) | |||||||||||||||||||||||||||||||||||||||||||||||||||||||||||||||||||
| Oakwood Village | Miamisburg, OH | B |
|
|
|
(
|
(3)
|
|
|
|
|
(
|
1998 | (A&C) | ||||||||||||||||||||||||||||||||||||||||||||||||||||||||||||||||||
| Ocean Breeze Jensen Beach MH & RV Resort | Jensen Beach, FL | C |
|
|
|
|
|
|
|
|
(
|
2016 | (A&C) | |||||||||||||||||||||||||||||||||||||||||||||||||||||||||||||||||||
|
Ocean Breeze MH & RV Resort
(6)
|
Marathon, FL | — |
|
|
|
|
|
|
|
|
(
|
2016 | (A) | |||||||||||||||||||||||||||||||||||||||||||||||||||||||||||||||||||
|
Ocean Mesa RV Resort
(4)
|
Goleta, CA | — |
|
|
|
|
|
|
|
|
(
|
2020 | (A) | |||||||||||||||||||||||||||||||||||||||||||||||||||||||||||||||||||
| Ocean Pines | Garden City, SC | C |
|
|
|
|
|
|
|
|
(
|
2019 | (A) | |||||||||||||||||||||||||||||||||||||||||||||||||||||||||||||||||||
| Ocean West | McKinleyville, CA | B |
|
|
|
|
|
|
|
|
(
|
2017 | (A) | |||||||||||||||||||||||||||||||||||||||||||||||||||||||||||||||||||
| Oceanside RV Resort & Campground | Coos Bay, OR | — |
|
|
|
|
|
|
|
|
(
|
2018 | (A) | |||||||||||||||||||||||||||||||||||||||||||||||||||||||||||||||||||
| Orange City MH & RV Resort | Orange City, FL | B |
|
|
|
|
|
|
|
|
(
|
2011 | (A) | |||||||||||||||||||||||||||||||||||||||||||||||||||||||||||||||||||
| Orange Tree Village | Orange City, FL | D |
|
|
|
|
|
|
|
|
(
|
1994 | (A) | |||||||||||||||||||||||||||||||||||||||||||||||||||||||||||||||||||
| Orchard Lake | Milford, OH | C |
|
|
|
(
|
(3)
|
|
|
|
|
(
|
1999 | (A) | ||||||||||||||||||||||||||||||||||||||||||||||||||||||||||||||||||
| Paddock Park South | Ocala, FL | — |
|
|
|
|
|
|
|
|
(
|
2016 | (A) | |||||||||||||||||||||||||||||||||||||||||||||||||||||||||||||||||||
| Palm Creek Golf & RV Resort | Casa Grande, AZ | D |
|
|
|
|
|
|
|
|
(
|
2012 | (A&C) | |||||||||||||||||||||||||||||||||||||||||||||||||||||||||||||||||||
| Palm Key Village | Davenport, FL | D |
|
|
|
|
|
|
|
|
(
|
2015 | (A) | |||||||||||||||||||||||||||||||||||||||||||||||||||||||||||||||||||
| Palm Village | Bradenton, FL | — |
|
|
|
|
|
|
|
|
(
|
2016 | (A) | |||||||||||||||||||||||||||||||||||||||||||||||||||||||||||||||||||
|
Palos Verdes Shores MH & Golf Community
(2)
|
San Pedro, CA | D |
|
|
|
|
|
|
|
|
(
|
2016 | (A) | |||||||||||||||||||||||||||||||||||||||||||||||||||||||||||||||||||
|
Pandion Ridge RV Resort
|
Orange Beach, AL | — |
|
|
|
|
|
|
|
|
(
|
2019 | (A) | |||||||||||||||||||||||||||||||||||||||||||||||||||||||||||||||||||
| Park Place | Sebastian, FL | — |
|
|
|
|
|
|
|
|
(
|
2015 | (A) | |||||||||||||||||||||||||||||||||||||||||||||||||||||||||||||||||||
F - 62
SUN COMMUNITIES, INC.
REAL ESTATE AND ACCUMULATED DEPRECIATION, SCHEDULE III
DECEMBER 31, 2020
(amounts in thousands)
| Encumbrance | Initial Cost to Company | Costs Capitalized Subsequent to Acquisition (Improvements) |
Gross Amount Carried at
December 31, 2020
|
|||||||||||||||||||||||||||||||||||||||||||||||||||||||||||||||||||||||||||||
| Property Name | Location | Group | Amount | Land | Depreciable Assets | Land | Depreciable Assets | Land | Depreciable Assets | Total | Accumulated Depreciation | Date | Acquired (A) or Constructed (C) | |||||||||||||||||||||||||||||||||||||||||||||||||||||||||||||||||||
| Park Royale | Pinellas Park, FL | D |
|
|
|
|
|
|
|
|
(
|
2015 | (A) | |||||||||||||||||||||||||||||||||||||||||||||||||||||||||||||||||||
| Parkside Village | Cheektowaga, NY | — |
|
|
|
|
|
|
|
|
(
|
2014 | (A) | |||||||||||||||||||||||||||||||||||||||||||||||||||||||||||||||||||
| Pebble Creek | Greenwood, IN | C |
|
|
|
|
|
|
|
|
(
|
2000 | (A&C) | |||||||||||||||||||||||||||||||||||||||||||||||||||||||||||||||||||
| Pecan Branch | Georgetown, TX | C |
|
|
|
|
|
|
|
|
(
|
1999 | (C) | |||||||||||||||||||||||||||||||||||||||||||||||||||||||||||||||||||
| Pecan Park RV Resort | Jacksonville, FL | — |
|
|
|
|
|
|
|
|
(
|
2016 | (A&C) | |||||||||||||||||||||||||||||||||||||||||||||||||||||||||||||||||||
| Pelican Bay | Micco, FL | D |
|
|
|
|
|
|
|
|
(
|
2015 | (A) | |||||||||||||||||||||||||||||||||||||||||||||||||||||||||||||||||||
| Pelican RV Resort & Marina | Marathon, FL | C |
|
|
|
|
|
|
|
|
(
|
2016 | (A) | |||||||||||||||||||||||||||||||||||||||||||||||||||||||||||||||||||
| Pembroke Downs | Chino, CA | D |
|
|
|
|
|
|
|
|
(
|
2016 | (A) | |||||||||||||||||||||||||||||||||||||||||||||||||||||||||||||||||||
| Peter’s Pond RV Resort | Sandwich, MA | C |
|
|
|
|
|
|
|
|
(
|
2013 | (A) | |||||||||||||||||||||||||||||||||||||||||||||||||||||||||||||||||||
| Petoskey KOA RV Resort | Petoskey, MI | — |
|
|
|
|
|
|
|
|
(
|
2018 | (A) | |||||||||||||||||||||||||||||||||||||||||||||||||||||||||||||||||||
| Petoskey RV Resort | Petoskey, MI | — |
|
|
|
|
|
|
|
|
(
|
2016 | (A) | |||||||||||||||||||||||||||||||||||||||||||||||||||||||||||||||||||
| Pheasant Ridge | Lancaster, PA | B |
|
|
|
|
|
|
|
|
(
|
2002 | (A) | |||||||||||||||||||||||||||||||||||||||||||||||||||||||||||||||||||
| Pickerel Park RV Resort & Campground | Napanee, ON | — |
|
|
|
(
|
(1)
|
|
|
|
|
(
|
2016 | (A) | ||||||||||||||||||||||||||||||||||||||||||||||||||||||||||||||||||
| Pin Oak Parc | O’Fallon, MO | — |
|
|
|
|
|
|
|
|
(
|
1994 | (A&C) | |||||||||||||||||||||||||||||||||||||||||||||||||||||||||||||||||||
| Pine Hills | Middlebury, IN | A |
|
|
|
|
|
|
|
|
(
|
1980 | (A) | |||||||||||||||||||||||||||||||||||||||||||||||||||||||||||||||||||
| Pine Ridge | Prince George, VA | B |
|
|
|
|
|
|
|
|
(
|
1986 | (A&C) | |||||||||||||||||||||||||||||||||||||||||||||||||||||||||||||||||||
| Pine Trace | Houston, TX | — |
|
|
|
(
|
(3)
|
|
|
|
|
(
|
2004 | (A&C) | ||||||||||||||||||||||||||||||||||||||||||||||||||||||||||||||||||
| Pinebrook Village | Kentwood, MI | — |
|
|
|
|
|
|
|
|
(
|
2011 | (A) | |||||||||||||||||||||||||||||||||||||||||||||||||||||||||||||||||||
| Pismo Dunes RV Resort | Pismo Beach, CA | D |
|
|
|
|
|
|
|
|
(
|
2017 | (A) | |||||||||||||||||||||||||||||||||||||||||||||||||||||||||||||||||||
| Pleasant Lake RV Resort | Bradenton, FL | E |
|
|
|
|
|
|
|
|
(
|
2016 | (A) | |||||||||||||||||||||||||||||||||||||||||||||||||||||||||||||||||||
| Pony Express RV Resort & Campground | North Salt Lake, UT | — |
|
|
|
|
|
|
|
|
(
|
2018 | (A) | |||||||||||||||||||||||||||||||||||||||||||||||||||||||||||||||||||
| Presidential Estates Mobile Village | Hudsonville, MI | B |
|
|
|
|
|
|
|
|
(
|
1996 | (A) | |||||||||||||||||||||||||||||||||||||||||||||||||||||||||||||||||||
| Rainbow MH & RV Resort | Frostproof, FL | A |
|
|
|
|
|
|
|
|
(
|
2012 | (A) | |||||||||||||||||||||||||||||||||||||||||||||||||||||||||||||||||||
| Rainbow Village of Largo | Largo, FL | E |
|
|
|
|
|
|
|
|
(
|
2016 | (A) | |||||||||||||||||||||||||||||||||||||||||||||||||||||||||||||||||||
| Rainbow Village of Zephyrhills | Zephyrhills, FL | D |
|
|
|
|
|
|
|
|
(
|
2016 | (A) | |||||||||||||||||||||||||||||||||||||||||||||||||||||||||||||||||||
|
Rancho Alipaz
(2)
|
San Juan Capistrano, CA | D |
|
|
|
|
|
|
|
|
(
|
2016 | (A) | |||||||||||||||||||||||||||||||||||||||||||||||||||||||||||||||||||
| Rancho Caballero | Riverside, CA | D |
|
|
|
|
|
|
|
|
(
|
2016 | (A) | |||||||||||||||||||||||||||||||||||||||||||||||||||||||||||||||||||
| Rancho Mirage | Apache Junction, AZ | — |
|
|
|
|
|
|
|
|
(
|
2014 | (A) | |||||||||||||||||||||||||||||||||||||||||||||||||||||||||||||||||||
|
Red Oaks MH & RV Resort
(2)
|
Bushnell, FL | — |
|
|
|
|
|
|
|
|
(
|
2016 | (A) | |||||||||||||||||||||||||||||||||||||||||||||||||||||||||||||||||||
| Regency Heights | Clearwater, FL | D |
|
|
|
|
|
|
|
|
(
|
2016 | (A) | |||||||||||||||||||||||||||||||||||||||||||||||||||||||||||||||||||
F - 63
SUN COMMUNITIES, INC.
REAL ESTATE AND ACCUMULATED DEPRECIATION, SCHEDULE III
DECEMBER 31, 2020
(amounts in thousands)
| Encumbrance | Initial Cost to Company | Costs Capitalized Subsequent to Acquisition (Improvements) |
Gross Amount Carried at
December 31, 2020
|
|||||||||||||||||||||||||||||||||||||||||||||||||||||||||||||||||||||||||||||
| Property Name | Location | Group | Amount | Land | Depreciable Assets | Land | Depreciable Assets | Land | Depreciable Assets | Total | Accumulated Depreciation | Date | Acquired (A) or Constructed (C) | |||||||||||||||||||||||||||||||||||||||||||||||||||||||||||||||||||
| Reserve at Fox Creek | Bullhead City, AZ | D |
|
|
|
|
|
|
|
|
(
|
2014 | (A) | |||||||||||||||||||||||||||||||||||||||||||||||||||||||||||||||||||
|
Reunion Lake RV Resort
|
Ponchatoula, LA | — |
|
|
|
|
|
|
|
|
(
|
2019 | (A) | |||||||||||||||||||||||||||||||||||||||||||||||||||||||||||||||||||
| Richmond Place | Richmond, MI | B |
|
|
|
(
|
(3)
|
|
|
|
|
(
|
1998 | (A) | ||||||||||||||||||||||||||||||||||||||||||||||||||||||||||||||||||
| Riptide RV Resort & Marina | Key Largo, FL | — |
|
|
|
|
|
|
|
|
(
|
2016 | (A) | |||||||||||||||||||||||||||||||||||||||||||||||||||||||||||||||||||
| River Haven Village | Grand Haven, MI | — |
|
|
|
|
|
|
|
|
(
|
2001 | (A) | |||||||||||||||||||||||||||||||||||||||||||||||||||||||||||||||||||
|
River Pines
|
Nashua, NH | C |
|
|
|
|
|
|
|
|
(
|
2019 | (A) | |||||||||||||||||||||||||||||||||||||||||||||||||||||||||||||||||||
| River Ranch | Austin, TX | C |
|
|
|
|
|
|
|
|
(
|
2000 | (A&C) | |||||||||||||||||||||||||||||||||||||||||||||||||||||||||||||||||||
| River Ridge Estates | Austin, TX | B |
|
|
|
|
|
|
|
|
(
|
2002 | (C) | |||||||||||||||||||||||||||||||||||||||||||||||||||||||||||||||||||
| River Run | Granby, CO | — |
|
|
|
|
|
|
|
|
(
|
2018 | (C) | |||||||||||||||||||||||||||||||||||||||||||||||||||||||||||||||||||
| Riverside Club | Ruskin, FL | D |
|
|
|
|
|
|
|
|
(
|
2015 | (A) | |||||||||||||||||||||||||||||||||||||||||||||||||||||||||||||||||||
|
Riverside Drive Park
(4)
|
Augusta, ME | — |
|
|
|
|
|
|
|
|
(
|
2020 | (A) | |||||||||||||||||||||||||||||||||||||||||||||||||||||||||||||||||||
|
Riverside Village
(4)
|
Jensen Beach, FL | — |
|
|
|
|
|
|
|
|
|
2020 | (A) | |||||||||||||||||||||||||||||||||||||||||||||||||||||||||||||||||||
| Rock Crusher Canyon RV Resort | Crystal River, FL | C |
|
|
|
|
|
|
|
|
(
|
2015 | (A) | |||||||||||||||||||||||||||||||||||||||||||||||||||||||||||||||||||
|
Rolling Hills
|
Storrs, CT | C |
|
|
|
|
|
|
|
|
(
|
2019 | (A) | |||||||||||||||||||||||||||||||||||||||||||||||||||||||||||||||||||
| Roxbury Park | Goshen, IN | — |
|
|
|
|
|
|
|
|
(
|
2001 | (A) | |||||||||||||||||||||||||||||||||||||||||||||||||||||||||||||||||||
| Royal Country | Miami, FL | E |
|
|
|
|
|
|
|
|
(
|
1994 | (A) | |||||||||||||||||||||||||||||||||||||||||||||||||||||||||||||||||||
| Royal Palm Village | Haines City, FL | E |
|
|
|
|
|
|
|
|
(
|
2015 | (A) | |||||||||||||||||||||||||||||||||||||||||||||||||||||||||||||||||||
|
Royal Palms MH & RV Resort
(2)
|
Cathedral City, CA | — |
|
|
|
|
|
|
|
|
(
|
2016 | (A) | |||||||||||||||||||||||||||||||||||||||||||||||||||||||||||||||||||
| Rudgate Clinton | Clinton Township, MI | A |
|
|
|
|
|
|
|
|
(
|
2012 | (A) | |||||||||||||||||||||||||||||||||||||||||||||||||||||||||||||||||||
| Rudgate Manor | Sterling Heights, MI | A |
|
|
|
|
|
|
|
|
(
|
2012 | (A) | |||||||||||||||||||||||||||||||||||||||||||||||||||||||||||||||||||
| Saco / Old Orchard Beach KOA | Saco, ME | C |
|
|
|
|
|
|
|
|
(
|
2014 | (A) | |||||||||||||||||||||||||||||||||||||||||||||||||||||||||||||||||||
| Saddle Oak Club | Ocala, FL | D |
|
|
|
|
|
|
|
|
(
|
1995 | (A) | |||||||||||||||||||||||||||||||||||||||||||||||||||||||||||||||||||
| Saddlebrook | San Marcos, TX | — |
|
|
|
|
|
|
|
|
(
|
2002 | (C) | |||||||||||||||||||||||||||||||||||||||||||||||||||||||||||||||||||
|
San Pedro RV Resort & Marina
(6)
|
Islamorada, FL | — |
|
|
|
|
(
|
|
|
|
(
|
2016 | (A) | |||||||||||||||||||||||||||||||||||||||||||||||||||||||||||||||||||
| Sandy Lake MH & RV Resort | Carrolton, TX | — |
|
|
|
|
|
|
|
|
(
|
2016 | (A) | |||||||||||||||||||||||||||||||||||||||||||||||||||||||||||||||||||
| Saralake Estates | Sarasota, FL | — |
|
|
|
|
|
|
|
|
(
|
2016 | (A) | |||||||||||||||||||||||||||||||||||||||||||||||||||||||||||||||||||
| Savanna Club | Port St. Lucie, FL | D |
|
|
|
|
|
|
|
|
(
|
2015 | (A&C) | |||||||||||||||||||||||||||||||||||||||||||||||||||||||||||||||||||
| Scio Farms Estates | Ann Arbor, MI | B |
|
|
|
(
|
(3)
|
|
|
|
|
(
|
1995 | (A&C) | ||||||||||||||||||||||||||||||||||||||||||||||||||||||||||||||||||
| Sea Air Village | Rehoboth Beach, DE | — |
|
|
|
|
|
|
|
|
(
|
1997 | (A) | |||||||||||||||||||||||||||||||||||||||||||||||||||||||||||||||||||
|
Sea Breeze MH & RV Resort
(6)
|
Islamorada, FL | — |
|
|
|
|
|
|
|
|
(
|
2016 | (A) | |||||||||||||||||||||||||||||||||||||||||||||||||||||||||||||||||||
F - 64
SUN COMMUNITIES, INC.
REAL ESTATE AND ACCUMULATED DEPRECIATION, SCHEDULE III
DECEMBER 31, 2020
(amounts in thousands)
| Encumbrance | Initial Cost to Company | Costs Capitalized Subsequent to Acquisition (Improvements) |
Gross Amount Carried at
December 31, 2020
|
|||||||||||||||||||||||||||||||||||||||||||||||||||||||||||||||||||||||||||||
| Property Name | Location | Group | Amount | Land | Depreciable Assets | Land | Depreciable Assets | Land | Depreciable Assets | Total | Accumulated Depreciation | Date | Acquired (A) or Constructed (C) | |||||||||||||||||||||||||||||||||||||||||||||||||||||||||||||||||||
| Seaport RV Resort | Old Mystic, CT | C |
|
|
|
|
|
|
|
|
(
|
2013 | (A) | |||||||||||||||||||||||||||||||||||||||||||||||||||||||||||||||||||
| Seashore Campsites & RV Resort | Cape May, NJ | D |
|
|
|
|
|
|
|
|
(
|
2014 | (A) | |||||||||||||||||||||||||||||||||||||||||||||||||||||||||||||||||||
| Serendipity | North Fort Myers, FL | — |
|
|
|
|
|
|
|
|
(
|
2015 | (A) | |||||||||||||||||||||||||||||||||||||||||||||||||||||||||||||||||||
| Settler’s Rest RV Resort | Zephyrhills, FL | C |
|
|
|
|
|
|
|
|
(
|
2016 | (A) | |||||||||||||||||||||||||||||||||||||||||||||||||||||||||||||||||||
| Shadow Wood Village | Hudson, FL | — |
|
|
|
|
|
|
|
|
(
|
2016 | (A) | |||||||||||||||||||||||||||||||||||||||||||||||||||||||||||||||||||
| Shady Pines MH & RV Resort | Galloway Township, NJ | — |
|
|
|
|
|
|
|
|
(
|
2016 | (A) | |||||||||||||||||||||||||||||||||||||||||||||||||||||||||||||||||||
| Shady Road Villas | Ocala, FL | — |
|
|
|
|
|
|
|
|
(
|
2016 | (A) | |||||||||||||||||||||||||||||||||||||||||||||||||||||||||||||||||||
| Sheffield Estates | Auburn Hills, MI | C |
|
|
|
|
|
|
|
|
(
|
2006 | (A) | |||||||||||||||||||||||||||||||||||||||||||||||||||||||||||||||||||
|
Shelby Forest
|
Shelby Twp, MI | — |
|
|
|
|
|
|
|
|
(
|
2019 | (A) | |||||||||||||||||||||||||||||||||||||||||||||||||||||||||||||||||||
|
Shelby West
|
Shelby Twp, MI | — |
|
|
|
|
|
|
|
|
(
|
2019 | (A) | |||||||||||||||||||||||||||||||||||||||||||||||||||||||||||||||||||
| Shell Creek RV Resort & Marina | Punta Gorda, FL | E |
|
|
|
|
|
|
|
|
(
|
2016 | (A) | |||||||||||||||||||||||||||||||||||||||||||||||||||||||||||||||||||
|
Shenandoah Acres Family
Campground
(4)
|
Stuarts Draft, VA | — |
|
|
|
|
|
|
|
|
(
|
2020 | (A) | |||||||||||||||||||||||||||||||||||||||||||||||||||||||||||||||||||
| Sherkston Shores Beach Resort & Campground | Sherkston, ON | — |
|
|
|
|
|
|
|
|
(
|
2016 | (A) | |||||||||||||||||||||||||||||||||||||||||||||||||||||||||||||||||||
| Siesta Bay RV Park | Ft. Myers, FL | B |
|
|
|
|
|
|
|
|
(
|
1996 | (A) | |||||||||||||||||||||||||||||||||||||||||||||||||||||||||||||||||||
| Silver Birches RV Resort & Campground | Lambton Shores, ON | — |
|
|
|
(
|
(1)
|
|
|
|
|
(
|
2016 | (A) | ||||||||||||||||||||||||||||||||||||||||||||||||||||||||||||||||||
| Silver Creek RV Resort | Mears, MI | — |
|
|
|
|
|
|
|
|
(
|
2018 | (C) | |||||||||||||||||||||||||||||||||||||||||||||||||||||||||||||||||||
| Silver Springs | Clinton Township, MI | B |
|
|
|
|
|
|
|
|
(
|
2012 | (A) | |||||||||||||||||||||||||||||||||||||||||||||||||||||||||||||||||||
| Sky Harbor | Cheektowaga, NY | A |
|
|
|
|
|
|
|
|
(
|
2014 | (A) | |||||||||||||||||||||||||||||||||||||||||||||||||||||||||||||||||||
| Skyline | Fort Collins, CO | E |
|
|
|
|
|
|
|
|
(
|
2014 | (A) | |||||||||||||||||||||||||||||||||||||||||||||||||||||||||||||||||||
|
Slickrock RV Resort & Campground
|
Moab, UT | — |
|
|
|
|
|
|
|
|
(
|
2019 | (A) | |||||||||||||||||||||||||||||||||||||||||||||||||||||||||||||||||||
| Smith Creek Crossing | Granby, CO | — |
|
|
|
|
|
|
|
|
(
|
2018 | (C) | |||||||||||||||||||||||||||||||||||||||||||||||||||||||||||||||||||
| Southern Charm MH & RV Resort | Zephyrhills, FL | E |
|
|
|
|
|
|
|
|
(
|
2016 | (A) | |||||||||||||||||||||||||||||||||||||||||||||||||||||||||||||||||||
| Southern Hills / Northridge Place | Stewartville, MN | E |
|
|
|
|
|
|
|
|
(
|
2014 | (A&C) | |||||||||||||||||||||||||||||||||||||||||||||||||||||||||||||||||||
|
Southern Palms
|
Ladson, SC | C |
|
|
|
|
|
|
|
|
(
|
2019 | (A) | |||||||||||||||||||||||||||||||||||||||||||||||||||||||||||||||||||
| Southern Pines | Bradenton, FL | — |
|
|
|
|
|
|
|
|
(
|
2016 | (A) | |||||||||||||||||||||||||||||||||||||||||||||||||||||||||||||||||||
| Southport Springs Golf & Country Club | Zephyrhills, FL | D |
|
|
|
|
|
|
|
|
(
|
2015 | (A&C) | |||||||||||||||||||||||||||||||||||||||||||||||||||||||||||||||||||
|
Southside Landing
|
Cambridge, MD | C |
|
|
|
|
|
|
|
|
(
|
2019 | (A) | |||||||||||||||||||||||||||||||||||||||||||||||||||||||||||||||||||
| Southwood Village | Grand Rapids, MI | — |
|
|
|
|
|
|
|
|
(
|
2011 | (A) | |||||||||||||||||||||||||||||||||||||||||||||||||||||||||||||||||||
| Spanish Main MH & RV Resort | Thonotasassa, FL | — |
|
|
|
|
|
|
|
|
(
|
2016 | (A) | |||||||||||||||||||||||||||||||||||||||||||||||||||||||||||||||||||
F - 65
SUN COMMUNITIES, INC.
REAL ESTATE AND ACCUMULATED DEPRECIATION, SCHEDULE III
DECEMBER 31, 2020
(amounts in thousands)
| Encumbrance | Initial Cost to Company | Costs Capitalized Subsequent to Acquisition (Improvements) |
Gross Amount Carried at
December 31, 2020
|
|||||||||||||||||||||||||||||||||||||||||||||||||||||||||||||||||||||||||||||
| Property Name | Location | Group | Amount | Land | Depreciable Assets | Land | Depreciable Assets | Land | Depreciable Assets | Total | Accumulated Depreciation | Date | Acquired (A) or Constructed (C) | |||||||||||||||||||||||||||||||||||||||||||||||||||||||||||||||||||
| St. Clair Place | St. Clair, MI | A |
|
|
|
|
|
|
|
|
(
|
1998 | (A) | |||||||||||||||||||||||||||||||||||||||||||||||||||||||||||||||||||
| Stonebridge (MI) | Richfield Twp, MI | — |
|
|
|
|
|
|
|
|
(
|
1998 | (C) | |||||||||||||||||||||||||||||||||||||||||||||||||||||||||||||||||||
| Stonebridge (TX) | San Antonio, TX | C |
|
|
|
(
|
(3)
|
|
|
|
|
(
|
2000 | (A&C) | ||||||||||||||||||||||||||||||||||||||||||||||||||||||||||||||||||
| Stonebrook | Homosassa, FL | — |
|
|
|
|
|
|
|
|
(
|
2015 | (A) | |||||||||||||||||||||||||||||||||||||||||||||||||||||||||||||||||||
|
Strafford / Lake Winnipesaukee South KOA
(2)
|
Strafford, NH | — |
|
|
|
|
|
|
|
|
(
|
2019 | (A) | |||||||||||||||||||||||||||||||||||||||||||||||||||||||||||||||||||
| Summit Ridge | Converse, TX | C |
|
|
|
(
|
(3)
|
|
|
|
|
(
|
2000 | (A&C) | ||||||||||||||||||||||||||||||||||||||||||||||||||||||||||||||||||
| Sun N Fun RV Resort | Sarasota, FL | D |
|
|
|
(
|
(3)
|
|
|
|
|
(
|
2016 | (A) | ||||||||||||||||||||||||||||||||||||||||||||||||||||||||||||||||||
|
Sun Outdoors Sevierville Pigeon Forge
(9)
|
Sevierville, TN | — |
|
|
|
|
|
|
|
|
(
|
2019 | (A) | |||||||||||||||||||||||||||||||||||||||||||||||||||||||||||||||||||
| Sun Valley | Apache Junction, AZ | D |
|
|
|
|
|
|
|
|
(
|
2014 | (A) | |||||||||||||||||||||||||||||||||||||||||||||||||||||||||||||||||||
| Sun Villa Estates | Reno, NV | B |
|
|
|
(
|
(3)
|
|
|
|
|
(
|
1998 | (A) | ||||||||||||||||||||||||||||||||||||||||||||||||||||||||||||||||||
| Suncoast Gateway | Port Richey, FL | — |
|
|
|
|
|
|
|
|
(
|
2016 | (A) | |||||||||||||||||||||||||||||||||||||||||||||||||||||||||||||||||||
| Sundance | Zephyrhills, FL | B |
|
|
|
|
|
|
|
|
(
|
2015 | (A) | |||||||||||||||||||||||||||||||||||||||||||||||||||||||||||||||||||
| Sunlake Estates | Grand Island, FL | D |
|
|
|
|
|
|
|
|
(
|
2015 | (A) | |||||||||||||||||||||||||||||||||||||||||||||||||||||||||||||||||||
| Sunset Beach RV Resort | Cape Charles, VA | — |
|
|
|
|
|
|
|
|
(
|
2016 | (A) | |||||||||||||||||||||||||||||||||||||||||||||||||||||||||||||||||||
| Sunset Harbor at Cow Key Marina | Key West, FL | — |
|
|
|
|
|
|
|
|
(
|
2016 | (A) | |||||||||||||||||||||||||||||||||||||||||||||||||||||||||||||||||||
| Sunset Lakes RV Resort | Hillsdale, IL | — |
|
|
|
|
|
|
|
|
(
|
2017 | (A) | |||||||||||||||||||||||||||||||||||||||||||||||||||||||||||||||||||
| Sunset Ridge (MI) | Portland, MI | — |
|
|
|
(
|
(3)
|
|
|
|
|
(
|
1998 | (C) | ||||||||||||||||||||||||||||||||||||||||||||||||||||||||||||||||||
| Sunset Ridge (TX) | Kyle, TX | C |
|
|
|
|
|
|
|
|
(
|
2000 | (A&C) | |||||||||||||||||||||||||||||||||||||||||||||||||||||||||||||||||||
| Swan Meadow Village | Dillon, CO | E |
|
|
|
|
|
|
|
|
(
|
2014 | (A) | |||||||||||||||||||||||||||||||||||||||||||||||||||||||||||||||||||
| Sweetwater RV Resort | Zephyrhills, FL | E |
|
|
|
|
|
|
|
|
(
|
2016 | (A) | |||||||||||||||||||||||||||||||||||||||||||||||||||||||||||||||||||
| Sycamore Village | Mason, MI | — |
|
|
|
|
|
|
|
|
(
|
2011 | (A) | |||||||||||||||||||||||||||||||||||||||||||||||||||||||||||||||||||
| Tallowwood Isle | Coconut Creek, FL | C |
|
|
|
|
|
|
|
|
(
|
2016 | (A) | |||||||||||||||||||||||||||||||||||||||||||||||||||||||||||||||||||
| Tamarac Village MH & RV Resort | Ludington, MI | D |
|
|
|
|
|
|
|
|
(
|
2011 | (A) | |||||||||||||||||||||||||||||||||||||||||||||||||||||||||||||||||||
| Tampa East MH & RV Resort | Dover, FL | A |
|
|
|
|
|
|
|
|
(
|
2005 | (A) | |||||||||||||||||||||||||||||||||||||||||||||||||||||||||||||||||||
|
The Colony
(2)
|
Oxnard, CA | — |
|
|
|
|
|
|
|
|
(
|
2016 | (A) | |||||||||||||||||||||||||||||||||||||||||||||||||||||||||||||||||||
| The Grove at Alta Ridge | Thornton, CO | E |
|
|
|
|
|
|
|
|
(
|
2014 | (A) | |||||||||||||||||||||||||||||||||||||||||||||||||||||||||||||||||||
| The Hamptons Golf & Country Club | Auburndale, FL | D |
|
|
|
|
|
|
|
|
(
|
2015 | (A) | |||||||||||||||||||||||||||||||||||||||||||||||||||||||||||||||||||
| The Hideaway | Key West, FL | — |
|
|
|
|
|
|
|
|
(
|
2016 | (A) | |||||||||||||||||||||||||||||||||||||||||||||||||||||||||||||||||||
| The Hills | Apopka, FL | — |
|
|
|
|
|
|
|
|
(
|
2016 | (A) | |||||||||||||||||||||||||||||||||||||||||||||||||||||||||||||||||||
|
The Landings at Lake Henry
(9)
|
Haines City, FL | D |
|
|
|
|
|
|
|
|
(
|
2015 | (A) | |||||||||||||||||||||||||||||||||||||||||||||||||||||||||||||||||||
F - 66
SUN COMMUNITIES, INC.
REAL ESTATE AND ACCUMULATED DEPRECIATION, SCHEDULE III
DECEMBER 31, 2020
(amounts in thousands)
| Encumbrance | Initial Cost to Company | Costs Capitalized Subsequent to Acquisition (Improvements) |
Gross Amount Carried at
December 31, 2020
|
|||||||||||||||||||||||||||||||||||||||||||||||||||||||||||||||||||||||||||||
| Property Name | Location | Group | Amount | Land | Depreciable Assets | Land | Depreciable Assets | Land | Depreciable Assets | Total | Accumulated Depreciation | Date | Acquired (A) or Constructed (C) | |||||||||||||||||||||||||||||||||||||||||||||||||||||||||||||||||||
| The Ridge | Davenport, FL | D |
|
|
|
|
|
|
|
|
(
|
2015 | (A) | |||||||||||||||||||||||||||||||||||||||||||||||||||||||||||||||||||
| The Sands RV & Golf Resort | Desert Hot Springs, CA | — |
|
|
|
|
|
|
|
|
(
|
2018 | (A) | |||||||||||||||||||||||||||||||||||||||||||||||||||||||||||||||||||
| The Valley | Apopka, FL | — |
|
|
|
|
|
|
|
|
(
|
2016 | (A) | |||||||||||||||||||||||||||||||||||||||||||||||||||||||||||||||||||
| The Villas at Calla Pointe | Cheektowaga, NY | A |
|
|
|
|
|
|
|
|
(
|
2014 | (A) | |||||||||||||||||||||||||||||||||||||||||||||||||||||||||||||||||||
|
Three Gardens
|
Southington, CT | C |
|
|
|
|
|
|
|
|
(
|
2019 | (A) | |||||||||||||||||||||||||||||||||||||||||||||||||||||||||||||||||||
| Three Lakes | Hudson, FL | C |
|
|
|
|
|
|
|
|
(
|
2012 | (A) | |||||||||||||||||||||||||||||||||||||||||||||||||||||||||||||||||||
| Thunderhill Estates | Sturgeon Bay, WI | E |
|
|
|
|
|
|
|
|
(
|
2014 | (A) | |||||||||||||||||||||||||||||||||||||||||||||||||||||||||||||||||||
| Timber Ridge | Ft. Collins, CO | D |
|
|
|
|
|
|
|
|
(
|
1996 | (A) | |||||||||||||||||||||||||||||||||||||||||||||||||||||||||||||||||||
| Timberline Estates | Coopersville, MI | B |
|
|
|
|
|
|
|
|
(
|
1994 | (A) | |||||||||||||||||||||||||||||||||||||||||||||||||||||||||||||||||||
| Town & Country Mobile Village | Traverse City, MI | A |
|
|
|
|
|
|
|
|
(
|
1996 | (A) | |||||||||||||||||||||||||||||||||||||||||||||||||||||||||||||||||||
| Town & Country Village | Lisbon, ME | E |
|
|
|
|
|
|
|
|
(
|
2014 | (A) | |||||||||||||||||||||||||||||||||||||||||||||||||||||||||||||||||||
| Trailside RV Resort & Campground | Seguin, ON | — |
|
|
|
(
|
(1)
|
|
|
|
|
(
|
2016 | (A) | ||||||||||||||||||||||||||||||||||||||||||||||||||||||||||||||||||
| Traveler’s World MH & RV Resort | San Antonio, TX | — |
|
|
|
|
|
|
|
|
(
|
2016 | (A) | |||||||||||||||||||||||||||||||||||||||||||||||||||||||||||||||||||
| Treetops RV Resort | Arlington, TX | C |
|
|
|
|
|
|
|
|
(
|
2016 | (A) | |||||||||||||||||||||||||||||||||||||||||||||||||||||||||||||||||||
|
Troy Villa
(4)
|
Troy, MI | — |
|
|
|
|
|
|
|
|
(
|
2020 | (A) | |||||||||||||||||||||||||||||||||||||||||||||||||||||||||||||||||||
| Vallecito | Newbury Park, CA | D |
|
|
|
|
|
|
|
|
(
|
2016 | (A) | |||||||||||||||||||||||||||||||||||||||||||||||||||||||||||||||||||
| Victor Villa | Victorville, CA | D |
|
|
|
|
|
|
|
|
(
|
2016 | (A) | |||||||||||||||||||||||||||||||||||||||||||||||||||||||||||||||||||
| Vines RV Resort | Paso Robles, CA | C |
|
|
|
|
|
|
|
|
(
|
2013 | (A) | |||||||||||||||||||||||||||||||||||||||||||||||||||||||||||||||||||
| Vista Del Lago | Scotts Valley, CA | D |
|
|
|
|
|
|
|
|
(
|
2016 | (A) | |||||||||||||||||||||||||||||||||||||||||||||||||||||||||||||||||||
| Vista Del Lago MH & RV Resort | Bradenton, FL | E |
|
|
|
|
|
|
|
|
(
|
2016 | (A) | |||||||||||||||||||||||||||||||||||||||||||||||||||||||||||||||||||
| Vizcaya Lakes | Port Charlotte, FL | C |
|
|
|
|
|
|
|
|
(
|
2015 | (A) | |||||||||||||||||||||||||||||||||||||||||||||||||||||||||||||||||||
| Wagon Wheel RV Resort & Campground | Old Orchard Beach, ME | C |
|
|
|
|
|
|
|
|
(
|
2013 | (A) | |||||||||||||||||||||||||||||||||||||||||||||||||||||||||||||||||||
| Walden Woods | Homosassa, FL | D |
|
|
|
|
|
|
|
|
(
|
2015 | (A) | |||||||||||||||||||||||||||||||||||||||||||||||||||||||||||||||||||
| Warren Dunes Village | Bridgman, MI | C |
|
|
|
|
|
|
|
|
(
|
2011 | (A&C) | |||||||||||||||||||||||||||||||||||||||||||||||||||||||||||||||||||
| Water Oak Country Club Estates | Lady Lake, FL | D |
|
|
|
|
|
|
|
|
(
|
1993 | (A&C) | |||||||||||||||||||||||||||||||||||||||||||||||||||||||||||||||||||
| Waters Edge RV Resort | Zephyrhills, FL | E |
|
|
|
|
|
|
|
|
(
|
2016 | (A) | |||||||||||||||||||||||||||||||||||||||||||||||||||||||||||||||||||
| Waverly Shores Village | Holland, MI | B |
|
|
|
|
|
|
|
|
(
|
2011 | (A&C) | |||||||||||||||||||||||||||||||||||||||||||||||||||||||||||||||||||
| West Village Estates | Romulus, MI | B |
|
|
|
|
|
|
|
|
(
|
2012 | (A) | |||||||||||||||||||||||||||||||||||||||||||||||||||||||||||||||||||
| Westbrook Senior Village | Toledo, OH | D |
|
|
|
|
|
|
|
|
(
|
2001 | (A) | |||||||||||||||||||||||||||||||||||||||||||||||||||||||||||||||||||
| Westbrook Village | Toledo, OH | B |
|
|
|
|
|
|
|
|
(
|
1999 | (A) | |||||||||||||||||||||||||||||||||||||||||||||||||||||||||||||||||||
| Westside Ridge | Auburndale, FL | D |
|
|
|
|
|
|
|
|
(
|
2015 | (A) | |||||||||||||||||||||||||||||||||||||||||||||||||||||||||||||||||||
F - 67
SUN COMMUNITIES, INC.
REAL ESTATE AND ACCUMULATED DEPRECIATION, SCHEDULE III
DECEMBER 31, 2020
(amounts in thousands)
| Encumbrance | Initial Cost to Company | Costs Capitalized Subsequent to Acquisition (Improvements) |
Gross Amount Carried at
December 31, 2020
|
|||||||||||||||||||||||||||||||||||||||||||||||||||||||||||||||||||||||||||||
| Property Name | Location | Group | Amount | Land | Depreciable Assets | Land | Depreciable Assets | Land | Depreciable Assets | Total | Accumulated Depreciation | Date | Acquired (A) or Constructed (C) | |||||||||||||||||||||||||||||||||||||||||||||||||||||||||||||||||||
| Westward Ho RV Resort & Campground | Glenbeulah, WI | C |
|
|
|
|
|
|
|
|
(
|
2013 | (A) | |||||||||||||||||||||||||||||||||||||||||||||||||||||||||||||||||||
| Westward Shores Cottages & RV Resort | West Ossipee, NH | — |
|
|
|
|
|
|
|
|
(
|
2018 | (A) | |||||||||||||||||||||||||||||||||||||||||||||||||||||||||||||||||||
| White Lake Mobile Home Village | White Lake, MI | B |
|
|
|
|
|
|
|
|
(
|
1997 | (A&C) | |||||||||||||||||||||||||||||||||||||||||||||||||||||||||||||||||||
|
Whitewater RV Resort
(5)
|
Mountain View, AR | — |
|
|
|
|
|
|
|
|
(
|
2019 | (C) | |||||||||||||||||||||||||||||||||||||||||||||||||||||||||||||||||||
| Wild Acres RV Resort & Campground | Old Orchard Beach, ME | C |
|
|
|
|
|
|
|
|
(
|
2013 | (A) | |||||||||||||||||||||||||||||||||||||||||||||||||||||||||||||||||||
| Wildwood Community | Sandwich, IL | D |
|
|
|
|
|
|
|
|
(
|
2014 | (A) | |||||||||||||||||||||||||||||||||||||||||||||||||||||||||||||||||||
| Willow Lake RV Resort & Campground | Scotland, ON | — |
|
|
|
(
|
(1)
|
|
|
|
|
(
|
2016 | (A) | ||||||||||||||||||||||||||||||||||||||||||||||||||||||||||||||||||
| Willowbrook Place | Toledo, OH | B |
|
|
|
|
|
|
|
|
(
|
1997 | (A) | |||||||||||||||||||||||||||||||||||||||||||||||||||||||||||||||||||
| Willowood RV Resort & Campground | Amherstburg, ON | — |
|
|
|
(
|
(1)
|
|
|
|
|
(
|
2016 | (A) | ||||||||||||||||||||||||||||||||||||||||||||||||||||||||||||||||||
| Windham Hills Estates | Jackson, MI | — |
|
|
|
|
|
|
|
|
(
|
1998 | (A&C) | |||||||||||||||||||||||||||||||||||||||||||||||||||||||||||||||||||
| Windmill Village | Davenport, FL | D |
|
|
|
|
|
|
|
|
(
|
2015 | (A) | |||||||||||||||||||||||||||||||||||||||||||||||||||||||||||||||||||
| Windsor Woods Village | Wayland, MI | C |
|
|
|
|
|
|
|
|
(
|
2011 | (A) | |||||||||||||||||||||||||||||||||||||||||||||||||||||||||||||||||||
| Wine Country RV Resort | Paso Robles, CA | C |
|
|
|
|
|
|
|
|
(
|
2014 | (A&C) | |||||||||||||||||||||||||||||||||||||||||||||||||||||||||||||||||||
| Woodhaven Place | Woodhaven, MI | B |
|
|
|
|
|
|
|
|
(
|
1998 | (A) | |||||||||||||||||||||||||||||||||||||||||||||||||||||||||||||||||||
| Woodlake Trails | San Antonio, TX | C |
|
|
|
(
|
(3)
|
|
|
|
|
(
|
2000 | (A&C) | ||||||||||||||||||||||||||||||||||||||||||||||||||||||||||||||||||
| Woodland Lake RV Resort & Campground | Bornholm, ON | — |
|
|
|
(
|
(1)
|
|
|
|
|
(
|
2016 | (A) | ||||||||||||||||||||||||||||||||||||||||||||||||||||||||||||||||||
| Woodland Park Estates | Eugene, OR | — |
|
|
|
|
|
|
|
|
(
|
1998 | (A) | |||||||||||||||||||||||||||||||||||||||||||||||||||||||||||||||||||
| Woodlands at Church Lake | Groveland, FL | — |
|
|
|
|
|
|
|
|
(
|
2015 | (A) | |||||||||||||||||||||||||||||||||||||||||||||||||||||||||||||||||||
| Woodside Terrace | Holland, OH | B |
|
|
|
|
|
|
|
|
(
|
1997 | (A) | |||||||||||||||||||||||||||||||||||||||||||||||||||||||||||||||||||
|
Woodsmoke Camping Resort
(4)
|
Fort Myers, FL | — |
|
|
|
|
|
|
|
|
(
|
2020 | (A) | |||||||||||||||||||||||||||||||||||||||||||||||||||||||||||||||||||
| Wymberly | Martinez, GA | C |
|
|
|
|
|
|
|
|
(
|
2019 | (A) | |||||||||||||||||||||||||||||||||||||||||||||||||||||||||||||||||||
| Yankee Village | Old Saybrook, CT | C |
|
|
|
|
|
|
|
|
(
|
2019 | (A) | |||||||||||||||||||||||||||||||||||||||||||||||||||||||||||||||||||
| $ |
|
$ |
|
$ |
|
$ |
|
$ |
|
$ |
|
$ |
|
$ |
|
$ |
(
|
|||||||||||||||||||||||||||||||||||||||||||||||||||||||||||||||
|
Corporate Headquarters and Other
(7)
|
Southfield, MI | — |
|
|
|
|
|
|
|
|
(
|
|||||||||||||||||||||||||||||||||||||||||||||||||||||||||||||||||||||
| $ |
|
$ |
|
$ |
|
$ |
|
$ |
|
$ |
|
$ |
|
$ |
|
$ |
(
|
|||||||||||||||||||||||||||||||||||||||||||||||||||||||||||||||
A These properties collateralize $
267.3
million of secured debt.
B These properties collateralize $
1.2
billion of secured debt.
C These properties are unencumbered and support the borrowing base for (a) our unsecured senior credit facility which had $
40.4
million outstanding on the revolving loan and no borrowings on the term loan, (b) an unsecured term loan facility which had $
45.0
million outstanding.
F - 68
SUN COMMUNITIES, INC.
REAL ESTATE AND ACCUMULATED DEPRECIATION, SCHEDULE III
DECEMBER 31, 2020
(amounts in thousands)
D These properties collateralize $
1.7
billion of secured debt.
E These properties collateralize $
370.0
million of secured debt.
(1)
Gross amount carried at December 31, 2020, at our Canadian properties, reflects the impact of foreign currency translation.
(2)
All or part of this property is subject to a ground lease.
(3)
Gross amount carried at December 31, 2020 has decreased at this property due to a partial disposition of land or depreciable assets, as applicable.
(4)
This property was acquired during 2020.
(5)
This property was not included in our community count as of December 31, 2020 as it was not fully developed.
(6)
This property was impaired as a result of Hurricane Irma in September 2017.
(7)
Corporate Headquarters and other fixed assets.
(8)
This property was split into two separate properties in 2020.
(9)
This property had a name change in 2020.
The following tables set forth real estate and accumulated depreciation relating to our Safe Harbor branded marinas.
| Encumbrance | Initial Cost to Company | Costs Capitalized Subsequent to Acquisition (Improvements) |
Gross Amount Carried at
December 31, 2020
|
|||||||||||||||||||||||||||||||||||||||||||||||||||||||||||||||||||||||||||||
| Property Name | Location | Group | Amount | Land | Depreciable Assets | Land | Depreciable Assets | Land | Depreciable Assets | Total | Accumulated Depreciation | Date | Acquired (A) or Constructed (C) | |||||||||||||||||||||||||||||||||||||||||||||||||||||||||||||||||||
| Anacapa Isle | Oxnard, CA | — | — | $ |
|
$ |
|
$ |
|
$ |
|
$ |
|
$ |
|
$ |
|
$ |
|
2020 | (A) | |||||||||||||||||||||||||||||||||||||||||||||||||||||||||||
| Annapolis | Annapolis, MD | A | — |
|
|
|
|
|
|
|
|
2020 | (A) | |||||||||||||||||||||||||||||||||||||||||||||||||||||||||||||||||||
| Aqua Yacht | Iuka, MS | A | — |
|
|
|
|
|
|
|
(
|
2020 | (A) | |||||||||||||||||||||||||||||||||||||||||||||||||||||||||||||||||||
| Aqualand | Flowery Branch, GA | A | — |
|
|
|
|
|
|
|
(
|
2020 | (A) | |||||||||||||||||||||||||||||||||||||||||||||||||||||||||||||||||||
| Bahia Bleu | Thunderbolt, GA | A | — |
|
|
|
(
|
|
|
|
(
|
2020 | (A) | |||||||||||||||||||||||||||||||||||||||||||||||||||||||||||||||||||
| Ballena Isle | Alameda, CA | A | — |
|
|
|
|
|
|
|
(
|
2020 | (A) | |||||||||||||||||||||||||||||||||||||||||||||||||||||||||||||||||||
| Beaufort | Beaufort, SC | A | — |
|
|
|
|
|
|
|
(
|
2020 | (A) | |||||||||||||||||||||||||||||||||||||||||||||||||||||||||||||||||||
| Beaver Creek | Monticello, KY | A | — |
|
|
|
|
|
|
|
(
|
2020 | (A) | |||||||||||||||||||||||||||||||||||||||||||||||||||||||||||||||||||
| Belle Maer | Harrison Township, MI | A | — |
|
|
|
(
|
|
|
|
(
|
2020 | (A) | |||||||||||||||||||||||||||||||||||||||||||||||||||||||||||||||||||
| Bohemia Vista | Chesapeake Bay, MD | A | — |
|
|
|
|
|
|
|
(
|
2020 | (A) | |||||||||||||||||||||||||||||||||||||||||||||||||||||||||||||||||||
| Brady Mountain | Royal, AR | A | — |
|
|
|
(
|
|
|
|
(
|
2020 | (A) | |||||||||||||||||||||||||||||||||||||||||||||||||||||||||||||||||||
| Bristol | Charleston, SC | A | — |
|
|
|
|
|
|
|
(
|
2020 | (A) | |||||||||||||||||||||||||||||||||||||||||||||||||||||||||||||||||||
| Bruce & Johnsons | Branford, CT | A | — |
|
|
|
|
|
|
|
(
|
2020 | (A) | |||||||||||||||||||||||||||||||||||||||||||||||||||||||||||||||||||
| Burnside | Somerset, KY | A | — |
|
|
|
|
|
|
|
(
|
2020 | (A) | |||||||||||||||||||||||||||||||||||||||||||||||||||||||||||||||||||
| Burnt Store | Punta Gorda, FL | A | — |
|
|
|
|
|
|
|
(
|
2020 | (A) | |||||||||||||||||||||||||||||||||||||||||||||||||||||||||||||||||||
| Calusa Island | Goodland, FL | A | — |
|
|
|
|
|
|
|
(
|
2020 | (A) | |||||||||||||||||||||||||||||||||||||||||||||||||||||||||||||||||||
| Cape Harbour | Cape Coral, FL | A | — |
|
|
|
|
|
|
|
(
|
2020 | (A) | |||||||||||||||||||||||||||||||||||||||||||||||||||||||||||||||||||
| Capri | Port Washington, NY | A | — |
|
|
|
|
|
|
|
(
|
2020 | (A) | |||||||||||||||||||||||||||||||||||||||||||||||||||||||||||||||||||
F - 69
SUN COMMUNITIES, INC.
REAL ESTATE AND ACCUMULATED DEPRECIATION, SCHEDULE III
DECEMBER 31, 2020
(amounts in thousands)
| Encumbrance | Initial Cost to Company | Costs Capitalized Subsequent to Acquisition (Improvements) |
Gross Amount Carried at
December 31, 2020
|
|||||||||||||||||||||||||||||||||||||||||||||||||||||||||||||||||||||||||||||
| Property Name | Location | Group | Amount | Land | Depreciable Assets | Land | Depreciable Assets | Land | Depreciable Assets | Total | Accumulated Depreciation | Date | Acquired (A) or Constructed (C) | |||||||||||||||||||||||||||||||||||||||||||||||||||||||||||||||||||
| Carroll Island | Baltimore, MD | A | — |
|
|
|
|
|
|
|
(
|
2020 | (A) | |||||||||||||||||||||||||||||||||||||||||||||||||||||||||||||||||||
| Charleston City | Charleston, SC | A | — |
|
|
|
|
|
|
|
(
|
2020 | (A) | |||||||||||||||||||||||||||||||||||||||||||||||||||||||||||||||||||
| City Boatyard | Charleston, SC | A | — |
|
|
|
|
|
|
|
(
|
2020 | (A) | |||||||||||||||||||||||||||||||||||||||||||||||||||||||||||||||||||
| Cove Haven | Barrington, RI | A | — |
|
|
|
|
|
|
|
(
|
2020 | (A) | |||||||||||||||||||||||||||||||||||||||||||||||||||||||||||||||||||
| Cowesett | Warwick, RI | A | — |
|
|
|
|
|
|
|
(
|
2020 | (A) | |||||||||||||||||||||||||||||||||||||||||||||||||||||||||||||||||||
| Crystal Point | Point Pleasant, NJ | A | — |
|
|
|
|
|
|
|
(
|
2020 | (A) | |||||||||||||||||||||||||||||||||||||||||||||||||||||||||||||||||||
|
Dauntless
(1)
|
Essex, CT | A | — |
|
|
|
|
|
|
|
(
|
2020 | (A) | |||||||||||||||||||||||||||||||||||||||||||||||||||||||||||||||||||
|
Dauntless Shipyard
(1)
|
Essex, CT | A | — |
|
|
|
|
|
|
|
|
2020 | (A) | |||||||||||||||||||||||||||||||||||||||||||||||||||||||||||||||||||
| Deep River | Deep River, CT | A | — |
|
|
|
|
|
|
|
(
|
2020 | (A) | |||||||||||||||||||||||||||||||||||||||||||||||||||||||||||||||||||
| Eagle Cove | Byrdstown, TN | A | — |
|
|
|
|
|
|
|
(
|
2020 | (A) | |||||||||||||||||||||||||||||||||||||||||||||||||||||||||||||||||||
| Emerald Point | Austin, TX | A | — |
|
|
|
|
|
|
|
(
|
2020 | (A) | |||||||||||||||||||||||||||||||||||||||||||||||||||||||||||||||||||
| Emeryville | Emeryville, CA | A | — |
|
|
|
|
|
|
|
(
|
2020 | (A) | |||||||||||||||||||||||||||||||||||||||||||||||||||||||||||||||||||
|
Essex Island
(1)
|
Essex, CT | A | — |
|
|
|
|
|
|
|
|
2020 | (A) | |||||||||||||||||||||||||||||||||||||||||||||||||||||||||||||||||||
| Ferry Point | Old Saybrook, CT | A | — |
|
|
|
|
|
|
|
(
|
2020 | (A) | |||||||||||||||||||||||||||||||||||||||||||||||||||||||||||||||||||
| Fiddler's Cove | North Falmouth, MA | A | — |
|
|
|
|
|
|
|
(
|
2020 | (A) | |||||||||||||||||||||||||||||||||||||||||||||||||||||||||||||||||||
| Gaines | Rouses Point, NY | A | — |
|
|
|
|
|
|
|
(
|
2020 | (A) | |||||||||||||||||||||||||||||||||||||||||||||||||||||||||||||||||||
| Glen Cove | Glen Cove, NY | A | — |
|
|
|
|
|
|
|
(
|
2020 | (A) | |||||||||||||||||||||||||||||||||||||||||||||||||||||||||||||||||||
| Grand Isle | Grand Haven, MI | A | — |
|
|
|
|
|
|
|
(
|
2020 | (A) | |||||||||||||||||||||||||||||||||||||||||||||||||||||||||||||||||||
| Great Island | Harpswell, ME | A | — |
|
|
|
|
|
|
|
(
|
2020 | (A) | |||||||||||||||||||||||||||||||||||||||||||||||||||||||||||||||||||
| Great Lakes | Muskegon, MI | A | — |
|
|
|
|
|
|
|
(
|
2020 | (A) | |||||||||||||||||||||||||||||||||||||||||||||||||||||||||||||||||||
| Great Oak Landing | Chestertown, MD | A | — |
|
|
|
|
|
|
|
(
|
2020 | (A) | |||||||||||||||||||||||||||||||||||||||||||||||||||||||||||||||||||
| Green Harbor | Marshfield, MA | A | — |
|
|
|
|
|
|
|
(
|
2020 | (A) | |||||||||||||||||||||||||||||||||||||||||||||||||||||||||||||||||||
|
Greenport
(2)
|
Greenport, NY | A | — |
|
|
|
|
|
|
|
(
|
2020 | (A) | |||||||||||||||||||||||||||||||||||||||||||||||||||||||||||||||||||
| Greenwich Bay | Warwick, RI | A | — |
|
|
|
|
|
|
|
(
|
2020 | (A) | |||||||||||||||||||||||||||||||||||||||||||||||||||||||||||||||||||
| Grider Hill | Albany, KY | A | — |
|
|
|
|
|
|
|
(
|
2020 | (A) | |||||||||||||||||||||||||||||||||||||||||||||||||||||||||||||||||||
| Hacks Point | Earleville, MD | A | — |
|
|
|
|
|
|
|
(
|
2020 | (A) | |||||||||||||||||||||||||||||||||||||||||||||||||||||||||||||||||||
| Harbor House | Stamford, CT | A | — |
|
|
|
|
|
|
|
(
|
2020 | (A) | |||||||||||||||||||||||||||||||||||||||||||||||||||||||||||||||||||
| Harbors View | Afton, OK | A | — |
|
|
|
|
|
|
|
(
|
2020 | (A) | |||||||||||||||||||||||||||||||||||||||||||||||||||||||||||||||||||
| Harbortown | Fort Pierce, FL | A | — |
|
|
|
|
|
|
|
(
|
2020 | (A) | |||||||||||||||||||||||||||||||||||||||||||||||||||||||||||||||||||
| Haverstraw | West Haverstraw, NY | — | — |
|
|
|
|
|
|
|
(
|
2020 | (A) | |||||||||||||||||||||||||||||||||||||||||||||||||||||||||||||||||||
| Hawthorne Cove | Salem, MA | A | — |
|
|
|
|
|
|
|
(
|
2020 | (A) | |||||||||||||||||||||||||||||||||||||||||||||||||||||||||||||||||||
| Hideaway Bay | Flowery Branch, GA | A | — |
|
|
|
|
|
|
|
(
|
2020 | (A) | |||||||||||||||||||||||||||||||||||||||||||||||||||||||||||||||||||
F - 70
SUN COMMUNITIES, INC.
REAL ESTATE AND ACCUMULATED DEPRECIATION, SCHEDULE III
DECEMBER 31, 2020
(amounts in thousands)
| Encumbrance | Initial Cost to Company | Costs Capitalized Subsequent to Acquisition (Improvements) |
Gross Amount Carried at
December 31, 2020
|
|||||||||||||||||||||||||||||||||||||||||||||||||||||||||||||||||||||||||||||
| Property Name | Location | Group | Amount | Land | Depreciable Assets | Land | Depreciable Assets | Land | Depreciable Assets | Total | Accumulated Depreciation | Date | Acquired (A) or Constructed (C) | |||||||||||||||||||||||||||||||||||||||||||||||||||||||||||||||||||
| Holly Creek | Celina, TN | A | — |
|
|
|
|
|
|
|
(
|
2020 | (A) | |||||||||||||||||||||||||||||||||||||||||||||||||||||||||||||||||||
| Island Park | Portsmouth, RI | A | — |
|
|
|
|
|
|
|
(
|
2020 | (A) | |||||||||||||||||||||||||||||||||||||||||||||||||||||||||||||||||||
| Jamestown | Jamestown, KY | A | — |
|
|
|
|
|
|
|
(
|
2020 | (A) | |||||||||||||||||||||||||||||||||||||||||||||||||||||||||||||||||||
| Jamestown Boatyard | Jamestown, RI | A | — |
|
|
|
|
|
|
|
(
|
2020 | (A) | |||||||||||||||||||||||||||||||||||||||||||||||||||||||||||||||||||
| Jefferson Beach | St. Clair Shores, MI | A | — |
|
|
|
|
|
|
|
(
|
2020 | (A) | |||||||||||||||||||||||||||||||||||||||||||||||||||||||||||||||||||
| Kings Point | Cornelius, NC | A | — |
|
|
|
|
|
|
|
(
|
2020 | (A) | |||||||||||||||||||||||||||||||||||||||||||||||||||||||||||||||||||
| Lakefront | Port Clinton, OH | A | — |
|
|
|
|
|
|
|
(
|
2020 | (A) | |||||||||||||||||||||||||||||||||||||||||||||||||||||||||||||||||||
| Loch Lomond | San Rafael, CA | A | — |
|
|
|
|
|
|
|
(
|
2020 | (A) | |||||||||||||||||||||||||||||||||||||||||||||||||||||||||||||||||||
| Manasquan River | Brick Township, NJ | A | — |
|
|
|
|
|
|
|
(
|
2020 | (A) | |||||||||||||||||||||||||||||||||||||||||||||||||||||||||||||||||||
| Marina Bay | Quincy, MA | A | — |
|
|
|
|
|
|
|
(
|
2020 | (A) | |||||||||||||||||||||||||||||||||||||||||||||||||||||||||||||||||||
| Mystic | Mystic, CT | A | — |
|
|
|
|
|
|
|
(
|
2020 | (A) | |||||||||||||||||||||||||||||||||||||||||||||||||||||||||||||||||||
| Narrows Point | Grasonville, MD | A | — |
|
|
|
|
|
|
|
(
|
2020 | (A) | |||||||||||||||||||||||||||||||||||||||||||||||||||||||||||||||||||
| New England Boatworks | Portsmouth, RI | A | — |
|
|
|
|
|
|
|
(
|
2020 | (A) | |||||||||||||||||||||||||||||||||||||||||||||||||||||||||||||||||||
| New Port Cove | Riviera Beach, FL | A | — |
|
|
|
|
|
|
|
(
|
2020 | (A) | |||||||||||||||||||||||||||||||||||||||||||||||||||||||||||||||||||
| Newport Shipyard | Newport, RI | A | — |
|
|
|
|
|
|
|
(
|
2020 | (A) | |||||||||||||||||||||||||||||||||||||||||||||||||||||||||||||||||||
| North Palm Beach | North Palm Beach, FL | A | — |
|
|
|
|
|
|
|
(
|
2020 | (A) | |||||||||||||||||||||||||||||||||||||||||||||||||||||||||||||||||||
| Old Port Cove | North Palm Beach, FL | A | — |
|
|
|
|
|
|
|
(
|
2020 | (A) | |||||||||||||||||||||||||||||||||||||||||||||||||||||||||||||||||||
| Onset Bay | Buzzards Bay, MA | A | — |
|
|
|
|
|
|
|
(
|
2020 | (A) | |||||||||||||||||||||||||||||||||||||||||||||||||||||||||||||||||||
| Oxford | Oxford, MD | A | — |
|
|
|
|
|
|
|
(
|
2020 | (A) | |||||||||||||||||||||||||||||||||||||||||||||||||||||||||||||||||||
| Peninsula Yacht Club | Cornelius, NC | A | — |
|
|
|
|
|
|
|
(
|
2020 | (A) | |||||||||||||||||||||||||||||||||||||||||||||||||||||||||||||||||||
| Pier 121 | Lewisville, TX | A | — |
|
|
|
|
|
|
|
(
|
2020 | (A) | |||||||||||||||||||||||||||||||||||||||||||||||||||||||||||||||||||
| Pier 77 | Bradenton, FL | A | — |
|
|
|
|
|
|
|
(
|
2020 | (A) | |||||||||||||||||||||||||||||||||||||||||||||||||||||||||||||||||||
| Pilots Point | Westbrook,CT | A | — |
|
|
|
|
|
|
|
(
|
2020 | (A) | |||||||||||||||||||||||||||||||||||||||||||||||||||||||||||||||||||
| Pineland | Bokeelia, FL | A | — |
|
|
|
|
|
|
|
(
|
2020 | (A) | |||||||||||||||||||||||||||||||||||||||||||||||||||||||||||||||||||
| Plymouth | Plymouth, MA | A | — |
|
|
|
|
|
|
|
(
|
2020 | (A) | |||||||||||||||||||||||||||||||||||||||||||||||||||||||||||||||||||
| Port Royal | Port Royal, SC | A | — |
|
|
|
|
|
|
|
(
|
2020 | (A) | |||||||||||||||||||||||||||||||||||||||||||||||||||||||||||||||||||
| Post Road | Mamaroneck, NY | A | — |
|
|
|
|
|
|
|
(
|
2020 | (A) | |||||||||||||||||||||||||||||||||||||||||||||||||||||||||||||||||||
| Regatta Pointe | Palmetto, FL | A | — |
|
|
|
|
|
|
|
(
|
2020 | (A) | |||||||||||||||||||||||||||||||||||||||||||||||||||||||||||||||||||
| Reserve Harbor | Pawleys Island, SC | A | — |
|
|
|
|
|
|
|
(
|
2020 | (A) | |||||||||||||||||||||||||||||||||||||||||||||||||||||||||||||||||||
| Riviera Beach | Riviera Beach, FL | A | — |
|
|
|
|
|
|
|
|
2020 | (A) | |||||||||||||||||||||||||||||||||||||||||||||||||||||||||||||||||||
F - 71
SUN COMMUNITIES, INC.
REAL ESTATE AND ACCUMULATED DEPRECIATION, SCHEDULE III
DECEMBER 31, 2020
(amounts in thousands)
| Encumbrance | Initial Cost to Company | Costs Capitalized Subsequent to Acquisition (Improvements) |
Gross Amount Carried at
December 31, 2020
|
|||||||||||||||||||||||||||||||||||||||||||||||||||||||||||||||||||||||||||||
| Property Name | Location | Group | Amount | Land | Depreciable Assets | Land | Depreciable Assets | Land | Depreciable Assets | Total | Accumulated Depreciation | Date | Acquired (A) or Constructed (C) | |||||||||||||||||||||||||||||||||||||||||||||||||||||||||||||||||||
| Rockland | Rockland, ME | — | — |
|
|
|
|
|
|
|
|
2020 | (A) | |||||||||||||||||||||||||||||||||||||||||||||||||||||||||||||||||||
| Sakonnet | Portsmouth, RI | A | — |
|
|
|
|
|
|
|
(
|
2020 | (A) | |||||||||||||||||||||||||||||||||||||||||||||||||||||||||||||||||||
| Sandusky | Sandusky, OH | A | — |
|
|
|
|
|
|
|
(
|
2020 | (A) | |||||||||||||||||||||||||||||||||||||||||||||||||||||||||||||||||||
| Shelburne Shipyard | Shelburne, VT | A | — |
|
|
|
|
|
|
|
(
|
2020 | (A) | |||||||||||||||||||||||||||||||||||||||||||||||||||||||||||||||||||
| Siesta Key | Sarasota, FL | A | — |
|
|
|
|
|
|
|
(
|
2020 | (A) | |||||||||||||||||||||||||||||||||||||||||||||||||||||||||||||||||||
| Silver Spring | South Kingstown, RI | A | — |
|
|
|
|
|
|
|
(
|
2020 | (A) | |||||||||||||||||||||||||||||||||||||||||||||||||||||||||||||||||||
| Skippers Landing | Troutman, NC | A | — |
|
|
|
|
|
|
|
(
|
2020 | (A) | |||||||||||||||||||||||||||||||||||||||||||||||||||||||||||||||||||
| Skull Creek | Hilton Head, SC | A | — |
|
|
|
|
|
|
|
(
|
2020 | (A) | |||||||||||||||||||||||||||||||||||||||||||||||||||||||||||||||||||
| South Fork | Fort Lauderdale, FL | — | — |
|
|
|
|
|
|
|
|
2020 | (A) | |||||||||||||||||||||||||||||||||||||||||||||||||||||||||||||||||||
| South Harbour Village | Southport, NC | A | — |
|
|
|
|
|
|
|
(
|
2020 | (A) | |||||||||||||||||||||||||||||||||||||||||||||||||||||||||||||||||||
| Sportsman | Orange Beach, AL | A | — |
|
|
|
|
|
|
|
(
|
2020 | (A) | |||||||||||||||||||||||||||||||||||||||||||||||||||||||||||||||||||
|
Stirling
(2)
|
Greenport, NY | A | — |
|
|
|
|
|
|
|
|
2020 | (A) | |||||||||||||||||||||||||||||||||||||||||||||||||||||||||||||||||||
| Stratford | Stratford, CT | A | — |
|
|
|
|
|
|
|
(
|
2020 | (A) | |||||||||||||||||||||||||||||||||||||||||||||||||||||||||||||||||||
| Sunset Bay | Hull, MA | A | — |
|
|
|
|
|
|
|
(
|
2020 | (A) | |||||||||||||||||||||||||||||||||||||||||||||||||||||||||||||||||||
| Toledo Beach | La Salle Township, MI | A | — |
|
|
|
(
|
|
|
|
(
|
2020 | (A) | |||||||||||||||||||||||||||||||||||||||||||||||||||||||||||||||||||
| Trade Winds | Appling, GA | A | — |
|
|
|
|
|
|
|
(
|
2020 | (A) | |||||||||||||||||||||||||||||||||||||||||||||||||||||||||||||||||||
| Ventura Isle | Ventura, CA | A | — |
|
|
|
|
|
|
|
(
|
2020 | (A) | |||||||||||||||||||||||||||||||||||||||||||||||||||||||||||||||||||
| Walden | Montgomery, TX | A | — |
|
|
|
|
|
|
|
(
|
2020 | (A) | |||||||||||||||||||||||||||||||||||||||||||||||||||||||||||||||||||
| West Palm Beach | West Palm Beach, FL | A | — |
|
|
|
|
|
|
|
|
2020 | (A) | |||||||||||||||||||||||||||||||||||||||||||||||||||||||||||||||||||
| Westport | Denver, NC | A | — |
|
|
|
|
|
|
|
(
|
2020 | (A) | |||||||||||||||||||||||||||||||||||||||||||||||||||||||||||||||||||
| Wickford | Wickford, RI | A | — |
|
|
|
|
|
|
|
|
2020 | (A) | |||||||||||||||||||||||||||||||||||||||||||||||||||||||||||||||||||
| Wickford Cove | Wickford, RI | A | — |
|
|
|
|
|
|
|
(
|
2020 | (A) | |||||||||||||||||||||||||||||||||||||||||||||||||||||||||||||||||||
| Willsboro Bay | Willsboro, NY | A | — |
|
|
|
|
|
|
|
(
|
2020 | (A) | |||||||||||||||||||||||||||||||||||||||||||||||||||||||||||||||||||
| Wisdom Dock | Albany, KY | A | — |
|
|
|
|
|
|
|
(
|
2020 | (A) | |||||||||||||||||||||||||||||||||||||||||||||||||||||||||||||||||||
| Yacht Haven | Stamford, CT | A | — |
|
|
|
|
|
|
|
(
|
2020 | (A) | |||||||||||||||||||||||||||||||||||||||||||||||||||||||||||||||||||
| Zahnisers | Solomons, MD | A | — |
|
|
|
|
|
|
|
(
|
2020 | (A) | |||||||||||||||||||||||||||||||||||||||||||||||||||||||||||||||||||
| $ | — | $ |
|
$ |
|
$ |
|
$ |
|
$ |
|
$ |
|
$ |
|
$ |
(
|
|||||||||||||||||||||||||||||||||||||||||||||||||||||||||||||||
| Marinas Headquarters and Other | Dallas, TX | — | $ | — |
|
|
|
|
|
|
|
(
|
||||||||||||||||||||||||||||||||||||||||||||||||||||||||||||||||||||
| $ | — | $ |
|
$ |
|
$ |
|
$ |
|
$ |
|
$ |
|
$ |
|
$ |
(
|
|||||||||||||||||||||||||||||||||||||||||||||||||||||||||||||||
A These marinas are unencumbered and support the borrowing base for the Safe Harbor Facility which had $
652.0
million and $
500.0
million of borrowings outstanding under the revolving loan and term loan, respectively.
(1)
All costs from Dauntless Shipyard and Essex Island are grouped into Dauntless.
(2)
All costs from Stirling are grouped into Greenport.
F - 72
SUN COMMUNITIES, INC.
REAL ESTATE AND ACCUMULATED DEPRECIATION, SCHEDULE III
DECEMBER 31, 2020
(amounts in thousands)
The change in investment property for the years ended December 31, 2020, 2019, and 2018 is as follows (in thousands):
| Year Ended | |||||||||||||||||
| December 31, 2020 | December 31, 2019 | December 31, 2018 | |||||||||||||||
| Beginning balance | $ |
|
$ |
|
$ |
|
|||||||||||
| Community and land acquisitions, including immediate improvements |
|
|
|
||||||||||||||
| Community expansion and development |
|
|
|
||||||||||||||
| Improvements |
|
|
|
||||||||||||||
| Dispositions and other |
(
|
(
|
(
|
||||||||||||||
| Ending balance | $ |
|
$ |
|
$ |
|
|||||||||||
The change in accumulated depreciation for the years ended December 31, 2020, 2019, and 2018 is as follows (in thousands):
| Year Ended | |||||||||||||||||
| December 31, 2020 | December 31, 2019 | December 31, 2018 | |||||||||||||||
| Beginning balance | $ |
|
$ |
|
$ |
|
|||||||||||
| Depreciation for the period |
|
|
|
||||||||||||||
| Asset impairment |
(
|
|
|
||||||||||||||
| Dispositions and other |
(
|
(
|
(
|
||||||||||||||
| Ending balance | $ |
|
$ |
|
$ |
|
|||||||||||
F - 73
TABLE OF CONTENTS
Part IItem 1. BusinessItem 1A. Risk FactorsItem 1B. Unresolved Staff CommentsItem 2. PropertiesItem 3. Legal ProceedingsItem 4. Mine Safety DisclosuresPart IIItem 5. Market For Registrant S Common Equity, Related Stockholder Matters and Issuer Purchases Of Equity SecuritiesItem 6. Selected Financial DataItem 7. Management S Discussion and Analysis Of Financial Condition and Results Of OperationsItem 7A. Quantitative and Qualitative Disclosures About Market RiskItem 8. Financial Statements and Supplementary DataItem 9. Changes in and Disagreements with Accountants on Accounting and Financial DisclosureItem 9A. Controls and ProceduresItem 9B. Other InformationPart IIIItem 10. Directors, Executive Officers and Corporate GovernanceItem 11. Executive CompensationItem 12. Security Ownership Of Certain Beneficial Owners and Management and Related Stockholder MattersItem 13. Certain Relationships and Related Transactions, and Director IndependenceItem 14. Principal Accountant Fees and ServicesPart IVItem 15. Exhibits and Financial Statement SchedulesItem 16. Form 10-k Summary