SCHWEITZER MAUDUIT INTERNATIONAL INC
10-Ks and 10-Qs
|
|
|
|
|
|
|
|
|
|
|
|
|
|
|
|
|
|
|
|
|
|
|
|
|
|
|
|
|
|
|
|
|
|
|
|
|
|
|
|
|
|
|
|
|
|
|
|
|
|
|
|
|
|
|
|
|
|
|
UNITED STATES
SECURITIES AND EXCHANGE COMMISSION
Washington, D.C. 20549
FORM 10-K
(Mark One)
|
x
|
ANNUAL REPORT PURSUANT TO SECTION 13 OR 15(d) OF THE SECURITIES EXCHANGE ACT OF 1934
|
|
|
For the fiscal year ended December 31, 2017
|
OR
|
o
|
TRANSITION REPORT PURSUANT TO SECTION 13 OR 15(d) OF THE SECURITIES EXCHANGE ACT OF 1934
|
|
|
For the transition period from __________________ to __________________
|
1-13948
(Commission file number)
SCHWEITZER-MAUDUIT INTERNATIONAL, INC.
(Exact name of registrant as specified in its charter)
|
Delaware
|
62-1612879
|
|
(State or other jurisdiction of incorporation or organization)
|
(I.R.S. Employer Identification No.)
|
|
100 North Point Center East, Suite 600
Alpharetta, Georgia
|
30022
|
|
(Address of principal executive offices)
|
(Zip Code)
|
1-800-514-0186
(Registrant's telephone number, including area code)
Securities registered pursuant to Section 12(b) of the Act:
|
Title of each class
|
Name of each exchange on which registered
|
|
|
Common stock, par value $0.10 per share
|
New York Stock Exchange
|
|
Securities Registered Pursuant to Section 12(g) of the Act:
None
Indicate by check mark if the registrant is a well-known seasoned issuer, as defined in Rule 405 of the Securities Act. Yes
x
No
o
Indicate by check mark if the registrant is not required to file reports pursuant to Section 13 or Section 15(d) of the Act. Yes
o
No
x
Indicate by check mark whether the registrant (1) has filed all reports required to be filed by Section 13 or 15(d) of the Securities Exchange Act of 1934 during the preceding 12 months (or for such shorter period that the registrant was required to file such reports), and (2) has been subject to such filing requirements for the past 90 days. Yes
x
No
o
Indicate by check mark whether the registrant has submitted electronically and posted on its corporate Web site, if any, every Interactive Data File required to be submitted and posted pursuant to Rule 405 of Regulation S-T (§232.405 of this chapter) during the preceding 12 months (or for such shorter period that the registrant was required to submit and post such files). Yes
x
No
o
Indicate by check mark if disclosure of delinquent filers pursuant to Item 405 of Regulation S-K (§ 229.405) is not contained herein, and will not be contained, to the best of registrant's knowledge, in definitive proxy or information statements incorporated by reference in Part III of this Form 10-K or any amendment to this Form 10-K.
o
Indicate by check mark whether the registrant is a large accelerated filer, an accelerated filer, a non-accelerated filer, or a smaller reporting company. See the definitions of "large accelerated filer," "accelerated filer" and "smaller reporting company" in Rule 12b-2 of the Exchange Act. (Check one):
|
Large accelerated filer
x
|
Accelerated filer
o
|
Non-accelerated filer
o
|
Smaller reporting company
o
|
Emerging growth company
o
|
|
(Do not check if a smaller reporting company)
|
||||
If an emerging growth company, indicate by check mark if the registrant has elected not to use the extended transition period for complying with any new or revised financial accounting standards provided pursuant to Section 13(a) of the Exchange Act.
o
Indicate by check mark whether the registrant is a shell company (as defined in Rule 12b-2 of the Act). Yes
o
No
x
The aggregate market value of the outstanding common stock, par value $0.10 per share (the "Common Stock"), of the registrant held by non-affiliates as of
June 30, 2017
(the last business day of the registrant's most recently completed second fiscal quarter) was
$1.1 billion
, based on the last sale price for the Common Stock of $37.23 per share as reported on the New York Stock Exchange on said date. For purposes of the foregoing sentence only, all directors and executive officers are assumed to be affiliates.
There were
30,771,272
shares of Common Stock issued and outstanding as of
March 1, 2018
.
DOCUMENTS INCORPORATED BY REFERENCE
Portions of the registrant's definitive Proxy Statement relating to its 2018 Annual Meeting of Stockholders scheduled to be held on April 26, 2018 (the "2018 Proxy Statement") and filed pursuant to Regulation 14A are incorporated by reference into Part III of this Annual Report on Form 10-K.
SCHWEITZER-MAUDUIT INTERNATIONAL, INC.
TABLE OF CONTENTS
|
|
|
|
Page
|
|
|
Part I.
|
|
|
|
Item 1.
|
Business
|
||
|
Item 1A.
|
Risk Factors
|
||
|
Item 1B.
|
Unresolved Staff Comments
|
||
|
Item 2.
|
Properties
|
||
|
Item 3.
|
Legal Proceedings
|
||
|
Item 4.
|
Mine Safety Disclosures
|
||
|
|
Part II.
|
||
|
Item 5.
|
Market for Registrant's Common Equity, Related Stockholder Matters and Issuer Purchases of Equity Securities
|
||
|
Item 6.
|
Selected Financial Data
|
||
|
Item 7.
|
Management's Discussion and Analysis of Financial Condition and Results of Operations
|
||
|
|
|||
|
Item 7A.
|
Quantitative and Qualitative Disclosures about Market Risk
|
||
|
|
|||
|
Item 8.
|
Financial Statements and Supplementary Data
|
||
|
Item 9.
|
Changes in and Disagreements with Accountants on Accounting and Financial Disclosure
|
||
|
Item 9A.
|
Controls and Procedures
|
||
|
Item 9B.
|
Other Information
|
||
|
Part III.
|
|||
|
Item 10.
|
Directors, Executive Officers and Corporate Governance
|
||
|
|
|||
|
Item 11.
|
Executive Compensation
|
||
|
|
|
||
|
Item 12.
|
Security Ownership of Certain Beneficial Owners and Management and Related Stockholder Matters
|
||
|
|
|||
|
Item 13.
|
Certain Relationships and Related Transactions and Director Independence
|
||
|
|
|||
|
Item 14.
|
Principal Accountant Fees and Services
|
||
|
Part IV.
|
|||
|
Item 15.
|
Exhibits and Financial Statement Schedules
|
||
|
|
|||
|
Signatures
|
|||
|
Glossary of Terms
|
|||
Item 1.
Business
Disclosure Regarding Forward-Looking Statements
This Annual Report on Form 10-K contains forward-looking statements within the meaning of Section 27A of the Securities Act of 1933, as amended, and Section 21E of the Securities Exchange Act of 1934, as amended. Actual results, performance or achievements could differ materially from those projected in the forward-looking statements as a result of a number of risks, uncertainties, and other factors. For a discussion of important factors that could cause our results, performance, or achievements to differ materially from any future results, performance, or achievements expressed or implied by our forward-looking statements, please refer to Part I, Item 1A “Risk Factors” and Part I, Item 7 “Management’s Discussion and Analysis of Financial Condition and Results of Operations” below.
GENERAL
Background
Schweitzer-Mauduit International, Inc. (referred to, with its consolidated subsidiaries, as "we", "us", "our", the "Company", "SWM INTL" or "SWM" unless the context indicates otherwise) is a multinational producer of specialty materials, including papers, nets and films headquartered in the United States of America (the "U.S."). Since October 2015, the Company has operated under two reportable segments: Advanced Materials & Structures ("AMS"), which manufactures resin-based products used in specialty applications in the filtration, infrastructure and construction, transportation, industrial, and medical end-markets, and Engineered Papers ("EP"), which produces cigarette papers and reconstituted tobacco products for cigarette and cigar manufacturers, as well as various other non-tobacco paper products.
The Company was incorporated in Delaware in 1995 as a wholly-owned subsidiary of Kimberly-Clark Corporation ("Kimberly-Clark"). On November 30, 1995, Kimberly-Clark transferred its tobacco-related paper and other specialty paper products businesses conducted in the U.S., France and Canada to the Company and distributed all of the outstanding shares of common stock of the Company to its stockholders (the "spin-off"). As a result, the Company became an independent public company. We conduct business in over 90 countries and operate 23 production locations worldwide, with facilities in the U.S., United Kingdom, Canada, France, Luxembourg, Russia, Brazil, China, Belgium and Poland.
Our principal executive office is located at 100 North Point Center East, Suite 600, Alpharetta, Georgia 30022-8246 and our telephone number is (800) 514-0186. Our stock is traded on the New York Stock Exchange ("NYSE") under the symbol "SWM".
Strategic Transformation - Overview
Through 2013, the Company operated as a tobacco-centric paper operation. In late 2012, SWM's management and Board of Directors elected to pursue a strategic transformation by increasing profit streams outside the tobacco industry through business acquisitions, while carefully managing the profitable but mature tobacco operations. Over time, this strategy was intended to counterbalance the expected long-term pressures of the tobacco industry and transform SWM into a more diversified and growth-oriented enterprise while maintaining its company-wide focus on several underlying themes: technical expertise in high-performance specialty materials, collaborative customer relationships, and operational excellence. The Company selectively targeted acquisition candidates that served diversified and growing end-markets, generated profitability associated with premium differentiated products, and had leading and defensible competitive positions in their core product categories. In addition, management believed many acquisition targets would have unique synergy opportunities when combined with the assets and capabilities of SWM, such as a global infrastructure and a robust operational excellence program, and ultimately, synergies with other similar companies acquired by SWM.
1
Pursuant to this strategy, management has used free cash flow and liquidity available through our credit facility to support growth investments. From 2013 to 2017 the Company invested a total of approximately $850 million acquiring three primary businesses, DelStar, Argotec, and Conwed, and making two “bolt-on” acquisitions. These businesses together now comprise the Advanced Materials & Structures segment, which generated over $430 million in net sales in 2017. The combination of AMS with non-tobacco sales in our paper business, resulted in total non-tobacco sales representing 51% of the Company’s total revenue in
2017
, up from approximately 6% prior to these strategic actions. During this 5-year period, the EP segment has remained the source of the majority of the Company's cash flow, enabling the growth investments in the AMS segment and supporting steadily growing dividends to shareholders; the Company has paid more than $232 million in dividends since 2013.
Strategic Transformation - Creating the AMS Growth Platform
In December 2013, the Company acquired DelStar, Inc. ("DelStar"), a manufacturer of specialty resin-based nets, films and non-wovens, focused on the filtration, medical, and industrial end-markets. DelStar established SWM's presence in new industries and added a portfolio of high-value technologies. Management also believed DelStar could benefit from SWM's global footprint, Operational Excellence program, and ability to fund growth investments.
In October 2015, the Company acquired Argotec Intermediate Holdings LLC ("Argotec"), a manufacturer of specialty urethane films for applications primarily in the transportation end-market. A key growth driver was increasing demand for surface protection films used for automotive paint protection and glass lamination. This business also serves customers in the medical and industrial end-markets. From a technology standpoint, Argotec added to SWM's growing resin extrusion capabilities and added scale to the AMS growth platform.
In January 2017, SWM acquired Conwed Plastics LLC (“Conwed”), a producer of specialty resin-based netting. Conwed’s similarities to the Company’s existing netting production assets presented a compelling opportunity to drive synergies through footprint rationalization, procurement, and organizational realignment. Although operationally similar to AMS’ existing assets, Conwed added further end-market diversification, with approximately 75% of Conwed’s sales serving the infrastructure and construction end-markets. The remaining 25% of sales were split between filtration and industrial end-markets, which also complemented the existing AMS business.
The acquisitions described above comprise the AMS segment. The Company believes that these businesses offer long-term growth opportunities across a broad set of end-markets, advancing SWM's goal of diversifying its revenue stream, while maintaining consistency with many attributes of the EP segment. These core attributes include a focus on specialty materials for demanding applications, profitability associated with unique technologies, collaborative customer relationships, leading competitive positions, and operational excellence.
2
AVAILABLE INFORMATION
Our filings with the Securities and Exchange Commission ("SEC"), which filings include this Annual Report on Form 10-K, Proxy Statements, Quarterly Reports on Form 10-Q, Current Reports on Form 8-K and all related amendments, are available, free of charge, on the Investor Relations section of our web site at
www.swmintl.com
. Information from our web site is not incorporated by reference into this Annual Report on Form 10-K. These reports are available soon after they are filed electronically with, or furnished to, the SEC. The web site allows access to historical financial information, press releases and quarterly earnings conference calls, our Code of Conduct, corporate governance guidelines, Board of Directors committee charters, as well as disclosure of any amendment to or waivers of our Code of Conduct granted to any of the principal executive officer, principal financial officer or principal accounting officer. The web site provides additional background information about us including information on our history, products and locations. Requests for information, requests to contact our audit committee chairman, lead non-management director or the independent directors as a group, or requests to report concerns about accounting or other issues can be made in writing and sent to the Investor Relations Department at our principal executive office address listed above.
Our quarterly earnings conference calls are typically held the morning after our quarterly earnings releases and are available through our web site via a webcast. The tentative dates for our quarterly earnings conference calls related to 2018 financial results are May 3, 2018, August 2, 2018, November 8, 2018 and February 14, 2019. These dates are subject to change. Instructions on how to listen to the webcasts and updated information on times and actual dates are available through our web site at
www.swmintl.com
.
We have provided a Glossary of Terms at the end of this Annual Report on Form 10-K.
3
DESCRIPTION OF BUSINESS
Segment Financial Information
. We operate and manage two reportable segments based on our product lines: Advanced Materials & Structures and Engineered Papers. The Advanced Materials & Structures segment manufactures resin-based products used in specialty applications in the filtration, infrastructure and construction, transportation, industrial, and medical end-markets. This segment is comprised of the five businesses we acquired from 2013 to 2017: DelStar, the Pronamic and SNN acquisitions, Argotec and Conwed, which the Company has integrated into a more holistically aligned operating segment. Our Engineered Papers segment produces both tobacco-related papers and non-tobacco-related papers. Our tobacco-related papers, which comprise a large majority of EP's sales, include various papers used in cigarette production and reconstituted tobacco ("Recon"), a reprocessed tobacco material.
Additional information regarding "Segment Performance" is included in Part II, Item 7, Management's Discussion and Analysis of Financial Condition and Results of Operation. In addition, selected financial data for our segments is available in Note
20
. Segment Information, of the Notes to Consolidated Financial Statements and a discussion regarding the risks associated with foreign operations is available in Part I, Item 1A, Risk Factors, Market Risk. In conjunction with the change in reportable segments, corresponding information for all prior periods presented has been restated to correspond to the presentation in the current year.
Financial information about foreign and domestic operations, contained under the caption "Management's Discussion and Analysis of Financial Condition and Results of Operation" appearing in Part II, Item 7 herein and in Notes
12
,
13
,
16
and
20
("Restructuring and Impairment Activities," "Debt," "Income Taxes" and "Segment Information," respectively) to the Consolidated Financial Statements contained in "Financial Statements and Supplementary Data" in Part II, Item 8 herein, is incorporated by reference in this Item 1.
Advanced Materials & Structures
Products.
We manufacture and sell a variety of highly engineered resin-based nets, films, and other non-wovens. These specialty materials are often used in growing applications serving the filtration, infrastructure and construction, transportation, industrial, and medical end-markets. Most of our production technologies are extrusion-based, meaning resin pellets are heated, softened, and forced through a metal die to form continuous sheets or strands. We have significant technological expertise in proprietary die construction, which our competitors often outsource, and we consider this an advantage in protecting our technology and competitive position. However, unlike the EP segment which relies primarily on patent protection for key innovation protection, AMS relies more heavily on trade secrets and manufacturing "know-how."
Our thermoplastic nets are used in a variety of applications, the most prominent of which is their use as spacer netting in reverse osmosis water filtration (“RO filtration") devices. We have established a strong presence in this application by customizing products to meet demanding customer specifications, such as thickness/weight, flow characteristics, and heat and pressure resistance. Our nets are also used in a variety of other filtration applications such as fuel and hydraulic fluid filters, pharmaceutical filters, and food and beverage filters. Another key netting application is erosion and sediment control products for the infrastructure and construction end-markets. Our nets are the outside layers in erosion control blankets, which are used to prevent erosion on sloped terrain. We also produce high-performance sediment control “socks” which are used to set perimeters around various development sites to contain sediment and prevent contamination of water sources. Our nets can also be found in a variety of industrial applications such as carpet cushion support and retail food packaging.
We manufacture our thermoplastic polyurethane films ("TPU") to have combinations of the following attributes; UV, scratch and water resistance and ultra-clarity. The ability to demonstrate these rare combinations make them ideally suited for demanding transportation-related surface protection applications, primarily automotive paint protection and security reinforced glass. These products are also used in certain niche applications such as graphics and laminated textiles in the industrial end-market, and also in the medical end-market. Other films, including apertured film products, are used in wound care applications, such as finger bandages and wound dressings for the medical end-market and also used in specialty liquid filters for ultra-pure semiconductor manufacturing processes.
4
Our non-wovens are typically air-laid resin-based materials often used in liquid filtration and residential and commercial air filtration. In addition to rolled goods, SWM also manufactures rigid core tubing, an extruded resin product that also is primarily used in reverse osmosis water filtration devices, and flexible tubing used in various medical and industrial applications.
With the growth of our AMS division, our technical expertise around resin-based materials is increasing. We believe we have industry-leading innovation capabilities and an expanding product portfolio which we expect to support growth through collaborative product development opportunities with our customers.
Markets and Customers.
The AMS segment supplies customers serving the filtration, infrastructure and construction, transportation, medical, and industrial end-markets. These products are highly engineered and often customized. In some cases, we are the sole supplier of certain products to our top customers, though no customer represents more than 10% of our consolidated net sales. Generally, the applications and customers the AMS segment serves are in growing end-markets.
Within the filtration end-market, reverse osmosis water filtration has exhibited historical long-term growth due to increasing global demand for drinkable water and we expect global infrastructure investments in this area to continue long-term. Our other filtration products are often used in the food and beverage industries and heavy equipment and machinery used in the oil and gas industries, filtering fuel and other hydraulic liquids, as well as serving other functions in the exploration, processing, and transport of oil, gas, and metals. We refer to non-RO liquid filtration products generally as process filtration. While sales of process filtration products, particularly those used in the oil, gas, and mining sectors, can be subject to cyclicality and commodity price volatility, we expect strong long-term demand across the product line.
Our sales to the infrastructure and construction end-market are largely comprised of erosion/sediment control products. Our netting is used in the production of erosion control blankets, which are used in highway development projects to cover roadside slopes during and after construction until vegetation has stabilized the ground. This is a primarily U.S. business, with expected growth supported by continued highway infrastructure investments. We also offer customers a unique high-performance sediment control solution, a filled “sock”, used to seal perimeters of development sites which could contain harmful contaminants. This product has gained adoption in the oil and gas exploration and production industry, and also has potential to displace legacy competitive products such as silt fence, which is often used to surround various construction sites to control sediment. In the construction segment, our netting products are used a support material for carpet cushion, construction materials protection, and support backing for sod production.
The majority of our TPU films are used in transportation-related surface protection applications, specifically automotive paint protection. This product is typically sold and installed in the after-market through dealerships or auto body shops. Recently, we have benefited from global adoption of paint protection films, particularly in Asia. Other surface protection applications, such as ballistic-resistant and security glass used primarily on vehicles can be impacted by government and military contracts. These films are also used in commercial architectural glass. Our industrial applications are spread across a variety of other industries, such as apparel, food manufacturing, graphics and energy, while our medical film products largely serve the wound care management area of the medical end-market.
Sales and Distribution.
AMS products are primarily sold by the marketing, sales and customer service organizations of our AMS operations directly to manufacturers, however, in some geographic regions, we use sales agents to assist us in the sales process. As part of our enterprise transformation and integration efforts related to our recently acquired companies, we re-branded the acquired companies and transitioned our AMS sales operations toward a more unified organization. All acquired companies have been re-branded as SWM and the AMS sales organization will operate and go to market under the SWM trade name, with sales resources deployed by end-market and focused on selling products from across the totality of AMS offerings.
We typically deliver our products to customers by truck, rail and ocean-going vessels. As is typical in the industries in which we operate, ownership of the product generally transfers to our customer upon shipment from our manufacturing facilities, except for certain export sales where ownership typically transfers at the foreign port or customer facility. In certain instances, we produce and hold or consign products for a limited number of customers for which title does
5
not transfer until shipment from our manufacturing facility or the products are used by the customer. In these instances, we defer recognition of revenue related to these products until the products are shipped, or the product is used, and ownership of the product transfers to the customer.
Competition.
Our AMS products are typically leaders in their respective categories and compete against niche products made by competitors such as Marshall Manufacturing Company, Johns Manville, a subsidiary of Berkshire Hathaway Inc., Shaoxing Naite Plastics Co. Ltd., 3M Company, Covestro AG, Tenax Corporation, Intermas Group, and Hollingsworth and Vose Company. We believe our AMS products compete primarily on product features, innovations and customer service across the end-markets we serve. Of the end-markets we serve, industrial is generally the most price competitive due to a higher portion of commodity-type products that we often sell in order to maximize our machine utilization. As part of our overall strategic focus on high-value specialty products, we have elected to discontinue and/or reduce our efforts to sell some of our lower-margin products allowing us to streamline our capacity and focus on our high value product lines.
Raw Materials and Energy.
The primary raw material used in our AMS products is plastic resin, and we rely on a variety of commodity grade and specialty resins, including Polypropylene, Polyurethane, Polyethylene, Polyamide (nylon) and a selection of specialized high temperature engineering grade resins. Our thermoplastic nets and apertured films are produced using a blend of specialty resins and commodity grade resins like polypropylene. Resin prices can fluctuate significantly and can impact profitability. Commodity grade resin prices typically correlate with crude oil prices while specialty resin prices often do not. Our TPU films are produced using specialty resins which are significantly more expensive than commodity grade resins. To partially mitigate the effects of price fluctuations, we have contractual pricing adjustment mechanisms with certain customers.
We have multiple sources for most of our resin needs. However, some of our specialty resins are supplied by fewer manufacturers. We believe that our purchased raw materials are generally available from several sources and that the loss of a single supplier would not likely have a material adverse effect on our ability to procure needed raw materials from other suppliers. Our total resin purchases in
2017
and
2016
totaled $129 million and $95 million, respectively. The increase in 2017 resin purchases is due to Conwed, which is included in our 2017 results.
The majority of our energy requirements relate to electricity in the U.S. We consider this to be a relatively stable energy source.
Backlog and Seasonality.
In the AMS segment, customer orders are generally manufactured and shipped within 30 days or, in certain instances, within three months. Sales of our products within AMS are generally not subject to large seasonal fluctuations: however, we would expect the second and third quarters to be relatively stronger than the first and fourth quarters. As of
December 31, 2017
and
2016
, the AMS segment order backlog was approximately $71 million and $39 million, respectively. The increase in 2017 backlog is primarily due to Conwed, which is included in our 2017 results.
Engineered Papers
Products.
Our EP segment produces both tobacco-related and non-tobacco-related papers. Our tobacco-related papers include various papers used in cigarette production and reconstituted tobacco ("Recon"), a reprocessed tobacco material, and comprise a large majority of EP's sales.
One of our key cigarette paper products is low ignition propensity ("LIP") cigarette paper. LIP cigarettes are designed to self-extinguish when not actively being smoked, thus offering a fire-safety feature. The U.S., the European Union ("E.U."), and several other smaller jurisdictions have mandated the use of LIP papers. Our solutions pioneered this cigarette paper category, and we remain a leader in this cigarette paper sub-segment through either direct sales or through licensing agreements. The Company maintains an extensive and active intellectual property portfolio.
Recon is another key component of EP's total sales and profits. The most significant of our Recon products is reconstituted tobacco leaf, “RTL” or “traditional RTL”), which cigarette manufacturers often blend with virgin tobacco to achieve certain attributes in cigarettes, such as taste or reduced delivery of tar, nicotine, or other tobacco-related smoking
6
constituents. Historically, the production of RTL has often been a cost-effective use for tobacco leaf scraps, though virgin leaf price and inventory supply conditions can shift the relative attractiveness of our products. We also produce a similar line of Recon products referred to as wrappers and binders for use in machine-made cigars. Recently, a new generation of tobacco industry products generally referred to as Heat not Burn (“HnB”) have been introduced into the marketplace with a goal of reducing harmful components in smoking. We generated commercial sales to one customer in 2017, and this product offers potential growth if global consumer adoption gains momentum and it gains support from appropriate regulatory authorities.
Our non-tobacco paper products include a mix of lightweight papers including low-volume, high-value, engineered materials such as alkaline battery separator papers, as well as high-volume commodity paper grades for printing and writing, flooring laminates, and food service packaging, which are intended to maximize machine utilization. From 2014 through 2017, non-tobacco papers comprised approximately 11% of EP segment net sales. We intend to make continued diversification investments in our EP segment to broaden our offerings, utilize existing machine capacity, and/or further monetize our paper making and reconstitution technologies.
Our wet-laid paper making technologies can be broadly classified into two main production processes: flat-wire production and incline-wire production. Generally, our machines are flat-wire, meaning a liquid slurry of short pulp fibers and water are laid onto flat-wire conveyor belts, with the water draining through the wire as the fibers (wood, flax, tobacco, etc.) bond together to form a paper sheet. Incline-wire machines allow for increased drainage, enabling the use of longer fibers which bond into a more open web, increasing the porosity. Incline wire machines are typically associated with higher-value products given this added porosity, which is important in filtration and other specialty applications that tend to justify premium pricing.
The Company continues to focus resources on innovation through activities in our OneFiber lab where paper customers can work closely with our technologists to develop improved paper-based products and our LeafLab fiber reconstitution incubator at our facility in France. Our reconstitution technologies have potential to be utilized in products serving the cosmetics and packaging industries reprocessing botanical, vegetable, or other plant fibers. Furthermore, SWM’s Recon technologists are active in joint development with several cigarette manufacturers to drive continued innovation and product commercialization in the rapidly emerging Heat not Burn reduced-risk tobacco product area.
Markets and Customers.
Our EP segment is heavily influenced by global smoking trends, particularly in the U.S., the E.U. (both LIP markets), and Brazil where we have the majority of our operations and highest share of the category's volume. Historically, mature geographic regions, such as the U.S. and the E.U. have exhibited a steady decline in smoking rates, often to the low-to-mid single digits.
We supply the major, and many of the smaller, cigarette and cigar manufacturers. We sell our products directly to the major tobacco companies or their designated converters in the Americas, Europe, Asia and elsewhere. Philip Morris-USA, a subsidiary of Altria Group Inc., Japan Tobacco Inc. ("JT"), and British American Tobacco ("BAT"), are our three largest customers and, together with their respective affiliates and designated converters, accounted for 31%, 35% and 42% of our
2017
,
2016
and
2015
consolidated net sales, respectively. Although the total loss of one or more of these large customers could have a material adverse effect on our results of operations, we do not believe that such a loss is likely given our significance in the worldwide supply chain of cigarette-related papers.
Sales and Distribution.
Our internal marketing, sales and customer service organizations sell most of our tobacco-related products directly to cigarette manufacturers or their designated converters. Most of our EP segment's non-tobacco related products are sold directly to manufacturers. In some geographic regions, we use sales agents. We do not sell our products directly to consumers or advertise our products in consumer media. We typically deliver our products to customers by truck, rail and ocean-going vessels. As is typical in our industry, ownership of the product generally transfers to our customer upon shipment from our plants, except for certain export sales where ownership typically transfers at the foreign port or customer facility.
Competition.
The specialized nature of tobacco-related papers requires unique papermaking equipment, technical expertise, and research and development capabilities to meet exacting customer specifications. These factors have limited the number of competitors capable of servicing global cigarette manufacturers.
7
As the sole domestic producer of cigarette papers in North America and Latin America (SWM production in Brazil), we believe that we have a significant majority of the category share in those regions. Our paper plants in France and LIP printing facility in Poland sell a large amount of their products in the E.U. We estimate that we have a direct share of more than 40% of cigarette paper sales in the E.U., and coupled with royalty payments from a key competitor to whom we have licensed our LIP technology, we believe we are able to monetize over 80% of the LIP-compliant E.U. cigarette market. Our principal competitors include delfortgroup AG (" delfort"), which licenses our LIP technology, Miquel y Costas & Miquel S.A. ("Miquel y Costas"), Julius Glatz GmbH and PT Bukit Muria Jaya ("BMJ"). In December 2017, the Dusseldorf Court of Appeals affirmed the German District Court judgment of patent infringement against Glatz including an injunction against making and selling LIP cigarette paper. We believe that the basis of cigarette and our non-tobacco papers competition is price, consistent quality, security of supply, and level of technical service.
Outside of China, SWM is the only non-cigarette company that produces RTL through a paper-making process. Some cigarette companies such as Philip Morris-USA, British American Tobacco, JT and STMA (China) produce RTL primarily for their own internal use. Our customers' cigarette blending decisions, which affect our traditional RTL sales volumes, can be influenced by worldwide virgin tobacco prices and availability as well as the general attractiveness of various competing in-house reconstituted tobacco products. Huabao International Holdings Ltd, a Hong Kong company, produces reconstituted tobacco in China. We believe that the basis of competition in this geographic region is primarily quality and price. Similarly, for HnB products, we believe we are the only non-cigarette manufacturer with production capabilities.
Raw Materials and Energy.
Wood pulp is the primary fiber used in our EP segment. Our operations consumed approximately $42 million and $43 million of wood pulp in the years ended
December 31, 2017
and
2016
, respectively, all of which we purchased. While EP uses other specialty fibers, such as flax, in our operations, we believe that purchased raw materials are generally available from several sources.
Paper production uses significant amounts of energy, primarily electricity, natural gas and fuel oil. We believe that energy supply is generally reliable throughout our manufacturing footprint, although prices can fluctuate significantly based on demand. We enter into agreements to procure a portion of our energy requirements for future periods in order to reduce the uncertainty of future energy costs. We also have a sustainability program focused on reducing our impact on the environment.
Additional information regarding agreements for the supply of certain raw materials and energy is included in Note
19
. Commitments and Contingencies, of the Notes to Consolidated Financial Statements.
Backlog and Seasonality.
While our U.S., Polish and Brazilian EP operations do not calculate or maintain records of order backlogs, we typically receive forecasts of future demands from certain larger customers which are used to manage production and ensure sufficient supply of paper products. Our French paper operations order backlog was approximately $34 million and $28 million on
December 31, 2017
and
2016
, respectively. Paper orders are typically received and shipped within a 30-day period. For RTL operations, order backlog was approximately $100 million and $96 million on
December 31, 2017
and
2016
, respectively, and is typically filled within one fiscal year.
The EP segment has historically experienced steady order flow. However, beginning in the fourth quarter of 2015 and into the first half of 2016, we benefited from large customer-driven inventory builds of LIP papers in Europe ahead of an approaching regulatory change. This inventory build reversed in the second half of 2016, creating atypical seasonality in our quarterly financial results in 2016 and 2017. Generally, sales of our paper and reconstituted tobacco products are subject to seasonal fluctuations due to periodic machine downtime and typically lower order volumes in the fourth quarter.
8
Research and Development
As of
December 31, 2017
we employ approximately 90 research and development employees in research and laboratory facilities in France, Brazil, Poland, and the U.S. We are dedicated to developing product innovations and improvements to meet the needs of individual customers. We expensed
$17.8 million
in
2017
,
$17.5 million
in
2016
and
$14.0 million
in
2015
on research and development. We believe that our research and product development capabilities have played an important role in establishing our reputation for high quality, superior products in both our AMS and EP segments. Within AMS, we have a history of finding innovative design solutions, including developing products that improve the performance of customers' products and manufacturing operations. We believe that our commitment to research and development, coupled with our investment in new technology and equipment, has positioned us to take advantage of growth opportunities in many places around the world. Within EP, our research and development has enabled us to establish and sustain leading shares in various cigarette paper products, specifically LIP paper. We also are working with customers to meet potential future demand for reduced-harm tobacco products.
Patents and Trademarks
As of
December 31, 2017
, we owned 64 patents and had 65 pending patent applications in our AMS segment. While we consider our patents, and the protection thereof, to be important, no single patent or group of patents is material to the conduct of our AMS business segment.
In our AMS segment, as described in the branding initiative discussed above, SWM made a strategic decision to transition away from certain legacy business trade names associated with our recent acquisitions in favor of a streamlined SWM enterprise branding approach. Thus, in 2016, the Company recognized an impairment of our DelStar trade name asset as further described in Note
10
. Intangible Assets, of the Notes to Consolidated Financial Information. The Company will continue to market its products under the long-standing product-level brand names and trademarks such as "NALTEX®", "DELNET®", “ARGOGUARD®” and “ARGOTHANE®”.
As of
December 31, 2017
, we owned 238 patents and had 115 pending patent applications in our EP segment, covering a variety of cigarette papers, RTL, cigar wrapper and binder and other products and processes in the U.S., Western Europe and several other countries. We believe that our patents, together with our papermaking expertise and technical sales support, have been instrumental in establishing us as the leading worldwide supplier of cigarette papers. We believe that patents have contributed to our position as the world's leading independent producer of papers used for LIP cigarettes.
Management believes that in the EP segment, our "ALGINEX®" water-based technology trademark, our "GLUCIGEN
TM
" trademark for use in banded papers for the production of LIP cigarettes, and the "SWM" logo and trade names have been important contributors to the marketing of our products. Further, we have developed, individually or in conjunction with customers, technologies to address the demand for cigarette paper for LIP cigarettes in the U.S., Canada, Australia and the E.U. We have licensed to others the right to use certain of our LIP intellectual property, excluding ALGINEX® related intellectual properties.
Management of a large portion of SWM's research and development activities is provided from our Luxembourg City, Luxembourg operation ("SWM Luxembourg"). These activities are often performed at other SWM locations under contract by SWM Luxembourg, and funded by SWM Luxembourg. SWM Luxembourg has the authority to initiate and manage research and development projects in areas such as, but not limited to, LIP paper, reconstituted tobacco for heat-non-burn devices, netting and other extruded resin products, and our non-tobacco products unit (Advanced Fibers and Materials). This operation also provides global oversight and active management for much of the Company's intellectual property rights.
9
Administrative and Court Proceedings Regarding Papers for Lower Ignition Propensity Cigarettes
In January 2015, the Company initiated patent infringement proceedings in Germany against Glatz under multiple LIP-related patents. In December, 2017, the Dusseldorf Appeal Court affirmed the German District Court judgment on infringement of EP 1482815 against Glatz. The cost, timing and outcome of intellectual property litigation can be unpredictable and thus no assurances can be given as to the outcome or impact on us of such litigation.
Employees
As of
December 31, 2017
, we had approximately 3,600 regular, full-time, active employees.
North American Operations
.
Hourly employees at the Spotswood, New Jersey, Ancram, New York and Minneapolis, Minnesota plants are represented by locals of the United Steel Workers Union. The two-year collective bargaining agreement with hourly employees at our Spotswood plant is effective through July 28, 2018. The three-year collective bargaining agreement with employees at our Ancram plant is effective through September 30, 2020. The three-year collective bargaining agreement with hourly employees at our Minneapolis facility is effective through October 31, 2018. We believe employee and union relations continue to be positive at the Spotswood, Ancram and Minneapolis operational facilities.
Our operations in Canada, South Carolina, Massachusetts, and the former DelStar and Conwed facilities, other than Minneapolis, are non-union. We believe that employee relations are positive.
French Operations
.
Hourly employees at our Quimperlé, Spay, and Saint-Girons, France plants are union represented. We believe that employee relations in France are positive.
Luxembourg Operations.
Employees at our Luxembourg office are non-union. We believe that employee relations in Luxembourg are positive.
Brazilian Operations
.
Hourly employees at the Pirahy, Brazil plant are represented by a union. The one-year collective bargaining agreement with employees at SWM-B is effective through May 31, 2018. We believe that employee relations are generally positive and comparable to those of other similarly situated Brazilian manufacturing operations.
Polish Operations
.
Employees at our Strykow, Poland facility are non-union. We believe that employee relations in Poland are positive.
Chinese Operations
.
Employees at our Suzhou, China facility are non-union. We believe that employee relations in China are positive.
English Operations.
Some hourly employees at our Gilberdyke, England facility are represented by a union. We believe that employee relations in England are positive.
Belgium Operations
.
Employees at our Genk, Belgium facility work in accordance with Belgium labor regulations. We believe that employee relations in Belgium are positive.
Environmental Matters
Capital expenditures for environmental controls to meet legal requirements and those relating to the protection of the environment at our facilities in the U.S., United Kingdom, France and Brazil were
$1.1 million
in
2017
, no material amount of which was the result of environmental fines or settlements. We expect such expenditures to be $1.0 million or less in each of the next two years, of which no material amounts are expected to be the result of environmental fines or settlements. These expenditures are not expected to have a material adverse effect on our financial condition, results of operations or competitive position; however, these estimates could be modified as a result of changes in our plans, changes in legal requirements or other factors.
10
Working Capital
We normally maintain approximately 50 to 90 days of inventories to support our operations. Our sales terms average between 15 and 60 days for payment by our customers, dependent upon the products and market segment served. With respect to our accounts payable, we typically carry approximately 15 to 40 days outstanding, in accordance with our purchasing terms, which vary by business location. The accounts payable balance varies in relation to changes in our manufacturing operations, particularly due to changes in prices of wood pulp, resins and purchased energy and the level and timing of capital expenditures related to projects in progress.
Executive Officers of the Registrant
The names and ages of our executive officers as of
March 1, 2018
, together with certain biographical information, are as follows:
|
Name
|
Age
|
Position
|
|||
|
Dr. Jeffrey Kramer
|
57
|
|
Chief Executive Officer
|
||
|
Allison Aden
|
56
|
|
Co-Chief Financial Officer and Principal Financial Officer
|
||
|
R. Andrew Wamser
|
44
|
|
Co-Chief Financial Officer
|
||
|
Michel Fievez
|
60
|
|
Executive Vice President, Engineered Papers
|
||
|
Daniel Lister
|
45
|
|
Executive Vice President, Advanced Materials & Structures
|
||
|
Ricardo Nunez
|
53
|
|
General Counsel and Corporate Secretary
|
||
|
Robert Cardin
|
54
|
|
Corporate Controller
|
||
There are no family relationships between any of the directors, or any of our executive officers. None of our officers were selected pursuant to any arrangement or understanding between the officer and any person other than the Company. Our executive officers serve at the discretion of the Board of Directors and are elected annually by the Board.
Dr. Jeffrey Kramer
was appointed Chief Executive Officer in May 2017, after serving as Co-Chief Executive Officer since March 2017. Prior to joining SWM, Dr. Kramer served as Vice President, Lubricants of Brenntag AG, a distributor of chemicals, from January 2016. Dr. Kramer previously served as President and Chief Executive Officer of J.A.M. Distributing Company from January 2013 through December 2015. J.A.M. Distributing Company is a distributor of high performance lubricants and fuels. Dr. Kramer previously held various senior positions at Air Products and Chemicals, Inc., an industrial gases company, including Vice President and Chief Technology Officer from June 2012 through December 2012 and Vice President and General Manager, Packaged Gases, from 2005 through June 2012.
Allison Aden
was appointed Executive Vice President, Finance and Chief Financial Officer in November 2015. Ms. Aden is serving as Co-Chief Financial Officer and the Company's sole Principal Financial Officer from February 5, 2018 through March 2, 2018 and will then transition to Senior Financial Executive through April 27, 2018. Prior to joining SWM, Ms. Aden served as Executive Vice President and Chief Financial Officer at Americold Logistics, LLC, a global leader in temperature-controlled warehousing and logistics in the food industry, from 2012 to 2015. Prior to that, Ms. Aden served as the Chief Financial Officer at Recall Holdings Limited, a global provider of information management solutions, from 2007 to 2012.
R. Andrew Wamser
was appointed Co-Chief Financial officer on February 5, 2018 and, effective March 2, 2018, will become the sole Executive Vice President, Finance and Chief Financial Officer and the Company's Principal Financial Officer. Prior to joining SWM, Mr. Wamser served as Vice President, Finance; Investor Relations and Treasurer of AutoNation, Inc., the largest automotive retailer by revenue in the US. Prior to that Mr. Wamser served as Managing Director, Investment Banking; Diversified Industrial Group of Barclays Capital Plc, now known as Barclays Investment Bank, the investment banking division of Barclays PLC. He also previously held other investment banking roles at Barclays Capital and UBS Investment Bank.
11
Michel Fievez
was appointed Executive Vice President, Engineered Papers in December 2014. He previously held the title of Executive Vice President, Reconstituted Tobacco at the Company since March 2010. Prior to that, he held the position of President - European Operations from June 2007 to March 2010. From 2003 to May 2007, Mr. Fievez served as General Manager One Side Coated Papers and then Vice President and General Manager Packaging, Metalizing and Office and Graphic with Ahlstrom Corporation, a fiber-based materials company. From 1998 to 2003, he held key management positions, including Managing Director, with Chesapeake Display and Packaging in Europe, and from 1994 to 1998, held the position of Vice President Manufacturing and Technology with Mead Packaging Europe. Before that, he worked for five years as Associate and Engagement Manager with McKinsey & Company.
Daniel Lister
was appointed Executive Vice President, Advanced Materials & Structures on July 5, 2016. Mr. Lister joined SWM from Greif, Inc., a global leader in industrial packaging and services, where he worked since 2005. From 2009 to 2016 Mr. Lister held key international roles including, Vice President, Middle East Development and Division President and CEO of Greif Flexible Products & Services, a Joint Venture with the Al Dabbagh Group. Prior to his international assignments, Mr. Lister led key businesses in North America. Mr. Lister worked for The Dow Chemical Company from 2001 to 2005 where he held several commercial strategy, business growth, and business management roles.
Ricardo Nunez
was appointed Senior Vice President, General Counsel and Corporate Secretary in September 2017, after serving as Interim General Counsel since November 2016. Prior to joining SWM, Mr. Nunez served as General Counsel for Vivex Biomedical, Inc. a Marietta, GA based biologics company from April 2015 to July 2016. Prior to that, he served as SVP, General Counsel and Corporate Secretary for HD Supply, Inc. a spinoff from The Home Depot from March 2007 to April 2015. Mr. Nunez's previous experience also includes senior legal responsibilities at The Home Depot, General Electric, and Esso Inter-America, Inc. (the Latin America affiliate of Exxon Corporation), as well as private practice.
Robert Cardin
has served as Corporate Controller since November 2013. Previously, Mr. Cardin served as Controller for Syncreon International Group, a specialized provider of integrated logistics services to global industries, since 2011. Prior to that time he was employed by DENTSPLY International Inc., a worldwide manufacturer of dental products, as Assistant Corporate Controller from 2010 to 2011 and as Group Controller - Dental Consumables Business from 2004 to 2010.
12
Item 1A.
Risk Factors
Factors That May Affect Future Results
Many risk factors both within and outside of our control could have an adverse impact on our business, financial condition, results of operations and cash flows and on the market price of our common stock. While not an exhaustive list, the following important risk factors could affect our future results, including our actual results for
2017
and thereafter and could also cause our actual results to differ materially from those expressed in any forward-looking statements we have made or may make.
We expect our business to continue to be adversely impacted by governmental actions relating to tobacco products, as well as by decreased demand for tobacco products due to declining social acceptance of smoking, new smoking technologies, and litigation in the U.S. and other countries.
In
2017
, approximately 49% of our net sales were from products used by the tobacco industry in making cigarettes or other tobacco products. Cigarette consumption outside of Asia has generally declined due to, among other things, the diminishing social acceptance of smoking, public reports with respect to the possible harmful effects of smoking, including effects of second-hand smoke, the use of other tobacco products, the development and use of new tobacco-related or substitute products or technologies, such as e-cigarettes, that do not use our products, and, particularly in the U.S., to litigation and actions on the part of private parties to restrict smoking. For instance, litigation is continuing against major U.S. manufacturers of consumer tobacco products seeking damages for health problems allegedly resulting from the use of tobacco in various forms. It is not possible to predict the outcome of such litigation or the effect adverse developments in pending and future litigation may have on the tobacco industry or its demand for our products, but in the past litigation has adversely affected demand for consumer tobacco products. These factors have led, and could lead, to certain merchants deciding not to sell tobacco products. As a result, the overall demand for conventional tobacco cigarettes outside of Asia has generally been declining in terms of volume of sales. These declines have had an adverse effect on demand for our products in these regions. We expect these trends to accelerate and thus to continue to reduce smoking levels and adversely affect demand for our products, which could have a material adverse impact on our future financial condition, results of operations and cash flows.
In recent years, governmental entities around the world, particularly in the U.S., Brazil, Russia, Australia and Western Europe, have taken, or have proposed, actions that had, or are likely to have, the effect of reducing consumption of tobacco products which, in turn, reduces demand for our products. These actions, including efforts to regulate, restrict or prohibit the sale, advertisement and promotion of tobacco products and their components, to limit smoking in public places, to control or restrict additives that may be used in tobacco products and to increase taxes on such products, are intended to discourage the consumption of cigarettes and other tobacco products. For example, in the U.S., the regulatory jurisdiction of the federal Food and Drug Administration was extended in 2009 to include tobacco products, and again in 2016 to include cigars and additional tobacco products. These products are now subject to product component disclosure regulations, new controls on ingredients and design changes, and additional restrictions relating to marketing and labeling. The federal Food and Drug Administration could promulgate additional regulations. In Brazil, regulations limit the use of additives to cigarettes. In the E.U., the Tobacco Products Directive regulates the content, effects, marketing and labeling of tobacco products, and both revisions to the Directive and the ongoing phase-in of the Registration, Evaluation, Authorization, and Restriction of Chemical Substances regulation ("REACH") may further restrict product ingredients. Additionally, the World Health Organization is actively promoting tobacco regulation, and other countries worldwide are in the process of adopting some or all of these restrictions. It is not possible to predict the additional legislation or regulations relating to tobacco products that may be instituted, or additional countries that may adopt such legislation or regulations, or the extent to which such legislation or regulations may impact the design or formulation of our customers' products. Such legislation or regulation may adversely impact the demand for traditional cigarettes and cigars, with corresponding impacts on our sales of cigarette papers, RTL and associated items, which could have a material adverse effect on our future financial condition, results of operations and cash flows.
13
Our joint ventures in China serve only the local market. Declines in Chinese cigarette consumption could have a material adverse effect on our future financial condition, results of operations and cash flows, including our CTS and CTM joint ventures it.
Our technological advantages are unlikely to continue indefinitely.
We consider our intellectual property and patents to be a material asset. We have been at the forefront of developing new products and technology within our industries and have patented several of our innovations, particularly with regard to cigarette paper used to produce LIP cigarettes. This has enhanced our ability to sell products and to provide added functionality and other value to the products we sell allowing them to command higher margins. This advantage has also enabled us to license certain of our patents and know-how to, and earn royalty income from, third parties. Presently, we are seeing evidence of increasing efforts and activity by our competitors and some customers to develop and sell competitive products, particularly in the area of papers used for LIP applications and e-cigarettes, with the effect of creating pricing pressure on our LIP products. Over time, we expect our competitors to develop competitive products that are designed to avoid our intellectual property or to license our innovations. Ultimately, our patents will expire (generally before 2023) and some may be held invalid in certain jurisdictions before their expiration dates. In addition to protecting certain of our technological advantages through patenting, we also protect a significant amount of our technological advantages as trade secrets, especially with regard to our AMS segment and our RTL products. As we expand our production of LIP papers, RTL and our AMS operations to more locations and countries, the risk of the loss of proprietary trade secrets will increase, and any significant loss would result in the loss of the competitive advantages provided by such trade secrets. While we cannot predict the impact or the timing of these trends and eventualities, they likely will reduce our sales and margins from the levels that we otherwise would have achieved.
Furthermore, the extent to which LIP regulations will be adopted in additional regions is uncertain, as is the timing of such adoptions and the technical standards that would be implemented. The absence of such adoptions or the failure to implement standards consistent with those in the U.S. and Western Europe could have an adverse impact on our future financial condition, results of operations and cash flows.
Effectively policing our domestic and international intellectual property and patent rights is costly and may not be successful.
Our portfolio of granted patents varies by country, which could have an impact on any competitive advantage provided by patents in individual countries. We cannot guarantee that any U.S. or foreign patent, issued or pending, will provide us with any continued competitive advantage.
We rely on patent, trademark, and other intellectual property laws of the U.S. and other countries to protect our intellectual property rights. However, we cannot guarantee that one or more of our patents will not be challenged by third parties and/or ultimately held invalid by courts or patent agencies of competent jurisdiction, which could remove the legal barriers preventing competitors from practicing our LIP technology among others.
Further, there can be no assurances that we will be able, or that it will be economic for us, to prevent third parties from using our intellectual property or infringing our patents without our authorization, which may reduce any competitive advantage we have developed. In the event that we need to enforce certain of our patents against infringement through judicial or administrative actions, the litigation to protect these rights is often costly and time consuming and diverts management resources; moreover, there can be no assurance that our efforts to protect our intellectual property will be successful, or that a defendant will not assert counterclaims against us or challenges to other intellectual property we may own.
Some of our patents have been the subject of opposition hearings. Like the actions we undertake to enforce our IP rights, oppositions filed against us in respect of our intellectual property are expensive and divert management time and resources.
14
Even when the Company is initially successful, there can be no assurance that the counterparty will not appeal, or that the appeal will not be successful. Even when successful at the appeal level, as with respect to patents such as EP 1,482,815 (relating to a low-viscosity polymers to print LIP bands), there can be no assurance that a patent will not be later successfully challenged in individual national court jurisdictions.
We do not believe that any of our products infringe the valid intellectual property rights of third parties. However, we may be unaware of intellectual property rights of others that may cover some of our products or services or a court or other governmental body may come to a different conclusion from ours. In that event, we may be subject to significant claims for damages or disruptions to our operations.
Because of the geographic diversity of our business, we are subject to a range of international risks.
Our operations are located in many countries around the world and operate, to a degree, in a decentralized manner. There are inherent control and fraud risks in such a structure. Moreover, we have manufacturing facilities in eight countries and two joint ventures in China and sell products in over 90 countries, many of which are emerging and undeveloped markets.
As a result, our manufacturing operations, sales and results, depending on their location, are subject to various international business risks, including, but not limited to, the following:
|
•
|
Foreign countries can impose significant import, export, excise and income tax and other regulatory restrictions on our business, including limitations on repatriation of profits and proceeds of liquidated assets. While we attempt to manage our operations and international movements of cash from and amongst our foreign subsidiaries in a tax-efficient manner, unanticipated international movement of funds due to unexpected changes in our business or changes in tax and associated regulatory schemes could materially affect our financial position, results of operations and cash flows.
|
|
•
|
We are exposed to global as well as regional macroeconomic and microeconomic factors, which can affect demand and pricing for our products, including: unsettled political and economic conditions, including as they relate to Brazil, Russia and the Ukraine; expropriation; import and export tariffs; regulatory controls and restrictions; and inflationary and deflationary economies. These factors together with risks inherent in international operations, including risks associated with any non-compliance with the U.S. Foreign Corrupt Practices Act, the 2013 Brazilian Clean Companies Act, the U.K. Bribery Act of 2010, the 2013 Russian Law on Preventing Corruption and other non-U.S. anti-bribery law compliance, could adversely affect our financial condition, results of operations and cash flows.
|
|
•
|
We participate in two joint ventures and have one manufacturing facility in China. The joint ventures sell our products primarily to Chinese tobacco companies. Operations in China entail a number of risks including international and domestic political risks, the need to obtain operating and other permits from the government, adverse changes in the policies or in our relations with government-owned or run customers and the uncertainty inherent in operating within an evolving legal and economic system. There are also risks inherent with 50% joint ventures, such as a lack of ability to control, and visibility with respect to operations, customer relations and compliance practice, among others.
|
|
•
|
Changes or increases in international trade sanctions or quotas may restrict or prohibit us from transacting business with established customers or securing new ones, including as to Russia and the Ukraine, which are areas where the Company has offices and/or significant customers and as to which the applicable sanctions have changed unexpectedly on a number of occasions since 2014.
|
Changes in the laws and regulations described above, adverse interpretations or applications of such laws and regulations, and the outcome of various court and regulatory proceedings, including in Europe and Brazil, could adversely impact the Company's business in a variety of ways, including increasing expenses, increasing liabilities, decreasing sales, limiting its ability to repatriate funds and generally limiting its ability to conduct business, all of which could adversely affect our financial condition, results of operations and cash flows.
15
We are subject to the U.S. Foreign Corrupt Practices Act and other anti-corruption laws or trade control laws, as well as other laws governing our operations. If we fail to comply with these laws, we could be subject to civil or criminal penalties, other remedial measures, and legal expenses, which could adversely affect our business, financial condition and results of operations.
We are subject to anti-corruption laws, including the U.S. Foreign Corrupt Practices Act, or FCPA, and other anti-corruption laws that apply in countries where we do business. The FCPA, the 2013 Brazilian Clean Companies Act, the U.K. Bribery Act of 2010, the 2013 Russian Law on Preventing Corruption and these other laws generally prohibit us, our employees, consultants and agents from bribing, being bribed or making other prohibited payments to government officials or other persons to obtain or retain business or gain some other business advantage. We operate in a number of jurisdictions that pose a high risk of potential FCPA violations, and we participate in joint ventures and relationships with third parties whose actions could potentially subject us to liability under the FCPA or local anti-corruption laws. In addition, we cannot predict the nature, scope or effect of future regulatory requirements to which our international operations might be subject or the manner in which existing laws might be administered or interpreted.
We are also subject to other laws and regulations governing our international operations, including regulations administered by the U.S. Department of Commerce’s Bureau of Industry and Security, the U.S. Department of Treasury’s Office of Foreign Asset Control, and various non-U.S. government entities, including applicable export control regulations, economic sanctions on countries and persons, customs requirements, currency exchange regulations and transfer pricing regulations, or collectively, Trade Control laws.
However, there is no assurance that we will be completely effective in ensuring our compliance with all applicable anti-corruption laws, including the FCPA or other legal requirements, including Trade Control laws. If we are not in compliance with the FCPA and other anti-corruption laws or Trade Control laws, we may be subject to criminal and civil penalties, disgorgement and other sanctions and remedial measures, and legal expenses, which could have an adverse impact on our business, financial condition, results of operations and liquidity. Likewise, any investigation of any potential violations of the FCPA other anti-corruption laws or Trade Control laws by U.S. or foreign authorities could also have an adverse impact on our reputation, business, financial condition and results of operations.
Fluctuations in foreign currency exchange rates could adversely impact our financial condition, results of operations and cash flows.
A significant portion of our revenues are generated from operations outside the U.S. In addition, we maintain significant operations and acquire or manufacture many of our products outside the U.S. The functional currency of our international subsidiaries is generally the local currency in which each subsidiary operates. In particular, a large portion of our commercial business is denominated in euros. Our consolidated financial statements are presented in U.S. dollars. Therefore, we must translate revenues, expenses, assets and liabilities from functional currencies into U.S. dollars at exchange rates in effect during, or at the end of, the reporting period. As a result, our future revenues, costs, results of operations and earnings could be significantly affected by changes in foreign currency exchange rates, especially the euro to U.S. dollar exchange rate.
In addition, some of our sale and purchase transactions are denominated in a currency other than the local currency of our operations. As a result, changes in exchange rates between the currencies in which the transaction is denominated versus the local currency of our operation into which the transaction is being recorded can impact the amount of local currency recorded for such transaction. This can result in more or less local currency revenue or cost related to such transaction and thus have an effect on our operating profit. Our Brazilian and Polish operations are more fully exposed to currency transaction risk, especially as a result of U.S. dollar sales in Brazil and euro denominated sales in Poland. We also hold a significant amount of our cash balances in euros, thus any weakening of the euro versus the U.S. Dollar would reduce the amount of U.S. Dollars for which such balances could be exchanged.
Changes in foreign currency exchange rates also impact the amount reported in other income (expense), net. For instance, when a non-local currency receivable or payable is not settled in the period in which it is incurred, we are required to record a gain or loss, as applicable, to reflect the impact of any change in the exchange rate as of the end
16
of the period. We also have to reflect the translation rate impact on the carrying value of our foreign assets and liabilities as of the end of each period, which is recorded as Unrealized Translation Adjustment in Other Comprehensive Income.
We utilize a variety of practices to manage this risk, including operating and financing activities and, where considered appropriate, derivative instruments. All derivative instruments we use are either exchange traded or entered into with major financial institutions in order to reduce credit risk and risk of nonperformance by third parties. Counterparty risk cannot be eliminated and there can be no assurance that our efforts will be successful. We generally hedge foreign currency transaction risk primarily through the use of derivative instruments, including forward and swap contracts and, to a lesser extent, option contracts. The use of derivative instruments is intended to mitigate or reduce transactional level volatility in the results of foreign operations, but does not completely eliminate volatility. If our future revenues, costs and results of operations are significantly affected by economic conditions abroad and/or we are unable to effectively hedge these risks, they could materially adversely affect our financial condition, results of operations and cash flows.
Uncertainties in the interpretation and application of the recently passed U.S. Tax Cuts and Jobs Act (the “Tax Act”) could materially affect our tax obligations and effective tax rate.
On December 22, 2017, President Trump signed into law new legislation that significantly revises the Internal Revenue Code of 1986, as amended, or the Code. The newly enacted Tax Act, among other things, contains significant changes to corporate taxation, and as such, the U.S. Department of Treasury has broad authority to issue regulations and interpretative guidance that may significantly impact how we will apply the law and impact our results of operations. Currently, the application of accounting guidance is widely uncertain. Further, compliance with the Tax Act and the accounting for the newly enacted provisions requires accumulation of information not previously required or regularly produced by us. As a result, we have provided a provisional estimate on the effect of the Tax Act in our financial statements. As additional regulatory guidance is issued, as accounting treatments are clarified, as we perform additional analysis on the Code and the application of the law to our operations, and as we refine estimates in calculating the effect, our final analysis, which will be recorded in the period completed, may be different from our current provisional amounts, which could materially affect our tax obligations and effective tax rate.
The Company could be subject to changes in its tax rates, the adoption of new U.S., or international tax legislation or exposure to additional tax liabilities.
The Company is subject to taxes in the U.S. and in foreign jurisdictions where a number of the Company’s subsidiaries are organized. The Company’s future effective tax rate could be affected by changes in the mix of earnings in countries with differing statutory tax rates or future changes in tax laws or their interpretations as to the legality of tax advantages granted under various current and past corporate structures. Although none of the Company’s international tax arrangements are currently being challenged or threatened to be challenged, recent developments, such as the European Commission’s investigations on illegal state aid as well as the Organization for Economic Cooperation and Development project on base erosion and profit shifting may result in changes to long-standing tax principles or new challenges to our cross-border arrangements, which could materially affect our effective tax rate or require a restructuring of the holding of foreign subsidiaries. If the Company’s effective tax rates were to increase, or if any ultimate determination of the Company’s taxes owed is for an amount in excess of amounts previously accrued, the Company’s operating results, cash flows, and financial condition could be adversely affected.
We face competition from several established competitors and, in our RTL business from tobacco leaf; we have limited market transparency.
Our four largest competitors for our EP business are delfortgroup AG ("Delfort"), Julius Glatz GmbH ("Glatz"), Miquel y Costas & Miquel S.A. ("Miquel y Costas") and PT BUKIT Muria Jaya ("BMJ"). All four primarily operate from modern and cost-effective plants in Western Europe and Asia and are capable and long-standing suppliers to the tobacco industry. Further, three such competitors, Delfort, Glatz and BMJ, are privately held and the third, Miquel y Costas, is a closely held public company. Thus, their financial results and other business developments and strategies are not disclosed to the same extent as ours, which provides them some advantage in dealing with customers. Given the concentration of most of our competitors in Western Europe, which has seen declining demand for tobacco products
17
and has labor laws that make reducing capacity expensive and slow, excess capacity exists and therefore price competition is acute. We believe that all four competitors have good relationships with the multinational cigarette companies, as does the Company. The multinational cigarette companies have been known to use these close relationships to encourage the development of enhanced competition through supporting competitive products and facilities, especially when confronted with new, high-value technologies such as porous plug wrap in the past and LIP today. We believe our Engineered Paper products compete primarily on product features, price, innovations and customer service. Due to many of the factors described above, we have a limited ability to predict trends in the industry and there may be a time lag before we become aware of developing trends in the industry.
Our AMS segment products compete to some degree against niche products made by Marshall Manufacturing Company, Johns Manville, a subsidiary of Berkshire Hathaway Inc., Shaoxing Naite Plastics Co. Ltd., 3M Company, Covestro AG, Tenax Corporation, Intermas Group, and Hollingsworth and Vose Company. We believe our AMS products compete primarily on product features, innovations and customer service. Some of these competitors are larger than we are and have more resources, thus the actions of these competitors could have an impact on the results of our AMS segment operations.
As a result of the foregoing, the Company faces significant selling price, sales volume and new product risks from its competitors, especially during periods (often annually) in which the Company's contracts with its major customers are subject to renewal or renegotiation.
Currently, fine papers used to produce cigarettes are only exported on a limited basis from available capacity in China and other Asian locations to western multinational cigarette companies due to government taxes and tariffs, which limit price competitiveness, as well as due to customer preferences. Should conditions change in this regard, capacity that currently is operating in China and elsewhere in Asia would present a risk to our competitive position outside Asia and place further pressure on our legacy paper production platforms. Similarly, we are starting to see increased competition for some of our AMS products from companies in China, which, we believe, may have lower operating costs than us, resulting in a potential price advantage for such companies.
In the RTL end-market segment, demand is a function, among other things, of smoke delivery regulations, the cigarette manufacturer's desire for a uniform and consistent product, the taste profile sought by cigarette manufacturers and the cost of recycling the tobacco by-product scraps relative to the cost of virgin tobacco products. Thus, our RTL business is also subject to competitive risk from lower cost virgin tobacco leaf or other, cheaper, cigarette fillers. These factors have resulted, and are likely to continue to result, in materially lower sales volumes for our RTL business, resulting in downtime of certain production machines and, in some cases, accelerated depreciation or impairment charges for certain equipment as well as employee severance expenses associated with downsizing or restructuring activities.
Further, as a result of excess capacity in the tobacco-related papers industry and increased operating costs, competitive levels of selling prices for certain of the Company's products are not sufficient to cover those costs with a margin that the Company considers reasonable. Such competitive pressures have resulted, and could result in the future, in downtime of certain paper production machines and, in some cases, accelerated depreciation or impairment charges for certain equipment as well as employee severance expenses associated with downsizing or restructuring activities.
We are dependent upon a small number of customers for a significant portion of our sales; the loss of one or more of these customers, or changes in their cigarette blending approaches, could have a material adverse effect on our business.
Three customers, together with their respective affiliates and designated converters, accounted for over 31% of our net sales in
2017
. The loss of one or more of these customers, or a significant reduction in their purchases, particularly those that impact our sales of LIP papers or reconstituted tobacco, could have a material adverse effect on our financial condition, results of operations and cash flows. The enhanced capabilities provided by RTL in the area of product design and regulatory compliance are important to our customers. However, future RTL results could be adversely affected by fluctuations in customer inventories, changes in the cigarette tobacco blending approaches by our customers, changes in regulations and tariffs and the price of virgin tobacco leaf.
18
In addition, significant consolidation has occurred among our tobacco customers, thereby increasing our dependence upon a fewer number of tobacco industry customers and increasing the negotiating leverage of those customers that remain. If any of our customers were to change suppliers, in-source production of reconstituted tobacco or cigarette papers (including those used to produce LIP cigarettes), institute significant cost-cutting measures or experience financial difficulty, then these customers may substantially reduce their purchases from us, which could adversely impact our financial condition, results of operations and cash flows. In addition, adverse results in the negotiation of any of our significant customer contracts, the terms of which are typically negotiated every one to three years, could significantly impact our financial condition, results of operations and cash flows.
We are dependent upon the availability of credit, and changes in interest rates can impact our business.
We supplement operating cash flow with bank borrowings under a secured credit agreement with a syndicate of banks. Borrowings under this agreement will mature in October 2020 and October 2022. To date, we have been able to access credit when needed and on commercially reasonable terms. However, deterioration of credit markets, including an economic crisis in the U.S. or elsewhere, whether or not caused by the U.S. or European debt ceiling, deficits and budget issues, could have an adverse impact on our ability to negotiate new credit facilities or access or renew our existing one. Constraints on the availability of credit, or the unavailability of credit at reasonable interest rates, would negatively impact our business, including potentially impairing our ability to declare dividends, conduct share buy-backs and make acquisitions.
Our secured credit facility contains certain financial covenants. In the event of material unforeseen events that impact our financial performance, particularly during a time when we have material amounts of debt, a situation could arise where we are unable to fully draw from our existing credit facility notwithstanding that there is otherwise available capacity.
Our credit facilities are secured by substantially all of the personal property of the Company and its domestic subsidiaries. In the event of a default on these agreements, substantially all of the assets of the Company could be subject to foreclosure or liquidation by the secured creditors.
We may utilize a combination of variable and fixed-rate debt consisting of short-term and long-term instruments. We selectively hedge our exposure to interest rate increases on our variable rate long-term debt when we believe that it is practical to do so. We have utilized various forms of interest rate hedge agreements, including interest rate swap agreements, forward rate agreements and cross currency swaps. There are inherent risks associated with interest rate hedges, including those associated with the movement of interest rates, counterparty risk and unexpected need to refinance debt, thus there can be no certainty that our hedging activities will be successful or fully protect us from interest rate exposure. As of December 31, 2017 the Company has entered into interest rate hedge transactions which have the effect of fixing the interest rate on approximately 54% of our debt subject to variable interest rates.
Our use of interest rate hedge agreements to manage risk associated with interest rate volatility may expose us to additional risks, including the risk that a counterparty to a hedge agreement may fail to honor its obligations. Developing an effective interest rate risk strategy is complex and no strategy can completely insulate us from risks associated with interest rate fluctuations. There can be no assurance that our hedging activities will have the desired beneficial impact on our results of operations or financial condition. Termination of interest rate hedge agreements typically involves costs, such as transaction fees or breakage costs.
19
Our internal and external expansion plans and asset dispositions entail different and additional risks relative to the rest of our business.
From time to time, we consider acquisitions either within the tobacco industry or outside the industry in connection with our diversification initiatives, such as our acquisitions of DelStar Technologies, Inc., Argotec LLC and Conwed Plastics LLC. This acquisition activity could involve confidential negotiations that are not publicly announced unless and until those negotiations result in a definitive agreement. It is possible that an acquisition could adversely impact our results, credit ratings or the outlook of our business, due to, among other things, integration and employee retention challenges, contrasting company cultures and different information technology and reporting systems. Also, acquisition opportunities are limited and present risks of failing to achieve strategic objectives, smooth integrations or anticipated synergies or returns. There can be no assurance that we will be able to acquire attractive businesses on favorable terms, that we will realize the anticipated benefits or profits through acquisitions or that acquisitions will be accretive to our earnings. Changes in our portfolio of businesses, assets and products, whether through acquisition (such as our acquisitions of DelStar, Argotec and Conwed), disposition or internal growth, present additional risks, including causing us to incur unknown or new types of liabilities, subjecting us to new regulatory frameworks and new market risks, and acquiring operations in new geographic regions with challenging labor, regulatory and tax regimes. The potential future expansion of our AMS business unit or other operations could cause these operations to face additional competition from larger and more established competitors than is currently the case.
Our ability to dispose of idled assets and the value that may be obtained relative to their book value can result in significant impairment charges. Building a new plant or other facility or relocating, rebuilding or otherwise modifying existing production machinery is a major undertaking and entails a number of risks, including the possibility that the contractors and sub-contractors who are expected to build the facility or rebuild the machine and supply the necessary equipment do not perform as expected, the possibility of cost overruns and delays, or that design defects or omissions cause the facility or machine to perform at less than projected efficiency or at less than projected capacity. In addition, commencement of production at a new site or at a rebuilt or relocated machine is time consuming and requires testing and acceptance by customers and potentially by regulators, of the facility and the products that are produced. Also, while we anticipate sufficient demand for the facility's or machine's output, there can be no assurances that the expected demand will materialize. For more information on our expansion plans, see Part II, Item 7. "Management's Discussion and Analysis of Financial Condition and Results of Operation" of this report.
We also expect to continue to expend resources to diversify and expand our product portfolio. Research and development and product diversification have inherent risks, including technical success, market acceptance, new regulations and potential liabilities. We cannot guarantee that such efforts will succeed, that we will not incur new or different liabilities or that we will achieve a satisfactory return on such expenditures.
We may not successfully integrate acquisitions or integrate other SWM operations into AMS and we may be unable to achieve anticipated cost savings or other synergies.
The integration of the operations of acquired companies involves a number of risks and presents financial, managerial, reporting, legal and operational challenges. We may have difficulty, and may incur unanticipated expenses related to, integrating information systems, financial reporting activities, employee retention and integrating and retaining management and personnel from acquired companies. Among these risks are potential loss of consumer awareness and demand for the acquired companies’ products based on the rebranding of those products under the Company’s legacy brand names. Additionally with respect to the acquisitions of DelStar, the two associated acquisitions in December 2014, Argotec, and Conwed in early 2017, we may not be able to achieve anticipated cost savings or commercial or growth synergies, for a number of reasons, including contractual constraints and obligations or an inability to take advantage of expected commercial opportunities, inability to achieve increased operating efficiencies or commercial expansion of key technologies. In the second half of 2015, we formed our AMS business unit comprised of these operations and certain other SWM resources. The future success of AMS depends, in part, on our ability to attract additional management, retain key employees, integrate new personnel, operating and reporting systems as well as execute AMS’ growth strategy. Failure to successfully integrate acquired companies into AMS may have an adverse effect on our business, financial condition, results of operations, and cash flows.
20
Our restructuring activities are time-consuming and expensive and could significantly disrupt our business.
We have initiated significant restructuring activities in recent years, including restructurings in 2014, 2015, 2016 and 2017 in France and the U.S., during 2014 in Brazil and during 2012 in the Philippines, that have become part of an overall effort to improve an imbalance between demand for our products and our production capacity as well as improve our profitability and the quality of our products. We expect to continue these restructuring efforts from time to time. Restructuring of our existing operations, or as a result of acquisitions, involves issues that are complex, time-consuming and expensive and could significantly disrupt our business as well as garner review from regulatory authorities which could result in financial impacts to the Company. The challenges involved in executing the actions that are part of our ongoing and, potentially future, restructuring plans include:
|
•
|
demonstrating to customers that the restructuring activities will not result in adverse changes in service standards or business focus;
|
|
•
|
consolidating administrative infrastructure and manufacturing operations while maintaining adequate controls throughout the execution of the restructuring;
|
|
•
|
preserving distribution, sales and other important relationships and resolving potential conflicts that may arise;
|
|
•
|
estimating, managing and minimizing the cost of the restructuring activities;
|
|
•
|
minimizing the diversion of management attention from ongoing business activities;
|
|
•
|
maintaining employee morale, retaining key employees, maintaining reasonable collective bargaining agreements and avoiding strikes, work stoppages or other forms of labor unrest while implementing restructuring programs that often include reductions in the workforce;
|
|
•
|
securing government approval of such plans, where necessary, and managing the litigation and associated liabilities that often are associated with restructuring actions;
|
|
•
|
incurring costs associated with delays in restructuring activities caused by labor negotiations and/or governmental approvals;
|
|
•
|
coordinating and combining operations, which may be subject to additional constraints imposed by collective bargaining agreements and local laws and regulations; and
|
|
•
|
achieving the anticipated levels of net cost savings and efficiency as a result of the restructuring activities.
|
If we do not achieve future and continued expected benefits as a result of our legal entity realignment, the ability to achieve our financial guidance for operating results and our financial condition, results of operations and cash-flow could be adversely affected.
In 2014, 2016 and again in 2017, we re-examined and re-aligned certain internal business operations and our legal entity structure in order to improve our cash-flows, have easier access to our foreign cash, centralize, enhance the management of our intellectual property and streamline certain internal business activities. Steps to accomplish these objectives have been taken and additional steps may be taken later as we continue to grow certain of our operations, diversify our business and continue our business analyses. We anticipate that there could be further realignment activities in the future.
Realignments can present significant potential risks of events occurring that could delay, halt or adversely affect the success of a project, including delays encountered in finalizing the scope of, and implementing, the realignment, the failure to achieve targeted benefits or savings, the failure to follow appropriate regulatory requirements or internal processes and procedures and a potential decrease in employee morale. Further, there can be no assurance that the taxing authorities of the jurisdictions in which we operate, or to which we are otherwise deemed to have sufficient tax
21
activity, will not challenge our interpretation of tax laws and regulations or the tax benefits that we expect to realize as a result of the realignment. Any such challenges (including our response thereto) can be time consuming or expensive with potentially uncertain outcomes, including as to additional interest, penalties or increase in back taxes that could be payable by us. In addition, changes to U.S. or non-U.S. tax laws and regulations may materially impact the anticipated benefits of our legal entity structure and any potential future realignments. Any future impact to our effective tax rate will also depend on our ability to operate our business in a manner consistent with the regulatory requirements for such a realignment including applicable taxing provisions and realization of our anticipated profits as well as the countries in which such profits are realized. Further, we have incurred certain costs in connection with the realignment and we may incur additional costs, including ones that are not currently expected to be incurred. There also can be significant costs and complexities around meeting the necessary tax accounting rules as required by our realignment structure and regulations applicable to us and it is possible that the authorities might disagree with our accounting treatment or that there may be a disagreement or dispute regarding our calculations. It is also possible that the authorities might change, either prospectively or retrospectively, certain complex tax rulings that would have potentially significant impacts to our financial results. Additionally, due to the complex nature of some of the accounting and taxation calculations, the Company may incur significant costs in defending its interpretation of positions in regards to certain tax legislation, rulings and inquiries.
To the extent these risks or circumstances occur, we may fail to achieve the future financial and business benefits that we anticipate as a result of the realignments, our tax rate may increase and our future operating results, financial condition and cash flows may be negatively impacted. Thus, there can also be no assurance that we will realize the expected future benefits of the realignments.
Our financial performance can be significantly impacted by the cost and availability of raw materials and energy and we may have limited ability to pass through increases in costs to our customers.
Raw materials are a significant component of the cost of the products that we manufacture. The cost of wood pulp, which is the largest component of the raw materials that we use in our EP segment, and some resins used by our AMS segment are highly cyclical and can be more volatile than general consumer or producer inflationary changes in the general economy. For instance, during the period from January 2013 through December 2017, the U.S. list price of northern bleached softwood kraft pulp ("NBSK") a representative pulp grade that we purchase, increased by 35%. Also, in that same time period, the cost of polypropylene has fluctuated significantly based on a number of factors, including changes in global oil markets. As we periodically enter into agreements with customers under which we agree to supply products at fixed prices, unanticipated increases in the costs of raw materials, or the lack of availability of such raw materials (due to force majeure or other reasons), can significantly impact our financial performance. Even where we do not have fixed-price agreements, we generally cannot pass through increases in raw material costs in a timely manner and in many instances are not able to pass through the entire increase to our customers. Further, some of the resins we use in our AMS segment are only available from a single supplier, or a limited number of suppliers. Consequently, such supplier(s) can control the availability and thus the cost of the resins we use, notwithstanding any changes in the cost of oil. It can be time consuming and costly, and occasionally impractical, to find replacement resins where such suppliers limit the availability or increase the cost of resins we use.
Paper manufacturing is energy-intensive. In France, Poland, China and in the U.S., availability of energy generally is reliable, although prices can fluctuate significantly based on variations in overall demand. Western Europe is becoming significantly dependent on energy supplies from the Commonwealth of Independent States, which in the past has demonstrated a willingness to restrict or cut off supplies of energy to certain customers. The volume of oil or gas flowing through pipeline systems that ultimately connect to Western Europe also has been cut off or restricted in the past, and such actions can adversely impact the supply of energy to Western Europe and, consequently, the cost and availability of electricity to our European operations. In Brazil, because production of electricity is heavily reliant upon hydroelectric plants, availability of electricity can be, and has been in the past, affected by rain variations. Electricity in Brazil is also heavily taxed. Due to the competitive pricing for most of our products, we typically are unable to fully pass through higher energy costs to our customers. Periodically, when we believe it is advantageous to do so, we enter into agreements to procure a portion of our energy for future periods in order to reduce the uncertainty of future energy costs. However, in recent years this has only marginally slowed the increase in energy costs due to the volatile changes in energy prices we have experienced.
22
A failure of, or a security breach in, a key information technology system or process or other unusual events could compromise our information and expose us to liability, which could adversely affect our business; IT project delays and overruns are possible.
We rely extensively on information technology systems, some of which are managed by third-party service providers, to analyze, process and manage transactions and sensitive data, including intellectual property, our proprietary business information and that of our customers, suppliers and business partners, and personally identifiable information of our employees. The secure processing and maintenance of this information is critical to our operations and business strategy and we rely heavily on the integrity of this data in managing our business. Despite our security measures, our information technology and infrastructure may be vulnerable to attacks by hackers or be breached due to employee or third party error, malfeasance or other disruptions. Any such breach could compromise our networks and the information stored there could be accessed, publicly disclosed, lost or stolen. Any such access, disclosure or other loss of information could result in legal claims or proceedings, regulatory penalties, including penalties under EU privacy laws, and disrupt our operations. There are further risks associated with the information systems of companies we acquire, both in terms of systems compatibility, level of security and functionality. It may cost us significant money and resources to address these risks and we may fail to address them successfully, adversely impacting our financial condition, results of operations and cash flows.
From time to time, we undertake significant information technology systems projects, including enterprise resource planning updates, modifications and roll-outs. These projects are subject to cost overruns and delays. Not only could these cost overruns and delays impact our financial statements but a delay in the completion of a needed IT project could adversely impact our ability to run our business and make fully informed decisions.
We rely on a limited number of key employees, have had significant personnel turnover and have had difficulty in attracting and hiring qualified new personnel in some areas of our business.
The loss of any of our key employees, including our CEO and his direct reports, due to retirement, difference in culture with acquired businesses, the demands of our business, our tobacco-related operations or otherwise could adversely affect our business and thus our financial condition, results of operations and cash flows. Because a large part of our business is tied to the tobacco industry, we may also experience difficulty in retaining and hiring qualified executives and other personnel in our AMS segment, at corporate and/or in EP. This may be caused by the health and social issues associated with the tobacco industry. We not only compete for talent with consumer products and other companies that enjoy greater social acceptance but also with larger, more established companies within the tobacco industry.
As we diversify through acquisitions outside our tobacco-related operations, we run the risk of turnover of key personnel within the businesses we acquire as well as difficulty in finding and attracting first class talent in industry segments that are new to us. This could slow the growth of these businesses and impede our ability to find and complete synergistic acquisitions.
Our business is subject to seasonal or cyclical market and industry fluctuations which may result in reduced net sales and operating profits during certain periods.
Sales of our EP products in the U.S., Europe, China and Brazil are subject to seasonal fluctuations. In the U.S. and Europe, customer shutdowns typically occur in August and December and historically have resulted in reduced net sales and operating profit during those two months. Likewise, the production of cigarettes in China for the Chinese market slows significantly before and during Chinese New Year, with a corresponding reduction in demand for our EP products. Additionally, our facilities occasionally shut down equipment to perform additional maintenance during these months or as a result of slow demand, resulting in higher product costs, higher maintenance expenses and reduced operating profit. In Brazil, customer orders are typically lower in December due to a holiday season during much of January and February. The oil & gas, mining and automotive industries are important to sales in our AMS segment and these and other industries tend to be cyclical, which could adversely impact our business, financial condition, results of operations and cash flows during the duration of their down cycles.
23
Our business depends upon good relations with our employees; work stoppages, slowdowns or legal action by our unionized employees may have a material adverse effect on our business, financial condition, results of operations and cash flows.
We employ approximately 3,600 employees, including manufacturing employees represented by unions. Although we believe that employee and union relations are generally positive, there is no assurance that this will continue in the future. We may experience difficulties in maintaining appropriate relations with unions and employees in certain locations. Problems or changes affecting employees in certain locations may affect relations with our employees at other locations. The risk of labor disputes, work stoppages or other disruptions in production could adversely affect us, especially in conjunction with potential restructuring activities. If we cannot successfully negotiate or renegotiate collective bargaining agreements, or if negotiations take an excessive amount of time, there may be a heightened risk of work stoppages and we may be unable to achieve planned operational efficiencies. Work stoppages may be caused by the inability of national unions and the governments of countries in which we operate from reaching agreement, and are outside of our control. Any work stoppage or failure to reach agreements with our unions could have a material adverse effect on our customer relations, our productivity, the profitability of a manufacturing facility, our ability to develop new products and on our operations as a whole, resulting in an adverse impact on our business, financial condition, results of operations and cash flows.
Our business is subject to various environmental laws, regulations and related litigation that could impose substantial costs or other liabilities on us.
Our facilities are subject to significant federal, state, local and foreign environmental protection laws with respect to air, water and emissions as well as the disposal of solid waste. We believe that we are operating in substantial compliance with these laws and regularly incur capital and operating expenditures in order to achieve future compliance. However, these laws may change, which could require changes in our practices, additional capital expenditures or loss of carbon credits, and we may discover aspects of our business that are not in compliance. Violation of these laws can result in the imposition of significant fines and remediation costs. In France, we presently have sufficient authorized capacity for our emissions of carbon dioxide. However, this authorization must be renewed every five years and was last renewed in 2013. We cannot predict whether we will have sufficient authorized capacity to conduct our operations in France as presently conducted or to do so without having to make substantial capital expenditures in future years.
We are a member of a potentially responsible party group ("Global PRP Group") that entered into a settlement with the State of New Jersey in 1993 concerning the remediation of a landfill site in Middlesex County, New Jersey. The landfill remediation has been completed. We have established a reserve of approximately $0.4 million that we believe is adequate to cover our ongoing liability, but we remain exposed to post-closure operating costs over an extended period of years that cannot be fully known or estimated at this time.
Although we are not aware of any environmental conditions at any of our facilities that could have a material adverse effect on our financial condition, results of operations and cash flows, we own facilities in France, the U.S. and elsewhere that have been operated over the course of many decades. We may face higher disposal and clean-up costs to replace equipment or facilities containing materials that were compliant when installed, but are now considered contaminants. Additionally, as we sell closed or other facilities, we may be required to perform additional environmental evaluations that could identify items that might require remediation or other action, the nature, extent and cost of which are not presently known. We may also incur environmental liabilities in connection with assets or businesses we may purchase in the future.
Increases in costs of pension benefits may reduce our profitability.
Our results of operations may be negatively affected by expenses we record for our defined benefit pension plans. Generally accepted accounting principles in the U.S., ("GAAP"), require that we calculate income or expense for the plans using actuarial valuations. These valuations reflect assumptions about financial markets, longevity of our current and former employees and other economic conditions, which may change based on changes in key economic indicators and mortality tables. We are required to make an annual measurement of plan assets and liabilities, which may result
24
in increased funding obligations or negative changes in our stockholder equity. At the end of
2017
, the combined projected benefit obligation of our U.S. and French pension and other postretirement healthcare plans was underfunded by
$24.1 million
. For a discussion regarding our pension obligations, see Note
17
. Postretirement and Other Benefits of the Notes to Consolidated Financial Statements in Part II, Item 8 and "Other Factors Affecting Liquidity and Capital Resources" in Part II, Item 7. Although expense and pension funding contributions are not directly related, key economic factors that affect expense would also likely affect the amount of cash we would contribute to pension plans as required under the Employee Retirement Income Security Act ("ERISA") for U.S. plans. Failure to achieve expected returns on plan assets driven by various factors, which could include a continued environment of low interest rates or sustained market volatility, could also result in an increase to the amount of cash we would be required to contribute to pension plans.
We are subject to various legal actions and other claims.
We regularly are involved in legal actions and other claims arising in the ordinary course of business and otherwise. We are also subject to many laws and regulations around the world. Despite our efforts, we cannot guarantee that we are in compliance with every such law or regulation. Because of the complexity of Brazilian tax laws and court systems, legal actions are a particular risk that affects our Brazilian operations. Although we believe that our positions in pending disputes about state and federal taxes are correct and will ultimately be upheld by Brazilian courts, the outcome of legal proceedings is difficult to predict. An adverse result in one or more of these tax disputes could have a material adverse impact on our financial condition, results of operations and cash flows. We are also subject to other litigation in Brazil, including labor and workplace safety claims. Although we do not believe that any of the currently pending actions or claims against us will have a material adverse impact on our financial condition, results of operations and cash flows, we cannot provide any assurances in this regard. Information concerning some of these actions that currently are pending is contained in Note
19
. Commitments and Contingencies, of the Notes to Consolidated Financial Statements and in Part I, Item 3, “Legal Proceedings” of this report. We also cannot give any assurances as to any litigation that might be filed against us in the future, including any claims relating to the alleged harmful effect of tobacco use on human health.
Significant impairment charges could result from our evaluation of the Philippines RTL manufacturing site.
We suspended construction of our Philippines RTL manufacturing site during 2011. During 2015, as a result of management's intent and ability to dispose of these assets, the amounts were reclassified from property, plant and equipment to assets held for sale in our balance sheet. The carrying value of these assets is based on estimated fair value less cost to sell. During 2017, we compared the estimated fair value less cost to sell to the net book value of the assets which resulted in our recording of an impairment charge of $4.0 million.
In years prior to 2015, the carrying value of the assets was evaluated for impairment at each reporting period by assessing the recoverability of the costs based on the undiscounted cash flows of the operation, the likelihood of its reactivation and any alternative uses for the equipment. This evaluation, along with declines in our RTL volumes, resulted in 2013 in an impairment of $37.2 million. Further declines in the estimated fair value of these assets could result in a decision to record a further impairment of some or a substantial portion of the remaining outstanding balance of these assets, which was
$12.8 million
at
December 31, 2017
.
One portion of our business is dependent upon a single plant; further, we have limited cross redundancy across our facilities.
Sales of reconstituted tobacco leaf products represent a substantial portion of our revenues and profits. We presently produce reconstituted tobacco leaf at only one facility located in France and wrapper and binder products at only one facility located in Ancram, New York. In our AMS business, in order to enhance the protection of our trade secrets, critical proprietary dies used in a significant portion of our extruding operations are made at only one facility with very limited personnel trained to manufacture them. Further, in order to achieve operational efficiencies, among other reasons, we have limited ability to shift production across our various facilities, thus the loss of production at one facility may not be able to be mitigated by increased production at another. Consequently, natural disasters, pandemics and other unusual events could cause the loss of, or interruption of operations for a significant length of time at one or
25
more of our facilities in six different countries, which could have a material adverse effect on our financial condition, results of operations and cash flows.
Fluctuations in construction and infrastructure spending can impact demand for certain of our products.
Demand for certain of our products depends on spending in the construction industry, both residential and non-residential, as well as infrastructure sectors. Spending in those sectors is impacted by numerous circumstances beyond our control including, but not limited to, interest rates, availability of financing, housing inventory, capital spending, corporate investment, local, federal and state regulations, as well as availability and commitment of public funds for municipal spending, capacity utilization and general economic conditions. Decreased spending in any of these sectors could have an adverse impact on our financial condition, results of operations, and cash flows during the duration of their down cycle.
Historically, we have experienced significant cost savings and productivity benefits relating to our ongoing Operational Excellence program; however, these benefits may not continue indefinitely or at the same levels.
Historically, we have experienced significant cost savings and productivity benefits relating to our ongoing Operational Excellence program as it relates to our tobacco operations that have supported our margins during periods of significant attrition in the tobacco industry. We expect to continue to achieve significant savings and benefits from this program; however, in light of continued industry attrition, execution risks and other factors, we may be unable to continue in the future to obtain savings and benefits in line with historical achievements, and our profitability and financial results could be adversely affected.
Similarly, though we have initiated implementation of this program in our AMS business operations in order to achieve margin improvements, due to the different company cultures of the acquisitions that make up a significant part of AMS and our continuing integration of these acquisitions, we may not be able to achieve the desired margin improvements through our Operational Excellence program at AMS.
Item 1B.
Unresolved Staff Comments
None.
26
Item 2.
Properties
As of
December 31, 2017
, we operated a total of 23 production facilities on four continents and owned one non-production facility which is marketed for sale.
The following are the locations of our principal production facilities as of
December 31, 2017
. Except as otherwise noted, we own the facilities listed below:
|
Advanced Materials & Structures Segment Production Locations
|
Approximate Square Footage of Buildings
|
Engineered Papers
Segment Production Locations
|
Approximate Square Footage of Buildings
|
|||||
|
Middletown Manufacturing Site
|
Spotswood Plant
|
|||||||
|
Middletown, Delaware
|
142,000
|
|
Spotswood, New Jersey
|
399,000
|
|
|||
|
U.S. Netting Manufacturing Site*
|
Papeteries de Saint-Girons Plant
|
|||||||
|
Austin, Texas
|
115,000
|
|
Saint-Girons, France
|
214,000
|
|
|||
|
Tubing Operations*
|
PDM Industries Plant
|
|||||||
|
Richland, Pennsylvania
|
35,000
|
|
Quimperlé, France
|
592,000
|
|
|||
|
Tubing Operations*
|
Pirahy Plant
|
|||||||
|
El Cajon, California
|
22,000
|
|
Piraí, Brazil
|
1,098,000
|
|
|||
|
Suzhou Manufacturing Site*
|
Poland Plant*
|
|||||||
|
Suzhou, China
|
108,000
|
|
Strykow, Poland
|
125,000
|
|
|||
|
Poland Manufacturing Site*
|
Newberry Operation*
|
|||||||
|
Strykow, Poland
|
42,000
|
|
Newberry, South Carolina
|
50,000
|
|
|||
|
Gilberdyke Manufacturing Site
|
Fiber Operation
|
|||||||
|
Gilberdyke, United Kingdom
|
67,000
|
|
Manitoba, Canada
|
16,000
|
|
|||
|
Wilson Manufacturing Site*
|
LTR Industries Plant
|
|||||||
|
Wilson, North Carolina
|
108,000
|
|
Spay, France
|
736,000
|
|
|||
|
Argotec Manufacturing Operations*
|
182,000
|
|
Ancram Plant
|
|||||
|
Greenfield, Massachusetts
|
Ancram, New York
|
116,000
|
|
|||||
|
Minneapolis Manufacturing Site*
Minneapolis, Minnesota
|
144,000
|
|
RTL Philippines Plant (currently marketed for sale)
|
|||||
|
Sto. Tomas, Philippines
|
283,000
|
|
||||||
|
Athens Manufacturing Site
|
||||||||
|
Athens, Georgia
|
200,000
|
|
||||||
|
Roanoke Manufacturing Site
|
||||||||
|
Roanoke, Virginia
|
40,000
|
|
||||||
|
Chicago Manufacturing Site*
|
||||||||
|
Chicago, Illinois
|
66,000
|
|
||||||
|
European Manufacturing Site
|
||||||||
|
Genk, Belgium
|
90,000
|
|
||||||
|
* Leased properties
|
||||||||
27
During 2017 we acquired five production locations in conjunction with our acquisition of Conwed. In 2015 we acquired one production location in conjunction with our acquisition of Argotec and completed construction of our Poland site to support the manufacturing operations of our AMS segment.
As of
December 31, 2017
, AMS product manufacturing lines operated at approximately 63% capacity compared to 80% capacity as of
December 31, 2016
. We had approximately 184,000 metric tons of annual paper production capacity, dependent upon the production mix. Capacity utilization increased in
2017
to 82% for EP products compared with 80% in
2016
. We also operate flax fiber processing operations in Canada and printing operations in France, Poland and the U.S.
We maintain administrative and/or sales offices in Alpharetta, Georgia; Quimperlé, France; Spay, France; Shanghai, China; Piraí, Brazil; Moscow, Russia; Strykow, Poland; Middletown, Delaware; Greenfield, Massachusetts; Luxembourg City, Luxembourg; Minneapolis, Minnesota; and Bristol, England. Our world headquarters are located in Alpharetta, Georgia. All of these offices are owned except for those located in Alpharetta, Shanghai, Moscow, Strykow, Greenfield, Minneapolis, Luxembourg City, and Bristol which are leased.
We consider all of our facilities to be well-maintained, suitable for conducting our operations and business, and adequately insured. Our RTL Philippines facility in Sto. Tomas, Philippines, is currently being marketed for sale. This property is classified as Assets held for sale in the Company's Consolidated Balance Sheets as of
December 31, 2017
and
2016
.
Item 3.
Legal Proceedings
General
We are involved in various legal proceedings relating to contracts, commercial disputes, taxes, environmental issues, employment and workers' compensation claims, product liability and other matters. We periodically review the status of these proceedings with both inside and outside counsel. We believe that the ultimate disposition of these matters will not have a material effect on the results of operations in a given quarter or year, but no assurances can be given in this regard. Below is a summary of major outstanding litigation.
Litigation
Brazil
Imposto sobre Circulação de Mercadorias e Serviços ("ICMS") a form of value-added tax in Brazil, was assessed to our Brazilian subsidiary, Schweitzer-Mauduit do Brasil Indústria e Comércio de Papel Ltda. ("SWM-B"), in December of 2000. SWM-B received two assessments from the tax authorities of the State of Rio de Janeiro for unpaid ICMS taxes on certain raw materials from January 1995 through November 2000 (collectively, the "Raw Materials Assessments").
The Raw Materials Assessments concerned the accrual and use by SWM-B of ICMS tax credits generated from the production and sale of certain non-tobacco related grades of paper sold domestically. SWM-B has contested the Raw Materials Assessments based on Article 150, VI of the Brazilian Federal Constitution of 1988, which grants immunity from ICMS taxes to papers intended for printing books, newspapers and periodicals, or immune papers, and thus to the raw material inputs used to produce immune papers. One of the two assessments, or Assessment 1 (case number 2001.001.115144-5), related in part to tax periods that predated our acquisition of the Pirahy plant in Pirai, Brazil. In October 2015, the Federal Supreme Court of Brazil denied the State’s appeal of Assessment 1, in the amount of approximately
$16 million
, a decision which is now final. The second assessment, or Assessment 2 (case number 2001.001.064544-6), pertains exclusively to periods that SWM-B owned the Pirahy plant. Assessment 2 in the amount of approximately
$13 million
remains pending before the Federal Supreme Court of Brazil on SWM-B’s appeal on the merits and is likely to be finally decided by the action of the chamber of the court hearing the matter. No docket entry has been made yet regarding argument on Assessment 2.
28
SWM-B received assessments from the tax authorities of the State of Rio de Janeiro for unpaid ICMS and Fundo Estadual de Combate à Pobreza ("FECP", a value-added tax similar to ICMS) taxes on interstate purchases of electricity. The state issued three sets of assessments against SWM-B, one for May 2006 - November 2007, a second for January 2008 - December 2010, and a third for September 2011 - September 2013 (collectively the "Electricity Assessments"). SWM-B has challenged all three Electricity Assessments in administrative proceedings before the state tax council (in the first-level court Junta de Revisão Fiscal and the appellate court Conselho de Contribuintes) based on Resolution 1.610/89, which defers these taxes on electricity purchased by an "electricity-intensive consumer." In October and November 2014, a majority of the Conselho de Contribuintes sitting en banc ruled against SWM-B in each of the first and second electricity assessments. The State issued notices to SWM-B to pay approximately
$6 million
in connection with the first electricity assessment and
$9 million
in connection with the second electricity assessment, in each case based on the foreign currency exchange rate at
December 31, 2017
. SWM-B filed separate challenges to these electricity assessments in further court proceedings in the state judicial system, and different chambers of the judicial court granted SWM-B preliminary injunctions against enforcement. In March and July 2017, the first-level judicial court ruled that SWM-B must present additional evidence that it is an "electricity-intensive consumer" concerning the first and second electricity assessments. SWM-B is now pursuing these actions. SWM-B's challenge to the third electricity assessment (approximately
$4 million
as of
December 31, 2017
) was decided adversely to SWM-B at the first administrative level (Junta de Revisão Fiscal) and has been appealed to the Conselho de Contribuintes. The State issued a new regulation effective January 1, 2018 that only specific industries are “electricity-intensive consumers,” a list that excludes paper manufacturers.
SWM-B believes that both the remaining Raw Materials Assessment and the Electricity Assessments will ultimately be resolved in its favor. No liability has been recorded in our consolidated financial statements for these assessments based on our evaluation of these matters under the facts and law as presently understood. The Company can give no assurance as to the ultimate outcome of such proceedings.
France
In December 2016, the Conseil de Prud’hommes d’Orange (a French court dealing with labor matters) rendered a decision by which the Company’s wholly owned subsidiary, Schweitzer Mauduit France (“SWM France”), was ordered to pay approximately €1.3 million to 18 former employees of Malaucène Industries, another wholly owned subsidiary, on the grounds, among other things, that SWM France was a “co-employer” of the plaintiffs, and, as a result, liable for certain obligations of Malaucène Industries with respect to such employees. Malaucène Industries stopped production in 2009. The Company believes that SWM France, which is a corporate holding company and indirect corporate parent of Malaucène Industries, is not a “co-employer” of any person and that the other claims are also without merit. The Company has no liability recorded in the consolidated financial statements for this matter, believing that the chances of SWM France to reverse the decision on appeal are sufficient that no such reserve is warranted. There can be no assurance, however, that the court of appeals will decide in favor of SWM France on any of the questions pending before the court.
Environmental Matters
Our operations are subject to various federal, state and local laws, regulations and ordinances in various nations relating to environmental matters. The nature of our operations exposes us to the risk of claims with respect to various environmental matters, and there can be no assurance that material costs or liabilities will not be incurred in connection with such claims. While we have incurred in the past several years, and will continue to incur, capital and operating expenditures in order to comply with environmental laws and regulations, we believe that the future cost of compliance with environmental laws, regulations and ordinances, our exposure to liability for environmental claims, and our obligation to participate in the remediation and monitoring of certain hazardous waste disposal sites, will not have a material effect on our financial condition or results of operations. However, future events, such as changes in existing laws and regulations, or unknown contamination of sites owned, operated or used for waste disposal by us (including contamination caused by prior owners and operators of such sites or other waste generators) may give rise to additional costs which could have a material effect on our financial condition or results of operations.
29
The Company incurs spending necessary to meet legal requirements and otherwise relating to the protection of the environment at its facilities in the U.S., France, Poland, Brazil, China, the United Kingdom and Canada. For these purposes, the Company incurred total capital expenditures of
$1.1 million
in
2017
, and expects to incur less than
$1.0 million
in each of 2018 and 2019, of which no material amount is the result of environmental fines or settlements. The foregoing capital expenditures are not expected to reduce the Company's ability to invest in other appropriate and necessary capital projects and are not expected to have a material adverse effect on its financial condition or results of operations.
Indemnification Matters
In connection with our spin-off from Kimberly-Clark in 1995, we undertook to indemnify and hold Kimberly-Clark harmless from claims and liabilities related to the businesses transferred to us that were not identified as excluded liabilities in the related agreements. As of
December 31, 2017
, there are no material claims pending under this indemnification.
Item 4.
Mine Safety Disclosures
Not applicable.
30
Item 5.
Market for Registrant's Common Equity, Related Stockholder Matters and Issuer Purchases of Equity Securities
Market Information
. Since November 30, 1995, our common stock, $0.10 par value per share ("Common Stock") has been listed on the New York Stock Exchange, trading under the symbol "SWM". On February 28, 2018, our stock closed at $39.21 per share.
The table below presents the high and low sales prices of our Common Stock on the New York Stock Exchange - Composite Transactions reporting system for the periods indicated.
|
High
|
Low
|
||||||
|
2018
|
|||||||
|
First Quarter (through February 28, 2018)
|
$
|
48.01
|
|
$
|
39.10
|
|
|
|
2017
|
|||||||
|
Fourth Quarter
|
$
|
46.34
|
|
$
|
40.94
|
|
|
|
Third Quarter
|
41.67
|
|
36.29
|
|
|||
|
Second Quarter
|
44.75
|
|
36.36
|
|
|||
|
First Quarter
|
47.01
|
|
39.92
|
|
|||
|
2016
|
|||||||
|
Fourth Quarter
|
$
|
47.00
|
|
$
|
35.31
|
|
|
|
Third Quarter
|
40.79
|
|
34.46
|
|
|||
|
Second Quarter
|
36.19
|
|
30.21
|
|
|||
|
First Quarter
|
42.16
|
|
29.02
|
|
|||
31
Performance Graph.
The following graph compares the total cumulative stockholder return on our Common Stock during the period from December 31, 2012 through December 31, 2017, with the comparable cumulative total returns of the Russell 2000 Index, the S&P SmallCap 600 Capped Materials Index, the S&P 500 Index and a self-constructed peer group which reflects, but is not exactly comparable to, the Dow Jones Paper Products Index, which we expect reflected the performance of one of the primary industries in which we operate. We have selected Neenah Paper Inc., and P.H. Glatfelter Co. as our peer group. As part of the culmination of the Company's diversification beyond papers into advanced materials, the Company has added the Russell 2000 Index and the S&P SmallCap 600 Capped Materials Index, both of which we consider to be more reflective of the performance of the industries in which we operate.
The graph assumes that the value of the investments in the Common Stock and each index were $100 on December 31, 2012 and that all dividends were reinvested. The returns of the companies in the peer group have been weighted according to their market capitalization. The stock price performance shown on the graph below is not necessarily indicative of future price performance.
Comparison of Cumulative Five Year Return
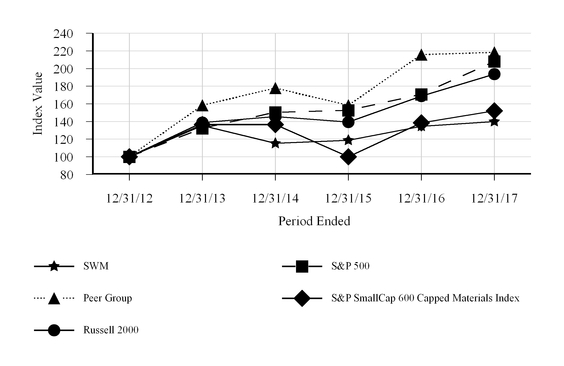
Holders.
As of March 1, 2018, there were 1,752 stockholders of record.
Dividends.
We have declared and paid cash dividends on our Common Stock every fiscal quarter since the second quarter of 1996. In
2017
,
2016
and
2015
, we declared and paid cash dividends totaling $1.69 per share, $1.62 per share and $1.54 per share, respectively. On
February 21, 2018
, we announced a cash dividend of $0.43 per share payable on
March 23, 2018
to stockholders of record as of the close of business on
March 2, 2018
. Our Credit Agreement covenants require that we maintain certain financial ratios, as disclosed in Note
13
. Debt, of the Notes to Consolidated Financial Statements, none of which under normal business conditions materially limit our ability to pay such dividends. We will continue to assess our dividend policy in light of our overall strategy, cash generation, debt levels and ongoing requirements for cash to fund operations and to pursue possible strategic opportunities.
Recent Sales of Unregistered Securities.
We had no unregistered sales of equity securities during the fiscal year ended
December 31, 2017
.
32
Repurchases of Equity Securities.
The following table indicates the cost of and number of shares of our Common Stock we have repurchased during
2017
and the remaining amount of share repurchases currently authorized by our Board of Directors as of
December 31, 2017
:
|
Issuer Purchases of Equity Securities
|
||||||||||||||||||
|
Period
|
Total
Number of
Shares
Purchased
|
Average
Price
Paid per
Share
|
Total Number of Shares
Purchased as Part of
Publicly Announced
Programs
|
Approximate Dollar Value of Shares that May Yet be Purchased Under the Programs
|
||||||||||||||
|
|
|
|
(# shares)
|
($ in millions)
|
($ in millions)
|
|||||||||||||
|
January 1-March 31, 2017
|
24,200
|
|
$
|
41.93
|
|
—
|
|
$
|
—
|
|
$
|
—
|
|
|||||
|
April 1-June 30, 2017
|
387
|
|
37.89
|
|
—
|
|
—
|
|
—
|
|
||||||||
|
July 1-September 30, 2017
|
589
|
|
37.88
|
|
—
|
|
—
|
|
—
|
|
||||||||
|
October 1-October 31, 2017
|
73
|
|
41.71
|
|
—
|
|
—
|
|
—
|
|
||||||||
|
November 1-November30, 2017
|
84
|
|
43.70
|
|
—
|
|
—
|
|
—
|
|
||||||||
|
December 1-December 31, 2017
|
527
|
|
44.32
|
|
—
|
|
—
|
|
—
|
|
||||||||
|
Total 2017
|
25,860
|
|
$
|
41.83
|
|
—
|
|
$
|
—
|
|
$
|
—
|
|
|||||
We sometimes use corporate 10b5-1 plans to allow for share repurchases to be made at predetermined stock price levels, without restricting such repurchases to specific windows of time. Any future common stock repurchases will be dependent upon various factors, including the stock price of our Common Stock, strategic opportunities, strategic outlook and cash availability. From time-to-time, certain of our officers and directors may sell shares pursuant to personal 10b5-1 plans.
33
Item 6.
Selected Financial Data
The following selected financial data should be read in conjunction with Part II, Item 7, "Management's Discussion and Analysis of Financial Condition and Results of Operations," and the consolidated financial statements and related notes within this Annual Report on Form 10-K. The results of our San Pedro, Philippines and Medan, Indonesia plants have been retrospectively presented as discontinued operations for all periods, both of which were sold in 2013. The results for 2017, 2015 and 2013 include results of operations of Conwed, Argotec and DelStar from the date of their acquisitions of January 20, 2017, October 28, 2015 and December 12, 2013, respectively. All dollar amounts are in millions except per share amounts, statistical data and ratios.
|
For the Years Ended December 31,
|
|||||||||||||||||||
|
2017
|
2016
|
2015
|
2014
|
2013
|
|||||||||||||||
|
Results of Operations
|
|||||||||||||||||||
|
Net sales
|
$
|
982.1
|
|
$
|
839.9
|
|
$
|
764.1
|
|
$
|
794.3
|
|
$
|
772.8
|
|
||||
|
Cost of products sold
|
699.8
|
|
583.2
|
|
539.7
|
|
575.5
|
|
520.1
|
|
|||||||||
|
Gross profit
|
282.3
|
|
256.7
|
|
224.4
|
|
218.8
|
|
252.7
|
|
|||||||||
|
Nonmanufacturing expenses
|
149.5
|
|
125.0
|
|
106.8
|
|
99.6
|
|
86.5
|
|
|||||||||
|
Restructuring & impairment expense
|
8.1
|
|
25.6
|
|
14.6
|
|
13.1
|
|
41.3
|
|
|||||||||
|
Operating profit
|
124.7
|
|
106.1
|
|
103.0
|
|
106.1
|
|
124.9
|
|
|||||||||
|
Income from continuing operations
|
34.4
|
|
82.8
|
|
90.5
|
|
89.7
|
|
78.5
|
|
|||||||||
|
Income (loss) from discontinued operations
|
0.1
|
|
—
|
|
(0.8
|
)
|
—
|
|
(2.4
|
)
|
|||||||||
|
Net income
|
$
|
34.5
|
|
$
|
82.8
|
|
$
|
89.7
|
|
$
|
89.7
|
|
$
|
76.1
|
|
||||
|
Net income (loss) per share - basic:
|
|||||||||||||||||||
|
Income from continuing operations
|
$
|
1.12
|
|
$
|
2.71
|
|
$
|
2.97
|
|
$
|
2.94
|
|
$
|
2.51
|
|
||||
|
(Loss) income from discontinued operations
|
—
|
|
—
|
|
(0.02
|
)
|
—
|
|
(0.08
|
)
|
|||||||||
|
Net income per share - basic
|
$
|
1.12
|
|
$
|
2.71
|
|
$
|
2.95
|
|
$
|
2.94
|
|
$
|
2.43
|
|
||||
|
Net income (loss) per share - diluted:
|
|||||||||||||||||||
|
Income from continuing operations
|
$
|
1.12
|
|
$
|
2.70
|
|
$
|
2.96
|
|
$
|
2.93
|
|
$
|
2.49
|
|
||||
|
(Loss) income from discontinued operations
|
—
|
|
—
|
|
(0.02
|
)
|
—
|
|
(0.07
|
)
|
|||||||||
|
Net income per share - diluted
|
$
|
1.12
|
|
$
|
2.70
|
|
$
|
2.94
|
|
$
|
2.93
|
|
$
|
2.42
|
|
||||
|
Cash dividends declared and paid per share
|
$
|
1.69
|
|
$
|
1.62
|
|
$
|
1.54
|
|
$
|
1.46
|
|
$
|
1.26
|
|
||||
|
EBITDA from continuing operations
(1)
|
$
|
192.4
|
|
$
|
157.6
|
|
$
|
162.8
|
|
$
|
162.5
|
|
$
|
171.7
|
|
||||
|
Adjusted EBITDA from continuing operations
(1)
|
$
|
200.5
|
|
$
|
183.2
|
|
$
|
177.4
|
|
$
|
177.7
|
|
$
|
213.0
|
|
||||
|
Percent of Net Sales
|
|||||||||||||||||||
|
Gross profit
|
28.7
|
%
|
30.6
|
%
|
29.4
|
%
|
27.5
|
%
|
32.7
|
%
|
|||||||||
|
Nonmanufacturing expenses
|
15.2
|
%
|
14.9
|
%
|
14.0
|
%
|
12.5
|
%
|
11.2
|
%
|
|||||||||
|
Financial Position
|
|||||||||||||||||||
|
Capital spending
|
$
|
37.2
|
|
$
|
27.8
|
|
$
|
24.2
|
|
$
|
35.1
|
|
$
|
29.1
|
|
||||
|
Depreciation and amortization
|
59.5
|
|
44.5
|
|
41.0
|
|
45.1
|
|
37.3
|
|
|||||||||
|
Total assets
|
1,542.5
|
|
1,173.7
|
|
1,290.0
|
|
1,185.0
|
|
1,224.1
|
|
|||||||||
|
Total debt
|
684.2
|
|
440.4
|
|
571.5
|
|
437.9
|
|
382.7
|
|
|||||||||
|
Total debt to capital ratio
|
55.6
|
%
|
46.4
|
%
|
55.0
|
%
|
47.2
|
%
|
43.7
|
%
|
|||||||||
|
(1)
|
Earnings before interest, taxes, depreciation and amortization ("EBITDA") from Continuing Operations is a non-GAAP financial measure that is calculated by adding interest expense, income tax provision and
|
34
depreciation and amortization expense to income from continuing operations. Adjusted EBITDA from Continuing Operations is a non-GAAP financial measure that is calculated by adding restructuring and impairment expense and start-up expenses from our CTS joint venture in China to EBITDA from continuing operations. We caution investors that amounts presented in accordance with our definitions of EBITDA from Continuing Operations and Adjusted EBITDA from Continuing Operations may not be comparable to similar measures disclosed by our competitors, because not all companies and analysts calculate EBITDA from Continuing Operations and Adjusted EBITDA from Continuing Operations in the same manner. We present EBITDA from Continuing Operations and Adjusted EBITDA from Continuing Operations because we consider them to be important supplemental measures of our performance and believe they are frequently used by securities analysts, investors and other interested parties in the evaluation of companies in our industry. Reconciliations to income from continuing operations are as follows ($ in millions):
|
For the Years Ended December 31,
|
|||||||||||||||||||
|
2017
|
2016
|
2015
|
2014
|
2013
|
|||||||||||||||
|
Income from continuing operations
|
$
|
34.4
|
|
$
|
82.8
|
|
$
|
90.5
|
|
$
|
89.7
|
|
$
|
78.5
|
|
||||
|
Plus: Interest expense
|
26.9
|
|
16.6
|
|
9.7
|
|
7.2
|
|
2.9
|
|
|||||||||
|
Plus: Income tax provision
|
69.6
|
|
15.4
|
|
21.6
|
|
20.5
|
|
53.0
|
|
|||||||||
|
Plus: Depreciation and amortization
|
61.5
|
|
42.8
|
|
41.0
|
|
45.1
|
|
37.3
|
|
|||||||||
|
EBITDA from continuing operations
|
192.4
|
|
157.6
|
|
162.8
|
|
162.5
|
|
171.7
|
|
|||||||||
|
Plus: Restructuring and impairment expense
|
8.1
|
|
25.6
|
|
14.6
|
|
13.1
|
|
41.3
|
|
|||||||||
|
Plus: CTS start-up expenses
|
—
|
|
—
|
|
—
|
|
2.1
|
|
—
|
|
|||||||||
|
Adjusted EBITDA from continuing operations
|
$
|
200.5
|
|
$
|
183.2
|
|
$
|
177.4
|
|
$
|
177.7
|
|
$
|
213.0
|
|
||||
35
Item 7.
Management's Discussion and Analysis of Financial Condition and Results of Operations
The following is a discussion of our financial condition and results of operations. This discussion should be read in conjunction with our consolidated financial statements and related notes included elsewhere in this Annual Report on Form 10-K and the selected financial data included in Part II, Item 6, "Selected Financial Data" of this Annual Report on Form 10-K. The discussion of our financial condition and results of operations includes various forward-looking statements about our markets, the demand for our products and our future prospects. These statements are based on certain assumptions that we consider reasonable. For information about risks and exposures relating to us and our business, you should read the sections entitled "Factors That May Affect Future Results," in Part I, Item 1A of this Annual Report on Form 10-K and "Forward Looking Statements" at the end of this Item 7. Unless the context indicates otherwise, references to "SWM", the "Company", "we", "us", "our", or similar terms include Schweitzer-Mauduit International, Inc. and our consolidated subsidiaries.
This Management's Discussion and Analysis of Financial Condition and Results of Operations is designed to provide a reader of our financial statements with an understanding of our recent performance, our financial condition and our prospects. The following will be discussed and analyzed:
|
•
|
Summary
|
|
•
|
Recent Developments
|
|
•
|
Critical Accounting Policies and Estimates
|
|
•
|
Recent Accounting Pronouncements
|
|
•
|
Results of Operations
|
|
•
|
Liquidity and Capital Resources
|
|
•
|
Other Factors Affecting Liquidity and Capital Resources
|
|
•
|
Contractual Obligations
|
|
•
|
Outlook
|
|
•
|
Forward-Looking Statements
|
Summary
In
2017
, SWM reported net income of
$34.5 million
on total net sales of
$982.1 million
. Compared to the prior year, net sales increased
$142.2 million
due primarily to incremental net sales generated from the operations of our newly acquired Conwed business, an increase in organic AMS sales and favorable net foreign currency impacts. These factors were partially offset by lower sales of traditional RTL products in the EP segment.
Net income decreased to
$34.5 million
in
2017
compared to
$82.8 million
in
2016
resulting primarily from the unfavorable impact of lower sales and associated gross profits in our EP segment, higher intangible asset amortization in our AMS segment and higher interest expense as a result of the Conwed acquisition, and a higher income tax provision primarily related to the enactment of the Tax Cuts and Jobs Act (the "Tax Act") on December 22, 2017. These factors were partially offset by the incremental operating profits from the Conwed acquisition and the benefit of higher organic sales and associated gross profits in our AMS segment.
Cash provided by operations was
$131.0 million
in
2017
compared to
$129.7 million
in
2016
. Uses of cash during
2017
included $291.7 million for the acquisition of Conwed,
$51.9 million
in cash dividends paid to SWM stockholders and
$37.2 million
of capital spending.
Recent Developments
On January 20, 2017, the Company completed the acquisition of Conwed Plastics LLC. The purchase price was $295 million in cash plus three potential earn-out payments not to exceed $40 million in the aggregate, which payments are contingent upon the achievement of certain financial metrics in each of 2019, 2020 and 2021. Conwed is a leading producer of resin-based netting solutions with proprietary manufacturing processes and innovative technologies and production facilities in the U.S. and Belgium. Conwed has been incorporated into our AMS segment and is expected to generate significant synergies with our existing AMS operations.
36
On November 1, 2017, we announced an increase of our quarterly dividend to $0.43 per share.
Critical Accounting Policies and Estimates
We disclose those accounting policies that we consider to be significant in determining the amounts to be utilized for communicating our consolidated financial position, results of operations and cash flows in the first note to our consolidated financial statements included elsewhere herein. Our discussion and analysis of our financial condition and results of operations are based on our consolidated financial statements. Our consolidated financial statements are prepared in conformity with accounting principles generally accepted in the U.S., which require management to make estimates that affect the amounts of revenues, expenses, assets and liabilities reported and disclosure of contingencies. Changes in these estimates could have a significant impact on our financial position, results of operations, and cash flows. We discussed with the Audit Committee of the Board of Directors the estimates and judgments made for each of the following items and our accounting for and presentation of these items in the accompanying financial statements:
Accounting for Income Taxes
Our income tax expense, deferred tax assets and liabilities, and liabilities for unrecognized tax benefits reflect management’s best estimate of current and future taxes to be paid. We are subject to income taxes in the U.S. and numerous foreign jurisdictions. Significant judgments and estimates are required in the determination of the consolidated income tax expense.
Deferred income taxes arise from temporary differences between the tax basis of assets and liabilities and their reported amounts in the financial statements, which will result in taxable or deductible amounts in the future. In evaluating our ability to recover our deferred tax assets in the jurisdiction from which they arise, we consider all available positive and negative evidence, including scheduled reversals of deferred tax liabilities, projected future taxable income, tax-planning strategies, and results of recent operations. In projecting future taxable income, we begin with historical results adjusted for the results of discontinued operations and incorporate assumptions about the amount of future state, federal, and foreign pretax operating income adjusted for items that do not have tax consequences. The assumptions about future taxable income require the use of significant judgment and are consistent with the plans and estimates we are using to manage the underlying businesses. In evaluating the objective evidence that historical results provide, we consider three years of cumulative operating income (loss).
The calculation of our tax liabilities involves dealing with uncertainties in the application of complex tax laws and regulations in a multitude of jurisdictions across our global operations. Accounting Standards Codification Topic No. 740,
Income Taxes
("ASC 740"), states that a tax benefit from an uncertain tax position may be recognized when it is more likely than not that the position will be sustained upon examination, including resolutions of any related appeals or litigation processes, on the basis of the technical merits. We (1) record unrecognized tax benefits as liabilities in accordance with ASC 740 and (2) adjust these liabilities when our judgment changes as a result of the evaluation of new information not previously available. Because of the complexity of some of these uncertainties, the ultimate resolution may result in a payment that is materially different from our current estimate of the unrecognized tax benefit liabilities. These differences will be reflected as increases or decreases to income tax expense in the period in which new information is available.
On December 22, 2017, the Tax Act was enacted into law and the new legislation contains several key tax provisions that affected us, which include, but are not limited to, a one-time mandatory transition tax on accumulated foreign earnings and a reduction of the corporate income tax rate from 35% to 21% effective January 1, 2018. We are required to recognize the effect of the tax law changes in the period of enactment, such as determining the transition tax, remeasuring our U.S. deferred tax assets and liabilities as well as reassessing the net realizability of our deferred tax assets and liabilities. In December 2017, the SEC staff issued Staff Accounting Bulletin No. 118,
Income Tax Accounting Implications of the Tax Cuts and Jobs Act
(“SAB 118”), which allows us to record provisional amounts during a measurement period not to extend beyond one year of the enactment date. Since the Tax Act was passed late in the fourth quarter of 2017, and ongoing guidance and accounting interpretation are expected over the next 12 months, we consider the accounting of the transition tax, deferred tax re-measurements, and other items to be incomplete due to
37
the forthcoming guidance and our ongoing analysis of final year-end data and tax positions. We expect to complete our analysis within the measurement period in accordance with SAB 118.
Revenue Recognition
The Company recognizes revenue and the related accounts receivable when the following four criteria are met: (1) persuasive evidence of an arrangement exists; (2) ownership has transferred to the customer; (3) the selling price is fixed or determinable; and (4) collection is reasonably assured based on the Company's judgment regarding the collectability of its accounts receivable. Generally, the Company recognizes revenue when it ships its manufactured product and title and risk of loss passes to its customer in accordance with the terms of sale of the product. Revenue is recorded at the time of shipment for terms designated free on board, shipping point, or equivalent. For sales transactions designated free on board, destination, or equivalent, revenue is recorded when the product is delivered to the customer's delivery site, at which time title and risk of loss are transferred. Provisions for discounts, returns, allowances, customer rebates and other adjustments are provided for in the same period the related revenue is recorded. Deferred revenue represents advance payments from customers which are earned based upon a mutually agreed-upon amount per unit of future product sales.
Accounting for Contingencies
We accrue an estimated loss by taking a charge to income when the likelihood that a future event, such as a legal proceeding, will result in a loss or the incurrence of a liability is probable and the amount of loss can be reasonably estimated. We disclose material contingencies if there is at least a reasonable possibility that a loss has been incurred. In determining whether a loss should be accrued, we evaluate, among other factors, the degree of probability of an unfavorable outcome and the ability to make a reasonable estimate of the amount of loss. Changes in these factors could materially impact our financial condition, results of operations, and our cash flows.
For further information, please see "Litigation" in Part I, Item 3, "Legal Proceedings" and Note
19
. Commitments and Contingencies, of the Notes to Consolidated Financial Statements.
Property, Plant and Equipment Valuation
Our manufacturing processes are capital intensive; as a result, we make substantial investments in property, plant and equipment which are recorded at cost. Net property, plant and equipment comprised
23%
of our total assets as of
December 31, 2017
. Property, plant and equipment is depreciated on the straight-line method over the estimated useful lives of the assets. Production machines and related equipment are not subject to substantial technological changes rendering them obsolete and are generally depreciated over estimated useful lives of 10 to 20 years. When indications of impairment exist, we assess the likelihood of recovering the cost of long-lived assets based on our expectation of future profitability and undiscounted cash flow of the related asset group. These factors, along with management's plans with respect to the operations, are considered in assessing the recoverability of property, plant and equipment. Changes in management's estimates and plans could significantly impact our financial condition, results of operations and cash flows.
As a result of excess capacity in the tobacco-related papers industry and increased purchased material and operating costs experienced in the last several years, competitive selling prices for certain of our products are not sufficient to cover our costs with a reasonable margin. Such competitive pressures have resulted in downtime of certain paper machines and, in some cases, accelerated depreciation or impairment of certain equipment. We have also incurred restructuring costs in our AMS segment in pursuit of synergies from integrating our acquisitions. Over the past six years, we have restructured our operations to improve our competitiveness and profitability. As a result, we incurred significant charges related to asset impairments, accelerated depreciation and employee severances.
In 2011, the Company revised its Asian RTL expansion plans and suspended the construction of the Philippine greenfield site. Due to this change, the carrying value of partially constructed assets was evaluated for impairment at each reporting period by assessing the recoverability of the costs based on the undiscounted cash flows of the operation, likelihood of its reactivation and alternative uses for the equipment, and, as a result of this analysis, the Company recorded an
38
impairment loss of $3.1 million during 2012. Based on an evaluation of the fair value at December 31, 2013, which used independent appraisals of certain assets, the Company recorded a
$37.2 million
impairment charge during 2013. There were no additional impairment charges recorded during 2014.
In 2015, the Company made the decision to dispose of the facility and related equipment. Based on an updated estimate of the fair value of the equipment in 2015, the Company recorded an additional impairment charge of $5.2 million. During 2015, the net book value of the RTL Philippines property, plant and equipment was reclassified as Assets held for sale in the Company's Consolidated Balance Sheets. The Company reviews these assets at each reporting period and would recognize an impairment charge for the excess of carrying value of the assets over the fair value less any costs to sell. The Company did not record any additional impairment charges during 2016. During 2017, the Company recognized additional impairment charges of $4.0 million related to the RTL Philippines assets. The net book value of the RTL Philippines property, plant and equipment was
$12.8 million
as of
December 31, 2017
.
Management continues to evaluate how to operate our production facilities more effectively. Further restructuring actions are possible that might require additional write-offs or accelerated depreciation of some equipment.
Business Combinations
Accounting for business combinations requires us to recognize, separately from goodwill, the assets acquired and the liabilities assumed ("net assets") at their acquisition date fair values. Goodwill is measured as the excess of consideration transferred over the net assets acquired at their respective fair values as of the acquisition date. The estimated fair values are based upon quoted market prices and widely accepted valuation techniques, which require significant estimates and assumptions including, but not limited to, estimating future cash flows and developing appropriate discount rates. While we use our best estimates and assumptions to accurately value assets acquired and liabilities assumed at the acquisition date, our estimates are inherently uncertain and subject to refinement. As a result, during the measurement period, which may be up to one year from the acquisition date, we may record adjustments to the assets acquired and liabilities assumed with the corresponding adjustment to goodwill, based on new information obtained about the facts and circumstances that existed as of the acquisition date. Upon the conclusion of the measurement period or final determination of the values of net assets acquired, whichever comes first, any subsequent adjustments are recorded to our consolidated financial statements. See Note
3
. Business Acquisitions, of the Notes to Consolidated Financial Statements for additional information.
Goodwill
Goodwill is not subject to amortization and is tested for impairment annually, or more frequently if events or changes in circumstances indicate that the asset may be impaired. Goodwill is measured as the excess of consideration transferred over the net assets acquired at their respective fair values as of the acquisition date. Goodwill is tested for impairment at the reporting unit level. Fair value of a reporting unit is typically based upon estimated future cash flows discounted at a rate commensurate with the risk involved or market-based comparables. If the carrying amount of the reporting unit’s net assets exceeds its fair value, then an analysis will be performed to compare the implied fair value of goodwill with the carrying amount of goodwill. An impairment loss will be recognized in an amount equal to the excess of the carrying amount over its implied fair value. After an impairment loss is recognized, the adjusted carrying amount of goodwill is its new accounting basis. The annual impairment tests performed on October 1,
2017
and
2016
did not indicate any impairment of goodwill.
Recent Accounting Pronouncements
For a discussion regarding recent accounting pronouncements, see "Recent Accounting Pronouncements" included in Note
2
. Summary of Significant Accounting Policies, of the Notes to Consolidated Financial Statements.
39
Results of Operations
|
For the Years Ended December 31,
|
|||||||||||
|
2017
(1)
|
2016
|
2015
(2)
|
|||||||||
|
($ in millions, except per share amounts)
|
|||||||||||
|
Net sales
|
$
|
982.1
|
|
$
|
839.9
|
|
$
|
764.1
|
|
||
|
Cost of products sold
|
699.8
|
|
583.2
|
|
539.7
|
|
|||||
|
Gross profit
|
282.3
|
|
256.7
|
|
224.4
|
|
|||||
|
Selling expense
|
33.3
|
|
25.3
|
|
22.2
|
|
|||||
|
Research expense
|
17.8
|
|
17.5
|
|
14.0
|
|
|||||
|
General expense
|
98.4
|
|
82.2
|
|
70.6
|
|
|||||
|
Total nonmanufacturing expenses
|
149.5
|
|
125.0
|
|
106.8
|
|
|||||
|
Restructuring and impairment expense
|
8.1
|
|
25.6
|
|
14.6
|
|
|||||
|
Operating profit
|
124.7
|
|
106.1
|
|
103.0
|
|
|||||
|
Interest expense
|
26.9
|
|
16.6
|
|
9.7
|
|
|||||
|
Other income, net
|
3.7
|
|
3.9
|
|
12.2
|
|
|||||
|
Income from continuing operations before income taxes and income from equity affiliates
|
101.5
|
|
93.4
|
|
105.5
|
|
|||||
|
Provision for income taxes
|
69.6
|
|
15.4
|
|
21.6
|
|
|||||
|
Income from equity affiliates, net of income taxes
|
2.5
|
|
4.8
|
|
6.6
|
|
|||||
|
Income from continuing operations
|
34.4
|
|
82.8
|
|
90.5
|
|
|||||
|
Income (loss) from discontinued operations
|
0.1
|
|
—
|
|
(0.8
|
)
|
|||||
|
Net income
|
$
|
34.5
|
|
$
|
82.8
|
|
$
|
89.7
|
|
||
|
Net income (loss) per share - basic:
|
|||||||||||
|
Income per share from continuing operations
|
$
|
1.12
|
|
$
|
2.71
|
|
$
|
2.97
|
|
||
|
(Loss) income per share from discontinued operations
|
—
|
|
—
|
|
(0.02
|
)
|
|||||
|
Net income per share - basic
|
$
|
1.12
|
|
$
|
2.71
|
|
$
|
2.95
|
|
||
|
Net income (loss) per share - diluted:
|
|||||||||||
|
Income per share from continuing operations
|
$
|
1.12
|
|
$
|
2.70
|
|
$
|
2.96
|
|
||
|
(Loss) income per share from discontinued operations
|
—
|
|
—
|
|
(0.02
|
)
|
|||||
|
Net income per share - diluted
|
$
|
1.12
|
|
$
|
2.70
|
|
$
|
2.94
|
|
||
(1)
Results during the year ended December 31, 2017 include Conwed from the January 20, 2017 acquisition date to December 31, 2017.
(2)
Results during the year ended December 31, 2015 include Argotec from the October 28, 2015 acquisition date to December 31, 2015.
40
Year Ended
December 31, 2017
Compared with the
Year Ended
December 31, 2016
Net Sales
(dollars in millions)
|
2017
|
2016
|
Change
|
Percent Change
|
|||||||||||
|
Advanced Materials & Structures
|
$
|
433.2
|
|
$
|
280.6
|
|
$
|
152.6
|
|
54.4
|
%
|
|||
|
Engineered Papers
|
548.9
|
|
559.3
|
|
(10.4
|
)
|
(1.9
|
)
|
||||||
|
Total
|
$
|
982.1
|
|
$
|
839.9
|
|
$
|
142.2
|
|
16.9
|
%
|
|||
Net sales were
$982.1 million
in
2017
compared with
$839.9 million
in
2016
. The
increase
in net sales consisted of the following (dollars in millions):
|
Amount
|
Percent
|
|||||
|
Incremental AMS segment revenue from acquisitions
|
$
|
141.3
|
|
16.8
|
%
|
|
|
Changes in currency exchange rates
|
8.6
|
|
1.0
|
|
||
|
Changes in royalties
|
(4.6
|
)
|
(0.5
|
)
|
||
|
Changes in product mix, selling prices and sales volumes
|
(3.1
|
)
|
(0.4
|
)
|
||
|
Total
|
$
|
142.2
|
|
16.9
|
%
|
|
AMS segment net sales were
$433.2 million
for
2017
compared to
$280.6 million
during
2016
. The increase of
$152.6 million
or
54.4%
was due primarily to $141.3 million in incremental net sales generated by the operations of our Conwed business and an increase in organic sales of $11.4 million, led by strong growth in transportation, mainly from surface protection films, as well as gains in industrial and medical sales; this growth was partially offset by softness in filtration sales.
The EP segment net sales during the year ended
December 31, 2017
of
$548.9 million
decreased by
$10.4 million
, or
1.9%
, versus net sales of
$559.3 million
in the prior year. The decrease in net sales was primarily the result of the $14.5 million net combined unfavorable impact of changes in volumes, mix of products sold and average selling prices, and $4.6 million of lower royalty income, partially offset by favorable net foreign currency impacts of $8.7 million, mainly from a stronger euro, in each case compared to the prior year.
Gross Profit
(dollars in millions)
|
|
|
Percent Change
|
Percent of Net Sales
|
|||||||||||||||||
|
2017
|
2016
|
Change
|
2017
|
2016
|
||||||||||||||||
|
Net sales
|
$
|
982.1
|
|
$
|
839.9
|
|
$
|
142.2
|
|
16.9
|
%
|
100.0
|
%
|
100.0
|
%
|
|||||
|
Cost of products sold
|
699.8
|
|
583.2
|
|
116.6
|
|
20.0
|
|
71.3
|
|
69.4
|
|
||||||||
|
Gross profit
|
$
|
282.3
|
|
$
|
256.7
|
|
$
|
25.6
|
|
10.0
|
%
|
28.7
|
%
|
30.6
|
%
|
|||||
Gross profit for the year ended
December 31, 2017
increased by
$25.6 million
, or
10.0%
, to
$282.3 million
from
$256.7 million
in the prior year. AMS gross profit increased by $46.8 million, primarily due to the incremental gross profit associated with the operations of our newly acquired Conwed business, along with organic sales growth and a favorable mix of products sold, partially offset by certain manufacturing inefficiencies and higher input costs. In the EP segment, gross profit decreased by $21.2 million, primarily due to the unfavorable impact of lower sales combined with the lower sales volume's associated impact on manufacturing efficiencies and overhead absorption compared to the prior-year period.
41
Nonmanufacturing Expenses
(dollars in millions)
|
|
|
Percent Change
|
Percent of Net Sales
|
|||||||||||||||||
|
2017
|
2016
|
Change
|
2017
|
2016
|
||||||||||||||||
|
Selling expense
|
$
|
33.3
|
|
$
|
25.3
|
|
$
|
8.0
|
|
31.6
|
%
|
3.4
|
%
|
3.0
|
%
|
|||||
|
Research expense
|
17.8
|
|
17.5
|
|
0.3
|
|
1.7
|
|
1.8
|
|
2.1
|
|
||||||||
|
General expense
|
98.4
|
|
82.2
|
|
16.2
|
|
19.7
|
|
10.0
|
|
9.8
|
|
||||||||
|
Nonmanufacturing expenses
|
$
|
149.5
|
|
$
|
125.0
|
|
$
|
24.5
|
|
19.6
|
%
|
15.2
|
%
|
14.9
|
%
|
|||||
Nonmanufacturing expenses in the year ended
December 31, 2017
increased by
$24.5 million
, or
19.6%
, to
$149.5 million
from
$125.0 million
in the prior year due primarily to incremental costs from the operations of our newly acquired Conwed business.
Restructuring and Impairment Expense
(dollars in millions)
|
|
|
Percent Change
|
Percent of Net Sales
|
|||||||||||||||||
|
2017
|
2016
|
Change
|
2017
|
2016
|
||||||||||||||||
|
Advanced Materials & Structures
|
$
|
2.7
|
|
$
|
21.3
|
|
$
|
(18.6
|
)
|
(87.3
|
)%
|
0.6
|
%
|
7.6
|
%
|
|||||
|
Engineered Papers
|
5.3
|
|
4.0
|
|
1.3
|
|
32.5
|
|
1.0
|
|
0.7
|
|
||||||||
|
Unallocated expenses
|
0.1
|
|
0.3
|
|
(0.2
|
)
|
(66.7
|
)
|
||||||||||||
|
Total
|
$
|
8.1
|
|
$
|
25.6
|
|
$
|
(17.5
|
)
|
(68.4
|
)%
|
0.8
|
%
|
3.0
|
%
|
|||||
The Company incurred total restructuring and impairment expense of
$8.1 million
in the year ended
December 31, 2017
, compared to
$25.6 million
in the year ended
December 31, 2016
, a decrease of
$17.5 million
or
68.4%
. In the year ended
December 31, 2017
, restructuring and impairment expenses consisted of $3.5 million related to severance expenses in the French, Belgian and U.S. operations for ongoing accruals over the remaining service lives of affected employees related to previously announced actions as well as $4.0 million of impairment charges to certain of our RTL Philippines physical assets and $0.6 million in impairment charges for manufacturing equipment at our French and U.S. manufacturing facilities.
In the year ended
December 31, 2016
, restructuring and impairment expenses consisted of $4.3 million related to severance expenses in the French, Brazilian and U.S. operations for ongoing accruals over the remaining service lives of affected employees related to previously announced actions as well as $0.6 million of impairment charges to certain of our Polish manufacturing equipment. Additionally, in the fourth quarter of 2016, in line with the Company's rebranding strategy, it was determined that use of the DelStar trade name would be discontinued in 2017. As a result, a $20.7 million impairment charge was recognized to adjust the carrying value of the DelStar trade name intangible asset to its estimated fair value as of December 31, 2016 based on expected future cash flows to be realized from the use of the trade name. The remaining value of this intangible was amortized in the first six months of 2017.
42
Operating Profit
(dollars in millions)
|
Percent Change
|
Return on Net Sales
|
|||||||||||||||||||
|
2017
|
2016
|
Change
|
2017
|
2016
|
||||||||||||||||
|
Advanced Materials & Structures
|
$
|
48.5
|
|
$
|
9.0
|
|
$
|
39.5
|
|
N.M
|
|
11.2
|
%
|
3.2
|
%
|
|||||
|
Engineered Papers
|
116.1
|
|
138.0
|
|
(21.9
|
)
|
(15.9
|
)
|
21.2
|
|
24.7
|
|
||||||||
|
Unallocated expenses
|
(39.9
|
)
|
(40.9
|
)
|
1.0
|
|
2.4
|
|
|
|
||||||||||
|
Total
|
$
|
124.7
|
|
$
|
106.1
|
|
$
|
18.6
|
|
17.5
|
%
|
12.7
|
%
|
12.6
|
%
|
|||||
N.M. - Not Meaningful
Operating profit was
$124.7 million
in the year ended
December 31, 2017
compared with
$106.1 million
during the prior year.
The AMS segment's operating profit in the year ended
December 31, 2017
was
$48.5 million
compared to
$9.0 million
in the prior year period. The increase of
$39.5 million
in the AMS segment's operating profit during the year ended
December 31, 2017
compared to the prior-year period was positively impacted by $18.6 million in decreased restructuring and impairment expenses due primarily to the prior-year's tradename impairment and $19.5 million in incremental operating profit associated with our newly acquired Conwed business and organic net sales growth and associated gross profits.
The EP segment's operating profit in the year ended
December 31, 2017
was
$116.1 million
, a decrease of
$21.9 million
, or
15.9%
, from
$138.0 million
in the prior year. The decrease was primarily due to overall sales volume decline. Lower RTL and overall cigarette paper volumes were partially offset by growth of non-tobacco paper, and positive currency movements offset anticipated lower LIP royalties.
Unallocated expenses in the year ended
December 31, 2017
were
$39.9 million
, down
$1.0 million
, or
2.4%
, from the
$40.9 million
in the prior year period. The decrease was primarily due to lower professional fees.
Non-Operating Expenses, Net
Interest expense was
$26.9 million
in the year ended
December 31, 2017
, an increase of $10.3 million from
$16.6 million
in the year ended
December 31, 2016
. The increase in interest expense is primarily due to higher average debt balances outstanding compared to the prior year in connection with the Conwed acquisition as well as the effect of the higher effective interest rate applied to borrowings under the Amended Credit Agreement executed in January 2017 when compared to our previous credit agreement. The weighted average effective interest rate on our debt facilities was approximately 3.45% and 2.42% for the year ended
December 31, 2017
and
2016
, respectively.
Other income, net was
$3.7 million
during the year ended
December 31, 2017
compared to
$3.9 million
during the year ended
December 31, 2016
. The $0.2 million decrease in other income, net, was due primarily to higher net currency losses in the current year, partially offset by lower transactional taxes incurred in Brazil in the current year and lower losses incurred on the sale of assets at our Philippines site.
Income Taxes
A
$69.6 million
and
$15.4 million
provision for income taxes in the years ended
December 31, 2017
and
2016
, respectively, resulted in an effective tax rate of
68.6%
compared with
16.5%
in the prior year. The Company’s effective tax rates differ from the statutory federal income tax rate of 35% due to varying tax rates in foreign jurisdictions, the relative amounts of income we earn in those jurisdictions, and additional taxes due to earnings intended to be indefinitely reinvested outside the U.S. On December 22, 2017, the Tax Act was enacted into law and the new legislation contains several key tax provisions that affected the Company, which include, but are not limited to, a one-time mandatory
43
transition tax of $48.7 million on accumulated foreign earnings and a reduction of the corporate income tax rate from 35% to 21% effective January 1, 2018.
Income from Equity Affiliates
Income from equity affiliates, net of income taxes, was
$2.5 million
in the year ended
December 31, 2017
compared with
$4.8 million
during the prior year and reflected the results of operations of CTM and CTS. The decrease in earnings was driven primarily by lower sales volumes at CTS in 2017 compared to the prior-year period.
Discontinued Operations
Because we closed our Philippines plant as previously reported, the results of this plant were reported as discontinued operations for all periods presented. Consequently, this plant's results have been removed from each line of the statements of income and the operating activities section of the statements of cash flow. In each case, a separate line has been added for the net results of the discontinued operation.
Net Income and Income per Share
Net income in the year ended
December 31, 2017
was
$34.5 million
, or
$1.12
per diluted share, compared with
$82.8 million
, or
$2.70
per diluted share, during the prior year period. The decrease in net income was primarily due to the unfavorable impact of the new tax legislation, the unfavorable impact of lower sales and associated gross profits in our EP segment, higher intangible asset amortization in our AMS segment as a result of the Conwed acquisition and higher interest expense. These factors were partially offset by the incremental operating profits from the Conwed acquisition, the favorable impact of higher organic sales and associated gross profits in our AMS segment and lower restructuring and impairment charges in 2017.
44
Year Ended
December 31, 2016
Compared with the Year Ended
December 31, 2015
Net Sales
(dollars in millions)
|
2016
|
2015
|
Change
|
Percent Change
|
|||||||||||
|
Advanced Materials & Structures
|
$
|
280.6
|
|
$
|
180.2
|
|
$
|
100.4
|
|
55.7
|
%
|
|||
|
Engineered Papers
|
559.3
|
|
583.9
|
|
(24.6
|
)
|
(4.2
|
)
|
||||||
|
Total
|
$
|
839.9
|
|
$
|
764.1
|
|
$
|
75.8
|
|
9.9
|
%
|
|||
Net sales were
$839.9 million
in
2016
compared with
$764.1 million
in
2015
. The
increase
in net sales consisted of the following (dollars in millions):
|
|
Amount
|
Percent
|
||||
|
Incremental AMS segment revenue from acquisitions
|
$
|
106.5
|
|
13.9
|
%
|
|
|
Changes in currency exchange rates
|
0.3
|
|
0.1
|
|
||
|
Changes in royalties
|
(1.2
|
)
|
(0.2
|
)
|
||
|
Changes in product mix, selling prices and sales volumes
|
(29.8
|
)
|
(3.9
|
)
|
||
|
Total
|
$
|
75.8
|
|
9.9
|
%
|
|
AMS segment net sales were
$280.6 million
for
2016
compared to
$180.2 million
during
2015
. The increase of
$100.4 million
or
55.7%
was due primarily to $106.5 million in incremental net sales generated by the operations of our Argotec business, partially offset by $3.3 million of unfavorable net foreign currency impacts, mainly from a weaker British pound and Chinese yuan and a $2.8 million combined impact primarily from planned reductions of low margin industrial sales and a decline in sales of certain air filtration products which more than offset growth in other filtration end-markets.
The EP segment net sales during the year ended
December 31, 2016
of
$559.3 million
decreased by
$24.6 million
, or
4.2
%, versus
$583.9 million
in the prior year. The decrease in net sales was primarily the result of the $27.0 million net combined unfavorable impact of changes in volumes, mix of products sold and average selling prices, and $1.2 million of lower royalty income, partially offset by favorable net foreign currency impacts of $3.6 million, mainly from a stronger euro, in each case compared to the prior year.
Gross Profit
(dollars in millions)
|
|
|
Percent Change
|
Percent of Net Sales
|
|||||||||||||||||
|
|
2016
|
2015
|
Change
|
2016
|
2015
|
|||||||||||||||
|
Net sales
|
$
|
839.9
|
|
$
|
764.1
|
|
$
|
75.8
|
|
9.9
|
%
|
100.0
|
%
|
100.0
|
%
|
|||||
|
Cost of products sold
|
583.2
|
|
539.7
|
|
43.5
|
|
8.1
|
|
69.4
|
|
70.6
|
|
||||||||
|
Gross profit
|
$
|
256.7
|
|
$
|
224.4
|
|
$
|
32.3
|
|
14.4
|
%
|
30.6
|
%
|
29.4
|
%
|
|||||
Gross profit for the year ended
December 31, 2016
increased by
$32.3 million
, or
14.4%
to
$256.7 million
from
$224.4 million
in the prior year. The AMS segment benefited from $31.2 million in incremental gross profit associated with the operations of our newly acquired Argotec business, partially offset by $1.0 million in unfavorable net foreign currency impacts as well as a combined $3.7 million impact of a decline in net sales, primarily from planned reductions of low margin industrial sales and associated unfavorable fixed cost absorption along with a decline in sales of certain air filtration products which more than offset growth in other filtration end-markets. In the EP segment, the $0.5 million
45
net favorable combined impact of operational improvements, lower input costs and net combined changes in volumes, mix of products sold and average selling prices, along with $5.5 million in favorable net foreign currency impacts and $1.0 million in lower distribution costs were partially offset by the $1.2 million impact of lower royalty income.
Nonmanufacturing Expenses
(dollars in millions)
|
|
|
Percent Change
|
Percent of Net Sales
|
|||||||||||||||||
|
|
2016
|
2015
|
Change
|
2016
|
2015
|
|||||||||||||||
|
Selling expense
|
$
|
25.3
|
|
$
|
22.2
|
|
$
|
3.1
|
|
14.0
|
%
|
3.0
|
%
|
2.9
|
%
|
|||||
|
Research expense
|
17.5
|
|
14.0
|
|
3.5
|
|
25.0
|
|
2.1
|
|
1.8
|
|
||||||||
|
General expense
|
82.2
|
|
70.6
|
|
11.6
|
|
16.4
|
|
9.8
|
|
9.2
|
|
||||||||
|
Nonmanufacturing expenses
|
$
|
125.0
|
|
$
|
106.8
|
|
$
|
18.2
|
|
17.0
|
%
|
14.9
|
%
|
13.9
|
%
|
|||||
Nonmanufacturing expenses in the year ended
December 31, 2016
increased by
$18.2 million
, or
17.0%
, to
$125.0 million
from
$106.8 million
in the prior year due primarily to $13.5 million in higher incremental costs from the operations of our newly acquired Argotec business along with $3.1 million in higher research and development and selling expenditures, and $2.0 million in higher general and administrative expenses including the combined impact of modestly higher legal costs relating to intellectual property litigation and proceedings in Europe, professional services fees, higher intangible asset amortization expense and general increases in other expenses. These factors were partially offset by $0.4 million in favorable foreign currency impacts.
Restructuring and Impairment Expense
(dollars in millions)
|
|
|
Percent Change
|
Percent of Net Sales
|
|||||||||||||||||
|
2016
|
2015
|
Change
|
2016
|
2015
|
||||||||||||||||
|
Advanced Materials & Structures
|
$
|
21.3
|
|
$
|
(0.2
|
)
|
$
|
21.5
|
|
N.M.
|
|
7.6
|
%
|
(0.1
|
)%
|
|||||
|
Engineered Papers
|
4.0
|
|
14.4
|
|
(10.4
|
)
|
(72.2
|
)
|
0.7
|
|
2.5
|
|
||||||||
|
Unallocated expenses
|
0.3
|
|
0.4
|
|
(0.1
|
)
|
(25.0
|
)
|
||||||||||||
|
Total
|
$
|
25.6
|
|
$
|
14.6
|
|
$
|
11.0
|
|
75.3
|
%
|
3.0
|
%
|
1.9
|
%
|
|||||
N.M. - Not Meaningful
The Company incurred total restructuring and impairment expense of
$25.6 million
in the year ended
December 31, 2016
, compared to
$14.6 million
in the year ended
December 31, 2015
, an increase of
$11.0 million
or
75.3%
. In 2016, restructuring and impairment expenses consisted of $4.3 million related to severance expenses in the French, Brazilian and U.S. operations for ongoing accruals over the remaining service lives of affected employees related to previously announced actions as well as $0.6 million of impairment charges to certain of our Polish manufacturing equipment. Additionally, in the fourth quarter of 2016, in line with the Company's rebranding strategy, it was decided that the use of the DelStar trade name be discontinued in 2017. As a result, a $20.7 million impairment charge was recognized to adjust the carrying value of the DelStar trade name intangible asset to its estimated fair value as of December 31, 2016 based on expected future cash flows to be realized from the use of the name. The remaining value of this intangible was amortized over its remaining six month useful life, which was completed in the second quarter of 2017.
In the year ended
December 31, 2015
, the Company's restructuring and impairment expense of
$14.6 million
was due to $8.0 million related to severance expenses in the French, Brazilian and U.S. operations for ongoing accruals over the remaining service lives of affected employees related to previously announced actions as well as $1.4 million of impairment charges to certain of our Polish manufacturing equipment and $5.2 million of loss recognized to adjust the recorded value of equipment at our Philippines RTL location to its net realizable value.
46
Operating Profit
(dollars in millions)
|
|
Percent Change
|
Return on Net Sales
|
||||||||||||||||||
|
|
2016
|
2015
|
Change
|
2016
|
2015
|
|||||||||||||||
|
Advanced Materials & Structures
|
$
|
9.0
|
|
$
|
16.7
|
|
$
|
(7.7
|
)
|
(46.1
|
)%
|
3.2
|
%
|
9.3
|
%
|
|||||
|
Engineered Papers
|
138.0
|
|
121.5
|
|
16.5
|
|
13.6
|
|
24.7
|
|
20.8
|
|
||||||||
|
Unallocated expenses
|
(40.9
|
)
|
(35.2
|
)
|
(5.7
|
)
|
16.2
|
|
|
|
||||||||||
|
Total
|
$
|
106.1
|
|
$
|
103.0
|
|
$
|
3.1
|
|
3.0
|
%
|
12.6
|
%
|
13.5
|
%
|
|||||
Operating profit was
$106.1 million
in the year ended
December 31, 2016
compared with
$103.0 million
during the prior year.
The AMS segment's operating profit in the year ended
December 31, 2016
was
$9.0 million
compared to
$16.7 million
in the prior year period. The decrease of
$7.7 million
, or
46.1%
in the AMS segment's operating profit during the year ended
December 31, 2016
compared to the prior-year period was partially caused by $21.5 million in increased restructuring and impairment expenses and $1.0 million in unfavorable net foreign currency impacts, partially offset by $17.7 million in incremental operating profit associated with the operations of our newly acquired Argotec business and $0.8 million in lower nonmanufacturing expenses. The AMS segment was also impacted by other factors, including a combined $3.7 million impact of a decline in net sales, including planned reductions of low margin industrial sales and associated unfavorable fixed cost absorption along with a decline in sales of certain air filtration products which more than offset growth in other filtration end-markets.
The EP segment's operating profit in the year ended
December 31, 2016
was
$138.0 million
, an increase of
$16.5 million
, or
13.6%
, from
$121.5 million
in the prior year. The increase was primarily due to $5.7 million in favorable net foreign currency translation impacts and $10.4 million in lower restructuring and impairment expenses, along with the $0.5 million net combined impact of operational improvements, lower input costs and net combined changes in volumes, mix of products sold and average selling prices, and $1.0 million in lower distribution costs which were partially offset by the $1.2 million impact of lower royalty income.
Unallocated expenses in the year ended
December 31, 2016
were
$40.9 million
compared to
$35.2 million
in the prior year period. The increase of
$5.7 million
, or
16.2%
, in unallocated expenses during the year ended
December 31, 2016
compared to the prior year was primarily due to the combined impact of modestly higher legal costs relating to intellectual property litigation and proceedings in Europe, professional services fees and general increases in other expenses.
Non-Operating Expenses
Interest expense was
$16.6 million
in the year ended
December 31, 2016
, an increase of $6.9 million from
$9.7 million
in the year ended
December 31, 2015
. The increase in interest expense is primarily due to higher average debt balances outstanding compared to the prior year in connection with the Argotec acquisition as well as the effect of the higher effective interest rate applied to borrowings under the Amended Credit Agreement executed in October 2015 when compared to our previous credit agreement. The weighted average effective interest rate on our debt facilities was approximately 2.42% and 1.76% for the years ended
December 31, 2016
and
2015
, respectively.
Other income, net was
$3.9 million
during the year ended
December 31, 2016
compared to
$12.2 million
during the year ended
December 31, 2015
. The $8.3 million decrease in other income, net, was due primarily to $2.5 million lower gain recognized related to the sale of water rights at our Spotswood, New Jersey facility, $2.6 million in lower interest income from lower cash balances outstanding during 2016, $0.9 million in lower royalties and fees earned from our joint ventures in China, $0.9 million in lower net currency gains, and $1.4 million in one-time transactional taxes incurred in Brazil and Poland during 2016, in each case compared to the prior-year period.
47
Income Taxes
A
$15.4 million
and
$21.6 million
provision for income taxes in the years ended
December 31, 2016
and
2015
, respectively, resulted in an effective tax rate of
16.5%
compared with
20.5%
in the prior year. The Company’s effective tax rates differ from the statutory federal income tax rate of 35% due to varying tax rates in foreign jurisdictions and the relative amounts of income we earn in those jurisdictions, for which no U.S. taxes are provided because such earnings are intended to be indefinitely reinvested outside the U.S. Other tax rate differences result from the impact of impairment expenses related to the DelStar trade name impairment and discrete one-time benefits related to favorable deferred tax movements and income tax valuation allowances. In 2016, tax expense was favorably impacted by the remeasurement of deferred tax assets and liabilities due to tax law changes in France, Poland and the state of Delaware.
Income from Equity Affiliates
Income from equity affiliates, net of income taxes, was
$4.8 million
in the year ended
December 31, 2016
compared with
$6.6 million
during the prior year and reflected the results of operations of CTM and CTS. The decrease in earnings was driven primarily by lower sales volumes at CTS in the first half of 2016 compared to the prior-year period. In April 2016, CTM temporarily suspended production in order to bring its operations into compliance with newly effective emissions standards in China. In June, it resumed operations. This suspension did not have a material adverse impact on our financial results in 2016.
Discontinued Operations
Because we closed our Philippines plat as previously reported, the results of this plant were reported as discontinued operations for all periods presented. Consequently, this plant's results have been removed from each line of the statements of income and the operating activities section of the statements of cash flow. In each case, a separate line has been added for the net results of the discontinued operation.
Net Income and Income per Share
Net income in the year ended
December 31, 2016
was
$82.8 million
, or
$2.70
per diluted share, compared with
$89.7 million
, or
$2.94
per diluted share, during the prior year period. The decrease in net income was primarily due to higher expenses from interest and intangible asset amortization, the impact of sales declines in certain end-markets in the AMS segment along with lower income from our equity affiliates, lower interest income and impairment expense recognized due to the phase out of the DelStar trade name in 2017. These factors were partially offset by incremental income earned from the operations of our newly acquired Argotec business as well as lower restructuring expenses, primarily in our EP segment, and the net combined impact of operational improvements and net combined changes in volumes, mix of products sold, and average selling prices, along with overall favorable net foreign currency impacts.
48
Liquidity and Capital Resources
A major factor in our liquidity and capital resource planning is our generation of cash flow from operations, which is sensitive to changes in the mix of products sold, volume and pricing of our products, as well as changes in our production volumes, costs and working capital. Our liquidity is supplemented by funds available under our revolving credit facility with a syndicate of banks that is used as either operating conditions or strategic opportunities warrant.
As of
December 31, 2017
, $76.8 million of our
$106.9 million
of cash and cash equivalents was held by foreign subsidiaries. Cash paid for income taxes (net of refunds) was $38.1 million for the year ended
December 31, 2017
. The Tax Act imposes a mandatory transition tax on accumulated foreign earnings and eliminates U.S. taxes on foreign subsidiary distributions. We recorded a provisional tax liability of $48.7 million relating to the one-time mandatory transition tax on our accumulated foreign earnings which we intend to pay over an eight-year payment schedule as prescribed by the Tax Act. We also revalued our deferred tax liability as a result of lower expected future tax rates, resulting in a $9.1million tax benefit. We established a partnership holding company in Luxembourg in 2014. As a result of the holding company structure, some of the foreign earnings flow directly to the U.S., and these earnings are no longer considered to be permanently reinvested overseas. We believe that we are able to maintain a sufficient level of liquidity for our domestic operations and commitments without repatriation of the cash held by these other foreign subsidiaries. We believe that our sources of liquidity and capital will be sufficient to finance our continued operations and growth strategy.
Capital spending for 2018 is projected to be approximately $40.0 million. We generally fund our capital projects using cash on-hand, cash generated from operations and our existing credit facilities, including the Amended Credit Agreement.
Cash Requirements
As of
December 31, 2017
, we had net operating working capital of
$184.2 million
and cash and cash equivalents of
$106.9 million
, compared with net operating working capital of
$124.1 million
and cash and cash equivalents of
$107.4 million
as of
December 31, 2016
. The
2017
year-over-year increase in net operating working capital is primarily due to increases in Accounts receivable and Inventories outstanding at December 31, 2017 compared to 2016 due to the addition of Conwed in 2017, and decreases in accrued income taxes. These factors were partially offset by a corresponding increase in Accounts payable due to the Conwed acquisition and a decrease in Assets held for sale outstanding at December 31, 2017. Changes in the amounts that make up these balances reflect the impacts of changes in currency exchange rates which are included in the changes in operating working capital presented on the Consolidated Statements of Cash Flow.
49
|
Cash Flows from Operating Activities
($ in millions)
|
For the Years Ended December 31,
|
||||||||||
|
2017
|
|
2016
|
|
2015
|
|||||||
|
Net income
|
$
|
34.5
|
|
$
|
82.8
|
|
$
|
89.7
|
|
||
|
Less: Income (loss) from discontinued operations
|
0.1
|
|
—
|
|
(0.8
|
)
|
|||||
|
Income from continuing operations
|
34.4
|
|
82.8
|
|
90.5
|
|
|||||
|
Non-cash items included in net income:
|
|
|
|||||||||
|
Depreciation and amortization
|
59.5
|
|
44.5
|
|
41.0
|
|
|||||
|
Impairment
|
4.6
|
|
21.3
|
|
6.7
|
|
|||||
|
Deferred income tax provision (benefit)
|
1.6
|
|
(13.5
|
)
|
(6.7
|
)
|
|||||
|
Pension and other postretirement benefits
|
3.8
|
|
3.8
|
|
4.2
|
|
|||||
|
Stock-based compensation
|
7.1
|
|
5.8
|
|
3.5
|
|
|||||
|
Income from equity affiliates
|
(2.5
|
)
|
(4.8
|
)
|
(6.6
|
)
|
|||||
|
Gain on sale of intangible assets
|
—
|
|
(1.8
|
)
|
(4.3
|
)
|
|||||
|
Gain on sale of assets
|
(4.9
|
)
|
—
|
|
—
|
|
|||||
|
Long-term income tax payable
|
36.7
|
|
—
|
|
—
|
|
|||||
|
Excess tax benefits of stock-based awards
|
—
|
|
0.2
|
|
(0.5
|
)
|
|||||
|
Cash dividends received from equity affiliates
|
1.8
|
|
3.0
|
|
3.9
|
|
|||||
|
Other items
|
0.7
|
|
(0.6
|
)
|
0.1
|
|
|||||
|
Net changes in operating working capital
|
(11.9
|
)
|
(11.0
|
)
|
12.8
|
|
|||||
|
Net cash provided (used) by operating activities of:
|
|
|
|||||||||
|
Continuing operations
|
130.9
|
|
129.7
|
|
144.6
|
|
|||||
|
Discontinued operations
|
0.1
|
|
—
|
|
0.1
|
|
|||||
|
Cash provided by operations
|
$
|
131.0
|
|
$
|
129.7
|
|
$
|
144.7
|
|
||
Net cash provided by operations was
$131.0 million
in the year ended
December 31, 2017
compared with
$129.7 million
in the prior year. Our net cash provided by operations increased primarily due to a $50.6 million year-over-year increase in non-cash add backs to net income, partially offset by lower net income of $48.3 million, a $0.9 million unfavorable year-over-year impact of a net change in operating working capital and $1.2 million in lower dividends received from equity affiliates.
Net cash provided by operations was
$129.7 million
in the year ended
December 31, 2016
compared with
$144.7 million
in the prior year. Our net cash provided by operations decreased due primarily to lower net income in 2016 compared to 2015 and a $23.8 million unfavorable year-over-year net change in operating working capital, partially offset by the impact of certain non-cash adjustments to net income, including $14.6 million in higher impairment expense, $3.5 million in higher depreciation and intangible amortization expense and $2.5 million in lower gain on the sale of water rights at our Spotswood, NJ manufacturing facility.
50
|
Operating Working Capital
($ in millions)
|
For the Years Ended December 31,
|
||||||||||
|
2017
|
|
2016
|
|
2015
|
|||||||
|
Changes in operating working capital
|
|
|
|||||||||
|
Accounts receivable
|
$
|
(0.9
|
)
|
$
|
3.1
|
|
$
|
(18.0
|
)
|
||
|
Inventories
|
(6.4
|
)
|
(6.9
|
)
|
1.3
|
|
|||||
|
Prepaid expenses
|
0.8
|
|
(0.5
|
)
|
1.1
|
|
|||||
|
Accounts payable
|
4.7
|
|
(3.7
|
)
|
6.5
|
|
|||||
|
Accrued expenses
|
(3.0
|
)
|
0.8
|
|
3.7
|
|
|||||
|
Accrued income taxes
|
(7.1
|
)
|
(3.8
|
)
|
18.2
|
|
|||||
|
Net changes in operating working capital
|
$
|
(11.9
|
)
|
$
|
(11.0
|
)
|
$
|
12.8
|
|
||
In
2017
, net changes in operating working capital decreased cash flow by
$11.9 million
compared with an
$11.0 million
decrease in cash flow in the prior year. The 2017 reduction in cash flow from the net change in working capital was driven by increases in accounts receivable and inventories, and decreases in accrued income taxes, partially offset by increases in accounts payable.
In
2016
, net changes in operating working capital decreased cash flow by
$11.0 million
compared with a
$12.8 million
increase in cash flow in the prior year. The 2016 reduction in cash flow from the net change in working capital was driven by increases in inventory and decreases in accounts payable and accrued income taxes, partially offset by decreases in accounts receivable.
In
2015
, net changes in operating working capital provided cash flow of
$12.8 million
compared with $18.6 million in 2014. The 2015 unfavorable net change in working capital was driven by increases in inventory and accounts receivable from acquisitions, partially offset by higher accrued expenses and accrued taxes.
|
Cash Flows from Investing Activities
($ in millions)
|
For the Years Ended December 31,
|
||||||||||
|
2017
|
|
2016
|
|
2015
|
|||||||
|
Capital spending
|
$
|
(37.2
|
)
|
$
|
(27.8
|
)
|
$
|
(24.2
|
)
|
||
|
Capitalized software costs
|
(3.5
|
)
|
(2.8
|
)
|
(0.9
|
)
|
|||||
|
Acquisitions, net of cash acquired
|
(291.7
|
)
|
—
|
|
(280.6
|
)
|
|||||
|
Proceeds from sale of assets
|
7.0
|
|
—
|
|
—
|
|
|||||
|
Other
|
6.9
|
|
8.2
|
|
(8.0
|
)
|
|||||
|
Cash used for investing
|
$
|
(318.5
|
)
|
$
|
(22.4
|
)
|
$
|
(313.7
|
)
|
||
Cash used for investing activities during
2017
was
$318.5 million
and consisted primarily of cash paid for the Conwed acquisition and capital spending, partially offset by $7.0 million received from the sale of assets.
Cash used for investing activities during
2016
was
$22.4 million
and consisted primarily of capital spending, partially offset by proceeds of $4.6 million received from the sale of assets held for sale and a gain of $1.8 million on the sale of water right intangible assets at our Spotswood, NJ manufacturing facility.
Cash used for investing activities during
2015
was
$313.7 million
and consisted primarily of funds used in the Argotec acquisition as well as capital spending, including expansion of DelStar both within its existing facilities as well as the new site in Poland.
51
Capital Spending
Capital spending was
$37.2 million
,
$27.8 million
and
$24.2 million
in
2017
,
2016
and
2015
, respectively.
During
2017
,
2016
and
2015
, capital spending was primarily related to maintenance capital spending, capacity additions to support growth in transportation and infrastructure end-markets, construction on AMS manufacturing facilities in China and Poland, and the rebuild of certain paper manufacturing lines.
We incur capital spending as necessary to meet legal requirements and otherwise in connection with the protection of the environment at our facilities in the U.S., United Kingdom, France, Belgium, Brazil, Canada, China and Poland. For these purposes, we expect to incur capital expenditures of less than
$1.0 million
in each of 2018 and 2019, of which no material amount is expected to be the result of environmental fines or settlements. The foregoing capital expenditures are not expected to reduce our ability to invest in other appropriate and necessary capital projects and are not expected to have a material adverse effect on our financial condition or results of operations.
|
Cash Flows from Financing Activities
($ in millions)
|
For the Years Ended December 31,
|
||||||||||
|
2017
|
|
2016
|
|
2015
|
|||||||
|
Cash dividends paid to SWM stockholders
|
$
|
(51.9
|
)
|
$
|
(49.4
|
)
|
$
|
(46.9
|
)
|
||
|
Net (repayments on) proceeds from borrowings
|
233.2
|
|
(135.4
|
)
|
149.1
|
|
|||||
|
Payments for debt issuance costs
|
(0.6
|
)
|
—
|
|
(7.4
|
)
|
|||||
|
Purchases of common stock
|
(1.2
|
)
|
(0.7
|
)
|
(2.9
|
)
|
|||||
|
Excess tax benefits of stock-based awards
|
—
|
|
(0.2
|
)
|
0.5
|
|
|||||
|
Cash (used in) provided by financing
|
$
|
179.5
|
|
$
|
(185.7
|
)
|
$
|
92.4
|
|
||
During
2017
, financing activities consisted primarily of net proceeds from borrowings of
$233.2 million
, primarily for the acquisition of Conwed, cash dividends of
$51.9 million
paid to SWM stockholders and share repurchases of
$1.2 million
.
During
2016
, financing activities consisted primarily of net repayments on borrowings of
$135.4 million
, cash dividends of
$49.4 million
paid to SWM stockholders and share repurchases of
$0.7 million
.
During
2015
, financing activities consisted primarily of net proceeds from borrowings of
$149.1 million
offset by cash dividends of
$46.9 million
paid to SWM stockholders, payments for debt issuance costs related to the Company's Amended Credit Agreement of $7.4 million and share repurchases of
$2.9 million
.
Dividend Payments
We have declared and paid cash dividends on our common stock every fiscal quarter since the second quarter of 1996. On
February 21, 2018
, we announced a cash dividend of $0.43 per share payable on
March 23, 2018
to stockholders of record as of the close of business on
March 2, 2018
. Our Amended Credit Agreement covenants require that we maintain certain financial ratios, as disclosed in Note
13
. Debt, of the Notes to Consolidated Financial Statements, none of which under normal business conditions materially limit our ability to pay such dividends. We will continue to assess our dividend policy in light of our overall strategy, cash generation, debt levels and ongoing requirements for cash to fund operations and to pursue possible strategic opportunities.
Share Repurchases
In
2017
,
2016
and
2015
, we repurchased 25,860 shares, 20,345 shares, and 63,365 shares, respectively, of our common stock at a cost of $1.2 million, $0.7 million and $2.9 million, respectively, for the value of employees' stock-based compensation share awards surrendered to satisfy their personal statutory income tax withholding obligations.
52
|
Debt Instruments and Related Covenants
($ in millions)
|
For the Years Ended December 31,
|
||||||||||
|
2017
|
2016
|
2015
|
|||||||||
|
Changes in short-term debt
|
$
|
1.5
|
|
$
|
—
|
|
$
|
(0.4
|
)
|
||
|
Proceeds from issuances of long-term debt
|
440.5
|
|
35.6
|
|
488.2
|
|
|||||
|
Payments on long-term debt
|
(208.8
|
)
|
(171.0
|
)
|
(338.7
|
)
|
|||||
|
Net (repayments on) proceeds from borrowings
|
$
|
233.2
|
|
$
|
(135.4
|
)
|
$
|
149.1
|
|
||
Net
proceeds
from borrowings were
$233.2 million
during
2017
. Absent any substantial acquisition(s) or any share repurchases, the Company does not expect to incur any significant additional borrowings during 2018, however the company could choose to refinance existing borrowings using the proceeds of new borrowings or debt securities.
In October 2015, Schweitzer-Mauduit International, Inc. entered into the Amended Credit Agreement, which provides an aggregate principal amount of $1 billion, consisting of a $650 million revolving credit facility maturing in October 2020, a $100 million Term Loan A-1 maturing in October 2020, and a $250 million Term Loan A-2 maturing in October 2022. The Term Loans are generally subject to mandatory repayment out of the net cash proceeds of asset sales which are not reinvested in operating assets. The credit facilities are secured by substantially all of the personal property of the Company and its domestic subsidiaries. Availability under the Amended Credit Agreement was
$278.8 million
as of
December 31, 2017
. We also had availability under our bank overdraft facilities and lines of credit of
$20.0 million
as of
December 31, 2017
.
The Company was in compliance with all of its covenants under the Amended Credit Agreement at
December 31, 2017
. In December 2016, and effective upon consummation of the Conwed acquisition in January 2017, the company entered into an amendment to the Amended Credit Agreement which changed certain of its financial covenants as discussed in more detail in Note
13
. Debt of the Notes to the Consolidated Financial Statements. With the current level of borrowing and forecasted results, we expect to remain in compliance with our Amended Credit Agreement financial covenants.
Our total debt to capital ratios at
December 31, 2017
and
December 31, 2016
were
55.6%
and
46.4%
, respectively.
Off-Balance Sheet Arrangements
As of
December 31, 2017
, we did not have any significant off-balance sheet arrangements, as defined in Item 303(a)(4)(ii) of SEC Regulation S-K.
53
Other Factors Affecting Liquidity and Capital Resources
The following table represents our future contractual cash requirements for the next five years and thereafter for our long-term debt obligations and other commitments ($ in millions):
|
Payments due for the years ended
|
|||||||||||||||||||||||||||
|
Contractual Obligations
|
Total
|
2018
|
2019
|
2020
|
2021
|
2022
|
Thereafter
|
||||||||||||||||||||
|
Current debt
(1)
|
$
|
6.9
|
|
$
|
6.9
|
|
$
|
—
|
|
$
|
—
|
|
$
|
—
|
|
$
|
—
|
|
$
|
—
|
|
||||||
|
Long-term debt
(2)
|
683.1
|
|
—
|
|
5.2
|
|
434.6
|
|
4.4
|
|
236.0
|
|
2.9
|
|
|||||||||||||
|
Debt interest
(3)
|
88.5
|
|
24.8
|
|
24.6
|
|
22.0
|
|
9.3
|
|
7.7
|
|
0.1
|
|
|||||||||||||
|
Restructuring obligations
(4)
|
1.7
|
|
0.6
|
|
0.9
|
|
0.2
|
|
—
|
|
—
|
|
—
|
|
|||||||||||||
|
Minimum operating lease
payments
(5)
|
33.8
|
|
6.2
|
|
5.2
|
|
4.8
|
|
4.2
|
|
3.7
|
|
9.7
|
|
|||||||||||||
|
Purchase obligations - raw
materials
(6)
|
23.8
|
|
14.8
|
|
1.8
|
|
1.9
|
|
1.9
|
|
1.7
|
|
1.7
|
|
|||||||||||||
|
Purchase obligations - energy
(7)
|
23.2
|
|
12.2
|
|
7.5
|
|
3.5
|
|
—
|
|
—
|
|
—
|
|
|||||||||||||
|
Tax Act transition obligation
(8)
|
36.7
|
|
2.9
|
|
2.9
|
|
2.9
|
|
2.9
|
|
2.9
|
|
22.2
|
|
|||||||||||||
|
Other long-term liabilities
(9) (10) (11) (12)
|
0.5
|
|
0.5
|
|
—
|
|
—
|
|
—
|
|
—
|
|
—
|
|
|||||||||||||
|
Total
|
$
|
898.2
|
|
$
|
68.9
|
|
$
|
48.1
|
|
$
|
469.9
|
|
$
|
22.7
|
|
$
|
252.0
|
|
$
|
36.6
|
|
||||||
|
(1)
|
Current debt excludes debt issuance costs of $1.8 million; see Note
13
, Debt. of the Notes to Consolidated Financial Statements.
|
|
(2)
|
Long-term debt excludes debt issuance costs of $3.9 million; see additional information regarding long-term debt in Note
13
. Debt, of the Notes to Consolidated Financial Statements.
|
|
(3)
|
The amounts reflected in debt interest are based upon the short-term and long-term scheduled principal maturities and interest rates in effect as of
December 31, 2017
. Where specific maturities are not stated, such as for an overdraft line-of-credit, a repayment date coinciding with the end of the year was used for purposes of these calculations. Since our debt is largely variable interest rate debt, applicable market interest rates were assumed to be the same as at
December 31, 2017
for purposes of these calculations. With respect to our variable-rate debt outstanding at
December 31, 2017
, a 100 basis point increase in interest rates would increase our debt interest obligation by $3.2 million in 2018, taking into account the affect of the interest rate hedge transactions the Company has entered into as of December 31, 2017. For more information regarding our outstanding debt and associated interest rates, as well as hedging strategies in place which serve to fix the interest rate on a large portion of our debt, see Note
13
. Debt, of the Notes to Consolidated Financial Statements.
|
|
(4)
|
Restructuring obligations are more fully discussed in Part II, Item 7, Management's Discussion and Analysis of Financial Condition and Results of Operations, Recent Developments and Note
12
. Restructuring and Impairment Activities, of the Notes to Consolidated Financial Statements.
|
|
(5)
|
Minimum operating lease payments relate to our future minimum obligations under non-cancelable operating leases having an initial or remaining term in excess of one year as of
December 31, 2017
.
|
|
(6)
|
Purchase obligations for raw materials include our calcium carbonate purchase agreement at our plant in Quimperlé, France, in which a vendor operates an on-site calcium carbonate plant and our plant has minimum purchase quantities. See Note
19
. Commitments and Contingencies, of the Notes to Consolidated Financial Statements for additional information.
|
54
|
(7)
|
Purchase obligations for energy include obligations under agreements with (1) an energy co-generation supplier at our plants in Quimperlé, France and Spay, France, to supply steam for which our plants have minimum purchase commitments, (2) a natural gas supplier to supply and distribute 100% of the natural gas needs of our three French plants, (3) an energy supplier to supply a constant supply of electricity for our Pirahy plant in Brazil, and (4) an energy supplier has a contract to provide biomass at our Spay, France facility for the next two years. See Note
19
. Commitments and Contingencies, of the Notes to Consolidated Financial Statements for additional information.
|
|
(8)
|
On December 22, 2017, the United States enacted the Tax Cuts and Jobs Act ("Tax Act") into law, which requires a one-time transition tax on certain unpatriated earnings of foreign subsidiaries. Companies may elect to pay the tax over eight years based on an installment schedule outlined in the Tax Act. We intend to make this election and have reflected our provisional transition tax due by year as a contractual obligation. See Note.
16
. Income Taxes, of the Notes to Consolidated Financial Statements for additional information.
|
|
(9)
|
Other long-term liabilities exclude
$1.0 million
of unrecognized tax benefits associated with uncertain tax positions for which there is no contractual obligation. We had no other long-term liabilities as defined for purposes of this disclosure by the SEC as of
December 31, 2017
.
|
|
(10)
|
Other long-term liabilities do not include any amounts for our pension obligations. The pension obligations are funded by our separate pension trusts, which held
$131.9 million
in assets at
December 31, 2017
. The combined projected benefit obligation ("PBO") of our U.S. and French pension plans was underfunded by
$22.7 million
and
$30.6 million
as of
December 31, 2017
and
2016
, respectively. We make contributions to our pension trusts based on many factors including regulatory guidelines, investment returns of the trusts and availability of cash for pension contributions versus other priorities. We did not make contributions to our U.S. and French pension plans during
2017
. We expect 2018 funding to be in compliance with the Pension Protection Act of 2006. For information regarding our long-term pension obligations and trust assets, see Note
17
. Postretirement and Other Benefits, of the Notes to Consolidated Financial Statements.
|
|
(11)
|
Other long-term liabilities do not include any amounts for our postretirement healthcare and life insurance benefits. Such payments are dependent upon our retirees incurring costs and filing claims; therefore, future payments are uncertain. Our net payments under these plans were approximately
$0.3 million
and
$0.4 million
in the years ended
December 31, 2017
and
2016
, respectively. Based on this past experience, we currently expect our share of the net payments to be less than $1.0 million during 2018 for these benefits. For more information regarding our retiree healthcare and life insurance benefit obligations, see Note
17
. Postretirement and Other Benefits, of the Notes to Consolidated Financial Statements.
|
|
(12)
|
Other long-term liabilities relate to contractual commitments for capital projects.
|
55
Outlook
For the AMS segment, we expect our growth outlook to be driven by macro factors affecting our served end-markets, including filtration, infrastructure and construction, transportation, industrial, and medical, as well as industry demand for many of our key applications. We expect water and other specialty filtration applications, surface protection products within transportation, and our products for infrastructure and construction end-markets to deliver growth exceeding GDP, or other global growth benchmarks, over the long-term due to the relative strong demand for the specific products we provide. Generally, we believe that our sales into the industrial and medical end-markets will perform relatively in line with long-term broad economic growth in the U.S. and to some extent Europe and China. For the EP segment, we expect our outlook and performance to be driven by macro factors, such as the expected long-term trend of reduced cigarette consumption and foreign exchange movements, and the potential regulatory changes in the tobacco industry such as approvals of various new reduced-risk tobacco products or tax-related price increases. In addition, cigarette industry consolidation may play a role in affecting trends in the tobacco industry.
Forward-Looking Statements
This report contains forward-looking statements within the meaning of Private Securities Litigation Reform Act of 1995 that are subject to the safe harbor created by that Act and other legal protections. Forward-looking statements, include, without limitation, those regarding 2018 outlook and future performance, mergers and acquisitions, future market trends, future RTL sales and volume trends, smoking attrition rates, synergies or growth from acquisitions, incurrence of additional debt, adoption of LIP standards in new regions, reverse osmosis water filtration and global drinking water demands, integration, and growth prospects (including international growth), the deductibility of goodwill associated with the Argotec acquisition, impact of our restructuring actions, post-retirement healthcare and life insurance payments, impact of the LIP intellectual property litigation and opposition proceedings, the amount of capital spending and/or common stock repurchases, the profitability of CTS, pricing pressures (including related to LIP), future cash flows, benefits associated with our global asset realignment (including possible non-recurrence of one-time tax benefits, lower or higher effective tax rates), purchase accounting impacts, impacts of our ongoing operational excellence and other cost-reduction initiatives, increasing revenues coming from our non-tobacco operations, and other statements generally identified by words such as "believe," "expect," "intend," "plan," "potential," "anticipate," "project," "appear," "should," "could," "may," "will," "typically" and similar words. These statements are not guarantees of future performance and involve certain risks and uncertainties that may cause actual results to differ materially from our expectations as of the date of this report. These risks include, among other things, those set forth in Part I, Item 1A. Risk Factors of this report as well as the following factors:
|
•
|
Recent changes to U.S. federal income tax law, the overall impact and interpretation of which remain uncertain and could be material, in addition to the extent to which states may conform to the newly enacted federal tax law as well as the impact of the tax reform on holders of our common stock;
|
|
•
|
Changes in sales or production volumes, pricing and/or manufacturing costs of reconstituted tobacco products, cigarette paper (including for LIP cigarettes), AMS end-market products due to changing customer demands (including any change by our customers in their tobacco and tobacco-related blends for their cigarettes, their target inventory levels and/or the overall demand for their products), new technologies such as e-cigarettes, inventory adjustments and rebalancings, competition or otherwise;
|
|
•
|
Changes in the Chinese economy, including relating to the demand for reconstituted tobacco, premium cigarettes and netting;
|
|
•
|
Risks associated with the implementation of our strategic growth initiatives, including diversification, and the Company's understanding of, and entry into, new industries and technologies;
|
|
•
|
Changes in the source and intensity of competition in our commercial segments. We operate in highly competitive markets in which alternative supplies and technologies may attract our customers away from our products. In additional, our customers may, in some cases, produce for themselves the components that the
|
56
Company sells to them for incorporation into their products, thus reducing or eliminating their purchases from us;
|
•
|
Our ability to attract and retain key personnel, due to our prior restructuring actions, the tobacco industry in which we operate or otherwise;
|
|
•
|
Weather conditions, including potential impacts, if any, from climate change, known and unknown, seasonality factors that affect the demand for virgin tobacco leaf and natural disasters or unusual weather events;
|
|
•
|
Increases in commodity prices and lack of availability of such commodities, including energy, wood pulp and resins, could impact the sales and profitability of our products;
|
|
•
|
Adverse changes in the oil, gas, automotive, construction and infrastructure, and mining sectors impacting key AMS segment customers;
|
|
•
|
Increases in operating costs due to inflation or otherwise, such as labor expense, compensation and benefits costs;
|
|
•
|
Employee retention and labor shortages;
|
|
•
|
Changes in employment, wage and hour laws and regulations in the U.S., France and elsewhere, including loi de Securisation de l'emploi, unionization rule and regulations by the National Labor Relations Board, equal pay initiatives, additional anti-discrimination rules or tests and different interpretations of exemptions from overtime laws;
|
|
•
|
Labor strikes, stoppages, disruptions or other disruptions at our facilities;
|
|
•
|
Existing and future governmental regulation and the enforcement thereof, for example relating to the tobacco industry, taxation and the environment (including the impact thereof on our Chinese joint ventures);
|
|
•
|
New reports as to the effect of smoking on human health or the environment;
|
|
•
|
Changes in general economic, financial and credit conditions in the U.S., Europe, China and elsewhere, including the impact thereof on currency exchange rates (including any weakening of the euro and Real) and on interest rates;
|
|
•
|
Changes in the manner in which we finance our debt and future capital needs, including potential acquisitions;
|
|
•
|
The success of, and costs associated with, our current or future restructuring initiatives, including the granting of any needed governmental approvals and the occurrence of work stoppages or other labor disruptions;
|
|
•
|
Changes in the discount rates, revenue growth, cash flow growth rates or other assumptions used by the Company in its assessment for impairment of assets and adverse economic conditions or other factors that would result in significant impairment charges;
|
|
•
|
The failure of one or more material suppliers, including energy, resin and pulp suppliers, to supply materials as needed to maintain our product plans and cost structure;
|
|
•
|
International conflicts and disputes, such as those involving the Russian Federation and the Middle East, which restrict our ability to supply products into affected regions, due to the corresponding effects on demand, the application of international sanctions, or practical consequences on transportation, banking transactions, and other commercial activities in troubled regions;
|
57
|
•
|
Compliance with the FCPA and other anti-corruption laws or trade control laws, as well as other laws governing our operations;
|
|
•
|
The pace and extent of further international adoption of LIP cigarette standards and the nature of standards so adopted;
|
|
•
|
Risks associated with our 50%-owned, non-U.S. joint ventures relating to control and decision-making, compliance, accounting standards, transparency and customer relations, among others;
|
|
•
|
A failure in our risk management and/or currency or interest rate swaps and hedging programs, including the failures of any insurance company or counterparty;
|
|
•
|
The number, type, outcomes (by judgment or settlement) and costs of legal, tax, regulatory or administrative proceedings, litigation and/or amnesty programs, including those in Brazil and France;
|
|
•
|
The outcome and cost of LIP-related intellectual property infringement and validity litigation in Europe and the European Patent Office opposition proceedings;
|
|
•
|
Risks associated with acquisitions or other strategic transactions, including acquired liabilities and restrictions, retaining customers from businesses acquired, achieving any expected results or synergies from acquired businesses, complying with new regulatory frameworks, difficulties in integrating acquired businesses or implementing strategic transactions generally and risks associated with international acquisition transactions, including in countries where we do not currently have a material presence;
|
|
•
|
Risks associated with dispositions, including post-closing claims being made against us, disruption to our other businesses during a sale process or thereafter, credit risks associated with any buyer of such disposed assets and our ability to collect funds due from any such buyer;
|
|
•
|
Risks associated with our global asset realignment initiatives, including: changes in tax law, treaties, interpretations, or regulatory determinations; audits made by applicable regulatory authorities and/or our auditor; and our ability to operate our business in a manner consistent with the regulatory requirements for such realignment;
|
|
•
|
Increased taxation on tobacco-related products;
|
|
•
|
Costs and timing of implementation of any upgrades or changes to our information technology systems;
|
|
•
|
Failure by us to comply with any privacy or data security laws or to protect against theft of customer, employee and corporate sensitive information;
|
|
•
|
Changes in tax rates, the adoption of new U.S. or international tax legislation or exposure to additional tax liabilities;
|
|
•
|
Changes in construction and infrastructure spending and its impact on demand for certain products;
|
|
•
|
Potential loss of consumer awareness and demand for acquired companies’ products if it is decided to rebrand those products under the Company’s legacy brand names; and
|
|
•
|
Other factors described elsewhere in this document and from time to time in documents that we file with the SEC.
|
All forward-looking statements made in this document are qualified by these cautionary statements. Forward-looking statements herein are made only as of the date of this document, and we do not undertake any obligation, other than as may be required by law, to update or revise any forward-looking or cautionary statements to reflect changes in
58
assumptions, the occurrence of events, unanticipated or otherwise, or changes in future operating results over time or otherwise.
Comparisons of results for current and any prior periods are not intended to express any future trends or indications of future performance unless expressed as such, and should only be viewed as historical data.
59
Item 7A.
Quantitative and Qualitative Disclosures about Market Risk
Foreign Currency Risk
Changes in foreign currency exchange rates may have an impact on our operating profit. Since we transact business in many countries, some of our sale and purchase transactions are denominated in a currency other than the local currency of our operations. As a result, changes in exchange rates between the currencies in which the transaction is denominated versus the local currency of our operation into which the transaction is being recorded can impact the amount of local currency recorded for such transaction. This can result in more or less local currency revenue or cost related to such transaction and thus have an effect on our operating profit. Currency transaction risk is mitigated partially in France as some of the revenue and expense transactions of our French subsidiaries are denominated in U.S. dollars, providing a degree of natural hedging. Our Brazilian and Polish operations are more fully exposed to currency transaction risk, especially as a result of U.S. dollar and euro denominated sales, respectively.
Additionally, changes in foreign currency exchange rates may have an impact on the amount reported in other income (expense), net. Once the above-indicated receivables and payables from the sale and purchase transactions have been recorded, to the extent currency exchange rates change prior to settlement of the balance, a gain or loss on the non-local currency denominated asset or liability balance may be experienced, in which case such gain or loss is included in other income (expense), net.
We utilize forward and swap contracts and, to a lesser extent, option contracts to selectively hedge our exposure to foreign currency transaction risk when it is practical and economical to do so. The use of these contracts minimizes transactional exposure to exchange rate changes because the gains or losses incurred on the derivative instrument will offset, in whole or in part, the loss or gain on the underlying foreign currency exposure. These instruments are entered into with money center banks, insurance companies or government agencies, collectively known as counterparties. We expect to continue to apply foreign currency hedging in our Brazilian and Polish operations in the foreseeable future. As of
December 31, 2017
, a 10% unfavorable change in the exchange rate of our functional currencies and those of our subsidiaries against the prevailing market rates of non-local currencies involving our transactional exposures would have resulted in a net pre-tax loss of approximately $3 million. These hypothetical gains or losses on foreign currency transactional exposures are based on the
December 31, 2017
rates and the assumed rates. While we believe the above loss resulting from the hypothetical unfavorable changes in foreign currency exchange rates could be material to our results of operations, we reduce this risk by selectively hedging our exposure when it is practical and economical to do so.
Interest Rate Risk
We may utilize a combination of variable-rate and fixed-rate debt consisting of short-term and long-term instruments. We selectively hedge our exposure to interest rate increases on our variable-rate, long-term debt when it is practical and economical to do so. We have utilized various forms of interest rate hedge agreements, including interest rate swap agreements and forward rate agreements. We utilize variable-to-fixed interest rate swap agreements, typically with contractual terms no longer than 60 months, which serve to convert a portion of our outstanding variable rate debt to a fixed rate. Various outstanding interest-bearing instruments are sensitive to changes in interest rates. With respect to our variable-rate debt outstanding at
December 31, 2017
, a 100 basis point increase in interest rates would result in a $3 million decrease to our future annual pre-tax earnings, taking into account the affect of the interest rate hedge transactions the Company has entered into as of December 31, 2017. As of
December 31, 2017
, the Company does not have significant fixed-rate debt outstanding. As of
December 31, 2017
the Company has entered into interest rate hedge transactions which have the effect of fixing the interest rate on approximately 54% of our debt subject to variable interest rates.
Commodity Price Risk
We are subject to commodity price risks from our purchases of raw materials, including resin and wood pulp. Resin is the largest single component of raw material cost in the AMS segment and wood pulp is our largest single component of raw material cost in our EP segment. The per pound price of resin is volatile and may impact the future results of
60
our AMS segment. Additionally, the per ton cost of wood pulp is cyclical in nature and more volatile than general inflation. During the period from January 2013 through December 2017, the U.S. list price of northern bleached softwood kraft pulp ("NBSK") a representative pulp grade that we use, increased by approximately 35%. We normally maintain approximately 50 to 90 days of inventories to support our operations. As a result, there is a lag in the impact of changes in the per ton list price of resin and wood pulp on our cost of products sold.
In our AMS segment, we utilize a variety of commodity grade and specialty resins, including a selection of specialized high temperature engineering grade resins. Certain of these specialty resins are significantly more expensive than commodity grade resins. Resin prices fluctuate significantly and can impact profitability. As we periodically enter into agreements with customers under which we agree to supply products at fixed prices, unanticipated increases in the costs of raw materials, or the lack of availability of such raw materials (due to force majeure or other reasons), can significantly impact our financial performance. Even where we do not have fixed-price agreements, we generally cannot pass through increases in raw material costs in a timely manner and in many instances are not able to pass through the entire increase to our customers. Further, some of the resins we use in our AMS segment are only available from a single supplier, or a limited number of suppliers. Consequently, such supplier(s) can control the availability and thus the cost of the resins we use, notwithstanding any changes in the cost of oil. It can be time consuming and costly, and occasionally impractical, to find replacement resins where such suppliers limit the availability or increase the cost of resins we use. Commodity grade resin prices typically correlate with crude oil prices while specialty resin prices often do not. To date, we have not utilized derivative instruments to manage this risk. With respect to our commodity price risk, a hypothetical 10% change in per ton resin prices would impact our future annual pre-tax earnings by approximately $13 million, assuming no compensating change in our selling prices.
Selling prices of our paper products are influenced, in part, by the market price for wood pulp, which is determined by worldwide industry supply and demand. Generally, over time, we have been able to increase our selling prices in response to increases in per ton wood pulp costs and have generally reduced our selling prices when wood pulp costs have significantly declined. Increases in prices of wood pulp could adversely impact our earnings if selling prices are not increased or if such increases do not fully compensate for or trail the increases in wood pulp prices. We have not utilized derivative instruments to manage this risk. With respect to our commodity price risk, a hypothetical 10% change in per ton wood pulp prices would impact our future annual pre-tax earnings by approximately $4 million, assuming no compensating change in our selling prices.
We believe that, while our exposure to commodity price risk is material to our results of operations, our customers understand such risk and over time changes in the price of the commodities used in our manufacturing processes are typically reflected in selling prices.
Energy Supply and Cost Volatility
In France, Poland, China and in the U.S., availability of energy is generally reliable, although prices can fluctuate significantly based on variations in demand. In Brazil, where that country's production of electricity is heavily reliant upon hydroelectric plants, availability of electricity has been affected in the past by rain variations. Although our Brazilian business currently has a sufficient supply of energy to continue its current level of operation, there can be no assurance that we will have sufficient electricity in the future, or that costs will remain stable.
Due to the competitive pricing in the markets for most of our products, we are typically unable to fully pass through higher energy costs to our customers. With respect to our purchased energy price risk, a hypothetical 10% change in per unit prices would impact our future annual pre-tax earnings by approximately $4 million, assuming no compensating change in our selling prices.
Periodically, when we believe it is appropriate to do so, we enter into agreements to procure a portion of our energy for future periods in order to reduce the uncertainty of future energy costs. However, in recent years this has only marginally slowed the increase in energy costs due to the volatile changes in energy prices we have experienced.
61
Item 8.
Financial Statements and Supplementary Data
Index to Consolidated Financial Statements
|
Page
|
|
|
Consolidated Financial Statements
|
|
|
Reports of Independent Registered Public Accounting Firm
|
|
Schedules have been omitted because they are either not required, not applicable or the required information is included in the consolidated financial statements or notes thereto.
62
SCHWEITZER-MAUDUIT INTERNATIONAL, INC. AND SUBSIDIARIES
(dollars in millions, except per share amounts)
|
For the Years Ended December 31,
|
|||||||||||
|
2017
|
2016
|
2015
|
|||||||||
|
Net sales
|
$
|
982.1
|
|
$
|
839.9
|
|
$
|
764.1
|
|
||
|
Cost of products sold
|
699.8
|
|
583.2
|
|
539.7
|
|
|||||
|
Gross profit
|
282.3
|
|
256.7
|
|
224.4
|
|
|||||
|
Selling expense
|
33.3
|
|
25.3
|
|
22.2
|
|
|||||
|
Research expense
|
17.8
|
|
17.5
|
|
14.0
|
|
|||||
|
General expense
|
98.4
|
|
82.2
|
|
70.6
|
|
|||||
|
Total nonmanufacturing expenses
|
149.5
|
|
125.0
|
|
106.8
|
|
|||||
|
Restructuring and impairment expense
|
8.1
|
|
25.6
|
|
14.6
|
|
|||||
|
Operating profit
|
124.7
|
|
|
106.1
|
|
|
103.0
|
|
|||
|
Interest expense
|
26.9
|
|
16.6
|
|
9.7
|
|
|||||
|
Other income, net
|
3.7
|
|
3.9
|
|
12.2
|
|
|||||
|
Income from continuing operations before income taxes and income from equity affiliates
|
101.5
|
|
93.4
|
|
105.5
|
|
|||||
|
Provision for income taxes
|
69.6
|
|
15.4
|
|
21.6
|
|
|||||
|
Income from equity affiliates, net of income taxes
|
2.5
|
|
4.8
|
|
6.6
|
|
|||||
|
Income from continuing operations
|
34.4
|
|
82.8
|
|
90.5
|
|
|||||
|
Gain (loss) from discontinued operations
|
0.1
|
|
—
|
|
(0.8
|
)
|
|||||
|
Net income
|
$
|
34.5
|
|
$
|
82.8
|
|
$
|
89.7
|
|
||
|
Net income (loss) per share - basic:
|
|||||||||||
|
Income per share from continuing operations
|
$
|
1.12
|
|
$
|
2.71
|
|
$
|
2.97
|
|
||
|
Loss per share from discontinued operations
|
—
|
|
—
|
|
(0.02
|
)
|
|||||
|
Net income per share – basic
|
$
|
1.12
|
|
$
|
2.71
|
|
$
|
2.95
|
|
||
|
Net income (loss) per share – diluted:
|
|
|
|
|
|||||||
|
Income per share from continuing operations
|
$
|
1.12
|
|
$
|
2.70
|
|
$
|
2.96
|
|
||
|
Loss per share from discontinued operations
|
—
|
|
—
|
|
(0.02
|
)
|
|||||
|
Net income per share – diluted
|
$
|
1.12
|
|
$
|
2.70
|
|
$
|
2.94
|
|
||
|
Weighted average shares outstanding:
|
|||||||||||
|
Basic
|
30,407,100
|
|
30,310,900
|
|
30,251,400
|
|
|||||
|
Diluted
|
30,549,300
|
|
30,463,400
|
|
30,374,300
|
|
|||||
The accompanying notes are an integral part of these consolidated financial statements.
63
SCHWEITZER-MAUDUIT INTERNATIONAL, INC. AND SUBSIDIARIES
CONSOLIDATED STATEMENTS OF COMPREHENSIVE INCOME
(dollars in millions)
|
For the Years Ended December 31,
|
|||||||||||
|
2017
|
2016
|
2015
|
|||||||||
|
Net income
|
$
|
34.5
|
|
$
|
82.8
|
|
$
|
89.7
|
|
||
|
Other comprehensive income (loss), net of tax:
|
|||||||||||
|
Foreign currency translation adjustments
|
36.0
|
|
(16.7
|
)
|
(54.4
|
)
|
|||||
|
Unrealized gains (losses) on derivative instruments
|
2.0
|
|
13.2
|
|
(24.9
|
)
|
|||||
|
Less: Reclassification adjustment for losses on derivative instruments included in net income
|
0.3
|
|
6.5
|
|
11.6
|
|
|||||
|
|
|||||||||||
|
Net gain (loss) from postretirement benefit plans
|
8.3
|
|
(4.3
|
)
|
(0.8
|
)
|
|||||
|
Less: Amortization of postretirement benefit plans' costs included in net periodic benefit cost
|
3.3
|
|
3.4
|
|
3.6
|
|
|||||
|
Other comprehensive income (loss)
|
49.9
|
|
2.1
|
|
(64.9
|
)
|
|||||
|
Comprehensive income
|
$
|
84.4
|
|
$
|
84.9
|
|
$
|
24.8
|
|
||
The accompanying notes are an integral part of these consolidated financial statements.
64
SCHWEITZER-MAUDUIT INTERNATIONAL, INC. AND SUBSIDIARIES
(dollars in millions, except per share amounts)
|
December 31,
2017 |
December 31,
2016 |
||||||
|
ASSETS
|
|
|
|||||
|
Cash and cash equivalents
|
$
|
106.9
|
|
$
|
107.4
|
|
|
|
Accounts receivable, net
|
149.4
|
|
115.1
|
|
|||
|
Inventories
|
155.2
|
|
119.4
|
|
|||
|
Income taxes receivable
|
3.4
|
|
—
|
|
|||
|
Assets held for sale
|
12.8
|
|
17.3
|
|
|||
|
Other current assets
|
5.4
|
|
5.1
|
|
|||
|
Total current assets
|
433.1
|
|
364.3
|
|
|||
|
Property, plant and equipment, net
|
361.9
|
|
307.4
|
|
|||
|
Deferred income tax benefits
|
1.0
|
|
3.7
|
|
|||
|
Investment in equity affiliates
|
68.5
|
|
63.8
|
|
|||
|
Goodwill
|
341.3
|
|
229.5
|
|
|||
|
Intangible assets
|
297.2
|
|
177.5
|
|
|||
|
Other assets
|
39.5
|
|
27.5
|
|
|||
|
Total assets
|
$
|
1,542.5
|
|
$
|
1,173.7
|
|
|
|
LIABILITIES AND STOCKHOLDERS' EQUITY
|
|
|
|
|
|||
|
Current debt
|
$
|
5.1
|
|
$
|
3.0
|
|
|
|
Accounts payable
|
59.4
|
|
50.3
|
|
|||
|
Income taxes payable
|
4.0
|
|
5.3
|
|
|||
|
Accrued expenses
|
78.6
|
|
77.2
|
|
|||
|
Total current liabilities
|
147.1
|
|
135.8
|
|
|||
|
Long-term debt
|
679.1
|
|
437.4
|
|
|||
|
Long-term income tax payable
|
36.7
|
|
—
|
|
|||
|
Pension and other postretirement benefits
|
30.7
|
|
33.1
|
|
|||
|
Deferred income tax liabilities
|
42.3
|
|
29.8
|
|
|||
|
Other liabilities
|
59.9
|
|
29.3
|
|
|||
|
Total liabilities
|
995.8
|
|
665.4
|
|
|||
|
Stockholders' equity:
|
|
|
|
|
|||
|
Preferred stock, $0.10 par value per share; 10,000,000 shares authorized; none issued or outstanding
|
—
|
|
—
|
|
|||
|
Common stock, $0.10 par value per share; 100,000,000 shares authorized; 30,711,299 and 30,544,494 shares issued and outstanding at December 31, 2017 and 2016, respectively
|
3.1
|
|
3.1
|
|
|||
|
Additional paid-in-capital
|
66.3
|
|
59.2
|
|
|||
|
Retained earnings
|
566.7
|
|
585.3
|
|
|||
|
Accumulated other comprehensive loss
|
(89.4
|
)
|
(139.3
|
)
|
|||
|
Total stockholders' equity
|
546.7
|
|
508.3
|
|
|||
|
Total liabilities and stockholders' equity
|
$
|
1,542.5
|
|
$
|
1,173.7
|
|
|
The accompanying notes are an integral part of these consolidated financial statements.
65
SCHWEITZER-MAUDUIT INTERNATIONAL, INC. AND SUBSIDIARIES
CONSOLIDATED STATEMENTS OF CHANGES IN STOCKHOLDERS' EQUITY
(dollars in millions, except per share amounts)
|
|
Common Stock Issued
|
|
|
|
|
|||||||||||||||||
|
|
Shares
|
Amount
|
Additional
Paid-In
Capital
|
Retained
Earnings
|
Accumulated
Other
Comprehensive
Income
(Loss)
|
Total
|
||||||||||||||||
|
Balance, December 31, 2014
|
30,465,522
|
|
$
|
3.0
|
|
$
|
49.8
|
|
$
|
512.7
|
|
$
|
(76.5
|
)
|
$
|
489.0
|
|
|||||
|
Net income
|
—
|
|
$
|
—
|
|
$
|
—
|
|
89.7
|
|
$
|
—
|
|
89.7
|
|
|||||||
|
Other comprehensive loss, net of tax
|
—
|
|
—
|
|
—
|
|
—
|
|
(64.9
|
)
|
(64.9
|
)
|
||||||||||
|
Dividends declared ($1.54 per share)
|
—
|
|
—
|
|
—
|
|
(46.9
|
)
|
—
|
|
(46.9
|
)
|
||||||||||
|
Restricted stock issuances, net
|
68,264
|
|
—
|
|
—
|
|
—
|
|
—
|
|
—
|
|
||||||||||
|
Stock-based employee compensation expense
|
—
|
|
—
|
|
3.3
|
|
—
|
|
—
|
|
3.3
|
|
||||||||||
|
Excess tax benefits of stock-based employee compensation
|
—
|
|
—
|
|
0.5
|
|
—
|
|
—
|
|
0.5
|
|
||||||||||
|
Stock issued to directors as compensation
|
3,728
|
|
—
|
|
0.1
|
|
—
|
|
—
|
|
0.1
|
|
||||||||||
|
Purchases and cancellation of common stock
|
(63,365
|
)
|
—
|
|
—
|
|
(2.9
|
)
|
—
|
|
(2.9
|
)
|
||||||||||
|
Balance, December 31, 2015
|
30,474,149
|
|
$
|
3.0
|
|
$
|
53.7
|
|
$
|
552.6
|
|
$
|
(141.4
|
)
|
$
|
467.9
|
|
|||||
|
Net income
|
—
|
|
—
|
|
—
|
|
82.8
|
|
—
|
|
82.8
|
|
||||||||||
|
Other comprehensive income, net of tax
|
—
|
|
—
|
|
—
|
|
—
|
|
2.1
|
|
2.1
|
|
||||||||||
|
Dividends declared ($1.62 per share)
|
—
|
|
—
|
|
—
|
|
(49.4
|
)
|
—
|
|
(49.4
|
)
|
||||||||||
|
Restricted stock issuances, net
|
84,105
|
|
0.1
|
|
—
|
|
—
|
|
—
|
|
0.1
|
|
||||||||||
|
Stock-based employee compensation expense
|
—
|
|
—
|
|
5.5
|
|
—
|
|
—
|
|
5.5
|
|
||||||||||
|
Excess tax deficit of stock-based employee compensation
|
—
|
|
—
|
|
(0.2
|
)
|
—
|
|
—
|
|
(0.2
|
)
|
||||||||||
|
Stock issued to directors as compensation
|
6,585
|
|
—
|
|
0.2
|
|
—
|
|
—
|
|
0.2
|
|
||||||||||
|
Purchases and cancellation of common stock
|
(20,345
|
)
|
—
|
|
—
|
|
(0.7
|
)
|
—
|
|
(0.7
|
)
|
||||||||||
|
Balance, December 31, 2016
|
30,544,494
|
|
$
|
3.1
|
|
$
|
59.2
|
|
$
|
585.3
|
|
$
|
(139.3
|
)
|
$
|
508.3
|
|
|||||
|
Net income
|
—
|
|
—
|
|
—
|
|
34.5
|
|
—
|
|
34.5
|
|
||||||||||
|
Other comprehensive income, net of tax
|
—
|
|
—
|
|
—
|
|
—
|
|
49.9
|
|
49.9
|
|
||||||||||
|
Dividends declared ($1.69 per share)
|
—
|
|
—
|
|
—
|
|
(51.9
|
)
|
—
|
|
(51.9
|
)
|
||||||||||
|
Restricted stock issuances, net
|
186,867
|
|
—
|
|
—
|
|
—
|
|
—
|
|
—
|
|
||||||||||
|
Stock-based employee compensation expense
|
—
|
|
—
|
|
6.9
|
|
—
|
|
—
|
|
6.9
|
|
||||||||||
|
Stock issued to directors as compensation
|
5,798
|
|
—
|
|
0.2
|
|
—
|
|
—
|
|
0.2
|
|
||||||||||
|
Purchases and cancellation of common stock
|
(25,860
|
)
|
—
|
|
—
|
|
(1.2
|
)
|
—
|
|
(1.2
|
)
|
||||||||||
|
Balance, December 31, 2017
|
30,711,299
|
|
$
|
3.1
|
|
$
|
66.3
|
|
$
|
566.7
|
|
$
|
(89.4
|
)
|
$
|
546.7
|
|
|||||
The accompanying notes are an integral part of these consolidated financial statements.
66
SCHWEITZER-MAUDUIT INTERNATIONAL, INC. AND SUBSIDIARIES
(dollars in millions)
|
For the Years Ended December 31,
|
|||||||||||
|
2017
|
2016
|
2015
|
|||||||||
|
Operations
|
|
|
|||||||||
|
Net income
|
$
|
34.5
|
|
$
|
82.8
|
|
$
|
89.7
|
|
||
|
Less: Gain (loss) from discontinued operations
|
0.1
|
|
—
|
|
(0.8
|
)
|
|||||
|
Income from continuing operations
|
34.4
|
|
82.8
|
|
90.5
|
|
|||||
|
Non-cash items included in net income:
|
|
|
|||||||||
|
Depreciation and amortization
|
59.5
|
|
44.5
|
|
41.0
|
|
|||||
|
Impairment
|
4.6
|
|
21.3
|
|
6.7
|
|
|||||
|
Deferred income tax provision (benefit)
|
1.6
|
|
(13.5
|
)
|
(6.7
|
)
|
|||||
|
Pension and other postretirement benefits
|
3.8
|
|
3.8
|
|
4.2
|
|
|||||
|
Stock-based compensation
|
7.1
|
|
5.8
|
|
3.5
|
|
|||||
|
Income from equity affiliates
|
(2.5
|
)
|
(4.8
|
)
|
(6.6
|
)
|
|||||
|
Gain on sale of intangible assets
|
—
|
|
(1.8
|
)
|
(4.3
|
)
|
|||||
|
Gain on sale of assets
|
(4.9
|
)
|
—
|
|
—
|
|
|||||
|
Long-term income tax payable
|
36.7
|
|
—
|
|
—
|
|
|||||
|
Excess tax deficit (benefit) of stock-based awards
|
—
|
|
0.2
|
|
(0.5
|
)
|
|||||
|
Cash dividends received from equity affiliates
|
1.8
|
|
3.0
|
|
3.9
|
|
|||||
|
Other items
|
0.7
|
|
(0.6
|
)
|
0.1
|
|
|||||
|
Changes in operating working capital:
|
|||||||||||
|
Accounts receivable
|
(0.9
|
)
|
3.1
|
|
(18.0
|
)
|
|||||
|
Inventories
|
(6.4
|
)
|
(6.9
|
)
|
1.3
|
|
|||||
|
Prepaid expenses
|
0.8
|
|
(0.5
|
)
|
1.1
|
|
|||||
|
Accounts payable
|
4.7
|
|
(3.7
|
)
|
6.5
|
|
|||||
|
Accrued expenses
|
(3.0
|
)
|
0.8
|
|
3.7
|
|
|||||
|
Accrued income taxes
|
(7.1
|
)
|
(3.8
|
)
|
18.2
|
|
|||||
|
Net changes in operating working capital
|
(11.9
|
)
|
(11.0
|
)
|
12.8
|
|
|||||
|
Net cash provided by operating activities of:
|
|
|
|
||||||||
|
- Continuing operations
|
130.9
|
|
129.7
|
|
144.6
|
|
|||||
|
- Discontinued operations
|
0.1
|
|
—
|
|
0.1
|
|
|||||
|
Cash provided by operations
|
131.0
|
|
129.7
|
|
144.7
|
|
|||||
|
Investing
|
|
|
|||||||||
|
Capital spending
|
(37.2
|
)
|
(27.8
|
)
|
(24.2
|
)
|
|||||
|
Capitalized software costs
|
(3.5
|
)
|
(2.8
|
)
|
(0.9
|
)
|
|||||
|
Acquisitions, net of cash acquired
|
(291.7
|
)
|
—
|
|
(280.6
|
)
|
|||||
|
Proceeds from sale of assets
|
7.0
|
|
—
|
|
—
|
|
|||||
|
Other investing
|
6.9
|
|
8.2
|
|
(8.0
|
)
|
|||||
|
Cash used for investing
|
(318.5
|
)
|
(22.4
|
)
|
(313.7
|
)
|
|||||
|
Financing
|
|
|
|||||||||
|
Cash dividends paid to SWM stockholders
|
(51.9
|
)
|
(49.4
|
)
|
(46.9
|
)
|
|||||
|
Changes in short-term debt
|
1.5
|
|
—
|
|
(0.4
|
)
|
|||||
|
Proceeds from issuances of long-term debt
|
440.5
|
|
35.6
|
|
488.2
|
|
|||||
|
Payments on long-term debt
|
(208.8
|
)
|
(171.0
|
)
|
(338.7
|
)
|
|||||
|
Payments for debt issuance costs
|
(0.6
|
)
|
—
|
|
(7.4
|
)
|
|||||
|
Purchases of common stock
|
(1.2
|
)
|
(0.7
|
)
|
(2.9
|
)
|
|||||
|
Excess tax (deficit) benefit of stock-based awards
|
—
|
|
(0.2
|
)
|
0.5
|
|
|||||
|
Cash provided by (used in) financing
|
179.5
|
|
(185.7
|
)
|
92.4
|
|
|||||
|
Effect of exchange rate changes on cash and cash equivalents
|
7.5
|
|
(0.7
|
)
|
(27.2
|
)
|
|||||
|
Decrease in cash and cash equivalents
|
(0.5
|
)
|
(79.1
|
)
|
(103.8
|
)
|
|||||
|
Cash and cash equivalents at beginning of period
|
107.4
|
|
186.5
|
|
290.3
|
|
|||||
|
Cash and cash equivalents at end of period
|
$
|
106.9
|
|
$
|
107.4
|
|
$
|
186.5
|
|
||
The accompanying notes are an integral part of these consolidated financial statements.
67
SCHWEITZER-MAUDUIT INTERNATIONAL, INC. AND SUBSIDIARIES
NOTES TO CONSOLIDATED FINANCIAL STATEMENTS
Note
1
. General
Nature of Business
Schweitzer-Mauduit International, Inc., or SWM or the Company, headquartered in the United States of America, is a multinational diversified producer of highly engineered solutions and advanced materials for a variety of industries. The Company maintains
two
operating product line segments: Advanced Materials and Structures and Engineered Papers.
The Advanced Materials & Structures segment, or AMS, produces mostly resin-based rolled goods such as nets, films and meltblown materials, typically through an extrusion process or other non-woven technologies. These products are used in a variety of specialty applications across the filtration, construction and infrastructure, transportation, industrial and medical end-markets. As discussed more fully in Note
3
. Business Acquisitions, in January 2017, the Company completed the acquisition of Conwed Plastics LLC, a Delaware limited liability company, and its Belgian subsidiary ("Conwed NV" and collectively with Conwed Plastic LLC, “Conwed”), which has been integrated into the AMS segment.
The Engineered Papers segment, or EP, primarily serves the tobacco industry with production of various cigarette papers and reconstituted tobacco products, or "recon". Traditional reconstituted tobacco leaf, or "RTL", is used as a blend with virgin tobacco in cigarettes and used as wrappers and binders for cigars. Recon, as well as LIP (low ignition propensity) cigarette paper, a specialty product with fire-safety features, are two key profit drivers, which together account for more than half of segment net sales. The EP segment also produces non-tobacco papers for both premium applications, such as energy storage, and industrial commodity paper grades, which are often produced to maximize machine utilization.
We conduct business in over
90
countries and operate
23
production locations worldwide, with facilities in the U.S., Canada, United Kingdom, France, Luxembourg, Belgium, Russia, Brazil, China and Poland. We also have a
50%
equity interest in
two
joint ventures in China. The first, China Tobacco Mauduit (Jiangmen) Paper Industry Ltd., or CTM, produces cigarette and porous plug wrap papers and the second, China Tobacco Schweitzer (Yunnan) Reconstituted Tobacco Co. Ltd., or CTS, produces RTL.
As used in this
2017
Annual Report on Form 10-K, unless the context indicates otherwise, references to "we," "us," "our," "SWM," "Schweitzer-Mauduit" or similar terms include Schweitzer-Mauduit International, Inc. and its consolidated subsidiaries.
Note
2
. Summary of Significant Accounting Policies
Basis of Presentation
The accompanying consolidated financial statements and the notes thereto have been prepared in accordance with accounting principles generally accepted in the United States of America, or U.S. GAAP. The preparation of financial statements in conformity with U.S. GAAP requires the Company to make estimates and assumptions that affect the reported amounts of assets and liabilities, disclosure of contingent assets and liabilities at the date of the financial statements, and the reported amounts of revenue and expenses during the reporting periods. The Company believes the estimates and assumptions used in the preparation of these consolidated financial statements are reasonable, based upon currently available facts and known circumstances. Actual results may differ from those estimates and assumptions as a result of a number of factors, including those discussed elsewhere in this report and in its other public filings from time to time.
68
SCHWEITZER-MAUDUIT INTERNATIONAL, INC. AND SUBSIDIARIES
NOTES TO CONSOLIDATED FINANCIAL STATEMENTS
Principles of Consolidation
The consolidated financial statements include the accounts of the Company and wholly-owned, majority-owned and controlled subsidiaries. Intercompany balances and transactions have been eliminated. Certain reclassifications of prior year data were made in the notes to consolidated financial statements. The reclassifications were made to conform to the current year presentation.
The Company uses the equity method to account for its investments in
two
joint ventures with the China National Tobacco Corporation (see Note
8
. Joint Ventures). Investment in equity affiliates represents the Company’s investment in these joint ventures. The Company’s
50%
share of the net income (loss) of the joint ventures is included in the consolidated statements of income as income (loss) from equity affiliates.
Revenue Recognition
The Company recognizes revenue and the related accounts receivable when the following four criteria are met: (1) persuasive evidence of an arrangement exists; (2) ownership has transferred to the customer; (3) the selling price is fixed or determinable; and (4) collection is reasonably assured based on the Company's judgment regarding the collectability of its accounts receivable. Generally, the Company recognizes revenue when it ships its manufactured product and title and risk of loss passes to its customer in accordance with the terms of sale of the product. Revenue is recorded at the time of shipment for terms designated free on board, shipping point, or equivalent. For sales transactions designated free on board, destination, or equivalent, revenue is recorded when the product is delivered to the customer's delivery site, at which time title and risk of loss are transferred. Provisions for discounts, returns, allowances, customer rebates and other adjustments are provided for in the same period the related revenue is recorded. Deferred revenue represents advance payments from customers which are earned based upon a mutually agreed-upon amount per unit of future product sales.
Freight Costs
The cost of delivering finished goods to the Company's customers is recorded as a component of cost of products sold. Those costs include the amounts paid to a third party to deliver the finished goods. Any freight costs billed to and paid by a customer are included in revenue.
Royalty Income
Royalties from third-party patent licenses are recognized when earned, including monies received at an agreement's initiation attributable to past sales. The Company recognizes up-front payments upon receipt when it has no future performance requirement or ongoing obligation arising from its agreements and the payment is for a separate earnings process. Minimum annual royalties received in advance are deferred and are recognized in the period earned. The Company recognized
$3.9 million
,
$8.3 million
and
$9.6 million
of royalty income during
2017
,
2016
and
2015
respectively, which is included in net sales in the Consolidated Statements of Income.
Foreign Currency Translation
The income statements of foreign entities are translated into U.S. dollars at average exchange rates prevailing during the periods presented. The balance sheets of these entities are translated at period-end exchange rates, and the differences from historical exchange rates are reflected in a separate component of accumulated other comprehensive income (loss) as unrealized foreign currency translation adjustments.
Foreign currency risks arise from transactions and balances denominated in non-local currencies. Gains and losses resulting from re-measurement and settlement of such transactions and balances, included in other income (expense), net, were a loss of
$3.5 million
, a loss of
$0.2 million
and a gain of
$0.8 million
in
2017
,
2016
and
2015
, respectively.
69
SCHWEITZER-MAUDUIT INTERNATIONAL, INC. AND SUBSIDIARIES
NOTES TO CONSOLIDATED FINANCIAL STATEMENTS
Derivative Instruments
The Company is exposed to changes in foreign currency exchange rates, interest rates and commodity prices. The Company utilizes a variety of practices to manage these market risks, including where considered appropriate, derivative instruments. The Company uses derivative instruments only for risk management purposes and not for trading or speculation. All derivative instruments the Company uses are either exchange traded or are entered into with major financial institutions in order to reduce credit risk and risk of nonperformance by third parties. The Company believes the credit risks with respect to the counterparties, and the foreign currency risks that would not be hedged if the counterparties fail to fulfill their obligations under the contracts, are not material in view of its understanding of the financial strength of the counterparties.
Gains and losses on instruments that hedge firm commitments are deferred and included in the basis of the underlying hedged items. All other hedging gains and losses are included in period income or expense based on the period-end market price of the instrument and are included in the Company's operating cash flows. See Note
14
. Derivatives, for additional information.
Cash and Cash Equivalents
The Company considers all highly liquid, unrestricted investments with remaining maturities of three months or less to be cash equivalents, including money market funds with no restrictions on withdrawals.
Business Combinations
The Company uses the acquisition method of accounting for business combinations. At the acquisition date, the Company records assets acquired and liabilities assumed at their respective fair market values. The Company estimates fair value using the exit price approach which is the price that would be received to sell an asset or paid to transfer a liability in an orderly market. An exit price is determined from a market participant's viewpoint in the principal or most advantageous market and may result in the Company valuing assets or liabilities at a fair value that is not reflective of the Company's intended use of the assets or liabilities. Any excess consideration above the estimated fair values of the net assets acquired is recognized as goodwill on the Company's Consolidated Balance Sheets. The operating results of acquired businesses are included in the Company's results of operations beginning as of their effective acquisition dates. Acquisition costs are expensed as incurred and were
$0.2 million
,
$1.8 million
, and
$2.6 million
in
2017
,
2016
and
2015
, respectively.
Impairment of Long-Lived Assets, Goodwill and Intangible Assets
The Company evaluates the carrying value of long-lived assets, including property and equipment, goodwill and intangible assets when events and circumstances warrant a review. Goodwill is also tested for impairment annually during the fourth quarter. Goodwill may be evaluated using a qualitative evaluation and/or a two-step test at the reporting unit level. The first step compares the book value of the reporting unit to its fair value. If the book value of a reporting unit exceeds its fair value, the Company performs the second step. In the second step, the Company determines an implied fair value of the reporting unit's goodwill by allocating the fair value of the reporting unit to all of the assets and liabilities other than goodwill. The difference between the total fair value of the reporting unit and the fair value of all the assets and liabilities other than goodwill is the implied fair value of that goodwill. Any impairment loss is measured as the excess of the book value of the goodwill over the implied fair value of that goodwill. See Note
9
. Goodwill for further discussion of the Company's annual impairment test results. During the annual testing in the fourth quarter of
2017
, the estimated fair value of each of the Company's reporting units was in excess of its respective carrying value.
We have acquired trade names that have been determined to have indefinite lives. We evaluate a number of factors to determine whether an indefinite life is appropriate, including the competitive environment, category share, business history, product life cycle and operating plans. Indefinite-lived intangibles are evaluated for impairment annually during the fourth quarter. Additionally, when certain events or changes in operating conditions occur, an impairment assessment is performed and indefinite-lived trade names may be adjusted to a determinable life or an impairment charge may be
70
SCHWEITZER-MAUDUIT INTERNATIONAL, INC. AND SUBSIDIARIES
NOTES TO CONSOLIDATED FINANCIAL STATEMENTS
recorded. In the fourth quarter of 2016, the Company made a strategic decision to transition away from certain legacy business trade names associated with our recent acquisitions in favor of a streamlined SWM branding approach. As a result, during the fourth quarter of 2016, the Company recognized an impairment loss related to the DelStar trade name, the financial impact of which is described in Note
10
. Intangible Assets.
The cost of intangible assets with determinable useful lives is amortized to reflect the pattern of economic benefits consumed, which approximates a straight-line basis, over the estimated periods benefited. When certain events or changes in operating conditions occur, an impairment assessment is performed and lives of intangible assets with determinable lives may be adjusted.
The carrying value of long-lived assets is reviewed to determine if events or circumstances have changed which may indicate that the assets may be impaired or the useful life may need to be changed. Upon occurrence of such a triggering event, the Company considers internal and external factors relating to each asset group, including expectation of future profitability, undiscounted cash flows and its plans with respect to the operations. If impairment is indicated, an impairment loss is measured by the amount the net carrying value of the asset exceeds its estimated fair value.
Environmental Spending
Environmental spending is capitalized if such spending qualifies as property, plant and equipment, substantially increases the economic value or extends the useful life of an asset. All other such spending is expensed as incurred, including fines and penalties incurred in connection with environmental violations. Environmental spending relating to an existing condition caused by past operations is expensed. Liabilities are accrued when environmental assessments are probable and the costs can be reasonably estimated. Generally, timing of these accruals coincides with completion of a feasibility study or commitment to a formal plan of action.
Capitalized Software Costs
The Company capitalizes certain purchases of software and software development costs in connection with major projects of software development for internal use. These costs are included in Other assets on the Consolidated Balance Sheets and are amortized using the straight-line method over the estimated useful life not to exceed
seven years
. Costs associated with business process redesign, end-user training, system start-up and ongoing software maintenance are expensed as incurred. Amortization of capitalized software was
$1.1 million
,
$1.0 million
and
$2.0 million
for the years ended December 31,
2017
,
2016
and
2015
, respectively. Accumulated amortization of capitalized software costs was
$35.4 million
and
$31.5 million
at December 31,
2017
and
2016
, respectively.
Business Tax Credits
Business tax credits represent value added tax credits receivable and similar assets, such as Imposto sobre Circulação de Mercadorias e Serviços, or ICMS, in Brazil. Business tax credits are generated when value-added taxes, or VAT, are paid on purchases. VAT and similar taxes are collected from customers on certain sales. In some jurisdictions, export sales do not require VAT collection. See Note
11
. Other Assets for additional information.
Income Taxes
The Company accounts for income taxes under the asset and liability method, which requires the recognition of deferred tax assets and liabilities for the expected future tax consequences of events that have been included in the financial statements. Under this method, deferred tax assets and liabilities are determined on the basis of the differences between the financial statement and tax bases of assets and liabilities by using enacted tax rates in effect for the year in which the differences are expected to reverse. The effect of a change in tax rates on deferred tax assets and liabilities is recognized in income in the period that includes the enactment date.
The Company recognizes deferred tax assets to the extent that it believes that these assets are more likely than not to be realized. In making such a determination, all available positive and negative evidence is considered, including future reversals of existing taxable temporary differences, projected future taxable income, tax-planning strategies, and results
71
SCHWEITZER-MAUDUIT INTERNATIONAL, INC. AND SUBSIDIARIES
NOTES TO CONSOLIDATED FINANCIAL STATEMENTS
of recent operations. If it is determined that the Company would be able to realize the deferred tax assets in the future in excess of their net recorded amount, an adjustment would be made to the deferred tax asset valuation allowance, which would reduce the provision for income taxes.
The Company records uncertain tax positions in accordance with ASC 740 on the basis of a two-step process in which (1) it is determined whether it is more likely than not that the tax positions will be sustained on the basis of the technical merits of the position and (2) for those tax positions that meet the more-likely-than-not recognition threshold, the Company recognizes the largest amount of tax benefit that is more than 50 percent likely to be realized upon ultimate settlement with the related tax authority.
On December 22, 2017, the 2017 Tax Cuts and Jobs Act (the “Tax Act”) was enacted into law and the new legislation contains several key tax provisions that affected SWM, which include, but are not limited to, a one-time mandatory transition tax on accumulated foreign earnings and a reduction of the corporate income tax rate from 35% to 21% effective January 1, 2018. The Company is required to recognize the effect of the tax law changes in the period of enactment, such as determining the transition tax, remeasuring U.S. deferred tax assets and liabilities as well as reassessing the net realizability of its deferred tax assets and liabilities. In December 2017, the SEC staff issued Staff Accounting Bulletin No. 118,
Income Tax Accounting Implications of the Tax Cuts and Jobs Act
(“SAB 118”), which allows the Company to record provisional amounts during a measurement period not to extend beyond one year of the enactment date. Since the Tax Act was passed late in the fourth quarter of 2017, and ongoing guidance and accounting interpretation is expected over the next 12 months, the Company considers the accounting of the transition tax, deferred tax re-measurements, and other items to be incomplete due to the forthcoming guidance and its ongoing analysis of final year-end data and tax positions. The Company expects to complete its analysis within the measurement period in accordance with SAB 118.
Pension and Other Postretirement Benefits Accounting
The Company recognizes the estimated compensation cost of employees' pension and other postretirement benefits over their approximate period of service. The Company's earnings are impacted by amounts of expense recorded related to these benefits, which primarily consist of U.S. and French pension benefits and U.S. other postretirement benefits, or OPEBs. Each year's recorded expenses are estimates based on actuarial calculations of the Company's accumulated and projected benefit obligations, or PBOs, for the Company's various plans.
Suspension of additional benefits for future service is considered a curtailment, and if material, necessitates a re-measurement of plan assets and PBO. As part of a re-measurement, the Company adjusts its discount rates and other actuarial assumptions, such as retirement, turnover and mortality table assumptions, as appropriate. See Note
17
. Postretirement and Other Benefits for additional information.
72
SCHWEITZER-MAUDUIT INTERNATIONAL, INC. AND SUBSIDIARIES
NOTES TO CONSOLIDATED FINANCIAL STATEMENTS
Comprehensive Income
Comprehensive income includes net income, as well as items charged and credited directly to stockholders' equity, which are excluded from net income. The Company has presented comprehensive income in the Consolidated Statements of Comprehensive Income. Reclassification adjustments of derivative instruments are presented in Net sales and Interest expense in the Consolidated Statements of Income. See Note
14
. Derivatives for additional information. Amortization of accumulated pension and other post-employment benefit (OPEB) liabilities are included in the computation of net periodic pension and OPEB costs, which are more fully discussed in Note
17
. Postretirement and Other Benefits.
Components of accumulated other comprehensive income (loss) were as follows ($ in millions):
|
December 31,
|
|||||||
|
2017
|
2016
|
||||||
|
Accumulated pension and OPEB liability adjustments, net of income tax benefit of $13.8 million and $17.6 million at December 31, 2017 and 2016, respectively
|
$
|
(24.9
|
)
|
$
|
(36.5
|
)
|
|
|
Accumulated unrealized loss on derivative instruments, net of income tax benefit of $0.2 million and $3.0 million at December 31, 2017 and 2016, respectively
|
0.4
|
|
(1.9
|
)
|
|||
|
Accumulated unrealized foreign currency translation adjustments, net of income tax benefit of $4.5 million and $0.0 million at December 31, 2017 and 2016, respectively
|
(64.9
|
)
|
(100.9
|
)
|
|||
|
Accumulated other comprehensive loss
|
$
|
(89.4
|
)
|
$
|
(139.3
|
)
|
|
Changes in the components of accumulated other comprehensive income (loss) were as follows ($ in millions):
|
For the Years Ended December 31,
|
|||||||||||||||||||||||||||||||||||
|
2017
|
2016
|
2015
|
|||||||||||||||||||||||||||||||||
|
Pre-tax
|
Tax
|
Net of
Tax
|
Pre-tax
|
Tax
|
Net of
Tax
|
Pre-tax
|
Tax
|
Net of
Tax
|
|||||||||||||||||||||||||||
|
Pension and OPEB liability adjustments
|
$
|
15.4
|
|
$
|
(3.8
|
)
|
$
|
11.6
|
|
$
|
3.4
|
|
$
|
(4.3
|
)
|
$
|
(0.9
|
)
|
$
|
1.9
|
|
$
|
0.9
|
|
$
|
2.8
|
|
||||||||
|
Derivative instrument adjustments
|
5.1
|
|
(2.8
|
)
|
2.3
|
|
23.0
|
|
(3.3
|
)
|
19.7
|
|
(13.6
|
)
|
0.3
|
|
(13.3
|
)
|
|||||||||||||||||
|
Unrealized foreign currency translation adjustments
|
31.5
|
|
4.5
|
|
36.0
|
|
(16.7
|
)
|
—
|
|
(16.7
|
)
|
(54.4
|
)
|
—
|
|
(54.4
|
)
|
|||||||||||||||||
|
Total
|
$
|
52.0
|
|
$
|
(2.1
|
)
|
$
|
49.9
|
|
$
|
9.7
|
|
$
|
(7.6
|
)
|
$
|
2.1
|
|
$
|
(66.1
|
)
|
$
|
1.2
|
|
$
|
(64.9
|
)
|
||||||||
Restricted Stock
All of the Company's restricted stock grants, including those that have been earned in the case of performance-based shares and cliff-vesting grants that are not performance based, vest upon completion of a specified period of time, typically between
two
and
four
years. The fair value of each award is equal to the share price of the Company's stock on the date of the grant. This cost is recognized over the vesting period of the respective award. The Company records forfeitures of shares related to continued service requirements as they occur. A summary of outstanding restricted stock awards as of December 31,
2017
and
2016
is included in Note
18
. Stockholders' Equity.
Restricted Stock Plan Performance Based Shares
The Company's long-term incentive compensation program, or LTICP, for key employees includes an equity-based award component that is provided through the Long-term Incentive Plan, or LTIP, which the Company adopted in 2015 and which replaced its previous Restricted Stock Plan, or RSP. The objectives under the LTICP are established at the beginning of a performance cycle and are intended to focus management on longer-term strategic goals. The
73
SCHWEITZER-MAUDUIT INTERNATIONAL, INC. AND SUBSIDIARIES
NOTES TO CONSOLIDATED FINANCIAL STATEMENTS
Compensation Committee of the Board of Directors designates participants in the LTICP and LTIP and determines the equity-based award opportunity in the form of restricted stock for each performance cycle, which is generally measured on the basis of a
one
year performance period (the measurement period). The restricted shares are considered issued and outstanding when the number of shares becomes fixed, after the annual performance is determined, and such awards vest at the end of the performance year or some predetermined period thereafter. The Company recognizes compensation expense with an offsetting credit to additional paid-in-capital over the performance period based on the fair value of the award at the date of grant, with compensation expense being adjusted cumulatively based on the number of shares expected to be earned according to the level of achievement of performance goals.
Fair Value Option
The Company has elected not to measure its financial instruments or certain commitments at fair value.
Recent Accounting Pronouncements
In May 2014, the Financial Accounting Standards Board, or FASB, issued Accounting Standards Update ("ASU") 2014-09, "Revenue from Contracts with Customers" (Topic 606). This guidance specifies how and when an entity will recognize revenue arising from contracts with customers and requires entities to disclose information about the nature, amount, timing and uncertainty of revenue and cash flows arising from contracts with customers. In August 2015, the FASB deferred the effective date for annual reporting periods beginning after December 15, 2017 (including interim reporting periods within those periods). The Company adopted this ASU effective January 1, 2018, utilizing the modified retrospective transition approach upon adoption. This approach requires an adjustment upon adoption to the financial statements to reflect the cumulative impact of the guidance and results in no change to prior period financial statements. Based on the evaluation of the provisions included in the new guidance, along with the related updates discussed below, the adoption of this guidance will not materially impact the amount or timing of revenues recognized in the consolidated financial statements or materially affect our financial position.
The Company has two main sources of revenue: product sales and materials conversion. The Company recognizes product sales revenues when control of a product is transferred to the customer. For the majority of product sales, transfer of control occurs when the products are shipped from one of the Company’s manufacturing facilities to the customer. The cost of delivering finished goods to the Company’s customers is recorded as a component of cost of products sold. Those costs include the amounts paid to a third party to deliver the finished goods. Any freight costs billed to and paid by a customer are included in net sales. The Company provides services to customers in conversion of customer-owned raw materials into processed finished goods. In these transactions, the Company generally recognizes revenue as processing occurs.
Revenue is recognized when obligations under the terms of a contract with a customer are satisfied, which generally occurs when control of the promised goods or services is transferred to the customer, in an amount that reflects the consideration the Company expects to be entitled to in exchange for those goods or services. Generally, the Company considers collectability of amounts due under a contract to be probable upon inception of a sale based on an evaluation of the credit worthiness of each customer. If collectability is not considered to be probable, the Company defers recognition of revenue on satisfied performance obligations until the uncertainty is resolved. Any variable consideration, such as discounts or price concessions, is set forth in the terms of the contract at inception, and is included in the assessment of the transaction price at the outset of the arrangement. The transaction price is allocated to the individual performance obligations due under the contract based on the relative stand-alone fair value of the performance obligations identified in the contract. The Company typically uses an observable price to determine the stand-alone selling price for separate performance obligations. Depending on the terms of an arrangement, the Company may defer the recognition of a portion of the consideration received or receivable, including amounts considered refundable, which is dependent on satisfaction of a future performance obligation.
Incidental items that are immaterial in the context of the contract are recognized as expense in the period incurred. The Company generally expenses sales commissions and other costs to obtain a contract when incurred because the amortization period would have been one year or less. These costs are recorded within sales and marketing expenses. The Company does not disclose the value of unsatisfied performance obligations for (i) contracts with an original
74
SCHWEITZER-MAUDUIT INTERNATIONAL, INC. AND SUBSIDIARIES
NOTES TO CONSOLIDATED FINANCIAL STATEMENTS
expected length of one year or less and (ii) contracts for which we recognize revenue at the amount to which we have the right to invoice for services performed. As a practical expedient, the Company treats shipping and handling activities that occur after control of the good transfers as fulfillment activities, and therefore, does not account for shipping and handling costs as a separate performance obligation.
In July 2015, the FASB issued ASU 2015-11, "Inventory (Topic 330): Simplifying the Measurement of Inventory." This update requires entities to measure inventory at the lower of cost and net realizable value. Net realizable value is the estimated selling prices in the ordinary course of business, less reasonably predictable costs of completion, disposal, and transportation. Subsequent measurement is unchanged for inventory measured using the Last-in, First-out or the retail inventory method. This guidance is effective for annual reporting periods beginning after December 15, 2016, and interim periods thereafter. The Company adopted this guidance as of January 1, 2017. Adoption of ASU 2015-11 did not have an impact on the consolidated financial statements.
In February 2016, the FASB issued ASU 2016-02, "Leases (Topic 842): Amendments to the FASB Accounting Standards Codification." The new standard establishes a right-of-use model that requires a lessee to record a right-of-use asset and a lease liability on the balance sheet for all leases with terms longer than twelve months. Leases will be classified as either finance or operating, with classification affecting the pattern of expense recognition in the income statement. This guidance is effective for annual reporting periods beginning after December 15, 2018, and interim periods thereafter. Early adoption is permitted. Companies must apply a modified retrospective transition approach for leases existing at, or entered into after, the beginning of the earliest comparative period presented in the financial statements. The modified retrospective approach would not require any transition accounting for leases that expired before the earliest comparative period presented. The Company is currently in the process of evaluating the impact of the pronouncement on the Company's outstanding leases and expects that adoption will have an impact on the consolidated balance sheets related to recording right-of-use assets and corresponding lease liabilities. Further, the Company is currently in the process of evaluating the impact of adoption on the consolidated statements of income.
In March 2016, the FASB issued ASU 2016-09, "Compensation - Stock Compensation (Topic 718): Improvements to Employee Share-Based Payment Accounting." This standard makes several modifications to existing guidance related to the accounting for forfeitures, employer tax withholding on share-based compensation and the financial statement presentation of excess tax benefits or deficiencies. ASU 2016-09 also clarifies the statement of cash flows presentation for certain components of share-based awards. This guidance is effective for annual reporting periods beginning after December 15, 2016, and interim periods thereafter. The Company adopted this guidance as of January 1, 2017. Adoption of ASU 2016-09 did not have an impact on the consolidated financial statements.
In March, April and May 2016, the FASB issued ASU 2016-08, “Revenue from Contracts with Customers: Principal versus Agent Considerations (Reporting Revenue Gross versus Net),” ASU 2016-10, “Revenue from Contracts with Customers: Identifying Performance Obligations and Licensing,” ASU 2016-11, "Revenue Recognition (Topic 605) and Derivatives and Hedging (Topic 815): Rescission of SEC Guidance Because of Accounting Standards Updates 2014-09 and 2014-16 Pursuant to Staff Announcements at the March 3, 2016 EITF Meeting," and ASU 2016-12, "Revenue from Contracts with Customers: Narrow-Scope Improvements and Practical Expedients," which provide supplemental adoption guidance and clarification to ASC 2014-09. ASU 2016-08, ASU 2016-10, ASU 2016-11 and ASU 2016-12 must be adopted concurrently with the adoption of ASU 2014-09. The Company is currently in the process of finalizing the financial statement disclosures required under ASU 2014-09 that will be incorporated in the Company's Form 10-Q for the first quarter of 2018 upon adoption of the guidance but does not expect that adoption of these updates will materially affect our financial position or materially impact the amount or timing of revenues recognized in the consolidated financial statements, as discussed above.
In October 2016, the FASB issued ASU 2016-16, "Income Taxes (Topic 718): Intra-Entity Transfers of Assets Other Than Inventory." This standard states that an entity should recognize the income tax consequences of an intra-entity transfer of an asset other than inventory when the transfer occurs, thus eliminating the exception for an intra-entity transfer of an asset other than inventory. This guidance is effective for annual reporting periods beginning after December 15, 2017, including interim reporting periods within those annual reporting periods. Early adoption is permitted. The Company will adopt this ASU effective January 1, 2018, utilizing the modified retrospective basis transition approach
75
SCHWEITZER-MAUDUIT INTERNATIONAL, INC. AND SUBSIDIARIES
NOTES TO CONSOLIDATED FINANCIAL STATEMENTS
upon adoption. The adoption of this guidance will result in a cumulative-effect adjustment directly to retained earnings of
$2.2 million
as of January 1, 2018.
In January 2017, the FASB issued ASU No. 2017-01, "Business Combinations (Topic 805): Clarifying the Definition of a Business." The guidance clarifies the definition of a business with the objective of assisting entities in evaluating whether transactions should be accounted for as acquisitions (or disposals) of assets or businesses. Acquisitions of integrated sets of assets and activities that do not meet the definition of a business are accounted for as asset acquisitions. The new update is effective for annual periods beginning after December 15, 2017. The amendments in ASU 2017-01 will be implemented on a prospective basis in the first quarter of 2018 and are not expected to have a material impact on the Company's financial statements.
In January 2017, the FASB issued ASU 2017-04, "Intangibles - Goodwill and Other (Topic 350): Simplifying the Test for Goodwill Impairment." The amendment eliminates the second step of the analysis that required the measurement of a goodwill impairment by comparing the implied value of a reporting unit’s goodwill and the goodwill’s carrying amount. This guidance is effective for annual or any interim goodwill impairment tests in fiscal years beginning after December 15, 2019. Early adoption is permitted. The Company is currently in the process of evaluating the impact of the pronouncement and does not expect the adoption of this guidance to have a material impact on the consolidated financial statements.
In March 2017, the FASB issued ASU 2017-07, "Compensation - Retirement Benefits (Topic 715): Improving the Presentation of Net Periodic Pension Cost and Net Periodic Postretirement Benefit Cost." The amendment requires an employer to report the service cost component in the same line item or line items as other compensation costs arising from services rendered by the pertinent employees during the period. The other components of net benefit cost are required to be presented in the income statement separately from the service cost component and outside a subtotal from operations. This guidance is effective for annual periods beginning after December 15, 2017. The Company will adopt this ASU effective January 1, 2018, utilizing the retrospective transition approach upon adoption. The adoption of this guidance will result in a reclassification of the components of net periodic pension cost, other than service cost, from Cost of products sold and General expense to Other income (expense), net, in the Consolidated Statements of Income. The reclassification of these costs effects only the EP segment, as there are no pension costs associated with the AMS segment. The adoption of this guidance will have no effect on Net income in the Consolidated Statements of Income and no effect on the other consolidated financial statements.
In May 2017, the FASB issued ASU 2017-09, "Compensation-Stock Compensation (Topic 718): Scope of Modification Accounting". This amendment clarifies the changes to terms or conditions of a share-based payment award that require an entity to apply modification accounting. ASU 2017-09 is effective for annual reporting periods, and interim periods therein, beginning after December 15, 2017. Early application is permitted and prospective application is required. The amendments in ASU 2017-09 will be implemented on a prospective basis in the first quarter of 2018 and are not expected to have a material impact on the Company's financial statements.
In August 2017, the FASB issued ASU 2017-12, "Derivatives and Hedging (Topic 815): Targeted Improvements to Accounting for Hedging Activities." This amendment better aligns an entity's risk management activities and financial reporting for hedging relationships through changes to both the designation and measurement guidance for qualifying hedging relationships and the presentation of hedge results. ASU 2017-12 is effective for annual reporting periods, and interim periods therein, beginning after December 15, 2018. Early application is permitted and should be applied to hedging relationships existing on the date of adoption. The effect of adoption should be reflected as of the beginning of the fiscal year of adoption. The Company is currently in the process of evaluating the impact of the pronouncement and does not expect the adoption of this guidance to have a material impact on the consolidated financial statements.
In February 2018, the FASB issued ASU 2018-02, "Income Statement - Reporting Comprehensive Income (Topic 220): Reclassification of Certain Tax Effects from Accumulated Other Comprehensive Income." In February 2018, this ASU was issued following the enactment of the Tax Cuts and Jobs Act (the "Tax Act") of 2017. This ASU allows an entity to elect a reclassification from accumulated other comprehensive income to retained earnings for stranded effects resulting from the Tax Act. ASU 2018-02 is effective for annual reporting periods, and interim periods therein, beginning after December 15, 2018. Early adoption is permitted and should be applied either in the period of adoption or
76
SCHWEITZER-MAUDUIT INTERNATIONAL, INC. AND SUBSIDIARIES
NOTES TO CONSOLIDATED FINANCIAL STATEMENTS
retrospectively to each period in which the effect of the change in the U.S. federal corporate income tax rate in the Tax Act is recognized. The Company is currently in the process of evaluating the impact of the pronouncement and does not expect the adoption of this guidance to have a material impact on the consolidated financial statements.
Note
3
. Business Acquisitions
On January 20, 2017, the Company completed the acquisition of Conwed pursuant to the Equity Interest Purchase Agreement, dated as of December 14, 2016, by and among the Company, Delstar Technologies, Inc., Baldwin Enterprises, Inc., Conwed and Leucadia National Corporation. As a result of the transaction, Conwed and its subsidiaries became wholly-owned indirect subsidiaries of the Company. The acquisition of Conwed expanded and continued the diversification of SWM's global presence in advanced materials and has been integrated into the Company's AMS segment.
The consideration transferred to acquire Conwed was
$295.0 million
in cash, subject to certain customary post-closing adjustments, plus three potential earn-out payments not to exceed
$40.0 million
in the aggregate, which payments are contingent upon the achievement of certain financial metrics in each of 2019, 2020 and 2021, in each case, upon the terms and subject to the conditions contained in the Purchase Agreement. The estimated fair value of the potential earn-out payments at the acquisition date was
$8.6 million
, for total consideration transferred of
$303.6 million
. The estimated fair value of the deferred contingent consideration was determined based on management's projections related to the achievement of certain financial metrics for the aforementioned years. The discount rate used to value the liability was based on specific business risk, cost of capital and other factors. The fair value of the contingent consideration was determined using significant unobservable inputs and is considered a Level 3 liability. There were no changes to the assumptions underlying the estimated fair value calculation during the year ended
December 31, 2017
. As of
December 31, 2017
, the balance of the contingent liability was
$9.5 million
, including
$0.9 million
in accretion year-to-date.
The purchase price for Conwed was funded from the Company’s borrowings under the First Amendment to Second Amended and Restated Credit Agreement, while the purchase price for Conwed NV was funded from cash on hand. See Note
13
. Debt, for additional information.
77
SCHWEITZER-MAUDUIT INTERNATIONAL, INC. AND SUBSIDIARIES
NOTES TO CONSOLIDATED FINANCIAL STATEMENTS
The consideration paid for Conwed and the final fair values of the assets acquired and liabilities assumed as of the January 20, 2017 acquisition date were as follows ($ in millions):
|
Fair Value as of January 20, 2017
|
|||
|
Cash and cash equivalents
|
$
|
3.3
|
|
|
Accounts receivable
|
15.4
|
|
|
|
Inventory
|
20.6
|
|
|
|
Other current assets
|
1.1
|
|
|
|
Property, plant and equipment
|
31.7
|
|
|
|
Identifiable intangible assets
|
134.4
|
|
|
|
Total assets
|
206.5
|
|
|
|
Accounts payable
|
8.2
|
|
|
|
Deferred tax liabilities
|
0.9
|
|
|
|
Net assets acquired
|
197.4
|
|
|
|
Goodwill
|
106.2
|
|
|
|
Total consideration
|
$
|
303.6
|
|
The Company used the income, market, or cost approach (or a combination thereof) for the valuation as appropriate, and used valuation inputs in these models and analyses that were based on market participant assumptions. Market participants are considered to be buyers and sellers in the principal or most advantageous market for the asset or liability. For certain items, the carrying amount was determined to be a reasonable approximation of fair value based on information available to SWM management. The fair value of receivables acquired from Conwed on January 20, 2017 was
$15.4 million
, with gross contractual amounts receivable of
$15.8 million
. Acquired inventories and property, plant and equipment were recorded at their fair values. Acquired intangible assets are primarily customer relationships, developed technology, trade names and non-competition agreements.
The fair value of the inventory acquired from Conwed on January 20, 2017 was
$20.6 million
, which included a step-up in basis of
$2.9 million
. Finished goods and work-in-process inventory was valued using the comparative sales method, which is a function of the estimated selling price less the sum of (a) any cost to complete, (b) costs of disposal, (c) holding costs and (d) a reasonable profit for allowance for the acquirer. Raw materials were valued using the replacement cost method of the cost approach.
Properties acquired included manufacturing and related facilities, land and leased sites that include leasehold improvements, and machinery and equipment for use in manufacturing operations. Management valued properties using the market and cost approaches, supported where available by observable market data which included consideration of obsolescence.
78
SCHWEITZER-MAUDUIT INTERNATIONAL, INC. AND SUBSIDIARIES
NOTES TO CONSOLIDATED FINANCIAL STATEMENTS
Intangible assets acquired included a number of customer relationships in the infrastructure, construction and industrial end-markets. In addition to these intangible assets, the Company acquired a number of patented and unpatented technologies, a number of business-to-business trade names and non-competition agreements. Management valued intangible assets using the relief from royalty, multi-period excess earnings and with-and-without methods, all forms of the income approach supported by observable market data for peer companies. The following table shows the fair values assigned to intangible assets ($ in millions):
|
Fair Value as of January 20, 2017
|
Weighted-Average Amortization Period (Years)
|
||||
|
Amortizable intangible assets:
|
|
|
|
||
|
Customer relationships
|
$
|
108.0
|
|
|
15.0
|
|
Developed technology
|
18.1
|
|
17.2
|
||
|
Non-competition agreements
|
1.2
|
|
|
7.2
|
|
|
Total amortizable intangible assets
|
127.3
|
|
|||
|
Indefinite-lived intangible assets:
|
|
|
|||
|
Trade names
|
7.1
|
|
|
Indefinite
|
|
|
Total
|
$
|
134.4
|
|
|
|
In connection with the acquisition, the Company recorded goodwill, which represents the excess of the consideration transferred over the fair value of tangible and intangible assets acquired, net of liabilities assumed. The goodwill is attributed primarily to Conwed's revenue growth and potential operational synergies from combining the SWM and Conwed businesses and workforces as well as the benefits of access to different markets and customers. Goodwill from the Conwed acquisition was assigned to the AMS reportable segment. The goodwill was determined on the basis of the fair values of the assets and liabilities identified as part of the transaction. The goodwill acquired in connection with Conwed and its domestic subsidiaries is expected to be deductible for tax purposes. The goodwill associated with Conwed NV is not expected to be deductible for tax purposes.
For the years ended December 31, 2017 and 2016, the Company recognized
$0.2 million
and
$1.4 million
, respectively, in direct and indirect acquisition-related costs. For the year ended December 31, 2017, the Company incurred
$0.6 million
in financing costs related to the acquisition. Direct and indirect acquisition-related costs were expensed as incurred and are included in the General expense line item in the consolidated statements of income. Financing costs related to expanding the Amended Credit Agreement (as defined below) have been capitalized and will be amortized in Interest expense over the life of the Amended Credit Agreement.
The amounts of Net sales and Income from continuing operations of Conwed included in the Company's consolidated income statement from the acquisition date are as follows ($ in millions):
|
Net Sales
|
Income from Continuing Operations
|
|||||||
|
January 21, 2017 - December 31, 2017
|
$
|
141.3
|
|
$
|
11.9
|
|
||
The amounts of the unaudited pro forma Net sales and Income from continuing operations of the combined entity had the acquisition date been January 1, 2016 are as follows ($ in millions):
|
Net Sales
|
Income from Continuing Operations
|
|||||||
|
2017 Supplemental Pro Forma from January 1, 2017 - December 31, 2017
|
$
|
989.8
|
|
$
|
31.1
|
|
||
|
2016 Supplemental Pro Forma from January 1, 2016 - December 31, 2016
|
984.1
|
|
90.6
|
|
||||
79
SCHWEITZER-MAUDUIT INTERNATIONAL, INC. AND SUBSIDIARIES
NOTES TO CONSOLIDATED FINANCIAL STATEMENTS
On October 28, 2015, the Company acquired Argotec Intermediate Holdings, LLC, or Argotec, through an Equity Interest Purchase Agreement entered into, by and among the Company, SWM Argotec, LLC, an indirect wholly-owned subsidiary of the Company, Argotec Intermediate Holdings Two LLC, and certain equity holders of Argotec Holdings LLC. The acquisition of Argotec expanded and diversified SWM's global presence in advanced materials and is now a part of the Company's AMS segment.
Total consideration paid by the Company was
$282.7 million
in cash, subject to certain customary post-closing adjustments, primarily for the adjusted value of working capital at the acquisition date. The acquisition was financed using borrowings under the Company's Amended Credit Agreement, see Note
13
. Debt, for additional information.
The consideration paid for Argotec and the fair values of the assets acquired and liabilities assumed as of the October 28, 2015 acquisition date were as follows ($ in millions):
|
Fair Value as of October 28, 2015
|
|||
|
Cash and cash equivalents
|
$
|
2.7
|
|
|
Accounts receivable
|
16.1
|
|
|
|
Inventory
|
16.3
|
|
|
|
Other current assets
|
0.1
|
|
|
|
Property, plant and equipment
|
15.9
|
|
|
|
Other noncurrent assets
|
0.9
|
|
|
|
Identifiable intangible assets
|
130.5
|
|
|
|
Total assets
|
182.5
|
|
|
|
Accounts payable
|
4.6
|
|
|
|
Accrued expenses
|
4.5
|
|
|
|
Net assets acquired
|
173.4
|
|
|
|
Goodwill
|
109.3
|
|
|
|
Cash paid
|
$
|
282.7
|
|
The Company used the income, market, or cost approach (or a combination thereof) for the valuation as appropriate, and used valuation inputs in these models and analyses that were based on market participant assumptions. Market participants are considered to be buyers and sellers in the principal or most advantageous market for the asset or liability. For certain items, the carrying amount was determined to be a reasonable approximation of fair value based on information available to SWM management. The fair value of receivables acquired from Argotec on October 28, 2015 was
$16.1 million
, with gross contractual amounts receivable of
$16.8 million
. Acquired inventories and property, plant and equipment were recorded at their fair values. Acquired intangible assets are primarily customer relationships, trade names and non-competition agreements.
Properties acquired included a manufacturing and related facility, land and leased sites that include leasehold improvements, and machinery and equipment for use in manufacturing operations. Management valued properties using the cost approach supported where available by observable market data which included consideration of obsolescence. One of the properties acquired, the Argotec-Stevens facility in Easthampton, Massachusetts with an estimated fair value of
$1.0 million
, was held for sale as of the acquisition date and during the fourth quarter of 2015 came under contract for sale to a third party. The sale of this property was completed in April 2016 and no gain or loss was recognized on the disposition.
80
SCHWEITZER-MAUDUIT INTERNATIONAL, INC. AND SUBSIDIARIES
NOTES TO CONSOLIDATED FINANCIAL STATEMENTS
Intangible assets acquired included trade names that are both business-to-business and business-to-consumer. In addition to these intangible assets, the Company acquired a number of customer relationships in the aeronautical, transportation, graphics, medical and industrial markets. Management valued intangible assets using the relief from royalty and multi-period excess earnings methods, both forms of the income approach supported by observable market data for peer companies. The following table shows the fair values assigned to intangible assets ($ in millions):
|
Fair Value as of October 28, 2015
|
Weighted-Average Amortization Period (Years)
|
||||
|
Amortizable intangible assets:
|
|
|
|
||
|
Customer relationships
|
$
|
115.9
|
|
|
15
|
|
Non-competition agreements
|
1.7
|
|
|
4
|
|
|
Indefinite-lived intangible assets:
|
|
|
|||
|
Trade names
|
12.9
|
|
|
Indefinite
|
|
|
Total
|
$
|
130.5
|
|
|
|
In connection with the acquisition, the Company recorded goodwill, which represents the excess of the consideration transferred over the fair value of tangible and intangible assets acquired, net of liabilities assumed. The goodwill is attributed primarily to Argotec's revenue growth from combining the SWM and Argotec business and workforce as well as the benefits of access to different markets and customers. Goodwill from the Argotec acquisition was assigned to the AMS reportable segment. The goodwill from this acquisition was determined on the basis of the preliminary fair values of the assets and liabilities identified as part of the transaction and is expected to be deductible for tax purposes.
In 2016 and 2015, the Company recognized
$0.4 million
and
$1.8 million
in direct and indirect acquisition-related costs. In 2015, the Company incurred
$7.4 million
in financing costs related to the acquisition. Direct and indirect acquisition-related costs were expensed as incurred and are included in the General Expense line item in the Consolidated Statements of Income. Financing costs related to expanding the Credit Agreement have been capitalized and will be amortized in Interest Expense over the life of the Credit Agreement.
The amounts of the acquisition's Net Sales and Income from Continuing Operations included in the Company's Consolidated Statements of Income for the year ended December 31, 2015, and the unaudited pro forma Net Sales and Income from Continuing Operations of the combined entity had the acquisition date been January 1, 2015 are as follows ($ in millions):
|
Net Sales
|
Income from Continuing Operations
|
|||||||
|
Actual from October 28, 2015 - December 31, 2015
|
$
|
22.3
|
|
$
|
0.9
|
|
||
|
2015 Supplemental Pro Forma from January 1, 2015 - December 31, 2015
|
859.7
|
|
90.2
|
|
||||
81
SCHWEITZER-MAUDUIT INTERNATIONAL, INC. AND SUBSIDIARIES
NOTES TO CONSOLIDATED FINANCIAL STATEMENTS
Note
4
. Discontinued Operations
The Company's former paper plant in San Pedro, Philippines has been reported as discontinued operations. This operation was previously presented as a component of the EP segment. For all periods presented, results of this plant have been removed from each individual line within the statements of income and the operating activities section of the statements of cash flow. In each case, a separate line has been added for the net results of discontinued operations.
Included in Other Assets and Accrued Expenses within the Consolidated Balance Sheets were the following major classes of assets and liabilities, respectively, associated with the discontinued operations ($ in millions):
|
December 31, 2017
|
December 31, 2016
|
||||||
|
Assets of discontinued operations:
|
|
|
|||||
|
Current assets
|
$
|
1.0
|
|
$
|
1.0
|
|
|
|
Other assets
|
2.4
|
|
2.5
|
|
|||
|
Liabilities of discontinued operations:
|
|
|
|
|
|||
|
Current liabilities
|
0.1
|
|
0.1
|
|
|||
Summary financial results of discontinued operations were as follows ($ in millions):
|
For the Years Ended December 31,
|
|||||||||||
|
|
2017
|
2016
|
2015
|
||||||||
|
Net sales
|
$
|
—
|
|
$
|
—
|
|
$
|
—
|
|
||
|
Other income (expense)
|
0.1
|
|
—
|
|
(0.7
|
)
|
|||||
|
Loss from discontinued operations before income taxes
|
0.1
|
|
—
|
|
(0.7
|
)
|
|||||
|
Income tax (provision) benefit
|
—
|
|
—
|
|
(0.1
|
)
|
|||||
|
Loss from discontinued operations
|
0.1
|
|
—
|
|
(0.8
|
)
|
|||||
Note
5
. Accounts Receivable
Accounts receivable are summarized as follows ($ in millions):
|
December 31,
|
|||||||
|
2017
|
2016
|
||||||
|
Trade receivables
|
$
|
120.2
|
|
$
|
98.2
|
|
|
|
Business tax credits, including VAT
|
4.3
|
|
3.1
|
|
|||
|
Hedge contracts receivable
|
4.8
|
|
1.0
|
|
|||
|
Other receivables
|
21.1
|
|
13.6
|
|
|||
|
Less allowance for doubtful accounts and sales discounts
|
(1.0
|
)
|
(0.8
|
)
|
|||
|
Total accounts receivable
|
$
|
149.4
|
|
$
|
115.1
|
|
|
82
SCHWEITZER-MAUDUIT INTERNATIONAL, INC. AND SUBSIDIARIES
NOTES TO CONSOLIDATED FINANCIAL STATEMENTS
Note
6
. Inventories
Inventories are valued at the lower of cost (using the First-In, First-Out and weighted average methods) or market. The Company's costs included in inventory primarily include resins, pulp, chemicals, direct labor, utilities, maintenance, depreciation, finishing supplies and an allocation of certain overhead costs. Machine start-up costs or abnormal machine shut downs are expensed in the period incurred and are not reflected in inventory. The definition of market value, with respect to all inventories, is net realizable value. The Company reviews inventories at least quarterly to determine the necessity of write-offs for excess, obsolete or unsalable inventory. The Company estimates write-offs for inventory obsolescence and shrinkage based on its judgment of future realization. These reviews require the Company to assess customer and market demand. The following schedule details inventories by major class ($ in millions):
|
December 31,
|
|||||||
|
2017
|
2016
|
||||||
|
Raw materials
|
$
|
50.4
|
|
$
|
40.9
|
|
|
|
Work in process
|
21.3
|
|
23.9
|
|
|||
|
Finished goods
|
74.2
|
|
44.9
|
|
|||
|
Supplies and other
|
9.3
|
|
9.7
|
|
|||
|
Total
|
$
|
155.2
|
|
$
|
119.4
|
|
|
Note
7
. Property, Plant and Equipment
Property, plant and equipment are stated at cost, less accumulated depreciation. Interest is capitalized as a component of the cost of construction for large projects. Expenditures for betterments are capitalized whereas normal repairs and maintenance are expensed as incurred. Property, other than land, is depreciated on a straight-line basis for financial reporting purposes. When property is sold or retired, the cost of the property and the related accumulated depreciation are removed from the balance sheet, and any gain or loss on the transaction is normally included in cost of products sold.
Property, plant and equipment (and related depreciable lives) consisted of the following ($ in millions):
|
December 31,
|
|||||||
|
2017
|
2016
|
||||||
|
Land and improvements
|
$
|
15.3
|
|
$
|
11.2
|
|
|
|
Buildings and improvements (20 to 40 years or remaining life of relevant lease)
|
145.1
|
|
118.5
|
|
|||
|
Machinery and equipment (5 to 20 years)
|
621.9
|
|
526.1
|
|
|||
|
Construction in progress
|
28.1
|
|
28.3
|
|
|||
|
Gross property, plant and equipment
|
810.4
|
|
684.1
|
|
|||
|
Less: Accumulated depreciation
|
448.5
|
|
376.7
|
|
|||
|
Property, plant and equipment, net
|
$
|
361.9
|
|
$
|
307.4
|
|
|
Depreciation expense was
$35.7 million
,
$29.4 million
and
$30.7 million
for the years ended December 31,
2017
,
2016
, and
2015
, respectively. During 2015, the physical assets of our RTL facility in the Philippines were reclassified from Property, plant and equipment, net to Assets held for sale on our Consolidated Balance Sheets. At December 31,
2017
, the net realizable value of these assets was
$12.8 million
.
83
SCHWEITZER-MAUDUIT INTERNATIONAL, INC. AND SUBSIDIARIES
NOTES TO CONSOLIDATED FINANCIAL STATEMENTS
Note
8
. Joint Ventures
The Company has
two
joint ventures with China National Tobacco Corporation, or CNTC. CNTC is the principal operating Company under China’s State Tobacco Monopoly Administration. CNTC and the Company’s subsidiary, Schweitzer-Mauduit International China, Limited, or SM-China, each own
50%
of each of the joint ventures. The paper joint venture China Tobacco Mauduit (Jiangmen) Paper Industry Co. LTD, or CTM, produces tobacco-related papers in China. The second joint venture China Tobacco Schweitzer (Yunnan) Reconstituted Tobacco Co. LTD, or CTS, produces reconstituted tobacco leaf products. The joint ventures pay to each the Company and CNTC sales-based royalties and management fees, of which SWM recognized
$2.1 million
,
$2.0 million
and
$2.9 million
in
2017
,
2016
and
2015
, respectively, in other income, net in the consolidated statements of income.
The Company uses the equity method to account for its ownership interest in both joint ventures. At
December 31, 2017
and
2016
, the Company’s equity investment in joint ventures was
$68.5 million
and
$63.8 million
, respectively. The Company’s share of the net income (loss) was included in income (loss) from equity affiliates within the consolidated statements of income. Below is summarized balance sheet information as of
December 31, 2017
and
2016
, and statement of operations information of the China joint ventures for the years ended
December 31, 2017
,
2016
and
2015
($ in millions):
|
December 31,
|
|||||||
|
2017
|
2016
|
||||||
|
Current assets
|
$
|
112.4
|
|
$
|
118.6
|
|
|
|
Noncurrent assets
|
205.3
|
|
201.7
|
|
|||
|
Current liabilities
|
64.8
|
|
69.6
|
|
|||
|
Long-term liabilities
|
114.7
|
|
122.0
|
|
|||
|
Stockholder's equity
|
138.2
|
|
128.7
|
|
|||
Summary financial results of joint ventures were as follows ($ in millions):
|
For the Years Ended December 31,
|
|||||||||||
|
|
2017
|
2016
|
2015
|
||||||||
|
Net sales
|
$
|
105.0
|
|
$
|
107.5
|
|
$
|
122.0
|
|
||
|
Gross profit
|
28.8
|
|
36.5
|
|
42.7
|
|
|||||
|
Net income
|
4.9
|
|
9.5
|
|
13.2
|
|
|||||
84
SCHWEITZER-MAUDUIT INTERNATIONAL, INC. AND SUBSIDIARIES
NOTES TO CONSOLIDATED FINANCIAL STATEMENTS
Note
9
. Goodwill
The Company evaluates goodwill for impairment at least annually during the fourth quarter. The annual tests during the fourth quarters of
2017
,
2016
and
2015
resulted in no impairment. Each of the Company's
two
reportable segments, AMS and EP, have goodwill. There are
no
accumulated impairment losses in the AMS segment as of December 31,
2017
. The EP segment has recorded
$2.7 million
in accumulated impairment losses in previous years.
The changes in the carrying amount of goodwill for each reportable segment were as follows ($ in millions):
|
|
Advanced Materials & Structures
|
Engineered Papers
|
Total
|
||||||||
|
Goodwill as of December 31, 2015
|
$
|
228.5
|
|
$
|
4.8
|
|
$
|
233.3
|
|
||
|
Goodwill adjusted during the year
|
(0.2
|
)
|
—
|
|
(0.2
|
)
|
|||||
|
Foreign currency translation adjustments
|
(3.5
|
)
|
(0.1
|
)
|
(3.6
|
)
|
|||||
|
Goodwill as of December 31, 2016
|
$
|
224.8
|
|
$
|
4.7
|
|
$
|
229.5
|
|
||
|
Goodwill acquired during the year
|
106.2
|
|
—
|
|
106.2
|
|
|||||
|
Foreign currency translation adjustments
|
5.1
|
|
0.5
|
|
5.6
|
|
|||||
|
Goodwill as of December 31, 2017
|
$
|
336.1
|
|
$
|
5.2
|
|
$
|
341.3
|
|
||
Note
10
. Intangible Assets
The gross carrying amount and accumulated amortization for intangible assets consisted of the following ($ in millions):
|
|
December 31, 2017
|
||||||||||||||||||
|
|
Gross
Carrying
Amount
|
Accumulated
Amortization
|
Accumulated Impairments
|
Accumulated Foreign Exchange
|
Net
Carrying
Amount
|
||||||||||||||
|
Amortized Intangible Assets
|
|||||||||||||||||||
|
Advanced Materials & Structures
|
|||||||||||||||||||
|
Customer relationships
|
$
|
276.3
|
|
$
|
32.9
|
|
$
|
—
|
|
$
|
(2.3
|
)
|
$
|
245.7
|
|
||||
|
Developed technology
|
34.0
|
|
6.0
|
|
—
|
|
(0.1
|
)
|
28.1
|
|
|||||||||
|
Customer contracts
|
0.9
|
|
0.9
|
|
—
|
|
—
|
|
—
|
|
|||||||||
|
Trade names
|
21.8
|
|
0.8
|
|
20.7
|
|
0.3
|
|
—
|
|
|||||||||
|
Non-compete agreements
|
2.9
|
|
1.1
|
|
—
|
|
—
|
|
1.8
|
|
|||||||||
|
Patents
|
1.5
|
|
0.3
|
|
—
|
|
—
|
|
1.2
|
|
|||||||||
|
Total
|
$
|
337.4
|
|
$
|
42.0
|
|
$
|
20.7
|
|
$
|
(2.1
|
)
|
$
|
276.8
|
|
||||
|
Unamortized Intangible Assets (Advanced Materials & Structures)
|
|||||||||||||||||||
|
Trade names
|
$
|
20.0
|
|
$
|
—
|
|
$
|
—
|
|
$
|
(0.4
|
)
|
$
|
20.4
|
|
||||
85
SCHWEITZER-MAUDUIT INTERNATIONAL, INC. AND SUBSIDIARIES
NOTES TO CONSOLIDATED FINANCIAL STATEMENTS
|
|
December 31, 2016
|
||||||||||||||||||
|
|
Gross
Carrying
Amount
|
Accumulated
Amortization
|
Accumulated Impairments
|
Accumulated Foreign Exchange
|
Net
Carrying
Amount
|
||||||||||||||
|
Amortized Intangible Assets
|
|||||||||||||||||||
|
Advanced Materials & Structures
|
|||||||||||||||||||
|
Customer relationships
|
$
|
168.3
|
|
$
|
15.9
|
|
$
|
—
|
|
$
|
3.1
|
|
$
|
149.3
|
|
||||
|
Developed technology
|
15.9
|
|
3.6
|
|
—
|
|
0.4
|
|
11.9
|
|
|||||||||
|
Customer contracts
|
0.9
|
|
0.9
|
|
—
|
|
—
|
|
—
|
|
|||||||||
|
Trade names
|
21.8
|
|
—
|
|
20.7
|
|
0.3
|
|
0.8
|
|
|||||||||
|
Non-compete agreements
|
1.7
|
|
0.5
|
|
—
|
|
—
|
|
1.2
|
|
|||||||||
|
Patents
|
1.5
|
|
0.2
|
|
—
|
|
—
|
|
1.3
|
|
|||||||||
|
Engineered Papers
|
|||||||||||||||||||
|
Customer-related intangibles
|
10.0
|
|
10.0
|
|
—
|
|
—
|
|
—
|
|
|||||||||
|
Total
|
$
|
220.1
|
|
$
|
31.1
|
|
$
|
20.7
|
|
$
|
3.8
|
|
$
|
164.5
|
|
||||
|
Unamortized Intangible Assets (Advanced Materials & Structures)
|
|||||||||||||||||||
|
Trade names
|
$
|
12.9
|
|
$
|
—
|
|
$
|
—
|
|
$
|
(0.1
|
)
|
$
|
13.0
|
|
||||
Amortization expense of intangible assets was
$20.9 million
,
$12.3 million
and
$5.6 million
for the years ended
December 31, 2017
,
2016
and
2015
, respectively. Incremental amortization expense of intangible assets for the Conwed acquisition was
$8.2 million
for the year ended
December 31, 2017
. Finite-lived intangibles in the AMS segment are expensed using the straight-line amortization method.
In our AMS segment, the Company made a strategic decision to transition away from certain legacy business trade names associated with its recent acquisitions in favor of a streamlined SWM branding approach. As a result of adopting this branding strategy, in the fourth quarter of 2016, the Company recognized an impairment expense of
$20.7 million
, representing a write-down of the DelStar trade name intangible asset to its fair market value, leaving a remaining balance of
$0.8 million
, which was fully amortized over the first six months of 2017, as the DelStar trade name is phased out. The carrying value of the DelStar trade name has been reclassified from Unamortized Intangible Assets to Amortized Intangible assets in the table above as of December 31, 2016.
The following table shows the estimated aggregate amortization expense for the next five years ($ in millions):
|
For the year ended December 31,
|
Estimated Amortization Expense
|
||
|
2018
|
$
|
20.7
|
|
|
2019
|
20.6
|
|
|
|
2020
|
20.3
|
|
|
|
2021
|
20.3
|
|
|
|
2022
|
20.2
|
|
|
86
SCHWEITZER-MAUDUIT INTERNATIONAL, INC. AND SUBSIDIARIES
NOTES TO CONSOLIDATED FINANCIAL STATEMENTS
Note
11
. Other Assets
Other assets consisted of the following ($ in millions):
|
December 31,
|
|||||||
|
2017
|
2016
|
||||||
|
Capitalized software costs, net of accumulated amortization
|
$
|
7.4
|
|
$
|
4.4
|
|
|
|
Business tax credits, including VAT and ICMS (net of $10.6 million and $11.5 million reserve as of December 31, 2017 and 2016, respectively)
|
2.4
|
|
2.5
|
|
|||
|
Grantor trust assets
|
12.2
|
|
10.3
|
|
|||
|
Net pension assets
|
4.6
|
|
—
|
|
|||
|
Long-term supplies inventory
|
7.0
|
|
6.0
|
|
|||
|
Other assets
|
5.9
|
|
4.3
|
|
|||
|
Total
|
$
|
39.5
|
|
$
|
27.5
|
|
|
The Company's ICMS credits in Brazil are fully reserved. These credits do not expire. The Company is still exploring other actions to utilize the credits. Charges and credits associated with normal ongoing activity are included in Cost of Products Sold in the Consolidated Statements of Income. Future material changes as a result of new legislation or a change in our operations will be reported separately.
Grantor trust assets consist primarily of cash surrender values in Company-owned life insurance policies held by a trust to be used for the eventual payment of employee deferred compensation. These assets are restricted from Company use until all obligations are satisfied.
Note
12
. Restructuring and Impairment Activities
The Company incurred restructuring and impairment expenses of
$8.1 million
,
$25.6 million
and
$14.6 million
in the years ended
December 31, 2017
,
2016
and
2015
, respectively.
The Company incurred
$2.7 million
,
$21.3 million
and reversed
$0.2 million
in restructuring and impairment expenses during the years ended
December 31, 2017
,
2016
and
2015
, respectively, within the AMS segment. Restructuring and impairment expense for the year ended
December 31, 2017
consisted of
$2.6 million
in severance accruals for employees at our U.S. and Belgium manufacturing operations, as well as
$0.1 million
in impairment charges at one of our U.S. manufacturing facilities. During 2016,
$20.7 million
of the expense in the AMS segment was attributable to the impairment of the DelStar trade name, as discussed in Note
10
. Intangible Assets. The remaining amount in 2016 and the total expense in 2015 related to accruals for severance incurred during the acquisition of the assets from Smith & Nephew in December 2014.
In the EP segment, restructuring and impairment expenses were
$5.3 million
,
$4.0 million
and
$14.4 million
during the years ended
December 31, 2017
,
2016
and
2015
, respectively. During 2017, restructuring and impairment expenses in the EP segment consisted of
$0.8 million
in severance accruals for employees at our manufacturing facilities in the U.S. and France, as well as an impairment charge of
$4.0 million
at our Philippines RTL location, and impairment charges totaling
$0.5 million
at our French and United States manufacturing facilities.
In 2016, restructuring and impairment expenses in the EP segment consisted of
$3.4 million
related to severance expenses in the French, Brazilian and U.S. operations for ongoing accruals over the remaining service lives of affected employees related to previously announced actions as well as
$0.6 million
of impairment charges to certain of the Company's manufacturing equipment in Poland and Brazil.
In 2015, restructuring and impairment expenses in the EP segment consisted of
$7.8 million
related to severance expenses in the French, Brazilian and U.S. operations for ongoing accruals over the remaining service lives of affected
87
SCHWEITZER-MAUDUIT INTERNATIONAL, INC. AND SUBSIDIARIES
NOTES TO CONSOLIDATED FINANCIAL STATEMENTS
employees related to previously announced actions as well as
$1.4 million
of impairment charges to certain of the Company's Polish and Brazilian manufacturing equipment and
$5.2 million
of loss recognized to adjust the recorded value of equipment at the Philippines RTL location to its estimated fair value less cost to sell as discussed in more detail below. The fair value of the RTL Philippines facility was determined by using independent appraisals of certain assets, which are considered significant unobservable inputs, or Level 3 inputs.
Additionally, the Company incurred
$0.1 million
,
$0.3 million
, and
$0.4 million
in
2017
,
2016
, and
2015
, respectively, in restructuring expenses related to accruals for severance expenses within supporting overhead departments which were not allocated to a specific segment.
Restructuring liabilities were classified within Accrued expenses in each of the Consolidated Balance Sheets as of
December 31, 2017
and
2016
. Changes in the restructuring liabilities, substantially all of which are employee-related, are summarized as follows ($ in millions):
|
2017
|
2016
|
||||||
|
Balance at beginning of year
|
$
|
4.3
|
|
$
|
7.7
|
|
|
|
Accruals for announced programs
|
3.5
|
|
4.3
|
|
|||
|
Cash payments
|
(6.4
|
)
|
(8.4
|
)
|
|||
|
Exchange rate impacts
|
0.3
|
|
0.7
|
|
|||
|
Balance at end of period
|
$
|
1.7
|
|
$
|
4.3
|
|
|
Long-lived assets to be sold are classified as held for sale in the period in which all of the following criteria are met: management, having the authority to approve the action, commits to a plan to sell the assets; the asset are available for immediate sale in present condition subject only to terms that are usual and customary for sales of such assets; an active program to locate a buyer and other actions required to complete the plan to sell the assets have been initiated; the sale of the assets is probable, and transfer of the assets is expected to qualify for recognition as a completed sale within one year, except if events or circumstances beyond our control extend the period of time required to sell the assets beyond one year; the assets are being actively marketed for sale at a price that is reasonable in relation to current fair value; and actions required to complete the plan indicate that it is unlikely that significant changes to the plan will be made or that the plan will be withdrawn.
A long-lived asset that is classified as held for sale is initially measured at the lower of its carrying value or fair value less any costs to sell. Any loss resulting from this measurement is recognized in the period in which the held for sale criteria are met. Conversely, gains are not recognized on the sale of a long-lived asset until the date of sale. The fair value of a long-lived asset less any costs to sell is assessed each reporting period it remains classified as held for sale and any reduction in fair value is reported as an adjustment to the carrying value of the asset. Upon being classified as held for sale, depreciation is ceased. Long-lived assets to be disposed of other than by sale are continued to be depreciated. Upon determining that a long-lived asset meets the criteria to be classified as held for sale, the assets and liabilities of the disposal group, if material, are reported in the line item "Assets held for sale" in our condensed consolidated balance sheets.
In early 2015, the Company made the decision to dispose of the Company’s mothballed RTL facility and related equipment in the Philippines. These assets are included in the EP segment. During 2015, the Company reclassified the equipment at this location, along with the land and building associated with the property, from Property, plant and equipment, net, to Assets held for sale on the consolidating balance sheets. The reclassifications were made for all assets that are expected to be sold within one year of the balance sheet date and, as of December 31, 2015, all of the physical assets of this entity were classified as Assets held for sale. As discussed above, during the year ended December 31, 2015, the Company incurred
$5.2 million
in impairment expense to write-down the carrying value of these assets to the net realizable value. Additional impairment charges of
$4.0 million
were recognized on these assets during the year ended December 31, 2017. There were
no
impairment charges related to these assets recorded during 2016.
88
SCHWEITZER-MAUDUIT INTERNATIONAL, INC. AND SUBSIDIARIES
NOTES TO CONSOLIDATED FINANCIAL STATEMENTS
Note
13
. Debt
Total debt, net of debt issuance costs, is summarized in the following table ($ in millions):
|
December 31,
2017 |
December 31,
2016 |
||||||
|
Term loan A-1
|
$
|
60.0
|
|
$
|
60.0
|
|
|
|
Term loan A-2
|
244.4
|
|
246.9
|
|
|||
|
Revolving credit agreement - U.S. dollar borrowings
|
344.5
|
|
131.0
|
|
|||
|
Revolving credit agreement - Euro borrowings
|
26.4
|
|
—
|
|
|||
|
French employee profit sharing
|
9.1
|
|
9.5
|
|
|||
|
Long-term capital lease obligations
|
4.1
|
|
—
|
|
|||
|
Other
|
1.5
|
|
—
|
|
|||
|
Debt issuance costs
|
(5.8
|
)
|
(7.0
|
)
|
|||
|
Total debt
|
684.2
|
|
440.4
|
|
|||
|
Less: Current debt
|
(5.1
|
)
|
(3.0
|
)
|
|||
|
Long-term debt
|
$
|
679.1
|
|
$
|
437.4
|
|
|
Credit Agreement
On December 1, 2016, the Company entered into the First Amendment to Second Amended and Restated Credit Agreement ("First Amendment") with JPMorgan Chase Bank, N.A. as administrative agent. Under the terms of the First Amendment, and effective upon the closing of the Conwed acquisition on January 20, 2017, the Company's maximum net debt to EBITDA ratio, as defined in the First Amendment, calculated on a trailing four fiscal quarter basis, is required to be not greater than
4.25
at December 31, 2017, reducing to
4.00
after December 31, 2017,
3.75
after March 31, 2018,
3.50
after June 30, 2018 and
3.00
after December 31, 2018.
On October 28, 2015 Schweitzer-Mauduit International, Inc. entered into a Second Amended and Restated Credit Agreement, or the Amended Credit Agreement, with JPMorgan Chase Bank, N.A., as administrative agent, providing for credit facilities in the aggregate principal amount of
$1 billion
, consisting of a
$650 million
revolving credit facility, or Revolving Credit Facility available to the Company; a
$100 million
Term Loan A-1 (“Term Loan A-1”) made to the Company; and a
$250 million
Term Loan A-2 (“Term Loan A-2” and, together with Term Loan A-1, the “Term Loans”) made to the Company. The Revolving Credit Facility matures on
October 28, 2020
. The Term Loan A-1 amortizes at the rate of
5.0%
for the first
two
years, at the rate of
10.0%
for the final
three
years and matures on
October 28, 2020
. The Term Loan A-2 amortizes at the rate of
1.0%
per year and matures on
October 28, 2022
. The Term Loans are generally subject to mandatory repayment out of the net cash proceeds of asset sales which are not reinvested in operating assets. The credit facilities are secured by substantially all of the personal property of the Company and its domestic subsidiaries. In December 2015, the Company prepaid the full amount of amortization for Term Loan A-1, which totaled
$40 million
.
The interest rate margins applicable to the Revolving Credit Facility and the Term Loans under the Amended Credit Agreement are based on a fluctuating rate of interest measured by reference to either, at the Company's option, (i) a base rate, plus an applicable margin, which ranges from
0.25%
to
1.50%
, in the case of the Revolving Credit Facility and Term Loan A-1, and from
0.50%
to
1.75%
, in the case of Term Loan A-2, or (ii) an adjusted London interbank offered rate (adjusted for maximum reserves) (“LIBOR”), plus an applicable margin, which ranges from
1.25%
to
2.50%
, in the case of the Revolving Credit Facility and Term Loan A-1, and from
1.50%
to
2.75%
, in the case of Term Loan A-2. The applicable margin, in each case, is adjusted from time to time based on the Company's ratio of net debt to EBITDA as defined by the Amended Credit Agreement. As of
December 31, 2017
, the average applicable interest rate on Amended Credit Agreement borrowings was
3.60%
on US Revolving Credit Facility borrowings,
2.00%
on Euro Revolving Credit Facility borrowings,
3.63%
on Term Loan A-1 borrowings and
3.88%
on Term Loan A-2 borrowings.
89
SCHWEITZER-MAUDUIT INTERNATIONAL, INC. AND SUBSIDIARIES
NOTES TO CONSOLIDATED FINANCIAL STATEMENTS
The Amended Credit Agreement also contains representations and warranties which are customary for facilities of this type.
The Company was in compliance with all of its covenants under the Amended Credit Agreement at December 31, 2017.
French Employee Profit Sharing
At both
December 31, 2017
and
2016
, long-term debt other than the Amended Credit Agreement primarily consisted of obligations of the French operations related to government-mandated profit sharing. Each year, representatives of the workers at each of the French businesses can make an election for the profit sharing amounts from the most recent year ended to be invested in a financial institution or with their respective employer. To the extent that funds are invested with the Company, these amounts bear interest at
1.15%
and
0.80%
at
December 31, 2017
and
2016
, respectively, and are generally payable in the fifth year subsequent to the year in which the profit sharing is accrued.
Bank Overdrafts
The Company also had bank overdraft facilities of
$20.0 million
and
$27.3 million
, at
December 31, 2017
and
2016
, respectively, of which none was outstanding at either
December 31, 2017
or
2016
. Interest is incurred on outstanding amounts at market rates and was
0.24%
and
0.14%
, respectively, at
December 31, 2017
and
2016
. No commitment fees are paid on the unused portion of these facilities.
Rate Swap Agreements
The Company maintained a forward interest rate swap agreement on a portion of its long-term debt as of
December 31, 2017
that will fix the LIBOR rate on
$50.0 million
of the Company's variable-rate long-term debt as of October 2014 at a predetermined rate plus a credit spread through the end of October 2018. See Note
14
. Derivatives for more information.
On January 20, 2017, the Company entered into an interest rate swap transaction with a major financial institution for a
three
-year term on a notional amount of
$315 million
. The interest rate swap is intended to manage the Company's interest rate risk by fixing the interest rate on a portion of the Company's debt currently outstanding under its credit facility that was previously subject to a floating interest rate equal to 1-month LIBOR plus a credit spread. The swap provides for the Company to pay a fixed rate of
1.65%
per annum in addition to the credit spread on such portion of its outstanding debt in exchange for receiving a variable interest rate based on 1-month LIBOR.
On January 20, 2017, the Company also entered into a
three
-year cross-currency swap with a major financial institution designated as a hedge of a portion of the Company's net investment in certain Euro-denominated subsidiaries. The terms of the cross-currency swap provide for an exchange of principal on a notional amount of
$100 million
swapped to
€93.7 million
at maturity. The Company will receive from our swap counterparty U.S. dollar interest at a fixed rate of
1.65%
per annum and pay to our swap counterparty Euro interest at a fixed rate of
-0.18%
per annum.
90
SCHWEITZER-MAUDUIT INTERNATIONAL, INC. AND SUBSIDIARIES
NOTES TO CONSOLIDATED FINANCIAL STATEMENTS
Principal Repayments
Under the Amended Credit Agreement, the Company selects an "interest period" for each of its borrowings from the Revolving Credit Facility. The Company can repay such borrowings and borrow again at a subsequent date if it chooses to do so, providing it flexibility and efficient use of any excess cash. The Company currently has the intent and ability to allow its debt balances to remain outstanding and expects to continue to file notices of continuation related to its borrowings outstanding at
December 31, 2017
such that those amounts are not expected to be repaid prior to the December 2020 expiration of the Revolving Credit Facility. Following are the expected maturities for the Company's debt obligations as of
December 31, 2017
($ in millions):
|
2018
|
$
|
6.9
|
|
|
2019
|
5.2
|
|
|
|
2020
|
434.6
|
|
|
|
2021
|
4.4
|
|
|
|
2022
|
236.0
|
|
|
|
Thereafter
|
2.9
|
|
|
|
Total
|
$
|
690.0
|
|
Fair Value of Debt
At
December 31, 2017
and
2016
, the estimated fair values of the Company's current and long-term debt approximated the respective carrying amounts, as the interest rates were variable and based on current market indices.
Debt Issuance Costs
In conjunction with the First Amendment, the Company capitalized approximately
$0.6 million
in deferred debt issuance costs which will be amortized over the term of the related debt instruments. In conjunction with the Amended Credit Agreement, the Company capitalized approximately
$7.4 million
, in the fourth quarter of 2015, in deferred debt issuance costs associated with the new facility which will be amortized over the term of the related debt instruments. As of
December 31, 2017
and
2016
, the Company's total deferred debt issuance costs totaled
$5.8 million
and
$7.0 million
, respectively.
Amortization expense of
$1.8 million
and
$1.7 million
was recorded during the years ended
December 31, 2017
and
2016
, respectively, and has been included as a component of Interest Expense in the accompanying Consolidated Statements of Income. Following is the expected future amortization of the Company's deferred debt issuance costs as of
December 31, 2017
($ in millions):
|
2018
|
$
|
1.8
|
|
|
2019
|
1.8
|
|
|
|
2020
|
1.6
|
|
|
|
2021
|
0.3
|
|
|
|
2022
|
0.3
|
|
|
|
Total
|
$
|
5.8
|
|
91
SCHWEITZER-MAUDUIT INTERNATIONAL, INC. AND SUBSIDIARIES
NOTES TO CONSOLIDATED FINANCIAL STATEMENTS
Note
14
. Derivatives
In the normal course of business, the Company is exposed to foreign currency exchange rate risk and interest rate risk on its variable-rate debt. To manage these risks, the Company utilizes a variety of practices including, where considered appropriate, derivative instruments. The Company has no derivative instruments for trading or speculative purposes or any derivatives with credit risk-related contingent features. All derivative instruments used by the Company are either exchange traded or are entered into with major financial institutions in order to reduce credit risk and risk of nonperformance by third parties. The fair values of the Company's derivative instruments are determined using observable inputs and are considered Level 2 assets or liabilities.
The Company utilizes currency forward, swap and, to a lesser extent, option contracts to selectively hedge its exposure to foreign currency risk when it is practical and economical to do so. The use of these contracts minimizes transactional exposure to exchange rate changes. We designate certain of our foreign currency hedges as cash flow hedges. Changes in the fair value of cash flow hedges are reported as a component of other comprehensive income (loss) and reclassified into earnings when the forecasted transaction affects earnings. For foreign exchange contracts not designated as cash flow hedges, changes in the contracts' fair value are recorded to net income each period.
The Company selectively hedges its exposure to interest rate increases on variable-rate, long-term debt when it is practical and economical to do so. Changes in the fair value of interest rate contracts considered cash flow hedges are reported as a component of other comprehensive income (loss) and reclassified into earnings when the forecasted transaction affects earnings.
On January 20, 2017, the Company entered into an interest rate swap transaction with a major financial institution for a
three
-year term on a notional amount of
$315 million
. The interest rate swap is intended to manage the Company's interest rate risk by fixing the interest rate on a portion of the Company's debt currently outstanding under its credit facility that was previously subject to a floating interest rate equal to 1-month LIBOR plus a credit spread. The swap provides for the Company to pay a fixed rate of
1.65%
per annum in addition to the credit spread on such portion of its outstanding debt in exchange for receiving a variable interest rate based on 1-month LIBOR.
On January 20, 2017, the Company also entered into a
three
-year cross-currency swap with a major financial institution N.A. designated as a hedge of a portion of the Company's net investment in certain Euro-denominated subsidiaries. The terms of the cross-currency swap provide for an exchange of principal on a notional amount of
$100 million
swapped to
€93.7 million
at maturity. The Company will receive from our swap counterparty U.S. dollar interest at a fixed rate of
1.65%
per annum and pay to our swap counterparty Euro interest at a fixed rate of
-0.18%
per annum.
The following table presents the fair value of asset and liability derivatives and the respective balance sheet locations at
December 31, 2017
($ in millions):
|
|
Asset Derivatives
|
Liability Derivatives
|
|||||||||
|
|
Balance Sheet
Location
|
Fair
Value
|
Balance Sheet
Location
|
Fair
Value
|
|||||||
|
Derivatives Designated as Hedges:
|
|
|
|
|
|||||||
|
Foreign exchange contracts
|
Accounts receivable
|
$
|
4.7
|
|
Accrued expenses
|
$
|
0.2
|
|
|||
|
Foreign exchange contracts
|
Other assets
|
—
|
|
Other liabilities
|
14.2
|
|
|||||
|
Interest rate contracts
|
Other assets
|
2.0
|
|
Other liabilities
|
—
|
|
|||||
|
Total derivatives designated as hedges
|
|
$
|
6.7
|
|
|
$
|
14.4
|
|
|||
|
Derivatives not designated as hedges:
|
|
|
|
|
|||||||
|
Foreign exchange contracts
|
Accounts receivable
|
$
|
0.1
|
|
Accounts payable
|
$
|
—
|
|
|||
|
Total derivatives not designated as hedges
|
|
0.1
|
|
|
—
|
|
|||||
|
Total derivatives
|
|
$
|
6.8
|
|
|
$
|
14.4
|
|
|||
92
SCHWEITZER-MAUDUIT INTERNATIONAL, INC. AND SUBSIDIARIES
NOTES TO CONSOLIDATED FINANCIAL STATEMENTS
The following table presents the fair value of asset and liability derivatives and the respective balance sheet locations at
December 31, 2016
($ in millions):
|
|
Asset Derivatives
|
Liability Derivatives
|
|||||||||
|
|
Balance Sheet
Location
|
Fair
Value
|
Balance Sheet
Location
|
Fair
Value
|
|||||||
|
Derivatives Designated as Hedges:
|
|
|
|
|
|||||||
|
Foreign exchange contracts
|
Accounts receivable
|
$
|
1.0
|
|
Accrued expenses
|
$
|
1.8
|
|
|||
|
Foreign exchange contracts
|
Other assets
|
1.9
|
|
Other liabilities
|
—
|
|
|||||
|
Interest rate contracts
|
Other assets
|
—
|
|
Other liabilities
|
0.4
|
|
|||||
|
Total derivatives designated as hedges
|
|
$
|
2.9
|
|
|
$
|
2.2
|
|
|||
The following table provides the gross effect that derivative instruments in cash flow hedging relationships had on accumulated other comprehensive income (loss), or AOCI, and results of operations ($ in millions):
|
Derivatives Designated as Cash Flow Hedging Relationships
|
Unrealized Gain (Loss) Recognized in AOCI on Derivatives, Net of Tax for the Year Ended December 31,
|
Loss Reclassified
from AOCI, Net of Tax
|
|||||||||||||||||||||
|
2017
|
2016
|
2015
|
2017
|
|
2016
|
|
2015
|
||||||||||||||||
|
Foreign exchange contracts
|
$
|
1.6
|
|
$
|
13.3
|
|
$
|
(24.4
|
)
|
$
|
0.9
|
|
$
|
(5.9
|
)
|
$
|
(11.1
|
)
|
|||||
|
Interest rate contracts
|
0.4
|
|
(0.1
|
)
|
(0.5
|
)
|
(1.2
|
)
|
(0.6
|
)
|
(0.5
|
)
|
|||||||||||
|
Total
|
$
|
2.0
|
|
$
|
13.2
|
|
$
|
(24.9
|
)
|
$
|
(0.3
|
)
|
$
|
(6.5
|
)
|
$
|
(11.6
|
)
|
|||||
The Company's designated derivative instruments are highly effective. As such, related to the hedge ineffectiveness or amounts excluded from hedge effectiveness testing, there were no gains or losses recognized immediately in income for the years ended
December 31, 2017
,
2016
or
2015
.
The following table provides the effect derivative instruments not designated as hedging instruments had on net income ($ in millions):
|
Derivatives Not Designated as Cash Flow Hedging Instruments
|
Amount of Gain / (Loss) Recognized in Other Income / Expense
|
||||||||||
|
2017
|
2016
|
2015
|
|||||||||
|
Interest rate contracts
|
$
|
—
|
|
$
|
—
|
|
$
|
—
|
|
||
|
Foreign exchange contracts
|
2.7
|
|
1.0
|
|
(1.5
|
)
|
|||||
|
Total
|
$
|
2.7
|
|
$
|
1.0
|
|
$
|
(1.5
|
)
|
||
Note
15
. Accrued Expenses
Accrued expenses consisted of the following ($ in millions):
|
December 31,
|
|||||||
|
2017
|
2016
|
||||||
|
Accrued salaries, wages and employee benefits
|
$
|
46.9
|
|
$
|
39.2
|
|
|
|
Other accrued expenses
|
31.7
|
|
38.0
|
|
|||
|
Total
|
$
|
78.6
|
|
$
|
77.2
|
|
|
93
SCHWEITZER-MAUDUIT INTERNATIONAL, INC. AND SUBSIDIARIES
NOTES TO CONSOLIDATED FINANCIAL STATEMENTS
Note
16
. Income Taxes
For financial reporting purposes, income before income taxes includes the following components ($ in millions):
|
For the Years Ended December 31,
|
|||||||||||
|
2017
|
2016
|
2015
|
|||||||||
|
United States
|
$
|
42.6
|
|
$
|
27.7
|
|
$
|
41.6
|
|
||
|
Foreign
|
58.9
|
|
65.7
|
|
63.9
|
|
|||||
|
Total
|
$
|
101.5
|
|
$
|
93.4
|
|
$
|
105.5
|
|
||
An analysis of the provision (benefit) for income taxes from continuing operations follows ($ in millions):
|
For the Years Ended December 31,
|
|||||||||||
|
2017
|
2016
|
2015
|
|||||||||
|
Current income taxes:
|
|||||||||||
|
U.S. federal
|
$
|
53.2
|
|
$
|
14.3
|
|
$
|
13.0
|
|
||
|
U.S. state
|
0.6
|
|
0.1
|
|
1.1
|
|
|||||
|
Foreign
|
14.2
|
|
17.2
|
|
14.2
|
|
|||||
|
68.0
|
|
31.6
|
|
28.3
|
|
||||||
|
Deferred income taxes:
|
|||||||||||
|
U.S. federal
|
(1.3
|
)
|
(2.7
|
)
|
(5.8
|
)
|
|||||
|
U.S. state
|
2.9
|
|
(4.0
|
)
|
0.1
|
|
|||||
|
Foreign
|
—
|
|
(9.5
|
)
|
(1.0
|
)
|
|||||
|
1.6
|
|
(16.2
|
)
|
(6.7
|
)
|
||||||
|
Total
|
$
|
69.6
|
|
$
|
15.4
|
|
$
|
21.6
|
|
||
A reconciliation of income taxes computed at the U.S. Federal statutory income tax rate to the provision for income taxes is as follows ($ in millions):
|
For the Years Ended December 31,
|
||||||||||||||||||||
|
2017
|
2016
|
2015
|
||||||||||||||||||
|
Amount
|
Percent
|
Amount
|
Percent
|
Amount
|
Percent
|
|||||||||||||||
|
Tax provision at U.S. statutory rate
|
$
|
35.6
|
|
35.0
|
%
|
$
|
32.6
|
|
35.0
|
%
|
$
|
36.9
|
|
35.0
|
%
|
|||||
|
Foreign income tax rate differential
|
0.7
|
|
0.7
|
|
(9.0
|
)
|
(9.6
|
)
|
(16.2
|
)
|
(15.4
|
)
|
||||||||
|
State income tax, net of federal benefit
|
2.7
|
|
2.6
|
|
(2.5
|
)
|
(2.7
|
)
|
1.1
|
|
1.1
|
|
||||||||
|
Domestic production deduction
|
(2.4
|
)
|
(2.3
|
)
|
(0.9
|
)
|
(1.0
|
)
|
(1.5
|
)
|
(1.4
|
)
|
||||||||
|
Remeasurement of deferred taxes for tax law change
|
(11.8
|
)
|
(11.7
|
)
|
(7.0
|
)
|
(7.5
|
)
|
—
|
|
—
|
|
||||||||
|
Adjustments to valuation allowances
|
(2.8
|
)
|
(2.8
|
)
|
3.5
|
|
3.7
|
|
1.4
|
|
1.3
|
|
||||||||
|
U.S. tax reform transition tax
|
51.4
|
|
50.6
|
|
—
|
|
—
|
|
—
|
|
—
|
|
||||||||
|
Other, net
|
(3.8
|
)
|
(3.5
|
)
|
(1.3
|
)
|
(1.4
|
)
|
(0.1
|
)
|
(0.1
|
)
|
||||||||
|
Provision for income taxes
|
$
|
69.6
|
|
68.6
|
%
|
$
|
15.4
|
|
16.5
|
%
|
$
|
21.6
|
|
20.5
|
%
|
|||||
On December 22, 2017, the Tax Cuts and Jobs Act of 2017 (the “Act”) was signed into law making significant changes to the Internal Revenue Code. Changes include, but are not limited to, a federal corporate tax rate decrease from 35% to 21% for tax years beginning after December 31, 2017. We are required to recognize the effect of the tax law changes in the period of enactment, such as determining the transition tax, remeasuring our U.S. deferred tax assets and liabilities as well as reassessing the net realizability of our deferred tax assets and liabilities. On December 22, 2017, the SEC
94
SCHWEITZER-MAUDUIT INTERNATIONAL, INC. AND SUBSIDIARIES
NOTES TO CONSOLIDATED FINANCIAL STATEMENTS
staff issued Staff Accounting Bulletin No. 118,
Income Tax Accounting Implications of the Tax Cuts and Jobs Act
("SAB 118"), which allows us to record provisional amounts during a measurement period not to extend beyond one year of the enactment date. In accordance with SAB 118, we have determined certain provisional amounts and reasonable estimates at December 31, 2017. The impact of the Act may differ from this estimate, possibly materially, due to, among other things, changes in interpretations and assumptions the Company has made, guidance that may be issued, and actions the Company may take as a result of the Act. In accordance with SAB 118, we have determined the provisional amounts and reasonable estimates of the transition tax and deferred tax remeasurement at December 31, 2017. The impact of the Act may differ from this estimate, possibly materially, due to, among other things, changes in interpretations and assumptions the Company has made, guidance that may be issued, and actions the Company may take as a result of the Act. We will complete our analysis over this measurement period ending December 22, 2018 and any adjustments during this measurement period will be included in net earnings from continuing operations as an adjustment to income tax expense in the reporting period when such adjustments are determined.
The Company has not accounted for the tax impacts related to state taxes, the Global Intangible Low Tax Income, Base Erosion Anti Abuse Tax or Foreign Derived Intangible Income regimes or any of the other provisions of the Tax Legislation that are not effective until fiscal year 2018. Any subsequent adjustment to these amounts will be recorded to current tax expense in the quarter of 2018 when the analysis is complete.
We previously considered the earnings in our non-U.S. subsidiaries to be indefinitely reinvested and, accordingly, recorded no deferred income taxes. Prior to the Transition Tax, we had an excess of the amount for financial reporting over the tax basis in our foreign subsidiaries, including undistributed foreign earnings. While the Transition Tax resulted in the reduction of the excess of the amount for financial reporting over the tax basis in our foreign subsidiaries, an actual repatriation from our non-U.S. subsidiaries could still be subject to additional foreign withholding taxes and U.S. state taxes. We have analyzed our global working capital and cash requirements and the potential tax liabilities attributable to a repatriation and have provisionally determined that we will not be repatriating any previously deemed indefinitely reinvested earnings.
95
SCHWEITZER-MAUDUIT INTERNATIONAL, INC. AND SUBSIDIARIES
NOTES TO CONSOLIDATED FINANCIAL STATEMENTS
Net deferred income tax assets (liabilities) were comprised of the following ($ in millions):
|
December 31,
|
|||||||
|
2017
|
2016
|
||||||
|
Deferred Tax Assets
|
|||||||
|
Receivable allowances
|
$
|
0.4
|
|
$
|
0.2
|
|
|
|
Reserves and accruals
|
3.8
|
|
3.9
|
|
|||
|
Inventory and other assets
|
0.7
|
|
2.3
|
|
|||
|
Postretirement and other employee benefits
|
15.9
|
|
20.0
|
|
|||
|
Net operating loss and tax credit carryforwards
|
94.1
|
|
104.8
|
|
|||
|
Intangibles
|
73.6
|
|
76.6
|
|
|||
|
Other
|
4.7
|
|
0.1
|
|
|||
|
193.2
|
|
207.9
|
|
||||
|
Less: Valuation allowance
|
(182.5
|
)
|
(194.8
|
)
|
|||
|
Net deferred income tax assets
|
$
|
10.7
|
|
$
|
13.1
|
|
|
|
Deferred Tax Liabilities
|
|||||||
|
Net fixed assets
|
$
|
(40.5
|
)
|
$
|
(34.4
|
)
|
|
|
Investment in subsidiaries
|
(9.8
|
)
|
(4.1
|
)
|
|||
|
Derivatives
|
(1.3
|
)
|
—
|
|
|||
|
Other
|
(0.4
|
)
|
(0.7
|
)
|
|||
|
Net deferred income tax liabilities
|
$
|
(52.0
|
)
|
$
|
(39.2
|
)
|
|
|
Total net deferred income tax liabilities
|
$
|
(41.3
|
)
|
$
|
(26.1
|
)
|
|
As of
December 31, 2017
the Company had approximately
$92.8 million
of tax affected operating loss carryforwards available to reduce future taxable income in various jurisdictions which will expire on various dates as follows:
|
2017
|
|||
|
2018-2022
|
$
|
3.4
|
|
|
2023-2034
|
12.7
|
|
|
|
Indefinite
|
76.7
|
|
|
|
92.8
|
|
||
In addition, the Company has
$1.3 million
of state tax credits that will expire between 2018 - 2036.
The Company's deferred tax asset valuation allowances are primarily the result of uncertainties regarding the future realization of recorded tax benefits on tax loss carryforwards for certain entities. The valuation allowance on deferred tax assets as of
December 31, 2017
, in Luxembourg, Spain and the Philippines total
$166.3 million
,
$9.1 million
and
$2.7 million
respectively, fully reserving the net deferred tax asset balances in these locations. In addition, there is a valuation allowance on a tax credit receivable of
$3.4 million
in Brazil. We believe that it is more likely than not that the benefit from certain state tax attributes will not be realized. In recognition of this risk, we have provided a valuation allowance of
$1.0 million
on the related deferred tax assets.
The Company's assumptions, judgments and estimates relative to the valuation of these net deferred tax assets take into account available positive and negative evidence of realizability, including recent financial performance, the ability to realize benefits of restructuring and other recent actions, projections of the amount and category of future taxable income and tax planning strategies. Actual future operating results and the underlying amount and category of income in future periods could differ from the Company's current assumptions, judgments and estimates. The Company believes
96
SCHWEITZER-MAUDUIT INTERNATIONAL, INC. AND SUBSIDIARIES
NOTES TO CONSOLIDATED FINANCIAL STATEMENTS
that it will generate sufficient future taxable income to realize the tax benefits related to the remaining net deferred tax assets.
The following table summarizes the activity related to the Company's unrecognized tax benefits related to income taxes ($ in millions):
|
December 31,
|
|||||||||||
|
2017
|
2016
|
2015
|
|||||||||
|
Uncertain tax position balance at beginning of year
|
$
|
2.4
|
|
$
|
0.9
|
|
$
|
1.8
|
|
||
|
Increases related to current year tax positions
|
0.3
|
|
2.0
|
|
—
|
|
|||||
|
Increases related to prior year tax positions
|
0.4
|
|
—
|
|
—
|
|
|||||
|
Decreases related to prior year tax positions
|
(2.0
|
)
|
—
|
|
—
|
|
|||||
|
Decreases related to expiration of statute of limitations
|
(0.1
|
)
|
(0.5
|
)
|
(0.9
|
)
|
|||||
|
Uncertain tax position balance at end of year
|
$
|
1.0
|
|
$
|
2.4
|
|
$
|
0.9
|
|
||
The liability for unrecognized tax benefits included
$1.1 million
as of
December 31, 2017
that if recognized would impact the Company's effective tax rate. We believe that it is reasonably possible that a decrease of up to approximately
$0.2 million
in unrecognized tax benefits may be recognized by the end of 2018 as a result of a lapse of the statute of limitations and other regulatory filings. The Company's policy with respect to penalties and interest in connection with income tax assessments or related to unrecognized tax benefits is to classify penalties as provision for income taxes and interest as interest expense in its Consolidated Statements of Income. There were no material income tax penalties or interest accrued during the years ended
December 31, 2017
,
2016
and
2015
.
The Company files income tax returns, including returns for its subsidiaries, with federal, state, local and foreign jurisdictions. Currently, the company is under U.S. audit for tax years 2014 and 2015. The following tax years remain subject to examination by the respective major tax jurisdictions:
|
Jurisdiction
|
Fiscal Years
|
|
Belgium
|
2014-2016
|
|
Brazil
|
2012-2016
|
|
Canada
|
2010-2016
|
|
China
|
2014-2016
|
|
France
|
2015-2016
|
|
Germany
|
2013-2016
|
|
Hong Kong
|
2011-2016
|
|
Luxembourg
|
2013-2016
|
|
Philippines
|
2014-2016
|
|
Poland
|
2012-2016
|
|
Spain
|
2013-2016
|
|
United Kingdom
|
2011-2016
|
|
United States
|
|
|
Federal
|
2014-2016
|
|
State
|
2014-2016
|
97
SCHWEITZER-MAUDUIT INTERNATIONAL, INC. AND SUBSIDIARIES
NOTES TO CONSOLIDATED FINANCIAL STATEMENTS
Note
17
. Postretirement and Other Benefits
North American Pension and Postretirement Healthcare and Life Insurance Benefits
The U.S. operations have defined benefit retirement plans that cover certain full-time employees. Retirement benefits are based on either a cash balance benefit formula or a final average pay formula for certain employees who were "grandfathered" and retained retirement benefits under the terms of the plan prior to its amendment to include a cash balance benefit formula. Benefits related to the U.S. defined benefit and pension plan are frozen for all employees.
The U.S. operations also have unfunded healthcare and life insurance benefit plans, or OPEB plans, which cover certain of its retirees through age 65. Some employees who retained benefits under the terms of the Company's plans prior to certain past amendments receive retiree healthcare coverage at rates subsidized by the Company. For other eligible employees, retiree healthcare coverage access is offered at full cost to the retiree. The postretirement healthcare plans include a limit on the Company's share of costs for current and future retirees. The U.S. operations' retiree life insurance plans are noncontributory. The Company's Canadian postretirement benefits liability is immaterial and therefore is not included in these disclosures.
French Pension Benefits
In France, employees are covered under a government-administered program. In addition, the Company's French operations sponsor retirement indemnity plans, which pay a lump sum retirement benefit to all of its permanent employees who retire. In addition, the Company's French operations sponsor a supplemental executive pension plan. Plan assets are principally invested in the general asset portfolio of a French insurance company.
98
SCHWEITZER-MAUDUIT INTERNATIONAL, INC. AND SUBSIDIARIES
NOTES TO CONSOLIDATED FINANCIAL STATEMENTS
U.S. and French Pension and U.S. Other Postretirement Benefit Disclosures
The U.S. pension and OPEB plans and French pension plans accounted for the majority of the Company's total plan assets and total Accumulated Benefit Obligations (ABO) at
December 31, 2017
for the Company and all of its consolidated subsidiaries.
The Company uses a measurement date of December 31 for its pension plans in the United States and France and other postretirement healthcare and life insurance benefit plans in the United States. The funded status of these plans as of
December 31, 2017
and
2016
was as follows ($ in millions):
|
Pension Benefits
|
OPEB Benefits
|
||||||||||||||||||||||
|
United States
|
France
|
United States
|
|||||||||||||||||||||
|
2017
|
2016
|
2017
|
2016
|
2017
|
2016
|
||||||||||||||||||
|
Change in Projected Benefit Obligation, or PBO:
|
|||||||||||||||||||||||
|
PBO at beginning of year
|
$
|
123.2
|
|
$
|
123.4
|
|
$
|
32.4
|
|
$
|
32.2
|
|
$
|
1.4
|
|
$
|
1.7
|
|
|||||
|
Service cost
|
—
|
|
—
|
|
1.1
|
|
1.0
|
|
—
|
|
—
|
|
|||||||||||
|
Interest cost
|
4.8
|
|
5.2
|
|
0.4
|
|
0.4
|
|
0.1
|
|
0.1
|
|
|||||||||||
|
Actuarial (gain) loss
|
3.9
|
|
2.4
|
|
(2.6
|
)
|
2.1
|
|
0.2
|
|
—
|
|
|||||||||||
|
Participant contributions
|
—
|
|
—
|
|
—
|
|
—
|
|
0.1
|
|
0.1
|
|
|||||||||||
|
Gross benefits paid
|
(7.8
|
)
|
(7.8
|
)
|
(5.7
|
)
|
(3.0
|
)
|
(0.4
|
)
|
(0.5
|
)
|
|||||||||||
|
Currency translation effect
|
—
|
|
—
|
|
4.9
|
|
(0.3
|
)
|
—
|
|
—
|
|
|||||||||||
|
PBO at end of year
|
$
|
124.1
|
|
$
|
123.2
|
|
$
|
30.5
|
|
$
|
32.4
|
|
$
|
1.4
|
|
$
|
1.4
|
|
|||||
|
Change in Plan Assets:
|
|||||||||||||||||||||||
|
Fair value of plan assets at beginning of year
|
118.9
|
|
116.7
|
|
6.1
|
|
8.4
|
|
—
|
|
—
|
|
|||||||||||
|
Actual return on plan assets
|
17.6
|
|
10.0
|
|
0.2
|
|
0.1
|
|
—
|
|
—
|
|
|||||||||||
|
Employer contributions
|
—
|
|
—
|
|
1.9
|
|
0.7
|
|
0.3
|
|
0.4
|
|
|||||||||||
|
Participant contributions
|
—
|
|
—
|
|
—
|
|
—
|
|
0.1
|
|
0.1
|
|
|||||||||||
|
Gross benefits paid
|
(7.8
|
)
|
(7.8
|
)
|
(5.6
|
)
|
(2.9
|
)
|
(0.4
|
)
|
(0.5
|
)
|
|||||||||||
|
Currency translation effect
|
—
|
|
—
|
|
0.6
|
|
(0.2
|
)
|
—
|
|
—
|
|
|||||||||||
|
Fair value of plan assets at end of year
|
$
|
128.7
|
|
$
|
118.9
|
|
$
|
3.2
|
|
$
|
6.1
|
|
$
|
—
|
|
$
|
—
|
|
|||||
|
Funded status at end of year
|
$
|
4.6
|
|
$
|
(4.3
|
)
|
$
|
(27.3
|
)
|
$
|
(26.3
|
)
|
$
|
(1.4
|
)
|
$
|
(1.4
|
)
|
|||||
99
SCHWEITZER-MAUDUIT INTERNATIONAL, INC. AND SUBSIDIARIES
NOTES TO CONSOLIDATED FINANCIAL STATEMENTS
The PBO, ABO and fair value of pension plan assets for the Company's U.S. and French defined benefit pension plans as of
December 31, 2017
and
2016
as follows ($ in millions):
|
United States
|
France
|
||||||||||||||
|
2017
|
2016
|
2017
|
2016
|
||||||||||||
|
PBO
|
$
|
124.1
|
|
$
|
123.2
|
|
$
|
30.5
|
|
$
|
32.4
|
|
|||
|
ABO
|
124.1
|
|
123.2
|
|
25.6
|
|
28.2
|
|
|||||||
|
Fair value of plan assets
|
128.7
|
|
118.9
|
|
3.2
|
|
6.1
|
|
|||||||
As of
December 31, 2017
, the pre-tax amounts in accumulated other comprehensive income that have not been recognized as components of net periodic benefit cost for the U.S. and French pension plans and other postretirement benefit plans in the United States are as follows ($ in millions):
|
Pension Benefits
|
OPEB Benefits
|
||||||||||
|
United States
|
France
|
United States
|
|||||||||
|
Accumulated loss
|
$
|
27.1
|
|
$
|
12.5
|
|
$
|
0.6
|
|
||
|
Prior service credit
|
—
|
|
(3.4
|
)
|
(0.2
|
)
|
|||||
|
Accumulated other comprehensive loss
|
$
|
27.1
|
|
$
|
9.1
|
|
$
|
0.4
|
|
||
The amounts in accumulated other comprehensive loss at
December 31, 2017
, which are expected to be recognized as components of U.S. and French net periodic benefit cost in 2018 are as follows ($ in millions):
|
Pension Benefits
|
OPEB Benefits
|
||||||||||
|
United States
|
France
|
United States
|
|||||||||
|
Amortization of accumulated loss
|
$
|
(3.5
|
)
|
$
|
(1.1
|
)
|
$
|
(0.3
|
)
|
||
|
Amortization of prior service credit
|
—
|
|
0.3
|
|
0.1
|
|
|||||
|
Total
|
$
|
(3.5
|
)
|
$
|
(0.8
|
)
|
$
|
(0.2
|
)
|
||
Actuarial assumptions are used to determine the Company's benefit obligations. The discount rate represents the interest rate used to determine the present value of future cash flows currently expected to be required to settle pension obligations. The discount rate fluctuates from year to year based on current market interest rates for high-quality, fixed-income investments. The Company also evaluates the expected average duration of its pension obligations in determining its discount rate. An assumed long-term rate of compensation increase is also used to determine the PBO. The weighted average assumptions used to determine benefit obligations as of
December 31, 2017
and
2016
were as follows:
|
Pension Benefits
|
OPEB Benefits
|
||||||||||||||||
|
United States
|
France
|
United States
|
|||||||||||||||
|
2017
|
2016
|
2017
|
2016
|
2017
|
2016
|
||||||||||||
|
Discount rate
|
3.60
|
%
|
4.11
|
%
|
1.14
|
%
|
1.12
|
%
|
3.59
|
%
|
4.09
|
%
|
|||||
|
Rate of compensation increase
|
—
|
%
|
—
|
%
|
1.75
|
%
|
1.90
|
%
|
3.50
|
%
|
3.50
|
%
|
|||||
The U.S. postretirement healthcare plan provides for benefits to be limited to a cost ceiling which has already been reached. Therefore, no increases in the health care cost trend rates are included in the measurement of the plan's benefit obligation.
100
SCHWEITZER-MAUDUIT INTERNATIONAL, INC. AND SUBSIDIARIES
NOTES TO CONSOLIDATED FINANCIAL STATEMENTS
The components of net pension and OPEB benefit costs for U.S. employees and net pension benefit costs for French employees during the years ended
December 31, 2017
,
2016
and
2015
were as follows ($ in millions):
|
|
U.S. Pension Benefits
|
French Pension Benefits
|
U.S. OPEB Benefits
|
||||||||||||||||||||||||||||||||
|
|
2017
|
2016
|
2015
|
2017
|
2016
|
2015
|
2017
|
2016
|
2015
|
||||||||||||||||||||||||||
|
Service cost
|
$
|
—
|
|
$
|
—
|
|
$
|
—
|
|
$
|
1.1
|
|
$
|
1.0
|
|
$
|
1.3
|
|
$
|
—
|
|
$
|
—
|
|
$
|
—
|
|
||||||||
|
Interest cost
|
4.8
|
|
5.2
|
|
5.0
|
|
0.4
|
|
0.4
|
|
0.4
|
|
0.1
|
|
0.1
|
|
0.1
|
|
|||||||||||||||||
|
Expected return on plan assets
|
(6.4
|
)
|
(6.8
|
)
|
(7.0
|
)
|
(0.2
|
)
|
(0.2
|
)
|
(0.3
|
)
|
—
|
|
—
|
|
—
|
|
|||||||||||||||||
|
Amortizations and other
|
3.2
|
|
3.8
|
|
5.1
|
|
1.4
|
|
1.1
|
|
0.2
|
|
0.2
|
|
0.2
|
|
(0.2
|
)
|
|||||||||||||||||
|
Net periodic benefit cost
|
$
|
1.6
|
|
$
|
2.2
|
|
$
|
3.1
|
|
$
|
2.7
|
|
$
|
2.3
|
|
$
|
1.6
|
|
$
|
0.3
|
|
$
|
0.3
|
|
$
|
(0.1
|
)
|
||||||||
Assumptions are used to determine net periodic benefit costs. In addition to the discount rate and rate of compensation increase, which are used to determine benefit obligations, an expected long-term rate of return on plan assets is also used to determine net periodic pension benefit costs. The weighted average assumptions used to determine net periodic benefit costs for the years ended
December 31, 2017
,
2016
and
2015
were as follows:
|
Pension Benefits
|
OPEB Benefits
|
|||||||||||||||||||||||||
|
United States
|
France
|
United States
|
||||||||||||||||||||||||
|
2017
|
2016
|
2015
|
2017
|
2016
|
2015
|
2017
|
2016
|
2015
|
||||||||||||||||||
|
Discount rate
|
4.11
|
%
|
4.40
|
%
|
3.94
|
%
|
1.14
|
%
|
1.12
|
%
|
1.43
|
%
|
4.09
|
%
|
4.29
|
%
|
3.82
|
%
|
||||||||
|
Expected long-term rate of return on plan assets
|
5.56
|
%
|
5.83
|
%
|
6.06
|
%
|
3.00
|
%
|
3.00
|
%
|
3.00
|
%
|
—
|
%
|
—
|
%
|
—
|
%
|
||||||||
|
Rate of compensation increase
|
—
|
%
|
—
|
%
|
—
|
%
|
1.75
|
%
|
1.90
|
%
|
1.90
|
%
|
3.50
|
%
|
3.50
|
%
|
3.50
|
%
|
||||||||
101
SCHWEITZER-MAUDUIT INTERNATIONAL, INC. AND SUBSIDIARIES
NOTES TO CONSOLIDATED FINANCIAL STATEMENTS
The Company's investment strategy with respect to its U.S. pension plan assets is to maximize the return on investment of plan assets at an acceptable level of risk and to assure the plans' fiscal health. The target asset allocation varies based on the funded status of the plan in an effort to match the duration of the plan's liabilities to investments in long duration fixed income assets over time. The Company's investments under the French pension plans are primarily invested as directed by governmental authorities, their contracted providers or the participants without direction from the Company. The primary goal of the Company's pension plans is to maintain the highest probability of assuring future benefit payments to participants while providing growth of capital in real terms. To achieve this goal, the investment philosophy is to protect plan assets from large investment losses, particularly over time, while steadily growing the assets in a prudent manner. While there cannot be complete assurance that the objectives will be realized, the Company believes that the likelihood of realizing the objectives are reasonable based upon this investment philosophy. The Company has an investment committee that meets on a periodic basis to review the portfolio returns and to determine asset mix targets. The U.S. and French pension plans' asset target allocations by asset category for 2018 and actual allocations by asset category at
December 31, 2017
and
2016
were as follows:
|
United States
|
France
|
|||||||||||||
|
2018 Target
|
2017
|
2016
|
2017
|
2016
|
||||||||||
|
Asset Category
|
||||||||||||||
|
Cash and cash equivalents
|
1
|
%
|
1
|
%
|
1
|
%
|
38
|
%
|
24
|
%
|
||||
|
Equity securities*
|
||||||||||||||
|
Domestic large cap
|
7
|
|
7
|
|
7
|
|
31
|
|
20
|
|
||||
|
Domestic small cap
|
4
|
|
4
|
|
5
|
|
—
|
|
—
|
|
||||
|
International
|
20
|
|
20
|
|
20
|
|
—
|
|
—
|
|
||||
|
Fixed income securities
|
68
|
|
68
|
|
67
|
|
28
|
|
54
|
|
||||
|
Alternative investments**
|
—
|
|
—
|
|
—
|
|
3
|
|
2
|
|
||||
|
Total
|
100
|
%
|
100
|
%
|
100
|
%
|
100
|
%
|
100
|
%
|
||||
|
*
|
None of the Company's pension plan assets are targeted for investment in SWM stock, except that it is possible that one or more mutual funds held by the plan could hold shares of SWM.
|
|
**
|
Investments in this category under the U.S. pension plan only may include hedge funds, and may include real estate under the French pension plan.
|
102
SCHWEITZER-MAUDUIT INTERNATIONAL, INC. AND SUBSIDIARIES
NOTES TO CONSOLIDATED FINANCIAL STATEMENTS
The Company's pension assets are classified according to an established fair value hierarchy that prioritizes the inputs to valuation techniques used to measure fair value. The hierarchy gives the highest priority to unadjusted quoted prices in active markets for identical assets or liabilities (Level 1 measurement) and the lowest priority to unobservable inputs (Level 3 measurements). A financial instrument's level within the hierarchy is based on the lowest level of any input that is significant to the fair value measurement. The three levels of the fair value hierarchy are described below:
|
Level 1
|
Unadjusted quoted prices in active markets that are accessible at the measurement date for identical, unrestricted assets or liabilities;
|
|
Level 2
|
Quoted prices in markets that are not considered to be active or financial instruments for which all significant inputs are observable, either directly or indirectly;
|
|
Level 3
|
Prices or valuations that require inputs that are both significant to the fair value measurement and unobservable.
|
The following table sets forth by level, within the fair value hierarchy, the U.S. and French pension plans' assets at fair value as of
December 31, 2017
($ in millions):
|
United States
|
France
|
||||||||||||||||||||||||||||||
|
Plan Asset Category
|
Total
|
Other*
|
Level 1
|
Level 2
|
Level 3
|
Total
|
Level 1
|
Level 2
|
|||||||||||||||||||||||
|
Cash equivalents
|
$
|
1.1
|
|
$
|
—
|
|
$
|
1.1
|
|
$
|
—
|
|
$
|
—
|
|
$
|
1.2
|
|
$
|
1.2
|
|
$
|
—
|
|
|||||||
|
Equity securities
|
|||||||||||||||||||||||||||||||
|
Domestic large cap
|
9.0
|
|
9.0
|
|
—
|
|
—
|
|
—
|
|
1.0
|
|
1.0
|
|
—
|
|
|||||||||||||||
|
Domestic small cap
|
5.8
|
|
5.8
|
|
—
|
|
—
|
|
—
|
|
—
|
|
—
|
|
—
|
|
|||||||||||||||
|
International
|
25.3
|
|
25.3
|
|
—
|
|
—
|
|
—
|
|
—
|
|
—
|
|
—
|
|
|||||||||||||||
|
Fixed income securities
|
87.4
|
|
31.1
|
|
—
|
|
56.3
|
|
—
|
|
0.9
|
|
—
|
|
0.9
|
|
|||||||||||||||
|
Alternative investments**
|
0.1
|
|
—
|
|
—
|
|
—
|
|
0.1
|
|
0.1
|
|
—
|
|
0.1
|
|
|||||||||||||||
|
Total
|
$
|
128.7
|
|
$
|
71.2
|
|
$
|
1.1
|
|
$
|
56.3
|
|
$
|
0.1
|
|
$
|
3.2
|
|
$
|
2.2
|
|
$
|
1.0
|
|
|||||||
The following table sets forth by level, within the fair value hierarchy, the U.S. and French pension plans' assets at fair value as of
December 31, 2016
($ in millions):
|
United States
|
France
|
||||||||||||||||||||||||||||||
|
Plan Asset Category
|
Total
|
Other*
|
Level 1
|
Level 2
|
Level 3
|
Total
|
Level 1
|
Level 2
|
|||||||||||||||||||||||
|
Cash equivalents
|
$
|
1.2
|
|
$
|
—
|
|
$
|
1.2
|
|
$
|
—
|
|
$
|
—
|
|
$
|
1.5
|
|
$
|
1.5
|
|
$
|
—
|
|
|||||||
|
Equity securities
|
|||||||||||||||||||||||||||||||
|
Domestic large cap
|
8.3
|
|
8.3
|
|
—
|
|
—
|
|
—
|
|
1.2
|
|
1.2
|
|
—
|
|
|||||||||||||||
|
Domestic small cap
|
5.7
|
|
5.7
|
|
—
|
|
—
|
|
—
|
|
—
|
|
—
|
|
—
|
|
|||||||||||||||
|
International
|
23.7
|
|
23.7
|
|
—
|
|
—
|
|
—
|
|
—
|
|
—
|
|
—
|
|
|||||||||||||||
|
Fixed income securities
|
79.9
|
|
79.9
|
|
—
|
|
—
|
|
—
|
|
3.2
|
|
—
|
|
3.2
|
|
|||||||||||||||
|
Alternative investments**
|
0.1
|
|
—
|
|
—
|
|
—
|
|
0.1
|
|
0.2
|
|
—
|
|
0.2
|
|
|||||||||||||||
|
Total
|
$
|
118.9
|
|
$
|
117.6
|
|
$
|
1.2
|
|
$
|
—
|
|
$
|
0.1
|
|
$
|
6.1
|
|
$
|
2.7
|
|
$
|
3.4
|
|
|||||||
|
*
|
Assets are measured at NAV as a practical expedient and not subject to hierarchy level classification disclosure.
|
** Alternative investments include ownership interests in shares of registered investment companies.
103
SCHWEITZER-MAUDUIT INTERNATIONAL, INC. AND SUBSIDIARIES
NOTES TO CONSOLIDATED FINANCIAL STATEMENTS
Values for Level 3 assets may be determined through appraisals and models for illiquid assets. The following table shows the changes in Level 3 asset values ($ in millions):
|
U.S.
Level 3 Asset Reconciliation
|
Alternative
Investments
Total
|
||
|
Beginning balance, January 1, 2016
|
$
|
0.3
|
|
|
Realized and unrealized gains
|
—
|
|
|
|
Purchases
|
—
|
|
|
|
Sales
|
(0.2
|
)
|
|
|
Ending balance, December 31, 2016
|
$
|
0.1
|
|
|
Realized and unrealized gains
|
—
|
|
|
|
Purchases
|
—
|
|
|
|
Sales
|
—
|
|
|
|
Ending balance, December 31, 2017
|
$
|
0.1
|
|
The Company expects the following estimated undiscounted future pension benefit payments for the United States and France and future postretirement healthcare and life insurance benefit payments for the United States, which are to be made from pension plan and employer assets, net of amounts that will be funded from retiree contributions, and which reflect expected future service, as appropriate ($ in millions):
|
United States
|
France
|
||||||||||
|
Pension
Benefits
|
Healthcare
and Life
Insurance
Benefits
|
Pension
Benefits
|
|||||||||
|
2018
|
$
|
8.5
|
|
$
|
0.2
|
|
$
|
1.4
|
|
||
|
2019
|
8.4
|
|
0.1
|
|
2.1
|
|
|||||
|
2020
|
8.3
|
|
0.1
|
|
0.7
|
|
|||||
|
2021
|
8.3
|
|
0.1
|
|
1.3
|
|
|||||
|
2022
|
8.2
|
|
0.1
|
|
0.9
|
|
|||||
|
2023 - 2027
|
39.1
|
|
0.3
|
|
7.7
|
|
|||||
The Company is not required to contribute during 2018 to its U.S. and French pension plans; although, it may make discretionary contributions dependent on market conditions to remain aligned with its investment policy statement.
Other Foreign Pension Benefits
In Brazil, Poland and the United Kingdom, employees are covered under government-administered programs. In Canada, the employee pension benefits are not significant and therefore are not included in the above disclosures.
Other Benefits
We sponsor a qualified defined contribution plan covering substantially all U.S. employees. Under the plan, the Company matches a portion of employee contributions. The Company's cost under the plan was
$3.6 million
,
$2.5 million
and
$2.5 million
for the years ended
December 31, 2017
,
2016
and
2015
, respectively.
The Company provides U.S. executives, certain other key personnel and its directors the opportunity to participate in deferred compensation plans. Participating employees can elect to defer a portion of their salaries and certain other compensation. Participating directors can elect to defer their meeting fees, as a cash deferral, as well as their quarterly retainer fees, as deferred stock unit credits. The Company's liability balance under these deferred compensation plans totaled
$17.4 million
and
$15.4 million
at
December 31, 2017
and
2016
, respectively, which were included in the Consolidated Balance Sheets in other liabilities. In connection with these plans, the Company has a grantor trust into
104
SCHWEITZER-MAUDUIT INTERNATIONAL, INC. AND SUBSIDIARIES
NOTES TO CONSOLIDATED FINANCIAL STATEMENTS
which it has contributed funds toward its future obligations under the various plans (See Note
11
. Other Assets). The balance of grantor trust assets totaled
$12.2 million
and
$10.3 million
at
December 31, 2017
and
2016
, respectively, which were included in Other assets in the Consolidated Balance Sheets. These assets are restricted from Company use until all obligations are satisfied.
In accordance with French law, certain salaried employees in France may accumulate unused regular vacation and supplemental hours of paid leave that can be credited to an individual's Compte Epargne Temps, or CET. The CET account may grow over an individual's career and the hours accumulated may be withdrawn upon retirement or under other special circumstances at the individual's then current rate of pay. The balance of the Company's liability for this program reflected in the accompanying Consolidated Balance Sheets in Other liabilities was
$5.6 million
and
$5.3 million
at
December 31, 2017
and
2016
, respectively.
Note
18
. Stockholders' Equity
Restricted Stock Plan
In April 2015, the Company adopted a new 2015 Long-term Incentive Plan, or LTIP, which replaced its existing Restricted Stock Plan ("RSP"). The LTIP is intended to promote the Company's long-term financial success by attracting and retaining outstanding executive personnel and to motivate such personnel by means of equity grants. The Compensation Committee of the Company's Board of Directors selects participants and establishes the terms of any grant of restricted stock. The Company's LTIP provides that issuance of restricted stock immediately transfers ownership rights in shares of its Common Stock to the recipient of the grant, including the right to vote the shares and to receive dividends thereon. Other types of stock awards are available under the LTIP, but not currently used. The recipient's continued ownership of and right to freely transfer the restricted stock is subject to such conditions on transferability and to such risks of forfeiture as are established by the Compensation Committee at the time of the grant, which may include continued employment with the Company for a defined period, achievement of specified management performance objectives or other conditions established by the Compensation Committee. The number of shares which may be issued under the LTIP is limited to
5,000,000
. Restricted shares outstanding under the RSP will continue to vest in accordance with the terms of each grant, however, no further grants of shares will be issued under the RSP. No single participant may be awarded, in the aggregate, more than
750,000
shares during any fiscal year.
As of
December 31, 2017
,
1,584,454
restricted shares had been issued under the Company's restricted stock plans of which
283,338
shares of issued restricted stock were not yet vested and for which
$2.0 million
in unrecognized compensation expense is expected to be recognized over a weighted average period of
2.4
years. The following table presents restricted stock activity for the years
2017
,
2016
and
2015
:
|
2017
|
2016
|
2015
|
||||||||||||||||||
|
# of Shares
|
Weighted Average Fair Value at Date of Grant
|
# of Shares
|
Weighted Average Fair Value at Date of Grant
|
# of Shares
|
Weighted Average Fair Value at Date of Grant
|
|||||||||||||||
|
Nonvested restricted shares outstanding at January 1
|
224,289
|
|
$
|
41.30
|
|
197,674
|
|
$
|
43.56
|
|
366,363
|
|
$
|
38.24
|
|
|||||
|
Granted
|
216,017
|
|
36.03
|
|
150,647
|
|
39.47
|
|
107,346
|
|
45.34
|
|
||||||||
|
Forfeited
|
(29,150
|
)
|
42.50
|
|
(51,234
|
)
|
43.56
|
|
(39,322
|
)
|
40.93
|
|
||||||||
|
Vested
|
(127,818
|
)
|
41.06
|
|
(72,798
|
)
|
42.06
|
|
(236,713
|
)
|
36.57
|
|
||||||||
|
Nonvested restricted shares outstanding at December 31
|
283,338
|
|
$
|
37.26
|
|
224,289
|
|
$
|
41.30
|
|
197,674
|
|
$
|
43.56
|
|
|||||
105
SCHWEITZER-MAUDUIT INTERNATIONAL, INC. AND SUBSIDIARIES
NOTES TO CONSOLIDATED FINANCIAL STATEMENTS
Restricted Stock Plan Performance Based Shares
During
2017
, the Company recognized
$1.7 million
for
75,741
shares earned under the 2017-2018 award opportunity and
$2.2 million
of compensation expense earned under the 2016-2017 award opportunity. During
2016
, the Company recognized
$2.8 million
for
167,961
shares earned under the 2016-2017 award opportunity and
$1.5 million
of compensation expense earned under the 2015-2016 award opportunity. During
2015
, the Company recognized
$1.8 million
of compensation expense for
71,228
shares earned under the 2015-2016 award opportunity and
$0.6 million
of compensation expense earned under the 2014-2015 award opportunity.
Basic and Diluted Shares Reconciliation
The Company uses the two-class method to calculate earnings per share. The Company has granted restricted stock that contains nonforfeitable rights to dividends on unvested shares. Since these unvested shares are considered participating securities under the two-class method, the Company allocates earnings per share to common stock and participating securities according to dividends declared and participation rights in undistributed earnings.
Diluted net income per common share is computed based on net income divided by the weighted average number of common and potential common shares outstanding. Potential common shares during the respective periods are those related to dilutive stock-based compensation, including long-term share-based incentive compensation, stock options outstanding, and directors' accumulated deferred stock compensation which may be received by the directors in the form of stock or cash. A reconciliation of the average number of common and potential common shares outstanding used in the calculations of basic and diluted net income per share follows ($ in millions, shares in thousands):
|
For the Years Ended December 31,
|
|||||||||||
|
2017
|
2016
|
2015
|
|||||||||
|
Numerator (basic and diluted):
|
|||||||||||
|
Net income
|
$
|
34.5
|
|
$
|
82.8
|
|
$
|
89.7
|
|
||
|
Less: Dividends paid to participating securities
|
(0.4
|
)
|
(0.3
|
)
|
(0.2
|
)
|
|||||
|
Less: Undistributed earnings available to participating securities
|
—
|
|
(0.2
|
)
|
(0.3
|
)
|
|||||
|
Undistributed and distributed earnings available to common stockholders
|
$
|
34.1
|
|
$
|
82.3
|
|
$
|
89.2
|
|
||
|
Denominator:
|
|||||||||||
|
Average number of common shares outstanding
|
30,407.1
|
|
30,310.9
|
|
30,251.4
|
|
|||||
|
Effect of dilutive stock-based compensation
|
142.2
|
|
152.5
|
|
122.9
|
|
|||||
|
Average number of common and potential common shares outstanding
|
30,549.3
|
|
30,463.4
|
|
30,374.3
|
|
|||||
106
SCHWEITZER-MAUDUIT INTERNATIONAL, INC. AND SUBSIDIARIES
NOTES TO CONSOLIDATED FINANCIAL STATEMENTS
Note
19
. Commitments and Contingencies
Leases
Future minimum obligations under non-cancelable operating leases having an initial or remaining term in excess of one year as of
December 31, 2017
are as follows ($ in millions):
|
2018
|
$
|
6.2
|
|
|
2019
|
5.2
|
|
|
|
2020
|
4.8
|
|
|
|
2021
|
4.2
|
|
|
|
2022
|
3.7
|
|
|
|
Thereafter
|
9.7
|
|
|
|
Total
|
$
|
33.8
|
|
Rental expense under operating leases was
$6.4 million
during
2017
,
$6.9 million
during
2016
and
$6.8 million
during
2015
.
Other Commitments
The EP segment's PDM Industries plant has a minimum annual commitment of approximately
$1.6 million
per year for calcium carbonate purchases, a raw material used in the manufacturing of some paper products, which totals approximately
$10.9 million
through 2024. Future purchases are expected to be at levels that exceed such minimum levels under these contracts.
The Company enters into certain other immaterial contracts from time to time for the purchase of certain raw materials. The Company also enters into certain contracts for the purchase of equipment and related costs in connection with its ongoing capital projects.
The Company has agreements with an energy co-generation supplier in France whereby the supplier constructed and operates a co-generation facility at certain plants and supplies steam that is used in the operation of these plants. The Company is committed to purchasing minimum annual amounts of steam generated by these facilities under the agreements through
2020
. These minimum annual commitments total approximately
$1.6 million
. The Company's current and expected requirements for steam at these facilities are at levels that exceed the minimum levels under the contracts.
The EP segment's Brazilian plant, SWM-B, has an agreement for the transmission and distribution of energy that covers all of the plant's consumption of electrical energy valued at approximately
$3.4 million
annually through
2020
. The French plants have contracts for natural gas to be distributed to and consumed at PdM, LTRI and St. Girons. The value of the natural gas and distribution to be provided under these contracts is estimated at approximately
$3.0 million
in 2018. The Spay, France plant has a contract to consume biomass at approximately
$2.1 million
for each of the next two years.
The Company has certain other letters of credit, guarantees and surety bonds outstanding at
December 31, 2017
, which are not material either individually or in the aggregate.
107
SCHWEITZER-MAUDUIT INTERNATIONAL, INC. AND SUBSIDIARIES
NOTES TO CONSOLIDATED FINANCIAL STATEMENTS
Litigation
Brazil
Imposto sobre Circulação de Mercadorias e Serviços, or ICMS, a form of value-added tax in Brazil, was assessed to our Brazilian subsidiary Schweitzer-Mauduit do Brasil Indústria e Comércio de Papel Ltda. ("SWM-B") in December of 2000. SWM-B received
two
assessments from the tax authorities of the State of Rio de Janeiro for unpaid ICMS taxes on certain raw materials from January 1995 through November 2000, collectively the Raw Materials Assessment.
The Raw Materials Assessments concerned the accrual and use by SWM-B of ICMS tax credits generated from the production and sale of certain non-tobacco related grades of paper sold domestically. SWM-B has contested the Raw Materials Assessments based on Article 150, VI of the Brazilian Federal Constitution of 1988, which grants immunity from ICMS taxes to papers intended for printing books, newspapers and periodicals, or immune papers, and thus to the raw material inputs used to produce immune papers.
One
of the
two
assessments, or Assessment 1 (case number 2001.001.115144-5), related in part to tax periods that predated our acquisition of the Pirahy plant in Pirai, Brazil. In October 2015, the Federal Supreme Court of Brazil denied the State’s appeal of Assessment 1, in the amount of approximately
$16 million
, a decision which is now final. The second assessment, or Assessment 2 (case number 2001.001.064544-6), pertains exclusively to periods that SWM-B owned the Pirahy plant. Assessment 2 in the amount of approximately
$13 million
remains pending before the Federal Supreme Court of Brazil on SWM-B’s appeal on the merits and is likely to be finally decided by the action of the chamber of the court hearing the matter. No docket entry has been made yet regarding argument on Assessment 2.
SWM-B received assessments from the tax authorities of the State of Rio de Janeiro for unpaid ICMS and Fundo Estadual de Combate à Pobreza ("FECP", a value-added tax similar to ICMS) taxes on interstate purchases of electricity. The state issued
three
sets of assessments against SWM-B, one for May 2006 - November 2007, a second for January 2008 - December 2010, and a third for September 2011 - September 2013 (collectively the "Electricity Assessments"). SWM-B has challenged all three Electricity Assessments in administrative proceedings before the state tax council (in the first-level court Junta de Revisão Fiscal and the appellate court Conselho de Contribuintes) based on Resolution 1.610/89, which defers these taxes on electricity purchased by an "electricity-intensive consumer." In October and November 2014, a majority of the Conselho de Contribuintes sitting en banc ruled against SWM-B in each of the first and second electricity assessments. The State issued notices to SWM-B to pay approximately
$6 million
in connection with the first electricity assessment and
$9 million
in connection with the second electricity assessment, in each case based on the foreign currency exchange rate at
December 31, 2017
. SWM-B filed separate challenges to these electricity assessments in further court proceedings in the state judicial system, and different chambers of the judicial court granted SWM-B preliminary injunctions against enforcement. In March and July 2017, the first-level judicial court ruled that SWM-B must present additional evidence that it is an "electricity-intensive consumer" concerning the first and second electricity assessments. SWM-B is now pursuing these actions. SWM-B's challenge to the third electricity assessment (approximately
$4 million
as of
December 31, 2017
) was decided adversely to SWM-B at the first administrative level (Junta de Revisão Fiscal) and has been appealed to the Conselho de Contribuintes. The State issued a new regulation effective January 1, 2018 that only specific industries are “electricity-intensive consumers,” a list that excludes paper manufacturers.
SWM-B believes that both the remaining Raw Materials Assessment and the Electricity Assessments will ultimately be resolved in its favor. No liability has been recorded in our consolidated financial statements for these assessments based on our evaluation of these matters under the facts and law as presently understood. The Company can give no assurance as to the ultimate outcome of such proceedings.
France
In December 2016, the Conseil de Prud’hommes d’Orange (a French court dealing with labor matters) rendered a decision by which the Company’s wholly owned subsidiary, Schweitzer Mauduit France (“SWM France”), was ordered to pay approximately
€1.3 million
to
18
former employees of Malaucène Industries, another wholly owned subsidiary, on the grounds, among other things, that SWM France was a “co-employer” of the plaintiffs, and, as a result, liable for certain obligations of Malaucène Industries with respect to such employees. Malaucène Industries stopped production
108
SCHWEITZER-MAUDUIT INTERNATIONAL, INC. AND SUBSIDIARIES
NOTES TO CONSOLIDATED FINANCIAL STATEMENTS
in 2009. The Company believes that SWM France, which is a corporate holding company and indirect corporate parent of Malaucène Industries, is not a “co-employer” of any person and that the other claims are also without merit. The Company has no liability recorded in the consolidated financial statements for this matter, believing that the chances of SWM France to reverse the decision on appeal are sufficient that no such reserve is warranted. There can be no assurance, however, that the court of appeals will decide in favor of SWM France on any of the questions pending before the court.
Environmental Matters
The Company's operations are subject to various nations' federal, state and local laws, regulations and ordinances relating to environmental matters. The nature of the Company's operations exposes it to the risk of claims with respect to various environmental matters, and there can be no assurance that material costs or liabilities will not be incurred in connection with such claims. While the Company has incurred in the past several years, and will continue to incur, capital and operating expenditures in order to comply with environmental laws and regulations, it believes that its future cost of compliance with environmental laws, regulations and ordinances, and its exposure to liability for environmental claims and its obligation to participate in the remediation and monitoring of certain hazardous waste disposal sites, will not have a material effect on its financial condition or results of operations. However, future events, such as changes in existing laws and regulations, or unknown contamination of sites owned, operated or used for waste disposal by the Company (including contamination caused by prior owners and operators of such sites or other waste generators) may give rise to additional costs which could have a material effect on its financial condition or results of operations.
The Company incurs spending necessary to meet legal requirements and otherwise relating to the protection of the environment at its facilities in the United States, France, Poland, Brazil, China and Canada. For these purposes, the Company incurred total capital expenditures of
$1.1 million
in
2017
, and expects to incur less than
$1.0 million
in each of 2018 and 2019, of which no material amount is the result of environmental fines or settlements. The foregoing capital expenditures are not expected to reduce the Company's ability to invest in other appropriate and necessary capital projects and are not expected to have a material adverse effect on its financial condition or results of operations.
Indemnification Matters
In connection with its spin-off from Kimberly-Clark in 1995, the Company undertook to indemnify and hold Kimberly-Clark harmless from claims and liabilities related to the businesses transferred to it that were not identified as excluded liabilities in the related agreements. As of
December 31, 2017
, there are no claims pending under this indemnification that the Company deems to be material.
General Matters
In the ordinary course of conducting business activities, the Company and its subsidiaries become involved in certain other judicial, administrative and regulatory proceedings involving both private parties and governmental authorities. These proceedings include insured and uninsured regulatory, employment, intellectual property, general and commercial liability, environmental and other matters. At this time, the Company does not expect any of these proceedings to have a material effect on its reputation, business, financial condition, results of operations or cash flows. However, the Company can give no assurance that the results of any such proceedings will not materially affect its reputation, business, financial condition, results of operations or cash flows.
109
SCHWEITZER-MAUDUIT INTERNATIONAL, INC. AND SUBSIDIARIES
NOTES TO CONSOLIDATED FINANCIAL STATEMENTS
Note
20
. Segment Information
The Company's
two
operating product line segments are also the Company's reportable segments: Advanced Materials and Structures and Engineered Papers. The AMS segment primarily produces engineered resin-based rolled goods such as nets, films, and other non-wovens for use in high-performance applications in the filtration, infrastructure and construction, transportation, medical, and industrial end-markets. It consists of the operations of DelStar, the December 2014 acquisitions, Argotec and Conwed. The EP segment primarily produces cigarette papers including LIP papers, plug wrap papers and base tipping papers used to wrap various parts of a cigarette for sale to cigarette manufacturers and reconstituted tobacco leaf, or RTL, and wrapper and binder products for sale to cigarette and cigar manufacturers. The EP segment also includes commercial and industrial products such as lightweight printing and writing papers, battery separator paper, drinking straw wrap, filter paper and other specialized papers.
Information about Net Sales and Operating Profit
The Company primarily evaluates segment performance and allocates resources based on operating profit. Expense amounts not associated with segments are referred to as unallocated expenses.
|
($ in millions)
|
Net Sales
|
|||||||||||||||||||
|
For the Years Ended December 31,
|
||||||||||||||||||||
|
2017
|
|
2016
|
|
2015
|
||||||||||||||||
|
Advanced Materials & Structures
|
$
|
433.2
|
|
44.1
|
%
|
$
|
280.6
|
|
33.4
|
%
|
$
|
180.2
|
|
23.6
|
%
|
|||||
|
Engineered Papers
|
548.9
|
|
55.9
|
|
559.3
|
|
66.6
|
|
583.9
|
|
76.4
|
|
||||||||
|
Consolidated
|
$
|
982.1
|
|
100.0
|
%
|
$
|
839.9
|
|
100.0
|
%
|
$
|
764.1
|
|
100.0
|
%
|
|||||
|
($ in millions)
|
Operating Profit
|
|||||||||||||||||||
|
For the Years Ended December 31,
|
||||||||||||||||||||
|
2017
|
2016
|
2015
|
||||||||||||||||||
|
Advanced Materials & Structures
|
$
|
48.5
|
|
38.9
|
%
|
$
|
9.0
|
|
8.5
|
%
|
$
|
16.7
|
|
16.2
|
%
|
|||||
|
Engineered Papers
|
116.1
|
|
93.1
|
|
138.0
|
|
130.0
|
|
121.5
|
|
118.0
|
|
||||||||
|
Unallocated
|
(39.9
|
)
|
(32.0
|
)
|
(40.9
|
)
|
(38.5
|
)
|
(35.2
|
)
|
(34.2
|
)
|
||||||||
|
Consolidated
|
$
|
124.7
|
|
100.0
|
%
|
$
|
106.1
|
|
100.0
|
%
|
$
|
103.0
|
|
100.0
|
%
|
|||||
|
($ in millions)
|
Segment Assets
|
||||||||||
|
December 31, 2017
|
December 31, 2016
|
December 31, 2015
|
|||||||||
|
Advanced Materials & Structures
|
$
|
811.7
|
|
$
|
569.3
|
|
$
|
648.4
|
|
||
|
Engineered Papers
|
537.6
|
|
505.1
|
|
507.3
|
|
|||||
|
Unallocated
|
193.2
|
|
99.3
|
|
134.3
|
|
|||||
|
Consolidated
|
$
|
1,542.5
|
|
$
|
1,173.7
|
|
$
|
1,290.0
|
|
||
|
($ in millions)
|
Capital Spending
|
Depreciation
|
|||||||||||||||||||||
|
2017
|
2016
|
2015
|
2017
|
2016
|
2015
|
||||||||||||||||||
|
Advanced Materials & Structures
|
$
|
11.5
|
|
$
|
10.1
|
|
$
|
11.2
|
|
$
|
12.3
|
|
$
|
7.1
|
|
$
|
5.5
|
|
|||||
|
Engineered Papers
|
25.6
|
|
17.6
|
|
12.5
|
|
23.4
|
|
22.3
|
|
25.6
|
|
|||||||||||
|
Unallocated
|
0.1
|
|
0.1
|
|
0.5
|
|
—
|
|
—
|
|
(0.4
|
)
|
|||||||||||
|
Consolidated
|
$
|
37.2
|
|
$
|
27.8
|
|
$
|
24.2
|
|
$
|
35.7
|
|
$
|
29.4
|
|
$
|
30.7
|
|
|||||
110
SCHWEITZER-MAUDUIT INTERNATIONAL, INC. AND SUBSIDIARIES
NOTES TO CONSOLIDATED FINANCIAL STATEMENTS
Information about Geographic Areas
Long-lived assets by geographic area as of year-end were as follows ($ in millions):
|
Long-Lived Assets
|
|||||||||||
|
2017
|
2016
|
2015
|
|||||||||
|
United States
|
$
|
115.0
|
|
$
|
89.6
|
|
$
|
87.5
|
|
||
|
France
|
181.3
|
|
162.7
|
|
163.5
|
|
|||||
|
Brazil
|
24.2
|
|
23.7
|
|
20.1
|
|
|||||
|
Poland
|
21.9
|
|
20.0
|
|
23.6
|
|
|||||
|
Other foreign countries
|
26.9
|
|
15.8
|
|
15.9
|
|
|||||
|
Consolidated
|
$
|
369.3
|
|
$
|
311.8
|
|
$
|
310.6
|
|
||
For the geographic disclosure in the following table, net sales are attributed to geographic locations based on the location of the Company's direct customers ($ in millions):
|
Net Sales
|
|||||||||||
|
2017
|
2016
|
2015
|
|||||||||
|
United States
|
$
|
468.9
|
|
$
|
372.2
|
|
$
|
310.7
|
|
||
|
Europe and the former Commonwealth of Independent States
|
259.9
|
|
253.2
|
|
261.2
|
|
|||||
|
Asia-Pacific (including China)
|
148.4
|
|
129.4
|
|
118.5
|
|
|||||
|
Latin America
|
57.9
|
|
47.4
|
|
34.6
|
|
|||||
|
Other foreign countries
|
47.0
|
|
37.7
|
|
39.1
|
|
|||||
|
Consolidated
|
$
|
982.1
|
|
$
|
839.9
|
|
$
|
764.1
|
|
||
Note
21
. Major Customers
There were no individual customers in the AMS segment which made up 10% or more of the Company's
2017
,
2016
or
2015
consolidated net sales. In our EP segment, two customers, together with their respective affiliates and designated converters, each accounted for more than 10% or more of the Company's consolidated net sales and together accounted for
23%
of the Company's consolidated net sales for the year ended
December 31, 2017
. For the year ended December 31, 2016, one customer, together with its respective affiliates and designated converters, accounted for
18%
of the Company's consolidated net sales. Philip Morris-USA, British American Tobacco and Japan Tobacco Inc. together with their respective affiliates and designated converters, each accounted for 10% or more of the Company's consolidated net sales in
2015
and together accounted for
42%
of the Company's
2015
consolidated net sales. The loss of one or more such customers, or a significant reduction in one or more of these customers' purchases, could have a material adverse effect on the Company's results of operations.
There were no individual customers in the AMS segment which made up 10% or more of the Company's consolidated accounts receivable at
December 31, 2017
or
2016
. In the EP segment, one customer, together with its respective affiliates and designated converters, accounted for
12%
of the Company's consolidated accounts receivable at
December 31, 2017
. There were no customers that accounted for 10% or more of consolidated accounts receivable at
December 31, 2016
.
111
SCHWEITZER-MAUDUIT INTERNATIONAL, INC. AND SUBSIDIARIES
NOTES TO CONSOLIDATED FINANCIAL STATEMENTS
Note
22
. Supplemental Disclosures
Analysis of Allowances for Doubtful Accounts:
($ in millions)
|
For the Years Ended December 31,
|
|||||||||||
|
2017
|
2016
|
2015
|
|||||||||
|
Allowance for Doubtful Accounts
|
|||||||||||
|
Beginning balance
|
$
|
0.8
|
|
$
|
0.4
|
|
$
|
0.3
|
|
||
|
Bad debt expense
|
0.8
|
|
0.4
|
|
0.2
|
|
|||||
|
Write-offs and discounts
|
(0.6
|
)
|
—
|
|
(0.1
|
)
|
|||||
|
Currency translation
|
—
|
|
—
|
|
—
|
|
|||||
|
Ending balance
|
$
|
1.0
|
|
$
|
0.8
|
|
$
|
0.4
|
|
||
Supplemental Cash Flow Information
($ in millions)
|
For the Years Ended December 31,
|
|||||||||||
|
2017
|
2016
|
2015
|
|||||||||
|
Interest paid
|
$
|
22.7
|
|
$
|
13.3
|
|
$
|
7.8
|
|
||
|
Income taxes paid
|
38.1
|
|
31.9
|
|
9.3
|
|
|||||
|
Capital spending in accounts payable and accrued liabilities
|
7.7
|
|
8.8
|
|
2.6
|
|
|||||
|
Deferred contingent business acquisition consideration
|
8.6
|
|
—
|
|
—
|
|
|||||
112
SCHWEITZER-MAUDUIT INTERNATIONAL, INC. AND SUBSIDIARIES
NOTES TO CONSOLIDATED FINANCIAL STATEMENTS
Note
23
. Quarterly Financial Information (Unaudited)
The following tables summarize the Company's unaudited quarterly financial data for the years ended
December 31, 2017
and
2016
($ in millions, except per share amounts):
|
2017
|
|||||||||||||||||||
|
First
Quarter
|
Second
Quarter
|
Third
Quarter
|
Fourth
Quarter
|
Year
|
|||||||||||||||
|
Net sales
|
$
|
233.3
|
|
$
|
255.3
|
|
$
|
257.8
|
|
$
|
235.7
|
|
$
|
982.1
|
|
||||
|
Gross profit
|
63.1
|
|
76.6
|
|
75.8
|
|
66.8
|
|
282.3
|
|
|||||||||
|
Restructuring and impairment expense
|
1.1
|
|
1.6
|
|
1.5
|
|
3.9
|
|
8.1
|
|
|||||||||
|
Operating profit
|
26.6
|
|
39.5
|
|
38.5
|
|
20.1
|
|
124.7
|
|
|||||||||
|
Income (loss) from continuing operations
|
13.7
|
|
22.3
|
|
25.7
|
|
(27.3
|
)
|
34.4
|
|
|||||||||
|
Income from discontinued operations
|
—
|
|
—
|
|
0.1
|
|
—
|
|
0.1
|
|
|||||||||
|
Net (loss) income
|
$
|
13.7
|
|
$
|
22.3
|
|
$
|
25.8
|
|
$
|
(27.3
|
)
|
$
|
34.5
|
|
||||
|
Net income (loss) per share:
|
|||||||||||||||||||
|
Income (loss) per share from continuing operations - basic
|
$
|
0.45
|
|
$
|
0.73
|
|
$
|
0.84
|
|
$
|
(0.90
|
)
|
$
|
1.12
|
|
||||
|
Income per share from discontinued operations - basic
|
—
|
|
—
|
|
—
|
|
—
|
|
—
|
|
|||||||||
|
Net income (loss) per share - basic
|
$
|
0.45
|
|
$
|
0.73
|
|
$
|
0.84
|
|
$
|
(0.90
|
)
|
$
|
1.12
|
|
||||
|
|
|||||||||||||||||||
|
Income (loss) per share from continuing operations - diluted
|
$
|
0.45
|
|
$
|
0.72
|
|
$
|
0.84
|
|
$
|
(0.89
|
)
|
$
|
1.12
|
|
||||
|
Income per share from discontinued operations - diluted
|
—
|
|
—
|
|
—
|
|
—
|
|
—
|
|
|||||||||
|
Net income (loss) per share - diluted
|
$
|
0.45
|
|
$
|
0.72
|
|
$
|
0.84
|
|
$
|
(0.89
|
)
|
$
|
1.12
|
|
||||
113
SCHWEITZER-MAUDUIT INTERNATIONAL, INC. AND SUBSIDIARIES
NOTES TO CONSOLIDATED FINANCIAL STATEMENTS
|
2016
|
|||||||||||||||||||
|
First
Quarter
|
Second
Quarter
|
Third
Quarter
|
Fourth
Quarter
|
Year
|
|||||||||||||||
|
Net sales
|
$
|
214.6
|
|
$
|
217.3
|
|
$
|
209.3
|
|
$
|
198.7
|
|
$
|
839.9
|
|
||||
|
Gross profit
|
63.5
|
|
66.9
|
|
63.1
|
|
63.2
|
|
256.7
|
|
|||||||||
|
Restructuring and impairment expense
|
1.8
|
|
0.9
|
|
1.3
|
|
21.6
|
|
25.6
|
|
|||||||||
|
Operating profit
|
31.6
|
|
37.5
|
|
30.8
|
|
6.2
|
|
106.1
|
|
|||||||||
|
Income from continuing operations
|
21.1
|
|
26.0
|
|
18.7
|
|
17.0
|
|
82.8
|
|
|||||||||
|
(Loss) income from discontinued operations
|
—
|
|
—
|
|
—
|
|
—
|
|
—
|
|
|||||||||
|
Net income
|
$
|
21.1
|
|
$
|
26.0
|
|
$
|
18.7
|
|
$
|
17.0
|
|
$
|
82.8
|
|
||||
|
Net income per share:
|
|||||||||||||||||||
|
Income per share from continuing operations - basic
|
$
|
0.69
|
|
$
|
0.85
|
|
$
|
0.62
|
|
$
|
0.55
|
|
$
|
2.71
|
|
||||
|
(Loss) income per share from discontinued operations - basic
|
—
|
|
—
|
|
—
|
|
—
|
|
—
|
|
|||||||||
|
Net income per share - basic
|
$
|
0.69
|
|
$
|
0.85
|
|
$
|
0.62
|
|
$
|
0.55
|
|
$
|
2.71
|
|
||||
|
Income per share from continuing operations - diluted
|
$
|
0.69
|
|
$
|
0.85
|
|
$
|
0.61
|
|
$
|
0.55
|
|
$
|
2.70
|
|
||||
|
(Loss) income per share from discontinued operations - diluted
|
—
|
|
—
|
|
—
|
|
—
|
|
—
|
|
|||||||||
|
Net income per share - diluted
|
$
|
0.69
|
|
$
|
0.85
|
|
$
|
0.61
|
|
$
|
0.55
|
|
$
|
2.70
|
|
||||
114
REPORT OF INDEPENDENT REGISTERED PUBLIC ACCOUNTING FIRM
To the shareholders and the Board of Directors of Schweitzer-Mauduit International, Inc. and Subsidiaries
Opinion on the Financial Statements
We have audited the accompanying consolidated balance sheets of Schweitzer-Mauduit International, Inc. and subsidiaries (the "Company") as of December 31, 2017 and 2016, the related consolidated statements of statements of income, comprehensive income, changes in stockholders' equity, and cash flows for each of the three years in the period ended December 31, 2017, and the related notes (collectively referred to as the “financial statements”). In our opinion, the financial statements present fairly, in all material respects, the financial position of the Company as of December 31, 2017 and 2016, and the results of its operations and its cash flows for each of the three years in the period ended December 31, 2017, in conformity with accounting principles generally accepted in the United States of America.
We have also audited, in accordance with the standards of the Public Company Accounting Oversight Board (United States) (PCAOB), the Company's internal control over financial reporting as of December 31, 2017, based on criteria established in
Internal Control - Integrated Framework (2013)
issued by the Committee of Sponsoring Organizations of the Treadway Commission and our report dated March 1, 2018, expressed an unqualified opinion on the Company's internal control over financial reporting.
Basis for Opinion
These financial statements are the responsibility of the Company's management. Our responsibility is to express an opinion on the Company's financial statements based on our audits. We are a public accounting firm registered with the PCAOB and are required to be independent with respect to the Company in accordance with the U.S. federal securities laws and the applicable rules and regulations of the Securities and Exchange Commission and the PCAOB.
We conducted our audits in accordance with the standards of the PCAOB. Those standards require that we plan and perform the audit to obtain reasonable assurance about whether the financial statements are free of material misstatement, whether due to error or fraud. Our audits included performing procedures to assess the risks of material misstatement of the financial statements, whether due to error or fraud, and performing procedures that respond to those risks. Such procedures included examining, on a test basis, evidence regarding the amounts and disclosures in the financial statements. Our audits also included evaluating the accounting principles used and significant estimates made by management, as well as evaluating the overall presentation of the financial statements. We believe that our audits provide a reasonable basis for our opinion.
/s/ Deloitte & Touche LLP
Atlanta, Georgia
March 1, 2018
We have served as the Company's auditor since 1995.
115
Item 9.
Changes in and Disagreements with Accountants on Accounting and Financial Disclosure
None.
Item 9A.
Controls and Procedures
Evaluation of Disclosure Controls and Procedures
We maintain disclosure controls and procedures (as defined in Rules 13a-15(e) and 15(d)-15(e) of the Securities Exchange Act of 1934, as amended (the "Exchange Act")) that are designed to ensure that information required to be disclosed in our reports filed or submitted under the Exchange Act is recorded, processed, summarized and reported within the time frames specified in SEC rules and forms, and that such information is accumulated and communicated to our management, including our principal executive officer and principal financial officer, as appropriate, to allow timely decisions regarding required disclosures.
An evaluation of the effectiveness of the design and operation of our disclosure controls and procedures, as of
December 31, 2017
, was made under the supervision and with the participation of our management including our principal executive officer and principal financial officer. Based upon this evaluation, our principal executive officer and principal financial officer have concluded that our disclosure controls and procedures were effective.
Our management, including our Chief Executive Officer and our Co-Chief Financial Officer and Principal Financial Officer, does not expect that our disclosure controls and procedures or our internal controls will prevent all errors and all fraud. A control system, no matter how well conceived and operated, is designed to provide only reasonable, not absolute, assurance that the objectives of the control system are met. Further, the design of a control system must reflect the fact that there are resource constraints, and the benefits of controls must be considered relative to their costs. Because of the inherent limitations in all control systems, no evaluation of controls can provide absolute assurance that all control issues and instances of fraud, if any, within the Company have been detected.
Management's Annual Report on Internal Control Over Financial Reporting
Our management is responsible for establishing and maintaining adequate internal control over financial reporting (as defined in Rule 13a-15(f) under the Exchange Act). Our management assessed the effectiveness of our internal control over financial reporting as of
December 31, 2017
. In making this assessment, our management used the criteria set forth in
Internal Control - Integrated Framework
issued by the Committee of Sponsoring Organizations of the Treadway Commission (2013). Based on the Company's evaluation under the framework in
Internal Control - Integrated Framework,
our management has concluded that, as of
December 31, 2017
, our internal control over financial reporting is effective based on these criteria. As of
December 31, 2017
, we had no material weaknesses based on our tests using the criteria set forth in
Internal Control - Integrated Framework
issued by the Committee of Sponsoring Organizations of the Treadway Commission (2013). Our independent registered public accounting firm, Deloitte & Touche LLP, has issued an audit report on its assessment of our internal control over financial reporting, which is included herein.
The SEC's general guidance permits the exclusion of an assessment of the effectiveness of a registrant's controls and procedures as they relate to its internal control over financial reporting for an acquired business during the first year following such acquisition if, among other circumstances and factors, there is not an adequate amount of time between the acquisition date and the date of assessment. In January 2017, we acquired Conwed Plastics LLC which was treated as a business combination in accordance with guidance provided by ASC 805. In accordance with the SEC guidance, the scope of our evaluation of internal controls over financial reporting as of December 31, 2017 did not include the internal control over financial reporting of these acquired operations. Assets acquired in these transactions represented 17.6% of our total consolidated assets at December 31, 2017 and net sales generated by the acquired operations represented 14.4% of our consolidated net sales for the year ended December 31, 2017. From the acquisition date to December 31, 2017, the processes and systems of the acquired operations did not significantly impact our internal control over financial reporting.
116
Changes in Internal Control Over Financial Reporting
There were no changes in our internal control over financial reporting during the quarter ended
December 31, 2017
that have materially affected, or are reasonably likely to materially affect, our internal control over financial reporting.
Item 9B.
Other Information
Not applicable.
117
REPORT OF INDEPENDENT REGISTERED PUBLIC ACCOUNTING FIRM
To the shareholders and the Board of Directors of Schweitzer-Mauduit International, Inc. and Subsidiaries
Opinion on Internal Control over Financial Reporting
We have audited the internal control over financial reporting of Schweitzer-Mauduit International, Inc. and Subsidiaries (the “Company”) as of December 31, 2017, based on criteria established in
Internal Control - Integrated Framework (2013)
issued by the Committee of Sponsoring Organizations of the Treadway Commission (COSO). In our opinion, the Company maintained, in all material respects, effective internal control over financial reporting as of December 31, 2017, based on criteria established in
Internal Control - Integrated Framework (2013)
issued by COSO.
We have also audited, in accordance with the standards of the Public Company Accounting Oversight Board (United States) (PCAOB), the consolidated financial statements of Schweitzer-Mauduit International, Inc. and subsidiaries as of and for the year ended December 31, 2017 of the Company and our report dated March 1, 2018, expressed an unqualified opinion on those financial statements.
As described in Management’s Annual Report on Internal Control over Financial Reporting, management excluded from its assessment the internal control over financial reporting at Conwed Plastics LLC, which was acquired on January 20, 2017 and whose financial statements constitute 18% of total assets and 14% of revenues of the consolidated financial statement amounts as of and for the year ended December 31, 2017. Accordingly, our audit did not include the internal control over financial reporting at Conwed Plastics LLC.
Basis for Opinion
The Company’s management is responsible for maintaining effective internal control over financial reporting and for its assessment of the effectiveness of internal control over financial reporting, included in the accompanying Management’s Annual Report on Internal Control over Financial Reporting. Our responsibility is to express an opinion on the Company’s internal control over financial reporting based on our audit. We are a public accounting firm registered with the PCAOB and are required to be independent with respect to the Company in accordance with the U.S. federal securities laws and the applicable rules and regulations of the Securities and Exchange Commission and the PCAOB.
We conducted our audit in accordance with the standards of the PCAOB. Those standards require that we plan and perform the audit to obtain reasonable assurance about whether effective internal control over financial reporting was maintained in all material respects. Our audit included obtaining an understanding of internal control over financial reporting, assessing the risk that a material weakness exists, testing and evaluating the design and operating effectiveness of internal control based on the assessed risk, and performing such other procedures as we considered necessary in the circumstances. We believe that our audit provides a reasonable basis for our opinion.
Definition and Limitations of Internal Control over Financial Reporting
A company’s internal control over financial reporting is a process designed to provide reasonable assurance regarding the reliability of financial reporting and the preparation of financial statements for external purposes in accordance with generally accepted accounting principles. A company’s internal control over financial reporting includes those policies and procedures that (1) pertain to the maintenance of records that, in reasonable detail, accurately and fairly reflect the transactions and dispositions of the assets of the company; (2) provide reasonable assurance that transactions are recorded as necessary to permit preparation of financial statements in accordance with generally accepted accounting principles, and that receipts and expenditures of the company are being made only in accordance with authorizations of management and directors of the company; and (3) provide reasonable assurance regarding prevention or timely detection of unauthorized acquisition, use, or disposition of the company’s assets that could have a material effect on the financial statements.
Because of its inherent limitations, internal control over financial reporting may not prevent or detect misstatements. Also, projections of any evaluation of effectiveness to future periods are subject to the risk that controls may become inadequate because of changes in conditions, or that the degree of compliance with the policies or procedures may deteriorate.
/s/ Deloitte & Touche LLP
Atlanta, Georgia
March 1, 2018
118
Item 10.
Directors, Executive Officers and Corporate Governance
Certain information called for by this Item is hereby incorporated by reference to the sections of our proxy statement relating to our 2018 Annual Meeting of Stockholders (the "2018 Proxy Statement") captioned "Proposal One - Election of Directors", "Corporate Governance" and "Section 16(a) Beneficial Ownership Reporting Compliance". Information with respect to our executive officers is set forth in Part I, Item 1 of this Form 10-K under the caption, "Executive Officers of the Registrant."
Item 11.
Executive Compensation
The information in the section of the 2018 Proxy Statement captioned "Executive Compensation," including the item captioned "Compensation Discussion and Analysis," is incorporated in this Item 11 by reference.
Item 12.
Security Ownership of Certain Beneficial Owners and Management and Related Stockholder Matters
Securities Authorized for Issuance under Equity Compensation Plans
The information in the section of the 2018 Proxy Statement entitled "Stock Ownership" is incorporated in this Item 12 by reference. The following table provides information, as of
December 31, 2017
, with respect to the shares of our Common Stock that may be issued under our existing equity compensation plans:
|
Plan Category
|
Number of Securities Remaining Available for Future Issuance Under Equity Compensation Plans
|
||
|
Equity compensation plans approved by stockholders:
|
|||
|
Outside Directors Stock Plan
(1)
|
110,046
|
|
|
|
Long-Term Incentive Plan
(2)
|
4,689,489
|
|
|
|
Total approved by stockholders
|
4,799,535
|
|
|
|
Equity compensation plans not approved by stockholders
|
—
|
|
|
|
Grand total
|
4,799,535
|
|
|
(1) The Outside Directors Stock Plan consists of shares registered for the purpose of issuance to our outside directors for payment of their retainer fees quarterly in advance. Director's retainer fees in
2017
consisted of $20,000 quarterly which are payable in our Common Stock. The number of shares issued each quarter is determined based on the then fair market value of the shares, which is determined in accordance with the plan at the closing price on the date one day prior to the date of distribution. Certain directors have elected to defer receipt of quarterly retainer fees under the terms of our Deferred Compensation Plan No. 2 for Non-Employee Directors, resulting in an accumulation of stock unit credits. The director has the option, upon retirement or earlier termination from the Board, to have these stock unit credits distributed in the form of our Common Stock or cash. While held in the deferred compensation plan account, these stock unit credits carry no voting rights and cannot be traded as Common Stock, although declared dividends create additional stock unit credits. As of
December 31, 2017
, deferred retainer fees have resulted in 119,281 accumulated stock unit credits, excluding credited dividends (151,743 accumulated stock unit credits including credited dividends).
(2) The Long-term Incentive Plan and former Restricted Stock Plan are described in Note
18
. Stockholders' Equity, of the Notes to Consolidated Financial Statements in Part II, Item 8 herein. Shares awarded under the terms of these plans are subject to forfeiture and cannot be sold or otherwise transferred until fully vested or such restrictions are otherwise lifted. Such shares are deemed by us to be issued and outstanding and are subject to all other financial interests, including our declared dividends. As of
December 31, 2017
,
283,338
shares issued under these plans remained restricted.
119
Item 13.
Certain Relationships and Related Transactions, and Director Independence
The information in the sections of the 2018 Proxy Statement captioned "Corporate Governance," including the items captioned "Transactions with Related Persons" and "Board of Directors and Standing Committees" is incorporated in this Item 13 by reference.
Item 14.
Principal Accountant Fees and Services
The information in the section of the 2018 Proxy Statement captioned "Proposal Two - Ratification of the Selection of the Independent Registered Public Accounting Firm" is incorporated in this Item 14 by reference.
120
Item 15.
Exhibits and Financial Statement Schedules
|
(a)
|
The consolidated financial statements and financial statement schedules filed as part of this report are listed in the Index to the Consolidated Financial Statements set forth in Part II, Item 8.
|
(b) The exhibits filed as part of this report are listed below:
|
Exhibit
Number
|
Exhibit
|
|
|
2.1
|
||
|
2.2
|
||
|
2.3
|
||
|
3.1
|
||
|
3.2
|
||
|
4.1
|
||
|
10.1
|
||
|
10.2
|
||
|
10.3
|
||
|
10.4.1
|
||
|
10.4.2
|
||
|
10.5
|
||
|
10.6.1
|
||
|
10.6.2
|
||
|
10.6.3
|
||
|
10.7
|
||
121
|
Exhibit
Number
|
Exhibit
|
|
|
10.8
|
||
|
*10.9
|
||
|
10.10.1
|
||
|
10.10.2
|
||
|
10.10.3
|
||
|
10.10.4
|
||
|
10.10.5
|
||
|
10.11.1
|
||
|
10.11.2
|
||
|
10.11.3
|
||
|
10.11.4
|
||
|
10.12
|
||
|
10.13
|
||
|
10.14
|
||
|
10.15
|
||
122
|
Exhibit
Number
|
Exhibit
|
|
|
10.16
|
||
|
10.17.1
|
||
|
10.17.2
|
||
|
10.18
|
|
|
|
10.19
|
|
|
|
*21.1
|
||
|
*23.1
|
||
|
*24.1
|
||
|
*31.1
|
||
|
*31.2
|
||
|
*32
|
||
|
99.2
|
||
|
101
|
The following materials from the Company's Annual Report on Form 10-K for the year ended December 31, 2017, formatted in Extensible Business Reporting Language ("XBRL"): (i) the Consolidated Statements of Income, (ii) the Consolidated Statements of Comprehensive Income, (iii) the Consolidated Balance Sheets, (iv) the Consolidated Statements of Changes in Stockholders' Equity, (v) the Consolidated Statements of Cash Flow, and (vi) Notes to Consolidated Financial Statements (furnished herewith).
|
|
|
*
|
Filed herewith.
|
|
**
|
Management contract or compensatory plan or arrangement required to be filed as an exhibit pursuant to Item 15(b) of Form 10-K
|
|
***
|
Schedules omitted pursuant to Item 601(b)(2) of Regulation S-K. The Company agrees to furnish a supplemental copy of any omitted schedule to the SEC upon request.
|
|
‡
|
These Section 906 certifications are not being incorporated by reference into the Form 10-K filing or otherwise deemed to be filed with the SEC.
|
123
SIGNATURES
Pursuant to the requirements of Section 13 or 15(d) of the Securities Exchange Act of 1934, the registrant has duly caused this report to be signed on its behalf by the undersigned, thereunto duly authorized.
|
Schweitzer-Mauduit International, Inc.
|
|||
|
By:
|
|||
|
Dated:
|
March 1, 2018
|
/s/ Dr. Jeffrey Kramer
|
|
|
Dr. Jeffrey Kramer
|
|||
|
Chief Executive Officer
|
|||
|
(principal executive officer)
|
|||
Pursuant to the requirements of the Securities Exchange Act of 1934, this report has been signed below by the following persons on behalf of the registrant and in the capacities and on the dates indicated.
|
Name
|
Position
|
Date
|
||
|
/s/ Dr. Jeffrey Kramer
|
Chief Executive Officer and Director
|
March 1, 2018
|
||
|
Dr. Jeffrey Kramer
|
(principal executive officer)
|
|||
|
/s/ Allison Aden
|
Co-Chief Financial Officer
|
March 1, 2018
|
||
|
Allison Aden
|
(principal financial officer)
|
|||
|
/s/ Robert Cardin
|
Corporate Controller
|
March 1, 2018
|
||
|
Robert Cardin
|
(principal accounting officer)
|
|||
|
*
|
Director
|
March 1, 2018
|
||
|
Claire L. Arnold
|
||||
|
*
|
Director
|
March 1, 2018
|
||
|
K.C. Caldabaugh
|
||||
|
*
|
Director
|
March 1, 2018
|
||
|
William A. Finn
|
||||
|
*
|
Director
|
March 1, 2018
|
||
|
Jeffrey Keenan
|
||||
|
*
|
Director
|
March 1, 2018
|
||
|
Marco Levi
|
||||
|
*
|
Director
|
March 1, 2018
|
||
|
John D. Rogers
|
||||
|
*
|
Director
|
March 1, 2018
|
||
|
Anderson D. Warlick
|
||||
|
*By:
|
||||
|
/s/ Ricardo Nunez
|
March 1, 2018
|
|||
|
Ricardo Nunez
|
||||
|
Attorney-In-Fact
|
||||
124
GLOSSARY OF TERMS
The following are definitions of certain terms used in this Form 10-K filing:
|
•
|
"Banded cigarette paper"
is a type of paper, used to produce lower ignition propensity cigarettes, by applying bands to the paper during the papermaking process.
|
|
•
|
"Extruded netting"
is a type of plastic mesh that can be used for support netting in a variety of filtration-type products.
|
|
•
|
"Flax"
is a cellulose fiber from a flax plant used as a raw material in the production of certain cigarette papers.
|
|
•
|
"Lower ignition propensity cigarette paper"
includes banded and print banded cigarette paper, both of which contain bands, which increase the likelihood that an unattended cigarette will self-extinguish.
|
|
•
|
"Net debt to EBITDA ratio"
is a financial measurement used in bank covenants where "
Net Debt
" is defined as consolidated total debt minus unrestricted domestic cash and cash equivalents and 65% of non-domestic unrestricted domestic cash and cash equivalents, in excess of $15 million, and "
EBITDA"
is defined as net income plus the sum of interest expense, income tax expense, depreciation and amortization, non-cash restructuring and impairment charges less amortization of deferred revenue and interest in the earnings of equity affiliates to the extent such earnings are not distributed to the Company.
|
|
•
|
"Total debt to capital ratio"
is total debt divided by the sum of total debt and total stockholders' equity.
|
|
•
|
"Net debt to equity ratio"
is total debt less cash and cash equivalents, divided by stockholders' equity.
|
|
•
|
"Net debt to EBITDA ratio"
is total debt less cash and cash equivalents divided by EBITDA.
|
|
•
|
"Net operating working capital"
is accounts receivable, inventory, income taxes receivable and prepaid expense, less accounts payable, accrued expenses and income taxes payable.
|
|
•
|
"Nonwovens"
are a fabric-like material made from long fibers, bonded together by chemical, mechanical, heat or solvent treatment. The term is used to denote fabrics, such as felt, which are neither woven nor knitted.
|
|
•
|
"Operating profit return on assets"
is operating profit divided by average total assets.
|
|
•
|
"Polyurethane"
is a polymer composed of organic units joined by carbamate (urethane) links.
|
|
•
|
"Print banded cigarette paper"
is a type of paper, used to produce lower ignition propensity cigarettes, with bands added to the paper during a printing process, subsequent to the papermaking process.
|
|
•
|
"Reconstituted tobacco"
is produced in two forms: leaf, or reconstituted tobacco leaf, and wrapper and binder products. Reconstituted tobacco leaf is blended with virgin tobacco as a design aid to achieve certain attributes of finished cigarettes. Wrapper and binder are reconstituted tobacco products used by manufacturers of cigars.
|
|
•
|
"Restructuring expense"
represents expenses incurred in connection with activities intended to significantly change the size or nature of the business operations, including significantly reduced utilization of operating equipment, exit of a product or market or a significant workforce reduction and charges to reduce property, plant and equipment to its fair value.
|
|
•
|
"Reverse osmosis"
is a water purification technology that uses a semipermeable membrane to remove larger particles from drinking water.
|
|
•
|
"Start-up costs"
are costs incurred prior to generation of income producing activities in the case of a new plant, or costs incurred in excess of expected ongoing normal costs in the case of a new or rebuilt machine. Start-up costs can include excess variable costs such as raw materials, utilities and labor and unabsorbed fixed costs.
|
|
•
|
"Thermoplastics"
are a plastic material, polymer, that becomes pliable or moldable above a specific temperature and solidifies upon cooling.
|
|
•
|
"Tobacco paper"
includes cigarette paper which wraps the column of tobacco within a cigarette and has varying properties such as basis weight, porosity, opacity, tensile strength, texture and burn rate, as well as plug wrap paper which wraps the outer layer of a cigarette filter and is used to hold the filter materials in a cylindrical form, and tipping paper which joins the filter element to the tobacco-filled column of the cigarette and is both printable and glueable at high speeds.
|
125
TABLE OF CONTENTS
Part IItem 1. BusinessItem 1A. Risk FactorsItem 1B. Unresolved Staff CommentsItem 2. PropertiesItem 3. Legal ProceedingsItem 4. Mine Safety DisclosuresPart IIItem 5. Market For Registrant's Common Equity, Related Stockholder Matters and Issuer Purchases Of Equity SecuritiesItem 6. Selected Financial DataItem 7. Management's Discussion and Analysis Of Financial Condition and Results Of OperationsItem 7A. Quantitative and Qualitative Disclosures About Market RiskItem 8. Financial Statements and Supplementary DataNote 1 . GeneralNote 2 . Summary Of Significant Accounting PoliciesNote 3 . Business AcquisitionsNote 4 . Discontinued OperationsNote 5 . Accounts ReceivableNote 6 . InventoriesNote 7 . Property, Plant and EquipmentNote 8 . Joint VenturesNote 9 . GoodwillNote 10 . Intangible AssetsNote 11 . Other AssetsNote 12 . Restructuring and Impairment ActivitiesNote 13 . DebtNote 14 . DerivativesNote 15 . Accrued ExpensesNote 16 . Income TaxesNote 17 . Postretirement and Other BenefitsNote 18 . Stockholders' EquityNote 19 . Commitments and ContingenciesNote 20 . Segment InformationNote 21 . Major CustomersNote 22 . Supplemental DisclosuresNote 23 . Quarterly Financial Information (unaudited)Item 9. Changes in and Disagreements with Accountants on Accounting and Financial DisclosureItem 9A. Controls and ProceduresItem 9B. Other InformationPart IIIItem 10. Directors, Executive Officers and Corporate GovernanceItem 11. Executive CompensationItem 12. Security Ownership Of Certain Beneficial Owners and Management and Related Stockholder MattersItem 13. Certain Relationships and Related Transactions, and Director IndependenceItem 14. Principal Accountant Fees and ServicesPart IVItem 15. Exhibits and Financial Statement Schedules