SUNCOKE ENERGY, INC.
10-Ks and 10-Qs
|
|
|
|
|
|
|
|
|
|
|
|
|
|
|
|
|
|
|
|
|
|
|
|
|
|
|
|
|
|
|
|
|
|
|
|
|
|
|
|
|
|
|
|
|
|
|
|
|
|
UNITED STATES
SECURITIES AND EXCHANGE COMMISSION
Washington, D.C. 20549
FORM 10-K
(Mark One)
|
ý
|
ANNUAL REPORT PURSUANT TO SECTION 13 OR 15(D) OF THE SECURITIES EXCHANGE ACT OF 1934
|
For the fiscal year ended December 31,
2015
or
|
¨
|
TRANSITION REPORT PURSUANT TO SECTION 13 OR 15(D) OF THE SECURITIES EXCHANGE ACT OF 1934
|
For the transition period from to
Commission File Number 001-35243
SUNCOKE ENERGY, INC.
(Exact name of Registrant as specified in its charter)
|
Delaware
|
|
90-0640593
|
|
(State of or other jurisdiction of
incorporation or organization)
|
|
(I.R.S. Employer
Identification No.)
|
|
1011 Warrenville Road, Suite 600
Lisle, Illinois
|
|
60532
|
|
(Address of principal executive offices)
|
|
(zip code)
|
Registrant’s telephone number, including area code: (630) 824-1000
Securities registered pursuant to Section 12(b) of the Act:
|
Title of Each Class
|
|
Name of Each Exchange on which Registered
|
|
Common Stock, $0.01 par value
|
|
New York Stock Exchange
|
Securities registered pursuant to Section 12(g) of the Act: None
Indicate by check mark if the registrant is a well-known seasoned issuer, as defined in Rule 405 of the Securities Act. Yes
¨
No
ý
Indicate by check mark if the registrant is not required to file reports pursuant to Section 13 or 15(d) of the Act. Yes
¨
No
ý
Indicate by check mark whether the registrant (1) has filed all reports required to be filed by Section 13 or 15(d) of the Securities Exchange Act of 1934 during the preceding 12 months (or for such shorter period that the registrant was required to file such reports), and (2) has been subject to such filing requirements for the past 90 days. Yes
ý
No
¨
Indicate by check mark whether the registrant has submitted electronically and posted on its corporate Web site, if any, every Interactive Data File required to be submitted and posted pursuant to Rule 405 of Regulation S-T during the preceding 12 months (or for such shorter period that the registrant was required to submit and post such files). Yes
ý
No
¨
Indicate by check mark if disclosure of delinquent filers pursuant to Item 405 of Regulation S-K is not contained herein, and will not be contained, to the best of registrant’s knowledge, in definitive proxy or information statements incorporated by reference in Part III of this Form 10-K or any amendment to this Form 10-K.
¨
Indicate by check mark whether the registrant is a large accelerated filer, an accelerated filer, a non-accelerated filer, or a smaller reporting company. See the definitions of “large accelerated filer,” “accelerated filer” and “smaller reporting company” in Rule 12b-2 of the Exchange Act.
|
Large accelerated filer
|
|
ý
|
|
Accelerated filer
|
|
¨
|
|
Non-accelerated filer
|
|
¨
(Do not check if a smaller reporting company)
|
|
Smaller reporting company
|
|
¨
|
Indicate by check mark whether the registrant is a shell company (as defined in Rule 12b-2 of the Act). Yes
¨
No
ý
The aggregate market value of the registrant's common stock (based upon the June 30, 2015 closing price of
$13.00
on the New York Stock Exchange) held by non-affiliates was approximately
$842,881,364
.
The number of shares of common stock outstanding as of
February 12, 2016
was
64,011,791
.
Portions of the SunCoke Energy, Inc. 2016 definitive Proxy Statement, which will be filed with the Securities and Exchange Commission within 120 days after December 31,
2015
, are incorporated by reference in Part III of this Form 10-K.
1
SUNCOKE ENERGY, INC.
TABLE OF CONTENTS
|
Item 1.
|
Business
|
Overview
SunCoke Energy, Inc. (“SunCoke Energy,” “Company,” “we,” “our” and “us”) is the largest independent producer of high-quality coke in the Americas, as measured by tons of coke produced each year, and has more than
50 years
of coke production experience. Coke is a principal raw material in the blast furnace steelmaking process. Coke is generally produced by heating metallurgical coal in a refractory oven, which releases certain volatile components from the coal, thus transforming the coal into coke. We also provide coal handling and/or mixing services at our Coal Logistics terminals.
We have designed, developed, built, own and operate
five
cokemaking facilities in the United States (“U.S.”) with collective nameplate capacity to produce approximately
4.2 million
tons of coke per year. Additionally, we have designed and operate
one
cokemaking facility in Brazil under licensing and operating agreements on behalf of our customer. We have a preferred stock investment in the project company that owns this facility, which has approximately
1.7 million
tons of annual cokemaking capacity. In March 2013, we formed a cokemaking joint venture with VISA Steel Limited ("VISA Steel") in India called VISA SunCoke Limited ("VISA SunCoke"), which has cokemaking capacity of approximately
440 thousand
tons of coke per year.
Our cokemaking ovens utilize efficient, modern heat recovery technology designed to combust the coal’s volatile components liberated during the cokemaking process and use the resulting heat to create steam or electricity for sale. This differs from by-product cokemaking, which repurposes the coal’s liberated volatile components for other uses. We have constructed the only greenfield cokemaking facilities in the U.S. in the last
25
years and are the only North American coke producer that utilizes heat recovery technology in the cokemaking process. We believe that heat recovery technology has several advantages over the alternative by-product cokemaking process, including producing higher quality coke, using waste heat to generate steam or electricity for sale and reducing the environmental impact.
Our Granite City facility, the first phase of our Haverhill facility, or Haverhill 1, and our VISA SunCoke joint venture have steam generation facilities, which use hot flue gas from the cokemaking process to produce steam for sale to customers pursuant to steam supply and purchase agreements. Granite City sells steam to U.S. Steel, and VISA SunCoke sells steam to VISA Steel. Previously, Haverhill 1 sold steam to Haverhill Chemicals LLC ("Haverhill Chemicals"), which filed for relief under Chapter 11 of the U.S. Bankruptcy Code during 2015. Beginning in the fourth quarter of 2015, Haverhill 1 provides steam, at no cost, to Altivia Petrochemicals, LLC ("Altivia"), which purchased the facility from Haverhill Chemicals. While the Company is not currently generating revenues from providing steam to Altivia, the current arrangement, for which rates may be renegotiated beginning in 2018, mitigates costs associated with disposing of steam as well as potential compliance issues. Our Middletown facility and the second phase of our Haverhill facility, or Haverhill 2, have cogeneration plants that use the hot flue gas created by the cokemaking process to generate electricity, which is either sold into the regional power market or to AK Steel pursuant to energy sales agreements.
Our Coal Logistics business provides coal handling and/or mixing services to steel, coke (including some of our domestic cokemaking facilities), electric utility and coal mining customers. During 2015, we acquired Convent Marine Terminal ("CMT") located in Convent, Louisiana, which represents a significant expansion of the Coal Logistics business and marks our entry into export coal handling. We also have terminals in East Chicago, Indiana and in West Virginia and Kentucky. Inclusive of the acquisition of CMT, the Coal Logistics business has the collective capacity to mix and/or transload more than
40 million
tons of coal annually and has storage capacity of
3 million
tons.
At December 31, 2015, we control approximately
109 million
tons of proven and probable coal mining reserves in Virginia and West Virginia
, a portion of which are currently mined by contractors
. Due to the depressed coal mining industry, we have rationalized our Coal Mining business, including terminating approximately 350 employees and reducing production approximately 50 percent. We will continue to evaluate options to minimize costs associated with providing our Jewell cokemaking facility with coal, including potentially closing our remaining mines and moving to a 100 percent purchased coal model.
Incorporated in Delaware in 2010 and headquartered in Lisle, Illinois, we became a publicly-traded company in 2011 and our stock is listed on the New York Stock Exchange (“NYSE”) under the symbol “SXC.”
Formation of a Master Limited Partnership
and Dropdown Transactions
On January 24, 2013, we completed the initial public offering of SunCoke Energy Partners, L.P., a master limited partnership (the "Partnership”), through the sale of
13,500,000
common units of limited partner interests in the Partnership in exchange for
$231.8 million
of net proceeds (the "Partnership Offering"). The key assets of the Partnership at the time of formation were a
65 percent
interest in each of our Haverhill and Middletown cokemaking and heat recovery facilities.
1
During 2014, we contributed an additional
33 percent
interest of our Haverhill and Middletown cokemaking facilities to the Partnership for a total transaction value of
$365.0 million
(the "Haverhill and Middletown Dropdown"). On January 13, 2015, we contributed an initial
75 percent
interest in our Granite City cokemaking and heat recovery facility for a total transaction value of
$244.4 million
(the "Granite City Dropdown"), and on August 12, 2015, we contributed an additional
23 percent
interest for a total transaction value of
$65.2 million
(the "Granite City Supplemental Dropdown"). Subsequent to these dropdowns, we continue to own the remaining 2 percent interest in each of these cokemaking facilities.
At December 31, 2015, we own the general partner of the Partnership, which holds a
2.0 percent
ownership interest and incentive distribution rights, and a
53.9 percent
limited partner interest in the Partnership. The remaining
44.1 percent
interest in the Partnership was held by public unitholders and is reflected in noncontrolling interest on our Consolidated Statements of Operations and Consolidated Balance Sheets.
See further discussion of these transactions in
Note 4
to our consolidated financial statements.
Business Segments
We report our business results through four segments:
|
•
|
Domestic Coke consists of our Jewell, Indiana Harbor, Haverhill, Granite City and Middletown cokemaking and heat recovery operations located in Vansant, Virginia; East Chicago, Indiana; Franklin Furnace, Ohio; Granite City, Illinois; and Middletown, Ohio, respectively.
|
|
•
|
Brazil Coke consists of our operations in Vitória, Brazil, where we operate a cokemaking facility for a Brazilian subsidiary of ArcelorMittal;
|
|
•
|
India Coke consists of our cokemaking joint venture with Visa Steel in Odisha, India.
|
|
•
|
Coal Logistics consists of our coal handling and/or mixing service operations in East Chicago, Indiana; Ceredo, West Virginia; Belle, West Virginia; Catlettsburg, Kentucky; and Convent, Louisiana.
|
For additional information regarding our business segments, see “Management’s Discussion and Analysis of Financial Condition and Results of Operations” and
Note 25
to our consolidated financial statements.
2
Cokemaking Operations
The following table sets forth information about our cokemaking facilities:
|
Facility
|
Location
|
Customer
|
Year of
Start Up
|
Contract
Expiration
|
Number of
Coke Ovens
|
Annual Cokemaking
Capacity
(thousands of tons)
|
Use of Waste Heat
|
|||||||
|
Owned and Operated:
|
||||||||||||||
|
Jewell
|
Vansant,
Virginia
|
ArcelorMittal
|
1962
|
2020
|
142
|
720
|
Partially used for thermal coal drying
|
|||||||
|
Indiana Harbor
|
East Chicago,
Indiana
|
ArcelorMittal
|
1998
|
2023
|
268
|
1,220
|
Heat for power generation
|
|||||||
|
Haverhill Phase I
|
Franklin Furnace,
Ohio
|
ArcelorMittal
|
2005
|
2020
|
100
|
550
|
Process steam
|
|||||||
|
Haverhill Phase II
|
Franklin
Furnace, Ohio
|
AK Steel
|
2008
|
2022
|
100
|
550
|
Power generation
|
|||||||
|
Granite City
|
Granite City,
Illinois
|
U.S. Steel
|
2009
|
2025
|
120
|
650
|
Steam for power generation
|
|||||||
|
Middletown
(1)
|
Middletown,
Ohio
|
AK Steel
|
2011
|
2032
|
100
|
550
|
Power generation
|
|||||||
|
Total
|
830
|
4,240
|
||||||||||||
|
Operated:
|
||||||||||||||
|
Vitória
|
Vitória, Brazil
|
ArcelorMittal
|
2007
|
2023
|
320
|
1,700
|
Steam for power generation
|
|||||||
|
1,150
|
5,940
|
|||||||||||||
|
Equity Method Investment:
|
||||||||||||||
|
VISA SunCoke
(2)
|
Odisha, India
|
Various
|
2007
|
NA
|
88
|
440
|
Steam for power generation
|
|||||||
|
Total
|
1,238
|
6,380
|
||||||||||||
|
(1)
|
Cokemaking capacity represents stated capacity for production of blast furnace coke. Middletown production and sales volumes are based on “run of oven” capacity, which includes both blast furnace coke and small coke. Middletown capacity on a “run of oven” basis is approximately 578 thousand tons per year.
|
|
(2)
|
Cokemaking capacity represents 100 percent of VISA SunCoke.
|
We are a technological leader in cokemaking. We believe our advanced heat recovery cokemaking process has numerous advantages over by-product cokemaking, including producing higher quality coke, using waste heat to generate derivative energy for resale and reducing environmental impact. The Clean Air Act Amendments of 1990 specifically directed the U.S. Environmental Protection Agency (“EPA”) to evaluate our heat recovery coke oven technology as a basis for establishing Maximum Achievable Control Technology (“MACT”) standards for new cokemaking facilities. In addition, each of the four cokemaking facilities that we have built since 1990 has either met or exceeded the applicable Best Available Control Technology (“BACT”), or Lowest Achievable Emission Rate (“LAER”) standards, as applicable, set forth by the EPA for cokemaking facilities at that time.
Our core business model is predicated on providing steelmakers an alternative to investing capital in their own captive coke production facilities. We direct our marketing efforts principally towards steelmaking customers that require coke for use in their blast furnaces.
Substantially all our coke sales are made pursuant to long-term, take-or-pay agreements with ArcelorMittal, AK Steel and U.S. Steel, who are three of the largest blast furnace steelmakers in North America, each of which individually accounts for greater than ten percent of our consolidated revenues. The take-or-pay provisions require that our customers purchase all of our coke production, in certain cases subject to a tonnage in excess of our stated capacity, or pay the contract price for any such coke they elect not to take. To date, our customers have satisfied their obligations under these agreements.
These coke sales agreements have an average remaining term of approximately
nine
years and contain pass-through provisions for costs we incur in the cokemaking process, including coal procurement costs, subject to meeting contractual coal-to-coke yields, operating and maintenance expenses, costs related to the transportation of coke to our customers, taxes (other than income taxes) and costs associated with changes in regulation. With the exception of our Jewell cokemaking facility, all of our coke sales agreements also provide for the pass-through of actual coal costs on a delivered basis, subject to meeting contractual coal-to-coke yields. The coal cost component of the coke price under the Jewell coke sales agreement reflects a market price for coal based upon third-party coal purchases under our Haverhill contract with ArcelorMittal. These features of our coke sales agreements reduce our exposure to variability in coal price changes and inflationary costs over the remaining terms of these agreements.
3
The coke sales agreement and energy sales agreement with AK Steel at our Haverhill facility are subject to early termination by AK Steel under limited circumstances and provided that AK Steel has given at least two years prior notice of its intention to terminate the agreement and certain other conditions are met. No other coke sales contract has an early termination clause.
Our steelmaking customers are currently operating in an environment that is significantly challenged by declining steel prices driven by global over capacity and lower demand. The combination of the strong U.S. dollar, continued high import activity and reduced drilling activity caused by low oil and gas prices has served to depress both spot and contract prices for steel, which has driven market deterioration for flat rolled and tubular steel. Several steel producers, including certain of our customers, have filed petitions with the Department of Commerce and the International Trade Commission alleging that unfairly traded imports are causing material injury to the domestic steel industry in the U.S. and that foreign steel producers benefit from significant subsidies provided by the governments of their respective countries. While trade action is underway, domestic steel utilization rates in 2015 are down significantly from 2014 utilization rates. As a result of these current market conditions, certain of our customers have temporarily idled portions of their facilities, but continue to comply with the terms of their long-term, take-or-pay contracts with us.
Further, ArcelorMittal is currently undergoing negotiations with its union labor workforce. Our coke and energy sales agreements contain force majeure provisions allowing temporary suspension of performance by our customers for the duration of specified events beyond the control of our customers, such as a strike. Declaration of force majeure, coupled with a lengthy suspension of performance under one or more coke or energy sales agreements, may seriously and adversely affect our cash flows, financial position and results of operations. For additional information see “Item 1A. Risk Factors.”
Through an engineering study in prior years, we identified major refurbishment work that was necessary to preserve the production capacity of our Indiana Harbor facility. We completed the resulting refurbishment project in the first half of 2014. While the original refurbishment improved overall plant condition, further work remains to stabilize plant performance.
During 2015, we rebuilt the interiors of 48 ovens using a more comprehensive approach. We approached these rebuilds in blocks of ovens as opposed to individually, taking them out of service and bringing them back online on a controlled basis, which gave us the ability to complete the work in a more systematic way. This new approach also provides a better ability to enter the ovens and more fully addresses the shortcomings in the oven walls and crowns. In 2016, we will continue improvement efforts and evaluate the performance of the rebuilt ovens with the overall goal of stabilizing daily production and increasing efficiency. Rather than focusing on delivering on the full-year production target of 1.22 million tons, our emphasis will be on achieving stable production results and operating the plant in an optimal manner, which we expect will drive improved profitability and more holistically address the continued underperformance at Indiana Harbor.
Revenues from our Brazilian cokemaking facility are derived from licensing and operating fees based upon the level of production required by our customer and include the full pass-through of the operating costs of the facility. We also receive an annual preferred dividend on our preferred stock investment in the Brazilian project company that owns the facility. In general, the facility must achieve certain minimum production levels for us to receive the preferred dividend. In 2013, we reduced production at our Brazilian cokemaking facility at the request of our customer. This production decrease did not impact the receipt of our preferred dividend. Production returned to historical levels in 2014 and reached record highs in 2015.
Our joint venture investment in VISA SunCoke, located in Odisha, India, generates earnings through heat recovery cokemaking and the associated steam generation units. VISA SunCoke's cokemaking process utilizes heat recovery technology developed in China and has an operating capacity of 440 thousand tons. Our India joint venture intends to sell approximately one-third of its coke production and all of its steam production to VISA Steel with the remainder of the coke production sold in the spot market. While VISA SunCoke continues to operate well, high volumes of low-priced Chinese coke imports have resulted in the deterioration of coke margins. Consequently, we significantly impaired our equity method investment in VISA SunCoke during 2014, and based on the continued deterioration of market factors, we further impaired our investment to zero in 2015. Consequently, beginning in the fourth quarter of 2015, we no longer include the results of our share of VISA SunCoke in our consolidated financial statements. In accordance with accounting principles generally accepted in the U.S. ("GAAP"), our share of future earnings of the joint venture will only be included in our results once the cumulative investment balance is no longer negative. The Company has no plans to make further capital contributions to this joint venture.
Coal Logistics Operations
During 2013, we expanded our operations into the coal logistics market through the acquisitions of Kanawha River Terminals ("KRT") and SunCoke Lake Terminal, LLC ("Lake Terminal"). KRT is a leading metallurgical and thermal coal mixing and handling terminal service provider with collective capacity to mix and transload
30 million
tons of coal annually through operations in West Virginia and Kentucky. Lake Terminal is located in East Chicago, Indiana and provides coal handling and mixing services to our Indiana Harbor cokemaking operations.
4
On August 12, 2015, we also acquired CMT for
$403.1 million
. CMT is one of the largest export terminals on the U.S. Gulf Coast. CMT provides strategic access to seaborne markets for coal and other industrial materials. Supporting low-cost Illinois basin coal producers, the terminal provides loading and unloading services and has direct rail access and the current capability to transload
10 million
tons of coal annually. The facility is supported by long-term contracts with volume commitments covering all of its current
10 million
ton capacity.
With the acquisition of CMT, we now own and operate five coal handling terminals with the collective capacity to mix and/or transload more than
40 million
tons of coal annually and has storage capacity of
3 million
tons. Our coal terminals act as intermediaries between coal producers and coal end users by providing transloading, storage and mixing services. Coal is transported from the mine site in numerous ways, including rail, truck, barge or ship. We do not take possession of coal but instead derive our revenues by providing coal handling and/or mixing services to our customers on a per ton basis. For CMT, cash received from customers based on pro-rata volume commitments under take-or-pay contracts that is in excess of cash earned for services provided during the quarter is recorded as deferred revenue. Deferred revenue on take-or-pay contracts is recognized into income annually based on the terms of the contract. Our coal mixing and/or handling services are provided to steel, coal mining, coke (including some of our domestic cokemaking facilities) and electric utility customers.
Our Coal Logistics coal mining customers are currently faced with a market depressed by oversupply and declining coal prices. Our CMT customers are also impacted by seaborne export market dynamics. Fluctuations in the benchmark price for coal delivery into northwest Europe, as referenced in the API2 index price, influence our customers' decisions to place tons into the export market and thus impact transloading volumes through our terminal facility. Despite the current challenging coal mining and coal export markets, our customers have continued to perform on their contracts with us.
Coal Mining Operations
Our underground metallurgical Coal Mining operations are located in Virginia and West Virginia, near our Jewell cokemaking facility. During 2014, we aggressively pursued the sale of our Coal Mining business without success. Consequently, in the fourth quarter of 2014, we began to rationalize our operations, which continued during 2015 with the idling of certain mines and a reduction of coal production from 1.2 million tons produced during 2014 to 0.6 million tons in 2015. We also transitioned to a fully contractor-mined operation and decommissioned our coal preparation plant. As a result, we purchased approximately 0.6 million tons of coal from third-parties in 2015 to help fulfill the remaining coal requirements to supply our Jewell cokemaking facility.
In 2015, 83 percent of the coal produced was used by our Jewell cokemaking facility, 6 percent was used at our other domestic cokemaking facilities, and the remaining 11 percent was sold to third-parties. Intersegment coal revenues for sales to our Domestic Coke segment are based on prices that third-parties, or coke customers of our Domestics Coke segment, have agreed to pay for our coal and approximate the market price for the applicable quality of metallurgical coal. Most of the coal sales to these third-parties and facilities are under contracts with one year terms, and, as a result, coal revenues lag the market for spot coal prices.
In 2016, we expect to continue reducing the ongoing impact of our Coal Mining operations on overall results. In the first half of 2016, we expect to complete a capital project to install additional coal handling and storage facilities to service our Jewell cokemaking operations and will evaluate the cost benefits of various coal procurement alternatives to minimize costs associated with providing our Jewell cokemaking facility with coal, including potentially closing our remaining mines and moving to a 100 percent purchased coal model.
Seasonality
Our revenues in our cokemaking business and much of our Coal Logistics business are tied to long-term, take-or-pay contracts and as such, are not seasonal. However, our cokemaking profitability is tied to coal-to-coke yields, which improve in drier weather. Accordingly, the coal-to-coke yield component of our profitability tends to be more favorable in the third quarter. Extreme weather may also challenge our operating costs and production in the winter months.
Raw Materials
Metallurgical coal is the principal raw material for our cokemaking operations. Except for our Jewell cokemaking facility, where we internally supply a substantial amount of the metallurgical coal from our contractor-mined Coal Mining operations discussed above, most of the metallurgical coal used to produce coke at our domestic cokemaking facilities is purchased from third-parties. We believe there is an ample supply of metallurgical coal available in the U.S. and worldwide, and we have been able to supply coal to our domestic cokemaking facilities without any significant disruption in coke production.
Each ton of coke produced at our facilities requires approximately 1.4 tons of metallurgical coal. We purchased 5.4 million tons of metallurgical coal in 2015. Coal from third-parties is generally purchased on an annual basis via one-year contracts with costs passed through to our customers in accordance with the applicable coke sales agreements. Occasionally,
5
shortfalls in deliveries by coal suppliers require us to procure supplemental coal volumes. As with typical annual purchases, the cost of these supplemental purchases is also passed through to our customers. In 2016, certain of our coal contracts contain an option, at the Company's discretion, to reduce our commitment by up to 15 percent. Most coal procurement decisions are made through a coal committee structure with customer participation. The customer can generally exercise an overriding vote on most coal procurement decisions.
While we generally pass coal costs through to our coke customers, all of our contracts include some form of coal-to-coke yield standard. To the extent that our actual yields are less than the standard in the contract, we are at risk for the cost of the excess coal used in the cokemaking process. Conversely, to the extent actual yields are higher than contractual standards, we are able to realize higher margins.
Transportation and Freight
For inbound transportation of coal purchases, our facilities that access a single rail provider have long-term transportation agreements, and where necessary, coal-mixing agreements that run concurrently with the associated coke sales agreement for the facility. At facilities with multiple transportation options, including rail and barge, we enter into short-term transportation contracts from year to year. For coke sales, the point of delivery varies by agreement and facility. The point of delivery for coke sales from our Jewell and Haverhill cokemaking facilities is generally designated by the customer and shipments are made by railcar under long-term transportation agreements held by us. All delivery costs are passed through to the customers. At our Middletown, Indiana Harbor and Granite City cokemaking facilities, coke is delivered primarily by a conveyor belt leading to the customer’s blast furnace, with the customer responsible for additional transportation costs, if any. All transportation and freight costs in our Coal Logistics segment are paid by the customer directly to the transportation provider.
Research and Development and Intellectual Property and Proprietary Rights
Our research and development program seeks to develop promising new cokemaking technologies and improve our heat recovery processes. Over the years, this program has produced numerous patents related to our heat recovery coking design and operation, including patents for pollution control systems, oven pushing and charging mechanisms, oven flue gas control mechanisms and various others.
At Indiana Harbor and Vitória, Brazil, where we do not own 100 percent of the entity owning the cokemaking facility, we have licensing agreements in place for the entity’s use of our technology. At Indiana Harbor, we receive no payment for the licensing rights. At Vitória, we receive a licensing fee that is payable in conjunction with the operation of the facility. We expect the Brazilian licensing agreement to continue through at least 2022. At VISA SunCoke, our joint venture with VISA Steel in India, our technology is not currently in use, but the parties have agreed to enter into a license agreement should our technology be used in the future.
We are party to an omnibus agreement with the Partnership, which grants the Partnership a royalty-free license to use the name “SunCoke” and related trademarks. Additionally, the omnibus agreement grants the Partnership a non-exclusive right to use all of our current and future cokemaking and related technology necessary for their operations.
Competition
Cokemaking
The cokemaking business is highly competitive. Most of the world’s coke production capacity is owned by blast furnace steel companies utilizing by-product coke oven technology. The international merchant coke market is largely supplied by Chinese, Colombian and Ukrainian producers among others, though it is difficult to maintain high quality coke in the export market, and when coupled with transportation costs, coke imports are often not economical.
The principal competitive factors affecting our cokemaking business include coke quality and price, technology, reliability of supply, proximity to market, access to metallurgical coals and environmental performance. Competitors include merchant coke producers as well as the cokemaking facilities owned and operated by blast furnace steel companies.
In the past, there have been technologies which have sought to produce carbonaceous substitutes for coke in the blast furnace. While none have proven commercially viable thus far, we monitor the development of competing technologies carefully. We also monitor ferrous technologies, such as direct reduced iron production ("DRI"), as these could indirectly impact our blast furnace customers.
We believe we are well-positioned to compete with other coke producers. Current production from our cokemaking business is largely committed under long-term contracts. As a result, competition mainly affects our ability to obtain new contracts supporting development of additional cokemaking capacity as well as the sale of coke in the spot market. Our facilities were constructed using proven, industry-leading technology with many proprietary features allowing us to produce
6
consistently higher quality coke than our competitors produce. Additionally, our technology allows us to produce ratable quantities of heat that can be utilized as industrial grade steam or converted into electrical power.
Coal Logistics
The coal mixing and/or handling service market is highly competitive in the geographic area of our operations. The principal competitive factors affecting our Coal Logistics business include proximity to the source of coal as well as the nature and price of our services provided. We believe we are well-positioned to compete with other coal mixing and/or handling terminal service providers. Our KRT competitors are generally located within 100 miles of our operations. KRT has state-of-the-art mixing capabilities with fully automated and computer controlled mixing that mixes coal to within two percent accuracy of customer specifications. KRT also has the ability to provide pad storage and has access to both CSX and Norfolk Southern rail lines as well as the Ohio River system. Lake Terminal provides coal handling and/or mixing services for our Indiana Harbor cokemaking facility and therefore does not have any competitors. Our CMT competitors, who serve the coal export market, are generally located on the lower Mississippi River. CMT is one of the largest export terminals on the U.S. gulf coast and provides strategic access to seaborne markets for coal and other industrial materials. CMT is currently building a new state-of-the-art ship loader which will allow faster coal loading onto larger ships. Additionally, CMT has direct rail access on the Canadian National Rail line, which provides a competitive advantage in the coal logistics industry.
Employees
As of December 31,
2015
, we have approximately
1,125
employees in the U.S. Approximately
32 percent
of our domestic employees, principally at our cokemaking operations, are represented by the United Steelworkers union under various contracts. Additionally, approximately
2 percent
of our domestic employees are represented by the International Union of Operating Engineers.
On
July 27, 2015
, we reached a new
four
-year labor agreement for our Haverhill location, which will expire on
November 1, 2019
. The labor agreement at our Indiana Harbor cokemaking facility expired on
September 1, 2015
. We are currently negotiating the extension of the agreement and do not anticipate any work stoppages. The labor agreements at our Quincy and Lake Terminal coal handling facilities expire on
April 30, 2016
and
June 30, 2016
, respectively. We will be negotiating the renewal of these agreements in 2016 and do not anticipate any work stoppages.
As of
December 31, 2015
, we have approximately
273
employees at the cokemaking facility in Vitória, Brazil, all of whom are represented by a union under a labor agreement. The labor agreement at our Vitoria, Brazil facility expired on
October 31, 2015
. We are currently negotiating the extension of the agreement and do not anticipate any work stoppages.
Safety
We are committed to maintaining a safe work environment and ensuring strict environmental compliance across all of our operations as the health and safety of our employees and the communities in which we operate are critical to our success. We believe that we employ best practices and conduct continual training programs to ensure that all of our employees are focused on safety. Furthermore, we employ a structured safety and environmental process that provides a robust framework for managing and monitoring safety and environmental performance.
We have consistently operated within the top quartile for the U.S. Occupational Safety and Health Administration’s recordable injury rates as measured and reported by the American Coke and Coal Chemicals Institute.
Arrangements and Transactions Between Sunoco and SunCoke Energy
In connection with the our initial public offering ("IPO"), SunCoke Energy and Sunoco, Inc. ("Sunoco") entered into certain agreements that effected our separation from Sunoco, provided a framework for our relationship with Sunoco after the separation and provided for the allocation between SunCoke Energy and Sunoco of Sunoco’s assets, employees, liabilities and obligations attributable to periods prior to, at and after the separation.
On July 18, 2011 (the "Separation Date"), SunCoke Energy and Sunoco entered into a guaranty, keep well, and indemnification agreement. Under this agreement, SunCoke Energy: (1) guarantees the performance of certain obligations of its subsidiaries, prior to the date that Sunoco or its affiliates may become obligated to pay or perform such obligations, including the repayment of a loan from Indiana Harbor Coke Company L.P.; (2) indemnifies, defends, and holds Sunoco and its affiliates harmless against all liabilities relating to these obligations; and (3) restricts the assets, debts, liabilities and business activities of one of its wholly-owned subsidiaries, so long as certain obligations of such subsidiary remain unpaid or unperformed. In addition, SunCoke Energy released Sunoco from its guaranty of payment of a promissory note owed by one of its subsidiaries to another of its subsidiaries.
Legal and Regulatory Requirements
The following discussion summarizes the principal legal and regulatory requirements that we believe may significantly affect us.
7
Permitting and Bonding
|
•
|
Permitting Process for Cokemaking Facilities.
The permitting process for our cokemaking facilities is administered by the individual states. However, the main requirements for obtaining environmental construction and operating permits are found in the federal regulations. Once all requirements are satisfied, a state or local agency produces an initial draft permit. Generally, the facility reviews and comments on the initial draft. After accepting or rejecting the facility’s comments, the agency typically publishes a notice regarding the issuance of the draft permit and makes the permit and supporting documents available for public review and comment. A public hearing may be scheduled, and the U.S. Environmental Protection Agency ("EPA") also has the opportunity to comment on the draft permit. The state or local agency responds to comments on the draft permit and may make revisions before a final construction permit is issued. A construction permit allows construction and commencement of operations of the facility and is generally valid for at least 18 months. Generally, construction commences during this period, while many states allow this period to be extended in certain situations.
|
|
•
|
Air quality.
Our cokemaking facilities employ Maximum Available Control Technology (“MACT”) standards designed to limit emissions of certain hazardous air pollutants. Specific MACT standards apply to door leaks, charging, oven pressure, pushing and quenching. Certain MACT standards for new cokemaking facilities were developed using test data from SunCoke's Jewell cokemaking facility located in Vansant, Virginia. Under applicable federal air quality regulations, permitting requirements may differ among facilities, depending upon whether the cokemaking facility will be located in an “attainment” area—i.e., one that meets the national ambient air quality standards (“NAAQS”) for certain pollutants, or in a “non-attainment” or "unclassifiable" area. The status of an area may change over time as new NAAQS standards are adopted, resulting in an area change from one status or classification to another. In an attainment area, the facility must install air pollution control equipment or employ Best Available Control Technology (“BACT”). In a non-attainment area, the facility must install air pollution control equipment or employ procedures that meet Lowest Achievable Emission Rate (“LAER”) standards. LAER standards are the most stringent emission limitation achieved in practice by existing facilities. Unlike the BACT analysis, cost is generally not considered as part of a LAER analysis, and emissions in a non-attainment area must be offset by emission reductions obtained from other sources.
|
|
•
|
Stringent NAAQS for ambient nitrogen dioxide and sulfur dioxide went into effect in 2010. In July 2013, the EPA identified or "designated" as nonattainment 29 areas in 16 states where monitored air quality showed violations of the 2010 1-hour SO2 NAAQS. In August 2015, the EPA finalized a new rulemaking to assist in implementation of the primary 1-hour SO2 NAAQS that requires either additional monitoring, or modeling of ambient air SO2 levels in various areas including where certain of our facilities are located. By July 2016, states subject to this rulemaking must provide EPA with either a modeling approach using existing emissions data, or a plan to undertake ambient air monitoring for SO2 to begin in 2017. For states that choose to install ambient air SO2 monitoring stations, after three years of data has been collected, or sometime in 2020, EPA will evaluate this data relative to the appropriate attainment designation for the areas under the 1-hour SO2 NAAQS. This rulemaking will require certain of our facilities to undertake this ambient air monitoring. We may be required to install yet additional pollution controls and incur greater costs of operating at those of our facilities located in areas that EPA determines to be non-attainment with the 1-hour SO2 NAAQS based on its evaluation of this data. In 2012, a NAAQS for fine particulate matter, or PM 2.5, went into effect. In November 2015, the EPA revised the existing NAAQS for ground level ozone to make the standard more stringent. These new standards and any future more stringent standard for ozone have two impacts on permitting: (1) demonstrating compliance with the standard using dispersion modeling from a new facility will be more difficult; and (2) additional areas of the country may become designated as non-attainment areas. Facilities operating in areas that become non-attainment areas due to the application of new standards may be required to install Reasonably Available Control Technology (“RACT”). A number of states have also filed or joined suits to challenge the EPA’s new standard in court. While we are not able to determine the extent to which this new standard will impact our business at this time, it does have the potential to have a material impact on our operations and cost structure.
|
|
•
|
The EPA adopted a rule in 2010 requiring a new facility that is a major source of greenhouse gases (“GHGs”) to install equipment or employ BACT procedures. Currently, there is little information on what may be acceptable as BACT to control GHGs (primarily carbon dioxide from our facilities), but the database and additional guidance may be enhanced in the future.
|
|
•
|
Several states have additional requirements and standards other than those in the federal statutes and regulations. Many states have lists of “air toxics” with emission limitations determined by dispersion modeling. States also often have specific regulations that deal with visible emissions, odors and nuisance. In some cases, the state delegates some or all of these functions to local agencies.
|
8
|
•
|
Wastewater and Stormwater.
Our heat recovery cokemaking technology does not produce process wastewater as is typically associated with by-product cokemaking. Our cokemaking facilities, in some cases, have wastewater discharge and stormwater permits.
|
|
•
|
Waste.
The primary solid waste product from our heat recovery cokemaking technology is calcium sulfate from flue gas desulfurization, which is generally taken to a solid waste landfill. The material from periodic cleaning of heat recovery steam generators is disposed of as hazardous waste. On the whole, our heat recovery cokemaking process does not generate substantial quantities of hazardous waste.
|
|
•
|
U.S. Endangered Species Act.
The U.S. Endangered Species Act and certain counterpart state regulations are intended to protect species whose populations allow for categorization as either endangered or threatened. With respect to permitting additional cokemaking facilities, protection of endangered or threatened species may have the effect of prohibiting, limiting the extent of or placing permitting conditions on soil removal, road building and other activities in areas containing the affected species. Based on the species that have been designated as endangered or threatened on our properties and the current application of these laws and regulations, we do not believe that they are likely to have a material adverse effect on our operations.
|
|
•
|
Permitting Process for Coal Mining Operations.
The U.S. coal mining permit application process is initiated by collecting baseline data to adequately assess and model the pre-mine environmental condition of the permit area, including geologic data, soil and rock structures, cultural resources, soils, surface and ground water hydrology, and coal that we intend to mine. We use this data to develop a mine and reclamation plan, which incorporate provisions of the Surface Mining Control and Reclamation Act of 1977 (“SMCRA”), state programs and complementary environmental programs that impact coal mining. The permit application includes the mine and reclamation plan, documents defining ownership and agreements pertaining to coal, minerals, oil and gas, water rights, rights of way and surface land and documents required by the Office of Surface Mining Reclamation and Enforcement’s (“OSM’s”) Applicant Violator System. Once a permit application is submitted to the regulatory agency, it goes through a completeness and technical review before a public notice and comment period. Some SMCRA mine permits take over a year to prepare, depending on the size and complexity of the mine, and often take six months to two years to be issued. Regulatory authorities have considerable discretion in the timing of the permit issuance and the public has the right to comment on and otherwise engage in the permitting process, including through public hearings and intervention in the courts. SMCRA mine permits also take a significant period of time to be transferred.
|
|
•
|
Bonding Requirements for Coal Mining Operations Permits.
Before a SMCRA permit is issued, a mine operator must submit a bond or other form of financial security to guarantee the payment and performance of certain long-term mine closure and reclamation obligations. The costs of these bonds or other forms of financial security have fluctuated in recent years and the market terms of surety bonds generally have become more unfavorable to mine operators. Surety providers are requiring greater amounts of collateral to secure a bond, which has required us to provide increasing quantities of cash to collateralize bonds or other forms of financial security to allow us to continue mining. These changes in the terms of the bonds have been accompanied, at times, by a decrease in the number of companies willing to issue surety bonds. As of
December 31, 2015
, we have posted an aggregate of approximately $48 million in surety bonds or other forms of financial security for reclamation purposes.
|
Regulation of Operations
|
•
|
Clean Air Act.
The Clean Air Act and similar state laws and regulations affect our cokemaking operations, primarily through permitting and/or emissions control requirements relating to particulate matter (“PM”) and sulfur dioxide (“SO2”). The Clean Air Act air emissions programs that may affect our operations, directly or indirectly, include, but are not limited to: the Acid Rain Program; NAAQS implementation for SO2, PM and nitrogen oxides (“NOx”); GHG rules; the Clean Air Interstate Rule; MACT emissions limits for hazardous air pollutants; the Regional Haze Program; New Source Performance Standards (“NSPS”); and New Source Review. The Clean Air Act requires, among other things, the regulation of hazardous air pollutants through the development and promulgation of various industry-specific MACT standards. Our cokemaking facilities are subject to two categories of MACT standards. The first category applies to pushing and quenching. The EPA is to make a risk-based determination for pushing and quenching emissions and determine whether additional emissions reductions are necessary, but the EPA has yet to publish or propose any residual risk standards; therefore, the impact of potential additional EPA regulation in this area cannot be estimated at this time. The second category of MACT standards applicable to our cokemaking facilities applies to emissions from charging and coke oven doors.
|
9
|
•
|
Terminal Operations.
Our terminal operations located along waterways and the Gulf of Mexico are also governed by permitting requirements under the CWA and CAA. These terminals are subject to U.S. Coast Guard regulations and comparable state statutes regarding design, installation, construction, and management. Many such terminals owned and operated by other entities that are also used to transport coal, including for export, have been pursued by environmental interest groups for alleged violations of their permits’ requirements, or have seen their efforts to obtain or renew such permits contested by such groups. While we believe that our operations are in material compliance with these permits, we cannot assure you that no such challenges or claims will be made against our operations in the future. Moreover, our terminal operations may be affected by the impacts of additional regulation on the mining of all types of coal and use of thermal coal for fuel, which is restricting supply in some markets and may reduce the volumes of coal that our terminals manage.
|
|
•
|
Federal Energy Regulatory Commission.
The Federal Energy Regulatory Commission (“FERC”) regulates the sales of electricity from our Haverhill and Middletown facilities, including the implementation of the Federal Power Act (“FPA”) and the Public Utility Regulatory Policies Act of 1978 (“PURPA”). The nature of the operations of the Haverhill and Middletown facilities makes each facility a qualifying facility under PURPA, which exempts the facilities and the Company from certain regulatory burdens, including the Public Utility Holding Company Act of 2005 (“PUHCA”), limited provisions of the FPA, and certain state laws and regulation. FERC has granted requests for authority to sell electricity from the Haverhill and Middletown facilities at market-based rates and the entities are subject to FERC’s market-based rate regulations, which require regular regulatory compliance filings.
|
|
•
|
Clean Water Act of 1972.
Although our cokemaking facilities generally do not have water discharge permits, the Clean Water Act (“CWA”) may affect our operations by requiring water quality standards generally and through the National Pollutant Discharge Elimination System (“NPDES”). Regular monitoring, reporting requirements and performance standards are requirements of NPDES permits that govern the discharge of pollutants into water. Discharges must either meet state water quality standards or be authorized through available regulatory processes such as alternate standards or variances. Additionally, through the CWA Section 401 certification program, states have approval authority over federal permits or licenses that might result in a discharge to their waters.
|
|
•
|
Resource Conservation and Recovery Act.
We may generate wastes, including “solid” wastes and “hazardous” wastes that are subject to the Resource Conservation and Recovery Act (“RCRA”) and comparable state statutes, although certain mining and mineral beneficiation wastes and certain wastes derived from the combustion of coal currently are exempt from regulation as hazardous wastes under RCRA. The EPA has limited the disposal options for certain wastes that are designated as hazardous wastes under RCRA. Furthermore, it is possible that certain wastes generated by our operations that currently are exempt from regulation as hazardous wastes may in the future be designated as hazardous wastes, and therefore be subject to more rigorous and costly management, disposal and clean-up requirements.
|
|
•
|
Comprehensive Environmental Response, Compensation, and Liability Act.
Under the Comprehensive Environmental Response, Compensation, and Liability Act (“CERCLA”), also known as Superfund, and similar state laws, responsibility for the entire cost of clean-up of a contaminated site, as well as natural resource damages, can be imposed upon current or former site owners or operators, or upon any party who released one or more designated “hazardous substances” at the site, regardless of the lawfulness of the original activities that led to the contamination. In the course of our operations we may have generated and may generate wastes that fall within CERCLA’s definition of hazardous substances. We also may be an owner or operator, or a past owner or operator, of facilities at which hazardous substances have been released. Under CERCLA, we may be responsible for all or part of the costs of cleaning up facilities at which such substances have been released and for natural resource damages. We also must comply with reporting requirements under the Emergency Planning and Community Right-to-Know Act and the Toxic Substances Control Act.
|
|
•
|
Climate Change Legislation and Regulations.
Our facilities are presently subject to the GHG reporting rule, which obligates us to report annual emissions of GHGs. The EPA also finalized a rule in 2010 requiring a new facility that is a major source of greenhouse gases (“GHGs”) to install equipment or employ BACT procedures. Currently there is little information as to what may constitute BACT for GHG in most industries. We may also be subject to the EPA’s “Tailoring Rule,” where certain modifications to our facilities could subject us to the additional permitting and other obligations relative to emissions of GSGs under the New Source Review/Prevention of Significant Deterioration (NSR/PSD) and Title V programs of the Clean Air Act based on whether the facility triggered NSR/PSD because of emissions of another pollutant such as SO2, NOx, PM, ozone or lead. The EPA has engaged in rulemakings to regulate GHG emissions from existing and new coal fired power plants, and we expect continued legal challenges to this rulemaking and any future rulemaking for other industries. For instance, in August 2015, the EPA issued its final Clean Power Plan rules establishing carbon pollution standards
|
10
for power plants. The EPA expects each state to develop implementation plans for power plants in its state to meet the individual state targets established in the Clean Power Plan, and has also proposed a federal compliance plan to implement the Clean Power Plan in the event that approvable state plans are not submitted. Judicial challenges have been be filed, which seek a stay of the implementation of the rules. Electricity generated by natural gas often results in lower CO
2
emission rates than other forms of fossil fuels. Depending on the method of implementation selected by the states, and if implementation is not stayed pending resolution of the legal challenges, the Clean Power Plan could increase the demand for natural gas-generated electricity. Currently, we do not anticipate these new or existing power plan GHG rules to apply directly to our facilities, the impact of and future GHG-related legislation and regulations on us will depend on a number of factors, including whether GHG sources in multiple sectors of the economy are regulated, the overall GHG emissions cap level, the degree to which GHG offsets are allowed, the allocation of emission allowances to specific sources, actions by the states in implementing these requirements and the indirect impact of carbon regulation on coal prices. We may not recover the costs related to compliance with regulatory requirements imposed on us from our customers due to limitations in our agreements. The imposition of a carbon tax or similar regulation could materially and adversely affect our revenues. Collectively, these requirements along with restrictions and requirements regarding the mining of all types of coal may reduce the volumes of coal that we manage and may ultimately adversely impact our revenues.
|
•
|
Mine Improvement and New Emergency Response Act of 2006.
The Mine Improvement and New Emergency Response Act of 2006 (the “Miner Act”), has increased significantly the enforcement of safety and health standards and imposed safety and health standards on all aspects of mining operations. There also has been a significant increase in the dollar penalties assessed for citations issued.
|
|
•
|
Security.
Our Convent Marine Terminal is subject to regulation by the United States Coast Guard pursuant to the Maritime Transportation Security Act. We have an internal inspection program designed to monitor and ensure compliance by the Convent Marine Terminal with these requirements. We believe that we are in material compliance with all applicable laws and regulations regarding the security of the facility.
|
Reclamation and Remediation
|
•
|
Surface Mining Control and Reclamation Act of 1977.
The SMCRA established comprehensive operational, environmental, reclamation and closure standards for all aspects of U.S. surface mining as well as many aspects of deep mining. Where state regulatory agencies have adopted federal mining programs under SMCRA, the state becomes the regulatory authority, and states that operate federally approved state programs may impose standards that are more stringent than the requirements of SMCRA. Permitting under SMCRA generally has become more difficult in recent years, which adversely affects the cost and availability of coal. The Abandoned Mine Land Fund, which is part of SMCRA, assesses a fee on all coal produced in the U.S. From October 1, 2007 through September 30, 2012, the fee was $0.315 per ton of surface-mined coal and $0.135 per ton of underground mined coal. From October 1, 2012 through September 30, 2021, the fee has been reduced to $0.28 per ton of surface-mined coal and $0.12 per ton of underground mined coal. Our reclamation obligations under applicable environmental laws could be substantial. Under GAAP, we are required to account for the costs related to the closure of mines and the reclamation of the land upon exhaustion of coal reserves. The fair value of an asset retirement obligation is recognized in the period in which it is incurred if a reasonable estimate of fair value can be made. The present value of the estimated asset retirement costs is capitalized as part of the carrying amount of the long-lived asset. At
December 31, 2015
, we had asset retirement obligation of
$13.8 million
related to estimated mine reclamation costs. The amounts recorded are dependent upon a number of variables, including the estimated future retirement costs, estimated proven reserves, assumptions involving profit margins, inflation rates, and the assumed credit-adjusted interest rates. Our future operating results would be adversely affected if these accruals were determined to be insufficient. These obligations are unfunded. Further, although specific criteria varies from state to state as to what constitutes an “owner” or “controller” relationship, under SMCRA the responsibility for reclamation or remediation, unabated violations, unpaid civil penalties and unpaid reclamation fees of independent contract mine operators can be imputed to other companies which are deemed, according to the regulations, to have “owned” or “controlled” the contract mine operator. Sanctions are quite severe and can include being denied new permits, permit amendments, permit revisions and revocation or suspension of permits issued since the violation or penalty or fee due date.
|
|
•
|
Black Lung Benefits Revenue Act of 1977 and Black Lung Benefits Reform Act of 1977, as amended in 1981.
Under these laws, each U.S. coal mine operator must pay federal black lung benefits and medical expenses to claimants who are current and former employees and last worked for the operator after July 1, 1973. Coal mine operators also must make payments to a trust fund for the payment of benefits and medical expenses to claimants who last worked in the coal industry prior to July 1, 1973. The trust fund is funded by an excise tax on U.S. coal production of up to $1.10 per ton for deep-mined coal and up to $0.55 per ton for surface-mined coal, neither
|
11
amount to exceed 4.4 percent of the gross sales price. The Patient Protection and Affordable Care Act (“PPACA”), which was implemented in 2010, amended previous legislation and provides for the automatic extension of awarded lifetime benefits to surviving spouses and changes the legal criteria used to assess and award claims. Our obligation related to black lung benefits is estimated based on various assumptions, including actuarial estimates, discount rates, changes in health care costs and the impact of PPACA.
|
•
|
Comprehensive Environmental Response, Compensation, and Liability Act.
Under the Comprehensive Environmental Response, Compensation, and Liability Act (“CERCLA”), also known as Superfund, and similar state laws, responsibility for the entire cost of clean-up of a contaminated site, as well as natural resource damages, can be imposed upon current or former site owners or operators, or upon any party who released one or more designated “hazardous substances” at the site, regardless of the lawfulness of the original activities that led to the contamination. In the course of our operations we may have generated and may generate wastes that fall within CERCLA’s definition of hazardous substances. We also may be an owner or operator of facilities at which hazardous substances have been released by previous owners or operators. Under CERCLA, we may be responsible for all or part of the costs of cleaning up facilities at which such substances have been released and for natural resource damages. We also must comply with reporting requirements under the Emergency Planning and Community Right-to-Know Act and the Toxic Substances Control Act.
|
Environmental Matters and Compliance
Our failure to comply with the aforementioned requirements may result in the assessment of administrative, civil and criminal penalties, the imposition of clean-up and site restoration costs and liens, the issuance of injunctions to limit or cease operations, the suspension or revocation of permits and other enforcement measures that could have the effect of limiting production from our operations. Please see
Note 18
to our consolidated financial statements for a discussion of the Notices of Violation (“NOVs”) issued by the EPA and state regulators for our Haverhill, Granite City, and Indiana Harbor cokemaking facilities.
Many other legal and administrative proceedings are pending or may be brought against us arising out of our current and past operations, including matters related to commercial and tax disputes, product liability, antitrust, employment claims, natural resource damage claims, premises-liability claims, allegations of exposures of third-parties to toxic substances and general environmental claims. Although the ultimate outcome of these proceedings cannot be ascertained at this time, it is reasonably possible that some of them could be resolved unfavorably to us. Management of the Company believes that any liability which may arise from such matters would not be material in relation to the financial position, results of operations or cash flows of the Company at
December 31, 2015
.
Available Information
We make available free of charge on our website, www.suncoke.com, our Annual Reports on Form 10-K, Quarterly Reports on Form 10-Q and Current Reports on Form 8-K and any amendments to such reports as soon as reasonably practicable after such materials are electronically filed with, or furnished to, the Securities and Exchange Commission ("SEC").
Executive Officers of the Registrant
Our executive officers and their ages as of
February 18, 2016
,
were as follows:
|
Name
|
Age
|
|
Position
|
|
Frederick A. Henderson
|
57
|
|
Chairman, President and Chief Executive Officer
|
|
Fay West
|
46
|
|
Senior Vice President and Chief Financial Officer
|
|
Katherine T. Gates
|
39
|
|
Senior Vice President, General Counsel and Chief Compliance Officer
|
|
P. Michael Hardesty
|
53
|
|
Senior Vice President, Commercial Operations, Business Development, Terminals and International Coke
|
|
Allison S. Lausas
|
36
|
|
Vice President and Controller
|
|
Gary P. Yeaw
|
58
|
|
Senior Vice President of Human Resources
|
Frederick A. Henderson
. Mr. Henderson was elected as Chairman and Chief Executive Officer of SunCoke Energy, Inc. in December 2010. He also served as a Senior Vice President of Sunoco, Inc. (a transportation fuel provider with interests in logistics) from September 2010 until our initial public offering in July 2011. In July 2012, Mr. Henderson was named Chief Executive Officer and appointed as Chairman of the Board of Directors of SunCoke Energy Partners GP, LLC, the general partner of the Partnership. From February 2010 until September 2010, he was a consultant for General Motors LLC, and from March 2010 until August 2010, he was a consultant for AlixPartners LLC (a business consulting firm). He was President and Chief Executive Officer of General Motors (a global automotive company) from April 2009 until December 2009. He was
12
President and Chief Operating Officer of General Motors from March 2008 until March 2009. He was Vice Chairman and Chief Financial Officer of General Motors from January 2006 until February 2008. He was Chairman of General Motors Europe from June 2004 until December 2005. Mr. Henderson is a director of Marriott International, Inc. (a worldwide lodging and hospitality services company), where he serves as chair of the Audit Committee. Mr. Henderson also is a trustee of the Alfred P. Sloan Foundation and chair of its Audit Committee. Mr. Henderson previously served as a Director of Compuware Corporation (from 2011-2014), a technology performance company; he served as chair of its Audit Committee and as a member of its Nominating/Governance and Advisory Committees.
Fay West
. Ms. West was appointed as Senior Vice President and Chief Financial Officer of SunCoke Energy, Inc. in October 2014. Prior to that time, she served as Vice President and Controller of SunCoke Energy, Inc. since February 2011. In addition, Ms. West was named Vice President and Controller and appointed to the Board of Directors of SunCoke Energy Partners GP LLC, in July 2012. Prior to joining SunCoke Energy, Inc., she was Assistant Controller at United Continental Holdings, Inc. (an airline holding company) from April 2010 to January 2011. She was Vice President, Accounting and Financial Reporting for PepsiAmericas, Inc. (a manufacturer and distributor of beverage products) from December 2006 through March 2010 and Director of Financial Reporting from December 2005 to December 2006. Ms. West worked at GATX Corporation from 1998 to 2005 in various accounting roles, including Vice President and Controller of GATX Rail Company from 2001 to 2005 and Assistant Controller of GATX Corporation from 2000 to 2001.
Katherine T. Gates.
Ms. Gates was appointed Senior Vice President, General Counsel and Chief Compliance Officer, effective October 22, 2015. At that time, she also was appointed as a Director of SunCoke Energy Partners GP, LLC. Ms. Gates joined SunCoke in February 2013 as Senior Health, Environment and Safety Counsel. She was promoted to Vice President and Assistant General Counsel in July 2014, where she focused on litigation, regulatory and commercial matters. Ms. Gates began her legal career in private practice as a Partner at Beveridge & Diamond, P.C. She served on the firm’s Management Committee, where she addressed budget, compensation, commercial, and other issues. Ms. Gates also co-chaired the civil litigation section of the firm’s Litigation Practice Group. We believe that Ms. Gate’s legal knowledge and skill, as well as her experience with SunCoke’s operations, provides the Board of Directors with valuable expertise regarding senior level strategic planning and relevant legal matters, including those related to corporate governance, health, environment, safety, mergers, acquisitions and compliance.
P. Michael Hardesty.
Mr. Hardesty was appointed Senior Vice President, Commercial Operations, Business Development, Terminals and International Coke of SunCoke Energy, Inc., effective October 1, 2015. At that time, he also was appointed as a Director of SunCoke Energy Partners GP, LLC. Mr. Hardesty joined SunCoke Energy, Inc. in 2011 as Senior Vice President, Sales and Commercial Operations, and has more than 30 years of experience in the mining industry. Before joining SunCoke, Mr. Hardesty served as Senior Vice President for International Coal Group, Inc. (“ICG”), where he was responsible for leading the sales and marketing functions and was a key member of the executive management team. Prior to ICG, Mr. Hardesty served as Vice President of Commercial Optimization at Arch Coal, where he developed and executed trade strategies, optimized production output and directed coal purchasing activities. He is a past board member and Secretary-Treasurer of the Putnam County Development Authority in West Virginia. We believe that Mr. Hardesty’s extensive industry experience, as well as his experience with SunCoke, provides the Board of Directors with valuable expertise in commercial operations, marketing and logistics. Mr. Hardesty also possesses health, environment and safety oversight experience by virtue of his oversight experience as a senior-level executive at ICG.
Allison S. Lausas.
Ms. Lausas was appointed Vice President and Controller of both SunCoke Energy, Inc. and SunCoke Energy Partners GP LLC, the general partner of SunCoke Energy Partners, L.P., in October 2014. Ms. Lausas joined SunCoke Energy, Inc. in 2011 and most recently held the role of Assistant Controller. Prior to joining SunCoke Energy, Inc., she worked as an auditor at KPMG LLP, an audit, advisory and tax services firm, from 2002 to 2011, where she served both public and private corporations in the consumer and industrial markets.
Gary P. Yeaw.
Mr. Yeaw was appointed Senior Vice President, Human Resources of SunCoke Energy, Inc. on November 1, 2015. Prior to that, he was Vice President, Human Resources. Mr. Yeaw leads the human resources function at SunCoke Energy, Inc., and is responsible for key organizational activities. Prior to joining SunCoke Energy, Inc., he was Executive Vice President, Human Resources and Communications for Chemtura Corporation. Mr. Yeaw also served as Vice President, Human Resources for American Standard Companies, as well as Vice President, Human Resources Operational Excellence in charge of global benefit programs, labor relations, HR systems and employee services. Mr. Yeaw holds professional designations as a Senior Human Resources Professional, Certified Compensation Professional and was a charter member of the International Society of Employee Benefits Specialists. We believe that Mr. Yeaw’s extensive human resources background and experience provides the Board of Directors with valuable expertise in executive compensation, employee benefits and labor relations. Mr. Yeaw also possesses senior level strategic planning experience by virtue of his experience as a senior-level executive at Chemtura Corporation.
13
|
Item 1A.
|
Risk Factors
|
In addition to the other information included in this Annual Report on Form 10-K, the following risk factors should be considered in evaluating our business and future prospects. These risk factors represent what we believe to be the known material risk factors with respect to us and our business. Our business, operating results, cash flows and financial condition are subject to these risks and uncertainties, any of which could cause actual results to vary materially from recent results or from anticipated future results.
Risks Inherent in Our Business and Industry
Unfavorable economic conditions in the U.S. and globally, may cause a reduction in the demand for our products and services, which could adversely affect our cash flows, financial position or results of operations.
Sustained volatility and disruption in worldwide capital and credit markets in the U.S. and globally could cause reduced demand for our products. Additionally, unfavorable economic conditions, including the potentially reduced availability of credit, may cause reduced demand for steel products or reduced demand for coal, either of which, in turn, could adversely affect demand for our products and services. Such conditions could have an adverse effect on our cash flows, financial position or results of operations.
Adverse developments at our cokemaking, coal logistics and/or coal mining, operations, including equipment failures or deterioration of assets, may lead to production curtailments, shutdowns or additional expenditures, which could have a material adverse effect on our results of operations.
Our cokemaking, coal logistics and coal mining operations are subject to significant hazards and risks that include, but are not limited to, equipment malfunction, explosions, fires and the effects of severe weather conditions and extreme temperatures, any of which could result in production and transportation difficulties and disruptions, permit non-compliance, pollution, personal injury or wrongful death claims and other damage to our properties and the property of others.
Adverse developments at our cokemaking facilities could significantly disrupt our coke, steam and/or electricity production and our ability to supply coke, steam, and/or electricity to our customers. Adverse developments at our coal logistics operations could significantly disrupt our ability to provide coal handling, mixing, storage, terminalling, transloading and/or transportation services to our customers. Adverse developments at our coal mining operations could significantly disrupt our ability to produce coal. Any sustained disruption at our cokemaking, coal logistics and/or coal mining operations could have a material adverse effect on our results of operations.
There is a risk of mechanical failure of our equipment both in the normal course of operations and following unforeseen events. Our cokemaking, coal logistics and coal mining operations depend upon critical pieces of equipment that occasionally may be out of service for scheduled upgrades or maintenance or as a result of unanticipated failures. Our facilities are subject to equipment failures and the risk of catastrophic loss due to unanticipated events such as fires, accidents or violent weather conditions or extreme temperatures. As a result, we may experience interruptions in our processing and production capabilities, which could have a material adverse effect on our results of operations and financial condition. In particular, to the extent a disruption leads to our failure to maintain the temperature inside our coke oven batteries, we would not be able to continue operation of such coke ovens, which could adversely affect our ability to meet our customers’ requirements for coke.
Assets and equipment critical to the operations of our cokemaking, coal logistics and coal mining operations also may deteriorate or become depleted materially sooner than we currently estimate. Such deterioration of assets may result in additional maintenance spending or additional capital expenditures. If these assets do not generate the amount of future cash flows that we expect, and we are not able to procure replacement assets in an economically feasible manner, our future results of operations may be materially and adversely affected.
We are required to perform impairment tests on our assets whenever events or changes in circumstances lead to a reduction of the estimated useful life or estimated future cash flows that would indicate that the carrying amount may not be recoverable or whenever management’s plans change with respect to those assets. For example, in 2015 we impaired our equity method investment in VISA SunCoke to zero. If we are required to incur impairment charges in the future, our results of operations in the period taken could be materially and adversely affected.
We are subject to extensive laws and regulations, which may increase our cost of doing business and have an adverse effect on our cash flows, financial position or results of operations.
Our operations are subject to increasingly strict regulation by federal, state and local authorities with respect to: discharges of substances into the air and water; emissions of greenhouse gases, or GHG; compliance with the NAAQS; management and disposal of hazardous substances and wastes; cleanup of contaminated sites; protection of groundwater quality and availability; protection of plants and wildlife; reclamation and restoration of properties after completion of mining or drilling; installation of safety equipment in our facilities; control of surface subsidence from underground mining; and protection of employee health and safety. Complying with these requirements, including the terms of our permits, can be costly
14
and time-consuming, and may delay commencement or hinder continuation of operations. In addition, these requirements are complex, change frequently and have become more stringent over time. These requirements may change in the future in a manner that could result in substantially increased capital, operating and compliance costs, and could have a material adverse effect on our business.
Failure to comply with these regulations or permits may result in the assessment of administrative, civil and criminal penalties, the imposition of cleanup and site restoration costs and liens, the issuance of injunctions to limit or cease operations, the suspension or revocation of permits and other enforcement measures that could limit or materially increase the cost of our operations. We may not have been, or may not be, at all times, in complete compliance with all of these requirements, and we may incur material costs or liabilities in connection with these requirements, or in connection with remediation at sites we own, or third-party sites where it has been alleged that we have liability, in excess of the amounts we have accrued. For a description of certain environmental laws and matters applicable to us, see “Item 1. Business-Legal and Regulatory Requirements.”
We may be unable to obtain, maintain or renew permits or leases necessary for our operations, which could materially reduce our production, cash flows or profitability.
Our cokemaking, coal logistics and coal mining operations require us to obtain a number of permits that impose strict regulations on various environmental and operational matters. These, as well as our facilities and operations (including our generation of electricity), include permits issued by various federal, state and local agencies and regulatory bodies. The permitting rules, and the interpretations of these rules, are complex, change frequently, and are often subject to discretionary interpretations by our regulators, all of which may make compliance more difficult or impractical, and may possibly preclude the continuance of ongoing operations or the development of future cokemaking, coal logistics, and/or coal mining facilities. Non-governmental organizations, environmental groups and individuals have certain statutory rights to engage in the permitting process, and may comment upon, or object to, the requested permits. Such persons also have the right to bring citizen’s lawsuits to challenge the issuance of permits, or the validity of environmental impact statements related thereto. If any permits or leases are not issued or renewed in a timely fashion or at all, or if permits issued or renewed are conditioned in a manner that restricts our ability to efficiently and economically conduct our operations, our cash flows or profitability could be materially and adversely affected.
Our businesses are subject to inherent risks, some for which we maintain third party insurance and some for which we self-insure. We may incur losses and be subject to liability claims that could have a material adverse effect on our financial condition, results of operations or cash flows.
We maintain insurance policies that provide limited coverage for some, but not all, potential risks and liabilities associated with our business. We may not obtain insurance if we believe the cost of available insurance is excessive relative to the risks presented. As a result of market conditions, premiums and deductibles for certain insurance policies can increase substantially, and in some instances, certain insurance may become unavailable or available only for reduced amounts of coverage. As a result, we may not be able to renew our existing insurance policies or procure other desirable insurance on commercially reasonable terms, if at all. In addition, certain environmental and pollution risks generally are not fully insurable. Even where insurance coverage applies, insurers may contest their obligations to make payments. Our financial condition, results of operations and cash flows could be materially and adversely affected by losses and liabilities from un-insured or under-insured events, as well as by delays in the payment of insurance proceeds, or the failure by insurers to make payments.
We also may incur costs and liabilities resulting from claims for damages to property or injury to persons arising from our operations. We must compensate employees for work-related injuries. If we do not make adequate provision for our workers’ compensation liabilities, or we are pursued for applicable sanctions, costs and liabilities, our operations and our profitability could be adversely affected.
Divestitures and other significant transactions may adversely affect our business. In particular, if we are unable to realize the anticipated benefits from such transactions, or are unable to conclude such transactions upon favorable terms, our financial condition, results of operations or cash flows could be adversely affected.
We regularly review strategic opportunities to further our business objectives, and may eliminate assets that do not meet our return-on-investment criteria. If we are unable to complete such divestitures or other transactions upon favorable terms, or in a timely manner, or if the market conditions assumed in our project economics deteriorate, our financial condition, results of operations or cash flows could be adversely affected.
The anticipated benefits of divestitures and other strategic transactions may not be realized, or may be realized more slowly than we expected. Such transactions also could result in a number of financial consequences having a material effect on our results of operations and our financial position, including reduced cash balances; higher fixed expenses; the incurrence of debt and contingent liabilities (including indemnification obligations); restructuring charges; loss of customers, suppliers, distributors, licensors or employees; legal, accounting and advisory fees; and impairment charges.
We may experience significant risks associated with future acquisitions and/or investments.
15
The success of our future acquisitions and/or investments will depend substantially on the accuracy of our analysis concerning such businesses and our ability to complete such acquisitions or investments on favorable terms, as well as to finance such acquisitions or investments and to integrate the acquired operations successfully with existing operations. Antitrust and other laws may prevent us from completing acquisitions. If we are unable to integrate new operations successfully, our financial results and business reputation could suffer.
Risks associated with acquisitions include the diversion of management’s attention from other business concerns, the potential loss of key employees and customers of the acquired business, the possible assumption of unknown liabilities, potential disputes with the sellers, and the inherent risks in entering markets or lines of business in which we have limited or no prior experience. Additionally, in the event we form joint ventures or other similar arrangements, we must pay close attention to the organizational formalities and time-consuming procedures for sharing information and making decisions. We may share ownership and management with other parties who may not have the same goals, strategies, priorities, or resources as we do. The benefits from a successful investment in an existing entity or joint venture will be shared among the co-owners, so we will not receive the exclusive benefits from a successful investment. Additionally, if a co-owner changes, our relationship may be materially and adversely affected.
Our operations could be disrupted if our information systems fail, causing increased expenses. Security breaches and other disruptions could compromise our information and expose us to liability, which would cause our business and reputation to suffer.
Our business is dependent on financial, accounting and other data processing systems and other communications and information systems, including our enterprise resource planning tools. We process a large number of transactions on a daily basis and rely upon the proper functioning of computer systems. If a key system was to fail or experience unscheduled downtime for any reason, our operations and financial results could be affected adversely. Our systems could be damaged or interrupted by a security breach, terrorist attack, fire, flood, power loss, telecommunications failure or similar event. Our disaster recovery plans may not entirely prevent delays or other complications that could arise from an information systems failure. Our business interruption insurance may not compensate us adequately for losses that may occur.
In the ordinary course of our business, we collect and store sensitive data in our data centers, on our networks, and in our cloud vendors. Such data includes: intellectual property; our proprietary business information and that of our customers, suppliers and business partners; and personally identifiable information of our employees. The secure processing, maintenance and transmission of this information is critical to our operations and business strategy. Despite our security measures, our information technology and infrastructure may be vulnerable to attacks by hackers or breached due to employee error, malfeasance or other disruptions. Any such breach could compromise our networks and the information stored there could be accessed, publicly disclosed, lost or stolen. Any such access, disclosure or other loss of information could result in legal claims or proceedings, liability under laws that protect the privacy of personal information, and regulatory penalties, disrupt our operations, and damage our reputation, which could adversely affect our business.
Our operating results have been and may continue to be affected by fluctuations in our costs of production, and, if we cannot pass increases in our costs of production to our customers, our financial condition, results of operations and cash flows may be negatively affected.
Our operations require a reliable supply of equipment and replacement parts. If the cost to produce coke and provide coal logistic services, including cost of supplies, equipment and labor, experience significant price inflation, and we cannot pass such increases in our costs of production to our customers, our profit margins may be reduced and our financial condition, results of operations and cash flows may be adversely affected.
Labor disputes with the unionized portion of our workforce could affect us adversely. Union represented labor creates an increased risk of work stoppages and higher labor costs.
We rely, at one or more of our facilities, on unionized labor, and there is always the possibility that we may be unable to reach agreement on terms and conditions of employment or renewal of a collective bargaining agreement. When collective bargaining agreements expire or terminate, we may not be able to negotiate new agreements on the same or more favorable terms as the current agreements, or at all, and without production interruptions, including labor stoppages. We are currently negotiating the extension of our labor agreement at Indiana Harbor, which expired on September 1, 2015. The labor agreements at our Quincy and Lake Terminal coal handling facilities expire on April 30, 2016 and June 30, 2016, respectively. We will be negotiating the renewal of these agreements in 2016. The labor agreement at our Vitoria, Brazil facility expired on October 31, 2015. We are currently negotiating the extension of the agreement and do not anticipate any work stoppages. If we are unable to negotiate the renewal of a collective bargaining agreement before its expiration date, our operations and our profitability could be adversely affected. A prolonged labor dispute, which may include a work stoppage, could adversely affect our ability to satisfy our customers’ orders and, as a result, adversely affect our operations, or the stability of production and reduce our future revenues, or profitability. It is also possible that, in the future, additional employee groups may choose to be represented by a labor union.
16
Our ability to operate our company effectively could be impaired if we fail to attract and retain key personnel.
We have implemented recruitment, training and retention efforts to optimally staff our operations. Our ability to operate our business and implement our strategies depends in part on the efforts of our executive officers and other key employees. In addition, our future success will depend on, among other factors, our ability to attract and retain other qualified personnel. The loss of the services of any of our executive officers or other key employees or the inability to attract or retain other qualified personnel in the future could have a material adverse effect on our business or business prospects. With respect to our represented employees, we may be adversely impacted by the loss of employees who retire or obtain other employment during a layoff or a work stoppage.
We have obligations for long-term employee plan benefits that may involve expenses that are greater than we have assumed.
We are required to provide various long-term employee benefits to retired employees and current employees who will retire in the future. We have estimated these obligations based on actuarial assumptions described in
Note 14
to our consolidated financial statements. However, if our assumptions are inaccurate, we could be required to expend materially greater amounts than anticipated, and this could have a material and adverse effect on our financial condition, results of operations and cash flows.
We currently are, and likely will be, subject to litigation, the disposition of which could have a material adverse effect on our cash flows, financial position or results of operations.
The nature of our operations exposes us to possible litigation claims in the future, including disputes relating to our operations and commercial and contractual arrangements. Although we make every effort to avoid litigation, these matters are not totally within our control. We will contest these matters vigorously and have made insurance claims where appropriate, but because of the uncertain nature of litigation and coverage decisions, we cannot predict the outcome of these matters. Litigation is very costly, and the costs associated with prosecuting and defending litigation matters could have a material adverse effect on our financial condition and profitability. In addition, our profitability or cash flow in a particular period could be affected by an adverse ruling in any litigation currently pending in the courts or by litigation that may be filed against us in the future. We are also subject to significant environmental and other government regulation, which sometimes results in various administrative proceedings. For additional information, see “Item 3. Legal Proceedings.”
Our indebtedness could adversely affect our financial condition and prevent us from fulfilling our obligations under outstanding notes and credit facilities.
Subject to the limits contained in our credit agreements, the indenture that governs our notes and our other debt instruments, we may be able to incur additional debt from time to time to finance working capital, capital expenditures, investments or acquisitions, or for other purposes. If we do so, the risks related to our level of debt could intensify. Specifically, a higher level of debt could have important consequences, including:
|
•
|
making it more difficult for us to satisfy our obligations with respect to the notes and our other debt;
|
|
•
|
limiting our ability to obtain additional financing to fund future working capital, capital expenditures, acquisitions or other general corporate requirements;
|
|
•
|
requiring a substantial portion of our cash flows to be dedicated to debt service payments instead of other purposes, thereby reducing the amount of cash flows available for the payment of dividends, working capital, capital expenditures, acquisitions and other general corporate purposes;
|
|
•
|
increasing our vulnerability to general adverse economic and industry conditions;
|
|
•
|
exposing us to the risk of increased interest rates as certain of our borrowings, including borrowings under the credit facilities, are at variable rates of interest;
|
|
•
|
limiting our flexibility in planning for and reacting to changes in the industry in which we compete;
|
|
•
|
placing us at a competitive disadvantage to other, less leveraged competitors; and
|
|
•
|
increasing our cost of borrowing.
|
In addition, the indenture that governs the notes and the credit agreement governing our credit facilities contain restrictive covenants that limit our ability to engage in activities (such as incurring additional debt) that may be in our long-term best interest. Our failure to comply with those covenants could result in an event of default which, if not cured or waived, could result in the acceleration of all our debt.
Our variable rate indebtedness subjects us to interest rate risk, which could cause our debt service obligations to increase significantly.
17
Borrowings under the credit facilities are at variable rates of interest and expose us to interest rate risk. If interest rates increase, our debt service obligations on the variable rate indebtedness will increase even though the amount borrowed remained the same, and our net income and cash flows, including cash available for servicing our indebtedness, will correspondingly decrease. We have entered into and may in the future enter into additional interest rate swaps that involve the exchange of floating for fixed rate interest payments in order to reduce interest rate volatility. However, we may decide not to maintain interest rate swaps with respect to all of our variable rate indebtedness, and any swaps we enter into may not fully mitigate our interest rate risk.
We face substantial debt maturities which may adversely affect our consolidated financial position.
Over the next six years, we have approximately
$1,004 million
of total consolidated debt maturing at SunCoke and the Partnership. See
Note 16
to the consolidated financial statements. We may not be able to refinance this debt, or may be forced to do so on terms substantially less favorable than our currently outstanding debt. We may be forced to delay or not make capital expenditures, which may adversely affect our competitive position and financial results.
Rating agencies may downgrade our credit ratings, which would make it more difficult for us to raise capital and would increase our financing costs.
Any downgrades in our credit ratings may make raising capital more difficult, may increase the cost and affect the terms of future borrowings, may affect the terms under which we purchase goods and services and may limit our ability to take advantage of potential business opportunities.
We own a significant equity interest in the Partnership, and our consolidated financial statements include the Partnership’s substantial indebtedness. If effective control of the Partnership’s general partner is transferred to a third party, the Partnership’s indebtedness could become due and payable, which would materially and adversely affect our consolidated financial position.
If effective control of the Partnership’s general partner is transferred to a third party, the Partnership, pursuant to the indenture for its outstanding senior secured notes, could be required to repurchase such notes in an amount equal to 101 percent of the aggregate principal amount outstanding, which was $552.5 million at December 31, 2015. Under the Partnership’s revolving credit agreement, the lenders could declare the loans and other amounts (including letter of credit obligations), totaling $182.0 million at December 31, 2015, to be immediately due and payable. In addition, the Partnership has $50.0 million drawn under a term loan facility that contains event of default and remedies provisions identical to those of the revolving credit agreement. Thus, the potential acceleration remedies under the Partnership’s revolving credit agreement and term loan facility could result in approximately $232.0 million of outstanding borrowings being declared immediately due and payable.
Due to our significant equity ownership interest in the Partnership, our consolidated financial statements include the Partnership’s indebtedness. If effective control of the Partnership’s general partner is transferred to a third party, resulting in the Partnership’s aggregate indebtedness becoming payable, our consolidated financial position would be materially and adversely affected.
Risks Related to Our Cokemaking Business
We are exposed to the credit risk, and certain other risks, of our major customers and other parties, and any material nonpayment or nonperformance by our major customers, or the failure of our customers to continue to purchase coke from us at similar prices under similar arrangements, may have a material adverse effect on our cash flows, financial position, permit compliance or results of operations.
We are subject to the credit risk of our major customers and other parties. If we fail to adequately assess the creditworthiness of existing or future customers or unanticipated deterioration of their creditworthiness, any resulting increase in nonpayment or nonperformance by them could have a material adverse effect on our cash flows, financial position or results of operations.
We are subject to the risk of loss resulting from nonpayment or nonperformance by our coke and/or our coal logistics customers. We have long-term take-or-pay agreements with our coke customers whose operations are concentrated in the steelmaking industry, and with certain of our coal logistics customers who market coal internationally and domestically. These agreements require such customers either to purchase all of our coke production (or a specified maximum tonnage greater than on stated capacity as applicable), or our coal handling services, as the case may be, or to pay the contract prices for the coke, or the coal handling services, they do not accept. Our customers experience significant fluctuations in demand for steel products because of economic conditions, consumer demand, raw material and energy costs and decisions by the U.S. federal and state governments to fund or not fund infrastructure projects, such as highways, bridges, schools, energy plants, railroads and transportation facilities. During periods of weak demand for steel, our customers may experience significant reductions in their operations, or substantial declines in the prices of the steel they sell. For example, in response to worsening market conditions
18
for the steel industry, U.S. Steel and AK Steel have temporarily idled their facilities at Granite City and Ashland, respectively. These and other factors such as labor negotiations or bankruptcy filings may lead certain of our customers to seek renegotiation or cancellation of their existing long-term coke purchase commitments to us, which could have a material adverse effect on our cash flows, financial position, permit compliance or results of operations.
The financial performance of our cokemaking business is substantially dependent upon three customers in the steel industry, and any failure by them to perform under their contracts with us could adversely affect our financial condition, results of operations and cash flows.
Substantially all of our domestic coke sales are currently made under long-term contracts with ArcelorMittal, U.S. Steel and AK Steel. We expect these three customers to continue to account for a significant portion of our revenues for the foreseeable future. If any one or more of these customers were to significantly reduce its purchases of coke from us, or default on their agreements with us, or fail to renew or terminate its agreements with us, or if we were unable to sell coke to any one or more of these customers on terms as favorable to us as the terms under our current agreements, our cash flows, financial position and results of operations could be materially and adversely affected.
If a substantial portion of our agreements to supply coke, electricity, and/or steam are modified or terminated, our results of operations may be adversely affected if we are not able to replace such agreements, or if we are not able to enter into new agreements at the same level of profitability.
We make substantially all of our coke, electricity and steam sales under long-term agreements. If a substantial portion of these agreements are modified or terminated or if force majeure is exercised, our results of operations may be adversely affected if we are not able to replace such agreements, or if we are not able to enter into new agreements at the same level of profitability. The profitability of our long-term coke, energy and steam sales agreements depends on a variety of factors that vary from agreement to agreement and fluctuate during the agreement term. We may not be able to obtain long-term agreements at favorable prices, compared either to market conditions or to our cost structure. Price changes provided in long-term supply agreements may not reflect actual increases in production costs. As a result, such cost increases may reduce profit margins on our long-term coke and energy sales agreements. In addition, contractual provisions for adjustment or renegotiation of prices and other provisions may increase our exposure to short-term price volatility.
From time to time, we discuss the extension of existing agreements and enter into new long-term agreements for the supply of coke, steam, and energy to our customers, but these negotiations may not be successful and these customers may not continue to purchase coke, steam, or electricity from us under long-term agreements. In addition, declarations of bankruptcy by customers such as Haverhill Chemicals LLC can result in changes in our contracts with less favorable terms. If any one or more of these customers were to become financially distressed and unable to pays us, significantly reduce their purchases of coke, steam, or electricity from us, or if we were unable to sell coke or electricity to them on terms as favorable to us as the terms under our current agreements, our cash flows, financial position, permit compliance, or results of operations may be materially and adversely affected.
Further, because of certain technological design constraints, we do not have the ability to shut down our cokemaking operations if we do not have adequate customer demand. If a customer refuses to take or pay for our coke, we must continue to operate our coke ovens even though we may not be able to sell our coke immediately and may incur significant additional costs for natural gas to maintain the temperature inside our coke oven batteries, which may have a material and adverse effect on our cash flows, financial position or results of operations.
The coke sales agreement and the energy sales agreement with AK Steel at our Haverhill facility are subject to early termination under certain circumstances and any such termination could have a material adverse effect on our results of operations and therefore our ability to distribute cash to unitholders.
The coke sales agreement and the energy sales agreement with AK Steel at Haverhill 2, or the Haverhill AK Steel Contracts, are subject to early termination by AK Steel under certain circumstances and any such termination could have a material adverse effect on our business. The Haverhill coke sales agreement with AK Steel expires on January 1, 2022, with two automatic, successive five-year renewal periods. The Haverhill energy sales agreement with AK Steel runs concurrently with the term of the coke sales agreement, including any renewals, and automatically terminates upon the termination of the related coke sales agreement. The coke sales agreement may be terminated by AK Steel at any time on or after January 1, 2014 upon two years prior written notice if AK Steel (i) permanently shuts down iron production operations at its steel plant works in Ashland, Kentucky, or the Ashland Plant; and (ii) has not acquired or begun construction of a new blast furnace in the U.S. to replace, in whole or in part, the Ashland Plant’s iron production capacity.
If AK Steel were to terminate the Haverhill AK Steel Contracts, we may be unable to enter into similar long-term contracts with replacement customers for all or any portion of the coke previously purchased by AK Steel. Similarly, we may be forced to sell some or all of the previously contracted coke in the spot market, which could be at prices lower than we have
19
currently contracted for and could subject us to significant price volatility. If AK Steel elects to terminate the Haverhill AK Steel Contracts, our cash flows, financial position and results of operations could be materially and adversely affected.
Excess capacity in the global steel industry, including in China, may weaken demand for steel produced by our U.S. steel industry customers, which, in turn, may reduce demand for our coke.
In some countries, such as China, steelmaking capacity exceeds demand for steel products. Rather than reducing employment by matching production capacity to consumption, steel manufacturers in these countries (often with local government assistance or subsidies in various forms) may export steel at prices that are significantly below their home market prices and that may not reflect their costs of production or capital.
The availability of this steel at such prices has negatively affected our steelmaking customers, who may have to decrease the prices that they charge for steel, or take other action, as the supply of steel increases. For example, in response to worsening market conditions for the steel industry, U.S. Steel and AK Steel have temporarily idled their facilities at Granite City and Ashland, respectively. Our customers also may reduce their demand for our coke correspondingly, and make it more likely that they may seek to renegotiate their contracts with us or fail to pay for the coke they are required to take under our contracts.
The profitability and financial position of our steelmaking customers may be adversely affected, which in turn, could adversely affect the certainty of our long-term relationships with those customers, as well as our ability to sell excess capacity in the spot market, and our own results of operations.
Increased exports of coke from producing countries may weaken our customers’ demand for coke capacity.
In recent years, significantly increased availability and supply of Chinese coke has exerted downward pressure on the pricing of coke sold by VISA SunCoke, our Indian joint venture. Future increases in exports of coke from China and/or other producing countries may reduce our customers’ demand for coke capacity, which could depress coke prices and limit our ability to enter into new, or renew existing, commercial arrangements with our customers, as well as our ability to sell excess capacity in the spot market, and could materially and adversely affect our future revenues and profitability.
Our cokemaking business is subject to operating risks, some of which are beyond our control, that could result in a material increase in our operating expenses.
Factors beyond our control could disrupt our cokemaking operations, adversely affect our ability to service the needs of our customers, and increase our operating costs, all of which could have a material adverse effect on our results of operations. Such factors could include:
|
•
|
earthquakes, subsidence and unstable ground or other conditions that may cause damage to infrastructure or personnel;
|
|
•
|
fire, explosion, or other major incident causing injury to personnel and/or equipment, resulting in all or part of the cokemaking operations at one of our facilities to cease, or be severely curtailed for a period of time;
|
|
•
|
processing and plant equipment failures, operating hazards and unexpected maintenance problems affecting our cokemaking operations or our customers; and
|
|
•
|
adverse weather and natural disasters, such as severe winds, heavy rains, snow, flooding, extremes of temperature, and other natural events affecting cokemaking operations, transportation, or our customers.
|
If any of these conditions or events occur, our cokemaking operations may be disrupted, operating costs could increase significantly, and we could incur substantial losses in this business segment. Disruptions in our cokemaking operations could materially and adversely affect our financial condition, or results of operations.
We are exposed to specific risks inherent in doing business in countries other than the U.S., which could adversely affect our results of operations and profitability.
Our foreign operations (e.g. in Brazil and India) expose us to several risks that are beyond our control, including, among other things, political and economic instability within the host country; foreign government regulations that favor or require the awarding of contracts to local competitors; difficulty recruiting and retaining management of our overseas operations; difficulties in collecting accounts receivable and longer collection periods; changing taxation policies; fluctuations in currency exchange rates; revaluations, devaluations and restrictions on repatriation of currency; and import/export quotas and restrictions or other trade barriers.
Fluctuations in foreign currency exchange rates could significantly and adversely affect results of operations or financial condition.
Our operations outside the U.S. have transactions and balances denominated in currencies other than the U.S. dollar, including the Indian rupee and the Brazilian real, among others. Because our consolidated financial statements are prepared in accordance with GAAP and are reported in U.S. dollars, we translate revenues, expenses and balance sheet accounts of our
20
foreign operations into U.S. dollars at exchange rates in effect during or at the end of each reporting period. Currency exchange rates are influenced by local inflation, growth, interest rates, governmental actions and other events and circumstances beyond our control.
Increases or decreases in the value of the U.S. dollar against these other currencies will affect our net operating revenues, operating income and the value of balance sheet items denominated in such foreign currencies, and fluctuations in foreign currency exchange rates could significantly and adversely affect results of operations or financial condition.
Our India Coke business segment purchases metallurgical coal to be used in the production of coke. Since these purchases of coal are denominated in U.S. dollars, while the functional currency of this business segment is the Indian rupee, such transactions are subject to foreign currency risk. In addition, unexpected and dramatic fluctuations in currency exchange rates, such as the recent deterioration in value of the Indian rupee, could materially and adversely affect the value of our earnings from our India Coke business segment. Although our India Coke business segment uses derivative financial instruments to hedge currency fluctuations for anticipated purchases of coal used in the production of coke, we cannot assure you that fluctuations in foreign currency exchange rates, particularly the strengthening of the U.S. dollar against the Indian rupee, or other currencies, would not materially affect our financial results.
Income from operation of the Vitória, Brazil cokemaking facility may be affected by global and regional economic and political factors and the policies and actions of the Brazilian government.
The Vitória cokemaking facility is owned by a project company controlled by a Brazilian affiliate of ArcelorMittal. We earn income from the Vitória, Brazil operations through licensing and operating fees earned at the Brazilian cokemaking facility payable to us under long-term agreements with the project company and an annual preferred dividend from the project company guaranteed by the Brazilian affiliate of ArcelorMittal. These revenues depend on continuing operations and, in some cases, certain minimum production levels being achieved at the Vitória cokemaking facility. In the past, the Brazilian economy has been characterized by frequent and occasionally extensive intervention by the Brazilian government and unstable economic cycles. The Brazilian government has changed in the past, and may change monetary, taxation, credit, tariff and other policies to influence Brazil’s economy in the future. If the operations at Vitória cokemaking facility are interrupted or if certain minimum production levels are not achieved, we will not be able to earn the same licensing and operating fees as we are currently earning, which could have an adverse effect on our financial position, results of operations and cash flows.
We face increasing competition both from alternative steelmaking and cokemaking technologies that have the potential to reduce or completely eliminate the use of coke, which may reduce the demand for the coke we produce and which could have an adverse effect on our results of operations.
Historically, coke has been used as a main input in the production of steel in blast furnaces. However, some blast furnace operators have reduced the amount of coke per ton of hot metal through alternative injectants, such as natural gas and pulverized coal, and the use of these coke substitutes could increase in the future, particularly in light of current low natural gas prices. Many steelmakers also are exploring alternatives to blast furnace technology that require less or no use of coke. For example, electric arc furnace technology is a commercially proven process widely used in the U.S. As these alternative processes for production of steel become more widespread, the demand for coke, including the coke we produce, may be significantly reduced, and this reduction could have a material and adverse effect on our financial position, results of operations and cash flows.
We also face competition from alternative cokemaking technologies, including both by-product and heat recovery technologies. As these technologies improve and as new technologies are developed, competition in the cokemaking industry may intensify.
Certain provisions in our long-term coke agreements may result in economic penalties to us, or may result in termination of our coke sales agreements for failure to meet minimum volume requirements or other required specifications, and certain provisions in these agreements and our energy sales agreements may permit our customers to suspend performance.
Our agreements for the supply of coke, energy and/or steam, contain provisions requiring us to supply minimum volumes of our products to our customers. To the extent we do not meet these minimum volumes, we are generally required under the terms of our coke sales agreements to procure replacement supply to our customers at the applicable contract price or potentially be subject to cover damages for any shortfall. If future shortfalls occur, we will work with our customer to identify possible other supply sources while we implement operating improvements at the facility, but we may not be successful in identifying alternative supplies and may be subject to paying the contract price for any shortfall or to cover damages, either of which could adversely affect our future revenues and profitability. Our coke sales agreements also contain provisions requiring us to deliver coke that meets certain quality thresholds. Failure to meet these specifications could result in economic penalties, including price adjustments, the rejection of deliveries or termination of our agreements.
21
Our coke and energy sales agreements contain force majeure provisions allowing temporary suspension of performance by our customers for the duration of specified events beyond the control of our customers. Declaration of force majeure, coupled with a lengthy suspension of performance under one or more coke or energy sales agreements, may seriously and adversely affect our cash flows, financial position and results of operations.
To the extent we do not meet coal-to-coke yield standards in our coke sales agreements, we are responsible for the cost of the excess coal used in the cokemaking process, which could adversely impact our results of operations and profitability.
Our ability to pass through our coal costs to our customers under our coke sales agreements is generally subject to our ability to meet some form of coal-to-coke yield standard. To the extent that we do not meet the yield standard in the contract, we are responsible for the cost of the excess coal used in the cokemaking process. We may not be able to meet the yield standards at all times, and as a result we may suffer lower margins on our coke sales and our results of operations and profitability could be adversely affected.
Failure to maintain effective quality control systems at our cokemaking facilities could have a material adverse effect on our results of operations.
The quality of our coke is critical to the success of our business. For instance, our coke sales agreements contain provisions requiring us to deliver coke that meets certain quality thresholds. If our coke fails to meet such specifications, we could be subject to significant contractual damages or contract terminations, and our sales could be negatively affected. The quality of our coke depends significantly on the effectiveness of our quality control systems, which, in turn, depends on a number of factors, including the design of our quality control systems, our quality-training program and our ability to ensure that our employees adhere to our quality control policies and guidelines. Any significant failure or deterioration of our quality control systems could have a material adverse effect on our results of operations.
If we are unable to realize the anticipated benefits from planned maintenance activities and additional measures to control costs at our Indiana Harbor cokemaking operations, our future financial performance, results of operations and cash flows could be materially and adversely affected.
During the third quarter of 2015, we implemented a more holistic approach for stabilizing our Indiana Harbor cokemaking operations to address deteriorating coke oven conditions and to improve plant costs and capital performance, including rebuilding certain ovens. Previous coke oven and plant refurbishment efforts have not delivered expected results.
Despite the recently implemented comprehensive plan of refurbishment to restore the integrity of coke oven structures as well as the more holistic focus on operating the plant in an optimal manner, unexpected costs and challenges may arise and there is a risk of continuing mechanical failures and deterioration of assets leading to production curtailments, shutdowns or additional expenditures at our Indiana Harbor operations, any or all of which could significantly disrupt our coke production and our ability to supply coke to our customer.
If the implementation of these systematic planned maintenance activities to improve operating performance at Indiana Harbor (and related additional measures to control and benchmark costs) do not produce the expected benefits, our future financial performance, results of operations and cash flows could be materially and adversely affected.
Disruptions to our supply of coal and coal mixing services may reduce the amount of coke we produce and deliver, and if we are not able to cover the shortfall in coal supply or obtain replacement mixing services from other providers, our results of operations and profitability could be adversely affected.
Most of the metallurgical coal used to produce coke at our cokemaking facilities, other than our Jewell facility, is purchased from third-parties under one- to two-year contracts. We cannot assure that there will continue to be an ample supply of metallurgical coal available or that we will be able to supply these facilities without any significant disruption in coke production, as economic, environmental, and other conditions outside of our control may reduce our ability to source sufficient amounts of coal for our forecasted operational needs. The failure of our coal suppliers to meet their supply commitments could materially and adversely impact our results of operations if we are not able to make up the shortfalls resulting from such supply failures through purchases of coal from other sources.
Other than at our Jewell cokemaking facility, we rely on third-parties to mix coals that we have purchased into coal mixes that we use to produce coke. We have entered into long-term agreements with coal mixing service providers that are coterminous with our coke sales agreements. However, there are limited alternative providers of coal mixing services and any disruptions from our current service providers could materially and adversely impact our results of operations. In addition, if our rail transportation agreements are terminated, we may have to pay higher rates to access rail lines or make alternative transportation arrangements.
Limitations on the availability and reliability of transportation, and increases in transportation costs, particularly rail systems, could materially and adversely affect our ability to obtain a supply of coal and deliver coke to our customers.
22
Our ability to obtain coal depends primarily on third-party rail systems and to a lesser extent river barges. If we are unable to obtain rail or other transportation services, or are unable to do so on a cost-effective basis, our results of operations could be adversely affected. Alternative transportation and delivery systems are generally inadequate and not suitable to handle the quantity of our shipments or to ensure timely delivery. The loss of access to rail capacity could create temporary disruption until the access is restored, significantly impairing our ability to receive coal and resulting in materially decreased revenues. Our ability to open new cokemaking facilities may also be affected by the availability and cost of rail or other transportation systems available for servicing these facilities.
Our coke production obligations at our Jewell cokemaking facility and one half of our Haverhill cokemaking facility require us to deliver coke to certain customers via railcar. We have entered into long-term rail transportation agreements to meet these obligations. Disruption of these transportation services because of weather-related problems, mechanical difficulties, train derailments, infrastructure damage, strikes, lock-outs, lack of fuel or maintenance items, fuel costs, transportation delays, accidents, terrorism, domestic catastrophe or other events could temporarily, or over the long-term, impair our ability to produce coke, and therefore, could materially and adversely affect our business and results of operations.
If we are unable to effectively protect our intellectual property, third parties may use our technology, which would impair our ability to compete in our markets.
Our future success will depend in part on our ability to obtain and maintain meaningful patent protection for certain of our technologies and products throughout the world. The degree of future protection for our proprietary rights in uncertain. We rely on patents to protect a significant part our intellectual property portfolio and to enhance our competitive position. However, our presently pending or future patent applications may not issue as patents, and any patent previously issued to us or our subsidiaries may be challenged, invalidated, held unenforceable or circumvented. Furthermore, the claims in patents that have been issued to us or our subsidiaries or that may be issued to us in the future may not be sufficiently broad to prevent third parties from using cokemaking technologies and heat recovery processes similar to ours. In addition, the laws of various foreign countries in which we plan to compete may not protect our intellectual property to the same extent as do the laws of the United States. If we fail to obtain adequate patent protection for our proprietary technology, our ability to be commercially competitive may be materially impaired.
Risks Related to Our Coal Logistics Business
The financial performance of our coal logistics business is substantially dependent upon a limited number of customers, and the loss of these customers, or any failure by them to perform under their contracts with us, could adversely affect the results of operations and cash flows of our coal logistics business.
The financial performance of our coal logistics business is substantially dependent upon a limited number of customers. The loss of any of these customers (or financial difficulties at any of these customers) could have a significant and adverse effect on our business, results of operations and financial condition, and/or our ability to make cash distributions at currently anticipated levels. For example, a significant portion of our revenues and cash flows from the Convent Marine Terminal is derived from long-term contracts with Foresight Energy LP and Murray American Coal. We expect these two customers to continue to account for a significant portion of the revenues of our coal logistics business for the foreseeable future. If either or both of these customers were to significantly reduce its purchases of coal terminalling, mixing or transportation services from us, or to default on their agreements with us, or fail to renew or terminate their agreements with us, or if we were unable to sell such coal logistics services to these customers on terms as favorable to us as the terms under our current agreements, the cash flows and results of our coal logistics operations could be materially and adversely affected. We also are exposed to the credit risk of these customers, and any significant unanticipated deterioration of their creditworthiness and resulting increase in nonpayment or nonperformance by them could have a material adverse effect on the cash flows and/or results of our coal logistics operations.
The growth and success of our coal logistics business depends upon our ability to find and contract for adequate throughput volumes, and an extended decline in demand for coal could affect the customers for our coal logistics business adversely. As a consequence, the operating results and cash flows of our coal logistics business could be materially and adversely affected.
The financial results of our Coal Logistics business segment are significantly affected by the demand for both thermal coal and metallurgical coal. An extended decline in our customers’ demand for either thermal or metallurgical coals could result in a reduced need for the coal mixing, terminalling and transloading services we offer, thus reducing throughput and utilization of our coal logistics assets. Demand for such coals may fluctuate due to factors beyond our control:
|
•
|
The demand for thermal coal can be impacted by changes in the energy consumption pattern of industrial consumers, electricity generators and residential users, as well as weather conditions and extreme temperatures. The amount of thermal coal consumed for electric power generation is affected primarily by the overall demand for electricity, the availability, quality and price of competing fuels for power generation, and governmental
|
23
regulation. For example, over the past few years, production of natural gas in the U.S. has increased dramatically, which has resulted in lower natural-gas prices. As a result of sustained low natural gas prices, coal-fuel generation plants have been displaced by natural-gas fueled generation plants. In addition, state and federal mandates for increased use of electricity from renewable energy sources, or the retrofitting of existing coal-fired generators with pollution control systems, also could adversely impact the demand for thermal coal. Finally, unusually warm winter weather may reduce the commercial and residential needs for heat and electricity which, in turn, may reduce the demand for thermal coal; and
|
•
|
The demand for metallurgical coal for use in the steel industry may be impacted adversely by economic downturns resulting in decreased demand for steel and an overall decline in steel production. A decline in blast furnace production of steel may reduce the demand for furnace coke, an intermediate product made from metallurgical coal. Decreased demand for metallurgical coal also may result from increased steel industry utilization of processes that do not use, or reduce the need for, furnace coke, such as electric arc furnaces, or blast furnace injection of pulverized coal or natural gas.
|
The Partnership's Convent Marine Terminal is impacted by seaborne export market dynamics. Fluctuations in the benchmark price for coal delivery into northwest Europe, as referenced in the API2 index price, influence our customers' decisions to place tons into the export market and thus impact transloading volumes through our terminal facility.
Additionally, fluctuations in the market price of coal can greatly affect production rates and investments by third-parties in the development of new and existing coal reserves. Mining activity may decrease as spot coal prices decrease. We have no control over the level of mining activity by coal producers, which may be affected by prevailing and projected coal prices, demand for hydrocarbons, the level of coal reserves, geological considerations, governmental regulation and the availability and cost of capital. A material decrease in coal mining production in the areas of operation for our coal logistics business, whether as a result of depressed commodity prices or otherwise, could result in a decline in the volume of coal processed through our coal logistics facilities, which would reduce our revenues and operating income.
Decreased demand for thermal or metallurgical coals, and extended or substantial price declines for coal could adversely affect our operating results for future periods and our ability to generate cash flows necessary to improve productivity and expand operations. The cash flows associated with our coal logistics business may decline unless we are able to secure new volumes of coal by attracting additional customers to these operations. Future growth and profitability of our coal logistics business segment will depend, in part, upon whether we can contract for additional coal volumes at a rate greater than that of any decline in volumes from existing customers. Accordingly, decreased demand for coal, or a decrease in the market price of coal, could have a material adverse effect on the results of operations or financial condition of our coal logistics business.
Our failure to obtain or renew surety bonds on acceptable terms could materially and adversely affect our ability to secure our reclamation obligations and, therefore, our ability to operate our coal logistics business.
Federal and state laws require us to obtain surety bonds to secure performance or payment of certain long-term obligations, such as reclamation costs, federal and state workers’ compensation costs and other obligations. Surety bond issuers and holders may not continue to renew the bonds or may demand higher fees, additional collateral, including letters of credit, or other terms less favorable to us upon renewals. We are also subject to increases in the amount of surety bonds required by Surface Mining Control and Reclamation Act and other federal and state laws as these laws, or interpretations of these laws, change. Because we are required by state and federal law to have these bonds in place before activities at our coal logistics operations can commence or continue, our failure to maintain (or inability to acquire) these bonds would have a material and adverse impact on us. That failure could result from a variety of factors, including: lack of availability, higher expense or unfavorable market terms of new bonds; restrictions on availability of collateral for current and future third-party surety bond issuers under the terms of future indebtedness; our inability to meet certain financial tests with respect to a portion of the reclamation bonds; and the exercise by third-party surety bond issuers of their right to refuse to renew, or to issue, new bonds.
Our coal logistics business is subject to operating risks, some of which are beyond our control, which could result in a material increase in our operating expenses.
Factors beyond our control could disrupt our coal logistics operations, adversely affect our ability to service the needs of our customers, and increase our operating costs, all of which could have a material adverse effect on our results of operations. Such factors could include:
|
•
|
geological, hydrologic, or other conditions that may cause damage to infrastructure or personnel;
|
|
•
|
a major incident that causes all or part of the coal logistics operations at a site to cease for a period of time;
|
|
•
|
processing and plant equipment failures and unexpected maintenance problems;
|
|
•
|
adverse weather and natural disasters, such as heavy rains or snow, flooding, extreme temperatures and other natural events affecting coal logistics operations, transportation, or customers;
|
24
|
•
|
possible legal challenges to the renewal of key permits, which may lead to their renewal on terms that restrict our terminalling operations, or impose additional costs on our operations.
|
If any of these conditions or events occur, our coal logistics operations may be disrupted, operating costs could increase significantly, and we could incur substantial losses in this business segment. Disruptions in our coal logistics operations could seriously and adversely affect our financial condition, or results of operations.
Deterioration in the global economic conditions in any of the industries in which our customers operate, or sustained uncertainty in financial markets, may have adverse impacts on our business and financial condition that we currently cannot predict.
Economic conditions in a number of industries in which our customers operate, such as electric power generation and steel making, have substantially deteriorated in recent years and reduced the demand for coal. Factors that could materially impact our business include:
|
•
|
demand for electricity in the U.S. is impacted by industrial production, which if weakened would negatively impact the revenues, margins and profitability of our coal logistics business;
|
|
•
|
demand for metallurgical coal depends on steel demand in the U.S. and globally, which if weakened would negatively impact the revenues, margins and profitability of our coal logistics business;
|
|
•
|
the tightening of credit or lack of credit availability to our customers could adversely affect our ability to collect our trade receivables; and
|
|
•
|
our ability to access the capital markets may be restricted at a time when we would like, or need, to raise capital for our business including for potential acquisitions, or other growth opportunities.
|
The acquisition of Convent Marine Terminal could expose the Partnership to potential significant liabilities. If the Partnership’s Convent Marine Terminal acquisition does not perform as expected, the Partnership’s future financial performance may be negatively impacted.
On August 12, 2015, the Partnership acquired all of the equity interests of Raven Energy LLC (“Raven”), the entity that currently owns the Convent Marine Terminal. Since the Partnership purchased the equity interests of Raven, rather than just its assets, the Partnership also acquired the liabilities of Raven, except for certain liabilities as outlined in the Purchase Agreement, including unknown and contingent liabilities. The Partnership performed due diligence in connection with the Convent Marine Terminal acquisition and attempted to verify the representations of the sellers and of management. However, there may be contemplated or contingent claims against Raven related to environmental, title, regulatory, litigation or other matters of which the Partnership is currently unaware. Although the former owners of Raven agreed to indemnify the Partnership on a limited basis against some of these liabilities, certain of these indemnification obligations will expire two years after the date the acquisition closed without any claims having been asserted by the Partnership. Accordingly, there is a risk that the Partnership ultimately could be liable for unknown obligations of Raven, which could materially adversely affect its operations and financial condition.
In addition, the Convent Marine Terminal is located in the Gulf Coast region, and its operations are subject to operational hazards and unforeseen interruptions, including interruptions from hurricanes or floods, which have historically impacted the region with some regularity. If any of these events were to occur, the Partnership could incur substantial losses because of personal injury or loss of life, severe damage to and destruction of property and equipment, and pollution or other environmental damage resulting in curtailment or suspension of our related operations. Additionally, Convent Marine Terminal operations may be affected by the impacts of additional regulation on the mining of all types of coal and use of thermal coal for fuel in export markets, which is limiting demand in some markets and may reduce the volumes of coal that our terminals manage.
Risks Related to Our Coal Mining Business
Coal prices are volatile, and a substantial or extended decline in prices could adversely affect our profitability and the value of our coal reserves.
Our profitability and the value of our coal reserves depend upon the prices we receive for the coal we sell, and such prices depend upon factors beyond our control, including:
|
•
|
the domestic and foreign demand and supply for metallurgical coal;
|
|
•
|
the quantity and quality of coal available from domestic and foreign competitors;
|
|
•
|
the demand for steel, which may lead to price fluctuations in the re-pricing of our metallurgical coal contracts;
|
|
•
|
competition within our industry;
|
25
|
•
|
adverse weather, extreme temperatures, climatic or other natural conditions, including natural disasters;
|
|
•
|
domestic and foreign economic conditions, including economic slowdowns;
|
|
•
|
legislative, regulatory and judicial developments, environmental regulatory changes or changes in energy policy and energy conservation measures that would adversely affect the coal industry, such as legislation limiting carbon emissions; and
|
|
•
|
the proximity, capacity and cost of transportation facilities.
|
A substantial or extended decline in the prices we receive for our future coal sales could adversely affect our profitability and the value of our coal reserves.
Extensive governmental regulations pertaining to employee health and safety and mandated benefits for retired coal miners impose significant costs on our mining operations, which could materially and adversely affect our results of operations.
The coal mining industry is subject to increasingly strict regulation by federal, state and local authorities with respect to matters such as employee health and safety and mandated benefits for retired coal miners. Compliance with these requirements imposes significant costs on us and can result in reduced productivity. Moreover, the possibility exists that new health and safety legislation and/or regulations and orders may be adopted that may materially and adversely affect our mining operations. We must compensate employees for work-related injuries. If we do not make adequate provisions for our workers’ compensation liabilities, it could harm our future operating results. In addition, the erosion through tort liability of the protections we are currently provided by workers’ compensation laws could increase our liability for work-related injuries and materially and adversely affect our operating results.
Under federal law, each coal mine operator must secure payment of federal black lung benefits to claimants who are current and former employees and contribute to a trust fund for the payment of benefits and medical expenses to claimants who last worked in the coal industry before January 1, 1970. The trust fund is funded by an excise tax on coal production. If this tax increases, or if we could no longer pass it on to the purchasers of our coal under our coal sales agreements, our operating costs could be increased and our results could be materially and adversely harmed. At December 31, 2015, our liabilities for coal workers’ black lung benefits totaled
$49.9 million
, which included the estimated impact of PPACA. If new laws or regulations increase the number and award size of claims, it could materially and adversely harm our business. See “Item 1. Business-Legal and Regulatory Requirements-Other Regulatory Requirements.”
Federal or state regulatory agencies have the authority to order our mines to be temporarily or permanently closed under certain circumstances, which could materially and adversely affect our ability to meet our customers’ demands.
Federal or state regulatory agencies have the authority under certain circumstances following significant health and safety incidents, such as fatalities, to order a mine to be temporarily or permanently closed. If this occurred, we may be required to incur capital expenditures to re-open the mine and may incur fines. In the event that these agencies order the closing of our mines, our coal sales contracts generally permit us to issue
force majeure
notices which suspend our obligations to deliver coal under these contracts. However, our customers may challenge our issuances of
force majeure
notices. If these challenges are successful, we may have to purchase coal from third-party sources, if it is available, to fulfill these obligations, incur capital expenditures to re-open the mines and/or negotiate settlements with the customers, which may include price reductions, the reduction of commitments or the extension of time for delivery or termination of customers’ contracts. Our coal operations also provide substantially all of the coal used at our Jewell cokemaking facility. The inability to deliver the required coal to this facility could significantly impact operations at the facility. Any of these actions could have a material adverse effect on our business and results of operations.
Extensive environmental regulations impose significant costs on our mining operations, and future regulations could materially increase those costs, impose new or increased liabilities, limit our ability to produce and sell coal, or require us to change our operations significantly, any one or more of which could materially and adversely affect our financial position and/or results of operations.
Our coal mining operations are subject to increasingly strict regulation by federal, state and local authorities with respect to environmental matters such as:
|
•
|
limitations on land use;
|
|
•
|
mine permitting and licensing requirements;
|
|
•
|
reclamation and restoration of mining properties after mining is completed;
|
|
•
|
management of materials generated by mining operations;
|
|
•
|
the storage, treatment and disposal of wastes;
|
26
|
•
|
remediation of contaminated soil and groundwater, including with respect to past or legacy mining operations;
|
|
•
|
air quality standards;
|
|
•
|
water pollution;
|
|
•
|
protection of human health, plant-life and wildlife, including endangered or threatened species;
|
|
•
|
protection of wetlands;
|
|
•
|
the discharge of materials into the environment;
|
|
•
|
the effects of mining on surface water and groundwater quality and availability; and
|
|
•
|
the management of electrical equipment containing polychlorinated biphenyls.
|
The costs, liabilities and requirements associated with the laws and regulations related to these and other environmental matters can be costly and time-consuming, and could delay commencement or continuation of expansion or production operations. We may not have been, or may not be, at all times in compliance with the applicable laws and regulations. Failure to comply with these laws and regulations may result in the assessment of administrative, civil and criminal penalties, the imposition of cleanup and site restoration costs and liens, the issuance of injunctions to limit or cease operations, the suspension or revocation of permits and other enforcement measures that could have the effect of limiting production from our operations. We may incur material costs and liabilities resulting from claims for damages to property or injury to persons arising from our operations. If we are pursued for sanctions, costs and liabilities in respect of these matters, our mining operations and, as a result, our profitability could be materially and adversely affected.
New legislation or administrative regulations or new judicial interpretations or administrative enforcement of existing laws and regulations, including proposals related to the protection of the environment that would further regulate and tax the coal industry, also may require us to change operations significantly, or incur increased costs. Such changes could have a material adverse effect on our financial condition and results of operations. See “Item 1. Business-Legal and Regulatory Requirements” for further information about the various governmental regulations affecting us.
Our coal mining operations are subject to operating risks, some of which are beyond our control, that could result in a material increase in our operating expenses and a decrease in our production levels.
Factors beyond our control could disrupt our coal mining operations, adversely affect production and shipments and increase our operating costs, all of which could have a material adverse effect on our results of operations. Such factors could include:
|
•
|
poor mining conditions resulting from geological, hydrologic or other conditions that may cause damage to nearby infrastructure or mine personnel;
|
|
•
|
variations in the thickness and quality of coal seams, and variations in the amounts of rock and other natural materials overlying the coal being mined;
|
|
•
|
a major incident at a mine site that causes all or part of the operations of the mine to cease for some period of time;
|
|
•
|
mining, processing and plant equipment failures and unexpected maintenance problems;
|
|
•
|
adverse weather, extreme temperatures, and natural disasters, such as heavy rains or snow, flooding and other natural events affecting operations, transportation or customers;
|
|
•
|
unexpected or accidental surface subsidence from underground mining;
|
|
•
|
accidental mine water discharges, fires, explosions or similar mining accidents; and
|
|
•
|
competition and/or conflicts with other natural resource extraction activities and production within our operating areas, such as coalbed methane extraction.
|
If any of these conditions or events occur, our coal mining operations may be disrupted, we could experience a delay or halt of production or shipments, operating costs could increase significantly, and we could incur substantial losses. In particular, our Jewell cokemaking facility currently obtains essentially all of its metallurgical coal requirements from our existing coal mining operations. Disruptions in our coal mining operations, resulting in decreased production of metallurgical coal, could seriously and adversely affect production at our Jewell cokemaking facility.
If transportation for our coal becomes unavailable or uneconomical for our customers, it may impair our ability to sell coal, and our results of operations may be adversely affected.
27
Transportation costs represent a significant portion of the total cost of coal and the cost of transportation is a critical factor in a customer’s purchasing decision. Increases in transportation costs and the lack of sufficient rail and port capacity could lead to reduced coal sales. For example, all of our coal mining operations are substantially dependent on, and only have access to, a single rail provider. A substantial amount of the metallurgical coal produced from our coal mining operations is used in our adjacent Jewell cokemaking facility. However, future disruption of transportation services (due to weather-related problems, infrastructure damage, strikes, lock-outs, lack of fuel or maintenance items, underperformance of port and rail infrastructure, congestion and balancing systems used to manage vessel queuing and demurrage, transportation delays or other reasons) may temporarily impair our ability to supply coal to other customers and adversely affect our results of operations.
We face numerous uncertainties in estimating economically recoverable coal reserves, and inaccuracies in estimates may result in lower than expected revenues, higher than expected costs and decreased profitability.
Our future performance depends on, among other things, the accuracy of our estimates of our proven and probable coal reserves. There are numerous uncertainties inherent in estimating quantities and values of economically recoverable coal reserves, including many factors beyond our control. As a result, estimates of economically recoverable coal reserves are by their nature uncertain. We base our estimates of reserves on engineering, economic and geological data assembled, analyzed and reviewed by internal and third-party engineers and consultants. We update our estimates of the quantity and quality of proven and probable coal reserves as needed to reflect production of coal from the reserves, updated geological models and mining recovery data, tonnage contained in newly acquired lease areas and estimated costs of production and sales prices.
There are numerous factors and assumptions that affect economically recoverable reserve estimates, including:
|
•
|
quality of the coal;
|
|
•
|
historical production from the area compared with production from other producing areas;
|
|
•
|
geological and mining conditions, which may not be fully identified by available exploration data and/or may differ from our experiences in areas where we currently mine;
|
|
•
|
the percentage of coal ultimately recoverable;
|
|
•
|
the assumed effects of regulation, including the issuance of required permits, taxes, including severance and excise taxes and royalties, and other payments to governmental agencies;
|
|
•
|
assumptions concerning the timing for the development of the reserves; and
|
|
•
|
assumptions concerning equipment and productivity, future coal prices, operating costs, including costs for critical supplies such as fuel and tires, capital expenditures and development and reclamation costs.
|
Each of these factors may vary considerably. As a result, estimates of the quantities and qualities of economically recoverable coal attributable to any particular group of properties, classifications of reserves based on risk of recovery, estimated cost of production, and estimates of future net cash flows expected from these properties as prepared by different engineers, or by the same engineers at different times, may vary materially due to changes in the foregoing factors and assumptions. Therefore, our estimates may not accurately reflect our actual reserves. Actual production, revenues and expenditures with respect to reserves will likely vary from estimates, and these variances may be material. Any inaccuracy in our estimates related to our reserves could result in decreased profitability from lower than expected revenues and/or higher than expected costs.
Our inability to develop coal reserves in an economically feasible manner could materially and adversely affect our business.
Our future success depends upon our ability to continue developing economically recoverable coal reserves. If we fail to develop additional coal reserves, our existing reserves eventually will be depleted. We may not be able to obtain replacement reserves when we require them. Replacement reserves may not be available or, if available, may not be capable of being mined at costs comparable to those characteristic of the depleting mines. Our ability to develop coal reserves in the future also may be limited by the availability of cash we generate from our operations or available financing, restrictions under our existing or future financing arrangements, the lack of suitable opportunities or the inability to acquire coal properties or leases on commercially reasonable terms. If we are unable to develop replacement reserves, our future production may decrease significantly and this may have a material and adverse impact on our cash flows, financial position and results of operations.
Mining in Central Appalachia is more complex and involves more regulatory constraints than mining in other areas of the U.S., which could affect our mining operations and cost structures in these areas.
Our coal mines are located in Virginia and West Virginia, in what is known as the Central Appalachian region. The geological characteristics of Central Appalachian coal reserves, such as coal seam thickness, make them complex and costly to mine. As compared to mines in other regions, permitting, licensing and other environmental and regulatory requirements are
28
more costly and time consuming to satisfy. These factors could materially adversely affect the mining operations and cost structures of coal produced at our mines in Central Appalachia.
A defect in title or the loss of a leasehold interest in certain property could limit our ability to mine our coal reserves or result in significant unanticipated costs.
We conduct a significant part of our coal mining operations on properties that we lease. A title defect or the loss of a lease could adversely affect our ability to mine the associated coal reserves. We may not verify title to our leased properties or associated coal reserves until we have committed to developing those properties or coal reserves. In some cases, the seller or lessor warrants property title. In other cases, separate title confirmation may not be required for leasing reserves where mining has occurred previously. Our right to mine some of our reserves may be adversely affected if defects in title or boundaries exist, or if our leasehold interests are subject to superior property rights of third-parties. In order to conduct our mining operations on properties where such defects exist, we may incur unanticipated costs. In addition, some leases require us to produce a minimum quantity of coal and require us to pay minimum production royalties. Our inability to satisfy those requirements may cause the leasehold interest to terminate. In addition, we may not be able to successfully negotiate new leases for properties containing additional reserves, or maintain our leasehold interests in properties where we have not commenced mining operations during the term of the lease.
Disruptions in the quantities of coal produced by our contract mine operators could impair our ability to fill customer orders or increase our operating costs.
We use independent contractors to mine coal at certain of our mining operations. Some of our contract miners may experience adverse geologic mining conditions, operational difficulties, escalated costs, financial difficulties or other factors beyond our control that could affect the availability, pricing and quality of coal produced for us. In addition, market volatility and price increases for coal or freight could result in non-performance by third-party suppliers under existing contracts with us, in order to take advantage of the higher prices in the current market. Disruptions in the quantities of coal produced by independent contractors for us could impair our ability to supply our cokemaking facilities and to fill our customer orders. Our profitability or exposure to loss on transactions or relationships such as these depends upon the reliability of the supply or the ability to substitute, when economical, third-party coal sources, with internal production or coal purchased in the market and other factors. Non-performance by contract miners may adversely affect our ability to fulfill deliveries under our coal supply agreements. If we are unable to fill a customer order, or if we are required to purchase coal from other sources in order to satisfy a customer order, we could lose existing customers and our operating costs could increase.
We have reclamation and mine closure obligations. If the assumptions underlying our accruals are inaccurate, we may be required to expend significantly greater amounts than anticipated.
The Surface Mining Control and Reclamation Act established operational, reclamation and closure standards for all aspects of surface mining as well as most aspects of deep mining. We accrue for the costs of current mine disturbance and of final mine closure, including the cost of treating mine water discharge where necessary. The amounts recorded are dependent upon a number of variables, including the estimated future retirement costs, estimated proven reserves, assumptions involving profit margins, inflation rates, and the assumed credit-adjusted risk-free interest rates. Furthermore, our reclamation and mine-closing liabilities are unfunded. If these accruals are insufficient, or our cash requirements in a particular year are greater than currently anticipated, our future operating results and cash flows could be adversely affected.
Our failure to obtain or renew surety bonds on acceptable terms could materially and adversely affect our ability to secure reclamation and coal lease obligations and, therefore, our ability to mine or lease coal.
Our reclamation and mine-closing liabilities are unfunded. Federal and state laws require us to obtain surety bonds to secure performance or payment of certain long-term obligations, such as mine closure or reclamation costs, federal and state workers’ compensation costs, coal leases and other obligations. Declarations of bankruptcy by various coal companies may lead to changes in the types and amounts of surety bonds that are required. These bonds are typically renewable annually. Surety bond issuers and holders may not continue to renew the bonds or may demand higher fees, additional collateral, including letters of credit or other terms less favorable to us upon those renewals. We are also subject to increases in the amount of surety bonds required by federal and state laws as these laws, or interpretations of these laws, change. Because we are required by state and federal law to have these bonds in place before mining can commence or continue, our failure to maintain (or inability to acquire) these bonds would have a material and adverse impact on us. That failure could result from a variety of factors, including the following: lack of availability, higher expense or unfavorable market terms of new bonds; restrictions on availability of collateral for current and future third-party surety bond issuers under the terms of future indebtedness; our inability to meet certain financial tests with respect to a portion of the post-mining reclamation bonds; and the exercise by third-party surety bond issuers of their right to refuse to renew or issue new bonds.
Risks Related to Ownership of Our Common Stock
29
Your percentage ownership in us may be diluted by future issuances of capital stock or securities or instruments that are convertible into our capital stock, which could reduce your influence over matters on which stockholders vote.
Our Board of Directors has the authority, without action or vote of our stockholders, to issue all or any part of our authorized but unissued shares of common stock, including shares issuable upon the exercise of options, shares that may be issued to satisfy our obligations under our incentive plans, shares of our authorized but unissued preferred stock and securities and instruments that are convertible into our common stock. Issuances of common stock or voting preferred stock would reduce your influence over matters on which our stockholders vote and, in the case of issuances of preferred stock, likely would result in your interest in us being subject to the prior rights of holders of that preferred stock.
Our ability to pay dividends on our common stock may be limited by restrictive covenants in our debt agreements and by other factors.
Our Board of Directors has suspended the Company's dividend. Any declaration and payment of future dividends to holders of our common stock will be limited by restrictive covenants contained in our debt agreements, and will be at the sole discretion of our Board of Directors and will depend on many factors, including our financial condition, earnings, capital requirements, level of indebtedness, statutory and contractual restrictions applying to the payment of dividends and other considerations that our Board of Directors deems relevant.
Further, we may not have sufficient surplus under Delaware law to be able to pay any dividends in the future. The absence of sufficient surplus may result from extraordinary cash expenses, actual expenses exceeding contemplated costs, funding of capital expenditures or increases in reserves.
Provisions of our amended and restated articles of incorporation, our amended and restated by-laws and the Delaware General Corporation Law (the “DGCL”) could discourage potential acquisition proposals and could deter or prevent a change in control.
Our amended and restated articles of incorporation and amended and restated by-laws contain provisions that are intended to deter coercive takeover practices and inadequate takeover bids and to encourage prospective acquirers to negotiate with our Board of Directors rather than to attempt a hostile takeover. These provisions include:
|
•
|
a Board of Directors that is divided into three classes with staggered terms;
|
|
•
|
action by written consent of stockholders may only be taken unanimously by holders of all our shares of common stock;
|
|
•
|
rules regarding how our stockholders may present proposals or nominate directors for election at stockholder meetings;
|
|
•
|
the right of our Board of Directors to issue preferred stock without stockholder approval;
|
|
•
|
limitations on the right of stockholders to remove directors; and
|
|
•
|
limitations on our ability to be acquired.
|
The DGCL also imposes some restrictions on mergers and other business combinations between us and any holder of 15 percent or more of our outstanding common stock.
We believe that these provisions protect our stockholders from coercive or otherwise unfair takeover tactics by requiring potential acquirers to negotiate with our Board of Directors and by providing our Board of Directors with more time to assess any acquisition proposal. These provisions are not intended to make us immune from takeovers. However, these provisions apply even if the offer may be considered beneficial by some stockholders and could delay or prevent an acquisition that our Board of Directors determines is in our best interests and that of our stockholders.
Any or all of the foregoing provisions could limit the price that some investors might be willing to pay in the future for shares of our common stock.
A person or group could establish a substantial position in SunCoke Energy, Inc. stock.
We do not have a shareholder rights plan which may make it easier for a person or group to acquire a substantial position in SunCoke Energy, Inc. stock. Such person or group may have interests adverse to the interests of our other stockholders.
We have a limited operating history as a separate public company, and our historical financial information is not necessarily representative of the results that we would have achieved as a separate, publicly-traded company and may not be a reliable indicator of our future results.
30
Our historical financial information for the periods ended prior to the Separation included in this Annual Report on Form 10-K is derived from the consolidated financial statements and accounting records of Sunoco. Accordingly, the historical financial information included here does not necessarily reflect the results of operations, financial position and cash flows that we would have achieved as a separate, publicly-traded company during the periods presented or those that we will achieve in the future primarily as a result of the following factors:
|
•
|
Prior to the Separation, our business was operated by Sunoco as part of its broader corporate organization, rather than as an independent company. Sunoco or one of its affiliates performed various corporate functions for us, including, but not limited to, legal services, treasury, accounting, auditing, risk management, information technology, human resources, corporate affairs, tax administration, certain governance functions (including internal audit and compliance with the Sarbanes-Oxley Act of 2002) and external reporting. Our historical financial results reflect allocations of corporate expenses from Sunoco for these and similar functions. These allocations are likely less than the comparable expenses we believe we would have incurred had we operated as a separate public company.
|
|
•
|
Previously, our business was integrated with the other businesses of Sunoco. Historically, we have shared economies of scale in costs, employees, vendor relationships and customer relationships. While we entered into transition agreements with Sunoco in connection with the Separation that govern certain commercial and other relationships between us, those transitional arrangements may not fully capture the benefits our businesses have enjoyed as a result of being integrated with the other businesses of Sunoco. The loss of these benefits could have an adverse effect on our cash flows, financial position and results of operations.
|
|
•
|
Generally, prior to the Separation, our working capital requirements and capital for our general corporate purposes, including acquisitions, research and development and capital expenditures, were satisfied as part of the enterprise-wide cash management policies of Sunoco. In connection with the Separation and the IPO, we obtained financing in the form of our credit facilities and notes. In the future, we may need to obtain additional financing from banks, through public offerings or private placements of debt or equity securities, strategic relationships or other arrangements.
|
|
•
|
The cost of capital for our business may be higher than Sunoco’s cost of capital prior to the Separation. Other significant changes may occur in our cost structure, management, financing and business operations as a result of operating as a public company separate from Sunoco. The adjustments and allocations we have made in preparing our historical consolidated financial statements may not appropriately reflect our operations during those periods as if we had in fact operated as a stand-alone entity, or what the actual effect of our Separation from Sunoco will be.
|
Risks Related to Our Master Limited Partnership
We own a significant equity interest in the Partnership.
We own the general partner of the Partnership, which holds a 2 percent ownership interest and incentive distribution rights, and we currently own a
53.9 percent
interest, in the Partnership. The Partnership holds a 98 percent interest in each of three entities that own our Haverhill, Ohio, Middletown, Ohio, and Granite City, Illinois cokemaking facilities and related assets. The Partnership also owns coal terminals and related assets that provide coal handling and mixing services in Louisiana, West Virginia and Kentucky. All of the Partnership’s coke sales, and certain of its coal logistics services, are made pursuant to long-term, take-or-pay agreements, and our financial statements include the consolidated results of the Partnership. The Partnership is subject to operating and regulatory risks which are substantially similar to our own. The occurrence of any of these risks could directly or indirectly affect the Partnership’s, as well as our, financial condition, results of operations and cash flows as the Partnership is a consolidated subsidiary. For additional information about the Partnership, see “Cokemaking Operations” and “Formation of a Master Limited Partnership” in Business and Management’s Discussion and Analysis of Financial Condition and Operating Results (Items 1 and 7), respectively.
We derive a portion of our cash flows from the quarterly cash distributions we receive due to our equity ownership interest in the Partnership. If the Partnership is unable to generate sufficient cash flow, its ability to pay quarterly distributions to unitholders (including us) at current levels, or to increase its quarterly distributions in the future, could adversely impact our cash position.
The Partnership’s ability to pay quarterly distributions depends primarily on cash flow. The Partnership’s ability to generate sufficient cash from operations is largely dependent upon its ability to successfully manage its business which may be affected by economic, financial, competitive, and regulatory factors beyond the Partnership’s control. To the extent the Partnership does not have adequate cash reserves, its ability to pay quarterly distributions to its common unitholders (including us) at current levels, or to increase its quarterly distributions in the future, could be adversely affected. Due to our equity ownership interest in the Partnership, we derive a portion of our cash flows from the quarterly cash distributions we receive. If
31
we are unable to obtain sufficient funds from the Partnership at current or increased levels, our cash position could be adversely affected.
We are party to an omnibus agreement with the Partnership that exposes us to various risks and uncertainties.
In connection with the initial public offering of the Partnership and the related contribution to the Partnership of an interest in each of our Haverhill, Ohio and Middletown, Ohio cokemaking facilities, we entered into an omnibus agreement with the Partnership. This omnibus agreement was later amended in connection with the contribution to the Partnership of an interest in our Granite City, Illinois cokemaking assets. Pursuant to this omnibus agreement, we have agreed to grant the Partnership preferential rights to pursue certain growth opportunities we identify in the U.S. and Canada and a right of first offer to acquire certain of our cokemaking assets located in the U.S. and Canada for so long as we control the Partnership’s general partner. In addition, pursuant to this agreement, we have agreed, for a period of five years from the closing of the initial public offering, to make the Partnership whole, in certain circumstances, to the extent of a customer’s failure to satisfy its obligations or to the extent a customer’s obligations are reduced. Additionally, pursuant to this agreement, we have agreed to indemnify the Partnership for certain environmental remediation projects costs arising prior to the contribution of the interests in the Haverhill, Ohio, Middletown, Ohio and Granite City, Illinois cokemaking facilities. The omnibus agreement further provides that we will fully indemnify the Partnership with respect to certain tax liabilities arising prior to, or in connection with, the contribution of the interests in the Haverhill, Ohio, Middletown, Ohio and Granite City, Illinois cokemaking facilities, and that we will cure or fully indemnify the Partnership for losses resulting from certain title defects at the properties owned by the Partnership or its subsidiaries. Our obligations and the extent of our exposures that may arise under the omnibus agreement are subject to various contingencies and cannot be estimated with certainty at this time.
The value of our investment in the Partnership depends on the Partnership's status as a partnership for federal income tax purposes, as well as the Partnership not being subject to a material amount of entity-level taxation by individual states. If the IRS were to treat the Partnership as a corporation for federal income tax purposes or the Partnership were to become subject to material additional amounts of entity-level taxation for state tax purposes, then the value of our investment in the Partnership could be substantially reduced.
The anticipated after-tax economic benefit of our investment in the Partnership depends largely on the Partnership being treated as a partnership for federal income tax purposes. Despite the fact that the Partnership is organized as a limited partnership under Delaware law, the Partnership would be treated as a corporation for federal income tax purposes unless more than 90 percent of its income is from certain specified sources (the “Qualifying Income Exception”).
On May 5, 2015, the U.S. Treasury Department (the “Treasury Department”) and the Internal Revenue Service (the “IRS”) issued proposed regulations (the “Proposed Regulations”) regarding the application of the Qualifying Income Exception to minerals and natural resources. On June 16, 2015, the Partnership submitted a comment letter requesting the IRS change the manner in which the Proposed Regulations define processing ores and minerals, and on October 27, 2015, we provided testimony at a public hearing related to the proposed regulations on qualifying income. While the Partnership believes that its cokemaking activities are largely consistent with the Proposed Regulations, the Partnership believes that the regulations should be clarified in order to eliminate any uncertainty with respect to its status as a partnership for U.S. federal income tax purposes.
Although the Partnership does not believe, based upon its current operations and language of the Proposed Regulations, that it will be treated as a corporation for U.S. federal income tax purposes, the IRS could disagree with its analysis and therefore cause it to be treated as a corporation for federal income tax purposes or otherwise subject the Partnership to taxation as an entity. In addition, a change in the Partnership’s business could also subject it to taxation as an entity. Because the income earned by the Partnership’s process steam and power generation subsidiaries may not satisfy the Qualifying Income Exception, if the income generated by these subsidiaries increases as a percentage of the Partnership’s total gross income, such that it is at risk of exceeding the amount of non-qualifying income it can earn and still be classified as a partnership for federal tax purposes (10 percent of the Partnership’s gross income each year), the Partnership may file an election to have one or both of these subsidiaries treated as a corporation for U.S. federal income tax purposes which would result in the subsidiaries becoming taxable entities.
The IRS may adopt positions that differ from the ones the Partnership has taken. A successful IRS contest of the federal income tax positions the Partnership takes may impact adversely the market for its common units, and the costs of any IRS contest could reduce the Partnership’s cash available for distribution to unitholders, including us. If the Partnership were treated as a corporation for federal income tax purposes, it would pay federal income tax on our taxable income at the corporate tax rate, which is currently a maximum of 35 percent, and would likely pay state income tax at varying rates. Because tax would be imposed upon the Partnership as a corporation, its after tax earnings and therefore its ability to distribute cash to us would be substantially reduced. Therefore, treatment of the Partnership as a corporation would result in a material reduction in the Partnership’s anticipated cash flow and after-tax return to the unitholders, likely causing a substantial reduction in the value of our investment in the Partnership.
32
The tax treatment of publicly traded partnerships or an investment in the Partnership’s common units could be subject to potential legislative, judicial or administrative changes and differing interpretations, possibly on a retroactive basis.
The present federal income tax treatment of publicly traded partnerships, including the Partnership, or an investment in its common units, may be modified by administrative, legislative or judicial interpretation at any time. Any modification to the federal income tax laws and interpretations thereof may or may not be applied retroactively. Moreover, any such modification could make it more difficult or impossible for the Partnership to meet the exception which allows publicly traded partnerships that generate qualifying income to be treated as partnerships (rather than corporations) for U.S. federal income tax purposes, affect or cause us to change our business activities, or affect the tax consequences of an investment in its common units. For example, members of Congress have been considering substantive changes to the definition of qualifying income and the treatment of certain types of income earned from partnerships. While these specific proposals would not appear to affect the treatment of the Partnership as a partnership, we are unable to predict whether any of these changes, or other proposals, will ultimately be enacted. Any such changes could negatively impact the value of SunCoke Energy’s investment in the Partnership’s common units.
33
|
Item 1B.
|
Unresolved Staff Comments
|
None.
|
Item 2.
|
Properties
|
We own the following real property:
|
•
|
Approximately 66 acres in Vansant (Buchanan County), Virginia, on which the Jewell cokemaking facility is located, along with an additional approximately 2,550 acres including the offices, warehouse and support buildings for our Jewell coal and coke affiliates located in Buchanan County, Virginia, as well as other general property holdings and unoccupied land in Buchanan County, Virginia and McDowell County, West Virginia. In addition, we own certain mineral rights on approximately 1,650 acres of property in Buchanan, Dickenson and Wise Counties, Virginia.
|
|
•
|
Approximately 250 acres in Russell County, Virginia owned by the HKCC Companies, which include a warehousing facility, two coal preparation plants and certain coal loadout facilities as well as unoccupied land.
|
|
•
|
Approximately 400 acres in Franklin Furnace (Scioto County), Ohio, on which the Haverhill cokemaking facility (both the first and second phases) is located.
|
|
•
|
Approximately 41 acres in Granite City (Madison County), Illinois, adjacent to the U.S. Steel Granite City Works facility, on which the Granite City cokemaking facility is located. Upon the earlier of ceasing production at the facility or the end of 2044, U.S. Steel has the right to repurchase the property, including the facility, at the fair market value of the land. Alternatively, U.S. Steel may require us to demolish and remove the facility and remediate the site to original condition upon exercise of its option to repurchase the land.
|
|
•
|
Approximately 250 acres in Middletown (Butler County), Ohio near AK Steel’s Middletown Works facility, on which the Middletown cokemaking facility is located.
|
|
•
|
Approximately 180 acres in Ceredo (Wayne County), West Virginia and approximately 36 acres in White Creek (Boyd County), Kentucky on which KRT has two coal terminals and one liquids terminal for its coal mixing and/or handling services along the Ohio and Big Sandy Rivers.
|
|
•
|
Approximately 174 acres in Convent (St. James Parish), Louisiana, on which Convent Marine Terminal is located.
|
We lease the following real property:
|
•
|
Approximately 88 acres of land located in East Chicago (Lake County), Indiana, on which the Indiana Harbor cokemaking facility is located and the coal handling and/or mixing facilities that service the Indiana Harbor cokemaking facility. The leased property is inside ArcelorMittal’s Indiana Harbor Works facility and is part of an enterprise zone.
|
|
•
|
Approximately 22 acres of land located in Buchanan County, Virginia, on which one of our coal preparation plants is located.
|
|
•
|
Approximately 25 acres in Belle (Kanawha County), West Virginia, on which KRT has a coal terminal for its coal mixing and/or handling services along the Kanawha River.
|
|
•
|
Our corporate headquarters is located in leased office space in Lisle, Illinois under an 11-year lease that commenced in 2011.
|
In addition, we lease small parcels of land, mineral rights and coal mining rights for approximately 127 thousand acres of land in Buchanan and Russell Counties, Virginia and McDowell County, West Virginia. Substantially all of the leases are “life of mine” agreements that extend our mining rights until all reserves have been recovered. These leases convey mining rights to us in exchange for payment of certain royalties and/or fixed fees. We use internal land managers and attorneys to perform title reviews on properties prior to obtaining coal leases.
34
Set forth below is a map depicting the properties and facilities of our coal mining operations.
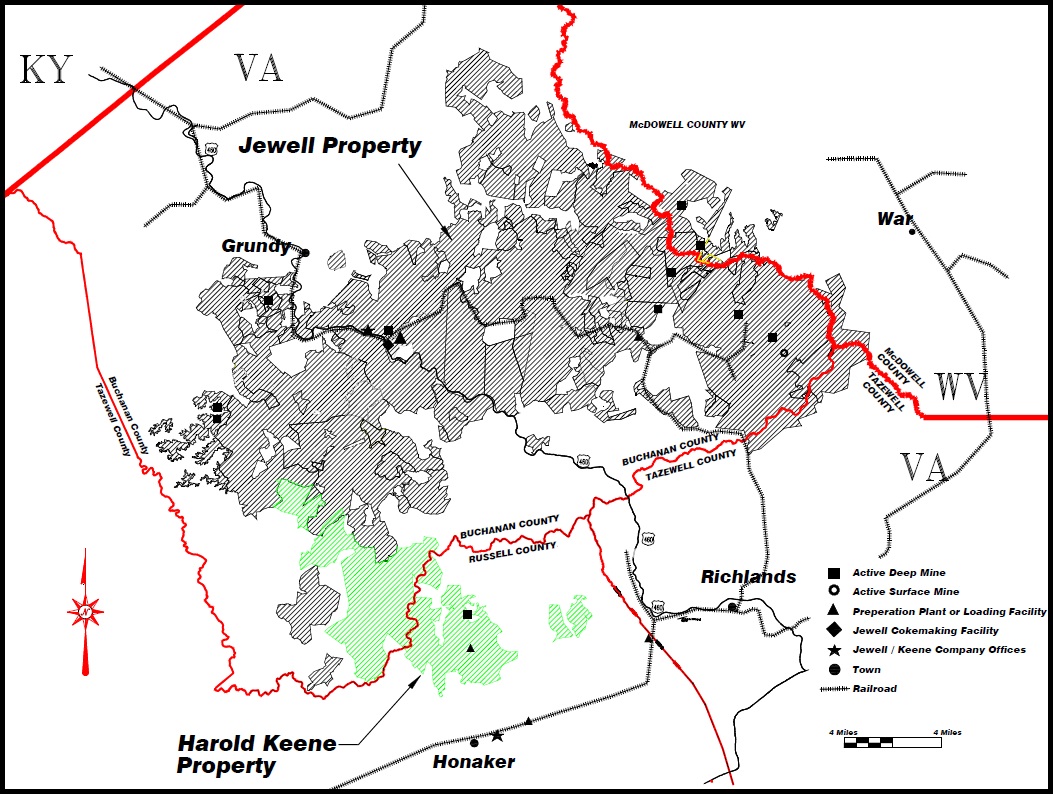
In 2011, we engaged Marshall Miller & Associates, Inc., a leading mining engineering firm, to conduct a comprehensive study to determine our proven and probable reserves for our coal mines. This study determined that we controlled proven and probable coal reserves of approximately 114 million tons as of December 31, 2011. Since 2011, we estimate that we have mined approximately 4.6 million tons of coal from these proven and probable reserves. At December 31, 2015, we control proven and probable coal reserves of approximately
109 million
tons, including approximately
19 million
tons of proven and probable coal reserves at our Harold Keene Coal Companies ("HKCC") located in Russell and Buchanan Counties in Virginia, contiguous to our existing metallurgical coal mining operations. We control a significant portion of our coal reserves through private leases. Substantially all of the leases are “life of mine” agreements that extend our mining rights until all reserves have been recovered. These leases convey mining rights to us in exchange for royalties and/or fixed fee payments.
35
The table below sets forth the proven and probable metallurgical coal reserves at our Jewell coal mining operations as of
December 31, 2015
:
|
|
Total Demonstrated Reserves (millions of tons)
(1)(2)
|
|||||||||||||||||||||||||||||||
|
|
Reserves
|
Tons by
Assignment
|
Tons by
Mining Type
|
Tons by
Permit Status
|
Tons by
Property Control
|
|||||||||||||||||||||||||||
|
Seam
|
Total
|
Proven
|
Probable
|
Assigned
|
Unassigned
|
Surface
|
Deep
|
Permitted
|
Not
Permitted
|
Owned
|
Leased
|
|||||||||||||||||||||
|
Hagy
|
0.18
|
|
0.02
|
|
0.16
|
|
0.18
|
|
—
|
|
—
|
|
0.18
|
|
—
|
|
0.18
|
|
—
|
|
0.18
|
|
||||||||||
|
Middle Splashdam
|
1.58
|
|
1.42
|
|
0.16
|
|
0.27
|
|
1.31
|
|
—
|
|
1.58
|
|
0.27
|
|
1.31
|
|
—
|
|
1.58
|
|
||||||||||
|
Upper Banner
|
0.52
|
|
0.41
|
|
0.11
|
|
—
|
|
0.52
|
|
—
|
|
0.52
|
|
—
|
|
0.52
|
|
—
|
|
0.52
|
|
||||||||||
|
Kennedy
|
2.70
|
|
2.22
|
|
0.48
|
|
0.06
|
|
2.64
|
|
—
|
|
2.70
|
|
0.06
|
|
2.64
|
|
—
|
|
2.70
|
|
||||||||||
|
Red Ash
|
26.43
|
|
16.29
|
|
10.14
|
|
2.75
|
|
23.68
|
|
—
|
|
26.43
|
|
2.75
|
|
23.68
|
|
—
|
|
26.43
|
|
||||||||||
|
Jawbone Rider
|
7.28
|
|
4.27
|
|
3.01
|
|
0.01
|
|
7.27
|
|
—
|
|
7.28
|
|
0.01
|
|
7.27
|
|
—
|
|
7.28
|
|
||||||||||
|
Jawbone (JB30)
|
40.39
|
|
23.78
|
|
16.61
|
|
7.98
|
|
32.41
|
|
0.30
|
|
40.09
|
|
7.98
|
|
32.41
|
|
—
|
|
40.39
|
|
||||||||||
|
Tiller
|
11.05
|
|
7.84
|
|
3.21
|
|
8.00
|
|
3.05
|
|
0.03
|
|
11.02
|
|
8.00
|
|
3.05
|
|
—
|
|
11.05
|
|
||||||||||
|
Grand Total
|
90.13
|
|
56.25
|
|
33.88
|
|
19.25
|
|
70.88
|
|
0.33
|
|
89.80
|
|
19.07
|
|
71.06
|
|
—
|
|
90.13
|
|
||||||||||
|
(1)
|
All tons are recoverable, reserve tons utilizing appropriate mine recovery, wash recovery at 1.50 float, preparation plant efficiency, and moisture factors.
|
|
(2)
|
Amounts may not add to totals due to rounding.
|
The table below sets forth a summary of the proven and probable metallurgical coal reserves of the HKCC Companies as of
December 31, 2015
:
|
|
Total Demonstrated Reserves (millions of tons)
(1)(2)
|
|||||||||||||||||||||||||||||
|
|
Reserves
|
Tons by
Assignment
|
Tons by
Mining Type
|
Tons by
Permit Status
|
Tons by
Property Control
|
|||||||||||||||||||||||||
|
Seam
|
Total
|
Proven
|
Probable
|
Assigned
|
Unassigned
|
Surface
|
Deep
|
Permitted
|
Not
Permitted
|
Owned
|
Leased
|
|||||||||||||||||||
|
Lower Banner
|
1.81
|
|
0.92
|
|
0.89
|
|
1.81
|
|
—
|
|
0.48
|
|
1.33
|
0.23
|
|
1.52
|
0.03
|
|
1.72
|
|
||||||||||
|
Kennedy
|
3.25
|
|
2.82
|
|
0.43
|
|
3.25
|
|
—
|
|
0.19
|
|
3.06
|
0.55
|
|
2.70
|
0.04
|
|
3.21
|
|
||||||||||
|
Red Ash
|
4.98
|
|
4.52
|
|
0.46
|
|
4.98
|
|
—
|
|
—
|
|
4.98
|
—
|
|
4.98
|
—
|
|
4.98
|
|
||||||||||
|
Jawbone Rider
|
7.60
|
|
6.76
|
|
0.84
|
|
7.60
|
|
—
|
|
—
|
|
7.60
|
—
|
|
7.60
|
—
|
|
7.60
|
|
||||||||||
|
Jawbone (JB20-30 & JB 10-30)
|
1.44
|
|
1.43
|
|
0.01
|
|
1.44
|
|
—
|
|
—
|
|
1.44
|
—
|
|
1.44
|
—
|
|
1.44
|
|
||||||||||
|
Grand Total
|
19.08
|
|
16.45
|
|
2.63
|
|
19.08
|
|
—
|
|
0.67
|
|
18.41
|
0.78
|
|
18.24
|
0.07
|
|
18.95
|
|
||||||||||
|
(1)
|
All tons are recoverable, reserve tons utilizing appropriate mine recovery, wash recovery at 1.50 float, and moisture factors.
|
|
(2)
|
Amounts may not add to totals due to rounding.
|
The table below sets forth the historical amount of coal produced at our coal mining operations:
|
|
Years Ended December 31,
|
|||||||||||||
|
|
2015
|
2014
|
2013
|
2012
|
2011
|
|||||||||
|
(thousands of tons)
|
||||||||||||||
|
Company operated mines
|
29
|
|
817
|
|
783
|
|
867
|
|
842
|
|
||||
|
Contractor operated mines
|
526
|
|
413
|
|
559
|
|
609
|
|
522
|
|
||||
|
Total
|
555
|
|
1,230
|
|
1,342
|
|
1,476
|
|
1,364
|
|
||||
|
Item 3.
|
Legal Proceedings
|
The information presented in
Note 18
to our consolidated financial statements within this Annual Report on Form 10-K is incorporated herein by reference.
36
Many legal and administrative proceedings are pending or may be brought against us arising out of our current and past operations, including matters related to commercial and tax disputes, product liability, employment claims, personal injury claims, premises-liability claims, allegations of exposures to toxic substances and general environmental claims. Although the ultimate outcome of these proceedings cannot be ascertained at this time, it is reasonably possible that some of them could be resolved unfavorably to us. Our management believes that any liabilities that may arise from such matters would not be material in relation to our business or our consolidated financial position, results of operations or cash flows at December 31, 2015.
|
Item 4.
|
Mine Safety Disclosures
|
The information concerning mine safety violations and other regulatory matters that we are required to report in accordance with Section 1503(a) of the Dodd-Frank Wall Street Reform and Consumer Protection Act is included in Exhibit 95.1 to this Annual Report on Form 10-K.
37
|
Item 5.
|
Market for Registrant’s Common Equity, Related Stockholders Matters and Issuer Purchases of Equity Securities
|
Market Information
Shares of our common stock, which are traded under the stock trading symbol “SXC”, have been trading since July 21, 2011, when our stock was listed on the New York Stock Exchange. The table below provides quarterly price ranges of our common stock for the two most recent fiscal years, based on the high and low prices from intraday trades.
|
2015
|
2014
|
||||||||||||||
|
High
|
Low
|
High
|
Low
|
||||||||||||
|
First quarter
|
$
|
19.56
|
|
$
|
14.38
|
|
$
|
23.85
|
|
$
|
19.82
|
|
|||
|
Second quarter
|
$
|
17.96
|
|
$
|
12.78
|
|
$
|
23.90
|
|
$
|
19.52
|
|
|||
|
Third quarter
|
$
|
13.52
|
|
$
|
7.66
|
|
$
|
24.57
|
|
$
|
21.22
|
|
|||
|
Fourth quarter
|
$
|
10.09
|
|
$
|
2.82
|
|
$
|
24.09
|
|
$
|
17.75
|
|
|||
38
Performance Graph
The graph below matches SunCoke Energy, Inc.'s cumulative 54-Month total shareholder return on common stock with the cumulative total returns of the S&P Small Cap 600 index and the Dow Jones U.S. Iron & Steel index. The graph tracks the performance of a $100 investment in our common stock and in each index (with the reinvestment of all dividends) from July 21, 2011 to December 31, 2015.
In selecting the indices for comparison, we considered market capitalization and industry or line-of-business. The S&P Small Cap 600 is a broad equity market index comprised of companies of between $400 million and $1.8 billion. SunCoke is a part of this index. The Dow Jones U.S. Iron & Steel index is comprised of both U.S.-based steel and metals manufacturing and coal and iron ore mining companies. While we do not manufacture steel, we do produce coke, an essential ingredient in the blast furnace production of steel. In addition, we have coal mining and coal logistics operations. Accordingly, we believe the Dow Jones U.S. Iron & Steel index is appropriate for comparison purposes.
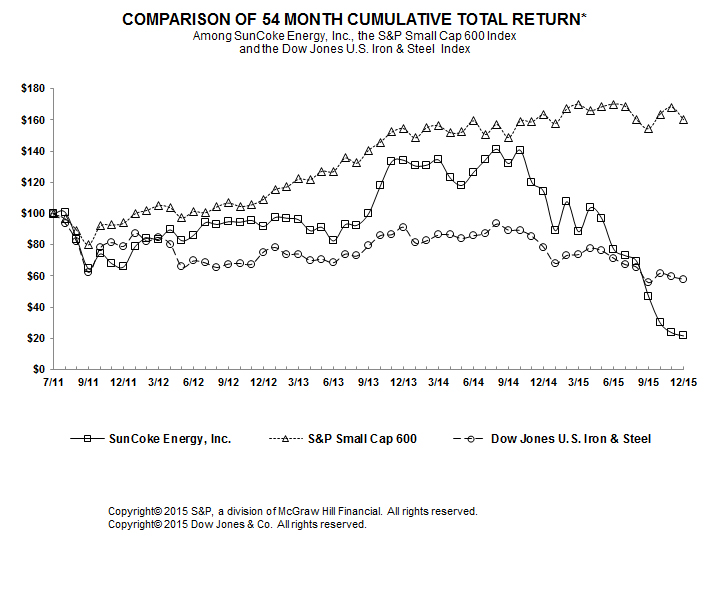
* This graph covers the period beginning with the date of our initial public offering on July 26, 2011.
39
Holders
As of
February 12, 2016
, we had a total of
64,011,791
issued and outstanding shares of our common stock and had 13,335 holders of record of our common stock.
Dividends
Our Board of Directors declared the following dividends payable in 2015:
|
Date Declared
|
Record Date
|
Dividend Per Share
|
Payment Date
|
|||
|
February 19, 2015
|
March 5, 2015
|
$0.0585
|
March 26, 2015
|
|||
|
April 20, 2015
|
May 5, 2015
|
$0.0750
|
June 10, 2015
|
|||
|
July 16, 2015
|
August 19, 2015
|
$0.1500
|
September 10, 2015
|
|||
|
October 9, 2015
|
November 18, 2015
|
$0.1500
|
December 7, 2015
|
|||
Our Board of Directors has suspended the Company's dividend. Any future dividends will be determined by the Company's Board of Directors on a quarterly basis and will depend on business conditions, our financial condition, earnings, liquidity and capital requirements, covenants in our debt agreements and other factors.
Share Repurchase Program
On July 23, 2014, the Company's Board of Directors authorized a program to repurchase outstanding shares of the Company’s common stock,
$0.01
par value, at any time and from time to time in the open market, through privately negotiated transactions, block transactions, or otherwise for a total aggregate cost to the Company not to exceed
$150.0 million
, which had $75.0 million available at December 31, 2014. During the first quarter of 2015, the Company repurchased 1.2 million shares of our common stock under this program at a cost of $20.0 million in the open market, for an average share price of $16.89. Additionally, during the third quarter of 2015, the Company repurchased 1.3 million shares of our common stock at a cost of $15.7 million in the open market, for an average share price of $11.87, leaving
$39.4 million
available under the authorized repurchase program at December 31, 2015. There were no share repurchases during the fourth quarter of 2015.
40
|
Item 6.
|
Selected Financial Data
|
The following table presents summary consolidated operating results and other information of SunCoke Energy and should be read in conjunction with "Item 7. Management’s Discussion and Analysis of Financial Condition and Results of Operations" and our consolidated financial statements and accompanying notes included elsewhere in this Annual Report on Form 10-K.
The historical combined financial statements for periods prior to the Separation Date include the accounts of all operations that comprised the cokemaking and coal mining operations of Sunoco, after elimination of all intercompany balances and transactions within the combined group of companies. The historical combined financial statements also include allocations of certain Sunoco corporate expenses. Our management believes the assumptions and methodologies underlying the allocation of corporate and other expenses were reasonable. However, such expenses should not be considered indicative of the actual level of expense that we would have incurred if we had operated as an independent, publicly-traded company during the periods prior to the IPO or of the costs expected to be incurred in future periods.
The weighted average number of common shares outstanding used in the computation of earnings attributable to SunCoke Energy, Inc. / net parent investment per common share for periods prior to 2012 includes 70.0 million shares of common stock owned by Sunoco on the Separation Date as a result of its contribution of the assets of its cokemaking and coal mining operations to us and related capitalization.
|
Years Ended December 31,
|
|||||||||||||||||||
|
2015
|
2014
|
2013
|
2012
|
2011
|
|||||||||||||||
|
(Dollars in millions, except per share amounts)
|
|||||||||||||||||||
|
Operating Results:
|
|||||||||||||||||||
|
Total revenues
|
$
|
1,362.7
|
|
$
|
1,503.8
|
|
$
|
1,647.7
|
|
$
|
1,914.1
|
|
$
|
1,538.9
|
|
||||
|
Operating income
(1)
|
$
|
79.8
|
|
$
|
(62.4
|
)
|
$
|
111.3
|
|
$
|
173.7
|
|
$
|
67.5
|
|
||||
|
Net income (loss)
(1)(2)
|
$
|
10.3
|
|
(101.8
|
)
|
$
|
50.1
|
|
$
|
102.5
|
|
$
|
58.9
|
|
|||||
|
(Loss) income attributable to SunCoke Energy, Inc. / net parent investment
|
$
|
(22.0
|
)
|
$
|
(126.1
|
)
|
$
|
25.0
|
|
$
|
98.8
|
|
$
|
60.6
|
|
||||
|
(Loss) earnings attributable to SunCoke Energy, Inc. / net parent investment per common share:
|
|||||||||||||||||||
|
Basic
|
$
|
(0.34
|
)
|
$
|
(1.83
|
)
|
$
|
0.36
|
|
$
|
1.41
|
|
$
|
0.87
|
|
||||
|
Diluted
|
$
|
(0.34
|
)
|
$
|
(1.83
|
)
|
$
|
0.36
|
|
$
|
1.40
|
|
$
|
0.87
|
|
||||
|
Dividends paid per share
|
$
|
0.4335
|
|
$
|
0.0585
|
|
|||||||||||||
|
Other Information:
|
|||||||||||||||||||
|
Cash and cash equivalents
|
$
|
123.4
|
|
$
|
139.0
|
|
$
|
233.6
|
|
$
|
239.2
|
|
$
|
127.5
|
|
||||
|
Total assets
|
$
|
2,255.5
|
|
$
|
1,959.7
|
|
$
|
2,217.4
|
|
$
|
1,989.1
|
|
$
|
1,941.2
|
|
||||
|
Long-term debt
|
$
|
997.7
|
|
$
|
633.5
|
|
$
|
634.2
|
|
$
|
700.8
|
|
$
|
723.1
|
|
||||
|
SunCoke Energy, Inc. stockholders’ equity
|
$
|
289.9
|
|
$
|
431.7
|
|
$
|
557.4
|
|
$
|
539.1
|
|
$
|
525.5
|
|
||||
|
(1)
|
During 2014, we recorded total impairment charges related to the Coal Mining business of
$150.3 million
, which included both long-lived asset and goodwill impairment charges.
|
|
(2)
|
During
2015
and
2014
, we recorded other-than-temporary impairment charges on our investment in VISA SunCoke of
$19.4 million
and
$30.5 million
, respectively. The 2015 impairment charges brought our investment in VISA SunCoke to zero.
|
41
|
Item 7.
|
Management’s Discussion and Analysis of Financial Condition and Results of Operations
|
This Annual Report on Form 10-K contains certain forward-looking statements of expected future developments, as defined in the Private Securities Litigation Reform Act of 1995. This discussion contains forward-looking statements about our business, operations and industry that involve risks and uncertainties, such as statements regarding our plans, objectives, expectations and intentions. Our future results and financial condition may differ materially from those we currently anticipate as a result of the factors we describe under “Cautionary Statement Concerning Forward-Looking Statements” and “Risk Factors.”
This “Management’s Discussion and Analysis of Financial Condition and Results of Operations” is based on financial data derived from the financial statements prepared in accordance with U.S. generally accepted accounting principles (“GAAP”) and certain other financial data that is prepared using non-GAAP measures. For a reconciliation of these non-GAAP measures to the most comparable GAAP components, see “Non-GAAP Financial Measures” at the end of this Item.
Business Overview and Market Conditions
SunCoke Energy, Inc. (“SunCoke Energy,” “Company,” “we,” “our” and “us”) is the largest independent producer of high-quality coke in the Americas, as measured by tons of coke produced each year, and has more than
50 years
of coke production experience. Coke is a principal raw material in the blast furnace steelmaking process. Coke is generally produced by heating metallurgical coal in a refractory oven, which releases certain volatile components from the coal, thus transforming the coal into coke. We also provide coal handling and/or mixing services at our Coal Logistics terminals.
We have designed, developed, built, own and operate
five
cokemaking facilities in the United States (“U.S.”) with collective nameplate capacity to produce approximately
4.2 million
tons of coke per year. Additionally, we have designed and operate
one
cokemaking facility in Brazil under licensing and operating agreements on behalf of our customer. We have a preferred stock investment in the project company that owns this facility, which has approximately
1.7 million
tons of annual cokemaking capacity. In March 2013, we formed a cokemaking joint venture with VISA Steel Limited ("VISA Steel") in India called VISA SunCoke Limited ("VISA SunCoke"), which has cokemaking capacity of approximately
440 thousand
tons of coke per year.
Our cokemaking ovens utilize efficient, modern heat recovery technology designed to combust the coal’s volatile components liberated during the cokemaking process and use the resulting heat to create steam or electricity for sale. This differs from by-product cokemaking, which repurposes the coal’s liberated volatile components for other uses. We have constructed the only greenfield cokemaking facilities in the U.S. in the last
25
years and are the only North American coke producer that utilizes heat recovery technology in the cokemaking process. We believe that heat recovery technology has several advantages over the alternative by-product cokemaking process, including producing higher quality coke, using waste heat to generate steam or electricity for sale and reducing the environmental impact.
Our core business model is predicated on providing steelmakers an alternative to investing capital in their own captive coke production facilities. We direct our marketing efforts principally towards steelmaking customers that require coke for use in their blast furnaces.
Our steelmaking customers are currently operating in an environment that is significantly challenged by declining steel prices driven by global over capacity and lower demand. The combination of the strong U.S. dollar, continued high import activity and reduced drilling activity caused by low oil and gas prices has served to depress both spot and contract prices for steel, which has driven market deterioration for flat rolled and tubular steel. Several steel producers, including certain of our customers, have filed petitions with the Department of Commerce and the International Trade Commission alleging that unfairly traded imports are causing material injury to the domestic steel industry in the U.S. and that foreign steel producers benefit from significant subsidies provided by the governments of their respective countries. While trade action is underway, domestic steel utilization rates in 2015 are down significantly from 2014 utilization rates. As a result of these current market conditions, certain of our customers have temporarily idled portions of their facilities, but continue to comply with the terms of their long-term, take-or-pay contracts with us.
Further, ArcelorMittal is currently undergoing negotiations with its union labor workforce. Our coke and energy sales agreements contain force majeure provisions allowing temporary suspension of performance by our customers for the duration of specified events beyond the control of our customers, such as a strike. Declaration of force majeure, coupled with a lengthy suspension of performance under one or more coke or energy sales agreements, may seriously and adversely affect our cash flows, financial position and results of operations. For additional information see “Item 1A. Risk Factors.”
Our Granite City facility, the first phase of our Haverhill facility, or Haverhill 1, and our VISA SunCoke joint venture have steam generation facilities, which use hot flue gas from the cokemaking process to produce steam for sale to customers pursuant to steam supply and purchase agreements. Granite City sells steam to U.S. Steel, and VISA SunCoke sells steam to VISA Steel. Previously, Haverhill 1 sold steam to Haverhill Chemicals LLC ("Haverhill Chemicals"), which filed for relief under Chapter 11 of the U.S. Bankruptcy Code during 2015. Beginning in the fourth quarter of 2015, Haverhill 1 provides steam, at no cost, to Altivia Petrochemicals, LLC ("Altivia"), which purchased the facility from Haverhill Chemicals. While the
42
Company is not currently generating revenues from providing steam to Altivia, the current arrangement, for which rates may be renegotiated beginning in 2018, mitigates costs associated with disposing of steam as well as potential compliance issues. Our Middletown facility and the second phase of our Haverhill facility, or Haverhill 2, have cogeneration plants that use the hot flue gas created by the cokemaking process to generate electricity, which is either sold into the regional power market or to AK Steel pursuant to energy sales agreements.
Our Coal Logistics business provides coal handling and/or mixing services to steel, coke (including some of our domestic cokemaking facilities), electric utility and coal mining customers. During 2015, we acquired Convent Marine Terminal ("CMT") located in Convent, Louisiana, which represents a significant expansion of the Coal Logistics business and marks our entry into export coal handling. We also have terminals in East Chicago, Indiana and in West Virginia and Kentucky. Inclusive of the acquisition of CMT, the Coal Logistics business has the collective capacity to mix and/or transload more than
40 million
tons of coal annually and has storage capacity of
3 million
tons.
Our Coal Logistics coal mining customers are currently faced with a market depressed by oversupply and declining coal prices. Our CMT customers are also impacted by seaborne export market dynamics. Fluctuations in the benchmark price for coal delivery into northwest Europe, as referenced in the API2 index price, influence our customers' decisions to place tons into the export market and thus impact transloading volumes through our terminal facility. Despite the current challenging coal mining and coal export markets, our customers have continued to perform on their contracts with us.
At December 31, 2015, we control approximately
109 million
tons of proven and probable coal mining reserves in Virginia and West Virginia
, a portion of which are currently mined by contractors
.
Incorporated in Delaware in 2010 and headquartered in Lisle, Illinois, we became a publicly-traded company in 2011 and our stock is listed on the New York Stock Exchange (“NYSE”) under the symbol “SXC.”
Formation of our Master Limited Partnership and Dropdown Transactions
On January 24, 2013, we completed the initial public offering of SunCoke Energy Partners, L.P., a master limited partnership (the "Partnership”), through the sale of
13,500,000
common units of limited partner interests in the Partnership in exchange for
$231.8 million
of net proceeds (the "Partnership Offering"). The key assets of the Partnership at the time of formation were a
65 percent
interest in each of our Haverhill and Middletown cokemaking and heat recovery facilities.
During 2014, we contributed an additional
33 percent
interest of our Haverhill and Middletown cokemaking facilities to the Partnership for a total transaction value of
$365.0 million
(the "Haverhill and Middletown Dropdown"). On January 13, 2015, we contributed an initial
75 percent
interest in our Granite City cokemaking and heat recovery facility for a total transaction value of
$244.4 million
(the "Granite City Dropdown"), and on August 12, 2015, we contributed an additional
23 percent
interest for a total transaction value of
$65.2 million
(the "Granite City Supplemental Dropdown"). Subsequent to these dropdowns, we continue to own the remaining 2 percent interest in each of these cokemaking facilities.
At December 31, 2015, we own the general partner of the Partnership, which holds a
2.0 percent
ownership interest and incentive distribution rights, and a
53.9 percent
limited partner interest in the Partnership. The remaining
44.1 percent
interest in the Partnership was held by public unitholders and is reflected in noncontrolling interest on our Consolidated Statements of Operations and Consolidated Balance Sheets.
See further discussion of these transactions in
Note 4
to our consolidated financial statements.
2015
Key Financial Results
|
•
|
Total revenues were
$1,362.7 million
in
2015
compared to
$1,503.8 million
in
2014
. The decrease in revenue primarily reflects the pass-through of lower coal prices and underperformance at Indiana Harbor. Excluding Indiana Harbor, we continue to produce coke tons at contract maximum levels, but volumes in excess of maximums as well as spot sales were lower in 2015 as compared to the prior year period. These decreases were partly offset by revenues contributed by CMT of $28.6 million, which was acquired in August 2015.
|
|
•
|
Adjusted EBITDA was
$185.8 million
in
2015
compared to
$210.7 million
in
2014
. Underperformance and lower cost recovery at Indiana Harbor, which decreased Adjusted EBITDA $23.7 million, as well as the impact of the reorganization of Haverhill Chemicals more than offset the $21.0 million of Adjusted EBITDA contribution from the acquisition of CMT.
|
|
•
|
Net loss attributable to shareholders was
$22.0 million
, or
$0.34
per share, in
2015
compared to net loss attributable to shareholders of
$126.1 million
, or
$1.83
per share, in
2014
. More than offsetting the decreases discussed above, the improvement over the prior year period was primarily driven by non-cash impairment charges related to the coal business of $150.3 million, or $92.2 million, net of tax, recorded in 2014. Additionally, we recorded non-cash impairment charges on our investment in VISA SunCoke, our Indian cokemaking joint venture, of $19.4 million and $30.5 million in 2015 and 2014, respectively.
|
43
|
•
|
Cash generated from operating activities was
$141.1 million
in
2015
compared to
$112.3 million
in
2014
, driven by working capital changes largely due to the wind down of a strategic inventory build in the prior year and the timing of payments associated with accounts payable.
|
Our Focus in
2015
During 2015, the Company's strategies and accomplishments were as follows:
|
•
|
Sustained solid safety, environmental and operating performance across our Domestic Coke and Coal Logistics fleet, excluding Indiana Harbor
;
|
|
•
|
Achieved significant growth at the Partnership through the successful acquisition of Convent Marine Terminal and the dropdown of our Granite City cokemaking operations
;
|
|
•
|
Returned approximately $64 million to investors via dividends and share repurchases during 2015
; and
|
|
•
|
Implemented a contract mining model and rationalized production at our coal mining operations
.
|
Sustained solid safety, environmental and operating performance across our Domestic Coke and Coal Logistics fleet, excluding Indiana Harbor
Domestic Coke performance, excluding Indiana Harbor, was solid during 2015. Domestic Coke Adjusted EBITDA was
$210.1 million
, or
$51
per ton, down
$37.8 million
from 2014 Adjusted EBITDA of
$247.9 million
, or
$59
per ton, primarily related to underperformance at Indiana Harbor, which decreased Adjusted EBITDA $23.7 million as compared to 2014. Excluding Indiana Harbor, we produced coke tons at contract maximum levels, but volumes in excess of maximums as well as spot sales were lower in 2015 as compared to 2014. Our remaining cokemaking facilities had solid performance despite the impact of the restructuring of Haverhill Chemicals, which decreased Adjusted EBITDA by $6.4 million. Additionally, in connection with the rationalization of our Coal Mining business, our Jewell Coke facility incurred certain separation costs, including higher handling and mixing charges as well as the impact of lower coal-to-coke yields mainly due to higher coal moistures, which decreased Adjusted EBITDA $7.6 million.
During 2015, we continued construction and implementation of our new gas sharing project to enhance environmental performance at our Haverhill cokemaking facility. We are nearing completion of construction on the project at Haverhill I and continued testing of the project at Haverhill II, which was placed into service at the end of 2014.
While our spending at Indiana Harbor was lower in 2015 as compared to the prior year, changes to our contracted reimbursement of operating and maintenance costs as well as volume shortfalls caused by operational inefficiencies drove an Adjusted EBITDA loss of $7.3 million in 2015. While the original refurbishment improved overall plant condition, further work remains to stabilize plant performance.
During 2015, we rebuilt the interiors of 48 ovens using a more comprehensive approach. We approached these rebuilds in blocks of ovens as opposed to individually, taking them out of service and bringing them back online on a controlled basis, which gave us the ability to complete the work in a more systematic way. This new approach also provides a better ability to enter the ovens and more fully addresses the shortcomings on the oven walls and crowns. We continue to evaluate the performance and results of the rebuilt ovens with the overall goal of stabilizing daily production and increasing efficiency.
Coal Logistics achieved Adjusted EBITDA of
$38.4 million
during 2015, with the successful integration of CMT contributing $21.0 million from the date of acquisition. Excluding CMT, Adjusted EBITDA increased $3.1 million in 2015 compared to 2014. While volumes were slightly down, the improvements in Adjusted EBITDA reflect a more favorable sales mix of higher margin services as well as cost savings in 2015.
We remain committed to maintaining a safe work environment and ensuring compliance with applicable laws and regulations. In 2015, we sustained top-tier safety and strong environmental performance in our Domestic Coke and Coal Logistics operations.
Achieved significant growth at the Partnership through the successful acquisition of Convent Marine Terminal and the dropdown of our Granite City cokemaking operations
On
August 12, 2015
, the Partnership completed the acquisition of a
100 percent
ownership interest in Raven Energy LLC, which owns CMT, for a total transaction value of
$403.1 million
. This transaction represents a significant expansion of the Partnership's Coal Logistics business and marks our entry into export coal handling. CMT is one of the largest export terminals on the U.S. Gulf Coast and provides strategic access to seaborne markets for coal and other industrial materials. Supporting low-cost Illinois basin coal producers, the terminal provides loading and unloading services and has direct rail access and the current capability to transload
10 million
tons of coal annually. The facility is supported by long-term contracts with volume commitments covering all of its current
10 million
ton capacity.
The acquisition of CMT resulted in Adjusted EBITDA of $21.0 million in 2015. See
Note 3
to our consolidated financial statements for further discussion of the acquisition of CMT.
44
Additionally, consistent with our previous plans to drop assets into the Partnership, on
January 13, 2015
,
the Company contributed a
75 percent
interest in its Granite City cokemaking facility to the Partnership for a total transaction value of
$244.4 million
.
On
August 12, 2015
, the Company contributed an additional
23 percent
interest in Granite City to the Partnership for a total transaction value of
$65.2 million
. See
Note 4
to our consolidated financial statements for further discussion of the dropdown of Granite City. As discussed below in "Our Focus and Outlook for 2016," given the current challenging market conditions and our focused efforts to de-lever the Partnership's balance sheet during 2016, we have suspended plans for future dropdowns.
Returned approximately $64 million to investors via dividends and share repurchases during 2015
During 2015, we paid $28.0 million in dividends to our shareholders. Additionally, we repurchased
2.5 million
shares of our common stock at a cost of
$35.7 million
in the open market for an average repurchase price of
$14.25
per share. In 2016, we will continue evaluating the appropriate use of capital and prioritize de-levering the Partnership, as further discussed in "Our Focus and Outlook for 2016."
Implemented a contract mining model and rationalized production at our coal mining operations
During 2015, actions to rationalize our Coal Mining operations continued and included idling certain mines to reduce coal production by half to approximately 0.6 million tons annually, transitioning to a fully contractor-mined operation and decommissioning our coal preparation plant. As a result, approximately 0.6 million tons of coal were purchased from third-parties during 2015 to fulfill the remaining coal requirements to supply the Jewell cokemaking facility. Adjusted EBITDA for our Coal Mining business was a loss of $18.9 million in 2015. We will continue to evaluate options to minimize costs associated with providing our Jewell cokemaking facility with coal, including potentially closing our remaining mines and moving to a 100 percent purchased coal model.
Our Focus and Outlook for
2016
In
2016
, we expect to deliver consolidated Adjusted EBITDA of $210 million to $235 million. Our primary focus will be to:
|
•
|
Manage through the challenging market conditions
;
|
|
•
|
Stabilize our Indiana Harbor cokemaking operations
;
|
|
•
|
Deliver operational excellence
; and
|
|
•
|
Achieve financial objectives and strengthen our balance sheet
.
|
Manage through the challenging market conditions
Given the challenging environment our customers are currently experiencing, our overall business risk has increased, and our focus in 2016 will be to remain flexible and responsive to changing market conditions.
Slowing steel demand in China, the world’s largest producer and consumer of steel, has led to global oversupply and significant downward pricing pressure. Domestically, a flood of steel imports, some later deemed by the U.S. Federal Trade Commission to be unfairly traded, have stressed U.S. steelmakers operationally and financially. Steel utilization rates in the U.S. are down significantly as compared to 2014. As a result, two of our customers, AK Steel and U.S. Steel have temporarily idled portions of their facilities at Ashland, Kentucky Works operations and Granite City Works operations, respectively. Our Haverhill II cokemaking facility supplies coke to AK Steel's Ashland, Kentucky Works under a long-term, take-or-pay contract until 2022, and our Granite City cokemaking facility supplies coke to U.S. Steel’s Granite City Works under a long-term, take-or-pay contract until 2025. These temporary idlings do not change any obligations that AK Steel or U.S. Steel have under these contracts. AK Steel and U.S. Steel have continued to take and pay for all of the coke we have produced at our Haverhill II and Granite City facilities, respectively. Despite these developments, longer term, we expect blast furnaces will continue to play a crucial role in the domestic steel industry. The Company is positioned with long-term, take-or-pay contracts, co-located assets with leading technology and an advantaged environmental footprint. Therefore, we believe we will continue to be a competitive source of coke and a preferred supplier to the steel value chain.
In the Partnership's Coal Logistics business, our export customers face significant challenges from oversupply and a strong U.S. dollar, but we expect, longer term, that the seaborne export coal market will remain relevant, particularly as emerging markets' electricity and power needs rise. As such, we believe Illinois Basin coal will remain a key part of the U.S. coal export base. Our CMT export facility benefits from its long-term, take-or-pay contracts and is uniquely positioned to serve its customers through direct rail access, the ability to load multi-category vessels and a new state-of-the-art ship loader, which we expect to complete in 2016. Our KRT domestic coal terminals are strategically located to handle both metallurgical and thermal coals, and both CMT and KRT have the ability to handle various industrial materials.
45
With these macro steel and coal industry backdrop challenges, we will continue to monitor our customers’ business developments, liquidity and credit profiles in an effort to be prepared to adapt and respond to any significant adverse events that may also impact us. Our focus has been and will continue to be to position ourselves for long-term success, which includes being a key supplier to our customers.
Stabilize our Indiana Harbor cokemaking operations
In 2016, we will be focused on stabilizing our Indiana Harbor plant and improving its performance. In late 2015, we implemented a more holistic approach to strengthen improvement efforts and address the continued underperformance at Indiana Harbor, which we will continue in 2016. Rather than focusing on delivering the full-year production target of 1.22 million tons, our emphasis will be on achieving stable production results and operating the plant in an optimal manner, which we expect will drive improved profitability. Should this approach result in tonnage shortfalls, we believe we can utilize excess tonnage from our other facilities to meet customer needs.
We expect our efforts to deliver Adjusted EBITDA at Indiana Harbor of $3 million to $13 million in 2016, an increase of approximately $10 million to $20 million over 2015, driven by expected full year production of approximately 1.05 million tons and a $5 million decrease in nominal operating and maintenance spending. We expect 2016 capital expenditures at Indiana Harbor of approximately $18 million, driven by oven rebuilds and environmental spending. We expect capital expenditures at Indiana Harbor of approximately $5 million to $10 million in 2017.
Deliver operational excellence
In 2016, we expect continued strong performance from our Domestic Coke and Coal Logistics businesses. Despite the challenging headwinds facing our steel and coal customers, we expect to deliver consolidated Adjusted EBITDA of between $210 million and $235 million. This increase reflects a full-year contribution from the Partnership's acquisition of CMT, improved Indiana Harbor results and rationalized corporate costs. We expect these improvements will be partially offset by increased operating and maintenance costs at our Haverhill facility for necessary oven repairs and a planned turbine outage and lower overall contributions from coal-to-coke yield performance due to the decline in coal prices.
We project that our Domestic Coke segment will produce approximately 4.1 million tons of coke during 2016 and achieve Adjusted EBITDA of approximately $50 to $55 per ton based on improvements at Indiana Harbor and expected solid ongoing operations across the rest of the fleet. Excluding Indiana Harbor, we expect our Domestic Coke fleet will sell at contract maximum volumes, but do not anticipate incremental spot sales.
We believe our Coal Logistics assets are positioned to withstand the coal downturn, and despite industry pressures, our results to-date have been in-line with expectations. In 2016, we expect the full-year benefit of CMT to drive Adjusted EBITDA of approximately $50 million to $55 million, up from $21.0 million in 2015. We expect our remaining Coal Logistics business will remain stable, contributing approximately $15 million to $20 million of Adjusted EBITDA during the year.
At our Coal Mining segment, we expect 2016 Adjusted EBITDA to remain essentially flat at a loss of approximately $20 million and will continue to pursue reducing the ongoing impact of our Coal Mining business on our overall results. In the first half of 2016, we expect to complete a capital project to install additional coal handling and storage facilities to service our Jewell cokemaking operation. We will continue to evaluate options to minimize costs associated with providing our Jewell cokemaking facility with coal, including potentially closing our remaining mines and moving to a 100 percent purchased coal model.
During 2016, in addition to delivering on our financial objectives, we will focus on shifting our capital allocation priorities towards de-levering the Partnership's balance sheet and maintaining a solid liquidity position at both the Company and the Partnership. The Partnership, along with support from the Company, has various potential options to increase liquidity. Each quarter, the Company will evaluate the alternatives for increasing liquidity at the Partnership, including providing support through a "reimbursement holiday" on the corporate cost allocated to the Partnership and/or returning incentive distribution rights distributions to the Partnership ("IDR giveback"). If approved for all four quarters by SunCoke, the corporate cost reimbursement holiday and IDR giveback would potentially provide approximately $28 million and $6 million of liquidity, respectively, in 2016. Additionally, the Partnership's Board of Directors will continue to evaluate the appropriate partnership distribution each quarter. We expect that these potential liquidity options, combined with the excess cash flows generated from operations, will provide us with at least $60 million in cash to meaningfully de-lever the Partnership's balance sheet in 2016. In order to maintain flexibility and liquidity, our Board of Directors has suspended the Company's dividend.
Items Impacting Comparability
|
•
|
Coal Logistics.
Coal Logistics reported revenues of
$81.2 million
,
$55.0 million
and
$13.6 million
, of which
$20.4 million
,
$18.8 million
and
$5.5 million
were intercompany revenues, and Adjusted EBITDA of
$38.4 million
,
$14.3 million
and
$4.7 million
during 2015,
2014
and
2013
, respectively. Comparability between periods
|
46
was impacted by the timing of the acquisition of CMT during the third quarter 2015, which contributed revenues of
$28.6 million
and Adjusted EBITDA of $21.0 million during 2015, as well as the acquisition of Lake Terminal and KRT during the second half of 2013, which established our Coal Logistics business.
|
•
|
Haverhill Chemicals.
During the second quarter of 2015, Haverhill Chemicals, with whom we previously had a steam supply agreement at our Haverhill 1 cokemaking operations, announced plans to shut down their facility and later filed for relief under Chapter 11 of the U.S. Bankruptcy Code, which did not impact our ability to produce coke.
Beginning in the fourth quarter of 2015, Haverhill 1 provides steam, at no cost, to Altivia, which purchased the facility from Haverhill Chemicals. While the Company is not currently generating revenues from providing steam to Altivia, the current arrangement, for which rates may be renegotiated beginning in 2018, mitigates costs associated with disposing of steam as well as potential compliance issues. These events decreased Adjusted EBITDA $6.4 million during 2015.
|
|
•
|
Severance.
In
2015
and
2014
, we reduced the workforce in our corporate office and incurred total charges of
$4.1 million
and
$1.4 million
in
2015
and
2014
, respectively, in Corporate and Other. We expect the 2015 reduction in workforce at our corporate office to provide savings of approximately $3.5 million in 2016.
|
In connection with the restructuring of our Coal Mining business, the Company recorded $12.5 million of employee-related restructuring costs in 2014 in the Coal Mining segment. During 2015, we reduced our severance accrual by $2.3 million as a result of changes in estimates, including the relocation of certain coal employees to other areas of our business.
These severance costs are included in selling, general and administrative expenses on the Consolidated Statements of Operations.
|
•
|
Pension Plan Termination.
Effective May 30, 2014, Dominion Coal Corporation ("Dominion Coal"), a wholly-owned subsidiary of the Company, terminated its defined benefit plan, a plan that was previously offered generally to all full-time employees of Dominion Coal. In June 2015, the plan settled its obligations by purchasing annuities using plan assets, which triggered settlement accounting and resulted in a non-cash loss of
$12.6 million
recorded in cost of products sold and operating expense on the Consolidated Statements of Operations.
|
|
•
|
Black Lung Obligation.
The Company recognized expense of
$9.8 million
and
$14.3 million
and income of
$0.3 million
during
2015
,
2014
, and
2013
, respectively, in connection with our black lung obligation. Our obligation related to black lung benefits was estimated based on various assumptions, including actuarial estimates, discount rates and changes in health care costs. In addition to changes in assumptions, the estimated liability in
2015
and
2014
was impacted by a significant increase in the number of claims filed as well as the rate at which claims are awarded. The Company made payments related to black lung of
$3.8 million
,
$2.8 million
and
$2.2 million
during
2015
,
2014
, and
2013
, respectively.
|
|
•
|
India Equity Method Investment.
As a result of the continued deterioration of market factors, primarily the continuation of low-priced Chinese coke imports and the resulting deterioration of coke margins, we evaluated the recoverability of our equity method investment in Visa SunCoke in both
2015
and
2014
. As a result of these analyses, we recorded impairment charges of
$19.4 million
and
$30.5 million
during
2015
and
2014
, respectively. These impairment charges were included in loss from equity method investment on the Consolidated Statements of Operations. The
2015
impairment brought our investment in VISA SunCoke to zero, and consequently, we no longer include our share of VISA SunCoke in our financial results. Loss from our equity method investment in VISA SunCoke was
$21.6 million
,
$35.0 million
and
$2.2 million
during 2015,
2014
and
2013
, respectively. See
Note 6
and
Note 24
to our consolidated financial statements.
|
|
•
|
Coal Mining Impairments.
In the second quarter of 2014, we evaluated the recoverability of our long-lived coal asset group given the projected losses resulting from the weakening coal market. We recorded total impairment charges related to the coal business of $150.3 million, or $92.2 million net of tax, including long-lived asset and goodwill impairment charges. See
Note 5
and
Note 24
to the consolidated financial statements.
|
|
•
|
I
nterest Expense, net.
Interest expense, net was
$56.7 million
,
$63.2 million
, and
$52.3 million
during
2015
,
2014
and
2013
, respectively, and was impacted by the following items:
|
|
◦
|
Net loss on extinguishment of debt was
$0.5 million
and
$15.4 million
in
2015
and
2014
, respectively. The
2015
net loss includes losses of $9.4 million and $3.2 million in connection with the financing of the Granite City Dropdown and the repayment of $60.4 million of the Company's senior notes, respectively, net of a
$12.1 million
gain on the retirement of
$47.5 million
of the Partnership's senior notes. During
2014
, the Company incurred a loss on the extinguishment of debt of
$15.4 million
in connection with the
|
47
financing of the Haverhill and Middletown Dropdown. There were no debt extinguishment gains or losses during
2013
.
|
◦
|
Interest of
$3.7 million
was capitalized in connection with the environmental remediation projects and the expansion capital improvement project at CMT during 2015. Interest of
$3.2 million
and
$1.0 million
was capitalized in connection with environmental remediation projects during
2014
and
2013
, respectively.
|
|
◦
|
Interest on higher debt balances, primarily associated with the acquisition of CMT, attributed to the remaining increase in interest expense, net during 2015 and 2014. The 2015 average debt balance was $816.2 million as compared to the 2014 average debt balance of $649.8 million. See
Note 16
to our consolidated financial statements.
|
|
•
|
Noncontrolling Interest.
Income attributable to noncontrolling interest represents the common public unitholders’ interest in the Partnership as well as a third-party interest in our Indiana Harbor cokemaking facility. Income attributable to noncontrolling interest was
$32.3 million
,
$24.3 million
and
$25.1 million
during
2015
,
2014
and
2013
, respectively.
|
|
◦
|
The increase of $8.0 million in 2015 was primarily driven by the Granite City dropdowns along with the CMT acquisition, all of which increased the overall earnings of the Partnership. The acquisition and dropdown transactions also increased the public unitholders ownership percentage of the Partnership from 43.9 percent to 44.6 percent.
|
|
◦
|
The decrease of $0.8 million in 2014 compared to 2013 was driven by lower overall earnings of Haverhill and Middletown as well as dropdown transaction costs incurred by the Partnership during 2014. These decreases were partially offset by the Partnership's increased ownership in Haverhill and Middletown due to the dropdown transaction in May 2014, which increased the Company's noncontrolling interest. The Haverhill and Middletown dropdown transaction increased the public unitholders ownership percentage of the Partnership from 42.1 percent to 43.9 percent.
|
Results of Operations
The following table sets forth amounts from the Consolidated Statements of Operations for the years ended December 31,
2015
,
2014
and
2013
:
|
Years Ended December 31,
|
|||||||||||
|
2015
|
2014
|
2013
|
|||||||||
|
(Dollars in millions)
|
|||||||||||
|
Revenues
|
|||||||||||
|
Sales and other operating revenue
|
$
|
1,351.3
|
|
$
|
1,490.7
|
|
$
|
1,633.5
|
|
||
|
Other income, net
|
11.4
|
|
13.1
|
|
14.2
|
|
|||||
|
Total revenues
|
1,362.7
|
|
1,503.8
|
|
1,647.7
|
|
|||||
|
Costs and operating expenses
|
|||||||||||
|
Cost of products sold and operating expenses
|
1,098.4
|
|
1,212.9
|
|
1,348.0
|
|
|||||
|
Selling, general and administrative expenses
|
75.4
|
|
96.7
|
|
92.4
|
|
|||||
|
Depreciation and amortization expense
|
109.1
|
|
106.3
|
|
96.0
|
|
|||||
|
Asset and goodwill impairment
|
—
|
|
150.3
|
|
—
|
|
|||||
|
Total costs and operating expenses
|
1,282.9
|
|
1,566.2
|
|
1,536.4
|
|
|||||
|
Operating income (loss)
|
79.8
|
|
(62.4
|
)
|
111.3
|
|
|||||
|
Interest expense, net
|
56.7
|
|
63.2
|
|
52.3
|
|
|||||
|
Income (loss) before income tax (benefit) expense and loss from equity method investment
|
23.1
|
|
(125.6
|
)
|
59.0
|
|
|||||
|
Income tax (benefit) expense
|
(8.8
|
)
|
(58.8
|
)
|
6.7
|
|
|||||
|
Loss from equity method investment
|
21.6
|
|
35.0
|
|
2.2
|
|
|||||
|
Net income (loss)
|
10.3
|
|
(101.8
|
)
|
50.1
|
|
|||||
|
Less: Net income attributable to noncontrolling interests
|
32.3
|
|
24.3
|
|
25.1
|
|
|||||
|
Net (loss) income attributable to SunCoke Energy, Inc.
|
$
|
(22.0
|
)
|
$
|
(126.1
|
)
|
$
|
25.0
|
|
||
48
Year Ended December 31,
2015
compared to Year Ended December 31,
2014
Revenues
.
Total revenues were
$1,362.7 million
for the year ended December 31,
2015
compared to
$1,503.8 million
for the corresponding period of
2014
. The decrease in revenue primarily reflects the pass-through of lower coal prices and underperformance at Indiana Harbor. Excluding Indiana Harbor, we continue to produce coke tons at contract maximum levels, but volumes in excess of maximums as well as spot sales were lower in 2015 as compared to the prior year period. These decreases were partially offset by additional revenue from CMT, which contributed revenues of $28.6 million since its acquisition in August 2015.
Costs and Operating Expenses
.
Total operating expenses were
$1,282.9 million
for the year ended December 31,
2015
compared to
$1,566.2 million
for the corresponding period of
2014
. The decrease was the result of lower coal prices as well as a
$150.3 million
impairment charge in 2014 relating to our Coal Mining business. These decreases were partially offset by CMT costs and operating expenses of $10.2 million since the date of acquisition in August 2015.
Interest Expense, Net.
Interest expense, net was
$56.7 million
for the year ended December 31,
2015
compared to
$63.2 million
for the year ended December 31,
2014
. Comparability between periods was impacted by the financing activities previously discussed in "Items Impacting Comparability."
Income Taxes
.
Income tax benefit from operations decreased
$50.0 million
to
$8.8 million
for the year ended December 31,
2015
compared to
$58.8 million
for the corresponding period of
2014
, which was primarily due to lower overall earnings in the prior year driven by the coal mining impairment previously discussed.
Loss from Equity Method Investment.
Loss from equity method investment was
$21.6 million
in
2015
compared to
$35.0 million
in
2014
. In 2014, we recorded a non-cash impairment charge on our investment in VISA SunCoke, our Indian cokemaking joint venture, of $30.5 million. We recorded an additional impairment charge of $19.4 million in 2015, which resulted in an investment balance of zero. Consequently, beginning in the fourth quarter of 2015, we no longer include our share of VISA SunCoke in our financial results.
Noncontrolling Interest.
Income attributable to noncontrolling interest represents the common public unitholders' interest in SunCoke Energy Partners, L.P. as well as a third-party interest in our Indiana Harbor cokemaking facility. Income attributable to noncontrolling interest was
$32.3 million
for the year ended December 31,
2015
compared to
$24.3 million
for the year ended December 31,
2014
. Comparability between periods was impacted by the Partnerships' ownership changes in its cokemaking facilities previously discussed in "Items Impacting Comparability."
Year Ended December 31,
2014
compared to Year Ended December 31,
2013
Revenues
.
Our total revenues, net of sales discounts, were
$1,503.8 million
for the year ended
December 31, 2014
compared to
$1,647.7 million
for the corresponding period of
2013
. The decrease was due primarily to the pass-through of lower coal prices and lower coke sales volumes in our Domestic Coke segment. Lower coal prices and lower coal sales volume in our Coal Mining segment, further contributed to the decrease. Additionally, operational inefficiencies caused by the refurbishment project at the Indiana Harbor facility had an adverse impact on production and yields as did severe weather during the first quarter of 2014. These decreases were partially offset by revenues from the Coal Logistics business of $36.2 million in 2014 compared to $8.1 million in 2013, which only included four months of Coal Logistics revenues, and the absence of sales discounts in 2014 due to the expiration of the Granite City fuel tax credits in late 2013.
Costs and Operating Expenses
.
Total operating expenses were
$1,566.2 million
for the year ended
December 31, 2014
compared to
$1,536.4 million
for the corresponding period of
2013
. The increase was primarily due to $150.3 million of asset and goodwill impairment charges associated with our Coal Mining segment in 2014. Additional depreciation in connection with the refurbishment of our Indiana Harbor facility further increased costs and operating expenses by
$15.6 million
, or
$0.23
per common share. These increases were mostly offset by decreases associated with lower coal prices as well as transaction costs in 2013 related to the acquisition of the Coal Logistics business.
Interest Expense, Net.
Interest expense, net was
$63.2 million
for the year ended
December 31, 2014
compared to
$52.3 million
for the year ended
December 31, 2013
. Comparability between periods was impacted by the financing activities previously discussed in "Items Impacting Comparability."
Income Taxes
.
We had income tax benefit of
$58.8 million
for the year ended
December 31, 2014
compared to income tax expense of
$6.7 million
for the corresponding period of
2013
, which was primarily due to lower overall earnings in 2014 driven by the coal mining impairments, as well as the enacted reduction in the Indiana statutory tax rate, partially offset by the expiration of nonconventional fuel tax credits related to the Granite City facility.
Loss from Equity Method Investment.
Loss from equity method investment was
$35.0 million
in
2014
compared to
$2.2 million
in
2013
. During 2014, the Company recorded an other-than-temporary impairment charge of
$30.5 million
. The loss in 2013 was impacted by foreign exchange losses of $1.5 million compared to $0.3 million in 2014.
49
Noncontrolling Interest.
Income attributable to noncontrolling interest represents the common public unitholders' interest in the Partnership as well as a third-party interest in our Indiana Harbor cokemaking facility. Income attributable to noncontrolling interest was
$24.3 million
for the year ended December 31,
2014
compared to
$25.1 million
for the year ended December 31,
2013
. Comparability between periods was impacted by the Haverhill and Middletown Dropdown activities previously discussed.
Results of Reportable Business Segments
We report our business results through four segments:
|
•
|
Domestic Coke consists of our Jewell, Indiana Harbor, Haverhill, Granite City and Middletown cokemaking and heat recovery operations located in Vansant, Virginia; East Chicago, Indiana; Franklin Furnace, Ohio; Granite City, Illinois; and Middletown, Ohio, respectively.
|
|
•
|
Brazil Coke consists of our operations in Vitória, Brazil, where we operate a cokemaking facility for a Brazilian subsidiary of ArcelorMittal;
|
|
•
|
India Coke consists of our cokemaking joint venture with Visa Steel in Odisha, India.
|
|
•
|
Coal Logistics consists of our coal handling and/or mixing service operations in East Chicago, Indiana; Ceredo, West Virginia; Belle, West Virginia; and Catlettsburg, Kentucky; and Convent, Louisiana.
|
Our coke sales agreements in our Domestic Coke segment contain highly similar contract provisions. Specifically, each agreement includes:
|
•
|
Take-or-Pay Provisions
. Substantially all of our coke sales at our domestic cokemaking facilities are under take-or-pay contracts that require us to produce the contracted volumes of coke and require the customer to purchase such volumes of coke up to a specified tonnage or pay the contract price for any tonnage they elect not to take. As a result, our ability to produce the contracted coke volume and performance by our customers are key determinants of our profitability. We generally do not have significant spot coke sales since our domestic capacity is consumed by long-term contracts; accordingly, spot prices for coke do not generally affect our revenues.
|
|
•
|
Coal Cost Component with Pass-Through Provisions
. The largest cost component of our coke is the cost of purchased coal, including any transportation or handling costs. Under the contracts at our domestic cokemaking facilities, coal costs are a pass-through component of the coke price, provided that we realize certain targeted coal-to-coke yields. When targeted coal-to-coke yields are achieved, the price of coal is not a significant determining factor in the profitability of these facilities, although it does affect our revenue and cost of sales for these facilities in approximately equal amounts. However, to the extent that the actual coal-to-coke yields are less than the contractual standard, we are responsible for the cost of the excess coal used in the cokemaking process. Conversely, to the extent our actual coal-to-coke yields are higher than the contractual standard, we realize gains. As coal prices decline, the benefits associated with favorable coal-to-coke yields also decline. The coal component of the Jewell coke price is fixed annually for each calendar year based on the weighted-average contract price of third-party coal purchases at our Haverhill facility applicable to ArcelorMittal coke sales.
|
|
•
|
Operating Cost Component with Pass-Through or Inflation Adjustment Provisions
. Our coke prices include an operating cost component. Operating costs under three of our coke sales agreements are passed through to the respective customers subject to an annually negotiated budget in some cases subject to a cap annually adjusted for inflation, and we share any difference in costs from the budgeted amounts with our customers. Under our other three coke sales agreements, the operating cost component for our coke sales are fixed subject to an annual adjustment based on an inflation index. Beginning in 2015, the operating and maintenance cost recovery mechanism in our Indiana Harbor coke sales agreement shifted from an annually negotiated budget amount with a cap to a fixed recovery per ton. Accordingly, actual operating costs can have a significant impact on the profitability of all our domestic cokemaking facilities. In 2018, the operating cost component of our contract at Indiana Harbor reverts to an annually negotiated budget, which is expected to have a favorable impact on our future results.
|
|
•
|
Fixed Fee Component
. Our coke prices also include a per ton fixed fee component for each ton of coke sold to the customer, which is determined at the time the coke sales agreement is signed and is effective for the term of each sales agreement. The fixed fee is intended to provide an adequate return on invested capital to SunCoke and may differ based on investment levels, tax benefits and other considerations. The actual return on invested capital at any facility is based on the fixed fee per ton and favorable or unfavorable performance on pass-through cost items.
|
50
|
•
|
Tax Component
. Our coke sales agreements also contain provisions that generally permit the pass-through of all applicable taxes (other than income taxes) related to the production of coke at our facilities.
|
|
•
|
Coke Transportation Cost Component
. Where we deliver coke to our customers via rail, our coke sales agreements also contain provisions that permit the pass-through of all applicable transportation costs related to the transportation of coke to our customers.
|
In 2013, our Granite City facility shared a portion of certain nonconventional fuel tax credits with its customer through discounts to the sales price of coke, which totaled $7.4 million. As a result, our pre-tax results for this facility reflect the impact of these sales discounts, while the actual tax benefits are reflected as a reduction of income tax expense. The tax benefit from generating credits, and the related sales discount to our customer, expired in 2013. Accordingly, the results of our Domestic Coke segment increased in 2014, but this increase is more than offset by the increase in our income tax expense.
Revenues from our Brazil segment are derived from licensing and operating fees based upon the level of production from a Brazilian subsidiary of ArcelorMittal. Our revenues also include the full pass-through of the operating costs of the facility. We also receive an annual preferred dividend on our preferred stock investment in the Brazilian project company that owns the facility. In general, the facility must achieve certain minimum production levels for us to receive the preferred dividend. In prior years, we reduced production at our Brazilian cokemaking facility at the request of our customer. This decrease to production did not impact our ability to receive our preferred dividend. In 2014, production returned to historical levels and reached record highs in 2015.
Our India segment results were generated by our joint venture equity method investment in the VISA SunCoke cokemaking facility in Odisha, India, which is comprised of a 440 thousand ton heat recovery cokemaking facility and the facility's associated steam generation units. VISA SunCoke's cokemaking process utilizes heat recovery technology developed in China. VISA SunCoke intends to sell approximately one-third of its coke production and all of its steam production to VISA Steel with the remainder of the coke production being sold in the spot market.
During 2015, we impaired our investment in VISA SunCoke to
zero
and, consequently, beginning in the fourth quarter of 2015, we no longer include our share of VISA SunCoke in our financial results.
Coal Logistics revenues are derived from services provided to steel, coal mining, coke (including some of our domestic cokemaking facilities) and electric utility customers. Services provided to our domestic cokemaking facilities are provided under a contract with terms equivalent to those of an arm's-length transaction. We do not take possession of coal but instead act as intermediaries between coal producers and coal end users by providing transloading, storage and mixing services to our customers on a per ton basis. Revenues are recognized when services are provided as defined by customer contracts. Certain of our Coal Logistics terminals have take-or-pay contracts with required minimum volume. Cash received in excess of revenues earned for services provided representing customer volume commitments under these take-or-pay contracts is recorded as deferred revenue. Deferred revenue on take-or-pay contracts is recognized into income when earned as determined by the terms of the contract.
The Coal Mining segment conducts coal mining operations near the Company’s Jewell cokemaking facility with mines located in Virginia and West Virginia, which are currently mined by contractors. A substantial portion of the coal production is sold to the Jewell cokemaking facility for conversion into coke. Some coal is also sold to other cokemaking facilities within the Domestic Coke segment. Intersegment coal revenues for sales to the Domestic Coke segment are reflective of the contract price that the facilities within the Domestic Coke segment charge their customers, which approximate the market prices for this quality of metallurgical coal.
Corporate expenses that can be identified with a segment have been included in determining segment results. The remainder is included in Corporate and Other, including certain legacy coal mining expense (i.e., black lung, workers compensation, net pension and other postretirement employee benefit obligations). Interest expense, net, which consists principally of interest income and interest expense, net of capitalized interest, is also excluded from segment results. Segment assets, net of tax are those assets that are utilized within a specific segment and exclude deferred taxes and current tax receivables.
Management believes Adjusted EBITDA is an important measure of operating performance and liquidity and uses it as the primary basis for the Chief Operating Decision Maker ("CODM") to evaluate the performance of each of our reportable segments. Adjusted EBITDA should not be considered a substitute for the reported results prepared in accordance with GAAP. See “Non-GAAP Financial Measures” at the end of this Item
.
51
Segment Operating Data
The following table sets forth financial and operating data for the years ended December 31,
2015
,
2014
and
2013
:
|
Years Ended December 31,
|
|||||||||||
|
2015
|
2014
|
2013
|
|||||||||
|
(Dollars in millions, except per ton amounts)
|
|||||||||||
|
Sales and other operating revenues:
|
|||||||||||
|
Domestic Coke
|
$
|
1,243.6
|
|
$
|
1,388.3
|
|
$
|
1,528.7
|
|
||
|
Brazil Coke
|
34.0
|
|
37.0
|
|
35.4
|
|
|||||
|
Coal Logistics
|
60.8
|
|
36.2
|
|
8.1
|
|
|||||
|
Coal Logistics intersegment sales
|
20.4
|
|
18.8
|
|
5.5
|
|
|||||
|
Coal Mining
|
12.9
|
|
29.2
|
|
61.3
|
|
|||||
|
Coal mining intersegment sales
|
101.0
|
|
136.0
|
|
136.7
|
|
|||||
|
Elimination of intersegment sales
|
(121.4
|
)
|
(154.8
|
)
|
(142.2
|
)
|
|||||
|
Total sales and other operating revenue
|
$
|
1,351.3
|
|
$
|
1,490.7
|
|
$
|
1,633.5
|
|
||
|
Adjusted EBITDA
(1)
:
|
|||||||||||
|
Domestic Coke
|
$
|
210.1
|
|
$
|
247.9
|
|
$
|
243.2
|
|
||
|
Brazil Coke
|
22.4
|
|
18.9
|
|
16.1
|
|
|||||
|
India Coke
|
(1.9
|
)
|
(3.1
|
)
|
0.9
|
|
|||||
|
Coal Logistics
|
38.4
|
|
14.3
|
|
|
4.7
|
|
||||
|
Coal Mining
|
(18.9
|
)
|
(16.0
|
)
|
(15.1
|
)
|
|||||
|
Corporate and Other, including legacy costs, net
(2)
|
(64.3
|
)
|
(51.3
|
)
|
(34.7
|
)
|
|||||
|
Adjusted EBITDA
|
$
|
185.8
|
|
$
|
210.7
|
|
$
|
215.1
|
|
||
|
Coke Operating Data:
|
|||||||||||
|
Domestic Coke capacity utilization (%)
|
97
|
|
98
|
|
101
|
|
|||||
|
Domestic Coke production volumes (thousands of tons)
|
4,122
|
|
4,175
|
|
4,269
|
|
|||||
|
Domestic Coke sales volumes (thousands of tons)
(3)
|
4,115
|
|
4,184
|
|
4,263
|
|
|||||
|
Domestic Coke Adjusted EBITDA per ton
(4)
|
$
|
51.06
|
|
$
|
59.25
|
|
$
|
57.05
|
|
||
|
Brazilian Coke production—operated facility (thousands of tons)
|
1,760
|
|
1,516
|
|
876
|
|
|||||
|
Coal Logistics Operating Data:
|
|||||||||||
|
Tons handled (thousands of tons)
|
18,864
|
|
19,037
|
|
3,785
|
|
|||||
|
Pay tons (thousands of tons)
(5)
|
1,135
|
|
—
|
|
—
|
|
|||||
|
(1)
|
See definition of Adjusted EBITDA and reconciliation to the most comparable GAAP measures at the end of this Item.
|
|
(2)
|
Legacy costs, net include costs associated with former mining employee-related liabilities prior to the implementation of our current contractor mining business, net of certain royalty revenues. See details of these legacy items below.
|
|
Years Ended December 31,
|
|||||||||||
|
2015
|
2014
|
2013
|
|||||||||
|
(Dollars in millions)
|
|||||||||||
|
Black lung (expense) benefit
|
$
|
(9.8
|
)
|
$
|
(14.3
|
)
|
$
|
0.3
|
|
||
|
Postretirement benefit plan benefit
|
3.6
|
|
3.7
|
|
1.0
|
|
|||||
|
Defined benefit plan (expense) benefit
|
(13.1
|
)
|
(0.2
|
)
|
0.1
|
|
|||||
|
Workers compensation expense
|
(2.3
|
)
|
(4.6
|
)
|
(2.0
|
)
|
|||||
|
Other
|
(0.4
|
)
|
0.7
|
|
0.6
|
|
|||||
|
Total legacy costs, net
|
$
|
(22.0
|
)
|
$
|
(14.7
|
)
|
$
|
—
|
|
||
|
(3)
|
Excludes 22 thousand tons of consigned coke sales in the year ended December 31, 2013.
|
|
(4)
|
Reflects Domestic Coke Adjusted EBITDA divided by Domestic Coke sales volumes.
|
|
(5)
|
Represents tons the Company did not handle, but received payment for under the long-term, take-or-pay contracts.
|
52
Analysis of Segment Results
Year Ended December 31,
2015
compared to Year Ended December 31,
2014
Domestic Coke
Sales and Other Operating Revenue
Sales and other operating revenue
decreased
$144.7 million
, or
10.4 percent
, to
$1,243.6 million
in
2015
compared to
$1,388.3 million
in
2014
. The decrease was mainly attributable to the pass-through of lower coal prices, which decreased revenues $91.2 million. Lower sales volumes of
69 thousand
tons decreased revenues $22.8 million. The remaining decrease of $30.7 million was primarily the result of lower reimbursement of operating and maintenance costs, driven by the change in Indiana Harbor's cost recovery mechanism in 2015 from an annually negotiated budget amount with a cap for certain expenses and cost sharing of any differences from budgeted amounts to a fixed recovery per ton.
Adjusted EBITDA
Domestic Coke Adjusted EBITDA decreased
$37.8 million
, or
15.2 percent
, to
$210.1 million
in
2015
compared to
$247.9 million
in
2014
. The change in Indiana Harbor's cost recovery mechanism, as discussed above, decreased Adjusted EBITDA $30.7 million over the same prior year period. This decrease was partially offset by lower operating and maintenance spending at Indiana Harbor of $12.4 million. Lower volumes and the impact of the reorganization of Haverhill Chemicals decreased Adjusted EBITDA $6.1 million and $6.4 million, respectively, in 2015 as compared to 2014. The remaining decrease of $7.0 million primarily relates to lower coal-to-coke yields resulting from lower coal prices and higher coal moistures.
Depreciation and amortization expense, which was not included in segment profitability increased slightly to
$81.6 million
in
2015
from
$81.3 million
in
2014
. This increase was driven by depreciation expense in the current period on certain environmental remediation assets placed into service at our Haverhill facility near the end of 2014, mostly offset by higher additional depreciation in the prior year. Additional depreciation associated with revisions to the useful lives of certain assets at our cokemaking facilities was
$10.2 million
and
$15.6 million
, or
$0.16
and
$0.23
per common share, in
2015
and
2014
, respectively.
Brazil Coke
Sales and Other Operating Revenue
Sales and other operating revenue
decreased
$3.0 million
, or
8.1 percent
, to
$34.0 million
in
2015
compared to
$37.0 million
in
2014
. The decrease was primarily a result of unfavorable translation adjustments, which decreased revenues by $8.4 million. This decrease was partially offset by higher volumes of 244 thousand over the prior year, which increased revenues $4.1 million. The remaining increase of $1.3 million was primarily related to production bonuses received from our customer for meeting certain volume targets during 2015.
Adjusted EBITDA
Adjusted EBITDA in the Brazil Coke segment
increased
$3.5 million
, or
18.5 percent
, to
$22.4 million
in
2015
compared to
$18.9 million
in
2014
. The increase was driven by higher volumes of
244 thousand
tons, which increased Adjusted EBITDA $2.1 million. The remaining increase of $1.4 million was primarily related to the production bonuses discussed above.
Depreciation expense, which was not included in segment profitability, was insignificant in both periods.
India Coke
We recognized our 49 percent share of earnings in VISA SunCoke on a one-month lag. Our share of Adjusted EBITDA was a loss of
$1.9 million
in 2015 compared to a loss of
$3.1 million
in 2014. Performance in both periods continued to be affected by a weak coke pricing environment due to increased Chinese coke imports. Additionally, during the third quarter of 2015, we impaired our investment balance to zero, and consequently, we no longer include the results of our share of VISA SunCoke in our consolidated financial statements. As such, periods are not comparable as we did not record our share of Adjusted EBITDA from the joint venture in the fourth quarter of 2015. In accordance with GAAP, our share of future earnings of the joint venture will only be included in our results once the cumulative investment balance is no longer negative. For further discussion see
Note 6
to the consolidated financial statements.
53
Coal Logistics
Sales and Other Operating Revenue
Inclusive of intersegment sales, sales and other operating revenues increased $26.2 million to $81.2 million in 2015 from $55.0 in 2014. The increase was due to additional revenue from our newly acquired CMT business of $28.6 million. Excluding CMT, more favorable pricing on higher volumes of mixing service increased revenues $3.3 million, which was more than offset by decreases of $5.7 million primarily related to lower overall volumes.
Adjusted EBITDA
Coal Logistics Adjusted EBITDA increased $24.1 million to $38.4 million in 2015 compared to $14.3 million in 2014. The acquisition of CMT provided additional adjusted EBITDA of $21.0 million on 2.2 million tons handled as well as payment on take-of-pay contracts for a
1.1 million
ton shortfall. Excluding CMT, higher margins caused by a shift in sales mix and lower spending increased Adjusted EBITDA by $3.8 million and $1.5 million, respectively. These increases were partly offset by decreases of $2.2 million, primarily driven by lower overall volume.
Depreciation and amortization expense, which was not included in segment profitability, was $14.0 million during
2015
compared to
$7.6 million
in
2014
. The increase was primarily due to depreciation and amortization expense associated with CMT.
Coal Mining
Sales and Other Operating Income
Inclusive of intersegment sales, sales and operating revenues decreased $51.3 million to $113.9 million in 2015, compared to $165.2 million in 2014. The decrease was primarily driven by lower volumes of 344 thousand tons, which decreased revenues $34.4 million. The remaining decrease is primarily the result of an $11 per ton decrease in price driven by depressed market conditions.
Adjusted EBITDA
Adjusted EBITDA decreased $2
.9 million to a loss of $18.9 million in 2015, compared to a loss of $16.0 million in 2014, which included a favorable $4.5 million fair value adjustment to the HKCC contingent consideration arrangement. The impact of lower pricing discussed above further decreased Adjusted EBITDA $13.3 million in 2015. These decreases were partially offset by the benefit of lower production volumes during the current period, which increased Adjusted EBITDA $13.1 million. The remaining increase of $1.8 million, primarily relates to the absence of allocation of corporate costs, which are no longer allocated in our current contract mining model and were suspended beginning in the third quarter of 2014 in conjunction with our previous held for sale presentation.
Depreciation
expense, which was not included in segment profitability, decreased $3.8 million to $10.1 million in 2015, compared to $13.9 in 2014. Depreciation decreased in 2015 due to lower asset net book value as a result of the 2014 coal impairments. This was partially offset by additional depreciation of
$4.9 million
, or
$0.08
per common share, in the current year period relating to the decommissioning of our coal preparation plant.
Corporate and Other
Corporate expenses
increased
$13.0 million
, or
25.3 percent
, to
$64.3 million
in
2015
from
$51.3 million
in
2014
. The increase was primarily due to $7.3 million in higher legacy costs, driven by $12.6 million in non-cash pension plan termination charges during 2015, partially offset by a decrease in black lung and workers compensation charges as compared to the prior year period. Excluding legacy costs, the remaining increase in corporate expenses of $5.7 million related to higher legal and severance expenses of $4.5 million and $2.7 million, respectively, as well as higher acquisition and business development costs of $2.6 million compared to 2014. These higher costs in 2015 were offset primarily by lower employee-related costs, including stock compensation expense, of $4.1 million.
Depreciation expense, which was not included in segment profitability, was relatively flat at
$2.8 million
and
$3.0 million
in 2015 and 2014, respectively.
Year Ended December 31,
2014
compared to Year Ended December 31,
2013
Domestic Coke
Sales and Other Operating Revenue
Sales and other operating revenue decreased $140.4 million, or 9.2 percent, to $1,388.3 million in 2014 compared to $1,528.7 million in 2013. The decrease was mainly attributable to the pass-through of lower coal prices, which contributed $149.8 million to the decrease. Operational inefficiencies at Indiana Harbor resulted in a decrease in volume of 60 thousand tons, lowering revenues by $20.1 million, partially offset by additional revenues of $7.5 million resulting from an increased
54
fixed fee per ton of coke produced per the ten-year extension of its existing coke sales agreement, effective October 1, 2013. Lower volumes at Haverhill, due primarily to severe winter weather and planned outages, decreased revenues by $14.4 million. Sales also increased due to higher reimbursable operating and maintenance costs of $23.9 million and the absence of $7.2 million in sales discounts. The remaining increase of $5.3 million was primarily related to an additional 19 thousand tons sold at our remaining cokemaking facilities.
Adjusted EBITDA
Domestic Coke Adjusted EBITDA increased $4.7 million, or 1.9 percent, to $247.9 million in 2014 compared to $243.2 million in 2013. The new Indiana Harbor coke sales agreement resulted in additional Adjusted EBITDA of $7.5 million compared to 2013. Also favorably impacting results in 2014 was the absence of a $2.5 million quality claim recorded in 2013. These increases were offset by operational inefficiencies at Indiana Harbor, caused by weather and the refurbishment project in the first quarter of 2014, which lowered Adjusted EBITDA by $3.5 million. Lower volumes at Haverhill, due primarily to severe winter weather, decreased Adjusted EBITDA by $5.4 million. Our remaining domestic cokemaking facilities operated at or above 100 percent utilization and sold an additional 19 thousand tons, which contributed approximately $1.6 million to Adjusted EBITDA. Lower coal-to-coke yields, caused by the impact of severe winter weather, and a lower operating and maintenance cost reimbursement rate decreased Adjusted EBITDA by $3.0 million and $2.0 million, respectively. The remaining increase of $7.0 million primarily related to the absence of coke quality issues in 2014 and lower corporate allocation in 2014.
Depreciation and amortization expense, which was not included in segment profitability, increased $13.2 million, to $81.3 million in 2014 from $68.1 million in 2013, primarily due to capital expenditures related to the Indiana Harbor refurbishment as well as additional depreciation taken at our Indiana Harbor facility previously discussed.
Brazil Coke
Sales and Other Operating Revenue
Sales and other operating revenue increased $1.6 million, or 4.5 percent, to $37.0 million in 2014 compared to $35.4 million in 2013, driven primarily by an increase in volume of 640 thousand tons. The increase in volume was offset by higher pricing in 2013 due to the minimum guarantee fee arrangement that we have with our customer, as the customer requested lower production volumes in 2013.
Adjusted EBITDA
Adjusted EBITDA in the Brazil Coke segment increased $2.8 million, or 17.4 percent, to $18.9 million in 2014 compared to $16.1 million in 2013. The increase is primarily due to an increase in volume of 640 thousand tons and foreign currency impacts. Adjusted EBITDA in 2013 was also impacted by the minimum guarantee fee arrangement.
Depreciation expense, which was not included in segment profitability, was insignificant in both periods.
India Coke
We recognize our share of earnings in VISA SunCoke on a one-month lag and began recognizing such earnings in the second quarter of 2013. Our 49 percent share of Adjusted EBITDA in 2014 was a loss of $3.1 million compared to income of $0.9 million in 2013. Performance in 2014 was affected by a weak coke pricing environment due to increased Chinese coke imports, partially offset by lower foreign currency losses on imported coal purchases of $0.3 million in 2014 compared to $1.5 million in 2013.
Coal Logistics
Sales and Other Operating Revenue
We entered into the coal logistics business with two acquisitions in 2013. Inclusive of intersegment sales, sales and other operating revenue increased $41.4 million, to $55.0 million in 2014 compared to $13.6 million in 2013. Comparison between periods was impacted by the timing of acquisitions.
Adjusted EBITDA
Coal Logistics Adjusted EBITDA was $14.3 million in 2014 compared to $4.7 million in 2013. Comparison between periods was impacted by the timing of acquisitions.
Depreciation and amortization expense, which was not included in segment profitability, was $7.6 million during 2014 compared to $1.8 million in 2013 and was also impacted by the timing of acquisitions.
55
Coal Mining
Sales and Other Operating Income
Inclusive of intersegment sales, sales and operating revenues decreased $32.8 million to $165.2 million in 2014 compared to $198.0 million in 2013. The decrease in revenue was primarily the result of an $18 per ton decline in price driven by depressed market conditions, which lowered revenues by $28.6 million. The remaining decrease mainly relates to lower volumes of 57 thousand tons.
Adjusted EBITDA
Adjusted EBITDA decreased $0.9 million, to a loss of $16.0 million in 2014 compared to a loss of $15.1 in 2013. The decrease in Adjusted EBITDA was primarily driven by the unfavorable impact in average coal sales price of $28.6 million as discussed above, partially offset by lower cash costs of approximately $6 per ton as well as a favorable $4.5 million fair value adjustment to the HKCC contingent consideration arrangement in 2014.
Depreciation expense, which was not included in segment profitability, decreased $9.3 million, or 40.1 percent, to $13.9 million for 2014 compared to $23.2 in 2013. As a result of our previous held for sale presentation, depreciation for most of our coal mining assets was suspended beginning in July 2014.
Corporate and Other
Corporate and other expenses increased $16.6 million to $51.3 million for 2014, compared to $34.7 million in 2013. The increase was primarily driven by an increase black lung charges incurred in 2014 of $14.3 million. Higher stock compensation expense and severance costs of $2.1 million and $1.4, respectively, further increased Corporate and other expenses in 2014. These increases were partially offset by lower bonus expense as well as a reduction in salaries in 2014.
Depreciation and amortization expense, which was not included in segment profitability, increased $0.5 million, to $3.0 million compared to $2.5 million in 2013.
Liquidity and Capital Resources
Our primary sources of liquidity are cash on hand, cash from operations and borrowings under debt financing arrangements. As of
December 31, 2015
, we had
$123.4 million
of cash and cash equivalents and
$154.8 million
of borrowing availability under our credit facilities. We believe these sources will be sufficient to fund our short and long-term planned operations, including capital expenditures and future stock repurchases and/or dividend payments.
We may be required to access the capital markets for funding related to the maturities of our long-term borrowings beginning in 2019. In addition, we may from time to time seek to retire or repurchase our outstanding debt. Such repurchases will depend on prevailing market conditions, our liquidity requirements, contractual restrictions and other factors. The amounts involved may be material.
During 2015, the Company and the Partnership returned $119.8 million to external investors through either dividends, distributions or equity repurchases. The Company paid dividends of
$28.0 million
and repurchased
2.5 million
shares of our common stock at a cost of
$35.6 million
in the open market, for an average share price of
$14.25
. Approximately
$39.4 million
remains available under the Company's authorized share repurchase program. Additionally, the Partnership paid cash distributions of
$43.3 million
to its public unitholders and repurchased
0.9 million
of its common units at a cost of
$12.8 million
in the open market, for an average price of
$14.91
per unit. Approximately
$37.2 million
remains available under the Partnership's authorized unit repurchase program.
In order to maintain flexibility and liquidity, our Board of Directors has suspended the Company's dividend. Any future dividends will be determined by the Company's Board of Directors on a quarterly basis and will depend on business conditions, our financial condition, earnings, liquidity and capital requirements, covenants in our debt agreements and other factors.
On January 25, 2016, the Partnership's Board of Directors declared a quarterly cash distribution of $0.5940 per unit. This distribution will be paid on March 1, 2016 to unitholders of record on February 15, 2016. The distribution is expected to include
$12.3 million
to the Partnership's public unitholders. The Board of Directors' decision to hold quarterly unitholder distributions flat at $0.5940 per unit is part of its capital allocation strategy to shift excess distributable cash flow towards paying down the Partnership’s debt. The Partnership and its Board of Directors will continue to evaluate its capital allocation and distribution priorities on a quarterly basis.
During 2016, we will focus on shifting our capital allocation priorities towards de-levering the Partnership's balance sheet and maintaining a solid liquidity position. Each quarter, the Company will evaluate various alternatives, as previously discussed in "Our Focus and Outlook in 2016," and expects the Partnership to generate excess liquidity of at least $60 million to meaningfully de-lever the Partnership's balance sheet in 2016.
56
During February 2016, the Partnership continued de-levering its balance sheet and redeemed
$22.0 million
of outstanding Partnership Notes for
$12.7 million
on the open market.
Subsequent to December 31, 2015, the Company issued a
$5.0 million
letter of credit as collateral to one of its surety providers in connection with black lung and other financial guarantee obligations. Also, the Company issued an
$18.0 million
letter of credit as collateral to surety providers in connection with certain contractual obligations, including certain reclamation obligations primarily related to our coal mining operations. These letters of credit lower our borrowing availability under our credit facilities.
On February 3, 2016, Moody's Corporation ("Moody's") lowered its corporate credit rating on SunCoke Energy, Inc. to B2 from Ba3. At the same time, Moody's ceased providing a corporate credit rating at the Partnership level and now assesses the Company and the Partnership on a consolidated basis. The downgrade reflects the continuing headwinds in the steel industry, as steel makers continue to idle operations and cut back production.
The Company and the Partnership are subject to certain debt covenants that, among other things, limit the Company's and Partnership’s ability and the ability of certain of the Company's and the Partnership’s subsidiaries to (i) incur indebtedness, (ii) pay dividends or make other distributions, (iii) prepay, redeem or repurchase certain debt, (iv) make loans and investments, (v) sell assets, (vi) incur liens, (vii) enter into transactions with affiliates and (viii) consolidate or merge. These covenants are subject to a number of exceptions and qualifications set forth in the respective agreements. Additionally, under the terms of the Credit Agreement, the Company is subject to a maximum consolidated leverage ratio of
3.25
to
1.00
,
calculated by dividing total debt by EBITDA as defined by the Credit Agreement, and a minimum consolidated interest coverage ratio of
2.75
to
1.00
, calculated by dividing EBITDA by interest expense as defined by the Credit Agreement. Under the terms of the Partnership Revolver, the Partnership is subject to a maximum consolidated leverage ratio of
4.50
to
1.00
,
calculated by dividing total debt by EBITDA as defined by the Partnership Revolver, and a minimum consolidated interest coverage ratio of
2.50
to
1.00
,
calculated by dividing EBITDA by interest expense as defined by the Partnership Revolver. The Partnership Term Loan has the same covenants as the previously discussed Partnership Revolver covenants. At
December 31, 2015
, the Company and the Partnership were in compliance with all applicable debt covenants contained in the Credit Agreement and the Partnership Revolver.
Under the terms of the Promissory Agreement, Raven Energy LLC, a wholly-owned subsidiary of the Partnership, is subject to a maximum leverage ratio of
5.00
:
1.00
for any fiscal quarter ending prior to August 12, 2018, calculated by dividing total debt by EBITDA as defined by the Promissory Agreement. For any fiscal quarter ending on or after August 12, 2018 the maximum leverage ratio is
4.50
:
1.00
.
Additionally in order to make restricted payments, Raven Energy LLC is subject to a fixed charge ratio of greater than
1.00
:
1.00
,
calculated by dividing EBITDA by fixed charges as defined by the Promissory Agreement.
If we fail to perform our obligations under these and other covenants, the lenders' credit commitment could be terminated and any outstanding borrowings, together with accrued interest, under the Revolving Facility, Partnership Revolver, Partnership Term Loan and Promissory Note could be declared immediately due and payable. The Partnership has a cross-default provision that applies to our indebtedness having a principal amount in excess of $20 million. We do not anticipate any violation of these covenants nor do we anticipate that any of these covenants will restrict our operations or our ability to obtain additional financing.
The following table sets forth a summary of the net cash provided by (used in) operating, investing and financing activities for the years ended December 31,
2015
,
2014
and
2013
:
|
Years Ended December 31,
|
|||||||||||
|
2015
|
2014
|
2013
|
|||||||||
|
(Dollars in millions)
|
|||||||||||
|
Net cash provided by operating activities
|
$
|
141.1
|
|
$
|
112.3
|
|
$
|
151.3
|
|
||
|
Net cash used in investing activities
|
(285.2
|
)
|
(125.2
|
)
|
(326.6
|
)
|
|||||
|
Net cash provided by (used in) financing activities
|
128.5
|
|
(81.7
|
)
|
169.7
|
|
|||||
|
Net decrease in cash and cash equivalents
|
$
|
(15.6
|
)
|
$
|
(94.6
|
)
|
$
|
(5.6
|
)
|
||
Cash Provided by Operating Activities
Net cash provided by operating activities increased by
$28.8 million
to $
141.1 million
for the year ended December 31,
2015
as compared to the prior year. The increase in operating cash flow is the result of lower inventory due to the current year wind down of a strategic build in inventory levels from the second half of 2014 and lower coal prices. This increase was partially offset by severance payments of
$11.5 million
during 2015 and decreased accounts payables due to the timing of payments.
57
Net cash provided by operating activities decreased by
$39.0 million
to
$112.3 million
for the year ended December 31,
2014
as compared to 2013. The decrease in operating cash flow is the result of a strategic build in inventory levels in the second half of 2014. Further decreasing operating cash flow were lower accounts payable balances resulting from the timing of purchases and payments as compared to prior period. These decreases were partially offset by lower accounts receivables related to an extension of customer terms at the end of 2013.
Cash Used in Investing Activities
Cash used in investing activities increased
$160.0 million
to
$285.2 million
for the year ended December 31,
2015
as compared to the prior year due to the acquisition of CMT resulting in a cash payment of
$191.7 million
and the restriction of an additional
$17.7 million
of cash withheld to fund the completion of expansion capital improvements. The
$17.7 million
of restricted cash is net of capital expenditures on the project since the acquisition and is included in restricted cash on the Consolidated Balance Sheets. The increase is partially offset by higher capital expenditures related to the Indiana Harbor refurbishment and environmental remediation project at Haverhill in the prior year.
Cash used in investing activities decreased
$201.4 million
to
$125.2 million
for the year ended December 31,
2014
as compared to 2013. The 2013 investing activities include expenditures of
$67.7 million
for our investment in the India joint venture, $28.6 million for the acquisition of Lake Terminal and $84.7 million for the acquisition of KRT. Capital expenditures also decreased by $20.4 million, primarily due to lower spending on the Indiana Harbor refurbishment in 2014 partially offset by higher spending on the environmental refurbishment project at Haverhill in 2014 as compared to 2013, related to the timing of spending on these projects.
Cash Provided by (Used in) Financing Activities
For the year ended December 31,
2015
, net cash provided by financing activities was
$128.5 million
compared to net cash used in financing activities of
$81.7 million
for the year ended December 31,
2014
.
In 2015, the Partnership received gross proceeds of
$260.8 million
from the issuance of Partnership notes and from the new Partnership term loan. Net proceeds of $182.0 million were received from draws on the Partnership Revolver during 2015 to fund the CMT acquisition. The Company received proceeds of
$60.4 million
from their revolving facility to redeem senior notes. These cash inflows were offset by the repayment of
$248.1 million
in long-term debt. The repayment of long-term debt consists of
$212.2 million
to repay the Company's senior notes, including principal and redemption premium,
$35.3 million
of the Partnership's notes and $0.6 million of the Partnership's promissory note.
During 2015, the Company had share repurchases of
$35.7 million
, dividend payments of $28.0 million and debt issuance cost payments of
$5.7 million
.
The Partnership paid
$12.8 million
to repurchase units under the unit repurchase program and paid quarterly cash distributions of
$43.3 million
to public unitholders of the Partnership.
For the year ended December 31,
2014
, net cash used in continuing financing activities was
$81.7 million
compared to net cash provided by financing activities of
$169.7 million
for the year ended December 31,
2013
. During 2014, in connection with the Haverhill and Middletown Dropdown transaction, we received
$90.5 million
from the issuance of common units and
$268.1 million
from issuance of Partnership Notes, offset by repayment of
$276.5 million
of senior notes, debt issuance costs of
$5.8 million
and a $40.0 million net pay down the Partnership Revolver. During 2014, we also had share repurchases of
$85.1 million
, cash distributions of
$32.3 million
to the Partnership's public unitholders and dividend payments of $3.8 million, slightly offset by cash proceeds of $3.2 million primarily related to the exercise of stock options.
Capital Requirements and Expenditures
Our operations are capital intensive, requiring significant investment to upgrade or enhance existing operations and to meet environmental and operational regulations. The level of future capital expenditures will depend on various factors, including market conditions and customer requirements, and may differ from current or anticipated levels. Material changes in capital expenditure levels may impact financial results, including but not limited to the amount of depreciation, interest expense and repair and maintenance expense.
Our capital requirements have consisted, and are expected to consist, primarily of:
|
•
|
Ongoing capital expenditures required to maintain equipment reliability, the integrity and safety of our coke ovens and steam generators and to comply with environmental regulations. Ongoing capital expenditures are made to replace partially or fully depreciated assets in order to maintain the existing operating capacity of the assets and/or to extend their useful lives and also include new equipment that improves the efficiency, reliability or effectiveness of existing assets. Ongoing capital expenditures do not include normal repairs and maintenance expenses, which are expensed as incurred;
|
|
•
|
Environmental remediation project expenditures required to implement design changes to ensure that our existing facilities operate in accordance with existing environmental permits; and
|
58
|
•
|
Expansion capital expenditures to acquire and/or construct complementary assets to grow our business and to expand existing facilities as well as capital expenditures made to enable the renewal of a coke sales agreement and on which we expect to earn a reasonable return.
|
The following table summarizes ongoing, environmental remediation project and expansion capital expenditures:
|
Years Ended December 31,
|
|||||||||||
|
2015
|
2014
|
2013
|
|||||||||
|
(Dollars in millions)
|
|||||||||||
|
Ongoing capital
|
$
|
45.9
|
|
$
|
50.6
|
|
$
|
51.5
|
|
||
|
Environmental remediation project
(1)
|
20.9
|
|
46.4
|
|
27.9
|
|
|||||
|
Expansion capital
(2)
|
|||||||||||
|
Indiana Harbor
|
2.4
|
|
24.2
|
|
66.2
|
|
|||||
|
CMT
(3)
|
4.6
|
|
—
|
|
—
|
|
|||||
|
Other capital expansion
|
2.0
|
|
4.0
|
|
—
|
|
|||||
|
Total expansion capital
|
9.0
|
|
28.2
|
|
66.2
|
|
|||||
|
Total capital expenditures
|
$
|
75.8
|
|
$
|
125.2
|
|
$
|
145.6
|
|
||
|
(1)
|
Includes
$2.9 million
,
$3.2 million
and
$1.0 million
of interest capitalized in connection with the environmental remediation project at Haverhill for the years ended December 31, 2015, 2014 and 2013, respectively.
|
|
(2)
|
Excludes the investment in VISA SunCoke and the acquisitions of Lake Terminal, KRT, and CMT.
|
|
(3)
|
Includes capital expenditures of $3.8 million for the ship loader and expansion project funded with cash withheld in conjunction with the acquisition of CMT. This also includes
$0.8 million
of interest capitalized in connection with these projects.
|
In 2016, we expect lower ongoing capital spending across the entire fleet and will focus our efforts on projects that are geared toward asset care and increasing workforce safety. Additionally, we have shifted the timing of the environmental remediation project at Granite City and will begin the work in 2017.
In 2016, excluding pre-funded capital projects at CMT, we expect our capital expenditures to be approximately $45 million of which is comprised of the following:
|
•
|
Total ongoing capital expenditures of approximately $38 million, of which $15 million will be spent at the Partnership;
|
|
•
|
Total capital expenditures on environmental remediation projects of approximately $3 million, all of which will be spent at the Partnership and was funded with a portion of the proceeds of the Partnership Offering and subsequent asset dropdowns; and
|
|
•
|
Total expansion capital of approximately $4 million.
|
|
•
|
We expect that capital expenditures will remain at this level in 2017 and 2018.
|
In total, we anticipate spending a total of approximately
$130 million
in environmental remediation projects to enhance the environmental performance at our Haverhill and Granite City cokemaking operations. We have spent approximately
$93 million
related to these projects since 2012. The remaining capital is expected to be spent through the first quarter of
2019
.
A portion of the proceeds from the Partnership Offering, the Haverhill and Middletown Dropdown and the
Granite City Dropdown
are being used to fund
$119 million
of these environmental remediation projects.
59
Contractual Obligations
The following table summarizes our significant contractual obligations as of
December 31, 2015
:
|
Payment Due Dates
|
|||||||||||||||||||
|
Total
|
2016
|
2017-2018
|
2019-2020
|
Thereafter
|
|||||||||||||||
|
(Dollars in millions)
|
|||||||||||||||||||
|
Total Debt:
(1)
|
|||||||||||||||||||
|
Principal
|
$
|
1,003.8
|
|
$
|
1.1
|
|
$
|
73.4
|
|
$
|
842.8
|
|
$
|
86.5
|
|
||||
|
Interest
|
238.0
|
|
56.5
|
|
104.2
|
|
74.7
|
|
2.6
|
|
|||||||||
|
Operating leases
(2)
|
12.8
|
|
4.0
|
|
4.3
|
|
2.5
|
|
2.0
|
|
|||||||||
|
Purchase obligations:
|
|
|
|||||||||||||||||
|
Coal
|
272.2
|
|
272.2
|
|
—
|
|
—
|
|
—
|
|
|||||||||
|
Transportation and coal handling
(3)
|
276.5
|
|
41.4
|
|
58.0
|
|
61.3
|
|
115.8
|
|
|||||||||
|
Other
(4)
|
14.6
|
|
3.9
|
|
3.0
|
|
2.6
|
|
5.1
|
|
|||||||||
|
Total
|
$
|
1,817.9
|
|
|
$
|
379.1
|
|
|
$
|
242.9
|
|
|
$
|
983.9
|
|
|
$
|
212.0
|
|
|
(1)
|
At December 31, 2015, debt consists of $44.6 million of Company notes, $60.4 million of Company revolver, $552.5 million of Partnership notes, $114.3 million of Partnership promissory note, $182.0 million of Partnership revolver and $50.0 million of Partnership term loan.
|
|
(2)
|
Our operating leases include leases for land, locomotives, office equipment and other property and equipment. Operating leases include all operating leases that have initial noncancelable terms in excess of one year.
|
|
(3)
|
Transportation and coal handling services consist primarily of railroad and terminal services attributable to delivery and handling of coal purchases and coke sales. Long-term commitments generally relate to locations for which limited transportation options exist and match the length of the related coke sales agreement.
|
|
(4)
|
Primarily represents open purchase orders for materials, supplies and services.
|
A purchase obligation is an enforceable and legally binding agreement to purchase goods or services that specifies significant terms, including: fixed or minimum quantities to be purchased; fixed, minimum or variable price provisions; and the approximate timing of the transaction. Our principal purchase obligations in the ordinary course of business consist of coal and transportation and distribution services, including railroad services. We also have contractual obligations supporting financing arrangements of third-parties, contracts to acquire or construct properties, plants and equipment, and other contractual obligations, primarily related to services and materials. Most of our coal purchase obligations are based on fixed prices. These purchase obligations generally include fixed or minimum volume requirements. Transportation and distribution obligations also typically include required minimum volume commitments. The purchase obligation amounts in the table above are based on the minimum quantities or services to be purchased at estimated prices to be paid based on current market conditions. Accordingly, the actual amounts may vary significantly from the estimates included in the table.
Off-Balance Sheet Arrangements
Other than the arrangements described in
Note 18
to the consolidated financial statements, the Company has not entered into any transactions, agreements or other contractual arrangements that would result in material off-balance sheet liabilities.
Impact of Inflation
Although the impact of inflation has slowed in recent years, it is still a factor in the U.S. economy and may increase the cost to acquire or replace properties, plants, and equipment and may increase the costs of labor and supplies. To the extent permitted by competition, regulation and existing agreements, we have generally passed along increased costs to our customers in the form of higher fees and we expect to continue this practice.
Critical Accounting Policies
A summary of our significant accounting policies is included in Note 2 to the consolidated financial statements. Our management believes that the application of these policies on a consistent basis enables us to provide the users of the financial statements with useful and reliable information about our operating results and financial condition. The preparation of our consolidated financial statements requires management to make estimates and assumptions that affect the reported amounts of assets, liabilities, revenues and expenses, and the disclosures of contingent assets and liabilities. Significant items that are subject to such estimates and assumptions consist of: (1) business combinations; (2) properties, plants and equipment; (3)
60
accounting for impairment of goodwill, intangible assets, long-lived assets and equity method investments; (4) retirement benefit liabilities; and (5) black lung benefit obligations. Although our management bases its estimates on historical experience and various other assumptions that are believed to be reasonable under the circumstances, actual results may differ to some extent from the estimates on which our consolidated financial statements have been prepared at any point in time. Despite these inherent limitations, our management believes the “Management’s Discussion and Analysis of Financial Condition and Results of Operations” and consolidated financial statements provide a meaningful and fair perspective of our financial condition.
Business Combinations
On August 12, 2015, the Partnership completed the acquisition of a
100 percent
ownership interest in Raven Energy LLC, which owns CMT, for a total transaction value of
$403.1 million
. Assets acquired and liabilities assumed as part of a business acquisition are generally recorded at their fair value at the date of acquisition. The excess of purchase price over the fair value of assets acquired and liabilities assumed is recorded as goodwill. In determining the fair values of assets acquired and liabilities assumed, we make significant estimates and assumptions, particularly with respect to long-lived tangible and intangible assets. Critical estimates used in valuing tangible and intangible assets include, but are not limited to, future expected cash flows, discount rates, market prices and asset lives. Although our estimates of fair value are based upon assumptions believed to be reasonable, actual results may differ.
See further discussion of this analysis in
Note 3
to the consolidated financial statements for more information related to our acquisitions.
Properties, Plants and Equipment
The cost of plants and equipment is generally depreciated on a straight-line basis over the estimated useful lives of the assets. Useful lives of assets are based on historical experience and are adjusted when changes in the expected physical life of the asset, its planned use, technological advances, or other factors show that a different life would be more appropriate. Changes in useful lives that do not result in the impairment of an asset are recognized prospectively.
We revised the estimated useful lives of certain assets at our domestic cokemaking facilities and recorded additional depreciation of
$10.2 million
,
$15.6 million
and
$9.5 million
, or
$0.16
,
$0.23
and
$0.14
per common share, during
2015
,
2014
and
2013
, respectively.
Additionally, in 2014, the Company revised the estimated useful lives of certain coal preparation plant assets, which resulted in additional depreciation in our Coal Mining segment of
$4.9 million
and
$1.0 million
, or
$0.08
and
$0.01
per common share, during
2015
and
2014
, respectively.
Normal repairs and maintenance costs are expensed as incurred. Repairs and maintenance costs, which are generally reimbursed as part of the pass-through nature of our contracts, were
$128.2 million
,
$141.7 million
and
$122.2 million
for the years ended December 31,
2015
,
2014
and
2013
, respectively. Direct costs, such as outside labor, materials, internal payroll and benefit costs, incurred as a part of capital projects that extend an asset's useful life, increase its productivity or add production capacity at our facilities are capitalized; indirect costs are not capitalized.
Accounting for Impairment of Goodwill, Intangible Assets, Long-Lived Assets and Equity Method Investment
Goodwill, which represents the excess of the purchase price over the fair value of net assets acquired, is tested for impairment as of October 1 of each year, or when events occur or circumstances change that would, more likely than not, reduce the fair value of a reporting unit to below its carrying value. The Company had goodwill carrying amounts of
$71.1 million
and
$11.6 million
as of
December 31, 2015
and 2014, respectively. The analysis of potential goodwill impairment employs a two-step process. The first step involves the estimation of fair value of our reporting units. If step one indicates that impairment of goodwill potentially exists, the second step is performed to measure the amount of impairment, if any. Goodwill impairment exists when the estimated implied fair value of goodwill is less than its carrying value.
The Company performed its annual goodwill impairment test as of October 1, 2015, with no indication of impairment.
The Coal Logistics reporting unit has a goodwill carrying value of
$67.7 million
as of
December 31, 2015
.
During our annual goodwill impairment test performed as of October 1, we estimated fair value exceeded carrying value of the reporting unit by approximately 15 percent.
See further discussion of this analysis in
Note 12
to the consolidated financial statements.
In the prior year period, an impairment charge of
$6.0 million
was recorded to our Coal Mining business. There were no other impairments of goodwill or other intangible assets during the periods presented.
We have finite-lived intangible assets with net values of
$190.2 million
and
$10.4 million
as of
December 31, 2015
and 2014, respectively. Intangible assets are primarily comprised of customer contracts, customer relationships and permits. Intangible assets are amortized over their useful lives in a manner that reflects the pattern in which the economic benefit of the intangible asset is consumed. We test the carrying amount of our finite-lived intangible assets for recoverability whenever events or changes in circumstances indicate that the carrying amount of such assets may not be recoverable. This assessment employs a two-step approach. The first step is used to determine if a potential impairment exists while the second step measures the associated impairment loss, if any. An impairment loss is recognized if, in performing the impairment review, it is determined that the carrying amount of an asset or asset group exceeds the estimated undiscounted future cash flows expected
61
to result from the use of the asset or asset group and its eventual disposition. No triggering events occurred during the years presented.
Long-lived assets are reviewed for impairment whenever events or changes in circumstances indicate that the carrying amount of the assets may not be recoverable. Such events and circumstances include, among other factors: operating losses; unused capacity; market value declines; changes in the expected physical life of an asset; technological developments resulting in obsolescence; changes in demand for our products or in end-use goods manufactured by others utilizing our products as raw materials; changes in our business plans or those of our major customers, suppliers or other business partners; changes in competition and competitive practices; uncertainties associated with the U.S. and world economies; changes in the expected level of capital, operating or environmental remediation project expenditures; and changes in governmental regulations or actions.
A long-lived asset, or group of assets, is considered to be impaired when the undiscounted net cash flows expected to be generated by the asset are less than its carrying amount. Such estimated future cash flows are highly subjective and are based on numerous assumptions about future operations and market conditions. The impairment recognized is the amount by which the carrying amount exceeds the fair market value of the impaired asset, or group of assets. It is also difficult to precisely estimate fair market value because quoted market prices for our long-lived assets may not be readily available. Therefore, fair market value is generally based on the present values of estimated future cash flows using discount rates commensurate with the risks associated with the assets being reviewed for impairment.
During 2014, we recorded total impairment charges related to the Coal Mining business of
$150.3 million
, including both long-lived asset and goodwill impairment charges on our coal mining assets previously held for sale, which were stated at fair value less costs to sell.
Additionally, during
2015
and
2014
, we recorded other-than-temporary impairment charges on our investment in VISA SunCoke of
$19.4 million
and
$30.5 million
, respectively. These impairment charges were included in loss from equity method investment on the Consolidated Statement of Operations and brought our investment in VISA SunCoke to
zero
.
See further discussion in
Note 5
,
Note 6
and
Note 24
to the consolidated financial statements.
Cash flows at our Indiana Harbor facility were negative during 2015, driven by changes to our contracted reimbursement of operating and maintenance costs as well as volume shortfalls caused by operational inefficiencies. Based on these results and recent operational challenges, we performed an impairment test and concluded that our undiscounted cash flows were sufficient to recover our long-lived assets at Indiana Harbor. However, we continue to closely monitor our performance at Indiana Harbor, and if operational challenges continue or conditions deteriorate, our current conclusion as to recoverability of assets at that location could change.
Retirement Benefit Liabilities
We use actuarial assumptions to calculate other post-retirement benefit obligations and related costs. The discount rate is a critical assumption and is an important element of plan expense and liability measurement. Other assumptions involve demographic factors such as expected retirement age, mortality, employee turnover and health care cost trends. We evaluate these assumptions annually and make adjustments in accordance with changes in underlying market conditions or demographics. Changes in these assumptions may increase or decrease periodic benefit plan expense as well as the carrying value of benefit plan obligations.
Pension Benefit Liabilities
. During 2015, the plan purchased annuities using plan assets and satisfied the pension obligation. As a result of the pension termination, $12.6 million of unrecognized losses, which previously were recorded in accumulated other comprehensive loss on the Consolidated Balance Sheet, were recognized as expense in cost of products sold and operating expenses on the Consolidated Statements of Operations during 2015.
Other Post-Employment Benefit Liabilities
. We have obligations totaling
$34.8 million
in connection with postretirement welfare benefit plans that provide health care benefits for substantially all of our current retirees. The postretirement welfare benefit plans are unfunded and have historically been paid by us subject to deductibles and coinsurance that have been the responsibility of retirees. Medical benefits under these plans were also phased out or eliminated for most non-mining employees with less than ten years of service on January 1, 2011. Employer costs for all those still eligible for such benefits were capped. Effective January 1, 2013, we made modifications to our postretirement welfare benefit plan to reduce the costs associated with the way we administer retiree health care coverage for certain current and future retirees. We amended our postretirement welfare benefit plan to provide Medicare participants with retiree medical benefits through a private insurance exchange beginning January 1, 2013 using a company-funded subsidy varying based upon participant age at the end of each plan year. The age-based, company-funded subsidy is fixed and does not increase with health care cost inflation.
The principal assumptions that impact the determination of both expense and benefit obligations for our postretirement health care benefit plan are the discount rate and the health care cost trend rate. However, the impact of the health care trend rate has been greatly mitigated by the cap on our contributions.
62
We determine the discount rates for our other postretirement welfare benefit obligations on the measurement date by reference to annualized rates earned on high quality fixed income investments and yield-to-maturity analysis specific to each plans’ estimated future benefit payments. We developed health care cost trend rate assumptions based on historical cost data and an assessment of likely long-term trends.
Actuarial gains or losses are triggered by changes in assumptions or experience that differs from the original assumptions and, as permitted by existing accounting rules, are not required to be recognized currently in benefit expense. Rather, those gains or losses are deferred as part of accumulated other comprehensive income (loss) and amortized into expense over future periods. At
December 31, 2015
, the accumulated net actuarial loss and unrecognized prior service credits attributable to our postretirement benefit plans were
$10.6 million
and
$3.1 million
, respectively. The unrecognized prior service credits are primarily attributable to the phase down or elimination of retiree medical benefits described above. Most of the benefit of this liability reduction will be amortized into income through 2016.
The following table illustrates the sensitivity to a change in certain assumptions for postretirement plans, holding all other assumptions constant:
|
Change in Rate
|
Expense
(1)
|
Benefit
Obligations (1) |
||||||||
|
(Dollars in millions)
|
||||||||||
|
Postretirement welfare benefits:
|
||||||||||
|
Decrease in the discount rate
|
0.25
|
%
|
$
|
—
|
|
$
|
0.7
|
|
||
|
Increase in the annual health care cost trend rates
|
1.00
|
%
|
$
|
—
|
|
$
|
—
|
|
||
|
(1)
|
Expense and benefit obligation changes less than $0.1 million are not reflected in the table.
|
See
Note 14
to our consolidated financial statements for further discussion.
Black Lung Benefit Liabilities
We have obligations related to coal workers’ pneumoconiosis, or black lung, benefits to certain of our employees and former employees (and their dependents). Such benefits are provided for under Title IV of the Federal Coal Mine Health and Safety Act of 1969 and subsequent amendments, as well as for black lung benefits provided in the states of Virginia, Kentucky and West Virginia pursuant to workers’ compensation legislation. The Patient Protection and Affordable Care Act (“PPACA”), which was implemented in 2010, amended previous legislation related to coal workers’ black lung obligations. PPACA provides for the automatic extension of awarded lifetime benefits to surviving spouses and changes the legal criteria used to assess and award claims. We act as a self-insurer for both state and federal black lung benefits and adjust our liability each year based upon actuarial calculations of our expected future payments for these benefits.
Our independent actuaries annually calculate the actuarial present value of the estimated black lung liability based on assumptions regarding disability incidence, medical costs, mortality, death benefits, dependents and discount rates. The discount rate is determined based on a portfolio of high-quality corporate bonds with maturities that are consistent with the estimated duration of our black lung obligations. For the years ended December 31,
2015
,
2014
and
2013
, the discount rate used to calculate the period end liability was
3.90
,
3.65
and
4.65
percent, respectively. A 0.25 percent decrease in the discount rate would have increased
2015
coal workers’ black lung expense by $1.3 million.
The estimated liability was
$49.9 million
and
$43.9 million
at
December 31, 2015
and
2014
,
respectively, of which
$5.2 million
and
$3.8 million
was included in accrued liabilities on the Consolidated Balance Sheet.
In addition to changes in the discount rate and other assumptions, the estimated liability at
December 31, 2015
was impacted by a significant increase in the number of claims filed as well as the rate at which claims are awarded.
The Company recognized expense of
$9.8 million
and
$14.3 million
and income of
$0.3 million
during
2015
,
2014
,
and
2013
,
respectively.
The Company made payments related to black lung of
$3.8 million
,
$2.8 million
and
$2.2 million
during
2015
,
2014
, and
2013
, respectively.
Recent Accounting Standards
See
Note 2
to our consolidated financial statements.
Non-GAAP Financial Measures
In addition to the GAAP results provided in the Annual Report on Form 10-K, we have provided a non-GAAP financial measure, Adjusted EBITDA. Reconciliation from GAAP to the non-GAAP measurement is presented below.
Our management, as well as certain investors, uses this non-GAAP measure to analyze our current and expected future financial performance and liquidity. This measure is not in accordance with, or a substitute for, GAAP and may be different from, or inconsistent with, non-GAAP financial measures used by other companies.
63
Adjusted EBITDA represents earnings before interest, taxes, depreciation and amortization (“EBITDA”) adjusted for impairments, coal rationalization costs, sales discounts, Coal Logistics deferred revenue and interest, taxes, depreciation and amortization attributable to our equity method investment. Prior to the expiration of our nonconventional fuel tax credits in November 2013, Adjusted EBITDA included an add-back of sales discounts related to the sharing of these credits with customers. Any adjustments to these amounts subsequent to 2013 have been included in Adjusted EBITDA. Coal Logistics deferred revenue adjusts for differences between the timing of recognition of take-or-pay shortfalls into revenue for GAAP purposes versus the timing of payments from our customers. This adjustment aligns Adjusted EBITDA more closely with cash flow. Our Adjusted EBITDA also includes EBITDA attributable to our equity method investment. EBITDA and Adjusted EBITDA do not represent and should not be considered alternatives to net income or operating income under GAAP and may not be comparable to other similarly titled measures in other businesses.
Management believes Adjusted EBITDA is an important measure of the operating performance and liquidity of the Company's net assets and its ability to incur and service debt, fund capital expenditures and make distributions. Adjusted EBITDA provides useful information to investors because it highlights trends in our business that may not otherwise be apparent when relying solely on GAAP measures and because it eliminates items that have less bearing on our operating performance and liquidity. EBITDA and Adjusted EBITDA are not measures calculated in accordance with GAAP, and they should not be considered a substitute for net income, operating cash flow or any other measure of financial performance presented in accordance with GAAP. Set forth below is additional discussion of the limitations of Adjusted EBITDA as an analytical tool.
Limitations.
Other companies may calculate Adjusted EBITDA differently than we do, limiting its usefulness as a comparative measure. Adjusted EBITDA also has limitations as an analytical tool and should not be considered in isolation or as a substitute for an analysis of our results as reported under GAAP. Some of these limitations include that Adjusted EBITDA:
|
•
|
does not reflect our cash expenditures, or future requirements, for capital expenditures or contractual commitments;
|
|
•
|
does not reflect items such as depreciation and amortization;
|
|
•
|
does not reflect changes in, or cash requirement for, working capital needs;
|
|
•
|
does not reflect our interest expense, or the cash requirements necessary to service interest on or principal payments of our debt;
|
|
•
|
does not reflect certain other non-cash income and expenses;
|
|
•
|
excludes income taxes that may represent a reduction in available cash; and
|
|
•
|
includes net income attributable to noncontrolling interests.
|
64
We explain Adjusted EBITDA and reconcile this non-GAAP financial measure to our net income and operating cash flow, which are its most directly comparable financial measure calculated and presented in accordance with GAAP. Below is a reconciliation of Adjusted EBITDA to its closest GAAP measures:
|
|
Years Ended December 31,
|
||||||||||
|
|
2015
|
2014
|
2013
|
||||||||
|
|
(Dollars in millions)
|
||||||||||
|
Adjusted EBITDA attributable to SunCoke Energy, Inc.
|
$
|
104.6
|
|
$
|
150.0
|
|
$
|
173.9
|
|
||
|
Add: Adjusted EBITDA attributable to noncontrolling interest
(1)
|
81.2
|
|
60.7
|
|
41.2
|
|
|||||
|
Adjusted EBITDA
|
$
|
185.8
|
|
$
|
210.7
|
|
$
|
215.1
|
|
||
|
Subtract:
|
|||||||||||
|
Adjustment to unconsolidated affiliate earnings
(2)
|
$
|
20.8
|
|
$
|
33.5
|
|
$
|
3.2
|
|
||
|
Coal rationalization costs
(3)
|
0.6
|
|
18.5
|
|
—
|
|
|||||
|
Depreciation and amortization expense
|
109.1
|
|
106.3
|
|
96.0
|
|
|||||
|
Interest expense, net
|
56.7
|
|
63.2
|
|
52.3
|
|
|||||
|
Income tax (benefit) expense
|
(8.8
|
)
|
(58.8
|
)
|
6.7
|
|
|||||
|
Sales discount provided to customers due to sharing of
nonconventional fuels tax credits (4) |
—
|
|
(0.5
|
)
|
6.8
|
|
|||||
|
Asset and goodwill impairment
|
—
|
|
150.3
|
|
—
|
|
|||||
|
Coal Logistics deferred revenue
(5)
|
(2.9
|
)
|
—
|
|
—
|
|
|||||
|
Net income (loss)
|
$
|
10.3
|
|
$
|
(101.8
|
)
|
$
|
50.1
|
|
||
|
Add:
|
|||||||||||
|
Asset and goodwill impairment
|
$
|
—
|
|
$
|
150.3
|
|
$
|
—
|
|
||
|
Depreciation and amortization expense
|
109.1
|
|
106.3
|
|
96.0
|
|
|||||
|
Deferred income tax (benefit) expense
|
(5.6
|
)
|
(64.4
|
)
|
1.6
|
|
|||||
|
Loss on extinguishment of debt
|
0.5
|
|
15.4
|
|
—
|
|
|||||
|
Changes in working capital and other
|
26.8
|
|
6.5
|
|
3.6
|
|
|||||
|
Net cash provided by operating activities
|
$
|
141.1
|
|
$
|
112.3
|
|
$
|
151.3
|
|
||
|
(1)
|
Reflects non-controlling interest in Indiana Harbor and the portion of the Partnership owned by public unitholders.
|
|
(2)
|
Reflects share of interest, taxes, impairment, depreciation and amortization related to VISA SunCoke. The years ended
December 31, 2015
and
2014
also reflect impairments of our investment in VISA SunCoke of
$19.4 million
and
$30.5 million
, respectively.
|
|
(3)
|
Coal rationalization costs include employee severance, contract termination costs and other one-time costs to idle mines incurred during the execution of our coal rationalization plan.
|
|
(4)
|
At December 31, 2013, we had $13.6 million accrued related to sales discounts to be paid to our customer at our Granite City facility. During the first quarter of 2014, we settled this obligation for $13.1 million which resulted in a gain of $0.5 million. The gain was recorded in sales and other operating revenue on our Consolidated Statement of Operations.
|
|
(5)
|
Coal Logistics deferred revenue adjusts for differences between the timing of recognition of take-or-pay shortfalls into revenue for GAAP purposes versus the timing of payments from our customers. This adjustment aligns Adjusted EBITDA more closely with cash flow.
|
65
Below is a reconciliation of 2016 Estimated Adjusted EBITDA to its closest GAAP measures:
|
2016
|
||||||||
|
Low
|
High
|
|||||||
|
(Dollars in millions)
|
||||||||
|
Adjusted EBITDA attributable to SunCoke Energy, Inc.
|
$
|
105
|
|
$
|
124
|
|
||
|
Add: Adjusted EBITDA attributable to noncontrolling interests
(1)
|
105
|
|
111
|
|
||||
|
Adjusted EBITDA
|
$
|
210
|
|
$
|
235
|
|
||
|
Subtract:
|
||||||||
|
Coal rationalization costs
(2)
|
5
|
|
5
|
|
||||
|
Depreciation and amortization expense
|
104
|
|
104
|
|
||||
|
Interest expense, net
|
62
|
|
58
|
|
||||
|
Income tax expense
|
3
|
|
14
|
|
||||
|
Net income
(3)
|
$
|
36
|
|
$
|
54
|
|
||
|
Add:
|
||||||||
|
Depreciation and amortization
|
104
|
|
104
|
|
||||
|
Changes in working capital and other
|
10
|
|
12
|
|
||||
|
Net cash provided by operating activities
|
$
|
150
|
|
$
|
170
|
|
||
|
(1)
|
Reflects non-controlling interest in Indiana Harbor and the portion of the Partnership owned by public unitholders.
|
|
(2)
|
Coal rationalization costs include employee severance, contract termination costs and other costs to idle mines incurred during the execution of our coal rationalization plan.
|
|
(3)
|
Does not reflect any potential impact from extinguishment of debt.
|
66
CAUTIONARY STATEMENT CONCERNING FORWARD-LOOKING STATEMENTS
We have made forward -looking statements in this Annual Report on Form 10-K, including, among others, in the sections entitled “Business,” “Risk Factors,” "Quantitative and Qualitative Disclosures About Market Risk" and “Management’s Discussion and Analysis of Financial Condition and Results of Operations.” Such forward-looking statements are based on management’s beliefs and assumptions and on information currently available. Forward-looking statements include the information concerning our possible or assumed future results of operations, business strategies, financing plans, competitive position, potential growth opportunities, potential operating performance, the effects of competition and the effects of future legislation or regulations. Forward-looking statements include all statements that are not historical facts and may be identified by the use of forward-looking terminology such as the words “believe,” “expect,” “plan,” “intend,” “anticipate,” “estimate,” “predict,” “potential,” “continue,” “may,” “will,” “should” or the negative of these terms or similar expressions. In particular, statements in this Annual Report on Form 10-K concerning future dividend declarations are subject to approval by our Board of Directors and will be based upon circumstances then existing.
Forward-looking statements involve risks, uncertainties and assumptions. Actual results may differ materially from those expressed in these forward-looking statements. You should not put undue reliance on any forward-looking statements. We do not have any intention or obligation to update any forward-looking statement (or its associated cautionary language), whether as a result of new information or future events, after the date of this Annual Report on Form 10-K, except as required by applicable law.
The risk factors discussed in “Risk Factors” could cause our results to differ materially from those expressed in these forward-looking statements. There also may be other risks that we are unable to predict at this time. Such risks and uncertainties include, without limitation:
|
•
|
changes in levels of production, production capacity, pricing and/or margins for coal and coke;
|
|
•
|
variation in availability, quality and supply of metallurgical coal used in the cokemaking process, including as a result of non-performance by our suppliers;
|
|
•
|
changes in the marketplace that may affect our Coal Logistics business, including the supply and demand for thermal and metallurgical coal;
|
|
•
|
changes in the marketplace that may affect our cokemaking business, including the supply and demand for our coke products, as well as increased imports of coke from foreign producers;
|
|
•
|
competition from alternative steelmaking and other technologies that have the potential to reduce or eliminate the use of coke;
|
|
•
|
our dependence on, relationships with, and other conditions affecting, our customers;
|
|
•
|
severe financial hardship or bankruptcy of one or more of our major customers, or the occurrence of a customer default or other event affecting our ability to collect payments from our customers;
|
|
•
|
volatility and cyclical downturns in the steel industry and in other industries in which our customers operate;
|
|
•
|
volatility, cyclical downturns and other change in the business climate and market for coal, affecting customers or potential customers for the Partnership's Coal Logistics business;
|
|
•
|
our significant equity interest in the Partnership;
|
|
•
|
our ability to enter into new, or renew existing, long-term agreements upon favorable terms for the sale of coke steam, or electric power, or for coal handling services;
|
|
•
|
the Partnership's ability to enter into new, or renew existing, agreements upon favorable terms for Coal Logistics services;
|
|
•
|
our ability to identify acquisitions, execute them under favorable terms, and integrate them into our existing business operations;
|
|
•
|
our ability to consummate investments under favorable terms, including with respect to existing cokemaking facilities, which may utilize by-product technology, and integrate them into our existing businesses and have them perform at anticipated levels;
|
|
•
|
our ability to develop, design, permit, construct, start up, or operate new cokemaking facilities in the U.S. or in foreign countries;
|
|
•
|
our ability to successfully implement domestic and/or our international growth strategies;
|
67
|
•
|
our ability to realize expected benefits from investments and acquisitions, including our investment in the Indian joint venture;
|
|
•
|
age of, and changes in the reliability, efficiency and capacity of the various equipment and operating facilities used in our coal mining and/or cokemaking operations, and in the operations of our subsidiaries major customers, business partners and/or suppliers;
|
|
•
|
changes in the expected operating levels of our assets;
|
|
•
|
our ability to meet minimum volume requirements, coal-to-coke yield standards and coke quality standards in our coke sales agreements;
|
|
•
|
changes in the level of capital expenditures or operating expenses, including any changes in the level of environmental capital, operating or remediation expenditures;
|
|
•
|
our ability to service our outstanding indebtedness;
|
|
•
|
our ability to comply with the restrictions imposed by our financing arrangements;
|
|
•
|
our ability to comply with federal or state environmental statutes, rules or regulations
|
|
•
|
nonperformance or force majeure by, or disputes with, or changes in contract terms with, major customers, suppliers, dealers, distributors or other business partners;
|
|
•
|
availability of skilled employees for our coal mining, cokemaking, and/or Coal Logistics operating, and other workplace factors;
|
|
•
|
effects of railroad, barge, truck and other transportation performance and costs, including any transportation disruptions;
|
|
•
|
effects of adverse events relating to the operation of our facilities and to the transportation and storage of hazardous materials (including equipment malfunction, explosions, fires, spills, and the effects of severe weather conditions);
|
|
•
|
effects of adverse events relating to the business or commercial operations of all customers or supplies
|
|
•
|
disruption in our information technology infrastructure and/or loss of our ability to securely store, maintain, or transmit data due to security breach by hackers, employee error or malfeasance, terrorist attack, power loss, telecommunications failure or other events;
|
|
•
|
our ability to enter into joint ventures and other similar arrangements under favorable terms;
|
|
•
|
our ability to consummate assets sales, other divestitures and strategic restructuring in a timely manner upon favorable terms, and/or realize the anticipated benefits from such actions;
|
|
•
|
changes in the availability and cost of equity and debt financing;
|
|
•
|
impact on our liquidity and ability to raise capital as a result of changes in the credit ratings assigned to our indebtedness;
|
|
•
|
changes in credit terms required by our suppliers;
|
|
•
|
risks related to labor relations and workplace safety;
|
|
•
|
proposed or final changes in existing, or new, statutes, regulations, rules, governmental policies and taxes, or their interpretations, including those relating to environmental matters and taxes;
|
|
•
|
the existence of hazardous substances or other environmental contamination on property owned or used by us;
|
|
•
|
the availability of future permits authorizing the disposition of certain mining waste;
|
|
•
|
claims of noncompliance with any statutory and regulatory requirements;
|
|
•
|
proposed or final changes in accounting and/or tax methodologies, laws, regulations, rules, or policies, or their interpretations, including those affecting inventories, leases, pensions, or income;
|
|
•
|
historical combined and consolidated financial data may not be reliable indicator of future results;
|
|
•
|
effects resulting from our separation from Sunoco, Inc.;
|
|
•
|
public company costs;
|
|
•
|
our indebtedness and certain covenants in our debt documents;
|
68
|
•
|
our ability to secure new coal supply agreements or to renew existing coal supply agreements;
|
|
•
|
defects in title or the loss of one or more mineral leasehold interests;
|
|
•
|
disruptions in the quantities of coal produced by our contract mine operators;
|
|
•
|
our ability to obtain and renew mining permits, and the availability and cost of surety bonds needed in our coal mining operations;
|
|
•
|
receipt of regulatory approvals and compliance with contractual obligations required in connection with our coal mining, cokemaking, and /or Coal Logistics operations;
|
|
•
|
changes in product specifications for either the coal or coke that we produce or the coals we mix, store and transport;
|
|
•
|
changes in insurance markets impacting cost, level and/or types of coverage available, and the financial ability of our insurers to meet their obligations;
|
|
•
|
changes in accounting rules or their interpretations, including the method of accounting for inventories, leases and/or pensions;
|
|
•
|
changes in tax laws or their interpretations, including the adoption of proposed rules governing whether the Partnership would be treated as a corporation for federal income tax purposes;
|
|
•
|
volatility in foreign currency exchange rates affecting the markets and geographic regions in which we conduct business;
|
|
•
|
changes in financial markets impacting pension expense and funding requirements;
|
|
•
|
the accuracy of our estimates of reclamation and other mine closure obligations;
|
|
•
|
inadequate protection of our intellectual property rights; and
|
|
•
|
effects of geologic conditions, weather, natural disasters and other inherent risks beyond our control.
|
The factors identified above are believed to be important factors, but not necessarily all of the important factors, that could cause actual results to differ materially from those expressed in any forward-looking statement made by us. Other factors not discussed herein also could have material adverse effects on us. All forward-looking statements included in this Annual Report on Form 10-K are expressly qualified in their entirety by the foregoing cautionary statements.
69
|
Item 7A.
|
Quantitative and Qualitative Disclosures About Market Risk
|
Our primary areas of market risk include changes in: (1) the price of coal, which is the key raw material for our cokemaking business; (2) current steel and coal market conditions; (3) interest rates; and (4) foreign currency exchange rates. We do not enter into any market risk sensitive instruments for trading purposes.
For our Domestic Coke segment, the largest component of the price of our coke is coal cost. However, under the coke sales agreements at all of our Domestic Coke cokemaking facilities, other than Jewell, coal costs are a pass-through component of the coke price, provided that we are able to realize certain targeted coal-to-coke yields. As such, when targeted coal-to-coke yields are achieved, the price of coal is not a significant determining factor in the profitability of these facilities. The coal component of the Jewell coke price is fixed annually for each calendar year based on the weighted-average contract price of third-party coal purchases at our Haverhill facility applicable to ArcelorMittal coke sales. To the extent that contracts for third-party coal purchases at our Haverhill facility convert to pricing mechanisms of less than a year, then the Jewell coke price will be adjusted accordingly during that year.
The provisions of our coke sales agreements require us to meet minimum production levels and generally require us to secure replacement coke supplies at the prevailing contract price if we do not meet contractual minimum volumes. Because market prices for coke are generally highly correlated to market prices for metallurgical coal, we are subject to market risk related to the procurement of replacement supplies to the extent any of our facilities are unable to produce their contractual minimum volumes.
Our steelmaking customers are currently operating in an environment that is significantly challenged by declining steel prices and lower demand. The combination of reduced drilling activity caused by low oil and gas prices and continued excessively high import activity, which has served to drastically depress both spot and contract prices for steel, has driven a deteriorating market for flat rolled and tubular steel. Several steel producers, including certain of our customers, have filed petitions with the Department of Commerce and the International Trade Commission, alleging that unfairly traded imports are causing material injury to the domestic steel industry in the United States and that foreign steel producers benefit from significant subsidies provided by the governments of their respective countries. While trade action is underway, domestic steel utilization rates are down significantly from 2014 utilization rates. As a result of these current market conditions, certain of our customers have temporarily idled portions of their facilities, but continue to comply with the terms of our long-term, take-or-pay contracts.
Our Coal Logistics coal mining customers are currently faced with a market depressed by oversupply and declining coal prices. Our CMT customers are also impacted by seaborne export market dynamics. Fluctuations in the benchmark price for coal delivery into northwest Europe, as referenced in the API2 index price, influence our customers' decisions to place tons into the export market and thus impact transloading volumes through our terminal facility. Despite the current challenging coal mining and coal export markets, our customers have continued to perform on their contracts with us.
We do not use derivatives to hedge any of our coal purchases or sales. Although we have not previously done so, we may enter into derivative financial instruments from time to time in the future to economically manage our exposure related to these market risks.
We are exposed to changes in interest rates as a result of borrowing activities with variable interest rates and interest earned on our cash balances. During the year ended December 31, 2015, the daily average outstanding balance on borrowings with variable interest rates was
$92.0 million
. Assuming a 50 basis point change in LIBOR, interest expense would have been impacted by $0.5 million in 2015. At December 31, 2015, we had outstanding borrowings with variable interest rates of
$60.4 million
,
$182.0 million
and
$50.0 million
under the Revolver, the Partnership Revolver and the Partnership Term Loan, respectively.
At December 31,
2015
, we had cash and cash equivalents of
$123.4 million
, which accrues interest at various rates. Assuming a 50 basis point change in the rate of interest associated with our cash and cash equivalents, interest income would have increased by approximately $0.7 million for the year ended December 31,
2015
.
Because we operate outside the U.S., we are subject to risk resulting from changes in currency exchange rates. Currency exchange rates are influenced by a variety of economic factors including local inflation, growth, interest rates and governmental actions, as well as other factors. Revenues and expenses of our foreign operations are translated at average exchange rates during the period and balance sheet accounts are translated at period-end exchange rates. Balance sheet translation adjustments are excluded from the results of operations and are recorded in equity as a component of accumulated other comprehensive loss. If the currency exchange rates had changed by 10 percent, we estimate the impact to our net income in 2015 would have been approximately $0.4 million.
70
|
Item 8.
|
Financial Statements and Supplementary Data
|
INDEX TO FINANCIAL STATEMENTS
|
Page
|
|
71
Report of Independent Registered Public Accounting Firm
To the Board of Directors and Stockholders
SunCoke Energy, Inc.:
We have audited the accompanying consolidated balance sheet of SunCoke Energy, Inc. and subsidiaries as of
December 31, 2015
and the related consolidated statements of operations, comprehensive (loss) income, equity, and cash flow for the year ended
December 31, 2015
. These consolidated financial statements are the responsibility of the Company’s management. Our responsibility is to express an opinion on these consolidated financial statements based on our audit.
We conducted our audit in accordance with the standards of the Public Company Accounting Oversight Board (United States). Those standards require that we plan and perform the audit to obtain reasonable assurance about whether the financial statements are free of material misstatement. An audit includes examining, on a test basis, evidence supporting the amounts and disclosures in the financial statements. An audit also includes assessing the accounting principles used and significant estimates made by management, as well as evaluating the overall financial statement presentation. We believe that our audit provides a reasonable basis for our opinion.
In our opinion, the consolidated financial statements referred to above present fairly, in all material respects, the financial position of SunCoke Energy, Inc. and subsidiaries as of
December 31, 2015
, and the results of their operations and their cash flows for the year ended
December 31, 2015
, in conformity with U.S. generally accepted accounting principles.
We also have audited, in accordance with the standards of the Public Company Accounting Oversight Board (United States), SunCoke Energy, Inc.’s internal control over financial reporting as of
December 31, 2015
, based on criteria established in
Internal Control - Integrated Framework (2013)
issued by the Committee of Sponsoring Organizations of the Treadway Commission (COSO), and our report dated
February 18, 2016
expressed an unqualified opinion on the effectiveness of the Company’s internal control over financial reporting.
/s/ KPMG LLP
Chicago, Illinois
February 18, 2016
72
Report of Independent Registered Public Accounting Firm
To the Board of Directors and Stockholders
SunCoke Energy, Inc.:
We have audited SunCoke Energy, Inc.’s internal control over financial reporting as of
December 31, 2015
, based on criteria established in
Internal Control-Integrated Framework (2013)
issued by the Committee of Sponsoring Organizations of the Treadway Commission (COSO). The Company's management is responsible for maintaining effective internal control over financial reporting and for its assessment of the effectiveness of internal control over financial reporting, included in the accompanying Management's Report on Internal Control Over Financial Reporting. Our responsibility is to express an opinion on the Company's internal control over financial reporting based on our audit.
We conducted our audit in accordance with the standards of the Public Company Accounting Oversight Board (United States). Those standards require that we plan and perform the audit to obtain reasonable assurance about whether effective internal control over financial reporting was maintained in all material respects. Our audit included obtaining an understanding of internal control over financial reporting, assessing the risk that a material weakness exists, and testing and evaluating the design and operating effectiveness of internal control based on the assessed risk. Our audit also included performing such other procedures as we considered necessary in the circumstances. We believe that our audit provides a reasonable basis for our opinion.
A company's internal control over financial reporting is a process designed to provide reasonable assurance regarding the reliability of financial reporting and the preparation of financial statements for external purposes in accordance with generally accepted accounting principles. A company's internal control over financial reporting includes those policies and procedures that (1) pertain to the maintenance of records that, in reasonable detail, accurately and fairly reflect the transactions and dispositions of the assets of the company; (2) provide reasonable assurance that transactions are recorded as necessary to permit preparation of financial statements in accordance with generally accepted accounting principles, and that receipts and expenditures of the company are being made only in accordance with authorizations of management and directors of the company; and (3) provide reasonable assurance regarding prevention or timely detection of unauthorized acquisition, use, or disposition of the company's assets that could have a material effect on the financial statements.
Because of its inherent limitations, internal control over financial reporting may not prevent or detect misstatements. Also, projections of any evaluation of effectiveness to future periods are subject to the risk that controls may become inadequate because of changes in conditions, or that the degree of compliance with the policies or procedures may deteriorate.
In our opinion, SunCoke Energy, Inc. maintained, in all material respects, effective internal control over financial reporting as of
December 31, 2015
, based on criteria established in
Internal Control-Integrated Framework (2013)
issued by COSO.
The Company acquired Raven Energy LLC during 2015, and management excluded from its assessment of the effectiveness of the Company’s internal control over financial reporting as of December 31, 2015, Raven Energy LLC’s internal control over financial reporting associated with total assets of $426.1 million and total revenues of $28.6 million included in the consolidated financial statements of the Company as of and for the year ended December 31, 2015. Our audit of internal control over financial reporting of the Company also excluded an evaluation of the internal control over financial reporting of Raven Energy LLC.
We also have audited, in accordance with the standards of the Public Company Accounting Oversight Board (United States), the consolidated balance sheet of SunCoke Energy, Inc. as of
December 31, 2015
, and the related consolidated statements of operations, comprehensive (loss) income, equity, and cash flow for the year ended
December 31, 2015
, and our report dated
February 18, 2016
expressed an unqualified opinion on those consolidated financial statements.
/s/ KPMG LLP
Chicago, Illinois
February 18, 2016
73
Report of Independent Registered Public Accounting Firm
To the Board of Directors and Stockholders
SunCoke Energy, Inc.
We have audited the accompanying consolidated balance sheet of SunCoke Energy, Inc. as of December 31, 2014, and the related consolidated statements of operations, comprehensive (loss) income, equity and cash flows for each of the two years in the period ended December 31, 2014. These financial statements are the responsibility of the Company’s management. Our responsibility is to express an opinion on these financial statements based on our audits.
We conducted our audits in accordance with the standards of the Public Company Accounting Oversight Board (United States). Those standards require that we plan and perform the audit to obtain reasonable assurance about whether the financial statements are free of material misstatement. An audit includes examining, on a test basis, evidence supporting the amounts and disclosures in the financial statements. An audit also includes assessing the accounting principles used and significant estimates made by management, as well as evaluating the overall financial statement presentation. We believe that our audits provide a reasonable basis for our opinion.
In our opinion, the financial statements referred to above present fairly, in all material respects, the consolidated financial position of SunCoke Energy, Inc. at December 31, 2014 and the consolidated results of its operations and its cash flows for each of the two years in the period ended December 31, 2014, in conformity with U.S. generally accepted accounting principles.
/s/ Ernst & Young LLP
Chicago, Illinois
February 18, 2016
74
SunCoke Energy, Inc.
|
Years Ended December 31,
|
|||||||||||
|
2015
|
2014
|
2013
|
|||||||||
|
(Dollars and shares in millions, except per share amounts)
|
|||||||||||
|
Revenues
|
|||||||||||
|
Sales and other operating revenue
|
$
|
1,351.3
|
|
$
|
1,490.7
|
|
$
|
1,633.5
|
|
||
|
Other income, net
|
11.4
|
|
13.1
|
|
14.2
|
|
|||||
|
Total revenues
|
1,362.7
|
|
1,503.8
|
|
1,647.7
|
|
|||||
|
Costs and operating expenses
|
|||||||||||
|
Cost of products sold and operating expenses
|
1,098.4
|
|
1,212.9
|
|
1,348.0
|
|
|||||
|
Selling, general and administrative expenses
|
75.4
|
|
96.7
|
|
92.4
|
|
|||||
|
Depreciation and amortization expense
|
109.1
|
|
106.3
|
|
96.0
|
|
|||||
|
Asset and goodwill impairment
|
—
|
|
150.3
|
|
—
|
|
|||||
|
Total costs and operating expenses
|
1,282.9
|
|
1,566.2
|
|
1,536.4
|
|
|||||
|
Operating income (loss)
|
79.8
|
|
(62.4
|
)
|
111.3
|
|
|||||
|
Interest expense, net
|
56.7
|
|
63.2
|
|
52.3
|
|
|||||
|
Income (loss) before income tax (benefit) expense and loss from equity method investment
|
23.1
|
|
(125.6
|
)
|
59.0
|
|
|||||
|
Income tax (benefit) expense
|
(8.8
|
)
|
(58.8
|
)
|
6.7
|
|
|||||
|
Loss from equity method investment
|
21.6
|
|
35.0
|
|
2.2
|
|
|||||
|
Net income (loss)
|
10.3
|
|
(101.8
|
)
|
50.1
|
|
|||||
|
Less: Net income attributable to noncontrolling interests
|
32.3
|
|
24.3
|
|
25.1
|
|
|||||
|
Net (loss) income attributable to SunCoke Energy, Inc.
|
$
|
(22.0
|
)
|
$
|
(126.1
|
)
|
$
|
25.0
|
|
||
|
(Loss) earnings attributable to SunCoke Energy, Inc. per common share:
|
|||||||||||
|
Basic
|
$
|
(0.34
|
)
|
$
|
(1.83
|
)
|
$
|
0.36
|
|
||
|
Diluted
|
$
|
(0.34
|
)
|
$
|
(1.83
|
)
|
$
|
0.36
|
|
||
|
Weighted average number of common shares outstanding:
|
|||||||||||
|
Basic
|
65.0
|
|
68.8
|
|
69.9
|
|
|||||
|
Diluted
|
65.0
|
|
68.8
|
|
70.2
|
|
|||||
(See Accompanying Notes)
75
SunCoke Energy, Inc.
Consolidated Statements of Comprehensive (Loss) Income
|
Years Ended December 31,
|
|||||||||||
|
2015
|
2014
|
2013
|
|||||||||
|
(Dollars in millions)
|
|||||||||||
|
Net income (loss)
|
$
|
10.3
|
|
$
|
(101.8
|
)
|
$
|
50.1
|
|
||
|
Other comprehensive (loss) income:
|
|||||||||||
|
Reclassifications of prior service cost (benefit) and actuarial loss amortization to earnings (net of related tax (expense) benefit of ($3.4 million), $2.7 million and $1.3 million, respectively)
|
5.2
|
|
(4.0
|
)
|
(1.9
|
)
|
|||||
|
Retirement benefit plans funded status adjustment (net of related tax benefit (expense) of $0.1 million, $1.6 million and ($3.8 million), respectively)
|
(0.4
|
)
|
(2.6
|
)
|
5.7
|
|
|||||
|
Currency translation adjustment
|
(3.1
|
)
|
(0.8
|
)
|
(10.0
|
)
|
|||||
|
Comprehensive income (loss)
|
12.0
|
|
(109.2
|
)
|
43.9
|
|
|||||
|
Less: Comprehensive income attributable to noncontrolling
interests |
32.3
|
|
24.3
|
|
25.1
|
|
|||||
|
Comprehensive (loss) income attributable to SunCoke Energy, Inc.
|
$
|
(20.3
|
)
|
$
|
(133.5
|
)
|
$
|
18.8
|
|
||
(See Accompanying Notes)
76
SunCoke Energy, Inc.
Consolidated Balance Sheets
|
December 31,
|
|||||||
|
2015
|
2014
|
||||||
|
(Dollars in millions,
except par value amounts)
|
|||||||
|
Assets
|
|||||||
|
Cash and cash equivalents
|
$
|
123.4
|
|
$
|
139.0
|
|
|
|
Receivables
|
65.2
|
|
78.2
|
|
|||
|
Inventories
|
122.1
|
|
142.2
|
|
|||
|
Income tax receivable
|
11.6
|
|
6.0
|
|
|||
|
Other current assets
|
3.8
|
|
3.6
|
|
|||
|
Total current assets
|
326.1
|
|
369.0
|
|
|||
|
Restricted cash
|
18.2
|
|
0.5
|
|
|||
|
Investment in Brazilian cokemaking operations
|
41.0
|
|
41.0
|
|
|||
|
Equity method investment in VISA SunCoke Limited
|
—
|
|
22.3
|
|
|||
|
Properties, plants and equipment, net
|
1,593.4
|
|
1,480.0
|
|
|||
|
Goodwill
|
71.1
|
|
11.6
|
|
|||
|
Other intangible assets, net
|
190.2
|
|
10.4
|
|
|||
|
Deferred charges and other assets
|
15.5
|
|
24.9
|
|
|||
|
Total assets
|
$
|
2,255.5
|
|
$
|
1,959.7
|
|
|
|
Liabilities and Equity
|
|||||||
|
Accounts payable
|
$
|
99.9
|
|
$
|
121.3
|
|
|
|
Accrued liabilities
|
45.8
|
|
71.3
|
|
|||
|
Current portion of long-term debt
|
1.1
|
|
—
|
|
|||
|
Interest payable
|
18.9
|
|
19.9
|
|
|||
|
Total current liabilities
|
165.7
|
|
212.5
|
|
|||
|
Long-term debt
|
997.7
|
|
633.5
|
|
|||
|
Accrual for black lung benefits
|
44.7
|
|
40.1
|
|
|||
|
Retirement benefit liabilities
|
31.3
|
|
33.6
|
|
|||
|
Deferred income taxes
|
349.0
|
|
295.5
|
|
|||
|
Asset retirement obligations
|
22.2
|
|
22.2
|
|
|||
|
Other deferred credits and liabilities
|
22.1
|
|
16.9
|
|
|||
|
Total liabilities
|
1,632.7
|
|
1,254.3
|
|
|||
|
Equity
|
|||||||
|
Preferred stock, $0.01 par value. Authorized 50,000,000 shares; no issued shares at December 31, 2015 and 2014
|
—
|
|
—
|
|
|||
|
Common stock, $0.01 par value. Authorized 300,000,000 shares; issued 71,489,448 shares and 71,251,529 shares at December 31, 2015 and 2014, respectively
|
0.7
|
|
0.7
|
|
|||
|
Treasury stock, 7,477,657 shares and 4,977,115 shares at December 31, 2015 and 2014 respectively
|
(140.7
|
)
|
(105.0
|
)
|
|||
|
Additional paid-in capital
|
486.1
|
|
543.6
|
|
|||
|
Accumulated other comprehensive loss
|
(19.8
|
)
|
(21.5
|
)
|
|||
|
Retained (deficit) earnings
|
(36.4
|
)
|
13.9
|
|
|||
|
Total SunCoke Energy, Inc. stockholders' equity
|
289.9
|
|
431.7
|
|
|||
|
Noncontrolling interests
|
332.9
|
|
273.7
|
|
|||
|
Total equity
|
622.8
|
|
705.4
|
|
|||
|
Total liabilities and equity
|
$
|
2,255.5
|
|
$
|
1,959.7
|
|
|
(See Accompanying Notes)
77
SunCoke Energy, Inc.
|
Years Ended December 31,
|
|||||||||||
|
2015
|
2014
|
2013
|
|||||||||
|
(Dollars in millions)
|
|||||||||||
|
Cash Flows from Operating Activities:
|
|||||||||||
|
Net income (loss)
|
$
|
10.3
|
|
$
|
(101.8
|
)
|
$
|
50.1
|
|
||
|
Adjustments to reconcile net income (loss) to net cash provided by operating activities:
|
|||||||||||
|
Asset and goodwill impairment
|
—
|
|
150.3
|
|
—
|
|
|||||
|
Loss from equity method investment
|
21.6
|
|
35.0
|
|
2.2
|
|
|||||
|
Depreciation and amortization expense
|
109.1
|
|
106.3
|
|
96.0
|
|
|||||
|
Deferred income tax (benefit) expense
|
(5.6
|
)
|
(64.4
|
)
|
1.6
|
|
|||||
|
Settlement loss and payments in excess of expense for pension plan
|
13.1
|
|
(7.5
|
)
|
(0.1
|
)
|
|||||
|
Gain on curtailment and payments in excess of expense for postretirement plan benefits
|
(8.0
|
)
|
(0.6
|
)
|
(5.3
|
)
|
|||||
|
Share-based compensation expense
|
7.2
|
|
9.8
|
|
7.6
|
|
|||||
|
Excess tax benefit from share-based awards
|
—
|
|
(0.3
|
)
|
—
|
|
|||||
|
Loss on extinguishment of debt
|
0.5
|
|
15.4
|
|
—
|
|
|||||
|
Changes in working capital pertaining to operating activities (net of acquisitions):
|
|||||||||||
|
Receivables
|
18.8
|
|
13.3
|
|
(18.1
|
)
|
|||||
|
Inventories
|
23.2
|
|
(12.6
|
)
|
29.2
|
|
|||||
|
Accounts payable
|
(17.9
|
)
|
(33.0
|
)
|
20.0
|
|
|||||
|
Accrued liabilities
|
(28.7
|
)
|
(8.0
|
)
|
(24.7
|
)
|
|||||
|
Interest payable
|
(1.0
|
)
|
1.7
|
|
2.5
|
|
|||||
|
Income taxes
|
(5.6
|
)
|
1.0
|
|
(10.2
|
)
|
|||||
|
Accrual for black lung benefits
|
6.0
|
|
11.5
|
|
(2.4
|
)
|
|||||
|
Other
|
(1.9
|
)
|
(3.8
|
)
|
2.9
|
|
|||||
|
Net cash provided by operating activities
|
141.1
|
|
112.3
|
|
151.3
|
|
|||||
|
Cash Flows from Investing Activities:
|
|||||||||||
|
Capital expenditures
|
(75.8
|
)
|
(125.2
|
)
|
(145.6
|
)
|
|||||
|
Acquisition of businesses, net of cash received
|
(191.7
|
)
|
—
|
|
(113.3
|
)
|
|||||
|
Restricted cash
|
(17.7
|
)
|
—
|
|
—
|
|
|||||
|
Equity method investment in VISA SunCoke Limited
|
—
|
|
—
|
|
(67.7
|
)
|
|||||
|
Net cash used in investing activities
|
(285.2
|
)
|
(125.2
|
)
|
(326.6
|
)
|
|||||
|
Cash Flows from Financing Activities:
|
|||||||||||
|
Proceeds from issuance of common units of SunCoke Energy Partners, L.P., net of offering costs
|
—
|
|
90.5
|
|
237.8
|
|
|||||
|
Proceeds from issuance of long-term debt
|
260.8
|
|
268.1
|
|
150.0
|
|
|||||
|
Repayment of long-term debt
|
(248.1
|
)
|
(276.5
|
)
|
(225.0
|
)
|
|||||
|
Debt issuance costs
|
(5.7
|
)
|
(5.8
|
)
|
(6.9
|
)
|
|||||
|
Proceeds from revolving facility
|
292.4
|
|
40.0
|
|
40.0
|
|
|||||
|
Repayment of revolving facility
|
(50.0
|
)
|
(80.0
|
)
|
—
|
|
|||||
|
Dividends paid
|
(28.0
|
)
|
(3.8
|
)
|
—
|
|
|||||
|
Cash distributions to noncontrolling interests
|
(43.3
|
)
|
(32.3
|
)
|
(17.8
|
)
|
|||||
|
Shares repurchased
|
(35.7
|
)
|
(85.1
|
)
|
(10.9
|
)
|
|||||
|
SunCoke Energy Partners, L.P. units repurchased
|
(12.8
|
)
|
—
|
|
—
|
|
|||||
|
Proceeds from exercise of stock options, net of shares withheld for taxes
|
(1.1
|
)
|
2.9
|
|
2.5
|
|
|||||
|
Excess tax benefit from share-based awards
|
—
|
|
0.3
|
|
—
|
|
|||||
|
Net cash provided by (used in) financing activities
|
128.5
|
|
(81.7
|
)
|
169.7
|
|
|||||
|
Net decrease in cash and cash equivalents
|
(15.6
|
)
|
(94.6
|
)
|
(5.6
|
)
|
|||||
|
Cash and cash equivalents at beginning of year
|
139.0
|
|
233.6
|
|
239.2
|
|
|||||
|
Cash and cash equivalents at end of year
|
$
|
123.4
|
|
$
|
139.0
|
|
$
|
233.6
|
|
||
|
Supplemental Disclosure of Cash Flow Information
|
|||||||||||
|
Interest paid
|
$
|
58.1
|
|
$
|
45.8
|
|
$
|
43.2
|
|
||
|
Income taxes paid, net of refunds of, $1.5 million and $4.6 million in 2015 and 2014, respectively, and no refunds in 2013.
|
$
|
2.4
|
|
$
|
9.1
|
|
$
|
15.3
|
|
||
(See Accompanying Notes)
78
SunCoke Energy, Inc.
Consolidated Statements of Equity
|
Common Stock
|
Treasury Stock
|
Additional
Paid-In
Capital
|
Accumulated
Other
Comprehensive
Loss
|
Retained
Earnings
|
Total SunCoke
Energy, Inc. Equity |
Non-controlling
Interests
|
Total
Equity
|
||||||||||||||||||||||||||||||
|
Shares
|
Amount
|
Shares
|
Amount
|
||||||||||||||||||||||||||||||||||
|
(Dollars in millions)
|
|||||||||||||||||||||||||||||||||||||
|
At December 31, 2012
|
70,561,439
|
|
$
|
0.7
|
|
603,528
|
|
$
|
(9.4
|
)
|
$
|
436.9
|
|
$
|
(7.9
|
)
|
$
|
118.8
|
|
$
|
539.1
|
|
$
|
35.8
|
|
$
|
574.9
|
|
|||||||||
|
Net income
|
—
|
|
—
|
|
—
|
|
—
|
|
—
|
|
—
|
|
25.0
|
|
25.0
|
|
25.1
|
|
50.1
|
|
|||||||||||||||||
|
Reclassifications of prior service benefit and actuarial loss amortization to earnings (net of related tax benefit of $1.3 million)
|
—
|
|
—
|
|
—
|
|
—
|
|
—
|
|
(1.9
|
)
|
—
|
|
(1.9
|
)
|
—
|
|
(1.9
|
)
|
|||||||||||||||||
|
Retirement benefit plans funded status adjustment (net of related tax expense of $3.8 million)
|
—
|
|
—
|
|
—
|
|
—
|
|
—
|
|
5.7
|
|
—
|
|
5.7
|
|
—
|
|
5.7
|
|
|||||||||||||||||
|
Currency translation adjustment
|
—
|
|
—
|
|
—
|
|
—
|
|
—
|
|
(10.0
|
)
|
—
|
|
(10.0
|
)
|
—
|
|
(10.0
|
)
|
|||||||||||||||||
|
Net proceeds from issuance of SunCoke Energy Partners, L.P. units
|
—
|
|
—
|
|
—
|
|
—
|
|
—
|
|
—
|
|
—
|
|
—
|
|
231.8
|
|
231.8
|
|
|||||||||||||||||
|
Cash distributions to noncontrolling interests
|
—
|
|
—
|
|
—
|
|
—
|
|
—
|
|
—
|
|
—
|
|
—
|
|
(17.8
|
)
|
(17.8
|
)
|
|||||||||||||||||
|
Share-based compensation expense
|
—
|
|
—
|
|
—
|
|
—
|
|
7.6
|
|
—
|
|
—
|
|
7.6
|
|
—
|
|
7.6
|
|
|||||||||||||||||
|
Share issuances, net of shares withheld for taxes
|
330,701
|
|
—
|
|
—
|
|
—
|
|
2.8
|
|
—
|
|
—
|
|
2.8
|
|
—
|
|
2.8
|
|
|||||||||||||||||
|
Shares repurchased
|
—
|
|
—
|
|
651,827
|
|
(10.5
|
)
|
(0.4
|
)
|
—
|
|
—
|
|
(10.9
|
)
|
—
|
|
(10.9
|
)
|
|||||||||||||||||
|
At December 31, 2013
|
70,892,140
|
|
$
|
0.7
|
|
1,255,355
|
|
$
|
(19.9
|
)
|
$
|
446.9
|
|
$
|
(14.1
|
)
|
$
|
143.8
|
|
$
|
557.4
|
|
$
|
274.9
|
|
$
|
832.3
|
|
|||||||||
(See Accompanying Notes)
79
SunCoke Energy, Inc.
Consolidated Statements of Equity
|
Common Stock
|
Treasury Stock
|
Additional
Paid-In Capital |
Accumulated
Other Comprehensive Loss |
Retained
Earnings |
Total SunCoke
Energy, Inc. Equity |
Non- controlling
Interests |
Total
Equity |
||||||||||||||||||||||||||||||
|
Shares
|
Amount
|
Shares
|
Amount
|
||||||||||||||||||||||||||||||||||
|
(Dollars in millions)
|
|||||||||||||||||||||||||||||||||||||
|
At December 31, 2013
|
70,892,140
|
|
$
|
0.7
|
|
1,255,355
|
|
$
|
(19.9
|
)
|
$
|
446.9
|
|
$
|
(14.1
|
)
|
$
|
143.8
|
|
$
|
557.4
|
|
$
|
274.9
|
|
$
|
832.3
|
|
|||||||||
|
Net (loss) income
|
—
|
|
—
|
|
—
|
|
—
|
|
—
|
|
—
|
|
(126.1
|
)
|
(126.1
|
)
|
24.3
|
|
(101.8
|
)
|
|||||||||||||||||
|
Reclassifications of prior service benefit and actuarial loss amortization to earnings (net of related tax benefit of $2.7 million)
|
—
|
|
—
|
|
—
|
|
—
|
|
—
|
|
(4.0
|
)
|
—
|
|
(4.0
|
)
|
—
|
|
(4.0
|
)
|
|||||||||||||||||
|
Retirement benefit plans funded status adjustment (net of related tax benefit of $1.6 million)
|
—
|
|
—
|
|
—
|
|
—
|
|
—
|
|
(2.6
|
)
|
—
|
|
(2.6
|
)
|
—
|
|
(2.6
|
)
|
|||||||||||||||||
|
Currency translation adjustment
|
—
|
|
—
|
|
—
|
|
—
|
|
—
|
|
(0.8
|
)
|
—
|
|
(0.8
|
)
|
—
|
|
(0.8
|
)
|
|||||||||||||||||
|
Net proceeds from issuance of SunCoke Energy Partners, L.P. units
|
—
|
|
—
|
|
—
|
|
—
|
|
—
|
|
—
|
|
—
|
|
—
|
|
90.5
|
|
90.5
|
|
|||||||||||||||||
|
Adjustments from changes in ownership of SunCoke Energy Partners, L.P.
|
—
|
|
—
|
|
—
|
|
—
|
|
83.7
|
|
—
|
|
—
|
|
83.7
|
|
(83.7
|
)
|
—
|
|
|||||||||||||||||
|
Cash distributions to noncontrolling interests
|
—
|
|
—
|
|
—
|
|
—
|
|
—
|
|
—
|
|
—
|
|
—
|
|
(32.3
|
)
|
(32.3
|
)
|
|||||||||||||||||
|
Dividends
|
—
|
|
—
|
|
—
|
|
—
|
|
—
|
|
—
|
|
(3.8
|
)
|
(3.8
|
)
|
—
|
|
(3.8
|
)
|
|||||||||||||||||
|
Share-based compensation expense
|
—
|
|
—
|
|
—
|
|
—
|
|
9.8
|
|
—
|
|
—
|
|
9.8
|
|
—
|
|
9.8
|
|
|||||||||||||||||
|
Excess tax benefit from share-based awards
|
—
|
|
—
|
|
—
|
|
—
|
|
0.3
|
|
—
|
|
—
|
|
0.3
|
|
—
|
|
0.3
|
|
|||||||||||||||||
|
Share issuances, net of shares withheld for taxes
|
359,389
|
|
—
|
|
—
|
|
—
|
|
2.9
|
|
—
|
|
—
|
|
2.9
|
|
—
|
|
2.9
|
|
|||||||||||||||||
|
Shares repurchased
|
—
|
|
—
|
|
3,721,760
|
|
(85.1
|
)
|
—
|
|
—
|
|
—
|
|
(85.1
|
)
|
—
|
|
(85.1
|
)
|
|||||||||||||||||
|
At December 31, 2014
|
71,251,529
|
|
$
|
0.7
|
|
4,977,115
|
|
$
|
(105.0
|
)
|
$
|
543.6
|
|
$
|
(21.5
|
)
|
$
|
13.9
|
|
$
|
431.7
|
|
$
|
273.7
|
|
$
|
705.4
|
|
|||||||||
(See Accompanying Notes)
80
SunCoke Energy, Inc.
Consolidated Statements of Equity
|
Common Stock
|
Treasury Stock
|
Additional
Paid-In Capital |
Accumulated
Other Comprehensive Loss |
Retained
Earnings |
Total SunCoke
Energy, Inc. Equity |
Non- controlling
Interests |
Total
Equity |
||||||||||||||||||||||||||||||
|
Shares
|
Amount
|
Shares
|
Amount
|
||||||||||||||||||||||||||||||||||
|
(Dollars in millions)
|
|||||||||||||||||||||||||||||||||||||
|
At December 31, 2014
|
71,251,529
|
|
$
|
0.7
|
|
4,977,115
|
|
$
|
(105.0
|
)
|
$
|
543.6
|
|
$
|
(21.5
|
)
|
$
|
13.9
|
|
$
|
431.7
|
|
$
|
273.7
|
|
$
|
705.4
|
|
|||||||||
|
Net (loss) income
|
—
|
|
—
|
|
—
|
|
—
|
|
—
|
|
—
|
|
(22.0
|
)
|
(22.0
|
)
|
32.3
|
|
10.3
|
|
|||||||||||||||||
|
Reclassifications of prior service cost and actuarial loss amortization to earnings (net of related tax expense of $3.4 million)
|
—
|
|
—
|
|
—
|
|
—
|
|
—
|
|
5.2
|
|
—
|
|
5.2
|
|
—
|
|
5.2
|
|
|||||||||||||||||
|
Retirement benefit plans funded status adjustment (net of related tax benefit of $0.1 million)
|
—
|
|
—
|
|
—
|
|
—
|
|
—
|
|
(0.4
|
)
|
—
|
|
(0.4
|
)
|
—
|
|
(0.4
|
)
|
|||||||||||||||||
|
Currency translation adjustment
|
—
|
|
—
|
|
—
|
|
—
|
|
—
|
|
(3.1
|
)
|
—
|
|
(3.1
|
)
|
—
|
|
(3.1
|
)
|
|||||||||||||||||
|
Adjustments from changes in ownership of SunCoke Energy Partners, L.P.
|
—
|
|
—
|
|
—
|
|
—
|
|
(8.0
|
)
|
—
|
|
—
|
|
(8.0
|
)
|
83.0
|
|
75.0
|
|
|||||||||||||||||
|
Deferred taxes related to basis difference in the Partnership
|
—
|
|
—
|
|
—
|
|
—
|
|
(55.6
|
)
|
—
|
|
—
|
|
(55.6
|
)
|
—
|
|
(55.6
|
)
|
|||||||||||||||||
|
Cash distributions to noncontrolling interests
|
—
|
|
—
|
|
—
|
|
—
|
|
—
|
|
—
|
|
—
|
|
—
|
|
(43.3
|
)
|
(43.3
|
)
|
|||||||||||||||||
|
Dividends
|
—
|
|
—
|
|
—
|
|
—
|
|
—
|
|
—
|
|
(28.3
|
)
|
(28.3
|
)
|
—
|
|
(28.3
|
)
|
|||||||||||||||||
|
Share-based compensation expense
|
—
|
|
—
|
|
—
|
|
—
|
|
7.2
|
|
—
|
|
—
|
|
7.2
|
|
—
|
|
7.2
|
|
|||||||||||||||||
|
Share issuances, net of shares withheld for taxes
|
237,919
|
|
—
|
|
|
|
|
|
(1.1
|
)
|
—
|
|
—
|
|
(1.1
|
)
|
—
|
|
(1.1
|
)
|
|||||||||||||||||
|
Shares repurchased
|
—
|
|
—
|
|
2,500,542
|
|
(35.7
|
)
|
—
|
|
—
|
|
—
|
|
(35.7
|
)
|
—
|
|
(35.7
|
)
|
|||||||||||||||||
|
Partnership unit repurchases
|
—
|
|
—
|
|
—
|
|
—
|
|
—
|
|
—
|
|
—
|
|
—
|
|
(12.8
|
)
|
(12.8
|
)
|
|||||||||||||||||
|
At December 31, 2015
|
71,489,448
|
|
$
|
0.7
|
|
7,477,657
|
|
$
|
(140.7
|
)
|
$
|
486.1
|
|
$
|
(19.8
|
)
|
$
|
(36.4
|
)
|
$
|
289.9
|
|
$
|
332.9
|
|
$
|
622.8
|
|
|||||||||
(See Accompanying Notes)
81
SunCoke Energy, Inc.
Notes to Consolidated Financial Statements
1. General and Basis of Presentation
Description of Business
SunCoke Energy, Inc. (“SunCoke Energy,” “Company,” “we,” “our” and “us”) is the largest independent producer of high-quality coke in the Americas, as measured by tons of coke produced each year, and has more than
50 years
of coke production experience. Coke is a principal raw material in the blast furnace steelmaking process. Coke is generally produced by heating metallurgical coal in a refractory oven, which releases certain volatile components from the coal, thus transforming the coal into coke. We also provide coal handling and/or mixing services at our Coal Logistics terminals.
We have designed, developed, built, own and operate
five
cokemaking facilities in the United States (“U.S.”) with collective nameplate capacity to produce approximately
4.2 million
tons of coke per year. Additionally, we have designed and operate
one
cokemaking facility in Brazil under licensing and operating agreements on behalf of our customer. We have a preferred stock investment in the project company that owns this facility, which has approximately
1.7 million
tons of annual cokemaking capacity. In March 2013, we formed a cokemaking joint venture with VISA Steel Limited ("VISA Steel") in India called VISA SunCoke Limited ("VISA SunCoke"), which has cokemaking capacity of approximately
440 thousand
tons of coke per year.
Our cokemaking ovens utilize efficient, modern heat recovery technology designed to combust the coal’s volatile components liberated during the cokemaking process and use the resulting heat to create steam or electricity for sale. This differs from by-product cokemaking, which repurposes the coal’s liberated volatile components for other uses. We have constructed the only greenfield cokemaking facilities in the U.S. in the last
25
years and are the only North American coke producer that utilizes heat recovery technology in the cokemaking process. We believe that heat recovery technology has several advantages over the alternative by-product cokemaking process, including producing higher quality coke, using waste heat to generate steam or electricity for sale and reducing the environmental impact.
Our Granite City facility, the first phase of our Haverhill facility, or Haverhill 1, and our VISA SunCoke joint venture have steam generation facilities, which use hot flue gas from the cokemaking process to produce steam for sale to customers pursuant to steam supply and purchase agreements. Granite City sells steam to U.S. Steel, and VISA SunCoke sells steam to VISA Steel. Previously, Haverhill 1 sold steam to Haverhill Chemicals LLC ("Haverhill Chemicals"), which filed for relief under Chapter 11 of the U.S. Bankruptcy Code during 2015. Beginning in the fourth quarter of 2015, Haverhill 1 provides steam, at no cost, to Altivia Petrochemicals, LLC ("Altivia"), which purchased the facility from Haverhill Chemicals. While the Company is not currently generating revenues from providing steam to Altivia, the current arrangement, for which rates may be renegotiated beginning in 2018, mitigates costs associated with disposing of steam as well as potential compliance issues. Our Middletown facility and the second phase of our Haverhill facility, or Haverhill 2, have cogeneration plants that use the hot flue gas created by the cokemaking process to generate electricity, which is either sold into the regional power market or to AK Steel pursuant to energy sales agreements.
Our Coal Logistics business provides coal handling and/or mixing services to steel, coke (including some of our domestic cokemaking facilities), electric utility and coal mining customers. During 2015, we acquired Convent Marine Terminal ("CMT") located in Convent, Louisiana, which represents a significant expansion of the Coal Logistics business and marks our entry into export coal handling. We also have terminals in East Chicago, Indiana and in West Virginia and Kentucky. Inclusive of the acquisition of CMT, the Coal Logistics business has the collective capacity to mix and/or transload more than
40 million
tons of coal annually and has storage capacity of
3 million
tons.
At December 31, 2015, we control approximately
109 million
tons of proven and probable coal mining reserves in Virginia and West Virginia
, a portion of which are currently mined by contractors
.
Our consolidated financial statements include SunCoke Energy Partners, L.P. (the "Partnership"), a publicly-traded partnership. At
December 31, 2015
, we owned the general partner of the Partnership, which consists of a
2.0 percent
ownership interest and incentive distribution rights, and a
53.9 percent
limited partner interest in the Partnership. The remaining
44.1 percent
interest in the Partnership was held by public unitholders.
Consolidation and Basis of Presentation
The consolidated financial statements of the Company and its subsidiaries were prepared in accordance with accounting principles generally accepted in the U.S. ("GAAP") and include the assets, liabilities, revenues and expenses of the Company and all subsidiaries where we have a controlling financial interest. Intercompany transactions and balances have been eliminated in consolidation.
82
2. Summary of Significant Accounting Policies
Use of Estimates
The preparation of financial statements in conformity with GAAP requires management to make estimates and assumptions that affect the amounts reported in the consolidated financial statements and accompanying notes. Actual amounts could differ from these estimates.
Reclassifications
Certain amounts in the prior period consolidated financial statements have been reclassified to conform to the current year presentation.
Currency Translation
The functional currency of the Company’s Brazilian operations and India joint venture are the Brazilian real and Indian rupee, respectively. The Company’s foreign operations translate their assets and liabilities into U.S. dollars at the current exchange rates in effect at the end of the fiscal period. The gains or losses that result from this process are shown as cumulative translation adjustments within accumulated other comprehensive loss in the Consolidated Balance Sheets. The revenue and expense accounts of foreign operations are translated into U.S. dollars at the average exchange rates that prevailed during the period.
Some transactions of the Company’s Brazilian operations and India joint venture are conducted in currencies different from their functional currency. Gains and losses from these foreign currency transactions are included in income as they occur. Our share of equity method losses in India resulting from foreign currency transactions was
$0.6 million
,
$0.3 million
and
$1.5 million
for the years ended
December 31, 2015
,
2014
and
2013
, respectively. The gains from these foreign currency transactions from our Brazilian operations were
$0.9 million
,
$0.4 million
and
$0.1 million
during the years ended December 31,
2015
,
2014
and
2013
, respectively.
Revenue Recognition
The Company sells metallurgical coal and coke as well as steam and electricity and also provides coal mixing and/or handling services to third-party customers. The Company also receives fees for operating the cokemaking plant in Brazil and for the licensing of its proprietary technology for use at this facility as well as reimbursement of substantially all of its operating costs. Revenues related to the sale of products are recognized when title passes, while service revenues are recognized when services are provided as defined by customer contracts. Licensing fees, which are determined on a per ton basis, are recognized when coke is produced in accordance with the contract terms. Title passage generally occurs when products are shipped or delivered in accordance with the terms of the respective sales agreements. Revenues are not recognized until sales prices are fixed or determinable and collectability is reasonably assured.
Substantially all of the coke produced by the Company is sold pursuant to long-term contracts with its customers. The Company evaluates each of its contracts to determine whether the arrangement contains a lease under the applicable accounting standards. If the specific facts and circumstances indicate that it is remote that parties other than the contracted customer will take more than a minor amount of the coke that will be produced by the property, plant and equipment during the term of the coke supply agreement, and the price that the customer is paying for the coke is neither contractually fixed per unit nor equal to the current market price per unit at the time of delivery, then the long-term contract is deemed to contain a lease. The lease component of the price of coke represents the rental payment for the use of the property, plant and equipment, and all such payments are accounted for as contingent rentals as they are only earned by the Company when the coke is delivered and title passes to the customer. The total amount of revenue recognized by the Company for these contingent rentals represents less than
10 percent
of combined sales and other operating revenues for each of the years ended
December 31, 2015
,
2014
and
2013
.
The Company receives payment for shortfall obligations on certain Coal Logistics take-or-pay contracts. The payments in excess of services performed are recorded as deferred revenue and are included in accrued liabilities on the Consolidated Balance Sheets. Deferred revenue on take-or-pay contracts is recognized into income when earned as determined by the terms of the contract. See
Note 15
.
Business Combinations
On August 12, 2015, the Partnership completed the acquisition of a
100 percent
ownership interest in Raven Energy LLC, which owns CMT, for a total transaction value of
$403.1 million
. Assets acquired and liabilities assumed as part of a business acquisition are generally recorded at their fair value at the date of acquisition. The excess of purchase price over the fair value of assets acquired and liabilities assumed is recorded as goodwill. In determining the fair values of assets acquired and liabilities assumed, we make significant estimates and assumptions, particularly with respect to long-lived tangible and intangible assets. Critical estimates used in valuing tangible and intangible assets include, but are not limited to, future
83
expected cash flows, discount rates, market prices and asset lives. Although our estimates of fair value are based upon assumptions believed to be reasonable, actual results may differ.
See
Note 3
.
Cash Equivalents
The Company considers all highly liquid investments with a remaining maturity of three months or less at the time of purchase to be cash equivalents. These cash equivalents consist principally of time deposits and money market investments.
Inventories
Inventories are valued at the lower of cost or market. Cost is determined using the first-in, first-out method, except for the Company’s materials and supplies inventory, which are determined using the average-cost method.
The Company utilizes the selling prices under its long-term coke supply contracts to record lower of cost or market inventory adjustments.
Properties, Plants and Equipment
Plants and equipment are depreciated on a straight-line basis over their estimated useful lives. Coke and energy plant, machinery and equipment are depreciated over
25
to
30
years. Coal Logistics plant and equipment are depreciated over
15
to
35
years. All depreciation and amortization is excluded from cost of products sold and operating expenses and is presented separately on the Consolidated Statements of Operations. Gains and losses on the disposal or retirement of fixed assets are reflected in earnings when the assets are sold or retired. Amounts incurred that extend an asset’s useful life, increase its productivity or add production capacity are capitalized. The Company had capitalized interest costs related to its environmental remediation projects and capital expansion projects at CMT of
$3.7 million
in
2015
, and capitalized interest costs related to its environmental remediation projects of
$3.2 million
and
$1.0 million
in
2014
and
2013
, respectively. See
Note 18
. Direct costs, such as outside labor, materials, internal payroll and benefits costs incurred during capital projects are capitalized; indirect costs are not capitalized. Normal repairs and maintenance costs are expensed as incurred.
We revised the estimated useful lives of certain assets at our domestic cokemaking facilities and recorded additional depreciation of
$10.2 million
,
$15.6 million
and
$9.5 million
, or
$0.16
,
$0.23
and
$0.14
per common share, during
2015
,
2014
and
2013
, respectively.
Additionally, in 2014, the Company revised the estimated useful lives of certain coal preparation plant assets, which resulted in additional depreciation in our Coal Mining segment of
$4.9 million
and
$1.0 million
, or
$0.08
and
$0.01
per common share, during
2015
and
2014
, respectively.
See
Note 25
.
Impairment of Long-Lived Assets and Equity Method Investment
Long-lived assets are reviewed for impairment whenever events or changes in circumstances indicate that the carrying amount of the assets may not be recoverable. Such events and circumstances include, among other factors: operating losses; unused capacity; market value declines; changes in the expected physical life of an asset; technological developments resulting in obsolescence; changes in demand for our products or in end-use goods manufactured by others utilizing our products as raw materials; changes in our business plans or those of our major customers, suppliers or other business partners; changes in competition and competitive practices; uncertainties associated with the U.S. and world economies; changes in the expected level of capital, operating or environmental remediation project expenditures; and changes in governmental regulations or actions.
A long-lived asset, or group of assets, is considered to be impaired when the undiscounted net cash flows expected to be generated by the asset are less than its carrying amount. Such estimated future cash flows are highly subjective and are based on numerous assumptions about future operations and market conditions. The impairment recognized is the amount by which the carrying amount exceeds the fair market value of the impaired asset, or group of assets. It is also difficult to precisely estimate fair market value because quoted market prices for our long-lived assets may not be readily available. Therefore, fair market value is generally based on the present values of estimated future cash flows using discount rates commensurate with the risks associated with the assets being reviewed for impairment.
During 2014, we recorded total impairment charges related to the Coal Mining business of
$150.3 million
, including both long-lived asset and goodwill impairment charges on our coal mining assets previously held for sale, which were stated at fair value less costs to sell.
Additionally, during
2015
and
2014
, we recorded other-than-temporary impairment charges on our investment in VISA SunCoke of
$19.4 million
and
$30.5 million
, respectively. These impairment charges were included in loss from equity method investment on the Consolidated Statement of Operations and brought our investment in VISA SunCoke to
zero
.
See
Note 5
,
Note 6
and
Note 24
.
Cash flows at our Indiana Harbor facility were negative during 2015, driven by changes to our contracted reimbursement of operating and maintenance costs as well as volume shortfalls caused by operational inefficiencies. Based on these results and recent operational challenges, we performed an impairment test and concluded that our undiscounted cash flows were sufficient to recover our long-lived assets at Indiana Harbor. However, we continue to closely monitor our
84
performance at Indiana Harbor, and if operational challenges continue or conditions deteriorate, our current conclusion as to recoverability of assets at that location could change.
Goodwill and Other Intangibles
Goodwill, which represents the excess of the purchase price over the fair value of net assets acquired, is tested for impairment as of October 1 of each year, or when events occur or circumstances change that would, more likely than not, reduce the fair value of a reporting unit to below its carrying value. The Company had goodwill carrying amounts of
$71.1 million
and
$11.6 million
as of
December 31, 2015
and 2014, respectively. The analysis of potential goodwill impairment employs a two-step process. The first step involves the estimation of fair value of our reporting units. If step one indicates that impairment of goodwill potentially exists, the second step is performed to measure the amount of impairment, if any. Goodwill impairment exists when the estimated implied fair value of goodwill is less than its carrying value. There were no impairments, other than those previously discussed, of goodwill or other intangible assets during the periods presented. See
Note 12
and
Note 24
.
We have finite-lived intangible assets with net values of
$190.2 million
and
$10.4 million
as of
December 31, 2015
and 2014, respectively. Intangible assets are primarily comprised of customer contracts, customer relationships and permits. Intangible assets are amortized over their useful lives in a manner that reflects the pattern in which the economic benefit of the intangible asset is consumed. Intangible assets are assessed for impairment when a triggering event occurs. No triggering events occurred during periods presented. See
Note 12
.
Investment in Brazilian Cokemaking Operations
SunCoke Energy’s investment in preferred shares of the company that owns the cokemaking facility in Vitória, Brazil, which SunCoke Energy operates under licensing and operating agreements, is accounted for at cost. Income received by SunCoke Energy from this investment, which is in the form of a dividend, is contingent upon achieving certain minimum production levels at the facility and payment is guaranteed by the parent company of the plant’s owner, which is a lessee of the facility. Accordingly, the Company recognizes income from this investment in other income on the Consolidated Statements of Operations when certain required production levels have been met and the amount is deemed collectible, typically in the fourth quarter.
Income Taxes
Deferred tax asset and liabilities are measured using enacted tax rates expected to apply to taxable income in the years in which those differences are projected to be recovered or settled.
The Company recognizes uncertain tax positions in its financial statements when minimum recognition threshold and measurement attributes are met in accordance with current accounting guidance. Unrecognized tax benefits and accruals for interest and penalties are included in other deferred credits and liabilities on the Consolidated Balance Sheets. The Company recognizes interest related to unrecognized tax benefits in interest expense and penalties in income tax expense on the Consolidated Statements of Operations.
Retirement Benefit Liabilities
The postretirement benefit plans are unfunded and the accumulated postretirement benefit obligation is fully recognized on the Consolidated Balance Sheets. Actuarial gains (losses) and prior service (benefits) costs which have not yet been recognized in net income are recognized as a credit (charge) to accumulated other comprehensive loss. The credit (charge) to accumulated other comprehensive loss, which is reflected net of related tax effects, is subsequently recognized in net income when amortized as a component of postretirement benefit plans expense. In addition, the credit (charge) may also be recognized in net income as a result of a plan curtailment or settlement.
Effective May 30, 2014, Dominion Coal Corporation ("Dominion Coal"), a wholly-owned subsidiary of the Company, terminated its defined benefit plan, a plan that was previously offered generally to all full-time employees of Dominion Coal. In June 2015, the plan settled its obligations by purchasing annuities using plan assets, which triggered settlement accounting and resulted in a non-cash loss of
$12.6 million
recorded in cost of products sold and operating expense on the Consolidated Statements of Operations.
See
Note 14
.
Asset Retirement Obligations
The fair value of a liability for an asset retirement obligation is recognized in the period in which it is incurred if a reasonable estimate of fair value can be made. The associated asset retirement costs are capitalized as part of the carrying amount of the asset and depreciated over its remaining estimated useful life. The Company’s asset retirement obligations primarily relate to costs associated with restoring land to its original state.
85
Shipping and Handling Costs
Shipping and handling costs are included in cost of products sold and operating expenses on the Consolidated Statements of Operations.
Share-based Compensation
We measure the cost of employee services in exchange for an award of equity instruments based on the grant-date fair value of the award. The total cost is reduced by estimated forfeitures over the awards’ vesting period, and the cost is recognized over the requisite service period. Forfeiture estimates are reviewed on an annual basis.
Fair Value Measurements
The Company determines fair value as the price that would be received to sell an asset or paid to transfer a liability in an orderly transaction between market participants at the measurement date. As required, the Company utilizes valuation techniques that maximize the use of observable inputs (levels 1 and 2) and minimize the use of unobservable inputs (level 3) within the fair value hierarchy included in current accounting guidance. The Company generally applies the “market approach” to determine fair value. This method uses pricing and other information generated by market transactions for identical or comparable assets and liabilities. Assets and liabilities are classified within the fair value hierarchy based on the lowest level (least observable) input that is significant to the measurement in its entirety.
Recently Issued Pronouncements
In November 2015, Financial Accounting Standards Board ("FASB") issued Accounting Standards Update ("ASU") 2015-17, "Income Taxes (Topic 740): Balance Sheet Classification of Deferred Taxes." ASU 2015-17 requires that deferred tax assets and liabilities be classified as noncurrent in a classified statement of financial position. It is effective for fiscal years, and interim periods within those fiscal years, beginning after December 15, 2016, with early adoption permitted. The Company early adopted this ASU retrospectively during the fourth quarter of 2015. See
Note 9
.
In September 2015, FASB issued ASU 2015-16, "Business Combinations (Topic 805): Simplifying the Accounting for Measurement-Period Adjustments." ASU 2015-16 eliminates the requirement to retrospectively account for adjustments made to provisional amounts recognized at the acquisition date. It is effective for fiscal years, and interim periods within those fiscal years, beginning after December 15, 2015, with early adoption permitted. The Company early adopted this ASU during the third quarter of 2015. The Company does not expect this ASU to have a material effect on the Company's financial condition, results of operations, or cash flows.
In August 2015, the FASB issued ASU 2015-14, “Revenue from Contracts with Customers (Topic 606): Deferral of the Effective Date,” which defers the effective date of ASU 2014-09 by one year. This ASU is effective for annual reporting periods beginning after December 15, 2017, including interim periods within that reporting period and permits early adoption on a limited basis. ASU 2014-09, “Revenue from Contracts with Customers,” requires an entity to recognize revenue upon transfer of promised goods or services to customers in an amount that reflects the consideration to which the company expects to be entitled in exchange for those goods or services. The guidance also requires additional disclosure about the nature, amount, timing, and uncertainty of revenue and cash flows arising from the customer contracts, including significant judgments and changes in judgments and assets recognized from costs incurred to obtain or fulfill a contract. The Company is currently reviewing the provisions of ASU 2014-09 but does not expect it to have a material effect on the Company's financial condition, results of operations, and cash flows.
In July 2015, the FASB issued ASU 2015-11, "Inventory (Topic 330): Simplifying the Measurement of Inventory." ASU 2015-11 requires an entity to measure inventory at the lower of cost and net realizable value, removing the consideration of current replacement cost. It is effective for fiscal years, and interim periods within those fiscal years, beginning after December 15, 2016, with early adoption permitted. The Company does not expect this ASU to have a material effect on the Company's financial condition, results of operations, or cash flows.
In April 2015, the FASB issued ASU 2015-03, "Interest—Imputation of Interest (Subtopic 835-30): Simplifying the Presentation of Debt Issuance Cost." ASU 2015-03 requires that debt issuance costs related to a recognized debt liability be presented in the balance sheet as a direct deduction from the carrying amount of that debt liability, consistent with debt discounts. It is effective for fiscal years, and interim periods within those fiscal years, beginning after December 15, 2015, with early adoption permitted. The Company early adopted this ASU during the first quarter of 2015. See Note 9.
In February 2015, the FASB issued ASU 2015-02, "Consolidation (Topic 810): Amendments to the Consolidation Analysis." ASU 2015-02 eliminates the deferral of FASB Statement No. 167, "Amendments to FASB Interpretation No. 46(R)," and makes changes to both the variable interest model and the voting model. It is effective for fiscal years, and interim periods within those fiscal years, beginning after December 15, 2015, with early adoption permitted. The Company does not expect this ASU to have a material effect on the Company's financial condition, results of operations, or cash flows.
86
Labor Concentrations
As of December 31,
2015
, we have approximately
1,125
employees in the U.S. Approximately
32 percent
of our domestic employees, principally at our cokemaking operations, are represented by the United Steelworkers union under various contracts. Additionally, approximately
2 percent
of our domestic employees are represented by the International Union of Operating Engineers.
On
July 27, 2015
, we reached a new
four
-year labor agreement for our Haverhill location, which will expire on
November 1, 2019
. The labor agreement at our Indiana Harbor cokemaking facility expired on
September 1, 2015
. We are currently negotiating the extension of the agreement and do not anticipate any work stoppages. The labor agreements at our Quincy and Lake Terminal coal handling facilities expire on
April 30, 2016
and
June 30, 2016
, respectively. We will be negotiating the renewal of these agreements in 2016 and do not anticipate any work stoppages.
As of
December 31, 2015
, we have approximately
273
employees at the cokemaking facility in Vitória, Brazil, all of whom are represented by a union under a labor agreement. The labor agreement at our Vitoria, Brazil facility expired on
October 31, 2015
. We are currently negotiating the extension of the agreement and do not anticipate any work stoppages.
3. Acquisitions
Convent Marine Terminal Acquisition
On
August 12, 2015
, the Partnership completed the acquisition of a
100 percent
ownership interest in Raven Energy LLC, which owns CMT, for a total transaction value of
$403.1 million
. This transaction represents a significant expansion of the Partnership's Coal Logistics business and marks our entry into export coal handling. CMT is one of the largest export terminals on the U.S. Gulf Coast and provides strategic access to seaborne markets for coal and other industrial materials. Supporting low-cost Illinois basin coal producers, the terminal provides loading and unloading services and has direct rail access and the current capability to transload
10 million
tons of coal annually. The facility is supported by long-term contracts with volume commitments covering all of its current
10 million
ton capacity.
The total transaction value of
$403.1 million
included the issuance of
4.8 million
of the Partnership's common units to the previous owner of Raven Energy LLC, The Cline Group, with an aggregate value of $
75.0 million
, based on the unit price on the date of close. In addition, the Partnership assumed a
$114.9 million
, six-year term loan from Raven Energy LLC. The Partnership obtained additional funding for the transaction by drawing
$185.0 million
on the Partnership's revolving credit facility. The Partnership paid
$191.7 million
in cash, which was partially funded by SunCoke in exchange for
1.8 million
of the Partnership's common units, with an aggregate value of
$30.0 million
. In connection with the acquisition, the Company made a capital contribution to the Partnership of approximately
$2.3 million
in order to preserve its 2 percent general partner interest. An additional
$21.5 million
in cash was withheld to fund the completion of expansion capital improvements at CMT, which is recorded in restricted cash on the Consolidated Balance Sheets.
87
The following table summarizes the consideration transferred to acquire CMT and the amounts of identified assets acquired and liabilities assumed based on the estimated fair value at the acquisition date:
|
Consideration:
|
(Dollars in millions)
|
||
|
Cash
|
$
|
191.7
|
|
|
Partnership common units
|
75.0
|
|
|
|
Assumption of Raven Energy LLC term loan
|
114.9
|
|
|
|
Cash withheld to fund capital expenditures
|
21.5
|
|
|
|
Total consideration transferred
|
$
|
403.1
|
|
|
Recognized amounts of identifiable assets acquired and liabilities assumed:
|
|||
|
Receivables
|
$
|
5.9
|
|
|
Inventories
|
1.7
|
|
|
|
Other current assets
|
0.1
|
|
|
|
Properties, plants and equipment, net
|
145.1
|
|
|
|
Intangible assets
|
185.0
|
|
|
|
Accounts payable
|
(0.6
|
)
|
|
|
Accrued liabilities
(1)
|
(7.2
|
)
|
|
|
Current portion of long-term debt
|
(1.1
|
)
|
|
|
Long-term debt
|
(113.8
|
)
|
|
|
Contingent consideration
|
(7.9
|
)
|
|
|
Net recognized amounts of identifiable assets acquired
|
$
|
207.2
|
|
|
Goodwill
|
59.5
|
|
|
|
Total assets acquired, net of liabilities assumed
|
$
|
266.7
|
|
|
Plus:
|
|||
|
Debt assumed
|
114.9
|
|
|
|
Cash withheld to fund capital expenditures
|
21.5
|
|
|
|
Total consideration
|
$
|
403.1
|
|
(1) Payments in excess of services performed are recorded as deferred revenue and are excluded from sales and other operating income related to the timing of revenue recognition. Deferred revenue on take-or-pay contracts is recognized into income when earned as determined by the terms of the contract. CMT had deferred revenue of
$6.5 million
as of August 12, 2015.
The purchase price allocation has been determined provisionally and is subject to revision as additional information about the fair value of individual assets and liabilities becomes available. The Partnership is in the process of finalizing appraisals of tangible and intangible assets acquired. Accordingly, the provisional measurements are subject to change. Any change in the acquisition date fair value of acquired net assets will change the amount of the purchase price allocated to goodwill. Subsequent to September 30, 2015, minor measurement period adjustments were made to the preliminary purchase price allocation that impacted goodwill, receivables, accounts payable and accrued liabilities and are reflected in the table above.
Goodwill represents the excess of the purchase price over the fair value of the net tangible and intangible assets acquired. The primary factors that contributed to a premium in the purchase price and the resulting recognition of goodwill were the value of additional capacity and potential for future additional throughput.
The purchase price allocation to identifiable intangible assets, which are all amortizable, along with their respective weighted-average amortization periods at the acquisition date are as follows:
|
Purchase Price allocation to identifiable intangible assets
|
Weighted - Average Remaining Amortization Years
|
(Dollars in millions)
|
|||
|
Customer contracts
|
7
|
$
|
24.0
|
|
|
|
Customer relationships
|
17
|
22.0
|
|
||
|
Permits
|
27
|
$
|
139.0
|
|
|
|
Total purchase price allocation to identifiable intangible assets
|
$
|
185.0
|
|
||
88
The purchase price includes a contingent consideration arrangement that requires the Partnership to make future payments to The Cline Group based on future volume, price, and contract renewals. The fair value of the contingent consideration at the acquisition date was estimated at
$7.9 million
and was based on a probability-weighted analysis using significant inputs that are not observable in the market, or Level 3 inputs. Key assumptions included probability adjusted levels of coal handling services provided by CMT, anticipated price per ton on future sales, and probability of contract renewal including length of future contracts, volume commitment, and anticipated price per ton. Contingent consideration is included in other deferred credits and liabilities on the Consolidated Balance Sheet.
The results of CMT have been included in the consolidated financial statements since the date of acquisition and are reported in the Coal Logistics segment. CMT contributed revenues of
$28.6 million
and operating income of
$18.4 million
from the date of acquisition to
December 31, 2015
.
The following unaudited pro forma combined results of operations were prepared using historical financial information of CMT and assumes that the acquisition of CMT occurred on January 1, 2014:
|
Years Ended December 31,
|
|||||||
|
2015
|
2014
|
||||||
|
(Dollars in millions)
|
|||||||
|
Total revenues
|
$
|
1,395.4
|
|
$
|
1,564.0
|
|
|
|
Net income (loss)
|
9.7
|
|
(81.1
|
)
|
|||
|
Net loss attributable to SunCoke Energy, Inc.
|
(22.3
|
)
|
(114.7
|
)
|
|||
|
Loss attributable to SunCoke Energy, Inc. per common share:
|
|||||||
|
Basic
|
$
|
(0.34
|
)
|
$
|
(1.67
|
)
|
|
|
Diluted
|
$
|
(0.34
|
)
|
$
|
(1.67
|
)
|
|
The unaudited pro forma combined results of operations reflect historical results adjusted for interest expense, depreciation adjustments based on the fair value of acquired property, plant and equipment, amortization of acquired identifiable intangible assets, and income tax expense. The pro forma combined results do not include acquisition costs or new contracts.
The unaudited pro forma combined and consolidated financial statements are presented for informational purposes only and do not necessarily reflect future results given the timing of new customer contracts, revenue recognition related to take-or-pay shortfalls, and other effects of integration, nor do they purport to be indicative of the results of operations that actually would have resulted had the acquisition of CMT occurred on
January 1, 2014
or future results.
The Partnership incurred
$3.5 million
in acquisition and business development costs related to CMT as well as other targets for 2015.
These expenses are included in selling, general and administrative expenses on the Consolidated Statements of Operations.
Kanawha River Terminal LLC
On
October 1, 2013
, the Partnership acquired Kanawha River Terminals ("KRT") for
$84.7 million
, utilizing
$44.7 million
of available cash and
$40.0 million
of borrowings under its revolving credit facility. KRT is a leading metallurgical and thermal coal mixing and handling service provider with collective capacity to mix and transload more than
30 million
tons of coal annually through its operations in West Virginia and Kentucky. KRT has and will continue to provide coal handling and mixing services to third-party customers as well as certain SunCoke cokemaking facilities. This acquisition was part of the Company’s strategy to grow through adjacent business lines. Goodwill of
$8.2 million
arising from the acquisition was primarily due to the strategic location of KRT’s operations.
89
The following table summarizes the consideration paid for KRT and the fair value of assets acquired and liabilities assumed at the acquisition date:
|
Consideration:
|
(Dollars in millions)
|
||
|
Cash
|
$
|
84.7
|
|
|
Recognized amounts of identifiable assets acquired and liabilities assumed:
|
|||
|
Current assets
|
$
|
5.2
|
|
|
Plant, property and equipment
|
67.2
|
|
|
|
Intangible assets
|
7.9
|
|
|
|
Current liabilities
|
(3.7
|
)
|
|
|
Other long-term liabilities
|
(0.1
|
)
|
|
|
Total identifiable net assets assumed
|
$
|
76.5
|
|
|
Goodwill
|
8.2
|
|
|
|
Total consideration
|
$
|
84.7
|
|
The results of KRT have been included in the consolidated financial statements since the acquisition date and are included in the Coal Logistics segment. Inclusive of intersegment sales of
$6.5 million
$5.7 million
and
$1.2 million
, KRT had revenues of
$38.6 million
$41.6 million
and
$9.0 million
for the years ended
December 31, 2015
,
2014
, and
2013
, respectively. The acquisition of KRT increased operating income by
$4.9 million
,
$5.0 million
and
$1.0 million
for the years ended
December 31, 2015
,
2014
, and
2013
, respectively. The acquisition of KRT was not material to the Company’s consolidated financial statements; therefore, pro forma information has not been presented.
SunCoke Lake Terminal LLC
On
August 30, 2013
, the Partnership completed its acquisition of the assets and business operations of Lakeshore Coal Handling Corporation ("Lakeshore"), now called SunCoke Lake Terminal LLC ("Lake Terminal") for
$28.6 million
. Prior to the acquisition, the entity that owns SunCoke's Indiana Harbor cokemaking operations was a customer of Lakeshore and held the purchase rights to Lakeshore. Concurrent with the closing of the transaction, the Partnership paid
$1.8 million
to DTE Energy Company, the third-party investor owning a
15 percent
interest in the entity that owns Indiana Harbor, in consideration for assigning its share of the Lake Terminal buyout rights to the Partnership. The Partnership recognized this payment in selling, general, and administrative expenses on the Consolidated Statements of Operations during the period.
Located in East Chicago, Indiana, Lake Terminal does not take possession of coal but instead derives its revenue by providing coal handling and mixing services to its customers on a per ton basis. Lake Terminal has and will continue to provide coal handling and mixing services to SunCoke's Indiana Harbor cokemaking operations. In
September 2013
, Lake Terminal and Indiana Harbor entered into a new
10
-year contract with terms equivalent to those of an arm's-length transaction.
The following table summarizes the consideration paid for Lake Terminal and the fair value of the assets acquired at the acquisition date:
|
Consideration:
|
(Dollars in millions)
|
||
|
Cash
|
$
|
28.6
|
|
|
Recognized amounts of identifiable assets acquired and liabilities assumed:
|
|||
|
Plant, property and equipment
|
25.9
|
|
|
|
Inventory
|
2.7
|
|
|
|
Total consideration
|
$
|
28.6
|
|
The results of Lake Terminal have been included in the consolidated financial statements since the acquisition date and are included in the Coal Logistics segment. Inclusive of intersegment sales of
$13.9 million
,
$13.1 million
and
$4.3 million
, Lake Terminal had revenues of
$14.0 million
,
$13.4 million
and
$4.6 million
, for the years ended
December 31, 2015
,
2014
, and
2013
, respectively. The acquisition of Lake Terminal increased operating income by
$3.8 million
,
$1.7 million
and
$1.9 million
for the years ended
December 31, 2015
,
2014
, and
2013
, respectively. The acquisition of Lake Terminal was not material to the Company's consolidated financial statements; therefore, pro forma information has not been presented.
4. Partnership Initial Public Offering and Dropdown Transactions
Initial Public Offering
90
On
January 24, 2013
, we completed the initial public offering of SunCoke Energy Partners, L.P., a master limited partnership (“the Partnership”), through the sale of
13,500,000
common units representing limited partner interests in the Partnership in exchange for
$231.8 million
of net proceeds, net of
$24.7 million
of offering costs,
$6.0 million
of which were paid during 2012 (the "Partnership Offering"). Of these net proceeds,
$67.0 million
was retained by the Partnership for environmental remediation project expenditures and
$12.4 million
for sales discounts related to tax credits owed to our customers. Upon the closing of the Partnership Offering, we owned the general partner of the Partnership, which consists of a
2.0 percent
ownership interest and incentive distribution rights, and a
55.9 percent
limited partner interest in the Partnership. The remaining
42.1 percent
interest in the Partnership was held by public unitholders and was reflected in noncontrolling interest on our Consolidated Statements of Operations and Consolidated Balance Sheets beginning with the first quarter of 2013. Key assets of the Partnership at the time of formation were a
65 percent
interest in each of our Haverhill and Middletown cokemaking and heat recover facilities.
Haverhill and Middletown Dropdown
On
May 9, 2014
, SunCoke Energy contributed an additional
33 percent
interest in the Haverhill and Middletown cokemaking facilities to the Partnership for a total transaction value of
$365.0 million
(the "Haverhill and Middletown Dropdown.") After the Haverhill and Middletown Dropdown, SunCoke Energy continued to own the general partner of the Partnership, which consisted of a
2.0 percent
ownership interest and incentive distribution rights, and decreased its limited partner interest in the Partnership from
55.9 percent
to
54.1 percent
.
The remaining
43.9 percent
interest in the Partnership was held by public unitholders and was reflected as a noncontrolling interest in the consolidated financial statements.
The total transaction value included
2.7 million
common units totaling
$80.0 million
and
$3.3 million
of general partner interests. In addition, the Partnership assumed and repaid approximately
$271.3 million
o
f our outstanding debt and other liabilities, including a market premium of
$11.4 million
to complete the tender for and cancellation of certain of our Notes. The remaining transaction value of
$10.4 million
consisted of a
$3.4 million
cash payment from the Partnership and
$7.0 million
withheld by the Partnership to pre-fund our obligation to the Partnership for the anticipated cost of the environmental remediation project at Haverhill.
In conjunction with the Haverhill and Middletown Dropdown, the Partnership closed on the issuance of
3.2 million
common units to the public for
$88.7 million
of net proceeds
, completed on
April 30, 2014
,
and received approximately
$263.1 million
of gross proceeds from the issuance of
$250.0 million
aggregate principal amount of
7.375 percent
senior notes due 2020 through a private placement on
May 9, 2014
.
In addition, the Partnership received
$5.0 million
to fund interest from
February 1, 2014
to
May 9, 2014
, the period prior to the issuance. This interest was paid to noteholders on
August 1, 2014
.
We accounted for the Haverhill and Middletown Dropdown as an equity transaction, which resulted in a decrease in noncontrolling interest and an increase in SunCoke Energy's equity of
$83.7 million
, during the second quarter of 2014, representing the Partnership's common public unitholders' share of consideration paid for the acquisition, net of their share of the book value of ownership interest received.
Granite City Dropdowns
On
January 13, 2015
,
the Company contributed a
75 percent
interest in its Granite City, Illinois cokemaking facility ("Granite City") to the Partnership for a total transaction value of
$244.4 million
(the "Granite City Dropdown"). Subsequent to the Granite City Dropdown, we continued to own the general partner of the Partnership, which consisted of a
2 percent
ownership interest and incentive distribution rights, and a
56.1 percent
limited partner interest in the Partnership. The remaining
41.9 percent
limited partner interest in the Partnership was held by public unitholders and was reflected as a noncontrolling interest in the consolidated financial statements.
The total transaction value of
$244.4 million
included the issuance of
1.9 million
of the Partnership's common units with an aggregate value of
$50.1 million
to the Company and
$1.0 million
of general partner interests. In addition, the Partnership assumed and repaid
$135.0 million
of our
7.625 percent
senior notes due in
2019
("Notes") as well as
$5.6 million
of accrued interest, of which
$1.0 million
was included in interest expense, net on the Consolidated Statement of Operations. The total transaction value also included the applicable redemption premium of
$7.7 million
paid and included in interest expense, net on the Consolidated Statements of Operations. The Partnership withheld the remaining transaction value of
$45.0 million
to pre-fund our obligation to the Partnership for the anticipated cost of an environmental remediation project at Granite City. The Partnership funded the redemption of the Notes with net proceeds from a private placement of an additional
$200.0 million
of senior notes due in 2020 ("Partnership Notes"). See
Note 16
.
On
August 12, 2015
, the Company contributed an additional
23 percent
interest in Granite City to the Partnership for a total transaction value of
$65.2 million
(the "Granite City Supplemental Dropdown"). The transaction value for the Granite City Supplemental Dropdown included the issuance of
1.2 million
of the Partnership's common units totaling
$17.9 million
and
$0.4 million
of general partner interest to the Company. In addition, the Partnership assumed
$44.6 million
of our Notes and
$0.1 million
o
f accrued interest. The total transaction value also included interest incurred of
$0.5 million
, included
91
in interest expense, net on the Consolidated Statements of Operations, and the applicable redemption premium of approximately
$1.7 million
.
On
November 18, 2015
, SunCoke re-assumed the
$44.6 million
of Notes from the Partnership in exchange of cash from the Partnership.
We accounted for the Granite City Dropdown and Granite City Supplemental Dropdown as equity transactions, which resulted in an increase in noncontrolling interest and a decrease in SunCoke Energy's equity of
$6.5 million
and
$1.5 million
, respectively, representing the Partnership's common public unitholders' share of the book value of ownership interest received of
$114.7 million
, net of their share of the transaction value of
$106.7 million
. Subsequent to the Granite City Supplemental Dropdown and the units issued in connection with the acquisition of CMT (
Note 3
), we continue to own the general partner of the Partnership, which consists of a
2.0 percent
ownership interest and incentive distribution rights, and owned a
53.4 percent
limited partner interest in the Partnership. The remaining
44.6 percent
limited partner interest in the Partnership was held by public unitholders and was reflected as a noncontrolling interest in the consolidated financial statements.
The table below summarizes the effects of the changes in the Company’s ownership interest in Haverhill, Middletown and Granite City on SunCoke’s equity
.
|
Years Ended December 31,
|
|||||||
|
2015
|
2014
|
||||||
|
(Dollars in millions)
|
|||||||
|
Net loss attributable to SunCoke Energy, Inc.
|
$
|
(22.0
|
)
|
$
|
(126.1
|
)
|
|
|
Decrease in SunCoke Energy, Inc. equity for the contribution of 75 percent interest in Granite City
|
(6.5
|
)
|
—
|
|
|||
|
Decrease in SunCoke Energy, Inc. for the contribution of an additional 23 percent interest in Granite City
|
(1.5
|
)
|
—
|
|
|||
|
Increase in SunCoke Energy, Inc. equity for the contribution of 33 percent interest in Haverhill and Middletown
|
—
|
|
83.7
|
|
|||
|
Change from net loss attributable to SunCoke Energy, Inc. and dropdown transactions
|
$
|
(30.0
|
)
|
$
|
(42.4
|
)
|
|
5. Coal Mining Update
In July 2014, after the Company's Board of Directors authorized the Company to sell and/or otherwise dispose of the Company’s Coal Mining business, we reflected our coal mining operations as discontinued operations with the related assets and liabilities presented as held for sale in the Company's consolidated financial statements. During 2014, the Company recorded total impairment charges related to the coal business of
$150.3 million
, including long-lived asset and goodwill impairment charges as well as valuation impairment charges on the disposal group, which were stated at fair value less costs to sell. See
Note 24
.
During the second quarter of
2015
,
the Company determined that a sale of our coal mining business was no longer probable, and Coal Mining segment assets and liabilities were reclassified as held and used for all periods presented, at which time
the net assets were fair valued, with no net impact on the Consolidated Statements of Operations during
2015
. Additionally, the Consolidated Balance Sheet at
December 31, 2014
, was reclassified to reflect the coal mining assets and liabilities as held and used. There have been no changes since the second quarter of
2015
that would require further valuations of the Coal Mining business.
6. Investment in Visa SunCoke
On
March 18, 2013
, we completed a transaction to form a joint venture, VISA SunCoke, with VISA Steel. VISA SunCoke is comprised of a
440 thousand
ton heat recovery cokemaking facility and the facility's associated steam generation units in Odisha, India. We invested $
67.7 million
to acquire a
49 percent
interest in VISA SunCoke with VISA Steel holding the remaining
51 percent
interest. This investment was accounted for under the equity method under which investments are initially recorded at cost. We recognized our share of GAAP earnings in VISA SunCoke on a one-month lag and began recognizing such earnings in the second quarter of
2013
.
During
2014
, as the result of continued downward market pressures in India due to increased Chinese imports and restrictions on iron ore mining in India, which limited steel production, the Company evaluated its investment in Visa SunCoke for impairment and recorded an impairment charge of
$30.5 million
. During
2015
, continued decline in demand and price of coke in India led to an additional impairment of
$19.4 million
, resulting in an investment balance of
zero
. See
Note 24
. Consequently, beginning in the fourth quarter of
2015
, we no longer include the results of our share of VISA SunCoke in our consolidated financial statements. In accordance with GAAP, our share of future earnings of the joint venture will only be
92
included in our results once the cumulative investment balance is no longer negative. The Company's accumulated other comprehensive loss balance of
$9.0 million
from currency translation adjustments of the investment in VISA SunCoke remains until the cumulative investment balance is no longer negative or the investment is disposed. The balance would be reclassified to earnings if the investment is disposed by the Company. The Company has no plans to make further capital contributions to this investment. During the years ended
December 31, 2015
,
2014
, and
2013
, including the impairment charges, we incurred losses from the equity method investment in VISA SunCoke of
$21.6 million
,
$35.0 million
and
$2.2 million
, respectively.
7. Related Party Transactions
Our Coal Logistics business provides coal handling and storage services to Murray American Coal ("Murray") and Foresight Energy LP ("Foresight"), who are related parties with The Cline Group. Murray also holds a significant interest in Foresight. The Cline Group was the previous owner of Raven Energy LLC and currently owns a
10.3 percent
interest in the Partnership, which it acquired as part of the
August 12, 2015
CMT acquisition. See
Note 3
. Sales to Murray and Foresight accounted for
$22.0 million
, or
1.6 percent
,
of the Company’s sales and other operating revenue and were recorded in the Coal Logistics segments for the year ended
December 31, 2015
. At
December 31, 2015
, receivables from Murray and Foresight of
$7.2 million
were included in receivables on the Consolidated Balance Sheets.
8. Customer Concentrations
In
2015
, the Company sold approximately
4.1 million
tons of coke to its
three
primary Domestic Coke customers in the U.S.: AK Steel Corporation ("AK Steel"), ArcelorMittal USA, Inc. ("ArcelorMittal") and United States Steel Corporation ("U.S. Steel"). Substantially all of the production from the Jewell and Indiana Harbor facilities and approximately one-half of the production from the Haverhill facility is sold pursuant to long-term contracts with affiliates of ArcelorMittal. The remaining balance of coke sales at the Haverhill facility are primarily sold to AK Steel under long-term contracts. All coke sales from the Middletown cokemaking facility are made pursuant to a long-term contract with AK Steel. Substantially all coke sales from the Granite City cokemaking facility are made pursuant to a long-term contract with U.S. Steel. In addition, the licensing and operating fees, as well as preferred dividends pertaining to the Brazilian cokemaking operations, are payable to the Company under long-term contracts with a Brazilian subsidiary of ArcelorMittal.
Two
of our coke customers, AK Steel and U.S. Steel, have temporarily idled portions of their Ashland, Kentucky Works facility and Granite City Works facility, respectively. These temporary idlings do not change any obligations that AK Steel and/or U.S. Steel have under their long-term, take-or-pay contracts with us.
The table below shows sales to the Company's significant customers for the years ended December 31, 2015, 2014 and 2013 (dollars in millions):
|
Years ended December 31,
|
|||||||||||||||||||||
|
2015
|
2014
|
2013
|
|||||||||||||||||||
|
Sales and other operating revenue
|
Percent of Company sales and other operating revenue
|
Sales and other operating revenue
|
Percent of Company sales and other operating revenue
|
Sales and other operating revenue
|
Percent of Company sales and other operating revenue
|
||||||||||||||||
|
(Dollars in millions)
|
|||||||||||||||||||||
|
ArcelorMittal
(1)
|
$
|
662.3
|
|
49.0
|
%
|
$
|
771.9
|
|
51.8
|
%
|
$
|
826.7
|
|
50.6
|
%
|
||||||
|
AK Steel
(1)
|
$
|
395.4
|
|
29.3
|
%
|
$
|
402.4
|
|
27.0
|
%
|
$
|
489.7
|
|
30.0
|
%
|
||||||
|
U.S. Steel
(2)
|
$
|
212.7
|
|
15.7
|
%
|
$
|
249.2
|
|
16.7
|
%
|
$
|
276.6
|
|
16.9
|
%
|
||||||
(1) Represents revenues recorded in our Domestic Coke segment.
(2) Represents revenues recorded in our Domestic Coke and Coal Logistics segments.
Additionally, ArcelorMittal Brazil preferred dividends of
$9.5 million
were recorded in other income, net on the Consolidated Statements of Operations during
2015
,
2014
, and
2013
.
Total sales for services provided to Murray and Foresight were
$22.0 million
during 2015, which is
27.1 percent
of total Coal Logistics sales and other operating revenue, including intersegment sales, and
1.6 percent
of the Company’s consolidated sales and other operating revenue.
The Company generally does not require any collateral with respect to its receivables. At
December 31, 2015
, the Company’s receivables balance was primarily due from ArcelorMittal, AK Steel and U.S. Steel. As a result, the Company experiences concentrations of credit risk in its receivables with these
three
customers. These concentrations of credit risk may be affected by changes in economic or other conditions affecting the steel industry. At
December 31, 2015
, receivables due
93
from ArcelorMittal, AK Steel and U.S. Steel were
$25.5 million
,
$14.8 million
and
$5.9 million
,
respectively. Also included in receivables at
December 31, 2015
, was a
$9.5 million
preferred dividend from ArcelorMittal Brazil.
9. Income Taxes
The components of income (loss) before income tax (benefit) expense and loss from equity method investment are as follows:
|
|
Years Ended December 31,
|
||||||||||
|
|
2015
|
2014
|
2013
|
||||||||
|
|
(Dollars in millions)
|
||||||||||
|
Domestic
|
$
|
8.6
|
|
$
|
(137.0
|
)
|
$
|
46.5
|
|
||
|
Foreign
|
14.5
|
|
11.4
|
|
12.5
|
|
|||||
|
Total
|
$
|
23.1
|
|
$
|
(125.6
|
)
|
$
|
59.0
|
|
||
The components of income tax (benefit) expense are as follows:
|
|
Years Ended December 31,
|
||||||||||
|
|
2015
|
2014
|
2013
|
||||||||
|
|
(Dollars in millions)
|
||||||||||
|
Income taxes currently (receivable) payable:
|
|
|
|
||||||||
|
U.S. federal
|
$
|
(3.1
|
)
|
$
|
3.6
|
|
$
|
2.3
|
|
||
|
State
|
(3.3
|
)
|
(1.0
|
)
|
0.1
|
|
|||||
|
Foreign
|
3.2
|
|
3.0
|
|
2.7
|
|
|||||
|
Total taxes currently (receivable) payable
|
(3.2
|
)
|
5.6
|
|
5.1
|
|
|||||
|
Deferred tax (benefit) expense:
|
|
|
|
||||||||
|
U.S. federal
|
(12.7
|
)
|
(58.1
|
)
|
(6.3
|
)
|
|||||
|
State
|
7.1
|
|
(6.3
|
)
|
7.9
|
|
|||||
|
Total deferred tax (benefit) expense
|
(5.6
|
)
|
(64.4
|
)
|
1.6
|
|
|||||
|
Total
|
$
|
(8.8
|
)
|
$
|
(58.8
|
)
|
$
|
6.7
|
|
||
The reconciliation of the income tax (benefit) expense at the U.S. statutory rate to the income tax (benefit) expense is as follows:
|
|
Years Ended December 31,
|
|||||||||||||||||||
|
|
2015
|
2014
|
2013
|
|||||||||||||||||
|
|
(Dollars in millions)
|
|||||||||||||||||||
|
Income tax (benefit) expense at 35 percent U.S. statutory rate
|
$
|
8.0
|
|
35.0
|
%
|
$
|
(43.9
|
)
|
35.0
|
%
|
$
|
20.7
|
|
35.0
|
%
|
|||||
|
Increase (reduction) in income taxes resulting from:
|
||||||||||||||||||||
|
Income attributable to noncontrolling interests
(1)
|
(11.2
|
)
|
(48.3
|
)%
|
(8.7
|
)
|
6.9
|
%
|
(8.8
|
)
|
(14.9
|
)%
|
||||||||
|
Nonconventional fuel credit
|
—
|
|
—
|
%
|
—
|
|
—
|
%
|
(9.5
|
)
|
(16.0
|
)%
|
||||||||
|
State and other income taxes, net of federal income tax effects
|
1.8
|
|
7.7
|
%
|
(5.6
|
)
|
4.5
|
%
|
3.2
|
|
5.4
|
%
|
||||||||
|
Return-to-provision adjustments
|
—
|
|
—
|
%
|
—
|
|
—
|
%
|
(1.7
|
)
|
(2.9
|
)%
|
||||||||
|
Change in valuation allowance
(2)
|
(8.8
|
)
|
(38.0
|
)%
|
11.2
|
|
(9.1
|
)%
|
2.0
|
|
3.4
|
%
|
||||||||
|
Impact of tax sharing agreement
|
—
|
|
—
|
%
|
(0.7
|
)
|
0.6
|
%
|
0.7
|
|
1.2
|
%
|
||||||||
|
Investment in subsidiary
(2)
|
1.0
|
|
4.4
|
%
|
(11.9
|
)
|
9.5
|
%
|
—
|
|
—
|
%
|
||||||||
|
Coal impairment
|
—
|
|
—
|
%
|
2.4
|
|
(1.9
|
)%
|
—
|
|
—
|
%
|
||||||||
|
Prior year adjustment
|
—
|
|
—
|
%
|
(1.1
|
)
|
0.9
|
%
|
—
|
|
—
|
%
|
||||||||
|
Other
|
0.4
|
|
1.2
|
%
|
(0.5
|
)
|
0.4
|
%
|
0.1
|
|
0.2
|
%
|
||||||||
|
$
|
(8.8
|
)
|
(38.0
|
)%
|
$
|
(58.8
|
)
|
46.8
|
%
|
$
|
6.7
|
|
11.4
|
%
|
||||||
94
|
(1)
|
No income tax expense is reflected in the Consolidated Statements of Operations for partnership income attributable to noncontrolling interests.
|
|
(2)
|
On
December 22, 2014
, SunCoke executed a definitive agreement to sell
100 percent
of its interest in the entities that made up the Harold Keene Coal Companies. This required SunCoke to record a deferred tax asset of
$11.9 million
related to the outside basis difference on the Harold Keene investment. This deferred tax asset was offset by a
$9.8 million
valuation allowance. SunCoke canceled the definitive agreement during the third quarter of 2015. Due to the cancellation of the agreement, the deferred tax asset and the valuation allowance recorded during 2014 were reversed during 2015.
|
The tax effects of temporary differences that comprise the net deferred income tax liability from operations are as follows:
|
|
December 31,
|
||||||
|
|
2015
|
2014
|
|||||
|
|
(Dollars in millions)
|
||||||
|
Deferred tax assets:
|
|||||||
|
Retirement benefit liabilities
|
$
|
13.4
|
|
$
|
14.6
|
|
|
|
Black lung benefit liabilities
|
19.4
|
|
16.8
|
|
|||
|
Share-based compensation
|
8.4
|
|
6.9
|
|
|||
|
Federal tax credit carryforward
(1)
|
23.0
|
|
19.8
|
|
|||
|
Foreign tax credit carryforward
(2)
|
8.9
|
|
—
|
|
|||
|
Federal net operating loss
(3)
|
8.2
|
|
—
|
|
|||
|
State tax credit carryforward, net of federal income tax effects
(4)
|
6.4
|
|
9.2
|
|
|||
|
State net operating loss carryforward, net of federal income tax effects
(5)
|
7.4
|
|
5.4
|
|
|||
|
Other liabilities not yet deductible
|
12.0
|
|
19.4
|
|
|||
|
Properties, plants and equipment
|
12.0
|
|
—
|
|
|||
|
Investment in subsidiaries
|
—
|
|
11.8
|
|
|||
|
Total deferred tax assets
|
119.1
|
|
103.9
|
|
|||
|
Less valuation allowance
(6)
|
(5.8
|
)
|
(14.7
|
)
|
|||
|
Deferred tax asset, net
|
113.3
|
|
89.2
|
|
|||
|
Deferred tax liabilities:
|
|
|
|||||
|
Properties, plants and equipment
|
—
|
|
(85.0
|
)
|
|||
|
Investment in partnerships
|
(462.3
|
)
|
(299.7
|
)
|
|||
|
Total deferred tax liabilities
|
(462.3
|
)
|
(384.7
|
)
|
|||
|
Net deferred tax liability
|
$
|
(349.0
|
)
|
$
|
(295.5
|
)
|
|
|
(1)
|
Federal tax credit carryforward expires in 2032 through 2033.
|
|
(2)
|
Foreign tax credit carryforward expires in 2022 through 2025.
|
|
(3)
|
Federal net operating loss expires in 2035.
|
|
(4)
|
State tax credit carryforward, net of federal income tax effects expires in 2016 through 2020.
|
|
(5)
|
State net operating loss carryforward, net of federal income tax effects expires in 2017 through 2035.
|
|
(6)
|
Primarily related to state tax credit carryforward and state net operating loss carryforward.
|
Sunoco’s consolidated federal income tax returns have been examined by the Internal Revenue Service (“IRS”) for all years through the year ended October 4, 2012, the last year for which SunCoke was included on a Sunoco consolidated federal income tax return. Specifically related to SunCoke, the Sunoco consolidated federal income tax returns for all tax years between the years ended December 31, 2007 and October 4, 2012 remain open. Sunoco combined state income tax returns which specifically include SunCoke entities remain open for the years ended December 31, 2009 through October 4, 2012. SunCoke is currently open to examination by the IRS for the tax years ended December 31, 2012 and forward.
95
State and foreign income tax returns are generally subject to examination for a period of
three
to
five years
after the filing of the respective returns. The state impact of any amended federal returns remains subject to examination by various states for a period of up to
one
year after formal notification of such amendments to the states.
There were
no
uncertain tax positions at
December 31, 2015
, and
2014
and there were
no
interest or penalties recognized during the years ended
December 31, 2015
,
2014
and
2013
. The Company
does not expect
that any unrecognized tax benefits pertaining to income tax matters will be required in the next twelve months.
At
December 31, 2015
, our VISA SunCoke joint venture had cumulative losses. As such, there are currently no unconsolidated earnings that if remitted would result in additional tax. Further, in the event of earnings, such earnings are intended to be reinvested indefinitely to finance foreign activities. These additional foreign earnings could be subject to additional tax if remitted, or deemed remitted, as a dividend.
On July 18, 2011, SunCoke Energy and Sunoco entered into a new tax sharing agreement that governs the parties’ respective rights, responsibilities and obligations with respect to tax liabilities and benefits, tax attributes, the preparation and filing of tax returns, the control of audits and other tax proceedings and other matters regarding taxes.
SunCoke Energy is generally not entitled to receive payment from Sunoco in respect of any of SunCoke Energy’s tax attributes or tax benefits or any reduction of taxes of Sunoco. Moreover, Sunoco is generally entitled to refunds of income taxes with respect to periods ending at or prior to the distribution. If SunCoke Energy realizes any refund, credit or other reduction in otherwise required tax payments in any period beginning after the distribution date as a result of an audit adjustment resulting in taxes for which Sunoco would otherwise be responsible, then, subject to certain exceptions, SunCoke Energy must pay Sunoco the amount of any such taxes for which Sunoco would otherwise be responsible. Further, if any taxes are imposed on Sunoco as a result of a reduction in SunCoke Energy’s tax attributes for a period ending at or prior to the distribution date pursuant to an audit adjustment (relative to the amount of such tax attribute reflected on Sunoco’s tax return as originally filed), then, subject to certain exceptions, SunCoke Energy is generally responsible to pay Sunoco the amount of any such taxes.
SunCoke Energy has also agreed to certain restrictions that are intended to preserve the tax-free status of the contribution and the distribution. These covenants include restrictions on SunCoke Energy’s issuance or sale of stock or other securities (including securities convertible into our stock but excluding certain compensatory arrangements), and sales of assets outside the ordinary course of business and entering into any other corporate transaction which would cause SunCoke Energy to undergo a
50 percent
or greater change in its stock ownership. Certain key restrictions expired on
January 18, 2014
.
SunCoke Energy has generally agreed to indemnify Sunoco and its affiliates against any and all tax-related liabilities incurred by them relating to the contribution or the Distribution to the extent caused by an acquisition of SunCoke Energy’s stock or assets, or other of its actions. This indemnification applies even if Sunoco has permitted SunCoke Energy to take an action that would otherwise have been prohibited under the tax-related covenants as described above.
As of
December 31, 2015
, SunCoke Energy estimates that all tax benefits have been settled under the provisions of the tax sharing agreement. SunCoke Energy will continue to monitor the full utilization of all tax attributes when the respective tax returns are filed and will, consistent with the terms of the tax sharing agreement, record additional adjustments through earnings when necessary.
10. Inventories
The Company’s inventory consists of metallurgical coal, which is the principal raw material for the Company’s cokemaking operations, coke, which are the finished goods sold by the Company to its customers, and materials, supplies and other. These components of inventories were as follows:
|
|
December 31,
|
||||||
|
|
2015
|
2014
|
|||||
|
|
(Dollars in millions)
|
||||||
|
Coal
|
$
|
76.8
|
|
$
|
100.9
|
|
|
|
Coke
|
8.8
|
|
6.9
|
|
|||
|
Materials, supplies and other
|
36.5
|
|
34.4
|
|
|||
|
Total inventories
|
$
|
122.1
|
|
$
|
142.2
|
|
|
96
11. Properties, Plants, and Equipment, Net
The components of net properties, plants and equipment were as follows:
|
|
December 31,
(1)
|
||||||
|
|
2015
|
2014
|
|||||
|
|
(Dollars in millions)
|
||||||
|
Coke and energy plant, machinery and equipment
|
$
|
1,715.3
|
|
$
|
1,676.3
|
|
|
|
Coal logistics plant, machinery and equipment
|
159.4
|
|
83.6
|
|
|||
|
Land and land improvements
|
136.6
|
|
92.1
|
|
|||
|
Mining
(2)
|
148.4
|
|
151.5
|
|
|||
|
Construction-in-progress
(3)
|
106.1
|
|
65.6
|
|
|||
|
Other
|
30.8
|
|
30.2
|
|
|||
|
Gross investment, at cost
|
2,296.6
|
|
2,099.3
|
|
|||
|
Less: Accumulated depreciation
(2)
|
(703.2
|
)
|
(619.3
|
)
|
|||
|
Total properties, plants and equipment, net
|
$
|
1,593.4
|
|
$
|
1,480.0
|
|
|
|
(1)
|
Includes assets, consisting mainly of coke and energy plant, machinery and equipment, with a gross investment totaling
$1,278.3 million
and
$1,155.1 million
and accumulated depreciation of
$371.7 million
and
$262.4 million
at
December 31, 2015
and
December 31, 2014
, respectively, which are subject to long-term contracts to sell coke and are deemed to contain operating leases.
|
|
(2)
|
The net book value of our coal mining assets was
$13.1 million
and
$22.8 million
at
December 31, 2015
and
December 31, 2014
, respectively.
|
|
(3)
|
The
December 31, 2015
balance includes CMT construction-in-progress of
$37.3 million
. This expansion capital project at CMT was pre-funded in conjunction with the acquisition.
|
12. Goodwill and Other Intangible Assets
Goodwill allocated to SunCoke's reportable segments as of
December 31, 2015
and
2014
and changes in the carrying amount of goodwill during the fiscal years ended
December 31, 2015
and
2014
are as follows:
|
Domestic Coke
|
Coal Mining
|
Coal Logistics
|
Total
|
||||||||||||
|
(Dollars in millions)
|
|||||||||||||||
|
Net balance at December 31, 2013
|
$
|
3.4
|
|
$
|
6.0
|
|
$
|
8.2
|
|
$
|
17.6
|
|
|||
|
Impairment loss
(1)
|
—
|
|
(6.0
|
)
|
—
|
|
(6.0
|
)
|
|||||||
|
Net balance at December 31, 2014
|
$
|
3.4
|
|
$
|
—
|
|
$
|
8.2
|
|
$
|
11.6
|
|
|||
|
Goodwill acquired during the period
(2)
|
—
|
|
—
|
|
59.5
|
|
59.5
|
|
|||||||
|
Net balance at December 31, 2015
|
$
|
3.4
|
|
$
|
—
|
|
$
|
67.7
|
|
$
|
71.1
|
|
|||
(1)
As a result of the weakening coal market and the long-lived asset impairment relating to our Coal Mining segment, the Company performed a goodwill impairment analysis as of June 30, 2014 for the Coal Mining reporting unit. This analysis concluded that the fair value of the reporting unit, based on a discounted cash flows analysis, was less than the carrying amount. As a result, the Company recorded a
$6.0 million
pre-tax impairment of the entire goodwill balance. See
Note 24
.
(2)
The Company acquired CMT during 2015 for total consideration of
$403.1 million
, of which
$59.5 million
was allocated to goodwill, representing the value of additional capacity and potential for future additional throughput. See
Note 3
.
Goodwill, which represents the excess of the purchase price over the fair value of net assets acquired, is tested for impairment as of October 1 of each year, or when events occur or circumstances change that would, more likely than not, reduce the fair value of a reporting unit to below its carrying value. The analysis of potential goodwill impairment employs a two-step process. The first step involves the estimation of fair value of our reporting units. If step one indicates that impairment of goodwill potentially exists, the second step is performed to measure the amount of impairment, if any. Goodwill impairment exists when the estimated implied fair value of goodwill is less than its carrying value. The Company performed its annual
97
goodwill impairment test as of October 1, 2015, with no indication of impairment. The fair value of the Coal Logistics reporting unit exceeded carrying value of the reporting unit by approximately
15 percent
.
A significant portion of our Coal Logistics business holds long-term, take-or-pay contracts with Murray and Foresight. Key assumptions in our goodwill impairment test include continued customer performance against long-term, take-or-pay contracts and an
18 percent
discount rate representing the estimated weighted average cost of capital. The use of different assumptions, estimates or judgments, such as the estimated future cash flows of Coal Logistics and the discount rate used to discount such cash flows, could significantly impact the estimated fair value of a reporting unit, and therefore, impact the excess fair value above carrying value of the reporting unit. A
5 percent
change in estimated discounted cash flows of the reporting unit or a 100 basis point change in the discount rate would not have impacted the results of our step one analysis.
Despite the current challenging coal mining and coal export markets, our customers have continued to perform against their contracts, and our valuation model assumes continued performance under these contracts. However, to the extent changes in factors or circumstances occur, including further deterioration in the macro-economic environment or negative developments specific to our customers resulting from the difficulties being experienced in the coal and steel industries, future assessments of goodwill may result in impairment charges.
The following table summarized the components of gross and net intangible asset balances as of
December 31, 2015
and
December 31, 2014
:
|
December 31, 2015
|
December 31, 2014
|
||||||||||||||||||||||||
|
Weighted - Average Remaining Amortization Years
|
Gross Carrying Amount
|
Accumulated Amortization
|
Net
|
Gross Carrying Amount
|
Accumulated Amortization
|
Net
|
|||||||||||||||||||
|
(Dollars in millions)
|
|||||||||||||||||||||||||
|
Customer contracts
|
6
|
$
|
31.7
|
|
$
|
6.1
|
|
$
|
25.6
|
|
$
|
7.7
|
|
$
|
4.2
|
|
$
|
3.5
|
|
||||||
|
Customer relationships
|
14
|
28.7
|
|
1.8
|
|
26.9
|
|
6.7
|
|
0.7
|
|
6.0
|
|
||||||||||||
|
Permits
|
27
|
139.0
|
|
1.9
|
|
137.1
|
|
—
|
|
—
|
|
—
|
|
||||||||||||
|
Trade name
|
3
|
1.2
|
|
0.6
|
|
0.6
|
|
1.2
|
|
0.3
|
|
0.9
|
|
||||||||||||
|
Total
|
$
|
200.6
|
|
$
|
10.4
|
|
$
|
190.2
|
|
$
|
15.6
|
|
$
|
5.2
|
|
$
|
10.4
|
|
|||||||
Total amortization expense for intangible assets subject to amortization was
$5.1 million
,
$1.5 million
and
$0.8 million
for the years ended
December 31, 2015
,
2014
and 2013, respectively. Based on the carrying value of finite-lived intangible assets as of
December 31, 2015
, we estimate amortization expense for each of the next five years as follows:
|
(Dollars in millions)
|
|||
|
2016
|
$
|
11.1
|
|
|
2017
|
11.1
|
|
|
|
2018
|
11.1
|
|
|
|
2019
|
10.9
|
|
|
|
2020
|
10.7
|
|
|
|
2021-Thereafter
|
135.3
|
|
|
|
Total
|
$
|
190.2
|
|
13. Asset Retirement Obligations
The Company’s asset retirement obligations arise primarily from the Federal Surface Mining Control and Reclamation Act of 1977 and similar state statutes, which require that mine property be restored in accordance with specified standards and an approved reclamation plan. The Company also has asset retirement obligations related to certain contractual obligations, including the retirement and removal of long-lived assets from certain properties. We do not have any unrecorded asset retirement obligations.
The following table provides a reconciliation of changes in the asset retirement obligation from operations during each period:
98
|
(Dollars in millions)
|
|||
|
Balance at January 1, 2014
|
$
|
17.9
|
|
|
Liabilities incurred
|
2.6
|
|
|
|
Liabilities settled
|
(0.6
|
)
|
|
|
Accretion expense
(1)
|
1.4
|
|
|
|
Revisions in estimated cash flows
|
0.9
|
|
|
|
Balance at December 31, 2014
|
$
|
22.2
|
|
|
Liabilities settled
|
(2.1
|
)
|
|
|
Accretion expense
(1)
|
1.4
|
|
|
|
Revisions in estimated cash flows
|
0.7
|
|
|
|
Balance at December 31, 2015
|
$
|
22.2
|
|
|
(1)
|
Included in cost of products sold and operating expenses on the Consolidated Statements of Operations.
|
14. Retirement Benefits Plans
Defined Benefit Pension Plan and Postretirement Health Care and Life Insurance Plans
The Company had a noncontributory defined benefit pension plan (“defined benefit plan”), which provided retirement benefits for certain of its employees. Effective
January 1, 2011
, pension benefits under the Company’s defined benefit plan were frozen for all participants in this plan. Effective
May 30, 2014
, Dominion Coal Corporation, a wholly-owned subsidiary of the Company, terminated its defined benefit plan, a plan that was previously offered generally to all full-time employees of Dominion Coal Corporation. Subsequently, the Company obtained IRS approval for the plan termination and executed an agreement with a high-quality insurance company to annuitize the pension plan using plan assets. As a result of the termination of the Dominion Coal defined benefit plan, each participant became fully vested in his or her benefits thereunder without regard to age and years of service.
As a result of the pension termination, unrecognized losses, which previously were recorded in accumulated other comprehensive loss on the Consolidated Balance Sheets, were recognized as expense. The net settlement loss of
$12.6 million
was recorded in cost of products sold and operating expenses on the Consolidated Statements of Operations during
2015
. At
December 31, 2015
, there are
no
remaining benefit obligations or plan assets related to the defined benefit pension plan.
The Company also has plans which provide health care and life insurance benefits for many of its retirees (“postretirement benefit plans”). The postretirement benefit plans are unfunded and the costs are borne by the Company. The Company amended its postretirement benefit plans during the first quarter of
2010
. Effective
January 1, 2011
, postretirement medical benefits for future retirees were phased out or eliminated for non-mining employees with less than
ten
years of service. Employer costs for all those still eligible for such benefits were capped. The termination of coal mining employees triggered a curtailment gain of
$4.1 million
of
$2.5 million
in
2015
and
2014
, respectively, which represented accelerated amortization of prior service credits previously recorded in accumulated other comprehensive income.
Defined benefit plan expense (benefit) consisted of the following components:
|
|
Years Ended December 31,
|
||||||||||
|
|
2015
|
2014
|
2013
|
||||||||
|
|
(Dollars in millions)
|
||||||||||
|
Interest cost on benefit obligations
|
$
|
0.7
|
|
$
|
1.5
|
|
$
|
1.3
|
|
||
|
Expected return on plan assets
|
(0.7
|
)
|
(1.8
|
)
|
(2.4
|
)
|
|||||
|
Settlement loss
|
12.6
|
|
—
|
|
—
|
|
|||||
|
Amortization of:
|
|||||||||||
|
Actuarial losses
|
0.5
|
|
0.5
|
|
1.0
|
|
|||||
|
Total expense (benefit)
|
$
|
13.1
|
|
$
|
0.2
|
|
$
|
(0.1
|
)
|
||
99
Postretirement benefit plans benefit consisted of the following components:
|
|
Years Ended December 31,
|
||||||||||
|
|
2015
|
2014
|
2013
|
||||||||
|
|
(Dollars in millions)
|
||||||||||
|
Service cost
|
$
|
—
|
|
$
|
0.2
|
|
$
|
0.3
|
|
||
|
Interest cost on benefit obligations
|
1.3
|
|
1.5
|
|
1.4
|
|
|||||
|
Amortization of:
|
|||||||||||
|
Actuarial losses
|
0.8
|
|
0.9
|
|
1.5
|
|
|||||
|
Prior service benefit
|
(1.2
|
)
|
(5.6
|
)
|
(5.7
|
)
|
|||||
|
Curtailment gain
|
(4.1
|
)
|
(2.5
|
)
|
—
|
|
|||||
|
Total benefit
|
$
|
(3.2
|
)
|
$
|
(5.5
|
)
|
$
|
(2.5
|
)
|
||
Amortization of actuarial losses and prior service benefit for
2016
is estimated to be
$0.8 million
and
$0.7 million
, respectively, for the postretirement benefit plans.
Defined benefit plan and postretirement benefit plans expense (benefit) is determined using actuarial assumptions as of the beginning of the year or using weighted-average assumptions when curtailments, settlements and/or other events require a plan remeasurement. The following assumptions were used to determine defined benefit plan and postretirement benefit plans expense (benefit):
|
|
Defined Benefit Plan
|
Postretirement Benefit Plans
|
||||||||||||||||
|
|
2015
|
2014
|
2013
|
2015
|
2014
|
2013
|
||||||||||||
|
Discount Rate
|
—
|
%
|
4.55
|
%
|
3.65
|
%
|
3.45
|
%
|
4.15
|
%
|
3.30
|
%
|
||||||
|
Long-term expected rate of return on plan assets
|
—
|
%
|
4.90
|
%
|
7.10
|
%
|
—
|
%
|
—
|
%
|
—
|
%
|
||||||
The long-term expected rate of return on plan assets was estimated based on a variety of factors, including the historical investment return achieved over a long-term period, the targeted allocation of plan assets and expectations concerning future returns in the marketplace for fixed income securities.
The following amounts were recognized as components of other comprehensive (loss) income for the years ended
December 31, 2015
,
2014
and
2013
:
|
Years Ended December 31,
|
|||||||||||||||||||||||
|
|
Defined Benefit Plan
|
Postretirement Benefit Plans
|
|||||||||||||||||||||
|
|
2015
|
2014
|
2013
|
2015
|
2014
|
2013
|
|||||||||||||||||
|
|
(Dollars in millions)
|
||||||||||||||||||||||
|
Reclassifications to earnings of:
|
|||||||||||||||||||||||
|
Actuarial loss amortization
|
$
|
0.5
|
|
$
|
0.5
|
|
$
|
1.0
|
|
$
|
0.8
|
|
$
|
0.9
|
|
$
|
1.5
|
|
|||||
|
Prior service benefit amortization
|
—
|
|
—
|
|
—
|
|
(1.2
|
)
|
(5.6
|
)
|
(5.7
|
)
|
|||||||||||
|
Curtailment gain
|
—
|
|
—
|
|
—
|
|
(4.1
|
)
|
(2.5
|
)
|
—
|
|
|||||||||||
|
Settlement loss
|
12.6
|
|
—
|
|
—
|
|
—
|
|
—
|
|
—
|
|
|||||||||||
|
Retirement benefit plan funded status
adjustments:
|
|||||||||||||||||||||||
|
Actuarial gains (losses)
|
0.9
|
|
(3.9
|
)
|
5.6
|
|
(1.4
|
)
|
0.2
|
|
3.9
|
|
|||||||||||
|
Prior service cost
|
—
|
|
(0.5
|
)
|
—
|
|
—
|
|
—
|
|
—
|
|
|||||||||||
|
$
|
14.0
|
|
$
|
(3.9
|
)
|
|
$
|
6.6
|
|
$
|
(5.9
|
)
|
$
|
(7.0
|
)
|
$
|
(0.3
|
)
|
|||||
100
The following tables set forth the components of the changes in benefit obligations and fair value of plan assets during
2015
and
2014
, as well as the funded status at
December 31, 2015
and
2014
:
|
Years Ended December 31,
|
|||||||||||||||
|
|
Defined
Benefit Plan |
Postretirement
Benefit Plans |
|||||||||||||
|
|
2015
|
2014
|
2015
|
2014
|
|||||||||||
|
|
(Dollars in millions)
|
||||||||||||||
|
Benefit obligations at beginning of year
(1)
|
$
|
39.9
|
|
$
|
32.9
|
|
$
|
37.1
|
|
$
|
38.4
|
|
|||
|
Service cost
|
—
|
|
—
|
|
—
|
|
0.2
|
|
|||||||
|
Interest cost
|
0.7
|
|
1.5
|
|
1.3
|
|
1.5
|
|
|||||||
|
Actuarial (gains) losses
|
(2.5
|
)
|
7.2
|
|
1.4
|
|
1.2
|
|
|||||||
|
Plan amendments
(2)
|
—
|
|
0.5
|
|
—
|
|
—
|
|
|||||||
|
Curtailments
|
—
|
|
—
|
|
—
|
|
(1.4
|
)
|
|||||||
|
Benefits paid
|
(1.5
|
)
|
(2.2
|
)
|
(5.0
|
)
|
(2.8
|
)
|
|||||||
|
Settlement of obligation
|
(36.6
|
)
|
—
|
|
—
|
|
—
|
|
|||||||
|
Benefit obligations at end of year
(1)
|
$
|
—
|
|
$
|
39.9
|
|
$
|
34.8
|
|
$
|
37.1
|
|
|||
|
Fair value of plan assets at beginning of year
|
$
|
39.8
|
|
$
|
36.9
|
|
|||||||||
|
Actual (loss) income on plan assets
|
(1.0
|
)
|
5.1
|
|
|||||||||||
|
Benefits paid from plan assets
|
(1.5
|
)
|
(2.2
|
)
|
|||||||||||
|
Settlement of obligation
|
(36.6
|
)
|
—
|
|
|||||||||||
|
Transfer to defined contribution plan
|
(0.7
|
)
|
—
|
|
|||||||||||
|
Fair value of plan assets at end of year
|
$
|
—
|
|
$
|
39.8
|
|
|||||||||
|
Net liability at end of year
(3)
|
$
|
—
|
|
$
|
(0.1
|
)
|
$
|
(34.8
|
)
|
$
|
(37.1
|
)
|
|||
(1)
Represents both the accumulated benefit obligation and the projected benefit obligation for the defined benefit plan and the accumulated postretirement benefit obligations for the postretirement benefit plans.
(2)
The pension plan was terminated, effective May 30, 2014. As part of the plan termination process, all partially vested terminated participants were fully vested, and as a result, their accrued benefit increased
$0.5 million
. The amount is treated as a new prior service cost base which will be amortized over the plan's average future service.
(3) Represents retirement benefit assets (liabilities), including current portion, on the Consolidated Balance Sheets. The current portion of retirement liabilities, which totaled
$3.5 million
and
$3.7 million
at
December 31, 2015
and
2014
, respectively, is classified in accrued liabilities on the Consolidated Balance Sheets.
The following table sets forth the cumulative amounts not yet recognized in net income (loss) at
December 31, 2015
and
2014
:
|
|
Defined
Benefit Plan |
Postretirement
Benefit Plans |
|||||||||||||
|
|
2015
|
2014
|
2015
|
2014
|
|||||||||||
|
|
(Dollars in millions)
|
||||||||||||||
|
Cumulative amounts not yet recognized in net income (loss):
|
|||||||||||||||
|
Actuarial losses
|
$
|
—
|
|
$
|
13.5
|
|
$
|
10.6
|
|
$
|
10.0
|
|
|||
|
Prior service costs (benefits)
|
—
|
|
0.5
|
|
(3.1
|
)
|
(8.4
|
)
|
|||||||
|
Accumulated other comprehensive loss (before related tax benefit)
|
$
|
—
|
|
$
|
14.0
|
|
$
|
7.5
|
|
$
|
1.6
|
|
|||
101
The following table sets forth the plan assets in the funded defined benefit plan measured at fair value, by input level, at
December 31, 2015
and
2014
:
|
|
Quoted Prices in Active Markets for
Identical Assets (Level 1) |
||||||
|
|
2015
|
2014
|
|||||
|
(Dollars in millions)
|
|||||||
|
Mutual funds:
|
|||||||
|
Fixed income securities
|
$
|
—
|
|
$
|
39.4
|
|
|
|
Cash and cash equivalents
|
—
|
|
0.4
|
|
|||
|
Total
|
$
|
—
|
|
$
|
39.8
|
|
|
Investments in mutual funds are valued at the closing market price on the last business day of the year.
The expected benefit payments through
2024
for the postretirement benefit plan are as follows:
|
Postretirement
Benefit Plans |
||||
|
|
(Dollars in millions)
|
|||
|
Year ending December 31:
|
||||
|
2016
|
$
|
3.5
|
|
|
|
2017
|
3.4
|
|
||
|
2018
|
3.2
|
|
||
|
2019
|
3.0
|
|
||
|
2020
|
2.9
|
|
||
|
2021 through 2024
|
11.7
|
|
||
The measurement date for the Company’s defined benefit plan and postretirement benefit plans is December 31. The following discount rates were used at
December 31, 2015
and
2014
, respectively, to determine the benefit for the plans (in percentages):
|
|
Defined
Benefit Plan |
Postretirement
Benefit Plans |
||||||||||
|
|
2015
|
2014
|
2015
|
2014
|
||||||||
|
Discount rate
|
—
|
%
|
3.75
|
%
|
3.80
|
%
|
3.45
|
%
|
||||
The health care cost trend assumption used at
December 31, 2015
, to compute the accumulated postretirement benefit obligation for the postretirement benefit plans was an increase of
7.00 percent
(
7.50 percent
at December 31, 2014), which is assumed to decline gradually to
5.00 percent
in
2021
and to remain at that level thereafter. A one-percentage point change each year in assumed health care cost trend rates would have an impact of less than
$0.1 million
on the total of service and interest cost components of postretirement benefits expense and the accumulated postretirement benefit obligation as of
December 31, 2015
and
2014
.
Defined Contribution Plans
The Company has defined contribution plans which provide retirement benefits for certain of its employees. The Company’s contributions, which are principally based on the Company’s pretax income and the aggregate compensation levels of participating employees and are charged against income as incurred, amounted to
$6.5 million
,
$8.0 million
and
$7.4 million
for the years ended
December 31, 2015
,
2014
and
2013
, respectively.
102
15. Accrued Liabilities
Accrued liabilities consist of following:
|
|
December 31,
|
||||||
|
|
2015
|
2014
|
|||||
|
|
(Dollars in millions)
|
||||||
|
Accrued benefits
|
$
|
20.3
|
|
$
|
27.4
|
|
|
|
Other taxes payable
|
8.4
|
|
11.7
|
|
|||
|
Accrued severance
|
4.7
|
|
13.0
|
|
|||
|
Deferred revenue
|
2.1
|
|
—
|
|
|||
|
Current portion of black lung liability
|
5.2
|
|
3.8
|
|
|||
|
Other
|
5.1
|
|
15.4
|
|
|||
|
Total accrued liabilities
|
$
|
45.8
|
|
$
|
71.3
|
|
|
Total debt consisted of the following:
|
|
December 31,
|
||||||
|
|
2015
|
|
2014
|
||||
|
|
(Dollars in millions)
|
||||||
|
7.625 percent senior notes, due 2019 (“Notes”)
|
$
|
44.6
|
|
$
|
240.0
|
|
|
|
SunCoke's revolving credit facility, due 2018 ("Revolving Facility")
|
60.4
|
|
—
|
|
|||
|
7.375 percent senior notes, due 2020 ("Partnership Notes")
|
552.5
|
|
400.0
|
|
|||
|
Partnership's promissory note payable, due 2021 ("Promissory Note")
|
114.3
|
|
—
|
|
|||
|
Partnership's revolving credit facility, due 2019 ("Partnership Revolver")
|
182.0
|
|
—
|
|
|||
|
Partnership's Term Loan, due 2019 ("Partnership Term Loan")
|
50.0
|
|
—
|
|
|||
|
Total Borrowings
|
$
|
1,003.8
|
|
|
$
|
640.0
|
|
|
Original issue premium
|
12.1
|
|
11.5
|
|
|||
|
Debt issuance costs
|
(17.1
|
)
|
(18.0
|
)
|
|||
|
Total debt
|
998.8
|
|
633.5
|
|
|||
|
Less: current portion of long-term debt
|
1.1
|
|
|
—
|
|
||
|
Total long-term debt
|
$
|
997.7
|
|
|
$
|
633.5
|
|
Credit Facilities
On July 26, 2011, SunCoke Energy entered into a credit agreement ("Credit Agreement") which provides for the
five
-year
$150 million
Revolving Facility. The proceeds of any loans made under the Revolving Facility can be used to finance capital expenditures, acquisitions, working capital needs and for other general corporate purposes.
On
October 22, 2015
, the Company drew
$60.4 million
on the Revolving Facility to fund the redemption of
a portion
of the Company's outstanding Notes.
As of
December 31, 2015
, the Revolving Facility had letters of credit outstanding of
$2.8 million
and an outstanding balance of
$60.4 million
, leaving
$86.8 million
available subject to the terms of the Credit Agreement.
Commitment fees are based on the unused portion of the Revolving Facility at a rate of
0.4 percent
.
Borrowings under the Revolving Facility bear interest, at SunCoke Energy’s option, at either (i) a base rate plus an applicable margin or (ii) LIBOR plus an applicable margin. The applicable margin is based on the Company's total leverage ratio, as defined in the Credit Agreement. The weighted-average interest rate for borrowings outstanding under the Credit Agreement was
2.3 percent
and
4.1 percent
during 2015 and 2014, respectively.
The obligations under the Credit Agreement are guaranteed by certain of the Company’s subsidiaries and secured by liens on substantially all of the Company’s and the guarantors’ assets pursuant to a Guarantee and Collateral Agreement, dated as of
July 26, 2011
, among the Company, the subsidiaries of the Company party thereto and JPMorgan Chase Bank, N.A. as administrative agent.
In conjunction with the closing of the Partnership Offering in
2013
, the Partnership also entered into the Partnership Revolver. The Partnership Revolver, as amended, provides total aggregate commitments from lenders of
$250.0 million
and up
103
to
$100.0 million
uncommitted incremental revolving capacity with a term extending through May
2019
. The Partnership paid debt issuance costs of
$1.8 million
in 2014 for fees related to amendments.
On
August 12, 2015
, in connection with the funding of the acquisition of CMT, the Partnership drew
$185.0 million
on the Partnership Revolver.
During the fourth quarter of 2015, the Partnership made net repayments of
$3.0 million
on the Partnership Revolver. At
December 31, 2015
, the Partnership Revolver had
no
letters of credit outstanding and an outstanding balance of
$182.0 million
, leaving
$68.0 million
available. Commitment fees are based on the unused portion of the Partnership Revolver at a rate of
0.4 percent
.
The Partnership Revolver borrowings bear interest at a variable rate of LIBOR plus
250
basis points or an alternative base rate, based on the Partnership's total ratios as defined by the Partnership's credit agreement. The spread is subject to change based on the Partnership's total leverage ratio, as defined in the credit agreement. The weighted-average interest rate for borrowings under the Partnership Revolver was
2.9 percent
and
2.4 percent
during 2015 and 2014, respectively.
During
2015
, we incurred
$0.7 million
of debt issuance costs in connection with amendments of our Revolving Facility and the Partnership Revolver. The amendments decreased the Company's maximum consolidated leverage ratio to
3.25
to
1.00
and increased the Partnership's maximum consolidated leverage ratio to
4.50
to
1.00
.
Notes
On
July 26, 2011
, SunCoke Energy issued
$400.0 million
aggregate principal of Notes in a private placement. Interest on the Notes is payable semi-annually in cash in arrears on February 1 and August 1 of each year. The proceeds from the Notes were used to repay certain intercompany indebtedness to Sunoco, to pay related fees and expenses and for general corporate purposes.
The Notes were offered in the U.S. to qualified institutional buyers in accordance with Rule 144A under the Securities Act, and outside the U.S. to non-U.S. persons in accordance with Regulation S under the Securities Act. On
January 25, 2012,
we completed an exchange offer for the Notes for an equal principal amount of the Notes whose sale is registered under the Securities Act.
On May 9, 2014, in connection with the Haverhill and Middletown Dropdown, the Partnership assumed from SunCoke and repaid
$160.0 million
of Notes along with an
$11.4 million
market premium to complete the tender of the Notes. On January 13, 2015, in connection with the Granite City Dropdown, the Partnership assumed from SunCoke and repaid
$135.0 million
of Notes, as well as a market premium of
$7.7 million
to complete the tender of the Notes, which was included in interest expense, net on the Consolidated Statements of Operations. The Partnership also assumed
$2.2 million
in debt issuance costs,
$0.7 million
of which related to the portion of the debt extinguished and was recorded in interest expense, net on the Consolidated Statements of Operations.
On
August 12, 2015
, in connection with the Granite City Supplemental Dropdown, the Partnership assumed from SunCoke
$44.6 million
of Notes, which SunCoke re-assumed on
November 18, 2015
from the Partnership in exchange of cash from the Partnership.
On October 22, 2015, the Company redeemed
$60.4 million
of outstanding Notes for
$63.7 million
, which included accrued interest of
$1.0 million
and a market premium of
$2.3 million
. A
$3.2 million
loss on debt extinguishment was recorded in interest expense, net on the Consolidated Statement of Operations, resulting from the market premium discussed above and write-off of unamortized debt issuance costs of
$0.9 million
. The Company funded the redemption using cash of
$3.3 million
and
$60.4 million
of borrowings from the Revolving Facility.
At December 31, 2015 and 2014, the Company had
$44.6 million
and
$240.0 million
of Notes outstanding, respectively.
The Notes are the Company’s senior unsecured obligations and are guaranteed on a senior unsecured basis by each of the Company’s existing and future subsidiaries that guarantees the Company’s credit facilities (collectively, the “Notes Guarantors”). The Notes rank equally in right of payment to all of the Company’s existing and future unsecured unsubordinated debt and senior in right of payment to all of the Company’s existing and future debt that is by its terms expressly subordinated in right of payment to the Notes. The Notes are subordinated to indebtedness under the Credit Agreement as well as any future secured debt to the extent of the value of the assets securing such debt.
Prior to
August 1, 2014
, the Company was permitted to redeem some or all the Notes by paying a “make-whole” premium, on or after
August 1, 2014
, the Company may redeem some or all of the Notes at specified redemption prices.
The Company is obligated to offer to purchase the Notes at a price of (a)
101 percent
of their principal amount, together with accrued and unpaid interest, if any, to the date of purchase, upon the occurrence of certain change of control events; and (b)
100 percent
of their principal amount, together with accrued and unpaid interest, if any, to the date of purchase, with the proceeds from certain asset dispositions. These restrictions and prohibitions are subject to certain qualifications and exceptions set forth in the Indenture, including without limitation, reinvestment rights with respect to the proceeds of asset dispositions.
104
Partnership Notes
In addition, with the closing of the Partnership Offering, the Partnership issued
$150.0 million
of Partnership Notes. Interest on the Partnership Notes is payable semi-annually in cash in arrears on February 1 and August 1 of each year. The Partnership Notes are guaranteed on a senior unsecured basis by each of our existing and certain future subsidiaries. The Partnership may redeem some or all of the Partnership Notes prior to
February 1, 2016
by paying a “make-whole” premium. The Partnership also may redeem some or all of the Partnership Notes on or after
February 1, 2016
, at specified redemption prices. In addition, prior to
February 1, 2016
, the Partnership may redeem up to
35 percent
of the Partnership Notes using the proceeds of certain equity offerings. If the Partnership sells certain of its assets or experiences specific kinds of changes in control, subject to certain exceptions, the Partnership must offer to purchase the Partnership Notes.
On
May 9, 2014
, in connection with the Haverhill and Middletown Dropdown, the Partnership issued an additional
$250.0 million
of Partnership Notes. Proceeds of
$263.1 million
included an original issue premium of
$13.1 million
. In addition, the Partnership received
$5.0 million
to fund interest from
February 1, 2014
to
May 9, 2014
, the period prior to the issuance. This interest was paid to noteholders on
August 1, 2014
. The Partnership incurred debt issuance costs of
$4.9 million
, of which
$0.9 million
was considered a modification of debt and was immediately expensed and recorded in interest expense, net in the Consolidated Statement of Operations and was included in other operating cash flows in the Consolidated Statement of Cash Flows.
On
January 13, 2015
, in connection with the Granite City Dropdown, the Partnership issued an additional
$200.0 million
of Partnership Notes. Proceeds of
$204.0 million
included an original issue premium of
$4.0 million
. In addition, the Partnership received
$6.8 million
to fund interest from
August 1, 2014
to
January 13, 2015
the interest period prior to issuance. This interest was repaid to noteholders on
February 1, 2015
. The Partnership incurred debt issuance costs of
$5.2 million
, of which
$1.0 million
was considered a modification of debt and was recorded in interest expense, net on the Consolidated Statements of Operations and was included in other operating cash flows on the Consolidated Statements of Cash Flows.
During 2015, the Partnership began de-levering its balance sheet and redeemed
$47.5 million
of outstanding Partnership Notes for
$35.3 million
on the open market. A gain on debt extinguishment was recorded in interest expense, net on the Consolidated Statement of Operations, of
$12.1 million
, which included the write-off of unamortized original issue premium of
$0.8 million
and the unamortized debt issuance costs of
$0.9 million
.
At December 31, 2015 and 2014, the Partnership had
$552.5 million
and
$400.0 million
of outstanding Partnership Notes, respectively.
Promissory Note
On
August 12, 2015
, in connection with the acquisition of CMT, the Partnership assumed Raven Energy LLC's Promissory Note of
$114.9 million
. Under the Partnership's third amendment to the amended and restated credit agreement ("Promissory Agreement") dated
August 12, 2015
, the Partnership shall repay a principal amount of
$0.3 million
on the Promissory Note each fiscal quarter ending prior to
August 12, 2018
. For each fiscal quarter ending after
August 12, 2018
, the Partnership shall repay a principal amount of
$2.5 million
on the Promissory Note. The entire outstanding amount of the loan is due in full on
August 12, 2021
. The Promissory Note shall bear interest on the outstanding principal amount for each day from
August 12, 2015
, until it becomes due, at a rate per annum equal to
6.0
percent until
August 12, 2018
. After
August 12, 2018
, that rate shall be the LIBOR for the interest period then in effect plus
4.5
percent. Interest is due at the end of each fiscal quarter.
Partnership Term Loan
On
November 3, 2015
, the Partnership entered into the Partnership Term Loan, which provides for a three and one-half year term loan in a principal amount of
$50.0 million
. The Partnership shall repay the principal through even quarterly payments of
$1.3 million
starting on
December 31, 2017
through
May 9, 2019
, when the remaining payable balance is due. The Partnership Term Loan bears interest at a variable rate of LIBOR plus
250
basis points or an alternative base rate, based on the Partnership's total ratios as defined by the Partnership's credit agreement. Interest is due at the end of each fiscal quarter. The Company incurred and capitalized approximately
$0.8 million
of debt issuance costs associated with the transaction.
Covenants
The Company and the Partnership are subject to certain debt covenants that, among other things, limit the Company's and Partnership’s ability and the ability of certain of the Company's and the Partnership’s subsidiaries to (i) incur indebtedness, (ii) pay dividends or make other distributions, (iii) prepay, redeem or repurchase certain debt, (iv) make loans and investments, (v) sell assets, (vi) incur liens, (vii) enter into transactions with affiliates and (viii) consolidate or merge. These covenants are subject to a number of exceptions and qualifications set forth in the respective agreements. Additionally, under the terms of the Credit Agreement, the Company is subject to a maximum consolidated leverage ratio of
3.25
to
1.00
,
calculated by dividing total debt by EBITDA as defined by the Credit Agreement, and a minimum consolidated interest coverage ratio of
2.75
to
1.00
, calculated by dividing EBITDA by interest expense as defined by the Credit Agreement. Under the terms of the Partnership Revolver, the Partnership is subject to a maximum consolidated leverage ratio of
4.50
to
1.00
,
calculated by dividing total debt
105
by EBITDA as defined by the Partnership Revolver, and a minimum consolidated interest coverage ratio of
2.50
to
1.00
,
calculated by dividing EBITDA by interest expense as defined by the Partnership Revolver. The Partnership Term Loan has the same covenants as the previously discussed Partnership Revolver covenants. At
December 31, 2015
the Company and the Partnership were in compliance with all applicable debt covenants contained in the Credit Agreement and the Partnership Revolver.
Under the terms of the Promissory Agreement, Raven Energy LLC, a wholly-owned subsidiary of the Partnership, is subject to a maximum leverage ratio of
5.00
:
1.00
for any fiscal quarter ending prior to
August 12, 2018
, calculated by dividing total debt by EBITDA as defined by the Promissory Agreement. For any fiscal quarter ending on or after
August 12, 2018
the maximum leverage ratio is
4.50
:
1.00
.
Additionally in order to make restricted payments, Raven Energy LLC is subject to a fixed charge ratio of greater than
1.00
:
1.00
,
calculated by dividing EBITDA by fixed charges as defined by the Promissory Agreement.
If we fail to perform our obligations under these and other covenants, the lenders' credit commitment could be terminated and any outstanding borrowings, together with accrued interest, under the Revolving Facility, Partnership Revolver, Partnership Term Loan and Promissory Note could be declared immediately due and payable. The Partnership has a cross-default provision that applies to our indebtedness having a principal amount in excess of $20 million. We do not anticipate any violation of these covenants nor do we anticipate that any of these covenants will restrict our operations or our ability to obtain additional financing.
Maturities
As of
December 31, 2015
, the combined aggregate amount of maturities for long-term borrowings for each of the next five years is as follows:
|
(Dollars in Millions)
|
|||
|
2016
|
$
|
1.1
|
|
|
2017
|
2.4
|
|
|
|
2018
|
71.0
|
|
|
|
2019
|
280.3
|
|
|
|
2020
|
562.5
|
|
|
|
2021-Thereafter
|
86.5
|
|
|
|
Total
|
$
|
1,003.8
|
|
17. Black Lung Benefit Obligations
The Company is responsible for making pneumoconiosis (“black lung”) benefit payments to certain of its employees and former employees and their dependents. Such payments are for claims under Title IV of the Federal Coal Mine Health and Safety Act of 1969 and subsequent amendments, as well as for black lung benefits provided in the states of Virginia, Kentucky and West Virginia pursuant to workers’ compensation legislation. The Company acts as a self-insurer for both state and federal black lung benefits and adjusts the Company’s accrual each year based upon actuarial calculations of the Company’s expected future payments for these benefits.
The Patient Protection and Affordable Care Act (“PPACA”), which was implemented in 2010, amended previous legislation related to coal workers’ black lung obligations. PPACA provides for the automatic extension of awarded lifetime benefits to surviving spouses and changes the legal criteria used to assess and award claims.
Our obligation related to black lung benefits is estimated based on various assumptions, including actuarial estimates, discount rates, and changes in health care costs.
For the years ended
December 31, 2015
,
2014
and
2013
,
the discount rate used to calculate the period end liability was
3.90
,
3.65
and
4.65
percent, respectively.
The estimated liability was
$49.9 million
and
$43.9 million
at
December 31, 2015
and
2014
,
respectively, of which
$5.2 million
and
$3.8 million
was included in accrued liabilities on the Consolidated Balance Sheet.
In addition to changes in the discount rate and other assumptions, the estimated liability at
December 31, 2015
was impacted by a significant increase in the number of claims filed as well as the rate at which claims are awarded.
The Company recognized expense of
$9.8 million
and
$14.3 million
and income of
$0.3 million
during
2015
,
2014
,
and
2013
,
respectively.
The Company made payments related to black lung of
$3.8 million
,
$2.8 million
and
$2.2 million
during
2015
,
2014
, and
2013
, respectively.
106
18. Commitments and Contingent Liabilities
The Company, as lessee, has noncancelable operating leases for land, office space, equipment and railcars. Total rental expense was
$8.5 million
,
$7.9 million
and
$6.4 million
in
2015
,
2014
and
2013
, respectively. The aggregate amount of future minimum annual rental payments applicable to noncancelable operating leases is as follows:
|
Minimum
Rental Payments |
|||
|
|
(Dollars in millions)
|
||
|
Year ending December 31:
|
|||
|
2016
|
$
|
4.0
|
|
|
2017
|
2.5
|
|
|
|
2018
|
1.8
|
|
|
|
2019
|
1.4
|
|
|
|
2020
|
1.1
|
|
|
|
2021-Thereafter
|
2.0
|
|
|
|
Total
|
$
|
12.8
|
|
SunCoke Energy is party to an omnibus agreement pursuant to which we will provide indemnification to the Partnership upon the occurrence of certain potential adverse events under certain coke sales agreements, indemnification of certain environmental costs and preferential rights for growth opportunities.
The United States Environmental Protection Agency (the “EPA”) issued Notices of Violations (“NOVs”) for our Haverhill and Granite City cokemaking facilities which stemmed from alleged violations of our air emission operating permits for these facilities. We are working in a cooperative manner with the EPA, the Ohio Environmental Protection Agency and the Illinois Environmental Protection Agency to address the allegations, and have entered into a consent decree in federal district court with these parties. The consent decree includes a
$2.2 million
civil penalty payment, which was paid in
December 2014
,
as well as capital projects underway to improve the reliability of the energy recovery systems and enhance environmental performance at the Haverhill and Granite City facilities. We anticipate spending approximately
$130 million
related to these projects, of which we have spent approximately
$93 million
to date. The remaining capital is expected to be spent through the first quarter of
2019
. A portion of the proceeds from the Partnership Offering, the Haverhill and Middletown Dropdown and the Granite City Dropdown are being used to fund
$119 million
of these environmental remediation projects.
SunCoke Energy has also received NOVs, a Finding of Violation ("FOV"), and information requests from the EPA related to our Indiana Harbor cokemaking facility. After initial discussions with the EPA and the Indiana Department of Environmental Management (“IDEM”), resolution of the NOVs was postponed by mutual agreement because of ongoing discussions regarding the NOVs at Haverhill and Granite City. In
January 2012
, the Company began working in a cooperative manner to address the allegations with the EPA, the IDEM and Cokenergy, Inc., an independent power producer that owns and operates an energy facility, including heat recovery equipment and a flue gas desulfurization system, that processes hot flue gas from our Indiana Harbor facility to produce steam and electricity and to reduce the sulfur and particulate content of such flue gas. Settlement may require payment of a penalty for alleged past violations as well as undertaking capital projects to enhance reliability and environmental performance. At this time, SunCoke Energy cannot yet assess any future injunctive relief or potential monetary penalty and any potential future citations. The Company is unable to determine a range of probable or reasonably possible loss.
Other legal and administrative proceedings are pending or may be brought against the Company arising out of its current and past operations, including matters related to commercial and tax disputes, product liability, antitrust, employment claims, premises-liability claims, allegations of exposures of third-parties to toxic substances and general environmental claims. Although the ultimate outcome of these claims cannot be ascertained at this time, it is reasonably possible that some portion of these claims could be resolved unfavorably to the Company. Management of the Company believes that any liability which may arise from such matters would not be material in relation to the financial position, results of operations or cash flows of the Company at
December 31, 2015
.
The Company is a party to certain other pending and threatened claims, including matters related to commercial and tax disputes, product liability, employment claims, personal injury claims, premises-liability claims, allegations of exposures to toxic substances and general environmental claims. Although the ultimate outcome of these claims cannot be ascertained at this time, it is reasonably possible that some portion of these claims could be resolved unfavorably to the Company. Management of the Company believes that any liability which may arise from claims would not have a material adverse impact on our consolidated financial statements.
107
19. Restructuring
Corporate
In
2015
and
2014
, we reduced the workforce in our corporate office and incurred total charges of
$4.1 million
and
$1.4 million
in 2015 and 2014, respectively, in Corporate and Other.
The Company also recorded restructuring charges of
$0.7 million
and
$1.3 million
in
2014
and
2013
, respectively, in connection with the relocation of the Company's corporate headquarters from Knoxville, Tennessee to Lisle, Illinois.
The following table presents aggregate corporate restructuring charges:
|
Employee-
Related Costs |
Contract Terminations
|
Total
|
|||||||||
|
|
(Dollars in millions)
|
||||||||||
|
Year ended December 31, 2013
|
$
|
0.1
|
|
$
|
1.2
|
|
$
|
1.3
|
|
||
|
Year ended December 31, 2014
|
1.4
|
|
0.7
|
|
2.1
|
|
|||||
|
Year ended December 31, 2015
|
4.1
|
|
—
|
|
4.1
|
|
|||||
|
Charges recorded through December 31, 2015
|
$
|
5.6
|
|
$
|
1.9
|
|
$
|
7.5
|
|
||
Employee-related costs and contract terminations are included in selling, general and administrative expenses on the Consolidated Statements of Operations.
The following table presents accrued corporate restructuring and related activity as of and for the years ended
December 31, 2015
and
2014
:
|
Employee-
Related Costs |
Contract
Terminations |
Total
|
|||||||||
|
|
(Dollars in millions)
|
||||||||||
|
Balance at December 31, 2013
|
$
|
0.1
|
|
$
|
1.7
|
|
$
|
1.8
|
|
||
|
Charges
|
1.4
|
|
0.7
|
|
2.1
|
|
|||||
|
Cash payments
|
(1.0
|
)
|
(1.0
|
)
|
(2.0
|
)
|
|||||
|
Balance at December 31, 2014
|
$
|
0.5
|
|
$
|
1.4
|
|
$
|
1.9
|
|
||
|
Charges
|
4.1
|
|
—
|
|
4.1
|
|
|||||
|
Cash payments
|
(0.7
|
)
|
(1.4
|
)
|
(2.1
|
)
|
|||||
|
Balance at December 31, 2015
|
$
|
3.9
|
|
$
|
—
|
|
$
|
3.9
|
|
||
The corporate restructuring balance at December 31, 2015 relates to severance, and we expect it will be substantially paid in 2016.
Coal Mining
In connection with the restructuring of the Coal Mining business the Company recorded
$12.5 million
of employee-related restructuring costs and
$6.0 million
in contract termination costs
within the Coal Mining segment in 2014. During
2015
, the Company reduced the severance accrual by
$2.3 million
as a result of changes in estimates, including the relocation of certain coal employees to other areas of the business, the savings of which are included in selling, general and administrative expenses on the Consolidated Statements of Operations.
The following table presents aggregate Coal Mining operations restructuring charges:
|
Employee-
Related Costs |
Contract Terminations
|
Total
|
|||||||||
|
|
(Dollars in millions)
|
||||||||||
|
Year Ended December 31, 2014
|
$
|
12.5
|
|
$
|
6.0
|
|
$
|
18.5
|
|
||
|
Year Ended December 31, 2015
|
(2.3
|
)
|
—
|
|
(2.3
|
)
|
|||||
|
Charges recorded through December 31, 2015
|
$
|
10.2
|
|
$
|
6.0
|
|
$
|
16.2
|
|
||
108
The following table presents accrued restructuring and related activity for Coal Mining operations as of and for the years ended
December 31, 2015
,
2014
and
2013
:
|
Employee-
Related Costs |
Contract
Terminations |
Total
|
|||||||||
|
|
(Dollars in millions)
|
||||||||||
|
Balance at December 31, 2013
|
$
|
—
|
|
$
|
—
|
|
$
|
—
|
|
||
|
Charges
|
12.5
|
|
6.0
|
|
18.5
|
|
|||||
|
Cash payments
|
—
|
|
(6.0
|
)
|
(6.0
|
)
|
|||||
|
Balance at December 31, 2014
|
$
|
12.5
|
|
$
|
—
|
|
$
|
12.5
|
|
||
|
Changes in estimates
|
(2.3
|
)
|
—
|
|
(2.3
|
)
|
|||||
|
Cash payments
|
(9.4
|
)
|
—
|
|
(9.4
|
)
|
|||||
|
Balance at December 31, 2015
|
$
|
0.8
|
|
$
|
—
|
|
$
|
0.8
|
|
||
The Coal Mining restructuring balance at December 31, 2015 relates to severance, and we expect it will be substantially paid in 2016.
20. Accumulated Other Comprehensive Loss
The following tables set forth the changes in the balance of accumulated other comprehensive loss, net of tax, by component:
|
Benefit Plans
|
Currency Translation Adjustments
|
Total
|
||||||||||
|
(Dollars in millions)
|
||||||||||||
|
At December 31, 2013
|
$
|
(2.8
|
)
|
$
|
(11.3
|
)
|
$
|
(14.1
|
)
|
|||
|
Other comprehensive loss before reclassifications
|
—
|
|
(0.8
|
)
|
(0.8
|
)
|
||||||
|
Amounts reclassified from accumulated other comprehensive income
|
(4.0
|
)
|
—
|
|
(4.0
|
)
|
||||||
|
Retirement benefit plans funded status adjustment
|
(2.6
|
)
|
—
|
|
(2.6
|
)
|
||||||
|
Net current period other comprehensive loss
|
(6.6
|
)
|
(0.8
|
)
|
(7.4
|
)
|
||||||
|
At December 31, 2014
|
$
|
(9.4
|
)
|
$
|
(12.1
|
)
|
$
|
(21.5
|
)
|
|||
|
Other comprehensive loss before reclassifications
|
—
|
|
(3.1
|
)
|
(3.1
|
)
|
||||||
|
Amounts reclassified from accumulated other comprehensive
loss |
5.2
|
|
—
|
|
5.2
|
|
||||||
|
Retirement benefit plans funded status adjustment
|
(0.4
|
)
|
—
|
|
(0.4
|
)
|
||||||
|
Net current period other comprehensive loss
|
4.8
|
|
(3.1
|
)
|
1.7
|
|
||||||
|
At December 31, 2015
|
$
|
(4.6
|
)
|
$
|
(15.2
|
)
|
$
|
(19.8
|
)
|
|||
The tax benefit associated with the Company's benefit plans as of
December 31, 2015
and
2014
was
$2.9 million
and
$6.2 million
, respectively.
109
The impact on net income of reclassification adjustments from accumulated other comprehensive (income) loss were as follows:
|
|
December 31,
|
|||||||||||
|
2015
|
2014
|
2013
|
||||||||||
|
(Dollars in millions)
|
||||||||||||
|
Amortization of benefit plans to net income:
|
||||||||||||
|
Actuarial loss
|
(1.3
|
)
|
(1.4
|
)
|
(2.5
|
)
|
||||||
|
Prior service benefit
|
1.2
|
|
5.6
|
|
5.7
|
|
||||||
|
Curtailment gain
|
4.1
|
|
2.5
|
|
—
|
|
||||||
|
Settlement loss
|
(12.6
|
)
|
—
|
|
—
|
|
||||||
|
Total before taxes
|
(8.6
|
)
|
6.7
|
|
3.2
|
|
||||||
|
Income tax cost (benefit)
|
3.4
|
|
(2.7
|
)
|
(1.3
|
)
|
||||||
|
Total, net of tax
|
$
|
(5.2
|
)
|
$
|
4.0
|
|
$
|
1.9
|
|
|||
110
21. Share-Based Compensation
Effective
July 13, 2011
, SunCoke Energy’s Board of Directors approved the SunCoke Energy, Inc. Long-Term Performance Enhancement Plan (“SunCoke LTPEP”). The SunCoke LTPEP provides for the grant of equity-based awards including stock options and share units, or restricted stock, to the Company’s directors, officers, and other employees, advisors, and consultants who are selected by the plan committee for participation in the SunCoke LTPEP. The plan authorizes the issuance of (i)
1,600,000
shares of SunCoke Energy common stock issuable upon the adjustment of Sunoco equity awards in connection with the Distribution and (ii) up to
6,000,000
shares of SunCoke Energy common stock pursuant to new awards under the SunCoke LTPEP.
The Company measures the cost of employee services in exchange for an award of equity instruments based on the grant-date fair value of the award. The total cost is reduced for estimated forfeitures over the awards’ vesting period and the cost is recognized over the requisite service period. The estimated forfeiture rate is analyzed on an annual basis. The estimated forfeiture rate may be revised in subsequent periods if the actual forfeiture rate differs significantly. Compensation expense is recorded ratably over the service period.
Stock Options
During the years ended
December 31, 2015
,
2014
and
2013
, the Company granted stock options to certain employees to acquire
593,976
,
407,075
and
446,948
shares of common stock, respectively. The stock options have a
ten
-year term and an exercise price, which was equal to the average of the high and low prices of SunCoke Energy common stock on the dates of grant. The weighted average exercise price was
$16.33
per share,
$22.30
per share and
$16.55
per share in
2015
,
2014
and
2013
, respectively. The stock options become exercisable in
three
equal annual installments beginning
one
year from the date of grant (in each case subject to continued employment through the applicable vesting date). All awards vest immediately upon a change in control as defined by the SunCoke LTPEP.
The Company calculates the value of each employee stock option, estimated on the date of grant, using the Black-Scholes option pricing model. The weighted-average fair value of employee stock options granted during the years ended December 31,
2015
,
2014
and
2013
was
$4.87
,
$7.86
and
$6.00
, respectively, using the following weighted-average assumptions:
|
|
Years Ended December 31,
|
|||||||
|
|
2015
|
2014
|
2013
|
|||||
|
Risk free interest rate
|
1.66
|
%
|
1.57
|
%
|
0.93
|
%
|
||
|
Expected term
|
5 years
|
|
5 years
|
|
5 years
|
|
||
|
Volatility
|
36
|
%
|
38
|
%
|
44
|
%
|
||
|
Dividend yield
|
1.64
|
%
|
—
|
%
|
—
|
%
|
||
Beginning in
2014
, we based our expected volatility on our historical volatility over our entire available trading history. Prior to
2014
, the Company used the average implied volatility of the Dow Jones U.S. Steel index coupled with the implied volatility of the S&P 600. Since the Company does not have a direct peer group and only had a limited trading history, it believes this approach provided a reasonable implied volatility.
The risk-free interest rate assumption is based on the U.S. Treasury yield curve at the date of grant for periods which approximate the expected life of the option. The dividend yield assumption is based on the Company’s future expectation of dividend payouts at the time of grant. The
2014
and
2013
grants were made prior to the Board of Directors declaration of the Company's first dividend payment in the fourth quarter of
2014
. The expected life of employee options represents the average contractual term adjusted by the average vesting period of each option tranche. In calculating the fair value of options, the Company estimated a
15 percent
and
3 percent
forfeiture rate for options excluding those issued to certain executive employees, which were estimated at a
zero percent
forfeiture rate in
2015
and
2014
, respectively. The Company estimated a
3 percent
forfeiture rate in calculating fair value in
2013
.
111
The following table summarizes information with respect to common stock option awards outstanding as of
December 31, 2015
and stock option activity during the fiscal year then ended:
|
Number of
Options |
Weighted
Average Exercise Price |
Weighted Average Remaining Contractual Term (years)
|
Aggregate
Intrinsic Value (millions) |
|||||||||
|
Outstanding at December 31, 2014
|
2,403,850
|
|
$
|
17.34
|
|
7.3
|
$
|
5.9
|
|
|||
|
Granted
|
593,976
|
|
$
|
16.33
|
|
|||||||
|
Exercised
|
(27,021
|
)
|
$
|
16.32
|
|
|||||||
|
Forfeited
|
(268,200
|
)
|
$
|
18.92
|
|
|||||||
|
Outstanding at December 31, 2015
|
2,702,605
|
|
$
|
17.07
|
|
6.8
|
$
|
—
|
|
|||
|
Exercisable at December 31, 2015
|
2,032,116
|
|
$
|
16.70
|
|
6.3
|
$
|
—
|
|
|||
|
Expected to vest at December 31, 2015
|
651,416
|
|
$
|
18.20
|
|
8.5
|
$
|
—
|
|
|||
Intrinsic value for stock options is defined as the difference between the current market value of our common stock and the exercise price of the stock options. Total intrinsic value of stock options exercised during
2015
,
2014
and
2013
was
$0.1 million
,
$0.9 million
and
$0.1 million
, respectively.
The Company recognized
$2.5 million
,
$1.6 million
net of tax,
$4.7 million
,
$3.0 million
net of tax, and
$4.6 million
,
$2.9 million
net of tax, in compensation expense during the years ended
December 31, 2015
,
2014
and
2013
, respectively,
related to the above stock options. As of
December 31, 2015
, there was
$2.3 million
of total unrecognized compensation cost related to nonvested stock options. This compensation cost is expected to be recognized over the next
1.4
years.
Restricted Stock Units
During the years ended
December 31, 2015
,
2014
and
2013
, the Company issued a total of
297,514
,
236,844
and
293,918
restricted stock units (“RSU”) to certain employees for shares of the Company’s common stock. The weighted average grant date fair value was
$14.51
,
$22.06
and
$16.58
, in
2015
,
2014
and
2013
, respectively. The RSUs vest in
three
annual installments beginning
one
year from the date of grant. All awards vest immediately upon a change in control as defined by the SunCoke LTPEP. In calculating the fair value of the RSU, the Company estimated an
18 percent
and
3 percent
forfeiture rate excluding those issued to certain executive employees, which were estimated at a
zero percent
forfeiture rate in
2015
and
2014
, respectively. The Company estimated a
3 percent
forfeiture rate in calculating fair value in
2013
.
The following table summarizes information with respect to RSUs outstanding as of
December 31, 2015
and RSU activity during the fiscal year then ended:
|
Number of
RSUs |
Weighted
Average Grant- Date Fair Value |
|||||
|
Nonvested at December 31, 2014
|
479,673
|
|
$
|
18.77
|
|
|
|
Granted
|
297,514
|
|
$
|
14.51
|
|
|
|
Vested
|
(248,255
|
)
|
$
|
18.00
|
|
|
|
Forfeited
|
(44,808
|
)
|
$
|
19.43
|
|
|
|
Nonvested at December 31, 2015
|
484,124
|
|
$
|
16.48
|
|
|
Total fair value of RSUs vested was
$4.6 million
,
$2.9 million
and
$1.3 million
during
2015
,
2014
and
2013
, respectively.
The Company recognized
$4.2 million
,
$2.7 million
net of tax,
$3.9 million
,
$2.5 million
net of tax, and
$2.5 million
,
$1.6 million
net of tax, in compensation expense during the years ended
December 31, 2015
,
2014
and
2013
, respectively, related to the above RSUs. As of
December 31, 2015
, there was
$4.0 million
of total unrecognized compensation cost related to nonvested RSUs. This compensation cost is expected to be recognized over the next
1.7
years.
Performance Share Units
The Company issued
134,271
,
84,734
and
96,073
performance share units ("PSU") for shares of the Company's common stock during the years ended
December 31, 2015
,
2014
and
2013
, respectively, that are expensed over a service period through December 31, 2017, 2016 and 2015, respectively, and vest in the subsequent quarter upon final payout approval. All awards vest immediately upon a change in control and a qualifying termination of employment as defined by the SunCoke LTPEP. The weighted average fair value of the PSUs granted during the years ended
December 31, 2015
,
2014
and
2013
was
$17.58
, $
26.09
and
$19.56
respectively, and is based on the closing price of our common stock on the date of grant as well as a
112
Monte Carlo simulation for the portion of the award subject to market conditions. The Company estimated a
zero percent
forfeiture rate for these awards.
The number of PSUs ultimately awarded will be adjusted based upon the following metrics: (1)
50 percent
of the award will be determined by the Company's
three
year total shareholder return ("TSR") as compared to the TSR of the companies making up the S&P 600; and (2)
50 percent
of the award will be determined by the Company's
three
year average pre-tax return on capital for the Company's coke and coal logistics businesses for the 2015 and 2014 grants and coke business only for the
2013
grants. Each portion of the award may be adjusted between
zero
and
200 percent
of the original units granted.
The following table summarizes information with respect to unearned PSUs outstanding as of
December 31, 2015
and PSU activity during the fiscal year then ended:
|
Number of
PSUs |
Weighted
Average Grant- Date Fair Value |
|||||
|
Nonvested at December 31, 2014
|
161,438
|
|
$
|
22.63
|
|
|
|
Granted
|
134,271
|
|
$
|
17.58
|
|
|
|
Vested
|
—
|
|
$
|
—
|
|
|
|
Forfeited
|
(41,057
|
)
|
$
|
18.71
|
|
|
|
Nonvested at December 31, 2015
|
254,652
|
|
$
|
20.14
|
|
|
The Company recognized
$0.5 million
,
$0.3 million
net of tax,
$1.2 million
,
$0.7 million
net of tax, and
$0.5 million
,
$0.3 million
net of tax, during the years ended December 31,
2015
,
2014
and
2013
, respectively. As of
December 31, 2015
, there was
$1.3 million
of total unrecognized compensation cost related to these nonvested PSUs. This compensation cost is expected to be recognized over the next
1.7
years.
Modifications
In connection with the distribution, certain Sunoco common stock awards and stock options that were held by Sunoco employees, Sunoco directors and SunCoke Energy employees were modified and an anti-dilutive provision was added. In general, all Sunoco stock options held by Sunoco employees and Sunoco directors were converted into both Sunoco and SunCoke Energy stock options. Sunoco stock options held by SunCoke Energy employees were converted to SunCoke Energy stock options. All SunCoke Energy common stock issued as a result of option exercises or the vesting of common stock awards will be issued under the SunCoke LTPEP.
At the distribution date,
1,219,842
SunCoke Energy stock options were issued in connection with the conversion of the outstanding Sunoco stock options to Sunoco employees and directors, of which
68,069
were outstanding at
December 31, 2015
. The converted stock options for Sunoco employees and directors are fully vested and exercisable and any expense associated with the modification of these stock options was recognized by Sunoco.
At the Distribution Date,
295,854
SunCoke Energy stock options were issued in connection with the conversion of the outstanding Sunoco stock options for SunCoke Energy employees, all of which are fully vested with
282,277
outstanding and exercisable as of
December 31, 2015
. These awards were fully expensed prior to
2014
and compensation expense during the year ended
December 31, 2013
was not material.
22. Earnings per Share
Basic earnings per share has been computed by dividing net income (loss) available to SunCoke Energy, Inc. by the weighted average number of shares outstanding during the period. Except where the result would be anti-dilutive, diluted earnings per share has been computed to give effect to share-based compensation awards using the treasury stock method.
The following table sets forth the reconciliation of the weighted-average number of common shares used to compute basic earnings per share (“EPS”) to those used to compute diluted EPS:
|
|
Years Ended December 31,
|
|||||||
|
|
2015
|
2014
|
2013
|
|||||
|
|
(Shares in millions)
|
|||||||
|
Weighted-average number of common shares outstanding-basic
|
65.0
|
|
68.8
|
|
69.9
|
|
||
|
Add: effect of dilutive share-based compensation awards
|
—
|
|
—
|
|
0.3
|
|
||
|
Weighted-average number of shares-diluted
|
65.0
|
|
68.8
|
|
70.2
|
|
||
For the years ended
December 31, 2015
,
2014
and
2013
, diluted earnings per share was calculated to give effect to share-based compensation awards granted using the treasury stock method.
113
The following table shows stock options, restricted stock units, and performance stock units that are excluded from the computation of diluted earnings per share as the shares would have been anti-dilutive:
|
|
Years Ended December 31,
|
|||||||
|
|
2015
|
2014
|
2013
|
|||||
|
|
(Shares in millions)
|
|||||||
|
Stock options
|
2.9
|
|
2.7
|
|
0.2
|
|
||
|
Restricted stock units
|
0.5
|
|
0.5
|
|
—
|
|
||
|
Performance stock units
|
—
|
|
0.1
|
|
—
|
|
||
|
Total
|
3.4
|
|
3.3
|
|
0.2
|
|
||
On
July 23, 2014
, the Company's Board of Directors authorized a program to repurchase outstanding shares of the Company’s common stock,
$0.01
par value, at any time and from time to time in the open market, through privately negotiated transactions, block transactions, or otherwise for a total aggregate cost to the Company not to exceed
$150.0 million
.
During
2015
, the Company repurchased
2.5 million
shares of our common stock at a cost of
$35.6 million
in the open market at an average share price of
$14.25
, leaving
$39.4 million
available under the authorized repurchase program. During 2014, the Company repurchased
3.2 million
shares of our common stock at a cost of
$75.0 million
in the open market at an average share price of
$23.28
, under the authorized repurchase program.
23. Partnership Unit Repurchase Program and Equity Distribution Agreement
On
July 20, 2015
, the Partnership's Board of Directors authorized a program for the Partnership to repurchase up to
$50 million
of its common units from time to time in open market transactions, including block trades, or in privately negotiated transactions. During
2015
, the Partnership repurchased
0.9 million
of its common units, in the open market, for
$12.8 million
at an average price of
$14.91
per unit, leaving
$37.2 million
available under the authorized unit repurchase program.
On
August 5, 2014
, the Partnership entered into an equity distribution agreement ("Equity Agreement") in which the Partnership may sell from time to time through Wells Fargo Securities, LLC, the Partnership’s common units representing limited partner interests having an aggregate offering price of up to
$75.0 million
.
During 2014, the Partnership sold
62,956
common units under the Equity Agreement with an aggregate offering price of
$1.8 million
, leaving
$73.2 million
available under the Equity Agreement.
The Equity Agreement was suspended during
2015
.
24. Fair Value Measurements
The Company measures certain financial and non-financial assets and liabilities at fair value on a recurring basis. Fair value is defined as the price that would be received to sell an asset or paid to transfer a liability in the principal or most advantageous market in an orderly transaction between market participants on the measurement date. Fair value disclosures are reflected in a three-level hierarchy, maximizing the use of observable inputs and minimizing the use of unobservable inputs.
The valuation hierarchy is based upon the transparency of inputs to the valuation of an asset or liability on the measurement date. The three levels are defined as follows:
|
•
|
Level 1—inputs to the valuation methodology are quoted prices (unadjusted) for an identical asset or liability in an active market.
|
|
•
|
Level 2—inputs to the valuation methodology include quoted prices for a similar asset or liability in an active market or model-derived valuations in which all significant inputs are observable for substantially the full term of the asset or liability.
|
|
•
|
Level 3—inputs to the valuation methodology are unobservable and significant to the fair value measurement of the asset or liability.
|
Financial Assets and Liabilities Measured at Fair Value on a Recurring Basis
Certain assets and liabilities are measured at fair value on a recurring basis. The Company’s cash equivalents, which amounted to
$15.4 million
and
$88.2 million
at
December 31, 2015
and
2014
, respectively, were measured at fair value based on quoted prices in active markets for identical assets. These inputs are classified as Level 1 within the valuation hierarchy.
114
CMT Contingent Consideration
Contingent consideration related to the CMT acquisition is measured at fair value and amounted to
$7.9 million
at
December 31, 2015
. The fair value was based on a probability-weighted analysis using significant inputs that are not observable in the market, or Level 3 inputs. There have been no changes to the significant inputs since acquisition. See
Note 3
.
Non-Financial Assets and Liabilities Measured at Fair Value on a Nonrecurring Basis
Certain assets and liabilities are measured at fair value on a nonrecurring basis; that is, the assets and liabilities are not measured at fair value on an ongoing basis, but are subject to fair value adjustments in certain circumstances (e.g., when there is evidence of impairment).
Coal Mining Impairments
In the second quarter of
2014
, the Company evaluated the recoverability of its long-lived coal asset group given the probable disposition of the assets as well as projected losses resulting from the weakening coal market.
The Company performed a probability-weighted undiscounted cash flows analysis which indicated that the carrying value of the asset group was not recoverable. As such, the Company reduced the carrying value of the long-lived assets to their estimated fair value and recorded a pre-tax impairment charge of
$97.1 million
,
$59.5 million
, net of tax. The fair value was determined based on estimated discounted cash flows from the coal mining assets, which reflected the weakness in the coal market and were considered Level 3 inputs in the fair value hierarchy. Key assumptions included (a) coal sales prices of
$97
per ton to
$149
per ton; (b) sales volumes of
1.6 million
tons to
1.8 million
tons; and (c) a
14.0 percent
discount rate representing the estimated weighted average cost of capital. Various third-party indicative offers for the assets were considered and were also included in the Company's assessment of the fair value of the asset group. In previous analyses, based upon the business plan and market expectations of coal prices at that time, the carrying value was recoverable and was substantially in excess of the undiscounted cash flows. Recent changes in market conditions, specifically decreased coal sales price expectations, were included in our asset impairment analysis.
Additionally, in connections with plans to idle our preparation plant we recorded
$1.7 million
of impairment charges in the fourth quarter of 2014.
As a result of the weakening coal market and the long-lived asset impairment discussed above, the Company also performed a goodwill impairment analysis as of
June 30, 2014
for the coal mining reporting unit. This analysis concluded the fair value of the reporting unit, based on a discounted cash flows analysis, was less than the carrying amount. As a result, the Company recorded a
$6.0 million
pre-tax impairment of the entire goodwill balance,
$3.7 million
, net of tax.
During
2014
, with our previous held for sale presentation of our coal mining assets, the Company valued these assets at fair value less costs to sell. This resulted in additional impairment charges of
$45.5 million
,
$27.9 million
, net of tax. The fair value was estimated utilizing a market approach, which was considered Level 2 in the fair value hierarchy. See
Note 5
.
During the second quarter of
2015
the Company determined that a sale of our coal mining business was no longer probable, and Coal Mining segment assets and liabilities were reclassified as held and used for all periods presented, at which time
the net assets were fair valued, with no net impact on the Consolidated Statements of Operations during
2015
. Additionally, the Consolidated Balance Sheet at
December 31, 2014
, was reclassified to reflect the coal mining assets and liabilities as held and used. There have been no changes since the second quarter of
2015
that would require further valuations of the Coal Mining business.
India Equity Method Investment Valuation
VISA SunCoke has continued to experience downward market pressures. Coke imports from China caused weakness in the coke pricing environment, and certain iron ore restrictions in India limited steel production. As a result of these sustained depressed market conditions, during
2014
, the Company evaluated the recoverability of its equity method investment in VISA SunCoke, which
resulted in an other-than-temporary impairment charge of the joint venture investment in the Company's India reportable segment of
$30.5 million
, which was recorded in loss from equity method investment on the Consolidated Statement of Operations. Continued deterioration of market factors led to additional impairment of
$19.4 million
during
2015
, resulting in an investment balance of
zero
.
The estimated discounted cash flows in both
2014
and in
2015
reflect weakness in the India market and utilize inputs considered Level 3 in the fair value hierarchy. Key assumptions in the
2014
discounted cash flow analysis included the timing and extent of future improvements in the Indian market and gross margin of
$4
per ton to
$24
per ton and a discount rate of
13.5 percent
. These assumptions reflect the lifting of iron ore mining restrictions and the anticipated mitigation of Chinese coke imports. Key assumptions in the
2015
discounted cash flow analysis included a
13.5 percent
discount rate and estimated cash flows, which considered the timing and extent of future improvements in the Indian market, an important component of which is gross margin recovery. The continuing deterioration of market conditions has resulted in forecasted gross loss of
$8
per ton to a forecasted gross margin gain of
$13
per ton upon market recovery. A
$5
per ton change in the gross margin assumption would
115
impact the valuation of our investment by approximately
$8 million
. To the extent possible, the Company considered available market information and other third-party data and compared the inputs to relevant historical information.
Certain Financial Assets and Liabilities not Measured at Fair Value
At
December 31, 2015
and
2014
, the fair value of the Company’s long-term debt was estimated to be
$788.8 million
and
$662.9 million
, respectively, compared to a carrying amount of
$1,003.8 million
and
$640.0 million
, respectively. These fair values were estimated by management based upon estimates of debt pricing provided by financial institutions which are considered Level 2 inputs.
25. Business Segment Information
The Company is an independent owner and operator of
five
cokemaking facilities in the eastern and midwestern regions of the U.S. The Company is also the operator of a cokemaking facility for a project company in Brazil in which it has a preferred stock investment and is a
49 percent
joint venture partner in a cokemaking operation in India. In addition to its cokemaking operations, the Company has metallurgical coal mining operations in the eastern U.S. as well as coal handling and/or mixing operations in the eastern and midwestern regions of the U.S.
The Domestic Coke segment includes the Jewell, Indiana Harbor, Haverhill, Granite City and Middletown cokemaking facilities. Each of these facilities produces coke and all facilities except Jewell and Indiana Harbor recover waste heat which is converted to steam or electricity through a similar production process. Coke sales at each of the Company's
five
domestic cokemaking facilities are made pursuant to long-term, take-or-pay agreements with ArcelorMittal, AK Steel, and U.S. Steel. Each of the coke sales agreements contains pass-through provisions for costs incurred in the cokemaking process, including coal procurement costs (subject to meeting contractual coal-to-coke yields), operating and maintenance expense, costs related to the transportation of coke to the customers, taxes (other than income taxes) and costs associated with changes in regulation, in addition to containing a fixed fee.
We own a
49 percent
interest in VISA SunCoke and account for this investment under the equity method. VISA SunCoke is comprised of a
440 thousand
ton heat recovery cokemaking facility and the facility's associated steam generation units in Odisha, India. We recognized our share of earnings in VISA SunCoke on a
one
month lag and began recognizing such earnings in the second quarter of 2013.
During 2015, we impaired our investment in VISA SunCoke to
zero
and, consequently, beginning in the fourth quarter of 2015, we no longer include our share of VISA SunCoke in our financial results.
The Brazil Coke segment operates a cokemaking facility located in Vitória, Brazil for a project company. The Brazil Coke segment earns income from the Brazilian facility through (1) licensing and operating fees payable to us under long-term contracts with the local project company that will run through at least
2022
and (2) an annual preferred dividend on our preferred stock investment from the project company guaranteed by the Brazil subsidiary of ArcelorMittal.
Coal Logistics operations are comprised of CMT located in Louisiana, Lake Terminal located in Indiana and KRT located in Kentucky and West Virginia. This business provides coal handling and/or mixing services to third-party customers as well as SunCoke cokemaking facilities and has a collective capacity to mix and transload more than
40 million
tons of coal annually. Coal handling and mixing results are presented in the Coal Logistics segment.
The Coal Mining segment conducts coal mining operations near the Company’s Jewell cokemaking facility with mines located in Virginia and West Virginia, which are currently mined by contractors. A substantial portion of the coal production is sold to the Jewell cokemaking facility for conversion into coke. Some coal is also sold to other cokemaking facilities within the Domestic Coke segment. Intersegment coal revenues for sales to the Domestic Coke segment are reflective of the contract price that the facilities within the Domestic Coke segment charge their customers, which approximate the market prices for this quality of metallurgical coal.
Corporate expenses that can be identified with a segment have been included in determining segment results. The remainder is included in Corporate and Other, including certain legacy coal mining expense (i.e. black lung, workers compensation, and net pension and other postretirement employee benefit obligations). Interest expense, net, which consists principally of interest expense, net of capitalized interest and interest income, is also excluded from segment results. Segment assets, net of tax are those assets that are utilized within a specific segment and exclude deferred taxes and current tax receivables.
116
The following table includes Adjusted EBITDA, which is the measure of segment profit or loss and liquidity reported to the chief operating decision maker for purposes of allocating resources to the segments and assessing their performance:
|
|
Years Ended December 31,
|
|||||||||||
|
|
2015
|
2014
|
2013
|
|||||||||
|
|
(Dollars in millions)
|
|||||||||||
|
Sales and other operating revenue:
|
||||||||||||
|
Domestic Coke
|
$
|
1,243.6
|
|
$
|
1,388.3
|
|
$
|
1,528.7
|
|
|||
|
Brazil Coke
|
34.0
|
|
37.0
|
|
35.4
|
|
||||||
|
Coal Logistics
|
60.8
|
|
36.2
|
|
8.1
|
|
||||||
|
Coal Logistics intersegment sales
|
20.4
|
|
18.8
|
|
5.5
|
|
||||||
|
Coal Mining
|
12.9
|
|
29.2
|
|
61.3
|
|
||||||
|
Coal Mining intersegment sales
|
101.0
|
|
136.0
|
|
136.7
|
|
||||||
|
Elimination of intersegment sales
|
(121.4
|
)
|
(154.8
|
)
|
(142.2
|
)
|
||||||
|
Total sales and other operating revenue
|
$
|
1,351.3
|
|
$
|
1,490.7
|
|
$
|
1,633.5
|
|
|||
|
Adjusted EBITDA:
|
||||||||||||
|
Adjusted EBITDA
|
||||||||||||
|
Domestic Coke
|
$
|
210.1
|
|
$
|
247.9
|
|
$
|
243.2
|
|
|||
|
Brazil Coke
|
22.4
|
|
18.9
|
|
16.1
|
|
||||||
|
India Coke
|
(1.9
|
)
|
(3.1
|
)
|
0.9
|
|
||||||
|
Coal Logistics
|
38.4
|
|
14.3
|
|
4.7
|
|
||||||
|
Coal Mining
|
(18.9
|
)
|
(16.0
|
)
|
(15.1
|
)
|
||||||
|
Corporate and Other, including legacy costs, net
(1)
|
(64.3
|
)
|
(51.3
|
)
|
(34.7
|
)
|
||||||
|
Adjusted EBITDA
|
$
|
185.8
|
|
$
|
210.7
|
|
$
|
215.1
|
|
|||
|
Depreciation and amortization expense:
|
||||||||||||
|
Domestic Coke
(2)
|
$
|
81.6
|
|
$
|
81.3
|
|
$
|
68.1
|
|
|||
|
Brazil Coke
|
0.6
|
|
0.5
|
|
0.4
|
|
||||||
|
Coal Logistics
|
14.0
|
|
7.6
|
|
1.8
|
|
||||||
|
Coal Mining
(3)
|
10.1
|
|
13.9
|
|
23.2
|
|
||||||
|
Corporate and Other
|
2.8
|
|
3.0
|
|
2.5
|
|
||||||
|
Total depreciation and amortization expense
|
$
|
109.1
|
|
$
|
106.3
|
|
$
|
96.0
|
|
|||
|
Capital expenditures:
|
||||||||||||
|
Domestic Coke
|
$
|
67.6
|
|
$
|
109.2
|
|
$
|
121.2
|
|
|||
|
Brazil Coke
|
—
|
|
0.9
|
|
0.8
|
|
||||||
|
Coal Logistics
|
6.0
|
|
2.9
|
|
0.2
|
|
||||||
|
Coal Mining
|
1.7
|
|
8.8
|
|
20.1
|
|
||||||
|
Corporate and Other
|
0.5
|
|
3.4
|
|
3.3
|
|
||||||
|
Total capital expenditures
|
$
|
75.8
|
|
$
|
125.2
|
|
$
|
145.6
|
|
|||
117
(1) Legacy costs, net include costs associated with former mining employee-related liabilities prior to the implementation of our current contractor mining business, net of certain royalty revenues. See details of these legacy items below.
|
Years Ended December 31,
|
|||||||||||
|
2015
|
2014
|
2013
|
|||||||||
|
(Dollars in millions)
|
|||||||||||
|
Black lung (expense) benefit
|
$
|
(9.8
|
)
|
$
|
(14.3
|
)
|
$
|
0.3
|
|
||
|
Postretirement benefit plan benefit
|
3.6
|
|
3.7
|
|
1.0
|
|
|||||
|
Defined benefit plan (expense) benefit
|
(13.1
|
)
|
(0.2
|
)
|
0.1
|
|
|||||
|
Workers compensation expense
|
(2.3
|
)
|
(4.6
|
)
|
(2.0
|
)
|
|||||
|
Other
|
(0.4
|
)
|
0.7
|
|
0.6
|
|
|||||
|
Total legacy costs, net
|
$
|
(22.0
|
)
|
$
|
(14.7
|
)
|
$
|
—
|
|
||
(2) We revised the estimated useful lives at our domestic cokemaking facilities, resulting in additional depreciation of
$10.2 million
,
$15.6 million
and
$9.5 million
, or
$0.16
,
$0.23
and
$0.14
per common share from operations, during
2015
,
2014
and
2013
, respectively.
(3) We revised the estimated useful lives of certain coal preparation plant assets in our Coal Mining segment, which resulted in additional depreciation of
$4.9 million
and
$1.0 million
, or
$0.08
and
$0.01
per common share, during
2015
and
2014
, respectively.
|
Years Ended December 31,
|
||||||||
|
2015
|
2014
|
|||||||
|
(Dollars in millions)
|
||||||||
|
Segment assets
|
||||||||
|
Domestic Coke
|
$
|
1,534.2
|
|
$
|
1,577.9
|
|
||
|
Brazil Coke
|
58.8
|
|
61.6
|
|
||||
|
India Coke
|
—
|
|
22.5
|
|
||||
|
Coal Logistics
|
532.0
|
|
114.4
|
|
||||
|
Coal Mining
|
20.5
|
|
45.9
|
|
||||
|
Corporate and Other
|
98.4
|
|
131.4
|
|
||||
|
Segment assets, excluding tax assets
|
2,243.9
|
|
1,953.7
|
|
||||
|
Tax assets
|
11.6
|
|
6.0
|
|
||||
|
Total Assets
|
$
|
2,255.5
|
|
$
|
1,959.7
|
|
||
The following table sets forth the Company’s total sales and other operating revenue by product or service:
|
|
Years Ended December 31,
|
||||||||||
|
|
2015
|
2014
|
2013
|
||||||||
|
|
(Dollars in millions)
|
||||||||||
|
Sales and other operating revenue:
|
|||||||||||
|
Coke sales
|
$
|
1,182.0
|
|
$
|
1,323.1
|
|
$
|
1,462.9
|
|
||
|
Steam and electricity sales
|
61.5
|
|
65.7
|
|
65.6
|
|
|||||
|
Operating and licensing fees
|
34.0
|
|
37.0
|
|
35.4
|
|
|||||
|
Coal logistics
|
58.8
|
|
33.9
|
|
7.2
|
|
|||||
|
Metallurgical coal sales
|
11.0
|
|
24.0
|
|
61.0
|
|
|||||
|
Other
|
4.0
|
|
7.0
|
|
1.4
|
|
|||||
|
Sales and other operating revenue
|
$
|
1,351.3
|
|
$
|
1,490.7
|
|
$
|
1,633.5
|
|
||
The Company evaluates the performance of its segments based on segment Adjusted EBITDA, which is defined as earnings before interest, taxes, depreciation and amortization (“EBITDA”) adjusted for impairments, coal rationalization costs, sales discounts, Coal Logistics deferred revenue and interest, taxes, depreciation and amortization attributable to our equity method investment. Prior to the expiration of our nonconventional fuel tax credits in November
2013
, Adjusted EBITDA included an add-back of sales discounts related to the sharing of these credits with customers. Any adjustments to these
118
amounts subsequent to
2013
have been included in Adjusted EBITDA. Coal Logistics deferred revenue adjusts for differences between the timing of recognition of take-or-pay shortfalls into revenue for GAAP purposes versus the timing of payments from our customers. This adjustment aligns Adjusted EBITDA more closely with cash flow. Our Adjusted EBITDA also includes EBITDA attributable to our equity method investment. EBITDA and Adjusted EBITDA do not represent and should not be considered alternatives to net income or operating income under GAAP and may not be comparable to other similarly titled measures in other businesses.
Management believes Adjusted EBITDA is an important measure of the operating performance and liquidity of the Company's net assets and its ability to incur and service debt, fund capital expenditures and make distributions. Adjusted EBITDA provides useful information to investors because it highlights trends in our business that may not otherwise be apparent when relying solely on GAAP measures and because it eliminates items that have less bearing on our operating performance and liquidity. EBITDA and Adjusted EBITDA are not measures calculated in accordance with GAAP, and they should not be considered a substitute for net income, operating cash flow or any other measure of financial performance presented in accordance with GAAP. Set forth below is additional discussion of the limitations of Adjusted EBITDA as an analytical tool.
Limitations
. Other companies may calculate Adjusted EBITDA differently than we do, limiting its usefulness as a comparative measure. Adjusted EBITDA also has limitations as an analytical tool and should not be considered in isolation or as a substitute for an analysis of our results as reported under GAAP. Some of these limitations include that Adjusted EBITDA:
|
•
|
does not reflect our cash expenditures, or future requirements, for capital expenditures or contractual commitments;
|
|
•
|
does not reflect items such as depreciation and amortization;
|
|
•
|
does not reflect changes in, or cash requirement for, working capital needs;
|
|
•
|
does not reflect our interest expense, or the cash requirements necessary to service interest on or principal payments of our debt;
|
|
•
|
does not reflect certain other non-cash income and expenses
|
|
•
|
excludes income taxes that may represent a reduction in available cash; and
|
|
•
|
includes net income attributable to noncontrolling interests
|
119
Below is a reconciliation of Adjusted EBITDA to net income and net cash provided by operating activities, which are its most directly comparable financial measures calculated and presented in accordance with GAAP:
|
|
Years Ended December 31,
|
||||||||||
|
|
2015
|
2014
|
2013
|
||||||||
|
|
(Dollars in millions)
|
||||||||||
|
Adjusted EBITDA attributable to SunCoke Energy, Inc.
|
$
|
104.6
|
|
$
|
150.0
|
|
$
|
173.9
|
|
||
|
Add: Adjusted EBITDA attributable to noncontrolling interest
(1)
|
81.2
|
|
60.7
|
|
41.2
|
|
|||||
|
Adjusted EBITDA
|
$
|
185.8
|
|
$
|
210.7
|
|
$
|
215.1
|
|
||
|
Subtract:
|
|||||||||||
|
Adjustment to unconsolidated affiliate earnings
(2)
|
$
|
20.8
|
|
$
|
33.5
|
|
$
|
3.2
|
|
||
|
Coal rationalization costs
(3)
|
0.6
|
|
18.5
|
|
—
|
|
|||||
|
Depreciation and amortization expense
|
109.1
|
|
106.3
|
|
96.0
|
|
|||||
|
Interest expense, net
|
56.7
|
|
63.2
|
|
52.3
|
|
|||||
|
Income tax (benefit) expense
|
(8.8
|
)
|
(58.8
|
)
|
6.7
|
|
|||||
|
Sales discount provided to customers due to sharing of
nonconventional fuels tax credits (4) |
—
|
|
(0.5
|
)
|
6.8
|
|
|||||
|
Asset and goodwill impairment
|
—
|
|
150.3
|
|
—
|
|
|||||
|
Coal Logistics deferred revenue
(5)
|
(2.9
|
)
|
—
|
|
—
|
|
|||||
|
Net income (loss)
|
$
|
10.3
|
|
$
|
(101.8
|
)
|
$
|
50.1
|
|
||
|
Add:
|
|||||||||||
|
Asset and goodwill impairment
|
$
|
—
|
|
$
|
150.3
|
|
$
|
—
|
|
||
|
Depreciation and amortization expense
|
109.1
|
|
106.3
|
|
96.0
|
|
|||||
|
Deferred income tax (benefit) expense
|
(5.6
|
)
|
(64.4
|
)
|
1.6
|
|
|||||
|
Loss on extinguishment of debt
|
0.5
|
|
15.4
|
|
—
|
|
|||||
|
Changes in working capital and other
|
26.8
|
|
6.5
|
|
3.6
|
|
|||||
|
Net cash provided by operating activities
|
$
|
141.1
|
|
$
|
112.3
|
|
$
|
151.3
|
|
||
|
(1)
|
Reflects non-controlling interest in Indiana Harbor and the portion of the Partnership owned by public unitholders.
|
|
(2)
|
Reflects share of interest, taxes, depreciation and amortization related to VISA SunCoke. The years ended
December 31, 2015
and
2014
also reflect impairments of our investment in VISA SunCoke of
$19.4 million
and
$30.5 million
, respectively.
|
|
(3)
|
Coal rationalization costs include employee severance, contract termination costs and other costs to idle mines incurred during the execution of our coal rationalization plan.
|
|
(4)
|
At December 31, 2013, we had
$13.6 million
accrued related to sales discounts to be paid to our customer at our Granite City facility. During the first quarter of 2014, we settled this obligation for
$13.1 million
which resulted in a gain of
$0.5 million
. The gain was recorded in sales and other operating revenue on our Combined and Consolidated Statement of Operations.
|
|
(5)
|
Coal Logistics deferred revenue adjusts for differences between the timing of recognition of take-or-pay shortfalls into revenue for GAAP purposes versus the timing of payments from our customers. This adjustment aligns Adjusted EBITDA more closely with cash flow.
|
120
26. Selected Quarterly Data (unaudited)
|
|
2015
|
2014
|
|||||||||||||||||||||||||||||
|
|
First
Quarter |
Second
Quarter |
Third
Quarter |
Fourth
Quarter |
First
Quarter |
Second
Quarter |
Third
Quarter |
Fourth
Quarter |
|||||||||||||||||||||||
|
|
(Dollars in millions)
|
||||||||||||||||||||||||||||||
|
Sales and other operating revenue
|
$
|
323.9
|
|
$
|
347.6
|
|
$
|
336.2
|
|
$
|
343.6
|
|
$
|
358.0
|
|
$
|
371.7
|
|
$
|
376.2
|
|
$
|
384.8
|
|
|||||||
|
Gross profit
(1)
|
$
|
38.0
|
|
$
|
25.2
|
|
$
|
44.3
|
|
$
|
36.3
|
|
$
|
25.0
|
|
$
|
53.1
|
|
$
|
60.7
|
|
$
|
32.7
|
|
|||||||
|
Net income (loss)
(2)
|
$
|
0.4
|
|
$
|
(6.5
|
)
|
$
|
(16.5
|
)
|
$
|
32.9
|
|
$
|
(3.8
|
)
|
$
|
(48.6
|
)
|
$
|
6.4
|
|
$
|
(55.8
|
)
|
|||||||
|
Less: Net income attributable to noncontrolling interests
|
$
|
4.4
|
|
$
|
7.0
|
|
$
|
7.0
|
|
$
|
13.9
|
|
$
|
4.0
|
|
$
|
0.6
|
|
$
|
10.0
|
|
$
|
9.7
|
|
|||||||
|
Net (loss) income attributable to SunCoke Energy, Inc.
|
$
|
(4.0
|
)
|
$
|
(13.5
|
)
|
$
|
(23.5
|
)
|
$
|
19.0
|
|
$
|
(7.8
|
)
|
$
|
(49.2
|
)
|
$
|
(3.6
|
)
|
$
|
(65.5
|
)
|
|||||||
|
(Loss) earnings attributable to SunCoke Energy, Inc. per common share:
|
|||||||||||||||||||||||||||||||
|
Basic
|
$
|
(0.06
|
)
|
$
|
(0.21
|
)
|
$
|
(0.36
|
)
|
$
|
0.30
|
|
$
|
(0.11
|
)
|
$
|
(0.71
|
)
|
$
|
(0.05
|
)
|
$
|
(0.98
|
)
|
|||||||
|
Diluted
|
$
|
(0.06
|
)
|
$
|
(0.21
|
)
|
$
|
(0.36
|
)
|
$
|
0.30
|
|
$
|
(0.11
|
)
|
$
|
(0.71
|
)
|
$
|
(0.05
|
)
|
$
|
(0.98
|
)
|
|||||||
|
Cash dividends declared per share
|
$
|
0.0585
|
|
$
|
0.0750
|
|
$
|
0.1500
|
|
$
|
0.1500
|
|
$
|
—
|
|
$
|
—
|
|
$
|
—
|
|
$
|
0.0585
|
|
|||||||
|
(1)
|
Gross profit equals sales and other operating revenue less cost of products sold and operating expenses and depreciation and amortization.
|
|
(2)
|
Net income in the second, third and fourth quarter of 2014 was unfavorably impacted by impairment charges relating to our Coal Mining business of
$103.1 million
,
$16.4 million
and
$30.8 million
, respectively. The pension settlement unfavorably impacted net income in the second quarter of 2015, when the Company recorded a net settlement loss of
$12.6 million
. Additionally, net income was unfavorably impacted by non-cash impairment charges on our investment in VISA SunCoke, our Indian cokemaking joint venture, recorded in the third quarter of 2015 and the fourth quarter of 2014 of
$19.4 million
and
$30.5 million
, respectively.
|
27. Supplemental Condensed Consolidating Financial Information
Certain
100 percent
owned subsidiaries of the Company serve as guarantors of the obligations under the Credit Agreement and
$44.6 million
of Notes (“Guarantor Subsidiaries”). These guarantees are full and unconditional (subject, in the case of the Guarantor Subsidiaries, to customary release provisions as described below) and joint and several. For purposes of the following footnote, SunCoke Energy, Inc. is referred to as “Issuer.” The indenture dated
July 26, 2011
among the Company, the guarantors party thereto and The Bank of New York Mellon Trust Company, N.A., governs subsidiaries designated as “Guarantor Subsidiaries.” All other consolidated subsidiaries of the Company are collectively referred to as “Non-Guarantor Subsidiaries.”
The ability of the Partnership and Indiana Harbor to pay dividends and make loans to the Company is restricted under the partnership agreements of the Partnership and Indiana Harbor, respectively. The credit agreement governing the Partnership’s credit facility and the indenture governing the Partnership Notes contain customary provisions which would potentially restrict the Partnership’s ability to make distributions or loans to the Company under certain circumstances. For the year ended
December 31, 2015
, less than
25 percent
of net assets were restricted.
In connection with the Granite City Dropdown, the Company entered into an amendment to our Credit Agreement. In conjunction with the amendment, we designated Gateway Energy & Coke Company, LLC and Gateway Cogeneration Company, LLC as unrestricted subsidiaries.
Additionally, in 2015, the Company's Board of Directors designated certain coal mining entities as unrestricted subsidiaries
. As such, all the subsidiaries described above are presented as "Non-Guarantor Subsidiaries." Prior periods have been restated to reflect this change.
The guarantee of a Guarantor Subsidiary will terminate upon:
|
•
|
a sale or other disposition of the Guarantor Subsidiary or of all or substantially all of its assets;
|
|
•
|
a sale of the majority of the Capital Stock of a Guarantor Subsidiary to a third-party, after which the Guarantor Subsidiary is no longer a "Restricted Subsidiary" in accordance with the indenture governing the Notes;
|
|
•
|
the liquidation or dissolution of a Guarantor Subsidiary so long as no "Default" or "Event of Default," as defined under the indenture governing the Notes, has occurred as a result thereof;
|
121
|
•
|
the designation of a Guarantor Subsidiary as an "unrestricted subsidiary" in accordance with the indenture governing the Notes
|
|
•
|
the requirements for defeasance or discharge of the indentures governing the Notes having been satisfied;
|
|
•
|
the release, other than the discharge through payments by a Guarantor Subsidiary, from its guarantee under the Credit Agreement or other indebtedness that resulted in the obligation of the Guarantor Subsidiary under the indenture governing the Notes.
|
The following supplemental condensed combining and consolidating financial information reflects the Issuer’s separate accounts, the combined accounts of the Guarantor Subsidiaries, the combined accounts of the Non-Guarantor Subsidiaries, the combining and consolidating adjustments and eliminations and the Issuer’s consolidated accounts for the dates and periods indicated. For purposes of the following condensed combining and consolidating information, the Issuer’s investments in its subsidiaries and the Guarantor and Non-Guarantor Subsidiaries’ investments in its subsidiaries are accounted for under the equity method of accounting.
122
SunCoke Energy, Inc.
Condensed Consolidating Statement of Operations
Years Ended December 31, 2015
(Dollars in millions)
|
Issuer
|
Guarantor
Subsidiaries |
Non-
Guarantor Subsidiaries |
Combining
and Consolidating Adjustments |
Total
|
|||||||||||||||
|
Revenues
|
|||||||||||||||||||
|
Sales and other operating revenue
|
$
|
—
|
|
$
|
196.8
|
|
$
|
1,154.5
|
|
$
|
—
|
|
$
|
1,351.3
|
|
||||
|
Equity in (loss) earnings of subsidiaries
|
(8.4
|
)
|
34.4
|
|
—
|
|
(26.0
|
)
|
—
|
|
|||||||||
|
Other income (loss), net
|
—
|
|
0.4
|
|
11.0
|
|
—
|
|
11.4
|
|
|||||||||
|
Total revenues
|
(8.4
|
)
|
231.6
|
|
1,165.5
|
|
(26.0
|
)
|
1,362.7
|
|
|||||||||
|
Costs and operating expenses
|
|||||||||||||||||||
|
Cost of products sold and operating expenses
|
—
|
|
150.2
|
|
948.2
|
|
—
|
|
1,098.4
|
|
|||||||||
|
Selling, general and administrative expenses
|
9.5
|
|
30.7
|
|
35.2
|
|
—
|
|
75.4
|
|
|||||||||
|
Depreciation and amortization expenses
|
—
|
|
10.4
|
|
98.7
|
|
—
|
|
109.1
|
|
|||||||||
|
Total costs and operating expenses
|
9.5
|
|
|
191.3
|
|
|
1,082.1
|
|
|
|
|
|
1,282.9
|
|
|||||
|
Operating (loss) income
|
(17.9
|
)
|
40.3
|
|
83.4
|
|
(26.0
|
)
|
79.8
|
|
|||||||||
|
Interest (income) expense, net - affiliate
|
—
|
|
(7.3
|
)
|
7.3
|
|
—
|
|
—
|
|
|||||||||
|
Interest expense (income), net
|
9.5
|
|
(0.6
|
)
|
47.8
|
|
—
|
|
56.7
|
|
|||||||||
|
Total interest expense (income), net
|
9.5
|
|
(7.9
|
)
|
55.1
|
|
—
|
|
56.7
|
|
|||||||||
|
(Loss) income before income tax expense and loss from
equity method investment |
(27.4
|
)
|
|
48.2
|
|
|
28.3
|
|
|
(26.0
|
)
|
23.1
|
|
||||||
|
Income tax (benefit) expense
|
(5.4
|
)
|
29.6
|
|
(33.0
|
)
|
—
|
|
(8.8
|
)
|
|||||||||
|
Loss from equity method investment
|
—
|
|
—
|
|
21.6
|
|
—
|
|
21.6
|
|
|||||||||
|
Net (loss) income
|
(22.0
|
)
|
|
18.6
|
|
|
39.7
|
|
|
(26.0
|
)
|
10.3
|
|
||||||
|
Less: Net income attributable to noncontrolling interests
|
—
|
|
—
|
|
32.3
|
|
—
|
|
32.3
|
|
|||||||||
|
Net (loss) income attributable to SunCoke Energy, Inc.
|
$
|
(22.0
|
)
|
$
|
18.6
|
|
$
|
7.4
|
|
$
|
(26.0
|
)
|
$
|
(22.0
|
)
|
||||
|
Comprehensive (loss) income
|
$
|
(20.3
|
)
|
$
|
18.4
|
|
$
|
41.6
|
|
$
|
(27.7
|
)
|
$
|
12.0
|
|
||||
|
Less: Comprehensive income attributable to noncontrolling interests
|
—
|
|
—
|
|
32.3
|
|
—
|
|
32.3
|
|
|||||||||
|
Comprehensive (loss) income attributable to SunCoke Energy, Inc.
|
$
|
(20.3
|
)
|
$
|
18.4
|
|
$
|
9.3
|
|
$
|
(27.7
|
)
|
$
|
(20.3
|
)
|
||||
123
SunCoke Energy, Inc.
Condensed Consolidating Statement of Income
Years Ended December 31, 2014
(Dollars in millions)
|
Issuer
|
Guarantor
Subsidiaries |
Non-
Guarantor Subsidiaries |
Combining
and Consolidating Adjustments |
Total
|
|||||||||||||||
|
Revenues
|
|||||||||||||||||||
|
Sales and other operating revenue
|
$
|
—
|
|
$
|
210.0
|
|
$
|
1,280.7
|
|
$
|
—
|
|
$
|
1,490.7
|
|
||||
|
Equity in (loss) earnings of subsidiaries
|
(101.3
|
)
|
(57.4
|
)
|
—
|
|
158.7
|
|
—
|
|
|||||||||
|
Other (loss) income, net
|
(0.2
|
)
|
1.6
|
|
11.7
|
|
—
|
|
13.1
|
|
|||||||||
|
Total revenues
|
(101.5
|
)
|
154.2
|
|
1,292.4
|
|
158.7
|
|
1,503.8
|
|
|||||||||
|
Costs and operating expenses
|
|||||||||||||||||||
|
Cost of products sold and operating expenses
|
—
|
|
156.0
|
|
1,056.9
|
|
—
|
|
1,212.9
|
|
|||||||||
|
Selling, general and administrative expenses
|
13.5
|
|
28.3
|
|
54.9
|
|
—
|
|
96.7
|
|
|||||||||
|
Depreciation and amortization expenses
|
—
|
|
8.4
|
|
97.9
|
|
—
|
|
106.3
|
|
|||||||||
|
Asset and goodwill impairment
|
—
|
|
—
|
|
150.3
|
|
—
|
|
150.3
|
|
|||||||||
|
Total costs and operating expenses
|
13.5
|
|
192.7
|
|
1,360.0
|
|
—
|
|
1,566.2
|
|
|||||||||
|
Operating (loss) income
|
(115.0
|
)
|
(38.5
|
)
|
(67.6
|
)
|
158.7
|
|
(62.4
|
)
|
|||||||||
|
Interest (income) expense, net - affiliate
|
—
|
|
(7.3
|
)
|
7.3
|
|
—
|
|
—
|
|
|||||||||
|
Interest expense (income), net
|
26.3
|
|
(1.8
|
)
|
38.7
|
|
—
|
|
63.2
|
|
|||||||||
|
Total interest expense (income), net
|
26.3
|
|
(9.1
|
)
|
46.0
|
|
—
|
|
63.2
|
|
|||||||||
|
(Loss) income before income tax expense and loss from equity method investment
|
(141.3
|
)
|
|
(29.4
|
)
|
|
(113.6
|
)
|
|
158.7
|
|
(125.6
|
)
|
||||||
|
Income tax (benefit) expense
|
(15.2
|
)
|
29.5
|
|
(73.1
|
)
|
—
|
|
(58.8
|
)
|
|||||||||
|
Loss from equity method investment
|
—
|
|
—
|
|
35.0
|
|
—
|
|
35.0
|
|
|||||||||
|
Net (loss) income
|
(126.1
|
)
|
|
(58.9
|
)
|
|
(75.5
|
)
|
|
158.7
|
|
(101.8
|
)
|
||||||
|
Less: Net income attributable to noncontrolling interests
|
—
|
|
—
|
|
24.3
|
|
—
|
|
24.3
|
|
|||||||||
|
Net (loss) income attributable to SunCoke Energy, Inc.
|
$
|
(126.1
|
)
|
$
|
(58.9
|
)
|
$
|
(99.8
|
)
|
$
|
158.7
|
|
$
|
(126.1
|
)
|
||||
|
Comprehensive (loss) income
|
$
|
(133.5
|
)
|
$
|
(61.1
|
)
|
$
|
(80.7
|
)
|
$
|
166.1
|
|
$
|
(109.2
|
)
|
||||
|
Less: Comprehensive income attributable to noncontrolling interests
|
—
|
|
—
|
|
24.3
|
|
—
|
|
24.3
|
|
|||||||||
|
Comprehensive (loss) income attributable to SunCoke Energy, Inc.
|
$
|
(133.5
|
)
|
$
|
(61.1
|
)
|
$
|
(105.0
|
)
|
$
|
166.1
|
|
$
|
(133.5
|
)
|
||||
124
SunCoke Energy, Inc.
Condensed Consolidating Statement of Income
Years Ended December 31, 2013
(Dollars in millions)
|
Issuer
|
Guarantor
Subsidiaries |
Non-
Guarantor Subsidiaries |
Combining
and Consolidating Adjustments |
Total
|
|||||||||||||||
|
Revenues
|
|||||||||||||||||||
|
Sales and other operating revenue
|
$
|
—
|
|
$
|
236.0
|
|
$
|
1,397.5
|
|
$
|
—
|
|
$
|
1,633.5
|
|
||||
|
Equity in earnings (loss) of subsidiaries
|
56.2
|
|
84.3
|
|
—
|
|
(140.5
|
)
|
—
|
|
|||||||||
|
Other income (loss), net
|
—
|
|
3.7
|
|
10.5
|
|
—
|
|
14.2
|
|
|||||||||
|
Total revenues
|
56.2
|
|
324.0
|
|
1,408.0
|
|
(140.5
|
)
|
1,647.7
|
|
|||||||||
|
Costs and operating expenses
|
|||||||||||||||||||
|
Cost of products sold and operating expenses
|
—
|
|
179.3
|
|
1,168.7
|
|
—
|
|
1,348.0
|
|
|||||||||
|
Selling, general and administrative expenses
|
12.2
|
|
34.9
|
|
45.3
|
|
—
|
|
92.4
|
|
|||||||||
|
Depreciation and amortization expenses
|
—
|
|
7.5
|
|
88.5
|
|
—
|
|
96.0
|
|
|||||||||
|
Total costs and operating expenses
|
12.2
|
|
221.7
|
|
1,302.5
|
|
—
|
|
1,536.4
|
|
|||||||||
|
Operating income (loss)
|
44.0
|
|
102.3
|
|
105.5
|
|
(140.5
|
)
|
111.3
|
|
|||||||||
|
Interest (income) expense, net - affiliate
|
—
|
|
(7.3
|
)
|
7.3
|
|
—
|
|
—
|
|
|||||||||
|
Interest expense (income), net
|
37.8
|
|
(0.7
|
)
|
15.2
|
|
—
|
|
52.3
|
|
|||||||||
|
Total interest expense (income), net
|
37.8
|
|
(8.0
|
)
|
22.5
|
|
—
|
|
52.3
|
|
|||||||||
|
Income (loss) before income tax expense and loss from equity method investment
|
6.2
|
|
|
110.3
|
|
|
83.0
|
|
|
(140.5
|
)
|
59.0
|
|
||||||
|
Income tax (benefit) expense
|
(18.8
|
)
|
45.8
|
|
(20.3
|
)
|
—
|
|
6.7
|
|
|||||||||
|
Loss from equity method investment
|
—
|
|
—
|
|
2.2
|
|
—
|
|
2.2
|
|
|||||||||
|
Net income (loss)
|
25.0
|
|
|
64.5
|
|
|
101.1
|
|
|
(140.5
|
)
|
50.1
|
|
||||||
|
Less: Net income attributable to noncontrolling interests
|
—
|
|
—
|
|
25.1
|
|
—
|
|
25.1
|
|
|||||||||
|
Net income (loss) attributable to SunCoke Energy, Inc.
|
$
|
25.0
|
|
$
|
64.5
|
|
$
|
76.0
|
|
$
|
(140.5
|
)
|
$
|
25.0
|
|
||||
|
Comprehensive income (loss)
|
$
|
18.8
|
|
$
|
64.2
|
|
$
|
95.2
|
|
$
|
(134.3
|
)
|
$
|
43.9
|
|
||||
|
Less: Comprehensive income (loss) attributable to noncontrolling interests
|
—
|
|
—
|
|
25.1
|
|
—
|
|
25.1
|
|
|||||||||
|
Comprehensive income (loss) attributable to SunCoke Energy, Inc.
|
$
|
18.8
|
|
$
|
64.2
|
|
$
|
70.1
|
|
$
|
(134.3
|
)
|
$
|
18.8
|
|
||||
125
SunCoke Energy, Inc.
Condensed Consolidating Balance Sheet
December 31, 2015
(Dollars in millions, except per share amounts)
|
Issuer
|
Guarantor
Subsidiaries |
Non-
Guarantor Subsidiaries |
Combining
and Consolidating Adjustments |
Total
|
||||||||||||||||
|
Assets
|
||||||||||||||||||||
|
Cash and cash equivalents
|
$
|
—
|
|
$
|
70.6
|
|
$
|
52.8
|
|
$
|
—
|
|
$
|
123.4
|
|
|||||
|
Receivables
|
—
|
|
7.9
|
|
57.3
|
|
—
|
|
65.2
|
|
||||||||||
|
Inventories
|
—
|
|
5.3
|
|
116.8
|
|
—
|
|
122.1
|
|
||||||||||
|
Income tax receivable
|
10.9
|
|
—
|
|
60.0
|
|
(59.3
|
)
|
11.6
|
|
||||||||||
|
Other current assets
|
0.1
|
|
2.4
|
|
1.3
|
|
—
|
|
3.8
|
|
||||||||||
|
Advances to affiliates
|
—
|
|
250.9
|
|
—
|
|
(250.9
|
)
|
—
|
|
||||||||||
|
Total current assets
|
11.0
|
|
337.1
|
|
288.2
|
|
(310.2
|
)
|
326.1
|
|
||||||||||
|
Notes receivable from affiliate
|
—
|
|
89.0
|
|
300.0
|
|
(389.0
|
)
|
—
|
|
||||||||||
|
Restricted cash
|
—
|
|
—
|
|
18.2
|
|
—
|
|
18.2
|
|
||||||||||
|
Investment in Brazilian cokemaking operations
|
—
|
|
—
|
|
41.0
|
|
—
|
|
41.0
|
|
||||||||||
|
Properties, plants and equipment, net
|
—
|
|
68.2
|
|
1,525.2
|
|
—
|
|
1,593.4
|
|
||||||||||
|
Goodwill
|
—
|
|
3.4
|
|
67.7
|
|
—
|
|
71.1
|
|
||||||||||
|
Other intangibles assets, net
|
—
|
|
2.9
|
|
187.3
|
|
—
|
|
190.2
|
|
||||||||||
|
Deferred charges and other assets
|
0.2
|
|
12.5
|
|
2.8
|
|
—
|
|
15.5
|
|
||||||||||
|
Investment in subsidiaries
|
522.1
|
|
649.3
|
|
—
|
|
(1,171.4
|
)
|
—
|
|
||||||||||
|
Total assets
|
$
|
533.3
|
|
$
|
1,162.4
|
|
$
|
2,430.4
|
|
$
|
(1,870.6
|
)
|
$
|
2,255.5
|
|
|||||
|
Liabilities and Equity
|
|
|||||||||||||||||||
|
Advances from affiliate
|
$
|
105.2
|
|
$
|
—
|
|
$
|
145.7
|
|
$
|
(250.9
|
)
|
$
|
—
|
|
|||||
|
Accounts payable
|
—
|
|
10.4
|
|
89.5
|
|
—
|
|
99.9
|
|
||||||||||
|
Accrued liabilities
|
0.1
|
|
16.4
|
|
29.3
|
|
—
|
|
45.8
|
|
||||||||||
|
Current portion of long-term debt
|
—
|
|
—
|
|
1.1
|
|
—
|
|
1.1
|
|
||||||||||
|
Interest payable
|
1.5
|
|
—
|
|
17.4
|
|
—
|
|
18.9
|
|
||||||||||
|
Income taxes payable
|
—
|
|
59.3
|
|
—
|
|
(59.3
|
)
|
—
|
|
||||||||||
|
Total current liabilities
|
106.8
|
|
|
86.1
|
|
|
283.0
|
|
|
(310.2
|
)
|
165.7
|
|
|||||||
|
Long term-debt
|
103.2
|
|
—
|
|
894.5
|
|
—
|
|
997.7
|
|
||||||||||
|
Payable to affiliate
|
—
|
|
300.0
|
|
89.0
|
|
(389.0
|
)
|
—
|
|
||||||||||
|
Accrual for black lung benefits
|
—
|
|
12.6
|
|
32.1
|
|
—
|
|
44.7
|
|
||||||||||
|
Retirement benefit liabilities
|
—
|
|
14.9
|
|
16.4
|
|
—
|
|
31.3
|
|
||||||||||
|
Deferred income taxes
|
32.3
|
|
362.4
|
|
(45.7
|
)
|
—
|
|
349.0
|
|
||||||||||
|
Asset retirement obligations
|
—
|
|
—
|
|
22.2
|
|
—
|
|
22.2
|
|
||||||||||
|
Other deferred credits and liabilities
|
1.1
|
|
7.0
|
|
14.0
|
|
—
|
|
22.1
|
|
||||||||||
|
Total liabilities
|
243.4
|
|
|
783.0
|
|
|
1,305.5
|
|
|
(699.2
|
)
|
1,632.7
|
|
|||||||
|
Equity
|
||||||||||||||||||||
|
Common stock, $0.01 par value. Authorized 300,000,000
shares; issued 71,489,448 shares at December 31, 2015 |
0.7
|
|
—
|
|
—
|
|
—
|
|
0.7
|
|
||||||||||
|
Treasury Stock, 7,477,657 shares at December 31, 2015
|
(140.7
|
)
|
—
|
|
—
|
|
|
|
(140.7
|
)
|
||||||||||
|
Additional paid-in capital
|
486.1
|
|
62.0
|
|
664.7
|
|
(726.7
|
)
|
486.1
|
|
||||||||||
|
Accumulated other comprehensive loss
|
(19.8
|
)
|
(1.3
|
)
|
(18.5
|
)
|
19.8
|
|
(19.8
|
)
|
||||||||||
|
Retained (deficit) earnings
|
(36.4
|
)
|
318.7
|
|
145.8
|
|
(464.5
|
)
|
(36.4
|
)
|
||||||||||
|
Total SunCoke Energy, Inc. stockholders’ equity
|
289.9
|
|
379.4
|
|
792.0
|
|
(1,171.4
|
)
|
289.9
|
|
||||||||||
|
Noncontrolling interests
|
—
|
|
—
|
|
332.9
|
|
—
|
|
332.9
|
|
||||||||||
|
Total equity
|
289.9
|
|
379.4
|
|
1,124.9
|
|
(1,171.4
|
)
|
622.8
|
|
||||||||||
|
Total liabilities and equity
|
$
|
533.3
|
|
$
|
1,162.4
|
|
$
|
2,430.4
|
|
$
|
(1,870.6
|
)
|
$
|
2,255.5
|
|
|||||
126
SunCoke Energy, Inc.
Condensed Consolidating Balance Sheet
December 31, 2014
(Dollars in millions, except per share amounts)
|
Issuer
|
Guarantor
Subsidiaries |
Non-
Guarantor Subsidiaries |
Combining
and Consolidating Adjustments |
Total
|
||||||||||||||||
|
Assets
|
||||||||||||||||||||
|
Cash and cash equivalents
|
$
|
—
|
|
$
|
102.3
|
|
$
|
36.7
|
|
$
|
—
|
|
$
|
139.0
|
|
|||||
|
Receivables
|
0.1
|
|
17.4
|
|
60.7
|
|
—
|
|
78.2
|
|
||||||||||
|
Inventories
|
—
|
|
4.0
|
|
138.2
|
|
—
|
|
142.2
|
|
||||||||||
|
Income taxes receivable
|
28.0
|
|
—
|
|
14.1
|
|
(36.1
|
)
|
6.0
|
|
||||||||||
|
Other current assets
|
—
|
|
2.7
|
|
0.9
|
|
—
|
|
3.6
|
|
||||||||||
|
Advances to affiliate
|
—
|
|
117.0
|
|
—
|
|
(117.0
|
)
|
—
|
|
||||||||||
|
Total current assets
|
28.1
|
|
|
243.4
|
|
|
250.6
|
|
|
(153.1
|
)
|
369.0
|
|
|||||||
|
Notes receivable from affiliate
|
—
|
|
89.0
|
|
300.0
|
|
(389.0
|
)
|
—
|
|
||||||||||
|
Restricted Cash
|
—
|
|
—
|
|
0.5
|
|
—
|
|
0.5
|
|
||||||||||
|
Investment in Brazilian cokemaking operations
|
—
|
|
—
|
|
41.0
|
|
—
|
|
41.0
|
|
||||||||||
|
Equity method investment in VISA SunCoke Limited
|
—
|
|
—
|
|
22.3
|
|
—
|
|
22.3
|
|
||||||||||
|
Properties, plants and equipment, net
|
—
|
|
65.3
|
|
1,414.7
|
|
—
|
|
1,480.0
|
|
||||||||||
|
Goodwill
|
—
|
|
3.4
|
|
8.2
|
|
—
|
|
11.6
|
|
||||||||||
|
Other intangible assets, net
|
—
|
|
3.5
|
|
6.9
|
|
—
|
|
10.4
|
|
||||||||||
|
Deferred charges and other assets
|
0.2
|
|
9.9
|
|
14.8
|
|
—
|
|
24.9
|
|
||||||||||
|
Investment in subsidiaries
|
718.2
|
|
760.1
|
|
—
|
|
(1,478.3
|
)
|
—
|
|
||||||||||
|
Total assets
|
$
|
746.5
|
|
$
|
1,174.6
|
|
$
|
2,059.0
|
|
$
|
(2,020.4
|
)
|
$
|
1,959.7
|
|
|||||
|
Liabilities and Equity
|
||||||||||||||||||||
|
Advances from affiliate
|
$
|
73.4
|
|
$
|
—
|
|
$
|
43.6
|
|
$
|
(117.0
|
)
|
$
|
—
|
|
|||||
|
Accounts payable
|
—
|
|
12.8
|
|
108.5
|
|
—
|
|
121.3
|
|
||||||||||
|
Accrued liabilities
|
0.1
|
|
17.6
|
|
53.6
|
|
—
|
|
71.3
|
|
||||||||||
|
Interest payable
|
7.6
|
|
—
|
|
12.3
|
|
—
|
|
19.9
|
|
||||||||||
|
Income taxes payable
|
—
|
|
36.1
|
|
—
|
|
(36.1
|
)
|
—
|
|
||||||||||
|
Total current liabilities
|
81.1
|
|
|
66.5
|
|
|
218.0
|
|
|
(153.1
|
)
|
212.5
|
|
|||||||
|
Long-term debt
|
234.5
|
|
—
|
|
399.0
|
|
—
|
|
633.5
|
|
||||||||||
|
Payable to affiliate
|
—
|
|
300.0
|
|
89.0
|
|
(389.0
|
)
|
—
|
|
||||||||||
|
Accrual for black lung benefits
|
—
|
|
9.9
|
|
30.2
|
|
—
|
|
40.1
|
|
||||||||||
|
Retirement benefit liabilities
|
—
|
|
16.3
|
|
17.3
|
|
—
|
|
33.6
|
|
||||||||||
|
Deferred income taxes
|
(2.6
|
)
|
269.4
|
|
28.7
|
|
—
|
|
295.5
|
|
||||||||||
|
Asset retirement obligations
|
—
|
|
0.1
|
|
22.1
|
|
—
|
|
22.2
|
|
||||||||||
|
Other deferred credits and liabilities
|
1.8
|
|
6.9
|
|
8.2
|
|
—
|
|
16.9
|
|
||||||||||
|
Total liabilities
|
314.8
|
|
|
669.1
|
|
|
812.5
|
|
|
(542.1
|
)
|
|
1,254.3
|
|
||||||
|
Equity
|
||||||||||||||||||||
|
Common stock, $0.01 par value. Authorized 300,000,000
shares; issued 71,251,529 shares at December 31, 2014 |
0.7
|
|
—
|
|
—
|
|
—
|
|
0.7
|
|
||||||||||
|
Treasury stock, 4,977,115 shares at December 31, 2014
|
(105.0
|
)
|
—
|
|
—
|
|
—
|
|
(105.0
|
)
|
||||||||||
|
Additional paid-in capital
|
543.6
|
|
206.5
|
|
854.8
|
|
(1,061.3
|
)
|
543.6
|
|
||||||||||
|
Accumulated other comprehensive income
|
(21.5
|
)
|
(1.1
|
)
|
(20.4
|
)
|
21.5
|
|
(21.5
|
)
|
||||||||||
|
Retained earnings
|
13.9
|
|
300.1
|
|
138.4
|
|
(438.5
|
)
|
13.9
|
|
||||||||||
|
Total SunCoke Energy, Inc. stockholders’ equity
|
431.7
|
|
505.5
|
|
972.8
|
|
(1,478.3
|
)
|
431.7
|
|
||||||||||
|
Noncontrolling interests
|
—
|
|
—
|
|
273.7
|
|
—
|
|
273.7
|
|
||||||||||
|
Total equity
|
431.7
|
|
505.5
|
|
1,246.5
|
|
(1,478.3
|
)
|
705.4
|
|
||||||||||
|
Total liabilities and equity
|
$
|
746.5
|
|
$
|
1,174.6
|
|
$
|
2,059.0
|
|
$
|
(2,020.4
|
)
|
$
|
1,959.7
|
|
|||||
127
SunCoke Energy, Inc.
Condensed Consolidating Statement of Cash Flows
Years Ended December 31, 2015
(Dollars in millions)
|
Issuer
|
Guarantor
Subsidiaries |
Non-
Guarantor Subsidiaries |
Combining
and Consolidating Adjustments |
Total
|
|||||||||||||||
|
Cash Flows from Operating Activities:
|
|||||||||||||||||||
|
Net (loss) income
|
$
|
(22.0
|
)
|
$
|
18.6
|
|
$
|
39.7
|
|
$
|
(26.0
|
)
|
$
|
10.3
|
|
||||
|
Adjustments to reconcile net income to net cash (used in) provided by operating activities:
|
|||||||||||||||||||
|
Loss from equity method investment
|
—
|
|
—
|
|
21.6
|
|
—
|
|
21.6
|
|
|||||||||
|
Depreciation and amortization expense
|
—
|
|
10.4
|
|
98.7
|
|
—
|
|
109.1
|
|
|||||||||
|
Deferred income tax (benefit) expense
|
(20.7
|
)
|
14.9
|
|
0.2
|
|
—
|
|
(5.6
|
)
|
|||||||||
|
Settlement loss and payments in excess of expense for pension plan
|
—
|
|
—
|
|
13.1
|
|
—
|
|
13.1
|
|
|||||||||
|
Gain on curtailment and payments in excess of expense for postretirement plan benefits
|
—
|
|
(1.6
|
)
|
(6.4
|
)
|
—
|
|
(8.0
|
)
|
|||||||||
|
Share-based compensation expense
|
7.2
|
|
—
|
|
—
|
|
—
|
|
7.2
|
|
|||||||||
|
Equity in loss (earnings) of subsidiaries
|
8.4
|
|
(34.4
|
)
|
—
|
|
26.0
|
|
—
|
|
|||||||||
|
Loss on extinguishment of debt
|
1.2
|
|
—
|
|
(0.7
|
)
|
—
|
|
0.5
|
|
|||||||||
|
Changes in working capital pertaining to continuing operating activities (net of acquisitions):
|
|||||||||||||||||||
|
Receivables
|
0.1
|
|
9.4
|
|
9.3
|
|
—
|
|
18.8
|
|
|||||||||
|
Inventories
|
—
|
|
(1.3
|
)
|
24.5
|
|
—
|
|
23.2
|
|
|||||||||
|
Accounts payable
|
—
|
|
(3.2
|
)
|
(14.7
|
)
|
—
|
|
(17.9
|
)
|
|||||||||
|
Accrued liabilities
|
(0.2
|
)
|
(2.3
|
)
|
(26.2
|
)
|
—
|
|
(28.7
|
)
|
|||||||||
|
Interest payable
|
(6.1
|
)
|
—
|
|
5.1
|
|
—
|
|
(1.0
|
)
|
|||||||||
|
Income taxes
|
17.1
|
|
23.2
|
|
(45.9
|
)
|
—
|
|
(5.6
|
)
|
|||||||||
|
Accrual for black lung benefits
|
—
|
|
3.8
|
|
2.2
|
|
6.0
|
|
|||||||||||
|
Other
|
(0.9
|
)
|
(2.3
|
)
|
1.3
|
|
—
|
|
(1.9
|
)
|
|||||||||
|
Net cash provided by operating activities
|
(15.9
|
)
|
35.2
|
|
121.8
|
|
—
|
|
141.1
|
|
|||||||||
|
Cash Flows from Investing Activities:
|
|||||||||||||||||||
|
Capital expenditures
|
—
|
|
(11.8
|
)
|
(64.0
|
)
|
—
|
|
(75.8
|
)
|
|||||||||
|
Acquisition of businesses, net of cash acquired
|
—
|
|
—
|
|
(191.7
|
)
|
—
|
|
(191.7
|
)
|
|||||||||
|
Restricted Cash
|
—
|
|
—
|
|
(17.7
|
)
|
—
|
|
(17.7
|
)
|
|||||||||
|
Net cash used in investing activities
|
—
|
|
(11.8
|
)
|
(273.4
|
)
|
—
|
|
(285.2
|
)
|
|||||||||
|
Cash Flows from Financing Activities:
|
|||||||||||||||||||
|
Proceeds from issuance of long-term debt
|
—
|
|
—
|
|
260.8
|
|
—
|
|
260.8
|
|
|||||||||
|
Repayment of long-term debt
|
(16.8
|
)
|
—
|
|
(231.3
|
)
|
—
|
|
(248.1
|
)
|
|||||||||
|
Debt issuance costs
|
(0.4
|
)
|
—
|
|
(5.3
|
)
|
—
|
|
(5.7
|
)
|
|||||||||
|
Proceeds from revolving facility
|
60.4
|
|
—
|
|
232.0
|
|
—
|
|
292.4
|
|
|||||||||
|
Repayment of revolving facility
|
—
|
|
—
|
|
(50.0
|
)
|
—
|
|
(50.0
|
)
|
|||||||||
|
Dividends paid
|
(28.0
|
)
|
—
|
|
—
|
|
—
|
|
(28.0
|
)
|
|||||||||
|
Cash distributions to noncontrolling interests
|
—
|
|
—
|
|
(43.3
|
)
|
—
|
|
(43.3
|
)
|
|||||||||
|
Shares repurchased
|
(35.7
|
)
|
—
|
|
—
|
|
—
|
|
(35.7
|
)
|
|||||||||
|
SunCoke Energy Partners, L.P. units repurchased
|
—
|
|
—
|
|
(12.8
|
)
|
—
|
|
(12.8
|
)
|
|||||||||
|
Proceeds from exercise of stock options, net of shares withheld for taxes
|
(1.1
|
)
|
—
|
|
—
|
|
—
|
|
(1.1
|
)
|
|||||||||
|
Net increase (decrease) in advances from affiliate
|
37.5
|
|
(55.1
|
)
|
17.6
|
|
—
|
|
—
|
|
|||||||||
|
Net cash provided by (used in) financing activities
|
15.9
|
|
(55.1
|
)
|
167.7
|
|
—
|
|
128.5
|
|
|||||||||
|
Net (decrease) increase in cash and cash equivalents
|
—
|
|
(31.7
|
)
|
16.1
|
|
—
|
|
(15.6
|
)
|
|||||||||
|
Cash and cash equivalents at beginning of year
|
—
|
|
102.3
|
|
36.7
|
|
—
|
|
139.0
|
|
|||||||||
|
Cash and cash equivalents at end of year
|
$
|
—
|
|
$
|
70.6
|
|
$
|
52.8
|
|
$
|
—
|
|
$
|
123.4
|
|
||||
128
SunCoke Energy, Inc.
Condensed Consolidating Statement of Cash Flows
Years Ended December 31, 2014
(Dollars in millions)
|
Issuer
|
Guarantor
Subsidiaries |
Non-
Guarantor Subsidiaries |
Combining
and Consolidating Adjustments |
Total
|
||||||||||||||||
|
Cash Flows from Operating Activities:
|
||||||||||||||||||||
|
Net (loss) income
|
$
|
(126.1
|
)
|
$
|
(58.9
|
)
|
$
|
(75.5
|
)
|
$
|
158.7
|
|
$
|
(101.8
|
)
|
|||||
|
Adjustments to reconcile net income to net cash (used in) provided by operating activities:
|
||||||||||||||||||||
|
Asset and goodwill impairment
|
—
|
|
—
|
|
150.3
|
|
—
|
|
150.3
|
|
||||||||||
|
Loss from equity method investment
|
—
|
|
—
|
|
35.0
|
|
—
|
|
35.0
|
|
||||||||||
|
Depreciation and amortization expense
|
—
|
|
8.4
|
|
97.9
|
|
—
|
|
106.3
|
|
||||||||||
|
Deferred income tax expense (benefit)
|
6.8
|
|
(7.9
|
)
|
(63.3
|
)
|
—
|
|
(64.4
|
)
|
||||||||||
|
Payments in excess of expense for pension plan
|
—
|
|
—
|
|
(7.5
|
)
|
—
|
|
(7.5
|
)
|
||||||||||
|
Payments in excess of expense for postretirement plan benefits
|
—
|
|
—
|
|
(0.6
|
)
|
—
|
|
(0.6
|
)
|
||||||||||
|
Share-based compensation expense
|
9.8
|
|
—
|
|
—
|
|
—
|
|
9.8
|
|
||||||||||
|
Equity in loss (earnings) of subsidiaries
|
101.3
|
|
57.4
|
|
—
|
|
(158.7
|
)
|
—
|
|
||||||||||
|
Excess tax benefit from share-based awards
|
(0.4
|
)
|
0.1
|
|
—
|
|
—
|
|
(0.3
|
)
|
||||||||||
|
Loss on extinguishment of debt
|
—
|
|
—
|
|
15.4
|
|
—
|
|
15.4
|
|
||||||||||
|
Changes in working capital pertaining to operating activities (net of acquisitions):
|
||||||||||||||||||||
|
Receivables
|
(0.1
|
)
|
23.7
|
|
(10.3
|
)
|
—
|
|
13.3
|
|
||||||||||
|
Inventories
|
—
|
|
2.3
|
|
(14.9
|
)
|
—
|
|
(12.6
|
)
|
||||||||||
|
Accounts payable
|
—
|
|
0.4
|
|
(33.4
|
)
|
—
|
|
(33.0
|
)
|
||||||||||
|
Accrued liabilities
|
(0.4
|
)
|
(4.7
|
)
|
(2.9
|
)
|
—
|
|
(8.0
|
)
|
||||||||||
|
Interest payable
|
(6.0
|
)
|
7.3
|
|
0.4
|
|
—
|
|
1.7
|
|
||||||||||
|
Income taxes
|
12.3
|
|
(20.5
|
)
|
9.2
|
|
—
|
|
1.0
|
|
||||||||||
|
Accrual for black lung benefits
|
—
|
|
3.6
|
|
7.9
|
|
11.5
|
|
||||||||||||
|
Other
|
6.0
|
|
(8.2
|
)
|
(1.6
|
)
|
—
|
|
(3.8
|
)
|
||||||||||
|
Net cash provided by operating activities
|
3.2
|
|
3.0
|
|
106.1
|
|
—
|
|
112.3
|
|
||||||||||
|
Cash Flows from Investing Activities:
|
||||||||||||||||||||
|
Capital expenditures
|
—
|
|
(5.5
|
)
|
(119.7
|
)
|
—
|
|
(125.2
|
)
|
||||||||||
|
Net cash used in investing activities
|
—
|
|
(5.5
|
)
|
(119.7
|
)
|
—
|
|
(125.2
|
)
|
||||||||||
|
Cash Flows from Financing Activities:
|
||||||||||||||||||||
|
Proceeds from issuance of common units of SunCoke
Energy Partners, L.P., net of offering costs |
—
|
|
—
|
|
90.5
|
|
—
|
|
90.5
|
|
||||||||||
|
Proceeds from issuance of long-term debt
|
—
|
|
—
|
|
268.1
|
|
—
|
|
268.1
|
|
||||||||||
|
Repayment of long-term debt
|
—
|
|
—
|
|
(276.5
|
)
|
—
|
|
(276.5
|
)
|
||||||||||
|
Debt issuance costs
|
—
|
|
—
|
|
(5.8
|
)
|
—
|
|
(5.8
|
)
|
||||||||||
|
Proceeds from revolving facility
|
—
|
|
—
|
|
40.0
|
|
—
|
|
40.0
|
|
||||||||||
|
Repayment of revolving facility
|
—
|
|
—
|
|
(80.0
|
)
|
—
|
|
(80.0
|
)
|
||||||||||
|
Dividends paid
|
(3.8
|
)
|
—
|
|
—
|
|
—
|
|
(3.8
|
)
|
||||||||||
|
Cash distributions to noncontrolling interests
|
—
|
|
—
|
|
(32.3
|
)
|
—
|
|
(32.3
|
)
|
||||||||||
|
Shares repurchased
|
(85.1
|
)
|
—
|
|
—
|
|
—
|
|
(85.1
|
)
|
||||||||||
|
Proceeds from exercise of stock options
|
2.9
|
|
—
|
|
—
|
|
—
|
|
2.9
|
|
||||||||||
|
Excess tax benefit from share-based awards
|
0.3
|
|
—
|
|
—
|
|
—
|
|
0.3
|
|
||||||||||
|
Net increase (decrease) in advances from affiliate
|
82.5
|
|
(79.6
|
)
|
(2.9
|
)
|
—
|
|
—
|
|
||||||||||
129
|
Net cash (used in) provided by financing activities
|
(3.2
|
)
|
(79.6
|
)
|
1.1
|
|
—
|
|
(81.7
|
)
|
||||||||||
|
Net decrease in cash and cash equivalents
|
—
|
|
(82.1
|
)
|
(12.5
|
)
|
—
|
|
(94.6
|
)
|
||||||||||
|
Cash and cash equivalents at beginning of year
|
—
|
|
184.4
|
|
49.2
|
|
—
|
|
233.6
|
|
||||||||||
|
Cash and cash equivalents at end of year
|
$
|
—
|
|
$
|
102.3
|
|
$
|
36.7
|
|
$
|
—
|
|
$
|
139.0
|
|
|||||
130
SunCoke Energy, Inc.
Condensed Consolidating Statement of Cash Flows
December 31, 2013
(Dollars in millions)
|
Issuer
|
Guarantor
Subsidiaries |
Non-
Guarantor Subsidiaries |
Combining
and Consolidating Adjustments |
Total
|
||||||||||||||||
|
Cash Flows from Operating Activities:
|
||||||||||||||||||||
|
Net income (loss)
|
$
|
25.0
|
|
$
|
64.5
|
|
$
|
101.1
|
|
$
|
(140.5
|
)
|
$
|
50.1
|
|
|||||
|
Adjustments to reconcile net income to net cash (used in) provided by continuing operating activities:
|
||||||||||||||||||||
|
Loss from equity method investment
|
—
|
|
—
|
|
2.2
|
|
—
|
|
2.2
|
|
||||||||||
|
Depreciation and amortization expense
|
—
|
|
7.5
|
|
88.5
|
|
—
|
|
96.0
|
|
||||||||||
|
Deferred income tax expense
|
—
|
|
1.6
|
|
—
|
|
—
|
|
1.6
|
|
||||||||||
|
Payments in excess of expense for pension plan
|
—
|
|
—
|
|
(0.1
|
)
|
—
|
|
(0.1
|
)
|
||||||||||
|
Gain on curtailment and payments (in excess) less than expense for postretirement plan benefits
|
—
|
|
—
|
|
(5.3
|
)
|
—
|
|
(5.3
|
)
|
||||||||||
|
Share-based compensation expense
|
7.6
|
|
—
|
|
—
|
|
—
|
|
7.6
|
|
||||||||||
|
Equity in (earnings) loss of subsidiaries
|
(56.2
|
)
|
(84.3
|
)
|
—
|
|
140.5
|
|
—
|
|
||||||||||
|
Changes in working capital pertaining to operating activities (net of acquisitions):
|
||||||||||||||||||||
|
Receivables
|
—
|
|
(24.1
|
)
|
6.0
|
|
—
|
|
(18.1
|
)
|
||||||||||
|
Inventories
|
—
|
|
5.7
|
|
23.5
|
|
—
|
|
29.2
|
|
||||||||||
|
Accounts payable
|
(0.5
|
)
|
(2.6
|
)
|
23.1
|
|
—
|
|
20.0
|
|
||||||||||
|
Accrued liabilities
|
(0.1
|
)
|
3.8
|
|
(28.4
|
)
|
—
|
|
(24.7
|
)
|
||||||||||
|
Interest payable
|
(2.1
|
)
|
(7.3
|
)
|
11.9
|
|
—
|
|
2.5
|
|
||||||||||
|
Income taxes
|
(23.5
|
)
|
41.5
|
|
(28.2
|
)
|
—
|
|
(10.2
|
)
|
||||||||||
|
Accrual for black lung benefits
|
—
|
|
(3.5
|
)
|
1.1
|
|
(2.4
|
)
|
||||||||||||
|
Other
|
5.5
|
|
4.5
|
|
(7.1
|
)
|
—
|
|
2.9
|
|
||||||||||
|
Net cash (used in) provided by operating activities
|
(44.3
|
)
|
7.3
|
|
188.3
|
|
—
|
|
151.3
|
|
||||||||||
|
Cash Flows from Investing Activities:
|
||||||||||||||||||||
|
Capital expenditures
|
—
|
|
(7.9
|
)
|
(137.7
|
)
|
—
|
|
(145.6
|
)
|
||||||||||
|
Acquisition of business
|
—
|
|
—
|
|
(113.3
|
)
|
—
|
|
(113.3
|
)
|
||||||||||
|
Equity method investment in VISA SunCoke Limited
|
—
|
|
—
|
|
(67.7
|
)
|
(67.7
|
)
|
||||||||||||
|
Net cash used in investing activities
|
—
|
|
(7.9
|
)
|
(318.7
|
)
|
—
|
|
(326.6
|
)
|
||||||||||
|
Cash Flows from Financing Activities:
|
||||||||||||||||||||
|
Proceeds from issuance of common units of SunCoke Energy Partners, L.P., net of offering costs
|
—
|
|
—
|
|
237.8
|
|
—
|
|
237.8
|
|
||||||||||
|
Proceeds from issuance of long-term debt
|
—
|
|
—
|
|
150.0
|
|
—
|
|
150.0
|
|
||||||||||
|
Repayment of long-term debt
|
—
|
|
—
|
|
(225.0
|
)
|
—
|
|
(225.0
|
)
|
||||||||||
|
Debt issuance costs
|
—
|
|
—
|
|
(6.9
|
)
|
—
|
|
(6.9
|
)
|
||||||||||
|
Proceeds from revolving facility
|
—
|
|
—
|
|
40.0
|
|
—
|
|
40.0
|
|
||||||||||
|
Cash distributions to noncontrolling interests
|
—
|
|
—
|
|
(17.8
|
)
|
—
|
|
(17.8
|
)
|
||||||||||
|
Shares repurchased
|
(10.9
|
)
|
—
|
|
—
|
|
—
|
|
(10.9
|
)
|
||||||||||
|
Proceeds from exercise of stock options
|
2.5
|
|
—
|
|
—
|
|
—
|
|
2.5
|
|
||||||||||
|
Net increase (decrease) in advances from affiliate
|
52.7
|
|
(21.9
|
)
|
(30.8
|
)
|
—
|
|
—
|
|
||||||||||
|
Net cash provided by (used in) financing activities
|
44.3
|
|
(21.9
|
)
|
147.3
|
|
—
|
|
169.7
|
|
||||||||||
|
Net (decrease) increase in cash and cash equivalents
|
—
|
|
(22.5
|
)
|
16.9
|
|
—
|
|
(5.6
|
)
|
||||||||||
|
Cash and cash equivalents at beginning of year
|
—
|
|
206.9
|
|
32.3
|
|
—
|
|
239.2
|
|
||||||||||
|
Cash and cash equivalents at end of year
|
$
|
—
|
|
$
|
184.4
|
|
$
|
49.2
|
|
$
|
—
|
|
$
|
233.6
|
|
|||||
131
28. Subsequent Events
During February 2016, the Partnership continued de-levering its balance sheet and redeemed
$22.0 million
of outstanding Partnership Notes for
$12.7 million
on the open market.
Subsequent to December 31, 2015, the Company issued a
$5.0 million
letter of credit as collateral to one of its surety providers in connection with black lung and other financial guarantee obligations. Also, the Company issued an
$18.0 million
letter of credit as collateral to surety providers in connection with certain contractual obligations, including certain reclamation obligations primarily related to our coal mining operations. These letters of credit lower our borrowing availability under our credit facilities.
132
|
Item 9.
|
Changes in and Disagreements with Accountants on Accounting and Financial Disclosure
|
None.
|
Item 9A.
|
Controls and Procedures
|
Management’s Evaluation of Disclosure Controls and Procedures
Our management, with the participation of our principal executive officer and principal financial officer, is responsible for evaluating the effectiveness of our disclosure controls and procedures (as defined in Exchange Act Rules 13a-15(e) and 15d-15(e)). Our disclosure controls and procedures are designed to provide reasonable assurance that the information required to be disclosed by us in reports that we file or submit under the Exchange Act is accumulated and communicated to our management, including our principal executive officer and principal financial officer, as appropriate to allow timely decisions regarding required disclosure and is recorded, processed, summarized and reported within the time periods specified in the rules and forms of the SEC. Based upon that evaluation, our principal executive officer and principal financial officer concluded that, as of the end of the period covered by this report, our disclosure controls and procedures were effective at the reasonable assurance level.
Management’s Report on Internal Control over Financial Reporting
Our management, with the participation of our principal executive officer and principal financial officer, is responsible for establishing and maintaining adequate internal control over our financial reporting, as such term is defined under Exchange Act Rule 13a-15(f). Our internal control system was designed to provide reasonable assurance to management regarding the preparation and fair presentation of published financial statements.
In evaluating the effectiveness of our internal control over financial reporting as of December 31, 2015, management used the framework set forth by the Committee of Sponsoring Organizations of the Treadway Commission in
Internal Control -Integrated Framework
(2013). Based on such evaluation, management concluded that our internal control over financial reporting was effective as of December 31, 2015. This evaluation excluded Raven Energy LLC ("Raven"), which represented $426.1 million of total assets and $28.6 million of total revenue in the consolidated financial statements of the Company as of and for the year ended December 31, 2015.
Our management, including our principal executive officer and principal financial officer, does not expect that our disclosure controls and procedures or our internal controls over financial reporting will prevent all error and all fraud. A control system, no matter how well conceived and operated, can provide only reasonable, not absolute, assurance that the objectives of the control system are met. Further, the design of a control system must reflect the fact that there are resource constraints, and the benefits of controls must be considered relative to their costs. Because of the inherent limitations in all control systems, no evaluation of controls can provide absolute assurance that all control issues, misstatements, errors, and instances of fraud, if any, within our company have been or will be prevented or detected. These inherent limitations include the realities that judgments in decision-making can be faulty and that breakdowns can occur because of simple error or mistake. Controls also can be circumvented by the individual acts of some persons, by collusion of two or more people, or by management override of the controls. The design of any system of controls is based in part on certain assumptions about the likelihood of future events, and there can be no assurance that any design will succeed in achieving its stated goals under all potential future conditions. Projections of any evaluation of controls effectiveness to future periods are subject to risks that internal controls may become inadequate as a result of changes in conditions, or through the deterioration of the degree of compliance with policies or procedures.
KPMG LLP, our independent registered public accounting firm, issued an attestation report on our internal control over financial reporting, which is contained in Item 8, “Financial Statements and Supplementary Data.”
Changes in Internal Control over Financial Reporting
On August 12, 2015, the Partnership acquired Raven Energy LLC including Convent Marine Terminal and considers the transaction material to our results of operations, cash flows and financial position from the date of the acquisition. In conducting our evaluation of the effectiveness of our internal control over financial reporting, we have elected to exclude Raven from our evaluation in the year of acquisition as permitted by the Securities and Exchange Commission. We are currently in the process of evaluating and integrating Raven’s internal controls over financial reporting and expect to complete the integration of Raven’s internal controls in 2016. See Note 3 to the consolidated financial statements included in this Annual Report on Form 10-K for discussion of the acquisition and related financial data. There were no other changes in our internal control over financial reporting (as defined in Rules 13a-15(f) and 15d-15(f) under the Exchange Act) that occurred during the year ended December 31, 2015 that have materially affected, or are reasonably likely to materially affect, our internal control over financial reporting.
|
Item 9B.
|
Other Information
|
None.
133
|
Item 10.
|
Directors, Executive Officers and Corporate Governance
|
The information called for by this Item 10 required by Item 401 of Regulation S-K relating to Directors and Nominees for election to the Board of Directors is incorporated herein by reference to the section entitled “Proposal 1- Election of Directors” in our definitive Proxy Statement for our 2016 Annual Meeting of Stockholders to be held on May 5, 2016 (the “Proxy Statement”). Information called for by this Item 10 required by Item 401 of Regulation S-K concerning the Company’s executive officers appears in Part I of this Annual Report on Form 10-K.
The information called for by this Item 10 required by Item 405 of Regulation S-K is incorporated herein by reference to the section entitled “Section 16(a) Beneficial Ownership Reporting Compliance” under the heading “Other Information,” in the Proxy Statement.
The information called for by this Item 10 required by Item 406 of Regulation S-K is incorporated herein by reference to the section entitled “Code of Business Conduct and Ethics” under the heading “Corporate Governance” in the Proxy Statement.
The information called for by this Item 10 required by Item 407(c)(3) of Regulation S-K is incorporated herein by reference to the section entitled “Governance Committee Process for Director Nominations” under the heading “Corporate Governance” in the Proxy Statement.
The information called for by this Item 10 required by Items 407(d)(4) and 407(d)(5) of Regulation S-K is incorporated herein by reference to the information under the heading entitled “The Board of Directors and its Committees” and in the section entitled “Audit Committee Report” under the heading entitled “Audit Committee Matters,” in the Proxy Statement.
|
Item 11.
|
Executive Compensation
|
The information called for by this Item 11 required by Item 402 of Regulation S-K is incorporated herein by reference to the sections of the Proxy Statement appearing under the heading “Executive Compensation,” including the sections entitled “Compensation Discussion and Analysis,” “Summary Compensation Table,” “Grants of Plan-Based Awards Table,” “Outstanding Equity Awards at Fiscal Year-End Table,” “Option Exercises and Stock Vested Table,” “Pension Benefits,” “Nonqualified Deferred Compensation” and “Potential Payments Upon Termination or Change in Control,” and the sections of the Proxy Statement appearing under the heading “Directors Compensation.”
The information called for by this Item 11 required by Items 407(e)(4) and 407(e)(5) of Regulation S-K is incorporated herein by reference to the sections of the Proxy Statement appearing under the heading “Executive Compensation,” including the sections entitled “Compensation Committee Report” and “Compensation Committee Interlocks and Insider Participation.”
|
Item 12.
|
Security Ownership of Certain Beneficial Owners and Management and Related Stockholder Matters
|
The information called for by this Item 12 required by Item 201(d) of Regulation S-K is incorporated herein by reference to the section of the Proxy Statement entitled “Equity Compensation Plan Information,” appearing under the heading “Other Information.”
The information called for by this Item 12 required by Item 403 of Regulation S-K is incorporated herein by reference to the sections of the Proxy Statement appearing under the heading “Beneficial Stock Ownership of Directors, Executive Officers and Persons Owning More Than Five Percent of Common Stock.”
|
Item 13.
|
Certain Relationships and Related Transactions, and Director Independence
|
Arrangements Between SunCoke Energy and the Partnership
In connection with the focus on creating greater liquidity to reduce debt at the Partnership, SunCoke Energy will evaluate, for each of the four fiscal quarters ending December 31, 2016, to provide the Partnership an incentive distribution rights giveback and evaluate a corporate cost allocation reimbursement holiday for the Partnership, whereby the Partnership would not be required to reimburse SunCoke Energy for costs. In accordance with SunCoke Energy’s intentions, on December 23, 2015, the General Partner amended the Partnership’s First Amended and Restated Agreement of Limited Partnership dated as of January 24, 2013 (the "Partnership Agreement"). On December 23, 2015, SunCoke Energy, the Partnership and the General Partner, entered into a Sponsor Support Agreement, pursuant to which SunCoke Energy can elect to make certain quarterly cash capital contributions to the Partnership during each of the four fiscal quarters ending December 31, 2016. The amounts of such quarterly capital contributions will be determined quarterly by SunCoke Energy, and will be equal to all or a portion of the reimbursable expense payments and/or incentive distribution payments otherwise to be received by SunCoke Energy.
134
Omnibus Agreement
The omnibus agreement with SunCoke and the Partnership's general partner addresses certain aspects of our relationship, including:
Business Opportunities
. The Partnership has a preferential right to invest in, acquire and construct cokemaking facilities in the U.S. and Canada. SunCoke has a preferential right to all other business opportunities. If the Partnership decides not to pursue an opportunity to construct a new cokemaking facility and SunCoke or any of its controlled affiliates undertake such construction, then upon completion of such construction, the Partnership will have the option to acquire such facility at a price sufficient to give SunCoke an internal rate of return on its invested capital equal to the sum of SunCoke’s weighted average cost of capital (as determined in good faith by SunCoke) and 6.0 percent. If the Partnership decides not to pursue an opportunity to invest in or acquire a cokemaking facility, SunCoke or any of its controlled affiliates may undertake such an investment or acquisition and if such acquisition is completed by SunCoke, the cokemaking facility so acquired will be subject to the right of first offer described below. If a business opportunity includes cokemaking facilities but such facilities represent a minority of the value of such business opportunity as determined by SunCoke in good faith, SunCoke will have a preferential right as to such business opportunity. These agreements as to business opportunities shall apply only so long as SunCoke controls the Partnership, and shall not apply with respect to any business opportunity SunCoke or any of its controlled affiliates was actively pursuing at the time of the closing of the Partnership's IPO;
provided, however,
that the Partnership shall have certain preferential rights with respect to the Kentucky facility.
If SunCoke constructs the Kentucky facility, upon commencement of commercial operations the Partnership will have the option to acquire the Kentucky facility under the same terms as would apply to other new construction under the omnibus agreement. If the Partnership does not exercise its option to acquire the Kentucky facility upon commencement of commercial operations, the Kentucky facility will be subject to the right of first offer described below.
Right of First Offer
. If SunCoke or any of its controlled affiliates decides to sell, convey or otherwise transfer to a third-party a cokemaking facility located in the U.S. or Canada or an interest therein, the Partnership shall have a right of first offer as to such facility. SunCoke shall have the same right of first offer if the Partnership decides to sell, convey or otherwise transfer to a third-party any cokemaking facility or an interest therein. In the event a party decides to sell, convey or otherwise transfer a cokemaking facility, it will offer the other party, referred to as the ROFO Party, such facility with a proposed price for such assets. If the ROFO Party does not exercise its right, the seller shall have the right to complete the proposed transaction, on terms not materially more favorable to the buyer than the last written offer proposed during negotiations with the ROFO Party, with a third-party within 270 days. If the seller fails to complete such a transaction within 270 days, then the right of first offer is reinstated. This right of first offer shall apply only so long as SunCoke controls the Partnership.
Remarketing Arrangement Relating to Potential Defaults by Coke Agreement Counterparties
. For a period of five years from the closing date of the Partnership's IPO, SunCoke has agreed that: (i) if AK Steel exercises the early termination right provided in its Haverhill coke sales agreement, then SunCoke will, promptly upon the effective date of such termination, make the Partnership whole to the extent of AK Steel’s obligations under the Haverhill coke sales agreement (including the obligation to pay for coke) as the terms of that agreement exist on the date of the Partnership's IPO (without taking into effect the termination right), or (ii) if (a) other than as a result of a force majeure event or a default by the Partnership, any customer fails to purchase coke or defaults in payment under its coke sales agreement, or (b) the Partnership amends a coke sales agreement’s terms to reduce a customer’s purchase obligation as a result of the customer’s financial distress, as part of a bankruptcy or otherwise, then SunCoke will be obligated to make the Partnership whole to the extent of the customer’s failure to satisfy its obligations or to the extent the customer’s obligations are reduced, as applicable, under such coke sales agreement’s terms as exist on the date of the IPO. The Partnership and SunCoke will share in any damages and other amounts recovered from third-parties in connection with any of the events described in this paragraph in proportion to the relative loss and/or prospective loss suffered by the Partnership and SunCoke.
Indemnity.
SunCoke will indemnify the Partnership with respect to remediation at the Haverhill, Middletown and Granite City (Gateway) cokemaking facilities:
Known Remediation
. SunCoke will indemnify the Partnership to the full extent of any remediation arising from any environmental matter discovered and identified as requiring remediation prior to the contribution by SunCoke to the Partnership of an interest in these cokemaking facilities, except for any liability or increase in liability resulting from changes in environmental regulations;
provided, however,
that, in each case, SunCoke will be deemed to have contributed in satisfaction of this obligation, as of the effective date of the contribution of an interest in these cokemaking facilities, the amount identified in the applicable contribution agreement as being reserved to pre-fund existing environmental remediation projects.
Unknown Remediation . If, prior to the fifth anniversary of the closing of the Partnership's IPO, an environmental matter that was discovered either before or after the contribution by SunCoke to the Partnership of an interest in these cokemaking facilities, is identified as requiring remediation, SunCoke shall indemnify the Partnership to the full extent of any such remediation costs, except for any liability or increase in liability resulting from changes in environmental regulations;
135
provided, however, that, in each case, the Partnership must bear the first $5 million of such remediation costs, and SunCoke’s liability for such remediation costs will not exceed $50 million.
Post-closing
. The Partnership will indemnify SunCoke for events relating to the Partnership's operations except to the extent that it is entitled to indemnification by SunCoke.
Tax Matters.
SunCoke will fully indemnify the Partnership with respect to any tax liability arising prior to or in connection with the closing of its IPO.
Real Property
. SunCoke will either cure or fully indemnify the Partnership for losses resulting from any material title defects at the properties owned by the entities in which the Partnership has acquired an interest from SunCoke, to the extent that such defects interfere with, or reasonably could be expected to interfere with, the operations of the related cokemaking facilities.
License
. SunCoke has granted the Partnership a royalty-free license to use the name “SunCoke” and related marks. Additionally, SunCoke will grant the Partnership a non-exclusive right to use all of SunCoke’s current and future cokemaking and related technology. The Partnership has not paid and will not pay a separate license fee for the rights it receives under the license.
Expenses and Reimbursement
. SunCoke will continue to provide the Partnership with certain general and administrative services, and the Partnership will reimburse SunCoke for all direct costs and expenses incurred on the Partnership's behalf and the portion of SunCoke’s corporate and other costs and expenses attributable to the Partnership's operations. Additionally, the Partnership has agreed to pay all fees (i) due under its revolving credit facility and/or existing senior notes; and (iii) in connection with any future financing arrangement entered into for the purpose of amending, modifying, or replacing its revolving credit facility or its senior notes.
The omnibus agreement can be amended by written agreement of all parties to the agreement. However, the Partnership may not agree to any amendment or modification that would, in the reasonable discretion of our general partner, be adverse in any material respect to the holders of its common units without prior approval of the conflicts committee. So long as SunCoke controls the Partnership's general partner, the omnibus agreement will remain in full force and effect unless mutually terminated by the parties. If SunCoke ceases to control the Partnership's general partner, the omnibus agreement will terminate, provided (i) the indemnification obligations described above and (ii) the Partnership's non-exclusive right to use all of SunCoke’s existing cokemaking and related technology will remain in full force and effect in accordance with their terms.
Additional information called for by this Item 13 required by Item 404 of Regulation S-K is incorporated herein by reference to the sections of the Proxy Statement entitled “Transactions with Related Persons” under the heading “Governance Matters.”
|
Item 14.
|
Principal Accounting Fees and Services
|
The information called for by this Item 14 required by Item 9(e) of Schedule 14A is incorporated herein by reference to the sections of the Proxy Statement appearing under the heading “Audit Committee Matters.”
The information called for by this Item 14 required by Item 407(a) of Regulation S-K is incorporated herein by reference to the section of the Proxy Statement entitled “Corporate Governance,” under the heading “Director Independence.”
136
|
Item 15.
|
Exhibits, Financial Statement Schedules
|
|
(a)
|
The following documents are filed as a part of this report:
|
||||||
|
1.
|
Consolidated Financial Statements
:
|
||||||
|
The consolidated financial statements are set forth under Item 8 of this report.
|
|||||||
|
2.
|
Financial Statements Schedules
:
|
||||||
|
Financial statement schedules are omitted because the required information is shown elsewhere in this report, is not necessary or is not applicable.
|
|||||||
|
3.
|
Exhibits
:
|
||||||
|
2.1
|
Contribution Agreement, dated January 12, 2015, by and among SunCoal & SunCoke LLC, SunCoke Energy Partners, L.P., SunCoke Energy, Inc. and agreed to for purposes of Section 29 thereof by Gateway Energy & Coke Company, LLC (incorporated by reference herein to Exhibit 2.1 to the Company's Current Report on Form 8-K, filed on January 13, 2015, File No. 001-35243)
|
||||||
|
2.2
|
Contribution Agreement, dated as of July 20, 2015, by and between Raven Energy Holdings, LLC and SunCoke Energy Partners, L.P., incorporated by reference to Exhibit 2.1 to the Company's Current Report on Form 8-K (File No. 001-35243) filed on August 18, 2015
|
||||||
|
3.1
|
|
Amended and Restated Certificate of Incorporation of the Company (incorporated by reference herein to Exhibit 3.1 to the Company’s Amendment No. 4 to Registration Statement on Form S-1 filed on July 6, 2011, File No. 333-173022)
|
|||||
|
3.2
|
|
Amended and Restated Bylaws of SunCoke Energy, Inc., effective as of February 1, 2016 (incorporated by reference herein to Exhibit 3.1 to the Company’s Current Report on Form 8-K, filed on February 2, 2016, File No. 001-35243)
|
|||||
|
4.1
|
Form of Common Stock Certificate of the Registrant (incorporated by reference herein to Exhibit 4.1 to the Company's Amendment No. 2 to Registration Statement on Form S-1, filed on June 3, 2011, File No. 333-173022)
|
||||||
|
4.2
|
|
Indenture by and among the Company, the Guarantors party thereto and The Bank of New York Mellon Trust Company, N.A., as Trustee, dated July 26, 2011 (incorporated by reference to the Company’s Current Report on Form 8-K filed on August 1, 2011, File No. 001-35243)
|
|||||
|
4.2.1
|
Form of 7-5/8 percent Senior Notes due 2019 (included in Exhibit A to the Indenture filed herewith as Exhibit 4.1)
|
||||||
|
10.1
|
|
Credit Agreement, dated as of July 26, 2011, by and among SunCoke Energy, Inc., JPMorgan Chase Bank, N.A., as Administrative Agent, the lenders party thereto, Bank of America, N.A., as Revolving Facility Syndication Agent and Term Loan Documentation Agent, Credit Suisse Securities (USA) LLC, as Term Loan Syndication Agent, and The Royal Bank of Scotland PLC and KeyBank National Association, as Revolving Facility Co-Documentation Agents (incorporated by reference herein to Exhibit 10.1 to the Company’s Current Report on Form 8-K filed on August 1, 2011, File No. 001-35243)
|
|||||
|
10.1.1
|
Amendment No. 1 to Credit Agreement, dated as of January 24, 2013, by and among SunCoke Energy, Inc., the several banks and other financial institutions or entities as lenders party thereto and JPMorgan Chase Bank, N.A., as administrative agent (incorporated by reference herein to Exhibit 10.2 to the Company’s Current Report on Form 8-K, filed on January 24, 2013, File No. 001-35243)
|
||||||
|
10.1.2
|
Amendment No. 2 to Credit Agreement, dated as of January 13, 2015, by and among SunCoke Energy, Inc., the several banks and other financial institutions or entities as lenders party thereto and JPMorgan Chase Bank, N.A., as administrative agent (incorporated by reference herein to Exhibit 10.1.2. to the Company's Annual Report on Form 10-K, filed on February 24, 2015, File No. 001-35243)
|
||||||
|
10.1.3
|
Amendment No. 3 to Credit Agreement, dated as of April 21, 2015, by and among SunCoke Energy Partners, L.P., the banks and other financial institutions party thereto, and JPMorgan Chase Bank, N.A. as Administrative Agent (incorporated by reference to Current Report on Form 8-K, filed on April 27, 2015, File No. 001-35243)
|
||||||
|
10.1.4*
|
Amendment No. 4 to Credit Agreement, dated as of November 16, 2015, by and among SunCoke Energy Partners, L.P., the banks and other financial institutions party thereto, and JPMorgan Chase Bank, N.A. as Administrative Agent.
|
||||||
137
|
10.2
|
Separation and Distribution Agreement, dated as of July 18, 2011, between SunCoke Energy, Inc. and Sunoco, Inc. (incorporated by reference herein to Exhibit 10.1 to the Company’s Quarterly Report on Form 10-Q for the quarterly period ended June 30, 2011 filed on August 3, 2011, File No. 001-35243)
|
||||||
|
10.3
|
|
Guaranty, Keep Well, and Indemnification Agreement, dated as of July 18, 2011, between SunCoke Energy, Inc. and Sunoco, Inc. (incorporated by reference herein to Exhibit 10.8 to the Company’s Quarterly Report on Form 10-Q for the quarterly period ended June 30, 2011 filed on August 3, 2011, File No. 001-35243)
|
|||||
|
10.4
|
|
Tax Sharing Agreement, dated as of July 18, 2011, between SunCoke Energy, Inc. and Sunoco, Inc. (incorporated by reference herein to Exhibit 10.3 to the Company’ Quarterly Report on Form 10-Q for the quarterly period ended June 30, 2011 filed on August 3, 2011, File No. 33-35243)
|
|||||
|
10.5
|
Omnibus Agreement, dated January 24, 2013, by and among SunCoke Energy Partners, L.P., SunCoke Energy Partners GP LLC and SunCoke Energy, Inc. (incorporated by reference herein to Exhibit 10.1 to the Company’s Current Report on Form 8-K, filed on January 24, 2013, File No. 001-35243)
|
||||||
|
10.5.1
|
Amendment No. 1 to Omnibus Agreement, dated as of March 17, 2014, by and among SunCoke Energy Partners, L.P., SunCoke Energy Partners GP LLC and SunCoke Energy, Inc. (incorporated by reference herein to Exhibit 10.3 to the Company’s Quarterly Report on Form 10-Q for the quarterly period ended September 30, 2014 filed on October 28, 2014, File No. 001-35243)
|
||||||
|
10.5.2
|
Amendment No. 2 to Omnibus Agreement, dated as of January 13, 2015, by and among SunCoke Energy Partners, L.P., SunCoke Energy Partners GP LLC and SunCoke Energy, Inc. (incorporated by reference to Exhibit 10.5.2 to the Company's Annual Report on Form 10-K filed on February 24, 2015, File No. 001-35243)
|
||||||
|
10.6**
|
SunCoke Energy, Inc. Senior Executive Incentive Plan, amended and restated effective as of December 9, 2015 (incorporated by reference herein to Exhibit 10.1 to the Company’s Current Report on Form 8-K filed on January 8, 2016, File No. 001-35243)
|
||||||
|
10.7**
|
|
SunCoke Energy, Inc. Annual Incentive Plan, amended and restated as of December 9, 2015 (incorporated by reference to Exhibit 10.2 to the Company's Current Report on Form 8-K filed on January 8, 2016, File No. 001-35243)
|
|||||
|
10.8**
|
|
SunCoke Energy, Inc. Long-Term Performance Enhancement Plan, amended and restated effective as of February 22, 2013 (incorporated by reference herein to Exhibit A to the Company’s Notice of Annual Meeting of Stockholders and Definitive Proxy Statement on Schedule 14A, filed on March 28, 2013, File No. 001-35243)
|
|||||
|
10.8.1**
|
Form of Stock Option Agreement under the SunCoke Energy, Inc. Long-Term Performance Enhancement Plan by and between SunCoke Energy, Inc. and employees of SunCoke Energy, Inc. or one of its Affiliates (incorporated by reference to Exhibit 10.8.1 to the Company's Annual Report on Form 10-K filed on February 24, 2015, File No. 001-35243)
|
||||||
|
10.8.2**
|
Form of Restricted Share Unit Agreement under the SunCoke Energy, Inc. Long-Term Performance Enhancement Plan by and between SunCoke Energy, Inc. and employees of SunCoke Energy, Inc. or one of its Affiliates (incorporated by reference to Exhibit 10.8.2 to the Company's Annual Report on Form 10-K filed on February 24, 2015, File No. 001-35243)
|
||||||
|
10.8.3**
|
Form of Performance Share Unit Agreement under the SunCoke Energy, Inc. Long-Term Performance Enhancement Plan by and between SunCoke Energy, Inc. and employees of SunCoke Energy, Inc. or one of its Affiliates (incorporated by reference to Exhibit 10.8.3 to the Company's Annual Report on Form 10-K filed on February 24, 2015, File No. 001-35243)
|
||||||
|
10.9**
|
|
SunCoke Energy, Inc. Savings Restoration Plan (incorporated by reference herein to Exhibit 10.1 to the Company’s Form 8-K filed on December 9, 2011, File No. 001-35243)
|
|||||
|
10.9.1**
|
Amendment Number One to the SunCoke Energy, Inc. Savings Restoration Plan, effective as of January 1, 2012 (incorporated by reference herein to Exhibit 10.3 to the Company’s Quarterly Report on Form 10-Q for the quarterly period ended March 31, 2012 filed on May 2, 2012, File No. 001-35243)
|
||||||
|
10.10*
|
|
SunCoke Energy, Inc. Special Executive Severance Plan, amended and restated effective as of December 9, 2015 (filed herewith)
|
|||||
|
10.11*
|
|
SunCoke Energy, Inc. Executive Involuntary Severance Plan, amended and restated effective as of December 9, 2015 (filed herewith)
|
|||||
|
10.12**
|
|
SunCoke Energy, Inc. Retainer Stock Plan for Outside Directors, effective as of June 1, 2011 (incorporated by reference herein to Exhibit 10.36 to the Company’s Amendment No. 4 to Registration Statement on Form S-1 filed on July 6, 2011, File No. 333-173022)
|
|||||
138
|
10.13**
|
|
SunCoke Energy, Inc. Directors’ Deferred Compensation Plan, effective as of June 1, 2011 (incorporated by reference herein to Exhibit 10.35 to the Company’s Amendment No. 4 to Registration Statement on Form S-1 filed on July 6, 2011, File No. 333-173022)
|
|||||
|
10.14**
|
|
Form of Indemnification Agreement, individually entered into between SunCoke Energy, Inc. and each director of the Company (incorporated by reference herein to Exhibit 10.16 to the Company’s Quarterly Report on Form 10-Q for the quarterly period ended September 30, 2011 filed on November 2, 2012, File No. 001-35243)
|
|||||
|
10.15**
|
|
Stock Option Agreement under the SunCoke Energy, Inc. Long-Term Performance Enhancement Plan, entered into as of July 21, 2011, by and between SunCoke Energy, Inc. and Frederick A. Henderson (incorporated by reference herein to Exhibit 10.15 to the Company’s Quarterly Report on Form 10-Q for the quarterly period ended June 30, 2011 filed on August 3, 2011, File No. 001-35243)
|
|||||
|
10.16**
|
|
Amendment to Stock Option Agreements under the SunCoke Energy, Inc. Long-Term Performance Enhancement, entered into as of July 18, 2013, applicable to all Stock Option Awards outstanding as of July 18, 2012 (incorporated by reference herein to Exhibit 10.24 to the Company’s Annual Report on Form 10-K for the year ended December 31, 2012, filed on February 22, 2013, File No. 001-35243)
|
|||||
|
10.17**
|
|
Restricted Share Unit Agreement under the SunCoke Energy, Inc. Long-Term Performance Enhancement Plan, entered into as of July 21, 2011, by and between SunCoke Energy, Inc. and Frederick A. Henderson (incorporated by reference herein to Exhibit 10.14 to the Company’s Quarterly Report on Form 10-Q for the quarterly period ended June 30, 2011 filed on August 3, 2011, File No. 001-35243)
|
|||||
|
10.18**
|
|
Amendment to Restricted Share Unit Agreements under the SunCoke Energy, Inc. Long-Term Performance Enhancement, entered into as of July 18, 2013, applicable to all Awards of Restricted Share Units outstanding as of July 18, 2012 (incorporated by reference herein to Exhibit 10.24 to the Company’s Annual Report on Form 10-K for the year ended December 31, 2012, filed on February 22, 2013, File No. 001-35243)
|
|||||
|
10.19
|
The "Confidential General Release and Separation Agreement, dated as of September 25, 2015, by and between SunCoke Energy, Inc. and Michael J. Thomson, incorporated by reference to Exhibit 10.1 to the Quarterly Report on Form 10-Q (file No. 001-35243) filed on October 27, 2015".
|
||||||
|
10.20†
|
|
Amended and Restated Coke Supply Agreement, dated as of October 28, 2003, by and between Jewell Coke Company, L.P., ArcelorMittal Cleveland Inc. (f/k/a ISG Cleveland Inc.) and ArcelorMittal Indiana Harbor (f/k/a ISG Indiana Harbor Inc.) (incorporated by reference herein to Exhibit 10.18 to the Company’s Amendment No. 4 to Registration Statement on Form S-1 filed on July 6, 2011, File No. 333-173022)
|
|||||
|
10.20.1†
|
Amendment No. 1 to Amended and Restated Coke Supply Agreement, dated as of December 5, 2003, by and between Jewell Coke Company, L.P., ArcelorMittal Cleveland Inc. (f/k/a ISG Cleveland Inc.) and ArcelorMittal Indiana Harbor (f/k/a ISG Indiana Harbor Inc.) (incorporated by reference herein to Exhibit 10.19 to the Company’s Amendment No. 2 to Registration Statement on Form S-1 filed on June 3, 2011, File No. 333-173022)
|
||||||
|
10.20.2†
|
Letter Agreement, dated as of May 7, 2008, between ArcelorMittal USA Inc., Haverhill North Coke Company, Jewell Coke Company, L.P. and ISG Sparrows Point LLC, serving as (1) Amendment No. 2 to the Amended and Restated Coke Supply Agreement, by and between Jewell Coke Company, L.P., ArcelorMittal Cleveland Inc. (f/k/a ISG Cleveland Inc.) and ArcelorMittal Indiana Harbor (f/k/a ISG Indiana Harbor Inc.) and (2) Amendment No. 2 to the Coke Purchase Agreement, by and between Haverhill North Coke Company, ArcelorMittal Cleveland Inc. (f/k/a ISG Cleveland Inc.) and ArcelorMittal Indiana Harbor (f/k/a ISG Indiana Harbor Inc.) (incorporated by reference herein to Exhibit 10.20 to the Company’s Amendment No. 3 to Registration Statement on Form S-1 filed on June 3, 2011, File No. 333-173022)
|
||||||
|
10.20.3†
|
Amendment No. 3 to Amended and Restated Coke Supply Agreement, dated as of January 26, 2011, by and between Jewell Coke Company, L.P., ArcelorMittal Cleveland Inc. (f/k/a ISG Cleveland Inc.) and ArcelorMittal Indiana Harbor (f/k/a ISG Indiana Harbor Inc.) (incorporated by reference herein to Exhibit 10.21 to the Company’s Amendment No. 2 to Registration Statement on Form S-1 filed on June 3, 2011, File No. 333-173022)
|
||||||
|
10.21†
|
|
Coke Purchase Agreement, dated as of October 28, 2003, by and between Haverhill North Coke Company, ArcelorMittal Cleveland Inc. (f/k/a ISG Cleveland Inc.) and ArcelorMittal Indiana Harbor (f/k/a ISG Indiana Harbor Inc.) (incorporated by reference herein to Exhibit 10.22 to the Company’s Amendment No. 4 to Registration Statement on Form S-1 filed on July 6, 2011, File No. 333-173022)
|
|||||
|
10.21.1†
|
Amendment No. 1 to Coke Purchase Agreement, dated as of December 5, 2003, by and between Haverhill North Coke Company, ArcelorMittal Cleveland Inc. (f/k/a ISG Cleveland Inc.) and ArcelorMittal Indiana Harbor (f/k/a ISG Indiana Harbor Inc.) (incorporated by reference herein to Exhibit 10.23 to the Company’s Amendment No. 2 to Registration Statement on Form S-1 filed on June 3, 2011, File No. 333-17302)
|
||||||
139
|
10.21.2†
|
Amendment No. 3 to Coke Purchase Agreement, dated as of May 8, 2008, by and between Haverhill North Coke Company, ArcelorMittal Cleveland Inc. (f/k/a ISG Cleveland Inc.) and ArcelorMittal Indiana Harbor (f/k/a ISG Indiana Harbor Inc.) (incorporated by reference herein to Exhibit 10.25 to the Company’s Amendment No. 2 to Registration Statement on Form S-1 filed on June 3, 2011, File No. 333-17302)
|
||||||
|
10.21.3†
|
Amendment No. 4 to Coke Purchase Agreement, dated as of January 26, 2011, by and between Haverhill North Coke Company, ArcelorMittal Cleveland Inc. (f/k/a ISG Cleveland Inc.) and ArcelorMittal Indiana Harbor (f/k/a ISG Indiana Harbor Inc.) (incorporated by reference herein to Exhibit 10.26 to the Company’s Amendment No. 2 to Registration Statement on Form S-1 filed on June 3, 2011, File No. 333-17302)
|
||||||
|
10.22†
|
|
Coke Purchase Agreement, dated as of August 31, 2009, by and between Haverhill North Coke Company and AK Steel Corporation (incorporated by reference herein to Exhibit 10.27 to the Company’s Amendment No. 5 to Registration Statement on Form S-1 filed on July 18, 2011, File No. 333-17302)
|
|||||
|
10.23†
|
|
Amended and Restated Coke Purchase Agreement, dated as of February 19, 1998, by and between Indiana Harbor Coke Company, L.P. and ArcelorMittal USA Inc. (f/k/a Inland Steel Company) (incorporated by reference herein to Exhibit 10.1 to the Company’s Quarterly Report on Form 10-Q for the quarterly period ended September 30, 2013 filed on October 30, 2013, File No. 001-35243)
|
|||||
|
10.23.1†
|
Amendment No. 1 to Amended and Restated Coke Purchase Agreement, dated as of November 22, 2000, by and between Indiana Harbor Coke Company, L.P., a subsidiary of the Company, and ArcelorMittal USA Inc. (f/k/a Inland Steel Company) (incorporated by reference herein to Exhibit 10.29 to the Company’s Amendment No. 2 to Registration Statement on Form S-1 filed on June 3, 2011, File No. 333-17302)
|
||||||
|
10.23.2†
|
Amendment No. 2 to Amended and Restated Coke Purchase Agreement, dated as of March 31, 2001, by and between Indiana Harbor Coke Company, L.P. and ArcelorMittal USA Inc. (f/k/a Inland Steel Company) (incorporated by reference herein to Exhibit 10.2 to the Company’s Quarterly Report on Form 10-Q for the quarterly period ended September 30, 2013 filed on October 30, 2013, File No. 001-35243)
|
||||||
|
10.23.3†
|
Supplement to Amended and Restated Coke Purchase Agreement, dated as of February 3, 2011, by and between Indiana Harbor Coke Company, L.P. and ArcelorMittal USA Inc. (f/k/a Inland Steel Company) (incorporated by reference herein to Exhibit 10.3 to the Company’s Quarterly Report on Form 10-Q for the quarterly period ended September 30, 2013 filed on October 30, 2013, File No. 001-35243)
|
||||||
|
10.23.4†
|
Extension Agreement, dated as of September 5, 2013, by and between Indiana Harbor Coke Company, L.P. and ArcelorMittal USA Inc. (incorporated by reference herein to Exhibit 10.4 to the Company’s Quarterly Report on Form 10-Q for the quarterly period ended September 30, 2013 filed on October 30, 2013, File No. 001-35243)
|
||||||
|
10.23.5†
|
Supplement to the ArcelorMittal USA LLC and Indiana Harbor Coke Company, L.P. Coke Purchase Agreement Term Sheet and the ArcelorMittal Cleveland LLC, ArcelorMital Indiana Harbor LLC and Jewell Coke Company, L.P. Coke Supply Agreement , dated as of September 10, 2014 (incorporated by reference herein to Exhibit 10.2 to the Company’s Quarterly Report on Form 10-Q for the quarterly period ended September 30, 2014 filed on October 28, 2014, File No. 001-35243)
|
||||||
|
10.24†
|
|
Coke Sale and Feed Water Processing Agreement, dated as of February 28, 2008, by and between Gateway Energy & Coke Company, LLC and U.S. Steel Corporation (incorporated by reference herein to Exhibit 10.32 to the Company’s Amendment No. 7 to Registration Statement on Form S-1 filed on July 20, 2011, File No. 333-17302)
|
|||||
|
10.24.1†
|
|
Amendment No. 1 to Coke Sale and Feed Water Processing Agreement, dated as of November 1, 2010, by and between Gateway Energy & Coke Company, LLC and U.S. Steel Corporation (incorporated by reference herein to Exhibit 10.33 to the Company’s Amendment No. 2 to Registration Statement on Form S-1 filed on June 3, 2011, File No. 333-17302)
|
|||||
|
10.24.2
|
|
Amendment No. 2 to Coke Sale and Feed Water Processing Agreement, dated as of July 6, 2011, by and between Gateway Energy & Coke Company, LLC and U.S. Steel Corporation (incorporated by reference to Exhibit 10.23.2 to the Company's Annual Report on Form 10-K filed on February 24, 2015, File No. 001-35243)
|
|||||
|
10.24.3†
|
|
Amendment No. 3 to Coke Sale and Feed Water Processing Agreement, dated as of January 12, 2015, by and among Gateway Energy & Coke Company, LLC, Gateway Cogeneration Company LLC and U.S. Steel Corporation (incorporated by reference to Exhibit 10.23.3 to the Company's Annual Report on Form 10-K filed on February 24, 2015, File No. 001-35243)
|
|||||
|
10.25†
|
|
Amended and Restated Coke Purchase Agreement, dated as of September 1, 2009, by and between Middletown Coke Company, LLC, a subsidiary of the Company and AK Steel Corporation (incorporated by reference herein to Exhibit 10.34 to the Company’s Amendment No. 5 to Registration Statement on Form S-1 filed on July 18, 2011, File No. 333-17302)
|
|||||
|
12.1*
|
|
Consolidated Ratio of Earnings to Fixed Charges (filed herewith)
|
|||||
140
|
21.1*
|
|
Subsidiaries of the Registrant (filed herewith)
|
|||||
|
23.1*
|
|
Consent of KPMG LLP (filed herewith)
|
|||||
|
23.2*
|
|
Consent of Ernst & Young LLP (filed herewith)
|
|||||
|
24.1*
|
|
Powers of Attorney (filed herewith)
|
|||||
|
31.1*
|
|
Chief Executive Officer Certification Pursuant to Exchange Act Rule 13a-14(a) or Rule 15d-14(a), as Adopted Pursuant to Section 302 of the Sarbanes-Oxley Act of 2002 (filed herewith)
|
|||||
|
31.2*
|
|
Chief Financial Officer Certification Pursuant to Exchange Act Rule 13a-14(a) or Rule 15d-14(a), as Adopted Pursuant to Section 302 of the Sarbanes-Oxley Act of 2002 (filed herewith)
|
|||||
|
32.1*
|
|
Chief Executive Officer Certification Pursuant to Exchange Act Rule 13a-14(b) or Rule 15d-14(b) and Section 1350 of Chapter 63 of Title 18 of the U.S. Code, as Adopted pursuant to Section 906 of the Sarbanes-Oxley Act of 2002 (furnished herewith)
|
|||||
|
32.2*
|
|
Chief Financial Officer Certification Pursuant to Exchange Act Rule 13a-14(b) or Rule 15d-14(b) and Section 1350 of Chapter 63 of Title 18 of the U.S. Code, as Adopted pursuant to Section 906 of the Sarbanes-Oxley Act of 2002 (furnished herewith)
|
|||||
|
95.1*
|
|
Mine Safety Disclosure (filed herewith)
|
|||||
|
101.INS*
|
|
XBRL Instance Document
|
|||||
|
101.SCH*
|
|
XBRL Taxonomy Extension Schema Document
|
|||||
|
101.CAL*
|
|
XBRL Taxonomy Extension Calculation Linkbase Document
|
|||||
|
101.DEF*
|
|
XBRL Taxonomy Extension Definition Linkbase Document
|
|||||
|
101.LAB*
|
|
XBRL Taxonomy Extension Label Linkbase Document
|
|||||
|
101.PRE*
|
|
XBRL Taxonomy Extension Presentation Linkbase Document
|
|||||
|
*
|
Provided herewith.
|
||||||
|
**
|
Management contract or compensatory plan or arrangement.
|
||||||
|
†
|
Certain portions have been omitted pursuant to a confidential treatment request. Omitted information has been separately filed with the Securities and Exchange Commission.
|
||||||
141
SIGNATURES
Pursuant to the requirements of Section 13 or 15(d) of the Securities Exchange Act of 1934, the registrant has duly caused this report to be signed on its behalf by the undersigned, thereunto duly authorized, on the
18th day of February 2016
.
|
SUNCOKE ENERGY, INC.
|
||
|
By:
|
|
/s/ Fay West
|
|
|
Fay West
Senior Vice President and
Chief Financial Officer
|
|
Pursuant to the requirements of the Securities Act of 1934, this report has been signed by the following persons on behalf of the registrant and in the capacities indicated on
February 18, 2016
.
|
Signature
|
|
Title
|
|
/s/ Frederick A. Henderson*
|
|
Chairman, President and Chief Executive Officer
(Principal Executive Officer)
|
|
Frederick A. Henderson
|
||
|
/s/ Fay West
|
|
Senior Vice President and Chief Financial Officer (Principal Financial Officer)
|
|
Fay West
|
||
|
/s/ Allison S. Lausas*
|
|
Vice President and Controller
(Principal Accounting Officer)
|
|
Allison S. Lausas
|
||
|
/s/ Robert J. Darnall*
|
|
Director
|
|
Robert J. Darnall
|
||
|
/s/ Alvin Bledsoe*
|
|
Director
|
|
Alvin Bledsoe
|
||
|
/s/ Peter B. Hamilton*
|
|
Director
|
|
Peter B. Hamilton
|
||
|
/s/ Karen B. Peetz*
|
|
Director
|
|
Karen B. Peetz
|
||
|
/s/ John W. Rowe*
|
|
Director
|
|
John W. Rowe
|
||
|
/s/ James E. Sweetnam*
|
|
Director
|
|
James E. Sweetnam
|
||
|
* Fay West, pursuant to powers of attorney duly executed by the above officers and directors of SunCoke Energy, Inc. and filed with the SEC in Washington, D.C., hereby executes this Annual Report on Form 10-K on behalf of each of the persons named above in the capacity set forth opposite his or her name.
|
||
|
/s/ Fay West
|
|
February 18, 2016
|
|
Fay West
|
||
142
TABLE OF CONTENTS
Part IItem 1. BusinessItem 1A. Risk FactorsItem 1B. Unresolved Staff CommentsItem 2. PropertiesItem 3. Legal ProceedingsItem 4. Mine Safety DisclosuresPart IIItem 5. Market For Registrant S Common Equity, Related Stockholders Matters and Issuer Purchases Of Equity SecuritiesItem 6. Selected Financial DataItem 7. Management S Discussion and Analysis Of Financial Condition and Results Of OperationsItem 7A. Quantitative and Qualitative Disclosures About Market RiskItem 8. Financial Statements and Supplementary DataItem 9. Changes in and Disagreements with Accountants on Accounting and Financial DisclosureItem 9A. Controls and ProceduresItem 9B. Other InformationPart IIIItem 10. Directors, Executive Officers and Corporate GovernanceItem 11. Executive CompensationItem 12. Security Ownership Of Certain Beneficial Owners and Management and Related Stockholder MattersItem 13. Certain Relationships and Related Transactions, and Director IndependenceItem 14. Principal Accounting Fees and ServicesPart IVItem 15. Exhibits, Financial Statement Schedules