|
|
|
|
|
|
|
|
|
|
|
|
|
|
|
|
|
|
|
|
|
|
|
|
|
|
|
|
|
|
|
|
|
|
|
|
|
|
|
|
|
|
|
|
|
|
|
|
|
|
|
|
|
|
|
|
UNITED STATES
SECURITIES AND EXCHANGE COMMISSION
Washington, DC 20549
Form 10-K
Annual Report Pursuant to Section 13
or 15(d) of the Securities Exchange Act of 1934
|
For the Fiscal Year Ended |
|
Commission File Number |
|
December 31, 2011 |
|
1-13661 |
S.Y. BANCORP, INC.
1040 East Main Street
Louisville, Kentucky 40206
(502) 582-2571
|
Incorporated in Kentucky |
|
|
|
I.R.S. No. 61-1137529 |
Securities registered pursuant to Section 12(b) of the Act:
|
Title of each class: |
|
Name of each exchange on which registered: |
|
Common Stock, no par value Preferred Share Purchase Rights |
|
NASDAQ
|
|
10.00% Cumulative Trust Preferred Securities and the guarantee with respect thereto |
|
NASDAQ |
Securities registered pursuant to Section 12(g) of the Act: None
Indicate by check mark if the registrant is a well-known seasoned issuer (as defined in Rule 405 of the Securities Act). Yes o No x
Indicate by check mark if the registrant is not required to file reports pursuant to Section 13 or Section 15(d) of the Act. Yes o No x
Indicate by check mark whether the registrant (1) has filed all reports required to be filed by Section 13 or 15(d) of the Securities Exchange Act of 1934 during the preceding 12 months (or for such shorter period that the registrant was required to file such reports), and (2) has been subject to such filing requirements for the past 90 days. Yes x No o
Indicate by check mark whether the registrant has submitted electronically and posted on its corporate Web site, if any, every Interactive Data File required to be submitted and posted pursuant to Rule 405 of Regulation S-T (§232.405 of this chapter) during the preceding 12 months (or for such shorter period that the registrant was required to submit and post such files). Yes x No o
Indicate by check mark if disclosure of delinquent filers pursuant to Item 405 of Regulation S-K is not contained herein, and will not be contained, to the best of the registrant’s knowledge, in definitive proxy or information statements incorporated by reference in Part III of this Form 10-K or any amendment to this Form 10-K. x
Indicate by check mark whether the registrant is a large accelerated filer, an accelerated filer, a non-accelerated filer or a smaller reporting company. See the definitions of “large accelerated filer”, “accelerated filer” and “smaller reporting company” in Rule 12b-2 of the Exchange Act:
|
Large accelerated filer o |
|
Accelerated filer x |
|
|
|
|
|
Non-accelerated filer
o
|
|
Smaller reporting company o |
Indicate by check mark whether the registrant is a shell company (as defined in Rule 12b-2 of the Exchange Act). Yes o No x
The aggregate market value of registrant’s voting stock (Common Stock, no par value) held by non-affiliates of the registrant as of June 30, 2011 (the last business day of the registrant’s most recently completed second fiscal quarter) was $283,763,000.
The number of shares of the registrant’s Common Stock, no par value, outstanding as of February 21, 2012, was 13,823,555.
Documents Incorporated By Reference
Portions of Registrant’s definitive proxy statement related to Registrant’s Annual Meeting of Shareholders to be held on April 25, 2012 (the “Proxy Statement”), to be filed with the Securities and Exchange Commission, are incorporated by reference into Part III of this Form 10-K.
S.Y. BANCORP, INC.
Form 10-K
Index
S. Y. Bancorp, Inc. (“Bancorp” or “Company”) was incorporated in 1988 and is a Kentucky corporation headquartered in Louisville, Kentucky. Bancorp is a bank holding company registered with, and subject to supervision, regulation and examination by the Board of Governors of the Federal Reserve System. Bancorp has two subsidiaries, Stock Yards Bank & Trust Company (the Bank) and S.Y. Bancorp Capital Trust II (the Trust). The Bank is wholly owned and is a state chartered bank. Because Bancorp has no operations of its own, its business and that of the Bank are essentially the same. The operations of the Bank are fully reflected in the consolidated financial statements of Bancorp. Accordingly, references to “Bancorp” in this document may encompass both the holding company and the Bank. The Trust is a Delaware statutory trust that is a 100%-owned finance subsidiary of Bancorp. See Note 11 to Bancorp’s consolidated financial statements for further discussion of the Trust and its accounting treatment.
Stock Yards Bank & Trust Company
Stock Yards Bank & Trust Company is the banking subsidiary of Bancorp and was chartered in 1904. The Bank is headquartered in Louisville, Kentucky and provides commercial and personal banking services in the Louisville, Kentucky, Indianapolis, Indiana and Cincinnati, Ohio metropolitan markets through 30 full service banking offices (See “ITEM 2. PROPERTIES”). The Bank is chartered under the laws of the Commonwealth of Kentucky. In addition to traditional commercial and personal banking activities, the Bank has an investment management and trust department offering a wide range of trust administration, investment management, employee benefit plan and estate administration, and financial planning services. This department operates under the name of Stock Yards Trust Company. The Bank also originates and sells single-family residential mortgages through Stock Yards Mortgage Company. Additionally, the Bank offers securities brokerage services in the name of Stock Yards Financial Services through an arrangement with a third party broker-dealer. See Note 23 to Bancorp’s consolidated financial statements for information relating to the Bank’s business segments.
At December 31, 2011, the Bank had 480 full-time equivalent employees. Management of Bancorp strives to be an employer of choice and considers the relationship with employees to be good.
Supervision and Regulation
Bank holding companies and commercial banks are extensively regulated under both federal and state laws. Changes in applicable laws or regulations may have a material effect on the business and prospects of Bancorp and the Bank.
Bancorp, as a registered bank holding company, is subject to the supervision of and regulation by the Federal Reserve Board under the Bank Holding Company Act of 1956. In addition, Bancorp is subject to the provisions of Kentucky’s banking laws regulating bank acquisitions and certain activities of controlling bank shareholders.
Kentucky and federal banking statutes delineate permissible activities for Kentucky state-chartered banks. Kentucky’s statutes, however, contain a super parity provision for Kentucky banks having a top one or two rating in its most recent regulatory examination. This provision allows a state bank to engage in any banking activity in which a national bank in Kentucky, a state bank operating in any other state, or a federally chartered thrift could engage. The bank must first obtain a legal opinion specifying the statutory or regulatory provisions that permit the activity.
The Bank is subject to the supervision of the Kentucky Department of Financial Institutions and the Federal Deposit Insurance Corporation. The Federal Deposit Insurance Corporation (FDIC) insures the deposits of the Bank to the current maximums of $250,000 per depositor for time and demand deposit accounts and self-directed retirement accounts. In addition, the FDIC insures all balances in non-interest bearing demand deposit accounts of the Bank through December 31, 2012 as part of the Dodd-Frank Wall Street Reform and Consumer Protection Act signed into law in 2010.
The Gramm-Leach-Bliley Act (the “GLB Act”) allows for affiliations among banks, securities firms and insurance companies by means of a financial holding company (“FHC”). In most cases, the creation of an FHC is a simple election and notice to the Federal Reserve Board. The GLB Act requires that, at the time of establishment of an FHC, all depository institutions within that corporate group must be “well managed” and “well capitalized” and must have received a rating of “satisfactory” or better under its most recent Community Reinvestment Act examination. Further, non-banking financial firms (for example an insurance company or securities firm) may establish an FHC and acquire a depository institution. While the distinction between banks and non-banking financial firms has been blurring over recent years, the GLB Act makes it less cumbersome for banks to offer services “financial in nature” but beyond traditional commercial banking activities. Likewise, non-banking financial firms may find it easier to offer services that had, heretofore, been provided primarily by depository institutions. Management of Bancorp has chosen not to become an FHC at this time, but continues to evaluate the benefits and costs of such a structure.
In response to the stresses experienced in the financial markets, the Emergency Economic Stabilization Act (EESA) was enacted in 2008. Pursuant to its authority under EESA, Treasury created the TARP Capital Purchase Program (CPP) under which the Treasury Department would invest up to $250 billion in senior preferred stock of U.S. banks and savings associations or their holding companies. Although it was approved for participation, Bancorp declined to participate in federal TARP funding because its capital levels were and remain significantly in excess of what is required to be considered “well-capitalized” under regulatory standards.
The Dodd-Frank Wall Street Reform and Consumer Protection Act of 2010 (the “Dodd-Frank Act”) was signed into law in 2010. Generally, the Dodd-Frank Act was effective the day after it was signed into law, but different effective dates apply to specific sections of the law. This new extensive and complex legislation contained many new provisions affecting the banking industry, including:
· Creation of a new Bureau of Consumer Financial Protection
· Determination of debit card interchange rates by the Federal Reserve Board
· New regulation over derivative instruments
· Establishment of new powers enabling federal regulators to seize and dismantle troubled financial firms
· Phase outs of certain forms of trust preferred debt and hybrids previously included as bank capital
· Increases to FDIC deposit coverage, increased bank premiums, and numerous other provisions affecting financial institution regulation, oversight of certain non-banking organizations, investor protection, etc.
Uncertainty remains as to the ultimate impact of the Dodd-Frank Act, which could have an adverse impact on the financial services industry as a whole and on Bancorp’s business, results of operations and financial condition.
In 2009, as part of its efforts to rebuild the Deposit Insurance Fund, the FDIC levied a special assessment applicable to all insured depository institutions totaling 5 basis points of each institution’s total assets less Tier 1 capital as of June 30, 2009. In lieu of further special assessments, in November 2009, the FDIC required all insured depository institutions, with limited exceptions, to prepay their estimated quarterly risk-based assessments for the fourth quarter of 2009 and for all of 2010, 2011 and 2012.
In 2011, per the Dodd-Frank Act, the FDIC redefined the deposit assessment base as average consolidated total assets minus average tangible equity, and adopted a new assessment rate schedule effective April 1, 2011. This revision resulted in somewhat lower FDIC insurance expense for Bancorp beginning in 2011.
Available Information
Bancorp files reports with the SEC including the Annual Report on Form 10-K, quarterly reports on Form 10-Q, current event reports on Form 8-K, and proxy statements, as well as any amendments to those reports. The
public may read and copy any materials the Registrant files with the SEC at the SEC’s Public Reference Room at 100 F Street, NE, Washington, DC 20549. The public may obtain information on the operation of the Public Reference Room by calling the SEC at 1-800-SEC-0330. The SEC maintains an internet site that contains reports, proxy and information statements and other information regarding issuers that file electronically with the SEC at http://www.sec.gov. Bancorp’s Annual Report on Form 10-K, quarterly reports on Form 10-Q, current reports on Form 8-K, and amendments to those reports filed or furnished pursuant to section 13(a) or 15(d) of the Exchange Act are accessible at no cost on Bancorp’s web site at http://www.syb.com after they are electronically filed with or furnished to the SEC.
Investments in Bancorp’s common stock or trust preferred securities involve risk, and Bancorp’s profitability and success may be affected by a number of factors including those discussed below.
Financial condition and profitability depend significantly on local and national economic conditions.
Our success depends on general economic conditions both locally and nationally. Most of Bancorp’s customers are in the Louisville, Indianapolis, and Cincinnati metropolitan areas. Some of Bancorp’s customers are directly impacted by the local economy while others have more national or global business dealings. Some of the factors influencing general economic conditions include recession, unemployment, and inflation. Poor economic conditions have an unfavorable impact on the demand of customers for loans, the ability of some borrowers to repay these loans, availability of deposits and the value of the collateral securing these loans.
Bancorp offers a variety of secured loans, including commercial lines of credit, commercial term loans, real estate, construction, home equity, consumer and other loans. Over half of Bancorp’s loans are secured by real estate (both residential and commercial) in Bancorp’s market area. Adverse changes in the local or national economy could negatively affect the customer’s ability to pay these loans. In instances where borrowers are unable to repay their loans from us and there has been deterioration in the value of the loan collateral, Bancorp could experience higher loan losses. Additional increases in loan loss provisions may be necessary in the future. Deterioration in the quality of the credit portfolio could have a material adverse effect on financial condition, results of operations, and ultimately capital.
Declines in the housing market over the past few years, falling home prices, increasing foreclosures, unemployment and under employment have negatively impacted the credit performance of real estate related loans and resulted in significant write downs of asset values by many financial institutions. These write downs have caused many financial institutions to seek additional capital, to reduce or eliminate dividends, to merge with larger and stronger institutions and, in some cases, to fail. This market turmoil has led to an increased level of commercial and consumer delinquencies, lack of consumer confidence, increased market volatility and widespread reduction of business activity generally. To date, the impact of these adverse conditions has not been as severe in the markets Bancorp serves. Should market conditions not improve and foreclosed assets increase significantly, Bancorp’s flexibility to approach collateral sales in an orderly fashion to minimize losses may be reduced and management may be forced to liquidate problem loans more rapidly, thus increasing the loss on these assets.
Significant stock market volatility could negatively affect Bancorp’s financial results.
Capital and credit markets experience volatility and disruption from time to time. These conditions place downward pressure on credit availability, credit worthiness and customers’ inclinations to borrow. Prolonged volatility or a significant disruption could negatively impact customers’ ability to seek new loans or to repay existing loans. The personal wealth of many of borrowers and guarantors has historically added a source of financial strength to certain loans and would be negatively impacted by severe market declines. Sustained reliance on their personal assets to make loan payments would result in deterioration of their liquidity, and could result in loan defaults.
Income from investment management and trust services constitutes an average of 40% of non-interest income. Trust assets under management are expressed in terms of market value, and a significant portion of fee income is based upon those values. While investment management and trust fees are based on market values, they typically do not fluctuate directly with the overall stock market. Accounts typically contain fixed income and equity asset classes, which generally react to market fluctuations inversely to each other. As a broad approximation, a 10% drop in the S&P 500 index would decrease investment management and trust fees approximately 2 — 4%.
If actual loan losses are greater than Bancorp’s allowance assumption for loan losses, earnings could decrease.
Bancorp’s loan customers may not repay their loans according to the terms of these loans, the collateral securing the payment of these loans may be insufficient to ensure repayment and the wealth of guarantors providing guarantees to support these loans may be insufficient to aid in the repayment of these loans. Accordingly, Bancorp may experience significant credit losses which could have a material adverse effect on operating results. Bancorp makes various assumptions and judgments about the collectability of the loan portfolio, including the creditworthiness of borrowers and the value of real estate and other assets serving as collateral for repayment of many loans. In determining the adequacy of the allowance for loan losses, Bancorp considers, among other factors, an evaluation of economic conditions and Bancorp’s loan loss experience. Management continues to be concerned that the prolonged economic downturn and prospects for uncertain recovery will continue to take a toll on Bancorp’s loan portfolio and underlying collateral values, extending its impact to lending relationships that have to date not been identified. If Bancorp’s assumptions prove to be incorrect or economic problems are worse than projected, the current allowance may not be sufficient to cover loan losses and adjustments may be necessary to allow for different economic conditions or adverse developments in the loan portfolio. Such additions to the allowance, if necessary, could have a material adverse impact on financial results.
In addition, federal and state regulators periodically review Bancorp’s allowance for loan losses and may require an increase in the provision for loan losses or loan charge-offs. If the regulatory agencies require any increase in the provision for loan losses or loan charge-offs for which Bancorp had not allocated, it would have a negative effect on net income.
Fluctuations in interest rates could reduce profitability.
Our primary source of income is from the net interest spread, the difference between interest earned on loans and investments and the interest paid on deposits and borrowings. Bancorp expects to periodically experience “gaps” in the interest rate sensitivities of Bancorp’s assets and liabilities, meaning that either interest-bearing liabilities will be more sensitive to changes in market interest rates than interest-earning assets, or vice versa. In either event, if market interest rates should move contrary to Bancorp’s position, this “gap” will work against Bancorp and earnings will be negatively affected.
Many factors affect the fluctuation of market interest rates, including, but not limited to the following:
· Inflation or deflation;
· recession;
· a rise in unemployment;
· tightening money supply;
· international disorder and instability in foreign financial markets;
· the Federal Reserve reducing rates; and
· competition from other financial institutions.
Bancorp’s interest rate sensitivity analysis indicates an increase in interest rates of up to 2% would decrease net interest income, primarily because the majority of Bancorp’s variable rate loans have floors of 4% or higher, and are indexed to the prime rate. Since the prime rate is currently 3.25%, rates would have to increase more than 75 bp before the rates on such loans will rise. This effect negatively impacts the effect of rising rates. Deposit rates generally do not reprice as quickly as loans which negatively affects earnings as
rates decline. Bancorp’s asset-liability management strategy, which is designed to mitigate risk from changes in market interest rates, may not be able to prevent changes in interest rates from having a material adverse effect on Bancorp’s results of operations and financial condition. Bancorp’s most recent earnings simulation model estimating the impact of changing interest rates on earnings indicates net interest income will be virtually unchanged if interest rates immediately decrease 100 basis points for the next 12 months and decrease approximately 0.5% if rates increase 200 basis points. Prevailing interest rates are at historically low levels, and current indications are that the Federal Reserve will likely maintain the low rates for the next few years.
Competition with other financial institutions could adversely affect profitability.
Bancorp operates in a highly competitive industry that could become even more competitive as a result of legislative, regulatory and technological changes and continued consolidation. Bancorp faces vigorous competition from banks and other financial institutions. A number of these banks and other financial institutions have substantially greater resources and lending limits, larger branch systems and a wider array of banking services. Additionally, Bancorp encounters competition from smaller community banks in Bancorp’s markets. Bancorp also competes with other non-traditional providers of financial services, such as brokerage firms and insurance companies. This competition may reduce or limit margins on banking services, reduce market share and adversely affect results of operations and financial condition.
Credit unions, whose membership is no longer tied to a single company, have grown in popularity and size, and their expansion into business lending is growing. Because credit unions are not subject to federal income tax, and Bancorp pays federal income tax at a marginal rate 35%, these companies have a significant competitive advantage over Bancorp. This advantage may have a negative impact on Bancorp’s growth and resultant financial results as these credit unions continue to expand.
Bancorp’s accounting policies and methods are critical to how Bancorp reports its financial condition and results of operations. They require management to make estimates about matters that are uncertain.
Accounting policies and methods are fundamental to how Bancorp records and reports its financial condition and results of operations. Bancorp must exercise judgment in selecting and applying these accounting policies and methods so they comply with Accounting Principles Generally Accepted in the United States of America (US GAAP).
Bancorp has identified certain accounting policies as being critical because they require management’s judgment to ascertain the valuations of assets, liabilities, commitments and contingencies. A variety of factors could affect the ultimate value that is obtained either when earning income, recognizing an expense, recovering an asset, or reducing a liability. Bancorp has established detailed policies and control procedures that are intended to ensure these critical accounting estimates and judgments are well controlled and applied consistently. In addition, the policies and procedures are intended to ensure that the process for changing methodologies occurs in an appropriate manner. Because of the uncertainty surrounding Bancorp’s judgments and the estimates pertaining to these matters, there can be no assurances that actual results will not differ from those estimates. See the “Critical Accounting Policies” in the “Management’s Discussion and Analysis of Financial Condition and Results of Operations” for more information.
An extended disruption of vital infrastructure or a security breach could negatively impact Bancorp’s business, results of operations, and financial condition.
Bancorp’s operations depend upon, among other things, infrastructure, including equipment and facilities. Extended disruption of vital infrastructure by fire, power loss, natural disaster, telecommunications failure, information systems breaches, terrorist activity or the domestic and foreign response to such activity, or other events outside of Bancorp’s control could have a material adverse impact on the financial services industry as a whole and on Bancorp’s business, results of operations and financial condition. Bancorp’s business continuity plan may not work as intended or may not prevent significant interruption of
operations. The occurrence of any failures, interruptions, or security breaches of information systems could damage Bancorp’s reputation, result in the loss of customer business, subject us to additional regulatory scrutiny, or expose us to civil litigation and possible financial liability, any of which could have an adverse effect on Bancorp’s financial condition and results of operation.
Bancorp’s assets which are at risk for cyber-attacks include financial assets and non-public information belonging to customers. Bancorp utilizes several third-party vendors who have access to our assets via electronic media. Certain cyber security risks arise due to this access, including cyber espionage, blackmail, ransom, and theft. Bancorp employs many preventive and detective controls to protect its assets, and provides mandatory recurring information security training to all employees. Bancorp requires identified third parties to have similar or superior controls in place. Bancorp did not suffer a material incident in the years reported herein. Bancorp maintains insurance coverage to prevent material financial loss from cyber-attacks.
Bancorp operates in a highly regulated environment and may be adversely affected by changes in federal, state and local laws and regulations.
Bancorp is subject to extensive regulation, supervision and examination by federal and state banking authorities. Any change in applicable regulations or federal or state legislation could have a substantial impact on the bank and its operations. Additional legislation and regulations may be enacted or adopted in the future that could significantly affect Bancorp’s powers, authority and operations, which could have a material adverse effect on Bancorp’s financial condition and results of operations. The exercise of regulatory power may have negative impact on Bancorp’s results of operations and financial condition.
Item 1B. Unresolved Staff Comments
Bancorp has no unresolved SEC staff comments.
The principal offices of Bancorp and the Bank are located at 1040 East Main Street, Louisville, Kentucky. The Bank’s operations center is at a separate location. In addition to the main office complex and the operations center, the Bank owned 13 branch properties at December 31, 2011, two of which are located on leased land. At that date, the Bank also leased 16 branch facilities. Of the 30 banking locations, 25 are located in the Louisville Metropolitan Statistical Area (“MSA”), two are located in the Indianapolis MSA and three are located in the Cincinnati MSA. In 2011, Bancorp acquired property for one additional location in the Indianapolis market projected to open in 2012. See Notes 5 and 17 to Bancorp’s consolidated financial statements for the year ended December 31, 2011, for additional information relating to amounts invested in premises, equipment and lease commitments .
See Note 17 to Bancorp’s consolidated financial statements for the year ended December 31, 2011, for information relating to legal proceedings.
Item 4. Mine Safety Disclosures
Not applicable.
Executive Officers of the Registrant
The following table lists the names and ages as of December 31, 2011 of all current executive officers of Bancorp and the Bank. Each executive officer is appointed by Bancorp’s Board of Directors to serve at the discretion of the Board. There is no arrangement or understanding between any executive officer of Bancorp or the Bank and any other person(s) pursuant to which he/she was or is to be selected as an officer.
|
Name and Age
|
|
Position and Offices
|
|
David P. Heintzman Age 52 |
|
Chairman of the Board of Directors and Chief Executive Officer of Bancorp and the Bank |
|
|
|
|
|
James A. Hillebrand Age 43 |
|
President and Director of Bancorp and the Bank |
|
|
|
|
|
Kathy C. Thompson Age 50 |
|
Senior Executive Vice President and Director of Bancorp and the Bank |
|
|
|
|
|
Nancy B. Davis Age 56 |
|
Executive Vice President, Secretary, Treasurer and Chief Financial Officer of Bancorp and the Bank |
|
|
|
|
|
William M. Dishman III Age 48 |
|
Executive Vice President and Chief Risk Officer of the Bank |
|
|
|
|
|
Gregory A. Hoeck Age 61 |
|
Executive Vice President of the Bank |
|
|
|
|
|
Philip S. Poindexter Age 45 |
|
Executive Vice President and Chief Lending Officer of the Bank |
|
|
|
|
|
T. Clay Stinnett Age 38 |
|
Executive Vice President and Chief Strategic Officer of Bancorp and the Bank |
Mr. Heintzman was appointed Chairman and Chief Executive Officer effective in January 2006. Prior thereto, he served as President of Bancorp and the Bank since 1992. Mr. Heintzman joined the Bank in 1985.
Mr. Hillebrand was appointed President effective in July 2008. Prior thereto, he served as Executive Vice President and Director of Private Banking of the Bank since 2005. From 2000 to 2004, he served as Senior Vice President of Private Banking. Mr. Hillebrand joined the Bank in 1996.
Ms. Thompson was appointed Senior Executive Vice President in January 2006. Prior thereto, she served as Executive Vice President of Bancorp and the Bank. She joined the Bank in 1992 and is Manager of the Investment Management and Trust Department.
Ms. Davis was appointed Executive Vice President of Bancorp and the Bank in 1999 and Chief Financial Officer in 1993. She joined the Bank in 1991.
Mr. Dishman joined the Bank and was appointed Executive Vice President and Chief Risk Officer in February 2009. Prior thereto, he served as Executive Vice President and Chief Credit Officer for National City Bank’s Kentucky and Tennessee markets from 2004 to 2009.
Mr. Hoeck joined the Bank and was appointed Executive Vice President in May 1998. He is the manager of Retail Banking for the Bank.
Mr. Poindexter was appointed Chief Lending Officer in July 2008. Prior thereto, he served as Executive Vice President and Director of Commercial Lending. Mr. Poindexter joined the Bank in 2004.
Mr. Stinnett was appointed Executive Vice President and Chief Strategic Officer in February 2011. Prior thereto, he served as Senior Vice President and Chief Strategic Officer since 2005. Mr. Stinnett joined the Bank in 2000.
Item 5. Market for Registrant’s Common Equity, Related Stockholder Matters and Issuer Purchases of Equity Securities
Bancorp’s common stock is traded on the NASDAQ Global Select Market under the ticker symbol SYBT. Prior to July 2006, the stock traded on the American Stock Exchange under the symbol SYI. The table below sets forth the quarterly high and low market closing prices of Bancorp’s common stock and dividends declared per share. The payment of dividends by the Bank to Bancorp is subject to the restriction described in Note 16 to the consolidated financial statements. Management believes that Bancorp will continue to generate adequate earnings to continue to pay dividends on a quarterly basis. On December 31, 2011, Bancorp had approximately 1,457 shareholders of record, and approximately 3,600 non-objecting beneficial owners holding shares in nominee or “street” name.
|
|
|
2011 |
|
2010 |
|
||||||||||||||
|
Quarter |
|
High |
|
Low |
|
Cash dividends
|
|
High |
|
Low |
|
Cash dividends
|
|
||||||
|
|
|
|
|
|
|
|
|
|
|
|
|
|
|
||||||
|
First |
|
$ |
25.16 |
|
$ |
23.71 |
|
$ |
0.18 |
|
$ |
23.34 |
|
$ |
20.00 |
|
$ |
0.17 |
|
|
Second |
|
25.76 |
|
22.50 |
|
0.18 |
|
24.98 |
|
22.88 |
|
0.17 |
|
||||||
|
Third |
|
23.97 |
|
18.06 |
|
0.18 |
|
25.44 |
|
22.99 |
|
0.17 |
|
||||||
|
Fourth |
|
21.24 |
|
18.25 |
|
0.18 |
|
25.20 |
|
23.86 |
|
0.18 |
|
||||||
The following table shows information relating to the repurchase of shares of common stock by Bancorp during the three months ended December 31, 2011.
|
|
|
Total number of
|
|
Average price
|
|
Total number of
|
|
Maximum Number
|
|
|
|
October 1-October 31 |
|
6,078 |
|
$ |
20.40 |
|
— |
|
— |
|
|
November 1-November 30 |
|
11,733 |
|
20.76 |
|
— |
|
— |
|
|
|
December 1-December 31 |
|
648 |
|
20.71 |
|
— |
|
— |
|
|
|
Total |
|
18,459 |
|
$ |
20.64 |
|
— |
|
— |
|
(1) Fourth quarter 2011 activity represents shares surrendered by officers to pay the exercise price of stock options. This activity has no impact on the number of shares that may be purchased under a Board-approved plan.
(2) Since 2008, there has been no active share buyback plan in place.
The following performance graph and data shall not be deemed filed for purposes of Section 18 of the Securities Exchange Act of 1934 or otherwise subject to the liabilities of that section, nor shall it be deemed soliciting material or subject to Regulation 14A of the Exchange Act or incorporated by reference in any filing under the Exchange Act or the Securities Act of 1933, except as shall be expressly set forth by specific reference in such filing.
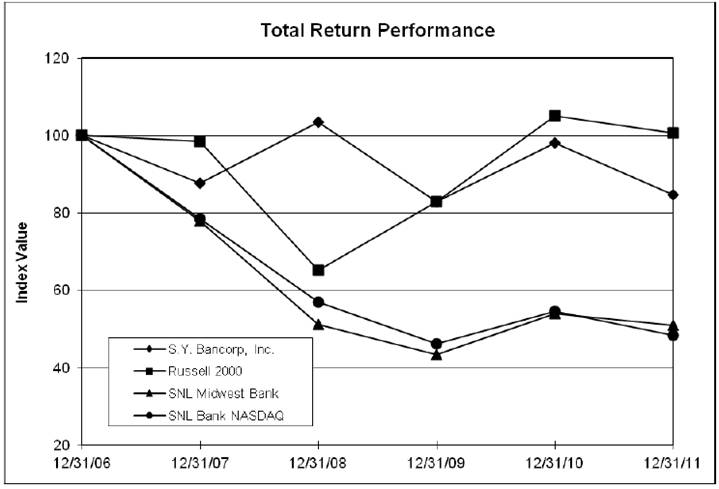
The graph compares the performance of Bancorp Common Stock to the Russell 2000 index, the SNL NASDAQ Bank index and the SNL Midwest Bank index for Bancorp’s last five fiscal years. The graph assumes the value of the investment in Bancorp Common Stock and in each index was $100 at December 31, 2006 and that all dividends were reinvested.
|
|
|
Period Ending |
|
||||||||||
|
Index |
|
12/31/06 |
|
12/31/07 |
|
12/31/08 |
|
12/31/09 |
|
12/31/10 |
|
12/31/11 |
|
|
S.Y. Bancorp, Inc. |
|
100.00 |
|
87.71 |
|
103.54 |
|
82.85 |
|
98.05 |
|
84.75 |
|
|
Russell 2000 Index |
|
100.00 |
|
98.43 |
|
65.18 |
|
82.89 |
|
105.14 |
|
100.75 |
|
|
SNL Midwest Bank Index |
|
100.00 |
|
77.94 |
|
51.28 |
|
43.45 |
|
53.96 |
|
50.97 |
|
|
SNL NASDAQ Bank Index |
|
100.00 |
|
78.51 |
|
57.02 |
|
46.25 |
|
54.57 |
|
48.42 |
|
Item 6. Selected Financial Data
Selected Consolidated Financial Data
|
(Dollars in thousands |
|
Years ended December 31 |
|
|||||||||||||
|
except per share data) |
|
2011 |
|
2010 |
|
2009 |
|
2008 |
|
2007 |
|
|||||
|
|
|
|
|
|
|
|
|
|
|
|
|
|||||
|
Net interest income |
|
$ |
70,732 |
|
$ |
66,879 |
|
$ |
58,675 |
|
$ |
56,858 |
|
$ |
53,691 |
|
|
Provision for loan losses |
|
12,600 |
|
11,469 |
|
12,775 |
|
4,050 |
|
3,525 |
|
|||||
|
Net income |
|
23,604 |
|
22,953 |
|
16,308 |
|
21,676 |
|
24,052 |
|
|||||
|
|
|
|
|
|
|
|
|
|
|
|
|
|||||
|
Per share data |
|
|
|
|
|
|
|
|
|
|
|
|||||
|
Net income, basic |
|
$ |
1.71 |
|
$ |
1.68 |
|
$ |
1.20 |
|
$ |
1.61 |
|
$ |
1.70 |
|
|
Net income, diluted |
|
1.71 |
|
1.67 |
|
1.19 |
|
1.59 |
|
1.67 |
|
|||||
|
Cash dividends declared |
|
0.72 |
|
0.69 |
|
0.68 |
|
0.68 |
|
0.63 |
|
|||||
|
Book value |
|
13.58 |
|
12.37 |
|
11.29 |
|
10.72 |
|
9.78 |
|
|||||
|
Market value |
|
20.53 |
|
24.55 |
|
21.35 |
|
27.50 |
|
23.94 |
|
|||||
|
|
|
|
|
|
|
|
|
|
|
|
|
|||||
|
Average balances |
|
|
|
|
|
|
|
|
|
|
|
|||||
|
Stockholders’ equity |
|
$ |
179,638 |
|
$ |
163,572 |
|
$ |
150,721 |
|
$ |
136,112 |
|
$ |
139,357 |
|
|
Assets |
|
1,959,609 |
|
1,847,452 |
|
1,717,474 |
|
1,567,967 |
|
1,413,614 |
|
|||||
|
Federal Home Loan Bank advances |
|
60,436 |
|
69,159 |
|
80,904 |
|
86,011 |
|
65,699 |
|
|||||
|
Long-term debt |
|
40,900 |
|
40,901 |
|
40,930 |
|
3,361 |
|
93 |
|
|||||
|
|
|
|
|
|
|
|
|
|
|
|
|
|||||
|
Selected ratios |
|
|
|
|
|
|
|
|
|
|
|
|||||
|
Return on average assets |
|
1.20 |
% |
1.24 |
% |
0.95 |
% |
1.38 |
% |
1.70 |
% |
|||||
|
Return on average stockholders’ equity |
|
13.14 |
|
14.03 |
|
10.82 |
|
15.93 |
|
17.26 |
|
|||||
|
Average stockholders’ equity to average assets |
|
9.17 |
|
8.85 |
|
8.78 |
|
8.68 |
|
9.86 |
|
|||||
|
Net interest rate spread |
|
3.79 |
|
3.74 |
|
3.43 |
|
3.60 |
|
3.63 |
|
|||||
|
Net interest rate margin, fully tax-equivalent |
|
3.99 |
|
3.99 |
|
3.74 |
|
3.99 |
|
4.25 |
|
|||||
|
Efficiency ratio |
|
56.47 |
|
56.01 |
|
58.70 |
|
57.27 |
|
54.68 |
|
|||||
|
Non-performing loans to total loans |
|
1.51 |
|
1.28 |
|
0.84 |
|
0.35 |
|
0.28 |
|
|||||
|
Non-performing assets to total assets |
|
1.51 |
|
1.30 |
|
0.77 |
|
0.39 |
|
0.49 |
|
|||||
|
Net charge offs to average loans |
|
0.55 |
|
0.40 |
|
0.59 |
|
0.16 |
|
0.20 |
|
|||||
|
Allowance for loan losses to total loans |
|
1.93 |
|
1.69 |
|
1.39 |
|
1.14 |
|
1.12 |
|
|||||
Financial Section Roadmap
The financial section of this Form 10-K includes management’s discussion and analysis, consolidated financial statements, and the notes to those financial statements. Bancorp has prepared the following summary, or “roadmap,” to assist in your review of the financial section. It is designed to give you an overview of S.Y. Bancorp, Inc. and summarize some of the more important activities and events that occurred during 2011.
Our Business
S.Y. Bancorp, Inc. (Bancorp), incorporated in 1988, has no active business operations. Thus, Bancorp’s business is substantially the same as that of its wholly owned subsidiary, Stock Yards Bank & Trust Company (the Bank). The Bank has operated continuously since it opened in 1904. The Bank conducted business at one location for 85 years and began branching in 1989. At December 31, 2011, the Bank had 25 full service banking locations in the Louisville MSA, two full service banking locations in the Indianapolis MSA, and three full service banking locations in the Cincinnati MSA. In 2011, Bancorp acquired property for one additional location in the Indianapolis market projected to open in the first quarter of 2012. The Bank’s focus on flexible, attentive customer service has been key to its growth and profitability. The wide range of services added by investment management and trust, securities brokerage, and mortgage origination helps support the corporate philosophy of capitalizing on full service customer relationships.
Financial Section Overview
The financial section includes the following:
Management’s discussion and analysis, or MD&A (pages 13 through 42) — provides information as to the analysis of the consolidated financial condition and results of operations of Bancorp. It contains management’s view about industry trends, risks, uncertainties, accounting policies that Bancorp views as critical in light of its business, results of operations including discussion of the key performance drivers, financial position, cash flows, commitments and contingencies, important events, transactions that have occurred over the last three years, and forward-looking information, as appropriate.
Financial statements (pages 43 through 47) — include Consolidated Balance Sheets as of the end of the last two years, and Consolidated Statements of Income, Changes in Stockholders’ Equity, Comprehensive Income, and Cash Flows for each of the last three years. Bancorp’s financial statements are prepared in accordance with US GAAP.
Notes to the financial statements (pages 48 through 84) — provide insight into, and are an integral part of, the financial statements. The notes contain explanations of significant accounting policies, details about certain captions on the financial statements, information about significant events or transactions that have occurred, discussions about legal proceedings, commitments and contingencies, and selected financial information relating to business segments. The notes to the financial statements also are prepared in accordance with US GAAP.
Reports related to the financial statements and internal control over financial reporting (pages 83 through 87) — include the following:
· A report from KPMG LLP, an independent registered public accounting firm, which includes their opinion on the fair presentation of Bancorp’s consolidated financial statements in all material respects based on their audits;
· A report from management indicating Bancorp’s responsibility for financial reporting and the financial statements;
· A report from management indicating Bancorp’s responsibility for the system of internal control over financial reporting, including an assessment of the effectiveness of those controls; and
· A report from KPMG LLP, which includes their opinion on the effectiveness of the Company’s internal control over financial reporting.
Forward-Looking Statements
This report contains forward-looking statements under the Private Securities Litigation Reform Act that involve risks and uncertainties. These forward-looking statements may be identified by the use of words such as “expect”, “anticipate”, “plan”, “foresee” or other words with similar meaning. Although Bancorp believes the assumptions underlying the forward-looking statements contained herein are reasonable, any of these assumptions could be inaccurate. Factors that could cause actual results to differ from results discussed in forward-looking statements include, but are not limited to: economic conditions both generally and more specifically in the markets in which Bancorp and its subsidiaries operate; competition for the Bank’s customers from other providers of financial services; government legislation and regulation which change from time to time and over which Bancorp has no control; changes in interest rates; material unforeseen changes in liquidity, deterioration in the real estate market, results of operations or financial condition of the Bank’s customers; or other risks detailed in Bancorp’s filings with the Securities and Exchange Commission and Item 1A of this Form 10-K all of which are difficult to predict and many of which are beyond the control of Bancorp.
Critical Accounting Policies
Bancorp has prepared the consolidated financial information in this report in accordance with US GAAP. In preparing the consolidated financial statements in accordance with US GAAP, Bancorp makes estimates and assumptions that affect the reported amount of assets and liabilities, disclosure of contingent assets and liabilities at the date of the financial statements, and the reported amounts of revenue and expenses during the reporting period. There can be no assurances that actual results will not differ from those estimates.
Management has identified the accounting policy related to the allowance and provision for loan losses as critical to the understanding of Bancorp’s results of operations and discussed this conclusion with the Audit Committee of the Board of Directors. Since the application of this policy requires significant management assumptions and estimates, it could result in materially different amounts to be reported if conditions or underlying circumstances were to change. Assumptions include many factors such as changes in borrowers’ financial condition which can change quickly or historical loss ratios related to certain loan portfolios which may or may not be indicative of future losses. To the extent that management’s assumptions prove incorrect, the results from operations could be materially affected. The impact and any associated risks related to this policy on Bancorp’s business operations are discussed in the “Allowance for Loan Losses” section below.
Additionally, management has identified the accounting policy related to accounting for income taxes as critical to the understanding of Bancorp’s results of operations and discussed this conclusion with the Audit Committee of the Board of Directors. The objectives of accounting for income taxes are to recognize the amount of taxes payable or refundable for the current year and deferred tax liabilities and assets for the future tax consequences of events that have been recognized in an entity’s financial statements or tax returns. Judgment is required in assessing the future tax consequences of events that have been recognized in Bancorp’s financial statements or tax returns. Fluctuations in the actual outcome of these future tax consequences, including the effects of IRS examinations and examinations by other state agencies, could materially impact Bancorp’s financial position and its results from operations. Additional information regarding income taxes is discussed in the “Income Taxes” section below.
Overview of 2011
The following discussion should be read in conjunction with Bancorp’s consolidated financial statements and accompanying notes and other schedules presented elsewhere in this report.
In 2011, Bancorp completed a year of asset and deposit growth with net income totaling $23,604,000, an increase of 3% over 2010. Increased profitability was primarily due to a decline in interest expense and tax expense, partially offset by higher non-interest expenses. Diluted earnings per share for 2011 increased 2% over 2010 to $1.71, exceeding the highest amount recorded in any prior year.
As is the case with most banks, the primary source of Bancorp’s revenue is net interest income and fees from various financial services provided to customers. Net interest income is the difference between interest
income earned on loans, investment securities and other interest earning assets less interest expense on deposit accounts and other interest bearing liabilities. Loan volume and the interest rates earned on those loans are critical to overall profitability. Similarly deposit volume is crucial to funding loans and rates paid on deposits directly impact profitability. Business volumes are influenced by overall economic factors including market interest rates, business spending, consumer confidence and competitive conditions within the marketplace.
Bancorp’s loan portfolio increased 2% during 2011 to $1.5 billion. Increased loan volume contributed to interest income in 2011, but the increase resulting from volume was offset by declining interest rates on loans and investments over the past year. As a result, interest income for 2011 was essentially level with 2010. Despite significant deposit growth, interest expense declined due to lower funding costs on deposits and borrowings. While rates on earning assets decreased, rates paid on liabilities decreased slightly more, resulting in an increased net interest spread and a stable net interest margin compared to 2010.
The magnitude of its investment management and trust revenue distinguishes Bancorp from other similarly sized community banks, making total non-interest income a continuing key contributor to earnings in 2011. Total non-interest income in 2011 was essentially level with 2010. Income from investment management and trust services, which constitutes an average of 40% of non-interest income, increased 4% for 2011 due to higher asset values and an expanding client base. Trust assets under management rose to $1.74 billion at December 31, 2011, compared to $1.70 billion at December 31, 2010. While fees are based on market values, they typically do not fluctuate directly with the overall stock market. Accounts typically contain fixed income and equity asset classes, which generally react inversely to each other. As a broad approximation, a 10% drop in the S&P 500 index would decrease fees approximately 2 — 4%. Nonrecurring fees such as estate, financial planning, insurance, and some retirement fees are not affected by the fluctuations in the market. In addition, Bancorp experienced increases in bankcard transaction income and brokerage income. Offsetting these increases was a decline in value of Bancorp’s investment in a domestic private investment fund.
Higher non-interest expenses for 2011 resulted from increases in occupancy, data processing expenses, losses on other real estate owned and other expenses, partially offset by decreases in salaries and benefits and FDIC insurance expense. Bancorp’s efficiency ratio for 2011 of 56.5% increased slightly from 56.0% in 2010.
Also affecting 2011 results, Bancorp’s provision for loan losses increased to $12,600,000 compared to $11,469,000 for 2010, in response to Bancorp’s assessment of inherent risk in the loan portfolio. The provision for loan losses is calculated after considering credit quality factors, and ultimately relies on an overall internal analysis of the risk in the loan portfolio. The provision results from an allowance methodology that is driven by risk ratings which reflects the impact on risk ratings resulting from the ongoing economic stress on borrowers witnessed from 2008 through 2011. Management continues to be concerned that the prolonged economic downturn and prospects for uncertain recovery will continue to take a toll on Bancorp’s loan portfolio and underlying collateral values, extending its impact to lending relationships that have to date not been identified. Bancorp’s allowance for loan losses was 1.93% of total loans at December 31, 2011, compared with 1.69% of total loans at December 31, 2010.
Bancorp’s effective tax rate decreased to 25.8% in 2011 from 28.3% in 2010. The decrease in the 2011 effective tax rate was primarily due to an adjustment of approximately $700,000, or $0.05 per share, to Bancorp’s deferred tax assets relating to tax-advantaged investments that Bancorp has made in its primary market area over the years. The lower income tax expense also reflected adjustments to update the Bancorp’s reserve for uncertain tax positions, which was reduced when the statute of limitations expired with the relevant taxing authorities.
Tangible common equity (TCE), a non-GAAP measure, is a measure of a company’s capital which is useful in evaluating the quality and adequacy of capital. It is calculated by subtracting the value of intangible assets and any preferred equity from the book value of Bancorp.
A summary of Bancorp’s TCE ratios at December 31, 2011 and 2010 is shown in the following table.
|
(in thousands, except per share data) |
|
December 31, 2011 |
|
December 31, 2010 |
|
||
|
|
|
|
|
|
|
||
|
Total equity |
|
$ |
187,686 |
|
$ |
169,861 |
|
|
Less goodwill |
|
(682 |
) |
(682 |
) |
||
|
Tangible common equity |
|
187,004 |
|
169,179 |
|
||
|
|
|
|
|
|
|
||
|
Total assets |
|
2,053,097 |
|
1,902,945 |
|
||
|
Less goodwill |
|
(682 |
) |
(682 |
) |
||
|
Total tangible assets |
|
2,052,415 |
|
1,902,263 |
|
||
|
|
|
|
|
|
|
||
|
Tangible common equity ratio |
|
9.11 |
% |
8.89 |
% |
||
|
|
|
|
|
|
|
||
|
Number of outstanding shares |
|
13,819 |
|
13,737 |
|
||
|
|
|
|
|
|
|
||
|
Tangible common equity per share |
|
$ |
13.53 |
|
$ |
12.32 |
|
See “Non-GAAP Financial Measures” for reconcilement of TCE to US GAAP measures.
Challenges for 2012 will include managing credit quality, achieving continued loan growth, and managing increasing regulatory requirements.
· Management continues to be concerned that a continued economic recession will cause a higher level of non-performing loans and potentially lower loan demand, both of which would negatively impact net income. The extended duration of the economic downturn continues to weaken already stressed borrowers. These conditions will likely have an ongoing effect on certain borrowers until overall business and real estate conditions improve. Moreover, should market conditions not improve and foreclosed assets increase significantly, Bancorp’s flexibility to approach collateral sales in an orderly fashion to minimize losses may be reduced and management may be forced to liquidate problem loans more rapidly, thus increasing the loss on these assets.
· To achieve profitability goals for 2012, net loan growth must continue at a pace in excess of 2011. This will be impacted by competition and prevailing economic conditions. Bancorp believes there is an opportunity for growth, and Bancorp’s ability to deliver attractive growth over the long-term is linked to Bancorp’s success in each market.
· The Federal Reserve Board lowered its key short term rate in 2008 to unprecedentedly low levels, and rates have remained low throughout 2009, 2010 and 2011. Indications are that the Federal Reserve will keep short term rates low through late 2014. Approximately 40% of the Bank’s loans are indexed to the prime interest rate and reprice immediately with Federal Reserve rate changes. However, approximately 72% of variable rate loans have reached their contractual floor of 4% or higher, meaning they will not reprice immediately when the prime rate increases. Deposit rates generally do not reprice as quickly as loans. Once rates begin to rise, Bancorp’s net interest margin likely will be negatively affected until the increase exceeds 75 basis points from today’s levels.
· Bancorp expects net interest margin to be fairly consistent in 2012 with the level achieved in the fourth quarter of 2011 as rates are expected to be largely unchanged through the fourth quarter of 2012. This would result in a net interest margin for 2012 similar to the level seen in 2011. Increased deposit and loan rate competition could negatively impact this expectation, as could a decrease in longer term interest rates.
· Bancorp expects a decrease in non-interest income for 2012 in gains on sales of mortgage loans held for sale, as Bancorp does not expect the volume of refinance activity to continue at the pace experienced from 2009 through 2011. Bancorp expects year-over-year increases in non-interest expense including personnel and occupancy expenses as it opened a new operations center and renovated the main office complex in 2011, and expects to add an additional branch location in 2012.
· Bancorp anticipates higher non-interest expenses to meet the ongoing and increasing burden of additional regulatory requirements.
The following sections provide more details on subjects presented in this overview.
Results of Operations
Net income was $23,604,000 or $1.71 per share on a diluted basis for 2011 compared to $22,953,000 or $1.67 per share for 2010 and $16,308,000 or $1.19 per share for 2009. Net income for 2011 was positively impacted by:
· A 6% or $3.9 million increase in net interest income.
· A 10% or $0.8 million decrease in income tax expense
Net income for 2011 was negatively impacted by:
· A 10% or $1.1 million increase in provision for loan losses.
· A 1% or $0.5 million decrease in non-interest income.
· A 4% or $2.5 million increase in non-interest expenses.
The following paragraphs provide a more detailed analysis of the significant factors affecting operating results.
Net Interest Income
Net interest income, the most significant component of Bancorp’s earnings, represents total interest income less total interest expense. Net interest spread is the difference between the taxable equivalent rate earned on average interest earning assets and the rate expensed on average interest bearing liabilities. Net interest margin represents net interest income on a taxable equivalent basis as a percentage of average earning assets. Net interest margin is affected by both the interest rate spread and the level of non-interest bearing sources of funds. The level of net interest income is determined by the mix and volume of interest earning assets, interest bearing deposits and interest bearing liabilities and by changes in interest rates. The discussion that follows is based on tax-equivalent interest data.
Comparative information regarding net interest income follows:
|
|
|
|
|
|
|
|
|
2011/2010 |
|
2010/2009 |
|
|||
|
(Dollars in thousands) |
|
2011 |
|
2010 |
|
2009 |
|
Change |
|
Change |
|
|||
|
|
|
|
|
|
|
|
|
|
|
|
|
|||
|
Net interest income, tax-equivalent basis |
|
$ |
72,262 |
|
$ |
68,264 |
|
$ |
59,729 |
|
5.9 |
% |
14.3 |
% |
|
Net interest spread |
|
3.79 |
% |
3.74 |
% |
3.43 |
% |
5 |
bp |
31 |
bp |
|||
|
Net interest margin |
|
3.99 |
% |
3.99 |
% |
3.74 |
% |
0 |
bp |
25 |
bp |
|||
|
Average earning assets |
|
$ |
1,809,043 |
|
$ |
1,712,173 |
|
$ |
1,596,989 |
|
5.7 |
% |
7.2 |
% |
|
Five year Treasury bond rate at year end |
|
0.83 |
% |
2.02 |
% |
2.69 |
% |
(119 |
)bp |
(67 |
)bp |
|||
|
Average five year |
|
|
|
|
|
|
|
|
|
|
|
|||
|
Treasury bond rate |
|
1.50 |
% |
1.91 |
% |
2.19 |
% |
(41 |
)bp |
(28 |
)bp |
|||
|
Prime rate at year end |
|
3.25 |
% |
3.25 |
% |
3.25 |
% |
0 |
bp |
0 |
bp |
|||
|
Average prime rate |
|
3.25 |
% |
3.25 |
% |
3.25 |
% |
0 |
bp |
0 |
bp |
|||
bp = basis point = 1/100th of a percent
All references above to net interest margin consistently apply a revised methodology for calculating net interest margin and net interest spread, implemented in the fourth quarter of 2011, and applied to all years presented herein, to exclude participation loans sold from the calculations. Such loans remain on Bancorp’s balance sheet as required by generally accepted accounting principles because Bancorp retains some form of effective control; however, Bancorp receives no interest income on the sold portion of these loans. Under its revised methodology, these participation loans sold are excluded in the calculation of margins, which, in Bancorp’s view, provides a more accurate determination of the performance of its loan portfolio.
Prime rate and the five year Treasury bond rate are included above to provide a general indication of the interest rate environment in which the Bank operated. Approximately $618 million, or 40%, of the Bank’s loans are variable rate; most of these loans are indexed to the prime rate and may reprice as that rate changes. However, approximately $441 million, or 72% of variable rate loans, have reached their contractual floor of 4% or higher. Approximately $75 million or 12% of variable rate loans have contractual floors below 4%. The remaining $102 million or 16% of variable rate loans have no contractual floor. The Bank intends to establish floors whenever possible upon renewal of the loans. The Bank’s variable rate loans are primarily comprised of commercial lines of credit and real estate loans. At inception, most of the Bank’s fixed rate loans are priced in relation to the five year Treasury bond.
Average loan balances increased $55 million or 3.8% in 2011; however, the declining interest rate environment drove average loan yields lower by 21 basis points. Bancorp grew average interest bearing deposits $54 million or 4.4%. Average interest costs on interest bearing deposits decreased 29 basis points, again reflecting the declining interest rate market and a more favorable mix of deposits. Average Federal Home Loan Bank (“FHLB”) advances decreased by $8.7 million or 12.6%, with average rates decreasing by 86 basis points. Rate changes, combined with volume changes on loans and deposits, resulted in a relatively stable net interest income and net interest margin for 2011 compared to 2010.
Management anticipates a stable prime rate for 2012. Time deposit maturities of approximately $144 million, or 35% of total time deposits, in the first two quarters could spark slight improvement in interest expense. However, this will be offset by declining overall rates in the loan portfolio as persistent low prevailing rates are expected to erode the overall yield on loans and investments. The margin could be impacted negatively if competition causes increases in deposit rates or a decline in loan pricing in Bancorp’s markets.
Asset/Liability Management and Interest Rate Risk
Managing interest rate risk is fundamental for the financial services industry. The primary objective of interest rate risk management is to neutralize effects of interest rate changes on net income. By considering both on and off-balance sheet financial instruments, management evaluates interest rate sensitivity while attempting to optimize net interest income within the constraints of prudent capital adequacy, liquidity needs, market opportunities and customer requirements.
Interest Rate Simulation Sensitivity Analysis
Bancorp uses an earnings simulation model to estimate and evaluate the impact of an immediate change in interest rates on earnings in a one year forecast. The simulation model is designed to reflect the dynamics of interest earning assets, interest bearing liabilities and off-balance sheet financial instruments. By estimating the effects of interest rate increases and decreases, the model can reveal approximate interest rate risk exposure. The simulation model is used by management to gauge approximate results given a specific change in interest rates at a given point in time. The model is therefore a tool to indicate earnings trends in given interest rate scenarios and does not indicate actual expected results.
The December 31, 2011 simulation analysis, which shows very little interest rate sensitivity, indicates that an increase in interest rates of 100 to 200 basis points would have a slightly negative effect on net interest income, and a decrease of 100 basis points in interest rates would have a slightly positive effect on net interest income. These estimates are summarized below.
|
|
|
Net interest
|
|
|
|
|
|
|
|
Increase 200 bp |
|
(0.51 |
) |
|
Increase 100 bp |
|
(1.70 |
) |
|
Decrease 100 bp |
|
0.01 |
|
|
Decrease 200 bp |
|
N/A |
|
Loans indexed to the prime rate, with floors of 4% or higher, comprise approximately 30% of total loans. Since the prime rate is currently 3.25%, rates would have to increase more than 75 bp before the rates on such loans will rise. This effect, captured in the simulation analysis above, negatively impacts the effect of rising rates. Analysis of rates increasing 300 bp or higher indicates a positive effect on net interest income.
The scenario of rates decreasing 200 bp is not reasonably possible given current low rates for short-term instruments and most deposits.
Undesignated derivative instruments described in Note 20 are recognized on the consolidated balance sheet at fair value, with changes in fair value, due to changes in prevailing interest rates, recorded in other non-interest income. Because of matching terms of offsetting contracts, in addition to collateral provisions which mitigate the impact of non-performance risk, changes in fair value subsequent to initial recognition have a minimal effect on earnings, and are therefore not included in the simulation analysis results above.
The following table presents the increases in net interest income due to changes in rate and volume computed on a tax-equivalent basis and indicates how net interest income in 2011 and 2010 was impacted by volume increases and the lower average interest rate environment. The tax-equivalent adjustments are based on a 35% federal tax rate. The change in interest due to both rate and volume has been allocated to the change due to rate and the change due to volume in proportion to the relationship of the absolute dollar amounts of the change in each.
Taxable Equivalent Rate/Volume Analysis
|
|
|
2011/2010 |
|
2010/2009 |
|
||||||||||||||
|
|
|
Increase (decrease) |
|
Increase (decrease) |
|
||||||||||||||
|
|
|
due to |
|
due to |
|
||||||||||||||
|
(In thousands) |
|
Net change |
|
Rate |
|
Volume |
|
Net change |
|
Rate |
|
Volume |
|
||||||
|
|
|
|
|
|
|
|
|
|
|
|
|
|
|
||||||
|
Interest income |
|
|
|
|
|
|
|
|
|
|
|
|
|
||||||
|
Loans |
|
$ |
(69 |
) |
$ |
(3,048 |
) |
$ |
2,979 |
|
$ |
2,615 |
|
$ |
(1,610 |
) |
$ |
4,225 |
|
|
Federal funds sold |
|
117 |
|
36 |
|
81 |
|
59 |
|
28 |
|
31 |
|
||||||
|
Mortgage loans held for sale |
|
(108 |
) |
(34 |
) |
(74 |
) |
(50 |
) |
(34 |
) |
(16 |
) |
||||||
|
Securities |
|
|
|
|
|
|
|
|
|
|
|
|
|
||||||
|
Taxable |
|
(100 |
) |
(84 |
) |
(16 |
) |
(104 |
) |
(666 |
) |
562 |
|
||||||
|
Tax-exempt |
|
198 |
|
(428 |
) |
626 |
|
101 |
|
(327 |
) |
428 |
|
||||||
|
|
|
|
|
|
|
|
|
|
|
|
|
|
|
||||||
|
Total interest income |
|
38 |
|
(3,558 |
) |
3,596 |
|
2,621 |
|
(2,609 |
) |
5,230 |
|
||||||
|
|
|
|
|
|
|
|
|
|
|
|
|
|
|
||||||
|
Interest expense |
|
|
|
|
|
|
|
|
|
|
|
|
|
||||||
|
Deposits |
|
|
|
|
|
|
|
|
|
|
|
|
|
||||||
|
Interest bearing demand deposits |
|
118 |
|
51 |
|
67 |
|
18 |
|
(29 |
) |
47 |
|
||||||
|
Savings deposits |
|
(54 |
) |
(65 |
) |
11 |
|
46 |
|
19 |
|
27 |
|
||||||
|
Money market deposits |
|
(649 |
) |
(1,011 |
) |
362 |
|
685 |
|
(86 |
) |
771 |
|
||||||
|
Time deposits |
|
(2,480 |
) |
(1,745 |
) |
(735 |
) |
(5,580 |
) |
(4,102 |
) |
(1,478 |
) |
||||||
|
Securities sold under agreements to repurchase |
|
(79 |
) |
(105 |
) |
26 |
|
61 |
|
29 |
|
32 |
|
||||||
|
Federal funds purchased and other short-term borrowings |
|
(7 |
) |
(4 |
) |
(3 |
) |
(18 |
) |
(15 |
) |
(3 |
) |
||||||
|
Federal Home Loan |
|
|
|
|
|
|
|
|
|
|
|
|
|
||||||
|
Bank advances |
|
(806 |
) |
(545 |
) |
(261 |
) |
(1,075 |
) |
(631 |
) |
(444 |
) |
||||||
|
Long-term debt |
|
(3 |
) |
(3 |
) |
— |
|
(51 |
) |
(49 |
) |
(2 |
) |
||||||
|
|
|
|
|
|
|
|
|
|
|
|
|
|
|
||||||
|
Total interest expense |
|
(3,960 |
) |
(3,427 |
) |
(533 |
) |
(5,914 |
) |
(4,864 |
) |
(1,050 |
) |
||||||
|
|
|
|
|
|
|
|
|
|
|
|
|
|
|
||||||
|
Net interest income |
|
$ |
3,998 |
|
$ |
(131 |
) |
$ |
4,129 |
|
$ |
8,535 |
|
$ |
2,255 |
|
$ |
6,280 |
|
Bancorp’s tax equivalent net interest income increased $4.0 million for the year ended December 31, 2011 compared to the same period of 2010 while 2010 increased $8.5 million compared to 2009. Net interest income for 2011 compared to 2010 was positively impacted by an increase in loan and securities volume and a decrease in deposit and other borrowing rates, a more favorable mix of deposits, and the volume of interest-bearing liabilities. Net interest income was negatively impacted by a decline in the average rate earned on assets. Loan volume increases boosted net interest income by $3.0 million and declining rates on deposits, particularly time deposits, contributed $2.8 million to the increase of net interest income. Partially offsetting the increases, declining rates on loans negatively impacted net interest income by $3.0 million.
For the year 2010 compared to 2009, loan interest income increased $2.6 million. This is the net effect of a $4.2 million increase attributable to loan growth, offset by a $1.6 million decrease attributed to lower rates on loans. Lower rates on deposits resulted in a decreased interest expense of $4.2 million, and lower volumes of liabilities resulted in decreased interest expense of $1.1 million.
Provision for Loan Losses
In determining the provision for loan losses, management considers many factors. Among these are the quality and underlying collateral of the loan portfolio, previous loss experience, the size and composition of the loan portfolio and an assessment of the impact of current economic conditions on borrowers’ ability to pay. The provision for loan losses and resulting ratios is summarized below:
|
(Dollars in thousands) |
|
2011 |
|
2010 |
|
2009 |
|
|||
|
|
|
|
|
|
|
|
|
|||
|
Provision for loan losses |
|
$ |
12,600 |
|
$ |
11,469 |
|
$ |
12,775 |
|
|
Allowance to loans at year end |
|
1.93 |
% |
1.69 |
% |
1.39 |
% |
|||
|
Allowance to average loans for year |
|
1.94 |
% |
1.74 |
% |
1.44 |
% |
|||
The provision for loan losses is determined by Bancorp’s assessment of inherent risk in the loan portfolio. The provision for loan losses is calculated after considering credit quality factors, and ultimately relies on an overall internal analysis of the risk in the loan portfolio. The provision reflects an allowance methodology that is driven by risk ratings, and reflected the impact of downgrading various loans’ status due to the ongoing economic stress on borrowers witnessed from 2008 through 2011. Bancorp intends to continue with its historically conservative stance toward credit quality, remaining cautious in assessing the potential risk in the loan portfolio.
Non-performing loans increased from $19.3 million at year-end 2010 to $23.3 million at December 31, 2011. The ratio of non-performing loans to total loans was 1.51% at December 31, 2011, up from 1.28% at December 31, 2010. Net charge-offs totaled 0.55% of average loans at year-end 2011, up from 0.40% at year-end 2010. The increase in non-performing loans, including non-accrual loans, in 2011 reflected the reclassification of several unrelated loans to non-performing status due to ongoing economic stress on borrowers. While Bancorp’s metrics for net charge-offs and non-performing loans remain at relatively low levels compared to the banking industry, management continues to be concerned that a prolonged recession will place additional pressure on credit quality and result in an increase in the level of non-performing loans. See “Financial Condition-Non-performing Loans and Assets” for further discussion of non-performing loans. See “Financial Condition-Summary of Loan Loss Experience” for further discussion of loans charged off during the year.
The Bank’s loan portfolio is diversified with no significant concentrations of credit. Geographically, most loans are extended to borrowers in the metropolitan areas of Louisville, Indianapolis and Cincinnati. The adequacy of the allowance is monitored on an ongoing basis and it is the opinion of management that the balance of the allowance for loan losses at December 31, 2011 is adequate to absorb probable losses inherent in the loan portfolio as of the financial statement date. See “Financial Condition-Allowance for Loan Losses” for more information on the allowance for loan losses.
Non-Interest Income and Non-Interest Expenses
The following table provides a comparison of the components of non-interest income for 2011, 2010 and 2009. The table shows the dollar and percentage change from 2010 to 2011 and from 2009 to 2010. Below the table is a discussion of significant changes and trends.
|
|
|
|
|
|
|
|
|
2011/2010 |
|
2010/2009 |
|
|||||||||
|
(Dollars in thousands) |
|
2011 |
|
2010 |
|
2009 |
|
Change |
|
% |
|
Change |
|
% |
|
|||||
|
|
|
|
|
|
|
|
|
|
|
|
|
|
|
|
|
|||||
|
Investment management and trust services |
|
$ |
13,841 |
|
$ |
13,260 |
|
$ |
11,180 |
|
$ |
581 |
|
4.4 |
% |
$ |
2,080 |
|
18.6 |
% |
|
Service charges on deposit acccounts |
|
8,348 |
|
8,600 |
|
8,531 |
|
(252 |
) |
(2.9 |
) |
69 |
|
0.8 |
|
|||||
|
Bankcard transaction revenue |
|
3,722 |
|
3,313 |
|
2,909 |
|
409 |
|
12.3 |
|
404 |
|
13.9 |
|
|||||
|
Gain on sales of mortgage loans held for sale |
|
2,122 |
|
2,321 |
|
2,163 |
|
(199 |
) |
(8.6 |
) |
158 |
|
7.3 |
|
|||||
|
Gain (loss) on sales of securities available for sale |
|
— |
|
159 |
|
(339 |
) |
(159 |
) |
(100.0 |
) |
498 |
|
(146.9 |
) |
|||||
|
Brokerage commissions and fees |
|
2,219 |
|
2,136 |
|
1,749 |
|
83 |
|
3.9 |
|
387 |
|
22.1 |
|
|||||
|
Bank owned life insurance income |
|
1,019 |
|
995 |
|
988 |
|
24 |
|
2.4 |
|
7 |
|
0.7 |
|
|||||
|
Other |
|
1,973 |
|
2,955 |
|
2,855 |
|
(982 |
) |
(33.2 |
) |
100 |
|
3.5 |
|
|||||
|
|
|
|
|
|
|
|
|
|
|
|
|
|
|
|
|
|||||
|
|
|
$ |
33,244 |
|
$ |
33,739 |
|
$ |
30,036 |
|
$ |
(495 |
) |
(1.5 |
)% |
$ |
3,703 |
|
12.3 |
% |
Total non-interest income decreased 1.5% for the year ended December 31, 2011 compared to 2010. The largest component of non-interest income is investment management and trust revenue. Along with the effects of improving investment market conditions in 2010 and 2011, this area of the Bank continued to grow through attraction of new business and retention of existing business, despite normal attrition. Trust assets under management totaled $1.74 billion at December 31, 2011, compared to $1.70 billion at December 31, 2010. Most recurring fees earned for managing accounts are based on a percentage of market value on a monthly basis. Some revenues of the investment management and trust department, most notably executor, insurance, and some employee benefit plan-related fees, are non-recurring in nature and the timing of these revenues corresponds with the related administrative activities. For 2011, 2010 and 2009 executor fees totaled approximately $362,000, $668,000 and $225,000, respectively.
Service charges on deposit accounts decreased $252,000 or 2.9%, for the year ended December 31, 2011 compared to the same period a year ago. Service charge income is driven by transaction volume, which can fluctuate throughout the year. Recent legislation required that Bancorp’s customers “opt in” to access their overdraft protection beginning in the third quarter of 2010. Management believes this requirement has resulted in fewer overdrafts and a corresponding decline in service charge income in 2011.
Bankcard transaction revenue increased $409,000 or 12.3% in 2011 compared to 2010 and primarily represents income the Bank derives from customers’ use of debit cards. Results in 2011 compared favorably to 2010 as bankcard transaction volume continued to increase. Most of this revenue is interchange income based on rates set by service providers in a competitive market. Beginning in October 2011, this rate was set by the Federal Reserve Board for banks with over $10 billion in assets. While this threshold indicates Bancorp will not be directly affected, it appears this change will indirectly affect Bancorp as vendors continue to push for lower fees to be paid to all banks. While there are many uncertainties about its effect or ultimately when these changes may take place, the Dodd-Frank legislation may negatively affect this source of income.
The Bank’s mortgage banking division originates residential mortgage loans to be sold in the secondary market. Interest rates on the loans sold are locked with the borrower and investor prior to closing the loans,
thus Bancorp bears no interest rate risk related to these loans. The division offers conventional, VA and FHA financing, for purchases and refinances, as well as programs for low-income and first time home buyers. The mortgage banking division also offers home equity conversion or “reverse” mortgages. Gains on sales of mortgage loans decreased $199,000, or 8.6%, in 2011 compared to 2010. Interest rates on mortgage loans directly impact the volume of business transacted by the mortgage banking division. Prevailing mortgage interest rates decreased during late 2011 and as a result refinance volume increased late in the year.
Bancorp had no gains on securities available for sale in 2011, compared to $159,000 for 2010. In 2010, for tax planning purposes, Bancorp sold securities with a cost of $26,905,000, resulting in gains totaling $159,000. In 2009, Bancorp sold trust preferred securities, generating a loss of $359,000, and mortgage-backed securities, generating gains of $20,000.
Brokerage commissions and fees earned consist primarily of stock, bond and mutual fund sales as well as wrap fees on accounts. Wrap fees are charges for investment programs that bundle together a suite of services, such as brokerage, advisory, research, and management, and are charged a fee based on a percentage of assets. Total securities brokerage fees increased $83,000 or 3.9% for 2011 compared to the prior year corresponding to higher overall brokerage volume. Bancorp deploys its brokers primarily through its branch network, while larger managed accounts are serviced in the investment management and trust department.
Income related to bank-owned life insurance (“BOLI”) was $1,019,000 in 2011 compared to $995,000 for 2010. BOLI represents the cash surrender value for life insurance policies on certain key employees who have provided consent for the Bank to be the beneficiary of a portion of such policies. The related change in cash surrender value and proceeds received under the policies, none of which have occurred to date, are recorded as non-interest income. This income helps offset the cost of employee benefits.
Other non-interest income decreased $982,000, or 33.2%, during 2011 compared to 2010 primarily due to a decrease of the value of a domestic private investment fund. Bancorp’s investment in a domestic private investment fund is comprised of bank and other financial industry securities and is accounted for in accordance with FASB ASC 323-10 “Investments — Equity Method and Joint Ventures”. The value of Bancorp’s investment decreased by $404,000 in 2011, compared to an increase of $606,000 in 2010. Primarily because of income statement related volatility, management has chosen to liquidate its investment in this fund and expects this to occur by March 31, 2012. Other non-interest income increased in 2010 compared to 2009 as a result of an increase in the value of the domestic private investment fund, partially offset by decreases in fees related to mortgage banking, combined with a variety of factors none of which are individually significant.
The following table provides a comparison of the components of non-interest expenses for 2011, 2010 and 2009. The table shows the dollar and percentage change from 2010 to 2011 and from 2009 to 2010. Below the table is a discussion of significant changes and trends.
|
|
|
|
|
|
|
|
|
2011/2010 |
|
2010/2009 |
|
|||||||||
|
(Dollars in thousands) |
|
2011 |
|
2010 |
|
2009 |
|
Change |
|
% |
|
Change |
|
% |
|
|||||
|
|
|
|
|
|
|
|
|
|
|
|
|
|
|
|
|
|||||
|
Salaries and employee benefits |
|
$ |
33,125 |
|
$ |
33,485 |
|
$ |
30,147 |
|
$ |
(360 |
) |
(1.1 |
)% |
$ |
3,338 |
|
11.1 |
% |
|
Net occupancy expense |
|
5,192 |
|
4,934 |
|
4,185 |
|
258 |
|
5.2 |
|
749 |
|
17.9 |
|
|||||
|
Data processing expense |
|
5,014 |
|
4,834 |
|
4,479 |
|
180 |
|
3.7 |
|
355 |
|
7.9 |
|
|||||
|
Furniture and equipment expense |
|
1,299 |
|
1,272 |
|
1,234 |
|
27 |
|
2.1 |
|
38 |
|
3.1 |
|
|||||
|
FDIC insurance |
|
1,655 |
|
2,038 |
|
2,687 |
|
(383 |
) |
(18.8 |
) |
(649 |
) |
(24.2 |
) |
|||||
|
Losses (gains) on other real estate owned |
|
1,716 |
|
(11 |
) |
— |
|
1,727 |
|
* |
|
(11 |
) |
(100.0 |
) |
|||||
|
Other |
|
11,580 |
|
10,579 |
|
9,963 |
|
1,001 |
|
9.5 |
|
616 |
|
6.2 |
|
|||||
|
|
|
|
|
|
|
|
|
|
|
|
|
|
|
|
|
|||||
|
|
|
$ |
59,581 |
|
$ |
57,131 |
|
$ |
52,695 |
|
$ |
2,450 |
|
4.3 |
% |
$ |
4,436 |
|
8.4 |
% |
* Ratio exceeds 100%
Salaries and benefits are the largest component of non-interest expenses and decreased $360,000 or 1.1% for 2011 compared to 2010, primarily due to decreases in performance-based incentive accruals. At December 31, 2011, the Bank had 480 full-time equivalent employees compared to 475 at the same date in 2010 and 470 for 2009.
Net occupancy expense increased $258,000 or 5.2% from 2010 to 2011, primarily due to an increase in depreciation expense, much of which is attributable to the new operations center location opened in 2011. The Bank opened no new branch locations in 2011, after opening two new locations in 2010. At December 31, 2011 the Bank had thirty banking center locations including the main office.
Data processing expense increased $180,000 or 3.7% largely due to increased computer equipment depreciation and higher costs for processing debit cards as volume increased.
Furniture and equipment expense increased $27,000 or 2.1% in 2011, as compared to 2010, due to a variety of factors, none of which is individually significant. Costs of capital asset additions flow through the statement of income over the lives of the assets in the form of depreciation expense.
FDIC insurance expense decreased $383,000, or 18.8% for the year ended December 31, 2011, as compared to the same period in 2010. The decrease is due to a change in the base on which the assessment is calculated and lower assessment rates in 2011.
Losses on other real estate owned (OREO) totaled $1,716,000 for the year ended December 31, 2011, compared to gains totaling $11,000 for the same period in 2010. In 2011, Bancorp recorded write-downs on OREO intended to position Bancorp to move those properties more quickly from the balance sheet.
Other non-interest expenses increased $1,001,000, or 9.5% for the year ended December 31, 2011 compared to the same period of 2010. The increases included a $380,000 write-down of fixed assets related to a building renovation, and an increase of $395,000 in donations. In addition, bank franchise taxes increased $407,000 from 2010 to 2011. Also included in this category are amortization expenses related to mortgage servicing rights (MSRs). Mortgage volume increased the amount of MSRs over 2010 and 2011, resulting in a corresponding increase of MSR amortization of $198,000 in 2011 compared to 2010. Offsetting the increases in 2011 were decreases of $254,000 in professional fees and a variety of factors including advertising, printing, mail and telecommunications, none of which is individually significant.
Income Taxes
A three year comparison of income tax expense and effective tax rate follows:
|
(Dollars in thousands) |
|
2011 |
|
2010 |
|
2009 |
|
|||
|
|
|
|
|
|
|
|
|
|||
|
Income tax expense |
|
$ |
8,191 |
|
$ |
9,065 |
|
$ |
6,933 |
|
|
Effective tax rate |
|
25.8 |
% |
28.3 |
% |
29.8 |
% |
|||
The decrease in the income tax expense and the effective tax rate primarily reflected an adjustment of approximately $700,000 to the Company’s deferred tax assets relating to tax-advantaged investments that the Company has made in its primary market area over the years. The lower income tax expense also reflected adjustments to update the Company’s reserve for uncertain tax positions, which was reduced when the statute of limitations expired with the relevant taxing authorities. For more information regarding income taxes and the effective tax rate see Note 7 to Bancorp’s consolidated financial statements.
Financial Condition
Earning Assets and Interest Bearing Liabilities
Summary information with regard to Bancorp’s financial condition follows:
|
|
|
|
|
|
|
|
|
2011/2010 |
|
2010/2009 |
|
|||||||||
|
(Dollars in thousands) |
|
2011 |
|
2010 |
|
2009 |
|
Change |
|
% |
|
Change |
|
% |
|
|||||
|
|
|
|
|
|
|
|
|
|
|
|
|
|
|
|
|
|||||
|
Average earning assets |
|
$ |
1,809,043 |
|
$ |
1,712,173 |
|
$ |
1,596,989 |
|
$ |
96,870 |
|
5.7 |
% |
$ |
115,184 |
|
7.2 |
% |
|
Average interest bearing liabilities |
|
1,456,866 |
|
1,408,593 |
|
1,330,228 |
|
48,273 |
|
3.4 |
|
78,365 |
|
5.9 |
|
|||||
|
Average total assets |
|
1,959,609 |
|
1,847,452 |
|
1,717,474 |
|
112,157 |
|
6.1 |
|
129,978 |
|
7.6 |
|
|||||
|
Total year end assets |
|
2,053,097 |
|
1,902,945 |
|
1,791,479 |
|
150,152 |
|
7.9 |
% |
111,466 |
|
6.2 |
% |
|||||
The Bank has experienced modest growth in earning assets over the last several years primarily in the area of loans. From 2010 to 2011, average loans increased 3.8%, or $54.7 million, while average securities increased $14.5 million, or 7.3%. Much of loan growth is attributed to industrial and multi-family properties and healthcare facility loans. The Bank continues to target private banking clientele as having attractive growth potential. These relationships afford loan growth and bring opportunities to provide full-service financial relationships as well as provide personal financial services to the business owners. During 2010, average loans increased 5.5% with growth being primarily from industrial and multi-family properties.
Average total interest bearing accounts increased 4.4% and non-interest bearing accounts increased 17.7% in 2011. The increase in average interest bearing liabilities from 2010 to 2011 occurred primarily in money market and demand deposits as clients have excess cash and few investment alternatives in the current environment. Time deposits decreased 8.4% or $38.5 million in 2011, as Bancorp intentionally did not renew higher cost deposits. Bancorp continued to utilize fixed rate advances from the FHLB during 2011 as they compared favorably to similar term time deposits. Bancorp had an average of $60.4 million in outstanding FHLB advances in 2011 compared to $69.2 million and $80.9 million in 2010 and 2009, respectively. In the fourth quarter of 2010, Bancorp restructured and extended terms on two advances totaling $30 million with the FHLB, resulting in lower interest cost over the remaining term of these advances.
In 2009, Bancorp began a correspondent banking division to offer participation loans, deposit services, international services, investment management and trust services, holding company loans, and other services to community banks across Kentucky and southern Indiana. At December 31, 2011 and 2010, federal funds purchased from correspondent banks totaled $17.3 million and $22.0 million, respectively.
Average Balances and Interest Rates — Taxable Equivalent Basis
|
|
|
Year 2011 |
|
Year 2010 |
|
Year 2009 |
|
||||||||||||||||||
|
(Dollars in thousands) |
|
Average
|
|
Interest |
|
Average
|
|
Average
|
|
Interest |
|
Average
|
|
Average
|
|
Interest |
|
Average
|
|
||||||
|
|
|
|
|
|
|
|
|
|
|
|
|
|
|
|
|
|
|
|
|
||||||
|
Earning assets |
|
|
|
|
|
|
|
|
|
|
|
|
|
|
|
|
|
|
|
||||||
|
Federal funds sold |
|
$ |
86,600 |
|
$ |
255 |
|
0.29 |
% |
$ |
57,433 |
|
$ |
138 |
|
0.24 |
% |
$ |
42,759 |
|
$ |
79 |
|
0.18 |
% |
|
Mortgage loans held for sale |
|
5,394 |
|
231 |
|
4.28 |
% |
7,069 |
|
339 |
|
4.80 |
% |
7,385 |
|
389 |
|
5.27 |
% |
||||||
|
Securities |
|
|
|
|
|
|
|
|
|
|
|
|
|
|
|
|
|
|
|
||||||
|
Taxable |
|
163,230 |
|
4,954 |
|
3.03 |
% |
163,945 |
|
5,057 |
|
3.08 |
% |
147,601 |
|
5,164 |
|
3.50 |
% |
||||||
|
Tax-exempt |
|
50,644 |
|
1,903 |
|
3.76 |
% |
35,438 |
|
1,705 |
|
4.81 |
% |
27,230 |
|
1,604 |
|
5.89 |
% |
||||||
|
FHLB stock |
|
5,900 |
|
220 |
|
3.73 |
% |
5,717 |
|
217 |
|
3.80 |
% |
5,138 |
|
214 |
|
4.17 |
% |
||||||
|
Loans, net of unearned income |
|
1,497,275 |
|
80,006 |
|
5.34 |
% |
1,442,571 |
|
80,075 |
|
5.55 |
% |
1,366,876 |
|
77,460 |
|
5.67 |
% |
||||||
|
|
|
|
|
|
|
|
|
|
|
|
|
|
|
|
|
|
|
|
|
||||||
|
Total earning assets |
|
1,809,043 |
|
87,569 |
|
4.84 |
% |
1,712,173 |
|
87,531 |
|
5.11 |
% |
1,596,989 |
|
84,910 |
|
5.32 |
% |
||||||
|
|
|
|
|
|
|
|
|
|
|
|
|
|
|
|
|
|
|
|
|
||||||
|
Less allowance for loan losses |
|
27,950 |
|
|
|
|
|
23,085 |
|
|
|
|
|
17,688 |
|
|
|
|
|
||||||
|
|
|
1,781,093 |
|
|
|
|
|
1,689,088 |
|
|
|
|
|
1,579,301 |
|
|
|
|
|
||||||
|
|
|
|
|
|
|
|
|
|
|
|
|
|
|
|
|
|
|
|
|
||||||
|
Non-earning assets |
|
|
|
|
|
|
|
|
|
|
|
|
|
|
|
|
|
|
|
||||||
|
Cash and due from banks |
|
27,240 |
|
|
|
|
|
26,990 |
|
|
|
|
|
25,690 |
|
|
|
|
|
||||||
|
Premises and equipment |
|
34,589 |
|
|
|
|
|
29,349 |
|
|
|
|
|
28,034 |
|
|
|
|
|
||||||
|
Accrued interest receivable and other assets |
|
116,687 |
|
|
|
|
|
102,025 |
|
|
|
|
|
84,449 |
|
|
|
|
|
||||||
|
|
|
|
|
|
|
|
|
|
|
|
|
|
|
|
|
|
|
|
|
||||||
|
Total assets |
|
$ |
1,959,609 |
|
|
|
|
|
$ |
1,847,452 |
|
|
|
|
|
$ |
1,717,474 |
|
|
|
|
|
|||
|
|
|
Year 2011 |
|
Year 2010 |
|
Year 2009 |
|
||||||||||||||||||
|
(Dollars in thousands) |
|
Average
|
|
Interest |
|
Average
|
|
Average
|
|
Interest |
|
Average
|
|
Average
|
|
Interest |
|
Average
|
|
||||||
|
|
|
|
|
|
|
|
|
|
|
|
|
|
|
|
|
|
|
|
|
||||||
|
Interest bearing liabilities |
|
|
|
|
|
|
|
|
|
|
|
|
|
|
|
|
|
|
|
||||||
|
Deposits |
|
|
|
|
|
|
|
|
|
|
|
|
|
|
|
|
|
|
|
||||||
|
Interest bearing demand deposits |
|
$ |
281,566 |
|
$ |
600 |
|
0.21 |
% |
$ |
248,626 |
|
$ |
482 |
|
0.19 |
% |
$ |
224,805 |
|
$ |
464 |
|
0.21 |
% |
|
Savings deposits |
|
70,290 |
|
109 |
|
0.16 |
% |
65,375 |
|
163 |
|
0.25 |
% |
54,039 |
|
117 |
|
0.22 |
% |
||||||
|
Money market deposits |
|
501,792 |
|
2,601 |
|
0.52 |
% |
447,319 |
|
3,250 |
|
0.73 |
% |
341,535 |
|
2,565 |
|
0.75 |
% |
||||||
|
Time deposits |
|
418,750 |
|
6,795 |
|
1.62 |
% |
457,275 |
|
9,275 |
|
2.03 |
% |
512,669 |
|
14,855 |
|
2.90 |
% |
||||||
|
Securities sold under agreements to repurchase |
|
61,595 |
|
253 |
|
0.41 |
% |
56,919 |
|
332 |
|
0.58 |
% |
51,145 |
|
271 |
|
0.53 |
% |
||||||
|
Federal funds purchased and other short-term borrowings |
|
21,537 |
|
38 |
|
0.18 |
% |
23,019 |
|
45 |
|
0.20 |
% |
24,201 |
|
63 |
|
0.26 |
% |
||||||
|
FHLB advances |
|
60,436 |
|
1,460 |
|
2.42 |
% |
69,159 |
|
2,266 |
|
3.28 |
% |
80,904 |
|
3,341 |
|
4.13 |
% |
||||||
|
Long-term debt |
|
40,900 |
|
3,451 |
|
8.44 |
% |
40,901 |
|
3,454 |
|
8.44 |
% |
40,930 |
|
3,505 |
|
8.56 |
% |
||||||
|
|
|
|
|
|
|
|
|
|
|
|
|
|
|
|
|
|
|
|
|
||||||
|
Total interest bearing liabilities |
|
1,456,866 |
|
15,307 |
|
1.05 |
% |
1,408,593 |
|
19,267 |
|
1.37 |
% |
1,330,228 |
|
25,181 |
|
1.89 |
% |
||||||
|
|
|
|
|
|
|
|
|
|
|
|
|
|
|
|
|
|
|
|
|
||||||
|
Non-interest bearing liabilities |
|
|
|
|
|
|
|
|
|
|
|
|
|
|
|
|
|
|
|
||||||
|
Non-interest bearing demand deposits |
|
277,310 |
|
|
|
|
|
235,644 |
|
|
|
|
|
198,888 |
|
|
|
|
|
||||||
|
Accrued interest payable and other liabilities |
|
45,795 |
|
|
|
|
|
39,643 |
|
|
|
|
|
37,637 |
|
|
|
|
|
||||||
|
|
|
|
|
|
|
|
|
|
|
|
|
|
|
|
|
|
|
|
|
||||||
|
Total liabilities |
|
1,779,971 |
|
|
|
|
|
1,683,880 |
|
|
|
|
|
1,566,753 |
|
|
|
|
|
||||||
|
|
|
|
|
|
|
|
|
|
|
|
|
|
|
|
|
|
|
|
|
||||||
|
Stockholders’ equity |
|
179,638 |
|
|
|
|
|
163,572 |
|
|
|
|
|
150,721 |
|
|
|
|
|
||||||
|
|
|
|
|
|
|
|
|
|
|
|
|
|
|
|
|
|
|
|
|
||||||
|
Total liabilities and stockholders’ equity |
|
$ |
1,959,609 |
|
|
|
|
|
$ |
1,847,452 |
|
|
|
|
|
$ |
1,717,474 |
|
|
|
|
|
|||
|
|
|
|
|
|
|
|
|
|
|
|
|
|
|
|
|
|
|
|
|
||||||
|
Net interest income |
|
|
|
$ |
72,262 |
|
|
|
|
|
$ |
68,264 |
|
|
|
|
|
$ |
59,729 |
|
|
|
|||
|
|
|
|
|
|
|
|
|
|
|
|
|
|
|
|
|
|
|
|
|
||||||
|
Net interest spread |
|
|
|
|
|
3.79 |
% |
|
|
|
|
3.74 |
% |
|
|
|
|
3.43 |
% |
||||||
|
|
|
|
|
|
|
|
|
|
|
|
|
|
|
|
|
|
|
|
|
||||||
|
Net interest margin |
|
|
|
|
|
3.99 |
% |
|
|
|
|
3.99 |
% |
|
|
|
|
3.74 |
% |
||||||
Notes:
· Yields on municipal securities have been computed on a fully tax-equivalent basis using the federal income tax rate of 35%.
· The approximate tax-equivalent adjustments to interest income were $1,530,000, $1,385,000 and $1,054,000 for the years ended December 31, 2011, 2010 and 2009, respectively.
· Average balances for loans include the principal balance of non-accrual loans and exclude participation loans accounted for as secured borrowings.
· Loan interest income includes loan fees and is computed on a fully tax-equivalent basis using the federal income tax rate of 35%. Loan fees, net of deferred costs, included in interest income amounted to $585,000, $922,000 and $570,000 in 2011, 2010 and 2009, respectively.
Securities
The primary purpose of the securities portfolio is to provide another source of interest income, as well as liquidity management. In managing the composition of the balance sheet, Bancorp seeks a balance between earnings sources and credit and liquidity considerations.
Securities intended to be held until maturity are carried at amortized cost. Securities available for sale include securities that may be sold in response to changes in interest rates, resultant prepayment risk and other factors related to interest rate and prepayment risk changes. Securities available for sale are carried at fair value with unrealized gains or losses, net of tax effect, included in stockholders’ equity.
The carrying value of securities is summarized as follows:
|
|
|
December 31 |
|
|||||||
|
(In thousands) |
|
2011 |
|
2010 |
|
2009 |
|
|||
|
Securities available for sale |
|
|
|
|
|
|
|
|||
|
U.S. Treasury and other U.S. government obligations |
|
$ |
115,001 |
|
$ |
— |
|
$ |
3,019 |
|
|
Government sponsored enterprise obligations |
|
46,186 |
|
114,539 |
|
124,688 |
|
|||
|
Mortgage-backed securities — government agencies |
|
120,495 |
|
60,748 |
|
66,681 |
|
|||
|
Obligations of states and political subdivisions |
|
69,501 |
|
68,789 |
|
32,812 |
|
|||
|
Trust preferred securities of financial institutions |
|
1,002 |
|
1,256 |
|
1,025 |
|
|||
|
|
|
|
|
|
|
|
|
|||
|
|
|
$ |
352,185 |
|
$ |
245,332 |
|
$ |
228,225 |
|
|
|
|
|
|
|
|
|
|
|||
|
Securities held to maturity |
|
|
|
|
|
|
|
|||
|
Mortgage-backed securities — government agencies |
|
$ |
— |
|
$ |
20 |
|
$ |
35 |
|
|
|
|
|
|
|
|
|
|
|||
|
|
|
$ |
— |
|
$ |
20 |
|
$ |
35 |
|
The maturity distribution and weighted average interest rates of securities at December 31, 2011, are as follows:
|
|
|
|
|
|
|
After one but within |
|
After five but within |
|
|
|
|
|
||||||||
|
|
|
Within one year |
|
five years |
|
ten years |
|
After ten years |
|
||||||||||||
|
(Dollars in thousands) |
|
Amount |
|
Rate |
|
Amount |
|
Rate |
|
Amount |
|
Rate |
|
Amount |
|
Rate |
|
||||
|
|
|
|
|
|
|
|
|
|
|
|
|
|
|
|
|
|
|
||||
|
Securities available for sale |
|
|
|
|
|
|
|
|
|
|
|
|
|
|
|
|
|
||||
|
U.S. Treasury and other U.S. government obligations |
|
$ |
115,001 |
|
-0.05 |
% |
$ |
— |
|
— |
|
$ |
— |
|
— |
|
$ |
— |
|
— |
|
|
Government sponsored enterprise obligations |
|
4,444 |
|
4.95 |
% |
36,560 |
|
3.63 |
% |
3,160 |
|
4.93 |
% |
2,022 |
|
4.83 |
% |
||||
|
Mortgage-backed securities — government agencies |
|
— |
|
— |
|
1,583 |
|
3.91 |
% |
12,998 |
|
1.86 |
% |
105,914 |
|
3.03 |
% |
||||
|
Obligations of states and political subdivisions |
|
11,262 |
|
2.81 |
% |
32,908 |
|
2.63 |
% |
25,331 |
|
5.00 |
% |
— |
|
— |
|
||||
|
Trust preferred securities of financial institutions |
|
— |
|
— |
|
— |
|
— |
|
— |
|
— |
|
1,002 |
|
8.00 |
% |
||||
|
|
|
|
|
|
|
|
|
|
|
|
|
|
|
|
|
|
|
||||
|
|
|
$ |
130,707 |
|
0.37 |
% |
$ |
71,051 |
|
3.17 |
% |
$ |
41,489 |
|
4.01 |
% |
$ |
108,938 |
|
3.11 |
% |
The $115 million of U.S. Treasury securities consisted of short-term treasury bills, which matured in January 2012, purchased over year-end as a means to minimize state taxes. Tax savings exceeded the lost principal generated by the negative yield on these securities.
Loan Portfolio
Bancorp’s primary source of income is interest on loans. The composition of loans as of the end of the last five years follows:
|
|
|
December 31 |
|
|||||||||||||
|
(In thousands) |
|
2011 |
|
2010 |
|
2009 |
|
2008 |
|
2007 |
|
|||||
|
|
|
|
|
|
|
|
|
|
|
|
|
|||||
|
Commercial and industrial |
|
$ |
393,729 |
|
$ |
343,956 |
|
$ |
336,889 |
|
$ |
348,174 |
|
$ |
309,506 |
|
|
|
|
|
|
|
|
|
|
|
|
|
|
|||||
|
Construction and development |
|
147,637 |
|
159,482 |
|
204,653 |
|
167,402 |
|
144,668 |
|
|||||
|
|
|
|
|
|
|
|
|
|
|
|
|
|||||
|
Real estate mortgage: |
|
|
|
|
|
|
|
|
|
|
|
|||||
|
Commercial investment |
|
399,655 |
|
343,163 |
|
326,421 |
|
248,308 |
|
240,610 |
|
|||||
|
Owner occupied commercial |
|
297,121 |
|
336,032 |
|
230,001 |
|
249,164 |
|
200,122 |
|
|||||
|
1-4 family residential |
|
154,565 |
|
157,983 |
|
147,342 |
|
160,322 |
|
145,362 |
|
|||||
|
Home equity |
|
|
(a) |
|
(a) |
|
(a) |
|
(a) |
136,962 |
|
|||||
|
Home equity - first lien |
|
38,637 |
|
39,449 |
|
41,644 |
|
22,973 |
|
|
(a) |
|||||
|
Home equity - junior lien |
|
76,687 |
|
91,813 |
|
108,398 |
|
122,535 |
|
|
(a) |
|||||
|
|
|
|
|
|
|
|
|
|
|
|
|
|||||
|
Subtotal: Real estate mortgage |
|
966,665 |
|
968,440 |
|
853,806 |
|
803,302 |
|
723,056 |
|
|||||
|
|
|
|
|
|
|
|
|
|
|
|
|
|||||
|
Consumer |
|
36,814 |
|
36,547 |
|
40,114 |
|
30,759 |
|
24,708 |
|
|||||
|
|
|
|
|
|
|
|
|
|
|
|
|
|||||
|
|
|
$ |
1,544,845 |
|
$ |
1,508,425 |
|
$ |
1,435,462 |
|
$ |
1,349,637 |
|
$ |
1,201,938 |
|
(a) In 2008, Bancorp changed its presentation for disclosing the types of loans in its portfolio to provide more detailed information. Home equity lines of credit were divided into two categories - first lien and junior lien; however, it was not feasible to obtain comparable amounts for these categories for prior periods.
Increases in loan categories reflect an overall increase in the size and composition of the loan portfolio, as well as the effect of internal reclassifications of loan types. It was not feasible to obtain comparable amounts for reclassification of prior period presentation.
The increase in the commercial investment and owner occupied commercial categories is the result of a consistent strategy to serve existing clients in Bancorp’s local markets. Much of the growth is attributed to industrial and multi-family properties and healthcare facility loans with substantial obligor cash equity and strong guarantor support. The decrease in the construction and development category since 2009 reflects internal reclassifications of loan types as project completions resulted in permanent financing. Bancorp’s focus has not been on housing and retail construction lending, sources of increased credit risk in the current environment.
Junior lien home equity loans, which comprise 5% of the loan portfolio at December 31, 2011, are typically underwritten with consideration of the borrower’s overall financial strength as a primary payment source, with some reliance on the value of the collateral. The overall level of home equity junior liens as a
percentage of the overall portfolio and the level of related outstanding commitments have been declining over the last several years, as this is not a primary strategy for loan growth for Bancorp.
Bancorp enters into loan participation agreements with correspondent banks in the ordinary course of business to diversify credit risk. For certain participation loans, Bancorp has retained effective control of the loans, typically by restricting the participating institutions from pledging or selling their share of the loan without permission from Bancorp. US GAAP requires these loans to be recorded as secured borrowings. These loans are included in the commercial and industrial and real estate mortgage loan totals above, and a corresponding liability is recorded in other liabilities. At December 31, 2011 and 2010, the total loans of this nature were $30.3 million and $34.8 million respectively.
The following tables detail the amounts of commercial and industrial loans, and construction and development loans at December 31, 2011 which, based on remaining scheduled repayments of principal, are due in the periods indicated. Also shown are the commercial and industrial loans due after one year classified according to sensitivity to changes in interest rates.
|
|
|
Maturing |
|
||||||||||
|
(In thousands) |
|
Within one year |
|
After one but
|
|
After five years |
|
Total |
|
||||
|
|
|
|
|
|
|
|
|
|
|
||||
|
Commercial and industrial |
|
$ |
181,667 |
|
$ |
144,331 |
|
$ |
67,731 |
|
$ |
393,729 |
|
|
Construction and development |
|
69,781 |
|
50,034 |
|
27,822 |
|
147,637 |
|
||||
|
|
|
Interest Sensitivity |
|
||||
|
Commercial and industrial loans |
|
Fixed rate |
|
Variable rate |
|
||
|
(In thousands) |
|
|
|
|
|
||
|
|
|
|
|
|
|
||
|
Due after one but within five years |
|
$ |
93,642 |
|
$ |
50,689 |
|
|
Due after five years |
|
58,865 |
|
8,866 |
|
||
|
|
|
|
|
|
|
||
|
|
|
$ |
152,507 |
|
$ |
59,555 |
|
Non-performing Loans and Assets
Information summarizing non-performing assets, including non-accrual loans follows:
|
|
|
December 31 |
|
|||||||||||||
|
(Dollars in thousands) |
|
2011 |
|
2010 |
|
2009 |
|
2008 |
|
2007 |
|
|||||
|
|
|
|
|
|
|
|
|
|
|
|
|
|||||
|
Non-accrual loans |
|
$ |
18,737 |
|
$ |
14,388 |
|
$ |
10,455 |
|
$ |
4,455 |
|
$ |
2,964 |
|
|
Troubled debt restructuring |
|
3,402 |
|
2,882 |
|
753 |
|
— |
|
— |
|
|||||
|
Loans past due 90 days or more and still accruing |
|
1,160 |
|
2,044 |
|
893 |
|
255 |
|
406 |
|
|||||
|
Non-performing loans |
|
23,299 |
|
19,314 |
|
12,101 |
|
4,710 |
|
3,370 |
|
|||||
|
Foreclosed real estate |
|
7,773 |
|
5,445 |
|
1,556 |
|
1,560 |
|
3,831 |
|
|||||
|
Other foreclosed property |
|
— |
|
— |
|
60 |
|
96 |
|
— |
|
|||||
|
Non-performing assets |
|
$ |
31,072 |
|
$ |
24,759 |
|
$ |
13,717 |
|
$ |
6,366 |
|
$ |
7,201 |
|
|
|
|
|
|
|
|
|
|
|
|
|
|
|||||
|
Non-performing loans as a percentage of total loans |
|
1.51 |
% |
1.28 |
% |
0.84 |
% |
0.35 |
% |
0.28 |
% |
|||||
|
Non-performing assets as a percentage of total assets |
|
1.51 |
% |
1.30 |
% |
0.77 |
% |
0.39 |
% |
0.49 |
% |
|||||
|
Allowance for loan loss as a percentage of non- performing loans |
|
128 |
% |
132 |
% |
165 |
% |
327 |
% |
399 |
% |
|||||
The following table sets forth the major classifications of non-accrual loans:
(in thousands)
|
Non-accrual loans by type |
|
December 31, 2011 |
|
December 31, 2010 |
|
||
|
Commercial and industrial |
|
$ |
2,665 |
|
$ |
2,328 |
|
|
Construction and development |
|
2,416 |
|
4,589 |
|
||
|
Real estate mortgage - commercial investment |
|
5,393 |
|
3,214 |
|
||
|
Real estate mortgage - owner occupied commercial |
|
4,681 |
|
1,426 |
|
||
|
Real estate mortgage - 1-4 family residential |
|
3,342 |
|
1,984 |
|
||
|
Home equity |
|
146 |
|
570 |
|
||
|
Consumer |
|
94 |
|
277 |
|
||
|
|
|
|
|
|
|
||
|
Total |
|
$ |
18,737 |
|
$ |
14,388 |
|
The increase in non-accrual loans reflects the effects on borrowers of continuing economic pressures and operating difficulties over the past year. The increase in these non-accrual loans has been confined to a relatively small number of borrowers within the portfolio. Bancorp has eight borrowers, all in its primary market, who account for $13,234,000 or approximately 70% of total non-accrual loans. Each of these loans is secured predominantly by commercial or residential real estate, and management estimates minimal loss exposure after consideration of collateral.
While Bancorp’s metrics for net charge-offs and non-performing loans remain at relatively low levels compared to the banking industry, management continues to be concerned that a prolonged recession will place additional pressure on credit quality and result in an increase in the level of non-performing loans. To
the extent that Bancorp chooses to work with borrowers by providing reasonable concessions, rather than initiate collection, this could result in an increase in loans accounted for as troubled debt restructuring.
The threshold at which loans are generally transferred to non-accrual of interest status is 90 days past due unless they are well secured and in the process of collection. Interest income recorded on non-accrual loans was $391,000, $250,000, and $216,000 for 2011, 2010, and 2009, respectively. Interest income that would have been recorded if non-accrual loans were on a current basis in accordance with their original terms was $464,000, $640,000, and $627,000 for 2011, 2010, and 2009, respectively.
In addition to the non-performing loans discussed above, there were loans, which are accruing interest, for which payments were current or less than 90 days past due where borrowers are experiencing significant financial difficulties. These potential problem loans totaled approximately $46,148,000, $50,051,000, and $20,564,000 at December 31, 2011, 2010, and 2009, respectively. These loans continue at levels higher than Bancorp experienced pre-recession due to the ongoing economic stress on borrowers witnessed from 2008 through 2011. These relationships are monitored closely for possible future inclusion in non-performing loans. Management believes it has adequately reflected the exposure in these loans in its determination of the allowance for loan losses.
Non-performing assets as a percentage of total assets increased 21 basis points from 2010 to 2011. The increase in non-performing assets as a percentage of total assets was due to the increase in non-accrual loans and an increase in foreclosed real estate. At December 31, 2011 and December 31, 2010, the carrying value of other real estate owned was $7.8 million and $5.5 million, respectively. The recession has resulted in an increase in foreclosures. In 2011, Bancorp recorded impairment charges totaling $1,737,000 based on appraisals of the foreclosed properties and write-downs intended to position Bancorp to move these properties more quickly from the balance sheet. No impairment charges were recorded in 2010 or 2009 for these properties as management believes these properties were appropriately recorded at lower of cost or market.
Effects of Declines in Real Estate Collateral Values
Bancorp’s principal market, Louisville, has had home values decline less than most markets nationwide according to the Federal Housing Finance Agency. However, continued decline in collateral values, including commercial properties, impacts Bancorp’s ability to collect on certain real estate loans when borrowers are dependent on the values of the real estate as a source of cash flow. As borrowers experience difficulty, Bancorp evaluates their cash flow as well as the collateral value to determine prospects for collection. On an individual basis, loans are evaluated for changes in risk ratings, thereby affecting the provision and allowance for loan losses. Home equity loans are typically underwritten with consideration of the borrower’s overall financial strength as a primary payment source, with some reliance on the value of the collateral. Bancorp typically requires appraisals on real estate at application and evaluates the transaction upon renewal to determine if market conditions and other factors such as cash flow warrant an updated valuation. Additionally, Bancorp evaluates the collateral condition and value upon classification as an impaired loan and upon foreclosure. Due to the above factors, the effects of declines in real estate collateral value have been considered in the allowance for loan losses.
Allowance for Loan Losses
An allowance for loan losses has been established to provide for probable losses on loans that may not be fully repaid. The allowance for loan losses is increased by provisions charged to expense and decreased by charge-offs, net of recoveries. Loans are typically charged off when management deems them uncollectible and after underlying collateral has been liquidated; however, collection efforts continue and future recoveries may occur. Management charges loans down to net realizable value if liquidation is inevitable but may take time.
Bancorp’s lending policies and procedures center on controlling credit risk and include procedures to identify and measure this risk. These procedures begin with lenders assigning a risk rating to each of their credits, and this rating is confirmed in the loan approval process. Internal loan review, through a year-round process of examining individually significant obligor relationships as well as a sample of each lender’s portfolio, tests
the reliability of these risk assessments. Additionally, a review of this process is an integral part of regulatory bank examinations.
Adversely rated credits are included on a loan watch list. This list also includes loans requiring closer monitoring due to borrower’s circumstances. However, these loans have generally not reached a level of adversity which would cause them to be criticized credits by regulators. Loans are added to the watch list when circumstances are detected which might affect the borrower’s ability to comply with terms of the loan. This could include any of the following:
· Delinquency of a scheduled loan payment,
· Severe deterioration in the borrower’s or guarantor’s financial condition identified in a review of periodic financial statements,
· Decrease in the value of collateral securing the loan, or
· Change in the economic environment in which the borrower operates.
Loans on the watch list require detailed status reports, including recommended corrective actions, prepared periodically by the responsible loan officer. These reports are reviewed by management. The watch list is also discussed in quarterly meetings with the Bank’s Board Loan Committee.
Changes in loan risk ratings are typically initiated by the responsible loan officer, but may also be initiated by internal loan review, or the senior loan committee at any time.
In determining the allowance and related provision for loan losses, these principal elements are considered:
· Specific allocations are based upon probable losses on individually evaluated impaired loans. These estimates are based primarily upon collateral value, but other objective factors such as payment history and financial condition of the borrower or guarantor may be used as well.
· Allocations for individually significant loans not defined as impaired are based on estimates needed for pools of loans with similar risk.
· Allocations for loans not reviewed are totaled by loan category and are assigned a loss allocation factor based upon the Bank’s historical net loss percentages by loan type.
· Additional allowance allocations based on subjective factors not necessarily associated with a specific credit or loan category and represent management’s effort to ensure that the overall allowance for loan losses appropriately reflects a margin for the imprecision necessarily inherent in the estimates of expected credit losses. Management considers a number of subjective factors, including local and general economic business factors and trends and portfolio concentrations.
Based on this quantitative and qualitative analysis, provisions are made to the allowance for loan losses. Such provisions are reflected as a charge against current earnings in Bancorp’s consolidated statements of income.
The allocation of the allowance for loan losses by loan category is a result of the analysis above. The same procedures used to determine requirements for the allowance for loan losses establish the distribution of the allowance by loan category. The distribution of the allowance will change from period to period due to changes in the identified risk in each loan in the portfolio, changes in the aggregate loan balances by loan category, and changes in management’s view of the subjective factors noted above. Although the allowance for loan losses is comprised of specific and general allocations the entire allowance is available to absorb any credit losses.
The method of calculating the allowance requirements has not changed significantly over time. The reallocations among different categories of loans between periods are the result of the redistribution of the individual loans that comprise the aggregate portfolio as described above. However, the perception of risk with respect to particular loans within the portfolio will change over time as a result of the characteristics and performance of those loans, overall economic and market trends, and the actual and expected trends in non-performing loans.
The adequacy of the allowance for loan losses is monitored by the internal loan review staff and reported quarterly to the Audit and Loan Committees of the Board of Directors. In addition, various regulatory agencies, as an integral part of their examination process, periodically review the adequacy of Bancorp’s allowance for loan losses. Such agencies may require Bancorp to make additional provisions to the allowance based upon their judgments about information available to them at the time of their examinations. Management believes that the allowance for loan losses is adequate to absorb probable inherent losses on existing loans that may become uncollectible. See “Provision for Loan Losses” for further discussion of the allowance for loan losses.
Summary of Loan Loss Experience
The following table summarizes average loans outstanding, changes in the allowance for loan losses arising from loans charged off and recoveries on loans previously charged off by loan category and additions to the allowance charged to expense.
|
|
|
Year ended December 31 |
|
|||||||||||||
|
(Dollars in thousands) |
|
2011 |
|
2010 |
|
2009 |
|
2008 |
|
2007 |
|
|||||
|
|
|
|
|
|
|
|
|
|
|
|
|
|||||
|
Average Loans |
|
$ |
1,529,556 |
|
$ |
1,469,116 |
|
$ |
1,391,644 |
|
$ |
1,295,711 |
|
$ |
1,159,101 |
|
|
|
|
|
|
|
|
|
|
|
|
|
|
|||||
|
Balance of allowance for loan losses at beginning of year |
|
$ |
25,543 |
|
$ |
20,000 |
|
$ |
15,381 |
|
$ |
13,450 |
|
$ |
12,203 |
|
|
Loans charged off |
|
|
|
|
|
|
|
|
|
|
|
|||||
|
Commercial and industrial |
|
1,015 |
|
1,418 |
|
4,925 |
|
341 |
|
1,695 |
|
|||||
|
Construction and development |
|
1,593 |
|
2,211 |
|
38 |
|
109 |
|
42 |
|
|||||
|
Real estate mortgage |
|
5,840 |
|
2,450 |
|
3,099 |
|
1,689 |
|
547 |
|
|||||
|
Consumer |
|
673 |
|
687 |
|
1,055 |
|
824 |
|
827 |
|
|||||
|
Total loans charged off |
|
9,121 |
|
6,766 |
|
9,117 |
|
2,963 |
|
3,111 |
|
|||||
|
|
|
|
|
|
|
|
|
|
|
|
|
|||||
|
Recoveries of loans previously charged off |
|
|
|
|
|
|
|
|
|
|
|
|||||
|
Commercial and industrial |
|
108 |
|
115 |
|
59 |
|
31 |
|
242 |
|
|||||
|
Construction and development |
|
— |
|
26 |
|
2 |
|
— |
|
— |
|
|||||
|
Real estate mortgage |
|
158 |
|
163 |
|
393 |
|
236 |
|
65 |
|
|||||
|
Consumer |
|
457 |
|
536 |
|
507 |
|
577 |
|
526 |
|
|||||
|
Total recoveries |
|
723 |
|
840 |
|
961 |
|
844 |
|
833 |
|
|||||
|
Net loans charged off |
|
8,398 |
|
5,926 |
|
8,156 |
|
2,119 |
|
2,278 |
|
|||||
|
Additions to allowance charged to expense |
|
12,600 |
|
11,469 |
|
12,775 |
|
4,050 |
|
3,525 |
|
|||||
|
Balance at end of year |
|
$ |
29,745 |
|
$ |
25,543 |
|
$ |
20,000 |
|
$ |
15,381 |
|
$ |
13,450 |
|
|
Ratio of net charge-offs during year to average loans |
|
0.55 |
% |
0.40 |
% |
0.59 |
% |
0.16 |
% |
0.20 |
% |
|||||
See “Provision for Loan Losses” for discussion of the provision for loan losses and 2011 charge-offs.
The following table sets forth the allocation of the allowance for loan losses for the loan categories shown. Although specific allocations exist, the entire allowance is available to absorb losses in any particular loan category.
|
|
|
December 31 |
|
|||||||||||||
|
(In thousands) |
|
2011 |
|
2010 |
|
2009 |
|
2008 |
|
2007 |
|
|||||
|
|
|
|
|
|
|
|
|
|
|
|
|
|||||
|
Commercial and industrial |
|
$ |
7,364 |
|
$ |
2,796 |
|
$ |
4,091 |
|
$ |
2,717 |
|
$ |
1,991 |
|
|
Construction and development |
|
3,546 |
|
3,630 |
|
1,518 |
|
1,528 |
|
876 |
|
|||||
|
Real estate mortgage |
|
11,182 |
|
12,203 |
|
6,513 |
|
4,065 |
|
3,421 |
|
|||||
|
Consumer |
|
540 |
|
623 |
|
947 |
|
1,865 |
|
3,444 |
|
|||||
|
Unallocated |
|
7,113 |
|
6,291 |
|
6,931 |
|
5,206 |
|
3,718 |
|
|||||
|
|
|
|
|
|
|
|
|
|
|
|
|
|
|
|
|
|
|
|
|
$ |
29,745 |
|
$ |
25,543 |
|
$ |
20,000 |
|
$ |
15,381 |
|
$ |
13,450 |
|
The changes in the allocation of the allowance from year to year in various categories are influenced by the level of net charge-offs in the respective categories and other factors including, but not limited to, an evaluation of the impact of current economic conditions and trends, risk allocations tied to specific loans or groups of loans and changes in qualitative allocations. Management believes that the allocations for each loan category are reflective of the risk inherent in the portfolio.
The unallocated allowance is based upon management’s evaluation of various conditions, the effects of which are not directly measured in the determination of the allocated allowance. Additional allowance allocations based on subjective factors are not necessarily associated with a specific credit or loan category and represent management’s effort to ensure that the overall allowance for loan losses appropriately reflects a margin for the imprecision necessarily inherent in the estimates of expected credit losses. The conditions evaluated in connection with the unallocated allowance primarily include factors such as economic conditions and forecasts and their potential impact on the loan portfolio, but may also include the adequacy of loan policies and internal controls, the experience of the lending staff, bank regulatory examination results, and changes in the composition of the portfolio.
Selected ratios relating to the allowance for loan losses follow:
|
|
|
Years ended December 31 |
|
||||
|
|
|
2011 |
|
2010 |
|
2009 |
|
|
|
|
|
|
|
|
|
|
|
Provision for loan losses to average loans |
|
0.82 |
% |
0.78 |
% |
0.92 |
% |
|
Net charge-offs to average loans |
|
0.55 |
% |
0.40 |
% |
0.59 |
% |
|
Allowance for loan losses to average loans |
|
1.94 |
% |
1.74 |
% |
1.44 |
% |
|
Allowance for loan losses to year end loans |
|
1.93 |
% |
1.69 |
% |
1.39 |
% |
Deposits
Bancorp’s core deposits consist of non-interest and interest bearing demand deposits, savings deposits, certificates of deposit under $250,000, certain certificates of deposit over $250,000 and IRAs. These deposits, along with other borrowed funds, are used by Bancorp to support its asset base. By adjusting rates offered to depositors, Bancorp is able to influence the amounts of deposits needed to meet its funding requirements. The average amount of deposits in the Bank and average rates paid on such deposits for the years indicated are summarized as follows:
|
|
|
Years ended December 31 |
|
|||||||||||||
|
|
|
2011 |
|
2010 |
|
2009 |
|
|||||||||
|
(Dollars in thousands) |
|
Average
|
|
Average
|
|
Average
|
|
Average
|
|
Average
|
|
Average
|
|
|||
|
|
|
|
|
|
|
|
|
|
|
|
|
|
|
|
|
|
|
Non-interest bearing demand deposits |
|
$ |
277,310 |
|
— |
|
$ |
235,644 |
|
— |
|
$ |
198,888 |
|
— |
|
|
Interest bearing demand deposits |
|
281,566 |
|
0.21 |
% |
248,626 |
|
0.19 |
% |
224,805 |
|
0.21 |
% |
|||
|
Savings deposits |
|
70,290 |
|
0.16 |
% |
65,375 |
|
0.25 |
% |
54,039 |
|
0.22 |
% |
|||
|
Money market deposits |
|
501,792 |
|
0.52 |
% |
447,319 |
|
0.73 |
% |
341,535 |
|
0.75 |
% |
|||
|
Time deposits |
|
418,750 |
|
1.62 |
% |
457,275 |
|
2.03 |
% |
512,669 |
|
2.90 |
% |
|||
|
|
|
|
|
|
|
|
|
|
|
|
|
|
|
|||
|
|
|
$ |
1,549,708 |
|
|
|
$ |
1,454,239 |
|
|
|
$ |
1,331,936 |
|
|
|
Maturities of time deposits of $250,000 or more outstanding at December 31, 2011, are summarized as follows:
|
(In thousands) |
|
Amount |
|
|
|
|
|
|
|
|
|
3 months or less |
|
$ |
11,253 |
|
|
Over 3 through 6 months |
|
7,714 |
|
|
|
Over 6 through 12 months |
|
15,346 |
|
|
|
Over 12 months |
|
10,394 |
|
|
|
|
|
|
|
|
|
|
|
$ |
44,707 |
|
Short-Term Borrowings
Securities sold under agreements to repurchase represent short-term borrowings from commercial customers as part of a cash management service. These agreements generally have maturities of one business day from the transaction date. Bancorp considers these core deposits since they represent excess cash balances of full relationship business customers.
Information regarding securities sold under agreements to repurchase follows:
|
|
|
Years ended December 31 |
|
|||||||||||||
|
|
|
2011 |
|
2010 |
|
2009 |
|
|||||||||
|
(Dollars in thousands) |
|
Amount |
|
Rate |
|
Amount |
|
Rate |
|
Amount |
|
Rate |
|
|||
|
|
|
|
|
|
|
|
|
|
|
|
|
|
|
|||
|
Securities sold under agreements to repurchase |
|
|
|
|
|
|
|
|
|
|
|
|
|
|||
|
Year end |
|
$ |
66,026 |
|
0.30 |
% |
$ |
60,075 |
|
0.44 |
% |
$ |
51,321 |
|
0.64 |
% |
|
Average during year |
|
61,595 |
|
0.41 |
% |
56,919 |
|
0.58 |
% |
51,145 |
|
0.53 |
% |
|||
|
Maximum month end balance during year |
|
69,818 |
|
|
|
65,521 |
|
|
|
56,125 |
|
|
|
|||
Subordinated Debentures
Subordinated debentures are classified as long term debt. In light of pressures on the economy and uncertainties in the banking industry, S.Y. Bancorp further strengthened its balance sheet during 2008 with the sale of $30,000,000 of 10% cumulative trust preferred securities in an over-subscribed public offering. The trust preferred securities, which qualify as Tier 1 capital, will mature on December 31, 2038, but are callable by Bancorp on or after December 31, 2013. Also in 2008, the Bank issued $10 million of subordinated debt, with a 10 year maturity, and a call option to the Bank two years after issuance. The subordinated debt qualifies as tier 2 capital and may be prepaid at any time. In the first quarter of 2012, Bancorp exercised its call option and prepaid the subordinated debt without penalty. See Note 11 for further information regarding subordinated debentures.
Liquidity
The role of liquidity management is to ensure funds are available to meet depositors’ withdrawal and borrowers’ credit demands while at the same time maximizing profitability. This is accomplished by balancing changes in demand for funds with changes in the supply of those funds. Liquidity is provided by short-term liquid assets that can be converted to cash, investment securities available for sale, various lines of credit available to Bancorp, and the ability to attract funds from external sources, principally deposits. Management believes it has the ability to increase deposits at any time by offering rates slightly higher than the market rate.
Bancorp’s Asset/Liability Committee is primarily made up of senior management and has direct oversight responsibility for Bancorp’s liquidity position and profile. A combination of daily, weekly and monthly reports provided to management detail the following: internal liquidity metrics, composition and level of the liquid asset portfolio, timing differences in short-term cash flow obligations, and exposure to contingent draws on Bancorp’s liquidity.
Bancorp’s most liquid assets are comprised of cash and due from banks, available for sale marketable investment securities and federal funds sold. Federal funds sold totaled $22.0 million at December 31, 2011. These investments normally have overnight maturities and are used for general daily liquidity purposes. The fair value of the available for sale investment portfolio was $352.2 million at December 31, 2011, and included an unrealized net gain of $9.1 million. The portfolio includes maturities of approximately $130.5 million over the next twelve months, which, combined with federal funds sold, offer substantial resources to meet either new loan demand or reductions in Bancorp’s deposit funding base. Bancorp pledges portions of its investment securities portfolio to secure public fund deposits, cash balances of certain investment management and trust accounts, and securities sold under agreements to repurchase. At December 31, 2011, total investment securities pledged for these purposes comprised 36% of the available for sale investment portfolio, leaving $226.8 million of unpledged securities.
Bancorp has a large base of core customer deposits, defined as demand, savings, and money market deposit accounts. At December 31, 2011, such deposits totaled $1.209 billion and represented 75% of Bancorp’s total
deposits. Because these core deposits are less volatile and are often tied to other products of Bancorp through long lasting relationships they do not put heavy pressure on liquidity. However, many of Bancorp’s overall deposit balances are historically high. When market conditions improve, these balances will likely decrease, putting some strain on Bancorp’s liquidity position. As of December 30, 2011, Bancorp had only $6.8 million or 0.4% of total deposits, in brokered deposits, which are entirely comprised of Certificate of Deposit Account Registry Service (CDARs) deposits, a program which allows Bancorp to offer FDIC insurance up to $50 million in deposits per customer through reciprocal agreements with other network participating banks.
Other sources of funds available to meet daily needs include the sales of securities under agreements to repurchase. Also, the Bank is a member of the FHLB of Cincinnati. As a member of the FHLB, the Bank has access to credit products of the FHLB. The Bank views these borrowings as a low cost alternative to other time deposits. At December 31, 2011, the amount of available credit from the FHLB totaled $96 million. See Note 10 for further information regarding advances from the Federal Home Loan Bank. Also, the Bank has available federal funds purchased lines with correspondent banks totaling $65 million. Bancorp also is eligible to borrow from the Federal Reserve Bank of St. Louis based upon its asset size.
Over the normal course of business, Bancorp enters into certain forms of off-balance sheet transactions, including unfunded loan commitments and letters of credit. These transactions are managed through Bancorp’s various risk management processes. Management considers both on-balance sheet and off-balance sheet transactions in its evaluation of Bancorp’s liquidity.
Sources and Uses of Cash
Cash flow is provided primarily through the financing activities of the Bank which include raising deposits and the borrowing of funds from institutional sources such as advances from FHLB and fed funds purchased as well as scheduled loan repayments. These funds are then primarily used to facilitate the investment activities of the Bank which include making loans and purchasing securities for the investment portfolio. Another important source of cash is from the net income of the Bank from operating activities. As discussed in Note 16 to Bancorp’s consolidated financial statements, as of January 1 of any year the Bank may pay dividends up to the Bank’s net income of the prior two years less any dividends paid for the same two years. Regulatory approval is required for dividends exceeding these amounts. Prior to the declaration of dividends, management considers the effect such payments will have on total stockholders’ equity and capital ratios. For more specific information, see the consolidated statement of cash flows in Bancorp’s consolidated financial statements.
Commitments
In the normal course of business, Bancorp is party to activities that contain credit, market and operational risk that are not reflected in whole or in part in Bancorp’s consolidated financial statements. Such activities include: traditional off-balance sheet credit-related financial instruments, commitments under operating leases and long-term debt.
The Bank provides customers with off-balance sheet credit support through loan commitments and standby letters of credit. Summarized credit-related financial instruments, including both commitments to extend credit and letters of credit at December 31, 2011 are as follows:
|
|
|
Amount of commitment expiration per period |
|
|||||||||||||
|
|
|
|
|
Less than |
|
1-3 |
|
3-5 |
|
Over 5 |
|
|||||
|
(In thousands) |
|
Total |
|
1 year |
|
Years |
|
Years |
|
Years |
|
|||||
|
|
|
|
|
|
|
|
|
|
|
|
|
|||||
|
Unused loan commitments |
|
$ |
318,907 |
|
$ |
211,514 |
|
$ |
45,494 |
|
$ |
34,013 |
|
$ |
27,886 |
|
|
Standby letters of credit |
|
13,289 |
|
8,686 |
|
4,502 |
|
100 |
|
1 |
|
|||||
Since some of the unused commitments are expected to expire or may not be fully used, the total amount of commitments in the preceding table does not necessarily represent future cash requirements.
In addition to owned banking facilities, Bancorp has entered into long-term leasing arrangements to support the ongoing activities of Bancorp. Bancorp also has required future payments for a defined benefit retirement plan, long-term debt and the maturity of time deposits. In 2009, Bancorp executed an agreement to acquire marketing rights for a sports and entertainment venue. Bancorp receives revenue from the relationship which offsets a portion of the expenses over the term of the agreement. See Note 10, Note 11, Note 14 and Note 17 to Bancorp’s consolidated financial statements for further information on Federal Home Loan Bank advances, subordinated debentures, the defined benefit retirement plan and operating leases.
The required payments under such commitments at December 31, 2011 are as follows:
|
|
|
Payments due by period |
|
|||||||||||||
|
|
|
|
|
Less than |
|
1-3 |
|
3-5 |
|
Over 5 |
|
|||||
|
(In thousands) |
|
Total |
|
1 year |
|
Years |
|
Years |
|
Years |
|
|||||
|
|
|
|
|
|
|
|
|
|
|
|
|
|||||
|
Operating leases |
|
$ |
10,233 |
|
$ |
1,779 |
|
$ |
2,801 |
|
$ |
1,994 |
|
$ |
3,659 |
|
|
Defined benefit retirement plan |
|
4,112 |
|
123 |
|
207 |
|
168 |
|
3,614 |
|
|||||
|
Time deposit maturities |
|
408,667 |
|
256,548 |
|
128,877 |
|
23,238 |
|
4 |
|
|||||
|
Federal Home Loan Bank advances |
|
60,431 |
|
12 |
|
40,023 |
|
20,024 |
|
372 |
|
|||||
|
Subordinated debentures |
|
10,000 |
|
— |
|
— |
|
— |
|
10,000 |
|
|||||
|
Trust preferred securities |
|
30,900 |
|
— |
|
— |
|
— |
|
30,900 |
|
|||||
|
Other |
|
3,200 |
|
400 |
|
800 |
|
800 |
|
1,200 |
|
|||||
Capital
Information pertaining to Bancorp’s capital balances and ratios follows:
|
|
|
Years ended December 31 |
|
|||||||
|
(Dollars in thousands, except share data) |
|
2011 |
|
2010 |
|
2009 |
|
|||
|
|
|
|
|
|
|
|
|
|||
|
Stockholders’ equity |
|
$ |
187,686 |
|
$ |
169,861 |
|
$ |
153,614 |
|
|
Dividends per share |
|
$ |
0.72 |
|
$ |
0.69 |
|
$ |
0.68 |
|
|
Tier 1 risk-based capital |
|
12.77 |
% |
12.06 |
% |
11.66 |
% |
|||
|
Total risk-based capital |
|
14.63 |
% |
13.93 |
% |
13.55 |
% |
|||
|
Leverage ratio |
|
10.53 |
% |
10.31 |
% |
10.16 |
% |
|||
Importantly, the strengthening of Bancorp’s capital position has occurred concurrently with growth in assets, not as a result of shrinkage of the balance sheet. Bancorp intends to maintain capital ratios at these historically high levels at least until such time as the economy demonstrates sustained improvement. Since 2008, Bancorp has had no share buyback plan, choosing instead to continue to grow its capital in the face of uncertain economic times and regulatory environment. S.Y. Bancorp increased its cash payout to stockholders during 2011 to an annual dividend of $0.72, up from $0.69 per share in 2010. This represents a payout ratio of 42.11% based on basic EPS and an annual yield of 3.51% based upon an annualized fourth quarter dividend rate and year-end closing stock price.
Bank holding companies and their subsidiary banks are required by regulators to meet risk-based capital standards. These standards, or ratios, measure the relationship of capital to a combination of balance sheet and off-balance sheet risks. The value of both balance sheet and off-balance sheet items are adjusted to reflect credit risks. The increase in capital ratios from 2010 to 2011 resulted largely from the growth of retained earnings. See Note 11 for more detail regarding the subordinated debenture component of capital. Note 21 to the consolidated financial statements provides more details of regulatory capital requirements, as well as capital ratios of Bancorp and the Bank. Bancorp and the Bank exceed regulatory capital ratios required to be well capitalized. Management considers the effects of growth on capital ratios as it contemplates plans for expansion.
One component of equity is accumulated other comprehensive income (loss) which, for Bancorp, consists of net unrealized gains or losses on securities available for sale and a minimum pension liability, both net of taxes. Accumulated other comprehensive income was $5,462,000 and $3,139,000 at December 31, 2011 and 2010, respectively. The $2,323,000 increase is primarily a reflection of the effect of the changing interest rate environment during fiscal year 2011 on the valuation of the Bank’s portfolio of securities available for sale.
The following table presents various key financial ratios:
|
|
|
Years ended December 31 |
|
||||
|
|
|
2011 |
|
2010 |
|
2009 |
|
|
|
|
|
|
|
|
|
|
|
Return on average assets |
|
1.20 |
% |
1.24 |
% |
0.95 |
% |
|
Return on average stockholders’ equity |
|
13.14 |
% |
14.03 |
% |
10.82 |
% |
|
Dividend payout ratio, based on basic EPS |
|
42.11 |
% |
41.07 |
% |
56.67 |
% |
|
Average stockholders’ equity to average assets |
|
9.17 |
% |
8.85 |
% |
8.78 |
% |
Fair Value Measurements
Bancorp follows the provisions of the authoritative guidance for fair value measurements. This guidance is definitional and disclosure oriented and addresses how companies should approach measuring fair value when required by US GAAP. The guidance prescribes various disclosures about financial statement categories and amounts which are measured at fair value, if such disclosures are not already specified elsewhere in US GAAP.
The authoritative guidance defines fair value as the price that would be received to sell an asset or paid to transfer a liability in an orderly transaction between participants at the measurement date. The guidance, which requires fair value measurements to be classified as Level 1 (quoted prices), Level 2 (based on observable inputs) or Level 3 (based on unobservable, internally-derived inputs), is discussed in more detail in Note 18 to the consolidated financial statements.
Bancorp’s investment securities available for sale and derivative instruments are recorded at fair value on a recurring basis. Other accounts including mortgage loans held for sale, mortgage servicing rights, impaired loans and other real estate owned may be recorded at fair value on a non-recurring basis, generally in the application of lower of cost or market adjustments or write-downs of specific assets.
The portfolio of investment securities available for sale is comprised of debt securities of the U.S. Treasury and other U.S. government-sponsored corporations, mortgage-backed securities, obligations of state and political subdivisions, and trust preferred securities of other banks. Trust preferred securities are priced using quoted prices of identical securities in an active market, and are classified as Level 1 measurements. All other securities are priced using standard industry models or matrices with various assumptions such as yield curves, volatility, prepayment speeds, default rates, time value, credit rating and market prices for the instruments. These assumptions are generally observable in the market place and can be derived from or supported by observable data. These securities are classified as Level 2 measurements.
Interest rate swaps are valued using primarily Level 2 inputs. Fair value measurements are obtained from an outside pricing service. Prices obtained are generally based on dealer quotes, benchmark forward yield curves, and other relevant observable market data. For purposes of potential valuation adjustments to derivative positions, Bancorp evaluates the credit risk of its counterparties as well as its own credit risk. To date, Bancorp has not realized any losses due to a counterparty’s inability to perform and the change in value of derivative assets and liabilities attributable to credit risk was not significant during 2011.
Mortgage loans held for sale are recorded at the lower of cost or market value. The portfolio is comprised of residential real estate loans and fair value is based on specific prices of underlying contracts for sales to investors. These measurements are classified as Level 2.
Mortgage servicing rights (“MSRs”), carried in other assets, are recorded at fair value upon capitalization, are amortized to correspond with estimated servicing income, and are periodically assessed for impairment based on fair value at the reporting date. Fair value is based on a valuation model that calculates the present value of estimated net servicing income. The model incorporates assumptions that market participants would use in estimating future net servicing income. These measurements are classified as Level 3. At December 31, 2011 and 2010 there was no valuation allowance for the MSRs, as the fair value exceeded the carrying value.
Other real estate owned, which is carried at the lower of cost or fair value, is periodically assessed for impairment based on fair value at the reporting date. Fair value is determined from external appraisals using judgments and estimates of external professionals. Many of these inputs are not observable and, accordingly, these measurements are classified as Level 3. At December 31, 2011 and December 31, 2010, the carrying value of other real estate owned was $7,773,000 and $5,445,000, respectively. The ongoing economic stress on borrowers witnessed from 2008 through 2011 has resulted in an increase in foreclosures.
Loans are measured for impairment and, if indicated, a specific allocation is established based on the value of underlying collateral. Impaired loans include non-accrual loans and loans accounted for as troubled debt restructuring. For impaired loans, the fair value is calculated as the carrying value of loans with a specific valuation allowance, less the specific allowance. At December 31, 2011 and December 31, 2010, the carrying value of impaired loans was $10,021,000 and $5,521,000, respectively. These measurements are classified as Level 3.
US GAAP requires that goodwill no longer be amortized, but instead be tested for impairment at least annually. Annual evaluations have resulted in no charges for impairment, as the fair value is substantially in excess of the carrying value. Bancorp currently has goodwill from the acquisition of a bank in southern Indiana in the amount of $682,000. Fair value is based on a valuation analysis that incorporates present value of financial assets of the commercial and retail banking segment of the Bank. The model incorporates assumptions that market participants would use in estimating future cash flows and their present value. These measurements are classified as Level 3.
See Note 18 for details of fair value measurements.
Non-GAAP Financial Measures
In addition to capital ratios defined by banking regulators, Bancorp considers various ratios when evaluating capital adequacy, including tangible common equity to tangible assets, and tangible common equity per share, all of which are non-GAAP measures. Bancorp believes these ratios are important because of their widespread use by investors as means to evaluate capital adequacy, as they reflect the level of capital available to withstand unexpected market conditions. Because US GAAP does not include capital ratio measures, there are no US GAAP financial measures comparable to these ratios. The following table reconciles Bancorp’s calculation of the measures to amounts reported under US GAAP.
|
|
|
December 31, |
|
||||
|
(in thousands, except per share data) |
|
2011 |
|
2010 |
|
||
|
|
|
|
|
|
|
||
|
Total equity (a) |
|
$ |
187,686 |
|
$ |
169,861 |
|
|
Less goodwill |
|
(682 |
) |
(682 |
) |
||
|
|
|
|
|
|
|
||
|
Tangible common equity (c) |
|
187,004 |
|
169,179 |
|
||
|
|
|
|
|
|
|
||
|
Total assets (b) |
|
$ |
2,053,097 |
|
$ |
1,902,945 |
|
|
Less goodwill |
|
(682 |
) |
(682 |
) |
||
|
|
|
|
|
|
|
||
|
Total tangible assets (d) |
|
2,052,415 |
|
1,902,263 |
|
||
|
|
|
|
|
|
|
||
|
Total shareholders’ equity to total assets (a/b) |
|
9.14 |
% |
8.93 |
% |
||
|
Tangible common equity ratio (c/d) |
|
9.11 |
% |
8.89 |
% |
||
|
|
|
|
|
|
|
||
|
Number of outstanding shares (e) |
|
13,819 |
|
13,737 |
|
||
|
|
|
|
|
|
|
||
|
Book value per share (a/e) |
|
$ |
13.58 |
|
$ |
12.37 |
|
|
Tangible common equity per share (c/e) |
|
13.53 |
|
12.32 |
|
||
Recently Issued Accounting Pronouncements
In September 2011, the FASB issued ASU No. 2011-08, Intangibles—Goodwill and Other , which permits an entity to make a qualitative assessment of whether it is more likely than not that a reporting unit’s fair value is less than its carrying amount before applying the two-step goodwill impairment test. If an entity concludes it is not more likely than not that the fair value of a reporting unit is less than its carrying amount, it need not perform the two-step impairment test. The ASU is effective for annual and interim goodwill impairment tests performed for fiscal years beginning after December 15, 2011. The adoption of ASU 2011-08 is not expected to have an impact on Bancorp’s financial statements.
In May 2011, the FASB issued ASU No. 2011-04, Amendments to Achieve Common Fair Value Measurement and Disclosure Requirements in U.S. GAAP and International Financial Reporting Standards (Topic 820)-Fair Value Measurement (ASU 2011-04), to provide a consistent definition of fair value and ensure that the fair value measurement and disclosure requirements are similar between U.S. GAAP and International Financial Reporting Standards. ASU 2011-04 changes certain fair value measurement principles and enhances the disclosure requirements particularly for level 3 fair value measurements. ASU 2011-04 is effective for Bancorp in its first quarter of fiscal 2012 and will be applied prospectively. Bancorp is evaluating the impact of ASU 2011-04, and believes there will be no significant impact on its consolidated financial statements.
In December 2011, the FASB issued ASU No. 2011-11, Disclosures about Offsetting Assets and Liabilities , which requires disclosures to allow investors to better compare financial statements prepared under U.S. GAAP with financial statements prepared under International Financial Reporting Standards (IFRS). Entities are required to provide disclosures about financial instruments and derivative instruments that are either offset on the statement of financial position or subject to an enforceable master netting arrangement or similar agreement, irrespective of whether they are offset on the statement of financial position. Entities are required to provide both net and gross information for these assets and liabilities in order to enhance comparability between those entities that prepare their financial statements on the basis of U.S. GAAP and those entities that prepare their financial statements on the basis of IFRS. The ASU is effective for annual periods beginning January 1, 2013, and interim periods within those annual periods. Retrospective application is required. The adoption of ASU 2011-11 is not expected to have an impact on Bancorp’s financial statements.
Information required by this item is included in Item 7, “Management’s Discussion and Analysis of Financial Condition and Results of Operations” of this Form 10-K.
The following consolidated financial statements of Bancorp, and reports of independent registered public accounting firm and management are included below:
|
|
Consolidated Balance Sheets - December 31, 2011 and 2010 |
|
|
|
Consolidated Statements of Income - years ended December 31, 2011, 2010 and 2009 |
|
|
|
Consolidated Statements of Changes in Stockholders’ Equity - years ended December 31, 2011, 2010 and 2009 |
|
|
|
Consolidated Statements of Comprehensive Income - years ended December 31, 2011, 2010 and 2009 |
|
|
|
Consolidated Statements of Cash Flows - years ended December 31, 2011, 2010 and 2009 |
|
|
|
Notes to Consolidated Financial Statements |
|
|
|
Report of Independent Registered Public Accounting Firm |
|
|
|
Management’s Report on Consolidated Financial Statements |
|
|
|
|
December 31, |
|
||||
|
(Dollars in thousands) |
|
2011 |
|
2010 |
|
||
|
|
|
|
|
|
|
||
|
Assets |
|
|
|
|
|
||
|
Cash and due from banks |
|
$ |
32,901 |
|
$ |
17,702 |
|
|
Federal funds sold and interest bearing due from banks |
|
22,019 |
|
23,953 |
|
||
|
Mortgage loans held for sale |
|
4,381 |
|
12,387 |
|
||
|
Securities available for sale (amortized cost of $343,059 in 2011 and $240,097 in 2010) |
|
352,185 |
|
245,332 |
|
||
|
Securities held to maturity (fair value of $22 in 2010) |
|
— |
|
20 |
|
||
|
Federal Home Loan Bank stock |
|
4,948 |
|
4,771 |
|
||
|
Other securities |
|
1,001 |
|
1,001 |
|
||
|
Loans |
|
1,544,845 |
|
1,508,425 |
|
||
|
Less allowance for loan losses |
|
29,745 |
|
25,543 |
|
||
|
Net loans |
|
1,515,100 |
|
1,482,882 |
|
||
|
Premises and equipment, net |
|
36,611 |
|
31,665 |
|
||
|
Bank owned life insurance |
|
27,143 |
|
26,124 |
|
||
|
Accrued interest receivable |
|
5,964 |
|
6,288 |
|
||
|
Other assets |
|
50,844 |
|
50,820 |
|
||
|
|
|
|
|
|
|
||
|
Total assets |
|
$ |
2,053,097 |
|
$ |
1,902,945 |
|
|
|
|
|
|
|
|
||
|
Liabilities |
|
|
|
|
|
||
|
Deposits |
|
|
|
|
|
||
|
Non-interest bearing |
|
$ |
313,587 |
|
$ |
247,465 |
|
|
Interest bearing |
|
1,304,152 |
|
1,246,003 |
|
||
|
Total deposits |
|
1,617,739 |
|
1,493,468 |
|
||
|
|
|
|
|
|
|
||
|
Securities sold under agreements to repurchase |
|
66,026 |
|
60,075 |
|
||
|
Federal funds purchased |
|
37,273 |
|
25,436 |
|
||
|
Other short-term borrowings |
|
— |
|
1,998 |
|
||
|
Accrued interest payable |
|
232 |
|
304 |
|
||
|
Other liabilities |
|
42,810 |
|
50,461 |
|
||
|
Federal Home Loan Bank advances |
|
60,431 |
|
60,442 |
|
||
|
Subordinated debentures |
|
40,900 |
|
40,900 |
|
||
|
|
|
|
|
|
|
||
|
Total liabilities |
|
1,865,411 |
|
1,733,084 |
|
||
|
|
|
|
|
|
|
||
|
Stockholders’ equity |
|
|
|
|
|
||
|
Preferred stock, no par value; 1,000,000 shares authorized; no shares issued or outstanding |
|
— |
|
— |
|
||
|
Common stock, no par value; 20,000,000 shares authorized; issued and outstanding 13,819,319 shares in 2011 and 13,736,942 shares in 2010 |
|
6,953 |
|
6,679 |
|
||
|
Additional paid-in capital |
|
14,599 |
|
12,206 |
|
||
|
Retained earnings |
|
160,672 |
|
147,837 |
|
||
|
Accumulated other comprehensive income |
|
5,462 |
|
3,139 |
|
||
|
|
|
|
|
|
|
||
|
Total stockholders’ equity |
|
187,686 |
|
169,861 |
|
||
|
|
|
|
|
|
|
||
|
Total liabilities and stockholders’ equity |
|
$ |
2,053,097 |
|
$ |
1,902,945 |
|
See accompanying notes to consolidated financial statements.
|
|
|
Years ended December 31, |
|
|||||||
|
(In thousands, except per share data) |
|
2011 |
|
2010 |
|
2009 |
|
|||
|
|
|
|
|
|
|
|
|
|||
|
Interest income |
|
|
|
|
|
|
|
|||
|
Loans |
|
$ |
79,049 |
|
$ |
79,203 |
|
$ |
76,889 |
|
|
Federal funds sold |
|
255 |
|
138 |
|
79 |
|
|||
|
Mortgage loans held for sale |
|
231 |
|
339 |
|
389 |
|
|||
|
Securities |
|
|
|
|
|
|
|
|||
|
Taxable |
|
5,174 |
|
5,274 |
|
5,378 |
|
|||
|
Tax-exempt |
|
1,330 |
|
1,192 |
|
1,121 |
|
|||
|
|
|
|
|
|
|
|
|
|||
|
Total interest income |
|
86,039 |
|
86,146 |
|
83,856 |
|
|||
|
|
|
|
|
|
|
|
|
|||
|
Interest expense |
|
|
|
|
|
|
|
|||
|
Deposits |
|
10,105 |
|
13,170 |
|
18,001 |
|
|||
|
Securities sold under agreements to repurchase |
|
253 |
|
332 |
|
271 |
|
|||
|
Federal funds purchased |
|
38 |
|
45 |
|
63 |
|
|||
|
Other short-term borrowings |
|
— |
|
— |
|
— |
|
|||
|
Federal Home Loan Bank advances |
|
1,460 |
|
2,266 |
|
3,341 |
|
|||
|
Subordinated debentures |
|
3,451 |
|
3,454 |
|
3,505 |
|
|||
|
|
|
|
|
|
|
|
|
|||
|
Total interest expense |
|
15,307 |
|
19,267 |
|
25,181 |
|
|||
|
Net interest income |
|
70,732 |
|
66,879 |
|
58,675 |
|
|||
|
|
|
|
|
|
|
|
|
|||
|
Provision for loan losses |
|
12,600 |
|
11,469 |
|
12,775 |
|
|||
|
Net interest income after provision for loan losses |
|
58,132 |
|
55,410 |
|
45,900 |
|
|||
|
|
|
|
|
|
|
|
|
|||
|
Non-interest income |
|
|
|
|
|
|
|
|||
|
Investment management and trust services |
|
13,841 |
|
13,260 |
|
11,180 |
|
|||
|
Service charges on deposit accounts |
|
8,348 |
|
8,600 |
|
8,531 |
|
|||
|
Bankcard transaction revenue |
|
3,722 |
|
3,313 |
|
2,909 |
|
|||
|
Gains on sales of mortgage loans held for sale |
|
2,122 |
|
2,321 |
|
2,163 |
|
|||
|
Gains (losses) on sales of securities available for sale |
|
— |
|
159 |
|
(339 |
) |
|||
|
Brokerage commissions and fees |
|
2,219 |
|
2,136 |
|
1,749 |
|
|||
|
Bank owned life insurance income |
|
1,019 |
|
995 |
|
988 |
|
|||
|
Other |
|
1,973 |
|
2,955 |
|
2,855 |
|
|||
|
|
|
|
|
|
|
|
|
|||
|
Total non-interest income |
|
33,244 |
|
33,739 |
|
30,036 |
|
|||
|
|
|
|
|
|
|
|
|
|||
|
Non-interest expenses |
|
|
|
|
|
|
|
|||
|
Salaries and employee benefits |
|
33,125 |
|
33,485 |
|
30,147 |
|
|||
|
Net occupancy expense |
|
5,192 |
|
4,934 |
|
4,185 |
|
|||
|
Data processing expense |
|
5,014 |
|
4,834 |
|
4,479 |
|
|||
|
Furniture and equipment expense |
|
1,299 |
|
1,272 |
|
1,234 |
|
|||
|
FDIC insurance |
|
1,655 |
|
2,038 |
|
2,687 |
|
|||
|
Loss (gain) on other real estate owned |
|
1,716 |
|
(11 |
) |
— |
|
|||
|
Other |
|
11,580 |
|
10,579 |
|
9,963 |
|
|||
|
|
|
|
|
|
|
|
|
|||
|
Total non-interest expenses |
|
59,581 |
|
57,131 |
|
52,695 |
|
|||
|
|
|
|
|
|
|
|
|
|||
|
Income before income taxes |
|
31,795 |
|
32,018 |
|
23,241 |
|
|||
|
Income tax expense |
|
8,191 |
|
9,065 |
|
6,933 |
|
|||
|
Net income |
|
$ |
23,604 |
|
$ |
22,953 |
|
$ |
16,308 |
|
|
Net income per share, basic |
|
$ |
1.71 |
|
$ |
1.68 |
|
$ |
1.20 |
|
|
Net income per share, diluted |
|
$ |
1.71 |
|
$ |
1.67 |
|
$ |
1.19 |
|
See accompanying notes to consolidated financial statements.
Consolidated Statements of Changes in Stockholders’ Equity
|
|
|
Three years ended December 31, 2011 |
|
|||||||||||||||
|
|
|
|
|
|
|
|
|
Accumulated |
|
|
|
|||||||
|
|
|
Common stock |
|
Additional |
|
|
|
other |
|
|
|
|||||||
|
(In thousands, except per share |
|
Number of |
|
|
|
paid-in |
|
Retained |
|
comprehensive |
|
|
|
|||||
|
data) |
|
shares |
|
Amount |
|
capital |
|
earnings |
|
income (loss) |
|
Total |
|
|||||
|
|
|
|
|
|
|
|
|
|
|
|
|
|
|
|||||
|
Balance December 31, 2008 |
|
13,474 |
|
$ |
5,802 |
|
$ |
7,485 |
|
$ |
128,923 |
|
$ |
2,290 |
|
$ |
144,500 |
|
|
|
|
|
|
|
|
|
|
|
|
|
|
|
|
|||||
|
Net income |
|
— |
|
— |
|
— |
|
16,308 |
|
— |
|
16,308 |
|
|||||
|
Other comprehensive income, net of tax |
|
— |
|
— |
|
— |
|
— |
|
(91 |
) |
(91 |
) |
|||||
|
Stock compensation expense |
|
— |
|
— |
|
691 |
|
— |
|
— |
|
691 |
|
|||||
|
Shares issued for stock options exercised |
|
114 |
|
379 |
|
1,204 |
|
— |
|
— |
|
1,583 |
|
|||||
|
Shares issued for dividend reinvestment plan |
|
10 |
|
35 |
|
219 |
|
— |
|
— |
|
254 |
|
|||||
|
Shares issued for non-vested restricted stock |
|
26 |
|
85 |
|
481 |
|
(566 |
) |
— |
|
— |
|
|||||
|
Cash dividends, $0.68 per share |
|
— |
|
— |
|
— |
|
(9,238 |
) |
— |
|
(9,238 |
) |
|||||
|
Shares repurchased and cancelled |
|
(17 |
) |
(57 |
) |
(351 |
) |
15 |
|
— |
|
(393 |
) |
|||||
|
|
|
|
|
|
|
|
|
|
|
|
|
|
|
|||||
|
Balance December 31, 2009 |
|
13,607 |
|
$ |
6,244 |
|
$ |
9,729 |
|
$ |
135,442 |
|
$ |
2,199 |
|
$ |
153,614 |
|
|
|
|
|
|
|
|
|
|
|
|
|
|
|
|
|||||
|
Net income |
|
— |
|
— |
|
— |
|
22,953 |
|
— |
|
22,953 |
|
|||||
|
Other comprehensive income, net of tax |
|
— |
|
— |
|
— |
|
— |
|
940 |
|
940 |
|
|||||
|
Stock compensation expense |
|
— |
|
— |
|
952 |
|
— |
|
— |
|
952 |
|
|||||
|
Shares issued for stock options exercised |
|
93 |
|
311 |
|
919 |
|
— |
|
— |
|
1,230 |
|
|||||
|
Shares issued for dividend reinvestment plan |
|
1 |
|
2 |
|
14 |
|
— |
|
— |
|
16 |
|
|||||
|
Shares issued for non-vested restricted stock |
|
54 |
|
181 |
|
961 |
|
(1,142 |
) |
— |
|
— |
|
|||||
|
Cash dividends, $0.69 per share |
|
— |
|
— |
|
— |
|
(9,448 |
) |
— |
|
(9,448 |
) |
|||||
|
Shares repurchased and cancelled |
|
(18 |
) |
(59 |
) |
(369 |
) |
32 |
|
— |
|
(396 |
) |
|||||
|
|
|
|
|
|
|
|
|
|
|
|
|
|
|
|||||
|
Balance December 31, 2010 |
|
13,737 |
|
$ |
6,679 |
|
$ |
12,206 |
|
$ |
147,837 |
|
$ |
3,139 |
|
$ |
169,861 |
|
|
|
|
|
|
|
|
|
|
|
|
|
|
|
|
|||||
|
Net income |
|
— |
|
— |
|
— |
|
23,604 |
|
— |
|
23,604 |
|
|||||
|
Other comprehensive income, net of tax |
|
— |
|
— |
|
— |
|
— |
|
2,323 |
|
2,323 |
|
|||||
|
Stock compensation expense |
|
— |
|
— |
|
1,165 |
|
— |
|
— |
|
1,165 |
|
|||||
|
Shares issued for stock options exercised |
|
47 |
|
157 |
|
493 |
|
— |
|
— |
|
650 |
|
|||||
|
Shares issued for dividend reinvestment plan |
|
1 |
|
2 |
|
11 |
|
— |
|
— |
|
13 |
|
|||||
|
Shares issued for non-vested restricted stock |
|
42 |
|
140 |
|
866 |
|
(1,006 |
) |
— |
|
— |
|
|||||
|
Cash dividends, $0.72 per share |
|
— |
|
— |
|
— |
|
(9,930 |
) |
— |
|
(9,930 |
) |
|||||
|
Shares repurchased and cancelled |
|
(8 |
) |
(25 |
) |
(142 |
) |
167 |
|
— |
|
— |
|
|||||
|
|
|
|
|
|
|
|
|
|
|
|
|
|
|
|||||
|
Balance December 31, 2011 |
|
13,819 |
|
$ |
6,953 |
|
$ |
14,599 |
|
$ |
160,672 |
|
$ |
5,462 |
|
$ |
187,686 |
|
See accompanying notes to consolidated financial statements.
Consolidated Statements of Comprehensive Income
|
|
|
Years ended December 31, |
|
|||||||
|
(In thousands) |
|
2011 |
|
2010 |
|
2009 |
|
|||
|
|
|
|
|
|
|
|
|
|||
|
Net income |
|
$ |
23,604 |
|
$ |
22,953 |
|
$ |
16,308 |
|
|
Other comprehensive income (loss), net of tax: |
|
|
|
|
|
|
|
|||
|
Unrealized gains (losses) on securities available for sale: |
|
|
|
|
|
|
|
|||
|
Unrealized gains (losses) arising during the period (net of tax of $1,362, $580, and $(163), respectively) |
|
2,530 |
|
1,076 |
|
(303 |
) |
|||
|
Reclassification adjustment for securities losses (gains) realized in income (net of tax of $0, $(56), and $119, respectively) |
|
— |
|
(103 |
) |
220 |
|
|||
|
Minimum Pension Liability adjustment (net of tax of $(111), $(18), and $(4), respectively) |
|
(207 |
) |
(33 |
) |
(8 |
) |
|||
|
|
|
|
|
|
|
|
|
|||
|
Other comprehensive income (loss) |
|
2,323 |
|
940 |
|
(91 |
) |
|||
|
|
|
|
|
|
|
|
|
|||
|
Comprehensive income |
|
$ |
25,927 |
|
$ |
23,893 |
|
$ |
16,217 |
|
See accompanying notes to consolidated financial statements.
|
|
|
Years ended December 31 |
|
|||||||
|
(in thousands) |
|
2011 |
|
2010 |
|
2009 |
|
|||
|
|
|
|
|
|
|
|
|
|||
|
Operating activities |
|
|
|
|
|
|
|
|||
|
Net income |
|
$ |
23,604 |
|
$ |
22,953 |
|
$ |
16,308 |
|
|
Adjustments to reconcile net income to net cash provided by operating activities: |
|
|
|
|
|
|
|
|||
|
Provision for loan losses |
|
12,600 |
|
11,469 |
|
12,775 |
|
|||
|
Depreciation, amortization and accretion, net |
|
4,019 |
|
3,274 |
|
2,554 |
|
|||
|
Deferred income tax benefit |
|
(2,068 |
) |
(1,556 |
) |
(1,949 |
) |
|||
|
Loss (gain) on sale of securities available for sale |
|
— |
|
(159 |
) |
339 |
|
|||
|
Gains on sales of mortgage loans held for sale |
|
(2,122 |
) |
(2,321 |
) |
(2,163 |
) |
|||
|
Origination of mortgage loans held for sale |
|
(126,306 |
) |
(173,112 |
) |
(231,399 |
) |
|||
|
Proceeds from sale of mortgage loans held for sale |
|
136,434 |
|
176,295 |
|
223,263 |
|
|||
|
Bank owned life insurance income |
|
(1,019 |
) |
(995 |
) |
(988 |
) |
|||
|
Decrease (increase) in value of private investment fund |
|
421 |
|
(606 |
) |
(459 |
) |
|||
|
Loss (gain) on the sale of foreclosed assets |
|
1,716 |
|
27 |
|
(46 |
) |
|||
|
Loss on the disposal of equipment |
|
382 |
|
2 |
|
— |
|
|||
|
Stock compensation expense |
|
1,165 |
|
952 |
|
691 |
|
|||
|
Excess tax benefits from share-based compensation arrangements |
|
(125 |
) |
(140 |
) |
(244 |
) |
|||
|
Valuation losses reversal of mortgage servicing rights |
|
— |
|
— |
|
(176 |
) |
|||
|
Decrease (increase) in accrued interest receivable and other assets |
|
3,533 |
|
(6,959 |
) |
(6,374 |
) |
|||
|
Increase (decrease) in accrued interest payable and other liabilities |
|
(7,805 |
) |
7,520 |
|
916 |
|
|||
|
Net cash provided by operating activities |
|
44,429 |
|
36,644 |
|
13,048 |
|
|||
|
|
|
|
|
|
|
|
|
|||
|
Investing activities |
|
|
|
|
|
|
|
|||
|
Purchases of securities available for sale |
|
(404,514 |
) |
(254,332 |
) |
(268,064 |
) |
|||
|
Proceeds from sale of securities available for sale |
|
— |
|
27,064 |
|
7,774 |
|
|||
|
Proceeds from maturities of securities available for sale |
|
300,620 |
|
210,907 |
|
203,756 |
|
|||
|
Proceeds from maturities of securities held to maturity |
|
20 |
|
15 |
|
8 |
|
|||
|
Net increase in loans |
|
(57,037 |
) |
(84,559 |
) |
(84,624 |
) |
|||
|
Purchases of premises and equipment |
|
(8,249 |
) |
(6,173 |
) |
(2,607 |
) |
|||
|
Proceeds from disposal of equipment |
|
7 |
|
4 |
|
— |
|
|||
|
Proceeds from sale of foreclosed assets |
|
7,206 |
|
1,808 |
|
1,012 |
|
|||
|
Net cash used in investing activities |
|
(161,947 |
) |
(105,266 |
) |
(142,745 |
) |
|||
|
|
|
|
|
|
|
|
|
|||
|
Financing activities |
|
|
|
|
|
|
|
|||
|
Net increase in deposits |
|
124,271 |
|
75,284 |
|
147,259 |
|
|||
|
Net increase in securities sold under agreements to repurchase and federal funds purchased |
|
17,788 |
|
14,672 |
|
4,322 |
|
|||
|
Net (decrease) increase in other short-term borrowings |
|
(1,998 |
) |
189 |
|
677 |
|
|||
|
Proceeds from Federal Home Loan Bank advances |
|
— |
|
50,000 |
|
20,460 |
|
|||
|
Repayments of Federal Home Loan Bank advances |
|
(11 |
) |
(50,011 |
) |
(30,007 |
) |
|||
|
Prepayment penalty on modification of Federal Home Loan Bank advances |
|
— |
|
(1,336 |
) |
— |
|
|||
|
Repayments of subordinated debentures |
|
— |
|
(30 |
) |
(30 |
) |
|||
|
Issuance of common stock for options and dividend reinvestment plan |
|
705 |
|
1,106 |
|
1,687 |
|
|||
|
Excess tax benefits from share-based compensation arrangements |
|
125 |
|
140 |
|
244 |
|
|||
|
Common stock repurchases |
|
(167 |
) |
(396 |
) |
(393 |
) |
|||
|
Cash dividends paid |
|
(9,930 |
) |
(11,765 |
) |
(9,211 |
) |
|||
|
Net cash provided by financing activities |
|
130,783 |
|
77,853 |
|
135,008 |
|
|||
|
|
|
|
|
|
|
|
|
|||
|
Net increase in cash and cash equivalents |
|
13,265 |
|
9,231 |
|
5,311 |
|
|||
|
|
|
|
|
|
|
|
|
|||
|
Cash and cash equivalents at beginning of year |
|
41,655 |
|
32,424 |
|
27,113 |
|
|||
|
|
|
|
|
|
|
|
|
|
|
|
|
Cash and cash equivalents at end of period |
|
$ |
54,920 |
|
$ |
41,655 |
|
$ |
32,424 |
|
|
|
|
|
|
|
|
|
|
|||
|
Supplemental cash flow information: |
|
|
|
|
|
|
|
|||
|
Income tax payments |
|
$ |
4,611 |
|
$ |
8,945 |
|
$ |
9,155 |
|
|
Cash paid for interest |
|
15,379 |
|
19,390 |
|
25,444 |
|
|||
|
Supplemental non-cash activity: |
|
|
|
|
|
|
|
|||
|
Transfers from loans to foreclosed assets |
|
$ |
12,219 |
|
$ |
5,776 |
|
$ |
759 |
|
|
See accompanying notes to consolidated financial statements. |
|
|
|
|
|
|
Notes to Consolidated Financial Statements
(1) Summary of Significant Accounting Policies
Principles of Consolidation and Nature of Operations
The consolidated financial statements include the accounts of S.Y. Bancorp, Inc. (Bancorp) and its wholly owned subsidiary, Stock Yards Bank & Trust Company (the Bank). S.Y. Bancorp Capital Trust II is a Delaware statutory trust that is a wholly-owned unconsolidated finance subsidiary of S.Y. Bancorp, Inc. Significant intercompany transactions and accounts have been eliminated in consolidation. Certain prior year amounts have been reclassified to conform to the 2011 presentation. Bancorp has evaluated subsequent events for recognition or disclosure up to the date on which financial statements were issued and determined there were none.
In addition to traditional commercial and personal banking activities, the Bank has an investment management and trust department offering a wide range of trust administration, investment management, retirement planning, estate administration and financial planning services. The Bank’s primary market area is Louisville, Kentucky and surrounding communities including southern Indiana. Other markets include Indianapolis, Indiana where the Bank has two full service branches, and Cincinnati, Ohio where the Bank has three full service branches.
Basis of Financial Statement Presentation and Use of Estimates
The consolidated financial statements of Bancorp and its subsidiaries have been prepared in conformity with accounting principles generally accepted in the United States of America (US GAAP) and conform to predominant practices within the banking industry. In preparing the consolidated financial statements, management is required to make estimates and assumptions that affect the reported amounts of certain assets and liabilities and disclosure of contingent assets and liabilities at the date of the financial statements and the reported amounts of related revenues and expenses during the reporting period. Actual results could differ from those estimates. Material estimates that are particularly susceptible to significant change relate to the valuation of other real estate owned, determination of the allowance for loan losses and income tax assets, estimated liabilities and expense.
Cash and Cash Equivalents
Cash and cash equivalents include cash and due from banks and Federal funds sold as segregated in the accompanying consolidated balance sheets.
Securities
Securities that Bancorp has the intent and ability to hold until maturity are carried at amortized cost. Securities available for sale include securities that may be sold in response to changes in interest rates, resultant prepayment risk and other factors related to interest rate and prepayment risk changes. Securities available for sale are carried at fair value with unrealized gains or losses, net of tax effect, included in stockholders’ equity. Amortization of premiums and accretion of discounts are recorded using the interest method over the life of the security. Gains or losses on sales of securities are computed on a specific identification cost basis for securities. Declines in the fair value of investment securities available for sale (with certain exceptions for debt securities noted below) that are deemed to be other-than-temporary are charged to earnings as a realized loss, and a new cost basis for the securities is established. In evaluating other-than-temporary impairment, management considers the length of time and extent to which the fair value has been less than cost, the financial condition and near-term prospects of the issuer, and the intent and ability of the Company to retain its investment in the issuer for a period of time sufficient to allow for any anticipated recovery in fair value in the near term. Declines in the fair value of debt securities below amortized cost are deemed to be other-than-temporary in circumstances where: (1) the Company has the intent to sell a security; (2) it is more likely than not that the Company will be required to sell the security before recovery of its amortized cost basis; or (3) the Company does not expect to recover the entire amortized cost basis of the security. If the Company intends to sell a security or if it is more likely than not
that the Company will be required to sell the security before recovery, an other-than-temporary impairment write-down is recognized in earnings equal to the difference between the security’s amortized cost basis and its fair value. If an entity does not intend to sell the security or it is not more likely than not that it will be required to sell the security before recovery, the other-than-temporary impairment write-down is separated into an amount representing credit loss, which is recognized in earnings, and an amount related to all other factors, which is recognized in other comprehensive income. Declines in value judged to be other-than-temporary are included in gains (losses) on sales of securities available for sale in the consolidated statements of income. See Note 3 for additional information on investment securities.
Mortgage Loans Held for Sale
Mortgage loans held for sale are initially recorded at the lower of cost or market value on an individual loan basis. All mortgage loans are covered by investor commitments, so gains on sales of mortgage loans are recorded at the time of disbursement of loan proceeds at the difference between the sales proceeds and the loan’s carrying value net of any origination costs. For each loan in the portfolio there is a commitment to purchase by an investor.
Loans
Loans are stated at the unpaid principal balance less net deferred loan fees or costs. Loan fees, net of any costs, are deferred and amortized over the life of the related loan on an effective yield basis. Interest income on loans is recorded on the accrual basis except for those loans in a non-accrual income status. Loans are placed in a non-accrual income status when the prospects for recovering both principal and accrued interest are considered doubtful or when a default of principal or interest has existed for 90 days or more unless such a loan is well secured and in the process of collection. When a loan is placed on non-accrual status, any interest previously accrued but not yet collected is reversed against current income. Interest income is recorded on a cash basis during the period a loan is on non-accrual status so long as the recovery of principal is reasonably assured. Non-accrual loans may be returned to accrual status once the prospects for recovering both principal and accrued interest are reasonably assured. Loans are accounted for as troubled debt restructuring when the Bank, for economic or legal reasons related to the debtor’s financial difficulties, grants a concession to the debtor that it would not otherwise consider. If a restructured loan at a current market rate performs according to its restructured terms, it shall be removed from restructured status generally after six months.
Loans are classified as impaired when it is probable the Bank will be unable to collect interest and principal according to the terms of the loan agreement. These loans are measured based on the present value of future cash flows discounted at the loans’ effective interest rate or at the estimated fair value of the loans’ collateral, if applicable. Impaired loans consist of loans in non-accrual status or loans accounted for as troubled debt restructuring.
Allowance for Loan Losses
The allowance for loan losses is maintained at a level that adequately provides for probable losses inherent in the loan portfolio. Management determines the adequacy of the allowance based on consideration of the following principal elements:
· Specific allocations are based upon probable losses on individually evaluated impaired loans. These estimates are based primarily upon collateral value less a discount representing estimated liquidation costs, but other objective factors such as payment history and financial condition of the borrower or guarantor may be considered as well.
· Allocations for individually significant loans not defined as impaired are assigned a loss allocation factor based on estimates needed for pools of loans with similar risk.
· Allocations for loans not reviewed are totaled by loan category and are assigned a loss allocation factor based upon the Bank’s historical net loss percentages by loan type.
· Additional allowance allocations are included based on subjective factors not necessarily associated with a specific credit or loan category which represent management’s effort to ensure that the overall allowance for loan losses appropriately reflects a margin for the imprecision necessarily inherent in the
estimates of expected credit losses. Management considers a number of subjective factors, including local and general economic business factors and trends and portfolio concentrations.
Based on this quantitative and qualitative analysis, provisions are made to the allowance for loan losses. Such provisions are reflected as a charge against current earnings in Bancorp’s consolidated statements of income.
The allocation of the allowance for loan losses by loan category is a result of the analysis above. The same procedures used to determine requirements for the allowance for loan losses establish the distribution of the allowance by loan category. The distribution of the allowance will change from period to period due to changes in the identified risk in each loan in the portfolio, changes in the aggregate loan balances by loan category, and changes in management’s view of the subjective factors noted above. Although the allowance for loan losses is comprised of specific and general allocations the entire allowance is available to absorb any credit losses.
The adequacy of the allowance for loan losses is monitored by the internal loan review staff and reported quarterly to the Audit and Loan Committees of the Board of Directors. Various regulatory agencies, as an integral part of their examination process, periodically review the adequacy of Bancorp’s allowance for loan losses. Such agencies may require Bancorp to make additional provisions to the allowance based upon their judgments about information available to them at the time of their examinations.
Premises and Equipment
Premises and equipment are carried at cost, less accumulated depreciation and amortization. Depreciation of premises and equipment is computed using straight-line methods over the estimated useful lives of the assets ranging from 3 to 40 years. Leasehold improvements are amortized on the straight-line method over the terms of the related leases, including expected renewals, or over the useful lives of the improvements, whichever is shorter. Maintenance and repairs are expensed as incurred while major additions and improvements are capitalized.
Other Assets
Bank-owned life insurance is carried at net realizable value, which considers any applicable surrender charges. Also, the Bank maintains life insurance policies other than BOLI in conjunction with its non-qualified defined benefit and non-qualified compensation plans.
Other real estate is carried at the lower of cost or estimated fair value minus estimated selling costs. Any write downs to fair value at the date of acquisition are charged to the allowance for loan losses. In certain situations, improvements to prepare assets for sale are capitalized if those costs increase the estimated fair value of the asset. Expenses incurred in maintaining assets, write downs to reflect subsequent declines in value, and realized gains or losses are reflected in operations and are included in non-interest income and expense.
Bancorp’s investment in a domestic private investment fund is comprised of bank and other financial industry securities and is accounted for as an equity-method investment in accordance with US GAAP.
Mortgage servicing rights (MSRs) are amortized in proportion to and over the period of estimated net servicing income, considering appropriate prepayment assumptions. MSRs are evaluated quarterly for impairment by comparing the carrying value to the fair value.
Goodwill is measured and evaluated at least annually for impairment. No impairment charges have been deemed necessary or recorded to date, as the fair value is substantially in excess of the carrying value.
Securities Sold Under Agreements to Repurchase
Bancorp enters into sales of securities under agreement to repurchase at a specified future date. Such repurchase agreements are considered financing agreements and, accordingly, the obligation to repurchase assets sold is reflected as a liability in the consolidated balance sheets of Bancorp. Repurchase agreements
are collateralized by debt securities which are owned and under the control of Bancorp. These agreements are used in conjunction with corporate cash management accounts.
Repurchased Shares of Common Stock
The repurchase of Bancorp’s common stock is recorded at cost, and repurchased shares are returned to the status of authorized, but unissued. Amounts recorded in common stock are based on the stated value of the shares, as there is no par value. Residual amounts are recorded in additional paid in capital.
Income Taxes
Bancorp accounts for income taxes using the asset and liability method. The objective of the asset and liability method is to establish deferred tax assets and liabilities for temporary differences between the financial reporting and the tax bases of Bancorp’s assets and liabilities at enacted tax rates expected to be in effect when such amounts are realized or settled. The effect on deferred tax assets and liabilities of a change in tax rates is recognized in the statement of income in the period that includes the enactment date.
No valuation allowance for deferred tax assets was recorded as of December 31, 2011 and 2010 because Bancorp has sufficient prior taxable income and tax planning strategies to allow for utilization of the deductible temporary differences and capital loss carryforwards within the carryforward period. Management believes it is more likely than not that all deferred tax assets will be realized.
To the extent unrecognized income tax benefits become realized or the related accrued interest is no longer necessary, Bancorp’s provision for income taxes would be favorably impacted. As of December 31, 2011 and 2010, the gross amount of unrecognized tax benefits was $101,000 and $230,000, respectively. If recognized, all of the tax benefits would increase net income, resulting in a decrease in the effective tax rate. The amount of unrecognized tax benefits may increase or decrease in the future for various reasons, including adding amounts for current year tax positions, expiration of open income tax returns due to statutes of limitation, changes in management’s judgment about the level of uncertainty, status of examination, litigation and legislative activity, and the addition or elimination of uncertain tax positions.
Bancorp’s policy is to report interest and penalties, if any, related to unrecognized tax benefits in income tax expense. As of December 31, 2011 and 2010, the amount accrued for the potential payment of interest and penalties was $7,000 and $20,000, respectively.
Bancorp invests in certain partnerships that yield low-income housing, historic and new market tax credits as well as tax deductible losses. These tax benefits are recognized in income tax expense using an effective yield method over the life of the investment.
Net Income Per Share
Basic net income per common share is determined by dividing net income by the weighted average number of shares of common stock outstanding. Diluted net income per share is determined by dividing net income by the weighted average number of shares of common stock outstanding plus the weighted average number of shares that would be issued upon exercise of dilutive options, assuming proceeds are used to repurchase shares under the treasury stock method.
Comprehensive Income
Comprehensive income is defined as the change in equity (net assets) of a business enterprise during a period from transactions and other events and circumstances from non-owner sources. For Bancorp, this includes net income, changes in unrealized gains and losses on available for sale investment securities, net of taxes, and minimum pension liability adjustments, net of taxes.
Segment Information
The Bank provides a broad range of financial services to individuals, corporations and others through its thirty full service banking locations as of December 31, 2011. These services include lending and deposit services, cash management services, securities brokerage activities, mortgage origination and investment management and trust activities. The Bank’s operations are considered by management to be aggregated in two reportable operating segments: commercial banking and investment management and trust.
Stock-Based Compensation
For all awards granted after 2005, stock-based compensation expense recognized is based on the fair value of the portion of stock-based payment awards that are ultimately expected to vest, reduced for estimated forfeitures. US GAAP requires forfeitures to be estimated at the time of grant and revised, if necessary, in subsequent periods if actual forfeitures differ from those estimates.
Derivatives
Bancorp offers interest rate swaps to customers desiring long-term fixed rate lending whereby Bancorp receives interest at a fixed rate and pays interest at a variable rate. Simultaneously, Bancorp enters into an interest rate swap agreement with a correspondent bank whereby Bancorp pays interest at a fixed rate and receives interest at a variable rate. Because of matching terms of offsetting contracts and the collateral provisions mitigating any non-performance risk, changes in fair value subsequent to initial recognition have an insignificant effect on earnings.
Bancorp’s interest rate swaps are recognized as other assets and liabilities in the consolidated balance sheet at fair value. Bancorp’s derivative instruments have not been designated as hedging instruments. These undesignated derivative instruments are recognized on the consolidated balance sheet at fair value, with changes in fair value, due to changes in prevailing interest rates, recorded in other noninterest income.
Recently Adopted Accounting Pronouncement
In April 2011, the FASB issued ASU No. 2011-02, A Creditor’s Determination of Whether a Restructuring Is a Troubled Debt Restructuring, as a result of stakeholders questioning whether additional guidance or clarification was needed to assist creditors with determining whether a modification is a Troubled Debt Restructuring (TDR). The final standard does not change the long-standing guidance that a restructuring of a debt constitutes a TDR “if the creditor for economic or legal reasons related to the debtor’s financial difficulties grants a concession to the debtor that it would not otherwise consider.” In other words, the creditor must conclude that both a restructuring constitutes a concession not otherwise granted in its operations, and the debtor is experiencing financial difficulties. For the purposes of those two tests, the final ASU provides clarifications regarding the debtor’s access to funds at current market rates, assessing the debtor’s financial difficulties, and payment delays. The amendments in this update were effective for the first interim or annual period beginning on or after June 15, 2011, and were applied retrospectively to the beginning of the annual period of adoption. The adoption of ASU 2011-02 did not result in additional loans being identified as TDR.
(2) Restrictions on Cash and Due from Banks
The Bank is required to maintain an average reserve balance in cash or with the Federal Reserve Bank relating to customer deposits. The amount of those required reserve balances was approximately $679,000 and $915,000 at December 31, 2011 and 2010, respectively.
(3) Securities
The amortized cost, unrealized gains and losses, and fair value of securities available for sale follow:
|
December 31, 2011 |
|
Amortized |
|
Unrealized |
|
|
|
||||||
|
Securities available for sale |
|
Cost |
|
Gains |
|
Losses |
|
Fair Value |
|
||||
|
(in thousands) |
|
|
|
|
|
|
|
|
|
||||
|
|
|
|
|
|
|
|
|
|
|
||||
|
U.S. Treasury and other U.S. government obligations |
|
$ |
115,001 |
|
$ |
— |
|
$ |
— |
|
$ |
115,001 |
|
|
Government sponsored enterprise obligations |
|
43,349 |
|
2,837 |
|
— |
|
46,186 |
|
||||
|
Mortgage-backed securities |
|
116,954 |
|
3,564 |
|
23 |
|
120,495 |
|
||||
|
Obligations of states and political subdivisions |
|
66,755 |
|
2,779 |
|
33 |
|
69,501 |
|
||||
|
Trust preferred securities of financial institutions |
|
1,000 |
|
2 |
|
— |
|
1,002 |
|
||||
|
|
|
|
|
|
|
|
|
|
|
||||
|
Total securities available for sale |
|
$ |
343,059 |
|
$ |
9,182 |
|
$ |
56 |
|
$ |
352,185 |
|
|
December 31, 2010 |
|
Amortized |
|
Unrealized |
|
|
|
||||||
|
Securities available for sale |
|
Cost |
|
Gains |
|
Losses |
|
Fair Value |
|
||||
|
(in thousands) |
|
|
|
|
|
|
|
|
|
||||
|
|
|
|
|
|
|
|
|
|
|
||||
|
Government sponsored enterprise obligations |
|
$ |
111,802 |
|
$ |
2,737 |
|
$ |
— |
|
$ |
114,539 |
|
|
Mortgage-backed securities |
|
58,616 |
|
2,348 |
|
216 |
|
60,748 |
|
||||
|
Obligations of states and political subdivisions |
|
68,429 |
|
777 |
|
417 |
|
68,789 |
|
||||
|
Trust preferred securities of financial institutions |
|
1,250 |
|
6 |
|
— |
|
1,256 |
|
||||
|
|
|
|
|
|
|
|
|
|
|
||||
|
Total securities available for sale |
|
$ |
240,097 |
|
$ |
5,868 |
|
$ |
633 |
|
$ |
245,332 |
|
No securities were sold in 2011. In the third quarter of 2010, for tax planning purposes, Bancorp sold securities with a cost of $26,905,000, resulting in gains totaling $159,000. In 2009, Bancorp sold trust preferred securities, generating a gross loss of $359,000, and mortgage-backed securities, generating gross gains of $20,000.
At December 31, 2010, Bancorp had mortgage-backed securities classified as held to maturity. These securities, with an amortized cost of $20,000, had a fair value of $22,000. There are no securities held to maturity as of December 31, 2011.
In addition to the available for sale and held to maturity portfolios, investment securities held by Bancorp include certain securities which are not readily marketable, and are carried at cost. This category includes holdings of Federal Home Loan Bank of Cincinnati (FHLB) stock which are required for borrowing availability, and are classified as restricted securities. Other securities consist of a Community Reinvestment Act (CRA) investment which matures in 2014, and is fully collateralized with a government agency security of similar duration.
Bancorp reviewed the investment in FHLB Stock as of December 31, 2011, considering the FHLB equity position, its continuance of dividend payments, liquidity position, and positive year-to-date net income. Based on this review, Bancorp is of the opinion that its investment in FHLB stock is not impaired.
A summary of securities as of December 31, 2011 based on maturity is presented below. Actual maturities may differ from contractual maturities because issuers may have the right to call or prepay obligations.
|
Securities available for sale |
|
Amortized Cost |
|
Fair Value |
|
||
|
(in thousands) |
|
|
|
|
|
||
|
|
|
|
|
|
|
||
|
Due within 1 year |
|
$ |
130,504 |
|
$ |
130,707 |
|
|
Due after 1 but within 5 years |
|
66,393 |
|
69,468 |
|
||
|
Due after 5 but within 10 years |
|
26,206 |
|
28,491 |
|
||
|
Due after 10 years |
|
3,002 |
|
3,024 |
|
||
|
Mortgage-backed securities |
|
116,954 |
|
120,495 |
|
||
|
|
|
|
|
|
|
||
|
Total securities available for sale |
|
$ |
343,059 |
|
$ |
352,185 |
|
Securities with a carrying value of approximately $125.4 million at December 31, 2011 and $87.5 million at December 31, 2010 were pledged to secure the accounts of commercial depositors in cash management accounts, public deposits, and cash balances for certain investment management and trust accounts.
At year end 2011 and 2010, there were no holdings of securities of any one issuer, other than the U.S. Government and its agencies, in an amount greater than 10% of stockholders’ equity.
Securities with unrealized losses at December 31, 2011 and 2010, not recognized in income are as follows:
|
|
|
Less than 12 months |
|
12 months or more |
|
Total |
|
||||||||||||
|
|
|
Fair |
|
Unrealized |
|
Fair |
|
Unrealized |
|
Fair |
|
Unrealized |
|
||||||
|
(In thousands) |
|
Value |
|
Losses |
|
Value |
|
Losses |
|
Value |
|
Losses |
|
||||||
|
|
|
|
|
|
|
|
|
|
|
|
|
|
|
||||||
|
December 31, 2011 |
|
|
|
|
|
|
|
|
|
|
|
|
|
||||||
|
Mortgage-backed securities |
|
$ |
5,122 |
|
$ |
23 |
|
$ |
— |
|
$ |
— |
|
$ |
5,122 |
|
$ |
23 |
|
|
Obligations of states and political subdivisions |
|
2,644 |
|
17 |
|
1,021 |
|
16 |
|
3,665 |
|
33 |
|
||||||
|
Total temporarily impaired securities |
|
$ |
7,766 |
|
$ |
40 |
|
$ |
1,021 |
|
$ |
16 |
|
$ |
8,787 |
|
$ |
56 |
|
|
|
|
|
|
|
|
|
|
|
|
|
|
|
|
||||||
|
December 31, 2010 |
|
|
|
|
|
|
|
|
|
|
|
|
|
||||||
|
Mortgage-backed securities |
|
$ |
9,620 |
|
$ |
216 |
|
$ |
— |
|
$ |
— |
|
9,620 |
|
216 |
|
||
|
Obligations of states and political subdivisions |
|
31,444 |
|
417 |
|
— |
|
— |
|
31,444 |
|
417 |
|
||||||
|
|
|
|
|
|
|
|
|
|
|
|
|
|
|
||||||
|
Total temporarily impaired securities |
|
$ |
41,064 |
|
$ |
633 |
|
$ |
— |
|
$ |
— |
|
$ |
41,064 |
|
$ |
633 |
|
Unrealized losses on Bancorp’s investment securities portfolio have not been recognized in income because the securities are of high credit quality, and the decline in fair values is largely due to changes in the prevailing interest rate environment since the purchase date. The fair value is expected to recover as the securities reach their maturity date and/or the interest rate environment returns to conditions similar to when the securities were purchased. These investments consist of 5 and 49 separate investment positions as of December 31, 2011 and 2010, respectively, that are not considered other-than-temporarily impaired.
Because management does not intend to sell the investments, and it is not likely that Bancorp will be required to sell the investments before recovery of their amortized cost bases, which may be maturity, Bancorp does not consider these securities to be other-than-temporarily impaired at December 31, 2011.
(4) Loans
The composition of loans by primary loan classification follows:
|
|
|
December 31, |
|
||||
|
(In thousands) |
|
2011 |
|
2010 |
|
||
|
Commercial and industrial |
|
$ |
393,729 |
|
$ |
343,956 |
|
|
Construction and development |
|
147,637 |
|
159,482 |
|
||
|
Real estate mortgage: |
|
966,665 |
|
968,440 |
|
||
|
Consumer |
|
36,814 |
|
36,547 |
|
||
|
|
|
|
|
|
|
||
|
|
|
$ |
1,544,845 |
|
$ |
1,508,425 |
|
Loan balances include net deferred loan fees of $32,000 at December 31, 2011 and $16,000 at December 31, 2010. The Bank’s credit exposure is diversified with secured and unsecured loans to individuals and businesses. No specific industry concentration exceeds ten percent of loans. While the Bank has a diversified loan portfolio, a customer’s ability to honor contracts is somewhat dependent upon the economic stability and/or industry in which that customer does business. Loans outstanding and related unfunded commitments are primarily concentrated within the Bank’s current market areas, which encompass the Louisville, Indianapolis and Cincinnati metropolitan markets.
Bancorp enters into loan participation agreements with other banks in the ordinary course of business to diversify credit risk. For most participation loans, Bancorp has retained effective control of the loans, typically by restricting the participating institutions from pledging or selling their share of the loan without permission from Bancorp. US GAAP requires these loans to be recorded as secured borrowings. These loans are included in the commercial and industrial loan totals above, and a corresponding liability is reflected in other liabilities. At December 31, 2011 and 2010, the total loans of this nature were $30,324,000 and $34,818,000 respectively.
Loans to directors and their associates, including loans to companies for which directors are principal owners, and executive officers are presented in the following table.
|
|
|
Year ended December 31, |
|
||||
|
Loans to directors and executive officers |
|
2011 |
|
2010 |
|
||
|
(in thousands) |
|
|
|
|
|
||
|
Balance as of January 1 |
|
$ |
642 |
|
$ |
1,783 |
|
|
New loans and advances on lines of credit |
|
11,924 |
|
538 |
|
||
|
Repayments on loans and lines of credit |
|
11,944 |
|
1,679 |
|
||
|
Balance as of December 31 |
|
$ |
622 |
|
$ |
642 |
|
The higher amounts of advances and repayments in 2011 are attributable to the implementation of daily sweep features on a working capital line of credit to a company owned by one director.
The following table presents the balance in the recorded investment in loans and allowance for loan losses by portfolio segment and based on impairment method as of December 31, 2011 and 2010.
|
|
|
Type of Loan |
|
|
|
|||||||||||
|
December 31, 2011 |
|
Commercial |
|
Construction |
|
Real estate |
|
|
|
|
|
|||||
|
(in thousands) |
|
and industrial |
|
and development |
|
mortgage |
|
Consumer |
|
Total |
|
|||||
|
|
|
|
|
|
|
|
|
|
|
|
|
|||||
|
Loans |
|
|
|
|
|
|
|
|
|
|
|
|||||
|
Balance |
|
$ |
393,729 |
|
$ |
147,637 |
|
$ |
966,665 |
|
$ |
36,814 |
|
$ |
1,544,845 |
|
|
|
|
|
|
|
|
|
|
|
|
|
|
|||||
|
Balance: individually evaluated for impairment |
|
$ |
5,459 |
|
$ |
2,416 |
|
$ |
14,170 |
|
$ |
94 |
|
$ |
22,139 |
|
|
|
|
|
|
|
|
|
|
|
|
|
|
|||||
|
Balance: collectively evaluated for impairment |
|
$ |
388,270 |
|
$ |
145,221 |
|
$ |
952,495 |
|
$ |
36,720 |
|
$ |
1,522,706 |
|
|
|
|
Commercial |
|
Construction |
|
Real estate |
|
|
|
|
|
|
|
||||||
|
|
|
and industrial |
|
and development |
|
mortgage |
|
Consumer |
|
Unallocated |
|
Total |
|
||||||
|
Allowance for loan losses |
|
|
|
|
|
|
|
|
|
|
|
|
|
||||||
|
Beginning balance December 31, 2010 |
|
$ |
2,796 |
|
$ |
2,280 |
|
$ |
12,272 |
|
$ |
623 |
|
$ |
7,572 |
|
$ |
25,543 |
|
|
Provision |
|
5,475 |
|
2,859 |
|
4,592 |
|
133 |
|
(459 |
) |
12,600 |
|
||||||
|
Charge-offs |
|
(1,015 |
) |
(1,593 |
) |
(5,840 |
) |
(673 |
) |
— |
|
(9,121 |
) |
||||||
|
Recoveries |
|
108 |
|
— |
|
158 |
|
457 |
|
— |
|
723 |
|
||||||
|
Ending balance December 31, 2011 |
|
$ |
7,364 |
|
$ |
3,546 |
|
$ |
11,182 |
|
$ |
540 |
|
$ |
7,113 |
|
$ |
29,745 |
|
|
|
|
|
|
|
|
|
|
|
|
|
|
|
|
||||||
|
|
$ |
954 |
|
$ |
10 |
|
$ |
1,597 |
|
$ |
— |
|
|
|
$ |
2,561 |
|
||
|
|
|
|
|
|
|
|
|
|
|
|
|
|
|
||||||
|
Balance: collectively evaluated for impairment |
|
$ |
6,410 |
|
$ |
3,536 |
|
$ |
9,585 |
|
$ |
540 |
|
$ |
7,113 |
|
$ |
27,184 |
|
|
|
|
Type of Loan |
|
|
|
|||||||||||
|
December 31, 2010 |
|
Commercial |
|
Construction |
|
Real estate |
|
|
|
|
|
|||||
|
(in thousands) |
|
and industrial |
|
and development |
|
mortgage |
|
Consumer |
|
Total |
|
|||||
|
|
|
|
|
|
|
|
|
|
|
|
|
|||||
|
Loans |
|
|
|
|
|
|
|
|
|
|
|
|||||
|
Balance |
|
$ |
343,956 |
|
$ |
159,482 |
|
$ |
968,440 |
|
$ |
36,547 |
|
$ |
1,508,425 |
|
|
|
|
|
|
|
|
|
|
|
|
|
|
|||||
|
Balance: individually evaluated for impairment |
|
$ |
520 |
|
$ |
700 |
|
$ |
15,955 |
|
$ |
95 |
|
$ |
17,270 |
|
|
|
|
|
|
|
|
|
|
|
|
|
|
|||||
|
Balance: collectively evaluated for impairment |
|
$ |
343,436 |
|
$ |
158,782 |
|
$ |
952,485 |
|
$ |
36,452 |
|
$ |
1,491,155 |
|
|
|
|
Commercial |
|
Construction |
|
Real estate |
|
|
|
|
|
|
|
||||||
|
|
|
and industrial |
|
and development |
|
mortgage |
|
Consumer |
|
Unallocated |
|
Total |
|
||||||
|
Allowance for loan losses |
|
|
|
|
|
|
|
|
|
|
|
|
|
||||||
|
Beginning balance December 31, 2009 |
|
$ |
4,091 |
|
$ |
1,518 |
|
$ |
6,513 |
|
$ |
947 |
|
$ |
6,931 |
|
$ |
20,000 |
|
|
Provision |
|
8 |
|
2,947 |
|
8,046 |
|
(173 |
) |
641 |
|
11,469 |
|
||||||
|
Charge-offs |
|
(1,418 |
) |
(2,211 |
) |
(2,450 |
) |
(687 |
) |
— |
|
(6,766 |
) |
||||||
|
Recoveries |
|
115 |
|
26 |
|
163 |
|
536 |
|
— |
|
840 |
|
||||||
|
Ending balance December 31, 2010 |
|
$ |
2,796 |
|
$ |
2,280 |
|
$ |
12,272 |
|
$ |
623 |
|
$ |
7,572 |
|
$ |
25,543 |
|
|
|
|
|
|
|
|
|
|
|
|
|
|
|
|
||||||
|
Balance: individually evaluated for impairment |
|
$ |
90 |
|
$ |
— |
|
$ |
1,724 |
|
$ |
— |
|
|
|
$ |
1,814 |
|
|
|
|
|
|
|
|
|
|
|
|
|
|
|
|
|
||||||
|
Balance: collectively evaluated for impairment |
|
$ |
2,706 |
|
$ |
2,280 |
|
$ |
10,548 |
|
$ |
623 |
|
$ |
7,572 |
|
$ |
23,729 |
|
Bancorp did not have any loans acquired with deteriorated credit quality at December 31, 2011 or 2010.
Management uses the following portfolio segments of loans when assessing and monitoring the risk and performance of the loan portfolio:
· Commercial and industrial
· Real estate mortgage
· Construction and development
· Consumer
The following table presents loans individually evaluated for impairment as of December 31, 2011 and 2010.
|
|
|
|
|
Unpaid |
|
|
|
Average |
|
||||
|
December 31, 2011 |
|
Recorded |
|
principal |
|
Related |
|
Recorded |
|
||||
|
(in thousands) |
|
investment |
|
balance |
|
allowance |
|
Investment |
|
||||
|
|
|
|
|
|
|
|
|
|
|
||||
|
Loans with no related allowance recorded |
|
|
|
|
|
|
|
|
|
||||
|
Commercial and industrial |
|
$ |
694 |
|
$ |
920 |
|
|
|
$ |
951 |
|
|
|
Real estate mortgage |
|
6,453 |
|
6,453 |
|
|
|
6,353 |
|
||||
|
Construction and development |
|
2,316 |
|
2,316 |
|
|
|
1,979 |
|
||||
|
Consumer |
|
94 |
|
94 |
|
|
|
83 |
|
||||
|
Subtotal |
|
9,557 |
|
9,783 |
|
|
|
9,366 |
|
||||
|
|
|
|
|
|
|
|
|
|
|
||||
|
Loans with an allowance recorded |
|
|
|
|
|
|
|
|
|
||||
|
Commercial and industrial |
|
$ |
4,765 |
|
$ |
6,415 |
|
$ |
954 |
|
$ |
2,447 |
|
|
Real estate mortgage |
|
7,717 |
|
11,962 |
|
1,597 |
|
7,249 |
|
||||
|
Construction and development |
|
100 |
|
100 |
|
10 |
|
20 |
|
||||
|
Consumer |
|
— |
|
— |
|
— |
|
10 |
|
||||
|
Subtotal |
|
12,582 |
|
18,477 |
|
2,561 |
|
9,726 |
|
||||
|
|
|
|
|
|
|
|
|
|
|
||||
|
Total |
|
|
|
|
|
|
|
|
|
||||
|
Commercial and industrial |
|
$ |
5,459 |
|
$ |
7,335 |
|
$ |
954 |
|
$ |
3,398 |
|
|
Real estate mortgage |
|
14,170 |
|
18,415 |
|
1,597 |
|
13,602 |
|
||||
|
Construction and development |
|
2,416 |
|
2,416 |
|
10 |
|
1,999 |
|
||||
|
Consumer |
|
94 |
|
94 |
|
— |
|
93 |
|
||||
|
Total |
|
$ |
22,139 |
|
$ |
28,260 |
|
$ |
2,561 |
|
$ |
19,092 |
|
|
|
|
|
|
Unpaid |
|
|
|
Average |
|
||||
|
December 31, 2010 |
|
Recorded |
|
principal |
|
Related |
|
Recorded |
|
||||
|
(in thousands) |
|
investment |
|
balance |
|
allowance |
|
Investment |
|
||||
|
|
|
|
|
|
|
|
|
|
|
||||
|
Loans with no related allowance recorded |
|
|
|
|
|
|
|
|
|
||||
|
Commercial and industrial |
|
$ |
420 |
|
$ |
1,982 |
|
|
|
$ |
250 |
|
|
|
Real estate mortgage |
|
8,720 |
|
9,455 |
|
|
|
5,565 |
|
||||
|
Construction and development |
|
700 |
|
700 |
|
|
|
350 |
|
||||
|
Consumer |
|
95 |
|
140 |
|
|
|
64 |
|
||||
|
Subtotal |
|
9,935 |
|
12,277 |
|
|
|
6,229 |
|
||||
|
|
|
|
|
|
|
|
|
|
|
||||
|
Loans with an allowance recorded |
|
|
|
|
|
|
|
|
|
||||
|
Commercial and industrial |
|
$ |
100 |
|
$ |
292 |
|
$ |
90 |
|
$ |
373 |
|
|
Real estate mortgage |
|
7,235 |
|
7,235 |
|
1,724 |
|
5,515 |
|
||||
|
Construction and development |
|
— |
|
— |
|
— |
|
2,123 |
|
||||
|
Consumer |
|
— |
|
— |
|
— |
|
— |
|
||||
|
Subtotal |
|
7,335 |
|
7,527 |
|
1,814 |
|
8,011 |
|
||||
|
|
|
|
|
|
|
|
|
|
|
||||
|
Total |
|
|
|
|
|
|
|
|
|
||||
|
Commercial and industrial |
|
$ |
520 |
|
$ |
2,274 |
|
$ |
90 |
|
$ |
623 |
|
|
Real estate mortgage |
|
15,955 |
|
16,690 |
|
1,724 |
|
11,080 |
|
||||
|
Construction and development |
|
700 |
|
700 |
|
— |
|
2,473 |
|
||||
|
Consumer |
|
95 |
|
140 |
|
— |
|
64 |
|
||||
|
Total |
|
$ |
17,270 |
|
$ |
19,804 |
|
$ |
1,814 |
|
$ |
14,240 |
|
Differences between the recorded investment amounts and the unpaid principal balance amounts are due to partial charge-offs which have occurred over the life of the loans.
Interest income on impaired or non-accrual loans (cash basis) was $391,000, $250,000 and $216,000 in 2011, 2010, and 2009, respectively. Interest income that would have been recorded if non-accrual loans were on a current basis in accordance with their original terms was $1,104,000, $1,192,000 and $732,000 in 2011, 2010 and 2009, respectively.
Impaired loans include non-accrual loans and loans accounted for as troubled debt restructuring. Non-performing loans include the balance of impaired loans plus any loans over 90 days past due and still accruing interest. Loans past due more than 90 days or more and still accruing interest amounted to $1,160,000 in 2011 and $2,044,000 in 2010.
The following table presents the recorded investment in non-accrual loans as of December 31, 2011 and 2010.
|
(In thousands) |
|
2011 |
|
2010 |
|
||
|
|
|
|
|
|
|
||
|
Commercial and industrial |
|
$ |
2,665 |
|
$ |
2,328 |
|
|
Construction and development |
|
2,416 |
|
4,589 |
|
||
|
Real estate mortgage |
|
13,562 |
|
7,194 |
|
||
|
Consumer |
|
94 |
|
277 |
|
||
|
|
|
|
|
|
|
||
|
Total |
|
$ |
18,737 |
|
$ |
14,388 |
|
Included in non-performing loans are loans accounted for as troubled debt restructurings (TDR) which continue to accrue interest. The following table presents the recorded investment in loans accounted for as TDR as of December 31, 2011 and 2010.
|
|
|
|
|
Post-modification |
|
Pre-modification |
|
||
|
December 31, 2011 |
|
Number of |
|
outstanding recorded |
|
outstanding recorded |
|
||
|
(Dollars in thousands) |
|
contracts |
|
investment |
|
investment |
|
||
|
|
|
|
|
|
|
|
|
||
|
Commercial & industrial |
|
4 |
|
$ |
2,794 |
|
$ |
2,794 |
|
|
Real estate mortgage |
|
2 |
|
608 |
|
608 |
|
||
|
Total |
|
6 |
|
$ |
3,402 |
|
$ |
3,402 |
|
|
|
|
|
|
Pre-modification |
|
Post-modification |
|
||
|
December 31, 2010 |
|
Number of |
|
outstanding recorded |
|
outstanding recorded |
|
||
|
(Dollars in thousands) |
|
contracts |
|
investment |
|
investment |
|
||
|
|
|
|
|
|
|
|
|
||
|
Real estate mortgage |
|
2 |
|
$ |
2,882 |
|
$ |
2,882 |
|
|
Total |
|
2 |
|
$ |
2,882 |
|
$ |
2,882 |
|
Bancorp has not had loans accounted for as TDR that have subsequently defaulted. At December 30, 2011, loans accounted for as TDR included temporary suspension of principal payments, resulting in payment of interest only. There has been no forgiveness of principal for loans accounted for as TDR. Loans accounted for as TDR are individually evaluated for impairment and, at December 31, 2011, had a total related allowance allocation of $1,167,000, compared to $652,000 at December 31, 2010.
The following table presents the aging of the recorded investment in past due loans as of December 31, 2011 and 2010.
|
|
|
|
|
|
|
Greater |
|
|
|
|
|
|
|
|
|
|||||||
|
|
|
|
|
|
|
than |
|
|
|
|
|
|
|
|
|
|||||||
|
|
|
|
|
|
|
90 days |
|
|
|
|
|
|
|
Recorded |
|
|||||||
|
|
|
|
|
|
|
past due |
|
|
|
|
|
|
|
investment > |
|
|||||||
|
December 31, 2011 |
|
30-59 days |
|
60-89 days |
|
(includes |
|
Total |
|
|
|
Total |
|
90 days and |
|
|||||||
|
(in thousands) |
|
past due |
|
past due |
|
non-accrual) |
|
past due |
|
Current |
|
loans |
|
accruing |
|
|||||||
|
|
|
|
|
|
|
|
|
|
|
|
|
|
|
|
|
|||||||
|
Commercial and industrial |
|
$ |
989 |
|
$ |
162 |
|
$ |
2,665 |
|
$ |
3,816 |
|
$ |
389,913 |
|
$ |
393,729 |
|
$ |
— |
|
|
Real estate mortgage |
|
8,520 |
|
957 |
|
14,722 |
|
24,199 |
|
942,466 |
|
966,665 |
|
1,160 |
|
|||||||
|
Construction and development |
|
86 |
|
— |
|
2,416 |
|
2,502 |
|
145,135 |
|
147,637 |
|
— |
|
|||||||
|
Consumer |
|
336 |
|
— |
|
94 |
|
430 |
|
36,384 |
|
36,814 |
|
— |
|
|||||||
|
Total |
|
$ |
9,931 |
|
$ |
1,119 |
|
$ |
19,897 |
|
$ |
30,947 |
|
$ |
1,513,898 |
|
$ |
1,544,845 |
|
$ |
1,160 |
|
|
|
|
|
|
|
|
Greater |
|
|
|
|
|
|
|
|
|
|||||||
|
|
|
|
|
|
|
than |
|
|
|
|
|
|
|
|
|
|||||||
|
|
|
|
|
|
|
90 days |
|
|
|
|
|
|
|
Recorded |
|
|||||||
|
|
|
|
|
|
|
past due |
|
|
|
|
|
|
|
investment > |
|
|||||||
|
December 31, 2010 |
|
30-59 days |
|
60-89 days |
|
(includes |
|
Total |
|
|
|
Total |
|
90 days and |
|
|||||||
|
(in thousands) |
|
past due |
|
past due |
|
non-accrual) |
|
past due |
|
Current |
|
loans |
|
accruing |
|
|||||||
|
|
|
|
|
|
|
|
|
|
|
|
|
|
|
|
|
|||||||
|
Commercial and industrial |
|
$ |
1,681 |
|
$ |
194 |
|
$ |
547 |
|
$ |
2,422 |
|
$ |
341,534 |
|
$ |
343,956 |
|
$ |
27 |
|
|
Real estate mortgage |
|
5,943 |
|
4,821 |
|
15,039 |
|
25,803 |
|
942,637 |
|
968,440 |
|
1,966 |
|
|||||||
|
Construction and development |
|
256 |
|
— |
|
700 |
|
956 |
|
158,526 |
|
159,482 |
|
— |
|
|||||||
|
Consumer |
|
69 |
|
4 |
|
146 |
|
219 |
|
36,328 |
|
36,547 |
|
51 |
|
|||||||
|
Total |
|
$ |
7,949 |
|
$ |
5,019 |
|
$ |
16,432 |
|
$ |
29,400 |
|
$ |
1,479,025 |
|
$ |
1,508,425 |
|
$ |
2,044 |
|
Bancorp categorizes loans into credit risk categories based on relevant information about the ability of borrowers to service their debt such as: current financial information, historical payment experience, credit documentation, public information and current economic trends. Pass-rated loans included all risk-rated loans other than those classified as special mention, substandard, and doubtful, which are defined below:
· Special Mention: Loans classified as special mention have a potential weakness that deserves management’s close attention. These potential weaknesses may result in deterioration of repayment prospects for the loan or of the Bank’s credit position at some future date.
· Substandard: Loans classified as substandard are inadequately protected by the current net worth and paying capacity of the obligor or of collateral pledged, if any. Loans so classified have a well-defined weakness or weaknesses that jeopardize repayment of the debt. They are characterized by the distinct possibility that the Bank will sustain some loss if the deficiencies are not corrected.
· Substandard non-performing: Loans classified as substandard-non-performing have all the characteristics of substandard loans and have been placed on non-accrual status or have been accounted for as troubled debt restructurings.
· Doubtful: Loans classified as doubtful have all the weaknesses inherent in those classified as substandard, with the added characteristic that the weaknesses make collection or repayment in full, on the basis of currently existing facts, conditions and values, highly questionable and improbable.
As of December 31, 2011 and 2010, the risk categories of loans were as follows:
Credit risk profile by internally assigned grade
(in thousands)
|
December 31, 2011 |
|
Commercial
|
|
Real estate
|
|
Construction
|
|
Consumer |
|
Total |
|
|||||
|
Grade |
|
|
|
|
|
|
|
|
|
|
|
|||||
|
Pass |
|
$ |
356,090 |
|
$ |
896,217 |
|
$ |
132,846 |
|
$ |
36,709 |
|
$ |
1,421,862 |
|
|
Special mention |
|
15,154 |
|
33,818 |
|
6,007 |
|
11 |
|
54,990 |
|
|||||
|
Substandard |
|
17,026 |
|
21,300 |
|
6,368 |
|
— |
|
44,694 |
|
|||||
|
Substandard non-performing |
|
5,459 |
|
15,330 |
|
2,416 |
|
94 |
|
23,299 |
|
|||||
|
Doubtful |
|
— |
|
— |
|
— |
|
— |
|
— |
|
|||||
|
Total |
|
$ |
393,729 |
|
$ |
966,665 |
|
$ |
147,637 |
|
$ |
36,814 |
|
$ |
1,544,845 |
|
|
December 31, 2010 |
|
Commercial
|
|
Real estate
|
|
Construction
|
|
Consumer |
|
Total |
|
|||||
|
Grade |
|
|
|
|
|
|
|
|
|
|
|
|||||
|
Pass |
|
$ |
315,053 |
|
$ |
891,762 |
|
$ |
140,986 |
|
$ |
36,172 |
|
$ |
1,383,973 |
|
|
Special mention |
|
20,440 |
|
30,402 |
|
6,222 |
|
67 |
|
57,131 |
|
|||||
|
Substandard |
|
7,916 |
|
28,355 |
|
11,574 |
|
162 |
|
48,007 |
|
|||||
|
Substandard non-performing |
|
547 |
|
17,921 |
|
700 |
|
146 |
|
19,314 |
|
|||||
|
Doubtful |
|
— |
|
— |
|
— |
|
— |
|
— |
|
|||||
|
Total |
|
$ |
343,956 |
|
$ |
968,440 |
|
$ |
159,482 |
|
$ |
36,547 |
|
$ |
1,508,425 |
|
(5) Premises and Equipment
A summary of premises and equipment follows:
|
|
|
December 31, |
|
||||
|
(In thousands) |
|
2011 |
|
2010 |
|
||
|
|
|
|
|
|
|
|
|
|
Land |
|
$ |
4,611 |
|
$ |
4,611 |
|
|
Buildings and improvements |
|
35,850 |
|
29,263 |
|
||
|
Furniture and equipment |
|
18,307 |
|
20,602 |
|
||
|
Construction in progress |
|
3,554 |
|
3,978 |
|
||
|
|
|
|
|
|
|
||
|
|
|
62,322 |
|
58,454 |
|
||
|
|
|
|
|
|
|
||
|
Accumulated depreciation and amortization |
|
(25,711 |
) |
(26,789 |
) |
||
|
|
|
|
|
|
|
||
|
|
|
$ |
36,611 |
|
$ |
31,665 |
|
Depreciation expense related to premises and equipment was $2,914,000 in 2011, $2,545,000 in 2010 and $2,517,000 in 2009.
(6) Other Assets
A summary of the major components of other assets as of December 31, 2011 and 2010 follows:
|
(in thousands) |
|
2011 |
|
2010 |
|
||
|
|
|
|
|
|
|
||
|
Cash surrender value of life insurance other than BOLI |
|
$ |
9,716 |
|
$ |
8,333 |
|
|
Net deferred tax asset |
|
9,581 |
|
8,764 |
|
||
|
Investments in tax credit related ventures |
|
7,933 |
|
9,529 |
|
||
|
Other real estate owned and other foreclosed property |
|
7,773 |
|
5,445 |
|
||
|
FDIC prepaid assessment |
|
3,106 |
|
4,612 |
|
||
|
Domestic private investment fund |
|
2,420 |
|
2,841 |
|
||
|
Mortgage servicing rights (MSRs) |
|
1,630 |
|
1,785 |
|
||
|
Other short term receivables |
|
1,277 |
|
1,316 |
|
||
|
Common securities of S.Y. Bancorp Capital Trust II |
|
900 |
|
900 |
|
||
|
Goodwill |
|
682 |
|
682 |
|
||
|
Investment in bank in expansion market |
|
520 |
|
520 |
|
||
|
Other |
|
5,306 |
|
6,093 |
|
||
|
|
|
$ |
50,844 |
|
$ |
50,820 |
|
Bancorp maintains life insurance policies other than BOLI in conjunction with its non-qualified defined benefit and non-qualified compensation plans.
In 2009, the FDIC required insured institutions to prepay three years of estimated insurance assessments, to strengthen the cash position of the Deposit Insurance Fund without immediately impacting earnings of the banking industry. Bancorp’s prepaid assessment, paid in December 2009, totaled $6,458,000 and will be amortized based on quarterly FDIC assessments, likely into 2013.
MSRs are amortized in proportion to and over the period of estimated net servicing income, considering appropriate prepayment assumptions. MSRs are evaluated quarterly for impairment by comparing the carrying value to the fair value. The estimated fair values of MSRs at December 31, 2011 and 2010 were $2,292,000 and $2,188,000, respectively. The total outstanding principal balances of loans serviced for others were $287,579,000 and $254,988,000 at December 31, 2011, and 2010 respectively.
Changes in the net carrying amount of MSRs for the years ended December 31, 2011 and 2010 are shown in the following table.
|
(in thousands) |
|
2011 |
|
2010 |
|
||
|
|
|
|
|
|
|
||
|
Balance at January 1 |
|
$ |
1,785 |
|
$ |
1,616 |
|
|
Originations |
|
571 |
|
695 |
|
||
|
Amortization |
|
(726 |
) |
(526 |
) |
||
|
|
|
|
|
|
|
||
|
Balance at December 31 |
|
$ |
1,630 |
|
$ |
1,785 |
|
(7) Income Taxes
The components of income tax expense (benefit) from operations for the years ended December 31, 2011, 2010, and 2009 were as follows:
|
|
|
Year ended December 31, |
|
|||||||
|
(In thousands) |
|
2011 |
|
2010 |
|
2009 |
|
|||
|
Current tax expense |
|
|
|
|
|
|
|
|||
|
Federal |
|
$ |
9,748 |
|
$ |
10,010 |
|
$ |
8,459 |
|
|
State |
|
511 |
|
611 |
|
423 |
|
|||
|
Total current tax expense |
|
10,259 |
|
10,621 |
|
8,882 |
|
|||
|
|
|
|
|
|
|
|
|
|||
|
Deferred tax benefit |
|
|
|
|
|
|
|
|||
|
Federal |
|
(1,934 |
) |
(1,502 |
) |
(1,832 |
) |
|||
|
State |
|
(134 |
) |
(54 |
) |
(117 |
) |
|||
|
Total deferred tax benefit |
|
(2,068 |
) |
(1,556 |
) |
(1,949 |
) |
|||
|
|
|
|
|
|
|
|
|
|
|
|
|
Total income tax expense |
|
$ |
8,191 |
|
$ |
9,065 |
|
$ |
6,933 |
|
The components of income tax expense (benefit) recorded directly to stockholders’ equity for the years ended December 31, 2011, 2010, and 2009 were as follows:
|
|
|
Year ended December 31, |
|
|||||||
|
(In thousands) |
|
2011 |
|
2010 |
|
2009 |
|
|||
|
Unrealized gain (loss) on securities available for sale |
|
$ |
1,362 |
|
$ |
580 |
|
$ |
(163 |
) |
|
Reclassification adjustment for securities losses (gains) realized in in income |
|
— |
|
(56 |
) |
119 |
|
|||
|
Compensation expense for tax purposes in excess of amounts recognized for financial reporting purposes |
|
(125 |
) |
(140 |
) |
(244 |
) |
|||
|
Minimum pension liability adjustment |
|
(111 |
) |
(17 |
) |
(4 |
) |
|||
|
|
|
|
|
|
|
|
|
|
|
|
|
|
|
$ |
1,126 |
|
$ |
367 |
|
$ |
(292 |
) |
An analysis of the difference between the statutory and effective tax rates from operations for the years ended December 31, 2011, 2010, and 2009 were as follows:
|
|
|
Year ended December 31, |
|
||||
|
|
|
2011 |
|
2010 |
|
2009 |
|
|
U.S. federal income tax rate |
|
35.0 |
% |
35.0 |
% |
35.0 |
% |
|
Tax exempt interest income |
|
(3.7 |
) |
(3.3 |
) |
(3.5 |
) |
|
Tax credits |
|
(2.6 |
) |
(2.5 |
) |
(1.4 |
) |
|
Cash surrender value of life insurance |
|
(1.5 |
) |
(2.0 |
) |
(2.1 |
) |
|
State income taxes |
|
0.9 |
|
1.1 |
|
0.9 |
|
|
Establish deferred taxes on tax credit investments |
|
(2.2 |
) |
— |
|
— |
|
|
Other, net |
|
(0.1 |
) |
— |
|
0.9 |
|
|
|
|
25.8 |
% |
28.3 |
% |
29.8 |
% |
The reduced level of income tax expense primarily reflected an adjustment of approximately $700,000 to the Bancorp’s deferred tax assets that relates to tax-advantaged investments that Bancorp has made in its primary market area over the years.
The effects of temporary differences that gave rise to significant portions of deferred tax assets and deferred tax liabilities for the years ended December 31, 2011 and 2010 were as follows:
|
|
|
December 31, |
|
||||
|
(In thousands) |
|
2011 |
|
2010 |
|
||
|
Allowance for loan loss |
|
$ |
10,724 |
|
$ |
9,209 |
|
|
Deferred compensation |
|
3,363 |
|
3,063 |
|
||
|
Accrued expenses |
|
412 |
|
1,112 |
|
||
|
Investments in partnerships |
|
749 |
|
— |
|
||
|
Write-downs of other real estate owned |
|
573 |
|
— |
|
||
|
Other assets |
|
847 |
|
603 |
|
||
|
Total deferred tax assets |
|
16,668 |
|
13,987 |
|
||
|
|
|
|
|
|
|
||
|
Securities |
|
4,101 |
|
2,729 |
|
||
|
Property and equipment |
|
1,213 |
|
274 |
|
||
|
Loan costs |
|
592 |
|
557 |
|
||
|
Prepayment penalty on modification of FHLB advances |
|
369 |
|
475 |
|
||
|
Mortgage servicing rights |
|
538 |
|
594 |
|
||
|
Other liabilities |
|
274 |
|
594 |
|
||
|
Total deferred tax liabilities |
|
7,087 |
|
5,223 |
|
||
|
Net deferred tax asset |
|
$ |
9,581 |
|
$ |
8,764 |
|
No valuation allowance for deferred tax assets was recorded as of December 31, 2011 and 2010 because Bancorp has sufficient prior taxable income and tax planning strategies to allow for utilization of the deductible temporary differences and capital loss carryforwards within the carryforward period. Management believes it is more likely than not that all deferred tax assets will be realized.
US GAAP provides guidance on the financial statement recognition and measurement of tax positions taken, or expected to be taken, in tax returns. As of December 31, 2011 and 2010, the gross amount of
unrecognized tax benefits was $101,000 and $230,000, respectively. If recognized, all of the tax benefits would increase net income, resulting in a decrease in the effective tax rate.
Bancorp’s policy is to report interest and penalties, if any, related to unrecognized tax benefits in income tax expense. As of December 31, 2011 and 2010, the amount accrued for the potential payment of interest and penalties was $7,000 and $20,000, respectively. Federal and state income tax returns are subject to examination for the tax return years after 2007.
A reconciliation of the amount of unrecognized tax benefits for the years ended December 31, 2011 and 2010 were as follows:
|
(In thousands) |
|
2011 |
|
2010 |
|
||
|
|
|
|
|
|
|
|
|
|
Balance as of January 1 |
|
$ |
230 |
|
$ |
230 |
|
|
Increases - current year tax positions |
|
11 |
|
— |
|
||
|
Increases - prior year tax positions |
|
5 |
|
|
|
||
|
Settlements |
|
(71 |
) |
|
|
||
|
Lapse of statute of limitations |
|
(74 |
) |
— |
|
||
|
Balance as of December 31 |
|
$ |
101 |
|
$ |
230 |
|
(8) Deposits
The composition of interest bearing deposits follows:
|
|
|
December 31, |
|
||||
|
(In thousands) |
|
2011 |
|
2010 |
|
||
|
|
|
|
|
|
|
|
|
|
Interest bearing demand |
|
$ |
297,916 |
|
$ |
270,761 |
|
|
Savings |
|
70,964 |
|
66,826 |
|
||
|
Money market |
|
526,605 |
|
475,898 |
|
||
|
Time deposits greater than $250,000 |
|
44,707 |
|
54,826 |
|
||
|
Other time deposits |
|
363,960 |
|
377,692 |
|
||
|
|
|
|
|
|
|
||
|
|
|
$ |
1,304,152 |
|
$ |
1,246,003 |
|
Interest expense related to certificates of deposit and other time deposits in denominations of $100,000 or more was $2,575,000, $3,445,000, and $5,544,000, respectively, for the years ended December 31, 2011, 2010 and 2009.
At December 31, 2011, the scheduled maturities of time deposits were as follows:
|
(In thousands) |
|
|
|
|
|
|
|
|
|
|
|
2012 |
|
$ |
256,548 |
|
|
2013 |
|
99,869 |
|
|
|
2014 |
|
29,008 |
|
|
|
2015 |
|
15,482 |
|
|
|
2016 and thereafter |
|
7,760 |
|
|
|
|
|
|
|
|
|
|
|
$ |
408,667 |
|
Deposits of directors and their associates, including deposits of companies for which directors are principal owners, and executive officers were $3,800,000 and $2,465,000 at December 31, 2011 and 2010, respectively.
At December 31, 2011 and 2010, Bancorp had $482,000 and $847,000, respectively, of deposits accounts in overdraft status and thus have been reclassified to loans on the accompanying consolidated balance sheets.
(9) Securities Sold Under Agreements to Repurchase and Other Short-Term Borrowings
Securities sold under agreements to repurchase are a funding source of the Bank and are primarily used by commercial customers in conjunction with corporate cash management accounts. Such repurchase agreements are considered financing agreements and generally mature within one business day from the transaction date. Information concerning securities sold under agreements to repurchase is summarized as follows:
|
|
|
December 31, |
|
||||
|
(Dollars in thousands) |
|
2011 |
|
2010 |
|
||
|
|
|
|
|
|
|
||
|
Average balance during the year |
|
$ |
61,595 |
|
$ |
56,919 |
|
|
Average interest rate during the year |
|
0.41 |
% |
0.58 |
% |
||
|
Maximum month-end balance during the year |
|
$ |
69,818 |
|
$ |
65,521 |
|
(10) Advances from the Federal Home Loan Bank
The Bank had outstanding borrowings of $60.4 million at December 31, 2011, via six separate advances. For five advances totaling $60 million, all of which are non-callable, interest payments are due monthly, with principal due at maturity. For the sixth advance of $431,000, principal and interest payments are due monthly based on a 15 year amortization schedule. In the fourth quarter of 2010, Bancorp restructured and extended terms on two advances with FHLB resulting in lower interest cost over the remaining term of these advances. Prepayment penalties totaling $1.3 million were incurred. In accordance with US GAAP, prepayment penalties associated with the modification of advances are to be amortized over the life of the new advances, and are recorded as interest expense, resulting in effective interest rates greater than the contractual rate paid to FHLB. The following is a summary of the contractual maturities and average effective rates:
|
|
|
December 31, 2011 |
|
December 31, 2010 |
|
||||||
|
(In thousands) |
|
Advance |
|
Rate |
|
Advance |
|
Rate |
|
||
|
2013 |
|
$ |
20,000 |
|
1.55 |
% |
$ |
20,000 |
|
1.55 |
% |
|
2014 |
|
20,000 |
|
2.43 |
% |
20,000 |
|
2.43 |
% |
||
|
2015 |
|
20,000 |
|
3.34 |
% |
20,000 |
|
3.34 |
% |
||
|
2024 |
|
431 |
|
2.40 |
% |
442 |
|
2.40 |
% |
||
|
|
|
|
|
|
|
|
|
|
|
||
|
|
|
$ |
60,431 |
|
2.44 |
% |
$ |
60,442 |
|
2.44 |
% |
Advances from the FHLB are collateralized by certain commercial and residential real estate mortgage loans under a blanket mortgage collateral agreement and FHLB stock. The Bank views the borrowings as an effective alternative to higher cost time deposits to fund loan growth. At December 31, 2011, the amount of available credit from the FHLB totaled $95.9 million.
(11) Subordinated Debentures
In 2008, Bancorp formed S.Y. Bancorp Capital Trust II, a Delaware statutory trust and 100%-owned finance subsidiary. S.Y. Bancorp Capital Trust II issued $30.0 million of 10% fixed rate cumulative trust preferred securities and invested the proceeds, along with $900,000 received from the purchase of its common equity securities, in $30.9 million of a fixed rate subordinated debenture of Bancorp. The principal asset of S.Y. Bancorp Capital Trust II is a $30.9 million subordinated debenture of Bancorp. The interest rate on both the trust preferred securities and the subordinated debentures is fixed at 10.00%. Bancorp may redeem all or part of the trust preferred securities at any time on or after December 31, 2013 at a redemption price equal to 100% of the aggregate liquidation amount of the trust preferred securities plus any accumulated and unpaid
distributions thereon to the date of redemption. The trust preferred securities are subject to mandatory redemption when the subordinated debenture is paid at maturity in 2038 or upon any earlier redemption of the debentures. The trust preferred securities may also be redeemed at any time in the event of unfavorable changes in certain laws or regulations. The obligations of Bancorp with respect to the issuance of the Securities constituted a full and unconditional guarantee by Bancorp of the Trust’s obligation with respect to the Securities. Issuance costs are being recognized as non-interest expense over the life of the Securities, and unamortized issuance costs at December 31, 2011 were $1,405,000. The primary source of funds for payments of the debentures is the current cash on hand of the Bancorp, as well as future dividends received from the Bank, which is limited by regulatory dividend restrictions. See Note 16 for details on dividend restrictions.
In 2008, the Bank issued $10 million of subordinated debt. The debentures mature in 2018, with a call option to the Bank on or after December 31, 2010. The only financial covenant of the debt agreement requires that the Bank remain well capitalized as defined by its primary regulator. In the first quarter of 2012, Bancorp exercised its call option and prepaid the subordinated debentures without penalty.
(12) Preferred Stock
Bancorp has a class of preferred stock (no par value; 1,000,000 shares authorized), the relative rights, preferences and other terms of which or any series within the class will be determined by the Board of Directors prior to any issuance. This preferred stock was established in connection with a shareholders’ rights plan adopted in 2003 and would be issued upon the occurrence of certain triggering events. None of this stock had been issued as of December 31, 2011.
(13) Net Income per Share and Common Stock Dividends
The following table reflects the numerators (net income) and denominators (average shares outstanding) for the basic and diluted net income per share computations:
|
(In thousands, except per share data) |
|
2011 |
|
2010 |
|
2009 |
|
|||
|
|
|
|
|
|
|
|
|
|||
|
Net income, basic and diluted |
|
$ |
23,604 |
|
$ |
22,953 |
|
$ |
16,308 |
|
|
|
|
|
|
|
|
|
|
|||
|
Average shares outstanding for basic EPS calculation |
|
13,786 |
|
13,689 |
|
13,561 |
|
|||
|
Effect of dilutive securities |
|
48 |
|
90 |
|
128 |
|
|||
|
|
|
|
|
|
|
|
|
|||
|
Average shares outstanding including dilutive securities |
|
13,834 |
|
13,779 |
|
13,689 |
|
|||
|
|
|
|
|
|
|
|
|
|||
|
Net income per share, basic |
|
$ |
1.71 |
|
$ |
1.68 |
|
$ |
1.20 |
|
|
|
|
|
|
|
|
|
|
|||
|
Net income per share, diluted |
|
$ |
1.71 |
|
$ |
1.67 |
|
$ |
1.19 |
|
(14) Employee Benefit Plans
The Bank has a combined employee stock ownership and profit sharing plan (“KSOP”). The plan is a defined contribution plan and is available to all employees meeting certain eligibility requirements. Employer expenses related to contributions to the plan for 2011, 2010, and 2009 were $1,449,000, $1,393,000, and $1,413,000, respectively. Employee and employer contributions are made in accordance with the terms of the plan. As of December 31, 2011 and 2010, the KSOP held 458,600 and 450,883, respectively, shares of Bancorp stock.
In addition the Bank has non-qualified “excess” plans into which directors and certain senior officers may defer director fees or salary. The Bank contributed approximately $75,000, $119,000, and $72,000 to the senior officers’ plan in 2011, 2010 and 2009 respectively. At December 31, 2011 and 2010, the amounts included in other liabilities in the consolidated financial statements for this plan were $2,383,000 and
$2,461,000, were comprised primarily of participants’ contributions, and represented the fair value of mutual fund investments directed by participants.
The Bank sponsors an unfunded, non-qualified, defined benefit retirement plan for four key officers (two current, and two retired), and has no plans to increase the number of participants. Benefits vest based on 20 years of service. Bancorp uses a December 31 measurement date for this plan. At December 31, 2011 and 2010, the accumulated benefit obligation for the plan included in other liabilities in the consolidated financial statements was $2,236,000 and $1,917,000, respectively. Discount rates of 3.95% and 5.20% were used in 2011 and 2010, respectively, in determining the actuarial present value of the projected benefit obligation. The actuarially determined pension costs are expensed and accrued over the service period, and benefits are paid from the Bank’s assets. The Bank maintains life insurance policies on certain current and former executives, the income from which will help to offset the cost of benefits. The liability for the Bank’s plan met the benefit obligation as of December 31, 2011 and 2010.
Information about the components of the net periodic benefit cost of the defined benefit plan follows:
|
|
|
Year ended December 31, |
|
|||||||
|
(in thousands) |
|
2011 |
|
2010 |
|
2009 |
|
|||
|
|
|
|
|
|
|
|
|
|||
|
Components of net periodic benefit cost: |
|
|
|
|
|
|
|
|||
|
Service cost |
|
$ |
— |
|
$ |
— |
|
$ |
— |
|
|
Interest cost |
|
86 |
|
96 |
|
102 |
|
|||
|
Expected return on plan assets |
|
— |
|
— |
|
— |
|
|||
|
Amortization of prior service cost |
|
— |
|
— |
|
— |
|
|||
|
Amortization of net losses |
|
56 |
|
27 |
|
23 |
|
|||
|
|
|
|
|
|
|
|
|
|||
|
Net periodic benefit cost |
|
$ |
142 |
|
$ |
123 |
|
$ |
125 |
|
The benefits expected to be paid in each year from 2012 to 2016 are listed in the table below.
|
(In thousands) |
|
Benefits |
|
|
|
2012 |
|
$ |
123 |
|
|
2013 |
|
123 |
|
|
|
2014 |
|
84 |
|
|
|
2015 |
|
84 |
|
|
|
2016 |
|
84 |
|
|
|
Beyond 2016 |
|
3,614 |
|
|
|
|
|
|
|
|
|
Total future payments |
|
$ |
4,112 |
|
The expected benefits to be paid are based on the same assumptions used to measure the Bank’s benefit obligation at December 31, 2011. There are no obligations for other post-retirement and post-employment benefits.
(15) Stock-Based Compensation
The fair value of all new and modified awards granted, net of estimated forfeitures, is recognized as compensation expense over the respective service period. Forfeiture estimates are based on historical experience.
Bancorp currently has one stock-based compensation plan. Initially, in the 2005 Stock Incentive Plan, there were 735,000 shares of common stock reserved for issuance of stock based awards. In 2010, shareholders approved a proposal to amend the 2005 Stock Incentive Plan to reserve an additional 700,000 shares of
common stock for issuance under the plan. As of December 31, 2011, there were 731,281 shares available for future awards. Bancorp’s 1995 Stock Incentive Plan expired in 2005; however, options granted under this plan expire as late as 2015.
Options and stock appreciation rights (SARs) granted generally have been subject to a vesting schedule of 20% per year. Restricted shares generally vest over three to five years. All awards under both plans have been granted at an exercise price equal to the market value of common stock at the time of grant; options and SARs expire ten years after the grant date unless forfeited due to employment termination.
Bancorp has recognized stock-based compensation expense, within salaries and employee benefits in the consolidated statements of income, as follows:
|
|
|
2011 |
|
2010 |
|
2009 |
|
|||
|
|
|
|
|
|
|
|
|
|
|
|
|
Stock-based compensation expense before income taxes |
|
$ |
1,165,000 |
|
$ |
952,000 |
|
$ |
691,000 |
|
|
Deferred tax benefit |
|
408,000 |
|
333,000 |
|
242,000 |
|
|||
|
Reduction of net income |
|
$ |
757,000 |
|
$ |
619,000 |
|
$ |
449,000 |
|
As of December 31, 2011 Bancorp has $2,660,000 of unrecognized stock-based compensation expense that will be recorded as compensation expense over the next five years as awards vest. Bancorp received cash of $692,000, $785,000 and $1,083,000 from the exercise of options during 2011, 2010 and 2009, respectively.
As required, Bancorp reduces future stock-based compensation expense by estimated forfeitures at the grant date. These forfeiture estimates are based on historical experience.
The fair value of Bancorp’s stock options is estimated at the date of grant using the Black-Scholes option pricing model, a leading formula for calculating the value of stock options and SARs. This model requires the input of subjective assumptions, changes to which can materially affect the fair value estimate. The fair value of restricted shares is determined by Bancorp’s closing stock price on the date of grant. The following assumptions were used in option valuations:
|
Assumptions used in option valuation |
|
2011 |
|
2010 |
|
2009 |
|
|
|
|
|
|
|
|
|
|
|
Dividend yield |
|
2.48 |
% |
2.18 |
% |
2.11 |
% |
|
Expected volatility |
|
22.64 |
% |
23.87 |
% |
23.59 |
% |
|
Risk free interest rate |
|
2.90 |
% |
3.57 |
% |
3.11 |
% |
|
Forfeitures |
|
6.07 |
% |
5.96 |
% |
5.96 |
% |
|
Expected life of options (in years) |
|
7.50 |
|
7.60 |
|
7.69 |
|
The expected life of options and SARs is based on actual experience of past like-term options. All outstanding options have a 10-year contractual term. Bancorp evaluated historical exercise and post-vesting termination behavior when determining the expected life for options granted during 2011, 2010 and 2009.
The dividend yield and expected volatility are based on historical information corresponding to the expected life of options and SARs granted. The expected volatility is the volatility of the underlying shares for the expected term on a monthly basis. The risk free interest rate is the implied yield currently available on U. S. Treasury issues with a remaining term equal to the expected life of the options.
A summary of stock option and SARs activity and related information for the year ended December 31, 2011 follows. The number of options and SARs and aggregate intrinsic value are stated in thousands.
|
|
|
|
|
|
|
|
|
|
|
|
|
Weighted |
|
||||
|
|
|
|
|
|
|
Weighted |
|
|
|
Weighted |
|
average |
|
||||
|
|
|
|
|
|
|
average |
|
Aggregate |
|
average |
|
remaining |
|
||||
|
|
|
Options |
|
|
|
exercise |
|
intrinsic |
|
fair |
|
contractual |
|
||||
|
|
|
and SARs |
|
Exercise price |
|
price |
|
value |
|
value |
|
life (years) |
|
||||
|
|
|
|
|
|
|
|
|
|
|
|
|
|
|
||||
|
At December 31, 2010 |
|
|
|
|
|
|
|
|
|
|
|
|
|
||||
|
Vested and exercisable |
|
710 |
|
$ |
16.00-26.83 |
|
$ |
22.03 |
|
$ |
2,007 |
|
$ |
4.91 |
|
4.15 |
|
|
Unvested |
|
273 |
|
21.03-26.83 |
|
22.85 |
|
552 |
|
5.36 |
|
7.72 |
|
||||
|
Total outstanding |
|
983 |
|
16.00-26.83 |
|
22.26 |
|
2,559 |
|
5.03 |
|
5.14 |
|
||||
|
|
|
|
|
|
|
|
|
|
|
|
|
|
|
||||
|
Granted |
|
67 |
|
23.76-24.87 |
|
23.78 |
|
— |
|
5.04 |
|
|
|
||||
|
Exercised |
|
(90 |
) |
16.00-23.37 |
|
16.52 |
|
524 |
|
3.36 |
|
|
|
||||
|
Forfeited |
|
(47 |
) |
18.05-26.83 |
|
22.89 |
|
13 |
|
5.17 |
|
|
|
||||
|
|
|
|
|
|
|
|
|
|
|
|
|
|
|
||||
|
At December 31, 2011 |
|
|
|
|
|
|
|
|
|
|
|
|
|
||||
|
Vested and exercisable |
|
681 |
|
18.62-26.83 |
|
22.94 |
|
160 |
|
5.18 |
|
3.89 |
|
||||
|
Unvested |
|
232 |
|
21.03-26.83 |
|
22.80 |
|
— |
|
5.22 |
|
7.73 |
|
||||
|
Total outstanding |
|
913 |
|
18.62-26.83 |
|
22.90 |
|
$ |
160 |
|
5.19 |
|
4.87 |
|
|||
|
|
|
|
|
|
|
|
|
|
|
|
|
|
|
||||
|
Vested during year |
|
95 |
|
21.03-26.83 |
|
23.58 |
|
$ |
— |
|
5.48 |
|
|
|
|||
The aggregate intrinsic value of stock options and SARs exercised in 2011, 2010 and 2009 was $524,000, $1,122,000 and $1,236,000, respectively. The aggregate intrinsic value of stock options exercised was calculated as the difference in the closing price of Bancorp’s common shares on the date of exercise and the exercise price, multiplied by the number of shares exercised.
The weighted average Black-Scholes fair values of options and SARs granted in 2011, 2010 and 2009 were $5.04, $5.31 and $5.36, respectively.
In addition to the SARs reflected above, in 2011, Bancorp granted 41,991 shares of restricted common stock at the weighted average current market price of $23.96.
Also in 2011, Bancorp awarded RSUs with a fair value of $21.99 to executive officers of the Bank, the three-year performance period for which began January 1, 2011. Bancorp believes the most likely vesting of these RSUs will be 16,857 shares of common stock.
Options and SARs outstanding, stated in thousands, at December 31, 2011 were as follows:
|
Expiration |
|
Number of
|
|
Options and
|
|
Weighted average
|
|
|
|
|
|
|
|
|
|
|
|
|
|
2012 |
|
66 |
|
66 |
|
$ |
18.62 |
|
|
2013 |
|
90 |
|
90 |
|
20.17 |
|
|
|
2014 |
|
132 |
|
132 |
|
22.70 |
|
|
|
2015 |
|
2 |
|
2 |
|
20.83 |
|
|
|
2016 |
|
159 |
|
159 |
|
24.07 |
|
|
|
2017 |
|
129 |
|
110 |
|
26.81 |
|
|
|
2018 |
|
96 |
|
68 |
|
23.37 |
|
|
|
2019 |
|
92 |
|
37 |
|
22.15 |
|
|
|
2020 |
|
82 |
|
17 |
|
21.03 |
|
|
|
2021 |
|
65 |
|
— |
|
23.78 |
|
|
|
|
|
913 |
|
681 |
|
$ |
22.90 |
|
(16) Dividend Restriction
Bancorp’s principal source of cash revenues is dividends received from the Bank. On January 1 of any year, the Bank’s regulatory dividend restriction represents the Bank’s net income of the prior two years less any dividends paid for the same two years. At December 31, 2011, the Bank may pay up to $51.6 million in dividends to Bancorp without regulatory approval subject to the ongoing capital requirements of the Bank.
(17) Commitments and Contingent Liabilities
As of December 31, 2011, Bancorp had various commitments outstanding that arose in the normal course of business, including standby letters of credit and commitments to extend credit, which are properly not reflected in the consolidated financial statements. In management’s opinion, commitments to extend credit of $332.2 million including standby letters of credit of $13.3 million represent normal banking transactions, and no significant losses are anticipated to result from these commitments as of December 31, 2011. Commitments to extend credit were $350.3 million, including letters of credit of $9.6 million, as of December 31, 2010. Bancorp’s maximum exposure to credit loss in the event of nonperformance by the other party to these commitments is represented by the contractual amount of these instruments. Bancorp uses the same credit and collateral policies in making commitments and conditional guarantees as for on-balance sheet instruments. Commitments to extend credit are agreements to lend to a customer as long as there is no violation of any condition established in the contract. Commitments generally have fixed expiration dates or other termination clauses. Commitments to extend credit are mainly made up of commercial lines of credit, construction and home equity credit lines. Since some of the commitments are expected to expire without being drawn upon, the total commitment amounts do not necessarily represent future cash requirements. Bancorp evaluates each customer’s creditworthiness on a case by case basis. The amount of collateral obtained is based on management’s credit evaluation of the customer. Collateral held varies but may include accounts receivable, inventory, equipment, and real estate. At December 31, 2011, no amounts have been recorded in the consolidated financial statements relating to these instruments.
Commitments to extend credit are agreements to lend to a customer as long as there is no violation of any condition established in the contract. Commitments generally have fixed expiration dates or other termination clauses. Since some of the unused commitments are expected to expire or may not be fully used, the total amount of commitments in the preceding table does not necessarily represent future cash requirements. The
Bank evaluates each customer’s creditworthiness on a case-by-case basis. The amount of collateral obtained, if deemed necessary by the Bank upon extension of credit, is based on management’s credit evaluation of the customer. Collateral held varies but may include accounts receivable, inventory, property, plant and equipment, real estate and securities.
Standby letters of credit and financial guarantees written are conditional commitments issued by the Bank to guarantee the performance of a customer to a third party. Those guarantees are primarily issued to support private borrowing arrangements. Standby letters of credit generally have maturities of up to five years.
The Bank leases certain facilities, improvements and equipment under non-cancelable operating leases. Future minimum lease commitments for these leases are outlined in the table below.
|
Year |
|
Total amount |
|
|
|
2012 |
|
$ |
1,779,000 |
|
|
2013 |
|
1,663,000 |
|
|
|
2014 |
|
1,138,000 |
|
|
|
2015 |
|
995,000 |
|
|
|
2016 |
|
999,000 |
|
|
|
Thereafter |
|
3,659,000 |
|
|
Rent expense, net of sublease income, was $1,804,000 in 2011, $1,940,000 in 2010, and $1,556,000 in 2009.
In order to provide service to commercial accounts, Bancorp aids customers with swap contracts and letters of credits with other financial institutions. Accordingly, Bancorp has entered into agreements to guarantee performance of several customers’ contracts with other financial institutions. Bancorp will make payments under these agreements if a customer defaults on its obligations to the other financial institutions. The terms of the agreements range from 5 to 14 months. The maximum potential future payment guaranteed by Bancorp cannot be readily estimated because it is dependent upon the fair value of the contracts at the time of default. If an event of default on all contracts had occurred at December 31, 2011, Bancorp would have been required to make payments of approximately $2.2 million. No payments have ever been required as a result of default on these contracts. These agreements are normally collateralized — generally with real properties, equipment, inventories and receivables — by the customer, which limits Bancorp’s credit risk associated with the agreements.
Also, as of December 31, 2011, there were pending legal actions and proceedings in which claims for damages are asserted. Management, after discussion with legal counsel, believes the ultimate result of these legal actions and proceedings will not have a material adverse effect on the consolidated financial position or results of operations of Bancorp.
(18) Fair Value Measurements
Bancorp follows the provisions of the authoritative guidance for fair value measurements. This guidance is definitional and disclosure oriented and addresses how companies should approach measuring fair value when required by US GAAP. The guidance prescribes various disclosures about financial statement categories and amounts which are measured at fair value, if such disclosures are not already specified elsewhere in US GAAP.
The authoritative guidance defines fair value as the price that would be received to sell an asset or paid to transfer a liability in an orderly transaction between participants at the measurement date. FASB ASC 820-10 also establishes a hierarchy to group assets and liabilities carried at fair value in three levels based upon the markets in which the assets and liabilities trade and the reliability of assumptions used to determine fair value. These levels are:
· Level 1 Valuation is based upon quoted prices for identical instruments traded in active markets.
· Level 2 Valuation is based upon quoted prices for similar instruments in active markets, quoted prices for identical or similar instruments in markets that are not active, and model-based valuation techniques for which all significant assumptions are observable in the market.
· Level 3 Valuation is generated from model-based techniques that use significant assumptions not observable in the market. These unobservable assumptions would reflect our own estimates of assumptions that market participants would use in pricing the asset or liability. Valuation techniques could include pricing models, discounted cash flows and other similar techniques.
Bancorp’s policy is to maximize the use of observable inputs and minimize the use of unobservable inputs in fair value measurements. Where there exists limited or no observable market data, Bancorp uses its own estimates generally considering characteristics of the asset/liability, the current economic and competitive environment and other factors. For this reason, results cannot be determined with precision and may not be realized on an actual sale or immediate settlement of the asset or liability.
Bancorp’s investment securities available for sale and interest rate swaps are recorded at fair value on a recurring basis. Other accounts including mortgage loans held for sale, mortgage servicing rights, impaired loans and other real estate owned may be recorded at fair value on a non-recurring basis, generally in the application of lower of cost or market adjustments or write-downs of specific assets.
The portfolio of investment securities available for sale is comprised of U.S. Treasury and other U.S government obligations, debt securities of U.S. government-sponsored corporations, mortgage-backed securities, obligations of state and political subdivisions, and trust preferred securities of other banks. Trust preferred securities are priced using quoted prices of identical securities in an active market. These measurements are classified as Level 1 in the hierarchy above. All other securities are priced using standard industry models or matrices with various assumptions such as yield curves, volatility, prepayment speeds, default rates, time value, credit rating and market prices for the instruments. These assumptions are generally observable in the market place and can be derived from or supported by observable data. These measurements are classified as Level 2 in the hierarchy above.
Interest rate swaps are valued using primarily Level 2 inputs. Fair value measurements are obtained from an outside pricing service. Prices obtained are generally based on dealer quotes, benchmark forward yield curves, and other relevant observable market data. For purposes of potential valuation adjustments to derivative positions, Bancorp evaluates the credit risk of its counterparties as well as its own credit risk. To date, Bancorp has not realized any losses due to a counterparty’s inability to perform and the change in value of derivative assets and liabilities attributable to credit risk was not significant during 2011.
Below are the carrying values of assets measured at fair value on a recurring basis (in thousands).
|
|
|
Fair value at December 31, 2011 |
|
||||||||||
|
(In thousands) |
|
Total |
|
Level 1 |
|
Level 2 |
|
Level 3 |
|
||||
|
Assets |
|
|
|
|
|
|
|
|
|
||||
|
|
|
|
|
|
|
|
|
|
|
||||
|
Investment securities available for sale |
|
|
|
|
|
|
|
|
|
||||
|
U.S. Treasury and other U.S. government obligations |
|
$ |
115,001 |
|
$ |
— |
|
$ |
115,001 |
|
$ |
— |
|
|
Government sponsored enterprise obligations |
|
46,186 |
|
— |
|
$ |
46,186 |
|
— |
|
|||
|
Mortgage-backed securities |
|
120,495 |
|
— |
|
120,495 |
|
— |
|
||||
|
Obligations of states and political subdivisions |
|
69,501 |
|
— |
|
69,501 |
|
— |
|
||||
|
Trust preferred securities of financial institutions |
|
1,002 |
|
1,002 |
|
— |
|
— |
|
||||
|
|
|
|
|
|
|
|
|
|
|
||||
|
Total investment securities available for sale |
|
352,185 |
|
1,002 |
|
351,183 |
|
— |
|
||||
|
|
|
|
|
|
|
|
|
|
|
||||
|
Interest rate swaps |
|
442 |
|
— |
|
442 |
|
— |
|
||||
|
|
|
|
|
|
|
|
|
|
|
||||
|
Total assets |
|
$ |
352,627 |
|
$ |
1,002 |
|
$ |
351,625 |
|
$ |
— |
|
|
|
|
|
|
|
|
|
|
|
|
||||
|
Liabilities |
|
|
|
|
|
|
|
|
|
||||
|
|
|
|
|
|
|
|
|
|
|
||||
|
Interest rate swaps |
|
$ |
442 |
|
$ |
— |
|
$ |
442 |
|
$ |
— |
|
|
|
|
Fair value at December 31, 2010 |
|
||||||||||
|
(In thousands) |
|
Total |
|
Level 1 |
|
Level 2 |
|
Level 3 |
|
||||
|
Assets |
|
|
|
|
|
|
|
|
|
||||
|
|
|
|
|
|
|
|
|
|
|
||||
|
Investment securities available for sale |
|
|
|
|
|
|
|
|
|
||||
|
Government sponsored enterprise obligations |
|
$ |
114,539 |
|
— |
|
$ |
114,539 |
|
— |
|
||
|
Mortgage-backed securities |
|
60,748 |
|
— |
|
60,748 |
|
— |
|
||||
|
Obligations of states and political subdivisions |
|
68,789 |
|
— |
|
68,789 |
|
— |
|
||||
|
Trust preferred securities of financial institutions |
|
1,256 |
|
1,256 |
|
— |
|
— |
|
||||
|
|
|
|
|
|
|
|
|
|
|
||||
|
Total investment securities available for sale |
|
245,332 |
|
1,256 |
|
244,076 |
|
— |
|
||||
|
|
|
|
|
|
|
|
|
|
|
||||
|
Interest rate swaps |
|
305 |
|
— |
|
305 |
|
— |
|
||||
|
|
|
|
|
|
|
|
|
|
|
||||
|
Total assets |
|
$ |
245,637 |
|
$ |
1,256 |
|
$ |
244,381 |
|
$ |
— |
|
|
|
|
|
|
|
|
|
|
|
|
||||
|
Liabilities |
|
|
|
|
|
|
|
|
|
||||
|
|
|
|
|
|
|
|
|
|
|
||||
|
Interest rate swaps |
|
$ |
305 |
|
$ |
— |
|
$ |
305 |
|
$ |
— |
|
Bancorp did not have any financial instruments classified within Level 3of the valuation hierarchy for assets and liabilities measured at fair value on a recurring basis at December 31, 2011 or 2010.
Mortgage loans held for sale are recorded at the lower of cost or market value. The portfolio is comprised of residential real estate loans and fair value is based on specific prices of underlying contracts for sales to investors. These measurements are classified as Level 2. Because the fair value of the loans held for sale exceeded their carrying value, they are not included in either table below for December 31, 2011 or 2010.
MSRs are recorded at fair value upon capitalization, are amortized to correspond with estimated servicing income, and are periodically assessed for impairment based on fair value at the reporting date. Fair value is based on a valuation model that calculates the present value of estimated net servicing income. The model incorporates assumptions that market participants would use in estimating future net servicing income. These measurements are classified as Level 3. At December 31, 2011 and 2010 there was no valuation allowance for the mortgage servicing rights, as the fair value exceeded the cost. Accordingly, the MSRs are not included in either table below for December 31, 2011 or 2010.
Other real estate owned, which is carried at the lower of cost or fair value, is periodically assessed for impairment based on fair value at the reporting date. Fair value is determined from external appraisals using judgments and estimates of external professionals. Many of these inputs are not observable and, accordingly, these measurements are classified as Level 3. At December 31, 2011 and 2010, the carrying value of other real estate owned was $7,773,000 and $5,445,000, respectively. Other real estate owned is not included in either table below, as the fair value of the properties exceeded their carrying value at December 31, 2011 and 2010.
For impaired loans in the table below, the fair value is calculated as the carrying value of only loans with a specific valuation allowance, less the specific allowance. As of December 31, 2011, total impaired loans with a valuation allowance were $12.6 million, and the specific allowance totaled $2.6 million, resulting in a fair value of $10.0 million, compared to total impaired loans with a valuation allowance of $7.3 million, and the specific allowance allocation totaling $1.8 million, resulting in a fair value of $5.5 million at December 31, 2010. The losses represent the change in the specific allowances for the period indicated.
Below are the carrying values of assets measured at fair value on a non-recurring basis (in thousands).
|
|
|
Fair value at December 31, 2011 |
|
|
|
|||||||||||
|
(in thousands) |
|
Total |
|
Level 1 |
|
Level 2 |
|
Level 3 |
|
Total losses |
|
|||||
|
Impaired loans |
|
$ |
10,021 |
|
$ |
— |
|
$ |
— |
|
$ |
10,021 |
|
$ |
(1,961 |
) |
|
|
|
|
|
|
|
|
|
|
|
|
|
|||||
|
Total |
|
$ |
10,021 |
|
$ |
— |
|
$ |
— |
|
$ |
10,021 |
|
$ |
(1,961 |
) |
|
|
|
Fair value at December 31, 2010 |
|
|
|
|||||||||||
|
(in thousands) |
|
Total |
|
Level 1 |
|
Level 2 |
|
Level 3 |
|
Total losses |
|
|||||
|
Impaired loans |
|
$ |
5,521 |
|
$ |
— |
|
$ |
— |
|
$ |
5,521 |
|
$ |
(1,771 |
) |
|
|
|
|
|
|
|
|
|
|
|
|
|
|||||
|
Total |
|
$ |
5,521 |
|
$ |
— |
|
$ |
— |
|
$ |
5,521 |
|
$ |
(1,771 |
) |
In the case of the securities portfolio, Bancorp monitors the valuation technique utilized by pricing agencies to ascertain when transfers between levels have occurred. The nature of the remaining assets and liabilities is such that transfers in and out of any level are expected to be rare. For the twelve months ended December 31, 2011, there were no transfers between Levels 1, 2, or 3.
(19) Fair Value of Financial Instruments
The estimated fair values of financial instruments at December 31, 2011 and 2010 are as follows:
|
|
|
December 31, 2011 |
|
December 31, 2010 |
|
||||||||
|
(In thousands) |
|
Carrying
|
|
Fair value |
|
Carrying
|
|
Fair value |
|
||||
|
|
|
|
|
|
|
|
|
|
|
||||
|
Financial assets |
|
|
|
|
|
|
|
|
|
||||
|
Cash and short-term investments |
|
$ |
54,920 |
|
$ |
54,920 |
|
$ |
41,655 |
|
$ |
41,655 |
|
|
Mortgage loans held for sale |
|
4,381 |
|
4,594 |
|
12,387 |
|
12,626 |
|
||||
|
Securities |
|
352,185 |
|
352,185 |
|
245,352 |
|
245,354 |
|
||||
|
Federal Home Loan Bank stock and other securities |
|
5,949 |
|
5,949 |
|
5,772 |
|
5,772 |
|
||||
|
Loans, net |
|
1,515,100 |
|
1,549,473 |
|
1,482,882 |
|
1,507,079 |
|
||||
|
Accrued interest receivable |
|
5,964 |
|
5,964 |
|
6,288 |
|
6,288 |
|
||||
|
Interest rate swap |
|
442 |
|
442 |
|
305 |
|
305 |
|
||||
|
|
|
|
|
|
|
|
|
|
|
||||
|
Financial liabilities |
|
|
|
|
|
|
|
|
|
||||
|
Deposits |
|
$ |
1,617,739 |
|
$ |
1,626,170 |
|
$ |
1,493,468 |
|
$ |
1,512,882 |
|
|
Short-term borrowings |
|
103,299 |
|
103,299 |
|
87,509 |
|
87,509 |
|
||||
|
Long-term borrowings |
|
101,331 |
|
100,491 |
|
101,342 |
|
100,815 |
|
||||
|
Accrued interest payable |
|
232 |
|
232 |
|
304 |
|
304 |
|
||||
|
Interest rate swap |
|
442 |
|
442 |
|
305 |
|
305 |
|
||||
|
|
|
|
|
|
|
|
|
|
|
||||
|
Off balance sheet financial instruments |
|
|
|
|
|
|
|
|
|
||||
|
Commitments to extend credit |
|
318,907 |
|
— |
|
350,314 |
|
— |
|
||||
|
Standby letters of credit |
|
13,289 |
|
(199 |
) |
9,598 |
|
(144 |
) |
||||
Management used the following methods and assumptions to estimate the fair value of each class of financial instrument for which it is practicable to estimate the value.
Cash, Short-term investments, Accrued interest receivable/payable and Short-term borrowings
For these short-term instruments, the carrying amount is a reasonable estimate of fair value.
Securities
For securities, fair value equals quoted market price, if available. If a quoted market price is not available, fair value is estimated using quoted market prices for similar securities or dealer quotes.
Federal Home Loan Bank stock and other securities
For these securities without readily available market values, the carrying amount is a reasonable estimate of fair value.
Mortgage loans held for sale
The fair value of mortgage loans held for sale is determined by market quotes for each loan based on loan type, term, rate, size and the borrower’s credit score.
Loans, net
US GAAP prescribes the exit price concept for estimating fair value of loans. Because there is not a liquid market (exit price) for trading the predominant types of loans in Bancorp’s portfolio, the fair value of loans is estimated by discounting future cash flows using current rates at which similar loans would be made to borrowers with similar credit ratings and for the same remaining maturities (e.g. entrance price).
Interest rate swaps
Fair value measurements are obtained from an outside pricing service. Prices obtained are generally based on dealer quotes, benchmark forward yield curves, and other relevant observable market data.
Deposits
The fair value of demand deposits, savings accounts, and certain money market deposits is the amount payable on demand at the reporting date. The fair value of fixed-rate certificates of deposits is estimated by discounting the future cash flows using the rates currently offered for deposits of similar remaining maturities.
Long-term borrowings
The fair value of long-term borrowings is estimated by discounting the future cash flows using estimates of the current market rate for instruments with similar terms and remaining maturities.
Commitments to extend credit and standby letters of credit
The fair values of commitments to extend credit are estimated using fees currently charged to enter into similar agreements and the creditworthiness of the customers. The fair values of standby letters of credit are based on fees currently charged for similar agreements or the estimated cost to terminate them or otherwise settle the obligations with the counterparties at the reporting date.
Limitations
The fair value estimates are made at a specific point in time based on relevant market information and information about the financial instruments. Because no market exists for a significant portion of Bancorp’s financial instruments, fair value estimates are based on judgments regarding future expected loss experience, current economic conditions, risk characteristics of various financial instruments, and other factors. These estimates are subjective in nature and involve uncertainties and matters of significant judgment and therefore cannot be determined with precision. Therefore, the calculated fair value estimates in many instances cannot be substantiated by comparison to independent markets and, in many cases, may not be realizable in a current sale of the instrument. Changes in assumptions could significantly affect the estimates.
(20) Derivative Financial Instruments
Bancorp typically manages its interest rate risk without the use of hedging instruments, and currently does not have derivative financial instruments employed for any reason except for the accommodation of customers. Bancorp enters into free-standing interest rate swaps for the benefits of its commercial customers who desire to hedge their exposure to changing interest rates. Bancorp hedges its interest rate exposure on commercial customer transactions by entering into offsetting swap agreements with approved reputable independent counterparties with substantially matching terms. Because of matching terms of offsetting contracts and the collateral provisions mitigating any non-performance risk, changes in fair value subsequent to initial recognition are expected to have an insignificant effect on earnings. Exchanges of cash flows related to the interest rate swap agreements for 2011 were offsetting and therefore had no effect on Bancorp’s earnings or cash flows.
At December 31, 2011, Bancorp’s interest rate swaps are recognized as other assets and liabilities in the consolidated balance sheets at fair value. Bancorp’s derivative instruments have not been designated as
hedging instruments. These undesignated derivative instruments are recognized on the consolidated balance sheet at fair value.
The interest rate swap agreements derive their value from underlying interest rates. These transactions involve both credit and market risk. The notional amounts are amounts on which calculations, payments, and the value of the derivative are based. Notional amounts do not represent direct credit exposures. Direct credit exposure is limited to the net difference between the calculated amounts to be received and paid, if any. Bancorp is exposed to credit-related losses in the event of nonperformance by the counterparties to these agreements. Bancorp controls the credit risk of its financial contracts through credit approvals, limits and monitoring procedures, and does not expect any counterparties to fail their obligations.
At December 31, 2011 and 2010, Bancorp had outstanding interest rate swap contracts as follows:
|
|
|
Receiving |
|
Paying |
|
||||||||
|
|
|
December 31, |
|
December 31, |
|
December 31, |
|
December 31, |
|
||||
|
(dollar amounts in thousands) |
|
2011 |
|
2010 |
|
2011 |
|
2010 |
|
||||
|
Notional amount |
|
$ |
4,869 |
|
$ |
5,270 |
|
$ |
4,869 |
|
$ |
5,270 |
|
|
Weighted average maturity (years) |
|
7.2 |
|
8.1 |
|
7.2 |
|
8.1 |
|
||||
|
Fair value |
|
$ |
(442 |
) |
$ |
(305 |
) |
$ |
442 |
|
$ |
305 |
|
(21) Regulatory Matters
Bancorp and the Bank are subject to various capital requirements prescribed by banking regulations and administered by state and federal banking agencies. Under these requirements, Bancorp and the Bank must meet minimum amounts and percentages of Tier I and total capital, as defined, to risk weighted assets and Tier I capital to average assets. Risk weighted assets are determined by applying certain risk weightings prescribed by the regulations to various categories of assets and off-balance sheet commitments. Capital and risk weighted assets may be further subject to qualitative judgments by regulators as to components, risk weighting and other factors. Failure to meet the capital requirements can result in certain mandatory, and possibly discretionary, corrective actions prescribed by the regulations or determined to be necessary by the regulators, which could materially affect the consolidated financial statements. Management believes Bancorp and the Bank met all capital requirements to which they were subject as of December 31, 2011.
As of December 2011 and 2010, the Bank’s primary regulator categorized the Bank as well capitalized under the regulatory framework for prompt corrective action. There are no conditions or events since those notifications that management believes have changed the Bank’s capital categories.
A summary of Bancorp’s and the Bank’s capital ratios at December 31, 2011 and 2010 follows:
|
December 31, 2011 |
|
Actual |
|
Minimum for
|
|
Minimum for well
|
|
|||||||||
|
(Dollars in thousands) |
|
Amount |
|
Ratio |
|
Amount |
|
Ratio |
|
Amount |
|
Ratio |
|
|||
|
|
|
|
|
|
|
|
|
|
|
|
|
|
|
|||
|
Total risk-based capital (1) |
|
|
|
|
|
|
|
|
|
|
|
|
|
|||
|
Consolidated |
|
$ |
242,365 |
|
14.63 |
% |
$ |
132,530 |
|
8.00 |
% |
NA |
|
NA |
|
|
|
Bank |
|
210,614 |
|
12.77 |
% |
131,943 |
|
8.00 |
% |
$ |
164,929 |
|
10.00 |
% |
||
|
|
|
|
|
|
|
|
|
|
|
|
|
|
|
|||
|
Tier I risk-based capital (1) |
|
|
|
|
|
|
|
|
|
|
|
|
|
|||
|
Consolidated |
|
$ |
211,544 |
|
12.77 |
% |
$ |
66,263 |
|
4.00 |
% |
NA |
|
NA |
|
|
|
Bank |
|
179,890 |
|
10.91 |
% |
65,954 |
|
4.00 |
% |
$ |
98,931 |
|
6.00 |
% |
||
|
|
|
|
|
|
|
|
|
|
|
|
|
|
|
|||
|
Leverage (2) |
|
|
|
|
|
|
|
|
|
|
|
|
|
|||
|
Consolidated |
|
$ |
211,544 |
|
10.53 |
% |
$ |
60,269 |
|
3.00 |
% |
NA |
|
NA |
|
|
|
Bank |
|
179,890 |
|
8.99 |
% |
60,030 |
|
3.00 |
% |
$ |
100,050 |
|
5.00 |
% |
||
|
December 31, 2010 |
|
Actual |
|
Minimum for
|
|
Minimum for well
|
|
|||||||||
|
(Dollars in thousands) |
|
Amount |
|
Ratio |
|
Amount |
|
Ratio |
|
Amount |
|
Ratio |
|
|||
|
|
|
|
|
|
|
|
|
|
|
|
|
|
|
|||
|
Total risk-based capital (1) |
|
|
|
|
|
|
|
|
|
|
|
|
|
|||
|
Consolidated |
|
$ |
226,421 |
|
13.93 |
% |
$ |
130,034 |
|
8.00 |
% |
NA |
|
NA |
|
|
|
Bank |
|
183,562 |
|
11.37 |
% |
129,155 |
|
8.00 |
% |
$ |
161,444 |
|
10.00 |
% |
||
|
|
|
|
|
|
|
|
|
|
|
|
|
|
|
|||
|
Tier I risk-based capital (1) |
|
|
|
|
|
|
|
|
|
|
|
|
|
|||
|
Consolidated |
|
$ |
196,040 |
|
12.06 |
% |
$ |
65,022 |
|
4.00 |
% |
NA |
|
NA |
|
|
|
Bank |
|
153,311 |
|
9.49 |
% |
64,620 |
|
4.00 |
% |
$ |
96,930 |
|
6.00 |
% |
||
|
|
|
|
|
|
|
|
|
|
|
|
|
|
|
|||
|
Leverage (2) |
|
|
|
|
|
|
|
|
|
|
|
|
|
|||
|
Consolidated |
|
$ |
196,040 |
|
10.31 |
% |
$ |
57,044 |
|
3.00 |
% |
NA |
|
NA |
|
|
|
Bank |
|
153,311 |
|
8.12 |
% |
56,642 |
|
3.00 |
% |
$ |
94,403 |
|
5.00 |
% |
||
(1) Ratio is computed in relation to risk-weighted assets.
(2) Ratio is computed in relation to average assets.
NA — Not applicable. Well capitalized is not defined for holding companies in regulatory framework.
The variance between the consolidated and the Bank’s capital ratios is largely due to the Bancorp’s 2008 issuance of $30 million of trust preferred securities and a special dividend of $25 million from the Bank to Bancorp in 2009 as part of a strategy to minimize state bank taxes. This capital is available to the Bank as necessary.
Included in the total risk based capital at December 31, 2011 and 2010 was $10 million of subordinated debentures, which qualified as Tier 2 capital. Bancorp prepaid the debentures in the first quarter of 2012.
(22) S.Y. Bancorp, Inc. (parent company only)
Condensed Balance Sheets
|
|
|
December 31, |
|
||||
|
(In thousands) |
|
2011 |
|
2010 |
|
||
|
|
|
|
|
|
|
||
|
Assets |
|
|
|
|
|
||
|
Cash on deposit with subsidiary bank |
|
$ |
24,966 |
|
$ |
28,662 |
|
|
Investment in and receivable from subsidiaries |
|
186,031 |
|
159,353 |
|
||
|
Securities available for sale (amortized cost of $1,000 in 2011 and $4,639 in 2010) |
|
1,002 |
|
4,649 |
|
||
|
Other assets |
|
6,731 |
|
8,176 |
|
||
|
Total assets |
|
$ |
218,730 |
|
$ |
200,840 |
|
|
|
|
|
|
|
|
||
|
Liabilities and stockholders’ equity |
|
|
|
|
|
||
|
Other liabilities |
|
$ |
144 |
|
$ |
79 |
|
|
Subordinated debentures |
|
30,900 |
|
30,900 |
|
||
|
Total stockholders’ equity |
|
187,686 |
|
169,861 |
|
||
|
Total liabilities and stockholders’ equity |
|
$ |
218,730 |
|
$ |
200,840 |
|
Condensed Statements of Income
|
|
|
Years ended December 31, |
|
|||||||
|
(In thousands) |
|
2011 |
|
2010 |
|
2009 |
|
|||
|
|
|
|
|
|
|
|
|
|||
|
Income - dividends and interest from subsidiaries |
|
$ |
90 |
|
$ |
90 |
|
$ |
29,683 |
|
|
Income - interest income from securities |
|
104 |
|
351 |
|
102 |
|
|||
|
Gain on securities sold |
|
— |
|
159 |
|
— |
|
|||
|
Income (loss) - other |
|
(402 |
) |
606 |
|
459 |
|
|||
|
Expenses |
|
4,654 |
|
4,531 |
|
4,134 |
|
|||
|
Income (loss) before income taxes and equity in undistributed net income of subsidiary |
|
(4,862 |
) |
(3,325 |
) |
26,110 |
|
|||
|
Income tax benefit |
|
(1,889 |
) |
(1,211 |
) |
(963 |
) |
|||
|
Income (loss) before equity in undistributed net income of subsidiary |
|
(2,973 |
) |
(2,114 |
) |
27,073 |
|
|||
|
Equity in undistributed net income of subsidiary |
|
26,577 |
|
25,067 |
|
(10,765 |
) |
|||
|
Net income |
|
$ |
23,604 |
|
$ |
22,953 |
|
$ |
16,308 |
|
Condensed Statements of Cash Flows
|
|
|
Years ended December 31 |
|
|||||||
|
(in thousands) |
|
2011 |
|
2010 |
|
2009 |
|
|||
|
|
|
|
|
|
|
|
|
|||
|
Operating activities |
|
|
|
|
|
|
|
|||
|
Net income |
|
$ |
23,604 |
|
$ |
22,953 |
|
$ |
16,308 |
|
|
Adjustments to reconcile net income to net cash provided by operating activities: |
|
|
|
|
|
|
|
|||
|
Equity in undistributed net (loss) income of subsidiaries |
|
(26,577 |
) |
(25,067 |
) |
10,765 |
|
|||
|
Increase in receivable from subsidiaries |
|
(101 |
) |
(62 |
) |
(3,290 |
) |
|||
|
Stock compensation expense |
|
1,165 |
|
952 |
|
691 |
|
|||
|
Excess tax benefits from share- based compensation arrangements |
|
(125 |
) |
(140 |
) |
(244 |
) |
|||
|
Depreciation, amortization and accretion, net |
|
9 |
|
90 |
|
— |
|
|||
|
Gain on sale of securities available for sale |
|
— |
|
(159 |
) |
— |
|
|||
|
Decrease (increase) in other assets |
|
3,983 |
|
(1,861 |
) |
2,039 |
|
|||
|
(Decrease) increase in other liabilities |
|
(17 |
) |
317 |
|
(255 |
) |
|||
|
|
|
|
|
|
|
|
|
|||
|
Net cash provided by (used in) operating activities |
|
1,941 |
|
(2,977 |
) |
26,014 |
|
|||
|
|
|
|
|
|
|
|
|
|||
|
Investing activities |
|
|
|
|
|
|
|
|||
|
Purchases of securities available for sale |
|
— |
|
(74,835 |
) |
(44,999 |
) |
|||
|
Proceeds from sale of securities available for sale |
|
— |
|
27,064 |
|
— |
|
|||
|
Proceeds from maturities of securities available for sale |
|
3,630 |
|
44,450 |
|
45,000 |
|
|||
|
|
|
|
|
|
|
|
|
|||
|
Net cash provided by (used in) investing activities |
|
3,630 |
|
(3,321 |
) |
1 |
|
|||
|
|
|
|
|
|
|
|
|
|||
|
Financing activities |
|
|
|
|
|
|
|
|||
|
Proceeds from stock options |
|
705 |
|
1,106 |
|
1,687 |
|
|||
|
Excess tax benefit from share-based compensation arrangements |
|
125 |
|
140 |
|
150 |
|
|||
|
Common stock repurchases |
|
(167 |
) |
(396 |
) |
(393 |
) |
|||
|
Cash dividends paid |
|
(9,930 |
) |
(11,765 |
) |
(9,211 |
) |
|||
|
|
|
|
|
|
|
|
|
|||
|
Net cash used in financing activities |
|
(9,267 |
) |
(10,915 |
) |
(7,767 |
) |
|||
|
|
|
|
|
|
|
|
|
|||
|
Net (decrease) increase in cash |
|
(3,696 |
) |
(17,213 |
) |
18,248 |
|
|||
|
Cash at beginning of year |
|
28,662 |
|
45,875 |
|
27,627 |
|
|||
|
|
|
|
|
|
|
|
|
|||
|
Cash at end of year |
|
$ |
24,966 |
|
$ |
28,662 |
|
$ |
45,875 |
|
(23) Segments
The Bank’s, and thus Bancorp’s, principal activities include commercial banking and investment management and trust. Commercial banking provides a full range of loan and deposit products to individual consumers and businesses. Commercial banking also includes the Bank’s mortgage origination and securities brokerage activity. Investment management and trust provides wealth management services including investment management, trust and estate administration, and retirement plan services.
The financial information for each business segment reflects that which is specifically identifiable or allocated based on an internal allocation method. Income taxes are allocated based on the effective federal income tax rate adjusted for any tax exempt activity. All tax exempt activity and provision for loan losses have been allocated to the commercial banking segment. The measurement of the performance of the business segments is based on the management structure of the Bank and is not necessarily comparable with similar information for any other financial institution. The information presented is also not necessarily indicative of the segments’ operations if they were independent entities.
Principally, all of the net assets of S.Y. Bancorp, Inc. are involved in the commercial banking segment. Bancorp has goodwill of $682,000 related to the 1996 purchase of a bank in southern Indiana. This purchase facilitated Bancorp’s expansion in southern Indiana. Goodwill has been assigned to the commercial banking segment.
Selected financial information by business segment follows:
|
|
|
|
|
Investment |
|
|
|
|||
|
|
|
Commercial |
|
management |
|
|
|
|||
|
(In thousands) |
|
banking |
|
and trust |
|
Total |
|
|||
|
Year ended December 31, 2011 |
|
|
|
|
|
|
|
|||
|
Net interest income |
|
$ |
70,592 |
|
$ |
140 |
|
$ |
70,732 |
|
|
Provision for loan losses |
|
12,600 |
|
— |
|
12,600 |
|
|||
|
Investment management and trust services |
|
— |
|
13,841 |
|
13,841 |
|
|||
|
All other non-interest income |
|
19,382 |
|
21 |
|
19,403 |
|
|||
|
Non-interest expense |
|
52,527 |
|
7,054 |
|
59,581 |
|
|||
|
Income before income taxes |
|
24,847 |
|
6,948 |
|
31,795 |
|
|||
|
Tax expense |
|
5,992 |
|
2,199 |
|
8,191 |
|
|||
|
Net income |
|
$ |
18,855 |
|
$ |
4,749 |
|
$ |
23,604 |
|
|
|
|
|
|
|
|
|
|
|||
|
Year ended December 31, 2010 |
|
|
|
|
|
|
|
|||
|
Net interest income |
|
$ |
66,764 |
|
$ |
115 |
|
$ |
66,879 |
|
|
Provision for loan losses |
|
11,469 |
|
— |
|
11,469 |
|
|||
|
Investment management and trust services |
|
— |
|
13,260 |
|
13,260 |
|
|||
|
All other non-interest income |
|
20,479 |
|
— |
|
20,479 |
|
|||
|
Non-interest expense |
|
49,618 |
|
7,513 |
|
57,131 |
|
|||
|
Income before income taxes |
|
26,156 |
|
5,862 |
|
32,018 |
|
|||
|
Tax expense |
|
7,013 |
|
2,052 |
|
9,065 |
|
|||
|
Net income |
|
$ |
19,143 |
|
$ |
3,810 |
|
$ |
22,953 |
|
|
|
|
|
|
|
|
|
|
|||
|
Year ended December 31, 2009 |
|
|
|
|
|
|
|
|||
|
Net interest income |
|
$ |
58,517 |
|
$ |
158 |
|
$ |
58,675 |
|
|
Provision for loan losses |
|
12,775 |
|
— |
|
12,775 |
|
|||
|
Investment management and trust services |
|
— |
|
11,180 |
|
11,180 |
|
|||
|
All other non-interest income |
|
18,856 |
|
— |
|
18,856 |
|
|||
|
Non-interest expense |
|
46,305 |
|
6,390 |
|
52,695 |
|
|||
|
Income before income taxes |
|
18,293 |
|
4,948 |
|
23,241 |
|
|||
|
Tax expense |
|
5,201 |
|
1,732 |
|
6,933 |
|
|||
|
Net income |
|
$ |
13,092 |
|
$ |
3,216 |
|
$ |
16,308 |
|
(24) Quarterly Operating Results (unaudited)
Following is a summary of quarterly operating results (unaudited) for 2011 and 2010:
|
|
|
2011 |
|
2010 |
|
||||||||||||||||||||
|
(In thousands, except per |
|
4th |
|
3rd |
|
2nd |
|
1st |
|
4th |
|
3rd |
|
2nd |
|
1st |
|
||||||||
|
share data |
|
Qtr. |
|
Qtr. |
|
Qtr. |
|
Qtr. |
|
Qtr. |
|
Qtr. |
|
Qtr. |
|
Qtr. |
|
||||||||
|
|
|
|
|
|
|
|
|
|
|
|
|
|
|
|
|
|
|
||||||||
|
Interest income |
|
$ |
21,569 |
|
$ |
21,616 |
|
$ |
21,566 |
|
$ |
21,288 |
|
$ |
21,723 |
|
$ |
22,018 |
|
$ |
21,448 |
|
$ |
20,957 |
|
|
Interest expense |
|
3,553 |
|
3,826 |
|
3,955 |
|
3,973 |
|
4,399 |
|
4,804 |
|
4,901 |
|
5,163 |
|
||||||||
|
|
|
|
|
|
|
|
|
|
|
|
|
|
|
|
|
|
|
||||||||
|
Net interest income |
|
18,016 |
|
17,790 |
|
17,611 |
|
17,315 |
|
17,324 |
|
17,214 |
|
16,547 |
|
15,794 |
|
||||||||
|
|
|
|
|
|
|
|
|
|
|
|
|
|
|
|
|
|
|
||||||||
|
Provision for loan losses |
|
3,100 |
|
4,100 |
|
2,600 |
|
2,800 |
|
3,695 |
|
2,695 |
|
2,384 |
|
2,695 |
|
||||||||
|
Net interest income after provision |
|
14,916 |
|
13,690 |
|
15,011 |
|
14,515 |
|
13,629 |
|
14,519 |
|
14,163 |
|
13,099 |
|
||||||||
|
Non-interest income |
|
9,229 |
|
7,858 |
|
8,152 |
|
8,005 |
|
9,578 |
|
8,262 |
|
7,923 |
|
7,976 |
|
||||||||
|
Non-interest expenses |
|
16,727 |
|
13,302 |
|
14,725 |
|
14,827 |
|
15,083 |
|
13,909 |
|
14,381 |
|
13,758 |
|
||||||||
|
|
|
|
|
|
|
|
|
|
|
|
|
|
|
|
|
|
|
||||||||
|
Income before income taxes |
|
7,418 |
|
8,246 |
|
8,438 |
|
7,693 |
|
8,124 |
|
8,872 |
|
7,705 |
|
7,317 |
|
||||||||
|
Income tax expense |
|
1,076 |
|
2,472 |
|
2,441 |
|
2,202 |
|
2,073 |
|
2,507 |
|
2,149 |
|
2,336 |
|
||||||||
|
|
|
|
|
|
|
|
|
|
|
|
|
|
|
|
|
|
|
||||||||
|
Net income |
|
$ |
6,342 |
|
$ |
5,774 |
|
$ |
5,997 |
|
$ |
5,491 |
|
$ |
6,051 |
|
$ |
6,365 |
|
$ |
5,556 |
|
$ |
4,981 |
|
|
|
|
|
|
|
|
|
|
|
|
|
|
|
|
|
|
|
|
||||||||
|
Basic earnings per share |
|
$ |
0.46 |
|
$ |
0.42 |
|
$ |
0.43 |
|
$ |
0.40 |
|
$ |
0.44 |
|
$ |
0.46 |
|
$ |
0.41 |
|
$ |
0.37 |
|
|
Diluted earnings per share |
|
0.46 |
|
0.42 |
|
0.43 |
|
0.40 |
|
0.44 |
|
0.46 |
|
0.40 |
|
0.36 |
|
||||||||
Note: The sum of earnings per share of each of the quarters in 2011 and 2010 may not add to the year to date amount reported in Bancorp’s consolidated financial statements due to rounding.
Report of Independent Registered Public Accounting Firm
To the Board of Directors and Stockholders
S.Y. Bancorp, Inc.:
We have audited the accompanying consolidated balance sheets of S.Y. Bancorp, Inc. and subsidiaries (the “Company”) as of December 31, 2011 and 2010, and the related consolidated statements of income, changes in stockholders’ equity, comprehensive income, and cash flows for each of the years in the three-year period ended December 31, 2011. These consolidated financial statements are the responsibility of the Company’s management. Our responsibility is to express an opinion on these consolidated financial statements based on our audits.
We conducted our audits in accordance with the standards of the Public Company Accounting Oversight Board (United States). Those standards require that we plan and perform the audit to obtain reasonable assurance about whether the financial statements are free of material misstatement. An audit includes examining, on a test basis, evidence supporting the amounts and disclosures in the financial statements. An audit also includes assessing the accounting principles used and significant estimates made by management, as well as evaluating the overall financial statement presentation. We believe that our audits provide a reasonable basis for our opinion.
In our opinion, the consolidated financial statements referred to above present fairly, in all material respects, the financial position of S.Y. Bancorp, Inc. and subsidiaries as of December 31, 2011 and 2010, and the results of their operations and their cash flows for each of the years in the three-year period ended December 31, 2011, in conformity with U.S. generally accepted accounting principles.
We also have audited, in accordance with the standards of the Public Company Accounting Oversight Board (United States), S.Y. Bancorp, Inc.’s internal control over financial reporting as of December 31, 2011, based on criteria established in Internal Control — Integrated Framework issued by the Committee of Sponsoring Organizations of the Treadway Commission (COSO), and our report dated February 29, 2012 expressed an unqualified opinion on the effectiveness of the Company’s internal control over financial reporting.
|
(signed) KPMG LLP |
|
|
|
|
|
Louisville, Kentucky |
|
February 29, 2012 |
Management’s Report on Consolidated Financial Statements
The accompanying consolidated financial statements and other financial data were prepared by the management of S.Y. Bancorp, Inc. (Bancorp), which has the responsibility for the integrity of the information presented. The consolidated financial statements have been prepared in conformity with U.S. generally accepted accounting principles and, as such, include amounts that are the best estimates and judgments of management with consideration given to materiality.
Management is further responsible for maintaining a system of internal controls designed to provide reasonable assurance that the books and records reflect the transactions of Bancorp and that its established policies and procedures are carefully followed. Management believes that Bancorp’s system, taken as a whole, provides reasonable assurance that transactions are executed in accordance with management’s general or specific authorization; transactions are recorded as necessary to permit preparation of financial statements in conformity with U.S. generally accepted accounting principles and to maintain accountability for assets; access to assets is permitted only in accordance with management’s general or specific authorization, and the recorded accountability for assets is compared with the existing assets at reasonable intervals and appropriate action is taken with respect to any differences.
Management also seeks to assure the objectivity and integrity of Bancorp’s financial data by the careful selection and training of qualified personnel, an internal audit function and organizational arrangements that provide an appropriate division of responsibility.
KPMG LLP, the independent registered public accounting firm that audited the consolidated financial statements of Bancorp included in this Annual Report on Form 10-K, has issued a report on Bancorp’s internal control over financial reporting as of December 31, 2011. The report expresses an unqualified opinion on the effectiveness of Bancorp’s internal control over financial reporting as of December 31, 2011.
The Board of Directors provides its oversight role for the consolidated financial statements through the Audit Committee. The Audit Committee meets periodically with management, the internal auditors, and the independent auditors, each on a private basis, to review matters relating to financial reporting, the internal control systems, and the scope and results of audit efforts. The internal and independent auditors have unrestricted access to the Audit Committee, with and without the presence of management, to discuss accounting, auditing, and financial reporting matters. The Audit Committee also recommends the appointment of the independent auditors to Board of Directors, and ultimately has sole authority to appoint or replace the independent auditors.
|
/s/ David P. Heintzman |
|
|
David P. Heintzman |
|
|
Chairman and Chief Executive Officer |
|
|
|
|
|
/s/ Nancy B. Davis |
|
|
Nancy B. Davis |
|
|
Executive Vice President and Chief Financial Officer |
|
Item 9. Changes in and Disagreements with Accountants on Accounting and Financial Disclosure
None
Item 9A. Controls and Procedures
Bancorp maintains disclosure controls and procedures designed to ensure that it is able to collect the information it is required to disclose in the reports it files with the Securities and Exchange Commission (SEC), and to process, summarize and disclose this information within the time periods specified in the rules of the SEC. Based on their evaluation of Bancorp’s disclosure controls and procedures which took place as of December 31, 2011, the Chief Executive and Chief Financial Officers believe that these controls and procedures are effective to ensure that Bancorp is able to collect, process and disclose the information it is required to disclose in the reports it files with the SEC within the required time periods.
Based on the evaluation of Bancorp’s disclosure controls and procedures by the Chief Executive and Chief Financial Officers, no changes occurred during the fiscal quarter ended December 31, 2011 in Bancorp’s internal control over financial reporting that has materially affected, or is reasonably likely to materially affect, Bancorp’s internal control over financial reporting.
Management’s Report on Internal Control Over Financial Reporting
The management of S.Y. Bancorp, Inc. and subsidiaries (Bancorp) is responsible for establishing and maintaining adequate internal control over financial reporting. Bancorp’s internal control over financial reporting is a process designed under the supervision of Bancorp’s Chief Executive Officer and Chief Financial Officer, and effected by Bancorp’s board of directors, management and other personnel, to provide reasonable assurance regarding the reliability of financial reporting and the preparation of financial statements for external purposes in accordance with U.S. generally accepted accounting principles. This process includes those policies and procedures that:
1. Pertain to the maintenance of records, that in reasonable detail, accurately and fairly reflect the transactions and dispositions of the assets of Bancorp;
2. Provide reasonable assurance that transactions are recorded as necessary to permit preparation of financial statements in accordance with U.S. generally accepted accounting principles, and that receipts and expenditures of Bancorp are being made only in accordance with authorizations of management and directors of Bancorp; and
3. Provide reasonable assurance regarding prevention or timely detection of unauthorized acquisition, use or disposition of Bancorp’s assets that could have a material effect on the financial statements.
Because of its inherent limitations, internal control over financial reporting may not prevent or detect misstatements. Also, projections of any evaluation of effectiveness to future periods are subject to the risk that controls may become inadequate because of changes in conditions, or that the degree of compliance with policies or procedures may deteriorate.
Management has assessed the effectiveness of its internal control over financial reporting as of December 31, 2011, based on the control criteria established in a report entitled Internal Control — Integrated Framework , issued by the Committee of Sponsoring Organizations (COSO) of the Treadway Commission. Based on such assessment, management has concluded that Bancorp’s internal control over financial reporting is effective as of December 31, 2011.
KPMG LLP, the independent registered public accounting firm that audited the consolidated financial statements of Bancorp included in this Annual Report on Form 10-K, has issued a report on Bancorp’s internal control over financial reporting as of December 31, 2011. The report expresses an unqualified opinion on the effectiveness of Bancorp’s internal control over financial reporting as of December 31, 2011.
|
/s/ David P. Heintzman |
|
|
David P. Heintzman |
|
|
Chairman and Chief Executive Officer |
|
|
|
|
|
/s/ Nancy B. Davis |
|
|
Nancy B. Davis |
|
|
Executive Vice President and Chief Financial Officer |
|
Report of Independent Registered Public Accounting Firm
To the Board of Directors and Stockholders
S.Y. Bancorp, Inc.:
We have audited S.Y. Bancorp, Inc.’s internal control over financial reporting as of December 31, 2011, based on criteria established in Internal Control — Integrated Framework issued by the Committee of Sponsoring Organizations of the Treadway Commission (COSO). S.Y. Bancorp, Inc.’s management is responsible for maintaining effective internal control over financial reporting and for its assessment of the effectiveness of internal control over financial reporting, included in the accompanying Management’s Report on Internal Control Over Financial Reporting . Our responsibility is to express an opinion on the Company’s internal control over financial reporting based on our audit.
We conducted our audit in accordance with the standards of the Public Company Accounting Oversight Board (United States). Those standards require that we plan and perform the audit to obtain reasonable assurance about whether effective internal control over financial reporting was maintained in all material respects. Our audit included obtaining an understanding of internal control over financial reporting, assessing the risk that a material weakness exists, and testing and evaluating the design and operating effectiveness of internal control based on the assessed risk. Our audit also included performing such other procedures as we considered necessary in the circumstances. We believe that our audit provides a reasonable basis for our opinion.
A company’s internal control over financial reporting is a process designed to provide reasonable assurance regarding the reliability of financial reporting and the preparation of financial statements for external purposes in accordance with generally accepted accounting principles. A company’s internal control over financial reporting includes those policies and procedures that (1) pertain to the maintenance of records that, in reasonable detail, accurately and fairly reflect the transactions and dispositions of the assets of the company; (2) provide reasonable assurance that transactions are recorded as necessary to permit preparation of financial statements in accordance with generally accepted accounting principles, and that receipts and expenditures of the company are being made only in accordance with authorizations of management and directors of the company; and (3) provide reasonable assurance regarding prevention or timely detection of unauthorized acquisition, use, or disposition of the company’s assets that could have a material effect on the financial statements.
Because of its inherent limitations, internal control over financial reporting may not prevent or detect misstatements. Also, projections of any evaluation of effectiveness to future periods are subject to the risk that controls may become inadequate because of changes in conditions, or that the degree of compliance with the policies or procedures may deteriorate.
In our opinion, S.Y. Bancorp, Inc. maintained, in all material respects, effective internal control over financial reporting as of December 31, 2011, based on criteria established in Internal Control — Integrated Framework issued by the Committee of Sponsoring Organizations of the Treadway Commission.
We also have audited, in accordance with the standards of the Public Company Accounting Oversight Board (United States), the consolidated balance sheets of S.Y. Bancorp, Inc. and subsidiaries as of December 31, 2011 and 2010, and the related consolidated statements of income, changes in stockholders’ equity, comprehensive income, and cash flows for each of the years in the three-year period ended December 31, 2011, and our report dated February 29, 2012 expressed an unqualified opinion on those consolidated financial statements.
|
(signed) KPMG LLP |
|
|
|
|
|
Louisville, Kentucky |
|
February 29, 2012 |
None
Information regarding the directors and executive officers of Bancorp is incorporated herein by reference to the discussion under the headings, “ITEM 2. ELECTION OF ELEVEN DIRECTORS,” and “SECTION 16(A) BENEFICIAL OWNERSHIP REPORTING COMPLIANCE” in Bancorp’s Proxy Statement to be filed with the Securities and Exchange Commission for the 2012 Annual Meeting of Shareholders (“Proxy Statement”) and the section captioned EXECUTIVE OFFICERS OF THE REGISTRANT in this Form 10-K.
Information regarding the Audit Committee is incorporated herein by reference to the discussion under the heading, “BOARD OF DIRECTORS’ MEETINGS AND COMMITTEES” in Bancorp’s Proxy Statement.
Information regarding principal occupation of directors of Bancorp follows:
David H. Brooks — Retired. Former Chairman and Chief Executive Officer, S.Y. Bancorp, Inc. and Stock Yards Bank & Trust Company;
James E. Carrico — Retired. Former Managing Director, Wells Fargo Insurance Services;
Charles R. Edinger, III — President, J. Edinger & Son. Inc.;
David P. Heintzman — Chairman and Chief Executive Officer, S.Y. Bancorp, Inc. and Stock Yards Bank & Trust Company;
Carl G. Herde — Vice President of Finance and Chief Financial Officer, Baptist Healthcare System, Inc.;
James A. Hillebrand —President, S.Y. Bancorp, Inc. and Stock Yards Bank & Trust Company;
Richard A. Lechleiter — Executive Vice President and Chief Financial Officer, Kindred Healthcare, Inc.;
Bruce P. Madison — Chief Executive Officer, Plumbers Supply Company, Inc.;
Richard Northern — Partner, Wyatt, Tarrant & Combs
Nicholas X. Simon — President and Chief Executive Officer, Publishers Printing Company, LLC;
Norman Tasman — President, Tasman Industries Inc. and Tasman Hide Processing Inc.;
Kathy C. Thompson — Senior Executive Vice President, S.Y. Bancorp, Inc. and Stock Yards Bank & Trust Company.
The Board of Directors of Bancorp has adopted a code of ethics for its chief executive officer and financial executives. A copy of the code of ethics is filed as an exhibit to this Annual Report.
Information regarding the compensation of Bancorp’s executive officers and directors is incorporated herein by reference to the discussion under the heading, “EXECUTIVE COMPENSATION AND OTHER INFORMATION — REPORT ON EXECUTIVE COMPENSATION” in Bancorp’s Proxy Statement.
Information regarding the Compensation Committee is incorporated herein by reference to the discussion under the heading, “TRANSACTIONS WITH MANAGEMENT AND OTHERS” in Bancorp’s Proxy Statement. The report of the Compensation Committee shall not be deemed filed for purposes of Section 18 of the Securities Exchange Act of 1934 or otherwise subject to the liabilities of that section, nor shall it be deemed soliciting material or subject to Regulation 14A of the Exchange Act or incorporated by reference in any filing under the Exchange Act or the Securities Act of 1933, except as shall be expressly set forth by specific reference in such filing.
The information required by this item is incorporated herein by reference to the discussion under the headings, “ITEM 2. ELECTION OF ELEVEN DIRECTORS” and “SECURITY OWNERSHIP OF CERTAIN BENEFICIAL OWNERS AND MANAGEMENT,” in Bancorp’s Proxy Statement.
The information required by this item is incorporated herein by reference to the discussion under the headings, “ITEM 2. ELECTION OF ELEVEN DIRECTORS” and “TRANSACTIONS WITH MANAGEMENT AND OTHERS,” in Bancorp’s Proxy Statement.
The information required by this item is incorporated herein by reference to the discussion under the heading, “REPORT OF THE AUDIT COMMITTEE” in Bancorp’s Proxy Statement.
(a) 1. The following financial statements are included in this Form 10-K:
|
Consolidated Balance Sheets — December 31, 2011 and 2010 |
|
Consolidated Statements of Income - years ended December 31, 2011, 2010 and 2009 |
|
Consolidated Statements of Changes in Stockholders’ Equity - years ended December 31, 2011, 2010 and 2009 |
|
Consolidated Statements of Comprehensive Income - years ended December 31, 2011, 2010 and 2009 |
|
Consolidated Statements of Cash Flows - years ended December 31, 2011, 2010 and 2009 |
|
Notes to Consolidated Financial Statements |
|
Report of Independent Registered Public Accounting Firm |
(a) 2. List of Financial Statement Schedules
Schedules to the consolidated financial statements of Bancorp are omitted since they are either not required under the related instructions, are inapplicable, or the required information is shown in the consolidated financial statements or notes thereto.
(a) 3. List of Exhibits
|
3.1 |
|
Amended and Restated Articles of Incorporation of Bancorp filed with the Secretary of State of Kentucky on April 23, 2008. Exhibit 3.1 to Form 8-K filed April 28, 2008, is incorporated by reference herein. |
|
3.2 |
|
Bylaws of Bancorp as currently in effect. Exhibit 3.2 to Form 8-K filed April 28, 2008, is incorporated by reference herein. |
|
4.1 |
|
Rights agreement dated as of April 23, 2003, between S.Y. Bancorp, Inc. and Wachovia Bank, National Association, as rights agent. Exhibit 1 to Form 8-A filed April 23, 2003, is incorporated by reference herein. |
|
4.2 |
|
Indenture for 10% Subordinated Debentures due 2038, dated as of December 23, 2008, between S.Y. Bancorp, Inc. and Wilmington Trust Company, as Trustee. Exhibit 4.1 to Form 8-K filed December 23, 2008, is incorporated by reference herein. |
|
10.1* |
|
S.Y. Bancorp, Inc. Amended And Restated 1995 Stock Incentive Plan. Exhibit 10.1 to Annual Report on Form 10-K for the year ended December 31, 2001, of Bancorp is incorporated by reference herein. |
|
10.2* |
|
Stock Yards Bank & Trust Company Executive Nonqualified Deferred Compensation Plan (as Amended and Restated in 2009), as filed as Exhibit 10.4 to Form 8-K filed on December 19, 2008, is incorporated by reference herein. |
|
10.3* |
|
Stock Yards Bank & Trust Company Director Nonqualified Deferred Compensation Plan (as Amended and Restated in 2009), as filed as Exhibit 10.3 to Form 8-K filed on December 19, 2008, is incorporated by reference herein. |
|
10.4* |
|
Form of Stock Yards Bank & Trust Company Executive Nonqualified Deferred Compensation Plan Employer Contribution Agreement, as filed as Exhibit 10.3 to Form 8-K filed on October 23, 2006, is incorporated by reference herein. |
|
10.5* |
|
Stock Yards Bank & Trust Company 2009 Restated Senior Officers Security Plan Exhibit 10.1 to Form 8-K filed December 19, 2008, is incorporated by reference herein. |
|
10.6* |
|
Change in Control Severance Agreement dated as of January 27, 2010 between Stock Yards Bank & Trust Company and David P. Heintzman, Exhibit 10.1 to Form 8-K filed January 27, 2010, is incorporated by reference herein. |
|
10.7* |
|
Change in Control Severance Agreement dated as of January 27, 2010 between Stock Yards Bank & Trust Company and Kathleen C. Thompson, Exhibit 10.2 to Form 8-K filed January 27, 2010, is incorporated by reference herein. |
|
10.8* |
|
Change in Control Severance Agreement dated as of January 27, 2010 between Stock Yards Bank & Trust Company and James A. Hillebrand, Exhibit 10.3 to Form 8-K filed January 27, 2010, is incorporated by reference herein. |
|
10.9* |
|
Change in Control Severance Agreement dated as of January 27, 2010 between Stock Yards Bank & Trust Company and Nancy Davis, Exhibit 10.4 to Form 8-K filed January 27, 2010, is incorporated by reference herein. |
|
10.10* |
|
Form of Change in Control Severance Agreement (Poindexter, Hoeck and Dishman), Exhibit 10.5 to Form 8-K filed January 27, 2010, is incorporated by reference herein. |
|
10.11* |
|
S.Y. Bancorp, Inc. 2005 Stock Incentive Plan. Exhibit 10.1 to Form 8-K filed May 2, 2005, is incorporated by reference herein. |
|
10.12* |
|
Amendment No. 1 to S. Y. Bancorp, Inc. 2005 Stock Incentive Plan, as filed as Exhibit 10.1 to Form 8-K filed on April 22, 2010, is incorporated by reference herein. |
|
10.13* |
|
Form of Employer Contribution Agreement, Nancy Davis, Participant, as filed as Exhibit 10.4 to Form 8-K filed on October 23, 2006, is incorporated by reference herein. |
|
10.14* |
|
Terms of Restricted Stock Program, as filed as Exhibit 10.1 to Form 8-K filed on February 26, 2007, is incorporated by reference herein. |
|
10.15* |
|
Form of Restricted Stock Agreement (3 year vesting), as filed as Exhibit 10.2 to Form 8-K filed on February 26, 2007, is incorporated by reference herein. |
|
10.16* |
|
Form of Stock Option Grant and Agreement (6 months vesting), as filed as Exhibit 10.1 to Form 8-K filed on January 19, 2006, is incorporated by reference herein. |
|
10.17* |
|
Form of Stock Option Grant and Agreement (5 year vesting), as filed as Exhibit 10.2 to Form 8-K filed on January 19, 2006, is incorporated by reference herein. |
|
10.18* |
|
Form of Stock Appreciation Right Grant Agreement (6 month vesting), as filed as Exhibit 10.1 to Form 8-K filed on February 22, 2008, is incorporated by reference herein. |
|
10.19* |
|
Form of Stock Appreciation Right Grant Agreement (5 year vesting), as filed as Exhibit 10.2 to Form 8-K filed on February 22, 2008, is incorporated by reference herein. |
|
10.20* |
|
Form of Indemnification Agreement between Stock Yards Bank & Trust Company, S.Y. Bancorp, Inc. and each member of the Board of Directors. Exhibit 10.3 to Annual Report on Form 10-K for the year ended December 31, 2001, of Bancorp is incorporated by reference herein. |
|
10.21* |
|
Form of Restricted Stock Award Agreement (5 year vesting) between S.Y. Bancorp, Inc. and each recipient of restricted stock. Exhibit 10.21 to Annual Report on Form 10-K for the year ended December 31, 2010, of Bancorp is incorporated by reference herein. |
|
10.22* |
|
Form of Director Restricted Stock Award Agreement (1 year vesting) between S.Y. Bancorp, Inc. and each member of the Board of Directors. Exhibit 10.22 to Annual Report on Form 10-K for the year ended December 31, 2010, of Bancorp is incorporated by reference herein. |
|
10.23* |
|
Amendment No. 2 to the S. Y. Bancorp, Inc. 2005 Stock Incentive Plan, as filed as Exhibit 10.1 to Form 8-K filed on April 22, 2011, is incorporated by reference herein. |
|
10.24* |
|
Form of S.Y. Bancorp, Inc. Restricted Stock Unit Grant Agreement, as filed as Exhibit 10.2 to Form 8-K filed on April 22, 2011, is incorporated by reference herein. |
|
14 |
|
Code of Ethics for the Chief Executive Officer and Financial Executives. |
|
21 |
|
Subsidiaries of the Registrant. |
|
23 |
|
Consent of Independent Registered Public Accounting Firm. |
|
31.1 |
|
Certifications pursuant to Section 302 of the Sarbanes-Oxley Act by David P. Heintzman. |
|
31.2 |
|
Certifications pursuant to Section 302 of the Sarbanes-Oxley Act by Nancy B. Davis. |
|
32.1 |
|
Certifications pursuant to 18 U.S.C. Section 1350, as Adopted Pursuant to Section 906 of the Sarbanes-Oxley Act of 2002 by David P. Heintzman. |
|
32.2 |
|
Certifications pursuant to 18 U.S.C. Section 1350, as Adopted Pursuant to Section 906 of the Sarbanes-Oxley Act of 2002 by Nancy B. Davis. |
|
101 |
|
The following financial statements from the S.Y.Bancorp, Inc. December 31, 2011 Annual Report on Form 10-K, filed on February 29, 2012, formatted in eXtensible Business Reporting Language(XBRL): (1) Consolidated Balance Sheets (2) Consolidated Statements of Income (3) Consolidated Statement of Changes in Stockholders’ Equity (4) Consolidated Statements of Comprehensive Income (5) Consolidated Statements of Cash Flows (6) Notes to Consolidated Financial Statements |
* Indicates matters related to executive compensation or other management contracts.
Copies of the foregoing Exhibits will be furnished to others upon request and payment of Bancorp’s reasonable expenses in furnishing the exhibits.
(b) Exhibits
The exhibits listed in response to Item 15(a) 3 are filed or furnished as a part of this report.
(c) Financial Statement Schedules
None
Where You Can Find More Information
Bancorp is subject to the informational requirements of the Securities Exchange Act of 1934 and accordingly files its annual report on Form 10-K, quarterly reports on Form 10-Q, current reports on Form 8-K, proxy statements and other information with the Securities and Exchange Commission (“SEC”). The public may read and copy any materials filed with the SEC at the SEC’s Public Reference Room at 100 F Street, NE, Washington, DC 20549. Please call the SEC at (800) SEC-0330 for further information on the Public Reference Room. Bancorp’s public filings are also maintained on the SEC’s Internet site that contains reports, proxy and information statements and other information regarding issuers that file electronically with the SEC. The address of that web site is http://www.sec.gov. In addition, Bancorp’s annual report on Form 10-K, quarterly reports on Form 10-Q, current reports on Form 8-K and amendments to those reports filed or furnished pursuant to Section 13(a) or 15(d) of the Exchange Act may be accessed free of charge through Bancorp’s web site after we have electronically filed such material with, or furnished it to, the SEC. The address of that web site is http://www.syb.com.
Pursuant to the requirements of Section 13 or 15(d) of the Securities Exchange Act of 1934, the registrant has duly caused this report to be signed on its behalf by the undersigned, thereunto duly authorized.
|
February 29, 2012 |
S.Y. BANCORP, INC. |
|
|
|
|
|
|
|
BY: |
/s/ David P. Heintzman |
|
|
|
David P. Heintzman |
|
|
|
Chairman and Chief Executive Officer |
Pursuant to the requirements of the Securities Exchange Act of 1934, this report has been signed below by the following persons on behalf of the registrant and in the capacities and on the dates indicated.
|
/s/ David P. Heintzman |
|
Chairman, Chief Executive Officer and Director |
February 29, 2012 |
|
David P. Heintzman |
|
(principal executive officer) |
|
|
|
|
|
|
|
/s/ James A. Hillebrand |
|
President and Director |
February 29, 2012 |
|
James A. Hillebrand |
|
|
|
|
|
|
|
|
|
/s/ Nancy B. Davis |
|
Executive Vice President and Chief Financial |
February 29, 2012 |
|
Nancy B. Davis |
|
Officer (principal financial and accounting officer) |
|
|
|
|
|
|
|
/s/ David H. Brooks |
|
Director |
February 29, 2012 |
|
David H. Brooks |
|
|
|
|
|
|
|
|
|
/s/ James E. Carrico |
|
Director |
February 29, 2012 |
|
James E. Carrico |
|
|
|
|
|
|
|
|
|
/s/ Charles R. Edinger, III |
|
Director |
February 29, 2012 |
|
Charles R. Edinger, III |
|
|
|
|
|
|
|
|
|
/s/ Carl G. Herde |
|
Director |
February 29, 2012 |
|
Carl G. Herde |
|
|
|
|
|
|
|
|
|
/s/ Richard A. Lechleiter |
|
Director |
February 29, 2012 |
|
Richard A. Lechleiter |
|
|
|
|
|
|
|
|
|
|
|
|
|
|
/s/ Bruce P. Madison |
|
Director |
February 29, 2012 |
|
Bruce P. Madison |
|
|
|
|
|
|
|
|
|
/s/ Richard Northern |
|
Director |
February 29, 2012 |
|
Richard Northern |
|
|
|
|
|
|
|
|
|
/s/ Nicholas X. Simon |
|
Director |
February 29, 2012 |
|
Nicholas X. Simon |
|
|
|
|
|
|
|
|
|
/s/ Norman Tasman |
|
Director |
February 29, 2012 |
|
Norman Tasman |
|
|
|
|
|
|
|
|
|
/s/ Kathy C. Thompson |
|
Senior Executive Vice President and Director |
February 29, 2012 |
|
Kathy C. Thompson |
|
|
|
Exhibit Number
|
3.1 |
|
Amended and Restated Articles of Incorporation of Bancorp filed with the Secretary of State of Kentucky on April 23, 2008. Exhibit 3.1 to Form 8-K filed April 28, 2008, is incorporated by reference herein. |
|
3.2 |
|
Bylaws of Bancorp as currently in effect. Exhibit 3.2 to Form 8-K filed April 28, 2008, is incorporated by reference herein. |
|
4.1 |
|
Rights agreement dated as of April 23, 2003, between S.Y. Bancorp, Inc. and Wachovia Bank, National Association, as rights agent. Exhibit 1 to Form 8-A filed April 23, 2003, is incorporated by reference herein. |
|
4.2 |
|
Indenture for 10% Subordinated Debentures due 2038, dated as of December 23, 2008, between S.Y. Bancorp, Inc. and Wilmington Trust Company, as Trustee. Exhibit 4.1 to Form 8-K filed December 23, 2008, is incorporated by reference herein. |
|
10.1* |
|
S.Y. Bancorp, Inc. Amended And Restated 1995 Stock Incentive Plan. Exhibit 10.1 to Annual Report on Form 10-K for the year ended December 31, 2001, of Bancorp is incorporated by reference herein. |
|
10.2* |
|
Stock Yards Bank & Trust Company Executive Nonqualified Deferred Compensation Plan (as Amended and Restated in 2009), as filed as Exhibit 10.4 to Form 8-K filed on December 19, 2008, is incorporated by reference herein. |
|
10.3* |
|
Stock Yards Bank & Trust Company Director Nonqualified Deferred Compensation Plan (as Amended and Restated in 2009), as filed as Exhibit 10.3 to Form 8-K filed on December 19, 2008, is incorporated by reference herein. |
|
10.4* |
|
Form of Stock Yards Bank & Trust Company Executive Nonqualified Deferred Compensation Plan Employer Contribution Agreement, as filed as Exhibit 10.3 to Form 8-K filed on October 23, 2006, is incorporated by reference herein. |
|
10.5* |
|
Stock Yards Bank & Trust Company 2009 Restated Senior Officers Security Plan Exhibit 10.1 to Form 8-K filed December 19, 2008, is incorporated by reference herein. |
|
10.6* |
|
Change in Control Severance Agreement dated as of January 27, 2010 between Stock Yards Bank & Trust Company and David P. Heintzman, Exhibit 10.1 to Form 8-K filed January 27, 2010, is incorporated by reference herein. |
|
10.7* |
|
Change in Control Severance Agreement dated as of January 27, 2010 between Stock Yards Bank & Trust Company and Kathleen C. Thompson, Exhibit 10.2 to Form 8-K filed January 27, 2010, is incorporated by reference herein. |
|
10.8* |
|
Change in Control Severance Agreement dated as of January 27, 2010 between Stock Yards Bank & Trust Company and James A. Hillebrand, Exhibit 10.3 to Form 8-K filed January 27, 2010, is incorporated by reference herein. |
|
10.9* |
|
Change in Control Severance Agreement dated as of January 27, 2010 between Stock Yards Bank & Trust Company and Nancy Davis, Exhibit 10.4 to Form 8-K filed January 27, 2010, is incorporated by reference herein. |
|
10.10* |
|
Form of Change in Control Severance Agreement (Poindexter, Hoeck and Dishman), Exhibit 10.5 to Form 8-K filed January 27, 2010, is incorporated by reference herein. |
|
10.11* |
|
S.Y. Bancorp, Inc. 2005 Stock Incentive Plan. Exhibit 10.1 to Form 8-K filed May 2, 2005, is incorporated by reference herein. |
|
10.12* |
|
Amendment No. 1 to S. Y. Bancorp, Inc. 2005 Stock Incentive Plan, as filed as Exhibit 10.1 to Form 8-K filed on April 22, 2010, is incorporated by reference herein. |
|
10.13* |
|
Form of Employer Contribution Agreement, Nancy Davis, Participant, as filed as Exhibit 10.4 to Form 8-K filed on October 23, 2006, is incorporated by reference herein. |
|
10.14* |
|
Terms of Restricted Stock Program, as filed as Exhibit 10.1 to Form 8-K filed on February 26, 2007, is incorporated by reference herein. |
|
10.15* |
|
Form of Restricted Stock Agreement (3 year vesting), as filed as Exhibit 10.2 to Form 8-K filed on February 26, 2007, is incorporated by reference herein. |
|
10.16* |
|
Form of Stock Option Grant and Agreement (6 months vesting), as filed as Exhibit 10.1 to Form 8-K filed on January 19, 2006, is incorporated by reference herein. |
|
10.17* |
|
Form of Stock Option Grant and Agreement (5 year vesting), as filed as Exhibit 10.2 to Form 8-K filed on January 19, 2006, is incorporated by reference herein. |
|
10.18* |
|
Form of Stock Appreciation Right Grant Agreement (6 month vesting), as filed as Exhibit 10.1 to Form 8-K filed on February 22, 2008, is incorporated by reference herein. |
|
10.19* |
|
Form of Stock Appreciation Right Grant Agreement (5 year vesting), as filed as Exhibit 10.2 to Form 8-K filed on February 22, 2008, is incorporated by reference herein. |
|
10.20* |
|
Form of Indemnification Agreement between Stock Yards Bank & Trust Company, S.Y. Bancorp, Inc. and each member of the Board of Directors. Exhibit 10.3 to Annual Report on Form 10-K for the year ended December 31, 2001, of Bancorp is incorporated by reference herein. |
|
10.21* |
|
Form of Restricted Stock Award Agreement (5 year vesting) between S.Y. Bancorp, Inc. and each recipient of restricted stock. Exhibit 10.21 to Annual Report on Form 10-K for the year ended December 31, 2010, of Bancorp is incorporated by reference herein. |
|
10.22* |
|
Form of Director Restricted Stock Award Agreement (1 year vesting) between S.Y. Bancorp, Inc. and each member of the Board of Directors. Exhibit 10.22 to Annual Report on Form 10-K for the year ended December 31, 2010, of Bancorp is incorporated by reference herein. |
|
10.23* |
|
Amendment No. 2 to the S. Y. Bancorp, Inc. 2005 Stock Incentive Plan, as filed as Exhibit 10.1 to Form 8-K filed on April 22, 2011, is incorporated by reference herein. |
|
10.24* |
|
Form of S.Y. Bancorp, Inc. Restricted Stock Unit Grant Agreement, as filed as Exhibit 10.2 to Form 8-K filed on April 22, 2011, is incorporated by reference herein. |
|
14 |
|
Code of Ethics for the Chief Executive Officer and Financial Executives. |
|
21 |
|
Subsidiaries of the Registrant. |
|
23 |
|
Consent of Independent Registered Public Accounting Firm. |
|
31.1 |
|
Certifications pursuant to Section 302 of the Sarbanes-Oxley Act by David P. Heintzman. |
|
31.2 |
|
Certifications pursuant to Section 302 of the Sarbanes-Oxley Act by Nancy B. Davis. |
|
32.1 |
|
Certifications pursuant to 18 U.S.C. Section 1350, as Adopted Pursuant to Section 906 of the Sarbanes-Oxley Act of 2002 by David P. Heintzman. |
|
32.2 |
|
Certifications pursuant to 18 U.S.C. Section 1350, as Adopted Pursuant to Section 906 of the Sarbanes-Oxley Act of 2002 by Nancy B. Davis. |
|
101 |
|
The following financial statements from the S.Y.Bancorp, Inc. December 31, 2011 Annual Report on Form 10-K, filed on February 29, 2012, formatted in eXtensible Business Reporting Language(XBRL): (1) Consolidated Balance Sheets (2) Consolidated Statements of Income (3) Consolidated Statement of Changes in Stockholders’ Equity (4) Consolidated Statements of Comprehensive Income (5) Consolidated Statements of Cash Flows (6) Notes to Consolidated Financial Statements |
* Indicates matters related to executive compensation or other management contracts.