STRYKER CORP
10-Ks and 10-Qs
|
|
|
|
|
|
|
|
|
|
|
|
|
|
|
|
|
|
|
|
|
|
|
|
|
|
|
|
|
|
|
|
|
|
|
|
|
|
|
|
|
|
|
|
|
|
|
|
|
|
|
|
|
|
|
|
UNITED STATES SECURITIES AND EXCHANGE COMMISSION
Washington, D.C. 20549
_______________________________________________________________________
|
FORM 10-K
|
||||
_______________________________________________________________________
|
ý
|
ANNUAL REPORT PURSUANT TO SECTION 13 OR 15(d) OF THE SECURITIES EXCHANGE ACT OF 1934
|
For the fiscal year ended
December 31, 2013
OR
|
¨
|
TRANSITION REPORT PURSUANT TO SECTION 13 OR 15(d) OF THE SECURITIES EXCHANGE ACT OF 1934
|
_______________________________________________________________________

STRYKER CORPORATION
(Exact name of registrant as specified in its charter)
_______________________________________________________________________
|
Michigan
|
|
38-1239739
|
|
(State of incorporation)
|
|
(I.R.S. Employer Identification No.)
|
|
2825 Airview Boulevard, Kalamazoo, Michigan
|
|
49002
|
|
(Address of principal executive offices)
|
|
(Zip Code)
|
Registrant’s telephone number, including area code: (269) 385-2600
_______________________________________________________________________
Securities registered pursuant to Section 12(b) of the Act:
|
Title of each class
|
|
Name of each exchange on which registered
|
|
Common Stock, $.10 par value
|
|
New York Stock Exchange
|
Securities registered pursuant to Section 12(g) of the Act: None
Indicate by check mark if the registrant is a well-known seasoned issuer, as defined in Rule 405 of the Securities Act. YES
ý
NO
o
Indicate by check mark if the registrant is not required to file reports pursuant to Section 13 or 15(d) of the Act. YES
o
NO
ý
Indicate by check mark whether the registrant (1) has filed all reports required to be filed by Section 13 or 15(d) of the Securities and Exchange Act of 1934 during the preceding 12 months (or for such shorter period that the registrant was required to file such reports), and (2) has been subject to such filing requirements for the past 90 days. YES
ý
NO
o
Indicate by check mark whether the registrant has submitted electronically and posted on its corporate Website, if any, every Interactive Data File required to be submitted and posted pursuant to Rule 405 of Regulation S-T (§232.405 of this chapter) during the preceding 12 months (or for such shorter period that the registrant was required to submit and post such files). YES
ý
NO
o
Indicate by check mark if disclosure of delinquent filers pursuant to Item 405 of Regulation S-K (§229.405 of this chapter) is not contained herein, and will not be contained, to the best of registrant’s knowledge, in definitive proxy or information statements incorporated by reference in Part III of this Form 10-K or any amendment to this Form 10-K.
o
Indicate by check mark whether the registrant is a large accelerated filer, an accelerated filer, a non-accelerated filer, or a smaller reporting company. See definitions of large “accelerated filer,” “accelerated filer” and “smaller reporting company” in Rule 12b-2 of the Exchange Act.
|
Large accelerated filer
ý
|
|
Accelerated filer
o
|
|
Non-accelerated filer
o
|
|
Smaller reporting company
o
|
Indicate by check mark whether the registrant is a shell company (as defined in Rule 12b-2 of the Act). YES
o
NO
ý
Based on the closing sales price of
June 30, 2013
, the aggregate market value of the voting stock held by non-affiliates of the registrant was approximately
$22,463,504,679
. The number of shares outstanding of the registrant’s common stock, $.10 par value, was
377,870,936
at
January 31, 2014
.
DOCUMENTS INCORPORATED BY REFERENCE
Portions of the proxy statement to be filed with the U.S. Securities and Exchange Commission relating to the
2014
Annual Meeting of Shareholders (the
2014
proxy statement) are incorporated by reference into Part III.
TABLE OF CONTENTS
|
PART I
|
|||
|
Item 1.
|
Business
|
1
|
|
|
Item 1A.
|
Risk Factors
|
4
|
|
|
Item 1B.
|
Unresolved Staff Comments
|
7
|
|
|
Item 2.
|
Properties
|
7
|
|
|
Item 3.
|
Legal Proceedings
|
7
|
|
|
Item 4.
|
Mine Safety
|
7
|
|
|
PART II
|
|||
|
Item 5.
|
Market for the Registrant’s Common Equity, Related Stockholder Matters and Issuer Purchases of Equity Securities
|
7
|
|
|
Item 6.
|
Selected Financial Data
|
9
|
|
|
Item 7.
|
Management’s Discussion and Analysis of Financial Condition and Results of Operations
|
10
|
|
|
Item 7A.
|
Quantitative and Qualitative Disclosures About Market Risk
|
18
|
|
|
Item 8.
|
Financial Statements and Supplementary Data
|
19
|
|
|
Report of Independent Registered Public Accounting Firm on Consolidated Financial Statements
|
19
|
|
|
|
Consolidated Statements of Earnings
|
20
|
|
|
|
Consolidated Statements of Comprehensive Income
|
20
|
|
|
|
Consolidated Balance Sheets
|
21
|
|
|
|
Consolidated Statements of Shareholders’ Equity
|
22
|
|
|
|
Consolidated Statements of Cash Flows
|
23
|
|
|
|
Notes to Consolidated Financial Statements
|
24
|
|
|
|
Item 9.
|
Changes in and Disagreements With Accountants on Accounting and Financial Disclosure
|
41
|
|
|
Item 9A.
|
Controls and Procedures
|
41
|
|
|
Item 9B.
|
Other Information
|
42
|
|
|
PART III
|
|||
|
Item 10.
|
Directors, Executive Officers and Corporate Governance
|
42
|
|
|
Item 11.
|
Executive Compensation
|
43
|
|
|
Item 12.
|
Security Ownership of Certain Beneficial Owners and Management and Related Stockholder Matters
|
43
|
|
|
Item 13.
|
Certain Relationships and Related Transactions, and Director Independence
|
43
|
|
|
Item 14.
|
Principal Accounting Fees and Services
|
43
|
|
|
PART IV
|
|||
|
Item 15.
|
Exhibits, Financial Statement Schedules
|
44
|
|
|
ITEM 1.
|
BUSINESS.
|
General
Stryker Corporation is one of the world's leading medical technology companies with
2013
revenues of
$9,021
and net earnings of
$1,006
. Stryker's products include implants used in joint replacement and trauma surgeries; surgical equipment and surgical navigation systems; endoscopic and communications systems; patient handling and emergency medical equipment; neurosurgical, neurovascular and spinal devices; as well as other medical device products used in a variety of medical specialties.
Stryker was incorporated in Michigan in 1946 as the successor company to a business founded in 1941 by Dr. Homer H. Stryker, a prominent orthopaedic surgeon and the inventor of several orthopaedic products. In the United States, most of our products are marketed directly to doctors, hospitals and other healthcare facilities. Internationally, our products are sold in over 100 countries through company-owned sales subsidiaries and branches as well as third-party dealers and distributors.
As used herein, and except where the context otherwise requires, "Stryker," "we," "us," and "our" refer to Stryker Corporation and its consolidated subsidiaries.
Business Segments and Geographic Information
We segregate our reporting into three reportable business segments: Reconstructive, MedSurg, and Neurotechnology and Spine. Financial information regarding our reportable business segments and certain geographic information is included under "Results of Operations" in Item 7 of this report and Note 13 to the Consolidated Financial Statements in Item 8 of this report.
The net sales for each reportable segment over the last three years was:
|
2013
|
2012
|
2011
|
|||||||||||||||
|
Reconstructive
|
$
|
4,004
|
|
44
|
%
|
$
|
3,823
|
|
44
|
%
|
$
|
3,710
|
|
45
|
%
|
||
|
MedSurg
|
3,359
|
|
37
|
%
|
3,265
|
|
38
|
%
|
3,160
|
|
38
|
%
|
|||||
|
Neurotechnology and Spine
|
1,658
|
|
19
|
%
|
1,569
|
|
18
|
%
|
1,437
|
|
17
|
%
|
|||||
|
Total
|
$
|
9,021
|
|
100
|
%
|
$
|
8,657
|
|
100
|
%
|
$
|
8,307
|
|
100
|
%
|
||
Reconstructive
Reconstructive products consist primarily of implants used in hip and knee joint replacements and trauma and extremities surgeries. We bring patients and physicians advanced implant designs and specialized instrumentation that make orthopaedic surgery and recovery simpler, faster and more effective. We support surgeons with the technology and services they need as they develop new surgical techniques.
The composition of net sales of Reconstructive products over the last three years was:
|
2013
|
2012
|
2011
|
|||||||||||||||
|
Knees
|
$
|
1,371
|
|
34
|
%
|
$
|
1,356
|
|
35
|
%
|
$
|
1,316
|
|
35
|
%
|
||
|
Hips
|
1,272
|
|
32
|
%
|
1,233
|
|
32
|
%
|
1,228
|
|
33
|
%
|
|||||
|
Trauma and Extremities
|
1,116
|
|
28
|
%
|
989
|
|
26
|
%
|
931
|
|
25
|
%
|
|||||
|
Other
|
245
|
|
6
|
%
|
245
|
|
7
|
%
|
235
|
|
7
|
%
|
|||||
|
Total
|
$
|
4,004
|
|
100
|
%
|
$
|
3,823
|
|
100
|
%
|
$
|
3,710
|
|
100
|
%
|
||
In December 2013 we acquired MAKO Surgical Corp. (MAKO). The acquisition of MAKO, combined with our strong history in joint reconstruction, capital equipment (operating room integration and surgical navigation) and surgical instruments, will help further advance the growth of robotic arm assisted surgery. Our combined expertise offers the potential to simplify joint reconstruction procedures, reduce variability and enhance the surgeon and patient experience.
In March 2013 we acquired Trauson Holdings Company Limited (Trauson). The acquisition of Trauson will enhance our product offerings, primarily within our Reconstructive segment, broaden our presence in China and enable us to expand into the fast growing value segment of the emerging markets.
In 2013 we launched the Tritanium Cementless Baseplate for our Triathlon Knee System (TKA), which combines biologic fixation with Triathlon’s ideal kinematics to provide surgeons with a superior option for cementless TKA. We also launched the Secur-Fit Advanced Femoral Hip Stem aimed at accurately restoring biomechanics by leveraging our new and unique Stryker Orthopaedics Modeling and Analytics system.
In June 2012 we voluntarily recalled our Rejuvenate and ABG II modular-neck hip stems and terminated global distribution of these hip products. We notified healthcare professionals and regulatory bodies of this recall, which was taken due to potential risks associated with fretting and/or corrosion that may lead to adverse local tissue reactions. We continue to work with the medical community to evaluate the data and further understand this matter and the associated costs as more fully described in Note 7 to the Consolidated Financial Statements in Item 8 of this report; this information is incorporated herein by reference.
In 2012 we launched Accolade II, the first hip stem with a Morphometric Wedge design, an evolution of the tapered wedge stem.
In 2011 we acquired Memometal Technologies, which develops, manufactures and markets products for extremity (hand and foot) indications that enhance the offerings in our trauma and extremities product line.
Stryker is one of five leading competitors in the United States for joint replacement and trauma products; the other four are Zimmer Holdings, Inc. (Zimmer), DePuy Synthes Company (DePuy Synthes, a subsidiary of Johnson & Johnson), Biomet, Inc. and
|
1
|
Dollar amounts in millions except per share amounts or as otherwise specified
|
|
Smith & Nephew plc. We are also a leading player in the international markets, with these same companies as our principal competitors.
MedSurg
MedSurg products include surgical equipment and surgical navigation systems (Instruments); endoscopic and communications systems (Endoscopy); patient handling and emergency medical equipment (Medical); and reprocessed and remanufactured medical devices as well as other medical device products used in a variety of medical specialties.
The composition of net sales of MedSurg products over the last three years was:
|
2013
|
2012
|
2011
|
|||||||||||||||
|
Instruments
|
$
|
1,269
|
|
38
|
%
|
$
|
1,261
|
|
39
|
%
|
$
|
1,187
|
|
38
|
%
|
||
|
Endoscopy
|
1,167
|
|
35
|
%
|
1,111
|
|
34
|
%
|
1,080
|
|
34
|
%
|
|||||
|
Medical
|
710
|
|
21
|
%
|
691
|
|
21
|
%
|
722
|
|
23
|
%
|
|||||
|
Other
|
213
|
|
6
|
%
|
202
|
|
6
|
%
|
171
|
|
5
|
%
|
|||||
|
Total
|
$
|
3,359
|
|
100
|
%
|
$
|
3,265
|
|
100
|
%
|
$
|
3,160
|
|
100
|
%
|
||
In December 2013 we announced our intent to acquire Patient Safety Technologies, Inc. (PST). PST's proprietary Safety-Sponge
®
System and SurgiCount 360™ compliance software help prevent Retained Foreign Objects in the operating room. The transaction is subject to customary closing conditions and is expected to close in the first quarter of 2014.
In March 2013 we received a warning letter from the United States Food and Drug Administration (FDA) concerning quality system observations made during an inspection and citing us for failing to notify the FDA of a product recall and for marketing devices, including certain of our Neptune Waste Management Systems, without a required 510(k) clearance. We were notified in January 2014 that the actions taken to address issues raised in the warning letter are sufficient and no further corrective actions related to the warning letter are required.
In December 2013 we received 510(k) clearance to market a modified Neptune 2 Waste Management System. The Neptune 2 Waste Management System mitigates risk to healthcare workers by eliminating harmful exposure to fluids and smoke in the operating room. This constantly closed system collects surgical waste and disposes of it without exposing the operator to contact with infectious fluids and surgical plumes.
In 2012 we launched System 7, the next generation of heavy duty surgical power tools. These tools are used in total joint procedures, such as hip and knee replacements, and offer the latest in advanced cutting technology. We also launched the 1488 HD 3-Chip Endoscopic Camera System, which utilizes advanced CMOS technology and premium optics to provide a clear bright image designed to enhance patient outcomes. In addition, we launched Power-LOAD
TM
, our cot fastener system that lifts and lowers the cot into and out of ambulances, thereby reducing spinal loads and the risk of cumulative trauma injuries to emergency responders.
Stryker is one of four market leaders in Instruments, competing principally with Zimmer, Medtronic, Inc. and Conmed Linvatec, Inc. (a subsidiary of CONMED Corporation) globally; internationally, we also compete with Aesculap-Werke AG (a division of B. Braun Melsungen AG). In Endoscopy, we compete with Smith & Nephew Endoscopy (a division of Smith & Nephew plc), ConMed Linvatec, Inc., Arthrex, Inc., Karl Storz GmbH & Co. and Olympus Optical Co. Ltd. Our primary competitors in Medical are Hill-Rom Holdings, Inc. and Kinetic Concepts, Inc.
Neurotechnology and Spine
Our Neurotechnology and Spine products include both neurosurgical and neurovascular devices. Our neurotechnology offering includes products used for minimally invasive endovascular techniques; a comprehensive line of products for traditional brain and open skull base surgical procedures; orthobiologic and biosurgery products, including synthetic bone grafts and vertebral augmentation products; and minimally invasive products for the treatment of acute ischemic and hemorrhagic stroke. We also develop, manufacture and market spinal implant products including cervical, thoracolumbar and interbody systems used in spinal injury, deformity and degenerative therapies.
The composition of net sales of Neurotechnology and Spine products over the last three years was:
|
2013
|
2012
|
2011
|
|||||||||||||||
|
Neurotechnology
|
$
|
915
|
|
55
|
%
|
$
|
842
|
|
54
|
%
|
$
|
750
|
|
52
|
%
|
||
|
Spine
|
743
|
|
45
|
%
|
727
|
|
46
|
%
|
687
|
|
48
|
%
|
|||||
|
Total
|
$
|
1,658
|
|
100
|
%
|
$
|
1,569
|
|
100
|
%
|
$
|
1,437
|
|
100
|
%
|
||
In 2012 we received 510(k) clearance to market the Trevo
®
Pro Retriever, our next generation clot removal technology that utilizes proprietary Stentriever
®
Technology for optimized clot integration and retrieval in patients experiencing acute ischemic stroke. In addition, we received 510(k) clearance to market our Trevo
®
ProVEU
TM
Retriever, the first clot removal device fully visible during the procedure for precise positioning within the clot and optimized clot retrieval in patients experiencing acute ischemic stroke.
In 2012 we acquired Surpass Medical, Ltd. (Surpass). Surpass is developing and commercializing next-generation flow diversion stent technology to treat brain aneurysms using a unique mesh design and delivery system. The acquisition of Surpass enhances our product offerings in Neurotechnology.
In 2011 we acquired the assets of the Neurovascular division of Boston Scientific Corporation (Neurovascular), as well as Concentric Medical, Inc., a manufacturer of minimally invasive products for the treatment of acute ischemic stroke. These acquisitions significantly expanded our product offerings in Neurotechnology. In addition, we acquired Orthovita, Inc. (Orthovita), a developer of orthobiologic and biosurgery products, including synthetic bone grafts and vertebral augmentation
|
2
|
Dollar amounts in millions except per share amounts or as otherwise specified
|
|
products. The acquisition of Orthovita complements our existing product offerings, primarily in Spine.
Our primary competitors in Neurotechnology are Micrus Endovascular, LLC and DePuy Synthes (subsidiaries of Johnson & Johnson), Covidien and Medtronic. We are one of five market leaders in Spine, along with Medtronic Sofamor Danek, Inc. (a subsidiary of Medtronic, Inc.), DePuy Synthes, Nuvasive, Inc. and Globus Medical.
Geographic Areas
In
2013
approximately
66.3%
of our revenues were generated from customers in the United States. Internationally our products are sold in over 100 countries through local dealers and direct sales efforts. Additional geographic information is included under "Results of Operations" in Item 7 of this report and Note 13 to the Consolidated Financial Statements in Item 8 of this report.
Raw Materials and Inventory
Raw materials essential to our business are generally readily available from multiple sources. Substantially all products we manufacture are stocked in inventory, while certain MedSurg products are assembled to order. The dollar amount of backlog orders at any given time is not considered material to an understanding of our business taken as a whole.
Patents and Trademarks
Patents and trademarks are significant to our business to the extent that a product or an attribute of a product represents a unique design or process. Patent protection of such products restricts competitors from duplicating these unique designs and features. We seek to obtain patent protection on our products whenever appropriate for protecting our competitive advantage. As of
December 31, 2013
we owned approximately 1,783 United States patents and 3,420 international patents.
Seasonality
Our business is generally not seasonal in nature; however, the number of reconstructive implant surgeries is generally lower during the summer months and sales of capital equipment are generally stronger in the fourth quarter.
Competition
In all of our product lines we compete with local and global companies located throughout the world. Competition exists in all product lines without regard to the number and size of the competing companies involved. The development of new and innovative products is important to our success in all areas of our business and competition in research, involving the development and the improvement of new and existing products and processes, is particularly significant. The competitive environment requires substantial investments in continuing research and in maintaining sales forces.
The principal factors that we believe differentiate us in the highly competitive product categories in which we operate and enable us to compete effectively include our commitment to innovation and quality, service and reputation. We believe that our competitive position in the future will depend to a large degree on our ability to develop new products and make improvements to existing products.
Product Development
Most of our products and product improvements have been developed internally at research facilities in the United States, Ireland, Puerto Rico, Germany, Switzerland, India and France. We also invest through acquisitions in technologies developed by third parties that have the potential to expand the markets in which we operate. We maintain close working relationships with physicians and medical personnel in hospitals and universities who assist us in product development efforts. The total costs of worldwide company-sponsored research, development and engineering activities relating to the development of new products, improvement of existing products, technical support of products and compliance with governmental regulations for the protection of customers and patients were
$536
,
$471
and
$462
in
2013
,
2012
and
2011
, respectively. Research, development and engineering expenses as a percentage of sales were
5.9%
,
5.4%
and
5.6%
in
2013
,
2012
and
2011
, respectively. The spending level in 2013 increased due to the timing of projects and continued investment in new technologies. The spending level in 2012 as a percentage of sales decreased primarily due to the termination of all development of the OP-1 molecule in late 2011.
Regulation
Our businesses are subject to varying degrees of governmental regulation in the countries in which we operate, and the general trend is toward increasingly stringent regulation.
In the United States, the Medical Device Amendments of 1976 to the Federal Food, Drug and Cosmetic Act and its subsequent amendments, and the regulations issued or proposed thereunder, provide for regulation by the FDA of the design, manufacture and marketing of medical devices, including most of our products. Many of our new products fall into FDA classifications that require notification of and review by the FDA before we begin marketing them, submitted as a 510(k). Certain of our products require extensive clinical testing, consisting of safety and efficacy studies, followed by pre-market approval (PMA) applications for specific surgical indications.
The FDA's Quality System regulations set forth standards for our product design and manufacturing processes, require the maintenance of certain records and provide for inspections of our facilities by the FDA. There are also certain requirements of state, local and foreign governments that must be complied with in the manufacture and marketing of our products.
The member states of the European Union (EU) have adopted the European Medical Device Directives that form a single set of
|
3
|
Dollar amounts in millions except per share amounts or as otherwise specified
|
|
medical device regulations for all EU member countries. These regulations require companies that wish to manufacture and distribute medical devices in EU member countries to meet certain quality system requirements and obtain CE marking for their products. We have authorization to apply the CE marking to substantially all of our products. In addition, we comply with the unique regulatory requirements of each of the countries in which we market our products.
Initiatives sponsored by government agencies, legislative bodies and the private sector to limit the growth of healthcare expenses generally and hospital costs in particular, including price regulation and competitive pricing, are ongoing in markets where we do business. It is not possible to predict at this time the long-term impact of such cost containment measures on our future business. In addition, business practices in the healthcare industry have come under increased scrutiny, particularly in the United States, by government agencies and state attorneys general, and resulting investigations and prosecutions carry the risk of significant civil and criminal penalties.
Employees
At
December 31, 2013
, we had approximately
25,000
employees worldwide. Certain international employees are covered by collective bargaining agreements. We believe that we maintain positive relationships with our employees worldwide.
Executive Officers of the Registrant
Information regarding our executive officers appears under the caption "Directors, Executive Officers and Corporate Governance" in Item 10 of this Report.
Available Information
Our main corporate website address is
www.stryker.com.
Copies of our Quarterly Reports on Form 10-Q, Annual Reports on Form 10-K and Current Reports on Form 8-K filed or furnished to the United States Securities and Exchange Commission (SEC) will be provided without charge to any shareholder submitting a written request to our Corporate Secretary at our principal executive offices. All of our SEC filings are also available free of charge on our website within the "For Investors - SEC Filings & Ownership Reports" link as soon as reasonably practicable after having been electronically filed or furnished to the SEC. All SEC filings are also available at the SEC's website at
www.sec.gov
.
|
ITEM 1A.
|
RISK FACTORS.
|
This report contains statements referring to us that are not historical facts and are considered "forward-looking statements" within the meaning of the Private Securities Litigation Reform Act of 1995. These statements, which are intended to take advantage of the "safe harbor" provisions of the Reform Act, are based on current projections about operations, industry conditions, financial condition and liquidity. Words that identify forward-looking statements include words such as "may," "could," "will," "should,"
"possible," "plan," "predict," "forecast," "potential," "anticipate," "estimate," "expect," "project," "intend," "believe," "may impact," "on track," and words and terms of similar substance used in connection with any discussion of future operating or financial performance, an acquisition or our businesses. In addition, any statements that refer to expectations, projections or other characterizations of future events or circumstances, including any underlying assumptions, are forward-looking statements. Those statements are not guarantees and are subject to risks, uncertainties and assumptions that are difficult to predict. Therefore, actual results could differ materially and adversely from these forward-looking statements. Some important factors that could cause our actual results to differ from our expectations in any forward-looking statements include the risks discussed below.
Our operations and financial results are subject to various risks and uncertainties that could adversely affect our business, cash flows, financial condition and results of operations. Additional risks and uncertainties not currently known to us or that we currently deem to be immaterial may also materially and adversely affect our business, cash flows, financial condition or results of operations.
LEGAL AND REGULATORY RISKS
The impact of United States healthcare reform legislation on our business remains uncertain.
In 2010 federal legislation to reform the United States healthcare system was enacted into law. The legislation is far-reaching and is intended to expand access to health insurance coverage, improve the quality and reduce the costs of healthcare over time. Its provisions become effective at various dates and there are many programs and requirements for which the details have not been determined. We expect the law will have a significant impact upon various aspects of our business operations. Among other things, the law imposes a 2.3 percent excise tax on Class I, II and III medical devices that applies to United States sales of a majority of our medical device products. Other provisions of this legislation, including Medicare provisions aimed at improving quality and decreasing costs, comparative effectiveness research, an independent payment advisory board, and pilot programs to evaluate alternative payment methodologies, could meaningfully change the way healthcare is developed and delivered. Further, we cannot predict what other healthcare programs and regulations will be ultimately implemented at the federal or state level or the effect of any future legislation or regulation in the United States. However, any change that lowers reimbursements for our products or reduces medical procedure volumes could adversely affect our business and results of operations.
Cost containment measures in the United States and other countries resulting in pricing pressures could have a negative impact on our future operating results.
Initiatives sponsored by government agencies, legislative bodies and the private sector to limit the growth of healthcare costs, including price regulation and competitive pricing, are ongoing in markets where we do business. Pricing pressure has also increased in our markets due to continued consolidation among healthcare providers, trends toward managed care, the shift towards governments becoming the primary payers of healthcare expenses, and government laws and regulations
|
4
|
Dollar amounts in millions except per share amounts or as otherwise specified
|
|
relating to sales and promotion, reimbursement and pricing generally. Reductions in reimbursement levels or coverage or other cost containment measures could unfavorably affect our future operating results.
We may be adversely affected by product liability claims, unfavorable court decisions or legal settlements.
Our business exposes us to potential product liability risks that are inherent in the design, manufacture and marketing of medical devices, many of which are intended to be implanted in the human body for long periods of time or indefinitely. We are currently defendants in a number of product liability matters, including those relating to the voluntary recall in 2012 of our Rejuvenate and ABGII modular neck hip stems discussed in "Other Information-Legal and Regulatory Matters" in Item 7 of this report and Note 7 to the Consolidated Financial Statements in Item 8 of this report. These matters are subject to many uncertainties and outcomes are not predictable. In addition, we may incur significant legal expenses regardless of whether we are found to be liable.
The Company is currently self-insured for product liability-related claims and expenses. The ultimate cost to us with respect to pro
duct liability claims could be materially different than the amount of the current estimates and accruals and could have a material adverse effect on our financial position, results of operations and cash flows.
Intellectual property litigation and infringement claims could cause us to incur significant expenses or prevent us from selling certain of our products.
The medical device industry is characterized by extensive intellectual property litigation and, from time to time, we are the subject of claims by third parties of potential infringement or misappropriation. Regardless of outcome, such claims are expensive to defend and divert the time and effort of management and operating personnel from other business issues. A successful claim or claims of patent or other intellectual property infringement against us could result in our payment of significant monetary damages and/or royalty payments or negatively impact our ability to sell current or future products in the affected category.
Dependence on patent and other proprietary rights and failing to protect such rights or to be successful in litigation related to such rights may impact offerings in our product portfolios.
Our long-term success largely depends on our ability to market technologically competitive products. If we fail to obtain or maintain adequate intellectual property protection, such a failure could allow others to sell products that compete with offerings in our product portfolio. Also, our issued patents are subject to claims concerning priority, scope and other issues, and currently pending or future patent applications may not result in issued patents.
We are subject to extensive governmental regulations relating to the manufacturing, labeling and marketing of our products.
Substantially all of our products are subject to regulation by the FDA and other governmental authorities in the United States and internationally. The process of obtaining regulatory approvals to market a medical device can be costly and time consuming and approvals might not be granted for future products on a timely basis, if at all. We have ongoing responsibilities under FDA regulations with respect to our products and facilities and are
subject to periodic inspections by the FDA to determine compliance with the quality system and medical device reporting regulations and other requirements. If we fail to fully comply with applicable regulatory requirements, we may be subject to a range of sanctions, including warning letters, product recalls, the suspension of product manufacturing, monetary fines and criminal prosecution.
We are subject to federal, state and foreign healthcare regulations, including fraud and abuse laws, as well as anti-bribery laws, and could face substantial penalties if we fail to fully comply with such regulations and laws.
Our relationship with healthcare professionals, such as physicians, hospitals and those that may market our products, are subject to scrutiny under various state and federal laws often referred to collectively as healthcare fraud and abuse laws. In addition, the United States and foreign government regulators have increased the enforcement of the Foreign Corrupt Practices Act and other anti-bribery laws. These laws are broad in scope and are subject to evolving interpretation, which could require us to incur substantial costs to monitor compliance or to alter our practices if we are found not to be in compliance. We also must comply with a variety of other laws which protect the privacy of individually identifiable healthcare information and impose extensive tracking and reporting related to all transfers of value provided to certain healthcare professionals. Violations of these laws may be punishable by criminal or civil sanctions, including substantial fines, imprisonment and exclusion from participation in governmental healthcare programs.
MARKET RISKS
Macroeconomic developments, such as the recent recessions in Europe and the debt crises in certain countries in the European Union, could negatively affect our ability to conduct business in those geographies.
The continuing debt crises in certain European Union countries could cause the value of the euro to deteriorate, reducing the purchasing power of our European Union customers. Financial difficulties experienced by our suppliers and customers, including distributors, could result in product delays and inventory issues; risks to accounts receivable could also include delays in collection and greater bad debt expense.
Exposure to exchange rate fluctuations on cross border transactions and translation of local currency results into United States dollars.
Cross border transactions, both with external parties and intercompany relationships, result in increased exposure to foreign exchange effects. In addition, our sales are translated into United States dollars for reporting purposes. The strengthening or weakening of the United States dollar results in favorable or unfavorable translation effects as the results of our foreign locations are translated into United States dollars.
BUSINESS AND OPERATIONAL RISKS
We may be unable to effectively develop and market products against the products of our competitors in a highly competitive industry.
Our present or future products could be rendered obsolete or uneconomical by technological advances by our competitors. Competitive factors include price, customer service,
|
5
|
Dollar amounts in millions except per share amounts or as otherwise specified
|
|
technology, innovation, quality, reputation and reliability. Our competition may respond more quickly to new or emerging technologies, undertake more extensive marketing campaigns, have greater financial, marketing and other resources than us or be more successful in attracting potential customers, employees and strategic partners. Given these factors, we cannot guarantee that we will be able to continue our level of success in the industry.
Competition in research, involving the development and improvement of new and existing products, is particularly significant and results from time to time in product obsolescence.
The markets in which we operate are highly competitive, and new products and surgical procedures are introduced on an ongoing basis. Such marketplace changes may cause some of our products to become obsolete. If actual product life cycles, product demand or acceptance of new product introductions are less favorable than projected by management, a higher level of inventory write downs may result.
We may be unable to maintain adequate working relationships with healthcare professionals.
We seek to maintain close working relationships with respected physicians and medical personnel in hospitals and universities who assist in product research and development. We rely on these professionals to assist us in the development of proprietary products and product improvements to complement and expand our existing product lines. If we are unable to maintain these relationships, our ability to develop, market and sell new and improved products could decrease.
We are subject to additional risks associated with our extensive international operations.
We develop, manufacture and distribute our products throughout the world. Our international operations are subject to a number of additional risks and potential costs, including changes in foreign medical reimbursement policies and programs, unexpected changes in foreign regulatory requirements, differing local product preferences and product requirements, diminished protection of intellectual property in some countries, trade protection measures and import or export licensing requirements, difficulty in staffing and managing foreign operations, political and economic instability. Our results of operations and/or financial condition could be adversely impacted if we are unable to successfully manage these and other risks of international operations in an increasingly volatile environment.
We may be unable to capitalize on previous or future acquisitions.
In addition to internally developed products, we rely upon investment in new technologies through acquisitions. Investments in medical technology are inherently risky, and we cannot guarantee that any acquisition will be successful or will not have a material unfavorable impact on us. These risks include the activities required by us to integrate new businesses, which may result in the need to allocate more resources to integration and product development activities than originally anticipated, diversion of management's time, which could adversely affect management's ability to focus on other projects, the inability to realize the expected benefits, savings or synergies from the acquisition, the loss of key personnel of the acquired company, and exposure to unexpected liabilities of the acquired company. In
addition, we cannot be certain that the businesses we acquire will become profitable or remain so, which may result in unexpected impairment charges.
We may record future goodwill impairment charges related to one or more of our business units, which could materially adversely impact our results of operations.
We perform our annual impairment test for goodwill in the fourth quarter of each year, or more frequently if indicators are present or changes in circumstances suggest that impairment may exist. In evaluating the potential for impairment we make assumptions regarding revenue projections, growth rates, cash flows, tax rates, and discount rates. These assumptions are uncertain and by nature may vary from actual results. A significant reduction in the estimated fair values could result in impairment charges that could materially affect our results of operations.
Our results of operations could be negatively impacted by future changes in the allocation of income to each of the income tax jurisdictions in which we operate.
We operate in multiple income tax jurisdictions both in the United States and internationally. Accordingly, our management must determine the appropriate allocation of income to each jurisdiction based on current interpretations of complex income tax regulations. Income tax authorities regularly perform audits of our income tax filings. Income tax audits associated with the allocation of income and other complex issues, including inventory transfer pricing and cost sharing, product royalty and foreign branch arrangements, may require an extended period of time to resolve and may result in significant income tax adjustments. If changes to the income allocation are required between jurisdictions with different income tax rates, the related adjustments could have a material unfavorable impact on our results of operations.
Failure of a key information technology system, process or site could have a material adverse impact on our business.
We rely extensively on information technology systems to conduct business. These systems include, but are not limited to, ordering and managing materials from suppliers, converting materials to finished products, shipping products to customers, processing transactions, summarizing and reporting results of operations, complying with regulatory, legal or tax requirements, providing data security and other processes necessary to manage our business. If our systems are damaged or cease to function properly due to any number of causes, ranging from catastrophic events to power outages to security breaches, and our business continuity plans do not effectively compensate on a timely basis, we may suffer interruptions in our operations.
We may be unable to attract and retain key employees.
Our sales, technical and other key personnel play an integral role in the development, marketing and selling of new and existing products. If we are unable to recruit, hire, develop and retain a talented, competitive work force, we may not be able to meet our strategic business objectives.
|
ITEM 1B.
|
UNRESOLVED STAFF COMMENTS.
|
None.
|
6
|
Dollar amounts in millions except per share amounts or as otherwise specified
|
|
|
ITEM 2.
|
PROPERTIES.
|
The following are our principal manufacturing locations as of
December 31, 2013
:
|
Location
|
Segment
|
Square
Feet
|
Owned/
Leased
|
||||
|
Portage, Michigan
|
M
|
1,034,000
|
|
Owned
|
|||
|
Changzhou, China
|
R, NS
|
736,000
|
|
Owned
|
|||
|
Mahwah, New Jersey
|
R
|
531,000
|
|
Owned
|
|||
|
Arroyo, Puerto Rico
|
M
|
220,000
|
|
Leased
|
|||
|
Kiel, Germany
|
R
|
173,000
|
|
Owned
|
|||
|
Suzhou, China
|
R, NS
|
158,000
|
|
Owned
|
|||
|
San Jose, California
|
M
|
185,000
|
|
Leased
|
|||
|
Selzach, Switzerland
|
R
|
137,000
|
|
Owned
|
|||
|
Lakeland, Florida
|
M
|
125,000
|
|
Leased
|
|||
|
Freiburg, Germany
|
R
|
123,000
|
|
Owned
|
|||
|
Limerick, Ireland
|
R
|
121,000
|
|
Owned
|
|||
|
Flower Mound, Texas
|
M
|
114,000
|
|
Leased
|
|||
|
Carrigtwohill, Ireland
|
R, NS
|
110,000
|
|
Leased
|
|||
|
Phoenix, Arizona
|
M
|
100,000
|
|
Leased
|
|||
|
Cestas, France
|
NS
|
91,000
|
|
Owned
|
|||
|
Neuchâtel, Switzerland
|
NS
|
88,000
|
|
Owned
|
|||
|
Ft. Lauderdale, Florida
|
R
|
83,000
|
|
Leased
|
|||
|
Carrigtwohill, Ireland
|
R
|
72,000
|
|
Owned
|
|||
|
Malvern, Pennsylvania
|
R
|
65,000
|
|
Leased
|
|||
|
Mountain View, California
|
NS
|
62,000
|
|
Leased
|
|||
|
Fremont, California
|
NS
|
52,000
|
|
Leased
|
|||
|
Guayama, Puerto Rico
|
M
|
46,000
|
|
Leased
|
|||
|
Cestas, France
|
NS
|
35,000
|
|
Leased
|
|||
|
Freiburg, Germany
|
R, M
|
34,000
|
|
Leased
|
|||
|
Stetten, Germany
|
R
|
33,000
|
|
Owned
|
|||
|
Rennes, France
|
R
|
31,000
|
|
Leased
|
|||
|
West Valley, Utah
|
NS
|
29,000
|
|
Leased
|
|||
|
R = Reconstructive M = MedSurg NS = Neurotechnology and Spine
|
|||||||
Our corporate headquarters are located in Kalamazoo, Michigan, in a 75,000 square foot owned facility. In addition, we maintain administrative and sales offices and warehousing and distribution facilities in multiple countries. We believe that our properties are suitable and adequate for the manufacture and distribution of our products.
|
ITEM 3.
|
LEGAL PROCEEDINGS.
|
We are involved in various proceedings, legal actions and claims arising in the normal course of business, including proceedings related to product, labor and intellectual property, and other matters that are more fully described in Note 7 to the Consolidated Financial Statements in Item 8 of this report; this information is incorporated herein by reference.
|
ITEM 4.
|
MINE SAFETY.
|
Not applicable.
|
ITEM 5.
|
MARKET FOR THE REGISTRANT’S COMMON EQUITY, RELATED STOCKHOLDER MATTERS AND ISSUER PURCHASES OF EQUITY SECURITIES.
|
Our common stock is traded on the New York Stock Exchange under the symbol SYK. Quarterly stock price and dividend information for the years ended
December 31, 2013
and
2012
were as follows:
|
2013 Quarter Ended
|
Mar. 31
|
June 30
|
Sept. 30
|
Dec. 31
|
||||||||||||
|
Dividends declared per share of common stock
|
$
|
0.265
|
|
$
|
0.265
|
|
$
|
0.265
|
|
$
|
0.305
|
|
||||
|
Market price of common stock:
|
||||||||||||||||
|
High
|
66.92
|
|
70.00
|
|
71.94
|
|
75.55
|
|
||||||||
|
Low
|
55.24
|
|
63.35
|
|
63.71
|
|
66.93
|
|
||||||||
|
2012 Quarter Ended
|
Mar. 31
|
June 30
|
Sept. 30
|
Dec. 31
|
||||||||||||
|
Dividends declared per share of common stock
|
$
|
0.2125
|
|
$
|
0.2125
|
|
$
|
0.2125
|
|
$
|
0.265
|
|
||||
|
Market price of common stock:
|
||||||||||||||||
|
High
|
55.90
|
|
57.14
|
|
56.79
|
|
56.75
|
|
||||||||
|
Low
|
50.41
|
|
49.43
|
|
50.05
|
|
51.60
|
|
||||||||
Our Board of Directors considers payment of cash dividends at each of its quarterly meetings. On
January 31, 2014
, there were
3,556
shareholders of record of our common stock.
In December of
2012
,
2011
and 2010, we announced that our Board of Directors had authorized us to purchase up to
$405
,
$500
and
$500
, respectively, of our common stock (the 2012, 2011 and 2010 Repurchase Programs, respectively). The manner, timing and amount of purchases is determined by management based on an evaluation of market conditions, stock price and other factors and is subject to regulatory considerations. Purchases are to be made from time to time in the open market, in privately negotiated transactions or otherwise.
During the year ended
December 31, 2013
we repurchased
1.4 million
shares at a cost of $95 under the 2010 Repurchase Program and
3.4 million
shares at a cost of $222 under the 2011 Repurchase Program. As of
December 31, 2013
, the 2010 Repurchase Program was complete and the maximum dollar value of shares that may yet be purchased under the 2011 Repurchase Program was $278. We had made no repurchases pursuant to the 2012 Repurchase Program at
December 31, 2013
.
Shares repurchased under the share repurchase programs are available for general corporate purposes, including offsetting dilution associated with stock option and other equity-based employee benefit plans. At
December 31, 2013
, the maximum
dollar value of shares that may be purchased under the authorized Repurchase Programs was $683.
The activity pursuant to the 2011 Repurchase Program for the three months ended
December 31, 2013
is summarized as follows:
|
7
|
Dollar amounts in millions except per share amounts or as otherwise specified
|
|
|
Period
|
Total
Number
of Shares
Purchased
|
Average Price
Paid
Per Share
|
Total
Number of
Shares
Purchased as
Part of Publicly
Announced Plan
|
Maximum Dollar Value of Shares that may yet be Purchased Under the Plan
|
||||||
|
10/1/2013-10/31/2013
|
—
|
|
$
|
—
|
|
—
|
|
$
|
343
|
|
|
11/1/2013-11/30/2013
|
—
|
|
—
|
|
—
|
|
343
|
|
||
|
12/1/2013-12/31/2013
|
0.91
|
|
71.70
|
|
0.91
|
|
278
|
|
||
|
Total
|
0.91
|
|
$
|
71.70
|
|
0.91
|
|
|||
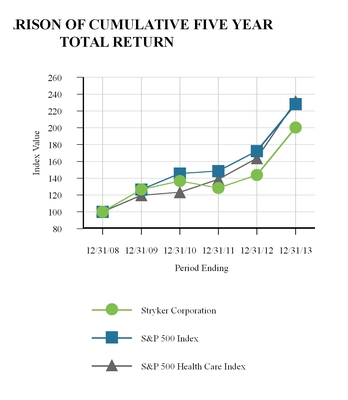
The following graph compares our total returns (including reinvestments of dividends) against the Standard & Poor’s (S&P) 500 Index and the S&P 500 Health Care Index. The graph assumes $100 (not in millions) invested on December 31, 2008 in our Common Stock and each of the indices.
|
Company / Index
|
2008
|
2009
|
2010
|
2011
|
2012
|
2013
|
|
Stryker Corporation
|
100.00
|
126.71
|
136.71
|
128.35
|
143.87
|
200.40
|
|
S&P 500 Index
|
100.00
|
126.46
|
145.51
|
148.59
|
172.37
|
228.19
|
|
S&P 500 Health Care Index
|
100.00
|
119.70
|
123.17
|
138.85
|
163.69
|
231.55
|
|
8
|
Dollar amounts in millions except per share amounts or as otherwise specified
|
|
|
ITEM 6.
|
SELECTED FINANCIAL DATA.
|
Selected financial data for each of the five years in the period ended
December 31, 2013
is as follows:
|
CONSOLIDATED OPERATIONS
|
2013
|
2012
|
2011
|
2010
|
2009
|
|||||||||||||||
|
Net sales
|
$
|
9,021
|
|
$
|
8,657
|
|
$
|
8,307
|
|
$
|
7,320
|
|
$
|
6,723
|
|
|||||
|
Cost of sales
|
2,977
|
|
2,781
|
|
2,811
|
|
2,286
|
|
2,184
|
|
||||||||||
|
Gross profit
|
6,044
|
|
5,876
|
|
5,496
|
|
5,034
|
|
4,539
|
|
||||||||||
|
Research, development and engineering expenses
|
536
|
|
471
|
|
462
|
|
394
|
|
336
|
|
||||||||||
|
Selling, general and administrative expenses
|
4,066
|
|
3,466
|
|
3,150
|
|
2,707
|
|
2,506
|
|
||||||||||
|
Intangibles amortization
|
138
|
|
123
|
|
122
|
|
58
|
|
36
|
|
||||||||||
|
Other (a)
|
48
|
|
75
|
|
76
|
|
124
|
|
67
|
|
||||||||||
|
4,788
|
|
4,135
|
|
3,810
|
|
3,283
|
|
2,945
|
|
|||||||||||
|
Operating income
|
1,256
|
|
1,741
|
|
1,686
|
|
1,751
|
|
1,594
|
|
||||||||||
|
Other income (expense)
|
(44
|
)
|
(36
|
)
|
—
|
|
(22
|
)
|
30
|
|
||||||||||
|
Earnings before income taxes
|
1,212
|
|
1,705
|
|
1,686
|
|
1,729
|
|
1,624
|
|
||||||||||
|
Income taxes
|
206
|
|
407
|
|
341
|
|
456
|
|
517
|
|
||||||||||
|
Net earnings
|
$
|
1,006
|
|
$
|
1,298
|
|
$
|
1,345
|
|
$
|
1,273
|
|
$
|
1,107
|
|
|||||
|
PER SHARE DATA
|
||||||||||||||||||||
|
Net earnings per share of common stock:
|
||||||||||||||||||||
|
Basic
|
$
|
2.66
|
|
$
|
3.41
|
|
$
|
3.48
|
|
$
|
3.21
|
|
$
|
2.79
|
|
|||||
|
Diluted
|
$
|
2.63
|
|
$
|
3.39
|
|
$
|
3.45
|
|
$
|
3.19
|
|
$
|
2.77
|
|
|||||
|
Dividends per share of common stock:
|
||||||||||||||||||||
|
Declared
|
$
|
1.10
|
|
$
|
0.9025
|
|
$
|
0.7525
|
|
$
|
0.63
|
|
$
|
0.25
|
|
|||||
|
Paid
|
$
|
1.06
|
|
$
|
0.85
|
|
$
|
0.72
|
|
$
|
0.60
|
|
$
|
0.50
|
|
|||||
|
Average number of shares outstanding—in millions:
|
||||||||||||||||||||
|
Basic
|
378.6
|
|
380.6
|
|
386.5
|
|
396.4
|
|
397.4
|
|
||||||||||
|
Diluted
|
382.1
|
|
383.0
|
|
389.5
|
|
399.5
|
|
399.4
|
|
||||||||||
|
CONSOLIDATED FINANCIAL POSITION
|
||||||||||||||||||||
|
Cash, cash equivalents and current marketable securities
|
$
|
3,980
|
|
$
|
4,285
|
|
$
|
3,418
|
|
$
|
4,380
|
|
$
|
2,955
|
|
|||||
|
Accounts receivable—net
|
1,518
|
|
1,430
|
|
1,417
|
|
1,252
|
|
1,147
|
|
||||||||||
|
Inventory—net
|
1,422
|
|
1,265
|
|
1,283
|
|
1,057
|
|
943
|
|
||||||||||
|
Property, plant and equipment—net
|
1,081
|
|
948
|
|
888
|
|
798
|
|
948
|
|
||||||||||
|
Capital expenditures
|
195
|
|
210
|
|
226
|
|
182
|
|
131
|
|
||||||||||
|
Depreciation and amortization
|
511
|
|
486
|
|
481
|
|
410
|
|
385
|
|
||||||||||
|
Total assets
|
15,743
|
|
13,206
|
|
12,146
|
|
10,895
|
|
9,071
|
|
||||||||||
|
Accounts payable—net
|
314
|
|
288
|
|
345
|
|
292
|
|
200
|
|
||||||||||
|
Total debt
|
2,764
|
|
1,762
|
|
1,768
|
|
1,021
|
|
18
|
|
||||||||||
|
Shareholders’ equity
|
9,047
|
|
8,597
|
|
7,683
|
|
7,174
|
|
6,595
|
|
||||||||||
|
Net cash provided by operating activities
|
1,886
|
|
1,657
|
|
1,434
|
|
1,547
|
|
1,461
|
|
||||||||||
|
OTHER DATA
|
||||||||||||||||||||
|
Number of shareholders of record
|
3,612
|
|
4,258
|
|
4,508
|
|
4,586
|
|
4,607
|
|
||||||||||
|
Approximate number of employees
|
25,000
|
|
22,000
|
|
21,000
|
|
20,000
|
|
19,000
|
|
||||||||||
(a) Includes restructuring and asset impairment charges.
|
9
|
Dollar amounts in millions except per share amounts or as otherwise specified
|
|
|
ITEM 7.
|
MANAGEMENT’S DISCUSSION AND ANALYSIS OF FINANCIAL CONDITION AND RESULTS OF OPERATIONS.
|
NON-GAAP FINANCIAL MEASURES
We supplement the reporting of our financial information determined under accounting principles generally accepted in the United States (GAAP) with certain non-GAAP financial measures, including percentage sales growth in constant currency; percentage organic sales growth; adjusted gross profit; adjusted selling, general and administrative expenses; adjusted operating income; adjusted other income (expense); adjusted effective income tax rate; adjusted net earnings; and adjusted diluted net earnings per share. We believe that these non-GAAP measures provide meaningful information to assist shareholders in understanding our financial results and assessing our prospects for future performance. Management believes percentage sales growth in constant currency and the other adjusted measures described above are important indicators of our operations because they exclude items that may not be indicative of or are unrelated to our core operating results and provide a baseline for analyzing trends in our underlying businesses. Management uses these non-GAAP financial measures for reviewing the operating results of reportable business segments and analyzing potential future business trends in connection with our budget process and bases certain management incentive compensation on these non-GAAP financial measures. To measure percentage sales growth in constant currency, we remove the impact of changes in foreign currency exchange rates that affect the comparability and trend of sales. Percentage sales growth in constant currency is calculated by translating current year results at prior year average foreign currency exchange rates. To measure percentage organic sales growth, we remove the impact of changes in foreign currency exchange rates and acquisitions that affect the comparability and trend of sales. Percentage organic sales growth is calculated by translating current year results at prior year average foreign currency exchange rates excluding the impact of acquisitions. To measure earnings performance on a consistent and comparable basis, we exclude certain items that affect the comparability of operating results and the trend of earnings. Because non-GAAP financial measures are not standardized, it may not be possible to compare these financial measures with other companies' non-GAAP financial measures having the same or similar names. These adjusted financial measures should not be considered in isolation or as a substitute for reported sales growth, gross profit, selling, general and administrative expenses, operating income, other income/(expense), effective income tax rate, net earnings and diluted net earnings per share, the most directly comparable GAAP financial measures. These non-GAAP financial measures are an additional way of viewing aspects of our operations that, when viewed with our GAAP results and the reconciliations to corresponding GAAP financial measures at the end of the discussion of Results of Operations below, provide a more complete understanding of our business. We strongly encourage investors and shareholders to review our financial statements and publicly-filed reports in their entirety and not to rely on any single financial measure.
ABOUT STRYKER
Stryker is one of the world's leading medical technology companies, with
2013
revenues of
$9,021
and net earnings of
$1,006
. We are dedicated to helping healthcare professionals perform their jobs more efficiently while enhancing patient care. We offer a diverse array of innovative medical technologies, including reconstructive, medical and surgical, and neurotechnology and spine products, to help people lead more active and more satisfying lives.
In the United States, most of our products are marketed directly to doctors, hospitals and other healthcare facilities. In general, we maintain separate dedicated sales forces for each of our principal product lines to provide focus and a high level of expertise to each medical specialty served. Internationally our products are sold in over 100 countries through company-owned sales subsidiaries and branches as well as third-party dealers and distributors. Our business is generally not seasonal in nature; however, the number of reconstructive implant surgeries is generally lower during the summer months and sales of capital equipment are generally higher in the fourth quarter.
Recent Business Developments
In December 2013 we announced our intent to acquire Patient Safety Technologies, Inc. (PST), for an aggregate purchase price of
$120
. PST conducts its business through its wholly owned subsidiary, SurgiCount Medical, Inc. Its proprietary Safety-Sponge® System and SurgiCount 360™ compliance software help prevent Retained Foreign Objects in the operating room. The System includes bar-coded surgical sponges and towels, an integrated bar-code scanner, and compliance tracking software. The transaction is subject to customary closing conditions and is expected to close in the first quarter of 2014.
In December 2013 we acquired MAKO Surgical Corp. (MAKO) for an aggregate purchase price of approximately $1,679. The acquisition of MAKO, combined with our strong history in joint reconstruction, capital equipment (operating room integration and surgical navigation) and surgical instruments, will help further advance the growth of robotic arm assisted surgery. Our combined expertise offers the potential to simplify joint reconstruction procedures, reduce variability and enhance the surgeon and patient experience.
In April 2013 William R. Jellison was named our Vice President and Chief Financial Officer. Mr. Jellison replaced Dean Bergy who was our Interim Chief Financial Officer.
In March 2013 we sold $600 of senior unsecured notes due 2018 (the 2018 Notes) and $400 of senior unsecured notes due 2043 (the 2043 Notes). The 2018 Notes bear interest at 1.3% per year and, unless previously redeemed, will mature in April 1, 2018. The 2043 Notes bear interest at 4.1% per year and, unless previously redeemed, will mature on April 1, 2043. We intend to use the net proceeds from the offering for working capital and other general
|
10
|
Dollar amounts in millions except per share amounts or as otherwise specified
|
|
corporate purposes, including acquisitions, stock repurchases and other business opportunities.
In March 2013 we acquired Trauson Holdings Company Limited for a total consideration of $751. With this acquisition we expanded our presence in a key emerging market with a product portfolio
and pipeline that is targeted at the large and fast growing value segment of the Chinese orthopaedic market.
In
2013
we recorded charges for the Rejuvenate, ABG II and Neptune recalls of $460, net of tax, and other matters that are discussed more fully in Results of Operations below.
RESULTS OF OPERATIONS
|
Consolidated results of operations:
|
Percentage Change
|
||||||||||
|
2013
|
2012
|
2011
|
2013/2012
|
2012/2011
|
|||||||
|
Net Sales
|
$9,021
|
$8,657
|
$8,307
|
4.2
|
|
4.2
|
|
||||
|
Gross Profit
|
6,044
|
5,876
|
5,496
|
2.9
|
|
6.9
|
|
||||
|
Research, development & engineering expenses
|
536
|
471
|
462
|
13.8
|
|
1.9
|
|
||||
|
Selling, general & administrative expenses
|
4,066
|
3,466
|
3,150
|
17.3
|
|
10.0
|
|
||||
|
Intangibles amortization
|
138
|
123
|
122
|
12.2
|
|
0.8
|
|
||||
|
Restructuring charges
|
48
|
|
75
|
|
76
|
|
(36.0
|
)
|
(1.3
|
)
|
|
|
Other income (expense)
|
(44)
|
(36)
|
—
|
|
22.2
|
|
—
|
|
|||
|
Income taxes
|
206
|
407
|
341
|
(49.4
|
)
|
19.4
|
|
||||
|
Net Earnings
|
$1,006
|
$1,298
|
$1,345
|
(22.5
|
)
|
(3.5
|
)
|
||||
|
Diluted Net Earnings per share
|
$2.63
|
$3.39
|
$3.45
|
(22.4
|
)
|
(1.7
|
)
|
||||
|
Geographic and segment net sales:
|
Percentage Change
|
||||||||||||||||||||
|
|
2013/2012
|
2012/2011
|
|||||||||||||||||||
|
|
Year Ended December 31
|
Constant
Currency |
Constant
Currency |
||||||||||||||||||
|
|
2013
|
2012
|
2011
|
Reported
|
Reported
|
||||||||||||||||
|
Geographic sales:
|
|||||||||||||||||||||
|
United States
|
$
|
5,984
|
|
$
|
5,658
|
|
$
|
5,269
|
|
5.8
|
5.8
|
7.4
|
|
7.4
|
|||||||
|
International
|
3,037
|
|
2,999
|
|
3,038
|
|
1.3
|
6.0
|
(1.3
|
)
|
1.9
|
||||||||||
|
Total net sales
|
$
|
9,021
|
|
$
|
8,657
|
|
$
|
8,307
|
|
4.2
|
5.9
|
4.2
|
|
5.4
|
|||||||
|
Segment sales:
|
|||||||||||||||||||||
|
Reconstructive
|
$
|
4,004
|
|
$
|
3,823
|
|
$
|
3,710
|
|
4.8
|
6.9
|
3.1
|
|
4.4
|
|||||||
|
MedSurg
|
3,359
|
|
3,265
|
|
3,160
|
|
2.9
|
3.8
|
3.3
|
|
4.2
|
||||||||||
|
Neurotechnology and Spine
|
1,658
|
|
1,569
|
|
1,437
|
|
5.6
|
7.7
|
9.2
|
|
10.5
|
||||||||||
|
Total net sales
|
$
|
9,021
|
|
$
|
8,657
|
|
$
|
8,307
|
|
4.2
|
5.9
|
4.2
|
|
5.4
|
|||||||
Net sales increased
4.2%
in 2013 after increasing 4.2% in 2012. In 2013 net sales grew by 6.5% as a result of increased unit volume and changes in product mix and 0.8% due to acquisitions and were negatively impacted by 1.4% due to changes in price and 1.6% due to the unfavorable impact of foreign currency exchange rates on net sales. Excluding the impact of acquisitions, net sales increased 5.1% in constant currency. Net sales in 2012 increased 5.6% as a result of unit volume and changes in product mix and 1.2% due to acquisitions and were negatively impacted by 1.4% due to changes in price and 1.2% due to the unfavorable impact of foreign currency exchange rates on net sales. Excluding the impact of acquisitions, 2012 net sales increased 4.2% in constant currency.
Net sales in 2013 increased primarily due to higher shipments of trauma and extremities products, neurotechnology products, hips and endoscopy products. Net sales in 2012 increased primarily due to higher shipments of neurotechnology products, instruments products, trauma and extremities products, spine products and reprocessed and remanufactured medical devices; these gains were partially offset by slowness in the European markets. In the United States net sales increased 5.8% in 2013 after increasing 7.4% in 2012. In constant currency, International sales increased 6.0% in 2013 after increasing 1.9% in 2012.
Supplemental geographical sales growth information
|
Year Ended December 31, 2013
|
Year Ended December 31, 2012
|
||||||||||||||||||||||||||||
|
Percentage Change
|
Percentage Change
|
||||||||||||||||||||||||||||
|
U.S.
|
International
|
U.S.
|
International
|
||||||||||||||||||||||||||
|
2013
|
2012
|
As Reported
|
Constant Currency
|
As Reported
|
As Reported
|
Constant Currency
|
2012
|
|
2011
|
|
As Reported
|
Constant Currency
|
As Reported
|
As Reported
|
Constant Currency
|
||||||||||||||
|
Reconstructive
|
|||||||||||||||||||||||||||||
|
Knees
|
1,371
|
|
1,356
|
|
1.1
|
%
|
2.6
|
%
|
3.4
|
%
|
(3.3
|
)%
|
1.1
|
%
|
1,356
|
|
1,316
|
|
3.0
|
%
|
4.0
|
%
|
6.0
|
%
|
(2.4
|
)%
|
0.4
|
%
|
|
|
Hips
|
1,272
|
|
1,233
|
|
3.2
|
%
|
6.0
|
%
|
7.2
|
%
|
(1.4
|
)%
|
4.5
|
%
|
1,233
|
|
1,228
|
|
0.4
|
%
|
1.5
|
%
|
5.2
|
%
|
(4.5
|
)%
|
(2.3
|
)%
|
|
|
Trauma and Extremities
|
1,116
|
|
989
|
|
12.8
|
%
|
15.1
|
%
|
18.4
|
%
|
7.2
|
%
|
11.8
|
%
|
989
|
|
931
|
|
6.2
|
%
|
8.4
|
%
|
18.0
|
%
|
(3.5
|
)%
|
0.4
|
%
|
|
|
TOTAL RECONSTRUCTIVE
|
4,004
|
|
3,823
|
|
4.8
|
%
|
6.9
|
%
|
7.9
|
%
|
0.5
|
%
|
5.5
|
%
|
3,823
|
|
3,710
|
|
3.1
|
%
|
4.4
|
%
|
9.2
|
%
|
(4.3
|
)%
|
(1.4
|
)%
|
|
|
MedSurg
|
|||||||||||||||||||||||||||||
|
Instruments
|
1,269
|
|
1,261
|
|
0.6
|
%
|
1.9
|
%
|
0.7
|
%
|
0.6
|
%
|
5.1
|
%
|
1,261
|
|
1,187
|
|
6.2
|
%
|
7.3
|
%
|
9.1
|
%
|
(0.4
|
)%
|
3.1
|
%
|
|
|
Endoscopy
|
1,167
|
|
1,111
|
|
5.0
|
%
|
6.0
|
%
|
6.6
|
%
|
1.3
|
%
|
4.6
|
%
|
1,111
|
|
1,080
|
|
2.9
|
%
|
3.9
|
%
|
2.6
|
%
|
3.7
|
%
|
7.1
|
%
|
|
|
Medical
|
710
|
|
691
|
|
2.8
|
%
|
3.1
|
%
|
3.4
|
%
|
0.3
|
%
|
2.0
|
%
|
691
|
|
722
|
|
(4.3
|
)%
|
(3.7
|
)%
|
(7.8
|
)%
|
11.1
|
%
|
14.8
|
%
|
|
|
TOTAL MEDSURG
|
3,359
|
|
3,265
|
|
2.9
|
%
|
3.8
|
%
|
3.6
|
%
|
0.8
|
%
|
4.3
|
%
|
3,265
|
|
3,160
|
|
3.3
|
%
|
4.2
|
%
|
3.4
|
%
|
3.0
|
%
|
6.5
|
%
|
|
|
Neurotechnology and Spine
|
|||||||||||||||||||||||||||||
|
Neurotechnology
|
915
|
|
842
|
|
8.7
|
%
|
11.4
|
%
|
11.2
|
%
|
5.1
|
%
|
11.8
|
%
|
842
|
|
750
|
|
12.3
|
%
|
13.9
|
%
|
19.0
|
%
|
3.9
|
%
|
7.6
|
%
|
|
|
Spine
|
743
|
|
727
|
|
2.1
|
%
|
3.4
|
%
|
1.8
|
%
|
2.9
|
%
|
7.2
|
%
|
727
|
|
687
|
|
5.8
|
%
|
6.9
|
%
|
9.2
|
%
|
(1.7
|
)%
|
1.7
|
%
|
|
|
TOTAL NEUROTECHNOLOGY AND SPINE
|
1,658
|
|
1,569
|
|
5.6
|
%
|
7.7
|
%
|
6.4
|
%
|
4.3
|
%
|
10.0
|
%
|
1,569
|
|
1,437
|
|
9.2
|
%
|
10.5
|
%
|
13.8
|
%
|
1.7
|
%
|
5.3
|
%
|
|
|
11
|
Dollar amounts in millions except per share amounts or as otherwise specified
|
|
Reconstructive Net Sales
Reconstructive net sales in
2013
increased 4.8%, primarily due to a 7.9% increase in unit volume and changes in product mix and 1.4% due to acquisitions. Net sales were negatively impacted by 2.4% due to changes in price and 2.1% due to the unfavorable impact of foreign currency exchange rates on net sales. Excluding the impact of acquisitions, net sales increased by 5.5% in constant currency in
2013
, primarily due to increases in trauma and extremities products and hips. Net sales in
2012
increased 3.1%, primarily due to a 5.6% increase in unit volume and changes in product mix and 0.9% due to acquisitions. Net sales were negatively impacted by 2.2% due to changes in price and 1.3% due to the unfavorable impact of foreign currency exchange rates on net sales. In constant currency, net sales increased by 4.4% in
2012
, primarily due to increases in trauma and extremities products and market share gains partially due to a competitor's product recall, partially offset by slowness in the European markets.
MedSurg Net Sales
MedSurg net sales in
2013
increased 2.9%, primarily due to a 3.8% increase in unit volume and changes in product mix and were negatively impacted by 0.9% due to the unfavorable impact of foreign currency exchange rates on net sales. The effect of pricing was not significant. In constant currency, net sales in
2013
increased 3.8%, led by higher shipments of endoscopy products. Net sales in
2012
increased 3.3%, primarily due to a 4.1% increase in unit volume and changes in product mix and 0.1% due to acquisitions, and were negatively impacted by 0.1% due to changes in price and 0.9% due to the unfavorable impact of foreign currency exchange rates on net sales. In constant currency, net sales in
2012
increased 4.2%, led by higher shipments of instruments products and reprocessed and remanufactured medical devices; these higher shipments were partially offset by challenging global market conditions for capital equipment.
Neurotechnology and Spine Net Sales
Neurotechnology and Spine net sales in
2013
increased 5.6%, primarily due to an 8.8% increase in unit volume and changes in product mix and 0.9% due to acquisitions, and were negatively impacted by 2.0% due to changes in price and 2.1% due to the unfavorable impact of foreign currency exchange rates on net sales. Excluding the impact of acquisitions, net sales in 2013 increased 6.8% in constant currency, due to higher shipments of neurotechnology products. Net sales in
2012
increased 9.2%, primarily due to an 8.5% increase in unit volume and changes in product mix and 4.2% due to acquisitions, and were negatively impacted by 2.2% due to changes in price and 1.3% due to the unfavorable impact of foreign currency exchange rates on net sales. In constant currency net sales in
2012
increased 10.5%.
Consolidated Cost of Sales
Cost of sales increased 7.0% in
2013
to 33.0% of sales compared to 32.1% in 2012. The Medical Device Excise Tax was 0.9% of sales in the current year. Cost of sales as a percentage of sales was adversely impacted by changes in selling prices for our products and by the unfavorable effect of foreign currency exchange rates; these effects were offset by improvements in manufacturing productivity. Cost of sales in
2013
and
2012
includes an additional cost of $28 and $18, respectively, related to inventory that was
"stepped up" to fair value following acquisitions; $11 and $5, respectively in restructuring and restructuring related costs; and $7 in 2013 for disgorgement of profits associated with a legal settlement. Cost of sales decreased 1.1% in
2012
to 32.1% of sales compared to 33.8% in
2011
. Cost of sales in
2012
and
2011
includes an additional cost of $18 and $143, respectively, related to inventory that was "stepped up" to fair value following acquisitions and $5 in 2012 in restructuring and related costs.
Research, Development and Engineering Expenses
Research, development and engineering expenses represented 5.9% of sales in 2013 compared to 5.4% in
2012
and 5.6% in
2011
. The increased spending level in
2013
was driven by the timing of projects and continued investment in new technologies. The spending level in
2012
decreased as a percentage of sales primarily due to the termination of all development of the OP-1 molecule in late
2011
.
Selling, General and Administrative Expenses
Selling, general and administrative expenses increased 17.3% in
2013
and represented 45.1% of sales compared to 40.0% in
2012
and 37.9% in
2011
. These expenses included $70 and $37 in
2013
and
2012
, respectively, of acquisition and integration related charges; $622 and $174, respectively, related to the Rejuvenate, ABG II and Neptune recalls; $62 and $33 in
2013
and
2012
, respectively, related to regulatory and legal matters; $25 in 2013 representing a donation to an educational institution and $4 in 2013 in restructuring related charges. Excluding the impact of these charges, selling, general and administrative expenses were 36.4% of sales in
2013
compared to 37.2% in
2012
. In
2011
general and administrative expenses included the payment of an intellectual property infringement claim, offset by a favorable resolution of a value added tax issue.
Restructuring Charges
In
2013
,
2012
and
2011
we recorded $50 ($2 in cost of sales and $48 in selling, general and administrative expense),
$75
and $76, respectively, in restructuring charges related to focused reductions of our global workforce and other restructuring initiatives. The targeted reductions and other restructuring activities were initiated to provide efficiencies and realign resources as well as to allow for continued investment in strategic areas and drive growth.
Other Income (Expense)
Other expense increased by $8 in
2013
after increasing by $36 in
2012
. Net expense in 2013 increased due to lower income from interest and marketable securities, offset by hedge gains and lower interest expense. The decrease in interest expense was due to favorable tax audit resolutions in multiple jurisdictions that resulted in interest expense credits, partially offset by higher interest expense on borrowings. The increase in
2012
was primarily due to reductions of accrued interest expense in 2011 resulting from settlements reached with the United States Internal Revenue Service (IRS).
In 2011 we reached a favorable settlement regarding an IRS proposed adjustment to our previously filed 2003 through 2007 income tax returns related to the income tax positions we had taken for our Irish cost sharing arrangements. We also reached a settlement with the IRS with respect to the allocation of income
|
12
|
Dollar amounts in millions except per share amounts or as otherwise specified
|
|
with a wholly owned subsidiary operating in Puerto Rico for the years 2006 through 2009. The higher interest expense in
2012
due to the effect of the
2011
tax settlements was partially offset by higher interest income on our investments, due to higher cash and cash equivalents and marketable securities balances compared to 2011.
Income Taxes
Our effective income tax rate on earnings was 17.0%, 23.9% and
20.2%
in
2013
,
2012
and
2011
, respectively. The effective income tax rate for 2013 includes income tax benefits relating to favorable audit resolutions in multiple jurisdictions. The effective income tax rate for 2012 includes the net impact of effective settlement of all tax matters through 2004 relating to two German subsidiaries, and adjustment of the estimate of foreign tax credits to the amount shown on the tax return as filed. The effective income tax rate for 2011 includes the net impact of the settlements with the IRS as described above.
The American Taxpayer Relief Act of 2012 (the Act) was signed on January 2, 2013. The Act provided numerous tax provisions for corporations including an extension of the research tax credit and an extension of certain provisions for companies with significant international operations. The provisions originally expired at
December 31, 2011 but were retroactively extended through December 31, 2013. In 2013 we recorded tax benefits of $13 related to the 2012 research tax credit and other provision of the Act.
Net Earnings
Net earnings in
2013
decreased 22.5% to $1,006. Basic net earnings per share in
2013
decreased 22.0% to $2.66, and diluted net earnings per share in
2013
decreased 22.4% to $2.63. Net earnings in
2012
decreased 3.5% to $1,298. Basic net earnings per share in
2012
decreased 2.0% to $3.41, and diluted net earnings per share in
2012
decreased 1.7% to $3.39.
Reported net earnings in 2013 includes charges for the Rejuvenate, ABG II and Neptune recalls, acquisition and integration related charges related to the Neurovascular, Surpass, Trauson and MAKO acquisitions, additional cost of sales for inventory sold that was "stepped up" to fair value related to the Trauson and MAKO acquisitions, restructuring and related charges, certain charges related to legal and regulatory matters, a donation to an educational institution and benefits associated with the resolution of certain tax matters. Excluding the impact of these items, adjusted net earnings in
2013
increased 3.6% to $1,616 after increasing 7.7% in
2012
. Adjusted diluted net earnings per share in
2013
increased 3.9% to $4.23 after increasing 9.4% in
2012
.
Non-GAAP Financial Measures
The following reconciles the non-GAAP financial measures: adjusted gross profit; adjusted selling, general and administrative expense; adjusted operating income; adjusted other income/(expense); adjusted net earnings; adjusted effective tax rate; and adjusted diluted net earnings per share; with the most directly comparable GAAP financial measures:
|
Year Ended December 31, 2013
|
Gross Profit
|
Selling, General and Administrative Expenses
|
Operating Income
|
Other Income (Expense)
|
Net Earnings
|
Effective Tax Rate
|
Diluted EPS
|
|||||||||||||
|
AS REPORTED
|
$
|
6,044
|
|
$
|
4,066
|
|
$
|
1,256
|
|
$
|
(44
|
)
|
$
|
1,006
|
|
17.0
|
%
|
$
|
2.63
|
|
|
Acquisition and integration related charges
|
||||||||||||||||||||
|
Inventory stepped up to fair value
|
28
|
|
—
|
|
28
|
|
—
|
|
21
|
|
0.1
|
|
0.06
|
|
||||||
|
Other acquisition and integration related
|
—
|
|
(70
|
)
|
70
|
|
—
|
|
51
|
|
0.3
|
|
0.13
|
|
||||||
|
Restructuring and related charges
|
11
|
|
(4
|
)
|
63
|
|
—
|
|
46
|
|
0.3
|
|
0.12
|
|
||||||
|
Rejuvenate and recall matters
|
—
|
|
(622
|
)
|
622
|
|
—
|
|
460
|
|
2.0
|
|
1.20
|
|
||||||
|
Regulatory and legal matters
|
7
|
|
(62
|
)
|
69
|
|
2
|
|
63
|
|
(0.6
|
)
|
0.17
|
|
||||||
|
Donation
|
—
|
|
(25
|
)
|
25
|
|
—
|
|
15
|
|
0.3
|
|
0.04
|
|
||||||
|
Tax matters
|
—
|
|
—
|
|
—
|
|
(13
|
)
|
(46
|
)
|
2.9
|
|
(0.12
|
)
|
||||||
|
ADJUSTED
|
$
|
6,090
|
|
$
|
3,283
|
|
$
|
2,133
|
|
$
|
(55
|
)
|
$
|
1,616
|
|
22.3
|
%
|
$
|
4.23
|
|
|
Year Ended December 31, 2012
|
||||||||||||||||||||
|
AS REPORTED
|
$
|
5,876
|
|
$
|
3,466
|
|
$
|
1,741
|
|
$
|
(36
|
)
|
$
|
1,298
|
|
23.9
|
%
|
$
|
3.39
|
|
|
Acquisition and integration related charges
|
||||||||||||||||||||
|
Inventory stepped up to fair value
|
18
|
|
—
|
|
18
|
|
—
|
|
13
|
|
—
|
|
0.03
|
|
||||||
|
Other acquisition and integration related
|
—
|
|
(37
|
)
|
37
|
|
—
|
|
24
|
|
0.3
|
|
0.06
|
|
||||||
|
Restructuring and related charges
|
5
|
|
—
|
|
80
|
|
—
|
|
59
|
|
0.1
|
|
0.15
|
|
||||||
|
Rejuvenate and recall matters
|
—
|
|
(174
|
)
|
174
|
|
—
|
|
133
|
|
—
|
|
0.35
|
|
||||||
|
Regulatory and legal matters
|
—
|
|
(33
|
)
|
33
|
|
—
|
|
33
|
|
(0.5
|
)
|
0.09
|
|
||||||
|
ADJUSTED
|
$
|
5,899
|
|
$
|
3,222
|
|
$
|
2,083
|
|
$
|
(36
|
)
|
$
|
1,560
|
|
23.8
|
%
|
$
|
4.07
|
|
|
Year Ended December 31, 2011
|
||||||||||||||||||||
|
AS REPORTED
|
$
|
5,496
|
|
$
|
3,150
|
|
$
|
1,686
|
|
$
|
—
|
|
$
|
1,345
|
|
20.2
|
%
|
$
|
3.45
|
|
|
Acquisition and integration related charges
|
||||||||||||||||||||
|
Inventory stepped up to fair value
|
143
|
|
—
|
|
143
|
|
—
|
|
97
|
|
0.6
|
|
0.25
|
|
||||||
|
Other acquisition and integration related
|
—
|
|
(66
|
)
|
66
|
|
—
|
|
45
|
|
0.3
|
|
0.12
|
|
||||||
|
Restructuring and related charges
|
—
|
|
—
|
|
76
|
|
—
|
|
60
|
|
(0.2
|
)
|
0.16
|
|
||||||
|
Regulatory and legal matters
|
—
|
|
(1
|
)
|
1
|
|
—
|
|
—
|
|
—
|
|
—
|
|
||||||
|
Tax matters
|
—
|
|
—
|
|
—
|
|
(27
|
)
|
(99
|
)
|
4.7
|
|
(0.26
|
)
|
||||||
|
ADJUSTED
|
$
|
5,639
|
|
$
|
3,083
|
|
$
|
1,972
|
|
$
|
(27
|
)
|
$
|
1,448
|
|
25.6
|
%
|
$
|
3.72
|
|
The weighted-average basic and diluted shares outstanding used in the calculation of these non-GAAP financial measures are the same as the weighted-average shares outstanding used in the calculation of the reported per share amounts.
|
13
|
Dollar amounts in millions except per share amounts or as otherwise specified
|
|
FINANCIAL CONDITION AND LIQUIDITY
Operating Activities
Operating cash flow was $1,886 in
2013
, an increase of 13.8% and resulted primarily from net earnings adjusted for non-cash items (depreciation and amortization, share-based compensation, sale of inventory "stepped up" to fair value at acquisition and deferred income taxes), along with a decrease of $278 in cash paid for income taxes, associated with the timing of cash payments as well as favorable tax audit resolutions in multiple jurisdictions. These increases were partially offset by higher levels of inventory and accounts receivable. The net of accounts receivable, inventory and accounts payable resulted in the consumption of $165 of cash in
2013
. Inventory days on hand improved by 1 day due to continued focus on improved inventory management; accounts receivable days sales outstanding remained consistent with 2012.
Operating cash flow was
$1,657
in 2012, an increase of
15.6%
, and resulted primarily from net earnings adjusted for non-cash items (depreciation and amortization, share-based compensation, sale of inventory "stepped up" to fair value at acquisition and deferred income taxes). The net of accounts receivable, inventory and accounts payable consumed
$50
of cash in 2012. Inventory reductions contributed $
18
of cash as inventory days on hand decreased by
5
days, due to lower inventory levels driven primarily by improved inventory management. Accounts receivable increases from business growth resulted in the consumption of
$20
of cash, while accounts receivable days sales outstanding decreased by 3 days due to timing of sales.
Investing Activities
Net investing activities resulted in cash consumption of $2,217, $736 and $2,135 in
2013
, 2012 and 2011, respectively, primarily due to acquisitions and capital spending.
Acquisitions.
Acquisitions resulted in cash consumption of $2,320 in
2013
and $154 in 2012. In
2013
the cash consumed was primarily for Trauson and MAKO. In
2012
cash consumed was primarily for Surpass for $99 as well as for milestone payments related to previous acquisitions. Cash consumed in
2011
of $2,066 was primarily for the acquisitions of Neurovascular for $1,450; Orthovita for $316; Memometal for $150; and Concentric for $135.
Capital Spending.
We manage capital spending to support our business growth. Capital expenditures, primarily to support integration of acquisitions, information technology infrastructure upgrades, capacity expansion, new product introductions, innovation and cost savings, were $195, $210 and $226 in
2013
,
2012
and
2011
, respectively.
Proceeds from Asset Sales.
Proceeds from asset sales contributed $67 of cash in
2011
, primarily due to the sale of certain assets related to the OP-1 product family.
Financing Activities
Dividend Payments.
Dividends paid per common share increased 24.7% to $1.06 per share in
2013
, and increased
18.1%
to
$0.85
per share in 2012. As a result of the annual increase in dividends paid per share, total dividend payments to common shareholders were $401,
$324
and $279 in 2013,
2012
and
2011
, respectively.
In March 2013 we sold $600 million of senior unsecured notes due 2018 (the 2018 Notes) and $400 million of senior unsecured notes due 2043 (the 2043 Notes). The 2018 Notes bear interest at 1.3% per year and mature in April 1, 2018. The 2043 Notes bear interest at 4.1% per year and mature on April 1, 2043. We intend to use the net proceeds from the offering for working capital and other general corporate purposes, including acquisitions, stock repurchases and other business opportunities.
Total debt was $2,764 and $1,762 in
2013
and
2012
, respectively.
Share Repurchases.
The total use of cash for share repurchases was $317, $108 and $622 in 2013, 2012 and 2011, respectively.
Liquidity
Our cash, cash equivalents and marketable securities were $3,980 and $4,285 at
December 31, 2013
and 2012, respectively, and our current assets exceeded current liabilities by $5,678 and $6,272 at December 31, 2013 and 2012, respectively. We anticipate being able to support our short-term liquidity and operating needs, including settlements related to the Rejuvenate and ABG II recalls, from a variety of sources, including cash from operations, commercial paper and existing credit lines. In the past we have also raised funds in the capital markets and may continue to do so from time to time in the future. We have strong short-term and long-term debt ratings that we believe should enable us to refinance our debt as it becomes due.
In August 2012 we refinanced our credit facility with a new $1,000 Unsecured Revolving Credit Facility due August 2017 (2012 Facility). The 2012 Facility replaced the previously outstanding $1,000 Unsecured Credit Facility that would have become due in August 2013. The 2012 Facility includes an increase option permitting us to increase the size of the facility up to an additional $500, a $500 multicurrency sublimit (with no sublimit for euro borrowings) and a $100 letter of credit sublimit. The 2012 Facility has an annual facility fee ranging from 5 to 22.5 basis points and bears interest at LIBOR, as defined in the 2012 Facility agreement, plus an applicable margin ranging from 57.5 to 127.5 basis points, both of which are dependent on our credit ratings.
Should additional funds be required we had approximately $1,052 of borrowing capacity available under all of our existing credit facilities at
December 31, 2013
, including the 2012 Facility.
At
December 31, 2013
, approximately 78% of our consolidated cash, cash equivalents and marketable securities were held outside of the United States. These funds are considered indefinitely reinvested to be used to expand operations either organically or through acquisitions outside the United States.
We continually evaluate our receivables, particularly in Spain, Portugal, Italy and Greece (the Southern European Region). The total net receivables from the Southern European Region were approximately $199 and $198 at
December 31, 2013
and
2012
, respectively, including approximately $103 of sovereign
|
14
|
Dollar amounts in millions except per share amounts or as otherwise specified
|
|
receivables in both years. We believe that our current reserves related to receivables are adequate and any additional credit risk associated with the Southern European Region is not expected to have a material adverse impact on our financial position or liquidity. We currently do not have any investments in the sovereign debt instruments of the Southern European Region. Any non-sovereign exposure in these countries in our investment portfolio is considered immaterial.
Guarantees and Other Off-Balance Sheet Arrangements
We do not have guarantees or other off-balance sheet financing arrangements, including variable interest entities, of a magnitude that we believe could have a material impact on our financial condition or liquidity.
CONTRACTUAL OBLIGATIONS AND FORWARD-LOOKING CASH REQUIREMENTS
As further described in Note 7 to the Consolidated Financial Statements, as of
December 31, 2013
we have recorded charges to earnings totaling
$790
representing the minimum of the range of probable loss to resolve the Rejuvenate and ABG II recalls. Based on the information that has been received, the actuarially determined range of probable loss to resolve this matter is estimated to be approximately
$790
to
$1,235
, before third-party insurance recoveries. The final outcome of this matter is dependent on many variables that are difficult to predict. The ultimate cost to entirely resolve this matter may be materially different than the amount of the current estimate and could have a material adverse effect on our financial position, results of operations and cash flows. We are not able to reasonably estimate the future periods in which payments will be made.
As further described in Note 12 to the Consolidated Financial Statements, as of
December 31, 2013
our defined benefit pension plans were underfunded by $175, of which approximately $174 related to plans outside the United States. Due to the rules affecting tax-deductible contributions in the jurisdictions in which the plans are offered and the impact of future plan asset performance, changes in interest rates and the potential for changes in legislation in the United States and other foreign jurisdictions, we are not able to reasonably estimate, beyond 2013, the amounts that may be required to fund defined benefit pension plans.
As further described in Note 11 to the Consolidated Financial Statements, as of
December 31, 2013
we have recorded a liability for uncertain income tax positions of
$204
. Due to uncertainties regarding the ultimate resolution of income tax audits, we are not able to reasonably estimate the future periods in which income tax payments to settle these uncertain income tax positions will be made.
Our future contractual obligations for agreements with initial terms greater than one year, including agreements to purchase materials in the normal course of business, are:
|
|
Payment Period
|
||||||||||||||||||||||||||
|
|
2014
|
2015
|
2016
|
2017
|
2018
|
After 2018
|
Total
|
||||||||||||||||||||
|
Short-term and long-term debt
|
$
|
25
|
|
$
|
500
|
|
$
|
750
|
|
$
|
—
|
|
$
|
600
|
|
$
|
900
|
|
$
|
2,775
|
|
||||||
|
Unconditional purchase obligations
|
479
|
|
136
|
|
11
|
|
6
|
|
33
|
|
3
|
|
668
|
|
|||||||||||||
|
Operating leases
|
51
|
|
53
|
|
33
|
|
26
|
|
21
|
|
38
|
|
222
|
|
|||||||||||||
|
Contributions to defined benefit plans
|
20
|
|
—
|
|
—
|
|
—
|
|
—
|
|
—
|
|
20
|
|
|||||||||||||
|
Other
|
5
|
|
5
|
|
5
|
|
3
|
|
2
|
|
55
|
|
75
|
|
|||||||||||||
|
$
|
580
|
|
$
|
694
|
|
$
|
799
|
|
$
|
35
|
|
$
|
656
|
|
$
|
996
|
|
$
|
3,760
|
|
|||||||
CRITICAL ACCOUNTING POLICIES AND ESTIMATES
In preparing our financial statements in accordance with GAAP, there are certain accounting policies that may require a choice between acceptable accounting methods or may require substantial judgment or estimation in their application. These include allowance for doubtful accounts, inventory reserves, income taxes, acquisitions, goodwill and intangible assets, and legal and other contingencies. We believe these accounting policies and the others set forth in Note 1 to the Consolidated Financial Statements should be reviewed as they are integral to understanding our results of operations and financial condition.
Allowance for Doubtful Accounts
We maintain an allowance for doubtful accounts for estimated losses in the collection of accounts receivable. We make estimates regarding the future ability of our customers to make required payments based on historical credit experience and expected future trends. If actual customer financial conditions are less favorable than projected by management, additional accounts receivable write offs may be necessary, which could unfavorably affect future operating results.
Inventory Reserves
We maintain reserves for excess and obsolete inventory resulting from the potential inability to sell certain products at prices in excess of current carrying costs. We make estimates regarding the future recoverability of the costs of these products and record provisions based on historical experience, expiration of sterilization dates and expected future trends. If actual product life cycles, product demand or acceptance of new product introductions are less favorable than projected by management, additional inventory write downs may be required, which could unfavorably affect future operating results.
Income Taxes
Our annual tax rate is determined based on our income, statutory tax rates and the tax impacts of items treated differently for tax purposes than for financial reporting purposes. Tax law requires certain items be included in the tax return at different times than the items are reflected in the financial statements. Some of these differences are permanent, such as expenses that are not deductible
|
15
|
Dollar amounts in millions except per share amounts or as otherwise specified
|
|
in our tax return, and some differences are temporary and reverse over time, such as depreciation expense. These temporary differences create deferred tax assets and liabilities.
Deferred tax assets generally represent the tax effect of items that can be used as a tax deduction or credit in future years for which we have already recorded the tax benefit in our income statement. Deferred tax liabilities generally represent tax expense recognized in our financial statements for which payment has been deferred, the tax effect of expenditures for which a deduction has already been taken in our tax return but has not yet been recognized in our financial statements or assets recorded at fair value in business combinations for which there was no corresponding tax basis adjustment.
Inherent in determining our annual tax rate are judgments regarding business plans, tax planning opportunities and expectations about future outcomes. Realization of certain deferred tax assets is dependent upon generating sufficient taxable income in the appropriate jurisdiction prior to the expiration of the carryforward periods. Although realization is not assured, management believes it is more likely than not that our deferred tax assets, net of valuation allowances, will be realized.
We operate in multiple jurisdictions with complex tax policy and regulatory environments. In certain of these jurisdictions, we may take tax positions that management believes are supportable but are potentially subject to successful challenge by the applicable taxing authority. These differences of interpretation with the respective governmental taxing authorities can be impacted by the local economic and fiscal environment. We evaluate our tax positions and establish liabilities in accordance with the applicable accounting guidance on uncertainty in income taxes. We review these tax uncertainties in light of changing facts and circumstances, such as the progress of tax audits, and adjust them accordingly. We have a number of audits in process in various jurisdictions. Although the resolution of these tax positions is uncertain, based on currently available information, we believe that it is more likely than not that the ultimate outcomes will not have a material adverse effect on our financial position, results of operations or cash flows.
Because there are a number of estimates and assumptions inherent in calculating the various components of our tax provision, certain changes or future events, such as changes in tax legislation, geographic mix of earnings, completion of tax audits or earnings repatriation plans, could have an impact on those estimates and our effective tax rate.
Acquisitions, Goodwill and Intangibles, and Long-Lived Assets
We account for acquired businesses using the purchase method of accounting. Under the purchase method, our financial statements include the operations of an acquired business starting from the completion of the acquisition. In addition, the assets acquired and liabilities assumed are recorded at the date of acquisition at their respective estimated fair values, with any excess of the purchase price over the estimated fair values of the net assets acquired recorded as goodwill.
Significant judgment is required in estimating the fair value of intangible assets and in assigning their respective useful lives. Accordingly, we typically obtain the assistance of third-party valuation specialists for significant items. The fair value estimates are based on available historical information and on future expectations and assumptions deemed reasonable by management but are inherently uncertain.
We typically use an income method to estimate the fair value of intangible assets, which is based on forecasts of the expected future cash flows attributable to the respective assets. Significant estimates and assumptions inherent in the valuations reflect a consideration of other marketplace participants and include the amount and timing of future cash flows (including expected growth rates and profitability), the underlying product or technology life cycles, the economic barriers to entry and the discount rate applied to the cash flows. Unanticipated market or macroeconomic events and circumstances may occur that could affect the accuracy or validity of the estimates and assumptions.
Determining the useful life of an intangible asset also requires judgment. With the exception of certain trade names, the majority of our acquired intangible assets (e.g., certain trademarks or brands, customer and distributor relationships, patents and technologies) are expected to have determinable useful lives. Our assessment as to the useful lives of these intangible assets is based on a number of factors including competitive environment, market share, trademark and/or brand history, underlying product life cycles, operating plans and the macroeconomic environment of the countries in which the trademarks or brands are sold. Our estimates of the useful lives of determinable-lived intangibles are primarily based on these same factors. Determinable-lived intangible assets are amortized to expense over their estimated useful life.
In certain of our acquisitions, we acquire in-process research and development (IPRD) intangible assets. IPRD is considered to be an indefinite-lived intangible asset until such time as the research is completed (at which time it becomes a determinable-lived intangible asset) or determined to have no future use (at which time it is impaired).
The value of indefinite-lived intangible assets and goodwill is not amortized but is tested at least annually for impairment. Our impairment testing for goodwill is performed separately from our impairment testing of indefinite-lived intangibles. We perform our annual impairment test for goodwill in the fourth quarter of each year. We have adopted the provisions of Accounting Standards Update (ASU) No. 2011-08,
Intangibles - Goodwill and Other: Testing Goodwill for Impairment
, which permits us to consider qualitative indicators of the fair value of a reporting unit when it is unlikely that a reporting unit has impaired goodwill. In certain circumstances, we may also utilize a discounted cash flow analysis that requires certain assumptions and estimates be made regarding market conditions and our future profitability. In those circumstances we test goodwill for impairment by reviewing the book value compared to the fair value at the reporting unit level. We test individual indefinite-lived intangibles by reviewing the individual book values compared to the fair value.
|
16
|
Dollar amounts in millions except per share amounts or as otherwise specified
|
|
We determine the fair value of our reporting units and indefinite-lived intangible assets based on the income approach. Under the income approach, we calculate the fair value of our reporting units and indefinite-lived intangible assets based on the present value of estimated future cash flows. Considerable management judgment is necessary to evaluate the impact of operating and macroeconomic changes and to estimate future cash flows to measure fair value. Assumptions used in our impairment evaluations, such as forecasted growth rates and cost of capital, are consistent with internal projections and operating plans. We believe such assumptions and estimates are also comparable to those that would be used by other marketplace participants.
We did not recognize any material impairment charges for goodwill during the years presented, as our annual impairment testing indicated that all reporting unit goodwill fair values exceeded their respective recorded values. Future changes in the judgments, assumptions and estimates that are used in our impairment testing for goodwill and indefinite-lived intangible assets, including discount and tax rates or future cash flow projections, could result in significantly different estimates of the fair values. A significant reduction in the estimated fair values could result in impairment charges that could materially affect our financial statements.
We review our other long-lived assets for indicators of impairment whenever events or changes in circumstances indicate that the carrying amount may not be recoverable. The evaluation is performed at the lowest level of identifiable cash flows, which is at the individual asset level or the asset group level. The undiscounted cash flows expected to be generated by the related assets are estimated over their useful life based on updated projections. If the evaluation indicates that the carrying amount of the assets may not be recoverable, any potential impairment is measured based upon the fair value of the related assets or asset group as determined by an appropriate market appraisal or other valuation technique. Assets classified as held for sale, if any, are recorded at the lower of carrying amount or fair value less costs to sell.
Legal and Other Contingencies
We are involved in various ongoing proceedings, legal actions and claims arising in the normal course of business, including proceedings related to product, labor and intellectual property, and other matters that are more fully described in "Other Information" below and in Note 7 to the Consolidated Financial Statements. The outcomes of these matters will generally not be known for prolonged periods of time. In certain of the legal proceedings, the claimants seek damages, as well as other compensatory and equitable relief, that could result in the payment of significant claims and settlements and/or the imposition of injunctions or other equitable relief. For legal matters for which management has sufficient information to reasonably estimate our future obligations, a liability representing management's best estimate of the probable loss, or the minimum of the range of probable losses when a best estimate within the range is not known, for the resolution of these legal matters is recorded. The estimates are based on consultation with legal counsel, previous settlement
experience and settlement strategies. If actual outcomes are less favorable than those projected by management, additional expense may be incurred, which could unfavorably affect future operating results.
The Company is currently self-insured for product liability-related claims and expenses.
The ultimate cost to us with respect to product liability claims could be materially different than the amount of the current estimates and accruals and could have a material adverse effect on our financial position, results of operations and cash flows.
NEW ACCOUNTING PRONOUNCEMENTS
No accounting pronouncements that were issued or became effective during the year have had or are expected to have a material impact on our Consolidated Financial Statements.
OTHER INFORMATION
Hedging and Derivative Financial Instruments
We sell our products throughout the world. As a result, our financial results could be significantly affected by factors such as weak economic conditions or changes in foreign currency exchange rates. Our operating results are primarily exposed to changes in exchange rates among the United States dollar; European currencies, in particular the euro, Swiss franc and the British pound; the Japanese yen; the Australian dollar; and the Canadian dollar. We develop and manufacture products in the United States, China, France, Germany, Ireland, Puerto Rico and Switzerland and incur costs in the applicable local currencies. This worldwide deployment of facilities serves to partially mitigate the impact of currency exchange rate changes on our cost of sales.
We enter into designated and non-designated forward currency exchange contracts to mitigate the impact of currency fluctuations on transactions denominated in nonfunctional currencies, thereby limiting risk that would otherwise result from changes in exchange rates. These nonfunctional currency exposures principally relate to intercompany receivables and payables arising from intercompany purchases of manufactured products. The periods of the forward currency exchange contracts correspond to the periods of the exposed transactions, with realized gains and losses included in the measurement and recording of transactions denominated in the nonfunctional currencies. All forward currency exchange contracts are recorded at their fair value each period, with resulting gains (losses) for non-designated forward contracts and any ineffectiveness measured on designated forward currency exchange contracts included in our Consolidated Statements of Earnings. For derivative instruments that are designated and qualify as a cash flow hedge, the effective portion of the gain or loss on the derivative is reported as a component of accumulated other comprehensive income, and reclassified into earnings in the same period during which the hedged transaction affects earnings.
The estimated fair value of forward currency exchange contracts represents the measurement of the contracts at month-end spot rates as adjusted by current forward points. A hypothetical 10% change in foreign currencies relative to the United States dollar would change the
December 31, 2013
fair value by approximately
$6
. We are exposed to credit loss in the event of nonperformance by counterparties on our outstanding forward currency exchange
|
17
|
Dollar amounts in millions except per share amounts or as otherwise specified
|
|
contracts, but we do not anticipate nonperformance by any of our counterparties.
We have certain investments in net assets in international locations that are not hedged. These investments are subject to translation gains and losses due to changes in foreign currency exchange rates. For
2013
the strengthening of foreign currencies relative to the United States dollar increased the value of these investments in net assets and the related foreign currency translation adjustment gain in shareholders' equity by
$80
to
$306
, from
$226
as of
December 31, 2012
.
Legal and Regulatory Matters
In 2010 we received a subpoena from the United States Department of Justice (DOJ) related to the sales and marketing of the OtisKnee device. The subpoena concerns allegations of violations of Federal laws related to sales of a device not cleared by the United States Food and Drug Administration (FDA). We continue to discuss the settlement of this matter with the DOJ, but there can be no assurance that we will reach a consensual resolution rather than seeking a resolution through the courts. We have recorded charges totaling
$80
related to the above matter, including
$47
in the year ended December 31, 2013.
In June 2012 we voluntarily recalled our Rejuvenate and ABG II modular-neck hip stems and terminated global distribution of these hip products. We notified healthcare professionals and regulatory bodies of this recall, which was taken due to potential risks associated with fretting and/or corrosion that may lead to adverse local tissue reactions. Product liability lawsuits relating to this voluntary recall have been filed against us. As previously announced, we intend to reimburse implanted patients for reasonable and customary costs of testing and treatment services, including any necessary revision surgeries. We continue to work with the medical community to evaluate the data and further understand this matter and the associated costs. The ultimate total cost with respect to this matter will depend on many factors that are difficult to predict with the information received to date and may vary materially based on the number of and actual costs of patients seeking testing and treatment services, the number of and actual costs of patients requiring revision surgeries, the number of and actual costs to settle lawsuits filed against us, and the amount of third-party insurance recoveries. Based on the information that has been received, the actuarially determined range of probable loss to resolve this matter is estimated to be approximately
$790
to
$1,235
, before third-party insurance recoveries. In the year ended December 31, 2013, we recorded charges to earnings of
$600
representing the excess of the
$790
minimum of the range over the previously recorded reserves. No contingent gain for third-party insurance recoveries was recorded as of December 31, 2013. As noted above, the final outcome of this matter is dependent on many variables that are difficult to predict. The ultimate cost to entirely resolve this matter may be materially different than the amount of the current estimate and accruals and could have a material adverse effect on our financial position, results of operations and cash flows.
In 2010 we filed a lawsuit in federal court against Zimmer Holdings, Inc. (Zimmer), alleging that a Zimmer product infringed three of our patents. In rulings issued in August and September
2013, the trial judge upheld the February 2013 jury verdict in our favor, issued a permanent injunction barring Zimmer from making or selling infringing products, and ordered Zimmer to pay us at least
$228
. Zimmer is appealing this ruling and the ultimate resolution of this matter may differ materially. Accordingly, we have not recorded a contingent gain related to this matter.
For each of the following legal matters the final outcome is dependent on many variables and cannot be predicted. Accordingly, it is not possible at this time for us to estimate any material loss or range of losses. However, the ultimate cost to resolve these matters could have a material adverse effect on our financial position, results of operations and cash flows.
In April 2011 lawsuits brought by Hill-Rom Company, Inc. and affiliated entities (Hill-Rom) against us were filed in the United States District Court for the Western District of Wisconsin and the United States District Court for the Southern District of Indiana. The Wisconsin lawsuit was subsequently transferred to the United States District Court in Indiana. The suits allege infringement under United States patent laws with respect to certain patient handling equipment we manufactured and sold and seek damages and permanent injunctions. We have entered into an agreement settling the first lawsuit, with terms as previously disclosed. The second lawsuit involves
nine
patents related to electrical network communications for hospital beds. The case has been stayed with respect to
six
of the patents, which are currently under reexamination by the United States Patent Office. With respect to the
three
remaining patents, Hill-Rom is appealing the trial court's grant of summary judgment in our favor and the ultimate resolution of this particular part of the suit may differ. The ultimate resolution of the entire second suit may have no relation to the resolution of the first suit and cannot be predicted; however, the ultimate result could have a material adverse effect on our financial position, results of operations and cash flows.
In 2010 we received a subpoena from the DOJ related to sales, marketing and regulatory matters related to the Stryker PainPump. We have received requests for certain documents in connection with this investigation. The investigation is ongoing and we are fully cooperating with the DOJ regarding this matter.
|
ITEM 7A.
|
QUANTITATIVE AND QUALITATIVE DISCLOSURES ABOUT MARKET RISK
|
We consider our material area of market risk exposure to be exchange rate risk. Quantitative and qualitative disclosures about exchange rate risk are included in the "Other Information" section of Management's Discussion and Analysis of Financial Condition in Item 7, under the caption Other Information - "Hedging and Derivative Financial Instruments".
|
18
|
Dollar amounts in millions except per share amounts or as otherwise specified
|
|
|
ITEM 8.
|
FINANCIAL STATEMENTS AND SUPPLEMENTARY DATA.
|
REPORT OF INDEPENDENT REGISTERED PUBLIC ACCOUNTING FIRM ON CONSOLIDATED FINANCIAL STATEMENTS
The Board of Directors and Shareholders of Stryker Corporation
:
We have audited the accompanying consolidated balance sheets of Stryker Corporation and subsidiaries as of
December 31, 2013
and
2012
, and the related consolidated statements of earnings and comprehensive income, shareholders' equity, and cash flows for each of the three years in the period ended
December 31, 2013
. Our audits also included the financial statement schedule listed in the Index at Item 15(a). These financial statements and schedule are the responsibility of the Company's management. Our responsibility is to express an opinion on these financial statements and schedule based on our audits.
We conducted our audits in accordance with the standards of the Public Company Accounting Oversight Board (United States). Those standards require that we plan and perform the audit to obtain reasonable assurance about whether the financial statements are free of material misstatement. An audit includes examining, on a test basis, evidence supporting the amounts and disclosures in the financial statements. An audit also includes assessing the accounting principles used and significant estimates made by management, as well as evaluating the overall financial statement presentation. We believe that our audits provide a reasonable basis for our opinion.
In our opinion, the financial statements referred to above present fairly, in all material respects, the consolidated financial position of Stryker Corporation and subsidiaries at
December 31, 2013
and
2012
, and the consolidated results of their operations and their cash flows for each of the three years in the period ended
December 31, 2013
, in conformity with U.S. generally accepted accounting principles. Also, in our opinion, the related financial statement schedule, when considered in relation to the basic financial statements taken as a whole, presents fairly in all material respects the information set forth therein.
We also have audited, in accordance with the standards of the Public Company Accounting Oversight Board (United States), Stryker Corpora
tion's internal control over financial reporting as of
December 31, 2013
, based on criteria established in Internal Control-Integrated Framework issued by the Committee of Sponsoring Organizations of the Treadway Commission (1992 framework) and our report dated
February 13, 2014
expressed an unqualified opinion thereon.
/s/ ERNST & YOUNG LLP
Grand Rapids, Michigan
February 13, 2014
|
19
|
Dollar amounts in millions except per share amounts or as otherwise specified
|
|
Stryker Corporation and Subsidiaries
CONSOLIDATED STATEMENTS OF EARNINGS
|
Years Ended December 31
|
||||||||||||
|
2013
|
2012
|
2011
|
||||||||||
|
Net sales
|
$
|
9,021
|
|
$
|
8,657
|
|
$
|
8,307
|
|
|||
|
Cost of sales
|
2,977
|
|
2,781
|
|
2,811
|
|
||||||
|
Gross profit
|
6,044
|
|
5,876
|
|
5,496
|
|
||||||
|
Research, development and engineering expenses
|
536
|
|
471
|
|
462
|
|
||||||
|
Selling, general and administrative expenses
|
4,066
|
|
3,466
|
|
3,150
|
|
||||||
|
Intangible asset amortization
|
138
|
|
123
|
|
122
|
|
||||||
|
Restructuring charges
|
48
|
|
75
|
|
76
|
|
||||||
|
Total operating expenses
|
4,788
|
|
4,135
|
|
3,810
|
|
||||||
|
Operating income
|
1,256
|
|
1,741
|
|
1,686
|
|
||||||
|
Other income (expense), net
|
(44
|
)
|
(36
|
)
|
—
|
|
||||||
|
Earnings before income taxes
|
1,212
|
|
1,705
|
|
1,686
|
|
||||||
|
Income taxes
|
206
|
|
407
|
|
341
|
|
||||||
|
Net earnings
|
$
|
1,006
|
|
$
|
1,298
|
|
$
|
1,345
|
|
|||
|
Net earnings per share of common stock:
|
||||||||||||
|
Basic net earnings per share of common stock
|
$
|
2.66
|
|
$
|
3.41
|
|
$
|
3.48
|
|
|||
|
Diluted net earnings per share of common stock
|
$
|
2.63
|
|
$
|
3.39
|
|
$
|
3.45
|
|
|||
|
Weighted-average shares outstanding—in millions:
|
||||||||||||
|
Basic
|
378.6
|
|
380.6
|
|
386.5
|
|
||||||
|
Net effect of dilutive employee stock options
|
3.5
|
|
2.4
|
|
3.0
|
|
||||||
|
Diluted
|
382.1
|
|
383.0
|
|
389.5
|
|
||||||
|
Anti-dilutive shares excluded from the calculation of net effect of dilutive employee stock options
|
—
|
|
6.4
|
|
7.8
|
|
||||||
|
Years Ended December 31
|
||||||||||||
|
2013
|
2012
|
2011
|
||||||||||
|
Net earnings
|
$
|
1,006
|
|
$
|
1,298
|
|
$
|
1,345
|
|
|||
|
Unrealized gains (losses) on securities, net of tax (expense) benefit of $1, ($1) and $1, respectively
|
(4
|
)
|
4
|
|
(2
|
)
|
||||||
|
Unfunded pension gains (losses), net of tax (expense) benefit of ($15), $25 and ($8), respectively
|
20
|
|
(69
|
)
|
12
|
|
||||||
|
Unrealized gains on designated hedges, net of tax expense of $4, $0 and $0, respectively
|
7
|
|
—
|
|
—
|
|
||||||
|
Foreign currency translation adjustments
|
80
|
|
50
|
|
(20
|
)
|
||||||
|
Total other comprehensive income (loss)
|
103
|
|
(15
|
)
|
(10
|
)
|
||||||
|
Comprehensive income
|
$
|
1,109
|
|
$
|
1,283
|
|
$
|
1,335
|
|
|||
See accompanying notes to Consolidated Financial Statements.
|
20
|
Dollar amounts in millions except per share amounts or as otherwise specified
|
|
Stryker Corporation and Subsidiaries
|
December 31
|
||||||||
|
2013
|
2012
|
|||||||
|
ASSETS
|
||||||||
|
Current assets
|
||||||||
|
Cash and cash equivalents
|
$
|
1,339
|
|
$
|
1,395
|
|
||
|
Marketable securities
|
2,641
|
|
2,890
|
|
||||
|
Accounts receivable, less allowance of $72 ($58 in 2012)
|
1,518
|
|
1,430
|
|
||||
|
Inventories
|
||||||||
|
Materials and supplies
|
227
|
|
202
|
|
||||
|
Work in process
|
85
|
|
71
|
|
||||
|
Finished goods
|
1,110
|
|
992
|
|
||||
|
Total inventories
|
1,422
|
|
1,265
|
|
||||
|
Deferred income taxes
|
880
|
|
811
|
|
||||
|
Prepaid expenses and other current assets
|
535
|
|
357
|
|
||||
|
Total current assets
|
8,335
|
|
8,148
|
|
||||
|
Property, plant and equipment
|
||||||||
|
Land, buildings and improvements
|
686
|
|
625
|
|
||||
|
Machinery and equipment
|
1,811
|
|
1,607
|
|
||||
|
Total property, plant and equipment
|
2,497
|
|
2,232
|
|
||||
|
Less allowance for depreciation
|
1,416
|
|
1,284
|
|
||||
|
Net property, plant and equipment
|
1,081
|
|
948
|
|
||||
|
Other assets
|
||||||||
|
Goodwill
|
3,844
|
|
2,142
|
|
||||
|
Other intangibles, net
|
1,989
|
|
1,424
|
|
||||
|
Other
|
494
|
|
544
|
|
||||
|
Total assets
|
$
|
15,743
|
|
$
|
13,206
|
|
||
|
LIABILITIES AND SHAREHOLDERS' EQUITY
|
||||||||
|
Current liabilities
|
||||||||
|
Accounts payable
|
314
|
|
288
|
|
||||
|
Accrued compensation
|
|
535
|
|
467
|
|
|||
|
Income taxes
|
|
131
|
|
70
|
|
|||
|
Dividend payable
|
|
115
|
|
101
|
|
|||
|
Accrued expenses and other liabilities
|
|
1,537
|
|
934
|
|
|||
|
Current maturities of debt
|
|
25
|
|
16
|
|
|||
|
Total current liabilities
|
|
2,657
|
|
1,876
|
|
|||
|
Long-term debt, excluding current maturities
|
2,739
|
|
1,746
|
|
||||
|
Other liabilities
|
|
1,300
|
|
987
|
|
|||
|
Shareholders' equity
|
||||||||
|
Common stock, $0.10 par value:
|
||||||||
|
Authorized: 1 billion shares, outstanding: 378 million shares (380 million in 2012)
|
38
|
|
38
|
|
||||
|
Additional paid-in capital
|
1,160
|
|
1,098
|
|
||||
|
Retained earnings
|
7,617
|
|
7,332
|
|
||||
|
Accumulated other comprehensive income
|
232
|
|
129
|
|
||||
|
Total shareholders' equity
|
9,047
|
|
8,597
|
|
||||
|
Total liabilities & shareholders' equity
|
$
|
15,743
|
|
$
|
13,206
|
|
||
See accompanying notes to Consolidated Financial Statements.
|
21
|
Dollar amounts in millions except per share amounts or as otherwise specified
|
|
Stryker Corporation and Subsidiaries
CONSOLIDATED STATEMENTS OF SHAREHOLDERS’ EQUITY
|
Common
Stock |
Additional
Paid-In Capital |
Retained
Earnings |
Accumulated
Other Comprehensive Income |
Total
|
||||||||||||||||
|
Balances at January 1, 2011
|
$
|
39
|
|
$
|
964
|
|
$
|
6,017
|
|
$
|
154
|
|
$
|
7,174
|
|
|||||
|
Net earnings
|
1,345
|
|
1,345
|
|
||||||||||||||||
|
Other comprehensive loss
|
(10
|
)
|
(10
|
)
|
||||||||||||||||
|
Issuance of 1.6 million shares of common stock under stock option and benefit plans, including $6 excess income tax benefit
|
13
|
|
13
|
|
||||||||||||||||
|
Repurchase and retirement of 11.8 million shares of common stock
|
(1
|
)
|
(30
|
)
|
(591
|
)
|
(622
|
)
|
||||||||||||
|
Share-based compensation
|
75
|
|
75
|
|
||||||||||||||||
|
Cash dividends declared of $0.7525 per share of common stock
|
(292
|
)
|
(292
|
)
|
||||||||||||||||
|
Balances at December 31, 2011
|
38
|
|
1,022
|
|
6,479
|
|
144
|
|
7,683
|
|
||||||||||
|
Net earnings
|
1,298
|
|
1,298
|
|
||||||||||||||||
|
Other comprehensive loss
|
(15
|
)
|
(15
|
)
|
||||||||||||||||
|
Issuance of 1.5 million shares of common stock under stock option and benefit plans, including $1 excess income tax benefit
|
7
|
|
7
|
|
||||||||||||||||
|
Repurchase and retirement of 2.1 million shares of common stock
|
(6
|
)
|
(102
|
)
|
(108
|
)
|
||||||||||||||
|
Share-based compensation
|
75
|
|
75
|
|
||||||||||||||||
|
Cash dividends declared of $0.9025 per share of common stock
|
(343
|
)
|
(343
|
)
|
||||||||||||||||
|
Balances at December 31, 2012
|
38
|
|
1,098
|
|
7,332
|
|
129
|
|
8,597
|
|
||||||||||
|
Net earnings
|
1,006
|
|
1,006
|
|
||||||||||||||||
|
Other comprehensive income
|
103
|
|
103
|
|
||||||||||||||||
|
Issuance of 2.1 million shares of common stock under stock option and benefit plans, including $6 excess income tax benefit
|
(1
|
)
|
(1
|
)
|
||||||||||||||||
|
Repurchase and retirement of 4.8 million shares of common stock
|
(13
|
)
|
(304
|
)
|
(317
|
)
|
||||||||||||||
|
Share-based compensation
|
76
|
|
76
|
|
||||||||||||||||
|
Cash dividends declared of $1.10 per share of common stock
|
(417
|
)
|
(417
|
)
|
||||||||||||||||
|
Balances at December 31, 2013
|
$
|
38
|
|
$
|
1,160
|
|
$
|
7,617
|
|
$
|
232
|
|
$
|
9,047
|
|
|||||
See accompanying notes to Consolidated Financial Statements.
|
22
|
Dollar amounts in millions except per share amounts or as otherwise specified
|
|
Stryker Corporation and Subsidiaries
|
Year Ended December 31
|
||||||||||||
|
2013
|
2012
|
2011
|
||||||||||
|
Operating activities
|
||||||||||||
|
Net earnings
|
$
|
1,006
|
|
$
|
1,298
|
|
$
|
1,345
|
|
|||
|
Adjustments to reconcile net earnings to net cash provided by operating activities:
|
||||||||||||
|
Depreciation
|
169
|
|
154
|
|
160
|
|
||||||
|
Intangible asset amortization
|
138
|
|
123
|
|
122
|
|
||||||
|
Share-based compensation
|
76
|
|
75
|
|
75
|
|
||||||
|
Restructuring charges
|
50
|
|
75
|
|
76
|
|
||||||
|
Sale of inventory stepped up to fair value at acquisition
|
28
|
|
18
|
|
143
|
|
||||||
|
Deferred income tax benefit
|
23
|
|
(39
|
)
|
(164
|
)
|
||||||
|
Changes in operating assets and liabilities, net of effects of acquisitions:
|
||||||||||||
|
Accounts receivable
|
(89
|
)
|
(20
|
)
|
(152
|
)
|
||||||
|
Inventories
|
(77
|
)
|
18
|
|
(166
|
)
|
||||||
|
Accounts payable
|
1
|
|
(48
|
)
|
44
|
|
||||||
|
Accrued expenses and other liabilities
|
657
|
|
180
|
|
158
|
|
||||||
|
Income taxes
|
(124
|
)
|
(159
|
)
|
(95
|
)
|
||||||
|
Other
|
28
|
|
(18
|
)
|
(112
|
)
|
||||||
|
Net cash provided by operating activities
|
1,886
|
|
1,657
|
|
1,434
|
|
||||||
|
Investing activities
|
||||||||||||
|
Acquisitions, net of cash acquired
|
(2,320
|
)
|
(154
|
)
|
(2,066
|
)
|
||||||
|
Purchases of marketable securities
|
(4,558
|
)
|
(3,480
|
)
|
(6,779
|
)
|
||||||
|
Proceeds from sales of marketable securities
|
4,856
|
|
3,108
|
|
6,869
|
|
||||||
|
Purchases of property, plant and equipment
|
(195
|
)
|
(210
|
)
|
(226
|
)
|
||||||
|
Proceeds from sales of property, plant and equipment
|
—
|
|
—
|
|
67
|
|
||||||
|
Net cash used in investing activities
|
(2,217
|
)
|
(736
|
)
|
(2,135
|
)
|
||||||
|
Financing activities
|
||||||||||||
|
Proceeds from borrowings
|
369
|
|
178
|
|
178
|
|
||||||
|
Payments on borrowings
|
(355
|
)
|
(182
|
)
|
(190
|
)
|
||||||
|
Proceeds from issuance of long-term debt, net
|
991
|
|
—
|
|
749
|
|
||||||
|
Dividends paid
|
(401
|
)
|
(324
|
)
|
(279
|
)
|
||||||
|
Repurchase and retirement of common stock
|
(317
|
)
|
(108
|
)
|
(622
|
)
|
||||||
|
Other
|
13
|
|
(13
|
)
|
3
|
|
||||||
|
Net cash provided by (used in) financing activities
|
300
|
|
(449
|
)
|
(161
|
)
|
||||||
|
Effect of exchange rate changes on cash and cash equivalents
|
(25
|
)
|
18
|
|
9
|
|
||||||
|
Change in cash and cash equivalents
|
(56
|
)
|
490
|
|
(853
|
)
|
||||||
|
Cash and cash equivalents at beginning of year
|
1,395
|
|
905
|
|
1,758
|
|
||||||
|
Cash and cash equivalents at end of year
|
$
|
1,339
|
|
$
|
1,395
|
|
$
|
905
|
|
|||
|
Supplemental cash flow disclosure:
|
||||||||||||
|
Cash paid for income taxes, net of refunds
|
$
|
321
|
|
$
|
599
|
|
$
|
574
|
|
|||
See accompanying notes to Consolidated Financial Statements.
|
23
|
Dollar amounts in millions except per share amounts or as otherwise specified
|
|
Stryker Corporation and Subsidiaries
NOTES TO CONSOLIDATED FINANCIAL STATEMENTS
December 31, 2013
Nature of Operations:
Stryker Corporation (the "Company," "we," "us," or "our") is one of the world's leading medical technology companies. Our products include implants used in joint replacement and trauma surgeries; surgical equipment and surgical navigation systems; endoscopic and communications systems; patient handling and emergency medical equipment; neurosurgical, neurovascular and spinal devices; as well as other medical device products used in a variety of medical specialties.
Basis of Presentation:
The Consolidated Financial Statements include the Company and its subsidiaries. Intercompany transactions are eliminated.
Use of Estimates:
Preparation of financial statements in conformity with accounting principles generally accepted in the United States (GAAP) requires management to make estimates and assumptions that affect the amounts reported in the Consolidated Financial Statements and accompanying disclosures. These estimates are based on management's best knowledge of current events and actions the Company may undertake in the future. Estimates are used in accounting for, among other items, pensions, stock options, valuation of acquired intangible assets, useful lives for depreciation and amortization of long-lived assets, future cash flows associated with impairment testing for goodwill, indefinite-lived intangible assets and other long-lived assets, deferred tax assets and liabilities, uncertain income tax positions and contingencies. Actual results may ultimately differ from estimates.
Revenue Recognition:
Sales are recognized when revenue is realized or realizable and has been earned. Our policy is to recognize revenue when title to the product, ownership and risk of loss transfer to the customer, which can be on the date of shipment, the date of receipt by the customer or, for most reconstructive products, when we receive appropriate notification that the product has been used or implanted. A provision for estimated sales returns, discounts, rebates and other sales incentives is recorded as a reduction of net sales in the same period that the revenue is recognized. Shipping and handling costs charged to customers are included in net sales.
Cost of Sales:
Cost of sales is primarily comprised of direct materials and supplies consumed in the manufacture of product, as well as manufacturing labor, depreciation expense and direct overhead expense necessary to acquire and convert the purchased materials and supplies into finished product. Cost of sales also includes the cost to distribute products to customers, inbound freight costs, warehousing costs and other shipping and handling activity.
Research, Development and Engineering Expenses:
Research and development costs are charged to expense as incurred. Costs include research, development and engineering activities relating to the development of new products, improvement of existing products, technical support of products and compliance with governmental regulations for the protection of customers and
patients. Costs primarily consist of salaries, wages, consulting and depreciation and maintenance of research facilities and equipment.
Selling, General and Administrative Expenses:
Selling, general and administrative expense is primarily comprised of selling expenses, marketing expenses, administrative and other indirect overhead costs, amortization of loaner instrumentation, depreciation and amortization expense of non-manufacturing assets and other miscellaneous operating items.
Currency Translation:
Financial statements of subsidiaries outside the United States generally are measured using the local currency as the functional currency. Adjustments to translate those statements into United States dollars are recorded in other comprehensive income (OCI). Transactional exchange gains and losses are included in earnings.
Cash Equivalents:
Highly liquid investments with remaining stated maturities of three months or less when purchased are considered cash equivalents and recorded at cost.
Marketable Securities:
Marketable securities consist of marketable debt securities, certificates of deposit and mutual funds. Mutual funds are acquired to offset changes in certain liabilities related to deferred compensation arrangements and are expected to be used to settle these liabilities. Pursuant to our investment policy, all individual marketable security investments must have a minimum credit quality of single A (per Standard & Poor’s and Fitch) and A2 (per Moody’s Corporation) at the time of acquisition, while the overall portfolio of marketable securities must maintain a minimum average credit quality of double A (per Standard & Poor’s and Fitch) or Aa (per Moody’s Corporation). In the event of a rating downgrade below the minimum credit quality subsequent to purchase, the marketable security investment is evaluated to determine the appropriate action to take to minimize the overall risk to our marketable security investment portfolio. Our marketable securities are classified as available-for-sale and trading securities.
Accounts Receivable:
Accounts receivable consists of trade and other miscellaneous receivables. An allowance is maintained for doubtful accounts for estimated losses in the collection of accounts receivable. Estimates are made regarding the ability of customers to make required payments based on historical credit experience and expected future trends. Accounts receivable are written off when all reasonable collection efforts are exhausted.
Inventories:
Inventories are stated at the lower of cost or market, with cost generally determined using the first-in, first-out (FIFO) cost method. For excess and obsolete inventory resulting from the potential inability to sell specific products at prices in excess of current carrying costs, reserves are maintained to reduce current carrying cost to market prices.
Financial Instruments:
Our financial instruments consist of cash, cash equivalents, marketable securities, accounts receivable, other investments, accounts payable, debt and foreign currency exchange
|
24
|
Dollar amounts in millions except per share amounts or as otherwise specified
|
|
contracts. With the exception of our long-term debt, which is discussed in further detail in Note 8, our estimates of fair value for financial instruments approximate their carrying amounts as of
December 31, 2013
and
2012
.
All marketable securities are recognized at fair value. Adjustments to the fair value of marketable securities that are classified as available-for-sale are recorded as increases or decreases, net of income taxes, within accumulated other comprehensive income (AOCI) in shareholders’ equity and adjustments to the fair value of marketable securities that are classified as trading are recorded in earnings. The amortized cost of marketable debt securities is adjusted for amortization of premiums and discounts to maturity computed under the effective interest method. Such amortization is included in other income (expense) along with interest and realized gains and losses. The cost of securities sold is determined by the specific identification method.
We review declines in the fair value of our investments classified as available-for-sale for impairment to determine whether the decline in fair value is an other-than-temporary impairment. The resulting losses from other-than-temporary impairments of available-for-sale marketable securities are included in earnings.
Derivatives:
All derivatives are recognized at fair value. We enter into forward currency exchange contracts to mitigate the impact of currency fluctuations on transactions denominated in nonfunctional currencies, thereby limiting our risk that would otherwise result from changes in exchange rates. These nonfunctional currency exposures principally relate to intercompany receivables and payables arising from intercompany purchases of manufactured products. The periods of the forward currency exchange contracts correspond to the periods of the exposed transactions, with realized gains and losses included in the measurement and recording of transactions denominated in the nonfunctional currencies. All forward currency exchange contracts are recorded at their fair value each period, with resulting gains (losses) included in earnings.
Forward currency exchange contracts designated as cash flow hedges are designed to hedge the variability of cash flows associated with forecasted transactions denominated in a foreign currency that will take place in the future. Changes in value of derivatives designated as cash flow hedges are recorded in AOCI on the consolidated balance sheets until earnings are affected by the variability of the underlying cash flows. At that time, the applicable amount of gain or loss from the derivative instrument that is deferred in shareholders’ equity is reclassified into earnings and is included in other income (expense) or cost of goods sold in the consolidated statements of earnings, depending on the underlying transaction that is being hedged.
In December 2011 the Financial Accounting Standards Board (FASB) issued accounting guidance related to disclosures on offsetting assets and liabilities on the balance sheet. This accounting standard requires an entity to disclose both gross and net information about instruments and transactions eligible for offset in the balance sheet as well as instruments and transactions executed under a master netting or similar arrangement and enables users of financial statements to understand the effects or potential
effects of those arrangements on its financial position. This accounting guidance was effective for the Company beginning in 2013. We have elected to report our derivative instruments on a gross basis.
Property, Plant and Equipment:
Property, plant and equipment is stated at cost. Depreciation is generally computed by the straight-line method over the estimated useful lives of
3
to
30
years for buildings and improvements and
3
to
10
years for machinery and equipment.
Goodwill and Other Intangible Assets:
Goodwill represents the excess of purchase price over fair value of tangible net assets of acquired businesses at the acquisition date, after amounts allocated to other identifiable intangible assets. Factors that contribute to the recognition of goodwill include securing synergies that are specific to our business and not available to other market participants and are expected to increase revenues and profits; acquisition of a talented workforce; cost savings opportunities; the strategic benefit of expanding our presence in core and adjacent markets; and diversifying our product portfolio.
The fair values of other identifiable intangible assets are primarily determined using the income approach. Other intangible assets include, but are not limited to, developed technology, customer and distributor relationships (which reflect expected continued customer or distributor patronage) and trademarks and patents. Intangible assets with determinable useful lives are amortized on a straight-line basis over their estimated useful lives of
4
to
40
years. Certain acquired trade names are considered to have indefinite lives and are not amortized, but are assessed annually for potential impairment as described below.
In certain of our acquisitions, we acquire in-process research and development (IPRD) intangible assets. IPRD is considered to be an indefinite-lived intangible asset until such time as the research is completed (at which time it becomes a determinable-lived intangible asset) or determined to have no future use (at which time it is impaired).
Goodwill, Intangibles and Long-Lived Asset Impairment Tests:
We perform our annual impairment test for goodwill in the fourth quarter of each year. We consider qualitative indicators of the fair value of a reporting unit when it is unlikely that a reporting unit has impaired goodwill. In certain circumstances, we may also utilize a discounted cash flow analysis that requires certain assumptions and estimates be made regarding market conditions and our future profitability. Indefinite-lived intangible assets are also tested at least annually for impairment by comparing the individual carrying values to the fair value.
We review long-lived assets for indicators of impairment whenever events or changes in circumstances indicate that the carrying amount may not be recoverable. The evaluation is performed at the lowest level of identifiable cash flows. Undiscounted cash flows expected to be generated by the related assets are estimated over the asset's useful life based on updated projections. If the evaluation indicates that the carrying amount of the asset may not be recoverable, any potential impairment is measured based upon the fair value of the related asset or asset group as determined by an appropriate market appraisal or other valuation technique. Assets
|
25
|
Dollar amounts in millions except per share amounts or as otherwise specified
|
|
classified as held for sale are recorded at the lower of carrying amount or fair value less costs to sell.
Stock Options:
At
December 31, 2013
, we had long-term incentive plans that are described more fully in Note 9 to the Consolidated Financial Statements, under which stock options are granted to key employees and non-employee directors. We measure the cost of employee stock options based on the grant-date fair value and recognize that cost using the straight-line method over the period during which a recipient is required to provide services in exchange for the options, typically the vesting period. The weighted-average fair value per share of options granted during
2013
,
2012
and
2011
, estimated on the date of grant using the Black-Scholes option pricing model, was
$15.24
,
$13.36
, and
$17.14
, respectively. The fair value of options granted was estimated using the following weighted-average assumptions:
|
2013
|
2012
|
2011
|
|||||||
|
Risk-free interest rate
|
1.3
|
%
|
1.3
|
%
|
2.9
|
%
|
|||
|
Expected dividend yield
|
1.9
|
%
|
1.5
|
%
|
1.4
|
%
|
|||
|
Expected stock price volatility
|
27.9
|
%
|
27.6
|
%
|
26.9
|
%
|
|||
|
Expected option life
|
7.1 years
|
|
7.1 years
|
|
6.9 years
|
|
|||
The risk-free interest rate for periods within the expected life of options granted is based on the United States Treasury yield curve in effect at the time of grant. Expected stock price volatility is based on the historical volatility of our stock. The expected option life, representing the period of time that options granted are expected to be outstanding, is based on historical option exercise and employee termination data.
Income Taxes:
Deferred income tax assets and liabilities are determined based on differences between financial reporting and income tax bases of assets and liabilities and are measured using the enacted income tax rates in effect for the years in which the differences are expected to reverse. Deferred income tax benefits generally represent the change in net deferred income tax assets
and liabilities during the year. Other amounts result from adjustments related to acquisitions as appropriate.
We operate in multiple income tax jurisdictions both within the United States and internationally. Accordingly, management must determine the appropriate allocation of income to each of these jurisdictions based on current interpretations of complex income tax regulations. Income tax authorities in these jurisdictions regularly perform audits of our income tax filings. Income tax audits associated with the allocation of this income and other complex issues, including inventory transfer pricing and cost sharing, product royalty and foreign branch arrangements, may require an extended period of time to resolve and may result in significant income tax adjustments if changes to the income allocation are required between jurisdictions with different income tax rates.
Legal and Other Contingencies:
We are involved in various proceedings, legal actions and claims arising in the normal course of business, including proceedings related to product, labor and intellectual property and other matters that are more fully described in Note 7 to the Consolidated Financial Statements. The outcomes of these matters will generally not be known for prolonged periods of time. In certain of the legal proceedings, the claimants seek damages, as well as other compensatory and equitable relief, that could result in the payment of significant claims and settlements and/or the imposition of injunctions or other equitable relief. For legal matters for which management has sufficient information to reasonably estimate our future obligations, a liability representing management’s best estimate of the probable loss, or the minimum of the range of probable losses when a best estimate within the range is not known, for the resolution of these legal matters is recorded. The estimates are based on consultation with legal counsel, previous settlement experience and settlement strategies.
Changes in and reclassifications out of AOCI, net of tax, for the
years ended December 31, 2013
and
2012
were:
|
Marketable Securities Unrealized Gain (Loss)
|
Defined Benefit Pension Plans
|
Unrecognized Gain (Loss) on Hedge
|
Foreign Currency Translation
|
Total AOCI
|
|||||||||||||||||||||||||||||||||||
|
2013
|
2012
|
2013
|
2012
|
2013
|
2012
|
2013
|
2012
|
2013
|
2012
|
||||||||||||||||||||||||||||||
|
Beginning balance
|
$
|
4
|
|
$
|
—
|
|
$
|
(101
|
)
|
$
|
(32
|
)
|
$
|
—
|
|
$
|
—
|
|
$
|
226
|
|
$
|
176
|
|
$
|
129
|
|
$
|
144
|
|
|||||||||
|
OCI before reclassifications
|
17
|
|
40
|
|
15
|
|
(70
|
)
|
12
|
|
—
|
|
80
|
|
50
|
|
124
|
|
20
|
|
|||||||||||||||||||
|
Amounts reclassified from AOCI
|
(21
|
)
|
(36
|
)
|
5
|
|
1
|
|
(5
|
)
|
—
|
|
—
|
|
—
|
|
(21
|
)
|
(35
|
)
|
|||||||||||||||||||
|
Net current-period OCI
|
(4
|
)
|
4
|
|
20
|
|
(69
|
)
|
7
|
|
—
|
|
80
|
|
50
|
|
103
|
|
(15
|
)
|
|||||||||||||||||||
|
Ending Balance
|
$
|
—
|
|
$
|
4
|
|
$
|
(81
|
)
|
$
|
(101
|
)
|
$
|
7
|
|
$
|
—
|
|
$
|
306
|
|
$
|
226
|
|
$
|
232
|
|
$
|
129
|
|
|||||||||
|
26
|
Dollar amounts in millions except per share amounts or as otherwise specified
|
|
Items reclassified out of AOCI into earnings for the
years ended December 31, 2013
and
2012
were:
|
Year ended December 31, 2013
|
Year ended December 31, 2012
|
|||||||||||
|
Detail of AOCI Components
|
Amount Reclassified from AOCI
|
Affected Line Item in the Consolidated Statements of Earnings
|
Amount Reclassified from AOCI
|
Affected Line Item in the Consolidated Statements of Earnings
|
||||||||
|
Unrealized gains on available-for-sale marketable securities
|
$
|
(21
|
)
|
Other (income) expense
|
$
|
(37
|
)
|
Other (income) expense
|
||||
|
—
|
|
Income tax expense
|
1
|
|
Income tax expense
|
|||||||
|
$
|
(21
|
)
|
Net of tax
|
$
|
(36
|
)
|
Net of tax
|
|||||
|
Amortization of defined benefit pension items:
|
||||||||||||
|
Actuarial losses
|
$
|
7
|
|
Cost of sales
|
$
|
2
|
|
Cost of sales
|
||||
|
(2
|
)
|
Income tax benefit
|
(1
|
)
|
Income tax benefit
|
|||||||
|
$
|
5
|
|
Net of tax
|
$
|
1
|
|
Net of tax
|
|||||
|
Unrealized gain (loss) on hedge
|
$
|
(9
|
)
|
Other (income) expense
|
$
|
—
|
|
Other (income) expense
|
||||
|
4
|
|
Income tax expense
|
—
|
|
Income tax expense
|
|||||||
|
$
|
(5
|
)
|
Net of tax
|
$
|
—
|
|
Net of tax
|
|||||
Accounting guidance on fair value measurements for certain financial assets and liabilities requires that financial assets and liabilities carried at fair value be classified and disclosed in one of the following three categories:
Level 1: Quoted market prices in active markets for identical assets or liabilities.
Level 2: Observable market-based inputs or unobservable inputs that are corroborated by market data.
Level 3: Unobservable inputs reflecting the reporting entity's own assumptions or external inputs from active markets.
When applying fair value principles in the valuation of assets and liabilities, we are required to maximize the use of quoted market prices and minimize the use of unobservable inputs. We calculate the fair value of our Level 1 and Level 2 instruments based on the exchange traded price of similar or identical instruments, where available, or based on other observable inputs. There were no significant transfers into or out of Level 1 or Level 2 that occurred between
December 31, 2012
and December 31, 2013. The fair value of our Level 3 assets and liabilities are calculated as the net present value of expected cash flows based on externally provided or obtained inputs. Certain Level 3 assets may also be based on sale prices of similar assets. Our fair value calculations take into consideration our credit risk and that of our counterparties. Should a counterparty default, our maximum exposure to loss is the asset balance of the instrument. We did not change our valuation techniques used in measuring the fair value of any financial assets and liabilities during the year.
Our valuation of our assets and liabilities measured at fair value at
December 31, 2013
and
2012
:
|
Total
|
(Level 1)
|
(Level 2)
|
(Level 3)
|
||||||||||||||||||||||||
|
2013
|
2012
|
2013
|
2012
|
2013
|
2012
|
2013
|
2012
|
||||||||||||||||||||
|
Assets:
|
|||||||||||||||||||||||||||
|
Cash and cash equivalents
|
$
|
1,339
|
|
$
|
1,395
|
|
$
|
1,339
|
|
$
|
1,395
|
|
$
|
—
|
|
$
|
—
|
|
$
|
—
|
|
$
|
—
|
|
|||
|
Available-for-sale marketable securities
|
|||||||||||||||||||||||||||
|
Corporate and asset-backed debt securities
|
1,177
|
|
1,280
|
|
—
|
|
—
|
|
1,177
|
|
1,280
|
|
—
|
|
—
|
|
|||||||||||
|
Foreign government debt securities
|
845
|
|
848
|
|
—
|
|
—
|
|
845
|
|
848
|
|
—
|
|
—
|
|
|||||||||||
|
United States agency debt securities
|
211
|
|
288
|
|
—
|
|
—
|
|
211
|
|
288
|
|
—
|
|
—
|
|
|||||||||||
|
United States treasury debt securities
|
350
|
|
343
|
|
—
|
|
—
|
|
350
|
|
343
|
|
—
|
|
—
|
|
|||||||||||
|
Certificates of deposit
|
53
|
|
114
|
|
—
|
|
—
|
|
53
|
|
114
|
|
—
|
|
—
|
|
|||||||||||
|
Other
|
5
|
|
17
|
|
—
|
|
—
|
|
5
|
|
17
|
|
—
|
|
—
|
|
|||||||||||
|
Total available-for-sale marketable securities
|
2,641
|
|
2,890
|
|
—
|
|
—
|
|
2,641
|
|
2,890
|
|
—
|
|
—
|
|
|||||||||||
|
Trading marketable securities
|
72
|
|
57
|
|
72
|
|
57
|
|
—
|
|
—
|
|
—
|
|
—
|
|
|||||||||||
|
Foreign currency exchange forward contracts
|
25
|
|
3
|
|
—
|
|
—
|
|
25
|
|
3
|
|
—
|
|
—
|
|
|||||||||||
|
$
|
4,077
|
|
$
|
4,345
|
|
$
|
1,411
|
|
$
|
1,452
|
|
$
|
2,666
|
|
$
|
2,893
|
|
$
|
—
|
|
$
|
—
|
|
||||
|
Liabilities:
|
|||||||||||||||||||||||||||
|
Deferred compensation arrangements
|
$
|
72
|
|
$
|
57
|
|
$
|
72
|
|
$
|
57
|
|
$
|
—
|
|
$
|
—
|
|
$
|
—
|
|
$
|
—
|
|
|||
|
Contingent consideration
|
59
|
|
103
|
|
—
|
|
—
|
|
—
|
|
—
|
|
59
|
|
103
|
|
|||||||||||
|
Foreign currency exchange forward contracts
|
2
|
|
1
|
|
—
|
|
—
|
|
2
|
|
1
|
|
—
|
|
—
|
|
|||||||||||
|
$
|
133
|
|
$
|
161
|
|
$
|
72
|
|
$
|
57
|
|
$
|
2
|
|
$
|
1
|
|
$
|
59
|
|
$
|
103
|
|
||||
|
27
|
Dollar amounts in millions except per share amounts or as otherwise specified
|
|
The following is a rollforward of our assets and liabilities measured at fair value using unobservable inputs (Level 3):
|
Total
|
Corporate and Asset-Backed Debt Securities
|
Contingent Consideration
|
||||||||||||||||||
|
2013
|
2012
|
2013
|
2012
|
2013
|
2012
|
|||||||||||||||
|
Balance at the beginning of the period
|
$
|
(103
|
)
|
$
|
(114
|
)
|
$
|
—
|
|
$
|
1
|
|
$
|
(103
|
)
|
$
|
(115
|
)
|
||
|
Transfers into Level 3
|
—
|
|
—
|
|
—
|
|
—
|
|
—
|
|
—
|
|
||||||||
|
Transfers out of Level 3
|
—
|
|
—
|
|
—
|
|
—
|
|
—
|
|
—
|
|
||||||||
|
Gains or (losses) included in earnings
|
5
|
|
6
|
|
—
|
|
—
|
|
5
|
|
6
|
|
||||||||
|
Sales
|
—
|
|
(1
|
)
|
—
|
|
(1
|
)
|
—
|
|
—
|
|
||||||||
|
Settlements
|
39
|
|
39
|
|
—
|
|
—
|
|
39
|
|
39
|
|
||||||||
|
Other
|
—
|
|
(33
|
)
|
—
|
|
—
|
|
—
|
|
(33
|
)
|
||||||||
|
Balance at the end of the period
|
$
|
(59
|
)
|
$
|
(103
|
)
|
$
|
—
|
|
$
|
—
|
|
$
|
(59
|
)
|
$
|
(103
|
)
|
||
The estimated fair value of the liability for contingent consideration represents milestone payments for acquisitions. The fair value of the liability was estimated using a discounted cash flow technique. Significant inputs to this technique included our probability assessments of occurrence of triggering events, appropriately discounted considering the uncertainties associated with the obligation. We remeasure this liability each reporting period and record the changes in the fair value in general and administrative expense (for probability of occurrence) and other income (expense) (for changes in time value of money) in earnings.
The following presents quantitative information about the inputs and valuation methodologies we use for material fair value measurements classified in Level 3:
|
Probability Range (Weighted Average)
|
||||||
|
Fair Value
|
Valuation Technique
|
Unobservable Input
|
Minimum
|
Maximum
|
Weighted Average
|
|
|
Contingent consideration
|
$59
|
Discounted cash flow
|
Probability of occurrence
|
85
|
100
|
95
|
The following is a summary of our marketable securities:
|
Amortized Cost
|
Gross Unrealized Gains
|
Gross Unrealized Losses
|
Estimated Fair Value
|
||||||||||||||||||||||||
|
2013
|
2012
|
2013
|
2012
|
2013
|
2012
|
2013
|
2012
|
||||||||||||||||||||
|
Available-for-sale marketable securities:
|
|||||||||||||||||||||||||||
|
Corporate and asset-backed debt securities
|
$
|
1,177
|
|
$
|
1,277
|
|
$
|
1
|
|
$
|
4
|
|
$
|
(1
|
)
|
$
|
(1
|
)
|
$
|
1,177
|
|
$
|
1,280
|
|
|||
|
Foreign government debt securities
|
846
|
|
846
|
|
—
|
|
2
|
|
(1
|
)
|
—
|
|
845
|
|
848
|
|
|||||||||||
|
United States agency debt securities
|
211
|
|
288
|
|
—
|
|
—
|
|
—
|
|
—
|
|
211
|
|
288
|
|
|||||||||||
|
United States treasury debt securities
|
350
|
|
343
|
|
—
|
|
—
|
|
—
|
|
—
|
|
350
|
|
343
|
|
|||||||||||
|
Certificates of deposit
|
53
|
|
114
|
|
—
|
|
—
|
|
—
|
|
—
|
|
53
|
|
114
|
|
|||||||||||
|
Other
|
5
|
|
17
|
|
—
|
|
—
|
|
—
|
|
—
|
|
5
|
|
17
|
|
|||||||||||
|
Total available-for-sale marketable securities
|
$
|
2,642
|
|
$
|
2,885
|
|
$
|
1
|
|
$
|
6
|
|
$
|
(2
|
)
|
$
|
(1
|
)
|
2,641
|
|
2,890
|
|
|||||
|
Trading marketable securities
|
72
|
|
57
|
|
|||||||||||||||||||||||
|
Total marketable securities
|
$
|
2,713
|
|
$
|
2,947
|
|
|||||||||||||||||||||
|
Reported as:
|
|||||||||||||||||||||||||||
|
Current assets-marketable securities
|
$
|
2,641
|
|
$
|
2,890
|
|
|||||||||||||||||||||
|
Noncurrent assets-other
|
72
|
|
57
|
|
|||||||||||||||||||||||
|
$
|
2,713
|
|
$
|
2,947
|
|
||||||||||||||||||||||
The unrealized losses on our available-for-sale marketable securities were primarily caused by increases in yields as a result of changing conditions in the global credit markets. While some of these investments have been downgraded by rating agencies since their initial purchase, less than
1%
of our investments in available-for-sale marketable securities had a credit quality rating of less than single A (per Standard & Poors and Fitch) and A2 (per Moody's). Because we do not intend to sell the investments and it is not more likely than not that we will be required to sell the investments before recovery of their amortized cost basis, which may be maturity, we do not consider these investments to be other-than-temporarily impaired at
December 31, 2013
.
The cost and estimated fair value of available-for-sale marketable securities at
December 31, 2013
by contractual maturity are:
|
Cost
|
Estimated
Fair Value
|
|||||||
|
Due in one year or less
|
$
|
425
|
|
$
|
424
|
|
||
|
Due after one year through three years
|
1,989
|
|
1,989
|
|
||||
|
Due after three years
|
228
|
|
228
|
|
||||
|
$
|
2,642
|
|
$
|
2,641
|
|
|||
|
28
|
Dollar amounts in millions except per share amounts or as otherwise specified
|
|
The gross unrealized losses and fair value of our investments with unrealized losses that are not deemed to be other-than-temporarily impaired, aggregated by investment category and length of time that the individual securities have been in a continuous unrealized loss position at
December 31, 2013
, are as follows:
|
Corporate and Asset-Backed Debt Securities
|
Foreign Government Debt Securities
|
United States Agency Debt Securities
|
Other
|
Total
|
||||||||||||||||||||||||||||||||||||||||||||||
|
Less Than 12 Months
|
Greater Than 12 Months
|
Total
|
Less Than 12 Months
|
Greater Than 12 Months
|
Total
|
Less Than 12 Months
|
Greater Than 12 Months
|
Total
|
Less Than 12 Months
|
Greater Than 12 Months
|
Total
|
Less Than 12 Months
|
Greater Than 12 Months
|
Total
|
||||||||||||||||||||||||||||||||||||
|
Number of investments
|
2013
|
256
|
|
6
|
|
262
|
|
102
|
|
9
|
|
111
|
|
40
|
|
1
|
|
41
|
|
163
|
|
21
|
|
184
|
|
561
|
|
37
|
|
598
|
|
|||||||||||||||||||
|
2012
|
216
|
|
—
|
|
216
|
|
67
|
|
—
|
|
67
|
|
27
|
|
—
|
|
27
|
|
15
|
|
—
|
|
15
|
|
325
|
|
—
|
|
325
|
|
||||||||||||||||||||
|
Fair value
|
2013
|
$
|
478
|
|
$
|
22
|
|
$
|
500
|
|
$
|
538
|
|
$
|
77
|
|
$
|
615
|
|
$
|
164
|
|
$
|
9
|
|
$
|
173
|
|
$
|
25
|
|
$
|
2
|
|
$
|
27
|
|
$
|
1,205
|
|
$
|
110
|
|
$
|
1,315
|
|
||||
|
2012
|
425
|
|
—
|
|
425
|
|
324
|
|
—
|
|
324
|
|
87
|
|
—
|
|
87
|
|
27
|
|
—
|
|
27
|
|
863
|
|
—
|
|
863
|
|
||||||||||||||||||||
|
Unrealized losses
|
2013
|
1
|
|
—
|
|
1
|
|
1
|
|
—
|
|
1
|
|
—
|
|
—
|
|
—
|
|
—
|
|
—
|
|
—
|
|
2
|
|
—
|
|
2
|
|
|||||||||||||||||||
|
2012
|
1
|
|
—
|
|
1
|
|
—
|
|
—
|
|
—
|
|
—
|
|
—
|
|
—
|
|
—
|
|
—
|
|
—
|
|
1
|
|
—
|
|
1
|
|
||||||||||||||||||||
Interest and marketable securities income totaled
$24
,
$47
and
$34
in
2013
,
2012
, and
2011
, respectively, and is included in other income (expense).
Our international activities expose us to the risks related to the effects of changes in foreign currency exchange rates. We use operational and economic hedges as well as foreign currency exchange forward contracts to manage the impact of currency exchange on earnings and cash flow. At the inception of the forward contract, the derivative is designated as either a freestanding derivative or a cash flow hedge. We do not enter into currency exchange derivative instruments for speculative purposes.
The gross notional amount of all currency exchange rate derivative instruments outstanding were $
2,344
and $
1,352
at
December 31, 2013
and
2012
, respectively. The aggregate currency exchange rate gains (losses) were
$3
,
($7)
and
($3)
for the years ended
December 31, 2013
,
2012
and
2011
. These gains (losses) represent the net impact to the consolidated statement of earnings for the derivative instruments discussed below.
We are exposed to credit loss in the event of nonperformance by counterparties on our outstanding forward currency exchange contracts but do not anticipate nonperformance by any of our counterparties. Should a counterparty default, our maximum exposure to loss is the asset balance of the instrument. The maximum term of the forward currency exchange contracts at
December 31, 2013
and
2012
were
546
days and
183
days.
Derivative Instruments Not Designated as Hedges
Derivative forward contracts are used to offset our exposure to the change in value of specific foreign currency denominated assets and liabilities. These derivatives are not designated as hedges, and therefore, changes in the value of these forward contracts are recognized in earnings, thereby offsetting the current earnings effect of the related changes in value of foreign currency denominated assets and liabilities. The estimated fair value of our forward currency exchange contracts represents the measurement of the contracts at month-end spot rates as adjusted by current forward points.
The gross notional amount of all non-designated currency exchange rate derivative instruments outstanding were $
2,000
and $
1,352
at
December 31, 2013
and
2012
, respectively. For the years ended
December 31, 2013
,
2012
and
2011
, recognized foreign currency transaction gains (losses) included in other income (expense) in earnings were
($6)
,
($7)
, and
($3)
, respectively.
Derivative Instruments Designated as Hedges
In 2013 we implemented a layered hedging program to hedge select anticipated foreign currency cash flows to reduce volatility in both cash flows and reported earnings. These foreign exchange contracts generally have maturities up to eighteen months. For derivative instruments that are designated and qualify as a cash flow hedge, the effective portion of the gain or loss on the derivative is reported as a component of AOCI and reclassified into other income (expense) or cost of sales within earnings in the same period during which the hedged transaction affects earnings. In 2013 a gain of
$9
was reclassified from AOCI to earnings relating to the discontinuance of certain cash flow hedges, as we now consider it probable that the original forecasted transactions will not occur. The gross notional amount of designated currency exchange rate derivative instruments outstanding were
$344
at
December 31, 2013
. Cash flows associated with these instruments are included in cash from operations in the same category as the cash flows from the items being hedged.
The fair value amounts are presented on a gross basis in the balance sheet and are segregated between derivatives that are designated and qualify as hedging instruments and those that are not for the years ended
December 31, 2013
and
2012
, as follows:
|
29
|
Dollar amounts in millions except per share amounts or as otherwise specified
|
|
|
December 31, 2013
|
December 31, 2012
|
||||||||||||||||||||||||||||||
|
Prepaid expenses and other current assets
|
Other Assets- Noncurrent
|
Accrued expenses and other current liabilities
|
Other Liabilities – Noncurrent
|
Prepaid expenses and other current assets
|
Other Assets- Noncurrent
|
Accrued expenses and other current liabilities
|
Other Liabilities – Noncurrent
|
||||||||||||||||||||||||
|
Derivatives designated as hedging instruments:
|
|||||||||||||||||||||||||||||||
|
Foreign exchange forward contracts
|
$
|
11
|
|
$
|
1
|
|
$
|
1
|
|
$
|
—
|
|
$
|
—
|
|
$
|
—
|
|
$
|
—
|
|
$
|
—
|
|
|||||||
|
Derivatives not designated as hedging instruments:
|
|||||||||||||||||||||||||||||||
|
Foreign exchange forward contracts
|
10
|
|
3
|
|
1
|
|
—
|
|
3
|
|
—
|
|
1
|
|
—
|
|
|||||||||||||||
|
Total derivative instruments
|
$
|
21
|
|
$
|
4
|
|
$
|
2
|
|
$
|
—
|
|
$
|
3
|
|
$
|
—
|
|
$
|
1
|
|
$
|
—
|
|
|||||||
The amount and location of gains in the consolidated statements of earnings and amounts recorded in AOCI related to the derivative instruments designated as hedges for the year ended
December 31, 2013
were:
|
Amount of gain reported as a component of AOCI on derivatives, net of tax (effective portion)
|
Amount of pre-tax gain reclassified from AOCI into income (effective portion)
|
Amount of pre-tax gain recognized in other income (expense) (ineffective portion and amount excluded from effectiveness testing)
|
|||||||||
|
Foreign exchange contracts
|
$
|
8
|
|
$
|
—
|
|
$
|
9
|
|
||
At December 31, 2013, deferred pretax gains on derivatives designated as hedges of
$12
, which are recorded in AOCI, are expected to be reclassified to current earnings during the next twelve months. This reclassification is primarily due to the sale of inventory that includes previously hedged purchases.
In December 2013 we announced our intent to acquire Patient Safety Technologies, Inc. (PST) for an aggregate purchase price of approximately
$120
. PST conducts its business through its wholly owned subsidiary, SurgiCount Medical, Inc. PST’s proprietary Safety-Sponge
®
System and SurgiCount 360™ compliance software help prevent Retained Foreign Objects in the operating room. The transaction is subject to customary closing conditions and is expected to close in the first quarter of 2014. The acquisition of PST is expected to enhance our product offerings within our MedSurg segment.
In December 2013 we acquired MAKO Surgical Corp. (MAKO) for an aggregate purchase price of approximately
$1,679
. The acquisition of MAKO, combined with our strong history in joint reconstruction, capital equipment (operating room integration and surgical navigation) and surgical instruments, will help further advance the growth of robotic assisted surgery. Our combined expertise offers the potential to simplify joint reconstruction procedures, reduce variability and enhance the surgeon and patient experience. The acquisition of MAKO enhances our product offerings within our Reconstructive segment. Intangible assets acquired with MAKO will be amortized over a weighted-average life of 9 years, except for the trade name that is deemed to have an indefinite life. IPRD is considered to be an indefinite-lived intangible asset until such time as the research is completed (at which time it becomes a determinable-lived intangible asset) or determined to have no future use (at which time it is impaired).
In March 2013 we acquired Trauson Holdings Company Limited (Trauson) for a total consideration of
$751
. The acquisition of Trauson enhances our product offerings, primarily within our Reconstructive segment, broadens our presence in China and enables us to expand into the fast growing value segment of the emerging markets. Intangible assets acquired with Trauson will be amortized over a weighted-average life of
15 years
, except for the trade name that is deemed to have an indefinite life. IPRD is considered to be an indefinite-lived intangible asset until such time as the research is completed (at which time it becomes a determinable-lived intangible asset) or determined to have no future use (at which time it is impaired).
The purchase price allocations for the MAKO and Trauson acquisitions were based upon preliminary valuations, and our estimates and assumptions are subject to change within the measurement period as the valuations are finalized. Management is currently in the process of verifying data and finalizing information related to the MAKO valuation and recording of identifiable intangible assets, deferred income taxes and the corresponding effect on the value of goodwill. For the Trauson acquisition, the measurement period has been completed; revisions to our original estimates include an increase to customer relationship intangible assets of
$40
, an increase to liabilities of
$14
, and a reduction to goodwill of
$31
.
In November 2012 we acquired Surpass Medical, Ltd. (Surpass) for
$100
, with an additional
$35
to be paid upon the completion of certain milestones. Surpass develops and commercializes next-generation flow diversion stent technology to treat brain aneurysms using
|
30
|
Dollar amounts in millions except per share amounts or as otherwise specified
|
|
a unique mesh design and delivery system. The acquisition of Surpass enhances our product offerings within our Neurotechnology and Spine segment. Intangible assets acquired with Surpass will be amortized over a weighted-average life of
15 years
. IPRD is considered to be an indefinite-lived intangible asset until such time as the research is completed (at which time it becomes a determinable-lived intangible asset) or determined to have no future use (at which time it is impaired). The measurement period for Surpass was completed in the fourth quarter of 2013; revisions to our original estimates include a reduction to developed technology of
$18
, a reduction to IPRD of
$26
, and an increase to goodwill of
$27
.
The effects of all the acquisitions described above are included in our Consolidated Financial Statements prospectively from the date of acquisition. Pro forma consolidated results of operations for the years ended
December 31, 2013
and
2012
would not differ significantly as a result of these acquisitions.
The allocation of the purchase price to the acquired net assets of the acquisitions described above are as follows:
|
2013
|
2013
|
2012
|
||||||||||
|
MAKO
|
Trauson
|
Surpass
|
||||||||||
|
Purchase price paid
|
$
|
1,679
|
|
$
|
751
|
|
$
|
100
|
|
|||
|
Contingent consideration
|
—
|
|
—
|
|
33
|
|
||||||
|
Total purchase consideration
|
$
|
1,679
|
|
$
|
751
|
|
$
|
133
|
|
|||
|
Tangible assets acquired:
|
||||||||||||
|
Inventory
|
50
|
|
43
|
|
2
|
|
||||||
|
Other assets
|
174
|
|
163
|
|
1
|
|
||||||
|
Liabilities
|
(277
|
)
|
(87
|
)
|
(28
|
)
|
||||||
|
Identifiable intangible assets:
|
||||||||||||
|
Customer relationship
|
91
|
|
112
|
|
—
|
|
||||||
|
Trade name
|
24
|
|
34
|
|
—
|
|
||||||
|
Developed technology
|
231
|
|
31
|
|
45
|
|
||||||
|
In-process research & development
|
169
|
|
5
|
|
19
|
|
||||||
|
Goodwill
|
1,217
|
|
450
|
|
94
|
|
||||||
|
$
|
1,679
|
|
$
|
751
|
|
$
|
133
|
|
||||
We completed our annual impairment tests of goodwill in 2013 and 2012 and concluded in each year that no impairments exist. The changes in the net carrying value of goodwill by segment are as follows:
|
Reconstructive
|
MedSurg
|
Neurotechnology and Spine
|
Total
|
|||||||||||||
|
Balance as of January 1, 2012
|
$
|
685
|
|
$
|
510
|
|
$
|
877
|
|
$
|
2,072
|
|
||||
|
Goodwill acquired
|
8
|
|
—
|
|
67
|
|
75
|
|
||||||||
|
Foreign currency translation effects and other
|
(2
|
)
|
3
|
|
(6
|
)
|
(5
|
)
|
||||||||
|
Balance as of December 31, 2012
|
691
|
|
513
|
|
938
|
|
2,142
|
|
||||||||
|
Goodwill acquired
|
1,559
|
|
2
|
|
108
|
|
1,669
|
|
||||||||
|
Transfers
|
(17
|
)
|
(9
|
)
|
26
|
|
—
|
|
||||||||
|
Foreign currency translation effects and other
|
(6
|
)
|
—
|
|
39
|
|
33
|
|
||||||||
|
Balance as of December 31, 2013
|
$
|
2,227
|
|
$
|
506
|
|
$
|
1,111
|
|
$
|
3,844
|
|
||||
Measurement period adjustments that reflect changes to goodwill for acquisitions completed in a previous year are included in "Foreign currency translation effects and other."
The following is a summary of our other intangible assets:
|
Gross
Carrying Amount |
Less
Accumulated Amortization |
Net
Carrying Amount |
|||||||||||||||||||
|
2013
|
2012
|
2013
|
2012
|
2013
|
2012
|
||||||||||||||||
|
Intangible assets:
|
|||||||||||||||||||||
|
Developed technologies
|
$
|
1,450
|
|
1,069
|
|
$
|
380
|
|
282
|
|
$
|
1,070
|
|
787
|
|
||||||
|
Customer relationships
|
677
|
|
563
|
|
189
|
|
147
|
|
488
|
|
416
|
|
|||||||||
|
Patents
|
238
|
|
230
|
|
190
|
|
182
|
|
48
|
|
48
|
|
|||||||||
|
Trademarks
|
127
|
|
69
|
|
34
|
|
31
|
|
93
|
|
38
|
|
|||||||||
|
In-process research and development
|
223
|
|
86
|
|
—
|
|
—
|
|
223
|
|
86
|
|
|||||||||
|
Other
|
118
|
|
105
|
|
51
|
|
56
|
|
67
|
|
49
|
|
|||||||||
|
$
|
2,833
|
|
$
|
2,122
|
|
$
|
844
|
|
$
|
698
|
|
$
|
1,989
|
|
$
|
1,424
|
|
||||
|
31
|
Dollar amounts in millions except per share amounts or as otherwise specified
|
|
The estimated amortization expense for each of the next five years is as follows:
|
2014
|
2015
|
2016
|
2017
|
2018
|
|||||||||||
|
Estimated amortization expense
|
$
|
167
|
|
$
|
163
|
|
$
|
162
|
|
$
|
158
|
|
$
|
156
|
|
We are involved in various ongoing proceedings, legal actions and claims arising in the normal course of business, including proceedings related to product, labor and intellectual property, and other matters. The outcomes of these matters will generally not be known for prolonged periods of time. In certain of the legal proceedings, the claimants seek damages, as well as other compensatory and equitable relief, that could result in the payment of significant claims and settlements and/or the imposition of injunctions or other equitable relief. For legal matters for which management has sufficient information to reasonably estimate our future obligations, a liability representing management's best estimate of the probable loss, or the minimum of the range of probable losses when a best estimate within the range is not known, for the resolution of these legal matters is recorded. The estimates are based on consultation with legal counsel, previous settlement experience and settlement strategies. If actual outcomes are less favorable than those projected by management, additional expense may be incurred, which could unfavorably affect future operating results
. The Company is currently self-insured for product liability-related claims and expenses. T
he ultimate cost to us with respect to product liability claims could be materially different than the amount of the current estimates and accruals and could have a material adverse effect on our financial position, results of operations and cash flows.
In 2010 we received a subpoena from the United States Department of Justice (DOJ) related to the sales and marketing of the OtisKnee device. The subpoena concerns allegations of violations of federal laws related to sales of a device not cleared by the United States Food and Drug Administration (FDA). We continue to discuss the settlement of this matter with the DOJ, but there can be no assurance that we will reach a consensual resolution rather than seeking a resolution through the courts. We have recorded charges totaling
$80
related to the above matter, including
$47
in the year ended December 31, 2013.
In June 2012 we voluntarily recalled our Rejuvenate and ABG II modular-neck hip stems and terminated global distribution of these hip products. We notified healthcare professionals and regulatory bodies of this recall, which was taken due to potential risks associated with fretting and/or corrosion that may lead to adverse local tissue reactions. Product liability lawsuits relating to this voluntary recall have been filed against us. As previously announced, we intend to reimburse implanted patients for reasonable and customary costs of testing and treatment services, including any necessary revision surgeries. We continue to work with the medical community to evaluate the data and further understand this matter and the associated costs. The ultimate total cost with respect to this matter will depend on many factors that are difficult to predict with the information received to date and may vary materially based on the number of and actual costs of patients seeking testing and treatment services, the number of and actual costs of patients requiring revision surgeries, the number of
and actual costs to settle lawsuits filed against us, and the amount of third-party insurance recoveries. Based on the information that has been received, the actuarially determined range of probable loss to resolve this matter is estimated to be approximately
$790
to
$1,235
, before third-party insurance recoveries. In the year ended December 31, 2013, we recorded charges to earnings of
$600
representing the excess of the
$790
minimum of the range over the previously recorded reserves. No contingent gain for third-party insurance recoveries was recorded as of December 31, 2013. As noted above, the final outcome of this matter is dependent on many variables that are difficult to predict. The ultimate cost to entirely resolve this matter may be materially different than the amount of the current estimate and accruals and could have a material adverse effect on our financial position, results of operations and cash flows.
In 2010 we filed a lawsuit in federal court against Zimmer Holdings, Inc. (Zimmer), alleging that a Zimmer product infringed three of our patents. In rulings issued in August and September 2013, the trial judge upheld the February 2013 jury verdict in our favor, issued a permanent injunction barring Zimmer from making or selling infringing products, and ordered Zimmer to pay us at least
$228
. Zimmer is appealing this ruling and the ultimate resolution of this matter may differ materially. Accordingly, we have not recorded a contingent gain related to this matter.
For each of the following legal matters the final outcome is dependent on many variables and cannot be predicted. Accordingly, it is not possible at this time for us to estimate any material loss or range of losses. However, the ultimate cost to resolve these matters could have a material adverse effect on our financial position, results of operations and cash flows.
In April 2011 lawsuits brought by Hill-Rom Company, Inc. and affiliated entities (Hill-Rom) against us were filed in the United States District Court for the Western District of Wisconsin and the United States District Court for the Southern District of Indiana. The Wisconsin lawsuit was subsequently transferred to the United States District Court in Indiana. The suits allege infringement under United States patent laws with respect to certain patient handling equipment we manufactured and sold and seek damages and permanent injunctions. We have entered into an agreement settling the first lawsuit, with terms as previously disclosed. The second lawsuit involves
nine
patents related to electrical network communications for hospital beds. The case has been stayed with respect to
six
of the patents, which are currently under reexamination by the United States Patent Office. With respect to the
three
remaining patents, Hill-Rom is appealing the trial court's grant of summary judgment in our favor and the ultimate resolution of this particular part of the suit may differ. The ultimate resolution of the entire second suit may have no relation to the resolution of the first suit and cannot be predicted; however, the ultimate result could have a material adverse effect on our financial position, results of operations and cash flows.
|
32
|
Dollar amounts in millions except per share amounts or as otherwise specified
|
|
In 2010 we received a subpoena from the DOJ related to sales, marketing and regulatory matters related to the Stryker PainPump. We have received requests for certain documents in connection with this investigation. The investigation is ongoing and we are fully cooperating with the DOJ regarding this matter.
Purchase Commitments and Operating Leases
We have purchase commitments for materials, supplies, services and property, plant and equipment as part of the normal course of business. In addition, we lease various manufacturing, warehousing and distribution facilities, administrative and sales offices as well as equipment under operating leases. Future commitments under these obligations and minimum lease commitments under these leases are:
|
2014
|
2015
|
2016
|
2017
|
2018
|
Thereafter
|
|||||||||||||
|
Purchase obligations
|
$
|
479
|
|
$
|
136
|
|
$
|
11
|
|
$
|
6
|
|
$
|
33
|
|
$
|
3
|
|
|
Minimum lease payments
|
51
|
|
53
|
|
33
|
|
26
|
|
21
|
|
38
|
|
||||||
Rent expense totaled
$100
,
$98
and
$96
in
2013
,
2012
and
2011
, respectively.
Our debt is summarized as follows:
|
December 31
|
|||||||||||
|
2013
|
2012
|
||||||||||
|
Senior unsecured notes:
|
|||||||||||
|
Rate
|
Due
|
||||||||||
|
3.00
|
%
|
January 15, 2015
|
$
|
500
|
|
$
|
500
|
|
|||
|
4.38
|
%
|
January 15, 2020
|
498
|
|
497
|
|
|||||
|
2.00
|
%
|
September 30, 2016
|
749
|
|
749
|
|
|||||
|
1.30
|
%
|
April 1, 2018
|
598
|
|
—
|
|
|||||
|
4.10
|
%
|
April 1, 2043
|
394
|
|
—
|
|
|||||
|
Other
|
25
|
|
16
|
|
|||||||
|
Total debt
|
2,764
|
|
1,762
|
|
|||||||
|
Less current maturities
|
(25
|
)
|
(16
|
)
|
|||||||
|
Total Long-term Debt
|
$
|
2,739
|
|
$
|
1,746
|
|
|||||
In March 2013 we completed a public offering of
$600
in
1.30%
Notes due April 1, 2018, net of an offering discount of
$3
(2018 Notes), and $
400
in
4.10%
Notes due
April 1, 2043
, net of an offering discount of
$6
(2043 Notes and, together with the 2018 Notes, the Notes). Interest on the Notes is payable on April 1 and October 1 of each year, commencing on October 1, 2013. Unless previously redeemed, the 2018 Notes will mature on April 1, 2018 and the 2043 Notes will mature on April 1, 2043. We intend to use the net proceeds from the Notes for working capital and other general corporate purposes, including acquisitions, stock repurchases and other business opportunities.
In
August 2012
we refinanced our credit facility with a new
$1,000
Unsecured Revolving Credit Facility due
August 2017
(2012 Facility). The 2012 Facility replaced the previously outstanding
$1,000
Unsecured Credit Facility due in
August 2013
. The 2012 Facility includes an increase option permitting us to increase the size of the facility up to an additional
$500
, a
$500
multicurrency sublimit (with no sublimit for euro borrowings) and a
$100
letter of credit sublimit. The 2012 Facility has an annual facility fee ranging from
5 to 22.5
basis points and
bears interest at LIBOR, as defined in the 2012 Facility agreement, plus an applicable margin
ranging from 57.5 to 127.5 basis points
, both of which are dependent on our credit ratings. The 2012 Facility requires us to comply with certain financial and other covenants. We were in compliance with all covenants at
December 31, 2013
.
In September 2011 we sold
$750
of unsecured notes due September 2016 (the 2016 Notes). The 2016 Notes bear interest at
2.00%
per year and, unless previously redeemed, will mature on
September 30, 2016
. We received net proceeds of
$749
, net of an offering discount of
$1
.
On July 15, 2011 we entered into a commercial paper program (the Program) under which we may issue, on a private placement basis, unsecured commercial paper notes (the Notes) up to a maximum aggregate amount outstanding at any time of
$500
. We may issue the Notes under the Program from time to time. The net proceeds from the sale of the Notes will be used for general corporate purposes. The Program contains customary representations, warranties, covenants and indemnification provisions. The maturities of the Notes will vary but may not exceed
397
days, and the Notes must be in a minimum denomination of
$0.25
. The Notes will be sold at a discount from par or, alternatively, will be sold at par and bear interest at either a fixed or floating rate that will vary based upon market conditions at the time of the issuance of the Notes. The interest on a floating rate Note may be (a) the CD rate, (b) the commercial paper rate, (c) the federal funds rate, (d) the LIBOR rate, (e) the prime rate, (f) the treasury rate or (g) such other base rate as may be specified at the time of issuance. The Notes will not be redeemable prior to maturity or be subject to voluntary prepayment. As of December 31, 2013, no Notes had been issued under the Program.
In addition, we have lines of credit, issued by various financial institutions, available to fund our day-to-day operating needs. At
December 31, 2013
, we had
$1,052
of borrowing capacity available under all of our existing credit facilities.
The weighted-average interest rate, excluding required fees, for all borrowings was
2.9%
at
December 31, 2013
. At
December 31, 2013
, total unamortized debt issuance costs incurred in connection with our unsecured notes were
$16
. The fair value of debt (including current maturities) at
December 31, 2013
and
December 31, 2012
was
$2,790
and
$1,866
, respectively, based on the quoted interest rates for similar types and amounts of borrowing agreements.
Interest expense, including required fees incurred on outstanding debt and credit facilities, which is included in other income (expense), totaled
$83
,
$63
, and
$56
in
2013
,
2012
and
2011
, respectively. Cash interest paid on debt, including required fees, was
$88
,
$55
, and
$39
in
2013
,
2012
and
2011
, respectively.
|
33
|
Dollar amounts in millions except per share amounts or as otherwise specified
|
|
In February 2013 we declared a quarterly dividend of
$0.265
per share, payable April 30, 2013 to shareholders of record at the close of business on March 28, 2013. In April 2013 we declared a quarterly dividend of
$0.265
per share, payable July 31, 2013 to shareholders of record at the close of business on June 28, 2013. In July 2013 we declared a quarterly dividend of
$0.265
per share, payable October 31, 2013 to shareholders of record at the close of business on September 30, 2013. In December 2013 we declared a quarterly dividend of
$0.305
per share, payable January 31, 2014 to shareholders of record at the close of business on December 31, 2013.
In December of
2012
,
2011
and 2010, we announced that our Board of Directors had authorized us to purchase up to
$405
,
$500
and
$500
, respectively, of our common stock (the 2012, 2011 and 2010 Repurchase Programs, respectively). The manner, timing and amount of purchases is determined by management based on an evaluation of market conditions, stock price and other factors and is subject to regulatory considerations. Purchases are to be made from time to time in the open market, in privately negotiated transactions or otherwise.
During the year ended
December 31, 2013
we repurchased
1.4 million
shares at a cost of
$95
under the 2010 Repurchase Program and
3.4 million
shares at a cost of
$222
under the 2011 Repurchase Program. As of
December 31, 2013
, the 2010 Repurchase Program was complete and the maximum dollar value of shares that may yet be purchased under the 2011 Repurchase Program was
$278
. We had made no repurchases pursuant to the 2012 Repurchase Program at
December 31, 2013
. Shares repurchased under the share repurchase programs are available for general corporate purposes, including offsetting dilution associated with stock option and other equity-based employee benefit plans. At
December 31, 2013
, the maximum dollar value of shares that may be purchased under the authorized Repurchase Programs was
$683
.
Shares reserved for future compensation grants of Stryker common stock were
23 million
and
29 million
at
December 31, 2013
and
2012
.
We have
0.5 million
authorized shares of
$1
par value preferred stock, none of which is outstanding.
Stock Options
We have long-term incentive plans from which we grant stock options to certain key employees and non-employee directors at an exercise price not less than the fair market value of the underlying common stock, which is the closing quoted price of our common stock on the day prior to the date of grant. The options are granted for periods of up to
10
years and become exercisable in varying installments.
A summary of 2013 stock option activity is as follows:
|
Shares (in millions)
|
Weighted
Average Exercise Price |
Weighted-Average
Remaining Term (in years) |
Aggregate
Intrinsic Value |
||||||||||
|
Outstanding January 1
|
19.7
|
|
$
|
52.23
|
|
||||||||
|
Granted
|
3.1
|
|
64.11
|
|
|||||||||
|
Exercised
|
(5.0
|
)
|
47.96
|
|
|||||||||
|
Canceled
|
(0.8
|
)
|
57.75
|
|
|||||||||
|
Outstanding December 31
|
17.0
|
|
$
|
55.35
|
|
5.5
|
$
|
337.4
|
|
||||
|
Exercisable December 31
|
10.1
|
|
$
|
53.77
|
|
3.9
|
$
|
216.7
|
|
||||
|
Options expected to vest
|
6.5
|
|
$
|
57.47
|
|
7.9
|
$
|
114.0
|
|
||||
The aggregate intrinsic value, which represents the cumulative difference between the fair market value of the underlying common stock and the option exercise prices, of options exercised during the years ended
December 31, 2013
,
2012
and
2011
was
$97
,
$52
and
$69
, respectively. Exercise prices for options outstanding at
December 31, 2013
ranged from
$37.86
to
$67.80
. At
December 31, 2013
, there was
$65
of unrecognized compensation cost related to nonvested stock options granted under the long-term incentive plans; that cost is expected to be recognized over the weighted-average period of
1.6
years.
Restricted Stock Units (RSUs) and Performance Stock Units (PSUs)
We grant RSUs to key employees and non-employee directors and PSUs to certain key employees under our long-term incentive plans. The fair value of RSUs is determined based on the number of shares granted and the closing quoted price of our common stock on the day prior to the date of grant, adjusted for the fact that RSUs do not include anticipated dividends. RSUs generally vest in one-third increments over a three-year period and are settled in stock. PSUs are earned over a three-year performance cycle and vest in March of the year following the end of that performance cycle. The number of PSUs that will ultimately be earned is based on our performance relative to pre-established goals during that three-year performance cycle. The fair value of PSUs is determined based on the closing quoted price of our common stock on the day prior to the date of grant.
A summary of 2013 RSU and PSU activity is as follows:
|
Shares
(in millions) |
Weighted
Average Grant date Fair value |
|||||||||||||
|
RSUs
|
PSUs
|
RSUs
|
PSUs
|
|||||||||||
|
Nonvested at January 1
|
1.5
|
|
0.2
|
|
$
|
52.53
|
|
$
|
54.78
|
|
||||
|
Granted
|
0.8
|
|
0.1
|
|
60.81
|
|
64.01
|
|
||||||
|
Vested
|
(0.7
|
)
|
—
|
|
52.92
|
|
—
|
|
||||||
|
Canceled
|
(0.1
|
)
|
—
|
|
54.80
|
|
—
|
|
||||||
|
Nonvested at December 31
|
1.5
|
|
0.3
|
|
$
|
56.19
|
|
$
|
58.10
|
|
||||
At
December 31, 2013
there was
$50
of unrecognized compensation cost related to nonvested RSUs; that cost is expected to be recognized as expense over the weighted-average period of
1.0
year. The weighted-average grant date fair value per share of RSUs granted in
2013
and
2012
was
$60.81
and
$50.90
, respectively. The fair value of RSUs vested in
2013
was
$35
. At
|
34
|
Dollar amounts in millions except per share amounts or as otherwise specified
|
|
December 31, 2013
, there was
$7
of unrecognized compensation cost related to nonvested PSUs; that cost is expected to be recognized as expense over the weighted-average period of
1.0
year.
Employee Stock Purchase Plans (ESPP)
Full-time and part-time employees may participate in our ESPP provided they meet certain eligibility requirements. The purchase
price for our common stock under the terms of the ESPP is defined as
95%
of the closing stock price on the last trading day of a purchase period. During
2013
and
2012
, we issued
163,533
and
196,267
shares, respectively, under the ESPP.
In
2013
,
2012
and
2011
we recorded
$50
(
$2
in cost of sales and
$48
in selling, general and administrative expense),
$75
and
$76
, respectively, in restructuring charges related to focused reductions of our global workforce and other restructuring initiatives. The targeted reductions and other restructuring activities were initiated to provide efficiencies and realign resources as well as to allow for continued investment in strategic areas and drive growth.
For the years ended December 31,
2013
and
2012
we recorded
$22
and
$40
, respectively, in severance and related costs and
$25
and
$32
, respectively, in contractual and other obligations, as certain of our restructuring actions resulted in the discontinued use of specific assets and the exit of certain lease and other commitments. In both
2013
and
2012
we also recorded
$3
in agent conversion expense. Our current restructuring actions were completed at the end of
2013
, and we expect that the related cash payments will be substantially completed by the end of the first quarter of 2014.
A summary of our restructuring liability balance and full-year restructuring activity is as follows:
|
Total
|
Agent Conversions
|
Severance and Related Costs
|
Contractual Obligations and Other
|
|||||||||||||||||||||||||||||||||||||
|
2013
|
2012
|
2011
|
2013
|
2012
|
2011
|
2013
|
2012
|
2011
|
2013
|
2012
|
2011
|
|||||||||||||||||||||||||||||
|
January 1 Balance
|
$
|
40
|
|
$
|
28
|
|
$
|
3
|
|
$
|
5
|
|
$
|
9
|
|
$
|
—
|
|
$
|
20
|
|
$
|
10
|
|
$
|
1
|
|
$
|
15
|
|
$
|
9
|
|
$
|
2
|
|
||||
|
Charges to earnings
|
50
|
|
75
|
|
76
|
|
3
|
|
3
|
|
6
|
|
22
|
|
40
|
|
38
|
|
25
|
|
32
|
|
32
|
|
||||||||||||||||
|
Cash paid
|
(54
|
)
|
(59
|
)
|
(29
|
)
|
(6
|
)
|
(7
|
)
|
—
|
|
(30
|
)
|
(32
|
)
|
(29
|
)
|
(18
|
)
|
(20
|
)
|
—
|
|
||||||||||||||||
|
Other adjustments
|
(16
|
)
|
(4
|
)
|
(22
|
)
|
—
|
|
—
|
|
3
|
|
(2
|
)
|
2
|
|
—
|
|
(14
|
)
|
(6
|
)
|
(25
|
)
|
||||||||||||||||
|
December 31 Balance
|
$
|
20
|
|
$
|
40
|
|
$
|
28
|
|
$
|
2
|
|
$
|
5
|
|
$
|
9
|
|
$
|
10
|
|
$
|
20
|
|
$
|
10
|
|
$
|
8
|
|
$
|
15
|
|
$
|
9
|
|
||||
Earnings before income taxes consisted of:
|
2013
|
2012
|
2011
|
||||||||||
|
United States
|
$
|
193
|
|
$
|
591
|
|
$
|
613
|
|
|||
|
International
|
1,019
|
|
1,114
|
|
1,073
|
|
||||||
|
$
|
1,212
|
|
$
|
1,705
|
|
$
|
1,686
|
|
||||
Income taxes consisted of:
|
2013
|
2012
|
2011
|
||||||||||
|
Current income tax expense
|
||||||||||||
|
United States federal
|
$
|
79
|
|
$
|
227
|
|
$
|
100
|
|
|||
|
United States state and local
|
29
|
|
41
|
|
33
|
|
||||||
|
International
|
75
|
|
178
|
|
372
|
|
||||||
|
Total current income tax expense
|
183
|
|
446
|
|
505
|
|
||||||
|
Deferred income tax expense (benefit)
|
||||||||||||
|
United States federal
|
(52
|
)
|
(12
|
)
|
(16
|
)
|
||||||
|
United States state and local
|
(4
|
)
|
(9
|
)
|
(9
|
)
|
||||||
|
International
|
79
|
|
(18
|
)
|
(139
|
)
|
||||||
|
Total deferred income tax benefit
|
23
|
|
(39
|
)
|
(164
|
)
|
||||||
|
Total income tax expense
|
206
|
|
407
|
|
341
|
|
||||||
|
Interest expense and penalties included in other income (expense)
|
$
|
12
|
|
$
|
(4
|
)
|
$
|
36
|
|
|||
In 2013 we recorded income tax benefits related to favorable audit resolutions in multiple jurisdictions. In 2011 we recorded an income tax benefit related to a favorable settlement with the United States Internal Revenue Service (IRS) regarding its proposed adjustment to our previously filed 2003 through 2007 income tax
returns related to income tax positions we had taken for our cost sharing arrangements with two wholly-owned entities operating in Ireland, and we recorded charges for other uncertain tax positions related to the outcome of the IRS settlements. The net income tax benefit of these adjustments was
$82
.
Reconciliation of the United States federal statutory income tax rate to our effective income tax rate:
|
2013
|
2012
|
2011
|
|||||||
|
United States federal statutory income tax rate
|
35.0
|
%
|
35.0
|
%
|
35.0
|
%
|
|||
|
Add (deduct):
|
|||||||||
|
United States state and local income taxes, less federal deduction
|
1.4
|
|
1.7
|
|
0.9
|
|
|||
|
International operations
|
(13.7
|
)
|
(12.1
|
)
|
(13.7
|
)
|
|||
|
Repatriation of foreign earnings
|
—
|
|
(0.4
|
)
|
1.1
|
|
|||
|
Other
|
(5.7
|
)
|
(0.3
|
)
|
(3.1
|
)
|
|||
|
17.0
|
%
|
23.9
|
%
|
20.2
|
%
|
||||
|
35
|
Dollar amounts in millions except per share amounts or as otherwise specified
|
|
Deferred income tax assets and liabilities:
|
|
December 31
|
|||||||
|
|
2013
|
2012
|
||||||
|
Deferred income tax assets:
|
||||||||
|
Inventories
|
$
|
607
|
|
$
|
623
|
|
||
|
Other accrued expenses
|
288
|
|
212
|
|
||||
|
Depreciation and amortization
|
46
|
|
41
|
|
||||
|
State income taxes
|
53
|
|
54
|
|
||||
|
Share-based compensation
|
101
|
|
115
|
|
||||
|
Net operating loss carryforwards
|
124
|
|
90
|
|
||||
|
Other
|
107
|
|
97
|
|
||||
|
Total deferred income tax assets
|
1,326
|
|
1,232
|
|
||||
|
Less valuation allowances
|
(39
|
)
|
(33
|
)
|
||||
|
Total deferred income tax assets after valuation allowances
|
1,287
|
|
1,199
|
|
||||
|
Deferred income tax liabilities:
|
||||||||
|
Depreciation and amortization
|
(668
|
)
|
(450
|
)
|
||||
|
Other
|
(102
|
)
|
(57
|
)
|
||||
|
Total deferred income tax liabilities
|
(770
|
)
|
(507
|
)
|
||||
|
Net deferred income tax assets
|
$
|
517
|
|
$
|
692
|
|
||
|
Reported as:
|
||||||||
|
Current assets— Prepaid expenses and other current assets
|
$
|
880
|
|
$
|
811
|
|
||
|
Noncurrent assets—Other
|
34
|
|
63
|
|
||||
|
Current liabilities—Accrued expenses and other liabilities
|
—
|
|
—
|
|
||||
|
Noncurrent liabilities—Other liabilities
|
(397
|
)
|
(182
|
)
|
||||
|
$
|
517
|
|
$
|
692
|
|
|||
|
Accrued interest and penalties reported as accrued expenses and other liabilities
|
$
|
34
|
|
$
|
49
|
|
||
Net operating loss carryforwards totaling
$377
at
December 31, 2013
are available to reduce future taxable earnings of certain domestic and foreign subsidiaries. United States loss carryforwards of
$270
expire between
2013
and
2032
. International loss carryforwards of
$107
expire beginning in
2013
; however, some have no expiration. Of these carryforwards,
$55
are subject to a full valuation allowance. We also have a tax credit carryforward of
$25
with a full valuation allowance. These credits have no expiration; however, we do not anticipate generating income tax in excess of the credits in the foreseeable future.
No provision has been made for United States federal and state income taxes or international income taxes that may result from future remittances of the undistributed earnings of foreign subsidiaries that are determined to be indefinitely reinvested (
$7,023
at
December 31, 2013
). Determination of the amount of any unrecognized deferred income tax liability on these is not practicable.
The changes in the amounts recorded for uncertain income tax positions are as follows:
|
|
December 31
|
|||||||
|
|
2013
|
2012
|
||||||
|
Balance at beginning of year
|
$
|
227
|
|
$
|
249
|
|
||
|
Increases related to current year income tax positions
|
22
|
|
17
|
|
||||
|
Increases related to prior year income tax positions
|
56
|
|
3
|
|
||||
|
Decreases related to prior year income tax positions:
|
||||||||
|
Settlements and resolutions of income tax audits
|
(37
|
)
|
(19
|
)
|
||||
|
Statute of limitations expirations
|
(64
|
)
|
(23
|
)
|
||||
|
Balance at end of year
|
$
|
204
|
|
$
|
227
|
|
||
|
Reported as:
|
||||||||
|
Current liabilities—Income taxes
|
$
|
10
|
|
$
|
11
|
|
||
|
Noncurrent liabilities—Other liabilities
|
194
|
|
216
|
|
||||
|
$
|
204
|
|
$
|
227
|
|
|||
Our income tax expense could have been reduced by
$194
and
$216
at
December 31, 2013
and
December 31, 2012
, respectively, had these uncertain income tax positions been favorably resolved. It is reasonably possible that the amount of unrecognized tax benefits will significantly change due to one or more of the following events in the next twelve months: expiring statutes, audit activity, tax payments, competent authority proceedings related to transfer pricing or final decisions in matters that are the subject of controversy in various taxing jurisdictions in which we operate, including inventory transfer pricing and cost sharing, product royalty and foreign branch arrangements. We are not able to reasonably estimate the amount or the future periods in which changes in unrecognized tax benefits may be resolved; however, we do not anticipate any significant changes within the next twelve months. Interest and penalties incurred associated with uncertain tax positions are included in other income (expense).
In the normal course of business, income tax authorities in various income tax jurisdictions both within the United States and internationally conduct routine audits of our income tax returns filed in prior years. These audits are generally designed to determine if individual income tax authorities are in agreement with our interpretations of complex income tax regulations regarding the allocation of income to the various income tax jurisdictions. Income tax years are open from 2010 through the current year for the United States federal jurisdiction; income tax years open for our other major jurisdictions range from 2003 through the current year.
We provide certain employees with defined contribution plans. A portion of our retirement plan expense under the defined contribution plans is funded with Stryker common stock. The use of Stryker common stock represents a non-cash operating activity that is not reflected in the consolidated statements of cash flows.
|
2013
|
2012
|
2011
|
||||||||||
|
Defined contribution retirement plan expense
|
$
|
132
|
|
$
|
112
|
|
$
|
106
|
|
|||
|
Defined contribution plan expense funded with Stryker common stock
|
16
|
|
15
|
|
12
|
|
||||||
|
Stryker common stock held by defined contribution plan
|
||||||||||||
|
Dollar amount
|
150
|
|
104
|
|
91
|
|
||||||
|
Shares (in millions of shares)
|
2.0
|
|
1.9
|
|
1.8
|
|
||||||
|
Value as a percentage of total plan assets
|
9
|
%
|
9
|
%
|
9
|
%
|
||||||
|
36
|
Dollar amounts in millions except per share amounts or as otherwise specified
|
|
Certain of our subsidiaries have both funded and unfunded defined benefit pension plans covering some or all of their employees. Substantially all of the defined benefit pension plans have projected benefit obligations in excess of plan assets.
|
Obligations and Funded Status
|
December 31
|
|||||||
|
2013
|
2012
|
|||||||
|
Funded status
|
||||||||
|
Fair value of plan assets
|
$
|
281
|
|
$
|
254
|
|
||
|
Benefit obligations
|
456
|
|
447
|
|
||||
|
Funded status
|
$
|
(175
|
)
|
$
|
(193
|
)
|
||
|
Amounts recognized in the Consolidated Balance Sheets
|
||||||||
|
Current liabilities—accrued compensation
|
(1
|
)
|
(1
|
)
|
||||
|
Noncurrent liabilities—other liabilities
|
(174
|
)
|
(192
|
)
|
||||
|
Pre-tax amounts recognized in AOCI
|
||||||||
|
Unrecognized net actuarial loss
|
$
|
(115
|
)
|
$
|
(150
|
)
|
||
|
Unrecognized prior service cost
|
12
|
|
12
|
|
||||
|
$
|
(103
|
)
|
$
|
(138
|
)
|
|||
The estimated net actuarial loss for the defined benefit pension plans to be reclassified from AOCI into net periodic benefit cost in the year ended
12/31/2014
is
($4)
. We estimate that an immaterial amount of amortization of prior service cost and transition amount for the defined benefit pension plans will be reclassified from AOCI into net periodic benefit cost in the year ended
12/31/2014
.
Pension plans with an accumulated benefit obligation in excess of plan assets had projected benefit obligations, accumulated benefit obligations and fair value of plan assets of
$456
,
$427
, and
$281
, respectively, at
December 31, 2013
and
$447
,
$417
and
$254
, respectively, at December 31, 2012.
|
Change in Benefit Obligations and Plan Assets
|
December 31
|
|||||||
|
2013
|
2012
|
|||||||
|
Change in projected benefit obligations:
|
||||||||
|
Projected benefit obligations at beginning of year
|
$
|
447
|
|
$
|
316
|
|
||
|
Service cost
|
30
|
|
21
|
|
||||
|
Interest cost
|
13
|
|
13
|
|
||||
|
Foreign exchange impact
|
2
|
|
2
|
|
||||
|
Employee contributions
|
6
|
|
6
|
|
||||
|
Actuarial (gains) losses
|
(29
|
)
|
110
|
|
||||
|
Plan amendments
|
(1
|
)
|
(1
|
)
|
||||
|
Benefits paid
|
(12
|
)
|
(20
|
)
|
||||
|
Projected benefit obligations at end of year
|
$
|
456
|
|
$
|
447
|
|
||
|
Accumulated benefit obligations at end of year
|
427
|
|
$
|
417
|
|
|||
|
|
December 31
|
|||||||
|
2013
|
2012
|
|||||||
|
Change in plan assets:
|
||||||||
|
Fair value of plan assets at beginning of year
|
254
|
|
210
|
|
||||
|
Actual return
|
11
|
|
33
|
|
||||
|
Employer contributions
|
20
|
|
21
|
|
||||
|
Employee contributions
|
6
|
|
6
|
|
||||
|
Foreign exchange impact
|
1
|
|
2
|
|
||||
|
Benefits paid
|
(11
|
)
|
(18
|
)
|
||||
|
Fair value of plan assets at end of year
|
$
|
281
|
|
$
|
254
|
|
||
|
37
|
Dollar amounts in millions except per share amounts or as otherwise specified
|
|
Components of Net Periodic Pension Cost
|
2013
|
2012
|
2011
|
||||||||||
|
Net periodic benefit cost:
|
||||||||||||
|
Service cost
|
$
|
(30
|
)
|
$
|
(21
|
)
|
$
|
(20
|
)
|
|||
|
Interest cost
|
(13
|
)
|
(13
|
)
|
(13
|
)
|
||||||
|
Expected return on plan assets
|
10
|
|
9
|
|
10
|
|
||||||
|
Amortization of prior service cost and transition amount
|
1
|
|
1
|
|
—
|
|
||||||
|
Recognized actuarial loss
|
(8
|
)
|
(5
|
)
|
(2
|
)
|
||||||
|
Net periodic benefit cost
|
(40
|
)
|
(29
|
)
|
(25
|
)
|
||||||
|
Other changes in plan assets and benefit obligations, recognized in OCI:
|
||||||||||||
|
Net actuarial gain (loss)
|
28
|
|
(87
|
)
|
(10
|
)
|
||||||
|
Recognized net actuarial loss
|
8
|
|
5
|
|
2
|
|
||||||
|
Prior service cost and transition amount
|
(1
|
)
|
—
|
|
12
|
|
||||||
|
Total recognized in OCI
|
35
|
|
(82
|
)
|
4
|
|
||||||
|
Total recognized in net periodic benefit cost and OCI
|
$
|
(5
|
)
|
$
|
(111
|
)
|
$
|
(21
|
)
|
|||
|
Assumptions
|
||||||||||||
|
Weighted-average rates used in the determination of net periodic benefit cost:
|
||||||||||||
|
Discount rate
|
2.9
|
%
|
4.2
|
%
|
4.2
|
%
|
||||||
|
Expected return on plan assets
|
3.7
|
%
|
4.2
|
%
|
4.6
|
%
|
||||||
|
Rate of compensation increase
|
3.0
|
%
|
3.0
|
%
|
1.5
|
%
|
||||||
|
Weighted-average discount rate used in the determination of the projected benefit obligations
|
3.2
|
%
|
2.9
|
%
|
4.2
|
%
|
||||||
Discount rate
The discount rates were selected using a hypothetical portfolio of high quality bonds at December 31 that would provide the necessary cash flows to match our projected benefit payments.
Expected return on plan assets
The expected return on plan assets is determined by applying the target allocation in each asset category of plan investments to the anticipated return for each asset category based on historical and projected returns.
Investment strategy
The investment strategy for our defined benefit pension plans is to meet the liabilities of the plans as they fall due and to maximize the return on invested assets within appropriate risk tolerances. The weighted-average target and actual allocation of plan assets by asset category is as follows:
|
|
Target
|
December 31
|
||||||
|
|
2013
|
2013
|
2012
|
|||||
|
Equity securities
|
31.8
|
%
|
33.5
|
%
|
31.2
|
%
|
||
|
Debt securities
|
50.0
|
|
45.5
|
|
47.9
|
|
||
|
Other
|
18.2
|
|
21.0
|
|
20.9
|
|
||
|
100.0
|
%
|
100.0
|
%
|
100.0
|
%
|
|||
Valuation of Our Pension Plan Assets by Pricing Categories
|
Total
|
(Level 1)
|
(Level 2)
|
(Level 3)
|
|||||||||||||||||||||||||
|
2013
|
2012
|
2013
|
2012
|
2013
|
2012
|
2013
|
2012
|
|||||||||||||||||||||
|
Cash and cash equivalents
|
$
|
10
|
|
5
|
|
$
|
10
|
|
$
|
5
|
|
$
|
—
|
|
$
|
—
|
|
$
|
—
|
|
$
|
—
|
|
|||||
|
Equity securities
|
94
|
|
100
|
|
94
|
|
100
|
|
—
|
|
—
|
|
—
|
|
—
|
|
||||||||||||
|
Corporate debt securities
|
128
|
|
93
|
|
127
|
|
93
|
|
2
|
|
—
|
|
—
|
|
—
|
|
||||||||||||
|
Other
|
49
|
|
56
|
|
18
|
|
22
|
|
8
|
|
11
|
|
22
|
|
23
|
|
||||||||||||
|
Total
|
$
|
281
|
|
$
|
254
|
|
$
|
249
|
|
$
|
220
|
|
$
|
10
|
|
$
|
11
|
|
$
|
22
|
|
$
|
23
|
|
||||
Our Level 3 pension plan assets (See Note 3 for an explanation of our fair value hierarchy) consist primarily of guaranteed investment contracts with insurance companies. The insurance contracts guarantee us principal repayment and a fixed rate of return. Our valuation of Level 3 assets is based on third-party actuarial valuations that are an estimation of the surrender value of the guaranteed investment contract between us and the insurance company. The surrender value equals the actuarial value of the notional investments underlying the guaranteed investment contract, using the actuarial assumptions as stated in the guaranteed investment contract.
|
38
|
Dollar amounts in millions except per share amounts or as otherwise specified
|
|
Rollforward of Level 3 Pension Plan Assets
|
2013
|
2012
|
|||||||
|
Balance at January 1
|
$
|
23
|
|
$
|
17
|
|
||
|
Actual return on plan assets held at the reporting date
|
—
|
|
—
|
|
||||
|
Purchases, sales, and settlements
|
(1
|
)
|
6
|
|
||||
|
Balance at December 31
|
$
|
22
|
|
$
|
23
|
|
||
We expect to contribute
$20
to our defined benefit pension plans in
2014
. The estimated future benefit payments by year based on expected future service as appropriate are:
|
2014
|
2015
|
2016
|
2017
|
2018
|
2019-2023
|
|||||||||||||||||||
|
Expected benefit payments
|
$
|
16
|
|
$
|
15
|
|
$
|
15
|
|
$
|
15
|
|
$
|
15
|
|
$
|
81
|
|
||||||
We segregate our operations into three reportable business segments: Reconstructive, MedSurg, and Neurotechnology and Spine. The Reconstructive segment includes orthopaedic reconstructive (hip and knee) and trauma implant systems as well as other related products. The MedSurg segment includes surgical equipment and surgical navigation systems (Instruments); endoscopic and communications systems (Endoscopy); patient handling and emergency medical equipment (Medical); and other related products. The Neurotechnology and Spine segment includes neurovascular products, spinal implant systems and other related products. The Other category shown in the table below includes corporate and global operations administration, central research and development initiatives, interest expense, interest and marketable securities income and share-based compensation, which includes compensation related to both employee and director stock option, restricted stock unit and performance stock unit grants.
Our reportable segments are business units that offer different products and services and are managed separately because each business requires different manufacturing, technology and marketing strategies. The accounting policies of the segments are the same as those described in the summary of significant accounting policies in Note 1 to the Consolidated Financial Statements. We measure the financial results of our reportable segments using an internal performance measure that excludes acquisition and integration-related charges, restructuring and related charges, reserves for certain product recall matters, reserves for certain legal and regulatory matters, a donation to an educational institution, and certain income tax adjustments. Identifiable assets are those assets used exclusively in the operations of each business segment or allocated when used jointly. Corporate assets are principally cash and cash equivalents, marketable securities and property, plant and equipment. Results for our reportable segments are as follows:
|
Reconstructive
|
MedSurg
|
Neurotechnology and Spine
|
Other
|
Total
|
|||||||||||||||||||||||||||||||||||||||||||||
|
2013
|
2012
|
2011
|
2013
|
2012
|
2011
|
2013
|
2012
|
2011
|
2013
|
2012
|
2011
|
2013
|
2012
|
2011
|
|||||||||||||||||||||||||||||||||||
|
Net sales
|
$
|
4,004
|
|
$
|
3,823
|
|
$
|
3,710
|
|
$
|
3,359
|
|
$
|
3,265
|
|
$
|
3,160
|
|
$
|
1,658
|
|
$
|
1,569
|
|
$
|
1,437
|
|
$
|
—
|
|
$
|
—
|
|
$
|
—
|
|
$
|
9,021
|
|
$
|
8,657
|
|
$
|
8,307
|
|
||||
|
Depreciation and amortization
|
273
|
|
271
|
|
267
|
|
84
|
|
85
|
|
84
|
|
135
|
|
122
|
|
119
|
|
19
|
|
8
|
|
11
|
|
511
|
|
486
|
|
481
|
|
|||||||||||||||||||
|
Income taxes (credit)
|
347
|
|
344
|
|
375
|
|
148
|
|
177
|
|
165
|
|
82
|
|
76
|
|
63
|
|
(115
|
)
|
(110
|
)
|
(106
|
)
|
462
|
|
487
|
|
497
|
|
|||||||||||||||||||
|
Segment net earnings (loss)
|
970
|
|
936
|
|
926
|
|
621
|
|
603
|
|
535
|
|
283
|
|
267
|
|
221
|
|
(258
|
)
|
(246
|
)
|
(234
|
)
|
1,616
|
|
1,560
|
|
1,448
|
|
|||||||||||||||||||
|
Other (net of income taxes):
|
|||||||||||||||||||||||||||||||||||||||||||||||||
|
Less acquisition and integration-related charges
|
(72
|
)
|
(37
|
)
|
(142
|
)
|
|||||||||||||||||||||||||||||||||||||||||||
|
Less restructuring charges
|
(46
|
)
|
(59
|
)
|
(60
|
)
|
|||||||||||||||||||||||||||||||||||||||||||
|
Less Rejuvenate and related charges
|
(460
|
)
|
(133
|
)
|
—
|
|
|||||||||||||||||||||||||||||||||||||||||||
|
Less regulatory and legal matters
|
(63
|
)
|
(33
|
)
|
—
|
|
|||||||||||||||||||||||||||||||||||||||||||
|
Less donation
|
(15
|
)
|
—
|
|
—
|
|
|||||||||||||||||||||||||||||||||||||||||||
|
Add income tax adjustments
|
46
|
|
—
|
|
99
|
|
|||||||||||||||||||||||||||||||||||||||||||
|
Net earnings
|
1,006
|
|
1,298
|
|
1,345
|
|
|||||||||||||||||||||||||||||||||||||||||||
|
Total assets
|
6,675
|
|
3,654
|
|
3,758
|
|
3,382
|
|
2,996
|
|
2,358
|
|
3,147
|
|
2,600
|
|
2,245
|
|
2,539
|
|
3,956
|
|
3,785
|
|
15,743
|
|
13,206
|
|
12,146
|
|
|||||||||||||||||||
|
Capital spending
|
89
|
|
87
|
|
119
|
|
59
|
|
51
|
|
56
|
|
16
|
|
53
|
|
27
|
|
31
|
|
19
|
|
24
|
|
195
|
|
210
|
|
226
|
|
|||||||||||||||||||
|
39
|
Dollar amounts in millions except per share amounts or as otherwise specified
|
|
The countries in which we have local revenue generating operations have been combined into the following geographic areas: the United States (including Puerto Rico); Europe, Middle East, Africa (EMEA); Asia Pacific; and other foreign countries, which include Canada and countries in the Latin American region. Sales are attributable to a geographic area based upon the customer’s country of domicile. Net property, plant and equipment are based upon physical location of the assets. Geographic information follows:
|
Net Sales
|
Net Property, Plant & Equipment
|
||||||||||||||||
|
2013
|
2012
|
2011
|
2013
|
2012
|
|||||||||||||
|
United States
|
$
|
5,984
|
|
$
|
5,658
|
|
$
|
5,269
|
|
$
|
506
|
|
$
|
473
|
|
||
|
Europe, Middle East, Africa
|
1,316
|
|
1,266
|
|
1,382
|
|
446
|
|
410
|
|
|||||||
|
Asia Pacific
|
1,319
|
|
1,336
|
|
1,285
|
|
122
|
|
58
|
|
|||||||
|
Other foreign countries
|
402
|
|
397
|
|
371
|
|
7
|
|
7
|
|
|||||||
|
$
|
9,021
|
|
$
|
8,657
|
|
$
|
8,307
|
|
$
|
1,081
|
|
$
|
948
|
|
|||
|
|
2013 Quarter Ended
|
2012 Quarter Ended
|
||||||||||||||||||||||||||||||
|
|
Mar. 31
|
June 30
|
Sept. 30
|
Dec. 31
|
Mar. 31
|
June 30
|
Sept. 30
|
Dec. 31
|
||||||||||||||||||||||||
|
Net sales
|
$
|
2,190
|
|
$
|
2,212
|
|
$
|
2,151
|
|
$
|
2,468
|
|
$
|
2,161
|
|
$
|
2,106
|
|
$
|
2,052
|
|
$
|
2,337
|
|
||||||||
|
Gross profit
|
1,477
|
|
1,482
|
|
1,469
|
|
1,616
|
|
1,452
|
|
1,434
|
|
1,397
|
|
1,593
|
|
||||||||||||||||
|
Earnings before income taxes
|
375
|
|
269
|
|
137
|
|
431
|
|
468
|
|
435
|
|
444
|
|
358
|
|
||||||||||||||||
|
Net earnings
|
304
|
|
213
|
|
103
|
|
386
|
|
350
|
|
325
|
|
353
|
|
270
|
|
||||||||||||||||
|
Net earnings per share of common stock:
|
||||||||||||||||||||||||||||||||
|
Basic
|
0.80
|
|
0.56
|
|
0.27
|
|
1.02
|
|
0.92
|
|
0.85
|
|
0.93
|
|
0.71
|
|
||||||||||||||||
|
Diluted
|
0.79
|
|
0.56
|
|
0.27
|
|
1.01
|
|
0.91
|
|
0.85
|
|
0.92
|
|
0.71
|
|
||||||||||||||||
|
Market price of common stock:
|
||||||||||||||||||||||||||||||||
|
High
|
66.92
|
|
70.00
|
|
71.94
|
|
75.55
|
|
55.90
|
|
57.14
|
|
56.79
|
|
56.75
|
|
||||||||||||||||
|
Low
|
55.24
|
|
63.35
|
|
63.71
|
|
66.93
|
|
50.41
|
|
49.43
|
|
50.05
|
|
51.60
|
|
||||||||||||||||
|
Dividends declared per share of common stock
|
$
|
0.265
|
|
$
|
0.265
|
|
$
|
0.265
|
|
$
|
0.305
|
|
$
|
0.2125
|
|
$
|
0.2125
|
|
$
|
0.2125
|
|
$
|
0.265
|
|
||||||||
The price quotations reported above were supplied by the New York Stock Exchange.
|
40
|
Dollar amounts in millions except per share amounts or as otherwise specified
|
|
|
ITEM 9.
|
CHANGES IN AND DISAGREEMENTS WITH ACCOUNTANTS ON ACCOUNTING AND FINANCIAL DISCLOSURE.
|
Not applicable.
|
ITEM 9A.
|
CONTROLS AND PROCEDURES.
|
Evaluation of Disclosure Controls and Procedures—
An evaluation of the effectiveness of the Company’s disclosure controls and procedures as of
December 31, 2013
was carried out under the supervision and with the participation of the Company’s management, including the President and Chief Executive Officer and the Vice President and Chief Financial Officer (the Certifying Officers). Based on that evaluation, the Certifying Officers concluded that the Company’s disclosure controls and procedures are effective.
Changes in Internal Control Over Financial Reporting—
There was no change to our internal control over financial reporting during the quarter ended
December 31, 2013
that materially affected, or is reasonably likely to materially affect, our internal control over financial reporting.
Management’s Report on Internal Control Over Financial Reporting—
The management of Stryker Corporation is responsible for establishing and maintaining adequate internal control over financial reporting, as such term is defined in Exchange Act Rules 13a-15(f). Stryker Corporation’s internal control system was designed to provide reasonable assurance to the Company's management and Board of Directors regarding the preparation and fair presentation of published financial statements.
Stryker Corporation’s management assessed the effectiveness of our internal control over financial reporting as of
December 31, 2013
. In making this assessment, we used the criteria set forth by the Committee of Sponsoring Organizations of the Treadway Commission in
Internal Control-Integrated Framework
. Based on that assessment, management concluded that our internal control over financial reporting is effective.
The internal controls over financial reporting of an acquired business are eligible for a one year exclusion as permitted by Securities and Exchange Commission Staff interpretive guidance. Accordingly, management's assessment of and conclusion on the effectiveness of internal control over financial reporting did not include the internal controls of Trauson Holdings Company Limited and MAKO Surgical Corp., which are included in the December 31, 2013 consolidated financial statements of Stryker Corporation and subsidiaries. Assets and shareholders' equity excluded from management's assessment constitute 2.3% and (0.2%) of total assets and shareholders' equity, respectively, as of December 31, 2013 and 0.7% and (3.2%) of revenues and net earnings, respectively, for the year then ended.
Stryker Corporation’s independent registered public accounting firm, Ernst & Young LLP, has issued an attestation report on the effectiveness of our internal control over financial reporting.
REPORT OF INDEPENDENT REGISTERED PUBLIC ACCOUNTING FIRM ON INTERNAL CONTROL OVER FINANCIAL REPORTING
THE BOARD OF DIRECTORS AND SHAREHOLDERS OF STRYKER CORPORATION:
We have audited Stryker Corporation and subsidiaries' internal control over financial reporting as of
December 31, 2013
, based on criteria established in Internal Control-Integrated Framework issued by the Committee of Sponsoring Organizations of the Treadway Commission (1992 framework) (the COSO criteria). Stryker Corporation and subsidiaries' management is responsible for maintaining effective internal control over financial reporting, and for its assessment of the effectiveness of internal control over financial reporting included in the accompanying Management's Report on Internal Control Over Financial Reporting. Our responsibility is to express an opinion on the Company's internal control over financial reporting based on our audit.
We conducted our audit in accordance with the standards of the Public Company Accounting Oversight Board (United States). Those standards require that we plan and perform the audit to obtain reasonable assurance about whether effective internal control over financial reporting was maintained in all material respects. Our audit included obtaining an understanding of internal control over financial reporting, assessing the risk that a material weakness exists, testing and evaluating the design and operating effectiveness of internal control based on the assessed risk, and performing such other procedures as we considered necessary in the circumstances. We believe that our audit provides a reasonable basis for our opinion.
A company's internal control over financial reporting is a process designed to provide reasonable assurance regarding the reliability of financial reporting and the preparation of financial statements for external purposes in accordance with generally accepted accounting principles. A company's internal control over financial reporting includes those policies and procedures that (1) pertain to the maintenance of records that, in reasonable detail, accurately and fairly reflect the transactions and dispositions of the assets of the company; (2) provide reasonable assurance that transactions are recorded as necessary to permit preparation of financial statements in accordance with generally accepted accounting principles, and that receipts and expenditures of the company are being made only in accordance with authorizations of management and directors of the company; and (3) provide reasonable assurance regarding prevention or timely detection of unauthorized acquisition, use or disposition of the company's assets that could have a material effect on the financial statements.
Because of its inherent limitations, internal control over financial reporting may not prevent or detect misstatements. Also, projections of any evaluation of effectiveness to future periods are subject to the risk that controls may become inadequate because of changes in conditions, or that the degree of compliance with the policies or procedures may deteriorate.
As indicated in the accompanying Management’s Report on Internal Control Over Financial Reporting, management’s assessment of and conclusion on the effectiveness of internal
|
41
|
||
control over financial reporting did not include the internal controls of Trauson Holdings Company Limited and MAKO Surgical Corp., which are included in the December 31, 2013 consolidated financial statements of Stryker Corporation and subsidiaries and constituted 2.3% and (0.2%) of total assets and shareholders' equity, respectively, as of December 31, 2013 and 0.7% and (3.2%) of revenues and net earnings, respectively, for the year then ended. Our audit of internal control over financial reporting of Stryker Corporation and subsidiaries also did not include an evaluation of the internal control over financial reporting of Trauson Holdings Company Limited and MAKO Surgical Corp.
In our opinion, Stryker Corporation and subsidiaries maintained, in all material respects, effective internal control over financial reporting as of
December 31, 2013
, based on the COSO criteria.
We also have audited, in accordance with the standards of the Public Company Accounting Oversight Board (United States), the consolidated balance sheets of Stryker Corporation and subsidiaries as of
December 31, 2013
and
2012
and the related consolidated statements of earnings and comprehensive income, shareholders' equity and cash flows for each of the three years in the period ended
December 31, 2013
of Stryker Corporation and subsidiaries, and our report
dated February 13, 2014 e
xpressed an unqualified opinion thereon.
/s/ ERNST & YOUNG LLP
Grand Rapids, Michigan
February 13, 2014
|
ITEM 9B.
|
OTHER INFORMATION.
|
As previously announced, effective as of the filing of this Annual Report on Form 10-K, Tony M. McKinney resigned his position as Vice President and Chief Accounting Officer to accept another position with the Company. From and after the date of this filing, William E. Berry Jr., the Company's Vice President and Corporate Controller, will, as part of his regular duties and responsibilities, oversee the Company's accounting policies and function and serve as the Company's principal accounting officer.
|
ITEM 10.
|
DIRECTORS, EXECUTIVE OFFICERS AND CORPORATE GOVERNANCE.
|
Information regarding our directors and certain corporate governance and other matters appearing under the captions "Information About the Board of Directors and Corporate Governance Matters," "Proposal 1—Election of Directors," "Information About the Board of Directors and Corporate Governance Matters— Board Committees—Audit Committee" and "Additional Information—Section 16(a) Beneficial Ownership Reporting Compliance" in the
2014
proxy statement is incorporated herein by reference.
The names and ages of our executive officers as of
January 31, 2014
, the positions they held on that date and the year they first became an executive officer are:
|
Name
|
Age
|
Position
|
First Became an Executive Officer
|
|
Kevin A. Lobo
|
48
|
President and Chief Executive Officer
|
2011
|
|
Steven P. Benscoter
|
46
|
Vice President, Human Resources
|
2012
|
|
Scott P. Bruder, MD, PhD
|
51
|
Vice President, Chief Medical and Scientific Officer
|
2013
|
|
Lonny J. Carpenter
|
52
|
Group President, Global Quality and Operations
|
2008
|
|
David K. Floyd
|
53
|
Group President, Orthopaedics
|
2012
|
|
Curtis E. Hall
|
57
|
Chief Legal Officer
|
2004
|
|
William R. Jellison
|
56
|
Vice President and Chief Financial Officer
|
2013
|
|
Tony M. McKinney
|
44
|
Vice President, Chief Accounting Officer
|
2008
|
|
Katherine A. Owen
|
43
|
Vice President, Strategy and Investor Relations
|
2007
|
|
Timothy J. Scannell
|
49
|
Group President, MedSurg and Neurotechnology
|
2008
|
|
Ramesh Subrahmanian
|
52
|
Group President, International
|
2011
|
Each of our executive officers was elected by our Board of Directors to serve in the office indicated until the first meeting of the Board of Directors following the annual meeting of shareholders in
2014
or until a successor is chosen and qualified or until his or her resignation or removal. Each of our executive officers has held the position above or has served Stryker in various executive or administrative capacities for at least five years, except for Mr. Lobo, Mr. Jellison, Dr. Bruder, Mr. Subrahmanian and Mr. Floyd. Prior to joining Stryker in April 2011, Mr. Lobo held a variety of senior level leadership roles for the previous nine years at Johnson & Johnson, most recently as Worldwide President of Ethicon Endo-Surgery. Prior to joining Stryker in April 2013, Mr. Jellison held a variety of senior level leadership roles for the previous 15 years at Dentsply International, the world's largest manufacturer of professional dental products, most recently as Senior Vice President and Chief Financial Officer. Prior to joining Stryker in January 2013, Dr. Bruder was Chief Science and Technology Officer for the previous five years with Becton, Dickinson and Company. Prior to joining Stryker in September 2011, Mr. Subrahmanian held a variety of senior level leadership roles for the previous five years with Merck & Co. Inc., most recently as
|
42
|
||
Senior Vice President & President, Asia Pacific Human Health. Prior to joining Stryker in November 2012, Mr. Floyd held a variety of senior level leadership roles with DePuy (a division of Johnson & Johnson), Abbott Spine, AxioMed Spine, Centerpulse Orthopaedics and most recently was Chief Executive Officer for OrthoWorx.
The Corporate Governance Guidelines adopted by our Board of Directors, as well as the charters of each of the Audit Committee, the Finance Committee, the Governance and Nominating Committee and the Compensation Committee and the Code of Ethics applicable to the principal executive officer, principal financial officer and principal accounting officer or controller or persons performing similar functions are available, free of charge, under the "Investors—Corporate Governance" section of our website at
www.stryker.com
. Print copies of such documents are available, free of charge, upon written request sent to the Corporate Secretary of Stryker Corporation at 2825 Airview Boulevard, Kalamazoo, Michigan 49002.
|
ITEM 11.
|
EXECUTIVE COMPENSATION.
|
Information regarding the compensation of our management appearing under the captions "Compensation Discussion and Analysis," "Compensation Committee Report," "Executive Compensation" and "Compensation of Directors" in the
2014
proxy statement is incorporated herein by reference.
|
ITEM 12.
|
SECURITY OWNERSHIP OF CERTAIN BENEFICIAL OWNERS AND MANAGEMENT AND RELATED STOCKHOLDER MATTERS.
|
The information under the caption "Stock Ownership" in the
2014
proxy statement is incorporated herein by reference.
At
December 31, 2013
, we had an equity compensation plan under which options are granted at a price not less than fair market value at the date of grant and under which awards of restricted stock units (RSUs) and performance stock units have been made. Options and RSUs had also been awarded under a previous plan. These equity compensation plans were previously submitted to and approved by our shareholders. Additional information regarding our equity compensation plans appear in Note 1 and Note 9 to the Consolidated Financial Statements in Item 8 of this report. At
December 31, 2013
, we also had a stock performance incentive award program pursuant to which shares of our common stock have been and may be issued to certain employees with respect to performance. The status of these plans as of
December 31, 2013
follows:
|
Plan category
|
Number of shares of common
stock to be issued upon exercise of outstanding options, warrants and rights |
Weighted-average
exercise price of outstanding options, warrants and rights |
Number of shares of common
stock remaining available for future issuance under equity compensation plans (excluding shares reflected in the first column) |
|||
|
Equity compensation plans approved by shareholders
|
18,940,837
|
$49.91
|
27,606,008
|
|||
|
ITEM 13.
|
CERTAIN RELATIONSHIPS AND RELATED TRANSACTIONS, AND DIRECTOR INDEPENDENCE.
|
The information under the caption "Information About the Board of Directors and Corporate Governance Matters—Independent Directors" and "Information About the Board of Directors and Corporate Governance Matters—Certain Relationships and Related Party Transactions" in the
2014
proxy statement is incorporated herein by reference.
|
ITEM 14.
|
PRINCIPAL ACCOUNTING FEES AND SERVICES.
|
The information under the caption "Proposal 2—Ratification of Appointment of Our Independent Registered Public Accounting Firm—Relationship with Ernst & Young LLP" in the
2014
proxy statement is incorporated herein by reference.
|
43
|
Dollar amounts in millions except per share amounts or as otherwise specified
|
|
|
ITEM 15.
|
EXHIBITS, FINANCIAL STATEMENT SCHEDULES.
|
|
(a) 1.
|
Financial Statements
|
||
|
The following Consolidated Financial Statements are set forth in Part II, Item 8 of this report.
|
|||
|
Report of Independent Registered Public Accounting Firm on Financial Statements
|
19
|
|
|
|
Consolidated Statements of Earnings for the Years Ended December 31, 2013, 2012 and 2011
|
20
|
|
|
|
Consolidated Statements of Comprehensive Income for the Years Ended December 31, 2013, 2012 and 2011
|
20
|
|
|
|
Consolidated Balance Sheets as of December 31, 2013 and 2012
|
21
|
|
|
|
Consolidated Statements of Shareholders’ Equity for the Years Ended December 31, 2013, 2012 and 2011
|
22
|
|
|
|
Consolidated Statements of Cash Flows for the Years Ended December 31, 2013, 2012 and 2011
|
23
|
|
|
|
Notes to Consolidated Financial Statements
|
24
|
|
|
|
(a) 2.
|
Financial Statement Schedules
|
||
|
The consolidated financial statement schedule (Schedule II) of Stryker Corporation and its subsidiaries has been submitted as a separate section of this report following the signature page. All other schedules for which provision is made in the applicable accounting regulation of the U.S. Securities and Exchange Commission are not required under the related instructions or are inapplicable and, therefore, have been omitted.
|
|||
|
(a) 3.
|
Exhibits
|
||
|
A list of exhibits required to be filed as part of this report is set forth in the Exhibit Index, which immediately precedes such exhibits, and is incorporated herein by reference.
|
|||
|
(c)
|
Financial Statement Schedules
|
||
|
44
|
Dollar amounts in millions except per share amounts or as otherwise specified
|
|
SIGNATURES
Pursuant to the requirements of Section 13 or 15(d) of the Securities Exchange Act of 1934, the registrant has duly caused this report to be signed on its behalf by the undersigned, thereunto duly authorized.
|
|
STRYKER CORPORATION
|
|
|
Date: February 13, 2014
|
|
/s/ WILLIAM R. JELLISON
|
|
|
William R. Jellison, Vice President, Chief Financial Officer
|
|
Pursuant to the requirements of the Securities Exchange Act of 1934, this report has been signed below by the following persons on the date indicated above on behalf of the registrant and in the capacities indicated.
|
/s/ KEVIN A. LOBO
|
|
/s/ WILLIAM R. JELLISON
|
|
Kevin A. Lobo, President and Chief Executive Officer (Principal Executive Officer)
|
|
William R. Jellison, Vice President, Chief Financial Officer (Principal Financial Officer)
|
|
/s/ TONY M. MCKINNEY
|
||
|
Tony M. McKinney, Vice President, Chief Accounting Officer (Principal Accounting Officer)
|
||
|
/s/ WILLIAM U. PARFET
|
|
/s/ RONDA E. STRYKER
|
|
William U. Parfet—Director, Non-Executive Chairman
|
|
Ronda E. Stryker—Director
|
|
/s/ ROCH DOLIVEUX
|
/s/ SRIKANT M. DATAR
|
|
|
Roch Doliveux—Director
|
Srikant M. Datar, Ph.D.—Director
|
|
|
/s/ LOUISE L. FRANCESCONI
|
|
/s/ ALLAN C. GOLSTON
|
|
Louise L. Francesconi—Director
|
|
Allan C. Golston—Director
|
|
/s/ ANDREW K. SILVERNAIL
|
|
/s/ HOWARD E. COX, JR.
|
|
Andrew K. Silvernail —Director
|
|
Howard E. Cox, Jr.—Director
|
|
/s/ HOWARD L. LANCE
|
|
|
|
Howard L. Lance —Director
|
|
|
|
45
|
||
SCHEDULE II—VALUATION AND QUALIFYING ACCOUNTS
STRYKER CORPORATION AND SUBSIDIARIES
|
Column A
|
Column B
|
Column C
|
Column D
|
Column E
|
Column F
|
|||||||||||||||
|
|
|
Additions
|
Deductions
|
|
||||||||||||||||
|
Description
|
Balance at
Beginning of Period |
Charged to
Costs & Expenses |
Describe (a)
|
Describe (b)
|
Balance
at End of Period |
|||||||||||||||
|
DEDUCTED FROM ASSET ACCOUNTS
|
||||||||||||||||||||
|
Allowance for Doubtful Accounts:
|
||||||||||||||||||||
|
Year ended December 31, 2013
|
$
|
58
|
|
$
|
21
|
|
$
|
11
|
|
$
|
(4
|
)
|
$
|
72
|
|
|||||
|
Year ended December 31, 2012
|
$
|
56
|
|
$
|
10
|
|
$
|
8
|
|
$
|
—
|
|
$
|
58
|
|
|||||
|
Year ended December 31, 2011
|
$
|
57
|
|
$
|
9
|
|
$
|
9
|
|
$
|
1
|
|
$
|
56
|
|
|||||
|
(a)
|
Uncollectible amounts written off, net of recoveries.
|
|
(b)
|
Effect of changes in foreign exchange rates.
|
|
46
|
Dollar amounts in millions except per share amounts or as otherwise specified
|
|
FORM 10-K—ITEM 15(a) 3. and ITEM 15(c)
STRYKER CORPORATION AND SUBSIDIARIES
EXHIBIT INDEX
|
Exhibit 3—
|
|
Articles of Incorporation and By-Laws
|
|
(i)
|
|
Restated Articles of Incorporation
|
|
(ii)
|
|
By-Laws — Incorporated by reference to Exhibit 3(ii) to our Form 8-K dated October 28, 2008 (Commission File No. 000-09165).
|
|
Exhibit 4—
|
|
Instruments defining the rights of security holders, including indentures—We agree to furnish to the Commission upon request a copy of each instrument pursuant to which long-term debt of Stryker Corporation and its subsidiaries not exceeding 10% of the total assets of Stryker Corporation and its consolidated subsidiaries is authorized.
|
|
(i)
|
|
Credit Agreement, dated as of August 22, 2012, among Stryker Corporation and certain subsidiaries, as designated borrowers; the lenders party thereto; and JPMorgan Chase Bank, N.A., as administrative agent—Incorporated by reference to Exhibit 4.1 to our Form 8-K dated August 27, 2012 (Commission File No. 000-09165).
|
|
(ii)
|
|
Indenture, dated January 15, 2010, between Stryker Corporation and U.S. Bank National Association.—Incorporated by reference to Exhibit 4.1 to our Form 8-K dated January 15, 2010 (Commission File No. 000-09165).
|
|
(iii)
|
|
First Supplemental Indenture (including the form of 2015 note), dated January 15, 2010, between Stryker Corporation and U.S. Bank National Association.—Incorporated by reference to Exhibit 4.2 to our Form 8-K dated January 15, 2010 (Commission File No. 000-09165).
|
|
(iv)
|
|
Second Supplemental Indenture (including the form of 2020 note), dated January 15, 2010, between Stryker Corporation and U.S. Bank National Association.—Incorporated by reference to Exhibit 4.3 to our Form 8-K dated January 15, 2010 (Commission File No. 000-09165).
|
|
(v)
|
|
Third Supplemental Indenture (including the form of 2016 note), dated September 16, 2011, between Stryker Corporation and U.S. Bank National Association —Incorporated by reference to Exhibit 4.2 to our Form 8-K dated September 16, 2011 (Commission File No. 000-09165).
|
|
(vi)
|
Fourth Supplemental Indenture (including the form of 2018 note) dated March 25, 2013, between Stryker Corporation and U.S. Bank National Association. - Incorporated by reference to Exhibit 4.2 to our Form 8-K dated March 25, 2013 (Commission File No. 000-09165).
|
|
|
(vii)
|
Fifth Supplemental Indenture (including the form of 2043 note) dated March 25, 2013, between Stryker Corporation and U.S. Bank National Association. - Incorporated by reference to Exhibit 4.3 to our Form 8-K dated March 25, 2013 (Commission File No. 000-09165).
|
|
|
|
||
|
Exhibit 10—
|
|
Material contracts
|
|
(i)*
|
|
2011 Long-Term Incentive Plan (as amended effective July 26, 2011)—Incorporated by reference to Exhibit 4(i) to Amendment No. 1 to our Registration Statement on Form S-8, File No. 333-179142 (Commission File No. 000-09165).
|
|
(ii)*
|
|
2006 Long-Term Incentive Plan (as amended effective February 8, 2011)—Incorporated by reference to Exhibit 10(i) to our Form 10-K for the year ended December 31, 2010 (Commission File No. 000-09165).
|
|
(iii)*
|
†
|
Form of grant notice and terms and conditions for stock options granted in 2014 under the 2011 Long-Term Incentive Plan.
|
|
(iv)*
|
†
|
Form of grant notice and terms and conditions for restricted stock units granted in 2014 under the 2011 Long-Term Incentive Plan.
|
|
(v)*
|
†
|
Form of grant notice and terms and conditions for performance stock units granted in 2014 under the 2011 Long-
Term Incentive Plan.
|
|
(vi)*
|
†
|
Form of grant notice and terms and conditions for stock options and restricted stock units granted in 2014 under the 2011 Long-Term Incentive Plan to non-employee directors.
|
|
(vii)*
|
|
Form of grant notice and terms and conditions for stock options granted in 2013 under the 2006 Long-Term Incentive Plan—Incorporated by reference to Exhibit 10(ii) to our Form 10-K for the year ended December 31, 2012 (Commission File No. 000-09165).
|
|
47
|
||
|
(viii)*
|
|
Form of grant notice and terms and conditions for restricted stock units granted in 2013 under the 2006 Long-Term Incentive Plan—Incorporated by reference to Exhibit 10(ii) to our Form 10-K for the year ended December 31, 2012. (Commission File No. 000-09165).
|
|
(ix)*
|
|
Form of grant notice and terms and conditions for performance stock units granted in 2013 under the 2011 Long-
Term Incentive Plan—Incorporated by reference to Exhibit 10(ii) to our Form 10-K for the year ended December 31, 2012 (Commission File No. 000-09165).
|
|
(x)*
|
|
Form of grant notice and terms and conditions for stock options granted in 2012 under the 2006 Long-Term Incentive Plan—Incorporated by reference to Exhibit 10(i) to our Form 10-Q for the quarter ended March 31, 2012 (Commission File No. 000-09165).
|
|
(xi)*
|
|
Form of grant notice and terms and conditions for restricted stock units granted in 2012 under the 2006 Long-Term Incentive Plan—Incorporated by reference to Exhibit 10(ii) to our Form 10-Q for the quarter ended March 31, 2012 (Commission File No. 000-09165).
|
|
(xii)*
|
|
Form of grant notice and terms and conditions for performance stock units granted in 2012 under the 2011 Long-Term Incentive Plan—Incorporated by reference to Exhibit 10(iii) to our Form 10-Q for the quarter ended March 31, 2012 (Commission File No. 000-09165).
|
|
(xiii)*
|
|
Form of grant notice and terms and conditions for stock options granted in 2011 under the 2006 Long-Term Incentive Plan—Incorporated by reference to Exhibit 10(ii) to our Form 10-K for the year ended December 31, 2010 (Commission File No. 000-09165).
|
|
(xiv)*
|
|
Form of grant notice and terms and conditions for restricted stock units granted in 2011 under the 2006 Long-Term Incentive Plan—Incorporated by reference to Exhibit 10(iii) to our Form 10-K for the year ended December 31, 2010 (Commission File No. 000-09165).
|
|
(xv)*
|
|
Form of grant notice and terms and conditions for performance stock units granted in 2011 under the 2006 Long-Term Incentive Plan—Incorporated by reference to Exhibit 10(iv) to our Form 10-K for the year ended December 31, 2010 (Commission File No. 000-09165).
|
|
(xvi)*
|
|
Form of terms and conditions for restricted stock units granted in 2010 under the 2006 Long-Term Incentive Plan.—Incorporated by reference to Exhibit 10(iii) to our Form 10-K for the year ended December 31, 2009 (Commission File No.000-09165).
|
|
(xvii)*
|
|
Supplemental Savings and Retirement Plan (as amended effective January 1, 1995)—Incorporated by reference to Exhibit 10(iii) to our Form 10-K for the year ended December 31, 1994 (Commission File No.000-09165).
|
|
(xviii)*
|
Stryker Corporation Executive Bonus Plan—Incorporated by reference to Exhibit 10.1 to our Form 8-K dated February 21, 2007 (Commission File No. 000-09165).
|
|
|
(xix)
|
Form of Indemnification Agreement for Directors—Incorporated by reference to Exhibit 10 (xiv) to our Form 10-K for the year ended December 31, 2008 (Commission File No. 000-09165).
|
|
|
(xx)
|
Form of Indemnification Agreement for Certain Officers—Incorporated by reference to Exhibit 10 (xv) to our Form 10-K for the year ended December 31, 2008 (Commission File No. 000-09165).
|
|
|
(xxi)
|
Resignation Agreement and General Release dated February 21, 2012 by and between Stryker Corporation and Stephen P. MacMillan— Incorporated by reference to Exhibit 10.1 to our Form 8-K dated February 24, 2012 (Commission File No. 000-09165).
|
|
|
(xxii)
|
Letter Agreement dated September 28, 2012 between Stryker Corporation and Kevin A. Lobo— Incorporated by reference to Exhibit 10.1 to our Form 8-K dated October 3, 2012 (Commission File No. 000-09165).
|
|
|
(xxiii)
|
Letter Agreement dated October 1, 2012 between Stryker Corporation and Dean H. Bergy— Incorporated by reference to Exhibit 10.2 to our Form 8-K dated October 3, 2012 (Commission File No. 000-09165).
|
|
|
(xxiv)
|
Transition Services and Separation Agreement dated as of October 1, 2012 between Stryker Corporation and Curt R. Hartman— Incorporated by reference to Exhibit 10.1 to our Amendment No. 1 to Form 8-K dated October 17, 2012 (Commission File No. 000-09165).
|
|
|
(xxv)
|
Agreement and Plan of Merger, dated September 25, 2013, by and among Stryker Corporation, Lauderdale Merger Corporation and MAKO Surgical Corp. — Incorporated by reference to Exhibit 2.1 of our Current Report on Form 8-K filed with the SEC on September 27, 2013 (Commission File No. 000-09165).
|
|
|
(xxvi)
|
Letter Agreement between Stryker Corporation and William Jellison — Incorporated by reference to Exhibit 10.1 of our Current Report on Form 8-K filed with the SEC on April 11, 2013 (Commission File No. 000-09165).
|
|
|
Exhibit 11—
|
|
Statement re: computation of per share earnings
|
|
(i)
|
|
Consolidated Statement of Earnings in Item 8 of this report.
|
|
Exhibit 21—
|
|
Subsidiaries of the registrant
|
|
(i)
|
†
|
List of Subsidiaries.
|
|
Exhibit 23—
|
|
Consent of experts and counsel
|
|
(i)
|
†
|
Consent of Independent Registered Public Accounting Firm.
|
|
Exhibit 31—
|
|
Rule 13a-14(a) Certifications
|
|
48
|
||
|
(i)
|
†
|
Certification by Principal Executive Officer of Stryker Corporation.
|
|
(ii)
|
†
|
Certification by Principal Financial Officer of Stryker Corporation.
|
|
Exhibit 32—
|
|
18 U.S.C. Section 1350 Certifications
|
|
(i)
|
†
|
Certification by Principal Executive Officer of Stryker Corporation.
|
|
(ii)
|
†
|
Certification by Principal Financial Officer of Stryker Corporation.
|
|
Exhibit 99—
|
|
Additional exhibits
|
|
(i)*
|
|
2008 Employee Stock Purchase Plan as amended on February 10, 2009—Incorporated by reference to Exhibit 99 (i) to our Form 10-K for the year ended December 31, 2008 (Commission File No. 000-09165).
|
|
Exhibit 101—
|
|
XBRL (Extensible Business Reporting Language) Documents
|
|
101.INS
|
|
XBRL Instance Document
|
|
101.SCH
|
|
XBRL Schema Document
|
|
101.CAL
|
|
XBRL Calculation Linkbase Document
|
|
101.DEF
|
|
XBRL Definition Linkbase Document
|
|
101.LAB
|
|
XBRL Label Linkbase Document
|
|
101.PRE
|
|
XBRL Presentation Linkbase Document
|
|
*
|
compensation arrangement
|
|
†
|
furnished with this Form 10-K
|
|
49
|
||
TABLE OF CONTENTS
Part IItem 1. BusinessItem 1A. Risk FactorsItem 1B. Unresolved Staff CommentsItem 2. PropertiesItem 3. Legal ProceedingsItem 4. Mine SafetyPart IIItem 5. Market For The Registrant S Common Equity, Related Stockholder Matters and Issuer Purchases Of Equity SecuritiesItem 6. Selected Financial DataItem 7. Management S Discussion and Analysis Of Financial Condition and Results Of OperationsItem 7A. Quantitative and Qualitative Disclosures About Market RiskItem 8. Financial Statements and Supplementary DataNote 1 - Significant Accounting PoliciesNote 2 - Accumulated Other Comprehensive Income (aoci)Note 3 - Fair Value MeasurementsNote 4 - Derivative Instruments and Hedging StrategiesNote 5 - AcquisitionsNote 6 - Goodwill and Other Intangible AssetsNote 7 - Contingencies and CommitmentsNote 8 - Debt and Credit FacilitiesNote 9 - Capital StockNote 10 - Restructuring ChargesNote 11 - Income TaxesNote 12 - Retirement PlansNote 13 - Segment and Geographic DataNote 14 - Summary Of Quarterly Data (unaudited)Item 9. Changes in and Disagreements with Accountants on Accounting and Financial DisclosureItem 9A. Controls and ProceduresItem 9B. Other InformationPart IIIItem 10. Directors, Executive Officers and Corporate GovernanceItem 11. Executive CompensationItem 12. Security Ownership Of Certain Beneficial Owners and Management and Related Stockholder MattersItem 13. Certain Relationships and Related Transactions, and Director IndependenceItem 14. Principal Accounting Fees and ServicesPart IVItem 15. Exhibits, Financial Statement Schedules