MOLSON COORS BEVERAGE CO
10-Ks and 10-Qs
|
|
|
|
|
|
|
|
|
|
|
|
|
|
|
|
|
|
|
|
|
|
|
|
|
|
|
|
|
|
|
|
|
|
|
|
|
|
|
|
|
|
|
|
|
|
|
|
|
|
|
|
|
|
|
|
|
|
|
UNITED STATES
SECURITIES AND EXCHANGE COMMISSION
Washington, D.C. 20549
_______________________________________________________________
FORM 10-K
|
(Mark One)
|
|
|
ý
|
ANNUAL REPORT PURSUANT TO SECTION 13 OR 15(d) OF THE SECURITIES EXCHANGE ACT OF 1934
|
|
For the fiscal year ended December 29, 2012
|
|
|
OR
|
|
|
o
|
TRANSITION REPORT PURSUANT TO SECTION 13 OR 15(d) OF THE SECURITIES EXCHANGE ACT OF 1934
|
|
For the transition period from ______ to ______ .
|
|
Commission File Number: 1-14829

Molson Coors Brewing Company
(Exact name of registrant as specified in its charter)
|
DELAWARE
|
|
84-0178360
|
|
(State or other jurisdiction of
incorporation or organization)
|
|
(I.R.S. Employer
Identification No.)
|
|
1225 17th Street, Denver, Colorado
1555 Notre Dame Street East, Montréal, Québec, Canada
|
|
80202
H2L 2R5
|
|
(Address of principal executive offices)
|
|
(Zip Code)
|
303-927-2337 (Colorado)
514-521-1786 (Québec)
(Registrant's telephone number, including area code)
_______________________________________________________________
Securities registered pursuant to Section 12(b) of the Act:
|
Title of each class
|
|
Name of each exchange
on which registered
|
|
Class A Common Stock, $0.01 par value
|
|
New York Stock Exchange
|
|
Class B Common Stock, $0.01 par value
|
|
New York Stock Exchange
|
Securities registered pursuant to Section 12(g) of the Act: None
Indicate by check mark if the registrant is a well-known seasoned issuer, as defined in Rule 405 of the Securities Act. YES
ý
NO
o
Indicate by check mark if the registrant is not required to file reports pursuant to Section 13 or Section 15(d) of the Act. YES
o
NO
ý
Indicate by check mark whether the registrant (1) has filed all reports required to be filed by Section 13 or 15(d) of the Securities Exchange Act of 1934 during the preceding 12 months (or for such shorter period that the registrant was required to file such reports), and (2) has been subject to such filing requirements for the past 90 days. YES
ý
NO
o
Indicate by check mark whether the registrant has submitted electronically and posted on its corporate Web site, if any, every Interactive Data File required to be submitted and posted pursuant to Rule 405 of Regulation S-T (§232.405 of this chapter) during the preceding 12 months (or for such shorter period that the registrant was required to submit and post such files). YES
ý
NO
o
Indicate by check mark if disclosure of delinquent filers pursuant to Item 405 of Regulation S-K (§ 229.405 of this chapter) is not contained herein, and will not be contained, to the best of registrant's knowledge, in definitive proxy or information statements incorporated by reference in Part III of this Form 10-K or any amendment to this Form 10-K.
o
Indicate by check mark whether the registrant is a large accelerated filer, an accelerated filer, a non-accelerated filer, or a smaller reporting company. See the definitions of "large accelerated filer," "accelerated filer" and "smaller reporting company" in Rule 12b-2 of the Exchange Act.
|
Large accelerated filer
ý
|
|
Accelerated filer
o
|
|
Non-accelerated filer
o
|
|
Smaller reporting company
o
|
|
(Do not check if a smaller reporting company)
|
||||||
Indicate by check mark whether the registrant is a shell company (as defined in Rule 12b-2 of the Act). YES
o
NO
ý
The aggregate market value of the registrant's voting and non-voting common stock held by non-affiliates of the registrant at the close of business on June 29, 2012, was $6,037,690,186 based upon the last sales price reported for such date on the New York Stock Exchange and the Toronto Stock Exchange. For purposes of this disclosure, shares of common and exchangeable stock held by persons holding more than 10% of the outstanding shares of stock and shares owned by officers and directors of the registrant as of June 29, 2012, are excluded in that such persons may be deemed to be affiliates. This determination is not necessarily conclusive of affiliate status for other purposes.
The number of shares outstanding of each of the registrant's classes of common stock, as of
February 15, 2013
:
|
Class A Common Stock—2,556,894 shares
|
|
Class B Common Stock—156,773,354 shares
|
Exchangeable shares:
As of
February 15, 2013
, the following number of exchangeable shares was outstanding for Molson Coors Canada, Inc.:
|
Class A Exchangeable Shares—2,896,943 shares
|
|
Class B Exchangeable Shares—19,246,210 shares
|
These Class A and Class B exchangeable shares offer substantially the same economic and voting rights as the respective classes of common shares of the registrant. This is achieved via the following structure: The registrant has outstanding one share each of special Class A and Class B voting stock, through which the holders of Class A exchangeable shares and Class B exchangeable shares of Molson Coors Canada Inc. (a subsidiary of the registrant), respectively, may exercise their voting rights with respect to the registrant. The special Class A and Class B voting stock are entitled to one vote for each of the exchangeable shares, respectively, excluding shares held by the registrant or its subsidiaries, and generally vote together with the Class A common stock and Class B common stock, respectively, on all matters on which the Class A common stock and Class B common stock are entitled to vote. The trustee holder of the special Class A voting stock and the special Class B voting stock has the right to cast a number of votes equal to the number of then outstanding Class A exchangeable shares and Class B exchangeable shares, respectively.
Documents Incorporated by Reference:
Portions of the registrant's definitive proxy statement for the registrant's
2013
annual meeting of stockholders, which will be filed no later than 120 days after the close of the registrant's fiscal year ended
December 29, 2012
, are incorporated by reference under Part III of this Annual Report on Form 10-K.
MOLSON COORS BREWING COMPANY AND SUBSIDIARIES
INDEX
|
|
|
|
Page
|
|
|
|||
|
|
|||
|
|
|||
|
|
|||
|
|
|||
|
|
|||
|
|
|||
|
|
|||
|
|
|||
|
|
|||
|
|
|||
|
|
|||
|
|
|||
|
|
|||
|
|
|||
|
|
|||
|
|
|||
|
|
|||
|
|
|||
|
|
|||
1
Cautionary Statement Pursuant to Safe Harbor Provisions of the Private Securities Litigation Reform Act of 1995
This Annual Report on Form 10-K contains forward-looking statements within the meaning of Section 27A of the Securities Act of 1933 and Section 21E of the Securities Exchange Act of 1934 (the "Exchange Act"). From time to time, we may also provide oral or written forward-looking statements in other materials we release to the public. Such forward-looking statements are subject to the safe harbor created by the Private Securities Litigation Reform Act of 1995.
Statements that refer to projections of our future financial performance, our anticipated growth and trends in our businesses, and other characterizations of future events or circumstances are forward-looking statements, and include, but are not limited to, statements in Part II—Item 7 Management's Discussion and Analysis of Financial Condition and Results of Operations in this report, and under the heading "Outlook for
2013
" therein, relating to overall volume trends, consumer preferences, pricing trends, industry forces, cost reduction strategies, anticipated results, anticipated synergies, expectations for funding future capital expenditures and operations, debt service capabilities, shipment levels and profitability, market share and the sufficiency of capital resources. In addition, statements that we make in this report that are not statements of historical fact may also be forward-looking statements. Words such as "expects," "goals," "plans," "believes," "continues," "may," "anticipate," "seek," "estimate," "outlook," "trends," "future benefits," "strategies," and variations of such words and similar expressions are intended to identify forward-looking statements.
Forward-looking statements are subject to risks and uncertainties that could cause actual results to be materially different from those indicated (both favorably and unfavorably). These risks and uncertainties include, but are not limited to those described under the heading "Risk Factors," elsewhere throughout this report, and those described from time to time in our past and future reports filed with the Securities and Exchange Commission ("SEC"). Caution should be taken not to place undue reliance on any such forward-looking statements. Forward-looking statements speak only as of the date when made and we undertake no obligation to update any forward-looking statement, whether as a result of new information, future events or otherwise.
2
Unless otherwise noted in this report, any description of "we", "us" or "our" includes Molson Coors Brewing Company ("MCBC" or the "Company"), principally a holding company, and its subsidiaries. On June 15, 2012, we completed our acquisition (the "Acquisition") of StarBev Holdings S.a.r.l. ("StarBev"), which we subsequently renamed Molson Coors Central Europe ("MCCE"), operating in Central Europe (which includes Czech Republic, Serbia, Croatia, Romania, Bulgaria, Hungary, Montenegro, Bosnia-Herzegovina and Slovakia). Our other subsidiaries include: Molson Coors Canada ("MCC"), operating in Canada; MillerCoors LLC ("MillerCoors"), which is accounted for by us under the equity method of accounting, operating in the United States ("U.S."); Molson Coors Brewing Company (UK) Limited ("MCBC-UK"), operating in the United Kingdom ("U.K.") and the Republic of Ireland; Molson Coors International ("MCI") operating in various other countries; and our other non-operating subsidiaries. Any reference to "Coors" means the Adolph Coors Company prior to the 2005 merger with Molson Inc. (the "Merger"). Any reference to Molson Inc. or Molson means MCC prior to the Merger. Any reference to "Molson Coors" means MCBC after the Merger.
Unless otherwise indicated, information in this report is presented in U.S. dollars ("USD" or "$").
Background
We are one of the world's largest brewers and have a diverse portfolio of owned and partner brands, including signature brands
Coors Light
,
Molson Canadian
,
Carling
and
Staropramen
, as well as craft and specialty beers such as
Blue Moon
,
Creemore Springs,
Cobra
and
Doom Bar
. For more than 350 combined years, we have been brewing, innovating and delighting the world's beer drinkers. Our success depends on our ability to make our products available to meet a wide range of consumer segments and occasions.
Molson and Coors were founded in 1786 and 1873, respectively. Our commitment to producing the highest quality beers is a key part of our heritage and remains so to this day. Our brands are designed to appeal to a wide range of consumer tastes, styles and price preferences. Our largest markets are Canada, the U.S. and Europe.
Coors was incorporated in June 1913 under the laws of the state of Colorado. In August 2003, Coors changed its state of incorporation to the state of Delaware. In February 2005, upon completion of the Merger, Coors changed its name to Molson Coors Brewing Company.
Our Segments
In 2012, we operated the following segments: Canada, the U.S., Central Europe, the U.K., and MCI. The U.K. and Central Europe segments will be shown as a single European segment, named Molson Coors Europe, effective the beginning of fiscal year 2013. A separate operating team manages each segment and each segment manufactures, markets, and sells beer and other beverage products.
See Part II—Item 8 Financial Statements and Supplementary Data, Note 4 "Segment Reporting" of the Notes to the Consolidated Financial Statements ("Notes") for information relating to our segments and operations, including financial and geographic information. For certain risks attendant to our foreign operations, refer to Part I—Item 1A, "Risk Factors" and the discussions regarding our Canada, Central Europe, U.K. and MCI segments.
Our Products
We have a diverse portfolio of owned and partner brands, including signature brands
Coors Light, Molson Canadian, Carling
and
Staropramen,
which are positioned to meet a wide range of consumer segments and occasions in a variety of markets.
Brands sold in Canada include
Coors Light
,
Molson Canadian
,
Molson Export, Molson Canadian 67, Coors Light Iced T, Molson Dry
,
Molson M,
the
Rickard's
family of brands,
Carling, Carling Black Label, Pilsner, Keystone, Creemore Springs
, the
Granville Island
brands,
Caffrey's, Cobra,
and a number of other regional brands. We also brew or distribute under license the following brands:
Heineken, Amstel Light,
Murphy's, Newcastle Brown Ale
and
Strongbow
cider under license from Heineken N.V. ("Heineken"), and
Miller Lite
,
Miller Genuine Draft
,
Miller Chill, Milwaukee's Best,
and
Milwaukee's Best Dry
under license from SABMiller plc ("SABMiller"). In 2012, we continued to brew the
Foster's
brand under license from Foster's Group Limited ("Foster's") although this license was terminated in December 2012. We are also party to a joint venture with Grupo Modelo S.A.B. de C.V. ("Modelo") that imports, distributes and markets the Modelo beer brand portfolio, including the
Corona, Coronita, Negra Modelo,
and
Pacifico
brands, across all Canadian provinces and territories. In Canada, we also have
3
contract brewing agreements to produce for the U.S. market
Asahi
and
Asahi Select
for Asahi Breweries, Ltd. and
Labatt Blue
and
Labatt Blue Light
for North American Breweries, Inc.
MillerCoors sells a wide variety of brands in the U.S. In the formation of the MillerCoors joint venture, MCBC and SABMiller each assigned the United States and Puerto Rican ownership rights to its respective legacy brands to MillerCoors, but retained all ownership of these brands outside the United States and Puerto Rico. MillerCoors' flagship premium light brands are
Coors Light,
Miller Lite
and
Miller64
. Brands in the domestic premium segment include
Coors Banquet
and
Miller Genuine Draft
. Brands in the below premium segment include
Miller High Life, Keystone
,
Icehouse
,
Mickey's
,
Milwaukee's Best, Hamm's,
and
Old English 800
brands. MillerCoors also brews or distributes under license the
Molson
and
Foster's
brands and
George Killian's Irish Red
. Craft and import brands, marketed and sold through Tenth and Blake, include the
Blue Moon
brands,
Henry Weinhard's
brands
,
Leinenkugel's
brands,
Peroni Nastro Azzurro
,
Pilsner Urquell,
Batch 19,
Grolsch, Worthington's, St. Stefanus
and cider brands from the Crispin Cider Company. Brands in the non-alcoholic segment include
Coors Non-Alcoholic
and
Sharp's
.
Brands sold in Central Europe include
Staropramen, Branik, Ostravar, Ozujsko, Borsodi, Kamenitza, Astika, Jelen, Niksicko, Bergenbier, Noroc
and
Apatinsko
as well as other regional brands
.
The Central European business has licensing agreements with various other brewers through which it also brews or distributes the
Stella Artois, Hoegaarden, Leffe, Beck's, Lowenbrau, Spaten, Löwenweisse
and
Belle-Vue Kriek
brands in certain central European countries.
Brands sold in the U.K. and Ireland include:
Carling
,
Carling Zest
,
Coors Light
,
Worthington's
,
White Shield, Red Shield, Caffrey's
, Sharp's
Doom Bar,
and
Blue Moon,
as well as a number of smaller regional ale brands. We also sell the
Grolsch
brands through a joint venture with Royal Grolsch N.V. and the
Cobra
brands through a joint venture called Cobra Beer Partnership Ltd., and are the exclusive distributor for several brands which are sold under license, including
Corona, Coronita, Negra Modelo
,
Pacifico,
and
Singha
. Additionally, in order to be able to provide a full line of beer and other beverages to our U.K. on-premise customers, we sell "factored" brands, which are third-party beverage brands for which we provide distribution to retail, typically on a non-exclusive basis.
MCI also markets and sells several of our brands in its international markets. Brands unique to these international markets include
Zima, Iceberg
brands
, Coors Gold,
and
Coors Extra.
Canada Segment
We are Canada's second-largest brewer by volume and North America's oldest beer company. Our approximate market share of the Canada beer market in
2012
was 39%. We brew, market, sell and distribute a wide variety of beer brands nationally. Our portfolio has leading brands in all major product and price segments. Our focus and investment is on key owned brands, including
Coors Light, Molson Canadian, Carling, Molson Dry, Molson Export, Rickard's, Pilsner, Creemore Springs
and
Granville Island
and strategic distribution partnerships, including those with Heineken, Modelo and SABMiller. In
2012
,
Coors Light
had an approximate 14% market share and was the top selling beer brand in Canada, and
Molson Canadian
had an approximate 8% market share and was the third top selling beer in Canada.
The Canada segment also includes our partnership arrangements related to the distribution of beer in Ontario, Brewers' Retail Inc. ("BRI"), and in the Western provinces, Brewers' Distributor Ltd. ("BDL"). BRI and BDL are accounted for under the equity method of accounting.
Sales and Distribution
In Canada, provincial governments regulate the beer industry, particularly with regard to the pricing, mark-up, container management, sale, distribution, and advertising of beer. Distribution and the retail sale of alcohol products involve a wide range and varied degree of Canadian government control through their respective provincial liquor boards.
Province of Ontario
In Ontario, beer may only be purchased at retail outlets operated by BRI, at government-regulated retail outlets operated by the Liquor Control Board of Ontario, at approved agents of the Liquor Control Board of Ontario, or at any bar, restaurant, or tavern licensed by the Liquor Control Board of Ontario to sell liquor for on-premise consumption. We, together with certain other brewers, participate in the ownership of BRI in proportion to provincial market share relative to other brewers in the ownership group. Brewers may deliver directly to BRI's outlets or may choose to use BRI's distribution centers to access retail stores in Ontario, the Liquor Control Board of Ontario system and licensed establishments.
Province of Québec
In Québec, beer is distributed to retail outlets directly by each brewer or through independent agents. We are the agent for the licensed brands we distribute. The brewer or agent distributes the products to permit holders for retail sales for on-premise
4
consumption. Québec retail sales for off-premise consumption are made through grocery and convenience stores as well as government operated outlets.
Province of British Columbia
In British Columbia, the government's Liquor Distribution Branch controls the regulatory elements of distribution of all alcohol products in the province. BDL, which we co-own with a competitor, manages the distribution of our products throughout British Columbia. Consumers can purchase beer at any Liquor Distribution Branch retail outlet, at any independently owned and licensed retail store or at any licensed establishment for on-premise consumption. Establishments licensed primarily for on-premise liquor sales may also be licensed for off-premise consumption.
Province of Alberta
In Alberta, the distribution of beer is managed by independent private warehousing and shipping companies or by a government sponsored system in the case of U.S. sourced products. All sales of liquor in Alberta are made through retail outlets licensed by the Alberta Gaming and Liquor Commission or licensees, such as bars, hotels and restaurants. BDL manages the distribution of our products in Alberta.
Other Provinces
Our products are distributed in the provinces of Manitoba and Saskatchewan through local liquor boards. Manitoba and Saskatchewan also have licensed private retailers. BDL manages the distribution of our products in Manitoba and Saskatchewan. In the Maritime Provinces (other than Newfoundland), local liquor boards distribute and sell our products. In Yukon, Northwest Territories and Nunavut, government liquor commissioners manage the distribution and sale of our products.
Manufacturing, Production and Packaging
Brewing Raw Materials
We select global suppliers in order to procure the highest quality materials and services at the lowest prices available. We also use hedging instruments to mitigate the risk of volatility in certain commodities and foreign exchange markets.
We source barley malt from one primary provider. Hops are purchased from a variety of global suppliers in the U.S., Europe, and New Zealand. Other starch brewing adjuncts are sourced from two main suppliers, both in North America. We do not foresee any significant risk of disruption in the supply of these agricultural products. Water used in the brewing process is from local sources in the communities where our breweries operate. We do not anticipate future difficulties in accessing water or agricultural products.
Brewing and Packaging Facilities
We operate seven breweries, strategically located throughout Canada, which brew and package all owned and certain licensed brands sold in and exported from Canada. See Item 2, "Properties" for further detail.
Packaging Materials
We single source glass bottles and have a committed supply through 2014. We source cans and lids from two primary providers and are currently negotiating long-term contracts with each. We currently utilize a hedging program for aluminum requirements in Canada. We do not expect any future difficulties in accessing glass bottles or aluminum cans. The distribution systems in each province generally provide the collection network for returnable bottles and aluminum cans. The standard container for beer brewed in Canada is the 341 ml returnable bottle, which in
2012
represented a significant majority of the approximately 47% of volume sales in Canada in bottles. In
2012
, aluminum cans accounted for approximately 42% of our volume sales in Canada. In
2012
, we sold approximately 11% of our beer volume in stainless steel kegs. A limited number of kegs are purchased every year, and we have no long-term supply commitment. Crowns, labels, corrugate, and paperboard are purchased from a small number of sources unique to each product. We do not foresee difficulties in accessing these packaging products in the near future.
Contract Manufacturing
We have an agreement with North American Breweries, Inc. to brew, package and ship
Labatt
trademark brands to the U.S. market through 2016.
5
Seasonality of Business
Consumption of beer in Canada is seasonal. In 2012, approximately 40% of our sales volume occurred during the four months from May through August, which is consistent with our historical results.
Known Trends and Competitive Conditions
2012
Canada Beer Industry Overview
The Canadian brewing industry is a mature market. It is characterized by aggressive competition for volume and market share from regional brewers, microbrewers and certain foreign brewers, as well as our main domestic competitor. These competitive pressures require significant annual investment in marketing and selling activities.
There are three major beer price segments: above premium, which includes most imports; premium, which includes the majority of domestic brands and the light sub-segment; and value (below premium).
Since 2001, the premium beer segment in Canada has gradually lost volume to the above premium and value segments. From 2003 to 2008, Canada beer industry shipments annual average growth rate approximated 1%. For each of 2009 and 2010, there were slight declines, and for each of 2011 and 2012, there were approximate declines of 2% in Canada beer industry shipments.
Our Competitive Position
Our brands compete with competitor beer brands and other alcohol beverages, including wine and spirits, and thus our competitive position is affected by consumer preferences between and among these other categories. Our brand portfolio gives us strong representation in all major beer segments.
The Canada brewing industry is composed principally of two major brewers, MCBC, which had approximately 39% of the market share in 2012, and Anheuser-Busch InBev ("ABI"), which had approximately 42% of the market share in 2012. In
2012
, the Ontario and Québec markets accounted for approximately 61% of the total beer market in Canada.
Regulation
In Canada, provincial governments regulate the production, marketing, distribution, selling, and pricing of beer (including the establishment of minimum prices), and impose commodity taxes and license fees in relation to the production and sale of beer. During November 2012, an increase in beer excise taxes of over 20% was announced and affected in Québec. In addition, the federal government regulates the advertising, labeling, quality control, and international trade of beer, and also imposes commodity taxes, consumption taxes, excise taxes, and in certain instances, custom duties on imported beer. In 2012, our Canada excise taxes totaled $638.4 million or approximately $75 per hectoliter sold. Further, certain bilateral and multilateral treaties entered into by the federal government, provincial governments and certain foreign governments, especially with the United States, affect the Canadian beer industry.
United States Segment
MillerCoors is the nation's second largest brewer by volume, selling approximately 29% of the total 2012 U.S. brewing industry shipments (excluding exports and U.S. shipments of imports). MillerCoors was formed on July 1, 2008 as a joint venture between MCBC and SABMiller. Each party contributed its U.S. and Puerto Rico businesses and related operating assets and certain liabilities. The percentage interests in the profits of MillerCoors are 58% for SABMiller and 42% for MCBC. Voting interests are shared 50%-50%, and MCBC and SABMiller have equal board representation within MillerCoors. MCBC and SABMiller each agreed not to transfer its economic or voting interests in MillerCoors for a period commencing on the date of combination and expiring on July 1, 2013, and certain rights of first refusal apply to any subsequent assignment. Our interest in MillerCoors is accounted for under the equity method of accounting.
Prior to the formation of MillerCoors, MCBC produced, marketed, and sold the MCBC portfolio of brands in the United States and its territories, and its U.S. operating segment included the results of the Rocky Mountain Metal Container ("RMMC") and Rocky Mountain Bottle Container ("RMBC") joint ventures. Effective July 1, 2008, MCBC's equity investment in MillerCoors represents our U.S. operating segment.
Sales and Distribution
In the United States, beer is generally distributed through a three-tier system consisting of manufacturers, distributors and retailers. A national network of approximately 450 independent distributors purchases MillerCoors' products and distributes them to retail accounts. In
2012
, approximately 18% was sold on-premise in bars and restaurants, and the other 82% was sold
6
off-premise in convenience stores, grocery stores, liquor stores and other retail outlets. MillerCoors wholly owns one distributorship, which handled less than 1% of its total volume in
2012
.
Manufacturing, Production and Packaging
Brewing Raw Materials
MillerCoors uses the highest quality ingredients to brew its products. MillerCoors malts a portion of its production requirements, using barley purchased under yearly contracts from independent farmers located in the western United States. Other barley, malt, and cereal grains are purchased from suppliers primarily in the U.S. Hops are purchased from suppliers in the U.S., New Zealand and certain European countries. MillerCoors has water rights to provide for and to sustain brewing operations in case of a prolonged drought in the regions for which it has operations. MillerCoors does not anticipate future difficulties in accessing water or agricultural products.
Brewing and Packaging Facilities
There are eight major breweries/packaging facilities which produce MillerCoors products. MillerCoors imports
Molson
brands and
Worthington's
from MCBC and
Peroni Nastro Azzurro
,
Pilsner Urquell
,
Grolsch
, and other import brands from SABMiller.
Packaging Materials
Over half of U.S. products sold were packaged in aluminum cans in
2012
. A portion of aluminum cans were purchased from RMMC, a joint venture between MillerCoors and Ball Corporation ("Ball"), whose production facilities are located near the brewery in Golden, Colorado. In addition to the supply agreement with RMMC, MillerCoors has a commercial supply agreement with Ball to purchase cans and ends in excess of what is supplied through RMMC; these agreements have various expiration dates. In 2011, MillerCoors signed a 10-year contract extension with Ball to extend the RMMC joint venture agreement along with the commercial can and end purchase agreements. Approximately one-third of U.S. products sold in
2012
were packaged in glass bottles of which a portion was provided by RMBC, a joint venture between MillerCoors and Owens-Brockway Glass Container, Inc ("Owens"). The joint venture with Owens, as well as a supply agreement with Owens for the glass bottles required in excess of RMBC's production, expires in 2015. The approximate remaining 10% of U.S. production volume sold in
2012
was packaged in half, quarter, and one-sixth barrel stainless steel kegs. A limited number of kegs are purchased each year, and there is no long-term supply agreement. Crowns, labels, corrugate and paperboard are purchased from a small number of sources unique to each product. MillerCoors does not foresee difficulties in accessing packaging products in the near future.
Contract Manufacturing
MillerCoors has an agreement to brew, package and ship products for Pabst Brewing Company through June 2020. Additionally, MillerCoors produces beer under contract for our MCI segment and SABMiller.
Seasonality of the Business
MillerCoors U.S. sales volumes are normally lowest in the winter months (first and fourth quarters) and highest in the summer months (second and third quarters).
Known Trends and Competitive Conditions
2012
U.S. Beer Industry Overview
The beer industry in the United States is highly competitive, and the two largest brewers, ABI and MillerCoors together represented approximately 77% of the market in 2012. The formation of MillerCoors in 2008 created a stronger U.S. presence for MCBC with the scale, operational efficiency and distribution platform to compete more effectively in the U.S. market place. Growing or even maintaining market share has required significant investments in marketing. From 1998 to 2008, the U.S. beer industry shipments annual growth rate approximated 1%, compared with declines ranging from 1% to 2% in each of the years 2009, 2010 and 2011. In 2012, industry volumes improved, with estimated overall growth of 1% to 2%.
The 2009 to 2011 decline in the U.S. beer industry has been partially attributed to relatively poor economic conditions. High rates of unemployment and lower consumer confidence have negatively affected the legal age key beer drinkers' purchasing behaviors.
7
Our Competitive Position
The MillerCoors portfolio of beers competes with numerous above-premium, premium, and economy brands. These competing brands are produced by international, national, regional and local brewers. MillerCoors competes most directly with ABI, but also competes with imported and craft beer brands. MillerCoors is the nation's second largest brewer by volume, selling approximately 29% of the total
2012
U.S. brewing industry shipments (including exports and U.S. shipments of imports). This compares to ABI's estimated market share of 48%.
MillerCoors' products also compete with other alcohol beverages, including wine and spirits, and thus their competitive position is affected by consumer preferences between and among these other categories. Driven by increased spirits advertising along with increased wine and spirits sales execution, sales of wine and spirits have grown faster than sales of beers in recent years, resulting in a reduction in the beer segment's lead in the overall alcohol beverage market.
Regulation
The U.S. beer business is regulated by federal, state, and local governments. These regulations govern many parts of MillerCoors' operations, including brewing, marketing and advertising, transportation, distributor relationships, sales, and environmental issues. To operate their facilities, MillerCoors must obtain and maintain numerous permits, licenses and approvals from various governmental agencies, including the U.S. Treasury Department; Alcohol and Tobacco Tax and Trade Bureau; the U.S. Department of Agriculture; the U.S. Food and Drug Administration; state alcohol regulatory agencies; and state and federal environmental agencies.
Governmental entities also levy taxes and may require bonds to ensure compliance with applicable laws and regulations. U.S. federal excise taxes on malt beverages approximated $15 per hectoliter in
2012
. State excise taxes are levied in specific states at varying rates.
Central Europe Segment
As a result of our Acquisition of StarBev, we are Central Europe's third largest brewer by volume with an approximate 22% market share in
2012
. The majority of sales are in Czech Republic, Serbia, Romania, Bulgaria, Croatia and Hungary. Our portfolio includes beers that have the largest share in their respective countries, such as
Jelen
in Serbia and
Ozujsko
in Croatia. We have beers that rank in the top four in market share in countries throughout the region, including
Staropramen, Bergenbier, Kamenitza
and
Borsodi.
We also brew and distribute
Stella Artois, Beck's, Lowenbrau
and
Spaten
under license agreements with ABI companies.
Sales and Distribution
In Central Europe, beer is generally distributed through a three-tier system consisting of manufacturers, distributors and retailers, except for on-premise sales in Czech Republic and to certain key international accounts for which we sell directly to retailers.
Off-Premise Channel
The off-premise channel includes sales to supermarkets, convenience stores, liquor stores, distributors, and wholesalers. The off-premise channel accounted for approximately 70% of our Central Europe sales volume in 2012, of which approximately 36% consisted of sales made through wholesalers to smaller outlets (which is referred to as "traditional off-trade") and approximately 34% consisted of direct sales to large retailers (which is referred to as "modern off-trade").
On-Premise Channel
The on-premise channel accounted for approximately 30% of our Central Europe sales volume in 2012. The installation and maintenance of draught beer dispensing equipment in the on-premise channel is generally the responsibility of the brewer. Accordingly, we own refrigeration units and other equipment used to dispense beer from kegs to consumers that are used in on-premise outlets.
Distribution
Distribution activities for both the on-premise and off-premise channels are conducted primarily by third-party logistics providers, of which there are several hundred operating across the Central European business. We also conduct a small amount of secondary distribution in Czech Republic utilizing our own fleet of vehicles.
8
Manufacturing, Production and Packaging
Brewing Raw Materials
We have entered into long term contracts with two suppliers for most of our required malt for 2012. These contracts are with Boortmalt and Malteries Soufflet and expire in December 2015 and December 2020, respectively. The remaining 20% was acquired from various malt suppliers in the region. Hops are purchased under various contracts with German suppliers, which cover our anticipated needs through June 2014, and adjuncts are purchased under various contracts with local producers, which cover 80% of our needs for 2013. Water used in the brewing process is sourced through water rights and supply contracts. We do not anticipate future difficulties in accessing required water or agricultural products.
Brewing and Packaging Facilities
We operate nine breweries in Central Europe, which brew and package all owned brands sold in Central Europe. See Item 2, "Properties" for further detail.
Packaging Materials
Returnable bottles represented a significant majority of the approximately 46% of bottle volume sales in Central Europe in 2012. We have contracts with two primary providers for returnable bottles. Approximately 27% of our Central Europe volume sales in 2012 consisted of products packaged in recyclable plastic containers for which we have one year agreements with various manufacturers in the region. Approximately 15% of our Central Europe volume sales in 2012 consisted of products packaged in cans, of which 95% were aluminum and 5% were steel. We have long term contracts with three providers for our required supply of cans. The remaining amount of our Central Europe volume sales in 2012 consisted of products packaged in returnable kegs. A limited number of steel kegs are purchased each year, and we are currently negotiating a long-term supply agreement for our steel keg requirements. Crowns, labels and corrugate are purchased from a small number of sources. We do not foresee difficulties in accessing these or other packaging materials in the near future.
Seasonality of Business
In Central Europe, the beer industry is subject to seasonal sales fluctuations primarily influenced by holidays, weather and major televised sporting events. Peak selling seasons typically occur during the summer and during the Christmas and New Year holidays.
Known Trends and Competitive Conditions
2012
Central Europe Beer Industry Overview
The Central Europe beer market grew volume by approximately 1% in 2012, with volumes shifting from the higher margin on-premise channel to the lower margin off-premise channel. Since 2008, the off-premise market share has increased from 65% to 67% of total volume, and the on-premise market share has declined from 35% to 33%. Central Europe beer industry shipments have increased by approximately 1% in each of 2011 and 2012 after declines of approximately 10% in 2009 and approximately 5% in 2010.
Our Competitive Position
Our principal competitors are SABMiller, Heineken, and Carlsberg Group ("Carlsberg"), with estimated regional market shares in 2012 of approximately 27%, 26%, and 8%, respectively, compared to our share of 22%.
Regulation
Each country that is part of our Central Europe segment is either a member of the European Union or a current candidate to join, and, as such, there are similarities in the regulations that apply to many parts of our Central Europe segment's operations and products, including brewing, food safety, labeling and packaging, marketing and advertising, environmental, health and safety, employment and data protection regulations. To operate breweries and conduct our business in Central Europe, we must obtain and maintain numerous permits and licenses from various governmental agencies.
Each country's government levies excise taxes on all alcohol beverages, and all countries, with the exception of Serbia, use similar measurements based on alcohol by volume or Plato degrees. Currently, Serbia uses a flat excise per hectoliter but is moving toward alignment with the other countries. In
2012
, the excise taxes for our Central Europe segment totaled $131.5 million, or approximately $17 per hectoliter.
9
United Kingdom Segment
We are the United Kingdom's second-largest brewer by volume, with an approximate 18% share (excluding factored products) of the U.K. beer market in 2012. Sales are primarily in England and Wales, with
Carling
representing more than two-thirds of our total U.K. segment beer volume. The U.K. segment consists of our production and sale of the MCBC brands in the U.K. and the Republic of Ireland, our joint venture arrangements for the production and distribution of
Grolsch
and
Cobra
brands in the U.K. and the Republic of Ireland, factored brand sales (beverage brands owned by other companies, but sold and delivered to retail by us), and our Tradeteam joint venture arrangement with DHL (formerly Exel Logistics) for the distribution of products throughout the U.K. Tradeteam is accounted for under the equity method of accounting. Additionally, we distribute the Modelo brands, including
Corona
, pursuant to a distribution agreement with Modelo.
Sales and Distribution
In the U.K., beer is generally distributed through a two-tier system consisting of manufacturers and retailers. Most of our beer in the U.K. is sold directly to retailers. It is also common in the U.K. for brewers to distribute beer, wine, spirits, and other products owned and produced by other companies to the on-premise channel (bars and restaurants). Approximately 20% of our U.K. segment net sales in
2012
represented factored brands. Factored brand sales are included in our net sales and cost of goods, but are not included in our reported volumes.
Generally, over the past three decades, volumes have shifted from the higher margin on-premise channel, where products are consumed in pubs and restaurants, to the lower margin off-premise channel, also referred to as the "take-home" market.
On-Premise Channel
The on-premise channel accounted for approximately 64% of our U.K. sales volumes in
2012
. The on-premise channel has two sub-categories: multiple on-premise and independent on-premise. Multiple on-premise refers to those customers who own a number of pubs and restaurants and independent on-premise refers to individual owner-operators of pubs and restaurants.
In
2012
, approximately 47% and 53% of our on-premise volume sales were made to multiple (including national wholesalers) and independent on-premise customers, respectively. In recent years, pricing competition in the on-premise channel has intensified as the retail pub chains have consolidated. As a result, the larger pub chains have been able to negotiate lower beer prices from brewers. The installation and maintenance of draught beer dispensing equipment in the on-premise channel is generally the responsibility of the brewer. Accordingly, we own equipment used to dispense beer from kegs to consumers. This includes beer lines, cooling equipment, taps, and counter mounts.
Similar to other U.K. brewers, we utilize loans in securing supply relationships with customers in the on-premise market. Loans are normally granted at below-market rates of interest, with the outlet purchasing beer at lower-than-average discount levels to compensate. We reclassify a portion of sales revenue to interest income to reflect the economic substance of these loans. See Part II—Item 8 Financial Statements and Supplementary Data, Note 1 "Basis of Presentation and Summary of Significant Accounting Policies" of the Notes for further discussion.
Off-Premise Channel
The off-premise channel accounted for approximately 36% of our U.K. sales volume in
2012
. The off-premise channel includes direct sales to supermarkets, convenience stores, liquor stores, distributors, and wholesalers. The off-premise channel has become increasingly concentrated among a small number of super-store chains, placing increasing downward pressure on beer pricing.
Distribution
Distribution activities for both the on- and off-premise channels are conducted by Tradeteam, which operates a system of satellite warehouses and a transportation fleet.
Manufacturing, Production and Packaging
Brewing Raw Materials
We use the highest quality water, barley and hops to brew our products. During
2012
, we produced 100% of our required malt using U.K. sourced barley. Hops and adjuncts used in the brewing process are purchased from agricultural sources in the U.K., U.S. and on the European continent. Water used in the brewing process is sourced from various wells that have sufficient recharge capacity for assumed production. We do not anticipate future difficulties in accessing water or agricultural products.
10
Brewing and Packaging Facilities
We operate four breweries in the U.K which brew and package all owned brands sold in the U.K. and the Republic of Ireland with the exception of
Coors Light
, which is contract brewed in the Republic of Ireland. See "Contract Manufacturing" and Item 2, "Properties" for further detail.
Packaging Materials
We used kegs and casks for approximately 59% of the U.K. products sold in
2012
, reflecting a high percentage of product sold on-premise. Approximately 33% of our U.K. products sold in 2012 were packaged in steel cans with aluminum ends. All of our cans are purchased through a supply contract with Ball. Approximately 8% of the U.K. products sold in 2012 were packaged in glass bottles purchased through supply contracts with third-party suppliers. Crowns, labels, corrugate, and paperboard are purchased from sources unique to each product. We do not foresee difficulties in accessing these or other packaging materials in the near future.
Contract Manufacturing
We have a contract brewing and kegging agreement with Heineken for the
Foster's
and
Kronenbourg
brands. We also have an agreement with Heineken whereby it will brew and package certain of our products for sale in the Republic of Ireland through December 2014. In addition, we have a multi-year agreement to contract brew ales for Carlsberg which began in 2011.
Seasonality of Business
In the U.K., the beer industry is subject to seasonal sales fluctuations primarily influenced by holidays, weather and by certain major televised sporting events. Peak selling seasons occur during the summer and during the Christmas and New Year holidays.
Known Trends and Competitive Conditions
2012
U.K. Beer Industry Overview
Sales in the U.K. beer market in
2012
declined by 5.1%, with on-premise sales declining 5.0% and off-premise sales decreasing 5.1%, impacted by poor summer weather and weak economic conditions. Despite a widening price differential between the on-premise (higher prices) and the off-premise (lower prices) channels, volumes in both channels declined in 2012. The recession has accelerated this downward trend. From 1997 through 2007, U.K. beer industry shipments declined at an average rate of 1% to 2% per year, compared to annual declines of approximately 4% from 2008 to
2012
.
While the industry has experienced a general trend away from ales and toward lagers, volume sales of premium bottled ales grew in the off-premise channel in 2012. Sales of lagers accounted for 74% of the total volume sales in the U.K. market in
2012
.
Our Competitive Position
Our beers compete not only with similar products from competitors, but also with other alcohol beverages, including wines, spirits, and ciders. With the exception of stout, where we do not have our own brand, we believe our brand portfolio gives us strong representation in all major beer categories.
Carling
was the number-one beer brand in the U.K. in 2012, and
Coors Light
is one of the fastest growing major brands. We believe the
Corona
,
Cobra
and
Grolsch
brands position us well to take advantage of the growth in more premium world beers alongside our portfolio of imported and specialty beer brands, such as
Singha
and
Blue Moon
. In addition,
Doom Bar
is one of the fastest growing brands in the craft segment.
Our principal competitors are Heineken, ABI, and Carlsberg, with market shares in
2012
of approximately 24%, 17%, and 14%, respectively, compared to our market share of 18%.
Regulation
U.K. regulations apply to many parts of our operations and products, including brewing, food safety, labeling and packaging, marketing and advertising, environmental, health and safety, employment, and data protection regulations. To operate our breweries and carry on business in the U.K., we must obtain and maintain numerous permits and licenses from local Licensing Justices and governmental bodies, including Her Majesty's Revenue & Customs; the Office of Fair Trading; the Data Protection Commissioner and the Environment Agency.
The U.K. government levies excise taxes on all alcohol beverages at varying rates depending on the type of product and its alcohol content by volume. In
2012
, our excise taxes totaled $904.6 million, or $108 per hectoliter. In 2010, the U.K. government announced that alcohol excise tax rates will increase at a rate of 2% above U.K. inflation annually through 2015.
11
Molson Coors International Segment
The objective of MCI is to grow and expand our business and brand portfolios in our non-core and emerging markets, which includes Asia, continental Europe (excluding Central Europe, as it is a part of the Central Europe segment), Mexico, Latin America and the Caribbean (excluding Puerto Rico, as it is a part of the U.S. segment).
Asia
The MCI Asia region is primarily composed of businesses in India, Japan and China. Our joint venture in India gives us a 51% share and operational control of Molson Coors Cobra India ("MC Cobra India"). MC Cobra India produces, sells and markets a beer portfolio consisting of
King Cobra
,
Cobra
and
Iceberg's 9000
. The results of MC Cobra India are consolidated in our financial statements. The Japan business is focused on the
Zima, Coors Light
and
Modelo
brands. Our China business is focused on growing
Coors Light
and other brands
.
During the third quarter of 2012, we deconsolidated our 51% ownership in our joint venture in China, Molson Coors Si'hai ("MC Si'hai"), from our financial statements due to a loss of our ability to control the joint venture.
Europe
Our Central Europe export and license business was added to MCI as part of the Acquisition and is primarily focused on
Staropramen.
This includes the licensing arrangements with ABI to brew and distribute our products in Russia and Ukraine, export arrangements with Carlsberg in the U.K. and Sweden and with ABI in Germany, Canada and Italy, and other export arrangements in various other countries. Our other businesses within continental Europe are focused on growing
Carling
,
Coors Light
and
Cobra
. These products are brewed by and exported from our U.K. breweries to portions of continental Europe. We also have various licensing agreements for the manufacturing and distribution of our products, primarily in Ukraine, Spain and Russia.
Mexico, Latin America, the Caribbean, and Other
Coors Light
is sold in Mexico through an exclusive licensing agreement with Heineken. In the Caribbean and Latin America, our products are produced under a brewing agreement with MillerCoors and are exported to and sold through agreements with independent distributors.
Corporate
Corporate includes interest and certain other general and administrative costs that are not allocated to any of the operating segments. The majority of these corporate costs relate to worldwide administrative functions, such as corporate affairs, legal, human resources, finance and accounting, treasury, insurance and risk management. Additionally, the results of our water resources and energy operations in Colorado are included in Corporate. Corporate also includes certain royalty income and administrative costs related to the management of intellectual property.
Other Information
Global Intellectual Property
We own trademarks on the majority of the brands we produce and have licenses for the remainder. We also hold several patent and design registrations with expiration dates through 2049 relating to beer dispensing systems, packaging and certain other innovations. We are not reliant on patent royalties for our financial success. Therefore, these expirations are not expected to have a significant impact on our business.
Corporate Responsibility
Our corporate responsibility is integral to our business strategy. We are committed to sustainable growth while improving the impact we have on our communities, people and the environment. In 2012, we were named Global Beverage Sector Leader on the Dow Jones Sustainability World Index. We were listed on the Dow Jones Sustainability North America Index in 2011.
Environmental Matters
Our operations are subject to a variety of extensive and changing federal, state and local environmental laws, regulations and ordinances that govern activities or operations that may have adverse effects on human health or the environment. Such laws, regulations or ordinances may impose liability for the cost of remediation, and for certain damages resulting from sites of past releases of hazardous materials. Our policy is to comply with all such legal requirements. While we cannot predict our eventual aggregate cost for the environmental and related matters in which we may be or are currently involved, we believe that any payments, if required, for these matters would be made over a period of time in amounts that would not be material in any one year to our operating results, cash flows, or our financial or competitive position. We believe adequate reserves have been
12
provided for losses that are probable and estimable. However, there can be no assurance that environmental laws will not become more stringent in the future or that we will not incur material costs in the future in order to comply with such laws. See Part II—Item 8 Financial Statements and Supplementary Data, Note 20 "Commitments and Contingencies" of the Notes under the caption "
Environmental"
for additional information regarding environmental matters.
Employees
We have approximately 2,700 full-time employees in our Canada segment, of which 60% are represented by trade unions. We maintain agreements with the various unions representing workers at each of our facilities. MillerCoors has approximately 8,900 employees, of which 35% are represented by unions. Additionally, we have approximately 4,300 employees in our Central Europe segment within Czech Republic, Serbia, Croatia, Romania, Bulgaria, Hungary, Montenegro, Bosnia-Herzegovina and Slovakia and we have approximately 2,200 employees in our U.K. segment, of which 25% of the U.K. total workforce is represented by trade unions. Furthermore, we have approximately 400 employees in our MCI business in 16 countries, primarily in Asia (India, Japan and China) and within our Denver headquarters office. Finally, we have approximately 200 employees in our corporate headquarters in Denver, Colorado.
Financial Information about Foreign and Domestic Operations and Export Sales
See Part II—Item 8 Financial Statements and Supplementary Data, Note 4 "Segment Reporting" of the Notes for discussion of sales, operating income and identifiable assets attributable to our country of domicile, the United States, and all foreign countries.
Available Information
Our internet website is http://www.molsoncoors.com. Through a direct link to our reports at the SEC's website at http://www.sec.gov, we make available, free of charge on our website, our annual reports on Form 10-K, quarterly reports on Form 10-Q, current reports on Form 8-K and amendments to those reports as soon as reasonably practicable after we electronically file or furnish such materials to the SEC. The foregoing website addresses are provided as inactive textual references only. The information provided on our website (or any other website referred to in this report) is not part of this report and is not incorporated by reference as part of this report.
Executive Officers
The following tables set forth certain information regarding our executive officers as of
February 15, 2013
:
|
Name
|
Age
|
Position
|
||
|
Peter Swinburn
|
60
|
President, Chief Executive Officer, and a Director of MillerCoors LLC
|
||
|
Krishnan Anand
|
55
|
President and Chief Executive Officer of Molson Coors International
|
||
|
Peter H. Coors
|
66
|
Vice Chairman of the Board of the Company, Executive Director of Coors Brewing Company, and Chairman of the Board of MillerCoors LLC
|
||
|
Stewart Glendinning
|
47
|
President and Chief Executive Officer of Molson Coors Canada and a Director of MillerCoors LLC
|
||
|
Gavin Hattersley
|
50
|
Chief Financial Officer and a Director of MillerCoors LLC
|
||
|
Mark Hunter
|
50
|
President and Chief Executive Officer of Molson Coors Europe
|
||
|
Celso White
|
51
|
Chief Supply Chain Officer
|
||
|
Samuel D. Walker
|
54
|
Chief People and Legal Officer, Corporate Secretary, and a Director of MillerCoors LLC
|
||
The reader should carefully consider the following risk factors and the other information contained within this document. The risks set forth below are those that management believes are most likely to have a material adverse effect on us. We may also be subject to other risks or uncertainties not presently known to us. If any of the following risks or uncertainties actually occur, it may have a material adverse effect on our business, results of operations and prospects.
Risks Specific to Our Company
Competition in our markets could require us to reduce prices or increase capital and other expenditures or cause us to lose sales volume, any of which could have a material adverse effect on our business and financial results.
In most of our markets, our primary competitors have substantially greater financial, marketing, production and distribution resources than
13
we, and are more diverse in terms of their geographies and brand portfolios. In all of the markets in which we operate, aggressive marketing strategies by these competitors could adversely affect our financial results. In addition, continuing consolidation among major global brewers may lead to stronger or new competitors, loss of partner brands and predatory marketing and pricing tactics by competitors. Moreover, several of our major markets are mature. Our products also compete for consumers against non-beer products such as wine, spirits and other alcoholic and non-alcoholic beverages.
Our success as an enterprise depends largely on the success of relatively few products in several mature markets; the failure or weakening of one or more of these products or markets could materially adversely affect our financial results.
Our
Molson Canadian
and
Coors Light
brands in Canada,
Miller Lite
and
Coors Light
brands in the U.S., and
Carling
brand in the U.K. represented more than half of each respective segment's sales in
2012
. Consequently, any material shift in consumer preferences away from these brands, or from the categories in which they compete, could have a material adverse effect on our business. Consumer preferences and tastes may shift away from our brands or beer generally due to, among others, changing taste preferences, demographics or perceived value. Beer consumption in many of our markets is also tied to general economic conditions. Difficult macro-economic conditions in our markets may result in lower sales volume.
If Pentland and the Coors Trust do not agree on a matter submitted to stockholders, generally the matter will not be approved, even if beneficial to us or favored by other stockholders.
Pentland Securities (1981) Inc. (the "Pentland Trust") (a company controlled by the Molson family and related parties) and the Adolph Coors, Jr. Trust (the "Coors Trust"), which together control more than ninety percent of our Class A common stock and Class A exchangeable shares, have voting trust agreements through which they have combined their voting power over the shares of our Class A common stock and the Class A exchangeable shares that they own. In the event that these two stockholders do not agree to vote in favor of a matter submitted to a stockholder vote (other than the election of directors), the voting trustees will be required to vote all of the Class A common stock and Class A exchangeable shares deposited in the voting trusts against the matter. There is no other mechanism in the voting trust agreements to resolve a potential deadlock between these stockholders. Therefore, if either the Pentland Trust or the Coors Trust is unwilling to vote in favor of a proposal that is subject to a stockholder vote, we would be unable to implement the proposal even if our board, management or other stockholders believe the proposal is beneficial to us. Similarly, our bylaws require the authorization of a super-majority (two-thirds) of the board of directors to take certain transformational actions. Thus it is possible that the Company will not be authorized to take action even if it is supported by a simple majority of the board. In addition, our Class B common stock has fewer voting rights than our Class A common stock.
Poor investment performance of pension plan holdings and other factors impacting pension plan costs could unfavorably impact liquidity and results of operations.
Our costs of providing defined benefit pension plans are dependent upon a number of factors, such as the rates of return on the plans' assets, discount rates, the level of interest rates used to measure the required minimum funding levels of the plans, exchange rate fluctuations, future government regulation, global equity prices, and our required and/or voluntary contributions to the plans. While we comply with the minimum funding requirements, we have certain qualified pension plans with obligations which exceed the value of the plans' assets. Without sustained growth in the pension investments over time to increase the value of the plans' assets, and depending upon the other factors as listed above, we could be required to fund the plans with significant amounts of cash. Such cash funding obligations could have a material impact on our cash flows, credit rating and cost of borrowing, financial position or results of operations.
We rely on a small number of suppliers to obtain the packaging we need to operate our business. The inability to obtain materials could unfavorably affect our ability to produce our products.
We purchase certain types of packaging materials including aluminum, glass and paperboard from a small number of suppliers. Consolidation of the packaging materials suppliers has reduced local supply alternatives and increased risks of supply disruptions. The inability of any of these suppliers to meet our production requirements without sufficient time to develop an alternative source could have a material adverse effect on our business.
Termination of one or more manufacturer/distribution agreements could have a material adverse effect on our business.
We manufacture and/or distribute products of other beverage companies through various joint ventures, licensing, distribution or other arrangements. The loss of one or more of these arrangements, as a result of industry consolidation or otherwise, could have a material adverse effect on the business and financial results of one or more reporting segments. For example, Miller Brewing Company (“Miller”) has notified us of its intent to terminate the license agreement between Miller and us in Canada, which could have an adverse impact on our Canadian volumes.
Changes in tax, environmental or other regulations or failure to comply with existing licensing, trade and other regulations could have a material adverse effect on our financial condition.
Our business is highly regulated by federal, state, provincial and local laws and regulations in various countries regarding such matters as licensing requirements, trade and pricing practices, labeling, advertising, promotion and marketing practices, relationships with distributors, environmental matters, smoking bans at on-premise locations and other matters. These laws and regulations are subject to frequent re-evaluation, varying interpretations and political debate and inquiries from government regulators charged with their enforcement. Examples of this are the recently announced increase in beer excise tax rates of over 20% in Québec and a 50%
14
increase to the statutory corporate income tax rate in Serbia. Failure to comply with existing laws and regulations or changes in these laws and regulations or in tax, environmental, excise tax levels imposed or any other laws or regulations could result in the loss, revocation or suspension of our licenses, permits or approvals and could have a material adverse effect on our business, financial condition and results of operations. Additionally, uncertainties exist with respect to the interpretation of complex tax regulations and the amount and timing of future taxable income. Given the wide range of international business relationships and the long-term nature and complexity of existing contractual agreements, differences arising between the actual results and assumptions made, or future changes to such assumptions, could necessitate future adjustments to tax income and expense already recorded. Finally, advocates of prohibition and other severe restrictions on the marketing and sales of alcohol are becoming increasingly organized on a global basis, seeking to impose regulations to curtail substantially the consumption of alcohol, including beer, in developed and developing markets. To the extent such views gain traction in national regulations where we do or plan to do business, they could have a material adverse impact on our business and results of operations.
Our consolidated financial statements are subject to fluctuations in foreign exchange rates, most significantly the Canadian dollar, British Pound and our Central European operating currencies such as, but not limited to, Euro, Czech Koruna, Croatian Kuna, Serbian Dinar, New Romanian Leu and Bulgarian Lev.
We hold assets and incur liabilities, earn revenues and pay expenses in different currencies, most significantly in Canada and in the U.K and throughout Central Europe. Because our financial statements are presented in U.S. Dollars ("USD"), we must translate our assets, liabilities, income and expenses into USD. Increases and decreases in the value of the USD will affect, perhaps adversely, the value of these items in our financial statements, even if their local currency value has not changed. To the extent that we fail to adequately manage these risks, including if our hedging arrangements do not effectively or completely hedge changes in foreign currency rates, our results of operations may be materially and adversely impacted.
Our operations face significant exposure to changes in commodity prices, which could materially and adversely affect our operating results.
We use a large volume of agricultural and other raw materials to produce our products, including barley, barley malt, hops, corn, other various starches, water and packaging materials, including aluminum, cardboard and other paper products. We also use a significant amount of diesel fuel and electricity in our operations. The supply and price of these raw materials and commodities can be affected by a number of factors beyond our control, including market demand, global geopolitical events (especially as to their impact on crude oil prices and the resulting impact on diesel fuel prices), frosts, droughts and other weather conditions, economic factors affecting growth decisions, inflation, plant diseases and theft. To the extent any of the foregoing factors affect the prices of ingredients or packaging or our hedging arrangements do not effectively or completely hedge changes in commodity price risks, our results of operations could be materially and adversely impacted.
The success of our business relies heavily on brand image, reputation, product quality and protection of intellectual property.
It is important that we maintain and increase the image and reputation of our existing products. Concerns about product quality, even when unsubstantiated, could be harmful to our image and reputation of our products. Deterioration to our brand equity may be difficult to combat or reverse and could have a material effect on our business and financial results. In addition, because our brands carry family names, personal activities by certain members of the Molson or Coors families that harm their public image or reputation could have an adverse effect on our brands. Further, the success of our Company is dependent on our ability to protect our intellectual property rights, including trademarks, patents, domain names, trade secrets and know-how.
Due to a high concentration of unionized workers in Canada, the United Kingdom, and at MillerCoors in the U.S., we could be significantly affected by labor strikes, work stoppages or other employee-related issues.
Approximately 60%, 35% and 25% of our Canadian, MillerCoors and U.K. workforces, respectively, are represented by trade unions. Stringent labor laws in the U.K. expose us to a greater risk of loss should we experience labor disruptions in that market. A labor strike, work stoppage or other employee-related issue could have a material adverse effect on our business and financial results.
Changes to the regulation of the distribution systems for our products could adversely impact our business.
In our U.S. market, there is a three-tier distribution system that has historically applied to the distribution of products now sold through MillerCoors (including our non-U.S. products). That system is increasingly subject to the legal challenges on the basis that it allegedly interferes with interstate commerce. To the extent that such challenges are successful and require changes to the three-tier system, such changes could have a materially adverse impact on MillerCoors and, consequently, MCBC. Further, in certain Canadian provinces, our products are distributed through joint venture arrangements that are mandated and regulated by provincial government regulators. If provincial regulation should change, the costs to adjust our distribution methods could have a material adverse impact on our business.
Changes in various supply chain standards or agreements could adversely impact our business.
Our business includes various joint venture and industry agreements which standardize parts of the supply chain system. An example includes our warehousing and customer delivery systems organized under joint venture agreements with other brewers. Any negative change in these agreements could have a material adverse impact on our business.
15
Because of our reliance on third-party service providers for certain administrative functions, we could experience a disruption to our business.
We rely exclusively on information services providers worldwide for our information technology functions including network, help desk, hardware and software configuration. We also have outsourced a significant portion of work associated with our finance and accounting, human resources and other information technology functions to a third-party service provider. If one of these service providers was to fail and we were unable to find a suitable replacement in a timely manner, we could be unable to properly administer our outsourced functions. Additionally, our internal and outsourced systems may also be the target of outside parties attempting to breach our security, which, if successful, could expose us to the loss of key business information and disruption of our operations.
We may incur impairments of the carrying value of our goodwill and other intangible assets.
In connection with various business combinations, we have allocated material amounts of the related purchase prices to goodwill and other intangible assets that are considered to have indefinite useful lives. These assets are tested for impairment at least annually, using estimates and assumptions affected by factors such as economic and industry conditions and changes in operating performance. Potential resulting charges could be material and could adversely impact our results of operations. Our most recent impairment analysis indicated that the fair value of our U.K. and Canada reporting units were close to failing step one of the goodwill impairment test. The fair value of the U.K. reporting unit and the Canada reporting unit were estimated at approximately
7%
and
15%
in excess of their carrying values, respectively. In addition, the fair value of the
Molson
core brands was estimated at approximately
14%
in excess of its carrying value. The reporting units and
Molson
core brands are therefore at risk of a future impairment in the event of significant unfavorable changes in the forecasted cash flows, terminal growth rates, market transaction multiples and/or weighted-average cost of capital utilized in the discounted cash flow analysis. Additionally, we have identified risks to our Central Europe reporting unit due to weak economic conditions within the regions in which we operate, as well as risks related to the possible termination of our license agreement with Miller in Canada.
Climate change and water availability may negatively affect our business.
There is concern that a gradual increase in global average temperatures could cause significant changes in weather patterns around the globe and an increase in the frequency and severity of natural disasters. While warmer weather has historically been associated with increased sales of beer, changing weather patterns could result in decreased agricultural productivity in certain regions which may limit availability or increase the cost of key agricultural commodities, such as hops, barley and other cereal grains, which are important ingredients for our products. Increased frequency or duration of extreme weather conditions could also impair production capabilities, disrupt our supply chain or impact demand for our products. In addition, public expectations for reductions in greenhouse gas emissions could result in increased energy, transportation and raw material costs and may require us to make additional investments in facilities and equipment. As a result, the effects of climate change could have a long-term, material adverse impact on our business and results of operations. There are also water availability risks. Climate change may cause water scarcity and a deterioration of water quality in areas where we maintain brewing operations. The competition for water among domestic, agricultural and manufacturing users is increasing in some of our brewing communities. Even where water is widely available, water purification and waste treatment infrastructure limitations could increase costs or constrain our operations.
Failure to successfully identify, complete or integrate attractive acquisitions and joint ventures into our existing operations could have an adverse impact on our business, financial condition and results of operations.
We have made a number of acquisitions and entered into several joint ventures. In order to compete in the consolidating global brewing industry, we anticipate that we may, from time to time, in the future acquire additional businesses or enter into additional joint ventures that we believe would provide a strategic fit with our business. Potential issues associated with acquisitions and joint ventures could include, among other things: our ability to identify attractive acquisitions and joint ventures; our ability to offer potential acquisition targets and joint ventures competitive transaction terms; our ability to realize the benefits or cost savings that we expect to realize as a result of the acquisition or joint venture; diversion of management's attention; our ability to successfully integrate our businesses with the business of the acquired company; motivating, recruiting and retaining key employees; conforming standards, controls, procedures and policies, business cultures and compensation structures among our company and the acquired company; consolidating and streamlining sales, marketing and corporate operations; potential exposure to unknown liabilities of acquired companies; loss of key employees and customers of the acquired business; and managing tax costs or inefficiencies associated with integrating our operations following completion of an acquisition or entry into a joint venture. If an acquisition or joint venture is not successfully completed or integrated into our existing operations, our business, financial condition and results of operations could be adversely impacted.
Risks associated with operating our joint ventures may adversely affect our financial condition and results of operations.
We have entered into several joint ventures, including our MillerCoors joint venture in the United States and Puerto Rico with SABMiller. We may enter into additional joint ventures in the future. Our joint venture partners may at any time have economic, business or legal interests or goals that are inconsistent with our goals or with the goals of the joint venture. In addition, we compete against our joint venture partners in certain of our markets. Disagreements with our business partners may impede our ability to maximize the benefits of our partnerships and adversely affect our results of operations. Our joint venture arrangements may require us, among other matters, to pay certain costs or to make certain capital investments or
16
to seek our joint venture partner's consent to take certain actions. In addition, our joint venture partners may be unable or unwilling to meet their economic or other obligations under the operative documents, and we may be required to either fulfill those obligations alone to ensure the ongoing success of a joint venture or to dissolve and liquidate a joint venture. For example, during 2012, we decided to terminate our joint venture in China due to the failure of our joint venture partner to meet its obligations.
We depend on key personnel, the loss of whom would harm our business.
The loss of the services and expertise of any key employee could harm our business. Our future success depends on our ability to identify, attract and retain qualified personnel on a timely basis. Turnover of senior management can adversely impact our stock price, our results of operations and our client relationships and may make recruiting for future management positions more difficult. In addition, we must successfully integrate any new management personnel that we hire within our organization in order to achieve our operating objectives, and changes in other key management positions may temporarily affect our financial performance and results of operations as new management becomes familiar with our business.
Our operations outside of North America and the U.K. expose us to additional risks which could harm our business, financial condition and results of operations.
We expect our operations outside of North America and the U.K. to become more significant to our operating results as we continue to further expand internationally. In certain of these markets, we have limited operating experience and may not succeed. In addition to risks described elsewhere in this section, our operations in these markets expose us to additional risks, including: changes in local political, economic, social and labor conditions; restrictions on foreign ownership and investments; repatriation of cash earned in countries outside the U.S.; import and export requirements; currency exchange rate fluctuations; a less developed and less certain legal and regulatory environment, which among other things can create uncertainty with regard to liability issues; longer payment cycles, increased credit risk and higher levels of payment fraud; and other challenges caused by distance, language, and cultural differences.
Loss of a major brewery or other key facility, due to unforeseen or catastrophic events or otherwise, could have an adverse impact on our business.
Our business and results of operations could be adversely impacted by physical risks such as earthquakes, hurricanes, other natural disasters or catastrophic events that damage or destroy one of our breweries or key facilities. Additionally, certain catastrophes are not covered by our general insurance policies, which could result in significant unrecoverable losses.
Impacts of the Acquisition on our financial position.
As a result of the Acquisition, the already significant amount of goodwill and other intangible assets on our consolidated financial statements increased. Such amounts are subject to impairment assessments based upon future adverse changes in our business or prospects. In addition, we incurred a significant amount of additional indebtedness in connection with the Acquisition. After giving effect to our $1.9 billion senior notes offering, borrowings under the new credit and term loan agreements in connection with the Acquisition and the issuance of the Convertible Note to the Seller, we have outstanding $4,668 million of indebtedness as of
December 29, 2012
, and the ability to incur up to an additional €150 million, $550 million and $400 million of indebtedness under our revolving credit facilities. We may incur significantly more indebtedness in the future. As a result of the debt that we incurred in connection with the Acquisition, we have suspended share repurchases until our credit metrics are closer to pre-Acquisition levels, and there can be no assurance that our credit ratings will remain at an investment grade level or that they will improve. Additionally, any deterioration of our current credit rating from an investment grade level could result in less than favorable terms of future debt issuances, which may be necessary to support the ongoing needs of the business, fund future capital investments or acquisitions or refinance terms of our debt obligations currently outstanding. We also intend to use cash from operations to reduce our debt level, which will reduce funds available for other purposes and may increase our vulnerability to adverse economic or industry conditions. In addition, our indebtedness also subjects us to financial and operating covenants, which may limit our flexibility in responding to our business needs. If we are not able to maintain compliance with stated financial ratios or if we breach any of the other covenants in any debt agreement, we could be in default under such agreement. Such a default may allow the creditors to accelerate the related indebtedness and may result in the acceleration of any other indebtedness to which a cross-acceleration or cross-default provision applies.
Risks Specific to the Canada Segment
We may experience continued price discounting in Canada.
The continuation, acceleration or the increase of price discounting, in Ontario, Québec, Alberta or other provinces, could adversely impact our business.
In the event that we are required to move away from the industry standard returnable bottle we use today, we may incur unexpected losses.
Along with ABI and other brewers in Canada, we currently use an industry standard returnable bottle which represents more than 40% of total volume sales in Canada. Changes to the Industry Standard Bottle Agreement could impact our use of the industry standard returnable bottle. If we cease to use the industry standard returnable bottle, our current bottle inventory and a portion of our bottle packaging equipment could become obsolete and could result in a material write-off of these assets.
17
Risks Specific to the United States Segment and MillerCoors
We do not fully control the operations and administration of MillerCoors, which represents our interests in the U.S. beer business.
We jointly control MillerCoors with SABMiller, and hold a 42% economic interest. MillerCoors management is responsible for the day to day operations of the business and therefore, we do not have full control over the activities of MillerCoors. Our results of operations are dependent upon the efforts of MillerCoors management, our ability to govern the joint venture effectively with SABMiller and factors beyond our control that may affect SABMiller. Additionally, our disclosure controls and procedures with respect to MillerCoors are necessarily substantially more limited than those we maintain with respect to our consolidated subsidiaries.
We may incur unexpected costs or face other business issues from MillerCoors due to challenges associated with integrating operations, technologies and other aspects of the operations.
The MillerCoors management team continues to focus on fully integrating ours and SABMiller's U.S. operations, technologies and services, as well as the distribution networks including the resolution of disputes arising from the consolidation of distributors arising from the MillerCoors joint venture. The failure of MillerCoors to successfully integrate the two operations could adversely affect our financial results or prospects.
MillerCoors is highly dependent on independent distributors in the United States to sell its products, with no assurance that these distributors will effectively sell its and our products.
MillerCoors sells all of its products and our non-U.S. products in the United States to distributors for resale to retail outlets and the regulatory environment of many states makes it very difficult to change distributors. Consequently, if MillerCoors is not allowed or is unable to replace unproductive or inefficient distributors, its business, financial position and results of operation may be adversely affected, which could have a material adverse effect on our business and financial results.
Risks Specific to the Central Europe Segment
We may not recognize the benefits of the Acquisition.
We may not realize the expected benefits of the Acquisition because of integration difficulties and other challenges. The success of the Acquisition will depend, in part, on our ability to realize all or some of the anticipated synergies and other benefits from integrating MCCE's business with our existing businesses. The integration process may be complex, costly and time-consuming. The difficulties of integrating the operations of MCCE's business include, among others:
|
•
|
failure to implement our business plan for the combined business;
|
|
•
|
unanticipated issues in integrating manufacturing, logistics, information, communications and other systems;
|
|
•
|
possible inconsistencies in standards, controls, procedures and policies, and compensation structures between
|
MCCE's structure and our structure;
|
•
|
failure to retain key customers and suppliers;
|
|
•
|
unanticipated changes in applicable laws and regulations;
|
|
•
|
failure to retain key employees;
|
|
•
|
operating risks inherent in MCCE's business and our business;
|
|
•
|
unanticipated issues, expenses and liabilities;
|
|
•
|
unfamiliarity with operating in Central Europe.
|
We may not be able to maintain the levels of revenue, earnings or operating efficiency that each of Molson Coors and MCCE had achieved or might achieve separately. In addition, we may not accomplish the integration of MCCE's business smoothly, successfully or within the anticipated costs or timeframe. Moreover, the markets in which MCCE operates may not experience the growth rates expected and any further economic downturn affecting Europe could negatively impact MCCE's business. These markets are in differing stages of development and may experience more volatility than expected or face more operating risks than in the more mature markets in which Molson Coors has historically operated. If we experience difficulties with the integration process or if the MCCE business or the markets in which it operates deteriorate, the anticipated cost savings, growth opportunities and other synergies of the Acquisition may not be realized fully, or at all, or may take longer to realize than expected. In such case, our business, financial condition and results of operations may be negatively impacted.
We face risks associated with the Sale and Purchase Agreement ("SPA") in connection with the Acquisition.
In connection with the Acquisition, we assumed substantially all the liabilities of MCCE that were not satisfied on or prior to the closing date. There may be liabilities that we underestimated or did not discover in the course of performing our due diligence investigation of MCCE. Under the SPA and a management warranty deed (the "Management Warranty Deed"), the Seller has agreed to provide us with a limited set of representations and warranties. Our sole remedy from the Seller for any breach of those representations and warranties is an action for indemnification, not to exceed €100 million under the SPA and €50 million under the Management Warranty Deed. Damages resulting from a breach of a representation or warranty could have a material and adverse effect on our financial condition and results of operations.
18
Economic trends and intense competition in certain Central European markets could unfavorably impact our profitability.
Our Central European businesses have been and may continue to be adversely affected by conditions in the global financial markets and economic and political conditions generally. During 2012, real gross domestic product declined in most of the major Central European markets in which we operate. Additionally, we face intense competition in certain of our Central European markets, particularly with respect to price, which could lead to reduced sales or profitability. In particular, the on-going focus by large competitors in Central Europe to drive increased market share through aggressive pricing strategies could adversely affect our sales and results of operations.
Risks Specific to the United Kingdom Segment
Sales volume trends in the United Kingdom brewing industry reflect movement from on-premise channels to off-premise channels, a trend which unfavorably impacts our profitability.
In recent years, beer volume sales in the U.K. have been shifting from pubs and restaurants (on-premise) to retail stores (off-premise), for the industry in general. A ban on smoking in pubs and restaurants across the whole of the U.K. enacted in 2007 accelerated this trend. Margins on sales to off-premise customers tend to be lower than margins on sales to on-premise customers, and, as a result, continuation or acceleration of these trends would further adversely impact our profitability.
Consolidation of pubs and growth in the size of pub chains in the United Kingdom could unfavorably impact pricing.
The trend toward consolidation of pubs, away from independent pub and club operations, is continuing in the United Kingdom. These larger entities have stronger price negotiating power, and therefore continuation of this trend could impact our ability to obtain favorable pricing in the on-premise channel (due to the spillover effect of reduced negotiating leverage) and could reduce our revenues and profit margins. In addition, these larger customers continue to move to purchasing directly more of the products that, in the past, we have provided as part of our factored business. Further consolidation could contribute to an adverse financial impact.
In the event that a significant pub chain were to go bankrupt, or experience similar financial difficulties, our business could be adversely impacted.
We extend credit to pub chains in the U.K., and in some cases the amounts are significant. The continuing challenging economic environment in the U.K. has caused business at on-premise outlets to slow since late 2008, and some pub chains may face increasing financial difficulty if economic conditions do not improve. In the event that a pub chain were to be unable to pay amounts owed to us as a result of bankruptcy or similar financial difficulties, our business could be adversely impacted.
We depend exclusively on one logistics provider for the distribution of our products in the United Kingdom.
Tradeteam handles all of the physical distribution for us in the U.K., except where a different distribution system is requested by a customer. If Tradeteam were unable to continue distribution of our products and we were unable to find a suitable replacement in a timely manner, we could experience significant disruptions in our business that could have an adverse financial impact.
Risks Specific to the Molson Coors International Segment
An inability to expand our operations in emerging markets could adversely affect our growth prospects.
Our ability to grow our MCI segment in emerging markets depends on social, economic and political conditions in those markets and on our ability to create effective product distribution networks and consumer brand awareness in new markets. Due to product price, local competition and cultural differences, there is no assurance that our products will be accepted in any particular emerging market. If we are unable to expand our businesses in emerging markets, our growth prospects could be adversely affected.
In addition, compliance with complex foreign laws and regulations, and U.S. laws such as the Foreign Corrupt Practices Act, that apply to our international operations increases our cost of doing business in some international jurisdictions. Violations of these laws and regulations could result in fines and penalties, criminal sanctions against us, our officers, or our employees, prohibitions on the conduct of our business and on our ability to offer our products and services in one or more countries and a materially negative impact on our brands and our operating results. Although we have implemented policies and procedures designed to ensure compliance with these foreign and U.S. laws and regulations, including the Foreign Corrupt Practices Act, there can be no assurance that our employees, business partners or agents will not violate our policies.
Risks Specific to Our Discontinued Operations
19
however, we could incur future statement of operations charges as facts further develop resulting in changes to our estimates or changes in our assessment of probability of loss on these items as well as due to fluctuations in foreign exchange rates. Due to the uncertainty involved in the ultimate outcome and timing of these contingencies, significant adjustments to the carrying value of our indemnity liabilities and corresponding statement of operations charges/credits could result in the future.
None.
20
As of
December 29, 2012
, our major facilities were owned (unless otherwise indicated) and are as follows:
|
Facility
|
|
Location
|
|
Character
|
|
Canada Segment
|
|
|
|
|
|
Administrative offices
|
|
Toronto, Ontario
|
|
Canada Segment Headquarters
|
|
|
Montréal, Québec
|
|
Corporate Headquarters
|
|
|
Brewery/packaging plants
|
|
St John's, Newfoundland
|
|
Brewing and packaging
|
|
|
Montréal, Québec(1)
|
|
Brewing and packaging
|
|
|
|
Creemore, Ontario
|
|
Brewing and packaging
|
|
|
|
Moncton, New Brunswick
|
|
Brewing and packaging
|
|
|
|
Toronto, Ontario(1)
|
|
Brewing and packaging
|
|
|
|
Vancouver, British Columbia(2)
|
|
Brewing and packaging
|
|
|
Distribution warehouses
|
|
Québec Province(3)
|
|
Distribution centers
|
|
|
Rest of Canada(4)
|
|
Distribution centers
|
|
|
MCI Segment and Corporate
|
|
|
||
|
Administrative offices
|
|
Denver, Colorado(5)
|
|
Corporate and MCI Headquarters
|
|
Miami, Florida(5)
|
MCI offices
|
|||
|
Madrid, Spain(5)
|
MCI offices
|
|||
|
Mumbai, India(5)
|
MCI offices
|
|||
|
|
Guangzhou, China(6)
|
|
MCI offices
|
|
|
|
Tokyo, Japan(6)
|
|
MCI offices
|
|
|
|
Hong Kong(6)
|
|
MCI offices
|
|
|
Brewery/packaging plants
|
|
Chengde, China(7)
|
|
Brewing and packaging
|
|
Patna, India
|
Brewing and packaging
|
|||
|
Central Europe Segment
|
||||
|
Administrative offices
|
Prague, Czech Republic
|
Central Europe Segment Headquarters
|
||
|
Brewery/packaging plants
|
Ploiesti, Romania(1)
|
Brewing and packaging
|
||
|
Niksic, Montenegro
|
Brewing and packaging
|
|||
|
Prague, Czech Republic(1)
|
Brewing and packaging
|
|||
|
Ostrava, Czech Republic
|
Brewing and packaging
|
|||
|
Apatin, Serbia(1)
|
Brewing and packaging
|
|||
|
Haskovo, Bulgaria
|
Brewing and packaging
|
|||
|
Plovdiv, Bulgaria
|
Brewing and packaging
|
|||
|
Zagreb, Croatia,
|
Brewing and packaging
|
|||
|
Bőcs, Hungary
|
Brewing and packaging
|
|||
|
Distribution warehouses
|
Central Europe(8)
|
Distribution centers
|
||
|
United Kingdom Segment
|
|
|
|
|
|
Administrative office
|
|
Burton-on-Trent, Staffordshire
|
|
U.K. Segment Headquarters
|
|
Brewery/packaging plants
|
|
Burton-on-Trent, Staffordshire(1)
|
|
Brewing and packaging
|
|
|
Tadcaster Brewery, Yorkshire
|
|
Brewing and packaging
|
|
|
|
Alton Brewery, Hampshire
|
|
Brewing and packaging
|
|
|
Sharp's Brewery, Cornwall
|
Brewing and packaging
|
|||
|
Malting/grain silos
|
|
Burton-on-Trent, Staffordshire
|
|
Malting facility
|
|
Distribution warehouse
|
|
Burton-on-Trent, Staffordshire
|
|
Distribution center
|
21
|
(1)
|
Montréal and Toronto breweries collectively account for approximately 78% of our Canada production. The Burton-on-Trent brewery is our largest brewery in the U.K. and accounts for approximately 60% of our U.K. production. Apatin, Prague and Ploiesti breweries collectively account for approximately 57% of our Central Europe production.
|
|
(2)
|
We own two brewing and packaging facilities in Vancouver, British Columbia.
|
|
(3)
|
We own 11 distribution centers, lease two additional distribution centers, own one warehouse and lease seven additional warehouses in the Québec Province.
|
|
(4)
|
We lease nine warehouses throughout Canada, excluding the Québec Province.
|
|
(5)
|
Leased facility.
|
|
(6)
|
We lease headquarter offices in Asia. Additionally, in China we lease regional offices to comply with local regulations which require an office in each city where we conduct business (55 cities).
|
|
(7)
|
During the third quarter of 2012, we deconsolidated our joint venture in China, MC Si'hai, from our financial statements due to a loss of our ability to control the joint venture.
|
|
(8)
|
We own 17 distribution centers, lease 17 additional distribution centers, own 6 warehouses and lease one additional warehouse throughout Central Europe.
|
We believe our facilities are well maintained and suitable for their respective operations. In
2012
, our operating facilities were not capacity constrained.
In
December 2012, Miller Brewing Company (“Miller”) orally informed us of its intent to terminate the license agreement between Miller and us whereby we have exclusive rights to distribute certain Miller products in Canada (the “License Agreement”). Miller alleges that we failed to meet certain volume sales targets under the License Agreement. We do not believe Miller has any right under the License Agreement or otherwise to terminate the License Agreement. Following this communication, we filed a lawsuit in Ontario, Canada (Molson Canada 2005 v. Miller Brewing Company, Sup. Ct. of Justice-Ontario, CV-12-470589) seeking an injunction preventing Miller from terminating the License Agreement and ordering Miller to abide by its contractual terms. On January 18, 2013, Miller sent written notice to us purporting to terminate the License Agreement. In our lawsuit, we also assert that Miller breached the License Agreement by attempting to terminate the License Agreement. We intend to vigorously assert and defend our rights in this lawsuit. At this time we are unable to predict the outcome of this litigation or the impact, if any, of an adverse outcome on our business and results of operations, including any possible future asset impairment. As of December 29, 2012 we had a definite-lived intangible asset related to the License Agreement with a carrying value of approximately $70 million and a remaining life of 7 years.
We are involved in other disputes and legal actions arising in the ordinary course of our business. While it is not feasible to predict or determine the outcome of these proceedings, in our opinion, based on a review with legal counsel, none of these disputes and legal actions is expected to have a material impact on our consolidated financial position, results of operations or cash flows. However, litigation is subject to inherent uncertainties and an adverse result in these or other matters may arise from time to time that may harm our business.
Not applicable.
Our Class A common stock and Class B common stock trade on the New York Stock Exchange under the symbols "TAP A" and "TAP," respectively. In addition, our indirect subsidiary, Molson Coors Canada Inc., has Class A exchangeable shares and Class B exchangeable shares trading on the Toronto Stock Exchange under the symbols "TPX.A" and "TPX.B," respectively. The Class A and B exchangeable shares are a means for shareholders to defer tax in Canada and have substantially the same economic and voting rights as the respective common shares. The exchangeable shares can be exchanged for our Class A or B common stock at any time and at the exchange ratios described in the Merger documents, and receive the same
22
dividends. At the time of exchange, shareholders' taxes are due. The exchangeable shares have voting rights through special voting shares held by a trustee.
The approximate number of record security holders by class of stock at
February 15, 2013
, is as follows:
|
Title of class
|
Number of record
security holders
|
|
|
Class A common stock, $0.01 par value
|
26
|
|
|
Class B common stock, $0.01 par value
|
3,043
|
|
|
Class A exchangeable shares
|
257
|
|
|
Class B exchangeable shares
|
2,696
|
|
The following table sets forth the high and low sales prices per share of our Class A common stock for each fiscal quarter of
2012
and
2011
as reported by the New York Stock Exchange, as well as dividends paid in such fiscal quarter.
|
High
|
Low
|
Dividends
|
||||||||||
|
2012
|
|
|
|
|||||||||
|
First quarter
|
$
|
45.74
|
|
$
|
42.80
|
|
$
|
0.32
|
|
|||
|
Second quarter
|
$
|
45.80
|
|
$
|
38.50
|
|
$
|
0.32
|
|
|||
|
Third quarter
|
$
|
46.30
|
|
$
|
40.53
|
|
$
|
0.32
|
|
|||
|
Fourth quarter
|
$
|
45.50
|
|
$
|
40.31
|
|
$
|
0.32
|
|
|||
|
2011
|
|
|
|
|||||||||
|
First quarter
|
$
|
50.50
|
|
$
|
42.85
|
|
$
|
0.28
|
|
|||
|
Second quarter
|
$
|
49.10
|
|
$
|
43.75
|
|
$
|
0.32
|
|
|||
|
Third quarter
|
$
|
46.51
|
|
$
|
40.00
|
|
$
|
0.32
|
|
|||
|
Fourth quarter
|
$
|
44.11
|
|
$
|
39.25
|
|
$
|
0.32
|
|
|||
The following table sets forth the high and low sales prices per share of our Class B common stock for each fiscal quarter of
2012
and
2011
as reported by the New York Stock Exchange, as well as dividends paid in such fiscal quarter.
|
High
|
Low
|
Dividends
|
||||||||||
|
2012
|
|
|
|
|||||||||
|
First quarter
|
$
|
45.99
|
|
$
|
41.96
|
|
$
|
0.32
|
|
|||
|
Second quarter
|
$
|
45.91
|
|
$
|
37.96
|
|
$
|
0.32
|
|
|||
|
Third quarter
|
$
|
46.35
|
|
$
|
39.88
|
|
$
|
0.32
|
|
|||
|
Fourth quarter
|
$
|
45.19
|
|
$
|
39.46
|
|
$
|
0.32
|
|
|||
|
2011
|
|
|
|
|||||||||
|
First quarter
|
$
|
50.74
|
|
$
|
42.50
|
|
$
|
0.28
|
|
|||
|
Second quarter
|
$
|
49.58
|
|
$
|
43.41
|
|
$
|
0.32
|
|
|||
|
Third quarter
|
$
|
46.71
|
|
$
|
38.72
|
|
$
|
0.32
|
|
|||
|
Fourth quarter
|
$
|
44.13
|
|
$
|
37.99
|
|
$
|
0.32
|
|
|||
23
The following table sets forth the high and low sales prices per share of our Class A exchangeable shares for each fiscal quarter of
2012
and
2011
as reported by the Toronto Stock Exchange, as well as dividends paid in such fiscal quarter.
|
|
High
|
Low
|
Dividends
|
|||||||||
|
2012
|
|
|
|
|
||||||||
|
First quarter
|
C$
|
45.50
|
|
C$
|
42.64
|
|
$
|
0.32
|
|
|||
|
Second quarter
|
C$
|
43.00
|
|
C$
|
39.05
|
|
$
|
0.32
|
|
|||
|
Third quarter
|
C$
|
47.00
|
|
C$
|
40.00
|
|
$
|
0.32
|
|
|||
|
Fourth quarter
|
C$
|
44.09
|
|
C$
|
39.77
|
|
$
|
0.32
|
|
|||
|
2011
|
|
|
|
|
||||||||
|
First quarter
|
C$
|
50.67
|
|
C$
|
42.65
|
|
$
|
0.28
|
|
|||
|
Second quarter
|
C$
|
46.75
|
|
C$
|
42.00
|
|
$
|
0.32
|
|
|||
|
Third quarter
|
C$
|
44.14
|
|
C$
|
40.66
|
|
$
|
0.32
|
|
|||
|
Fourth quarter
|
C$
|
44.89
|
|
C$
|
39.90
|
|
$
|
0.32
|
|
|||
The following table sets forth the high and low sales prices per share of our Class B exchangeable shares for each fiscal quarter of
2012
and
2011
as reported by the Toronto Stock Exchange, as well as dividends paid in such fiscal quarter.
|
|
High
|
Low
|
Dividends
|
|||||||||
|
2012
|
|
|
|
|||||||||
|
First quarter
|
C$
|
46.32
|
|
C$
|
42.26
|
|
$
|
0.32
|
|
|||
|
Second quarter
|
C$
|
45.50
|
|
C$
|
39.52
|
|
$
|
0.32
|
|
|||
|
Third quarter
|
C$
|
45.00
|
|
C$
|
39.01
|
|
$
|
0.32
|
|
|||
|
Fourth quarter
|
C$
|
44.50
|
|
C$
|
39.60
|
|
$
|
0.32
|
|
|||
|
2011
|
|
|
|
|||||||||
|
First quarter
|
C$
|
50.50
|
|
C$
|
42.26
|
|
$
|
0.28
|
|
|||
|
Second quarter
|
C$
|
46.75
|
|
C$
|
42.57
|
|
$
|
0.32
|
|
|||
|
Third quarter
|
C$
|
44.74
|
|
C$
|
40.17
|
|
$
|
0.32
|
|
|||
|
Fourth quarter
|
C$
|
45.74
|
|
C$
|
39.89
|
|
$
|
0.32
|
|
|||
24
PERFORMANCE GRAPH
The following graph compares our cumulative total stockholder return over the last five fiscal years with the Standard and Poor's 500 Index® ("S&P 500"), and a customized index including, MCBC, SABMiller, ABI, Carlsberg, Heineken, Modelo and Asahi (the "Peer Group"). We have used a weighted-average based on market capitalization to determine the return for the Peer Group. The graph assumes $100 was invested on December 28, 2007, (the last trading day of our fiscal year 2007) in our Class B common stock, the S&P 500 and the Peer Group, and assumes reinvestment of all dividends.
Molson Coors Brewing Company
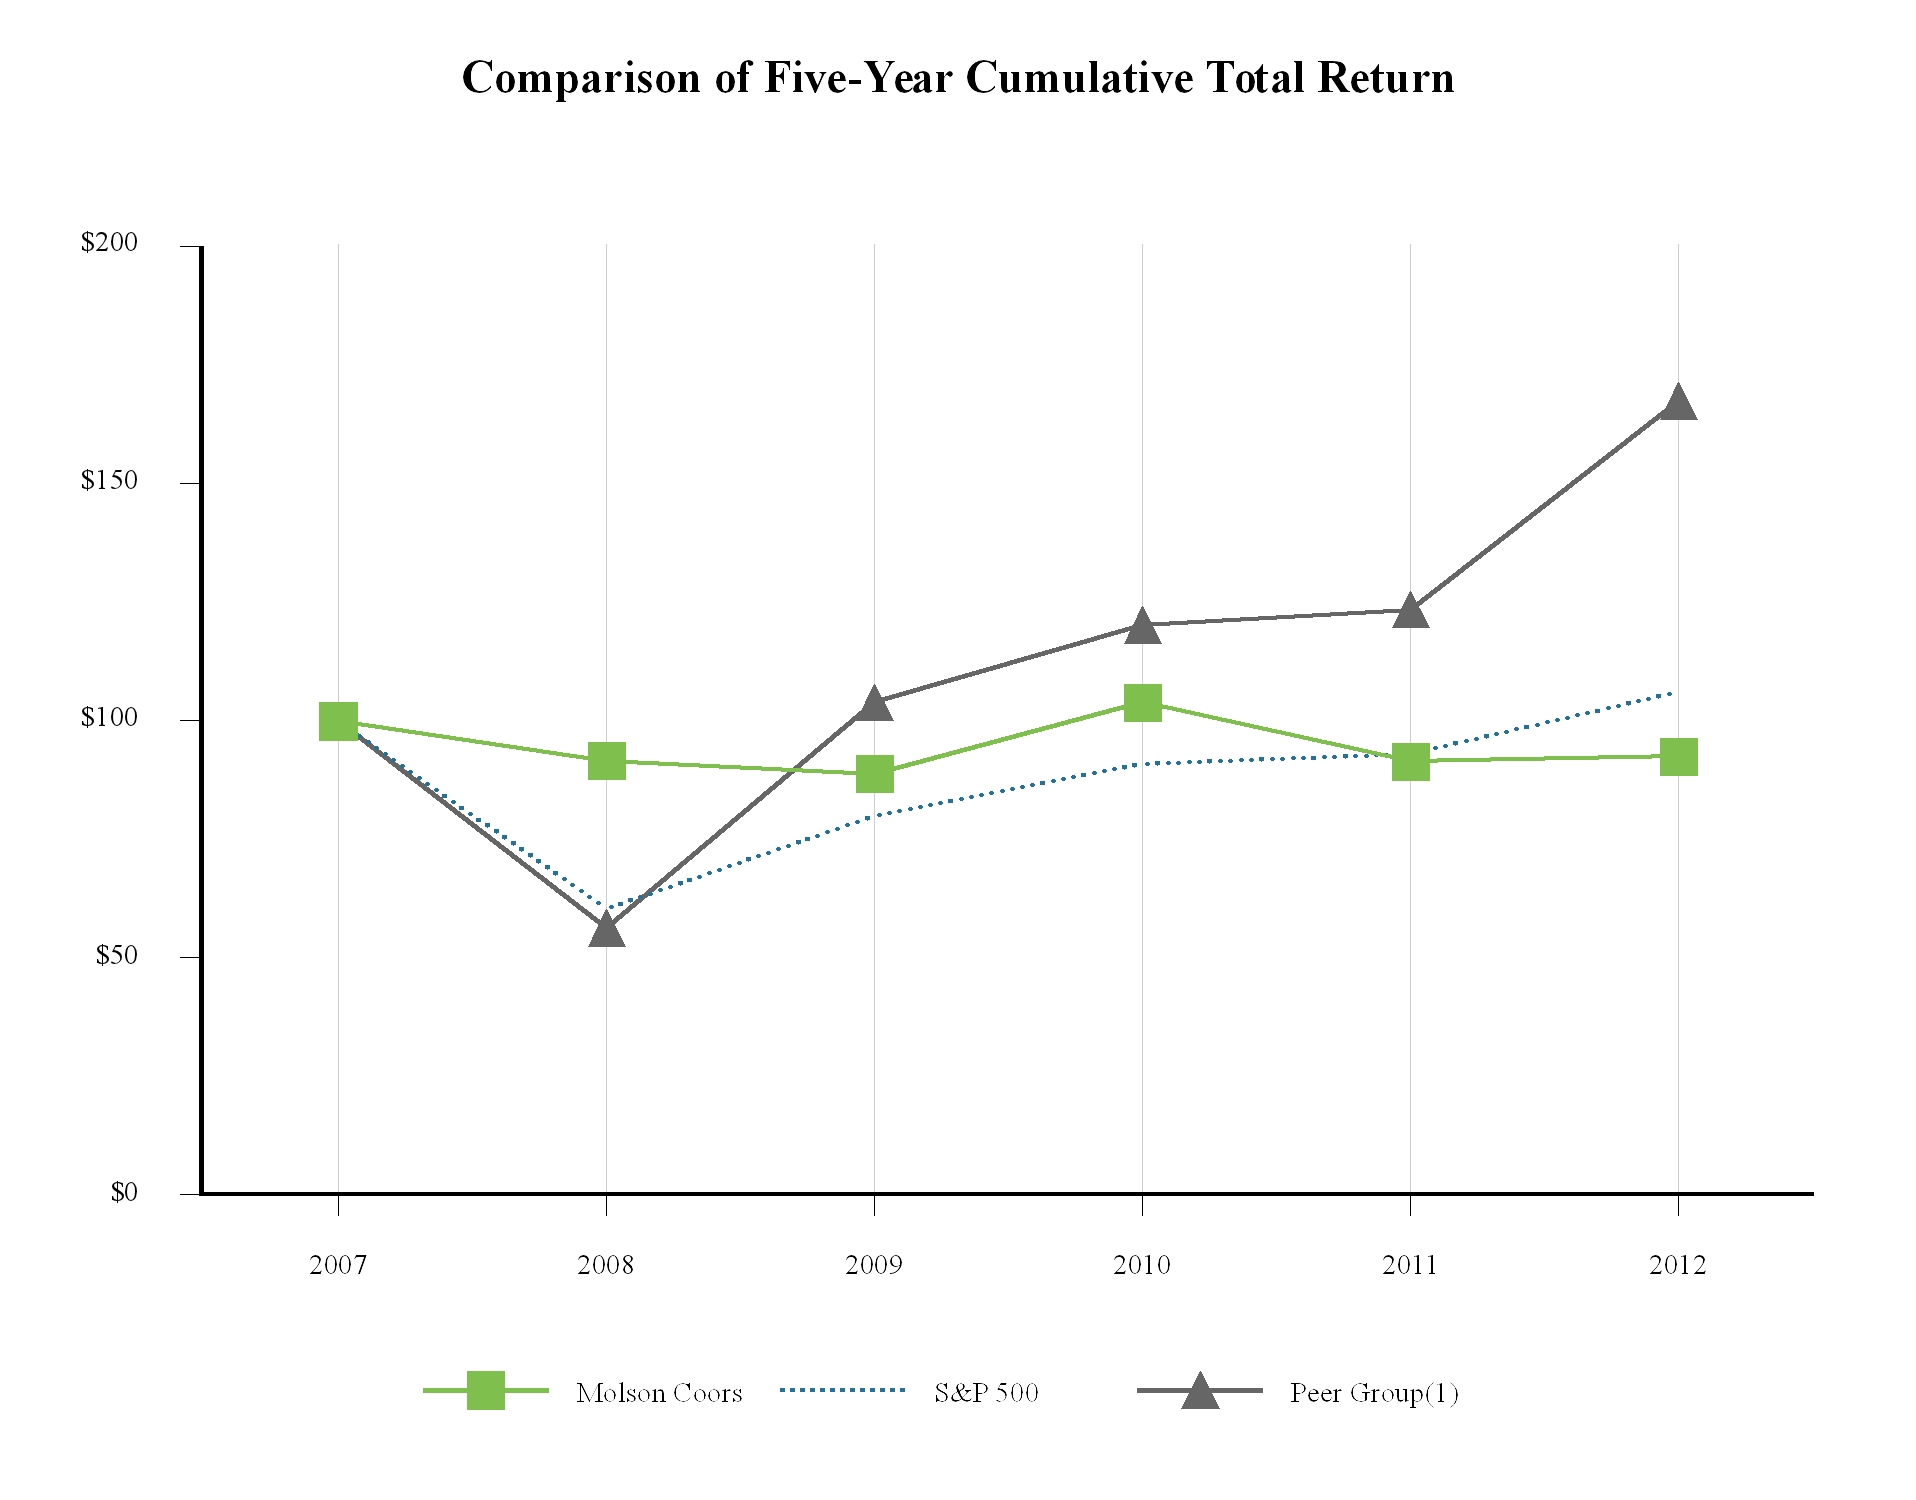
|
|
At Fiscal-Year End
|
|||||||||||||||||||||||
|
|
2007
|
2008
|
2009
|
2010
|
2011
|
2012
|
||||||||||||||||||
|
Molson Coors
|
$
|
100.00
|
|
$
|
91.63
|
|
$
|
88.86
|
|
$
|
103.91
|
|
$
|
91.45
|
|
$
|
92.50
|
|
||||||
|
S&P 500
|
$
|
100.00
|
|
$
|
60.43
|
|
$
|
79.91
|
|
$
|
90.97
|
|
$
|
92.97
|
|
$
|
106.05
|
|
||||||
|
Peer Group(1)
|
$
|
100.00
|
|
$
|
56.34
|
|
$
|
103.91
|
|
$
|
120.18
|
|
$
|
123.41
|
|
$
|
167.32
|
|
||||||
|
(1)
|
The Peer Group represents the weighted-average based on market capitalization of the common stock of MCBC, SABMiller, ABI, Carlsberg, Heineken, Modelo and Asahi. These securities are traded on various exchanges throughout the world.
|
Issuer Purchases of Equity Securities
In 2011, we announced that our Board of Directors approved and authorized a program to repurchase up to $1.2 billion of our Class A and Class B common stock in the open market or in privately negotiated transactions. The program has an expected term of three years and the number, price, and timing of the repurchases will be at our sole discretion and will be evaluated depending on market conditions, liquidity needs or other factors. Our Board of Directors may suspend, modify, or terminate the program at any time without prior notice. We did not make any share repurchases during the three months ended December 29, 2012.
25
The table below summarizes selected financial information for the five years ended as noted. For further information, refer to our consolidated financial statements and notes thereto presented under Part II—Item 8 Financial Statements and Supplementary Data.
|
2012(1)(2)
|
2011(1)
|
2010(1)
|
2009(1)
|
2008(1)
|
||||||||||||||||
|
|
(In millions, except per share data)
|
|||||||||||||||||||
|
Consolidated Statements of Operations:
|
|
|
|
|
|
|||||||||||||||
|
Net sales(3)
|
$
|
3,916.5
|
|
$
|
3,515.7
|
|
$
|
3,254.4
|
|
$
|
3,032.4
|
|
$
|
4,774.3
|
|
|||||
|
Income from continuing operations attributable to MCBC
|
$
|
441.5
|
|
$
|
674.0
|
|
$
|
668.1
|
|
$
|
729.4
|
|
$
|
390.8
|
|
|||||
|
Income from continuing operations attributable to MCBC per share:
|
|
|
|
|
||||||||||||||||
|
Basic
|
$
|
2.44
|
|
$
|
3.65
|
|
$
|
3.59
|
|
$
|
3.96
|
|
$
|
2.14
|
|
|||||
|
Diluted
|
$
|
2.43
|
|
$
|
3.62
|
|
$
|
3.57
|
|
$
|
3.92
|
|
$
|
2.11
|
|
|||||
|
Consolidated Balance Sheets:
|
|
|
|
|
||||||||||||||||
|
Total assets
|
$
|
16,212.2
|
|
$
|
12,423.8
|
|
$
|
12,697.6
|
|
$
|
12,021.1
|
|
$
|
10,386.6
|
|
|||||
|
Short-term borrowings and current portion of long-term debt
|
$
|
1,245.6
|
|
$
|
46.9
|
|
$
|
1.1
|
|
$
|
300.3
|
|
$
|
0.1
|
|
|||||
|
Long-term debt
|
$
|
3,422.5
|
|
$
|
1,914.9
|
|
$
|
1,959.6
|
|
$
|
1,412.7
|
|
$
|
1,752.0
|
|
|||||
|
Other information:
|
|
|
|
|
||||||||||||||||
|
Dividends per share of common stock
|
$
|
1.28
|
|
$
|
1.24
|
|
$
|
1.08
|
|
$
|
0.92
|
|
$
|
0.76
|
|
|||||
|
(1)
|
Fiscal year 2011 contained 53 weeks whereas fiscal years 2008, 2009, 2010, and 2012 contained 52 weeks.
|
|
(2)
|
Reflects activity as a result of our acquisition of StarBev Holdings S.a.r.l. on June 15, 2012.
|
|
(3)
|
As a result of the MillerCoors formation on July 1, 2008, and MCBC's prospective equity accounting for MillerCoors, net sales for the fifty-two weeks ended December 28, 2008, only include net U.S. sales through the period ended June 30, 2008.
|
26
Unless otherwise noted in this report, any description of "we", "us" or "our" includes Molson Coors Brewing Company ("MCBC" or the "Company"), principally a holding company, and its subsidiaries. On June 15, 2012, we completed our acquisition (the "Acquisition") of StarBev Holdings S.a.r.l. ("StarBev"), which we subsequently renamed Molson Coors Central Europe ("MCCE"), operating in Central Europe (which includes Czech Republic, Serbia, Croatia, Romania, Bulgaria, Hungary, Montenegro, Bosnia-Herzegovina and Slovakia). Our other subsidiaries include: Molson Coors Canada ("MCC"), operating in Canada; MillerCoors LLC ("MillerCoors"), which is accounted for by us under the equity method of accounting, operating in the United States ("U.S."); Molson Coors Brewing Company (UK) Limited ("MCBC-UK"), operating in the United Kingdom ("U.K.") and the Republic of Ireland; Molson Coors International ("MCI") operating in various other countries; and our other non-operating subsidiaries.
Unless otherwise indicated, (a) all $ amounts are in U.S. Dollars ("USD"), (b) comparisons are to comparable prior periods, and (c)
2012
refers to the 52 weeks ended on
December 29, 2012
,
2011
refers to the 53 weeks ended on
December 31, 2011
, and
2010
refers to the 52 weeks ended on
December 25, 2010
.
MillerCoors and MCCE follow a monthly reporting calendar. For MillerCoors,
2012
,
2011
and
2010
refer to the
12
months ended
December 31, 2012
,
December 31, 2011
, and
December 31, 2010
, respectively. For MCCE, 2012 refers to the period from the Acquisition date of June 15, 2012, through
December 31, 2012
.
In addition to financial measures presented on the basis of accounting principles generally accepted in the United States of America ("U.S. GAAP"), we also present pre-tax and after-tax "underlying income," "underlying income per diluted share," "underlying effective tax rate," and "underlying free cash flow," which are non-GAAP measures and should be viewed as supplements to (not substitutes for) our results of operations presented under U.S. GAAP. Our management uses underlying income, underlying income per diluted share, underlying effective tax rate and underlying free cash flow as measures of operating performance to assist in comparing performance from period to period on a consistent basis; as a measure for planning and forecasting overall expectations and for evaluating actual results against such expectations; and in communications with the board of directors, stockholders, analysts and investors concerning our financial performance. We believe that underlying income, underlying income per diluted share, underlying effective tax rate and underlying free cash flow performance are used by and are useful to investors and other users of our financial statements in evaluating our operating performance because they provide an additional tool to evaluate our performance without regard to special and non-core items, such as acquisition-related costs, which can vary substantially from company to company depending upon accounting methods and book value of assets and capital structure. We have provided reconciliations of all non-GAAP measures to their nearest U.S. GAAP measures.
Executive Summary
We are one of the world's largest brewers and have a diverse portfolio of owned and partner brands, including signature brands
Coors Light
,
Molson Canadian
,
Carling
and
Staropramen
, as well as craft and specialty beers such as
Blue Moon
,
Creemore Springs,
Cobra
and
Doom Bar
. For more than 350 combined years, we have been brewing, innovating and delighting the world's beer drinkers. Our success depends on our ability to make our products available to meet a wide range of consumer segments and occasions.
For the full year 2012, the biggest news was the acquisition of our Central Europe business, which we expect to strengthen our company, enhance our growth profile and increase shareholder value in the years ahead. We have begun implementing plans to capture synergies, leverage best practices and pay down debt related to buying this new business.
In 2012, we continued to focus on the three pillars of our growth strategy: to grow profitably in our core businesses through brands and innovation; to grow in new and emerging markets; and when it meets our strict shareholder return criteria, to grow through mergers and acquisitions. As in previous years, the first of these pillars was our primary focus as we continued to invest in our key brands and fill our innovation pipeline including growing
Coors Light
2012 market share in the U.S., U.K., and, including
Coors Light Iced T
, in Canada. Additionally, our above-premium craft portfolios in the U.S. and Canada out-performed the industry and grew market share. In our second growth pillar, MCI drove improved financial performance in the fourth quarter of 2012 as we began liquidating our under-performing China joint venture, restructured our
Coors Light
business in the rest of China, improved performance in Japan, and integrated the Central Europe license and export business. In our third growth pillar, the Central Europe integration has gone well. We are on schedule to capture the committed $50 million of cost and revenue synergies, and we are leveraging important process and commercial learnings from this business globally. The addition of this business provided more than $70 million of pre-tax earnings accretion in 2012 on an underlying basis (net of related interest expense).
27
Acquisition of StarBev
On June 15, 2012, we completed the Acquisition of StarBev from StarBev L.P. (the "Seller") for approximately €2.7 billion (or $3.4 billion), including the assumption and payoff of existing StarBev indebtedness. Headquartered in Amsterdam and Prague, StarBev is one of the largest brewers in Central Europe. StarBev, which we renamed Molson Coors Central Europe ("MCCE"), operates nine breweries in Czech Republic, Serbia, Croatia, Romania, Bulgaria, Hungary and Montenegro and sold approximately 13.3 million hectoliters of beer in 2011, including sales in Bosnia-Herzegovina and Slovakia. In 2011, StarBev held a top-three market share position in each of its markets, and its brand portfolio includes local champions such as
Staropramen, Borsodi, Kamenitza, Bergenbier, Ozujsko
,
Jelen
and
Niksicko,
and it also brews and distributes other brands under license.
Staropramen
is distributed and sold in over 45 countries. The operating results of MCCE are reported in our Central Europe and MCI segments.
The Acquisition fits squarely into our strategy to increase our portfolio of premium brands and deepen our reach into growth markets around the world. We believe the Central European beer market is attractive, with strong historical trends and upside potential as the region returns to its pre-economic-crisis growth rates. We believe MCCE, as a market leader in the Central European region, will provide us with a platform for growth and an excellent foundation from which to extend our key brands. We believe that
Staropramen
, MCCE's international flagship brand, will also enhance our portfolio in some of our current and planned markets.
2012
Financial Highlights:
|
•
|
We increased net sales, gross profit, underlying operating income and underlying after-tax income in 2012. Net income from continuing operations attributable to MCBC of
$441.5 million
(
$2.43
per diluted share) decreased
34.5%
from a year ago, primarily driven by MCCE-related financing and acquisition costs and special charges related to the impairments and related costs upon deconsolidation of our China joint venture, Molson Coors Si'hai ("MC Si'hai"), restructuring charges incurred by each of our segments and unfavorable foreign currency movements. Underlying after-tax income of
$710.5 million
, or
$3.91
per diluted share, increased
1.3%
compared to 2011, due to including the results of our Central Europe operations and positive performance in the U.S., partially offset by lower underlying earnings in Canada and the U.K., and unfavorable foreign currency movements. U.K. volume and Canada volume and pre-tax income benefited in 2011 from an additional week in our fiscal calendar. Our underlying income excludes
some special and other non-core gains, losses and expenses that net to a
$273.1 million
pre-tax charge as explained below. Worldwide beer volume for Molson Coors in 2012 increased
13.9%
compared to 2011, primarily due to including the results of our Central Europe operations, partially offset by lower volumes in Canada, the U.S. and the U.K.
Additionally, total-company net sales increased
11.4%
compared to 2011, primarily due to including the results of our Central Europe operations, positive pricing in Canada and higher MCI volumes, partially offset by lower volumes in Canada and the U.K.
|
|
•
|
We generated cash flow from operating activities of
$983.7 million
, representing a
13.3%
increase from
$868.1 million
in 2011 and a
31.2%
increase from
$749.7 million
in 2010, due to including the results of our Central Europe operations and favorable working capital movements. Underlying free cash flow in 2012 was
$864.7 million
compared to
$618.4 million
in 2011, representing an increase of
39.8%
and driven by including the results of our Central Europe operations and favorable working capital movements.
|
|
•
|
Along with approximately $601 million of available cash, we used the proceeds from $1.9 billion in senior unsecured notes, $300 million of bank debt, and a zero-coupon €500 million convertible note (or approximately $646 million fair value at closing) to purchase StarBev for approximately $3.4 billion, which represents a multiple of 10.8 times StarBev's 2011 pro forma underlying earnings before interest, taxes, depreciation and amortization, a non-GAAP measure. As we focus on achieving debt ratios closer to pre-Acquisition levels, we paid down approximately $180 million of our bank debt in the second half of 2012.
|
|
•
|
Regionally:
|
|
•
|
In Canada during 2012, we achieved positive pricing and brand mix. We strengthened our above-premium portfolio by introducing
Rickard's Cardigan
and
Oakhouse
seasonal brands and by acquiring the licenses for the
Newcastle Brown Ale
and
Strongbow
cider
brands. We also launched aluminum pint bottles for
Coors Light
and
Molson Canadian
. Our 2012 income from continuing operations before income taxes and underlying pre-tax income in Canada decreased by 10.9% to $423.0 million and by 10.2% to $436.7 million, respectively, compared to 2011. Positive pricing and cost reductions were more than offset by the negative impact of lower volume, a mix shift toward higher-cost products and packages, increased pension costs and negative foreign currency movements. Canada also benefited in 2011 from an additional week in our fiscal calendar a year ago which added approximately 0.140 million hectoliters of sales volume and $12 million to pre-tax income.
|
28
|
•
|
In the U.S.,
Coors Light
significantly outperformed the premium light segment and posted its eighth consecutive year of growth. We completed the relaunch of
Miller64
and rolled out
Leinenkugel's Lemon Berry Shandy
and
Batch 19
. Also in above-premium, we expanded
Henry Weinhard's
brands nationally and tested
Redd's Apple Ale
and
Third Shift
. The
Blue Moon
and
Leinenkugel's
brands continued to lead the craft beer segment with double-digit growth. We also purchased the Crispin Cider Company, which gives us brands in the fast-growing U.S. cider category. We continue to work hard to improve volume trends for
Miller Lite
, which is an important and profitable brand for us. Our 2012 equity income in MillerCoors increased 11.6% to $510.9 million, while underlying equity income in MillerCoors increased 9.2% to $524.3 million compared to 2011, driven by strong net pricing, favorable brand mix and cost savings, partially offset by lower sales volume, commodity inflation, increased marketing investments and spending behind new products and packaging innovations.
|
|
•
|
In Central Europe, we delivered a strong competitive performance in a tough trading environment with share and pricing growth in all our key markets, accelerated innovation performance driven by beer mixes,
Staropramen
growth in double digits and strict overhead cost management. On a full-year basis, we took the market share leadership position in Bulgaria, grew share in Croatia to its highest level in the past 10 years and achieved strong volume growth and record on-premise share in Czech Republic. We recorded solid share growth in all of our major markets in 2012 apart from Romania, where we gave up volume share in the thin-margin value segment. In our Central Europe segment, we reported 2012 income from continuing operations before income taxes of $97.4 million and 2012 underlying pre-tax income of $112.4 million. On a pro forma basis, Central Europe income from continuing operations before income taxes for 2012 decreased 26.3% to $121.5 million, and underlying pre-tax income for 2012 decreased 27.0% to $125.4 million due to significant unfavorable foreign currency movements, input cost inflation and lower volume, partially offset by positive pricing and lower marketing, general and administrative expenses. Pro forma amounts are used to give effect to the Acquisition as if it had occurred at the beginning of fiscal year 2011 and are discussed further in
"Results of Operations."
|
|
•
|
In a very challenging U.K. beer market, we now have two of the fastest growing premium brands with
Coors Light
and
Doom Bar
. We introduced
Carling Zest
with the launch being recognized as the best of the year in the U.K. by A.C. Nielsen. Our 2012 income from continuing operations before income taxes and underlying pre-tax income in the U.K. of $38.8 million and $59.6 million, respectively, represent decreases of $60.5 million and $41.9 million, respectively, compared to 2011, driven by lower sales volume, higher input inflation, higher pension expense and fixed cost deleverage from lower volume, partially offset by cost reduction initiatives and lower marketing investments.
|
|
•
|
During 2012, our approach to International organic growth within MCI continued to focus on disciplined market development, strong strategic partnerships and sound investments in our brands. Our MCI 2012 loss from continuing operations before income taxes increased by 116.5% to $72.1 million, due to the impairment loss recorded upon deconsolidation of our MC Si'hai joint venture. Our 2012 underlying pre-tax loss decreased by 9.0% to $29.4 million, driven by the addition of the Central Europe export and license business.
|
29
The following table highlights summarized components of our consolidated summary of operations for the years ended
December 29, 2012
,
December 31, 2011
, and
December 25, 2010
, and provides a reconciliation of "underlying income" to its nearest U.S. GAAP measure.
|
|
For the years ended
|
||||||||||||||||
|
|
December 29,
2012
|
|
% change
|
December 31,
2011
|
|
% change
|
December 25,
2010
|
|
|||||||||
|
|
(In millions, except percentages and per share data)
|
||||||||||||||||
|
Volume in hectoliters
|
25.343
|
|
34.4
|
%
|
18.861
|
|
2.2
|
%
|
18.464
|
|
|||||||
|
Net sales
|
$
|
3,916.5
|
|
11.4
|
%
|
$
|
3,515.7
|
|
8.0
|
%
|
$
|
3,254.4
|
|
||||
|
Net income attributable to MCBC from continuing operations
|
$
|
441.5
|
|
(34.5
|
)%
|
$
|
674.0
|
|
0.9
|
%
|
$
|
668.1
|
|
||||
|
Adjustments:
|
|
|
|||||||||||||||
|
Special items(1)
|
81.4
|
|
N/M
|
|
12.3
|
|
(42.3
|
)%
|
21.3
|
|
|||||||
|
42% of MillerCoors specials, net of tax(2)
|
13.4
|
|
(71.7
|
)%
|
47.4
|
|
N/M
|
|
12.7
|
|
|||||||
|
Acquisition, integration and financing related costs(3)
|
170.5
|
|
N/M
|
|
—
|
|
N/M
|
|
—
|
|
|||||||
|
Unrealized mark-to-market (gains) and losses(4)
|
12.8
|
|
178.3
|
%
|
4.6
|
|
N/M
|
|
—
|
|
|||||||
|
Basis amortization related to the
Sparks
brand impairment(5)
|
—
|
|
(100.0
|
)%
|
(25.2
|
)
|
N/M
|
|
—
|
|
|||||||
|
Other non-core items(6)
|
(5.0
|
)
|
(165.8
|
)%
|
7.6
|
|
(115.6
|
)%
|
(48.6
|
)
|
|||||||
|
Tax impact of Serbia statutory tax rate increase(7)
|
38.3
|
|
N/M
|
|
—
|
|
N/M
|
|
—
|
|
|||||||
|
Noncontrolling interest effect on special items(8)
|
(5.1
|
)
|
N/M
|
|
—
|
|
N/M
|
|
—
|
|
|||||||
|
Tax effect on special and non-core items(9)
|
(37.3
|
)
|
94.3
|
%
|
(19.2
|
)
|
N/M
|
|
13.4
|
|
|||||||
|
Non-GAAP: Underlying net income attributable to MCBC from continuing operations
|
$
|
710.5
|
|
1.3
|
%
|
$
|
701.5
|
|
5.2
|
%
|
$
|
666.9
|
|
||||
|
Net income attributable to MCBC per diluted share from continuing operations
|
$
|
2.43
|
|
(32.9
|
)%
|
$
|
3.62
|
|
1.4
|
%
|
$
|
3.57
|
|
||||
|
Non-GAAP: Underlying net income attributable to MCBC per diluted share from continuing operations
|
$
|
3.91
|
|
4.0
|
%
|
$
|
3.76
|
|
5.6
|
%
|
$
|
3.56
|
|
||||
N/M = not meaningful
|
(1)
|
See Part II—Item 8 Financial Statements and Supplementary Data, Note 9 "Special Items" of the Notes to the Consolidated Financial Statements ("Notes") for additional information.
|
|
(2)
|
See "Results of Operations", "United States Segment" under the sub-heading "
Special Items
" in this section for additional information.
|
|
(3)
|
In connection with the Acquisition, we recognized consulting and legal fees. Related to these fees we recorded $40.2 million as marketing, general and administrative expenses in 2012. In connection with the issuance and subsequent termination of the bridge loan, we incurred debt fees of
$13.0 million
in the second quarter of 2012 recorded as other expense. Additionally, in advance of our issuance of the
$1.9 billion
senior notes, we systematically removed a portion of our interest rate market risk in the second quarter of 2012 by entering into standard pre-issuance U.S. Treasury interest rate hedges ("Treasury Locks"). This resulted in an increase in the certainty of our yield to maturity when issuing the notes during which we recognized a cash loss of
$39.2 million
on settlement of the Treasury Locks recorded as interest expense. We also recognized $10.7 million of interest expense in the second quarter of 2012 on our
$1.9 billion
senior notes prior to the closing of the Acquisition. See Part II—Item 8 Financial Statements and Supplementary Data, Note 7 "Other Income and Expense" and Note 14 "Debt" of the Notes for additional information. Also, as part of the allocation of the consideration transferred for the Acquisition, MCCE's inventory value was increased by $8.6 million to its fair value in accordance with U.S. GAAP in the second quarter of 2012. This resulted in a corresponding decline in MCCE's gross profit after the Acquisition date of June 15, 2012, as all of this inventory was subsequently sold by MCCE in the second quarter of 2012. Finally, in connection with the Acquisition, we used the proceeds from our issuance of the
$1.9 billion
senior notes to purchase Euros. As a result of a negative foreign exchange movement between the Euro and USD prior to using these proceeds to fund the Acquisition, we realized a foreign exchange loss of $57.9 million on our Euro cash holdings in the second quarter of 2012 and recorded as other
|
30
expense. See Part II—Item 8 Financial Statements and Supplementary Data, Note 7 "Other Income and Expense" of the Notes for additional information.
|
(4)
|
We issued a €500 million
Zero
Coupon Senior Unsecured Convertible Note ("Convertible Note") to the Seller in conjunction with the closing of the Acquisition. The Convertible Note's embedded conversion feature was determined to meet the definition of a derivative required to be bifurcated and separately accounted for at fair value with changes in fair value recorded in earnings. In 2012, we recognized an unrealized gain of $8.0 million recorded as interest expense. See Part II—Item 8 Financial Statements and Supplementary Data, Note 14 "Debt" and Note 18 "Derivative Instruments and Hedging Activities" of the Notes for additional information. Additionally, we recognized a net unrealized foreign exchange loss of $23.8 million related to financing instruments entered into in conjunction with the financing and closing of the Acquisition in 2012 recorded as other expense. See Part II—Item 8 Financial Statements and Supplementary Data, Note 14 "Debt" of the Notes for additional information.
|
The unrealized gain related to changes in fair value on aluminum and diesel swaps are recorded as cost of goods sold within our Corporate business activities. As the exposure we are managing is realized, we reclassify the gain or loss to the segment, allowing our segments to realize the economic effects of the derivative without the resulting unrealized mark-to-market volatility. Unlike the majority of our derivative contracts, these swaps are not designated in a hedge accounting relationship. We recorded an unrealized gain of $3.0 million and an unrealized loss of $4.6 million related to these derivatives in 2012 and 2011, respectively.
|
(5)
|
See Part II—Item 8 Financial Statements and Supplementary Data, Note 5 "Investments" of the Notes under the sub-headings "Equity Investments" and "
Investment in MillerCoors"
for additional information.
|
|
(6)
|
In 2012, we recognized a gain of $5.2 million related to a sale of water rights recorded as other income.
|
We recognized gains related to the mark-to-market impact and settlement of the Foster's total return swap and options of $0.8 million and $47.9 million in 2011 and 2010, respectively, recorded as other income. This related to cash settled total return swap contracts entered into in 2008 in order to gain an economic interest exposure to Foster's Group Limited ("Foster's") stock, a major global brewer, and option contracts entered into in 2010 to limit our exposure to future changes in Foster's stock price.
In 2011, we recognized a $6.7 million loss related to the designation of our cross currency swap contracts as a net investment hedge of our Canadian business recorded as other expense. These swaps were historically designated as cash flow hedges and upon dedesignation as cash flow hedges, we reclassified the amounts previously recognized in accumulated other comprehensive income to earnings.
Other items included as non-core items include gains on sale of non-operating real estate, changes to environmental litigation provisions and the repayment of tax rebates received in the U.K.
|
(7)
|
In the fourth quarter of 2012, the Serbian government increased statutory corporate income tax rates from 10% to 15%, effective January 1, 2013. As a result of the impact of the rate change on differences between the book basis and tax basis of intangible and other assets purchased in the Acquisition, we increased our deferred tax liability by, and recognized income tax expense of, $38.3 million.
|
|
(8)
|
The effect of noncontrolling interest on the adjustments used to arrive at underlying income, a non-GAAP measure, is calculated based on our ownership percentage of our subsidiaries from which each adjustment arises. This adjustment relates primarily to the goodwill impairment charge in our MC Si'hai joint venture. See Part II—Item 8 Financial Statements and Supplementary Data, Note 13 "Goodwill and Intangible Assets" of the Notes for additional information.
|
|
(9)
|
The effect of taxes on the adjustments used to arrive at underlying net income, a non-GAAP measure, is calculated based on applying the estimated underlying full-year effective tax rate to underlying earnings, excluding special and non-core items. The effect of taxes on special and non-core items is calculated based on the statutory tax rate applicable to the item being adjusted for in the jurisdiction from which each adjustment arises.
|
Worldwide beer volume
Worldwide beer volume is composed of our financial volume, royalty volume and proportionate share of equity investment sales-to-retail. Financial volume represents owned beer brands sold to unrelated external customers within our geographical markets, net of returns and allowances. Royalty beer volume consists of our brands produced and sold by third parties under various license and contract-brewing agreements. Equity investment sales-to-retail brand volume represents our ownership percentage share of volume in our subsidiaries accounted for under the equity method, including MillerCoors and Modelo Molson Imports, L.P. ("MMI"), our joint venture in Canada with Grupo Modelo S.A.B. de C.V. ("Modelo").
31
The following table highlights summarized components of our sales volume for the years ended
December 29, 2012
,
December 31, 2011
, and
December 25, 2010
:
|
|
For the years ended
|
|||||||||||||
|
|
December 29,
2012
|
|
% change
|
December 31,
2011
|
|
% change
|
December 25,
2010
|
|
||||||
|
|
(In millions, except percentages)
|
|||||||||||||
|
Volume in hectoliters:
|
|
|
|
|
|
|||||||||
|
Financial volume
|
25.343
|
|
34.4
|
%
|
18.861
|
|
2.2
|
%
|
18.464
|
|
||||
|
Royalty volume(1)
|
1.064
|
|
135.9
|
%
|
0.451
|
|
30.0
|
%
|
0.347
|
|
||||
|
Owned volume
|
26.407
|
|
36.7
|
%
|
19.312
|
|
2.7
|
%
|
18.811
|
|
||||
|
Proportionate share of equity investment sales-to-retail(2)
|
28.652
|
|
(1.4
|
)%
|
29.046
|
|
(2.8
|
)%
|
29.878
|
|
||||
|
Total worldwide beer volume
|
55.059
|
|
13.9
|
%
|
48.358
|
|
(0.7
|
)%
|
48.689
|
|
||||
|
(1)
|
Includes our MCI segment volume in Russia, Ukraine, Mexico, Spain, Vietnam and Philippines and a portion of our U.K. segment volume in Ireland.
|
|
(2)
|
Reflects the addition of our proportionate share of equity method investments sales-to-retail for the periods presented.
|
Our worldwide beer volume increased 13.9% in
2012
compared to
2011
, due to including the results of our Acquisition. Excluding the volume results from our Acquisition, our worldwide beer volume declined 3.2% in 2012 driven by lower volumes in the U.K., U.S. and Canada. Worldwide beer volume decreased 0.7% in
2011
versus 2010, driven by lower volumes in the U.S. and Canada, partially offset by higher volumes in the U.K. and MCI.
Synergies and other cost savings initiatives
We achieved $74 million and $200 million of cost savings in
2012
and program to date, respectively, exceeding our second Resources for Growth ("RFG2") program's three-year goal of $150 million of annualized cost reductions by the end of 2012. In addition to our RFG2 savings, MillerCoors delivered incremental cost savings of $110 million in
2012
. We benefit from 42% of the MillerCoors cost savings.
Components of our Statements of Operations
Net sales
—Our net sales represent the sale of beer and other malt beverages net of excise taxes, the vast majority of which are brands that we own and brew ourselves. We import or brew and sell certain non-owned partner brands under licensing and related arrangements. We also sell certain "factored" brands (beverage brands owned by other companies, but sold and distributed by us), to on-premise customers in the U.K. In addition, we contract manufacture for other brewers in some of our markets.
Cost of goods sold
—Our cost of goods sold includes costs we incur to make and ship beer. These costs include brewing materials, such as barley, hops, and various grains. Packaging materials, including glass bottles, aluminum and steel cans, cardboard and paperboard are also included in our cost of goods sold. Additionally, our cost of goods sold include both direct and indirect labor, freight costs, utilities, maintenance costs, depreciation, promotional packaging, other manufacturing overheads and costs to purchase factored brands from suppliers, as well as the estimated cost to facilitate product returns.
Marketing, general and administrative
—Our marketing, general and administrative expenses include media advertising (television, radio, print), tactical advertising (signs, banners, point-of-sale materials) and promotion costs on both local and national levels within our operating segments. This classification includes general and administrative costs for functions such as finance, legal, human resources and information technology, which consist primarily of labor and outside services, as well as bad debt expense related to our allowance for doubtful accounts. These costs also include our marketing and sales organizations, including labor and other overheads. This line item includes amortization costs associated with intangible assets, as well as certain depreciation costs related to non-production equipment and share-based compensation.
Special items
—Our special items represent charges incurred or benefits realized that we do not believe to be indicative of our core operations; specifically, such items are considered to be one of the following:
|
•
|
infrequent or unusual items,
|
|
•
|
impairment or asset abandonment-related losses, or
|
|
•
|
restructuring charges and other atypical employee-related costs.
|
32
Although we believe these items are not indicative of our core operations, the items classified as special items are not necessarily non-recurring.
Equity income in MillerCoors
—Our equity income in MillerCoors represents our proportionate share for the period of the net income of our investment in MillerCoors accounted for under the equity method. Such amount typically reflects adjustments similar to those made in preparing consolidated statements, including adjustments to eliminate intercompany gains and losses, and to amortize, if appropriate, any difference between cost and underlying equity in net assets upon the formation of MillerCoors.
Interest expense, net
—Out interest costs are associated with borrowings to finance our operations. Interest income in the U.K. segment is associated with trade loans receivable from customers.
Other income (expense)
—Our other income (expense) classification includes primarily gains and losses associated with activities not directly related to brewing and selling beer. For instance, certain gains or losses on foreign exchange and on sales of non-operating assets are classified in this line item.
Discussions of statements of operations line items such as noncontrolling interests and discontinued operations are discussed in detail elsewhere in MD&A and in Part II—Item 8 Financial Statements and Supplementary Data in the Notes.
Depreciation and Amortization
Depreciation and amortization expense was
$272.7 million
in
2012
, an increase of $55.6 million compared to
2011
, primarily due to the Acquisition. Depreciation and amortization expense was
$217.1 million
in
2011
, an increase of $14.8 million compared to
2010
.
Income Taxes
Our effective tax rate, a U.S. GAAP measure, was approximately 26% in
2012
, 13% in
2011
and 17% in
2010
. Our effective tax rates were significantly lower than the federal statutory rate of 35% primarily due to lower effective income tax rates applicable to our Canada, Central Europe and U.K. businesses. The 2012 effective tax rate increased versus 2011 due to the statutory corporate income tax rate increase in Serbia as a result of differences between the book and tax bases of intangible assets purchased in the Acquisition increasing our deferred tax liability. Additionally, the increase in valuation allowances in 2012 also contributed to the higher 2012 effective rate driven by losses in the normal course of business in foreign jurisdictions and a capital loss generated in the U.S. related to the impairment charges recognized in our MC Si'hai joint venture in China. Our 2011 effective tax rate and our 2011 underlying effective tax rate, a non-GAAP measure, were low compared to 2012 due primarily to the favorable resolution of unrecognized tax positions and lower valuation allowances. See table below for the reconciliation of our underlying effective tax rate to its nearest U.S. GAAP measure.
|
|
For the years ended
|
||||||||
|
|
December 29,
2012
|
|
December 31,
2011
|
|
December 25,
2010
|
|
|||
|
Effective tax rate
|
26
|
%
|
13
|
%
|
17
|
%
|
|||
|
Adjustments:
|
|
|
|
||||||
|
Tax rate changes
|
(5
|
)%
|
—
|
%
|
—
|
%
|
|||
|
Acquisition-related costs
|
(2
|
)%
|
—
|
%
|
—
|
%
|
|||
|
China impairments
|
(1
|
)%
|
—
|
%
|
—
|
%
|
|||
|
MillerCoors special items
|
—
|
%
|
1
|
%
|
—
|
%
|
|||
|
Foster's total return swap
|
—
|
%
|
—
|
%
|
(1
|
)%
|
|||
|
Non-GAAP: Underlying effective tax rate
|
18
|
%
|
14
|
%
|
16
|
%
|
|||
Discontinued Operations
Discontinued operations are primarily associated with the formerly-owned Cervejarias Kaiser Brasil S.A. ("Kaiser") business in Brazil. See Part II—Item 8 Financial Statements and Supplementary Data, Note 6 "Discontinued Operations" of the Notes for discussions of the nature of amounts recognized in the discontinued operations section of the consolidated statements of operations, which consists primarily of amounts associated with indemnity obligations to FEMSA Cerveza S.A. de C.V. ("FEMSA") related to purchased tax credits and other tax, civil and labor issues.
We recognized gains from discontinued operations of
$1.5 million
,
$2.3 million
and
$39.6 million
during
2012
,
2011
, and
2010
, respectively. This amount is typically associated with adjustments to the indemnity liabilities due to changes in estimates
33
and foreign exchange gains or losses. However, during 2010, we recognized a gain of $42.6 million related to our settlement of a portion of our indemnity liabilities to FEMSA.
Additionally, during the third quarter of 2012, we finalized the settlement related to a distributorship litigation in Brazil for $6.8 million. We recognized a loss on settlement of the litigation of $2.0 million during 2012, as we had accrued $4.8 million as of December 31, 2011. In 2011, we incurred a loss related to an adjustment in legal reserves related to discontinued operations of $0.4 million. See Part II—Item 8 Financial Statements and Supplementary Data, Note 20 "Commitments and Contingencies" of the Notes for further discussion.
Results of Operations
Canada Segment
The Canada segment consists of our production, marketing and sales of the
Molson
family of brands,
Coors Light, Rickard's
,
Carling
, and other owned and licensed brands in Canada. Also included in the Canada segment is MMI, our joint venture established to import, distribute, and market the Modelo beer brand portfolio across all Canadian provinces and territories. MMI is accounted for under the equity method. In addition, the Canada segment includes Brewers' Retail, Inc. ("BRI"), our joint venture arrangement related to the distribution and retail sale of beer in Ontario, and Brewers' Distributor Ltd. ("BDL"), our joint venture arrangement related to the distribution of beer in the western provinces. Both BRI and BDL are accounted for under the equity method.
The following represents our results of operations for Canada for the years ended
December 29, 2012
,
December 31, 2011
, and
December 25, 2010
.
|
|
For the years ended
|
|||||||||||||||||
|
|
December 29, 2012
|
% change
|
December 31, 2011
|
% change
|
December 25, 2010
|
|||||||||||||
|
|
(In millions, except percentages)
|
|||||||||||||||||
|
Volume in hectoliters
|
8.505
|
|
(3.9
|
)%
|
8.850
|
|
(0.8
|
)%
|
8.922
|
|
||||||||
|
Net sales
|
$
|
2,036.8
|
|
(1.5
|
)%
|
$
|
2,067.3
|
|
6.7
|
%
|
$
|
1,938.2
|
|
|||||
|
Cost of goods sold
|
(1,120.7
|
)
|
3.0
|
%
|
(1,087.8
|
)
|
12.2
|
%
|
(969.6
|
)
|
||||||||
|
Gross profit
|
916.1
|
|
(6.5
|
)%
|
979.5
|
|
1.1
|
%
|
968.6
|
|
||||||||
|
Marketing, general and administrative expenses
|
(476.5
|
)
|
(1.9
|
)%
|
(485.6
|
)
|
(1.1
|
)%
|
(491.1
|
)
|
||||||||
|
Special items, net
|
(13.7
|
)
|
18.1
|
%
|
(11.6
|
)
|
(31.8
|
)%
|
(17.0
|
)
|
||||||||
|
Operating income (loss)
|
425.9
|
|
(11.7
|
)%
|
482.3
|
|
4.7
|
%
|
460.5
|
|
||||||||
|
Other income (expense), net
|
(2.9
|
)
|
(60.8
|
)%
|
(7.4
|
)
|
13.8
|
%
|
(6.5
|
)
|
||||||||
|
Income (loss) from continuing operations before income taxes
|
$
|
423.0
|
|
(10.9
|
)%
|
$
|
474.9
|
|
4.6
|
%
|
$
|
454.0
|
|
|||||
|
Adjusting items:
|
|
|
|
|
|
|||||||||||||
|
Special items
|
13.7
|
|
18.1
|
%
|
11.6
|
|
(31.8
|
)%
|
17.0
|
|
||||||||
|
Non-GAAP: Underlying pre-tax income (loss)
|
$
|
436.7
|
|
(10.2
|
)%
|
$
|
486.5
|
|
3.3
|
%
|
$
|
471.0
|
|
|||||
Foreign currency impact on results
Our Canada segment was unfavorably impacted by a 1.5% year-over-year decrease in the value of the Canadian Dollar ("CAD") against the USD in
2012
versus
2011
. This represented an approximate $11 million decrease to our
2012
USD earnings before income taxes and USD underlying pre-tax income. Our Canada segment was favorably impacted by a 4.4% year-over-year increase in the value of the CAD against the USD in
2011
versus
2010
. This represented an approximate $12 million and $13 million increase to our
2011
USD earnings before income taxes and USD underlying pre-tax income, respectively.
Assets and liabilities recorded in foreign currencies that are the functional currencies for the respective operations are translated at the prevailing exchange rate at the balance sheet date. Translation adjustments resulting from this process are reported as a separate component of other comprehensive income. Revenue and expenses are translated at the average exchange rates during the period. Gains and losses from foreign currency transactions are included in earnings for the period.
34
Volume and net sales
Our
2012
Canada sales to retail ("STRs") decreased 4.4% versus
2011
. The decrease was driven by cycling the 53rd week in 2011 along with declines in Western Canada and Québec due to increased competitor price discounting in these regions. Additionally, in the second half of 2012, the National Hockey League ("NHL") lockout limited our ability to activate our established brands of
Coors Light
and
Molson Canadian,
the official beer of the NHL.
The Canadian beer industry STRs decreased approximately 2% in calendar year
2012
compared to
2011
. As a result, our market share declined approximately a full share point on a full-year basis.
Our
2012
Canada sales volume decreased by 3.9% to 8.5 million hectoliters compared to
2011
, driven by the decline in STRs.
Our
2012
net sales per hectoliter increased 3.9% in local currency compared to
2011
, driven by positive net pricing, favorable mix and the absence of the North American Breweries, Inc. ("NAB") contract revenue in the first half of 2011.
Net sales decreased to $2,036.8 million in
2012
compared to $2,067.3 million in
2011
, driven by lower sales volume and unfavorable foreign exchange rates, partially offset by the increase in net sales per hectoliter.
Our
2011
Canada STRs decreased 1.0% versus
2010
. Declines in established brands offset volume gains from
Keystone Lager
expansion into Ontario and the introduction of
Molson Canadian 67 Sublime
and
Rickard's Blonde,
along with the continued expansion of
Creemore
and
Granville Island
to new markets. These declines were driven by increased competitor price discounting in key regions.
Canada industry volumes decreased in calendar year
2011
and our market share declined approximately a half share point on a full-year basis.
Our
2011
Canada sales volume decreased by 0.8% compared to
2010
, driven by the decline in STRs.
Our
2011
net sales per hectoliter increased 3.0% in local currency compared to
2010
, driven by positive net pricing and the addition of the contract brewing sales to NAB.
Net sales increased to $2,067.3 million in
2011
compared to $1,938.2 million in
2010
, driven by the increase in net sales per hectoliter and favorable foreign exchange rates, partially offset by lower sales volume.
Cost of goods sold
Cost of goods sold per hectoliter in local currency increased 8.6% in
2012
versus
2011
, driven by higher pension expense, input inflation, a mix shift toward higher-cost brands and packages, fixed cost deleverage from lower volume and a full year of contract brewing sales to NAB in 2012, partially offset by RFG2 savings.
Our
2011
cost of goods sold per hectoliter increased 8.4% in local currency compared to
2010
, driven by input inflation, the cost of brewing beer under our NAB contract, fixed cost deleverage from lower volume, unfavorable package mix and cycling one-time cost reductions in 2010. These factors were partially offset by RFG2 savings in 2011.
Marketing, general and administrative expenses
Our
2012
marketing, general and administrative expenses decreased 0.5% in local currency versus
2011
, driven by lower marketing and sales investments.
Our
2011
marketing, general and administrative expenses decreased 5.3% in local currency versus
2010
, driven by lower employee incentive compensation and other overhead expenses.
Special items, net
During
2012
, we recognized charges of $10.1 million relating to a restructuring program focused on labor savings across all functions. Also, during 2012 we recognized charges for pension curtailment and special termination benefits related to certain defined benefit pension plans of $5.0 million. Additionally, during 2012 we recognized a $1.4 million benefit related to the timing of insurance proceeds for flood damages in our Toronto offices.
During
2011
, we recognized special termination benefit costs of $5.2 million as eligible employees elected to take early retirement. Additionally, we recognized a $7.6 million loss related to the correction of an immaterial error to adjust fixed assets resulting from the performance of a fixed asset count. We also recognized a $2.0 million gain resulting from a reduction of our guarantee of BRI's debt obligations.
35
During
2010
, we recognized $12.8 million of expense related to a capital asset write-off and associated costs for the abandonment of sales support software, which had been under development. Additionally, we recognized expense for special termination benefits of $3.2 million as eligible employees elected to take early retirement and recognized $1.0 million of expense for restructuring costs. See Part II—Item 8 Financial Statements and Supplementary Data, Note 9 "Special Items" of the Notes for further discussion.
Other income (expense), net
Other expense in 2012 decreased $4.5 million compared to 2011, due to foreign currency movements. Other expense in 2011 increased $0.9 million compared to 2010, primarily due to foreign currency movements.
United States Segment
The U.S. segment consists of our interest, and results from our interest, in MillerCoors, our joint venture with SABMiller plc ("SABMiller") for all U.S. operations. MillerCoors produces, markets and sells beer brands in the U.S. and Puerto Rico. Its major brands include
Coors Light
,
Miller Lite
,
Miller High Life
,
Keystone Light
,
Blue Moon
,
Leinenkugel's
,
Coors Banquet
and
Miller Genuine Draft
. Our interest in MillerCoors is accounted for under the equity method of accounting. See Part II—Item 8 Financial Statements and Supplementary Data, Note 5 "Investments" of the Notes for further discussion.
The following represents the results of operations for MillerCoors for the years ended
December 31, 2012
,
December 31, 2011
, and
December 31, 2010
.
|
|
For the years ended
|
|||||||||||||||||
|
|
December 31, 2012
|
% change
|
December 31, 2011
|
% change
|
December 31, 2010
|
|||||||||||||
|
|
(In millions, except percentages)
|
|||||||||||||||||
|
Volumes in hectoliters
|
76.299
|
|
(0.5
|
)%
|
76.652
|
|
(2.8
|
)%
|
78.823
|
|
||||||||
|
Net sales
|
$
|
7,761.1
|
|
2.8
|
%
|
$
|
7,550.2
|
|
(0.3
|
)%
|
$
|
7,570.6
|
|
|||||
|
Cost of goods sold
|
(4,689.7
|
)
|
0.9
|
%
|
(4,647.9
|
)
|
(0.8
|
)%
|
(4,686.3
|
)
|
||||||||
|
Gross profit
|
3,071.4
|
|
5.8
|
%
|
2,902.3
|
|
0.6
|
%
|
2,884.3
|
|
||||||||
|
Marketing, general and administrative expenses
|
(1,828.5
|
)
|
3.4
|
%
|
(1,768.6
|
)
|
(0.4
|
)%
|
(1,775.1
|
)
|
||||||||
|
Special items, net
|
(31.8
|
)
|
(72.0
|
)%
|
(113.4
|
)
|
N/M
|
|
(30.3
|
)
|
||||||||
|
Operating income
|
1,211.1
|
|
18.7
|
%
|
1,020.3
|
|
(5.4
|
)%
|
1,078.9
|
|
||||||||
|
Other income (expense), net
|
0.3
|
|
(75.0
|
)%
|
1.2
|
|
(50.0
|
)%
|
2.4
|
|
||||||||
|
Income from continuing operations before income taxes and noncontrolling interests
|
1,211.4
|
|
18.6
|
%
|
1,021.5
|
|
(5.5
|
)%
|
1,081.3
|
|
||||||||
|
Income tax expense
|
(5.5
|
)
|
(26.7
|
)%
|
(7.5
|
)
|
(1.3
|
)%
|
(7.6
|
)
|
||||||||
|
Income from continuing operations
|
1,205.9
|
|
18.9
|
%
|
1,014.0
|
|
(5.6
|
)%
|
1,073.7
|
|
||||||||
|
Less: Net income attributable to noncontrolling interests
|
(15.0
|
)
|
47.1
|
%
|
(10.2
|
)
|
(38.9
|
)%
|
(16.7
|
)
|
||||||||
|
Net income attributable to MillerCoors
|
$
|
1,190.9
|
|
18.6
|
%
|
$
|
1,003.8
|
|
(5.0
|
)%
|
$
|
1,057.0
|
|
|||||
|
Adjusting items:
|
|
|
|
|
|
|||||||||||||
|
Special items
|
31.8
|
|
(72.0
|
)%
|
113.4
|
|
N/M
|
|
30.3
|
|
||||||||
|
Tax effect on special items, net
|
—
|
|
(100.0
|
)%
|
(0.4
|
)
|
N/M
|
|
(0.1
|
)
|
||||||||
|
Non-GAAP: Underlying net income attributable to MillerCoors
|
$
|
1,222.7
|
|
9.5
|
%
|
$
|
1,116.8
|
|
2.7
|
%
|
$
|
1,087.2
|
|
|||||
N/M = not meaningful
36
The following represents our proportional share of MillerCoors net income reported under the equity method (in millions):
|
For the year ended December 29, 2012
|
% change
|
For the year ended December 31, 2011
|
% change
|
For the year ended December 25, 2010
|
||||||||||||||
|
Net income attributable to MillerCoors
|
$
|
1,190.9
|
|
18.6
|
%
|
$
|
1,003.8
|
|
(5.0
|
)%
|
$
|
1,057.0
|
|
|||||
|
MCBC economic interest
|
42
|
%
|
42
|
%
|
42
|
%
|
||||||||||||
|
MCBC proportionate share of MillerCoors net income
|
500.2
|
|
18.6
|
%
|
421.6
|
|
(5.0
|
)%
|
443.9
|
|
||||||||
|
Amortization of the difference between MCBC contributed cost basis and proportional share of the underlying equity in net assets of MillerCoors(1)
|
4.9
|
|
(86.2
|
)%
|
35.4
|
|
N/M
|
|
6.9
|
|
||||||||
|
Share-based compensation adjustment(1)
|
5.8
|
|
N/M
|
|
0.9
|
|
(83.0
|
)%
|
5.3
|
|
||||||||
|
Equity Income in MillerCoors
|
$
|
510.9
|
|
11.6
|
%
|
$
|
457.9
|
|
0.4
|
%
|
$
|
456.1
|
|
|||||
|
Adjusting items:
|
|
|
|
|||||||||||||||
|
MCBC proportionate share of MillerCoors special items
|
13.4
|
|
(71.8
|
)%
|
47.6
|
|
N/M
|
|
12.7
|
|
||||||||
|
Basis amortization related to
Sparks
brand impairment(1)
|
—
|
|
(100.0
|
)%
|
(25.2
|
)
|
N/M
|
|
—
|
|
||||||||
|
Tax effect on special items
|
—
|
|
(100.0
|
)%
|
(0.2
|
)
|
N/M
|
|
—
|
|
||||||||
|
Non-GAAP Equity Income in MillerCoors
|
$
|
524.3
|
|
9.2
|
%
|
$
|
480.1
|
|
2.4
|
%
|
$
|
468.8
|
|
|||||
N/M = not meaningful
|
(1)
|
See Part II—Item 8 Financial Statements and Supplementary Data, Note 5 "Investments" of the Notes, for a detailed discussion of these equity method adjustments.
|
The discussion below highlights the MillerCoors results of operations for the year ended
December 31, 2012
, versus the year ended
December 31, 2011
, and for the year ended
December 31, 2011
, versus the year ended
December 31, 2010
.
Volume and net sales
MillerCoors domestic STRs declined 1.3% in
2012
versus
2011
, driven by declines in
Miller Lite
and the below premium portfolio, partially offset by growth in
Coors Light
and double-digit growth in Tenth and Blake led by the
Blue Moon
and
Leinenkugel's
brands.
Total sales volume declined 0.5% in
2012
compared to
2011
. Domestic sales-to-wholesalers decreased 1.1%
versus
2011
,
driven by the decline in STRs, partially offset by increased contract brewing volume.
Domestic net sales per hectoliter increased 3.5% in
2012
compared to
2011
, due to strong net pricing and brand mix. Total net sales per hectoliter, including contract brewing and company-owned distributor sales, increased 3.3% in
2012
compared to
2011
.
Net sales increased to $7,761.1 million in
2012
, compared to $7,550.2 million in
2011
. This increase was driven by the increase in domestic net sales per hectoliter, partially offset by lower sales volume.
Adjusted for trading days,
2011
domestic STRs declined 2.3% versus
2010
, driven by weak economic conditions affecting the entire industry. Declines in below premium and premium regular brands offset brand growth in Tenth and Blake. Additionally, premium light brands as a group
were down slightly.
Blue Moon
continued growing at a double-digit rate,
Coors Light
was up slightly, and the remaining focus brands (
Miller Lite
,
Miller High Life
,
Keystone,
and
MGD 64
) declined.
Total sales volume declined 2.8% in
2011
compared to
2010
. Domestic sales-to-wholesalers decreased 3.0% driven by the decline in STRs, and contract brewing volume was unchanged versus
2010
.
Domestic net sales per hectoliter increased 2.4% in
2011
compared to
2010
, due to higher domestic net pricing and favorable sales mix. Total net sales per hectoliter, including contract brewing and company-owned distributor sales, increased 2.6% in
2011
compared to
2010
.
37
Net sales decreased slightly to $7,550.2 million in
2011
, compared to $7,570.6 million in
2010
. This decrease was driven by lower sales volume largely offset by the increase in domestic net sales per hectoliter.
Cost of goods sold
Cost of goods sold per hectoliter increased 1.4% in
2012
compared to
2011
, driven by the cost of packaging innovations and commodity inflation, partially offset by cost savings initiatives.
MillerCoors
2011
cost of goods sold per hectoliter increased 2.0% compared to
2010
, due to higher freight, fuel and packaging costs, and fixed-cost deleverage, which were partially offset by cost savings.
Marketing, general and administrative expenses
Marketing, general and administrative expenses increased by 3.4% in
2012
versus
2011
, due to increased marketing investments and spending behind new products and packaging innovations.
MillerCoors
2011
marketing, general and administrative expenses decreased by 0.4% versus
2010
, driven by the one-time receipt of $14.0 million from a third party and lower marketing spending as strategic initiatives changed in 2011, specifically
Coors Light
changing its focus to local university alliances from the National Football League sponsorship, partially offset by higher information systems costs.
Special Items
During
2012
, MillerCoors recognized special charges of $31.8 million due to the write-down of assets related to discontinuing the production of the Home Draft packaging line and the write-down of information systems assets related to the business transformation project. Also, during 2012, MillerCoors recognized a pension curtailment gain of $2.3 million.
During
2011
, MillerCoors recognized special charges totaling $113.4 million, driven primarily by a $60.0 million write-down of the value of the
Sparks
brand and a $50.9 million charge resulting from the planned assumption of the Milwaukee Brewery Worker's Pension Plan, an underfunded multi-employer pension plan.
During
2010
, MillerCoors recognized $30.3 million of special charges driven largely by pension curtailment losses, as well as integration costs including severance and relocation costs resulting from the sales office reorganization.
38
Central Europe Segment
As a result of the Acquisition, our Central Europe segment produces and sells our brands principally in Czech Republic, Serbia, Croatia, Romania, Bulgaria, Hungary and Montenegro and also sells our brands in Bosnia-Herzegovina and Slovakia. Our brand portfolio includes
Jelen
,
Staropramen
,
Ozujsko
,
Bergenbier
,
Kamenitza
, and
Branik
. We also brew and distribute
Stella Artois, Beck's, Lowenbrau
and
Spaten
under license agreements with ABI companies.
Actual and Pro Forma Results
The following represents our actual and pro forma results of operations for Central Europe for the years ended
December 29, 2012
, and
December 31, 2011
, to give effect to the Acquisition as if it had occurred at the beginning of fiscal year 2011.
|
For the years ended
|
|||||||||||||||||||
|
2012
|
2011
|
||||||||||||||||||
|
Pro Forma
|
Actual
|
Pro Forma Combined
|
Pro Forma
|
||||||||||||||||
|
For the period January 1 through June 14(2)
|
For the period June 15 through December 29(1)
|
December 29, 2012(1)(2)
|
December 31, 2011(2)
|
% change
|
|||||||||||||||
|
(In millions, except percentages)
|
|||||||||||||||||||
|
Volume in hectoliters
|
5.303
|
|
7.565
|
|
12.868
|
|
12.951
|
|
(0.6
|
)%
|
|||||||||
|
Net sales(3)
|
$
|
327.7
|
|
$
|
481.2
|
|
$
|
808.9
|
|
$
|
914.1
|
|
(11.5
|
)%
|
|||||
|
Cost of goods sold(4)
|
(194.2
|
)
|
(277.7
|
)
|
(471.9
|
)
|
(504.7
|
)
|
(6.5
|
)%
|
|||||||||
|
Gross profit
|
133.5
|
|
203.5
|
|
337.0
|
|
409.4
|
|
(17.7
|
)%
|
|||||||||
|
Marketing, general and administrative expenses(5)
|
(108.8
|
)
|
(104.2
|
)
|
(213.0
|
)
|
(234.7
|
)
|
(9.2
|
)%
|
|||||||||
|
Special items, net
|
—
|
|
(2.0
|
)
|
(2.0
|
)
|
(7.0
|
)
|
(71.4
|
)%
|
|||||||||
|
Operating income (loss)
|
24.7
|
|
97.3
|
|
122.0
|
|
167.7
|
|
(27.3
|
)%
|
|||||||||
|
Other income (expense), net
|
(0.6
|
)
|
0.1
|
|
(0.5
|
)
|
(2.9
|
)
|
(82.8
|
)%
|
|||||||||
|
Income (loss) from continuing operations before income taxes
|
$
|
24.1
|
|
$
|
97.4
|
|
$
|
121.5
|
|
$
|
164.8
|
|
(26.3
|
)%
|
|||||
|
Adjusting items:
|
|||||||||||||||||||
|
Special items
|
—
|
|
2.0
|
|
2.0
|
|
7.0
|
|
(71.4
|
)%
|
|||||||||
|
Acquisition and integration related costs
|
(11.1
|
)
|
13.0
|
|
1.9
|
|
—
|
|
N/M
|
|
|||||||||
|
Non-GAAP: Underlying pre-tax income (loss)
|
$
|
13.0
|
|
$
|
112.4
|
|
$
|
125.4
|
|
$
|
171.8
|
|
(27.0
|
)%
|
|||||
N/M = Not meaningful
|
(1)
|
Represents Central Europe results from the Acquisition date of June 15, 2012, through December 29, 2012. The results related to the Central Europe export and license business, which includes arrangements in Russia and Ukraine as well as export of Central European brands, have been moved to our MCI segment effective July 1, 2012. The impact of our Central Europe export and license business for the period from Acquisition through the end of the second quarter 2012 was immaterial and therefore, have not been recast to be included in MCI results. However, this change is reflected in the following pro forma results. On a pro forma basis, this reporting change resulted in removing net sales and income from continuing operations of $1.4 million and $0.7 million, respectively, that were earned from the Acquisition date of June 15, 2012, through June 30, 2012, that were previously reported in our Central Europe segment.
|
|
(2)
|
Pro forma amounts include the results of operations for StarBev from January 1, 2012, to June 14, 2012 combined with the post-Acquisition actual results included in our consolidated financial statements subsequent to June 14, 2012, to form our pro forma combined results for the year ended December 29, 2012. Additionally, pro forma amounts include the historic StarBev results for the year ended December 31, 2011. These amounts also include pro forma adjustments as if StarBev had been acquired on December 26, 2010, the first day of our 2011 fiscal year, including the effects of acquisition accounting as described below and eliminating non-recurring costs and expenses directly related to the transaction, but do not include adjustments for costs related to integration activities, cost savings or synergies that have been or may be achieved by the combined businesses. Pro forma amounts are not necessarily indicative of
|
39
what the results would have been had we operated the businesses since December 26, 2010, nor are they indicative of the results that may be obtained in the future. Financial information for StarBev is from audited annual and unaudited interim financial information in Euros derived from StarBev's underlying books and records maintained in accordance with International Financial Reporting Standards ("IFRS") and translated to USD using quarterly average exchange rates during each period indicated. Based on our review of StarBev's historical financial statements and understanding of the differences between U.S. GAAP and IFRS, we are not aware of any further adjustments that we would need to make to StarBev's historical financial statements to present them on a U.S. GAAP basis except as noted below.
|
(3)
|
StarBev's historical net sales were reduced by $25.4 million and $61.8 million for the pre-Acquisition periods of January 1, 2012, to June 14, 2012, and the year ended December 31, 2011, respectively, to reflect reclassifications relating primarily to the treatment of payments made to customers. Specifically, in accordance with U.S. GAAP, these customer payments are considered a reduction of net sales and, therefore, have been reclassified from marketing, general and administrative expenses. These amounts include $6.3 million and $14.1 million for the pre-Acquisition periods of January 1, 2012, to June 14, 2012, and the year ended December 31, 2011, respectively, that StarBev classified as amortization associated with intangible assets related to customer supply rights.
|
|
(4)
|
To align StarBev to U.S. GAAP and to our accounting policies, StarBev's historical cost of goods sold were increased by $37.6 million and $101.4 million for the pre-Acquisition periods of January 1, 2012, to June 14, 2012, and the year ended December 31, 2011, respectively, to reflect U.S. GAAP reclassifications from the financial statements of StarBev to align their presentation with ours. This adjustment primarily relates to the reclassification of $39.0 million and $104.7 million for the pre-Acquisition periods of January 1, 2012, to June 14, 2012, and the year ended December 31, 2011, respectively, of distribution and logistics costs from marketing, general and administrative expenses to cost of goods sold. Additionally, there were $2.1 million and $4.7 million for the pre-Acquisition periods of January 1, 2012, to June 14, 2012, and the year ended December 31, 2011, respectively, of production equipment-related gains that were reclassified from marketing, general and administrative expenses to cost of goods sold. We also made pro forma adjustments to cost of goods sold for an increase of $1.7 million and a decrease of $3.2 million for the pre-Acquisition periods of January 1, 2012, to June 14, 2012, and the year ended December 31, 2011, respectively, resulting from the purchase price allocation for the Acquisition primarily driven by the amortization of the fair value of a favorable malting agreement within other intangibles offset in part by adjustments to decrease depreciation as a result of changes in the fair value of properties. This represents reductions in depreciation and amortization compared to previously filed pro forma information of $2.3 million and $4.9 million for the pre-Acquisition periods of January 1, 2012, to June 14, 2012, and the year ended December 31, 2011, respectively, as a result of updating our preliminary purchase accounting. Additionally, $8.6 million of charges related to the non-recurring fair value adjustment to acquisition date inventory that are reflected in the historical post-Acquisition MCBC results were added back for the fiscal 2012 results as they are non-recurring and directly related to the Acquisition.
|
|
(5)
|
To align StarBev to U.S. GAAP and to our accounting policies, StarBev's marketing, general and administrative expenses were reduced by $64.6 million and $162.7 million for the pre-Acquisition periods of January 1, 2012, to June 14, 2012, and the year ended December 31, 2011, respectively, to reflect reclassifications from the financial statements of StarBev to align presentation with ours. Along with the reclassifications discussed in notes (3) and (4) above, $2.3 million and $0.9 million for the pre-Acquisition periods of January 1, 2012, to June 14, 2012, and the year ended December 31, 2011, respectively, were added to marketing, general and administrative expenses to align recognition of various other immaterial items. We also made pro forma adjustments to reduce depreciation and amortization expense by $1.5 million and $0.1 million for the pre-Acquisition periods of January 1, 2012, to June 14, 2012, and the year ended December 31, 2011, respectively, to reflect the purchase price adjustments related to the valuations of properties and other intangibles. This represents increases in depreciation and amortization compared to previously filed pro forma information of $0.7 million and $1.5 million for the pre-Acquisition periods of January 1, 2012, to June 14, 2012, the and the year ended December 31, 2011, respectively, as a result of updating our preliminary purchase accounting. Additionally, for the year ended December 29, 2012, $2.5 million in acquisition-related costs incurred in the second quarter of 2012 that are reflected in the historical post-Acquisition MCBC results were removed from marketing, general and administrative expenses, as they are non-recurring and directly related to the Acquisition.
|
In order to provide meaningful trend analysis, the discussion below is based on pro forma results as there were no actual prior year results related to our Central Europe segment.
Foreign currency impact on results
During
2012
, the local currencies in the countries in which our Central Europe segment operates depreciated versus the USD on an average basis versus
2011
, resulting in an approximate $24 million and $25 million decrease to our pro forma
2012
USD earnings before income taxes and USD underlying pre-tax income, respectively.
40
Assets and liabilities recorded in foreign currencies that are the functional currencies for the respective operations are translated at the prevailing exchange rate at the balance sheet date. Translation adjustments resulting from this process are reported as a separate component of other comprehensive income. Revenue and expenses are translated at the average exchange rates during the period. Gains and losses from foreign currency transactions are included in earnings for the period.
Volume and net sales
On a pro forma basis, Central Europe sales volume decreased 0.6% in
2012
compared to
2011
, due to a decrease in consumer demand, the effect of destocking trade inventories in Romania and Serbia, and a focus on maintaining price growth in all markets.
The business maintained its market share in the region during the year, excluding the effect of trade destocking.
Pro forma net sales per hectoliter increased 2.2% in local currency in
2012
compared to
2011
, due to positive net pricing and brand mix.
Cost of goods sold
On a pro forma basis, cost of goods sold per hectoliter increased 7.2% in local currency in
2012
compared to
2011
, primarily driven by package mix changes and input inflation, specifically brewing materials, utilities and fuel.
Marketing, general and administrative expenses
Pro forma marketing, general and administrative expenses increased 2.9% in local currency in
2012
compared to
2011
, due to increased marketing behind product innovation, as well as increased bad debt expenses.
Special items, net
During
2012
, we recognized restructuring charges of $2.0 million, on a pro forma basis.
During 2011, we recognized special charges of $7.0 million, on a pro forma basis, primarily related to restructuring and special termination benefits.
Other income (expense), net
On a pro forma basis, other expense decreased $2.4 million in
2012
compared to
2011
, due to foreign currency movements.
41
United Kingdom Segment
The U.K. segment consists of our production, marketing and sales of our brands (the largest of which is
Carling
) principally in the U.K. and the Republic of Ireland; our consolidated joint venture arrangement to produce, import and distribute the
Grolsch
brands in the U.K. and the Republic of Ireland; our consolidated joint venture agreement to produce and distribute the
Cobra
brands in the U.K. and the Republic of Ireland; factored brand sales (beverage brands owned by other companies, but sold and delivered to retail by us) in the U.K.; and our joint venture arrangement with DHL ("Tradeteam") for the distribution of products throughout the U.K. accounted for under the equity method. We also distribute the Modelo brands, including
Corona
, pursuant to a distribution agreement with Modelo. In addition, we contract manufacture for Heineken U.K. and Carlsberg U.K.
The following represents our results of operations for the U.K. for the years ended
December 29, 2012
,
December 31, 2011
, and
December 25, 2010
.
|
|
For the years ended
|
|||||||||||||||||
|
|
December 29, 2012
|
% change
|
December 31, 2011
|
% change
|
December 25, 2010
|
|||||||||||||
|
|
(In millions, except percentages)
|
|||||||||||||||||
|
Volume in hectoliters(1)
|
8.331
|
|
(9.0
|
)%
|
9.151
|
|
3.2
|
%
|
8.870
|
|
||||||||
|
Net sales(1)
|
$
|
1,266.3
|
|
(5.0
|
)%
|
$
|
1,333.5
|
|
8.0
|
%
|
$
|
1,234.9
|
|
|||||
|
Cost of goods sold
|
(882.2
|
)
|
(0.6
|
)%
|
(887.4
|
)
|
12.0
|
%
|
(792.6
|
)
|
||||||||
|
Gross profit
|
384.1
|
|
(13.9
|
)%
|
446.1
|
|
0.9
|
%
|
442.3
|
|
||||||||
|
Marketing, general and administrative expenses
|
(327.2
|
)
|
(7.2
|
)%
|
(352.6
|
)
|
1.0
|
%
|
(349.2
|
)
|
||||||||
|
Special items, net
|
(21.5
|
)
|
N/M
|
|
0.3
|
|
N/M
|
|
(3.1
|
)
|
||||||||
|
Operating income (loss)
|
35.4
|
|
(62.3
|
)%
|
93.8
|
|
4.2
|
%
|
90.0
|
|
||||||||
|
Interest income(2)
|
5.7
|
|
(9.5
|
)%
|
6.3
|
|
(6.0
|
)%
|
6.7
|
|
||||||||
|
Other income (expense), net
|
(2.3
|
)
|
187.5
|
%
|
(0.8
|
)
|
(42.9
|
)%
|
(1.4
|
)
|
||||||||
|
Income (loss) from continuing operations before income taxes
|
$
|
38.8
|
|
(60.9
|
)%
|
$
|
99.3
|
|
4.2
|
%
|
$
|
95.3
|
|
|||||
|
Adjusting items:
|
|
|
|
|
|
|||||||||||||
|
Special items
|
21.5
|
|
N/M
|
|
(0.3
|
)
|
(109.7
|
)%
|
3.1
|
|
||||||||
|
Other non-core items
|
(0.7
|
)
|
(128.0
|
)%
|
2.5
|
|
N/M
|
|
—
|
|
||||||||
|
Non-GAAP: Underlying pre-tax income (loss)
|
$
|
59.6
|
|
(41.3
|
)%
|
$
|
101.5
|
|
3.2
|
%
|
$
|
98.4
|
|
|||||
N/M = Not meaningful
|
(1)
|
Reflects gross segment sales and for
2012
and
2011
includes intercompany sales to MCI of 0.246 million hectoliters and 0.152 million hectoliters, respectively and $16.0 million of net sales and $9.0 million of net sales, respectively. The offset is included within MCI cost of goods sold. These amounts are eliminated in the consolidated totals.
|
|
(2)
|
Interest income is earned on trade loans to U.K. on-premise customers and is typically driven by note receivable balances outstanding from period-to-period.
|
Foreign currency impact on results
Our U.K. segment results were unfavorably impacted by a 1.0% year-over-year decrease in the value of the British Pound ("GBP") against the USD in
2012
versus
2011
. This represented an approximate $1 million and $2 million decrease to our
2012
USD earnings before income taxes and USD underlying pre-tax income, respectively. Our U.K. segment was favorably impacted by a 4.2% year-over-year increase in the value of the GBP against the USD in 2011 versus 2010. This represented an approximate $4 million increase to both USD earnings before income taxes and USD underlying pre-tax income in
2011
versus 2010.
Assets and liabilities recorded in foreign currencies that are the functional currencies for the respective operations are translated at the prevailing exchange rate at the balance sheet date. Translation adjustments resulting from this process are reported as a separate component of other comprehensive income. Revenue and expenses are translated at the average exchange rates during the period. Gains and losses from foreign currency transactions are included in earnings for the period.
42
Volume and net sales
Our
2012
U.K. STRs decreased 9.8% compared to 2011, due to a weak U.K. market impacted by economic conditions, cycling the 53rd week in 2011 and a strong volume performance in the fourth quarter of 2011 partially driven by customer buy-in ahead of our January 2012 price increase. Market share decreased nearly one share point in 2012 with the U.K. beer industry decreasing approximately 5%.
Our
2012
U.K. sales volume decreased 9.0% to 8.3 million hectoliters compared to
2011
, driven by the decline in STRs.
Our
2012
net sales per hectoliter increased 5.3% in local currency versus 2011, due to higher on-premise channel pricing, favorable channel mix and an increase in contract production sales, partially offset by lower pricing in the off-premise channel.
Net sales decreased to $1,266.3 million in
2012
compared to $1,333.5 million in
2011
, driven by lower sales volume and unfavorable foreign exchange rates, partially offset by the increase in net sales per hectoliter.
STRs for our U.K. segment increased 1.6% in
2011
versus
2010
, driven by the addition of the Modelo brands and Sharp's brands.
2011
U.K. sales volume increased 3.2% to 9.2 million hectoliters compared to
2010
, driven by the increase in STRs.
Net sales per hectoliter for 2011 increased 0.7% in local currency versus
2010
, driven by positive sales mix, especially the addition of the higher-priced Modelo brands, partially offset by lower net pricing.
Net sales increased to $1,333.5 million in
2011
, compared to $1,234.9 million in
2010
, driven by the increase in net sales per hectoliter, higher sales volume and favorable foreign exchange rates.
Cost of goods sold
Cost of goods sold per hectoliter in local currency increased by 10.2% in
2012
compared to
2011
, driven by input inflation, higher pension expense, unfavorable package mix and fixed cost deleverage from lower volume.
Cost of goods sold per hectoliter in local currency increased by 4.6% in
2011
versus 2010, primarily due to the addition of the Modelo brands along with input inflation.
Marketing, general and administrative expenses
Marketing, general and administrative expenses decreased 6.2% in local currency in
2012
compared to
2011
, due to cost reduction initiatives and lower marketing investments, partially offset by higher pension expense.
Marketing, general and administrative expenses in local currency decreased by 2.8% in
2011
versus
2010
, driven by lower employee incentive compensation and lower pension expense, partially offset by higher marketing spending.
Special items, net
During
2012
, we recognized employee termination costs of $17.8 million related to a restructuring program focused on labor savings across all functions. Also, we recognized an asset abandonment charge of $7.2 million related to the discontinuation of primary packaging. We determined that the Home Draft package was not meeting expectations, and as a result, we recognized a loss related to the write-off of the Home Draft packaging line, tooling equipment, and packaging materials. Additionally, we recognized a $3.5 million gain related to a release of a portion of a non-income-related-tax reserve that was recorded as a special item in 2009.
During
2011
, we recognized employee termination costs of $2.1 million related to supply chain restructuring activity and company-wide efforts to increase efficiency in operations. Additionally, we recognized a $2.3 million gain primarily related to a release of a portion of a non-income-related-tax reserve that was recorded as a special item in 2009.
During
2010
, we recognized $2.6 million of employee termination costs related to restructuring activity resulting from on-going company-wide efforts to increase efficiency throughout the business. See Part II—Item 8 Financial Statements and Supplementary Data, Note 9 "Special Items" of the Notes for further discussion.
Other income (expense), net
We incurred other expense of $2.3 million, $0.8 million and $1.4 million in
2012
,
2011
and
2010
, respectively. The
2012
other expense is due primarily to foreign currency movements and leasehold costs. The
2011
and 2010 other expense is primarily due to leasehold costs.
43
Interest income
Interest income is earned on trade loans to U.K. on-premise customers. Interest income in local currency declined 9.6% and 9.2% in
2012
and
2011
, respectively. The declines in both
2012
and
2011
were due to reductions in trade loan balances.
Molson Coors International Segment
Our MCI segment is focused on growing our business and brand portfolios in key emerging and growth markets outside of the U.S., U.K., Canada and Central Europe, including Asia, continental Europe (outside of Central Europe), Mexico, Latin America and the Caribbean. This segment includes our Molson Coors Cobra India ("MC Cobra India") joint venture, our agreement in India with Cobra India. Beginning July 1, 2012, our Central Europe export and license business, which includes the licensing arrangements with ABI to brew and distribute our products in Russia and Ukraine, export arrangements with Carlsberg in the U.K. and Sweden and with ABI in Germany, Canada and Italy, and other export arrangements in various other countries, is being reported in our MCI segment.
The following represents our results of operations for MCI for the years ended
December 29, 2012
,
December 31, 2011
, and
December 25, 2010
.
|
|
For the years ended
|
|||||||||||||||||
|
|
December 29, 2012(1)
|
% change
|
December 31,
2011 |
% change
|
December 25,
2010 |
|||||||||||||
|
|
(In millions, except percentages)
|
|||||||||||||||||
|
Volume in hectoliters(2)
|
1.188
|
|
17.4
|
%
|
1.012
|
|
50.6
|
%
|
0.672
|
|
||||||||
|
Net sales
|
$
|
147.0
|
|
19.9
|
%
|
$
|
122.6
|
|
53.3
|
%
|
$
|
80.0
|
|
|||||
|
Cost of goods sold(3)
|
(90.1
|
)
|
16.1
|
%
|
(77.6
|
)
|
58.4
|
%
|
(49.0
|
)
|
||||||||
|
Gross profit
|
56.9
|
|
26.4
|
%
|
45.0
|
|
45.2
|
%
|
31.0
|
|
||||||||
|
Marketing, general and administrative expenses
|
(87.4
|
)
|
12.9
|
%
|
(77.4
|
)
|
38.7
|
%
|
(55.8
|
)
|
||||||||
|
Special items, net
|
(42.2
|
)
|
N/M
|
|
(1.0
|
)
|
(9.1
|
)%
|
(1.1
|
)
|
||||||||
|
Operating income (loss)
|
(72.7
|
)
|
117.7
|
%
|
(33.4
|
)
|
29.0
|
%
|
(25.9
|
)
|
||||||||
|
Other income (expense), net
|
0.6
|
|
N/M
|
|
0.1
|
|
(50.0
|
)%
|
0.2
|
|
||||||||
|
Income (loss) from continuing operations before income taxes(4)
|
$
|
(72.1
|
)
|
116.5
|
%
|
$
|
(33.3
|
)
|
29.6
|
%
|
$
|
(25.7
|
)
|
|||||
|
Adjusting items:
|
|
|
|
|
|
|
|
|
||||||||||
|
Special items
|
42.2
|
|
N/M
|
|
1.0
|
|
(9.1
|
)%
|
1.1
|
|
||||||||
|
Other non-core items
|
0.5
|
|
N/M
|
|
—
|
|
N/M
|
|
—
|
|
||||||||
|
Non-GAAP: Underlying pre-tax income (loss)
|
$
|
(29.4
|
)
|
(9.0
|
)%
|
$
|
(32.3
|
)
|
31.3
|
%
|
$
|
(24.6
|
)
|
|||||
N/M = Not meaningful
|
(1)
|
The results related to the Central Europe export business have been moved to our MCI segment beginning July 1, 2012. The impact of our Central Europe export and license business for the period from Acquisition through the end of the second quarter 2012 was immaterial and therefore, amounts for that period continue to be included in the Central Europe segment. The MCI results for the second half of 2012 reflect $5.4 million and $5.5 million of income from continuing operations before income taxes and non-GAAP underlying pre-tax income, respectively, relating to Central Europe export and license business.
|
|
(2)
|
Excludes royalty volume of 0.810 million hectoliters, 0.265 million hectoliters and 0.177 million hectoliters in
2012
,
2011
and
2010
, respectively.
|
|
(3)
|
Reflects gross segment amounts and for
2012
and
2011
includes intercompany cost of goods sold from the U.K. of $16.0 million and $9.0 million, respectively. The offset is included within U.K. net sales. These amounts are eliminated in the consolidated totals.
|
|
(4)
|
Includes loss attributable to noncontrolling interest of $8.0 million, $3.0 million and $1.1 million in
2012
,
2011
and
2010
, respectively.
|
44
Foreign currency impact on results
Our MCI segment operates in numerous countries around the world and each country's operations utilize distinct currencies. MCI's results were insignificantly impacted by foreign currency movements in both
2012
and
2011
. This includes an insignificant effect on both USD losses before income taxes and USD underlying pre-tax loss.
Assets and liabilities recorded in foreign currencies that are the functional currencies for the respective operations are translated at the prevailing exchange rate at the balance sheet date. Translation adjustments resulting from this process are reported as a separate component of other comprehensive income. Gains and losses from foreign currency transactions are included in earnings for the period.
Volume and net sales
MCI STRs increased 59.1% in
2012
compared to
2011
, due to the addition of the Central Europe export and license business,
Carling
growth in our Europe export and license markets,
Coors Light
growth in Latin America, higher sales of
Zima
and Modelo brands in Japan, and sales from MC Cobra India. Excluding royalty sales (primarily in Mexico and Eastern Europe), MCI reported sales volume increased 17.4% in
2012
compared to
2011
.
Net sales increased 19.9% to $147.0 million in
2012
versus
2011
, driven primarily by higher sales volume and positive sales mix, including higher sales of
Zima
and Modelo brands in Japan and the inclusion of the Central Europe export and license business.
MCI STRs increased 47.1% in
2011
compared to
2010
, driven by our Asian market sales, primarily by sales in China and India, which included the addition of the MC Si'hai brands in mid-2010 and the MC Cobra India brands in mid-2011. Volume increases in continental Europe and Latin America also contributed to overall MCI volume growth in 2011. Excluding royalty sales (primarily in Mexico and Eastern Europe), MCI reported sales volume increased 50.6% in
2011
compared to
2010
.
Net sales increased 53.3% to $122.6 million in
2011
versus
2010
, driven by higher sales volume.
Cost of goods sold
Cost of goods sold increased 16.1% in
2012
compared to
2011
, driven by higher sales volume and sales mix including higher sales of
Zima
and Modelo brands in Japan, and asset-value and cost adjustments in our MC Si'hai joint venture. The inclusion of the Central Europe export and license business drove more than half of the cost of goods sold increase.
Cost of goods sold increased 58.4% in
2011
compared to
2010
, due to higher sales volume.
Marketing, general and administrative expenses
Marketing general and administrative expenses increased 12.9% to $87.4 million in
2012
compared to
2011
, due to incremental brand investments in priority markets and asset-value and cost adjustments in our MC Si'hai joint venture. Marketing, general and administrative expenses attributable to the addition of the Central Europe export and license business were insignificant for 2012.
Marketing, general and administrative expenses in
2011
were $77.4 million, an increase of 38.7%, compared to
2010
. This increase was driven by investments in our priority international markets and the additions of the MC Si'hai and MC Cobra India joint ventures in China and India, respectively.
Special items, net
During
2012
, we recognized a $27.6 million impairment charge related to the deconsolidation of our MC Si'hai joint venture and $1.2 million of related costs. See Part II—Item 8 Financial Statements and Supplementary Data, Note 5 "Investments" of the Notes for further discussion. Also, during
2012
, we recognized a $10.4 million impairment charge to write-off the goodwill and definite-lived intangibles associated with MC Si'hai. See Part II—Item 8 Financial Statements and Supplementary Data, Note 13 "Goodwill and Intangible Assets" of the Notes for further discussion. Additionally, during
2012
, we recognized charges of $3.0 million relating to a restructuring program focused on labor savings across all functions.
During
2011
and 2010, we recognized charges of $1.0 million and $1.1 million, respectively, related to our acquisition and integration of our MC Si'hai and MC Cobra India joint ventures. See Part II—Item 8 Financial Statements and Supplementary Data, Note 9 "Special Items" of the Notes for further discussion.
45
Corporate
Corporate includes corporate interest and certain other general and administrative costs that are not allocated to any of the operating segments. The majority of these corporate costs relate to worldwide administrative functions, such as corporate affairs, legal, human resources, finance and accounting, treasury, insurance and risk management. Additionally, the results of our water resources and energy operations in the state of Colorado are included in Corporate. Corporate also includes certain royalty income and administrative costs related to the management of intellectual property.
The following represents our results of operations for Corporate for the years ended
December 29, 2012
,
December 31, 2011
, and
December 25, 2010
.
|
|
For the years ended
|
|||||||||||||||||
|
|
December 29,
2012 |
% change
|
December 31,
2011 |
% change
|
December 25,
2010 |
|||||||||||||
|
|
(In millions, except percentages)
|
|||||||||||||||||
|
Volume in hectoliters
|
—
|
|
—
|
%
|
—
|
|
—
|
%
|
—
|
|
||||||||
|
Net sales
|
$
|
1.2
|
|
(7.7
|
)%
|
$
|
1.3
|
|
—
|
%
|
$
|
1.3
|
|
|||||
|
Cost of goods sold
|
2.2
|
|
N/M
|
|
(5.3
|
)
|
N/M
|
|
(1.0
|
)
|
||||||||
|
Gross profit
|
3.4
|
|
N/M
|
|
(4.0
|
)
|
N/M
|
|
0.3
|
|
||||||||
|
Marketing, general and administrative expenses
|
(130.8
|
)
|
26.5
|
%
|
(103.4
|
)
|
(11.2
|
)%
|
(116.4
|
)
|
||||||||
|
Special items, net
|
(2.0
|
)
|
N/M
|
|
—
|
|
(100.0
|
)%
|
(0.1
|
)
|
||||||||
|
Operating income (loss)
|
(129.4
|
)
|
20.5
|
%
|
(107.4
|
)
|
(7.6
|
)%
|
(116.2
|
)
|
||||||||
|
Interest expense, net
|
(190.7
|
)
|
66.8
|
%
|
(114.3
|
)
|
7.7
|
%
|
(106.1
|
)
|
||||||||
|
Other income (expense), net
|
(85.8
|
)
|
N/M
|
|
(2.9
|
)
|
(105.6
|
)%
|
51.6
|
|
||||||||
|
Income (loss) from continuing operations before income taxes
|
$
|
(405.9
|
)
|
80.7
|
%
|
$
|
(224.6
|
)
|
31.6
|
%
|
$
|
(170.7
|
)
|
|||||
|
Adjusting items:
|
|
|
|
|
||||||||||||||
|
Special items
|
2.0
|
|
N/M
|
|
—
|
|
(100.0
|
)%
|
0.1
|
|
||||||||
|
Acquisition and integration related costs
|
157.5
|
|
N/M
|
|
—
|
|
N/M
|
|
—
|
|
||||||||
|
Unrealized mark-to-market (gains) and losses
|
12.8
|
|
178.3
|
%
|
4.6
|
|
N/M
|
|
—
|
|
||||||||
|
Other non-core items
|
(4.8
|
)
|
(194.1
|
)%
|
5.1
|
|
N/M
|
|
(48.6
|
)
|
||||||||
|
Non-GAAP: Underlying pre-tax income (loss)
|
$
|
(238.4
|
)
|
10.9
|
%
|
$
|
(214.9
|
)
|
(2.0
|
)%
|
$
|
(219.2
|
)
|
|||||
N/M = Not meaningful
Marketing, general and administrative expenses
Marketing, general and administrative expenses were $130.8 million in
2012
, an increase of $27.4 million or 26.5% versus
2011
, due to acquisition and integration costs of $35.8 million, partially offset by lower project and overhead costs.
Marketing, general and administrative expenses were $103.4 million in
2011
, a decrease of $13.0 million or 11.2% versus
2010
, due to lower project and employee incentive compensation costs.
Special items, net
During 2012, we recognized charges of $2.0 million relating to a restructuring program focused on labor savings across all functions. There were no special items for
2011
, and we recorded a net charge of $0.1 million in 2010 associated with strategic initiatives. See Part II—Item 8 Financial Statements and Supplementary Data, Note 9 "Special Items" of the Notes for further discussion.
Interest expense, net
Net interest expense increased $76.4 million to $190.7 million in 2012, driven by acquisition-related financing costs and the new debt issued to finance the Acquisition. Specifically, in 2012 we recognized a cash loss of
$39.2 million
on settlement of Treasury Locks we entered into in advance of our issuance of the
$1.9 billion
senior notes, which we used to remove a portion of our interest rate market risk. Additionally, we recognized $10.7 million of interest expense on our
$1.9 billion
senior notes in 2012 prior to the closing of the Acquisition, partially offset by the recognition of a $8.0 million unrealized gain in 2012 related to changes in the fair value of the conversion feature on the Convertible Note. Excluding the new debt issued to finance the
46
Acquisition and acquisition-related financing costs, net interest expense decreased $13.7 million to $100.6 million in 2012, primarily driven by the net investment hedge designation of our cross currency swap contracts in the fourth quarter of 2011. As a result of this designation, all changes in fair value of the designated swaps, inclusive of the periodic interest incurred, are recorded in accumulated other comprehensive income, partially offsetting the movements resulting from the periodic translation adjustment of our Canadian business.
Net interest expense was $114.3 million and $106.1 million in 2011 and 2010, respectively. The increase in 2011 compared to 2010 is due primarily to foreign currency movements as the CAD strengthened against the USD impacting our CAD denominated debt, along with moderately higher debt levels in 2011.
Other income (expense), net
Other expense was $85.8 million in
2012
, primarily driven by a $57.9 million foreign exchange loss in 2012 on our Euro cash holdings when we used the proceeds from our issuance of the
$1.9 billion
senior notes to purchase Euros and experienced a negative foreign exchange movement between the Euro and USD prior to using these proceeds to fund the Acquisition. Additionally, concurrent with the announcement of the Acquisition, we entered into a bridge loan agreement, which we terminated upon the closing of our issuance of the
$1.9 billion
senior notes. In connection with the issuance and subsequent termination of the bridge loan, we incurred debt fees of
$13.0 million
in 2012. Also, we recognized a net unrealized foreign exchange loss of $23.8 million related to financing instruments entered into in conjunction with the closing of the Acquisition in 2012. Finally, we recognized a $5.2 million gain on a sale of water rights and $2.3 million gain related to other foreign currency movements.
Other expense was $2.9 million in 2011, driven by $6.7 million expense related to the change in designation of our cross currency swaps from a cash flow hedge to a net investment hedge, partially offset by a $0.8 million mark-to-market gain related to final settlement of the remaining total return swaps and related financial instruments we arranged with respect to Foster's common stock, a $0.5 million gain related to foreign currency movements, and a $1.0 million gain on the sale of non-core real estate to MillerCoors.
Other income was $51.6 million in 2010 and primarily consisted of $47.9 million of income associated with the Foster's total return swaps and related instruments.
Liquidity and Capital Resources
Our primary sources of liquidity include cash provided by operating activities, access to external borrowings and monetization of assets. We believe that cash flows from operations, including distributions from MillerCoors, and cash provided by short-term and long-term borrowings, when necessary, will be more than adequate to meet our ongoing operating requirements, scheduled principal and interest payments on debt, and anticipated dividend payments and capital expenditures for the next twelve months and our long-term liquidity requirements. A significant portion of our trade receivables are concentrated in Europe. While these receivables are not concentrated in any specific customer and our allowance on these receivables factors in collectibility, we may encounter difficulties in our ability to collect due to the impact to our customer of any further economic downturn within Europe.
A significant portion of our cash flows from operating activities is generated outside the U.S., in currencies other than USD. As of
December 29, 2012
, approximately 69% of our cash and cash equivalents are denominated in foreign currencies. Most of the amounts held outside of the U.S. could be repatriated to the U.S., but, under current law, would be subject to U.S. federal and state income taxes, less applicable foreign tax credits. We accrue for U.S. federal and state tax consequences on the earnings of our foreign subsidiaries upon repatriation. When the earnings are considered indefinitely reinvested outside of the U.S., we do not accrue U.S. federal and state tax consequences. We utilize a variety of financing strategies in an effort to ensure that our worldwide cash is available in the locations in which it is needed.
47
Net Working Capital
As of
December 29, 2012
, and
December 31, 2011
, we had debt-free net working capital of
$394.9 million
and
$887.7 million
, respectively. Short-term borrowings and current portion of long-term debt are excluded from net working capital as they are not reflective of the ongoing operational requirements of the business. We commonly operate at minimal positive working capital levels or working capital deficits given the relatively quick turnover of our receivables and inventory, the levels of which fluctuate with the seasonality in our business. However, our current working capital level is bolstered by a high level of cash generated from revenue growth, as well as various cost saving initiatives. Our working capital is also sensitive to foreign exchange rates, as a significant majority of current assets and current liabilities are denominated in either CAD, GBP, or our Central European operating currencies such as, but not limited to, Euro, Czech Koruna, Croatian Kuna, Serbian Dinar, New Romanian Leu and Bulgarian Lev, while financial results are reported in USD. Below is a table outlining our current and historical net working capital levels (in millions):
|
|
As of
|
|||||||
|
|
December 29,
2012 |
December 31,
2011 |
||||||
|
Current assets
|
$
|
1,748.0
|
|
$
|
2,118.0
|
|
||
|
Less: Current liabilities
|
(2,598.7
|
)
|
(1,277.2
|
)
|
||||
|
Add back: Current portion of long-term debt and short-term borrowings
|
1,245.6
|
|
46.9
|
|
||||
|
Net working capital
|
$
|
394.9
|
|
$
|
887.7
|
|
||
The decrease in net working capital from
$887.7 million
at
December 31, 2011
, to $394.9 million at
December 29, 2012
, was due to $454.9 million of lower cash and cash equivalents, primarily driven by the significant amount of cash used to fund the Acquisition. The increase in current portion of long-term debt and short-term borrowings from
$46.9 million
at
December 31, 2011
, to $1,245.6 million at December 29, 2012, is primarily related to the
$575 million
convertible bonds maturing in the third quarter of 2013, as well as the issuance of the
€500 million
Zero
Coupon Senior Unsecured Convertible Note in connection with the Acquisition, which is classified as current. See additional discussion below under subheading "
Cash and Cash Equivalents
" and Part II—Item 8 Financial Statements and Supplementary Data, Note 14 "Debt" of the Notes for further discussion of the current portion of long-term debt and short-term borrowings.
Cash Flows
Our business usually generates positive operating cash flow each year, and our debt maturities are generally of a longer-term nature. However, our liquidity could be impacted significantly by the risk factors described in Part I, "Item 1A. Risk Factors" presented herein.
Cash Flows from Operating activities
Net cash provided by operating activities of
$983.7 million
in
2012
, increased by
$115.6 million
compared to
2011
. Drivers of this change include:
|
•
|
The increase was primarily due to improved working capital management of
$197.0 million
, primarily driven by lower accounts receivable balances in the U.K. and Canada and higher accrued liability balances in Corporate and the cycling of lower accounts payable and accrued liability balances in the U.K. in 2011, which were related to timing.
|
Net cash provided by operating activities of
$868.1 million
in
2011
, was higher by $118.4 million compared to
2010
. Drivers of this change include:
|
•
|
Pension contributions in 2011 were lower by approximately $270 million driving higher operating cash flow during 2011. This was partially offset by the timing of working capital in 2011.
|
|
•
|
Net income for 2011 including noncontrolling interest was lower by $32.8 million driven by lower worldwide beer volume, higher commodity inflation and the non-cash gain from discontinued operations in 2010.
|
Cash Flows from Investing activities
Net cash used in investing activities of
$2,635.1 million
in
2012
, was higher by
$2,297.0 million
compared to
2011
. Drivers of this change include:
48
|
•
|
Higher net cash used in investing activities was driven by the Acquisition of $2,257.4 million, net of cash acquired compared to the $31.0 million acquisition of Sharp's Brewery Ltd. and the $10.3 million acquisition of a controlling stake of MC Cobra India in 2011.
|
|
•
|
Higher net cash used in investing activities further relates to the $110.6 million settlement in 2012 of approximately 33% of our remaining cross currency swaps designated as a net investment hedge. See Part II—Item 8 Financial Statements and Supplementary Data, Note 18 "Derivative Instruments and Hedging Activities" of the Notes for further discussion.
|
|
•
|
Higher net cash used was driven by increased net contributions to MillerCoors of $49.0 million in 2012.
|
|
•
|
These increases in net cash used were partially offset by the $93.6 million capital contribution to BRI in 2011, which BRI used, along with the capital contributions received from its other shareholders, to repay its CAD 200 million debt, releasing us from our guarantee of this debt.
|
Net cash used in investing activities of
$338.1 million
in
2011
, was higher by $70.7 million compared to
2010
. Drivers of this change include:
|
•
|
In 2011, we made a $93.6 million capital contribution to BRI.
|
|
•
|
Our additions to properties increased by $57.5 million in 2011 driven by the addition of a high-speed can line in our Montréal brewery.
|
|
•
|
We acquired Sharp's Brewery Ltd. for $31.0 million and paid $10.3 million for the controlling stake of MC Cobra India in 2011.
|
|
•
|
These increases in cash use were partially offset by the $96.0 million paid in 2010 to settle indemnities related to our discontinued operations.
|
Cash Flows from Financing activities
Our debt position significantly affects our financing activity. See Part II—Item 8 Financial Statements and Supplementary Data, Note 14 "Debt" of the Notes for a summary of our debt position at
December 29, 2012
, and
December 31, 2011
.
Net cash provided by financing activities totaled
$1,171.4 million
in
2012
, compared to net cash used of
$665.1 million
in
2011
, an increase of
$1,836.5 million
. Drivers of this change include:
|
•
|
Higher net cash provided by financing activities was driven by proceeds from issuances of long-term debt of $2,195.4 million related to the Acquisition. This increase was partially offset by 2012 debt repayments including the $424.3 million repayment of the Subordinated Deferred Payment Obligation, which we assumed as part of the Acquisition, the repayment of the $150 million term loan, the principal repayment of approximately $32 million on the €120 million term loan and $38.1 million of higher debt issuance costs. We also repaid the remaining $44.8 million outstanding of our
$850 million
6.375%
10-year notes that were due in May 2012.
|
|
•
|
Additionally, in 2012 we purchased a portion of the non-controlling interests in Central Europe for $27.9 million.
|
|
•
|
In 2011, we repurchased 7.5 million of our Class B common shares for $321.1 million that contributed to higher net cash used in 2011. We did not repurchase any shares in 2012. We also made payments related to our cross currency swaps in 2011 for $104.5 million, inclusive of the settlement of a portion of these swaps.
|
Net cash used in financing activities totaled
$665.1 million
in
2011
, compared to net cash used of
$7.6 million
compared to
2010
, a increase of $657.5 million. Drivers of this change include:
|
•
|
In 2011, we initiated a stock repurchase plan through which we paid $321.1 million to repurchase 7.5 million shares.
|
|
•
|
We paid higher dividends of $27.0 million following our announcement of a 14.3% dividend increase effective in the second quarter of 2011.
|
|
•
|
Settlement of 25% of our cross currency swaps and related interest payments resulted in a cash use of $104.5 million in 2011 compared to the settlement of cross currency swaps of $42.0 million in 2010.
|
|
•
|
In 2010, we received proceeds from the issuance of long-term debt of $488.4 million offset by $300.0 million of payments on long-term debt.
|
49
Underlying Free Cash Flow
We generated
$864.7 million
of underlying free cash flow in
2012
. This represents a 39.8% increase in underlying free cash flow compared to
$618.4 million
in
2011
, driven by an increase in operating cash flow due to the addition of Central Europe and improvements in year-over-year working capital management. For 2012, we have revised our calculation of underlying free cash flow to exclude the benefit of proceeds from asset sales and to adjust for the cash impact of special and other non-core items, such as adding back payments related to special and other non-core charges. This change has the effect of aligning the adjustments to our underlying free cash flow with adjustments to our underlying earnings and provides greater consistency in the treatment of our non-GAAP measures. Following this approach reduced 2011 and 2010 underlying free cash flow by $16.9 million and $37.7 million, respectively.
The following table provides a reconciliation of Underlying Free Cash Flow to the nearest U.S. GAAP measure (Net Cash Provided by Operating Activities).
|
For the years ended
|
|||||||||||||
|
December 29, 2012
|
December 31, 2011
|
December 25, 2010
|
|||||||||||
|
|
(In millions)
|
||||||||||||
|
U.S. GAAP:
|
Net Cash Provided by Operating Activities
|
$
|
983.7
|
|
$
|
868.1
|
|
$
|
749.7
|
|
|||
|
Less:
|
Additions to properties(1)
|
(222.3
|
)
|
(235.4
|
)
|
(177.9
|
)
|
||||||
|
Less:
|
Investment in MillerCoors(1)
|
(1,008.8
|
)
|
(800.1
|
)
|
(1,071.2
|
)
|
||||||
|
Add:
|
Return of capital from MillerCoors(1)
|
942.4
|
|
782.7
|
|
1,060.3
|
|
||||||
|
Add:
|
Cash impact of Special items(2)
|
11.6
|
|
3.1
|
|
2.6
|
|
||||||
|
Add:
|
Costs related to the Acquisition(3)
|
134.7
|
|
—
|
|
—
|
|
||||||
|
Add:
|
Additional voluntary pension contributions(4)
|
—
|
|
—
|
|
285.0
|
|
||||||
|
Add:
|
MillerCoors investment in businesses(5)
|
14.4
|
|
—
|
|
25.8
|
|
||||||
|
Add:
|
MillerCoors purchase of noncontrolling interest(5)
|
9.0
|
|
—
|
|
—
|
|
||||||
|
Less:
|
Reduction of MillerCoors derivatives collateral requirements(5)
|
—
|
|
—
|
|
(6.7
|
)
|
||||||
|
Add:
|
MillerCoors capital expenditures to attain synergies(5)
|
—
|
|
—
|
|
8.0
|
|
||||||
|
Add:
|
MillerCoors special cash expenses to attain synergies(5)
|
—
|
|
—
|
|
11.0
|
|
||||||
|
Non-GAAP:
|
Underlying Free Cash Flow (adjusted for special cash sources/uses at MillerCoors)
|
$
|
864.7
|
|
$
|
618.4
|
|
$
|
886.6
|
|
|||
|
(1)
|
Included in Net cash used in investing activities.
|
|
(2)
|
Included in Net cash provided by operating activities.
|
|
(3)
|
Included in Net cash provided by operating activities and reflects loss related to settlement of Treasury Locks of $39.2 million, Euro currency purchase loss of $57.9 million and acquisition and integration costs paid of $37.6 million.
|
|
(4)
|
Additional voluntary cash contributions of $195.5 million, $47.5 million and $42.0 million made to U.K., Canada and U.S. (MillerCoors at 42%) pension plans, respectively.
|
|
(5)
|
Amounts represent our proportionate 42% share of the cash flow impacts, as determined by management. These items adjust operating cash flow to arrive at our underlying free cash flow for 2012 and the comparable prior-year periods.
|
Capital Resources
Cash and Cash Equivalents
As of
December 29, 2012
, we had total cash and cash equivalents of
$624.0 million
, compared to
$1,078.9 million
at
December 31, 2011
. The decrease versus prior year end was driven by the use of a significant amount of cash to fund the Acquisition. Our cash and cash equivalents are invested in a variety of highly liquid investments with original maturities of 90 days or less. These investments are viewed by management as low-risk investments and on which there are little to no restrictions regarding our ability to access the underlying cash to fund our operations as necessary. We also utilize a cash pooling arrangement to facilitate the access to cash across Central European countries.
50
Borrowings
See Part II—Item 8 Financial Statements and Supplementary Data, Note 14 "Debt" of the Notes for a complete discussion and presentation of all borrowings and available sources of borrowing, including lines of credit.
The majority of our outstanding borrowings as of
December 29, 2012
, consisted of publicly traded notes, with maturities ranging from 2013 to 2042. Long-term debt was
$3,422.5 million
and
$1,914.9 million
at
December 29, 2012
, and
December 31, 2011
, respectively. Not included in these amounts are current portions of long-term debt and short-term borrowings. Current portions of long-term debt were
$1,232.4 million
and
$44.7 million
as of
December 29, 2012
, and
December 31, 2011
, respectively. Short-term borrowings were
$13.2 million
and
$2.2 million
as of
December 29, 2012
, and
December 31, 2011
, respectively. Our total borrowings increased by approximately $2.7 billion from
December 31, 2011
to
December 29, 2012
, primarily due to financing activities in connection with the Acquisition as discussed below.
On April 3, 2012, we entered into a term loan agreement (the ''Term Loan Agreement'') that provides for a
4
-year term loan facility of
$300 million
, composed of
one
$150 million
borrowing and
one
Euro-denominated borrowing equal to
$150 million
at issuance (or
€120 million
borrowing) both of which were funded upon close of the Acquisition on June 15, 2012. The Term Loan Agreement requires quarterly principal repayments on each borrowing equal to
2.5%
of the initial principal obligation, commencing on September 30, 2012, with the remaining
62.5%
principal balance due at the June 15, 2016 maturity date. The obligations under the Term Loan Agreement are our general unsecured obligations. The Term Loan Agreement contains customary events of default, specified representations and warranties and covenants, including, among other things, covenants that limit our and our subsidiaries' ability to incur certain additional priority indebtedness, create or permit liens on assets or engage in mergers or consolidations. During the third quarter of 2012, we repaid the
$150 million
borrowing and made principal repayments of
€26.0 million
on the remaining
€120 million
borrowing. Additionally, during the third quarter of 2012, we designated the
€120 million
term loan as a net investment hedge of our Central European operations. See Part II—Item 8 Financial Statements and Supplementary Data, Note 18 "Derivative Instruments and Hedging Activities" of the Notes for further discussion.
On May 3, 2012, we issued $1.9 billion of senior notes with portions maturing in 2017, 2022 and 2042. The 2017 senior notes were issued with an initial aggregate principal amount of $300 million at 2.0% interest and will mature on May 1, 2017. The 2022 senior notes were issued with an initial aggregate principal amount of $500 million at 3.5% interest and will mature on May 1, 2022. The 2042 senior notes were issued with an initial aggregate principal amount of $1.1 billion at 5.0% interest and will mature on May 1, 2042.
On June 15, 2012, we issued a €500 million Zero Coupon Senior Unsecured Convertible Note due 2013 (the ''Convertible Note'') to the Seller in conjunction with the closing of the Acquisition. The Convertible Note matures on December 31, 2013, and is a senior unsecured obligation guaranteed by MCBC. The Seller may exercise a put right with respect to the Convertible Note beginning on March 14, 2013, (the “First Redemption Date”) and ending on December 19, 2013, for the greater of the principal amount of the Convertible Note or the aggregate cash value of 12,894,044 shares of our Class B Common Stock, as adjusted for certain corporate events. See Part II—Item 8 Financial Statements and Supplementary Data, Note 14 "Debt" of the Notes for further discussion of 2012 financing activities, as well as pre-existing borrowings.
In the first quarter of 2013, we began executing a series of financial foreign exchange contracts to hedge our risk associated with payments of Euro-denominated debt. These contracts are not designated in hedge accounting relationships. As of the date of this filing, the outstanding notional amount of this hedging program is approximately
€160 million
.
Based on the credit profile of our lenders that are party to our credit facilities, we are confident in our ability to draw on such credit facilities if the need arises. There were no outstanding borrowings on our 4-year revolving $400 million or 4-year revolving $550 million credit facilities as of
December 29, 2012
, which were issued in the second quarter of 2011 and second quarter of 2012, respectively. We also have uncommitted lines of credit with several banks should certain business units need additional short-term liquidity. On September 10, 2012, we entered into a revolving credit agreement ("Euro Credit Agreement") to support the operations of our Central Europe segment. The Euro Credit Agreement provides for a 1-year revolving credit facility of €150 million on an uncommitted basis. There were no outstanding borrowings on the Euro Credit Agreement as of
December 29, 2012
.
Under the terms of each of our debt facilities, we must comply with certain restrictions. These include restrictions on priority indebtedness (certain threshold percentages of secured consolidated net tangible assets), leverage thresholds, liens, and restrictions on certain types of sale lease-back transactions and transfers of assets. As of
December 29, 2012
, and
December 31, 2011
, we were in compliance with all of these restrictions and have met all debt payment obligations.
51
Use of Cash
With the Acquisition, our cash use will focus primarily on deleveraging for the next 2-3 years, along with cash dividends, potential strategic investments and other general corporate uses.
As of
December 29, 2012
, we had
$1,232.4 million
of long-term debt that will mature during 2013. This includes the
$575 million
convertible bonds and the €500 million Zero Coupon Senior Unsecured Convertible Note issued in connection with the Acquisition. The upcoming maturities may be settled in several ways, including use of cash on-hand, free cash flow from operations, and utilizing our existing credit facilities, on which we currently have no borrowings. We do not anticipate incurring significant tax charges associated with any cash movements related to making these payments. Additionally, as of
December 29, 2012
, we had outstanding cross currency swaps in a net liability position of $220.4 million scheduled to mature in March 2014. As part of our focus on deleveraging, we may consider prepayment of our debt or cross currency swap obligations should our cash outlook allow.
In 2011, we announced that our Board of Directors approved a program authorizing the repurchase of up to
$1.2 billion
of our Class A and Class B common stock, with an expected program term of three years. There were no repurchases in 2012, and we do not expect further repurchases until our debt ratios return closer to levels maintained prior to the financing activities related to the Acquisition.
Credit Rating
Following our offering of $1.9 billion of senior notes in the second quarter of 2012, DBRS and Moody's Investor Service each maintained our stable outlook while reducing our ratings from BBB High to BBB and from Baa1 to Baa2, respectively. Additionally, Fitch initiated their rating of BBB stable. Standard and Poor's maintained our BBB- rating while reducing its outlook from positive to negative. Our BBB- rating from Standard & Poor's is one notch above "below investment grade." A securities rating is not a recommendation to buy, sell or hold securities, and it may be revised or withdrawn at any time by the rating agency.
MillerCoors
MillerCoors distributes its excess cash to its owners, SABMiller and MCBC, on a 58%/42% basis, respectively. MillerCoors does not carry significant cash balances or debt obligations, and there are no restrictions from external sources on its ability to make cash distributions to its owners.
MillerCoors recognized $285.4 million, $301.8 million and $284.5 million of depreciation and amortization during
2012
,
2011
and
2010
, respectively.
As of
December 31, 2012
, and
December 31, 2011
, MillerCoors had cash of $17.3 million and $30.4 million, respectively. As of
December 31, 2012
, and
December 31, 2011
, total debt was $23.6 million and $28.2 million, respectively.
MillerCoors contributed $118.0 million (our 42% share is $49.6 million) to its defined benefit pension plans in
2012
. For
2013
, MillerCoors' contributions to its defined benefit pension plans are expected to be approximately $90 million to $110 million (our 42% share is $38 million to $46 million), which are not included in our contractual cash obligations.
Foreign Exchange
Foreign exchange risk is inherent in our operations primarily due to the significant operating results that are denominated in currencies other than USD, predominantly CAD, GBP, and our Central European operating currencies such as Euro, Czech Koruna, Croatian Kuna, Serbian Dinar, New Romanian Leu and Bulgarian Lev. Our approach is to reduce the volatility of cash flows and reported earnings which result from currency fluctuations rather than business related factors. Therefore, we closely monitor our operations in each country and seek to adopt appropriate strategies that are responsive to foreign currency fluctuations. Our financial risk management policy is intended to offset a portion of the potentially unfavorable impact of exchange rate changes on net income and earnings per share. See Part II—Item 8 Financial Statements and Supplementary Data, Note 18 "Derivative Instruments and Hedging Activities" of the Notes for additional information on our financial risk management strategies.
Capital Expenditures
In
2012
, we spent
$222.3 million
on capital improvement projects worldwide, which excludes capital spending by MillerCoors and other equity method joint ventures, representing a 5.6% decrease versus
2011
capital expenditures of
$235.4 million
. Capital expenditures in 2012 decreased as the impact of including the capital expenditures of our Central Europe operations was more than offset by the decrease due to cycling the 2011 Canada capital spending on the high-speed can line in
52
our Montréal brewery. Of the 2012 capital spending, approximately 44% was in support of the Canada segment, with the remainder split between Central Europe (16%) for a partial year, the U.K. (34%), MCI (3%) and Corporate (3%). The capital expenditure plan for
2013
is expected to be approximately $330 million, excluding MillerCoors, which is higher than 2012, primarily driven by having a full year of capital spending from MCCE.
Contractual Obligations and Commercial Commitments
Contractual Obligations
A summary of our consolidated contractual obligations as of
December 29, 2012
, and based on foreign exchange rates at fiscal year end
2012
, is as follows:
|
|
Payments due by period
|
|||||||||||||||||||
|
|
Total
|
2013
|
2014 - 2015
|
2016 - 2017
|
2018 and Thereafter
|
|||||||||||||||
|
|
(In millions)
|
|||||||||||||||||||
|
Debt obligations
|
$
|
4,677.6
|
|
$
|
1,249.0
|
|
$
|
924.3
|
|
$
|
904.3
|
|
$
|
1,600.0
|
|
|||||
|
Interest payments on debt obligations
|
2,049.2
|
|
153.8
|
|
279.3
|
|
189.8
|
|
1,426.3
|
|
||||||||||
|
Derivative payments(1)
|
236.1
|
|
13.9
|
|
222.2
|
|
—
|
|
—
|
|
||||||||||
|
Retirement plan expenditures(2)
|
220.4
|
|
122.0
|
|
18.1
|
|
19.2
|
|
61.1
|
|
||||||||||
|
Operating leases
|
124.0
|
|
35.0
|
|
45.5
|
|
21.7
|
|
21.8
|
|
||||||||||
|
Other long-term obligations(3)
|
2,612.2
|
|
914.6
|
|
949.3
|
|
485.3
|
|
263.0
|
|
||||||||||
|
Total obligations
|
$
|
9,919.5
|
|
$
|
2,488.3
|
|
$
|
2,438.7
|
|
$
|
1,620.3
|
|
$
|
3,372.2
|
|
|||||
See Part II - Item 8 Financial Statements and Supplementary Data, Note 14 "Debt", Note 17 "Employee Retirement Plans and Postretirement Benefits", Note 18 "Derivative Instruments and Hedging Activities", and Note 20 "Commitments and Contingencies" of the Notes for additional information.
|
(1)
|
The "derivative payments" line includes the payment obligations, to be paid to counterparties under our derivative contracts, as well as interest on the cross currency swap agreements. These obligations are primarily related to the cross currency swaps and exclude derivatives in an asset position of
$3.6 million
. As market rates fluctuate, payments to or receipts from our counterparties will also fluctuate. Due to the nature of our counterparty agreements, we are not able to net positions with the same counterparty across business units. Thus, in the event of default, we may be required to early settle all out-of-the-money contracts, without the benefit of netting the fair value of any in-the-money positions against this exposure.
|
In March 2012, we cash settled the remaining approximate
25%
of our original cross currency swaps that was not refinanced in October 2011 as previously disclosed. As a result of the settlement, we extinguished
$110.6 million
of the outstanding liability. Our outstanding cross currency swaps maturing in March 2014 were in a net liability position of
$220.4 million
and classified as non-current at
December 29, 2012
.
|
(2)
|
Represents expected contributions under our defined benefit pension plans in the next twelve months and our benefits payments under postretirement benefit plans for all periods presented. The net unfunded liability at
December 29, 2012
of our defined benefit pension plans (excluding our overfunded plans) and postretirement benefit plans is
$658.2 million
and
$186.4 million
, respectively. Contributions in future fiscal years will vary as a result of a number of factors, including actual plan asset returns and interest rates, and as such, have been excluded from the above table. We fund pension plans to meet the requirements set forth in applicable employee benefits laws. Sometimes we voluntarily increase funding levels to meet financial goals. Pension contributions and postretirement benefit payments on a consolidated basis (excluding MillerCoors, BRI and BDL) were
$63.4 million
in
2012
. Excluding MillerCoors, BRI and BDL, we expect to make contributions to our defined benefit pension plans of
$110 million
to
$120 million
and benefit payments for our other postretirement benefit plans of approximately
$10 million
in
2013
. As a result of a $195.5 million contribution to the U.K. pension plan in late 2010, we were not required to make any contributions in 2011 or 2012. Our U.K. pension plan is subject to a statutory valuation for funding purposes every three years, with the next valuation being as of June 30, 2013. The 2010 statutory valuation resulted in a long-term funding commitment plan along with an MCBC guarantee of GBP 25 million annual contributions in 2013 through March 2022. The per annum amount will be increased annually by the change in the Retail Price Index, subject to a maximum increase of 3% per annum. We have taken numerous steps in recent years to reduce our exposure to these long-term obligations, including the closure of the U.K. pension plan to future earning of service credit in early 2009
|
53
and benefit modifications in several of our Canada plans. However, given the net liability of these plans and their dependence upon the global financial markets for their financial health, the plans will continue to periodically require potentially significant amounts of cash funding.
|
(3)
|
Approximately $1,031.7 million of the total other long-term obligations relate to long-term supply contracts with third parties to purchase raw material, packaging materials and energy used in production. Approximately $642.9 million relates to commitments associated with Tradeteam in the United Kingdom. Our aggregate commitments for advertising and promotions, including sports sponsorship, total approximately
$399.4 million
. The remaining amounts relate to sales and marketing, distribution, information technology services, open purchase orders and other commitments. Included in other long-term obligations are $81.8 million of unrecognized tax benefits and
$20.0 million
of indemnities provided to FEMSA for which we cannot reasonably estimate the timing of future cash flows, and therefore we have included these amounts in the longer than 5 year bucket.
|
Guarantees
We guarantee indebtedness and other obligations to banks and other third parties for some of our equity investments and consolidated subsidiaries. See further discussion as described in Part II—Item 8 Financial Statements, Note 20 "Commitments and Contingencies" of the Notes.
Other Commercial Commitments as of
December 29, 2012
|
|
Amount of commitment expiration per period
|
|||||||||||||||||||
|
|
Total amounts
committed
|
2013
|
2014 - 2015
|
2016 - 2017
|
2018 and Thereafter
|
|||||||||||||||
|
|
(In millions)
|
|||||||||||||||||||
|
Standby letters of credit
|
$
|
37.2
|
|
$
|
37.2
|
|
$
|
—
|
|
$
|
—
|
|
$
|
—
|
|
|||||
Contingencies
We are party to various legal proceedings arising in the ordinary course of business, environmental litigation and indemnities associated with our sale of Kaiser to FEMSA. See further discussion as described in Part II—Item 8 Financial Statements, Note 20 "Commitments and Contingencies" of the Notes.
Off-Balance Sheet Arrangements
As of
December 29, 2012
, we did not have any material off-balance sheet arrangements (as defined in Item 303(a)(4)(ii) of Regulation S-K).
Outlook for
2013
In 2013, our focus will continue to be on the three pillars of our growth strategy, and particularly the first one, which is to grow profitably in our core businesses through brands and innovation. We also intend to pay down debt. In combination with disciplined, high-return cash use, our growth strategy is intended to drive long-term profit, cash flow and total return for our shareholders.
Effective for the first day of our 2013 fiscal year, we combined our U.K. and Ireland business with our new Central Europe organization to create a single European segment, called Molson Coors Europe.
In Canada, we are pleased to see the return of ho
ckey but, due to the short lead time, will be unable to effect full retail activation until the fall.
We e
xpect our two lead brands in Canada to also benefit from a renewed drive behind our innovative aluminum pint bottle and our new
Molson Canadian
advertising that went viral prior to its TV launch. We will also continue to transfer our craft beers to new regions following the success of
Granville Island
in Ontario last year.
We expect our
2013
Canada cost of goods sold per hectoliter to increase at a mid-single-digit rate in local currency.
In the U.S., MillerCoors will be developing our portfolio in above-premium and crafts and working to gain share in the premium light segment. We are planning new line extensions for
Leinenkugel's
and
Blue Moon
for summer and fall. In above-premium, we are also launching
Redd's Apple Ale
and
Third Shift
. In the premium light segment, we are investing behind new promotional properties, including in multicultural, particularly for
Coors Light
and
Miller Lite
. We will also launch a new iconic
Miller Lite
bottle in the on-premise.
54
We expect MillerCoors cost of goods sold per hectoliter to increase at a low-single digit rate in
2013
.
In our newly created Europe segment, we delivered a strong competitive performance in a tough trading environment with market share and pricing growth in all our major markets, with the exception of the U.K. and Romania. We also accelerated innovation performance driven by beer mixes, strong
Staropramen
growth, and strict overhead cost management. The restructuring to combine our U.K. and Ireland business with Central Europe has gone smoothly, enabling additional European cost savings to be delivered in 2013. In Hungary, we have stabilized and restructured the business under new leadership, and in Romania, which is our lowest share major market in the region, we have introduced new leadership, added sales resources, dealt with inventory overstocks and refocused the portfolio on the higher-value segments. Across Europe in 2013, we intend to increase the scale of innovation and accelerate sales and marketing investment to strengthen our mainstream and premium portfolio across all major markets to drive the top line and bottom line. In the U.K.,
Carling British Cider
will be hitting off-premise retailer shelves in the first quarter. We are investing in new pub fonts for
Carling
to strengthen its position and enhance its prominence on the bar. In the craft space, we have purchased the
Franciscan Well
brand and micro-brewery in Cork City, Republic of Ireland, with the intent to build a strong share in the craft beer market.
We expect our
2013
Europe cost of goods sold per hectoliter to increase at a low-single-digit rate in local currency on a pro forma basis.
In MCI, we will continue to focus on growth, and we are investing ahead of the curve in emerging markets behind a solid portfolio of
Coors Light
,
Carling
,
Staropramen
and
Blue Moon
. We anticipate that the cessation of operations for the China joint venture and the restructuring of the
Coors Light
business in the balance of China will reduce the underlying loss for this business in 2013.
We expect our
2013
MCI cost of goods sold per hectoliter to increase at a low-single-digit rate.
We expect
2013
marketing, general and administrative expense in Corporate to be approximately $105 million.
Including our 42% of MillerCoors, we currently anticipate approximately $150 million of cash contributions to our defined benefit pension plans in 2013 and pension expense of approximately $50 million.
Interest
We anticipate
2013
consolidated net interest expense of approximately $170 million, at
December 29, 2012
, foreign exchange rates, including approximately $5 million of Europe trade loan interest income.
Tax
Our tax rate is volatile and may move up or down with changes in, among other things, the amount and source of income or loss, our ability to utilize foreign tax credits, changes in tax laws, and the movement of liabilities established pursuant to accounting guidance for uncertain tax positions as statutes of limitations expire or positions are otherwise effectively settled. We anticipate that our
2013
underlying effective tax rate on income will be in the range of 16% to 20%. We expect our normalized long-term underlying effective tax rate to be in the range of 20% to 24%, although we anticipate that it will take a few years to move to that range. There are proposed or pending tax law changes in various jurisdictions in which we do business that, if enacted, may have an impact on our underlying effective tax rate.
Critical Accounting Estimates
Our consolidated financial statements are prepared in accordance with U.S. GAAP. In connection with the preparation of our consolidated financial statements, we are required to make judgments and estimates that significantly affect the reported amounts of assets, liabilities, revenues and expenses, and related disclosures. Our estimates are based on historical experience, current trends and various other assumptions we believe to be relevant under the circumstances. We review the underlying factors used in our estimates regularly, including reviewing the significant accounting policies impacting the estimates, to ensure compliance with U.S. GAAP. However, due to the uncertainty inherent in our estimates, actual results may be materially different. We have identified the accounting estimates below as critical to understanding and evaluating the financial results reported in our consolidated financial statements.
For a complete description of our significant accounting policies, see Part II—Item 8 Financial Statements and Supplementary Data, Note 1 "Basis of Presentation and Summary of Significant Accounting Policies" of the Notes. In previous years, we included "Derivatives and Other Financial Instruments" as a critical accounting estimate but have removed due to the lack of judgment and estimates required by management that could have a material impact to the financial results reported in our consolidated financial statements.
55
Pension and Postretirement Benefits
Pension and postretirement benefits include both our defined benefit plans that cover certain current and former employees in Canada, the U.K. and MCI, as well as our postretirement plans that provide medical benefits for retirees and their eligible dependents and life insurance for certain retirees in Canada, the U.S., and Central Europe. The Canada and U.K. defined benefit pension plans are primarily funded, but the Japan plan and the postretirement plans are unfunded. We also offer defined contribution plans in each of our segments.
Accounting for pensions and other postretirement benefits requires that we make assumptions including the discount rate, long-term expected rate of return on assets, compensation trends, inflation considerations, health care cost trends and other assumptions, as well as determine the fair value of assets in our funded plans. These assumptions involve considerable judgment and are significant inputs in the actuarial models that measure our net pension and postretirement obligations and ultimately impact our earnings.
Specifically, the discount rates, as well as the expected rates of return on assets and plan asset fair value determination, are important assumptions used in determining the plans' funded status and annual net periodic pension and postretirement benefit costs. We evaluate these critical assumptions at least annually on a plan and country-specific basis. We also periodically evaluate other assumptions involving demographic factors, such as retirement age, mortality and turnover, and update them to reflect our experience and expectations for the future. While we believe that our assumptions are appropriate, significant differences in our actual experience or significant changes in our assumptions may materially affect our net pension and postretirement benefit obligations and related expense.
Discount Rates
The assumed discount rates are used to present-value future benefit obligations based on each plan's respective duration. The Canada pension and postretirement discount rates are based on our annual evaluation of high quality corporate bonds in the Canada market based on appropriate indices and actuarial guidance. The U.K. pension discount rate is based on information obtained from our actuary and reviewed in comparison with a published bond index reflective of the duration of our defined benefit pension obligations. We believe that our discount rate assumptions are appropriate; however, significant changes in our assumptions may materially affect our pension and postretirement benefit obligations and related expense.
At
December 29, 2012
, on a weighted-average basis, the discount rates used were
4.18%
for our defined benefit pension plans and
4.12%
for our postretirement plans. This is a reduction from the weighted-average discount rates of
4.61%
for our defined benefit pension plans and
4.66%
for our postretirement plans at
December 31, 2011
, resulting from downward pressure on interest rates in each plan’s respective country impacted by the continued global economic conditions.
Long Term Expected Rates of Return on Assets
The assumed long-term expected returns on assets (“EROA”) are used to estimate the actual return that will occur on each individual funded plan's respective plan assets in the upcoming fiscal year. We determine each plan's EROA with substantial input from independent investment specialists, including our actuaries, investment services and other consultants. In developing each plan's EROA, we consider current and expected asset allocations, historical market rates, and historical and expected returns on each plan's individual asset classes. In developing future return expectations for each of our plan's assets, we evaluate general market trends as well as key elements of asset class returns such as expected earnings growth, yields and spreads. The calculation includes inputs for interest, inflation, credit, and risk premium (active investment management) rates and fees paid to service providers. Based on the above factors and expected asset allocations, we have assumed, on a weighted-average basis, the EROA for our defined benefit pension plan assets was
5.83%
for cost recognition in 2013. This is an increase from the weighted-average rate of
5.57%
we had assumed in 2012. We believe that our EROA assumptions are appropriate; however, significant changes in our assumptions may materially affect our net periodic pension costs.
Our EROA assumptions are applied to each of our plan's assets using the "market-related value", which utilizes a delayed approach to recognition of asset-related gains and losses to reduce volatility resulting from significant market movements. Specifically, while employer contributions and realized gains and losses (such as dividends received or gains and losses on sales of assets) are reflected immediately in the market-related value of assets, each year's unrealized gains and losses are amortized into the market-related value over five years. Therefore, significant divergences of actual returns from expected returns may not have an immediate impact on each of our plan's future net periodic pension costs; rather, such differences will be amortized over the five years following the event. Therefore, future years' pension expense will continue to be impacted by the gains and losses experienced in prior years.
56
A 50 basis point change in our discount rate and expected return on assets assumptions made at the beginning of
2012
would have had the following effects on
2012
net periodic pension and postretirement benefit costs:
|
|
Impact to 2012 pension and postretirement benefit costs - 50
basis points (unfavorable) favorable |
|||||||
|
|
Decrease
|
Increase
|
||||||
|
|
(In millions)
|
|||||||
|
Description of pension and postretirement plan sensitivity item
|
|
|
||||||
|
Expected return on pension plan assets
|
$
|
(15.9
|
)
|
$
|
15.9
|
|
||
|
Discount rate on pension plans
|
$
|
(8.7
|
)
|
$
|
8.8
|
|
||
|
Discount rate on postretirement plans
|
$
|
—
|
|
$
|
1.3
|
|
||
Fair Value of Plan Assets
We recognize our defined benefit pension plans as assets or liabilities in the consolidated balance sheets based on their underfunded or overfunded status as of our fiscal year end and recognize changes in the funded status in the year in which the changes occur within other comprehensive income. Our funded status of our defined benefit pension plans is measured as the difference between each plan's projected benefit obligation (“PBO”) and its assets' fair values. The fair value of plan assets is determined by us using available market information and appropriate valuation methodologies. However, considerable judgment is required in selecting an appropriate methodology and interpreting market data to develop the estimates of fair value, especially in the absence of quoted market values in an active market. Changes in these assumptions or the use of different market inputs may have a material impact on the estimated fair values or the ultimate amount at which the plan assets are available to satisfy our plan obligations.
Equity assets are diversified between domestic and other international investments. Relative allocations reflect the demographics of the respective plan participants. See Part II—Item 8 Financial Statements and Supplementary Data, Note 17 "Employee Retirement Plans and Postretirement Benefits" of the Notes for a comparison of target asset allocation percentages to actual asset allocations at
December 29, 2012
.
Other Considerations
Our net periodic pension and postretirement benefit costs are also influenced by the potential amortization (or non-amortization) from accumulated other comprehensive income of deferred gains and losses, which occur when actual experience differs from estimates. We employ the corridor approach for determining each plan's potential amortization. This approach defines the “corridor” as the greater of 10% of the PBO or 10% of the market-related value of plan assets (as discussed above) and requires amortization of the excess net gain or loss that exceeds the corridor over the average remaining service periods of active plan participants. As our U.K. plan is closed, the average remaining life expectancy of all plan participants (including retirees) is used. If our actuarial losses significantly exceed this corridor in the future, significant incremental pension and postretirement costs could result. As of year end
2012
, the deferred losses of several of our Canadian plans, as well as those in our U.K., U.S. and MCI plans, exceeded the 10% corridor.
The assumed health care cost trend rates represent the rates at which health care costs are assumed to increase and are based on actuarial input and consideration of historical and expected experience. We use these trends as a significant assumption in determining our postretirement benefit obligation and related costs. Changes in our projections of future health care costs due to general economic conditions and those specific to health care will impact this trend rate. An increase in the trend rate would increase our obligation and expense of our postretirement health care plan. We believe that our health care cost trend rate assumptions are appropriate; however, significant changes in our assumptions may materially affect our postretirement benefit obligations and related costs. At
December 29, 2012
, the health care trend rates used were ranging ratably from 7.9% in
2013
to 4.5% in 2028. This is consistent with our health care trend rates of ranging ratably from 8.2% in
2012
to 4.5% in 2028 at
December 31, 2011
. See Part II—Item 8 Financial Statements and Supplementary Data, Note 17 "Employee Retirement Plans and Postretirement Benefits" of the Notes for the impact of a one-percentage point change in assumed health care cost trend rates on total service and interest cost components and postretirement benefit obligation at
December 29, 2012
.
Contingencies, Environmental and Litigation Reserves
Contingencies, environmental and litigation reserves are recorded, when probable, using our best estimate of loss. This estimate, involving significant judgment, is based on an evaluation of the range of loss related to such matters and where the amount and range can be reasonably estimated. These matters are generally resolved over a number of years and only when one or more future events occur or fail to occur. Following our initial determination, we regularly reassess and revise the potential
57
liability related to any pending matters as new information becomes available. Unless capitalization is allowed or required by U.S. GAAP, environmental and legal costs are expensed when incurred. We disclose pending loss contingencies when the loss is deemed reasonably possible, which requires significant judgment. As a result of the inherent uncertainty of these matters, the ultimate conclusion and actual cost of settlement may materially differ from our estimates. We recognize contingent gains upon the determination that realization is assured beyond a reasonable doubt, regardless of the perceived probability of a favorable outcome prior to achieving that assurance. In the instance of gain contingencies resulting from favorable litigation, due to the numerous uncertainties inherent in a legal proceeding, gain contingencies resulting from legal settlements are not recognized in income until cash or other forms of payment are received. If significant and probable, we disclose as appropriate.
Currently, our most significant contingency relates to our Kaiser indemnity obligations. Historically, we defined the valuation of most of our recorded liabilities for Kaiser indemnity obligations using multiple probability-weighted scenarios. During 2009, FEMSA participated, with our consent, in a Brazilian tax amnesty program that substantially reduced penalties, interest, and attorney's fees owed by FEMSA to the government. As a result, a larger portion of our estimated liabilities associated with purchased tax credit cases were considered probable losses under the indemnities, and were reclassified as current liabilities in 2009 to reflect our estimates of the timing of potential resolution. During the first quarter of 2010, we reached a settlement agreement with FEMSA related to this portion of our indemnity. Our indemnity continues to cover other remaining, purchased tax credits and other tax, civil and labor issues. Our indemnity also covers fees and expenses that Kaiser incurs to manage the cases through the administrative and judicial systems. Any costs associated with these items would be recognized in Discontinued Operations.
For the remaining portion of our indemnity obligations, not deemed probable, we continue to utilize probability-weighted scenarios in determining the value of the indemnity obligations.
See Part I—Item 3 Legal Proceedings and Part II—Item 8 Financial Statements and Supplementary Data, Note 20 "Commitments and Contingencies" of the Notes for a discussion of our contingencies, environmental and litigation reserves as of
December 29, 2012
.
Goodwill and Indefinite-Lived Intangible Asset Valuation
Goodwill is allocated to the reporting unit in which the business that created the goodwill resides. A reporting unit is an operating segment, or a business unit one level below that operating segment, for which discrete financial information is prepared and regularly reviewed by segment management. In certain cases, we have aggregated business units into one reporting unit if the specific aggregation criteria under U.S. GAAP is met. The Canada, Central Europe and the U.K. reporting units are consistent with our operating segments. However, for our India business, the reporting unit is one level below the MCI operating segment. Our significant indefinite-lived intangible assets include the
Molson
core brands and the
Coors Light
distribution rights in Canada, the
Carling
brand in the U.K and the
Staropramen
,
Jelen
,
Ozujsko
,
Kamenitza
,
Branik
,
Ostravar
and
Niksicko
brands in Central Europe. We did not include the China reporting unit in our annual goodwill impairment testing as of July 1, 2012, as the entire goodwill balance was impaired and written off in the second quarter of 2012.
We evaluate the carrying value of our goodwill and indefinite-lived intangible assets for impairment at the reporting unit level at least annually or when an interim triggering event occurs that would indicate that impairment may have taken place. We evaluate our other definite-lived intangible assets for impairment when evidence exists that certain events or changes in circumstances indicate that the carrying amount of these assets may not be recoverable. Significant judgments and assumptions are required in such impairment evaluations.
Our annual evaluation involves comparing each reporting unit's fair value to its respective carrying value, including goodwill. If the fair value exceeds carrying value, then we conclude that no goodwill impairment has occurred. If a reporting unit's carrying value exceeds its fair value, a second step is required to measure possible goodwill impairment loss. This step would include valuing all tangible and intangible assets and liabilities of the reporting unit, excluding goodwill. Then, the implied fair value of the reporting unit's goodwill derived from this step would then be compared to the carrying value of that goodwill. If the carrying value of the reporting unit's goodwill were to exceed the implied fair value of the goodwill, we would recognize an impairment loss in an amount equal to the excess.
We use a combination of discounted cash flow analyses and market approaches to determine the fair value of each of our reporting units, and an excess earnings approach to determine the fair values of our indefinite-lived intangible assets. Our discounted cash flow projections include assumptions for growth rates for sales, costs and profits, which are based on various long-range financial and operational plans of each reporting unit or each indefinite-lived intangible asset. Additionally, discount rates used in our goodwill analysis are based on weighted-average cost of capital, driven by, among other factors, the prevailing interest rates in geographies where these businesses operate, as well as the credit ratings and financing abilities and opportunities of each reporting unit. Discount rates for the indefinite-lived intangible analysis largely reflect the rates for the overall reporting unit valuations, with some level of premium associated with the specificity of the intangibles themselves. Our
58
market-based valuations utilize earnings multiples of comparable public companies, which are reflective of the market in which each respective reporting unit operates, and recent market comparable transactions.
Our Canada and U.K. reporting units operate in mature beer markets, where we are reliant on a major brand for a high percentage of sales. Changes in the factors used in our fair value estimates, including declines in industry or company-specific beer volume sales, margin erosion, termination of brewing and/or distribution agreements with other brewers, and discount rates used, could have a significant impact on the fair values of the reporting units.
We completed the required annual impairment testing as of July 1,
2012
, the first day of our fiscal third quarter, and concluded there were no impairments with regards to goodwill or our indefinite-lived intangible assets. In
2012
, the discount rates used in developing our fair value estimates for each of our reporting units were 10.0%, 9.5% and 16.0% for our Canada, U.K. and India reporting units, respectively. Discount rates used for testing of indefinite-lived intangibles ranged from 9% to 10%. We decided to early adopt the new accounting pronouncement related to testing of indefinite-lived intangibles for impairment, effective for our 2012 impairment review. Under the new guidance, we assessed qualitative factors to determine whether it was more likely than not that the fair value of an indefinite-lived intangible was greater than its carrying amount. Based on this Step 0 assessment, we determined that a full quantitative analysis was not necessary for several of our indefinite-lived intangible assets, as sales volumes, profit, and cash flows have continued to grow and we have maintained or increased the market share of these brands, when compared to previous years where the quantitative assessment indicated the fair value to be significantly greater than the carrying value.
Through our annual impairment testing of goodwill performed, we determined that the fair value of our U.K. and Canada reporting units were close to failing step one of the goodwill impairment test. The fair value of the U.K. reporting unit was estimated at approximately
7%
in excess of its carrying value (of which
$863.2 million
is goodwill as of
December 29, 2012
) and the fair value of the Canada reporting unit was estimated at approximately
15%
in excess of its carrying value (of which
$764.0 million
is goodwill as of
December 29, 2012
). The reporting units are therefore at risk of a future impairment in the event of significant unfavorable changes in the forecasted cash flows, terminal growth rates, market transaction multiples and/or weighted-average cost of capital utilized in the discounted cash flow analysis. For testing purposes, management's best estimates of the expected future results are the primary driver in determining the fair value. Current projections reflect challenging environments that have been adversely impacted by a weak economy across all industries, partially offset by anticipated cost savings and specific brand-building and innovation activities. Through our annual impairment testing of indefinite-lived intangibles performed, it was determined that the fair value of our
Molson
core brands was estimated at approximately
14%
in excess of its carrying value (of which
$3,063.8 million
is indefinite-lived intangibles as of
December 29, 2012
). The
Molson
core brands face similar risks and challenges as the Canada reporting unit, as described above. Additionally, our annual impairment testing of indefinite-lived intangibles indicated that the
Carling
brand in the U.K. (of which
$324.8 million
is indefinite-lived intangible as of
December 29, 2012
) continues to have a fair value significantly in excess of its carrying value.
As of
December 29, 2012
, we had
$817.7 million
of goodwill and
$2,413.6 million
of indefinite-lived intangibles associated with our Central Europe reporting unit and Central Europe intangibles, primarily related to brands, respectively. Given the timing of our Acquisition, Central Europe and its indefinite-lived intangibles were not part of our annual impairment testing. In the second half of 2012, our Central Europe business, along with other European corporations across all industries, has been adversely impacted by the weak economy in Europe. If this continues, a future impairment charge may be required.
Fair value determinations require considerable judgment and are sensitive to changes in underlying assumptions and factors. As a result, there can be no assurance that the estimates and assumptions made for purposes of the annual goodwill impairment test will prove to be an accurate prediction of the future. Examples of events or circumstances that could reasonably be expected to negatively affect the underlying key assumptions and ultimately impact the estimated fair value of our U.K. and Canada reporting units and
Molson
core brands may include such items as: (i) a decrease in expected future cash flows, specifically, an increase in required pension contributions, a decrease in sales volume, unfavorable working capital changes and an inability to successfully achieve our cost savings targets, (ii) an economic recovery that significantly differs from our assumptions in timing and/or degree, (iii) volatility in the equity and debt markets which could result in a higher discount rate; and (iv) sensitivity to market transaction multiples. While historical performance and current expectations have resulted in fair values of our reporting units in excess of carrying values, if our assumptions are not realized, it is possible that an impairment charge may need to be recorded in the future.
As of
December 29, 2012
, the carrying values of goodwill and indefinite-lived intangible assets were
$2.5 billion
and
$7.2 billion
, respectively. If actual performance results differ significantly from our projections or we experience significant fluctuations in our other assumptions, a material impairment charge may occur in the future.
See Part II—Item 8 Financial Statements and Supplementary Data, Note 13 "Goodwill and Intangible Assets" of the Notes for further discussion and presentation of these amounts.
59
Income Taxes
Income taxes are accounted for in accordance with U.S. GAAP. Judgment is required in determining our worldwide provision for income taxes. In the ordinary course of our global business, there are many transactions for which the ultimate tax outcome is uncertain. Additionally, our income tax provision is based on calculations and assumptions that are subject to examination by many different tax authorities. We adjust our income tax provision in the period it is probable that actual results will differ from our estimates. Tax law and rate changes are reflected in the income tax provision in the period in which such changes are enacted.
We are periodically subject to tax return audits by both foreign and domestic tax authorities, which can involve questions regarding our tax positions. Settlement of any challenge resulting from these audits can result in no change, a complete disallowance, or some partial adjustment reached through negotiations or litigation. We recognize the tax benefit from an uncertain tax position only if it is more likely than not that the tax position will be sustained based on its technical merits. We measure and record the tax benefits from such a position based on the largest benefit that has a greater than 50% likelihood of being realized upon ultimate settlement. Our estimated liabilities related to these matters are adjusted in the period in which the uncertain tax position is effectively settled, the statute of limitations for examination expires or when additional information becomes available. Our liability for unrecognized tax benefits requires the use of assumptions and significant judgment to estimate the exposures associated with our various filing positions. Although we believe that the judgments and estimates made are reasonable, actual results could differ and resulting adjustments could materially affect our effective income tax rate and income tax provision.
We treat our portion of all foreign subsidiary earnings through
December 29, 2012
, as permanently reinvested under the accounting guidance and accordingly, have not provided for any U.S. federal or state tax thereon. As of
December 29, 2012
, approximately
$906.0 million
of retained earnings attributable to foreign subsidiaries was considered to be indefinitely invested. Our intention is to reinvest the earnings permanently or to repatriate the earnings when it is tax efficient to do so. It is not practicable to determine the amount of incremental taxes that might arise were these earnings to be remitted. However, we believe that U.S. foreign tax credits would largely eliminate any U.S. taxes and offset any foreign withholding taxes due upon remittance.
We record a valuation allowance to reduce our deferred tax assets to the amount that is more likely than not to be realized. While we consider future taxable income and ongoing prudent and feasible tax planning strategies in assessing the need for the valuation allowance, in the event we were to determine that we would be able to realize our deferred tax assets in the future in excess of its net recorded amount, an adjustment to the deferred tax asset would increase income in the period a determination was made. Likewise, should we determine that we would not be able to realize all or part of our net deferred tax asset in the future, an adjustment to the deferred tax asset would be charged to income in the period such determination was made.
New Accounting Pronouncements Not Yet Adopted
Disclosure about Offsetting Assets and Liabilities
In December 2011, the FASB issued authoritative guidance enhancing the disclosure requirements related to offsetting asset and liability positions. The update creates new disclosure requirements about the nature of an entity's rights of offset and related arrangements associated with its financial instruments and derivative instruments, including bifurcated embedded derivatives, repurchase agreements and reverse repurchase agreements, and securities borrowing and securities lending transactions that are either offset in accordance with applicable guidance or subject to an enforceable master netting arrangement. The new disclosures are designed to better facilitate comparison between financial statements prepared under U.S. GAAP and IFRS by requiring entities to provide financial statement users information about both gross and net exposures. The guidance is effective for interim and annual reporting periods beginning on or after January 1, 2013. We do not anticipate that this guidance will have an impact on our financial position or results from operations.
Reclassification of Items from Accumulated Other Comprehensive Income ("AOCI")
In February 2013, the FASB issued authoritative guidance which adds new disclosure requirements for items reclassified out of AOCI. The update requires that an entity present either in a single note or parenthetically on the face of the financial statements, the effect of significant amounts reclassified from each component of AOCI based on its source and the income statement line items affected by the reclassification. The guidance is effective for interim and annual reporting periods beginning on or after December 15, 2012. We do not anticipate that this guidance will have an impact on our financial position or results from operations.
60
See Part II-Item 8 Financial Statements and Supplementary Data, Note 2 "New Accounting Pronouncements" of the Notes for a description of new accounting pronouncements that we have adopted.
In the normal course of business, we actively manage our exposure to various market risks by entering into various supplier- and market-based hedging transactions, authorized under established risk management policies that place clear controls on these activities. Our objective in managing these exposures is to decrease the volatility of our cash flows due to changes in underlying rates and costs.
The counterparties to our market-based transactions are generally highly rated institutions. We perform assessments of their credit risk regularly. Our market-based transactions include a variety of derivative financial instruments, none of which are used for trading or speculative purposes.
Interest Rate Risk
We are exposed to volatility in interest rates with regard to current and future debt offerings. Primary exposures include U.S. Treasury rates, Canadian government rates, and LIBOR. To mitigate this exposure and to achieve our desired fixed-to-floating rate debt profile, we may enter into interest rate swaps from time to time.
Foreign Exchange Risk
Foreign currency fluctuations affect our net investments in foreign subsidiaries and foreign currency-denominated cash flows. The primary foreign currency exposures for which we hedge our risk are the CAD and GBP as of December 29, 2012. We manage this exposure through foreign currency forward contracts and cross currency swaps.
Commodity Price Risk
We use commodities in the production and distribution of our products. To manage the related price risk for these costs, we utilize market-based derivatives and long-term supplier-based contracts. Our primary objective when entering into these transactions is to achieve price certainty for commodities used in our supply chain. We manage our exposures through a combination of purchase orders, long-term supply contracts, and over-the-counter swaps.
61
Details of market-risk sensitive debt, derivative and other financial instruments, are included in the table below.
|
|
Notional amounts by expected maturity date
|
December 29,
2012 |
December 31,
2011 |
|||||||||||||||||||||||
|
|
December
|
|||||||||||||||||||||||||
|
|
2013
|
2014
|
2015
|
2016
|
2017
|
Thereafter
|
Total
|
Fair value
|
Fair value
|
|||||||||||||||||
|
|
(In millions)
|
|||||||||||||||||||||||||
|
Long-term debt:
|
|
|
|
|
|
|
|
|
|
|||||||||||||||||
|
$850 million, 6.375% fixed rate notes, due 2012
|
—
|
|
—
|
|
—
|
|
—
|
|
—
|
|
—
|
|
—
|
|
—
|
|
(45.7
|
)
|
||||||||
|
$575 million, 2.5% convertible bonds, due 2013
|
575.0
|
|
—
|
|
—
|
|
—
|
|
—
|
|
—
|
|
575.0
|
|
(588.6
|
)
|
(608.5
|
)
|
||||||||
|
€500 million, 0.0% convertible notes due 2013
|
660.8
|
|
—
|
|
—
|
|
—
|
|
—
|
|
—
|
|
660.8
|
|
(662.5
|
)
|
—
|
|
||||||||
|
CAD 900 million, 5.0% fixed rate, notes due 2015
|
—
|
|
—
|
|
902.7
|
|
—
|
|
—
|
|
—
|
|
902.7
|
|
(983.7
|
)
|
(971.9
|
)
|
||||||||
|
CAD 500 million, 3.95% fixed rate Series A notes, due 2017
|
—
|
|
—
|
|
—
|
|
—
|
|
501.5
|
|
—
|
|
501.5
|
|
(534.8
|
)
|
(507.5
|
)
|
||||||||
|
$300 million 2.0% notes due 2017
|
—
|
|
—
|
|
—
|
|
—
|
|
300.0
|
|
—
|
|
300.0
|
|
(310.0
|
)
|
—
|
|
||||||||
|
$500 million 3.5% notes due 2022
|
—
|
|
—
|
|
—
|
|
—
|
|
—
|
|
500.0
|
|
500.0
|
|
(534.0
|
)
|
—
|
|
||||||||
|
$1.1 billion 5.0% notes due 2042
|
—
|
|
—
|
|
—
|
|
—
|
|
—
|
|
1,100.0
|
|
1,100.0
|
|
(1,247.2
|
)
|
—
|
|
||||||||
|
€120 million term loan due 2016
|
—
|
|
5.2
|
|
15.9
|
|
102.8
|
|
—
|
|
—
|
|
123.9
|
|
(123.9
|
)
|
—
|
|
||||||||
|
Other long-term debt
|
—
|
|
—
|
|
0.5
|
|
—
|
|
—
|
|
—
|
|
0.5
|
|
(0.6
|
)
|
—
|
|
||||||||
|
Foreign currency management:
|
|
|
|
|
|
|
|
|
|
|
||||||||||||||||
|
Forwards
|
251.4
|
|
255.9
|
|
—
|
|
—
|
|
—
|
|
—
|
|
507.3
|
|
(1.7
|
)
|
2.2
|
|
||||||||
|
Cross currency swaps(1)
|
—
|
|
603.1
|
|
—
|
|
—
|
|
—
|
|
—
|
|
603.1
|
|
(220.4
|
)
|
(311.9
|
)
|
||||||||
|
Commodity pricing management:
|
|
|
|
|
|
|
|
|
|
|
||||||||||||||||
|
Swaps (notional in kWh)
|
324.1
|
|
162.0
|
|
—
|
|
—
|
|
—
|
|
—
|
|
486.1
|
|
(0.9
|
)
|
(2.3
|
)
|
||||||||
|
Swaps (notional in MT, rounds to zero)
|
—
|
|
—
|
|
—
|
|
—
|
|
—
|
|
—
|
|
—
|
|
(1.6
|
)
|
(4.6
|
)
|
||||||||
|
Equity management:
|
||||||||||||||||||||||||||
|
Equity conversion feature of debt
|
660.8
|
|
—
|
|
—
|
|
—
|
|
—
|
|
—
|
|
660.8
|
|
(7.9
|
)
|
—
|
|
||||||||
|
(1)
|
Our cross currency swaps consist of a series of contracts with a net position of pay GBP 398 million, receive USD $580 million for the swaps executed in 2002 and a net position of pay CAD 901 million, receive GBP 398 million for the swaps executed in 2007. On an aggregate basis, the GBP pay leg of the 2002 swaps and the GBP receive leg of the 2007 swaps offset leaving a series of net pay CAD, receive USD swaps. Approximately one-third of these swaps were settled in May 2012 and the remainder mature in March 2014. These swaps are used to hedge our exposure to foreign currency fluctuations related to our investment in our Canadian operations. See Part II—Item 8 Financial Statements and Supplementary Data, Note 18 "Derivatives Instruments and Hedging Activities" of the Notes for further discussion.
|
62
We have performed a sensitivity analysis to estimate our exposure to market risk of interest rates, foreign exchange rates, commodity prices and equity prices. The sensitivity analysis reflects the impact of a hypothetical 10% adverse change in the applicable market. The volatility of the applicable rates and prices are dependent on many factors that cannot be forecast with reliable accuracy. Therefore, actual changes in fair values could differ significantly from the results presented in the table below.
|
|
As of
|
|||||||
|
|
December 29,
2012 |
December 31,
2011 |
||||||
|
|
(In millions)
|
|||||||
|
Estimated fair value volatility
|
|
|
|
|||||
|
Foreign currency risk:
|
|
|
||||||
|
Forwards
|
$
|
(82.0
|
)
|
$
|
(72.6
|
)
|
||
|
Swaps
|
$
|
(57.8
|
)
|
$
|
(46.4
|
)
|
||
|
Foreign currency denominated debt
|
$
|
(228.6
|
)
|
$
|
(106.7
|
)
|
||
|
Equity conversion feature of debt
|
$
|
(5.6
|
)
|
$
|
—
|
|
||
|
Interest rate risk:
|
||||||||
|
Debt
|
$
|
(114.5
|
)
|
$
|
(17.5
|
)
|
||
|
Swaps
|
$
|
(25.4
|
)
|
$
|
(44.4
|
)
|
||
|
Commodity price risk:
|
||||||||
|
Swaps
|
$
|
(1.4
|
)
|
$
|
(2.7
|
)
|
||
|
Equity price risk:
|
|
|
||||||
|
Equity conversion feature of debt
|
$
|
(13.5
|
)
|
$
|
—
|
|
||
63
|
Index to Financial Statements
|
Page
|
|
Management's Report
|
|
64
MANAGEMENT'S REPORT
The preparation, integrity and objectivity of the financial statements and all other financial information included in this annual report are the responsibility of the management of Molson Coors Brewing Company. The financial statements have been prepared in accordance with generally accepted accounting principles in the United States, applying estimates based on management's best judgment where necessary. Management believes that all material uncertainties have been appropriately accounted for and disclosed.
The Company's management assessed the effectiveness of the Company's internal control over financial reporting as of
December 29, 2012
. In making this assessment, the Company's management used the criteria set forth by the Committee of Sponsoring Organizations of the Treadway Commission (COSO) in
Internal Control—Integrated Framework
. Based upon its assessment, management concluded that, as of
December 29, 2012
, the Company's internal control over financial reporting was effective. We acquired StarBev, which we subsequently renamed Molson Coors Central Europe ("MCCE") in the second quarter of 2012. As such, the scope of our assessment of the effectiveness of our internal control over financial reporting did not include the internal controls over financial reporting at MCCE. These exclusions are consistent with the Securities and Exchange Commission Staff's guidance that an assessment of a recently acquired business may be omitted from the scope of our assessment of the effectiveness of internal control over financial reporting in the year of acquisition. MCCE represented 27% of the Company's total assets and 13% of the Company's net sales as of and for the year ended December 29, 2012.
PricewaterhouseCoopers LLP, the Company's independent registered public accounting firm, provides an objective, independent audit of the consolidated financial statements and internal control over financial reporting. Their accompanying report is based upon an examination conducted in accordance with standards of the Public Company Accounting Oversight Board (United States), including tests of accounting procedures, records and internal control.
The Board of Directors, operating through its Audit Committee composed of independent, outside directors, monitors the Company's accounting control systems and reviews the results of the Company's auditing activities. The Audit Committee meets at least quarterly, either separately or jointly, with representatives of management, PricewaterhouseCoopers LLP, and internal auditors. To ensure complete independence, PricewaterhouseCoopers LLP and the Company's internal auditors have full and free access to the Audit Committee and may meet with or without the presence of management.
|
/s/ PETER SWINBURN
|
|
/s/ GAVIN HATTERSLEY
|
|
Peter Swinburn
|
Gavin Hattersley
|
|
|
President & Chief Executive Officer
|
Chief Financial Officer
|
|
|
Molson Coors Brewing Company
|
Molson Coors Brewing Company
|
|
|
February 22, 2013
|
February 22, 2013
|
|
65
Report of Independent Registered Public Accounting Firm
To the Board of Directors and Shareholders
of Molson Coors Brewing Company:
In our opinion, the consolidated financial statements listed in the accompanying index present fairly, in all material respects, the financial position of Molson Coors Brewing Company and its subsidiaries at
December 29, 2012
and
December 31, 2011
, and the results of their operations and their cash flows for each of the three years in the period ended
December 29, 2012
in conformity with accounting principles generally accepted in the United States of America. In addition, in our opinion the financial statement schedule listed in the index appearing under Item 15(a) (2)
presents fairly, in all material respects, the information set forth therein when read in conjunction with the related consolidated financial statements. Also in our opinion, the Company maintained, in all material respects, effective internal control over financial reporting as of
December 29, 2012
based on criteria established in
Internal Control--Integrated Framework
issued by the Committee of Sponsoring Organizations of the Treadway Commission (COSO). The Company's management is responsible for these financial statements and financial statement schedule, for maintaining effective internal control over financial reporting and for its assessment of the effectiveness of internal control over financial reporting, included in Management's Report on Internal Control over Financial Reporting appearing under Item 9A. Our responsibility is to express opinions on these financial statements, on the financial statement schedule, and on the Company's internal control over financial reporting based on our integrated audits. We conducted our audits in accordance with the standards of the Public Company Accounting Oversight Board (United States). Those standards require that we plan and perform the audits to obtain reasonable assurance about whether the financial statements are free of material misstatement and whether effective internal control over financial reporting was maintained in all material respects. Our audits of the financial statements included examining, on a test basis, evidence supporting the amounts and disclosures in the financial statements, assessing the accounting principles used and significant estimates made by management, and evaluating the overall financial statement presentation. Our audit of internal control over financial reporting included obtaining an understanding of internal control over financial reporting, assessing the risk that a material weakness exists, and testing and evaluating the design and operating effectiveness of internal control based on the assessed risk, except as noted below. Our audits also included performing such other procedures as we considered necessary in the circumstances. We believe that our audits provide a reasonable basis for our opinions.
A company's internal control over financial reporting is a process designed to provide reasonable assurance regarding the reliability of financial reporting and the preparation of financial statements for external purposes in accordance with generally accepted accounting principles. A company's internal control over financial reporting includes those policies and procedures that (i) pertain to the maintenance of records that, in reasonable detail, accurately and fairly reflect the transactions and dispositions of the assets of the company; (ii) provide reasonable assurance that transactions are recorded as necessary to permit preparation of financial statements in accordance with generally accepted accounting principles, and that receipts and expenditures of the company are being made only in accordance with authorizations of management and directors of the company; and (iii) provide reasonable assurance regarding prevention or timely detection of unauthorized acquisition, use, or disposition of the company's assets that could have a material effect on the financial statements.
Because of its inherent limitations, internal control over financial reporting may not prevent or detect misstatements. Also, projections of any evaluation of effectiveness to future periods are subject to the risk that controls may become inadequate because of changes in conditions, or that the degree of compliance with the policies or procedures may deteriorate.
As described in Management's Report on Internal Control over Financial Reporting appearing under Item 9A, management has excluded Molson Coors Central Europe from its assessment of internal control over financial reporting as of
December 29, 2012
because it was acquired by the Company in a purchase business combination during 2012. We have also excluded Molson Coors Central Europe from our audit of internal control over financial reporting. Molson Coors Central Europe is a consolidated subsidiary whose total assets and total net sales represent 27 percent and 13 percent, respectively, of the related consolidated financial statement amounts as of and for the year ended
December 29, 2012
.
/s/ PricewaterhouseCoopers LLP
Denver, Colorado
February 22, 2013
66
MOLSON COORS BREWING COMPANY AND SUBSIDIARIES
CONSOLIDATED STATEMENTS OF OPERATIONS
(IN MILLIONS, EXCEPT PER SHARE DATA)
|
|
For the Years Ended
|
||||||||||
|
|
December 29, 2012
|
December 31, 2011
|
December 25, 2010
|
||||||||
|
Sales
|
$
|
5,615.0
|
|
$
|
5,169.9
|
|
$
|
4,703.1
|
|
||
|
Excise taxes
|
(1,698.5
|
)
|
(1,654.2
|
)
|
(1,448.7
|
)
|
|||||
|
Net sales
|
3,916.5
|
|
3,515.7
|
|
3,254.4
|
|
|||||
|
Cost of goods sold
|
(2,352.5
|
)
|
(2,049.1
|
)
|
(1,812.2
|
)
|
|||||
|
Gross profit
|
1,564.0
|
|
1,466.6
|
|
1,442.2
|
|
|||||
|
Marketing, general and administrative expenses
|
(1,126.1
|
)
|
(1,019.0
|
)
|
(1,012.5
|
)
|
|||||
|
Special items, net
|
(81.4
|
)
|
(12.3
|
)
|
(21.3
|
)
|
|||||
|
Equity income in MillerCoors
|
510.9
|
|
457.9
|
|
456.1
|
|
|||||
|
Operating income (loss)
|
867.4
|
|
893.2
|
|
864.5
|
|
|||||
|
Other income (expense), net
|
|
|
|
||||||||
|
Interest expense
|
(196.3
|
)
|
(118.7
|
)
|
(110.2
|
)
|
|||||
|
Interest income
|
11.3
|
|
10.7
|
|
10.8
|
|
|||||
|
Other income (expense), net
|
(90.3
|
)
|
(11.0
|
)
|
43.9
|
|
|||||
|
Total other income (expense), net
|
(275.3
|
)
|
(119.0
|
)
|
(55.5
|
)
|
|||||
|
Income (loss) from continuing operations before income taxes
|
592.1
|
|
774.2
|
|
809.0
|
|
|||||
|
Income tax benefit (expense)
|
(154.5
|
)
|
(99.4
|
)
|
(138.7
|
)
|
|||||
|
Net income (loss) from continuing operations
|
437.6
|
|
674.8
|
|
670.3
|
|
|||||
|
Income (loss) from discontinued operations, net of tax
|
1.5
|
|
2.3
|
|
39.6
|
|
|||||
|
Net income (loss) including noncontrolling interests
|
439.1
|
|
677.1
|
|
709.9
|
|
|||||
|
Less: Net (income) loss attributable to noncontrolling interests
|
3.9
|
|
(0.8
|
)
|
(2.2
|
)
|
|||||
|
Net income (loss) attributable to Molson Coors Brewing Company
|
$
|
443.0
|
|
$
|
676.3
|
|
$
|
707.7
|
|
||
|
Basic net income (loss) attributable to Molson Coors Brewing Company per share:
|
|
|
|
||||||||
|
From continuing operations
|
$
|
2.44
|
|
$
|
3.65
|
|
$
|
3.59
|
|
||
|
From discontinued operations
|
0.01
|
|
0.01
|
|
0.21
|
|
|||||
|
Basic net income (loss) attributable to Molson Coors Brewing Company per share
|
$
|
2.45
|
|
$
|
3.66
|
|
$
|
3.80
|
|
||
|
Diluted net income (loss) attributable to Molson Coors Brewing Company per share:
|
|
|
|
||||||||
|
From continuing operations
|
$
|
2.43
|
|
$
|
3.62
|
|
$
|
3.57
|
|
||
|
From discontinued operations
|
0.01
|
|
0.01
|
|
0.21
|
|
|||||
|
Diluted net income (loss) attributable to Molson Coors Brewing Company per share
|
$
|
2.44
|
|
$
|
3.63
|
|
$
|
3.78
|
|
||
|
Weighted-average shares—basic
|
180.8
|
|
184.9
|
|
185.9
|
|
|||||
|
Weighted-average shares—diluted
|
181.8
|
|
186.4
|
|
187.3
|
|
|||||
|
Amounts attributable to Molson Coors Brewing Company
|
|
|
|
||||||||
|
Net income (loss) from continuing operations
|
$
|
441.5
|
|
$
|
674.0
|
|
$
|
668.1
|
|
||
|
Income (loss) from discontinued operations, net of tax
|
1.5
|
|
2.3
|
|
39.6
|
|
|||||
|
Net income (loss) attributable to Molson Coors Brewing Company
|
$
|
443.0
|
|
$
|
676.3
|
|
$
|
707.7
|
|
||
See notes to consolidated financial statements.
67
MOLSON COORS BREWING COMPANY AND SUBSIDIARIES
CONSOLIDATED STATEMENTS OF COMPREHENSIVE INCOME
(IN MILLIONS)
|
For the Years Ended
|
|||||||||||
|
December 29, 2012
|
December 31, 2011
|
December 25, 2010
|
|||||||||
|
Net income (loss) including noncontrolling interests
|
$
|
439.1
|
|
$
|
677.1
|
|
$
|
709.9
|
|
||
|
Other comprehensive income (loss), net of tax:
|
|
|
|
||||||||
|
Foreign currency translation adjustments
|
344.9
|
|
(67.7
|
)
|
121.5
|
|
|||||
|
Unrealized (loss) gain on derivative instruments
|
(26.4
|
)
|
(6.1
|
)
|
(16.0
|
)
|
|||||
|
Reclassification of derivative losses to income
|
8.6
|
|
19.4
|
|
8.4
|
|
|||||
|
Pension and other postretirement benefit adjustments
|
(195.8
|
)
|
(189.6
|
)
|
100.4
|
|
|||||
|
Amortization of net prior service costs and net actuarial losses to income
|
30.9
|
|
10.2
|
|
7.8
|
|
|||||
|
Ownership share of unconsolidated subsidiaries' other comprehensive income (loss)
|
(6.9
|
)
|
(67.0
|
)
|
(71.7
|
)
|
|||||
|
Total other comprehensive income (loss), net of tax
|
155.3
|
|
(300.8
|
)
|
150.4
|
|
|||||
|
Comprehensive income (loss)
|
594.4
|
|
376.3
|
|
860.3
|
|
|||||
|
Less: Comprehensive income (loss) attributable to the noncontrolling interest
|
3.9
|
|
(0.8
|
)
|
(2.2
|
)
|
|||||
|
Comprehensive income (loss) attributable to MCBC
|
$
|
598.3
|
|
$
|
375.5
|
|
$
|
858.1
|
|
||
See notes to consolidated financial statements.
68
|
MOLSON COORS BREWING COMPANY AND SUBSIDIARIES
(IN MILLIONS)
|
|||||||
|
|
As of
|
||||||
|
|
December 29, 2012
|
December 31, 2011
|
|||||
|
Assets
|
|
|
|||||
|
Current assets:
|
|
|
|||||
|
Cash and cash equivalents
|
$
|
624.0
|
|
$
|
1,078.9
|
|
|
|
Accounts and notes receivable:
|
|
|
|||||
|
Trade, less allowance for doubtful accounts of $13.4 and $10.3, respectively
|
608.3
|
|
529.9
|
|
|||
|
Affiliates
|
52.2
|
|
58.9
|
|
|||
|
Current notes receivable and other receivables, less allowance for doubtful accounts of $1.6 and $1.8, respectively
|
92.9
|
|
137.2
|
|
|||
|
Inventories:
|
|
|
|||||
|
Finished
|
139.9
|
|
140.7
|
|
|||
|
In process
|
20.3
|
|
15.3
|
|
|||
|
Raw materials
|
43.5
|
|
41.8
|
|
|||
|
Packaging materials
|
10.2
|
|
9.4
|
|
|||
|
Total inventories
|
213.9
|
|
207.2
|
|
|||
|
Maintenance and operating supplies, less allowance for obsolete supplies of $7.2 and $5.9, respectively
|
28.3
|
|
22.0
|
|
|||
|
Other current assets
|
89.2
|
|
72.0
|
|
|||
|
Deferred tax assets
|
39.2
|
|
11.6
|
|
|||
|
Discontinued operations
|
—
|
|
0.3
|
|
|||
|
Total current assets
|
1,748.0
|
|
2,118.0
|
|
|||
|
Properties, less accumulated depreciation of $1,224.6 and $1,020.1, respectively
|
1,995.9
|
|
1,430.1
|
|
|||
|
Goodwill
|
2,453.1
|
|
1,453.3
|
|
|||
|
Other intangibles, less accumulated amortization of $497.2 and $442.7, respectively
|
7,234.8
|
|
4,586.0
|
|
|||
|
Investment in MillerCoors
|
2,431.8
|
|
2,487.9
|
|
|||
|
Deferred tax assets
|
125.4
|
|
149.9
|
|
|||
|
Notes receivable, less allowance for doubtful accounts of $4.0 and $4.4, respectively
|
26.3
|
|
32.7
|
|
|||
|
Other assets
|
196.9
|
|
165.9
|
|
|||
|
Total assets
|
$
|
16,212.2
|
|
$
|
12,423.8
|
|
|
69
|
MOLSON COORS BREWING COMPANY AND SUBSIDIARIES
CONSOLIDATED BALANCE SHEETS (Continued)
(IN MILLIONS, EXCEPT PAR VALUE)
|
|||||||
|
|
As of
|
||||||
|
|
December 29, 2012
|
December 31, 2011
|
|||||
|
Liabilities and equity
|
|
|
|||||
|
Current liabilities:
|
|
|
|||||
|
Accounts payable:
|
|
|
|||||
|
Trade
|
$
|
392.9
|
|
$
|
268.5
|
|
|
|
Affiliates
|
34.1
|
|
32.7
|
|
|||
|
Accrued expenses and other liabilities
|
759.9
|
|
646.8
|
|
|||
|
Derivative hedging instruments
|
6.0
|
|
107.6
|
|
|||
|
Deferred tax liabilities
|
152.3
|
|
161.3
|
|
|||
|
Current portion of long-term debt and short-term borrowings
|
1,245.6
|
|
46.9
|
|
|||
|
Discontinued operations
|
7.9
|
|
13.4
|
|
|||
|
Total current liabilities
|
2,598.7
|
|
1,277.2
|
|
|||
|
Long-term debt
|
3,422.5
|
|
1,914.9
|
|
|||
|
Pension and postretirement benefits
|
833.0
|
|
697.5
|
|
|||
|
Derivative hedging instruments
|
222.2
|
|
212.5
|
|
|||
|
Deferred tax liabilities
|
948.5
|
|
455.6
|
|
|||
|
Unrecognized tax benefits
|
81.8
|
|
76.4
|
|
|||
|
Other liabilities
|
93.9
|
|
77.5
|
|
|||
|
Discontinued operations
|
20.0
|
|
22.0
|
|
|||
|
Total liabilities
|
8,220.6
|
|
4,733.6
|
|
|||
|
Commitments and contingencies (Note 20)
|
|
|
|
|
|||
|
Molson Coors Brewing Company stockholders' equity
|
|
|
|||||
|
Capital stock:
|
|
|
|||||
|
Preferred stock, no par value (authorized: 25.0 shares; none issued)
|
—
|
|
—
|
|
|||
|
Class A common stock, $0.01 par value (authorized: 500.0 shares; issued and outstanding: 2.6 shares and 2.6 shares, respectively)
|
—
|
|
—
|
|
|||
|
Class B common stock, $0.01 par value (authorized: 500.0 shares; issued: 164.2 shares and 162.7 shares, respectively)
|
1.6
|
|
1.6
|
|
|||
|
Class A exchangeable shares, no par value (issued and outstanding: 2.9 shares and 2.9 shares, respectively)
|
110.2
|
|
110.5
|
|
|||
|
Class B exchangeable shares, no par value (issued and outstanding: 19.3 shares and 19.3 shares, respectively)
|
724.4
|
|
724.8
|
|
|||
|
Paid-in capital
|
3,623.6
|
|
3,572.1
|
|
|||
|
Retained earnings
|
3,900.5
|
|
3,689.7
|
|
|||
|
Accumulated other comprehensive income (loss)
|
(72.3
|
)
|
(129.7
|
)
|
|||
|
Class B common stock held in treasury at cost (7.5 shares and 7.5 shares, respectively)
|
(321.1
|
)
|
(321.1
|
)
|
|||
|
Total Molson Coors Brewing Company stockholders' equity
|
7,966.9
|
|
7,647.9
|
|
|||
|
Noncontrolling interests
|
24.7
|
|
42.3
|
|
|||
|
Total equity
|
7,991.6
|
|
7,690.2
|
|
|||
|
Total liabilities and equity
|
$
|
16,212.2
|
|
$
|
12,423.8
|
|
|
See notes to consolidated financial statements.
70
|
MOLSON COORS BREWING COMPANY AND SUBSIDIARIES
(IN MILLIONS)
|
|||||||||||
|
|
For the Years Ended
|
||||||||||
|
|
December 29, 2012
|
December 31, 2011
|
December 25, 2010
|
||||||||
|
Cash flows from operating activities:
|
|
|
|
||||||||
|
Net income (loss) including noncontrolling interests
|
$
|
439.1
|
|
$
|
677.1
|
|
$
|
709.9
|
|
||
|
Adjustments to reconcile net income to net cash provided by operating activities:
|
|
|
|||||||||
|
Depreciation and amortization
|
272.7
|
|
217.1
|
|
202.3
|
|
|||||
|
Amortization of debt issuance costs and discounts
|
41.7
|
|
22.5
|
|
20.6
|
|
|||||
|
Share-based compensation
|
14.0
|
|
24.7
|
|
27.4
|
|
|||||
|
Loss (gain) on sale or impairment of properties and other long-lived assets
|
46.4
|
|
8.6
|
|
19.1
|
|
|||||
|
Excess tax benefits from share-based compensation
|
(4.9
|
)
|
(2.0
|
)
|
(4.8
|
)
|
|||||
|
Deferred income taxes
|
72.5
|
|
38.9
|
|
68.0
|
|
|||||
|
Unrealized (gain) loss on foreign currency fluctuations and derivative instruments
|
38.0
|
|
9.1
|
|
(9.9
|
)
|
|||||
|
Equity income in MillerCoors
|
(510.9
|
)
|
(457.9
|
)
|
(456.1
|
)
|
|||||
|
Distributions from MillerCoors
|
510.9
|
|
457.9
|
|
456.1
|
|
|||||
|
Equity in net income of other unconsolidated affiliates
|
(15.7
|
)
|
(23.2
|
)
|
(18.2
|
)
|
|||||
|
Distributions from other unconsolidated affiliates
|
15.2
|
|
28.4
|
|
14.0
|
|
|||||
|
Change in current assets and liabilities (net of assets acquired and liabilities assumed in business combinations) and other:
|
|
|
|
||||||||
|
Receivables
|
105.5
|
|
(29.0
|
)
|
(7.8
|
)
|
|||||
|
Inventories
|
54.1
|
|
(17.1
|
)
|
(10.1
|
)
|
|||||
|
Payables
|
(70.6
|
)
|
(16.4
|
)
|
45.3
|
|
|||||
|
Other assets and other liabilities
|
(22.8
|
)
|
(68.3
|
)
|
(266.5
|
)
|
|||||
|
(Gain) loss from discontinued operations
|
(1.5
|
)
|
(2.3
|
)
|
(39.6
|
)
|
|||||
|
Net cash provided by operating activities
|
983.7
|
|
868.1
|
|
749.7
|
|
|||||
|
Cash flows from investing activities:
|
|
|
|
||||||||
|
Additions to properties
|
(222.3
|
)
|
(235.4
|
)
|
(177.9
|
)
|
|||||
|
Proceeds from sales of properties and other long-lived assets
|
15.7
|
|
4.6
|
|
5.2
|
|
|||||
|
Acquisition of businesses, net of cash acquired
|
(2,258.3
|
)
|
(41.3
|
)
|
(19.8
|
)
|
|||||
|
Change in restricted cash balances
|
—
|
|
6.7
|
|
(10.8
|
)
|
|||||
|
Payment on discontinued operations
|
(6.8
|
)
|
—
|
|
(96.0
|
)
|
|||||
|
Investment in MillerCoors
|
(1,008.8
|
)
|
(800.1
|
)
|
(1,071.2
|
)
|
|||||
|
Return of capital from MillerCoors
|
942.4
|
|
782.7
|
|
1,060.3
|
|
|||||
|
Investment in and advances to an unconsolidated affiliate
|
—
|
|
(83.2
|
)
|
—
|
|
|||||
|
Loan repayments
|
22.9
|
|
22.4
|
|
16.6
|
|
|||||
|
Loan advances
|
(9.3
|
)
|
(9.9
|
)
|
(9.1
|
)
|
|||||
|
Proceeds from settlements of derivative instruments
|
—
|
|
15.4
|
|
35.1
|
|
|||||
|
Payments on settlement of derivative instruments
|
(110.6
|
)
|
—
|
|
—
|
|
|||||
|
Other
|
—
|
|
—
|
|
0.2
|
|
|||||
|
Net cash used in investing activities
|
(2,635.1
|
)
|
(338.1
|
)
|
(267.4
|
)
|
|||||
71
|
MOLSON COORS BREWING COMPANY AND SUBSIDIARIES
CONSOLIDATED STATEMENTS OF CASH FLOWS (Continued)
(IN MILLIONS)
|
|||||||||||
|
|
For the Years Ended
|
||||||||||
|
|
December 29, 2012
|
December 31, 2011
|
December 25, 2010
|
||||||||
|
Cash flows from financing activities:
|
|
|
|
||||||||
|
Exercise of stock options under equity compensation plans
|
34.1
|
|
11.6
|
|
38.5
|
|
|||||
|
Excess tax benefits from share-based compensation
|
4.9
|
|
2.0
|
|
4.8
|
|
|||||
|
Payments for purchase of treasury stock
|
—
|
|
(321.1
|
)
|
—
|
|
|||||
|
Dividends paid
|
(232.2
|
)
|
(228.1
|
)
|
(201.1
|
)
|
|||||
|
Dividends paid to noncontrolling interest holders
|
(5.0
|
)
|
(2.3
|
)
|
(3.7
|
)
|
|||||
|
Payments for purchase of noncontrolling interest
|
(27.9
|
)
|
—
|
|
—
|
|
|||||
|
Proceeds from issuances of long-term debt
|
2,195.4
|
|
—
|
|
488.4
|
|
|||||
|
Debt issuance costs
|
(40.3
|
)
|
(2.2
|
)
|
(3.3
|
)
|
|||||
|
Payments on long-term debt and capital lease obligations
|
(226.7
|
)
|
(0.3
|
)
|
(300.0
|
)
|
|||||
|
Payments on debt assumed in Acquisition
|
(424.3
|
)
|
—
|
|
—
|
|
|||||
|
Proceeds from short-term borrowings
|
16.0
|
|
6.8
|
|
12.1
|
|
|||||
|
Payments on short-term borrowings
|
(17.2
|
)
|
(18.3
|
)
|
(8.1
|
)
|
|||||
|
Net proceeds from (payments on) revolving credit facilities
|
7.8
|
|
2.1
|
|
—
|
|
|||||
|
Payments on settlements of debt-related derivatives
|
(8.2
|
)
|
(104.5
|
)
|
(42.0
|
)
|
|||||
|
Change in overdraft balances and other
|
(105.0
|
)
|
(10.8
|
)
|
6.8
|
|
|||||
|
Net cash provided by (used in) financing activities
|
1,171.4
|
|
(665.1
|
)
|
(7.6
|
)
|
|||||
|
Cash and cash equivalents:
|
|
|
|
||||||||
|
Net increase (decrease) in cash and cash equivalents
|
(480.0
|
)
|
(135.1
|
)
|
474.7
|
|
|||||
|
Effect of foreign exchange rate changes on cash and cash equivalents
|
25.1
|
|
(3.6
|
)
|
8.7
|
|
|||||
|
Balance at beginning of year
|
1,078.9
|
|
1,217.6
|
|
734.2
|
|
|||||
|
Balance at end of year
|
$
|
624.0
|
|
$
|
1,078.9
|
|
$
|
1,217.6
|
|
||
See notes to consolidated financial statements. See Note 1 "Basis of Presentation and Summary of Significant Accounting Policies" for supplementary cash flow data and Note 3 "Acquisition of StarBev" for non-cash activity related to the Acquisition.
72
|
MOLSON COORS BREWING COMPANY AND SUBSIDIARIES
CONSOLIDATED STATEMENTS OF STOCKHOLDERS' EQUITY
AND NONCONTROLLING INTERESTS
(IN MILLIONS)
|
|||||||||||||||||||||||||||||||||||||||
|
|
|
MCBC Shareholders
|
|
||||||||||||||||||||||||||||||||||||
|
|
|
|
Accumulated
|
|
Common Stock
|
|
|
||||||||||||||||||||||||||||||||
|
|
|
|
other
|
Common stock
|
held in
|
Exchangeable
|
Non
|
||||||||||||||||||||||||||||||||
|
|
|
Retained
|
comprehensive
|
issued
|
treasury
|
shares issued
|
Paid-in-
|
controlling
|
|||||||||||||||||||||||||||||||
|
|
Total
|
earnings
|
income (loss)
|
Class A
|
Class B
|
Class B
|
Class A
|
Class B
|
capital
|
interest
|
|||||||||||||||||||||||||||||
|
Balance at December 26, 2009
|
$
|
7,092.8
|
|
$
|
2,734.9
|
|
$
|
20.7
|
|
$
|
—
|
|
$
|
1.6
|
|
$
|
—
|
|
$
|
119.1
|
|
$
|
761.8
|
|
$
|
3,441.5
|
|
$
|
13.2
|
|
|||||||||
|
Exchange of shares
|
—
|
|
—
|
|
—
|
|
—
|
|
—
|
|
—
|
|
(7.9
|
)
|
(36.8
|
)
|
44.7
|
|
—
|
|
|||||||||||||||||||
|
Shares issued under equity compensation plan
|
39.6
|
|
—
|
|
—
|
|
—
|
|
—
|
|
—
|
|
—
|
|
—
|
|
39.6
|
|
—
|
|
|||||||||||||||||||
|
Amortization of stock based compensation
|
22.6
|
|
—
|
|
—
|
|
—
|
|
—
|
|
—
|
|
—
|
|
—
|
|
22.6
|
|
—
|
|
|||||||||||||||||||
|
Acquisition of a business
|
32.1
|
|
—
|
|
—
|
|
—
|
|
—
|
|
—
|
|
—
|
|
—
|
|
—
|
|
32.1
|
|
|||||||||||||||||||
|
Net income (loss) including noncontrolling interests
|
709.9
|
|
707.7
|
|
—
|
|
—
|
|
—
|
|
—
|
|
—
|
|
—
|
|
—
|
|
2.2
|
|
|||||||||||||||||||
|
Other comprehensive income (loss), net of tax
|
150.4
|
|
—
|
|
150.4
|
|
—
|
|
—
|
|
—
|
|
—
|
|
—
|
|
—
|
|
—
|
|
|||||||||||||||||||
|
Dividends declared and paid
|
(204.8
|
)
|
(201.1
|
)
|
—
|
|
—
|
|
—
|
|
—
|
|
—
|
|
—
|
|
—
|
|
(3.7
|
)
|
|||||||||||||||||||
|
Balance at December 25, 2010
|
$
|
7,842.6
|
|
$
|
3,241.5
|
|
$
|
171.1
|
|
$
|
—
|
|
$
|
1.6
|
|
$
|
—
|
|
$
|
111.2
|
|
$
|
725.0
|
|
$
|
3,548.4
|
|
$
|
43.8
|
|
|||||||||
|
Exchange of shares
|
—
|
|
—
|
|
—
|
|
—
|
|
—
|
|
—
|
|
(0.7
|
)
|
(0.2
|
)
|
0.9
|
|
—
|
|
|||||||||||||||||||
|
Shares issued under equity compensation plan
|
6.9
|
|
—
|
|
—
|
|
—
|
|
—
|
|
—
|
|
—
|
|
—
|
|
6.9
|
|
—
|
|
|||||||||||||||||||
|
Amortization of stock based compensation
|
15.9
|
|
—
|
|
—
|
|
—
|
|
—
|
|
—
|
|
—
|
|
—
|
|
15.9
|
|
—
|
|
|||||||||||||||||||
|
Net income (loss) including noncontrolling interests
|
677.1
|
|
676.3
|
|
—
|
|
—
|
|
—
|
|
—
|
|
—
|
|
—
|
|
—
|
|
0.8
|
|
|||||||||||||||||||
|
Other comprehensive income (loss), net of tax
|
(300.8
|
)
|
—
|
|
(300.8
|
)
|
—
|
|
—
|
|
—
|
|
—
|
|
—
|
|
—
|
|
—
|
|
|||||||||||||||||||
|
Repurchase of common stock
|
(321.1
|
)
|
—
|
|
—
|
|
—
|
|
—
|
|
(321.1
|
)
|
—
|
|
—
|
|
—
|
|
—
|
|
|||||||||||||||||||
|
Dividends declared and paid
|
(230.4
|
)
|
(228.1
|
)
|
—
|
|
—
|
|
—
|
|
—
|
|
—
|
|
—
|
|
—
|
|
(2.3
|
)
|
|||||||||||||||||||
|
Balance at December 31, 2011
|
$
|
7,690.2
|
|
$
|
3,689.7
|
|
$
|
(129.7
|
)
|
$
|
—
|
|
$
|
1.6
|
|
$
|
(321.1
|
)
|
$
|
110.5
|
|
$
|
724.8
|
|
$
|
3,572.1
|
|
$
|
42.3
|
|
|||||||||
|
Exchange of shares
|
—
|
|
—
|
|
—
|
|
—
|
|
—
|
|
—
|
|
(0.3
|
)
|
(0.4
|
)
|
0.7
|
|
—
|
|
|||||||||||||||||||
|
Shares issued under equity compensation plan
|
36.9
|
|
—
|
|
—
|
|
—
|
|
—
|
|
—
|
|
—
|
|
—
|
|
36.9
|
|
—
|
|
|||||||||||||||||||
|
Amortization of stock based compensation
|
12.5
|
|
—
|
|
—
|
|
—
|
|
—
|
|
—
|
|
—
|
|
—
|
|
12.5
|
|
—
|
|
|||||||||||||||||||
|
Acquisition of a business
|
40.6
|
|
—
|
|
—
|
|
—
|
|
—
|
|
—
|
|
—
|
|
—
|
|
—
|
|
40.6
|
|
|||||||||||||||||||
|
Purchase of noncontrolling interest in Central Europe
|
(27.9
|
)
|
—
|
|
—
|
|
—
|
|
—
|
|
—
|
|
—
|
|
—
|
|
1.4
|
|
(29.3
|
)
|
|||||||||||||||||||
|
Deconsolidation of MC Si'hai
|
(20.0
|
)
|
—
|
|
—
|
|
—
|
|
—
|
|
—
|
|
—
|
|
—
|
|
—
|
|
(20.0
|
)
|
|||||||||||||||||||
|
Net income (loss) including noncontrolling interests
|
439.1
|
|
443.0
|
|
—
|
|
—
|
|
—
|
|
—
|
|
—
|
|
—
|
|
—
|
|
(3.9
|
)
|
|||||||||||||||||||
|
Other comprehensive income (loss), net of tax
|
155.3
|
|
—
|
|
155.3
|
|
—
|
|
—
|
|
—
|
|
—
|
|
—
|
|
—
|
|
—
|
|
|||||||||||||||||||
|
Reclassification from investment in MillerCoors
|
(97.9
|
)
|
—
|
|
(97.9
|
)
|
—
|
|
—
|
|
—
|
|
—
|
|
—
|
|
—
|
|
—
|
|
|||||||||||||||||||
|
Dividends declared and paid
|
(237.2
|
)
|
(232.2
|
)
|
—
|
|
—
|
|
—
|
|
—
|
|
—
|
|
—
|
|
—
|
|
(5.0
|
)
|
|||||||||||||||||||
|
Balance at December 29, 2012
|
$
|
7,991.6
|
|
$
|
3,900.5
|
|
$
|
(72.3
|
)
|
$
|
—
|
|
$
|
1.6
|
|
$
|
(321.1
|
)
|
$
|
110.2
|
|
$
|
724.4
|
|
$
|
3,623.6
|
|
$
|
24.7
|
|
|||||||||
See notes to consolidated financial statements.
73
MOLSON COORS BREWING COMPANY AND SUBSIDIARIES
NOTES TO CONSOLIDATED FINANCIAL STATEMENTS
1. Basis of Presentation and Summary of Significant Accounting Policies
Unless otherwise noted in this report, any description of "we", "us" or "our" includes Molson Coors Brewing Company ("MCBC" or the "Company"), principally a holding company, and its subsidiaries. On
June 15, 2012
, we completed our acquisition (the "Acquisition") of StarBev Holdings S.a.r.l. ("StarBev"), which we subsequently renamed Molson Coors Central Europe ("MCCE"), operating in Central Europe (which includes Czech Republic, Serbia, Croatia, Romania, Bulgaria, Hungary, Montenegro, Bosnia-Herzegovina and Slovakia). Our other subsidiaries include: Molson Coors Canada ("MCC"), operating in Canada; MillerCoors LLC ("MillerCoors"), which is accounted for by us under the equity method of accounting, operating in the United States ("U.S."); Molson Coors Brewing Company (UK) Limited ("MCBC-UK"), operating in the United Kingdom ("U.K.") and the Republic of Ireland; Molson Coors International ("MCI") operating in various other countries; and our other non-operating subsidiaries. Any reference to "Coors" means the Adolph Coors Company prior to the 2005 merger with Molson Inc. (the "Merger"). Any reference to Molson Inc. or Molson means MCC prior to the Merger. Any reference to "Molson Coors" means MCBC after the Merger.
Unless otherwise indicated, information in this report is presented in U.S. dollars ("USD" or "$").
Our Fiscal Year
We follow a
52
/
53
week fiscal reporting calendar. Unless otherwise indicated, fiscal year
2012
refers to the
52
weeks ended
December 29, 2012
. Fiscal year
2011
refers to the
53
weeks ended
December 31, 2011
, and fiscal year
2010
refers to the
52
weeks ended
December 25, 2010
.
MillerCoors and MCCE follow a monthly fiscal reporting calendar. For MillerCoors, fiscal years
2012
,
2011
and
2010
refer to the
12
months ended
December 31, 2012
,
December 31, 2011
, and
December 31, 2010
, respectively. For MCCE, fiscal year 2012 refers to the period from the Acquisition date of
June 15, 2012
through
December 31, 2012
. Additionally, the results from Brewers' Retail, Inc. ("BRI"), Brewers' Distributor Ltd. ("BDL") and Modelo Molson Imports, L.P. ("MMI"), equity method investments, are reported one month in arrears. Our policy is to accelerate recording the effect of events occurring in the lag period that significantly affect our consolidated financial statements.
Principles of Consolidation
Our consolidated financial statements include our accounts and our majority-owned and controlled domestic and foreign subsidiaries, as well as certain variable interest entities ("VIEs") for which we are the primary beneficiary. All intercompany accounts and transactions have been eliminated in consolidation. We deconsolidated our joint venture in China, Molson Coors Si'hai ("MC Si'hai"), from our financial statements during the third quarter of 2012, due to a loss of our ability to control the joint venture. See Note 5, "Investments" for further information.
Use of Estimates
Our consolidated financial statements are prepared in accordance with accounting principles generally accepted in the United States of America ("U.S. GAAP"). These accounting principles require us to make certain estimates, judgments and assumptions. We believe that the estimates, judgments and assumptions used to determine certain amounts that affect the financial statements are reasonable, based on information available at the time they are made. To the extent there are differences between these estimates and actual results, our consolidated financial statements may be materially affected.
Revenue Recognition
Revenue is recognized when the significant risks and rewards of ownership, including the risk of loss, are transferred to the customer or distributor depending upon the method of distribution and shipping terms. The cost of various programs, such as price promotions, rebates and coupon programs are treated as a reduction of sales. In certain of our markets, slotting or listing fees are paid to customers and are also treated as a reduction of sales. Sales of products are for cash or otherwise agreed upon credit terms. Sales are stated net of incentives, discounts and returns.
We do not have standard terms that permit return of product; however, in certain markets where returns occur we estimate the amount of returns based on historical return experience and adjust our revenue accordingly. Products that do not meet our high quality standards are returned by the customer or recalled and destroyed and are recorded as a reduction of revenue. The reversal of revenue is recorded upon determination that the product will be recalled and destroyed. We estimate the costs required to facilitate product returns and record them in cost of goods sold as required.
74
In addition to supplying our own brands, the U.K. segment sells other beverage companies' products to on-premise customers to provide them with a full range of products for their retail outlets. We refer to this as the "factored brand business." Sales from this business are included in our net sales and cost of goods sold when ultimately sold, but the related volume is not included in our reported sales volumes. In the factored brand business, we normally purchase inventory, which includes excise taxes charged by the vendor, take orders from customers for such brands, and invoice customers for the product and related costs of delivery. In accordance with guidance pertaining to reporting revenue gross as a principal versus net as an agent, sales under the factored brands are reported on a gross income basis.
Payments made to customers are conditional on the achievement of volume targets, marketing commitments, or both. If paid in advance, we record such payments as prepayments and amortize them in the consolidated statements of operations over the relevant period to which the customer commitment is made (up to
five
years). Where there is no sufficiently separate identifiable benefit, and the payment is linked to volumes, or fair value cannot be established, the amortization of the prepayment or the cost as incurred is included in sales discounts as a reduction to sales and where there are specific marketing activities/commitments the cost is included as marketing, general and administrative expenses. The amounts capitalized are reassessed regularly for recoverability over the contract period and are impaired where there is objective evidence that the benefits will not be realized or the asset is otherwise not recoverable.
Excise Taxes
Excise taxes collected from customers and remitted to tax authorities are government-imposed excise taxes on beer shipments. Excise taxes on beer shipments are shown in a separate line item in the consolidated statements of operations as a reduction of sales. Sales taxes collected from customers are recognized as a liability, with the liability subsequently reduced when the taxes are remitted to the tax authority.
Cost of Goods Sold
Our Cost of goods sold includes costs we incur to make and ship beer. These costs include brewing materials, such as barley, hops and various grains. Packaging materials, including glass bottles, aluminum and steel cans, cardboard and paperboard are also included in our cost of goods sold. Additionally, our cost of goods sold include both direct and indirect labor, freight costs, utilities, maintenance costs, depreciation, promotional packaging, other manufacturing overheads and costs to purchase factored brands from suppliers, as well as the estimated cost to facilitate product returns.
Marketing, General and Administrative Expenses
Our Marketing, general and administrative expenses include media advertising (television, radio, print), tactical advertising (signs, banners, point-of-sale materials) and promotion costs on both local and national levels within our operating segments. The creative portion of our advertising activities is expensed as incurred. Production costs of advertising and promotional materials are expensed when the advertising is first run. Advertising expense was
$423.5 million
,
$398.8 million
, and
$361.6 million
for fiscal years
2012
,
2011
, and
2010
, respectively. Prepaid advertising costs of
$23.9 million
and
$21.6 million
, were included in other current assets in the consolidated balance sheets at
December 29, 2012
, and
December 31, 2011
, respectively.
This classification includes general and administrative costs for functions such as finance, legal, human resources and information technology, which consist primarily of labor and outside services, as well as bad debt expense related to our allowance for doubtful accounts. These costs also include our marketing and sales organizations, including labor and other overheads. This line item includes amortization costs associated with intangible assets, as well as certain depreciation costs related to non-production equipment and share-based compensation.
Share-based compensation is recognized using a straight-line method over the vesting period of the awards. Certain share-based compensation plans contain provisions that accelerate vesting of awards upon change in control, retirement, disability, or death of eligible employees and directors. Our share-based awards are considered vested when the employee's retention of the award is no longer contingent on providing service. Accordingly, we recognize share-based compensation cost for awards granted to retirement-eligible individuals immediately. Also, if less than the stated vesting period, we recognize these costs over the period from the grant date to the date retirement eligibility is achieved. We report the benefits of tax deductions in excess of recognized compensation cost as a financing cash flow, thereby reducing net operating cash flows and increasing net financing cash flows.
Special Items
Our special items represent charges incurred or benefits realized that we do not believe to be indicative of our core operations; specifically, such items are considered to be one of the following:
•
infrequent or unusual items,
75
•
impairment or asset abandonment-related losses, or
•
restructuring charges and other atypical employee-related costs.
Although we believe these items are not indicative of our core operations, the items classified as special items are not necessarily non-recurring.
Income Taxes
Deferred income taxes are provided for the temporary differences between the financial reporting basis and the tax basis of our assets, liabilities, and certain unrecognized gains and losses recorded in accumulated other comprehensive earnings. We provide for taxes that may be payable if undistributed earnings of overseas subsidiaries were to be remitted to the U.S., except for those earnings that
we consider to be permanently reinvested. Interest, penalties and offsetting positions related to unrecognized tax benefits are recognized as a component of income tax expense. Our deferred tax valuation allowances are primarily the result of uncertainties regarding the future realization of recorded tax benefits on tax loss carryforwards from operations in various jurisdictions. These valuation allowances are primarily related to deferred tax assets generated from net operating losses.
Cash and Cash Equivalents
Cash consists of cash on hand and bank deposits. Cash equivalents represent highly liquid investments with original maturities of
90
days or less. Our cash deposits may be redeemed upon demand and are maintained with multiple, reputable financial institutions. The following presents our supplemental cash flow information:
|
|
For the fiscal years ended
|
||||||||||
|
|
December 29, 2012
|
December 31, 2011
|
December 25, 2010
|
||||||||
|
|
(In millions)
|
||||||||||
|
Cash paid for interest
|
$
|
191.4
|
|
$
|
102.3
|
|
$
|
87.0
|
|
||
|
Cash paid for taxes
|
$
|
34.6
|
|
$
|
62.7
|
|
$
|
38.4
|
|
||
|
Non-cash convertible note issued upon close of the Acquisition
|
$
|
645.9
|
|
$
|
—
|
|
$
|
—
|
|
||
|
Non-cash receipt of note upon sale of property
|
$
|
—
|
|
$
|
—
|
|
$
|
5.3
|
|
||
We also have non-cash issuances of share-based awards. See further discussion in Note 15, "Share-Based Payments."
Accounts Receivable and Notes Receivable
We record accounts and notes receivable at net realizable value. This carrying value includes an appropriate allowance for estimated uncollectible amounts to reflect any loss anticipated on the accounts and notes receivable balances. We calculate this allowance based on our country-specific history of write-offs, level of past-due accounts based on the contractual terms of the receivables and our relationships with and the economic status of our customers, which may be impacted by current macroeconomic and regulatory factors specific to the country of origin.
The U.K. segment extends loans to a portion of the retail outlets that sell our brands. We reclassify a portion of beer revenue to interest income to reflect a market rate of interest on these loans. In fiscal years
2012
,
2011
and
2010
, these amounts were
$5.7 million
,
$6.3 million
, and
$6.7 million
, respectively and this interest income is included in the U.K. segment. At
December 29, 2012
, and
December 31, 2011
, total loans outstanding, net of allowances, were
$35.8 million
and
$42.6 million
, respectively, and are classified as either current or non-current notes receivable in our consolidated balance sheets. An allowance for credit losses is maintained to provide for loan losses deemed to be probable related to specifically identified loans and for losses in the loan portfolio that have been incurred at the balance sheet date. We establish our allowance through a provision for loan losses charged against earnings and recorded in marketing, general and administrative expenses. Loan balances that are written off are recorded against the allowance as a write-off. Activity within the allowance is insignificant for fiscal years
2012
,
2011
and
2010
.
Inventories
Inventories are stated at the lower of cost or market. Cost is determined by the first-in, first-out ("FIFO") method. We regularly assess the shelf-life of our inventories and reserve for those inventories when it becomes apparent the product will not be sold within our freshness specifications. We did not have a material allowance for obsolete finished goods or packaging materials at
December 29, 2012
, or at
December 31, 2011
.
76
Properties
Properties are stated at original cost less accumulated depreciation. Depreciation is recorded using the straight-line method over the estimated useful lives of the assets, which are reviewed periodically and have the following ranges: buildings and improvements:
20
-
40
years; machinery and equipment:
3
-
25
years; furniture and fixtures:
3
-
10
years; returnable containers:
2
-
15
years; and software:
3
-
5
years. Land is not depreciated, and construction in progress is not depreciated until ready for service. Costs of enhancements or modifications that substantially extend the capacity or useful life of an asset are capitalized and depreciated accordingly. Ordinary repairs and maintenance are expensed as incurred. When property is retired or otherwise disposed of, the cost and accumulated depreciation are removed from our consolidated balance sheets and the resulting gain or loss, if any, is reflected in our consolidated statements of operations. Long-lived assets are evaluated for impairment whenever events or changes in circumstances indicate the carrying value of an asset (or asset group) may not be recoverable.
Returnable containers are recorded at acquisition cost and consist of returnable bottles, kegs, pallets and crates that are both in our direct control within our breweries, warehouses and distribution facilities and those that we indirectly control in the market through our agreements with our customers and other brewers and for which a deposit is received. The deposits received on our returnable containers in the market are recorded as deposit liabilities, included as current liabilities within accrued expenses and other liabilities in the consolidated balance sheets. We estimate that the loss, breakage and deterioration of our returnable containers is comparable to the depreciation calculated on an estimated useful life of approximately
2
years for pallets,
4
years for bottles,
7
years for crates, and
15
years for returnable kegs. We also own and maintain other equipment in the market related to delivery of our products to end consumers, for example on-premise dispense equipment and refrigeration units. This equipment is recorded at acquisition cost and depreciated over lives of up to
7
years, depending on the market, reflecting the use of the equipment, as well as the loss and deterioration of the asset.
The costs of acquiring or developing internal-use computer software, including directly-related payroll costs for internal resources, are capitalized and classified within properties. Software maintenance and training costs are expensed in the period incurred.
Properties held under capital lease are depreciated using the straight-line method over the estimated useful life or the lease term, whichever is shorter, and the related depreciation is included in depreciation expense.
Goodwill and Other Intangible Assets
Goodwill is allocated to the reporting unit in which the business that created the goodwill resides. A reporting unit is an operating segment, or a business unit one level below that operating segment, for which discrete financial information is prepared and regularly reviewed by segment management. In certain cases, we have aggregated business units into one reporting unit if the specific aggregation criteria under U.S. GAAP is met. The Canada, U.K. and Central Europe reporting units are consistent with our operating segments. However, for our India business, the reporting unit is one level below the MCI operating segment. We evaluate the carrying value of our goodwill and indefinite-lived intangible assets for impairment at the reporting unit level at least annually or when an interim triggering event occurs that would indicate that impairment may have taken place. We evaluate our other definite-lived intangible assets for impairment when evidence exists that certain events or changes in circumstances indicate that the carrying amount of these assets may not be recoverable. Significant judgments and assumptions are required in such impairment evaluations. We are required to perform goodwill and indefinite-lived intangible asset impairment tests on at least an annual basis and more frequently in certain circumstances. Our annual impairment testing day is as of the first day of our fiscal third quarter. Definite-lived intangible assets are stated at cost less accumulated amortization. Amortization is recorded using the straight-line method over the estimated lives of the assets. We continuously monitor the performance of definite-lived intangible assets for potential triggering events suggesting an impairment review should be performed.
Equity Method Investments
We generally apply the equity method of accounting to
20%
to
50%
owned investments where we exercise significant influence or VIEs for which we are not the primary beneficiary. Equity method investments include our equity ownership in MillerCoors in the U.S. and Tradeteam, Ltd ("Tradeteam") (a transportation and logistics services company) in the U.K., along with MMI, BRI and BDL in Canada. See Note 5, "Investments" for further discussion.
There are
no
related parties that own interests in our equity method investments as of
December 29, 2012
.
Derivative Hedging Instruments
We use derivatives as part of our normal business operations to manage our exposure to fluctuations in interest, foreign currency exchange, commodity, production and packaging material costs and for other strategic purposes related to our core
77
business. We enter into derivatives for risk management purposes only, including derivatives designated in hedge accounting relationships as well as those derivatives utilized as economic hedges. We do not enter into derivatives for trading or speculative purposes. We recognize our derivatives on the consolidated balance sheets as assets or liabilities at fair value and are classified in either current or non-current assets or liabilities based on each contract's respective unrealized gain or loss position and each contract's respective maturity. Our policy is to present all derivative balances on a gross basis, without regard to counterparty master netting agreements or similar arrangements.
Changes in fair values (to the extent of hedge effectiveness) of outstanding cash flow and net investment hedges are recorded in other comprehensive income ("OCI"), until earnings are affected by the variability of cash flows of the underlying hedged item or the sale of the underlying net investment, respectively. Effective cash flow hedges offset the gains or losses recognized on the underlying exposure in the consolidated statements of operations, or for net investment hedges the foreign exchange translation gain or loss recognized in accumulated other comprehensive income ("AOCI"). Any ineffectiveness is recorded directly into earnings.
We record realized gains and losses from derivative instruments in the same financial statement line item as the hedged item/forecasted transaction. Changes in unrealized gains and losses for derivatives not designated in a hedge accounting relationship are recorded directly in earnings each period and are recorded in the same financial statement line item as the associated realized (cash settled) gains and losses. Cash flows from the settlement of derivatives appear in the consolidated statements of cash flows in the same categories as the cash flows of the hedged item.
In accordance with authoritative accounting guidance, we do not record the fair value of derivatives for which we have elected the Normal Purchase Normal Sale ("NPNS") exemption. We account for these contracts on an accrual basis, recording realized settlements related to these contracts in the same financial statement line items as the corresponding transaction.
Pension and Postretirement Benefits
We maintain retirement plans for the majority of our employees. Depending on the benefit program, we provide either defined benefit or defined contribution plans to our employees in each of our segments. Each plan is managed locally and in accordance with respective local laws and regulations. All retirement plans for our employees in the U.S. and Central Europe are defined contribution pension plans. Additionally, we offer other postretirement benefits ("OPEB") to the majority of our Canadian, U.S. and Central European employees. These plans are not funded. MillerCoors, BRI and BDL maintain defined benefit pension and postretirement benefit plans as well.
We recognize the underfunded or overfunded status of a defined benefit postretirement plan as an asset or liability in the consolidated balance sheets and recognize changes in the funded status in the year in which the changes occur within OCI. The funded status of a plan, measured as the difference between the fair value of plan assets and the projected or accumulated benefit obligation, and the related net periodic pension cost are calculated using a number of significant actuarial assumptions. Changes in net periodic pension cost and funding status may occur in the future due to changes in these assumptions.
Projected benefit obligation is the actuarial present value as of the measurement date of all benefits attributed by the plan benefit formula to employee service rendered before the measurement date using assumptions as to future compensation levels if the plan benefit formula is based on those future compensation levels. Accumulated benefit obligation is the actuarial present value of benefits (whether vested or unvested) attributed by the plan benefit formula to employee service rendered before the measurement date and based on employee service and compensation, if applicable, prior to that date. Accumulated benefit obligation differs from projected benefit obligation in that it includes no assumption about future compensation levels and years of service.
We employ the corridor approach for determining each plan's potential amortization from AOCI of deferred gains and losses, which occur when actual experience differs from estimates, into our net periodic pension and postretirement benefit cost. This approach defines the “corridor” as the greater of
10%
of the projected benefit obligation or
10%
of the market-related value of plan assets and requires amortization of the excess net gain or loss that exceeds the corridor over the average remaining service periods of active plan participants. As our U.K. plan is closed, the average remaining life expectancy of all plan participants (including retirees) is used.
Fair Value Measurements
The carrying amounts of our cash and cash equivalents, accounts receivable, accounts payable and accrued liabilities approximate fair value as recorded due to the short-term maturity of these instruments. In addition, the carrying amounts of our trade loan receivables, net of allowances, approximate fair value. The fair value of derivatives is estimated by discounting the estimated future cash flows utilizing observable market interest, foreign exchange and commodity rates adjusted for non-performance credit risk associated with our counterparties (assets) or with MCBC (liabilities). See Note 18, "Derivative
78
Instruments and Hedging Activities." Based on current market rates for similar instruments, the fair value of long-term debt is presented in Note 14, "Debt."
U.S. GAAP guidance for fair value includes a hierarchy that prioritizes fair value measurements based on the types of inputs used for the various valuation techniques (market approach, income approach and cost approach). Our financial assets and liabilities are measured using inputs from the three levels of the fair value hierarchy.
The three levels of the hierarchy are as follows:
Level 1—Inputs are unadjusted quoted prices in active markets for identical assets or liabilities that we have the ability to access at the measurement date.
Level 2—Inputs include quoted prices for similar assets and liabilities in active markets, quoted prices for identical or similar assets or liabilities in markets that are less active, inputs other than quoted prices that are observable for the asset or liability (i.e., interest rates, yield curves, etc.), and inputs that are derived principally from or corroborated by observable market data by correlation or other means (market corroborated inputs).
Level 3—Unobservable inputs that reflect the assumptions that we believe market participants would use in pricing the asset or liability. We develop these inputs based on the best information available, including our own data.
Foreign Currency
Assets and liabilities recorded in foreign currencies that are the functional currencies for the respective operations are translated at the prevailing exchange rate at the balance sheet date. Revenue and expenses are translated at the average exchange rates during the period. Translation adjustments resulting from this process are reported as a separate component of OCI. Gains and losses from foreign currency transactions are included in earnings for the period.
2. New Accounting Pronouncements
Adoption of New Accounting Pronouncements
Fair Value Measurement
In May 2011, the Financial Accounting Standards Board ("FASB") issued authoritative guidance related to fair value measurement and disclosure requirements. The new guidance results in a consistent definition of fair value and convergence between U.S. GAAP and International Financial Reporting Standards ("IFRS") on both how to measure fair value and on what disclosures to provide about fair value measurements. The guidance was effective for our quarter ended March 31, 2012. The adoption of this guidance did not impact our financial position or results from operations.
Presentation of Other Comprehensive Income
In June 2011, the FASB issued authoritative guidance related to the presentation of OCI, which was later amended in December 2011. Upon adoption of the guidance, as amended, an entity has the option to present the total of comprehensive income, the components of net income and the components of OCI either in a single continuous statement of comprehensive income or in two separate but consecutive statements. The guidance was effective for our quarter ended March 31, 2012. The adoption of this guidance was limited to a change in the presentation of our results, which we have elected to include as a separate consolidated statements of comprehensive income.
Testing Goodwill for Impairment
In September 2011, the FASB issued authoritative guidance related to goodwill impairment testing. The new guidance permits an entity to first assess qualitative factors to whether it is more likely than not that the fair value of a reporting unit is less than its carrying amount. If it is concluded that this is the case, it is necessary to perform the two-step goodwill impairment test. Otherwise, the two-step goodwill impairment test is not required. This guidance is effective for annual and interim goodwill impairment testing performed for our fiscal years beginning January 1, 2012. This guidance does not have an impact on our financial position or results from operations.
79
Testing Indefinite-lived Intangibles for Impairment
In July 2012, the FASB issued authoritative guidance related to the impairment testing of indefinite-lived intangibles. The new guidance permits an entity to first assess qualitative factors to determine whether it is more likely than not that the fair value of an indefinite-lived intangible is less than its carrying amount. If it is concluded that this is the case, the annual impairment test is necessary. Otherwise, the annual impairment test is not required. This guidance is effective for annual and interim indefinite-lived intangibles impairment testing performed for our fiscal years beginning January 1, 2013, however, we decided to early adopt and make it effective for our 2012 impairment review, which occurred during the third quarter of 2012. The adoption of this guidance did not have an impact on our financial position or results from operations.
New Accounting Pronouncements Not Yet Adopted
Disclosure about Offsetting Assets and Liabilities
In December 2011, the FASB issued authoritative guidance enhancing the disclosure requirements related to offsetting asset and liability positions. The update creates new disclosure requirements about the nature of an entity's rights of offset and related arrangements associated with its financial instruments and derivative instruments, including bifurcated embedded derivatives, repurchase agreements and reverse repurchase agreements, and securities borrowing and securities lending transactions that are either offset in accordance with applicable guidance or subject to an enforceable master netting arrangement. The new disclosures are designed to better facilitate comparison between financial statements prepared under U.S. GAAP and IFRS by requiring entities to provide financial statement users information about both gross and net exposures. The guidance is effective for interim and annual reporting periods beginning on or after January 1, 2013. We do not anticipate that this guidance will have an impact on our financial position or results from operations.
Reclassification of Items from Accumulated Other Comprehensive Income
In February 2013, the FASB issued authoritative guidance which adds new disclosure requirements for items reclassified out of AOCI. The update requires that an entity present either in a single note or parenthetically on the face of the financial statements, the effect of significant amounts reclassified from each component of AOCI based on its source and the income statement line items affected by the reclassification. The guidance is effective for interim and annual reporting periods beginning on or after December 15, 2012. We do not anticipate that this guidance will have an impact on our financial position or results from operations.
3. Acquisition of StarBev
General
In accordance with our strategy to increase our portfolio of premium brands and deepen our reach into growth markets around the world, we completed the Acquisition of StarBev from StarBev L.P. (the "Seller") on June 15, 2012, for approximately
€2.7 billion
(or
$3.4 billion
), including the assumption and payoff of pre-existing StarBev indebtedness. Headquartered in Amsterdam and Prague, StarBev is one of the largest brewers in Central Europe. StarBev, which we renamed Molson Coors Central Europe ("MCCE"), operates
nine
breweries in Czech Republic, Serbia, Croatia, Romania, Bulgaria, Hungary and Montenegro and sold approximately
13.3 million
hectoliters of beer in 2011, including sales in Bosnia-Herzegovina and Slovakia. In 2011, StarBev held a top-three market share position in each of its markets, and its brand portfolio includes local champions such as
Staropramen, Borsodi, Kamenitza, Bergenbier, Ozujsko
,
Jelen,
and
Niksicko,
and it also brews and distributes other brands under license.
Staropramen
is distributed and sold in over
45
countries. The operating results of MCCE are reported in our new Central Europe segment and our MCI segment as further described in Note 4, "Segment Reporting." We incurred acquisition and integration costs of
$41.1 million
in 2012, the majority of which was recorded as marketing, general and administrative expenses. We also incurred financing-related expenses as further described in Note 7, "Other Income and Expense" and Note 14, "Debt."
80
Unaudited Pro Forma Financial Information
MCCE contributed net sales of
$493.6 million
, of which
$481.2 million
is included in our Central Europe segment, and income from continuing operations before income taxes of
$102.8 million
, of which
$97.4 million
is included in our Central Europe segment, from the Acquisition date of June 15, 2012, through
December 29, 2012
. The incremental portion not included in our Central Europe segment results is our Central Europe export and license business reflected in our MCI segment results. The following unaudited pro forma summary presents our consolidated statements of operations as if MCCE had been acquired on December 26, 2010, the first day of our 2011 fiscal year. These amounts were calculated after conversion of StarBev's historical operating results to U.S. GAAP, conforming to our accounting policies, and adjusting StarBev's results to reflect the depreciation and amortization that would have been charged assuming the preliminary fair value adjustments to properties, net and other intangibles, net resulting from the purchase had it been applied from December 26, 2010, together with the consequential tax effects. These adjustments also reflect the removal of StarBev historical interest expense on debt that was repaid at the time of Acquisition, the addition of interest expense to be prospectively incurred on the debt issued to finance the Acquisition and the removal of the previously mentioned acquisition-related costs of
$31.4 million
incurred prior to the third quarter of 2012. Additional significant adjustments for 2012 include the removal of the following non-recurring, transaction-related costs included in the historical operating results: a
$57.9 million
Euro currency loss, a
$39.2 million
loss related to standard pre-issuance U.S. Treasury interest rate hedges ("Treasury Locks"), and bridge facility costs of
$13.0 million
, as further described in Note 7, "Other Income and Expense" and Note 14, "Debt", as well as expense of
$8.6 million
related to the fair value adjustment to Acquisition date inventory that was recorded in the post-Acquisition consolidated statements of operations. As a result of updating our preliminary purchase accounting, we have made an immaterial adjustment to our previously filed pro forma information. This unaudited pro forma financial information is not intended to reflect the performance which would have actually resulted had the Acquisition been effected on the dates indicated. Further, the unaudited pro forma results of operations are not necessarily indicative of the results of operations that may be obtained in the future.
|
For the years ended
|
|||||||
|
December 29, 2012(1)
|
December 31, 2011
|
||||||
|
(In millions)
|
|||||||
|
Net sales
|
$
|
4,257.0
|
|
$
|
4,455.7
|
|
|
|
Income from continuing operations before income taxes
|
$
|
720.8
|
|
$
|
850.0
|
|
|
|
Net income attributable to MCBC
|
$
|
559.0
|
|
$
|
762.5
|
|
|
|
Net income per common share attributable to MCBC:
|
|||||||
|
Basic
|
$
|
3.09
|
|
$
|
4.12
|
|
|
|
Diluted
|
$
|
3.08
|
|
$
|
4.09
|
|
|
|
(1)
|
The year ended
December 29, 2012
, includes actual results for the period from the Acquisition date of June 15, 2012, and pro forma results for the period January 1, 2012, through June 14, 2012.
|
Fair Value of the Purchase Price
The following table summarizes the purchase price, inclusive of pre-existing debt assumed and subsequently repaid, to acquire StarBev:
|
Fair Value
|
|||
|
(In millions)
|
|||
|
Cash consideration to Seller
|
$
|
1,816.0
|
|
|
Fair value of convertible note issued to Seller(1)
|
645.9
|
|
|
|
Senior debt facilities with third-party creditor(2)
|
585.0
|
|
|
|
Total consideration
|
$
|
3,046.9
|
|
|
Cash, net of bank overdraft acquired(3)
|
$
|
(42.3
|
)
|
|
Subordinated deferred payment obligation ("SDPO") with third-party creditors(4)
|
423.4
|
|
|
|
Total purchase price, inclusive of pre-existing debt assumed and subsequently repaid
|
$
|
3,428.0
|
|
|
(1)
|
We issued a
€500 million
Zero
Coupon Senior Unsecured Convertible Note due 2013 to the Seller upon close of the Acquisition. See Note 14, "Debt" for further discussion.
|
81
|
(2)
|
According to our agreement with the Seller and in accordance with the terms of the senior debt facility agreement, upon the closing of the Acquisition, we immediately repaid pre-existing StarBev third-party debt including accrued interest.
|
|
(3)
|
Consists of
$143.6 million
of cash acquired and
$101.3 million
of bank overdrafts assumed as part of MCCE's cash pool arrangement and repaid during the third quarter of 2012.
|
|
(4)
|
We assumed the pre-existing StarBev
$423.4 million
SDPO payable to third-party creditors, which we subsequently repaid on June 29, 2012, in accordance with the terms of the SDPO agreement. The SDPO was held by private investors and accrued interest at
11%
. The settlement of the SDPO was not required by our agreement with the Seller.
|
The following table represents the classifications of the cash flows used, which are included within our consolidated statements of cash flows:
|
(In millions)
|
|||
|
Operating activities(1)
|
$
|
1.4
|
|
|
Investing activities(2)
|
2,257.4
|
|
|
|
Financing activities(1)
|
424.3
|
|
|
|
Total cash used
|
$
|
2,683.1
|
|
|
Non-cash(3)
|
$
|
645.9
|
|
|
(1)
|
Includes the SDPO discussed above, which was subsequently repaid on June 29, 2012, for
$425.7 million
including the
$1.4 million
of interest incurred subsequent to the close of the Acquisition noted as "Operating activities" in the table above.
|
|
(2)
|
Includes
$1,816.0 million
of cash consideration to the Seller for shares acquired and release of StarBev's pre-existing obligations to the Seller. Also, included is
$585.0 million
of pre-existing third-party debt immediately repaid in accordance with our agreement with the Seller and the terms of the senior debt facility agreement. This amount is presented net of cash acquired of
$143.6 million
.
|
|
(3)
|
Reflects the
$645.9 million
fair value of the convertible note issued to the Seller upon close of the Acquisition. See Note 14, "Debt" for further discussion.
|
Allocation of Consideration Transferred
The following table represents the preliminary allocation of the total consideration to MCCE's identifiable net assets, fair value of the noncontrolling interest in MCCE, and resulting residual goodwill as of June 15, 2012. These allocated amounts were updated in the second half of 2012 and will be finalized during the first half of 2013. The changes in the second half of 2012 resulted in an increase to goodwill of approximately
$80 million
primarily driven by the decrease in the valuation of other intangibles, net with an immaterial impact to our consolidated statements of operations.
|
Fair Value
|
|||
|
(In millions)
|
|||
|
Cash and cash equivalents
|
$
|
143.6
|
|
|
Current assets(1)
|
263.4
|
|
|
|
Properties
|
571.5
|
|
|
|
Other intangibles(2)
|
2,438.6
|
|
|
|
Other assets
|
36.7
|
|
|
|
Total assets acquired
|
$
|
3,453.8
|
|
|
Current liabilities(3)
|
847.5
|
|
|
|
Non-current liabilities(4)
|
430.3
|
|
|
|
Total liabilities assumed
|
$
|
1,277.8
|
|
|
Total identifiable net assets
|
$
|
2,176.0
|
|
|
Noncontrolling interest measured at fair value
|
40.6
|
|
|
|
Goodwill(5)
|
911.5
|
|
|
|
Total consideration
|
$
|
3,046.9
|
|
|
(1)
|
Includes trade receivables of
$167.5 million
and inventory of
$57.3 million
.
|
82
|
(2)
|
See Note 13, "Goodwill and Intangible Assets" for further discussion.
|
|
(3)
|
Includes the
$423.4 million
SDPO assumed, which was subsequently repaid for
$425.7 million
on June 29, 2012.
|
|
(4)
|
Includes
$410.2 million
of deferred tax liabilities.
|
|
(5)
|
The goodwill resulting from the Acquisition is primarily attributable to MCCE's licensed brand brewing, distribution and import business, anticipated synergies and the assembled workforce. We have preliminarily assigned the majority of the goodwill to our Central Europe reporting unit with a portion allocated to the U.K. and Canada reporting units resulting from synergies. The goodwill is not deductible for tax purposes. See Note 13, "Goodwill and Intangible Assets" for further discussion.
|
4. Segment Reporting
Our reporting segments are based on the key geographic regions in which we operate, which are the basis on which our chief operating decision maker evaluates the performance of the business.
Reporting Segments
Canada
The Canada segment consists of our production, marketing and sales of the
Molson
family of brands,
Coors Light, Rickard's
,
Carling
, and other owned and licensed brands in Canada. Also included in the Canada segment is MMI, our joint venture with Grupo Modelo S.A.B. de C.V. ("Modelo"), established to import, distribute, and market the Modelo beer brand portfolio across all Canadian provinces and territories. MMI is accounted for under the equity method. In addition, the Canada segment includes BRI, our joint venture arrangement related to the distribution and retail sale of beer in Ontario, and BDL, our joint venture arrangement related to the distribution of beer in the western provinces. Both BRI and BDL are accounted for as equity method investments.
We have an agreement with Heineken N.V. ("Heineken") that grants us the right to import, market, distribute and sell Heineken products and with SABMiller plc ("SABMiller") that grants us the right to brew or import, market, distribute and sell several SABMiller brands. We also contract brew and package
Labatt Blue
and
Asahi
for the U.S. market.
United States (U.S.)
The U.S. segment consists of our interest, and results from our interest, in MillerCoors, our joint venture with SABMiller for all U.S. operations. MillerCoors produces, markets, and sells beer brands in the U.S. and Puerto Rico. Its major brands include
Coors Light
,
Miller Lite
,
Miller High Life
,
Keystone Light
,
Blue Moon
,
Leinenkugel's
,
Coors Banquet
and
Miller Genuine Draft
. Our interest in MillerCoors is accounted for under the equity method of accounting. See Note 5, "Investments" for further discussion.
Central Europe
As a result of the Acquisition, our Central Europe segment consists of our production, marketing and sales of our brands principally in Czech Republic, Serbia, Croatia, Romania, Bulgaria, Hungary and Montenegro and also sells our brands in Bosnia-Herzegovina and Slovakia. Our brand portfolio includes
Jelen
,
Staropramen
,
Ozujsko
,
Bergenbier
,
Kamenitza
, and
Branik
. We also brew and distribute
Stella Artois, Beck's, Lowenbrau
and
Spaten
under license agreements with Anheuser-Busch InBev ("ABI") companies. See Note 3, "Acquisition of StarBev" for further discussion.
United Kingdom (U.K.)
The U.K. segment consists of our production, marketing and sales of our brands (the largest of which is
Carling
) principally in the U.K. and the Republic of Ireland; our consolidated joint venture relating to the production and distribution of the
Grolsch
brands in the U.K. and the Republic of Ireland; our consolidated joint venture to produce and distribute the
Cobra
brands in the U.K. and the Republic of Ireland; factored brand sales (beverage brands owned by other companies, but sold and delivered to retail by us), in the U.K.; and our joint venture arrangement, Tradeteam, with DHL for the distribution of products throughout the U.K. accounted for under the equity method. We also distribute the Modelo brands, including
Corona
, pursuant to a distribution agreement with Modelo. In addition, we contract manufacture for Heineken U.K. and Carlsberg U.K.
83
Molson Coors International (MCI)
The MCI segment is focused on growing our business and brand portfolios in key emerging and growth markets outside of the U.S., U.K., Canada and Central Europe, including Asia, continental Europe (outside of Central Europe), Mexico, Latin America and the Caribbean. This segment includes our Molson Coors Cobra India joint venture, our agreement in India with Cobra India. Beginning July 1, 2012, our Central Europe export and license business, added as part of the Acquisition, which includes the licensing arrangements with ABI to brew and distribute our products in Russia and Ukraine, export arrangements with Carlsberg in the U.K. and Sweden and with ABI in Germany, Canada and Italy, and other export arrangements in various other countries, is being reported in our MCI segment. The impact of our Central Europe export and license business for the period from Acquisition through the end of the second quarter 2012 was immaterial and therefore, have not been recast to be included in MCI results.
Corporate
Corporate is not a segment and includes interest and certain other general and administrative costs that are not allocated to any of the operating segments. The majority of these corporate costs relate to worldwide administrative functions, such as corporate affairs, legal, human resources, finance and accounting, treasury, insurance and risk management. Additionally, the results of our water resources and energy operations in the state of Colorado are included in Corporate. Corporate also includes certain royalty income and administrative costs related to the management of intellectual property.
Summarized Financial Information
No single customer accounted for more than
10%
of our consolidated or segmented sales in
2012
,
2011
or
2010
. Net sales represent sales to third-party external customers. Inter-segment sales revenues other than sales to MillerCoors are insignificant and eliminated in consolidation.
The following tables represent consolidated net sales, consolidated interest expense, consolidated interest income, and reconciliations of amount shown as income (loss) from continuing operations before income taxes to income from continuing operations attributable to MCBC:
|
|
Year ended December 29, 2012
|
||||||||||||||||||||||||||||||
|
|
Canada
|
U.S.
|
Central Europe(1)
|
U.K.
|
MCI
|
Corporate
|
Eliminations(2)
|
Consolidated
|
|||||||||||||||||||||||
|
|
(In millions)
|
||||||||||||||||||||||||||||||
|
Net sales
|
$
|
2,036.8
|
|
$
|
—
|
|
$
|
481.2
|
|
$
|
1,266.3
|
|
$
|
147.0
|
|
$
|
1.2
|
|
$
|
(16.0
|
)
|
$
|
3,916.5
|
|
|||||||
|
Interest expense
|
—
|
|
—
|
|
—
|
|
—
|
|
—
|
|
(196.3
|
)
|
—
|
|
(196.3
|
)
|
|||||||||||||||
|
Interest income
|
—
|
|
—
|
|
—
|
|
5.7
|
|
—
|
|
5.6
|
|
—
|
|
11.3
|
|
|||||||||||||||
|
Income (loss) from continuing operations before income taxes
|
$
|
423.0
|
|
$
|
510.9
|
|
$
|
97.4
|
|
$
|
38.8
|
|
$
|
(72.1
|
)
|
$
|
(405.9
|
)
|
$
|
—
|
|
$
|
592.1
|
|
|||||||
|
Income tax benefit (expense)
|
|
|
|
|
|
|
|
|
(154.5
|
)
|
|||||||||||||||||||||
|
Net income (loss) from continuing operations
|
|
|
|
|
|
|
|
|
437.6
|
|
|||||||||||||||||||||
|
Less: Net (income) loss attributable to noncontrolling interests
|
|
|
|
|
|
|
|
|
3.9
|
|
|||||||||||||||||||||
|
Net income (loss) from continuing operations attributable to MCBC
|
|
|
|
|
|
|
|
|
$
|
441.5
|
|
||||||||||||||||||||
|
(1)
|
Represents activity from the Acquisition date of June 15, 2012.
|
|
(2)
|
Represents inter-segment sales from the U.K. segment to the MCI segment.
|
84
|
|
Year ended December 31, 2011
|
||||||||||||||||||||||||||
|
|
Canada
|
U.S.
|
U.K.
|
MCI
|
Corporate
|
Eliminations(1)
|
Consolidated
|
||||||||||||||||||||
|
|
(In millions)
|
||||||||||||||||||||||||||
|
Net sales
|
$
|
2,067.3
|
|
$
|
—
|
|
$
|
1,333.5
|
|
$
|
122.6
|
|
$
|
1.3
|
|
$
|
(9.0
|
)
|
$
|
3,515.7
|
|
||||||
|
Interest expense
|
—
|
|
—
|
|
—
|
|
—
|
|
(118.7
|
)
|
—
|
|
(118.7
|
)
|
|||||||||||||
|
Interest income
|
—
|
|
—
|
|
6.3
|
|
—
|
|
4.4
|
|
—
|
|
10.7
|
|
|||||||||||||
|
Income (loss) from continuing operations before income taxes
|
$
|
474.9
|
|
$
|
457.9
|
|
$
|
99.3
|
|
$
|
(33.3
|
)
|
$
|
(224.6
|
)
|
$
|
—
|
|
$
|
774.2
|
|
||||||
|
Income tax benefit (expense)
|
|
|
|
|
|
|
|
|
(99.4
|
)
|
|||||||||||||||||
|
Net income (loss) from continuing operations
|
|
|
|
|
|
|
|
|
674.8
|
|
|||||||||||||||||
|
Less: Net (income) loss attributable to noncontrolling interests
|
|
|
|
|
|
|
|
|
(0.8
|
)
|
|||||||||||||||||
|
Net income (loss) from continuing operations attributable to MCBC
|
|
|
|
|
|
|
|
|
$
|
674.0
|
|
||||||||||||||||
|
(1)
|
Represents inter-segment sales from the U.K. segment to the MCI segment.
|
|
|
Year ended December 25, 2010
|
||||||||||||||||||||||
|
|
Canada
|
U.S.
|
U.K.
|
MCI
|
Corporate
|
Consolidated
|
|||||||||||||||||
|
|
(In millions)
|
||||||||||||||||||||||
|
Net sales
|
$
|
1,938.2
|
|
$
|
—
|
|
$
|
1,234.9
|
|
$
|
80.0
|
|
$
|
1.3
|
|
$
|
3,254.4
|
|
|||||
|
Interest expense
|
—
|
|
—
|
|
—
|
|
—
|
|
(110.2
|
)
|
(110.2
|
)
|
|||||||||||
|
Interest income
|
—
|
|
—
|
|
6.7
|
|
—
|
|
4.1
|
|
10.8
|
|
|||||||||||
|
Income (loss) from continuing operations before income taxes
|
$
|
454.0
|
|
$
|
456.1
|
|
$
|
95.3
|
|
$
|
(25.7
|
)
|
$
|
(170.7
|
)
|
$
|
809.0
|
|
|||||
|
Income tax benefit (expense)
|
|
|
|
|
|
|
|
|
(138.7
|
)
|
|||||||||||||
|
Net income (loss) from continuing operations
|
|
|
|
|
|
|
|
|
670.3
|
|
|||||||||||||
|
Less: Net (income) loss attributable to noncontrolling interests
|
|
|
|
|
|
|
|
|
(2.2
|
)
|
|||||||||||||
|
Net income (loss) from continuing operations attributable to MCBC
|
|
|
|
|
|
|
|
|
$
|
668.1
|
|
||||||||||||
The following table presents total assets by segment:
|
|
As of
|
||||||
|
|
December 29, 2012
|
December 31, 2011
|
|||||
|
|
(In millions)
|
||||||
|
Canada
|
$
|
6,547.1
|
|
$
|
6,541.6
|
|
|
|
U.S.
|
2,431.8
|
|
2,487.9
|
|
|||
|
Central Europe
|
4,324.8
|
|
—
|
|
|||
|
U.K.
|
2,417.6
|
|
2,293.4
|
|
|||
|
MCI
|
92.0
|
|
151.7
|
|
|||
|
Corporate
|
398.9
|
|
948.9
|
|
|||
|
Discontinued operations
|
—
|
|
0.3
|
|
|||
|
Consolidated total assets
|
$
|
16,212.2
|
|
$
|
12,423.8
|
|
|
85
The following table presents select cash flow information by segment:
|
|
For the years ended
|
||||||||||
|
|
December 29, 2012
|
December 31, 2011
|
December 25, 2010
|
||||||||
|
|
|
(In millions)
|
|
||||||||
|
Depreciation and amortization(1):
|
|
|
|
||||||||
|
Canada
|
$
|
128.2
|
|
$
|
125.0
|
|
$
|
122.3
|
|
||
|
Central Europe
|
58.9
|
|
—
|
|
—
|
|
|||||
|
United Kingdom
|
72.7
|
|
75.6
|
|
67.5
|
|
|||||
|
MCI
|
3.4
|
|
3.2
|
|
0.8
|
|
|||||
|
Corporate
|
9.5
|
|
13.3
|
|
11.7
|
|
|||||
|
Consolidated depreciation and amortization
|
$
|
272.7
|
|
$
|
217.1
|
|
$
|
202.3
|
|
||
|
Capital expenditures(2):
|
|
|
|
||||||||
|
Canada
|
$
|
98.8
|
|
$
|
138.8
|
|
$
|
97.8
|
|
||
|
Central Europe
|
34.5
|
|
—
|
|
—
|
|
|||||
|
United Kingdom
|
76.2
|
|
80.3
|
|
70.0
|
|
|||||
|
MCI
|
5.8
|
|
12.4
|
|
4.2
|
|
|||||
|
Corporate
|
7.0
|
|
3.9
|
|
5.9
|
|
|||||
|
Consolidated capital expenditures
|
$
|
222.3
|
|
$
|
235.4
|
|
$
|
177.9
|
|
||
|
(1)
|
Depreciation and amortization amounts do not reflect amortization of bond discounts, fees, or other debt-related items.
|
|
(2)
|
Capital expenditures decreased in 2012 as the impact of including the results of our Central Europe operations was more than offset by the decrease due to cycling the 2011 Canada capital spending on the high-speed can line in our Montréal brewery.
|
The following table presents net sales by geography, based on the location of the customer:
|
|
For the years ended
|
||||||||||
|
|
December 29, 2012
|
December 31, 2011
|
December 25, 2010
|
||||||||
|
|
(In millions)
|
||||||||||
|
Net sales to unaffiliated customers:
|
|
|
|
||||||||
|
Canada
|
$
|
1,930.7
|
|
$
|
1,987.4
|
|
$
|
1,894.9
|
|
||
|
United States and its territories
|
107.3
|
|
81.3
|
|
44.6
|
|
|||||
|
United Kingdom
|
1,218.4
|
|
1,313.9
|
|
1,217.7
|
|
|||||
|
Other foreign countries(1)
|
660.1
|
|
133.1
|
|
97.2
|
|
|||||
|
Consolidated net sales
|
$
|
3,916.5
|
|
$
|
3,515.7
|
|
$
|
3,254.4
|
|
||
|
(1)
|
Reflects the addition of our Central Europe segment, which operates in
nine
countries and for which no individual country has total net sales exceeding 10% of the total consolidated net sales.
|
86
The following table presents net properties by geographic location:
|
|
As of
|
||||||
|
|
December 29, 2012
|
December 31, 2011
|
|||||
|
|
(In millions)
|
||||||
|
Net properties:
|
|
|
|||||
|
Canada
|
$
|
893.8
|
|
$
|
877.5
|
|
|
|
United States and its territories
|
33.1
|
|
35.7
|
|
|||
|
United Kingdom
|
474.7
|
|
456.3
|
|
|||
|
Other foreign countries(1)
|
594.3
|
|
60.6
|
|
|||
|
Consolidated net properties
|
$
|
1,995.9
|
|
$
|
1,430.1
|
|
|
|
(1)
|
Reflects the addition of our Central Europe segment, which operates in
nine
countries and for which no individual country has total net properties exceeding 10% of the total consolidated net properties.
|
5. Investments
Our investments include both equity method and consolidated investments. Those entities identified as VIEs have been evaluated to determine whether we are the primary beneficiary. The VIEs included under "Consolidated VIEs" below are those for which we have concluded that we are the primary beneficiary and accordingly, consolidate these entities. None of our consolidated VIEs held debt as of
December 29, 2012
, or
December 31, 2011
. We have not provided any financial support to any of our VIEs during the fiscal year 2012 that we were not previously contractually obligated to provide. Amounts due to and due from our equity method investments are recorded as affiliate accounts payable and affiliate accounts receivable.
Authoritative guidance related to the consolidation of VIEs requires that we continually reassess whether we are the primary beneficiary of VIEs in which we have an interest. As such, the conclusion regarding the primary beneficiary status is subject to change and we continually evaluate circumstances that could require consolidation or deconsolidation. As of
December 29, 2012
, and
December 31, 2011
, our consolidated VIEs are Cobra Beer Partnership, Ltd. ("Cobra U.K.") and Grolsch and our unconsolidated VIEs are BRI, BDL and MMI. See further discussion below.
Equity Investments
Investment in MillerCoors
MillerCoors has a Board of Directors consisting of
five
MCBC-appointed and
five
SABMiller-appointed directors. The percentage interests in the profits of MillerCoors are
58%
for SABMiller and
42%
for MCBC, and voting interests are shared
50%
-
50%
. Each party to the MillerCoors joint venture agreed not to transfer its economic or voting interests in the joint venture for a period of
five
years from July 1, 2008, and certain rights of first refusal will apply to any subsequent assignment of such interests. Our interest in MillerCoors is accounted for under the equity method of accounting.
87
Summarized financial information for MillerCoors is as follows (in millions):
Condensed Balance Sheet
|
|
As of
|
||||||
|
|
December 31, 2012
|
December 31, 2011
|
|||||
|
Current assets
|
$
|
841.4
|
|
$
|
810.9
|
|
|
|
Non-current assets
|
8,949.9
|
|
8,861.7
|
|
|||
|
Total assets
|
$
|
9,791.3
|
|
$
|
9,672.6
|
|
|
|
Current liabilities
|
$
|
958.5
|
|
$
|
922.7
|
|
|
|
Non-current liabilities
|
1,537.5
|
|
1,471.3
|
|
|||
|
Total liabilities
|
2,496.0
|
|
2,394.0
|
|
|||
|
Noncontrolling interests
|
28.4
|
|
36.7
|
|
|||
|
Owners' equity
|
7,266.9
|
|
7,241.9
|
|
|||
|
Total liabilities and equity
|
$
|
9,791.3
|
|
$
|
9,672.6
|
|
|
Results of Operations
|
For the years ended
|
|||||||||||
|
December 31, 2012
|
December 31, 2011
|
December 31, 2010
|
|||||||||
|
Net sales
|
$
|
7,761.1
|
|
$
|
7,550.2
|
|
$
|
7,570.6
|
|
||
|
Cost of goods sold
|
(4,689.7
|
)
|
(4,647.9
|
)
|
(4,686.3
|
)
|
|||||
|
Gross profit
|
$
|
3,071.4
|
|
$
|
2,902.3
|
|
$
|
2,884.3
|
|
||
|
Operating income(1)
|
$
|
1,211.1
|
|
$
|
1,020.3
|
|
$
|
1,078.9
|
|
||
|
Net income attributable to MillerCoors(1)
|
$
|
1,190.9
|
|
$
|
1,003.8
|
|
$
|
1,057.0
|
|
||
|
(1)
|
Fiscal year 2012 includes special charges of
$31.8 million
primarily due to the write-down of assets related to discontinuing the production of the Home Draft package in the U.S. and the write-down of information systems assets related to the business transformation project. Fiscal year 2011 includes special charges of
$60.0 million
for a write-down in the value of the
Sparks
brand and a
$50.9 million
charge resulting from the planned assumption of the Milwaukee Brewery Worker's Pension Plan, an under-funded multi-employer pension plan. Fiscal year
2010
includes special charges of
$30.3 million
primarily driven by pension curtailment losses and integration costs, including severance and relocation costs resulting from the sales office reorganization.
|
The following represents our proportional share in MillerCoors' net income, reported under the equity method (in millions):
|
For the years ended
|
|||||||||||
|
December 29, 2012
|
December 31, 2011
|
December 25, 2010
|
|||||||||
|
Net income attributable to MillerCoors
|
$
|
1,190.9
|
|
$
|
1,003.8
|
|
$
|
1,057.0
|
|
||
|
MCBC economic interest
|
42
|
%
|
42
|
%
|
42
|
%
|
|||||
|
MCBC proportionate share of MillerCoors net income
|
500.2
|
|
421.6
|
|
443.9
|
|
|||||
|
Amortization of the difference between MCBC contributed cost basis and proportional share of the underlying equity in net assets of MillerCoors(1)
|
4.9
|
|
35.4
|
|
6.9
|
|
|||||
|
Share-based compensation adjustment(2)
|
5.8
|
|
0.9
|
|
5.3
|
|
|||||
|
Equity income in MillerCoors
|
$
|
510.9
|
|
$
|
457.9
|
|
$
|
456.1
|
|
||
|
(1)
|
Our net investment in MillerCoors is based on the carrying values of the net assets contributed to the joint venture which is less than our proportional share of underlying equity (
42%
) of MillerCoors (contributed by both Coors Brewing Company ("CBC") and Miller Brewing Company ("Miller") by approximately
$576 million
as of
December 29, 2012
. This basis difference, with the exception of certain non-amortizing items (goodwill, land, etc.) is being amortized as additional equity income over the remaining useful lives of the contributed long-lived amortizing
|
88
assets. During the fourth quarter of 2012, MillerCoors acquired the remaining noncontrolling interest in a consolidated subsidiary for an amount in excess of its carrying value, resulting in a decrease to owners' equity of
$18.5 million
. This created an additional basis difference of approximately
$7.8 million
as the transaction did not have a corresponding impact to our investment in the fourth quarter of 2012. This amount is included in the approximate
$576 million
difference noted above and will be amortized as part of the basis difference generated upon formation of the joint venture. Additionally, during the fourth quarter of 2012, we also reclassified approximately
$95 million
from the investment in MillerCoors to AOCI primarily reflecting our proportional share of MillerCoors AOCI at formation, which was previously not recognized in MCBC's ownership share of MillerCoors' OCI. We made this reclassification as we believe the new presentation provides improved transparency of our share of MillerCoors AOCI. This reclassification was not made to prior periods as the impact is immaterial. See Note 16, “Accumulated Other Comprehensive Income (Loss)” for inclusion of this reclassification under the caption "Equity Method Investments" for the year-ended December 29, 2012. During the third quarter of 2011, MillerCoors recognized an impairment charge of
$60.0 million
associated with its
Sparks
brand intangible asset. Our portion,
$25.2 million
, or
42%
of the charge, is offset by an adjustment to our basis amortization above. This adjustment represents accelerated amortization attributable to our proportionate share of the underlying basis of the asset class in which
Sparks
was contributed. The total current basis difference including the AOCI reclassification described above less the
$35.0 million
recorded in 2008 and 2009 related to differences resulting from accounting policy elections, as well as a distribution timing difference of
$15.5 million
received in fiscal 2013 for MCBC must be subtracted from our
42%
of MillerCoors' owners' equity to reconcile to our investment in MillerCoors.
|
(2)
|
The net adjustment is to record all share-based compensation associated with pre-existing equity awards to be settled in Class B common stock held by former employees now employed by MillerCoors and to eliminate all share-based compensation impacts related to pre-existing SABMiller equity awards held by former Miller employees now employed by MillerCoors. As of the end of the second quarter of 2011, the share-based awards granted to former CBC employees now employed by MillerCoors became fully vested. As such, no further adjustments will be recorded related to these awards. We are still recording adjustments to eliminate the impacts related to the pre-existing SABMiller equity awards, which represent the amounts recorded in 2012.
|
The following table summarizes our transactions with MillerCoors (in millions):
|
For the years ended
|
|||||||||||
|
December 29, 2012
|
December 31, 2011
|
December 25, 2010
|
|||||||||
|
Beer sales to MillerCoors
|
$
|
18.9
|
|
$
|
28.2
|
|
$
|
35.1
|
|
||
|
Beer purchases from MillerCoors
|
$
|
13.1
|
|
$
|
11.5
|
|
$
|
9.3
|
|
||
|
Service agreement costs and other charges to MillerCoors
|
$
|
3.7
|
|
$
|
6.0
|
|
$
|
4.1
|
|
||
|
Service agreement costs and other charges from MillerCoors
|
$
|
1.2
|
|
$
|
1.3
|
|
$
|
1.2
|
|
||
As of
December 29, 2012
, and
December 31, 2011
, we had
$0.8 million
net payables due to MillerCoors, and
$2.0 million
net receivables due from MillerCoors, respectively.
We assigned the United States and Puerto Rican rights to the legacy Coors brands, including
Coors Light
,
Coors Banquet
,
Keystone Light
and the
Blue Moon
brands, to MillerCoors. We retained all ownership rights of these brands outside of the United States and Puerto Rico. In addition, we retained numerous water rights in Colorado. We lease these water rights to MillerCoors at no cost for use at its Golden, Colorado brewery.
There were no undistributed earnings in MillerCoors as of
December 29, 2012
, or
December 31, 2011
.
89
Other Equity Investments
Tradeteam Ltd.
Tradeteam, a joint venture between us and DHL in which we have a
49.9%
interest, has a contract with us which gives them exclusive rights to provide our transportation and logistics services in the U.K. until
2018
. Our approximate financial commitments under the distribution contract with Tradeteam based on foreign exchange rates as of
December 29, 2012
, are as follows:
|
Fiscal year
|
Amount
|
|||
|
|
(In millions)
|
|||
|
2013
|
$
|
132.6
|
|
|
|
2014
|
132.3
|
|
||
|
2015
|
112.0
|
|
||
|
2016
|
95.5
|
|
||
|
2017
|
97.4
|
|
||
|
Thereafter
|
73.1
|
|
||
|
Total
|
$
|
642.9
|
|
|
The financial commitments on termination of the distribution agreement are to essentially take over property, assets and people used by Tradeteam to deliver the service to us, paying Tradeteam's book value for fixed assets acquired which approximates
$36.3 million
as of
December 29, 2012
.
Services provided under the Tradeteam contract were approximately
$128.5 million
,
$130.7 million
, and
$117.6 million
for the fiscal years ended
2012
,
2011
and
2010
, respectively, and are included in cost of goods sold. As of
December 29, 2012
, and
December 31, 2011
, we had
$14.6 million
and
$15.6 million
, respectively, due to Tradeteam for services provided.
Brewers' Retail Inc.
BRI, a VIE, is a beer distribution and retail network for the Ontario region of Canada, owned by MCBC, ABI and Sleeman. BRI charges its owners administrative fees that are designed so the entity operates at break-even profit levels. This administrative fee is based on costs incurred, net of other revenues earned, and is allocated in accordance with the operating agreement to its owners based on volume of products. Contractual provisions cause our interests to fluctuate based on this calculated market share requiring frequent primary beneficiary evaluations. However, based on the existing structure, control is shared and therefore we do not anticipate becoming the primary beneficiary in the foreseeable future.
We have an obligation to proportionately fund BRI's operations. As a result of this obligation, we continue to record our proportional share of BRI's net income or loss and OCI activity, despite our negative equity method balance. As of
December 29, 2012
, and
December 31, 2011
, we had a negative equity method balance of
$41.9 million
and
28.5 million
, respectively. The increase to our net liability balance was primarily driven by an increase to BRI's employee retirement plan obligations adversely impacting the net assets of BRI. Additionally, in 2011 we recorded historical corrections of immaterial errors identified during 2011 related to changes since our 2009 deconsolidation, including decreases in ownership, a historical purchase accounting correction, and tax impacts of historical pension and postretirement adjustments. As a result of these immaterial errors, we recognized in 2011 a non-cash benefit of approximately
$4 million
in cost of goods sold, a decrease to goodwill of
$55.7 million
, and a credit to OCI of
$15.0 million
. Administrative fees under the agreement with BRI were approximately
$124.3 million
,
$99.5 million
and
$93.9 million
for fiscal years
2012
,
2011
and
2010
, respectively, recorded in cost of goods sold. As of
December 29, 2012
, and
December 31, 2011
, we had
$37.9 million
and
$40.9 million
due from BRI related to services under the administrative fees agreement, respectively.
Brewers' Distributor Ltd.
BDL, a VIE, is a distribution operation owned by MCBC and ABI and pursuant to an operating agreement, acts as an agent for the distribution of their products in the western provinces of Canada. The
two
owners share
50%
/
50%
voting control of this business.
BDL charges the owners administrative fees that are designed so the entity operates at break-even profit levels. This administrative fee is based on costs incurred, net of other revenues earned, and is allocated in accordance with the operating agreement to the owners based on volume of products. No other parties are allowed to sell beer through BDL, which does not take legal title to the beer distributed for the owners. As of
December 29, 2012
, and
December 31, 2011
, our investment in BDL
90
was
$8.4 million
and
$12.6 million
, respectively. The decrease in our investment was primarily related to an increase in BDL's employee retirement plan obligation adversely impacting the net assets of BDL. Administrative fees under the contract were approximately
$61.9 million
,
$41.6 million
, and
$38.5 million
for the fiscal years
2012
,
2011
and
2010
, respectively, recorded in cost of goods sold. As of
December 29, 2012
, and
December 31, 2011
, we had receivables of
$11.4 million
and
$13.5 million
due from BDL, respectively, related to services under the administrative fees agreement.
Modelo Molson Imports, L.P.
MMI, a
50%
/
50%
joint venture with Modelo, imports, distributes, and markets the Modelo beer brand portfolio across all Canadian provinces and territories. Our sales team is responsible for selling the brands across Canada on behalf of the joint venture. We account for MMI, a VIE, under the equity method of accounting. During fiscal years
2012
,
2011
and
2010
, we incurred
$12.0 million
,
$15.4 million
and
$12.3 million
, respectively, of fees due to MMI recorded in cost of goods sold. As of
December 29, 2012
, and
December 31, 2011
, we had payables of
$13.1 million
and
$11.0 million
due to MMI, respectively, related to activities under the operating agreement.
Our other equity method investments are not considered significant for disclosure of financial information on either an individual or aggregated basis and there were no significant undistributed earnings as of
December 29, 2012
, or
December 31, 2011
, for any of these companies.
Consolidated VIEs
Grolsch
Grolsch is a joint venture between us and Royal Grolsch N.V. in which we hold a
49%
interest. The Grolsch joint venture markets
Grolsch
brands in the United Kingdom and the Republic of Ireland. The majority of the
Grolsch
brands are produced by us under a contract brewing arrangement with the joint venture. MCBC and Royal Grolsch N.V. sell beer to the joint venture, which sells the beer back to MCBC (for onward sale to customers) for a price equal to what it paid, plus a marketing and overhead charge and a profit margin. Grolsch is a taxable entity in the U.K. Accordingly, income tax expense in our consolidated statements of operations includes taxes related to the entire income of the joint venture. We consolidate the results and financial position of Grolsch and it is reported within our U.K. operating segment.
Cobra Beer Partnership, Ltd
We hold a
50.1%
interest in Cobra U.K., which owns the worldwide rights to the
Cobra
beer brand (with the exception of the Indian sub-continent, owned by Cobra India). The noncontrolling interest is held by the founder of the
Cobra
beer brand. We consolidate the results and financial position of Cobra U.K., and it is reported within our U.K. operating segment.
The following summarizes the assets and liabilities of our consolidated VIEs (including noncontrolling interests).
|
|
As of
|
||||||||||||||
|
|
December 29, 2012
|
December 31, 2011
|
|||||||||||||
|
|
Total Assets
|
Total Liabilities
|
Total Assets
|
Total Liabilities
|
|||||||||||
|
|
(In millions)
|
||||||||||||||
|
Grolsch
|
$
|
10.0
|
|
$
|
5.6
|
|
$
|
20.4
|
|
$
|
12.9
|
|
|||
|
Cobra U.K.
|
$
|
33.2
|
|
$
|
3.3
|
|
$
|
31.6
|
|
$
|
3.0
|
|
|||
MC Si'hai Deconsolidation and Impairment
During the third quarter of 2012, there were a number of events that caused us to re-assess the consolidation of our MC Si'hai joint venture in China. Specifically, in the third quarter, (i) we terminated an agreement previously signed in the second quarter of 2012, which was intended to allow us to acquire the noncontrolling interest in the joint venture, and (ii) we decided to also initiate the termination of the joint venture agreement and a proposed liquidation of the joint venture. We terminated the agreement to acquire the joint venture's noncontrolling interest as a result of our joint venture partner's multiple breaches of the agreement, as well as our joint venture partner's failure and inability to satisfy numerous closing conditions. We subsequently began pursuing a path to terminate and liquidate the joint venture pursuant to the terms of the joint venture agreement's dispute resolution process, which requires arbitration. It is expected that the arbitration and liquidation process likely will be protracted and that there may be significant further delays in enforcing any order from the arbitrator with the local authorities.
Due to our termination of the agreement to acquire the joint venture partner's noncontrolling interest and the joint venture agreement and the joint venture partner's actions during the third quarter of 2012, we are not able to exercise legal or
91
operational control over the joint venture in accordance with the terms of the joint venture agreement. As a result, we deconsolidated the joint venture during the third quarter of 2012.
Upon loss of control and subsequent deconsolidation, the fair value of the remaining investment was a liability of
$5.4 million
representing our share of the joint venture's liabilities at termination of the joint venture. As a result, we recorded an impairment loss of
$27.6 million
as a special item in the third quarter of 2012. We do not anticipate any future material impacts to our consolidated financial position, results of operations or cash flows. See Note 13, "Goodwill and Intangible Assets" for further discussion of the MC Si'hai joint venture.
6. Discontinued Operations
The table below summarizes the income (loss) from discontinued operations, net of tax, presented on our consolidated statements of operations:
|
|
For the years ended
|
||||||||||
|
|
December 29, 2012
|
December 31, 2011
|
December 25, 2010
|
||||||||
|
|
(In millions)
|
||||||||||
|
Gain related to settlement of a portion of our indemnity liabilities(1)
|
$
|
—
|
|
$
|
—
|
|
$
|
42.6
|
|
||
|
Loss related to adjustment in legal reserves due to changes in estimates, fees and foreign exchange gains and losses(2)
|
(2.0
|
)
|
(0.4
|
)
|
(1.5
|
)
|
|||||
|
Adjustments to indemnity liabilities due to changes in estimates and foreign exchange gains and losses
|
3.5
|
|
2.7
|
|
(1.5
|
)
|
|||||
|
Income (loss) from discontinued operations, net of tax
|
$
|
1.5
|
|
$
|
2.3
|
|
$
|
39.6
|
|
||
|
(1)
|
In 2006, we sold our entire equity interest in our Brazilian unit, Cervejarias Kaiser Brasil S.A. ("Kaiser"), to FEMSA Cerveza S.A. de C.V. ("FEMSA"). The terms of the sale agreement require us to indemnify FEMSA for exposures related to certain tax, civil and labor contingencies arising prior to FEMSA's purchase of Kaiser (See Note 20, "Commitments and Contingencies").
|
|
(2)
|
During 2012, we incurred a
$2.0 million
loss associated with the settlement of a distributor litigation, which was previously accrued for in the current liabilities of discontinued operations section of our consolidated balance sheets. As of
December 29, 2012
, there are
no
accruals for legal matters related to discontinued operations. See Note 20, "Commitments and Contingencies" for additional information regarding the litigation settlement.
|
7. Other Income and Expense
The table below summarizes other income and expense:
|
|
For the years ended
|
||||||||||
|
|
December 29, 2012
|
December 31, 2011
|
December 25, 2010
|
||||||||
|
|
(In millions)
|
||||||||||
|
Bridge facility fees(1)
|
$
|
(13.0
|
)
|
$
|
—
|
|
$
|
—
|
|
||
|
Euro currency purchase loss(2)
|
(57.9
|
)
|
—
|
|
—
|
|
|||||
|
Gain from Foster's swap and related financial instruments(3)
|
—
|
|
0.8
|
|
47.9
|
|
|||||
|
Gain (loss) from foreign exchange and derivatives(4)
|
(25.2
|
)
|
(6.9
|
)
|
(3.4
|
)
|
|||||
|
Environmental reserve
|
(0.4
|
)
|
(0.2
|
)
|
0.2
|
|
|||||
|
Loss related to the change in designation of cross currency swaps(5)
|
—
|
|
(6.7
|
)
|
—
|
|
|||||
|
Other, net(6)
|
6.2
|
|
2.0
|
|
(0.8
|
)
|
|||||
|
Other income (expense), net
|
$
|
(90.3
|
)
|
$
|
(11.0
|
)
|
$
|
43.9
|
|
||
|
(1)
|
See Note 14, "Debt" for further discussion.
|
|
(2)
|
In connection with the Acquisition, we used the proceeds from our issuance of the
$1.9 billion
senior notes to purchase Euros in the second quarter of 2012. As a result of a negative foreign exchange movement between the Euro and USD prior to using these proceeds to fund the Acquisition, we realized a foreign exchange loss on our Euro cash holdings.
|
92
|
(3)
|
During
2010
, we settled the majority of our Foster's Group Limited's ("Foster's") (ASX:FGL) total return swaps, which we used to gain an economic interest exposure to Foster's stock, and related option contracts, which we used to limit our exposure to future changes in Foster's stock price. The remaining total return swaps and related options matured in January of
2011
.
|
|
(4)
|
Included in this amount is
$23.8 million
of losses for 2012 related to foreign currency movements on foreign-denominated financing instruments entered into in conjunction with the financing and the closing of the Acquisition. See Note 14, "Debt" for further discussion of financing activities related to the Acquisition.
|
|
(5)
|
See Note 18, "Derivative Instruments and Hedging Activities" under "Cross Currency Swaps" sub-heading for further discussion.
|
|
(6)
|
Included in this amount is a
$5.2 million
gain related to the sale of water rights in 2012. This also includes gains of
$1.0 million
in
2011
and
$0.5 million
in
2010
related to sales of non-core real estate to related but unconsolidated parties. During
2010
, we sold the historic Coors family home in Golden, Colorado, to the Adolph Coors Company LLC for
$0.5 million
. During
2011
, we sold non-core real estate in Golden to MillerCoors for
$1.0 million
. The selling price in both instances was based on a market appraisal by an independent third party.
|
8. Income Tax
Our income (loss) from continuing operations before income taxes on which the provision for income taxes was computed is as follows:
|
|
For the years ended
|
||||||||||
|
|
December 29, 2012
|
December 31, 2011
|
December 25, 2010
|
||||||||
|
|
(In millions)
|
||||||||||
|
Domestic
|
$
|
712.8
|
|
$
|
767.2
|
|
$
|
779.3
|
|
||
|
Foreign
|
(120.7
|
)
|
7.0
|
|
29.7
|
|
|||||
|
Total
|
$
|
592.1
|
|
$
|
774.2
|
|
$
|
809.0
|
|
||
Income tax expense (benefit) includes the following current and deferred provisions:
|
|
For the years ended
|
||||||||||
|
|
December 29, 2012
|
December 31, 2011(1)
|
December 25, 2010
|
||||||||
|
|
(In millions)
|
||||||||||
|
Current:
|
|
|
|
||||||||
|
Federal
|
$
|
45.5
|
|
$
|
29.8
|
|
$
|
7.4
|
|
||
|
State
|
8.3
|
|
5.7
|
|
24.6
|
|
|||||
|
Foreign
|
28.2
|
|
25.0
|
|
38.7
|
|
|||||
|
Total current tax expense (benefit)
|
$
|
82.0
|
|
$
|
60.5
|
|
$
|
70.7
|
|
||
|
Deferred:
|
|
|
|
||||||||
|
Federal
|
$
|
47.9
|
|
$
|
58.8
|
|
$
|
87.0
|
|
||
|
State
|
6.3
|
|
2.1
|
|
5.2
|
|
|||||
|
Foreign
|
18.3
|
|
(22.0
|
)
|
(24.2
|
)
|
|||||
|
Total deferred tax expense (benefit)
|
$
|
72.5
|
|
$
|
38.9
|
|
$
|
68.0
|
|
||
|
Total income tax expense (benefit) from continuing operations
|
$
|
154.5
|
|
$
|
99.4
|
|
$
|
138.7
|
|
||
|
(1)
|
Our deferred tax expense and current tax expense for the year ended December 31, 2011, have been adjusted to reflect the correction of an immaterial misclassification within this table of
$16.6 million
.
|
93
Our income tax expense varies from the amount expected by applying the statutory federal corporate tax rate to income as follows:
|
|
For the years ended
|
|||||||
|
|
December 29, 2012
|
December 31, 2011
|
December 25, 2010
|
|||||
|
Statutory Federal income tax rate
|
35.0
|
%
|
35.0
|
%
|
35.0
|
%
|
||
|
State income taxes, net of federal benefits
|
1.4
|
%
|
1.6
|
%
|
2.0
|
%
|
||
|
Effect of foreign tax rates(1)
|
(24.5
|
)%
|
(21.4
|
)%
|
(20.2
|
)%
|
||
|
Effect of foreign tax law and rate changes(2)
|
6.8
|
%
|
(0.4
|
)%
|
0.7
|
%
|
||
|
Effect of unrecognized tax benefits
|
(0.7
|
)%
|
(1.1
|
)%
|
0.8
|
%
|
||
|
Change in valuation allowance(3)
|
6.0
|
%
|
—
|
%
|
—
|
%
|
||
|
Other, net
|
2.1
|
%
|
(0.9
|
)%
|
(1.2
|
)%
|
||
|
Effective tax rate
|
26.1
|
%
|
12.8
|
%
|
17.1
|
%
|
||
|
(1)
|
Our effective tax rates were significantly lower than the federal statutory rate of
35%
primarily due to the impact of lower statutory income tax rates applicable to our foreign businesses. In addition, as part of the Acquisition, the statutory tax rates in the countries of Central Europe, ranging from
9%
to
20%
, in which we began doing business drove the 2012 change in the effect of foreign tax rates versus 2011 and 2010.
|
|
(2)
|
Primarily relates to the increased statutory corporate income tax rate in Serbia from
10%
to
15%
, effective January 1, 2013. As a result of the impact of the rate change on differences between the book basis and tax basis of intangible and other assets purchased in the Acquisition, we increased our deferred tax liability by
$38.3 million
in the fourth quarter of 2012.
|
|
(3)
|
We recorded additional tax expense in 2012 due to increases in our valuation allowance related to capital loss carryforwards and operating losses in several of our jurisdictions. See further discussion below.
|
The table below summarizes our deferred tax assets and liabilities:
|
|
As of
|
||||||
|
|
December 29, 2012
|
December 31, 2011
|
|||||
|
|
(In millions)
|
||||||
|
Current deferred tax assets:
|
|
|
|||||
|
Compensation related obligations
|
$
|
2.9
|
|
$
|
3.5
|
|
|
|
Accrued liabilities and other
|
53.5
|
|
47.3
|
|
|||
|
Tax loss carryforwards
|
6.1
|
|
—
|
|
|||
|
Valuation allowance
|
(20.2
|
)
|
(6.1
|
)
|
|||
|
Other
|
0.6
|
|
2.2
|
|
|||
|
Total current deferred tax assets
|
$
|
42.9
|
|
$
|
46.9
|
|
|
|
Current deferred tax liabilities:
|
|
|
|||||
|
Partnership investments
|
151.6
|
|
192.6
|
|
|||
|
Balance sheet reserves and accruals
|
4.5
|
|
4.0
|
|
|||
|
Other
|
(0.1
|
)
|
—
|
|
|||
|
Total current deferred tax liabilities
|
$
|
156.0
|
|
$
|
196.6
|
|
|
|
Net current deferred tax assets(1)
|
—
|
|
—
|
|
|||
|
Net current deferred tax liabilities(1)
|
$
|
113.1
|
|
$
|
149.7
|
|
|
94
|
|
As of
|
||||||
|
|
December 29, 2012
|
December 31, 2011
|
|||||
|
|
(In millions)
|
||||||
|
Non-current deferred tax assets:
|
|
|
|||||
|
Compensation related obligations
|
$
|
13.3
|
|
$
|
12.7
|
|
|
|
Postretirement benefits
|
209.6
|
|
191.5
|
|
|||
|
Foreign exchange losses
|
119.5
|
|
152.0
|
|
|||
|
Convertible debt
|
0.4
|
|
1.0
|
|
|||
|
Hedging
|
9.4
|
|
—
|
|
|||
|
Tax loss carryforwards
|
110.9
|
|
32.5
|
|
|||
|
Intercompany financing
|
8.4
|
|
13.2
|
|
|||
|
Partnership investments
|
12.2
|
|
13.1
|
|
|||
|
Accrued liabilities and other
|
19.3
|
|
22.2
|
|
|||
|
Other(2)
|
19.6
|
|
—
|
|
|||
|
Valuation allowance
|
(137.3
|
)
|
(22.9
|
)
|
|||
|
Total non-current deferred tax assets
|
$
|
385.3
|
|
$
|
415.3
|
|
|
|
Non-current deferred tax liabilities:
|
|
|
|||||
|
Fixed assets
|
132.6
|
|
117.8
|
|
|||
|
Partnership investments
|
39.6
|
|
19.8
|
|
|||
|
Intangibles
|
1,028.7
|
|
579.5
|
|
|||
|
Other
|
7.5
|
|
3.9
|
|
|||
|
Total non-current deferred tax liabilities
|
$
|
1,208.4
|
|
$
|
721.0
|
|
|
|
Net non-current deferred tax assets(1)
|
—
|
|
—
|
|
|||
|
Net non-current deferred tax liabilities(1)
|
$
|
823.1
|
|
$
|
305.7
|
|
|
|
(1)
|
Our net deferred tax assets and liabilities are presented in the table below.
|
|
(2)
|
Primarily relates to certain capitalized costs related to the Acquisition as of December 29, 2012. These capitalized costs are amortized over different periods for book and tax purposes, giving rise to differences in book basis and tax basis in 2012.
|
The following table presents our deferred tax assets and liabilities on a net basis:
|
|
As of
|
||||||
|
|
December 29, 2012
|
December 31, 2011
|
|||||
|
|
(In millions)
|
||||||
|
Domestic net current deferred tax liabilities
|
$
|
152.3
|
|
$
|
161.3
|
|
|
|
Foreign net current deferred tax assets
|
39.2
|
|
11.6
|
|
|||
|
Net current deferred tax liabilities
|
$
|
113.1
|
|
$
|
149.7
|
|
|
|
Domestic net non-current deferred tax assets
|
$
|
125.4
|
|
$
|
149.9
|
|
|
|
Foreign net non-current deferred tax liabilities
|
948.5
|
|
455.6
|
|
|||
|
Net non-current deferred tax liabilities
|
$
|
823.1
|
|
$
|
305.7
|
|
|
We have deferred tax assets for U.S. tax loss carryforwards that expire between
2013
and
2029
of
$13.0 million
and
$4.8 million
as of
December 29, 2012
, and
December 31, 2011
, respectively. We have foreign loss carryforwards that expire between
2013
and
2032
of
$109.1 million
and
$27.8 million
as of
December 29, 2012
, and
December 31, 2011
, respectively. We have foreign loss carryforwards that do not expire of
$9.3 million
and
$8.2 million
as of
December 29, 2012
, and
December 31, 2011
, respectively. The measurement of deferred tax assets is reduced by a valuation allowance if, based upon available evidence, it is more likely than not that the deferred tax assets will not be realized. Our valuation allowance was
$157.5 million
and
$29.0 million
as of
December 29, 2012
, and
December 31, 2011
, respectively. The valuation allowance increase in fiscal 2012 was primarily due to the addition of valued deferred tax assets taken on as part of the Acquisition, losses in the normal course of business in foreign jurisdictions and a capital loss generated in the U.S. related to the impairment loss
95
recognized in our MC Si'hai joint venture in China. See Note 3 "Acquisition of StarBev" and Note 5 "Investments" for further discussion.
A reconciliation of the beginning and ending amount of unrecognized tax benefits excluding interest and penalties is as follows:
|
|
For the years ended
|
||||||||||
|
|
December 29, 2012
|
December 31, 2011
|
December 25, 2010
|
||||||||
|
|
(In millions)
|
||||||||||
|
Balance at beginning of year
|
$
|
70.7
|
|
$
|
84.9
|
|
$
|
72.3
|
|
||
|
Additions for tax positions related to the current year
|
9.9
|
|
9.6
|
|
6.9
|
|
|||||
|
Additions for tax positions of prior years
|
8.6
|
|
4.3
|
|
6.5
|
|
|||||
|
Reductions for tax positions of prior years
|
(0.1
|
)
|
(0.1
|
)
|
(1.0
|
)
|
|||||
|
Settlements
|
(0.9
|
)
|
(1.5
|
)
|
(0.8
|
)
|
|||||
|
Release due to statute expiration
|
(14.4
|
)
|
(25.6
|
)
|
(1.6
|
)
|
|||||
|
Foreign currency adjustment
|
1.7
|
|
(0.9
|
)
|
2.6
|
|
|||||
|
Balance at end of year
|
$
|
75.5
|
|
$
|
70.7
|
|
$
|
84.9
|
|
||
Annual tax provisions include amounts considered sufficient to pay assessments that may result from examination of prior year tax returns; however, the amount ultimately paid upon resolution of issues may differ materially from the amount accrued. During 2013, we do not expect any significant increases or decreases to unrecognized tax benefits. Estimated interest and penalty payments of
$8.5 million
and
$8.6 million
were accrued in unrecognized tax benefits as of
December 29, 2012
and
December 31, 2011
, respectively. We recognized an income tax benefit of
$0.1 million
and income tax expense of
$0.3 million
for the net decrease and net increase in interest and penalties on unrecognized tax benefits during the fiscal years ended 2012 and 2011, respectively. In addition, as of both
December 29, 2012
and
December 31, 2011
, we had offsetting positions of
$1.9 million
recorded against unrecognized tax benefits. Our total balance for unrecognized tax benefits was
$82.1 million
as of
December 29, 2012
, of which
$0.3 million
was current and included in accrued expenses and other liabilities and
$81.8 million
was non-current, and
$77.4 million
as of
December 31, 2011
, of which
$1.0 million
was current and included in accrued expenses and other liabilities and
$76.4 million
was non-current.
We file income tax returns in most of the federal, state, and provincial jurisdictions in the U.S., U.K., Canada and various countries in Central Europe. Tax years through 2006 are closed in the U.S., while exam years 2007 and 2008 have been effectively settled and only remain open pending finalization of an advanced pricing agreement. In Canada, tax years through fiscal year ended 2007 are closed or have been effectively settled through examination except for issues relating to an intercompany transaction. Tax years through 2008 are closed or have been effectively settled through examination in the U.K. Tax years through fiscal year 2004 are closed for most countries in Central European jurisdictions with statutes of limitations varying from
3
-
7
years.
We treat our portion of all foreign subsidiary earnings through
December 29, 2012
, as permanently reinvested under the accounting guidance and accordingly, have not provided any U.S. federal or state tax thereon. As of
December 29, 2012
, approximately
$906.0 million
of retained earnings attributable to foreign subsidiaries was considered to be indefinitely invested. Our intention is to reinvest the earnings permanently or to repatriate the earnings when it is tax efficient to do so. It is not practicable to determine the amount of incremental taxes that might arise were these earnings to be remitted. However, we believe that U.S. foreign tax credits would largely eliminate any U.S. taxes and offset any foreign withholding taxes due on remittance.
96
9. Special Items
We have incurred charges or gains that we do not believe to be indicative of our core operations. As such, we have separately classified these costs as special items. The table below summarizes special items recorded by segment:
|
|
For the years ended
|
||||||||||
|
|
December 29, 2012
|
December 31, 2011
|
December 25, 2010
|
||||||||
|
|
(In millions)
|
||||||||||
|
Employee-related charges
|
|||||||||||
|
Restructuring(1)
|
|||||||||||
|
Canada
|
$
|
10.1
|
|
$
|
0.6
|
|
$
|
1.0
|
|
||
|
Central Europe
|
2.0
|
|
—
|
|
—
|
|
|||||
|
U.K.
|
17.8
|
|
2.1
|
|
2.6
|
|
|||||
|
MCI
|
3.0
|
|
—
|
|
—
|
|
|||||
|
Corporate
|
2.0
|
|
—
|
|
—
|
|
|||||
|
Other atypical employee-related costs
|
|||||||||||
|
Canada(2)
|
5.0
|
|
5.2
|
|
3.2
|
|
|||||
|
Impairments or asset abandonment charges
|
|||||||||||
|
Canada - Software abandonment(3)
|
—
|
|
—
|
|
12.8
|
|
|||||
|
U.K. - Asset abandonment(4)
|
7.2
|
|
—
|
|
—
|
|
|||||
|
MCI - China impairment and related costs(5)
|
39.2
|
|
—
|
|
—
|
|
|||||
|
Unusual or infrequent items
|
|||||||||||
|
Canada - Flood insurance loss (reimbursement)(6)
|
(1.4
|
)
|
0.2
|
|
—
|
|
|||||
|
Canada - BRI loan guarantee adjustment(7)
|
—
|
|
(2.0
|
)
|
—
|
|
|||||
|
Canada - Fixed asset adjustment(8)
|
—
|
|
7.6
|
|
—
|
|
|||||
|
U.K. - Release of non-income-related tax reserve(9)
|
(3.5
|
)
|
(2.3
|
)
|
0.4
|
|
|||||
|
U.K. - Costs associated with strategic initiatives
|
—
|
|
(0.1
|
)
|
0.1
|
|
|||||
|
MCI - Costs associated with outsourcing and other strategic initiatives
|
—
|
|
1.0
|
|
1.1
|
|
|||||
|
Corporate - Costs associated with other strategic initiatives
|
—
|
|
—
|
|
0.1
|
|
|||||
|
Total Special items, net
|
$
|
81.4
|
|
$
|
12.3
|
|
$
|
21.3
|
|
||
|
(1)
|
During
2012
, we recognized expenses associated with restructuring programs in each of our segments focused on labor savings and organizational effectiveness across all functions. As a result, we have reduced headcount by approximately
600
employees. During
2011
and
2010
, we recognized expenses associated with the employee terminations at the Montréal and Edmonton breweries and employee termination costs related to U.K. supply chain restructuring activity.
|
|
(2)
|
During
2012
,
2011
and
2010
, we recognized charges for pension curtailment and special termination benefits related to certain defined benefit pension plans in Canada. See Note 17 "Employee Retirement Plans and Postretirement Benefits" for impact to our defined benefit pension plans.
|
|
(3)
|
During
2010
, a capital asset write-off and associated costs were recorded related to the abandonment of sales support software, which had been under development, as a result of a change in strategic direction relative to the use of the software.
|
|
(4)
|
During the second quarter of 2012, we recognized an asset abandonment charge related to the discontinuation of the Home Draft packaging in the U.K. This packaging was not meeting expectations and as a result, we recognized a loss related to the write-off of the Home Draft packaging line, tooling equipment and packaging materials inventory.
|
|
(5)
|
In the second quarter of 2012, we recognized impairment charges of
$10.4 million
related to goodwill and definite-lived intangible assets in our MC Si'hai joint venture in China. See related detail in Note 13 "Goodwill and Intangible Assets." In the third quarter of 2012, we deconsolidated our MC Si'hai joint venture in China and recognized an
|
97
impairment loss of
$27.6 million
upon deconsolidation. During the second half of 2012, we recognized
$1.2 million
of costs related to the deconsolidation. See related detail in Note 5, "Investments."
|
(6)
|
During
2012
, we received insurance proceeds in excess of expenses incurred related to flood damages at our Toronto offices. During
2011
, we incurred expenses in excess of insurance proceeds related to these damages.
|
|
(7)
|
During the second quarter of
2011
, we recognized a
$2.0 million
gain resulting from a reduction of our guarantee of BRI debt obligations.
|
|
(8)
|
During the second quarter of
2011
, we recognized a
$7.6 million
loss related to the correction of an immaterial error in prior periods in the Canada segment, resulting from the performance of a fixed asset count that reduced properties by
$13.9 million
in 2011. The adjustment also resulted in an increase to goodwill of
$6.3 million
for the assets identified as not present as of the Merger date. The impact of the error and the related correction in
2011
was not material to any prior annual or interim financial statements and was not material to the fiscal year results for
2011
.
|
|
(9)
|
During
2009
, we established a non-income-related tax reserve of
$10.4 million
that was recorded as a special item. Our estimates indicated a range of possible loss relative to this reserve of
zero
to
$22.3 million
, inclusive of potential penalties and interest. The amounts recorded in
2012
and
2011
represent a release of a portion of this reserve as a result of a change in estimate.
|
The table below summarizes the activity in the restructuring accruals by segment:
|
Canada
|
Central Europe
|
U.K.
|
MCI
|
Corporate
|
Total
|
||||||||||||||||||
|
(In millions)
|
|||||||||||||||||||||||
|
Balance at December 25, 2010
|
$
|
0.2
|
|
$
|
—
|
|
$
|
2.2
|
|
$
|
—
|
|
$
|
—
|
|
$
|
2.4
|
|
|||||
|
Charges incurred
|
0.1
|
|
—
|
|
2.6
|
|
—
|
|
—
|
|
2.7
|
|
|||||||||||
|
Payments made
|
(0.5
|
)
|
—
|
|
(2.6
|
)
|
—
|
|
—
|
|
(3.1
|
)
|
|||||||||||
|
Foreign currency and other adjustments
|
0.3
|
|
—
|
|
(0.4
|
)
|
—
|
|
—
|
|
(0.1
|
)
|
|||||||||||
|
Balance at December 31, 2011
|
$
|
0.1
|
|
$
|
—
|
|
$
|
1.8
|
|
$
|
—
|
|
$
|
—
|
|
$
|
1.9
|
|
|||||
|
Charges incurred
|
10.1
|
|
2.0
|
|
17.8
|
|
3.0
|
|
2.0
|
|
34.9
|
|
|||||||||||
|
Payments made
|
(2.9
|
)
|
(1.4
|
)
|
(6.6
|
)
|
(0.2
|
)
|
(0.5
|
)
|
(11.6
|
)
|
|||||||||||
|
Foreign currency and other adjustments
|
(0.2
|
)
|
—
|
|
(0.2
|
)
|
—
|
|
—
|
|
(0.4
|
)
|
|||||||||||
|
Balance at December 29, 2012
|
$
|
7.1
|
|
$
|
0.6
|
|
$
|
12.8
|
|
$
|
2.8
|
|
$
|
1.5
|
|
$
|
24.8
|
|
|||||
10. Stockholders' Equity
Changes to the number of shares of capital stock issued were as follows:
|
|
Common stock
issued
|
Exchangeable
shares issued
|
|||||||||
|
|
Class A
|
Class B(1)
|
Class A
|
Class B
|
|||||||
|
|
(Share amounts in millions)
|
||||||||||
|
Balance at December 26, 2009
|
2.6
|
|
159.4
|
|
3.2
|
|
20.2
|
|
|||
|
Shares issued under equity compensation plans
|
—
|
|
1.4
|
|
—
|
|
—
|
|
|||
|
Shares exchanged for common stock
|
—
|
|
1.2
|
|
(0.2
|
)
|
(1.0
|
)
|
|||
|
Balance at December 25, 2010
|
2.6
|
|
162.0
|
|
3.0
|
|
19.2
|
|
|||
|
Shares issued under equity compensation plans
|
—
|
|
0.7
|
|
—
|
|
—
|
|
|||
|
Shares exchanged for Class B exchangeable shares
|
—
|
|
—
|
|
(0.1
|
)
|
0.1
|
|
|||
|
Balance at December 31, 2011
|
2.6
|
|
162.7
|
|
2.9
|
|
19.3
|
|
|||
|
Shares issued under equity compensation plans
|
—
|
|
1.5
|
|
—
|
|
—
|
|
|||
|
Balance at December 29, 2012
|
2.6
|
|
164.2
|
|
2.9
|
|
19.3
|
|
|||
98
|
(1)
|
During 2011, we repurchased Class B common shares which results in a lower number of outstanding shares compared to issued shares. See "Share Repurchase Program" below for further discussion. For all other classes, issued shares equal outstanding shares.
|
Exchangeable Shares
The Class A exchangeable shares and Class B exchangeable shares were issued by Molson Coors Canada Inc. ("MCCI") a wholly-owned subsidiary. The exchangeable shares are substantially the economic equivalent of the corresponding shares of Class A and Class B common stock that a Molson shareholder would have received in the Merger if the holder had elected to receive shares of Molson Coors common stock. Holders of exchangeable shares also receive, through a voting trust, the benefit of Molson Coors voting rights, entitling the holder to
one
vote on the same basis and in the same circumstances as one corresponding share of Molson Coors common stock.
Voting Rights
Each holder of record of Class A common stock, Class B common stock, Class A exchangeable shares and Class B exchangeable shares is entitled to one vote for each share held, without the ability to cumulate votes on the election of directors.
Conversion Rights
The Certificate of Incorporation provides for the right of holders of Class A common stock to convert their stock into Class B common stock on a one-for-one basis at any time. The exchangeable shares are exchangeable at any time, at the option of the holder on a one-for-one basis for corresponding shares of Molson Coors common stock.
Share Repurchase Program
In 2011, the Board of Directors authorized a program to repurchase up to
$1.2 billion
of outstanding shares of Class A and Class B common stock in the open market or in privately negotiated transactions over an expected term of
3
years. We have purchased a total of
7.5 million
shares of our Class B common stock under the share repurchase program as of
December 29, 2012
, for
$321.1 million
. There were no repurchases in 2012.
99
11. Earnings Per Share
Basic net income per share was computed using the weighted-average number of shares of common stock outstanding during the period. Diluted net income per share includes the additional dilutive effect of our potentially dilutive securities, which includes stock options ("options"), stock-only stock appreciation rights ("SOSARs"), restricted stock units ("RSUs"), performance units ("PUs") and deferred stock units ("DSUs"). The dilutive effects of our potentially dilutive securities are calculated using the treasury stock method. Diluted income per share could also be impacted by our convertible debt and related warrants outstanding to the extent dilutive. The following summarizes the effect of dilutive securities on diluted EPS:
|
|
For the years ended
|
||||||||||
|
|
December 29, 2012
|
December 31, 2011
|
December 25, 2010
|
||||||||
|
|
(In millions, except per share amounts)
|
||||||||||
|
Amount attributable to MCBC
|
|||||||||||
|
Net income (loss) from continuing operations
|
$
|
441.5
|
|
$
|
674.0
|
|
$
|
668.1
|
|
||
|
Income (loss) from discontinued operations, net of tax
|
1.5
|
|
2.3
|
|
39.6
|
|
|||||
|
Net income (loss) attributable to MCBC
|
$
|
443.0
|
|
$
|
676.3
|
|
$
|
707.7
|
|
||
|
Weighted-average shares for basic EPS
|
180.8
|
|
184.9
|
|
185.9
|
|
|||||
|
Effect of dilutive securities:
|
|
|
|
||||||||
|
Options and SOSARs
|
0.5
|
|
0.9
|
|
0.9
|
|
|||||
|
RSUs, PUs and DSUs
|
0.5
|
|
0.6
|
|
0.5
|
|
|||||
|
Weighted-average shares for diluted EPS
|
181.8
|
|
186.4
|
|
187.3
|
|
|||||
|
Basic net income (loss) per share:
|
|
|
|
||||||||
|
Continuing operations attributable to MCBC
|
$
|
2.44
|
|
$
|
3.65
|
|
$
|
3.59
|
|
||
|
Discontinued operations attributable to MCBC
|
0.01
|
|
0.01
|
|
0.21
|
|
|||||
|
Basic net income (loss) attributable to MCBC
|
$
|
2.45
|
|
$
|
3.66
|
|
$
|
3.80
|
|
||
|
Diluted net income (loss) per share:
|
|
|
|
||||||||
|
Continuing operations attributable to MCBC
|
$
|
2.43
|
|
$
|
3.62
|
|
$
|
3.57
|
|
||
|
Discontinued operations attributable to MCBC
|
0.01
|
|
0.01
|
|
0.21
|
|
|||||
|
Diluted net income (loss) attributable to MCBC
|
$
|
2.44
|
|
$
|
3.63
|
|
$
|
3.78
|
|
||
|
Dividends declared and paid per share
|
$
|
1.28
|
|
$
|
1.24
|
|
$
|
1.08
|
|
||
Our calculation of weighted-average shares includes Class A common stock and Class B common stock, and Class A exchangeable shares and Class B exchangeable shares. All classes of stock have in effect the same dividend rights and share equitably in undistributed earnings. Holders of Class A common stock receive dividends only to the extent dividends are declared and paid to holders of Class B common stock. See Note 10, "Stockholders' Equity," for further discussion of the Class A common stock and Class B common stock and Class A exchangeable shares and Class B exchangeable shares.
The following anti-dilutive securities were excluded from the computation of the effect of dilutive securities on diluted earnings per share:
|
|
For the years ended
|
|||||||
|
|
December 29, 2012
|
December 31, 2011
|
December 25, 2010
|
|||||
|
|
(In millions)
|
|||||||
|
Options, SOSARs and RSUs(1)
|
1.5
|
|
0.9
|
|
0.7
|
|
||
|
Shares of Class B common stock issuable upon assumed conversion of the 2.5% Convertible Senior Notes(2)
|
10.9
|
|
10.8
|
|
10.5
|
|
||
|
Warrants to issue shares of Class B common stock(2)
|
10.9
|
|
10.8
|
|
10.5
|
|
||
|
Shares of Class B common stock issuable upon assumed conversion of the €500 million Convertible Note(3)
|
1.1
|
|
—
|
|
—
|
|
||
|
Total anti-dilutive securities
|
24.4
|
|
22.5
|
|
21.7
|
|
||
100
|
(1)
|
Exercise prices exceed the average market price of the common shares or are anti-dilutive due to the impact of the unrecognized compensation cost on the calculation of assumed proceeds in the application of the treasury stock method.
|
|
(2)
|
In June 2007, we issued
$575 million
of senior convertible notes due July 2013. The impact of a net share settlement of the conversion amount at maturity will begin to dilute earnings per share if and when our stock price reaches
$52.18
. The impact of stock that could be issued to settle share obligations we could have under the warrants we issued simultaneously with the senior convertible notes issuance will begin to dilute earnings per share when our stock price reaches
$66.79
. The potential receipt of MCBC stock from counterparties under our purchased call options when and if our stock price is between
$52.18
and
$66.79
would be anti-dilutive and excluded from any calculations of earnings per share.
|
|
(3)
|
Upon closing of the Acquisition in June 2012, we issued a
€500 million
Zero Coupon Senior Unsecured Convertible Note due 2013 to the Seller. The impact of a net share settlement of the conversion amount at maturity will begin to dilute earnings per share if and when our stock price reaches
$51.25
based on foreign exchange rates at
December 29, 2012
. See further discussion in Note 14, "Debt."
|
We have no outstanding equity share awards that contain non-forfeitable rights to dividends on unvested shares.
12. Properties
The cost of properties and related accumulated depreciation consists of the following:
|
|
As of
|
||||||
|
|
December 29, 2012
|
December 31, 2011
|
|||||
|
|
(In millions)
|
||||||
|
Land and improvements
|
$
|
190.4
|
|
$
|
105.4
|
|
|
|
Buildings and improvements
|
485.5
|
|
351.9
|
|
|||
|
Machinery and equipment
|
1,700.3
|
|
1,259.6
|
|
|||
|
Returnable containers
|
285.6
|
|
203.2
|
|
|||
|
Furniture and fixtures
|
323.9
|
|
277.4
|
|
|||
|
Software
|
109.7
|
|
112.0
|
|
|||
|
Natural resource properties
|
3.0
|
|
3.0
|
|
|||
|
Construction in progress
|
122.1
|
|
137.7
|
|
|||
|
Total properties cost
|
3,220.5
|
|
2,450.2
|
|
|||
|
Less: accumulated depreciation
|
(1,224.6
|
)
|
(1,020.1
|
)
|
|||
|
Net properties
|
$
|
1,995.9
|
|
$
|
1,430.1
|
|
|
Properties increased as a result of the Acquisition. See Note 3 "Acquisition of StarBev" for further discussion.
Depreciation expense was
$230.3 million
,
$177.0 million
and
$159.6 million
for fiscal years
2012
,
2011
and
2010
, respectively. Loss and breakage expense related to our returnable containers, included in the depreciation expense amounts noted above, was
$45.3 million
,
$33.7 million
and
$31.2 million
for fiscal years
2012
,
2011
and
2010
, respectively, and is classified within cost of goods sold in the consolidated statements of operations.
101
13. Goodwill and Intangible Assets
The following summarizes the changes in goodwill:
|
Canada
|
Central Europe
|
U.K.
|
MCI
|
Consolidated
|
|||||||||||||||
|
(In millions)
|
|||||||||||||||||||
|
Balance at December 25, 2010
|
$
|
748.6
|
|
$
|
—
|
|
$
|
731.4
|
|
$
|
9.1
|
|
$
|
1,489.1
|
|
||||
|
Business acquisition
|
—
|
|
—
|
|
10.2
|
|
9.5
|
|
19.7
|
|
|||||||||
|
Foreign currency translation
|
(9.7
|
)
|
—
|
|
4.5
|
|
(0.9
|
)
|
(6.1
|
)
|
|||||||||
|
Historical corrections(1)
|
(49.4
|
)
|
—
|
|
—
|
|
—
|
|
(49.4
|
)
|
|||||||||
|
Balance at December 31, 2011
|
689.5
|
|
—
|
|
746.1
|
|
17.7
|
|
1,453.3
|
|
|||||||||
|
Business acquisition(2)
|
57.8
|
|
765.4
|
|
88.3
|
|
—
|
|
911.5
|
|
|||||||||
|
Impairment related to China reporting unit
|
—
|
|
—
|
|
—
|
|
(9.5
|
)
|
(9.5
|
)
|
|||||||||
|
Foreign currency translation
|
16.7
|
|
52.3
|
|
28.8
|
|
(0.4
|
)
|
97.4
|
|
|||||||||
|
Purchase price adjustment
|
—
|
|
—
|
|
—
|
|
0.4
|
|
0.4
|
|
|||||||||
|
Balance at December 29, 2012
|
$
|
764.0
|
|
$
|
817.7
|
|
$
|
863.2
|
|
$
|
8.2
|
|
$
|
2,453.1
|
|
||||
|
(1)
|
As a result of the 2011 correction of an immaterial error in prior periods related to BRI, goodwill decreased
$55.7 million
. See Note 5, "Investments" under the "Brewers' Retail Inc." sub-heading for further discussion. In addition, as a result of a fixed asset count performed in Canada, goodwill was increased by
$6.3 million
for the assets identified as not present as of the Merger date. See Note 9, "Special Items," for further discussion.
|
|
(2)
|
On June 15, 2012, we completed the Acquisition. See Note 3, "Acquisition of StarBev" for further discussion. We have preliminarily assigned the majority of the goodwill to our Central Europe reporting unit with a portion allocated to the U.K. and Canada reporting units resulting from synergies. This allocation is subject to change as we finalize purchase accounting, which we expect to occur during the first half of 2013.
|
The following table presents details of our intangible assets, other than goodwill, as of
December 29, 2012
:
|
Useful life
|
Gross
|
Accumulated
amortization
|
Net
|
||||||||||
|
|
(Years)
|
(In millions)
|
|||||||||||
|
Intangible assets subject to amortization:
|
|
|
|
|
|||||||||
|
Brands(1)
|
3 - 40
|
$
|
480.6
|
|
$
|
(205.7
|
)
|
$
|
274.9
|
|
|||
|
Distribution rights
|
2 - 23
|
350.8
|
|
(255.0
|
)
|
95.8
|
|
||||||
|
Patents and technology and distribution channels
|
3 - 10
|
35.3
|
|
(31.1
|
)
|
4.2
|
|
||||||
|
Favorable contracts, land use rights and other(1)
|
2 - 42
|
13.6
|
|
(5.4
|
)
|
8.2
|
|
||||||
|
Intangible assets not subject to amortization:
|
|
|
|
|
|||||||||
|
Brands(1)
|
Indefinite
|
5,821.6
|
|
—
|
|
5,821.6
|
|
||||||
|
Distribution networks
|
Indefinite
|
1,014.7
|
|
—
|
|
1,014.7
|
|
||||||
|
Other
|
Indefinite
|
15.4
|
|
—
|
|
15.4
|
|
||||||
|
Total
|
|
$
|
7,732.0
|
|
$
|
(497.2
|
)
|
$
|
7,234.8
|
|
|||
|
(1)
|
Includes the preliminary fair values, using a foreign exchange rate at the date of Acquisition, of
$145.6 million
for brand intangibles with a
30
year useful life,
$2,281.0 million
, as adjusted in the second half of 2012, for brand intangibles with an indefinite-life and a preliminary fair value of a favorable supply contract and other intangibles of
$12.0 million
with a
2
year useful life as a result of the Acquisition. See Note 3, "Acquisition of StarBev" for total allocation of consideration.
|
102
The following table presents details of our intangible assets, other than goodwill, as of
December 31, 2011
:
|
Useful life
|
Gross
|
Accumulated
amortization
|
Net
|
||||||||||
|
|
(Years)
|
(In millions)
|
|||||||||||
|
Intangible assets subject to amortization:
|
|
|
|
|
|||||||||
|
Brands
|
3 - 40
|
$
|
316.9
|
|
$
|
(179.0
|
)
|
$
|
137.9
|
|
|||
|
Distribution rights
|
2 - 23
|
342.0
|
|
(234.0
|
)
|
108.0
|
|
||||||
|
Patents and technology and distribution channels
|
3 - 10
|
34.9
|
|
(28.9
|
)
|
6.0
|
|
||||||
|
Land use rights and other
|
2 - 42
|
6.5
|
|
(0.8
|
)
|
5.7
|
|
||||||
|
Intangible assets not subject to amortization:
|
|
|
|
|
|||||||||
|
Brands
|
Indefinite
|
3,322.4
|
|
—
|
|
3,322.4
|
|
||||||
|
Distribution networks
|
Indefinite
|
990.5
|
|
—
|
|
990.5
|
|
||||||
|
Other
|
Indefinite
|
15.5
|
|
—
|
|
15.5
|
|
||||||
|
Total
|
|
$
|
5,028.7
|
|
$
|
(442.7
|
)
|
$
|
4,586.0
|
|
|||
The changes in the gross carrying amounts of intangibles from
December 31, 2011
, to
December 29, 2012
, are primarily due to the Acquisition. See Note 3, "Acquisition of StarBev" for further discussion. Changes are also driven by the impact of foreign exchange rates, as a significant amount of intangibles are denominated in foreign currencies.
Based on foreign exchange rates as of
December 29, 2012
, the estimated future amortization expense of intangible assets is as follows:
|
Fiscal year
|
Amount
|
|||
|
|
(In millions)
|
|||
|
2013
|
$
|
47.9
|
|
|
|
2014
|
$
|
39.8
|
|
|
|
2015
|
$
|
37.1
|
|
|
|
2016
|
$
|
37.1
|
|
|
|
2017
|
$
|
23.0
|
|
|
Amortization expense of intangible assets was
$42.4 million
,
$40.1 million
, and
$42.7 million
for the years ended
December 29, 2012
,
December 31, 2011
, and
December 25, 2010
, respectively, and is presented within marketing, general and administrative expenses.
We completed the required annual impairment testing as of
July 1, 2012
, the first day of our fiscal third quarter, and concluded there were
no
impairments of goodwill or other indefinite-lived intangible assets. Given the timing of our Acquisition, the Central Europe reporting unit and the associated indefinite-lived intangibles were not part of our annual impairment testing. Additionally, we did not include the China reporting unit in our annual goodwill impairment testing as of
July 1, 2012
, as the entire goodwill balance was impaired and written off in the second quarter of
2012
.
Through our annual impairment testing of goodwill performed, we determined that the fair value of our U.K. and Canada reporting units were close to failing step one of the goodwill impairment test. The fair value of the U.K. reporting unit was estimated at approximately
7%
in excess of its carrying value (of which
$863.2 million
is goodwill as of
December 29, 2012
) and the fair value of the Canada reporting unit was estimated at approximately
15%
in excess of its carrying value (of which
$764.0 million
is goodwill as of
December 29, 2012
). The reporting units are therefore at risk of a future impairment in the event of significant unfavorable changes in the forecasted cash flows, terminal growth rates, market transaction multiples and/or weighted-average cost of capital utilized in the discounted cash flow analysis. For testing purposes, management's best estimates of the expected future results are the primary driver in determining the fair value. Current projections reflect challenging environments that have been adversely impacted by a weak economy across all industries, partially offset by anticipated cost savings and specific brand-building and innovation activities. Through our annual impairment testing of indefinite-lived intangibles, it was determined that the fair value of our
Molson
core brands were close to failing step one of the impairment test, with the fair value of the
Molson
core brands estimated at approximately
14%
in excess of its carrying value (of which
$3,063.8 million
is indefinite-lived intangibles as of
December 29, 2012
). The
Molson
core brands face similar risks and challenges as the Canada reporting unit, as described above. Additionally, our annual impairment testing of indefinite-lived
103
intangibles indicated that the
Carling
brand in the U.K. (of which
$324.8 million
is indefinite-lived intangible as of
December 29, 2012
) continues to have a fair value significantly in excess of its carrying value.
As of
December 29, 2012
, we had
$817.7 million
of goodwill and
$2,413.6 million
of indefinite-lived intangibles associated with our Central Europe reporting unit and Central Europe intangibles, primarily related to brands, respectively. Given the timing of our Acquisition, Central Europe and its indefinite-lived intangibles were not part of our annual impairment testing. In the second half of 2012, our Central Europe business, along with other European corporations across all industries, has been adversely impacted by the weak economy in Europe. If this continues, a future impairment charge may be required.
Fair value determinations require considerable judgment and are sensitive to changes in underlying assumptions and factors. As a result, there can be no assurance that the estimates and assumptions made for purposes of the annual goodwill impairment test will prove to be an accurate prediction of the future. Examples of events or circumstances that could reasonably be expected to negatively affect the underlying key assumptions and ultimately impact the estimated fair value of our U.K. and Canada reporting units and
Molson
core brands may include such items as: (i) a decrease in expected future cash flows, specifically, an increase in required pension contributions, a decrease in sales volume, unfavorable working capital changes and an inability to successfully achieve our cost savings targets, (ii) an economic recovery that significantly differs from our assumptions in timing and/or degree, (iii) volatility in the equity and debt markets which could result in a higher discount rate; and (iv) sensitivity to market transaction multiples.
While historical performance and current expectations have resulted in fair values of our reporting units in excess of carrying values, if our assumptions are not realized, it is possible that an impairment charge may need to be recorded in the future.
Since its inception, the performance of our MC Si'hai joint venture (which is included in our China reporting unit with our other operations in China) did not meet our expectations due to delays in executing its business plans. As a result, our 2011 impairment testing indicated that the fair value of our China reporting unit only exceeded its carrying value by
4%
. As part of the negotiations with our partner to resolve business difficulties and other issues affecting the joint venture, during the second quarter of 2012, we signed an agreement to acquire our partner's
49%
noncontrolling interest in the joint venture. As of the end of the second quarter of 2012, there had been a lack of progress by our partner in timely satisfying the closing conditions, as well as delays and obstacles in gaining government approval for the acquisition of the noncontrolling interest, including a court order in China which prevented our joint venture partner from transferring its equity interest to us. These developments, coupled with the impact of increased competitive pressures in China were the combined trigger to review the future cash flows for the reporting unit. The subsequent testing identified that the full amount of the goodwill was impaired, resulting in a charge of
$9.5 million
in the second quarter of 2012. We also recognized an impairment charge on the definite-lived brand and distribution rights intangible assets of
$0.9 million
in the second quarter of 2012. Both of these charges are classified as special items in our consolidated statements of operations. In addition, as a result of developments identified in the third quarter of 2012, we deconsolidated our MC Si'hai joint venture and recorded an impairment loss of
$27.6 million
upon deconsolidation. See Note 5, "Investments" for further discussion.
Regarding definite-lived intangibles, we continuously monitor the performance of the underlying asset for potential triggering events suggesting an impairment review should be performed. No such triggering events were identified in
2012
, except as noted above related to our China reporting unit. In addition, the recent litigation related to a licensing agreement with Miller in Canada, for which we have a definite-lived intangible asset with a carrying value of approximately
$70 million
as of December 29, 2012, could be at risk for possible future impairment. See Note 20, "Commitments and Contingencies" for further discussion.
104
Debt Obligations
Our total long-term borrowings as of
December 29, 2012
, and
December 31, 2011
, were composed of the following:
|
|
As of
|
||||||
|
|
December 29, 2012
|
December 31, 2011
|
|||||
|
|
(In millions)
|
||||||
|
Senior notes:
|
|
|
|||||
|
$850 million 6.375% notes due 2012(1)
|
$
|
—
|
|
$
|
44.6
|
|
|
|
$575 million 2.5% convertible notes due 2013(2)
|
575.0
|
|
575.0
|
|
|||
|
€500 million 0.0% convertible note due 2013(3)
|
668.7
|
|
—
|
|
|||
|
Canadian Dollar ("CAD") 900 million 5.0% notes due 2015(4)
|
902.7
|
|
881.2
|
|
|||
|
CAD 500 million 3.95% Series A notes due 2017(4)
|
501.5
|
|
489.6
|
|
|||
|
$300 million 2.0% notes due 2017(5)
|
300.0
|
|
—
|
|
|||
|
$500 million 3.5% notes due 2022(5)
|
500.0
|
|
—
|
|
|||
|
$1.1 billion 5.0% notes due 2042(5)
|
1,100.0
|
|
—
|
|
|||
|
€120 million term loan due 2016(6)
|
123.9
|
|
—
|
|
|||
|
Other long-term debt
|
0.5
|
|
—
|
|
|||
|
Credit facilities(7)
|
—
|
|
—
|
|
|||
|
Less: unamortized debt discounts(8)
|
(17.4
|
)
|
(30.8
|
)
|
|||
|
Total long-term debt (including current portion)
|
4,654.9
|
|
1,959.6
|
|
|||
|
Less: current portion of long-term debt
|
(1,232.4
|
)
|
(44.7
|
)
|
|||
|
Total long-term debt
|
$
|
3,422.5
|
|
$
|
1,914.9
|
|
|
|
Short-term borrowings
|
$
|
13.2
|
|
$
|
2.2
|
|
|
|
Current portion of long-term debt
|
1,232.4
|
|
44.7
|
|
|||
|
Current portion of long-term debt and short-term borrowings
|
$
|
1,245.6
|
|
$
|
46.9
|
|
|
|
(1)
|
During the second quarter of 2012, we repaid the remaining outstanding portion of our
$850 million
6.375%
10
-year notes that were due in May 2012.
|
|
(2)
|
On
June 15, 2007
, MCBC issued in a public offering
$575 million
of
2.5%
Convertible Senior Notes (the "Notes") payable semi-annually in arrears. The Notes are senior unsecured obligations and rank equal in rights of payment with all of our other senior unsecured debt and senior to all of our future subordinated debt. The Notes are guaranteed by MCBC and certain of our U.S. and Canadian subsidiaries. The Notes mature on
July 30, 2013
, unless earlier converted or terminated, subject to certain conditions, as noted below. The Notes contain certain customary anti-dilution and make-whole provisions to protect holders of the Notes as defined in the Indenture.
|
Holders had the option to surrender their Notes for conversion prior to the close of business on
January 30, 2013
, if any of the following conditions are satisfied:
|
•
|
during any calendar quarter, if the closing sales price of our Class B common stock for at least 20 trading days in the period of 30 consecutive trading days ending on the last trading day of the calendar quarter preceding the quarter in which the conversion occurs is more than 130% of the conversion price of the Notes in effect on that last trading day
;
|
|
•
|
during the ten consecutive trading day period following any five consecutive trading day period in which the trading price for the Notes for each such trading day was less than 95% of the closing sale price of our Class B common stock on such date multiplied by the then current conversion rate
; or
|
|
•
|
if we make certain significant distributions to holders of our Class B common stock, we enter into specified corporate transactions or our Class B common stock ceases to be approved for listing on the New York Stock Exchange and is not listed for trading purposes on a U.S. national securities exchange.
|
105
As none of the Notes were surrendered prior to January 30, 2013, the holders may now surrender their Notes for conversion any time prior to the close of business on the business day immediately preceding the maturity date regardless of whether any of the conditions listed above have been satisfied. Upon conversion of the Notes, holders of the Notes will receive the par value amount of each note in cash and the shares of our Class B common stock (subject to our right to deliver cash in lieu of all or a portion of those shares) in satisfaction of the conversion feature if, on the day of conversion, the MCBC stock price exceeds the conversion price. The original conversion price for each
$1,000
aggregate principal amount of notes was
$54.76
per share of our Class B common stock, which represented a
25%
premium above the stock price on the day of the issuance of the Notes and corresponded to the initial conversion ratio of
18.263
shares per each
$1,000
aggregate principal amount of notes. The conversion ratio and conversion price are subject to adjustments for certain events and provisions, as defined in the Indenture. As of
November 2012
, our conversion price and ratio are
$52.18
and
19.1662
shares respectively. If, upon conversion, the MCBC stock price is below the conversion price, adjusted as necessary, a cash payment for the par value amount of the Notes will be made. As of
December 29, 2012
, the convertible debt's if-converted value did not exceed the principal.
We initially accounted for the Notes pursuant to guidance pertaining to convertible bonds with issuer option to settle for cash upon conversion, that is, we did not separate and assign values to the conversion feature of the Notes but rather accounted for the entire agreement as one debt instrument as the conversion feature met the requirements of guidance pertaining to accounting for derivative financial instruments indexed to, and potentially settled in, a company's own stock. The amounts in the table above have been reduced by the unamortized discount related to our convertible debt in the amounts of
$10.8 million
and
$28.9 million
for the years ended
December 29, 2012
, and
December 31, 2011
, respectively, included in the unamortized debt discount balances above.
During the fiscal years
2012
,
2011
and
2010
, we incurred additional non-cash interest expense of
$18.1 million
,
$17.5 million
, and
$16.9 million
, respectively. The additional non-cash interest expense impact (net of tax) to net income per share was a decrease of
$0.06
,
$0.06
and
$0.06
for the fiscal years
2012
,
2011
and
2010
, respectively. We also incurred interest expense related to the
2.5%
coupon rate of
$14.4 million
,
$14.6 million
, and
$14.3 million
for the fiscal years
2012
,
2011
and
2010
, respectively. The combination of non-cash and cash interest resulted in an effective interest rate of
5.75%
,
5.90%
and
5.91%
for the fiscal years
2012
,
2011
and
2010
, respectively. We also expect to record additional non-cash interest expense of
$10.8 million
in 2013, representing the remaining amortization of the debt discount on the Notes and thereby increasing the carrying value of the long-term debt to its
$575 million
face value at maturity.
Convertible Note Hedge and Warrants:
In connection with the issuance of the Notes, we entered into a privately negotiated convertible note hedge transaction. The convertible note hedge (the "purchased call options") will cover up to approximately
10.8 million
shares of our Class B common stock. The purchased call options, if exercised by us, require the counterparty to deliver to us shares of Class B common stock adequate to meet our net share settlement obligations under the Notes and are expected to reduce the potential dilution to our Class B common stock to be issued upon conversion of the Notes, if any. Separately and concurrently, we also entered into warrant transactions with respect to our Class B common stock pursuant to which we may be required to issue to the counterparty up to approximately
10.8 million
shares of our Class B common stock. The warrant price is
$67.82
which represents a
60%
premium above the stock price on the date of the warrant transaction. The warrants expire on
February 20, 2014
.
We used a portion of the net proceeds from the issuance of the Notes to pay for the cost of the purchased call options, which was partially offset by the proceeds received from the warrant transaction, resulting in a net use of proceeds of approximately
$50 million
. The net cost of these transactions, net of tax, was recorded in the stockholders' equity section of the consolidated balance sheets.
The purchased call options and warrants are separate transactions entered into by us, and they are not part of the terms of the Notes and do not affect the holders' rights under the Notes.
|
(3)
|
On June 15, 2012, we issued a
€500 million
Zero
Coupon Senior Unsecured Convertible Note due
2013
(the ''Convertible Note'') to the Seller in conjunction with the closing of the Acquisition. The Convertible Note matures on December 31, 2013, and is a senior unsecured obligation guaranteed by MCBC. The Seller may exercise a put right with respect to the Convertible Note beginning on March 14, 2013, (the “First Redemption Date”) and ending on December 19, 2013, for the greater of the principal amount of the Convertible Note or the aggregate cash value of
12,894,044
shares of our Class B common stock, as adjusted for certain corporate events. The Convertible Note's embedded conversion feature was determined to meet the definition of a derivative required to be bifurcated and separately accounted for at fair value with changes in fair value recorded in earnings. At issuance, we recorded a
|
106
liability of
$15.2 million
related to the conversion feature. The Convertible Note was issued at a discount of
$1.3 million
, which will be recognized as interest expense over the period from issuance to the First Redemption Date.
The carrying value of the Convertible Note and fair value of the conversion feature at
December 29, 2012
, were
$660.4 million
and
$7.9 million
, respectively. We recognized an unrealized gain of
$7.3 million
during
2012
related to changes in the fair value of the conversion feature. We also recognized
$0.9 million
in non-cash interest expense related to amortization of the debt discount. The non-cash interest, excluding the change in fair value of the convertible feature, resulted in an effective interest rate of
0.25%
for 2012. See Note 18, "Derivative Instruments and Hedging Activities" for further discussion of the derivative.
|
(4)
|
During the third quarter 2005, Molson Coors Capital Finance ULC completed a CAD
900 million
private placement in Canada due September 22, 2015. Additionally, during the fourth quarter 2010, Molson Coors International LP completed a CAD
500 million
private placement in Canada due October 6, 2017. Prior to issuing the bonds, we entered into forward starting interest rate transactions for a portion of each Canadian offering. The bond forward transactions effectively established, in advance, the yield of the government of Canada bond rate over which the Company's private placement was priced. At the time of the private placement offerings and pricings, the government of Canada bond rates were trading at a yield lower than that locked in with the Company's interest rate locks. This resulted in a loss on the bond forward transactions of
$4.0 million
related to the CAD
900 million
bonds, and CAD
7.9 million
on the CAD
500 million
bonds. Per authoritative accounting guidance pertaining to derivatives and hedging, the losses are being amortized over the life of each respective Canadian issued private placement and will serve to increase our effective cost of borrowing compared to the stated coupon rates by
0.05%
and
0.23%
on the CAD
900 million
and CAD
500 million
bonds, respectively.
|
|
(5)
|
On May 3, 2012, we issued
$1.9 billion
of senior notes with portions maturing in
2017
,
2022
and
2042
. The
2017
senior notes were issued in an initial aggregate principal amount of
$300 million
at
2.0%
interest and will mature on May 1, 2017. The
2022
senior notes were issued in an initial aggregate principal amount of
$500 million
at
3.5%
interest and will mature on May 1, 2022. The
2042
senior notes were issued in an initial aggregate principal amount of
$1.1 billion
at
5.0%
interest and will mature on May 1, 2042. The issuance resulted in total proceeds to us, before expenses, of
$1,880.7 million
, net of underwriting fees and discounts of
$14.7 million
and
$4.6 million
, respectively. Total debt issuance costs capitalized in connection with these senior notes, including the
$14.7 million
of underwriting fees, are approximately
$18.0 million
and will be amortized over the life of the notes. The issuance adds a number of guarantors to these debt securities as well as to our existing senior obligations, pursuant to requirements of our existing senior debt obligation agreements. These new guarantors consist principally of the U.K. operating entity. See Note 21, "Supplemental Guarantor Information" for further discussion and guarantor financial information reflective of this change.
|
Concurrent with the announcement of the Acquisition, we entered into a bridge loan agreement, which we terminated upon the issuance of the
$1.9 billion
senior notes. In connection with the issuance and subsequent termination of the bridge loan, we incurred costs of
$13.0 million
recorded in other expense in the second quarter of 2012. See Note 7, "Other Income and Expense."
Our risk management policy prohibits speculating on specific events, including the direction of interest rates. In advance of our issuance of the
$1.9 billion
senior notes, we systematically removed a portion of our interest rate market risk by entering into Treasury Locks. This resulted in an increase in the certainty of our yield to maturity when issuing the notes. In the second quarter of 2012, we recognized a cash loss of
$39.2 million
on settlement of the Treasury Locks recorded in interest expense. See Note 18, "Derivative Instruments and Hedging Activities" for further discussion.
|
(6)
|
On April 3, 2012, we entered into a term loan agreement (the ''Term Loan Agreement'') that provides for a
4
-year term loan facility of
$300 million
, composed of
one
$150 million
borrowing and
one
Euro-denominated borrowing equal to
$150 million
at issuance (or
€120 million
borrowing) both of which were funded upon close of the Acquisition on June 15, 2012. The Term Loan Agreement requires quarterly principal repayments equal to
2.5%
of the initial principal obligation, which commenced on September 30, 2012, with the remaining
62.5%
principal balance due at the June 15, 2016 maturity date. The obligations under the Term Loan Agreement are our general unsecured obligations. The Term Loan Agreement contains customary events of default, specified representations and warranties and covenants, including, among other things, covenants that limit our and our subsidiaries' ability to incur certain additional priority indebtedness, create or permit liens on assets or engage in mergers or consolidations. Debt issuance costs capitalized in connection with the Term Loan Agreement will be amortized over the life of the debt and total approximately
$3 million
.
|
107
During 2012, we repaid the
$150 million
borrowing and made principal repayments of
€26.0 million
on the remaining
€120 million
borrowing.
During the third quarter of 2012, we designated the
€120 million
term loan as a net investment hedge of our Central European operations. See Note 18, "Derivative Instruments and Hedging Activities" for further discussion.
|
(7)
|
On September 10, 2012, we entered into a revolving credit agreement ("Euro Credit Agreement") to support the operations of our Central Europe segment. The Euro Credit Agreement provides for a
1
-year revolving credit facility of
€150 million
on an uncommitted basis.
|
On April 3, 2012, we entered into a revolving credit agreement (the ''Credit Agreement''). The Credit Agreement provides for a
4
-year revolving credit facility of
$300 million
that was subsequently amended to increase the borrowing limit to
$550 million
. The Credit Agreement contains customary events of default and specified representations and warranties and covenants, including, among other things, covenants that limit our subsidiaries' ability to incur certain additional priority indebtedness, create or permit liens on assets, or engage in mergers or consolidations.
In the second quarter of 2011, we entered into an agreement for a
4
-year revolving multicurrency credit facility of
$400 million
, which provides a
$100 million
sub-facility available for the issuance of letters of credit.
In relation to the credit facilities issued during 2012, we incurred
$5.5 million
of total issuance costs and up-front fees, which are being amortized over the terms of each respective facility. There were no outstanding borrowings on these credit facilities as of
December 29, 2012
.
|
(8)
|
In addition to the unamortized debt discount on the
$575 million
convertible notes, we have unamortized debt discounts on the additional debt balances of
$6.6 million
and
$1.9 million
as of
December 29, 2012
, and
December 31, 2011
, respectively.
|
Short-term Borrowings
Our total short-term borrowing facilities consist of an overdraft facility of CAD
$30.0 million
at either
USD Prime or CAD Prime
depending on the borrowing currency, a line of credit for British Pound ("GBP")
10.0 million
and an overdraft facility for GBP
10.0 million
, both at
GBP LIBOR +1.5%
, and a line of credit for Japanese Yen
1.5 billion
(of which Japanese Yen
575.0 million
is committed under an outstanding letter of credit, at a
base rate of less than 1.0%
). As of
December 29, 2012
and
December 31, 2011
, we had outstanding borrowings of
$9.3 million
and
$2.2 million
, respectively, under the Japanese Yen line of credit, and no borrowings under any of the other facilities. See Note 20, "Commitments and Contingencies" for discussion related to letters of credit. Also included in short-term borrowings is
$3.9 million
related to factoring arrangements at MCCE.
Debt Fair Value Measurements
We utilize market approaches to estimate the fair value of certain outstanding borrowings by discounting anticipated future cash flows derived from the contractual terms of the obligations and observable market interest and foreign exchange rates. As of
December 29, 2012
, and
December 31, 2011
, the fair value of our outstanding long-term debt (including current portion) was
$4,993.0 million
and
$2,133.6 million
, respectively. Our
€120 million
term loan and all senior notes are valued based on significant observable inputs and would be classified as Level 2 in the fair value hierarchy. The fair value measurement of the conversion feature embedded in the Convertible Note includes significant unobservable inputs and is classified as Level 3 in the fair value hierarchy. See Note 18, "Derivative Instruments and Hedging Activities" for further discussion regarding the fair value of the conversion feature related to the Convertible Note. The carrying values of all other outstanding long-term borrowings and our short-term borrowings approximate their fair values.
Other
Under the terms of each of our debt facilities, we must comply with certain restrictions. These include restrictions on priority indebtedness (certain threshold percentages of secured consolidated net tangible assets), leverage thresholds, liens, and restrictions on certain types of sale lease-back transactions and transfers of assets. As of
December 29, 2012
, we were in compliance with all of these restrictions.
108
As of
December 29, 2012
, the aggregate principal debt maturities of long-term debt and short-term borrowings for the next
five
fiscal years are as follows:
|
Fiscal year
|
Amount
|
|||
|
|
(In millions)
|
|||
|
2013
|
$
|
1,249.0
|
|
|
|
2014
|
5.2
|
|
||
|
2015
|
919.1
|
|
||
|
2016
|
102.8
|
|
||
|
2017
|
801.5
|
|
||
|
Thereafter
|
1,600.0
|
|
||
|
Total
|
$
|
4,677.6
|
|
|
Interest
Interest incurred, capitalized and expensed were as follows:
|
|
For the years ended
|
||||||||||
|
|
December 29, 2012
|
December 31, 2011
|
December 25, 2010
|
||||||||
|
|
(In millions)
|
||||||||||
|
Interest incurred(1)
|
$
|
198.6
|
|
$
|
121.0
|
|
$
|
111.4
|
|
||
|
Interest capitalized
|
(2.3
|
)
|
(2.3
|
)
|
(1.2
|
)
|
|||||
|
Interest expensed
|
$
|
196.3
|
|
$
|
118.7
|
|
$
|
110.2
|
|
||
|
(1)
|
Interest incurred includes total non-cash interest of
$19.0 million
,
$17.5 million
and
$16.9 million
for the fiscal years
2012
,
2011
and
2010
, respectively.
|
15. Share-Based Payments
At
December 29, 2012
, we had
three
share-based compensation plans.
The 1990 Equity Incentive Plan
The 1990 Equity Incentive Plan ("EI Plan") generally provides for
two
types of grants for our employees: stock options for shares of Class B common stock and restricted stock awards of Class B common stock. The stock options have a term of
10
years and
one-third
of the stock option award vests in each of the
three
successive years after the date of grant. There were no awards granted under the EI Plan in
2012
,
2011
or
2010
and we are not expecting to grant any new awards under this plan.
Equity Compensation Plan for Non-Employee Directors
The Equity Compensation Plan for Non-Employee Directors ("EC Plan") provides for awards of shares of Class B common stock or options for shares of Class B common stock. Awards vest after completion of the director's annual term. The compensation cost associated with the EC plan is amortized over the directors' term. There were no awards granted under the EC Plan in
2012
,
2011
or
2010
and we are not expecting to grant any new awards under this plan.
Molson Coors Brewing Company Incentive Compensation Plan
During
2012
,
2011
and
2010
, we issued the following awards related to shares of Class B common stock to certain directors, officers, and other eligible employees, pursuant to the Molson Coors Brewing Company Incentive Compensation Plan ("MCBC IC Plan"): RSUs, DSUs, PUs, stock options, and SOSARs.
RSU awards are issued at the market value equal to the price of our stock at the date of the grant and vest over a period of
3
years. In
2012
,
2011
and
2010
, we granted
0.4 million
,
0.3 million
and
0.3 million
RSUs, respectively, with a weighted-average market value of
$42.04
,
$44.27
and
$43.61
each, respectively. Prior to vesting, RSUs have no voting rights.
DSU awards, under the Directors' Stock Plan pursuant to the MCBC IC Plan, are elections made by non-employee directors of MCBC that enable them to receive all or one-half of their annual cash retainer payments in our stock. The deferred stock unit awards are issued at the market value equal to the average day's price on the date of the grant. The DSUs are paid in
109
shares of stock upon termination of service. Prior to vesting, DSUs have no voting rights. In
2012
,
2011
and
2010
, we granted a small number of DSUs with a weighted-average market value of
$43.74
,
$43.53
and
$45.25
per share, respectively.
PUs are granted based on a target value established at the date of grant and vest upon completion of a service requirement. The payout value can range from
zero
to
two
times the target value based on achievement of specified adjusted earnings per share targets. The PU award value can be settled in cash or shares, or partly in cash and partly in shares, at the discretion of the Company. If settled in shares, it will be based on the closing Class B common stock price on the date of vesting. Prior to vesting,
no
shares are issued and PUs have no voting or dividend rights. We are unable to predict the vesting date share price and as a result, account for the PUs as liabilities, resulting in variable compensation expense until settled. The variability of compensation expense arises primarily from changing estimates of adjusted earnings per share. Changes in the price of Class B common stock during the vesting period do not impact compensation expense but will impact the number of shares ultimately issued if the awards are settled in stock. Compensation expense is determined based upon the estimated fair value and recognized over the requisite service period of the grant once we have determined that achievement of the performance condition is probable. If in the future it becomes improbable that the performance condition will be met, previously recognized compensation cost will be reversed, and no compensation cost will be recognized. The service condition vesting period is
three
years. In
2012
, we granted
0.7 million
PUs, all of which were outstanding as of
December 29, 2012
. In
2011
and
2010
, we granted
0.6 million
and
0.7 million
PUs, respectively. The aggregate intrinsic value of PUs outstanding at
December 29, 2012
, and
December 31, 2011
, was
$18.9 million
and
$22.9 million
, respectively.
Stock options are granted with an exercise price equal to the market value of a share of common stock on the date of grant. Stock options have a term of
10
years and generally vest over
three
years. During
2012
, we granted
0.3 million
options with a weighted-average fair value of
$8.09
each. During
2011
, we granted
0.7 million
options with a weighted-average fair value of
$9.60
each. During
2010
, we granted
0.7 million
options with a weighted-average fair value of
$10.95
each.
SOSARs were granted with an exercise price equal to the market value of a share of common stock on the date of grant. The SOSARs entitle the award recipient to receive shares of the Company's stock with a fair value equal to the excess of the trading price over the exercise price of such shares on the date of the exercise. SOSARs have a term of
ten
years and generally vest over
three
years. No SOSARs were granted in
2012
,
2011
or
2010
.
The mark-to-market share-based compensation expense before tax, related to our share-based awards granted to former CBC employees now employed by MillerCoors during the fiscal years
2011
and
2010
, was a benefit of
$0.1 million
and an expense of
$2.6 million
, respectively. These amounts are included in the table below. We did not record an adjustment in 2012 as these awards were fully vested as of the end of the second quarter of 2011. No further adjustments will be recorded related to these awards.
The following table summarizes share-based compensation expense:
|
|
For the years ended
|
||||||||||
|
|
December 29, 2012
|
December 31, 2011
|
December 25, 2010
|
||||||||
|
|
(In millions)
|
||||||||||
|
Pre-tax compensation expense
|
$
|
14.0
|
|
$
|
24.6
|
|
$
|
30.0
|
|
||
|
Tax benefit
|
(4.2
|
)
|
(6.8
|
)
|
(8.6
|
)
|
|||||
|
After-tax compensation expense
|
$
|
9.8
|
|
$
|
17.8
|
|
$
|
21.4
|
|
||
The decrease in expense during 2012 was primarily driven by lower values of performance units at year-end, fewer options granted during the year and increased forfeitures.
As of
December 29, 2012
, there was approximately
$17.2 million
of total unrecognized compensation cost from all share-based compensation arrangements granted under the plans, related to unvested shares. This compensation is expected to be recognized over a weighted-average period of approximately
1.2
years.
110
The following table represents non-vested RSUs, DSUs and PUs as of December 29, 2012, and the activity during
2012
:
|
|
RSUs and DSUs
|
PUs
|
|||||
|
|
Units
|
Weighted-average
grant date fair value
|
Units
|
Weighted-average
grant date fair value
|
|||
|
|
(In millions, except per share amounts)
|
||||||
|
Non-vested as of December 31, 2011
|
0.6
|
$43.35
|
2.0
|
$11.67
|
|||
|
Granted
|
0.4
|
$42.04
|
0.7
|
$14.35
|
|||
|
Vested
|
(0.2)
|
$42.52
|
(0.7)
|
$10.92
|
|||
|
Forfeited
|
(0.1)
|
$43.25
|
(0.3)
|
$10.89
|
|||
|
Non-vested as of December 29, 2012
|
0.7
|
$43.06
|
1.7
|
$10.90
|
|||
The total fair values of RSUs and DSUs vested during
2012
,
2011
and
2010
were
$9.4 million
,
$24.4 million
and
$12.5 million
, respectively. The total share based liabilities paid for PU's vested during
2012
,
2011
, and
2010
were
$7.3 million
,
$4.9 million
and
$2.5 million
, respectively.
The fair value of each option granted in
2012
,
2011
and
2010
was determined on the date of grant using the Black-Scholes option-pricing model with the following weighted-average assumptions:
|
|
For the years ended
|
||||
|
|
December 29, 2012
|
December 31, 2011
|
December 25, 2010
|
||
|
Risk-free interest rate
|
1.50%
|
2.57%
|
2.95%
|
||
|
Dividend yield
|
2.99%
|
2.57%
|
2.22%
|
||
|
Volatility range
|
25.8% - 27.6%
|
25.3% - 29.4%
|
27.2% - 29.5%
|
||
|
Weighted-average volatility
|
25.86%
|
26.29%
|
27.86%
|
||
|
Expected term (years)
|
4.0 - 7.7
|
4.0 - 7.7
|
5.0 - 7.0
|
||
|
Weighted-average fair value
|
$8.09
|
$9.60
|
$10.95
|
||
The risk-free interest rates utilized for periods throughout the contractual life of the options are based on a zero-coupon U.S. Treasury security yield at the time of grant. Expected volatility is based on a combination of historical and implied volatility of our stock. The expected term of options is estimated based upon observations of historical employee option exercise patterns and trends. The range on the expected term results from separate groups of employees who exhibit different historical exercise behavior.
The following table represents the summary of options and SOSARs outstanding as of
December 29, 2012
, and the activity during
2012
.
|
|
Shares outstanding
|
Shares exercisable at year-end
|
|||||||||||||||||
|
|
Shares
|
Weighted-
average
exercise price
|
Weighted-
average
remaining
contractual
life (years)
|
Aggregate
intrinsic
value
|
Shares
|
Weighted-
average
exercise price
|
Weighted-
average
remaining
contractual
life (years)
|
Aggregate
intrinsic
value
|
|||||||||||
|
(In millions, except per share amounts and years)
|
|||||||||||||||||||
|
Outstanding as of December 31, 2011
|
7.1
|
$38.69
|
4.31
|
$
|
43.1
|
|
5.7
|
$37.58
|
3.34
|
$
|
42.6
|
|
|||||||
|
Granted
|
0.3
|
$42.57
|
|
|
|
|
|
|
|
|
|||||||||
|
Exercised
|
(1.2)
|
$29.27
|
|
|
|
|
|
|
|
|
|||||||||
|
Forfeited
|
(0.2)
|
$45.65
|
|
|
|
|
|
|
|
|
|||||||||
|
Outstanding as of December 29, 2012
|
6.0
|
$40.55
|
4.05
|
$
|
23.2
|
|
5.2
|
$40.07
|
3.38
|
$
|
23.1
|
|
|||||||
The total intrinsic values of options exercised during
2012
,
2011
and
2010
were
$16.7 million
,
$3.9 million
and
$16.0 million
, respectively. During
2012
,
2011
and
2010
, cash received from stock options exercises was
$34.1 million
,
$11.6 million
and
$38.5 million
, respectively, and the total tax benefit to be realized for the tax deductions from these option exercises and other awards was
$4.9 million
,
$2.0 million
and
$4.8 million
, respectively.
111
As of
December 29, 2012
, there were
8.1 million
shares of the Company's stock available for the issuance as option, SOSAR, RSU, DSU, PSU, and PU awards under the MCBC IC Plan. This reflects the
5.0 million
additional shares approved by our shareholders during the second quarter of 2012.
16. Accumulated Other Comprehensive Income (Loss)
|
|
MCBC shareholders
|
||||||||||||||||||
|
|
Foreign
currency
translation
adjustments
|
Gain (loss) on
derivative
instruments
|
Pension and
Postretirement
Benefit
adjustments
|
Equity Method
Investments
|
Accumulated
other
comprehensive
income (loss)
|
||||||||||||||
|
|
(In millions)
|
||||||||||||||||||
|
As of December 26, 2009
|
$
|
784.8
|
|
$
|
(4.0
|
)
|
$
|
(605.6
|
)
|
$
|
(154.5
|
)
|
$
|
20.7
|
|
||||
|
Foreign currency translation adjustments
|
53.8
|
|
—
|
|
—
|
|
—
|
|
53.8
|
|
|||||||||
|
Unrealized gain (loss) on derivative instruments
|
—
|
|
(18.6
|
)
|
—
|
|
—
|
|
(18.6
|
)
|
|||||||||
|
Reclassification of derivative losses to income(1)
|
—
|
|
7.1
|
|
—
|
|
—
|
|
7.1
|
|
|||||||||
|
Pension and other postretirement benefit adjustments
|
—
|
|
—
|
|
136.9
|
|
—
|
|
136.9
|
|
|||||||||
|
Amortization of net prior service costs and net actuarial losses to income(1)
|
—
|
|
—
|
|
10.6
|
|
—
|
|
10.6
|
|
|||||||||
|
Ownership share of unconsolidated subsidiaries' other comprehensive income (loss)
|
—
|
|
—
|
|
—
|
|
(92.0
|
)
|
(92.0
|
)
|
|||||||||
|
Tax benefit (expense)
|
67.7
|
|
3.9
|
|
(39.3
|
)
|
20.3
|
|
52.6
|
|
|||||||||
|
As of December 25, 2010
|
$
|
906.3
|
|
$
|
(11.6
|
)
|
$
|
(497.4
|
)
|
$
|
(226.2
|
)
|
$
|
171.1
|
|
||||
|
Foreign currency translation adjustments
|
(49.6
|
)
|
—
|
|
—
|
|
—
|
|
(49.6
|
)
|
|||||||||
|
Unrealized gain (loss) on derivative instruments
|
—
|
|
(2.0
|
)
|
—
|
|
—
|
|
(2.0
|
)
|
|||||||||
|
Reclassification of derivative losses to income(1)
|
—
|
|
14.9
|
|
—
|
|
—
|
|
14.9
|
|
|||||||||
|
Pension and other postretirement benefit adjustments
|
—
|
|
—
|
|
(255.8
|
)
|
—
|
|
(255.8
|
)
|
|||||||||
|
Amortization of net prior service costs and net actuarial losses to income(1)
|
—
|
|
—
|
|
13.8
|
|
—
|
|
13.8
|
|
|||||||||
|
Ownership share of unconsolidated subsidiaries' other comprehensive income (loss)
|
—
|
|
—
|
|
—
|
|
(106.2
|
)
|
(106.2
|
)
|
|||||||||
|
Tax benefit (expense)
|
(18.1
|
)
|
0.4
|
|
62.6
|
|
39.2
|
|
84.1
|
|
|||||||||
|
As of December 31, 2011
|
$
|
838.6
|
|
$
|
1.7
|
|
$
|
(676.8
|
)
|
$
|
(293.2
|
)
|
$
|
(129.7
|
)
|
||||
|
Foreign currency translation adjustments
|
340.3
|
|
(1.6
|
)
|
(2.4
|
)
|
—
|
|
336.3
|
|
|||||||||
|
Unrealized gain (loss) on derivative instruments
|
—
|
|
(37.7
|
)
|
—
|
|
—
|
|
(37.7
|
)
|
|||||||||
|
Reclassification of derivative losses to income(1)
|
—
|
|
10.2
|
|
—
|
|
—
|
|
10.2
|
|
|||||||||
|
Pension and other postretirement benefit adjustments
|
—
|
|
—
|
|
(176.5
|
)
|
—
|
|
(176.5
|
)
|
|||||||||
|
Amortization of net prior service costs and net actuarial losses to income(1)
|
—
|
|
—
|
|
36.3
|
|
—
|
|
36.3
|
|
|||||||||
|
Ownership share of unconsolidated subsidiaries' other comprehensive income (loss)
|
—
|
|
—
|
|
—
|
|
(79.5
|
)
|
(79.5
|
)
|
|||||||||
|
Reclassification from investment in MillerCoors(2)
|
—
|
|
—
|
|
—
|
|
(97.9
|
)
|
(97.9
|
)
|
|||||||||
|
Tax benefit (expense)
|
8.6
|
|
9.7
|
|
(24.7
|
)
|
72.6
|
|
66.2
|
|
|||||||||
|
As of December 29, 2012
|
$
|
1,187.5
|
|
$
|
(17.7
|
)
|
$
|
(844.1
|
)
|
$
|
(398.0
|
)
|
$
|
(72.3
|
)
|
||||
|
(1)
|
The tax benefit recognized on reclassification of derivative losses to income was
$1.6 million
,
$4.5 million
and
$1.3 million
for the fiscal years
2012
,
2011
and
2010
, respectively. The tax benefit recognized on reclassification of net prior service costs and net actuarial losses to income was
$5.4 million
,
$3.6 million
and
$2.8 million
for the fiscal years
2012
,
2011
and
2010
, respectively.
|
|
(2)
|
During 2012 we recorded a reclassification from the investment in MillerCoors to AOCI reflecting our proportional share of MillerCoors AOCI at formation. See Note 5, "Investments" for further discussion.
|
We have significant levels of net assets denominated in currencies other than the USD due to our operations in foreign countries, and therefore recognize OCI gains and/or losses when those items are translated to USD. The foreign currency translation gains recognized during
2012
are largely due to the strengthening of the CAD, GBP and currencies of our Central European operations versus the USD, compared to the weakening of both the CAD and GBP in
2011
, and the strengthening of the CAD and weakening of the GBP in
2010
. OCI gains/losses related to our pension and OPEB plans are due to changes in our plan obligations, driven by actuarial gains/losses related to fluctuations in discount rate assumptions. OCI associated with our
112
equity method investments is primarily related to our
42%
share of the MillerCoors OCI activity (unrealized gains on derivative instruments and unrealized losses on pension obligations) and changes to BRI and BDL pension obligations.
17. Employee Retirement Plans and Postretirement Benefits
We maintain retirement plans for the majority of our employees. Depending on the benefit program, we provide either defined benefit pension or defined contribution plans to our employees in each of our segments. Each plan is managed locally and in accordance with respective local laws and regulations. All retirement plans for MCBC employees in the U.S. and Central Europe are defined contribution pension plans. Additionally, we offer OPEB plans to the majority of our Canadian, U.S. and Central European employees. These plans are not funded. MillerCoors, BRI and BDL maintain defined benefit pension and postretirement benefit plans as well; however, those plans are excluded from this disclosure as they are equity method investments and not consolidated.
Defined Benefit and OPEB Plans
Net Periodic Pension and OPEB Cost
|
For the years ended
|
|||||||||||||||||||||||||||||||||||
|
|
December 29, 2012
|
December 31, 2011
|
December 25, 2010
|
||||||||||||||||||||||||||||||||
|
|
Pension
|
OPEB
|
Consolidated
|
Pension
|
OPEB
|
Consolidated
|
Pension
|
OPEB
|
Consolidated
|
||||||||||||||||||||||||||
|
|
(In millions)
|
||||||||||||||||||||||||||||||||||
|
Components of net periodic pension and OPEB cost:
|
|
|
|
||||||||||||||||||||||||||||||||
|
Service cost—benefits earned during the year
|
$
|
16.8
|
|
$
|
2.9
|
|
$
|
19.7
|
|
$
|
18.8
|
|
$
|
2.4
|
|
$
|
21.2
|
|
$
|
17.4
|
|
$
|
2.5
|
|
$
|
19.9
|
|
||||||||
|
Interest cost on projected benefit obligation
|
165.7
|
|
8.0
|
|
173.7
|
|
180.5
|
|
7.7
|
|
188.2
|
|
188.3
|
|
9.4
|
|
197.7
|
|
|||||||||||||||||
|
Expected return on plan assets
|
(175.2
|
)
|
—
|
|
(175.2
|
)
|
(199.4
|
)
|
—
|
|
(199.4
|
)
|
(179.9
|
)
|
—
|
|
(179.9
|
)
|
|||||||||||||||||
|
Amortization of prior service cost (benefit)
|
0.8
|
|
(3.7
|
)
|
(2.9
|
)
|
0.8
|
|
(3.8
|
)
|
(3.0
|
)
|
0.7
|
|
(3.6
|
)
|
(2.9
|
)
|
|||||||||||||||||
|
Amortization of net actuarial loss (gain)
|
39.4
|
|
(0.2
|
)
|
39.2
|
|
20.2
|
|
(3.4
|
)
|
16.8
|
|
13.6
|
|
(0.1
|
)
|
13.5
|
|
|||||||||||||||||
|
Curtailment loss(1)
|
1.3
|
|
—
|
|
1.3
|
|
—
|
|
—
|
|
—
|
|
1.8
|
|
—
|
|
1.8
|
|
|||||||||||||||||
|
Special termination benefits(1)
|
0.4
|
|
—
|
|
0.4
|
|
—
|
|
—
|
|
—
|
|
—
|
|
—
|
|
—
|
|
|||||||||||||||||
|
Less: expected participant contributions
|
(1.5
|
)
|
—
|
|
(1.5
|
)
|
(1.6
|
)
|
—
|
|
(1.6
|
)
|
(2.0
|
)
|
—
|
|
(2.0
|
)
|
|||||||||||||||||
|
Net periodic pension and OPEB cost
|
$
|
47.7
|
|
$
|
7.0
|
|
$
|
54.7
|
|
$
|
19.3
|
|
$
|
2.9
|
|
$
|
22.2
|
|
$
|
39.9
|
|
$
|
8.2
|
|
$
|
48.1
|
|
||||||||
|
(1)
|
We recognized a curtailment loss and special termination benefit charges during the fourth quarter of 2012 as a result of the restructuring program in Canada. See Note 9, "Special Items" for further discussion of the Canada restructuring program.
|
113
Obligations and Changes in Funded Status
The changes in the benefit obligation, plan assets and the funded status of the pension and OPEB plans are as follows:
|
For the year ended December 29, 2012
|
For the year ended December 31, 2011
|
||||||||||||||||||||||
|
Pension
|
OPEB
|
Consolidated
|
Pension
|
OPEB
|
Consolidated
|
||||||||||||||||||
|
(In millions)
|
|||||||||||||||||||||||
|
Change in benefit obligation:
|
|||||||||||||||||||||||
|
Prior year benefit obligation
|
$
|
3,603.9
|
|
$
|
168.4
|
|
$
|
3,772.3
|
|
$
|
3,371.0
|
|
$
|
143.8
|
|
$
|
3,514.8
|
|
|||||
|
Postretirement benefit obligation assumed in Acquisition
|
—
|
|
2.7
|
|
2.7
|
|
—
|
|
—
|
|
—
|
|
|||||||||||
|
Service cost, net of expected employee contributions
|
15.6
|
|
2.9
|
|
18.5
|
|
17.3
|
|
2.4
|
|
19.7
|
|
|||||||||||
|
Interest cost
|
165.7
|
|
8.0
|
|
173.7
|
|
180.5
|
|
7.7
|
|
188.2
|
|
|||||||||||
|
Actual employee contributions
|
1.3
|
|
—
|
|
1.3
|
|
1.5
|
|
—
|
|
1.5
|
|
|||||||||||
|
Curtailment loss
|
1.3
|
|
—
|
|
1.3
|
|
—
|
|
—
|
|
—
|
|
|||||||||||
|
Special termination benefits
|
0.4
|
|
—
|
|
0.4
|
|
—
|
|
—
|
|
—
|
|
|||||||||||
|
Actuarial loss (gain)
|
243.7
|
|
8.3
|
|
252.0
|
|
243.3
|
|
24.7
|
|
268.0
|
|
|||||||||||
|
Amendments
|
0.5
|
|
—
|
|
0.5
|
|
—
|
|
—
|
|
—
|
|
|||||||||||
|
Benefits paid
|
(199.0
|
)
|
(8.1
|
)
|
(207.1
|
)
|
(191.8
|
)
|
(7.5
|
)
|
(199.3
|
)
|
|||||||||||
|
Adjustment due to change in historical accounting
|
—
|
|
—
|
|
—
|
|
(5.8
|
)
|
—
|
|
(5.8
|
)
|
|||||||||||
|
Foreign currency exchange rate change
|
122.1
|
|
4.2
|
|
126.3
|
|
(12.1
|
)
|
(2.7
|
)
|
(14.8
|
)
|
|||||||||||
|
Benefit obligation at end of year
|
$
|
3,955.5
|
|
$
|
186.4
|
|
$
|
4,141.9
|
|
$
|
3,603.9
|
|
$
|
168.4
|
|
$
|
3,772.3
|
|
|||||
|
Change in plan assets:
|
|||||||||||||||||||||||
|
Prior year fair value of assets
|
$
|
3,138.9
|
|
$
|
—
|
|
$
|
3,138.9
|
|
$
|
3,120.8
|
|
$
|
—
|
|
$
|
3,120.8
|
|
|||||
|
Actual return on plan assets
|
254.4
|
|
—
|
|
254.4
|
|
207.1
|
|
—
|
|
207.1
|
|
|||||||||||
|
Employer contributions
|
55.3
|
|
8.1
|
|
63.4
|
|
13.3
|
|
7.5
|
|
20.8
|
|
|||||||||||
|
Actual employee contributions
|
1.3
|
|
—
|
|
1.3
|
|
1.5
|
|
—
|
|
1.5
|
|
|||||||||||
|
Benefits and plan expenses paid
|
(201.1
|
)
|
(8.1
|
)
|
(209.2
|
)
|
(198.2
|
)
|
(7.5
|
)
|
(205.7
|
)
|
|||||||||||
|
Foreign currency exchange rate change
|
105.0
|
|
—
|
|
105.0
|
|
(5.6
|
)
|
—
|
|
(5.6
|
)
|
|||||||||||
|
Fair value of plan assets at end of year
|
$
|
3,353.8
|
|
$
|
—
|
|
$
|
3,353.8
|
|
$
|
3,138.9
|
|
$
|
—
|
|
$
|
3,138.9
|
|
|||||
|
Funded status:
|
$
|
(601.7
|
)
|
$
|
(186.4
|
)
|
$
|
(788.1
|
)
|
$
|
(465.0
|
)
|
$
|
(168.4
|
)
|
$
|
(633.4
|
)
|
|||||
|
Amounts recognized in the Consolidated Balance Sheets:
|
|||||||||||||||||||||||
|
Other non-current assets
|
$
|
56.5
|
|
$
|
—
|
|
$
|
56.5
|
|
$
|
74.2
|
|
$
|
—
|
|
$
|
74.2
|
|
|||||
|
Accrued expenses and other liabilities
|
(2.6
|
)
|
(9.0
|
)
|
(11.6
|
)
|
(2.4
|
)
|
(7.7
|
)
|
(10.1
|
)
|
|||||||||||
|
Pension and postretirement benefits
|
(655.6
|
)
|
(177.4
|
)
|
(833.0
|
)
|
(536.8
|
)
|
(160.7
|
)
|
(697.5
|
)
|
|||||||||||
|
Net amounts recognized
|
$
|
(601.7
|
)
|
$
|
(186.4
|
)
|
$
|
(788.1
|
)
|
$
|
(465.0
|
)
|
$
|
(168.4
|
)
|
$
|
(633.4
|
)
|
|||||
The accumulated benefit obligation for our defined benefit pension plans was
$3,953.0 million
and
$3,601.3 million
at
December 29, 2012
, and
December 31, 2011
, respectively.
Information for defined benefit pension and OPEB plans with accumulated benefit and projected benefit obligations in excess of plan assets is as follows:
|
As of December 29, 2012
|
As of December 31, 2011
|
||||||||||||||||||||||
|
Pension
|
OPEB
|
Consolidated
|
Pension
|
OPEB
|
Consolidated
|
||||||||||||||||||
|
(In millions)
|
|||||||||||||||||||||||
|
Accumulated benefit obligation
|
$
|
3,580.9
|
|
$
|
186.4
|
|
$
|
3,767.3
|
|
$
|
3,243.6
|
|
$
|
168.4
|
|
$
|
3,412.0
|
|
|||||
|
Projected benefit obligation
|
$
|
3,582.3
|
|
$
|
186.4
|
|
$
|
3,768.7
|
|
$
|
3,245.3
|
|
$
|
168.4
|
|
$
|
3,413.7
|
|
|||||
|
Fair value of plan assets
|
$
|
2,924.1
|
|
$
|
—
|
|
$
|
2,924.1
|
|
$
|
2,706.1
|
|
$
|
—
|
|
$
|
2,706.1
|
|
|||||
114
Accumulated Other Comprehensive Income
Amounts recognized in AOCI not yet recognized as components of net periodic pension and OPEB cost, pre-tax were as follows:
|
As of December 29, 2012
|
As of December 31, 2011
|
||||||||||||||||||||||
|
Pension
|
OPEB
|
Consolidated
|
Pension
|
OPEB
|
Consolidated
|
||||||||||||||||||
|
(In millions)
|
|||||||||||||||||||||||
|
Net actuarial loss (gain)
|
$
|
1,130.9
|
|
$
|
(6.1
|
)
|
$
|
1,124.8
|
|
$
|
999.3
|
|
$
|
(14.0
|
)
|
$
|
985.3
|
|
|||||
|
Net prior service cost
|
3.4
|
|
(7.2
|
)
|
(3.8
|
)
|
3.7
|
|
(10.6
|
)
|
(6.9
|
)
|
|||||||||||
|
Total not yet recognized
|
$
|
1,134.3
|
|
$
|
(13.3
|
)
|
$
|
1,121.0
|
|
$
|
1,003.0
|
|
$
|
(24.6
|
)
|
$
|
978.4
|
|
|||||
Changes in plan assets and benefit obligations recognized in OCI, pre-tax were as follows:
|
Pension
|
OPEB
|
Consolidated
|
|||||||||
|
|
(In millions)
|
||||||||||
|
Accumulated other comprehensive loss (income) as of December 25, 2010
|
$
|
786.3
|
|
$
|
(52.5
|
)
|
$
|
733.8
|
|
||
|
Amortization of prior service costs (benefit)
|
(0.8
|
)
|
3.8
|
|
3.0
|
|
|||||
|
Amortization of net actuarial loss (gain)
|
(20.2
|
)
|
3.4
|
|
(16.8
|
)
|
|||||
|
Current year actuarial loss
|
233.3
|
|
24.9
|
|
258.2
|
|
|||||
|
Adjustment due to change in historical accounting
|
(0.2
|
)
|
—
|
|
(0.2
|
)
|
|||||
|
Foreign currency exchange rate change
|
4.6
|
|
(4.2
|
)
|
0.4
|
|
|||||
|
Accumulated other comprehensive loss (income) as of December 31, 2011
|
$
|
1,003.0
|
|
$
|
(24.6
|
)
|
$
|
978.4
|
|
||
|
Amortization of prior service costs (benefit)
|
(0.8
|
)
|
3.7
|
|
2.9
|
|
|||||
|
Amortization of net actuarial loss (gain)
|
(39.4
|
)
|
0.2
|
|
(39.2
|
)
|
|||||
|
Current year actuarial loss (gain)
|
168.2
|
|
8.3
|
|
176.5
|
|
|||||
|
Foreign currency exchange rate change
|
3.3
|
|
(0.9
|
)
|
2.4
|
|
|||||
|
Accumulated other comprehensive loss (income) as of December 29, 2012
|
$
|
1,134.3
|
|
$
|
(13.3
|
)
|
$
|
1,121.0
|
|
||
Amortization of AOCI expected to be recognized in net periodic pension and OPEB cost during fiscal year
2013
pre-tax is as follows:
|
|
Pension
|
OPEB
|
Consolidated
|
||||||||
|
|
(In millions)
|
||||||||||
|
Amortization of net prior service cost (gain)
|
$
|
0.9
|
|
$
|
(3.7
|
)
|
$
|
(2.8
|
)
|
||
|
Amortization of actuarial net loss (gain)
|
$
|
7.3
|
|
$
|
(0.1
|
)
|
$
|
7.2
|
|
||
115
Assumptions
Periodic pension and OPEB cost is actuarially calculated annually for each individual plan based on data available at the beginning of each year. Assumptions used in the calculation include the settlement discount rate selected and disclosed at the end of the previous year as well as other assumptions detailed in the table below. The weighted-average rates used in determining the periodic pension and OPEB cost for the fiscal years
2012
,
2011
and
2010
were as follows:
|
|
For the years ended
|
||||||||||
|
|
December 29, 2012
|
December 31, 2011
|
December 25, 2010
|
||||||||
|
|
Pension
|
OPEB
|
Pension
|
OPEB
|
Pension
|
OPEB
|
|||||
|
Weighted-average assumptions:
|
|
|
|
|
|||||||
|
Settlement discount rate
|
4.61%
|
4.66%
|
5.32%
|
5.33%
|
5.72%
|
5.90%
|
|||||
|
Rate of compensation increase(1)
|
2.50%
|
N/A
|
3.00%
|
N/A
|
3.00%
|
N/A
|
|||||
|
Expected return on plan assets(2)
|
5.57%
|
N/A
|
6.17%
|
N/A
|
6.25%
|
N/A
|
|||||
|
Health care cost trend rate
|
N/A
|
Ranging ratably from 8.2% in 2012 to 4.5% in 2028
|
N/A
|
Ranging ratably from 8.5% in 2011 to 4.5% in 2028
|
N/A
|
Ranging ratably from 9.0% in 2010 to 5.0% in 2018
|
|||||
|
(1)
|
U.K. plan was closed to future accrual during 2009.
|
|
(2)
|
We develop our long term expected return on assets ("EROA") assumptions annually with input from independent investment specialists including our actuaries, investment consultants and other specialists. Each EROA assumption is based on historical data, including historical returns, historical market rates and is calculated for each plan's individual asset class. The calculation includes inputs for interest, inflation, credit, and risk premium (active investment management) rates and fees paid to service providers. We consider our EROA to be a significant management estimate. Any material changes in the inputs to our methodology used in calculating our EROA could have a significant impact on our reported defined benefit pension plans' expense.
|
Benefit obligations are actuarially calculated annually at the end of each year based on the assumptions detailed in the table below. Obligations under the OPEB plans are determined by the application of the terms of medical and life insurance plans, together with relevant actuarial assumptions and heath care cost trend rates. The weighted-average rates used in determining the projected benefit obligation for defined pension plans and the accumulated postretirement benefit obligation for OPEB plans, as of
December 29, 2012
and
December 31, 2011
, were as follows:
|
As of December 29, 2012
|
As of December 31, 2011
|
||||||
|
Pension
|
OPEB
|
Pension
|
OPEB
|
||||
|
Weighted-average assumptions:
|
|||||||
|
Settlement discount rate
|
4.18%
|
4.12%
|
4.61%
|
4.66%
|
|||
|
Rate of compensation increase(1)
|
2.50%
|
N/A
|
2.50%
|
N/A
|
|||
|
Health care cost trend rate
|
N/A
|
Ranging ratably from 7.9% in 2013 to 4.5% in 2028
|
N/A
|
Ranging ratably from 8.2% in 2012 to 4.5% in 2028
|
|||
|
(1)
|
U.K. plan was closed to future accrual during 2009.
|
Assumed health care cost trend rates have a significant effect on the amounts reported for OPEB health care plans. A one-percentage point change in assumed health care cost trend rates would have the following effects on related OPEB plans:
|
1% point
increase
(unfavorable)
|
1% point
decrease
favorable
|
||||||
|
(In millions)
|
|||||||
|
Effect on total of service and interest cost components
|
$
|
(1.2
|
)
|
$
|
1.3
|
|
|
|
Effect on postretirement benefit obligations
|
$
|
(19.4
|
)
|
$
|
17.8
|
|
|
116
Investment Strategy
The obligations of our defined benefit pension plans in Canada and the U.K. are supported by assets held in trusts for the payment of future benefits. The business segments are obligated to adequately fund these asset trusts. The underlying investments within our defined benefit pension plans include: cash and short term instruments, debt securities, equity securities, investment funds, and other investments including hedge fund of funds and real estate. Relative allocations reflect the demographics of the respective plans.
The plans use liability driven investment strategies in managing defined pension benefits. For all defined benefit pension plan assets the plans have the following primary investment objectives:
|
(1)
|
optimize the long-term return on plan assets at an acceptable level of risk and manage projected future cash contributions;
|
|
(2)
|
maintain a broad diversification across asset classes and among investment managers;
|
|
(3)
|
manage the risk level within each asset class and in relation to the plans' liabilities
|
Each plan's respective allocation targets promote optimal expected return and volatility characteristics given a focus on a long-term time horizon for fulfilling the plans' obligations. All assets are managed by external investment managers with a mandate to either match or outperform their benchmark. The plans use different asset managers in the U.K. and Canada.
Our investment strategies for our defined benefit pension plans also consider the funding status for each plan. For defined benefit pension plans that are highly funded, assets are invested primarily in fixed income holdings that have a similar duration to the associated liabilities. For plans with lower funding levels, the fixed income component is managed in a similar manner to the highly funded plans. In addition to this liability-matching fixed income allocation, these plans also contain exposure to return generating assets including: equities, real estate, debt, and other investments held with the goal of producing higher returns, which may also have a higher risk profile. These investments are diversified by investing globally with limitations placed on issuer concentration.
For both our U.K. and Canadian plans, the plans hedge a portion of the foreign exchange exposure between plan assets which are not denominated in the local plan currency and the local currency as the Canadian and U.K. pension liabilities will be settled in CAD and GBP, respectively.
Target Allocations
The following compares target asset allocation percentages with actual asset allocations on a weighted-average asset basis at
December 29, 2012
:
|
|
Target
allocations
|
Actual
allocations
|
|
|
Equities
|
31.9%
|
32.6%
|
|
|
Fixed income
|
50.5%
|
49.8%
|
|
|
Hedge funds
|
9.4%
|
9.5%
|
|
|
Real estate
|
4.1%
|
2.6%
|
|
|
Other
|
4.1%
|
5.5%
|
|
Significant Concentration Risks
We periodically evaluate our defined benefit pension plan assets for concentration risks. As of
December 29, 2012
, we did not have any individual underlying asset positions that composed greater than
10%
of each plan's overall assets. However, we currently have significant plan assets invested in U.K., U.S. and Canadian government fixed income holdings. A provisional credit rating downgrade for any of these governments could impact the asset values in a negative manner.
Further, as our benefit plans maintain exposure to non-government investments, a significant system-wide increase in credit spreads would also negatively impact the reported plan asset values. In general, equity and fixed income risks have been mitigated by company-specific concentration limits and by utilizing multiple equity managers. We do have significant amounts of assets invested with individual fixed income and hedge fund managers, and so the plans use outside investment consultants to aid in the oversight of these managers and fund performance.
117
Valuation Techniques
We use a variety of industry accepted valuation techniques to value our plan assets. The techniques vary depending upon instrument type. Whenever possible, we prioritize the use of observable market data in our valuation processes. We use market, income and cost approaches to value our plan assets as of period end. See Note 1 "Basis of Presentation and Summary of Significant Accounting Policies" for additional information on our fair value methodologies and accounting policies. We have not changed our fair value techniques used to value plan assets this year.
Major Categories of Plan Assets
As of
December 29, 2012
, our major categories of plan assets included the following:
|
•
|
Cash and short-term instruments—Includes cash, trades awaiting settlement, bank deposits, short-term bills and short-term notes. Our "trades awaiting settlement" category includes payables and receivables associated with asset purchases and sales that are awaiting final cash settlement as of year-end due to the use of trade date accounting for our pension plans assets. These payables normally settle within a few business days of the purchase or sale of the respective asset. The respective assets are included in or removed from our year end plan assets and categorized in their respective asset categories in the fair value hierarchy below. We include these items in Level 1 of this hierarchy, as the values are derived from quoted prices in active markets. Short-term instruments are included in Level 2 of the fair value hierarchy as these are highly liquid instruments that are valued using observable inputs, but their asset values are not publicly quoted.
|
|
•
|
Debt securities—Includes various government and corporate fixed income securities, interest and inflation-linked assets such as bonds and swaps, collateralized securities, and other debt securities. The majority of the plans' fixed income assets trade on "over the counter" exchanges, which provides observable inputs that are the primary data used to determine each individual investment's fair value. We also use independent pricing vendors, as well as matrix pricing techniques. Matrix pricing uses observable data from other similar investments as the primary input to determine the individual security's fair value. Government and corporate fixed income securities are generally classified as Level 2 in the fair value hierarchy as they are valued using observable inputs. Assets included in our collateralized securities include mortgage backed securities and collateralized mortgage obligations, which are considered Level 3 due to the use of the significant unobservable inputs used in deriving these assets' fair values.
|
|
•
|
Equities—Includes publicly traded common and other equity-like holdings, primarily publicly traded common stock, including real estate investment trusts, certain commingled funds investing in equities and other fund holdings. Equity assets are well diversified between international and domestic investments. We consider equities quoted on public exchanges as Level 1 while other assets that are not quoted on public exchanges but valued using significant observable inputs as Level 2 depending on the individual asset's characteristics.
|
|
•
|
Investment funds—Includes our debt funds, equity funds, hedge fund of funds, and real estate fund holdings. The market values for these funds are based on the net asset values multiplied by the number of shares owned. For some of our hedge fund of funds, we have the ability to liquidate without material delays at their net asset value and have recorded these assets at Level 2 as the values were based upon significant observable inputs.
|
Other hedge fund of funds and real estate funds, where we do not have this flexibility to liquidate the entire portfolio, are considered Level 3. This category does not directly hold physical real estate assets. For our real estate funds, these investment managers employ third-party appraisers to value each fund's underlying real estate holdings, which include apartments, office space, hotels and industrial holdings. Each property is valued at least once a year, but not all assets are valued by the independent appraiser during the same quarter. The highest and best use of each holding is used to determine the value of the holding. The independent appraisers use a combination of comparable sales methods and discounted cash flow techniques to value these holdings.
|
•
|
Other—Includes credit default swaps, repurchase agreements, recoverable taxes for taxes paid and awaiting reclaim due to the tax exempt nature of the pension plan, venture capital, and private equity. Repurchase agreements are agreements where our plan has purchased assets using borrowed funds, creating a repurchase agreement liability, to facilitate the trade. The assets associated with the repurchase agreement are included in the respective asset's category in the fair value hierarchy, and the repurchase agreement liability is classified as Level 1 in the hierarchy, as the liability is valued using quoted prices in active markets. We are viewing the asset type, as opposed to the investment vehicle, in determining the presentation of our asset allocations. We
|
118
include recoverable tax items in Level 1 of this hierarchy, as the values are derived from quoted prices in active markets. Our credit default swaps are included in Level 2 as the values were based upon significant observable inputs and our venture capital and private equity are included in Level 3 as the values are based upon the use of unobservable inputs.
Fair Value Hierarchy
The following presents our fair value hierarchy for our defined benefit pension plan assets:
|
|
|
Fair value measurements as of December 29, 2012
|
|||||||||||||
|
|
Total at
December 29, 2012 |
Quoted prices
in active
markets
(Level 1)
|
Significant
observable
inputs
(Level 2)
|
Significant
unobservable
inputs
(Level 3)
|
|||||||||||
|
Cash and cash equivalents
|
|
|
|
|
|||||||||||
|
Cash
|
$
|
108.2
|
|
$
|
108.2
|
|
$
|
—
|
|
$
|
—
|
|
|||
|
Trades awaiting settlement
|
5.4
|
|
5.4
|
|
—
|
|
—
|
|
|||||||
|
Bank deposits, short-term bills and notes
|
36.4
|
|
—
|
|
36.4
|
|
—
|
|
|||||||
|
Debt
|
|
||||||||||||||
|
Government securities
|
837.2
|
|
—
|
|
837.2
|
|
—
|
|
|||||||
|
Corporate debt securities
|
536.8
|
|
—
|
|
536.8
|
|
—
|
|
|||||||
|
Interest and inflation linked assets
|
171.6
|
|
—
|
|
205.7
|
|
(34.1
|
)
|
|||||||
|
Collateralized debt securities
|
4.3
|
|
—
|
|
—
|
|
4.3
|
|
|||||||
|
Other debt securities
|
—
|
|
—
|
|
—
|
|
—
|
|
|||||||
|
Equities
|
|
||||||||||||||
|
Common stock
|
583.7
|
|
581.7
|
|
—
|
|
2.0
|
|
|||||||
|
Other equity securities
|
1.2
|
|
1.2
|
|
—
|
|
—
|
|
|||||||
|
Investment funds
|
|
||||||||||||||
|
Debt funds
|
273.7
|
|
—
|
|
157.5
|
|
116.2
|
|
|||||||
|
Equity funds
|
499.7
|
|
7.8
|
|
491.9
|
|
—
|
|
|||||||
|
Real estate funds
|
55.9
|
|
—
|
|
—
|
|
55.9
|
|
|||||||
|
Hedge funds of funds
|
321.9
|
|
—
|
|
101.7
|
|
220.2
|
|
|||||||
|
Other
|
|
||||||||||||||
|
Repurchase agreements
|
(98.1
|
)
|
(98.1
|
)
|
—
|
|
—
|
|
|||||||
|
Credit default swaps
|
(13.5
|
)
|
—
|
|
(13.5
|
)
|
—
|
|
|||||||
|
Private equity
|
28.4
|
|
—
|
|
—
|
|
28.4
|
|
|||||||
|
Recoverable taxes
|
0.5
|
|
0.5
|
|
—
|
|
—
|
|
|||||||
|
Venture capital
|
0.5
|
|
—
|
|
—
|
|
0.5
|
|
|||||||
|
Total
|
$
|
3,353.8
|
|
$
|
606.7
|
|
$
|
2,353.7
|
|
$
|
393.4
|
|
|||
119
|
|
|
Fair value measurements as of December 31, 2011
|
|||||||||||||
|
|
Total at
December 31, 2011 |
Quoted prices
in active
markets
(Level 1)
|
Significant
observable
inputs
(Level 2)
|
Significant
unobservable
inputs
(Level 3)
|
|||||||||||
|
Cash and cash equivalents
|
|
|
|
|
|||||||||||
|
Cash
|
$
|
72.4
|
|
$
|
72.4
|
|
$
|
—
|
|
$
|
—
|
|
|||
|
Trades awaiting settlement
|
(6.4
|
)
|
(6.4
|
)
|
—
|
|
—
|
|
|||||||
|
Bank deposits, short-term bills and notes
|
62.2
|
|
0.5
|
|
61.7
|
|
—
|
|
|||||||
|
Debt
|
|
|
|
||||||||||||
|
Government securities
|
851.3
|
|
—
|
|
851.3
|
|
—
|
|
|||||||
|
Corporate debt securities
|
531.4
|
|
—
|
|
531.4
|
|
—
|
|
|||||||
|
Interest and inflation linked assets
|
212.1
|
|
—
|
|
213.3
|
|
(1.2
|
)
|
|||||||
|
Collateralized debt securities
|
5.8
|
|
—
|
|
—
|
|
5.8
|
|
|||||||
|
Other debt securities
|
0.1
|
|
—
|
|
0.1
|
|
—
|
|
|||||||
|
Equities
|
|
|
|
||||||||||||
|
Common stock
|
488.3
|
|
486.4
|
|
—
|
|
1.9
|
|
|||||||
|
Other equity securities
|
7.6
|
|
7.6
|
|
—
|
|
—
|
|
|||||||
|
Investment funds
|
|
|
|
||||||||||||
|
Debt funds
|
201.8
|
|
—
|
|
123.6
|
|
78.2
|
|
|||||||
|
Equity funds
|
389.5
|
|
—
|
|
389.5
|
|
—
|
|
|||||||
|
Real estate funds
|
61.9
|
|
—
|
|
—
|
|
61.9
|
|
|||||||
|
Hedge funds of funds
|
321.3
|
|
—
|
|
153.2
|
|
168.1
|
|
|||||||
|
Other
|
|
|
|
||||||||||||
|
Repurchase agreements
|
(66.6
|
)
|
(66.6
|
)
|
—
|
|
—
|
|
|||||||
|
Credit default swaps
|
(14.5
|
)
|
—
|
|
(14.5
|
)
|
—
|
|
|||||||
|
Private equity
|
19.8
|
|
—
|
|
—
|
|
19.8
|
|
|||||||
|
Recoverable taxes
|
0.5
|
|
0.5
|
|
—
|
|
—
|
|
|||||||
|
Venture capital
|
0.4
|
|
—
|
|
—
|
|
0.4
|
|
|||||||
|
Total
|
$
|
3,138.9
|
|
$
|
494.4
|
|
$
|
2,309.6
|
|
$
|
334.9
|
|
|||
120
Fair Value: Level Three Rollforward
The following presents our Level 3 Rollforward for our defined pension plan assets.
|
Amount
|
|||
|
(In millions)
|
|||
|
Balance at December 25, 2010
|
$
|
217.4
|
|
|
Total gain or loss (realized/unrealized):
|
|
||
|
Realized loss
|
(7.5
|
)
|
|
|
Unrealized loss included in AOCI
|
(7.2
|
)
|
|
|
Purchases, issuances, settlements
|
138.7
|
|
|
|
Transfers in/(out) of Level 3
|
(4.1
|
)
|
|
|
Foreign exchange translation (loss)/gain
|
(2.4
|
)
|
|
|
Balance at December 31, 2011
|
334.9
|
|
|
|
Total gain or loss (realized/unrealized):
|
|
||
|
Realized loss
|
(1.0
|
)
|
|
|
Unrealized (loss)/gain included in AOCI
|
(23.0
|
)
|
|
|
Purchases, issuances, settlements
|
68.5
|
|
|
|
Transfers in/(out) of Level 3
|
—
|
|
|
|
Foreign exchange translation loss
|
14.0
|
|
|
|
Balance at December 29, 2012
|
$
|
393.4
|
|
Expected Cash Flows
In
2013
, we expect to make contributions to our defined benefit pension plans totaling approximately
$110 million
to
$120 million
and benefit payments for our OPEB plans of approximately
$10 million
. MillerCoors, BRI and BDL contributions to their respective defined benefit pension plans are excluded here, as they are not consolidated in our financial statements. Plan funding strategies are influenced by employee benefits and tax laws as well as plan governance documents.
Expected future benefit payments for defined benefit pension and OPEB plans, based on foreign exchange rates at
December 29, 2012
, are as follows:
|
Expected benefit payments
|
Pension
|
OPEB
|
||||||
|
|
(In millions)
|
|||||||
|
2013
|
$
|
206.3
|
|
$
|
8.7
|
|
||
|
2014
|
$
|
211.3
|
|
$
|
9.1
|
|
||
|
2015
|
$
|
216.4
|
|
$
|
9.0
|
|
||
|
2016
|
$
|
220.9
|
|
$
|
9.4
|
|
||
|
2017
|
$
|
224.7
|
|
$
|
9.8
|
|
||
|
2018-2022
|
$
|
1,261.8
|
|
$
|
61.1
|
|
||
Defined Contribution Plans
We offer defined contribution pension plans for the majority of our Canadian, U.S., and U.K. employees. The investment strategy for defined contribution plans are determined by each individual participant. The employer contributions to the U.K. and Canadian plans range from
3%
to
8.5%
of employee compensation.
U.S. employees are eligible to participate in the Molson Coors Savings and Investment Plan, a qualified defined contribution plan, which provides for employer contributions ranging from
5%
to
9%
of our hourly and salaried employees' compensation (certain employees are also eligible for additional employer contributions). Both employee and employer contributions were made in cash in accordance with participant investment elections.
We recognized costs associated with defined contribution pension plans of
$23.0 million
,
$27.6 million
and
$24.1 million
in
2012
,
2011
and
2010
, respectively.
121
During
2011
, we established a nonqualified defined contribution plan for certain U.S. employees. MCBC has voluntarily funded these liabilities through a Rabbi Trust. These are company assets which are invested in publicly traded mutual funds whose performance is expected to closely match changes in the plan liabilities. As of
December 29, 2012
, and
December 31, 2011
, the plan liabilities were equal to the plan assets noted in the table below and were included in other assets and other liabilities on our consolidated balance sheets, respectively.
Fair Value Hierarchy
The following presents our fair value hierarchy for our corporate invested plan assets used in the aforementioned "Rabbi Trust" arrangements.
|
|
|
Fair value measurements as of December 29, 2012
|
|||||||||||||
|
|
Total at
December 29, 2012 |
Quoted prices
in active markets
(Level 1)
|
Significant
observable
inputs
(Level 2)
|
Significant
unobservable
inputs
(Level 3)
|
|||||||||||
|
Corporate
|
|
|
|
|
|||||||||||
|
Equities
|
|
|
|
|
|||||||||||
|
Mutual funds
|
$
|
3.1
|
|
$
|
3.1
|
|
$
|
—
|
|
$
|
—
|
|
|||
|
Total—Corporate
|
$
|
3.1
|
|
$
|
3.1
|
|
$
|
—
|
|
$
|
—
|
|
|||
|
|
|
Fair value measurements as of December 31, 2011
|
|||||||||||||
|
|
Total at
December 31, 2011 |
Quoted prices
in active markets
(Level 1)
|
Significant
observable
inputs
(Level 2)
|
Significant
unobservable
inputs
(Level 3)
|
|||||||||||
|
Corporate
|
|
|
|
|
|||||||||||
|
Equities
|
|
|
|
|
|||||||||||
|
Mutual funds
|
$
|
2.4
|
|
$
|
2.4
|
|
$
|
—
|
|
$
|
—
|
|
|||
|
Total—Corporate
|
$
|
2.4
|
|
$
|
2.4
|
|
$
|
—
|
|
$
|
—
|
|
|||
18. Derivative Instruments and Hedging Activities
Overview and Risk Management Policies
We use derivatives as part of our normal business operations to manage our exposure to fluctuations in interest rates, foreign currency, commodity price risk and for other strategic purposes related to our core business. We have established policies and procedures that govern the risk management of these exposures. Our primary objective in managing these exposures is to decrease the volatility of cash flows affected by changes in the underlying rates and prices.
To achieve our objectives, we enter into a variety of financial derivatives, including foreign currency exchange, commodity, interest rate, and cross currency swaps. We also enter into physical hedging agreements directly with our suppliers to manage our exposure to certain commodities.
Counterparty Risk
While, by policy, the counterparties to any of the financial derivatives we enter into are major institutions with investment grade credit ratings of at least A- (Standard & Poor's or the equivalent) or better, we are exposed to credit-related losses in the event of non-performance by counterparties. This credit risk is generally limited to the unrealized gains in such contracts, should any of these counterparties fail to perform as contracted.
We have established a counterparty credit policy and guidelines that are monitored and reported to management according to prescribed guidelines to assist in managing this risk. As an additional measure, we utilize a portfolio of institutions either headquartered or operating in the same countries that we conduct our business. In calculating the fair value of our derivative balances, we also record an adjustment to recognize the risk of counterparty credit and our non-performance risk.
Price and Liquidity Risks
We base the fair value of our derivative instruments upon market rates and prices. The volatility of these rates and prices are dependent on many factors that cannot be forecasted with reliable accuracy. The current fair values of our contracts could
122
differ significantly from the cash settled values with our counterparties. As such, we are exposed to price risk related to unfavorable changes in the fair value of our derivative contracts.
We may be forced to cash settle all or a portion of our derivative contracts before the expected settlement date upon the occurrence of certain contractual triggers including a change of control termination event or other breach of agreement. This could have a negative impact on our liquidity. For derivative contracts that we have designated as hedging instruments, early cash settlement would result in the timing of our hedge settlement not being matched to the cash settlement of the forecasted transaction or firm commitment. We may also decide to cash settle all or a portion of our derivative contracts before the expected settlement date through negotiations with our counterparties, which could also impact our cash position.
Due to the nature of our counterparty agreements, we are not able to net positions with the same counterparty across business units. Thus, in the event of default, we may be required to early settle all out-of-the-money contracts, without the benefit of netting the fair value of any in-the-money positions against this exposure.
Collateral
For the majority of our derivative transactions, we do not receive and are not required to post collateral unless a change of control event occurs. This termination event would give either party the right to early terminate all outstanding swap transactions in the event that the other party consolidates, merges with, or transfers all or substantially all its assets to, another entity, and the creditworthiness of the surviving entity that has assumed such party's obligations is materially weaker than that of such party. As of
December 29, 2012
, we did not have any collateral posted with any of our counterparties.
Derivative Accounting Policies
Overview
The majority of our derivative contracts qualify and are designated in a hedge accounting relationship. Our cross currency swaps, historically designated as a cash flow hedge, were designated as a net investment hedge in 2011. Our other foreign currency and commodity derivative instruments that are designated in hedge accounting relationships are designated as cash flow hedges. In certain situations, we may execute derivatives that do not qualify for hedge accounting but are determined to be important for managing risk. Economic hedges are measured at fair value on our consolidated balance sheets with changes in fair value recorded in earnings. We have historically elected to apply the NPNS exemption to certain contracts, as applicable. These contracts are typically transacted with our suppliers and include risk management features that allow us to fix the price on specific volumes of purchases for specified delivery periods. We also consider whether any provisions in our contracts represent embedded derivative instruments as defined in authoritative accounting guidance. As of
December 29, 2012
, we have identified the equity conversion feature of our
€500 million
Convertible Note as the only embedded derivative instrument required to be bifurcated and separately accounted for at fair value with changes in fair value recorded in earnings. Refer to "
Derivative Activity Related to the Acquisition
" below for further discussion.
Hedge Accounting Policies
We formally document all relationships receiving hedge accounting treatment between hedging instruments and hedged items, as well as the risk-management objective and strategy for undertaking hedge transactions pursuant to prescribed guidance. We also formally assess effectiveness both at the hedge's inception and on an ongoing basis, specifically whether the derivatives that are used in hedging transactions have been highly effective in mitigating the risk designated as being hedged and whether those hedges may be expected to remain highly effective in future periods.
We discontinue hedge accounting prospectively when (1) the derivative is no longer highly effective in offsetting changes in the cash flows of a forecasted future transaction; (2) the derivative expires or is sold, terminated, or exercised; (3) it is no longer probable that the forecasted transaction will occur; (4) management determines that designating the derivative as a hedging instrument is no longer appropriate; or (5) management decides to cease hedge accounting.
When we discontinue hedge accounting prospectively, but it continues to be probable that the forecasted transaction will occur in the originally expected period, the existing gain or loss on the derivative remains in AOCI and is reclassified into earnings when the forecasted transaction affects earnings. However, if it is no longer probable that a forecasted transaction will occur by the end of the originally specified time period or within an additional two-month period of time thereafter, the gains and losses in AOCI are recognized immediately in earnings. In all situations in which hedge accounting is discontinued and the derivative remains outstanding, we carry the derivative at its fair value on the consolidated balance sheets until maturity, recognizing future changes in the fair value in current period earnings.
123
Significant Derivative/Hedge Positions
Derivative Activity Related to the Acquisition
In May 2012, in connection with the Acquisition, we issued
$1.9 billion
of senior notes with portions maturing in 2017, 2022 and 2042. Prior to the issuance of the notes, we systematically removed a portion of our interest rate market risk by entering into Treasury Locks. This resulted in an increase in the certainty of our yield to maturity when issuing the notes. Subsequent to entering into the hedges, market interest rates decreased, resulting in more favorable interest rates for the issued notes. Consequently, we recognized a cash loss of
$39.2 million
on settlement of the Treasury Locks recorded in interest expense. See Note 14, "Debt" for further discussion.
Additionally, in June 2012, we issued a Convertible Note to the Seller simultaneous with the closing of the Acquisition. The Seller may exercise a put right with respect to put the Convertible Note to us during the conversion period for the greater of the principal amount of the Convertible Note or the aggregate cash value of
12,894,044
shares of our Class B common stock, as adjusted for certain corporate events. The Convertible Note's embedded conversion feature was determined to meet the definition of a derivative required to be bifurcated and separately accounted for at fair value with changes in fair value recorded in earnings. At issuance, we recorded a liability of
$15.2 million
related to the conversion feature. See Note 14, "Debt" for further discussion.
On April 3, 2012, we entered into a term loan agreement that provides for a
4
-year Euro-denominated term loan facility equal to
$150 million
(or
€120 million
at issuance), which was funded upon close of the Acquisition on June 15, 2012. In the third quarter of 2012, we designated the term loan as a net investment hedge of our Central European operations. As a result, all foreign exchange gains and losses due to fluctuations in the Euro-denominated borrowing have been prospectively recognized as currency translation adjustments in AOCI. See Note 14, "Debt" for further discussion of the term loan.
In the first quarter of 2013, we began executing a series of financial foreign exchange contracts to hedge our risk associated with payments of Euro-denominated debt. These contracts are not designated in hedge accounting relationships. As of the date of this filing, the outstanding notional amount of this hedging program is approximately
€160 million
.
Cross Currency Swaps
We historically designated the cross currency swap contracts as cash flow hedges of the variability of cash flows related to GBP denominated principal and interest payments on intercompany notes of GBP
530 million
. In September 2011, we cash settled approximately
25%
of our GBP
530 million
/
$774 million
and CAD
1.2 billion
/GBP
530 million
cross currency swaps. As a result of the settlement, we extinguished
$98.7 million
of the outstanding liability. Cash flow hedge accounting was discontinued on the settled swaps and losses of
$0.9 million
were reclassified from AOCI to other income (expense), net related to the hedge termination. Simultaneously with the settlement of the swaps, we paid down an equal portion of the outstanding principal of the intercompany notes in the amount of GBP
132 million
.
In October 2011, we simultaneously extended both the terms of approximately half of the original intercompany notes and cross currency swaps, such that the new maturities are March 2014. The remaining approximate
25%
was left unadjusted and continued to be due in May 2012. Following this extension, in November 2011, we dedesignated all of the remaining swaps as cash flow hedges and designated the aggregate swaps as a net investment hedge of our Canadian business. Following the dedesignation of the cash flow hedges, a
$6.7 million
loss was reclassified from AOCI to earnings and recorded as other income (expense).
In March 2012, we cash settled the remaining approximate
25%
of our original cross currency swaps that was not refinanced in October 2011 as discussed above. As a result of the settlement, we extinguished
$110.6 million
of the outstanding liability. Our outstanding cross currency swaps were in a net liability position of
$220.4 million
classified as non-current derivative hedging instruments at
December 29, 2012
.
Foreign Currency Forwards
As of year-end, we have financial foreign exchange forward contracts in place to manage our exposure to foreign currency fluctuations. We hedge foreign currency exposure related to certain royalty agreements, exposure associated with the purchase of production inputs and imports that are denominated in currencies other than the functional entity's local currency, and other foreign exchanges exposures. These contracts have been designated as cash flow hedges of forecasted foreign currency transactions. We use foreign currency forward contracts to hedge these future forecasted transactions up to a
36
month horizon.
124
Commodity Swaps
As of year-end, we had financial commodity swap contracts in place to hedge certain future expected purchases of natural gas. Essentially, these contracts allow us to swap our floating exposure to natural gas prices for a fixed rate. These contracts have been designated as cash flow hedges of forecasted natural gas purchases. The fair value of these swaps depends upon current market rates in relation to our fixed rate under the swap agreements at period end. MCBC uses these swaps to hedge forecasted purchases up to
24
months in advance.
Additionally, in 2011, we entered into financial commodity swap contracts to hedge our exposure to changes in the prices of aluminum and diesel. These contracts allow us to swap our floating exposure to changes in aluminum or diesel prices for a fixed rate. These contracts are not designated in hedge accounting relationships. As such, changes in fair value of these swaps are recorded in cost of goods sold in the consolidated statements of operations. We hedge forecasted purchases of aluminum up to
36
months and diesel up to
24
months out in the future for use in our supply chain. For purposes of measuring segment operating performance, the unrealized changes in fair value of the swaps not designated in hedge accounting relationships are reported in Corporate outside of segment specific operating results until such time that the exposure we are managing is realized. At that time we reclassify the gain or loss from Corporate to the operating segment, allowing our operating segments to realize the economic effects of the derivative without the resulting unrealized mark-to-market volatility.
Total Return Swaps
In 2008, we entered into a series of cash settled total return swap contracts. We transacted these swaps for the purpose of gaining exposure to Foster's, a major global brewer. These swaps were marked-to-market each period as these swaps did not qualify for hedge accounting. As such, all unrealized gains and losses related to these swaps were recorded directly to the income statement and were classified as other income (expense) in Corporate. During the third quarter of 2010, we accelerated the maturity dates of our total return swaps related to Foster's stock, and the majority of these swaps were settled prior to year end. Simultaneously, we entered into a series of option contracts to limit our exposure to future changes in Foster's stock price, effectively fixing a range of settlement values for our remaining open swap positions. The remaining total return swaps and related options matured in January of 2011.
Forward Starting Interest Rate Swaps
In order to manage our exposure to the volatility of the interest rates associated with the future interest payments on a forecasted debt issuance, we transacted forward starting interest rate swap contracts on our CAD
900 million
and CAD
500 million
private placements in Canada. These swaps had effective dates mirroring the terms of the forecasted debt issuances. Under these agreements we were required to early terminate these swaps at the approximate time we issued the previously forecasted debt. See Note 14, "Debt" for further discussion of our CAD
900 million
and CAD
500 million
fixed rate senior notes, and the impact of the forward starting interest rates swaps on the effective interest rate of each issuance. We had designated these contracts as cash flow hedges of a portion of the interest payments on a future forecasted debt issuance.
Derivative Fair Value Measurements
We utilize market approaches to estimate the fair value of our derivative instruments by discounting anticipated future cash flows derived from the derivative's contractual terms and observable market interest, foreign exchange and commodity rates. The fair values of our derivatives also include credit risk adjustments to account for our counterparties' credit risk, as well as our own non-performance risk.
125
The table below summarizes our derivative assets and liabilities that were measured at fair value as of
December 29, 2012
and
December 31, 2011
. See Note 1 "Basis of Presentation and Summary of Significant Accounting Policies" for further discussion related to measuring fair value derivative instruments.
|
|
|
Fair Value Measurements at
December 29, 2012 Using |
|||||||||||||
|
|
Total at
December 29, 2012
|
Quoted prices
in active markets
(Level 1)
|
Significant
Other
Observable
Inputs
(Level 2)
|
Significant
Unobservable
Inputs
(Level 3)
|
|||||||||||
|
|
(In millions)
|
||||||||||||||
|
Cross currency swaps
|
$
|
(220.4
|
)
|
$
|
—
|
|
$
|
(220.4
|
)
|
$
|
—
|
|
|||
|
Foreign currency forwards
|
(1.7
|
)
|
—
|
|
(1.7
|
)
|
—
|
|
|||||||
|
Commodity swaps
|
(2.5
|
)
|
—
|
|
(2.5
|
)
|
—
|
|
|||||||
|
Equity conversion feature of debt
|
(7.9
|
)
|
—
|
|
—
|
|
(7.9
|
)
|
|||||||
|
Total
|
$
|
(232.5
|
)
|
$
|
—
|
|
$
|
(224.6
|
)
|
$
|
(7.9
|
)
|
|||
|
|
|
Fair Value Measurements at
December 31, 2011 Using |
|||||||||||||
|
|
Total at
December 31, 2011
|
Quoted prices
in active markets
(Level 1)
|
Significant
Other
Observable
Inputs
(Level 2)
|
Significant
Unobservable
Inputs
(Level 3)
|
|||||||||||
|
|
(In millions)
|
||||||||||||||
|
Cross currency swaps
|
$
|
(311.9
|
)
|
$
|
—
|
|
$
|
(311.9
|
)
|
$
|
—
|
|
|||
|
Foreign currency forwards
|
2.2
|
|
—
|
|
2.2
|
|
—
|
|
|||||||
|
Commodity swaps
|
(6.9
|
)
|
—
|
|
(6.9
|
)
|
—
|
|
|||||||
|
Total
|
$
|
(316.6
|
)
|
$
|
—
|
|
$
|
(316.6
|
)
|
$
|
—
|
|
|||
The table below summarizes derivative valuation activity using significant unobservable inputs (Level 3) (In millions):
|
|
Rollforward of
Level 3 Inputs
|
||
|
Balance at December 25, 2010
|
$
|
2.9
|
|
|
Total gains or losses (realized/unrealized)
|
|
||
|
Included in earnings (or change in net assets)
|
1.5
|
|
|
|
Included in AOCI
|
—
|
|
|
|
Purchases, issuances and settlements
|
(4.4
|
)
|
|
|
Transfers In/Out of Level 3
|
—
|
|
|
|
Balance at December 31, 2011
|
$
|
—
|
|
|
Total gains or losses (realized/unrealized)
|
|
||
|
Included in earnings (or change in net assets)
|
7.3
|
|
|
|
Included in AOCI
|
—
|
|
|
|
Issuances(1)
|
(15.2
|
)
|
|
|
Settlements
|
—
|
|
|
|
Transfers In/Out of Level 3
|
—
|
|
|
|
Balance at December 29, 2012
|
$
|
(7.9
|
)
|
|
Unrealized gains or losses for Level 3 assets/liabilities outstanding at December 29, 2012(1)
|
$
|
7.3
|
|
(1) At issuance, we recorded a liability of
$15.2 million
related to the Convertible Note's embedded conversion feature.
As of
December 29, 2012
, the conversion feature related to the Convertible Note is classified as a Level 3 derivative due to valuations based upon significant unobservable inputs. As of
December 31, 2011
, we did not hold derivatives classified as
126
Level 3, as we settled all of our option contracts that were classified as Level 3 at
December 25, 2010
, during the first quarter of
2011
. We did not have any significant transfers between Level 1 and Level 2 during
2012
or
2011
. New derivative contracts transacted during fiscal year
2011
are all included in Level 2.
Quantitative information regarding significant unobservable inputs used for recurring Level 3 fair value measurements of financial instruments carried at fair value, were as follows (in millions):
|
Balance at December 29, 2012
|
Valuation Technique
|
Significant Unobservable Input(s)/Sensitivity of the Fair Value to Changes in the Unobservable Inputs
|
Range
|
|||
|
Equity conversion feature of debt
|
$
|
(7.9
|
)
|
Option model
|
Implied volatility(1)
|
21-25%
|
|
(1)
|
Significant increase (decrease) in the unobservable input in isolation would result in a significantly higher (lower) fair value measurement.
|
Results of Period Derivative Activity
The following tables include the year-to-date results of our derivative activity in our consolidated balance sheets as of
December 29, 2012
, and
December 31, 2011
, and our consolidated statements of operations for the year ended
December 29, 2012
,
December 31, 2011
, and
December 25, 2010
, respectively.
Fair Value of Derivative Instruments in the Consolidated Balance Sheets
(in millions, except for certain commodity swaps with notional amounts measured in Metric Tonnes, as noted)
|
|
As of December 29, 2012
|
|||||||||||||||
|
|
|
|
Asset derivatives
|
Liability derivatives
|
||||||||||||
|
|
Notional amount
|
Balance sheet
location
|
Fair value
|
Balance sheet
location
|
Fair value
|
|||||||||||
|
Derivatives designated as hedging instruments:
|
|
|
|
|
||||||||||||
|
Cross currency swaps
|
CAD
|
601.3
|
|
Other current assets
|
$
|
—
|
|
Current derivative hedging instruments
|
$
|
—
|
|
|||||
|
|
|
|
Other non-current assets
|
—
|
|
Non-current derivative hedging instruments
|
(220.4
|
)
|
||||||||
|
Foreign currency forwards
|
USD
|
507.3
|
|
Other current assets
|
2.0
|
|
Current derivative hedging instruments
|
(3.4
|
)
|
|||||||
|
|
|
|
Other non-current assets
|
1.4
|
|
Non-current derivative hedging instruments
|
(1.7
|
)
|
||||||||
|
Commodity swaps
|
kWh
|
486.1
|
|
Other current assets
|
—
|
|
Current derivative hedging instruments
|
(1.0
|
)
|
|||||||
|
|
|
|
Other non-current assets
|
0.2
|
|
Non-current derivative hedging instruments
|
(0.1
|
)
|
||||||||
|
Total derivatives designated as hedging instruments
|
|
|
|
|
$
|
3.6
|
|
|
$
|
(226.6
|
)
|
|||||
|
Derivatives not designated as hedging instruments:
|
|
|
|
|
||||||||||||
|
Equity conversion feature of debt
|
EUR
|
500.0
|
|
Current portion of long-term debt and short-term borrowings
|
$
|
(7.9
|
)
|
|||||||||
|
Aluminum swaps
|
Metric tonnes (actual)
|
2,850
|
|
Other current assets
|
—
|
|
Current derivative hedging instruments
|
(1.4
|
)
|
|||||||
|
Diesel swaps
|
Metric tonnes (actual)
|
5,493
|
|
Other current assets
|
—
|
|
Current derivative hedging instruments
|
(0.2
|
)
|
|||||||
|
Total derivatives not designated as hedging instruments
|
|
|
|
|
$
|
—
|
|
|
$
|
(9.5
|
)
|
|||||
|
Non-derivative financial instruments in net investment hedge relationships:
|
||||||||||||||||
|
€120 million term loan due 2016
|
EUR
|
93.7
|
|
Long-term debt
|
$
|
(123.9
|
)
|
|||||||||
|
Total non-derivative financial instruments in net investment hedge relationships
|
$
|
(123.9
|
)
|
|||||||||||||
127
|
|
As of December 31, 2011
|
|||||||||||||||
|
|
|
Asset derivatives
|
Liability derivatives
|
|||||||||||||
|
|
Notional amount
|
Balance sheet location
|
Fair value
|
Balance sheet location
|
Fair value
|
|||||||||||
|
Derivatives designated as hedging instruments:
|
|
|
|
|
||||||||||||
|
Cross currency swaps
|
CAD
|
901.3
|
|
Other current assets
|
$
|
—
|
|
Current derivative hedging instruments
|
$
|
(103.2
|
)
|
|||||
|
|
|
|
Other non-current assets
|
—
|
|
Non-current derivative hedging instruments
|
(208.7
|
)
|
||||||||
|
Foreign currency forwards
|
USD
|
464.6
|
|
Other current assets
|
—
|
|
Current derivative hedging instruments
|
(1.3
|
)
|
|||||||
|
|
|
|
Other non-current assets
|
3.4
|
|
Non-current derivative hedging instruments
|
—
|
|
||||||||
|
Commodity swaps
|
kWh
|
611.1
|
|
Other current assets
|
—
|
|
Current derivative hedging instruments
|
(1.8
|
)
|
|||||||
|
|
|
|
Other non-current assets
|
—
|
|
Non-current derivative hedging instruments
|
(0.5
|
)
|
||||||||
|
Total derivatives designated as hedging instruments
|
|
|
|
|
$
|
3.4
|
|
|
$
|
(315.5
|
)
|
|||||
|
Derivatives not designated as hedging instruments:
|
|
|
|
|
||||||||||||
|
Aluminum swaps
|
Metric tonnes (actual)
|
8,825
|
|
Other current assets
|
$
|
—
|
|
Current derivative hedging instruments
|
$
|
(1.3
|
)
|
|||||
|
Other non-current assets
|
—
|
|
Non-current derivative hedging instruments
|
(3.3
|
)
|
|||||||||||
|
Diesel swaps
|
Metric tonnes (actual)
|
9,668
|
|
Other current assets
|
0.1
|
|
Current derivative hedging instruments
|
—
|
|
|||||||
|
Total derivatives not designated as hedging instruments
|
|
|
|
|
$
|
0.1
|
|
|
$
|
(4.6
|
)
|
|||||
MCBC allocates the current and non-current portion of each contract to the corresponding derivative account above.
The Effect of Derivative Instruments on the Consolidated Statements of Operations
(in millions)
|
For the year ended December 29, 2012
|
|||||||||||||||
|
Derivatives in cash flow hedge relationships
|
Amount of gain
(loss) recognized
in OCI on
derivative
(effective portion)
|
Location of gain
(loss) reclassified
from AOCI
into income
(effective portion)
|
Amount of gain
(loss) recognized
from AOCI
on derivative
(effective portion)
|
Location of gain
(loss) recognized
in income
on derivative
(ineffective portion
and amount
excluded from
effectiveness testing)
|
Amount of gain
(loss) recognized
in income
on derivative
(ineffective portion
and amount
excluded from
effectiveness testing)
|
||||||||||
|
Forward starting interest rate swaps
|
$
|
—
|
|
Interest expense, net
|
$
|
(1.6
|
)
|
Interest expense, net
|
$
|
—
|
|
||||
|
Foreign currency forwards
|
(10.3
|
)
|
Other income (expense), net
|
(2.3
|
)
|
Other income (expense), net
|
—
|
|
|||||||
|
|
|
Cost of goods sold
|
(4.9
|
)
|
Cost of goods sold
|
—
|
|
||||||||
|
Commodity swaps
|
0.1
|
|
Cost of goods sold
|
(1.4
|
)
|
Cost of goods sold
|
—
|
|
|||||||
|
Total
|
$
|
(10.2
|
)
|
|
$
|
(10.2
|
)
|
|
$
|
—
|
|
||||
128
|
For the year ended December 29, 2012
|
|||||||||||||||
|
Derivatives in net investment hedge relationships
|
Amount of gain
(loss) recognized
in OCI on
derivative
(effective portion)
|
Location of gain
(loss) reclassified
from AOCI
into income
(effective portion)
|
Amount of gain
(loss) recognized
from AOCI
on derivative
(effective portion)
|
Location of gain
(loss) recognized
in income
on derivative
(ineffective portion
and amount
excluded from
effectiveness testing)
|
Amount of gain
(loss) recognized
in income
on derivative
(ineffective portion
and amount
excluded from
effectiveness testing)
|
||||||||||
|
Cross currency swaps
|
$
|
(27.5
|
)
|
Other income (expense), net
|
$
|
—
|
|
Other income (expense), net
|
$
|
—
|
|
||||
|
€120 million term loan due 2016
|
(8.1
|
)
|
Other income (expense), net
|
—
|
|
Other income (expense), net
|
—
|
|
|||||||
|
Total
|
$
|
(35.6
|
)
|
|
$
|
—
|
|
|
$
|
—
|
|
||||
Note: Amounts recognized in AOCI related to cash flow and net investment hedges are presented gross of taxes
During the period, we recorded no significant ineffectiveness related to these cash flow and net investment hedges.
|
For the year ended December 31, 2011
|
|||||||||||||||
|
Derivatives in cash flow hedge relationships
|
Amount of gain
(loss) recognized
in OCI on
derivative
(effective portion)
|
Location of gain
(loss) reclassified
from AOCI
into income
(effective portion)
|
Amount of gain
(loss) recognized
from AOCI
on derivative
(effective portion)
|
Location of gain
(loss) recognized
in income
on derivative
(ineffective portion
and amount
excluded from
effectiveness testing)
|
Amount of gain
(loss) recognized
in income
on derivative
(ineffective portion
and amount
excluded from
effectiveness testing)
|
||||||||||
|
Cross currency swaps(1)
|
$
|
0.2
|
|
Other income (expense), net
|
$
|
3.0
|
|
Other income (expense), net
|
$
|
—
|
|
||||
|
Forward starting interest rate swaps
|
—
|
|
Interest expense, net
|
(1.6
|
)
|
Interest expense, net
|
—
|
|
|||||||
|
Foreign currency forwards
|
0.4
|
|
Other income (expense), net
|
(6.7
|
)
|
Other income (expense), net
|
—
|
|
|||||||
|
|
|
Cost of goods sold
|
(9.6
|
)
|
Cost of goods sold
|
—
|
|
||||||||
|
Commodity swaps
|
0.1
|
|
Cost of goods sold
|
—
|
|
Cost of goods sold
|
—
|
|
|||||||
|
Total
|
$
|
0.7
|
|
|
$
|
(14.9
|
)
|
|
$
|
—
|
|
||||
|
(1)
|
As cash flow hedges, the foreign exchange gain (loss) component of these cross currency swaps was offset by the corresponding gain (loss) on the hedged forecasted transactions in other income (expense), net and interest expense, net. In the fourth quarter of
2011
, the cross currency swaps were dedesignated as cash flow hedges and redesignated as net investment hedges.
|
|
For the year ended December 31, 2011
|
|||||||||||||||
|
Derivatives in net investment hedge relationships
|
Amount of gain
(loss) recognized
in OCI on
derivative
(effective portion)
|
Location of gain
(loss) reclassified
from AOCI
into income
(effective portion)
|
Amount of gain
(loss) recognized
from AOCI
on derivative
(effective portion)
|
Location of gain
(loss) recognized
in income
on derivative
(ineffective portion
and amount
excluded from
effectiveness testing)
|
Amount of gain
(loss) recognized
in income
on derivative
(ineffective portion
and amount
excluded from
effectiveness testing)
|
||||||||||
|
Cross currency swaps
|
$
|
(0.3
|
)
|
Other income (expense), net
|
$
|
—
|
|
Other income (expense), net
|
$
|
—
|
|
||||
|
Total
|
$
|
(0.3
|
)
|
|
$
|
—
|
|
|
$
|
—
|
|
||||
Note: Amounts recognized in AOCI related to cash flow and net investment hedges are presented gross of taxes
During the period, we recorded no significant ineffectiveness related to these cash flow hedges.
129
|
For the year ended December 25, 2010
|
|||||||||||||||
|
Derivatives in cash flow hedge relationships
|
Amount of gain
(loss) recognized
in OCI on
derivative
(effective portion)
|
Location of gain
(loss) reclassified
from AOCI
into income
(effective portion)
|
Amount of gain
(loss) recognized
from AOCI
on derivative
(effective portion)
|
Location of gain
(loss) recognized
in income
on derivative
(ineffective portion
and amount
excluded from
effectiveness testing)
|
Amount of gain
(loss) recognized
in income
on derivative
(ineffective portion
and amount
excluded from
effectiveness testing)
|
||||||||||
|
Cross currency swaps(1)
|
$
|
(9.9
|
)
|
Other income (expense), net
|
$
|
(39.9
|
)
|
Other income (expense), net
|
$
|
—
|
|
||||
|
|
|
Interest expense
|
(12.1
|
)
|
Interest expense
|
—
|
|
||||||||
|
Forward starting interest rate swaps
|
13.9
|
|
Interest expense
|
(0.2
|
)
|
Interest expense
|
—
|
|
|||||||
|
Foreign currency forwards
|
6.3
|
|
Other income (expense), net
|
(5.0
|
)
|
Other income (expense), net
|
—
|
|
|||||||
|
|
|
Cost of goods sold
|
(1.7
|
)
|
Cost of goods sold
|
—
|
|
||||||||
|
|
|
Marketing, general and administrative expenses
|
0.1
|
|
Marketing, general and administrative expenses
|
—
|
|
||||||||
|
Commodity swaps
|
1.2
|
|
Cost of goods sold
|
(1.7
|
)
|
Cost of goods sold
|
—
|
|
|||||||
|
Total
|
$
|
11.5
|
|
|
$
|
(60.5
|
)
|
|
$
|
—
|
|
||||
Note: Amounts recognized in AOCI are presented gross of taxes
|
(1)
|
The foreign exchange gain (loss) component of these cross currency swaps is offset by the corresponding gain (loss) on the hedged forecasted transactions in other income (expense), net and interest expense, net.
|
During the period, we recorded no significant ineffectiveness related to these cash flow hedges.
We expect losses of approximately
$2.4 million
(pre-tax) recorded in AOCI at
December 29, 2012
, will be reclassified into earnings within the next 12 months. The maximum length of time over which forecasted transactions are hedged is
three
years, and such transactions relate to foreign exchange, interest rate and commodity exposures.
Other Derivatives
(in millions)
|
For the year ended December 29, 2012
|
||||||
|
Derivatives not in hedging relationship
|
Location of gain (loss) recognized
in income on derivative
|
Amount of gain (loss) recognized
in income on derivative
|
||||
|
Equity conversion feature of debt
|
Interest expense, net
|
$
|
8.0
|
|
||
|
Other income (expense), net
|
(0.7
|
)
|
||||
|
Commodity swaps
|
Cost of goods sold
|
(0.5
|
)
|
|||
|
Total
|
|
$
|
6.8
|
|
||
|
For the year ended December 31, 2011
|
||||||
|
Derivatives not in hedging relationship
|
Location of gain (loss) recognized
in income on derivative
|
Amount of gain (loss) recognized
in income on derivative
|
||||
|
Commodity swaps
|
Cost of goods sold
|
$
|
(4.7
|
)
|
||
|
Cash settled total return swap
|
Other income (expense), net
|
(0.6
|
)
|
|||
|
Option contracts
|
Other income (expense), net
|
1.5
|
|
|||
|
Foreign currency forwards
|
Other income (expense), net
|
(0.1
|
)
|
|||
|
Total
|
|
$
|
(3.9
|
)
|
||
|
For the year ended December 25, 2010
|
||||||
|
Derivatives not in hedging relationship
|
Location of gain (loss) recognized
in income on derivative
|
Amount of gain (loss) recognized
in income on derivative
|
||||
|
Cash settled total return swap
|
Other income (expense), net
|
$
|
28.3
|
|
||
|
Option contracts
|
Other income (expense), net
|
21.7
|
|
|||
|
Foreign currency forwards
|
Other income (expense), net
|
(6.0
|
)
|
|||
|
Total
|
$
|
44.0
|
|
|||
130
19. Accrued expenses and other liabilities
|
|
As of
|
||||||
|
|
December 29, 2012
|
December 31, 2011
|
|||||
|
|
(In millions)
|
||||||
|
Accrued compensation
|
$
|
93.7
|
|
$
|
54.3
|
|
|
|
Accrued excise taxes
|
212.3
|
|
246.2
|
|
|||
|
Accrued interest
|
36.8
|
|
23.1
|
|
|||
|
Accrued selling and marketing costs
|
105.0
|
|
117.3
|
|
|||
|
Container liability
|
104.1
|
|
43.5
|
|
|||
|
Accrued pension and postretirement benefits
|
11.6
|
|
10.1
|
|
|||
|
Other
|
196.4
|
|
152.3
|
|
|||
|
Accrued expenses and other liabilities
|
$
|
759.9
|
|
$
|
646.8
|
|
|
The increase in accrued expenses and other liabilities from 2011 to 2012 is primarily driven by the Acquisition, partially offset by a decrease in accrued excise taxes in the U.K. and Canada due to lower volumes and cycling the 53rd week in 2011.
20. Commitments and Contingencies
Letters of Credit
As of
December 29, 2012
, we had approximately
$37.2 million
outstanding in letters of credit with financial institutions. These letters expire throughout 2013. Approximately
$21.9 million
of the letters contain a feature that automatically renews the letter for an additional year if no cancellation notice is submitted. These letters of credit are being maintained as security for deferred compensation payments, reimbursements to insurance companies, reimbursements to the trustee for pension payments, deductibles or retention payments made on our behalf, various payments due to governmental agencies, and for operations of underground storage tanks, and are not included on our consolidated balance sheets.
Guarantees
We guarantee indebtedness and other obligations to banks and other third parties for some of our equity investments and consolidated subsidiaries.
Rocky Mountain Metal Container ("RMMC"), a Colorado limited liability company, is a joint venture with Ball Corporation in which MillerCoors holds and consolidates a
50%
interest. RMMC produces cans and ends for MillerCoors. Prior to the formation of MillerCoors on July 1, 2008, we held the
50%
interest in RMMC and consolidated the results and financial position of RMMC. As of
December 29, 2012
, and
December 31, 2011
, we guaranteed
$4.5 million
and
$9.1 million
, respectively, of RMMC debt which is due in 2013.
Related to our previous ownership in the Montréal Canadiens, we guarantee its obligations under a ground lease for the Bell Centre Arena (the "Ground Lease Guarantee"). Upon sale of our interest, the new owners agreed to indemnify us in connection with the liabilities we may incur under the Ground Lease Guarantee and provided us with a CAD
10 million
letter of credit to guarantee such indemnity. This transaction did not materially affect our risk exposure related to the Ground Lease Guarantee, which continues to be recognized as a liability on our consolidated balance sheets.
Related to guarantees, other liabilities in the accompanying consolidated balance sheets include
$6.2 million
as of
December 29, 2012
, and
$6.1 million
as of
December 31, 2011
, both of which are non-current.
131
Supply Contracts
We have various long-term supply contracts with unaffiliated third parties and our joint venture partners to purchase materials used in production and packaging. The supply contracts provide that we purchase certain minimum levels of materials throughout the terms of the contracts. The future aggregate minimum required purchase commitments under these supply contracts are shown in the table below based on foreign exchange rates as of
December 29, 2012
. The amounts in the table do not represent all anticipated payments under long-term contracts. Rather, they represent unconditional and legally enforceable committed expenditures:
|
Fiscal year
|
Amount
|
|||
|
|
(In millions)
|
|||
|
2013
|
$
|
379.4
|
|
|
|
2014
|
291.4
|
|
||
|
2015
|
194.5
|
|
||
|
2016
|
154.7
|
|
||
|
2017
|
11.7
|
|
||
|
Thereafter
|
—
|
|
||
|
Total
|
$
|
1,031.7
|
|
|
Total purchases under our supply contracts in
2012
,
2011
and
2010
were approximately
$791.6 million
,
$559.5 million
and
$492.8 million
, respectively.
Additionally, Tradeteam has a contract with us to provide for transportation and logistics services in the U.K. until 2018. See further discussion including financial commitments in Note 5, "Investments."
Advertising and Promotions
We have various long-term non-cancelable commitments for advertising, sponsorships and promotions, including marketing at sports arenas, stadiums and other venues and events. Based on foreign exchange rates as of
December 29, 2012
, these future commitments are as follows:
|
Fiscal year
|
Amount
|
|||
|
|
(In millions)
|
|||
|
2013
|
$
|
144.2
|
|
|
|
2014
|
65.8
|
|
||
|
2015
|
48.9
|
|
||
|
2016
|
42.0
|
|
||
|
2017
|
41.7
|
|
||
|
Thereafter
|
56.8
|
|
||
|
Total
|
$
|
399.4
|
|
|
Total advertising expense was
$423.5 million
,
$398.8 million
and
$361.6 million
in
2012
,
2011
and
2010
, respectively.
132
Operating Leases
We lease certain office facilities and operating equipment under cancelable and non-cancelable agreements accounted for as operating leases. Based on foreign exchange rates as of
December 29, 2012
, future minimum lease payments under operating leases that have initial or remaining non-cancelable terms in excess of one year are as follows:
|
Fiscal year
|
Amount
|
|||
|
|
(In millions)
|
|||
|
2013
|
$
|
35.0
|
|
|
|
2014
|
25.8
|
|
||
|
2015
|
19.7
|
|
||
|
2016
|
14.2
|
|
||
|
2017
|
7.5
|
|
||
|
Thereafter
|
21.8
|
|
||
|
Total
|
$
|
124.0
|
|
|
Total rent expense was
$37.0 million
,
$35.3 million
and
$33.5 million
in
2012
,
2011
and
2010
, respectively.
Kaiser
As discussed in Note 6 "Discontinued Operations," we sold our entire equity interest in Kaiser during 2006 to FEMSA. The terms of the sale agreement require us to indemnify FEMSA for certain exposures related to tax, civil and labor contingencies arising prior to FEMSA's purchase of Kaiser. We provided an indemnity to FEMSA for losses Kaiser may incur with respect to tax claims associated with certain previously utilized purchased tax credits. We generally classify such purchased tax credits into
two
categories.
During 2010, we reached a settlement agreement with FEMSA for the entirety of our indemnity obligations corresponding to the principal, penalties, interest and attorney's fees owed by Kaiser for the first category of purchased credits. This favorable settlement involved a cash payment of
$96.0 million
, and eliminated
$284.5 million
of maximum potential tax claims, of which
$131.2 million
of indemnity liabilities were accrued on our consolidated balance sheets at December 26, 2009. The payment was made in the second quarter of 2010. The maximum potential claims amount remaining for the second category of purchased tax credits (which we believe present less risk than the first category), was
$216.1 million
as of
December 29, 2012
. As of
December 29, 2012
, our total estimate of the indemnity liability was
$19.6 million
,
$7.9 million
of which was classified as a current liability and
$11.7 million
of which was classified as non-current.
Our estimates consider a number of scenarios for the ultimate resolution of these issues, the probabilities of which are influenced not only by legal developments in Brazil but also by management's intentions with regard to various alternatives that could present themselves leading to the ultimate resolution of these issues. The liabilities are impacted by changes in estimates regarding amounts that could be paid, the timing of such payments, adjustments to the probabilities assigned to various scenarios and foreign currency exchange rates.
Additionally, we also provided FEMSA with indemnity related to all other tax, civil, and labor contingencies existing as of the date of sale. In this regard, however, FEMSA assumed their full share of all of these contingent liabilities that had been previously recorded and disclosed by us prior to the sale on January 13, 2006. However, we may have to provide indemnity to FEMSA if those contingencies settle at amounts greater than those amounts previously recorded or disclosed by us. We will be able to offset any indemnity exposures in these circumstances with amounts that settle favorably to amounts previously recorded. Our exposure related to these indemnity claims is capped at the amount of the sales price of the
68%
equity interest of Kaiser, which was
$68.0 million
. As a result of these contract provisions, our estimates include not only probability-weighted potential cash outflows associated with indemnity provisions, but also probability-weighted cash inflows that could result from favorable settlements, which could occur through negotiation or settlement programs arising from the federal or any of the various state governments in Brazil. The recorded value of the tax, civil, and labor indemnity liability was
$8.3 million
as of
December 29, 2012
, which is classified as non-current.
Future settlement procedures and related negotiation activities associated with these contingencies are largely outside of our control. The sale agreement requires annual cash settlements relating to the tax, civil, and labor indemnities. Indemnity obligations related to purchased tax credits must be settled upon notification of FEMSA's settlement. Due to the uncertainty involved with the ultimate outcome and timing of these contingencies, significant adjustments to the carrying values of the indemnity obligations have been recorded to date, and additional future adjustments may be required. These liabilities are
133
denominated in Brazilian Reais and are therefore, subject to foreign exchange gains or losses, which are recognized in the discontinued operations section of the consolidated statements of operations.
The table below provides a summary of reserves associated with the Kaiser indemnity obligations from
December 26, 2009
, through
December 29, 2012
:
|
Total indemnity
reserves
|
|||
|
|
(In millions)
|
||
|
Balance at December 26, 2009
|
$
|
164.1
|
|
|
Changes in estimates
|
(32.3
|
)
|
|
|
Cash settlement
|
(96.0
|
)
|
|
|
Foreign exchange transaction impact
|
(2.1
|
)
|
|
|
Balance at December 25, 2010
|
$
|
33.7
|
|
|
Changes in estimates
|
—
|
|
|
|
Foreign exchange transaction impact
|
(3.1
|
)
|
|
|
Balance at December 31, 2011
|
$
|
30.6
|
|
|
Changes in estimates
|
—
|
|
|
|
Foreign exchange transaction impact
|
(2.7
|
)
|
|
|
Balance at December 29, 2012
|
$
|
27.9
|
|
Litigation and Other Disputes and Environmental
Related to litigation, other disputes and environmental issues, we have accrued an aggregate of
$14.5 million
as of
December 29, 2012
, and
$15.3 million
as of
December 31, 2011
. We believe that any reasonably possible losses in excess of the amounts accrued are immaterial to our consolidated financial statements.
In addition to the specific cases discussed below, we are involved in other disputes and legal actions arising in the ordinary course of our business. While it is not feasible to predict or determine the outcome of these proceedings, in our opinion, based on a review with legal counsel, none of these disputes and legal actions is expected to have a material impact on our consolidated financial position, results of operations or cash flows. However, litigation is subject to inherent uncertainties and an adverse result in these or other matters may arise from time to time that may harm our business.
While we cannot predict the eventual aggregate cost for environmental and related matters in which we are currently involved, we believe that any payments, if required, for these matters would be made over a period of time in amounts that would not be material in any one year to our results from operations, cash flows or our financial or competitive position. We believe adequate reserves have been provided for losses that are probable and estimable.
Litigation and Other Disputes
In 1999, Molson entered into an agreement for the distribution of Molson products in Brazil. In 2000, before commencing that business, Molson terminated the distribution agreement and paid the distributor
$150,000
in settlement. The distributor then sued Molson to set aside the settlement and to seek additional compensation. The Appellate Court of the State of Rio de Janeiro set aside the settlement agreement and determined that Molson was liable to the distributor, with the amount of damages to be determined through subsequent proceedings. Since 2000 we have been in a number of different legal proceedings and filed various appeals.
However,
during 2012, we entered into discussions and finalized the settlement related to the distributor litigation for
$6.8 million
, which included the
$4.8 million
accrued at December 31, 2011, as well as an additional
$2.0 million
loss on settlement.
I
n December 2012, Miller Brewing Company (“Miller”) orally informed us of its intent to terminate the license agreement between Miller and us whereby we have exclusive rights to distribute certain Miller products in Canada (the “License Agreement”). Miller alleges that we failed to meet certain volume sales targets under the License Agreement. We do not believe Miller has any right under the License Agreement or otherwise to terminate the License Agreement. Following this communication, we filed a lawsuit in Ontario, Canada (Molson Canada 2005 v. Miller Brewing Company, Sup. Ct. of Justice-Ontario, CV-12-470589) seeking an injunction preventing Miller from terminating the License Agreement and ordering Miller to abide by its contractual terms. On January 18, 2013, Miller sent written notice to us purporting to terminate the License Agreement. In our lawsuit, we also assert that Miller breached the License Agreement by attempting to terminate the License Agreement. We intend to vigorously assert and defend our rights in this lawsuit. At this time we are unable to predict the
134
outcome of this litigation or the impact, if any, of an adverse outcome on our business and results of operations, including any possible future asset impairment. As of December 29, 2012, we had a definite-lived intangible asset related to the License Agreement with a carrying value of approximately
$70 million
and a remaining life of
7
years.
Environmental
When we determine it is probable that a liability for environmental matters or other legal actions exists and the amount of the loss is reasonably estimable, an estimate of the future costs is recorded as a liability in the financial statements. Costs that extend the life, increase the capacity or improve the safety or efficiency of our assets or are incurred to mitigate or prevent future environmental contamination may be capitalized. Other environmental costs are expensed when incurred. Total environmental expenditures are recognized as other expense for
2012
and
2011
of
$0.4 million
and
$0.2 million
, respectively, and other income for
2010
of
$0.2 million
.
As described below, we have been notified that we are or may be a potentially responsible party ("PRP") under the Comprehensive Environmental Response, Compensation, and Liability Act or similar state laws for the cleanup of sites where hazardous substances have allegedly been released into the environment. We cannot predict with certainty the total costs of cleanup, our share of the total cost, the extent to which contributions will be available from other parties, the amount of time necessary to complete the cleanups or insurance coverage.
Canada
Our Canada brewing operations are subject to provincial environmental regulations and local permit requirements. Our Montréal and Toronto breweries have water treatment facilities to pre-treat waste water before it goes to the respective local governmental facility for final treatment. We have environmental programs in Canada including organization, monitoring and verification, regulatory compliance, reporting, education and training, and corrective action.
We sold a chemical specialties business in 1996. We are still responsible for certain aspects of environmental remediation, undertaken or planned, at those chemical specialties business locations. We have established provisions for the costs of these remediation programs.
United States
Lowry
We are one of a number of entities named by the Environmental Protection Agency ("EPA") as a PRP at the Lowry Superfund site. This landfill is owned by the City and County of Denver ("Denver") and is managed by Waste Management of Colorado, Inc. ("Waste Management"). In 1990, we recorded a pre-tax charge of
$30 million
, a portion of which was put into a trust in 1993 as part of a settlement with Denver and Waste Management regarding the then-outstanding litigation. Our settlement was based on an assumed remediation cost of
$120 million
(in 1992 adjusted dollars). We are obligated to pay a portion of future costs, if any, in excess of that amount.
Waste Management provides us with updated annual cost estimates currently extending through 2032. We review these cost estimates in the assessment of our accrual related to this issue. We use certain assumptions that differ from Waste Management's estimates to assess our expected liability. Our expected liability (based on the
$120 million
threshold being met) is based on our best estimates available.
The assumptions used are as follows:
|
•
|
trust management costs are included in projections with regard to the
$120 million
threshold, but are expensed only as incurred;
|
|
•
|
income taxes, which we believe are not an included cost, are excluded from projections with regard to the
$120 million
threshold;
|
|
•
|
a
2.5%
inflation rate for future costs; and
|
|
•
|
certain operations and maintenance costs were discounted using a
1.69%
risk-free rate of return.
|
Based on these assumptions, the present value and gross amount of the costs at
December 29, 2012
, are approximately
$4.3 million
and
$7.8 million
, respectively. We did not assume any future recoveries from insurance companies in the estimate of our liability, and none are expected.
Considering the estimates extend through the year 2032 and the related uncertainties at the site, including what additional remedial actions may be required by the EPA, new technologies and what costs are included in the determination of when the
135
$120 million
is reached, the estimate of our liability may change as further facts develop. We cannot predict the amount of any such change, but additional accruals in the future are possible.
Other
In prior years, we have been notified by the EPA and certain state environmental divisions that we are a PRP, along with other parties, at the Cooper Drum site in southern California, the East Rutherford and Berry's Creek sites in New Jersey and the Chamblee and Smyrna sites in Georgia. Certain former non-beer business operations, which we discontinued use of and sold (excluding the property of the former Chamblee site) in the mid-1990s, were involved at these sites. Potential losses associated with these sites could increase as remediation planning progresses.
We are aware of groundwater contamination at some of our properties in Colorado resulting from historical, ongoing, or nearby activities. There may also be other contamination of which we are currently unaware.
Central Europe
We are subject to the requirements of governmental and local environmental and occupational health and safety laws and regulations within each of the countries in which we operate. Compliance with these laws and regulations did not materially affect our 2012 capital expenditures, results of operations or our financial or competitive position, and we do not anticipate that they will do so in
2013
.
United Kingdom
We are subject to the requirements of government and local environmental and occupational health and safety laws and regulations. Compliance with these laws and regulations did not materially affect our
2012
capital expenditures, results from operations or our financial or competitive position, and we do not anticipate that they will do so in
2013
.
21. Supplemental Guarantor Information
For purposes of this Note 21, including the tables, "Parent Guarantor, 2007 and 2012 Issuer" shall mean MCBC and "Subsidiary Guarantors" shall mean certain U.S., U.K. and Canadian subsidiaries reflecting the substantial operations of each of our segments, with the exception of Central Europe and MCI.
SEC Registered Securities
On
June 15, 2007
, MCBC issued
$575 million
of
2.5%
Convertible Senior Notes due
July 30, 2013
, in a registered public offering (see Note 14, "Debt"). The convertible notes are guaranteed on a senior unsecured basis by the Subsidiary Guarantors, each of which is
100%
owned by the Parent Guarantor. The guarantees are full and unconditional and joint and several.
On May 3, 2012, MCBC issued
$1.9 billion
of senior notes, in a registered public offering, consisting of
$300 million
2.0%
senior notes due 2017,
$500 million
3.5%
senior notes due 2022, and
$1.1 billion
5.0%
senior notes due 2042. These senior notes are guaranteed on a senior unsecured basis by the Subsidiary Guarantors. Each of the Subsidiary Guarantors is 100% owned by the Parent Guarantor. The guarantees are full and unconditional and joint and several. The issuance of this debt also required the simultaneous addition of guarantors to our existing senior unsecured notes, pursuant to requirements of the respective debt agreements. This resulted in a change to the presentation of our guarantor financial statements to include the new guarantor entities (primarily our U.K. operations) as guarantors on all current and future filings, as well as to recast the historical presentation to include these entities within the Subsidiary Guarantor column. See Note 14, "Debt" for further discussion of the senior notes issuance.
Other Debt
On
September 22, 2005
, Molson Coors Capital Finance ULC ("MC Capital Finance") issued
$1.1 billion
of senior notes consisting of
$300 million
4.85%
U.S. publicly registered notes due
2010
and CAD
900 million
5.00%
privately placed notes maturing on September 22,
2015
. These CAD
900 million
senior notes were subsequently exchanged for substantially identical CAD
900 million
senior notes which were quantified by way of a prospectus in Canada. In connection with an internal corporate reorganization, Molson Coors International LP ("MCI LP") was subsequently added as a co-issuer of the CAD
900 million
senior notes. Following the repayment of our
$300 million
senior notes in 2010, we were no longer required to present the “2005 and 2010 Issuer” column (historically consisting of MC Capital Finance and MCI LP) and as such have removed that column. Additionally, the continuous disclosure requirements applicable to MC Capital Finance in Canada are satisfied through the consolidating financial information in respect of MC Capital Finance, MCI LP and other subsidiary guarantors of the CAD
900 million
senior notes as currently presented within the Subsidiary Guarantors column.
136
None of our other outstanding debt is publicly registered and it is all guaranteed on a senior and unsecured basis by the Parent Guarantor and certain Subsidiary Guarantors. These guarantees are full and unconditional and joint and several. See Note 14, "Debt" for details of all debt issued and outstanding as of
December 29, 2012
.
Presentation
On
May 7, 2002
, CBC completed a public offering of
$850 million
principal amount of
6.375%
10
-year senior notes due
2012
, which were repaid in full during the second quarter of 2012. Following the repayment, we are no longer required to present the "2002 Issuer" column (historically representing CBC) and as such have removed the column from the current and historical guarantor financial statements. CBC remains a guarantor of our existing senior unsecured notes, as such, the results of CBC are now included in the Subsidiary Guarantors column.
The following information sets forth the condensed consolidating statements of operations for the fiscal years ended
December 29, 2012
,
December 31, 2011
, and
December 25, 2010
, condensed consolidating balance sheets as of
December 29, 2012
, and
December 31, 2011
, and condensed consolidating statements of cash flows for the fiscal years ended
December 29, 2012
,
December 31, 2011
, and
December 25, 2010
. Investments in subsidiaries are accounted for on the equity method; accordingly, entries necessary to consolidate the Parent Guarantor, each of the issuers and all of our guarantor and non-guarantor subsidiaries are reflected in the eliminations column. In the opinion of management, separate complete financial statements of MCBC, CBC and the Subsidiary Guarantors would not provide additional material information that would be useful in assessing their financial composition.
137
MOLSON COORS BREWING COMPANY AND SUBSIDIARIES
CONDENSED CONSOLIDATING STATEMENT OF OPERATIONS
FOR THE FISCAL YEAR ENDED
DECEMBER 29, 2012
(IN MILLIONS)
|
Parent
Guarantor,
2007 and
2012 Issuer
|
Subsidiary
Guarantors
|
Subsidiary
Non
Guarantors
|
Eliminations
|
Consolidated
|
|||||||||||||||
|
Sales
|
$
|
20.7
|
|
$
|
4,839.5
|
|
$
|
947.8
|
|
$
|
(193.0
|
)
|
$
|
5,615.0
|
|
||||
|
Excise taxes
|
—
|
|
(1,503.9
|
)
|
(194.6
|
)
|
—
|
|
(1,698.5
|
)
|
|||||||||
|
Net sales
|
20.7
|
|
3,335.6
|
|
753.2
|
|
(193.0
|
)
|
3,916.5
|
|
|||||||||
|
Cost of goods sold
|
—
|
|
(1,954.2
|
)
|
(558.1
|
)
|
159.8
|
|
(2,352.5
|
)
|
|||||||||
|
Gross profit
|
20.7
|
|
1,381.4
|
|
195.1
|
|
(33.2
|
)
|
1,564.0
|
|
|||||||||
|
Marketing, general and administrative expenses
|
(113.7
|
)
|
(814.7
|
)
|
(230.9
|
)
|
33.2
|
|
(1,126.1
|
)
|
|||||||||
|
Special items, net
|
(4.1
|
)
|
(35.2
|
)
|
(42.1
|
)
|
—
|
|
(81.4
|
)
|
|||||||||
|
Equity income (loss) in subsidiaries
|
391.9
|
|
(582.7
|
)
|
393.6
|
|
(202.8
|
)
|
—
|
|
|||||||||
|
Equity income in MillerCoors
|
—
|
|
510.9
|
|
—
|
|
—
|
|
510.9
|
|
|||||||||
|
Operating income (loss)
|
294.8
|
|
459.7
|
|
315.7
|
|
(202.8
|
)
|
867.4
|
|
|||||||||
|
Interest income (expense), net
|
(107.7
|
)
|
312.8
|
|
(390.1
|
)
|
—
|
|
(185.0
|
)
|
|||||||||
|
Other income (expense), net
|
30.1
|
|
(39.9
|
)
|
(80.5
|
)
|
—
|
|
(90.3
|
)
|
|||||||||
|
Income (loss) from continuing operations before income taxes
|
217.2
|
|
732.6
|
|
(154.9
|
)
|
(202.8
|
)
|
592.1
|
|
|||||||||
|
Income tax benefit (expense)
|
225.8
|
|
(345.8
|
)
|
(34.5
|
)
|
—
|
|
(154.5
|
)
|
|||||||||
|
Net income (loss) from continuing operations
|
443.0
|
|
386.8
|
|
(189.4
|
)
|
(202.8
|
)
|
437.6
|
|
|||||||||
|
Income (loss) from discontinued operations, net of tax
|
—
|
|
—
|
|
1.5
|
|
—
|
|
1.5
|
|
|||||||||
|
Net income (loss) including noncontrolling interests
|
443.0
|
|
386.8
|
|
(187.9
|
)
|
(202.8
|
)
|
439.1
|
|
|||||||||
|
Add back (less): Loss (net income) attributable to noncontrolling interests
|
—
|
|
—
|
|
3.9
|
|
—
|
|
3.9
|
|
|||||||||
|
Net income (loss) attributable to MCBC
|
$
|
443.0
|
|
$
|
386.8
|
|
$
|
(184.0
|
)
|
$
|
(202.8
|
)
|
$
|
443.0
|
|
||||
|
Comprehensive income (loss) attributable to MCBC
|
$
|
598.3
|
|
$
|
529.8
|
|
$
|
(167.7
|
)
|
$
|
(362.1
|
)
|
$
|
598.3
|
|
||||
138
MOLSON COORS BREWING COMPANY AND SUBSIDIARIES
CONDENSED CONSOLIDATING STATEMENT OF OPERATIONS
FOR THE FISCAL YEAR ENDED
DECEMBER 31, 2011
(IN MILLIONS)
|
Parent
Guarantor,
2007 and
2012 Issuer
|
Subsidiary
Guarantors
|
Subsidiary
Non
Guarantors
|
Eliminations
|
Consolidated
|
|||||||||||||||
|
Sales
|
$
|
28.2
|
|
$
|
5,061.3
|
|
$
|
276.4
|
|
$
|
(196.0
|
)
|
$
|
5,169.9
|
|
||||
|
Excise taxes
|
—
|
|
(1,603.3
|
)
|
(50.9
|
)
|
—
|
|
(1,654.2
|
)
|
|||||||||
|
Net sales
|
28.2
|
|
3,458.0
|
|
225.5
|
|
(196.0
|
)
|
3,515.7
|
|
|||||||||
|
Cost of goods sold
|
—
|
|
(1,947.9
|
)
|
(266.0
|
)
|
164.8
|
|
(2,049.1
|
)
|
|||||||||
|
Gross profit
|
28.2
|
|
1,510.1
|
|
(40.5
|
)
|
(31.2
|
)
|
1,466.6
|
|
|||||||||
|
Marketing, general and administrative expenses
|
(119.3
|
)
|
(852.7
|
)
|
(78.2
|
)
|
31.2
|
|
(1,019.0
|
)
|
|||||||||
|
Special items, net
|
(0.8
|
)
|
(11.2
|
)
|
(0.3
|
)
|
—
|
|
(12.3
|
)
|
|||||||||
|
Equity income (loss) in subsidiaries
|
736.5
|
|
(426.1
|
)
|
446.6
|
|
(757.0
|
)
|
—
|
|
|||||||||
|
Equity income in MillerCoors
|
—
|
|
457.9
|
|
—
|
|
—
|
|
457.9
|
|
|||||||||
|
Operating income (loss)
|
644.6
|
|
678.0
|
|
327.6
|
|
(757.0
|
)
|
893.2
|
|
|||||||||
|
Interest income (expense), net
|
(28.8
|
)
|
275.9
|
|
(355.1
|
)
|
—
|
|
(108.0
|
)
|
|||||||||
|
Other income (expense), net
|
(10.6
|
)
|
(2.4
|
)
|
2.0
|
|
—
|
|
(11.0
|
)
|
|||||||||
|
Income (loss) from continuing operations before income taxes
|
605.2
|
|
951.5
|
|
(25.5
|
)
|
(757.0
|
)
|
774.2
|
|
|||||||||
|
Income tax benefit (expense)
|
71.1
|
|
(213.2
|
)
|
42.7
|
|
—
|
|
(99.4
|
)
|
|||||||||
|
Net income (loss) from continuing operations
|
676.3
|
|
738.3
|
|
17.2
|
|
(757.0
|
)
|
674.8
|
|
|||||||||
|
Income (loss) from discontinued operations, net of tax
|
—
|
|
—
|
|
2.3
|
|
—
|
|
2.3
|
|
|||||||||
|
Net income (loss) including noncontrolling interests
|
676.3
|
|
738.3
|
|
19.5
|
|
(757.0
|
)
|
677.1
|
|
|||||||||
|
Add back (less): Loss (net income) attributable to noncontrolling interests
|
—
|
|
—
|
|
(0.8
|
)
|
—
|
|
(0.8
|
)
|
|||||||||
|
Net income (loss) attributable to MCBC
|
$
|
676.3
|
|
$
|
738.3
|
|
$
|
18.7
|
|
$
|
(757.0
|
)
|
$
|
676.3
|
|
||||
|
Comprehensive income (loss) attributable to MCBC
|
$
|
375.5
|
|
$
|
455.7
|
|
$
|
(145.0
|
)
|
$
|
(310.7
|
)
|
$
|
375.5
|
|
||||
139
MOLSON COORS BREWING COMPANY AND SUBSIDIARIES
CONDENSED CONSOLIDATING STATEMENT OF OPERATIONS
FOR THE FISCAL YEAR ENDED
DECEMBER 25, 2010
(IN MILLIONS)
|
Parent
Guarantor,
2007 and
2012 Issuer
|
Subsidiary
Guarantors
|
Subsidiary
Non
Guarantors
|
Eliminations
|
Consolidated
|
|||||||||||||||
|
Sales
|
$
|
22.4
|
|
$
|
4,710.3
|
|
$
|
135.5
|
|
$
|
(165.1
|
)
|
$
|
4,703.1
|
|
||||
|
Excise taxes
|
—
|
|
(1,433.5
|
)
|
(15.2
|
)
|
—
|
|
(1,448.7
|
)
|
|||||||||
|
Net sales
|
22.4
|
|
3,276.8
|
|
120.3
|
|
(165.1
|
)
|
3,254.4
|
|
|||||||||
|
Cost of goods sold
|
—
|
|
(1,780.3
|
)
|
(174.3
|
)
|
142.4
|
|
(1,812.2
|
)
|
|||||||||
|
Gross profit
|
22.4
|
|
1,496.5
|
|
(54.0
|
)
|
(22.7
|
)
|
1,442.2
|
|
|||||||||
|
Marketing, general and administrative expenses
|
(122.9
|
)
|
(850.3
|
)
|
(63.5
|
)
|
24.2
|
|
(1,012.5
|
)
|
|||||||||
|
Special items, net
|
(1.2
|
)
|
(17.5
|
)
|
(2.6
|
)
|
—
|
|
(21.3
|
)
|
|||||||||
|
Equity income (loss) in subsidiaries
|
775.7
|
|
(407.0
|
)
|
456.1
|
|
(824.8
|
)
|
—
|
|
|||||||||
|
Equity income in MillerCoors
|
—
|
|
456.1
|
|
—
|
|
—
|
|
456.1
|
|
|||||||||
|
Operating income (loss)
|
674.0
|
|
677.8
|
|
336.0
|
|
(823.3
|
)
|
864.5
|
|
|||||||||
|
Interest income (expense), net
|
(33.3
|
)
|
245.1
|
|
(311.2
|
)
|
—
|
|
(99.4
|
)
|
|||||||||
|
Other income (expense), net
|
55.3
|
|
6.7
|
|
(18.1
|
)
|
—
|
|
43.9
|
|
|||||||||
|
Income (loss) from continuing operations before income taxes
|
696.0
|
|
929.6
|
|
6.7
|
|
(823.3
|
)
|
809.0
|
|
|||||||||
|
Income tax benefit (expense)
|
11.7
|
|
(157.0
|
)
|
6.6
|
|
—
|
|
(138.7
|
)
|
|||||||||
|
Net income (loss) from continuing operations
|
707.7
|
|
772.6
|
|
13.3
|
|
(823.3
|
)
|
670.3
|
|
|||||||||
|
Income (loss) from discontinued operations, net of tax
|
—
|
|
—
|
|
39.6
|
|
—
|
|
39.6
|
|
|||||||||
|
Net income (loss) including noncontrolling interests
|
707.7
|
|
772.6
|
|
52.9
|
|
(823.3
|
)
|
709.9
|
|
|||||||||
|
Add back (less): Loss (net income) attributable to noncontrolling interests
|
—
|
|
—
|
|
(2.2
|
)
|
—
|
|
(2.2
|
)
|
|||||||||
|
Net income (loss) attributable to MCBC
|
$
|
707.7
|
|
$
|
772.6
|
|
$
|
50.7
|
|
$
|
(823.3
|
)
|
$
|
707.7
|
|
||||
|
Comprehensive income (loss) attributable to MCBC
|
$
|
858.1
|
|
$
|
854.8
|
|
$
|
128.0
|
|
$
|
(982.8
|
)
|
$
|
858.1
|
|
||||
140
MOLSON COORS BREWING COMPANY AND SUBSIDIARIES
CONDENSED CONSOLIDATING BALANCE SHEETS
AS OF
DECEMBER 29, 2012
(IN MILLIONS)
|
Parent
Guarantor,
2007 and
2012 Issuer
|
Subsidiary
Guarantors
|
Subsidiary
Non
Guarantors
|
Eliminations
|
Consolidated
|
|||||||||||||||
|
Assets
|
|
|
|
|
|
||||||||||||||
|
Current assets:
|
|
|
|
|
|
||||||||||||||
|
Cash and cash equivalents
|
$
|
189.8
|
|
$
|
249.3
|
|
$
|
184.9
|
|
$
|
—
|
|
$
|
624.0
|
|
||||
|
Accounts receivable, net
|
1.7
|
|
524.7
|
|
134.1
|
|
—
|
|
660.5
|
|
|||||||||
|
Other receivables, net
|
22.7
|
|
54.6
|
|
15.6
|
|
—
|
|
92.9
|
|
|||||||||
|
Total inventories, net
|
—
|
|
172.5
|
|
41.4
|
|
—
|
|
213.9
|
|
|||||||||
|
Other assets, net
|
10.7
|
|
67.1
|
|
39.7
|
|
—
|
|
117.5
|
|
|||||||||
|
Deferred tax assets
|
—
|
|
—
|
|
40.7
|
|
(1.5
|
)
|
39.2
|
|
|||||||||
|
Intercompany accounts receivable
|
—
|
|
2,077.8
|
|
1,137.5
|
|
(3,215.3
|
)
|
—
|
|
|||||||||
|
Total current assets
|
224.9
|
|
3,146.0
|
|
1,593.9
|
|
(3,216.8
|
)
|
1,748.0
|
|
|||||||||
|
Properties, net
|
25.1
|
|
1,338.9
|
|
631.9
|
|
—
|
|
1,995.9
|
|
|||||||||
|
Goodwill
|
—
|
|
1,068.5
|
|
1,384.6
|
|
—
|
|
2,453.1
|
|
|||||||||
|
Other intangibles, net
|
—
|
|
4,606.8
|
|
2,628.0
|
|
—
|
|
7,234.8
|
|
|||||||||
|
Investment in MillerCoors
|
—
|
|
2,431.8
|
|
—
|
|
—
|
|
2,431.8
|
|
|||||||||
|
Net investment in and advances to subsidiaries
|
11,342.2
|
|
2,291.6
|
|
5,291.7
|
|
(18,925.5
|
)
|
—
|
|
|||||||||
|
Deferred tax assets
|
47.4
|
|
104.8
|
|
4.9
|
|
(31.7
|
)
|
125.4
|
|
|||||||||
|
Other assets, net
|
38.6
|
|
125.0
|
|
59.6
|
|
—
|
|
223.2
|
|
|||||||||
|
Total assets
|
$
|
11,678.2
|
|
$
|
15,113.4
|
|
$
|
11,594.6
|
|
$
|
(22,174.0
|
)
|
$
|
16,212.2
|
|
||||
|
Liabilities and equity
|
|
|
|
|
|
||||||||||||||
|
Current liabilities:
|
|
|
|
|
|
||||||||||||||
|
Accounts payable
|
$
|
6.9
|
|
$
|
250.4
|
|
$
|
169.7
|
|
$
|
—
|
|
$
|
427.0
|
|
||||
|
Accrued expenses and other liabilities, net
|
57.1
|
|
537.3
|
|
165.5
|
|
—
|
|
759.9
|
|
|||||||||
|
Derivative hedging instruments
|
—
|
|
6.0
|
|
—
|
|
—
|
|
6.0
|
|
|||||||||
|
Deferred tax liability
|
11.3
|
|
142.5
|
|
—
|
|
(1.5
|
)
|
152.3
|
|
|||||||||
|
Current portion of long-term debt and short-term borrowings
|
564.2
|
|
668.3
|
|
13.1
|
|
—
|
|
1,245.6
|
|
|||||||||
|
Discontinued operations
|
—
|
|
—
|
|
7.9
|
|
—
|
|
7.9
|
|
|||||||||
|
Intercompany accounts payable
|
1,166.3
|
|
1,133.3
|
|
915.7
|
|
(3,215.3
|
)
|
—
|
|
|||||||||
|
Total current liabilities
|
1,805.8
|
|
2,737.8
|
|
1,271.9
|
|
(3,216.8
|
)
|
2,598.7
|
|
|||||||||
|
Long-term debt
|
1,895.6
|
|
1,402.5
|
|
124.4
|
|
—
|
|
3,422.5
|
|
|||||||||
|
Pension and postretirement benefits
|
3.3
|
|
823.1
|
|
6.6
|
|
—
|
|
833.0
|
|
|||||||||
|
Derivative hedging instruments
|
—
|
|
222.2
|
|
—
|
|
—
|
|
222.2
|
|
|||||||||
|
Deferred tax liability
|
—
|
|
—
|
|
980.2
|
|
(31.7
|
)
|
948.5
|
|
|||||||||
|
Other liabilities, net
|
6.6
|
|
64.4
|
|
104.7
|
|
—
|
|
175.7
|
|
|||||||||
|
Discontinued operations
|
—
|
|
—
|
|
20.0
|
|
—
|
|
20.0
|
|
|||||||||
|
Intercompany notes payable
|
—
|
|
1,135.8
|
|
6,971.9
|
|
(8,107.7
|
)
|
—
|
|
|||||||||
|
Total liabilities
|
3,711.3
|
|
6,385.8
|
|
9,479.7
|
|
(11,356.2
|
)
|
8,220.6
|
|
|||||||||
|
MCBC stockholders' equity
|
8,843.9
|
|
15,036.7
|
|
3,011.8
|
|
(18,925.5
|
)
|
7,966.9
|
|
|||||||||
|
Intercompany notes receivable
|
(877.0
|
)
|
(6,309.1
|
)
|
(921.6
|
)
|
8,107.7
|
|
—
|
|
|||||||||
|
Total stockholders' equity
|
7,966.9
|
|
8,727.6
|
|
2,090.2
|
|
(10,817.8
|
)
|
7,966.9
|
|
|||||||||
|
Noncontrolling interests
|
—
|
|
—
|
|
24.7
|
|
—
|
|
24.7
|
|
|||||||||
|
Total equity
|
7,966.9
|
|
8,727.6
|
|
2,114.9
|
|
(10,817.8
|
)
|
7,991.6
|
|
|||||||||
|
Total liabilities and equity
|
$
|
11,678.2
|
|
$
|
15,113.4
|
|
$
|
11,594.6
|
|
$
|
(22,174.0
|
)
|
$
|
16,212.2
|
|
||||
141
MOLSON COORS BREWING COMPANY AND SUBSIDIARIES
CONDENSED CONSOLIDATING BALANCE SHEETS
AS OF
DECEMBER 31, 2011
(IN MILLIONS)
|
Parent
Guarantor,
2007 and
2012 Issuer
|
Subsidiary
Guarantors
|
Subsidiary
Non Guarantors
|
Eliminations
|
Consolidated
|
|||||||||||||||
|
Assets
|
|
|
|
|
|
||||||||||||||
|
Current assets:
|
|
|
|
|
|
||||||||||||||
|
Cash and cash equivalents
|
$
|
601.1
|
|
$
|
422.5
|
|
$
|
55.3
|
|
$
|
—
|
|
$
|
1,078.9
|
|
||||
|
Accounts receivable, net
|
0.9
|
|
550.8
|
|
37.1
|
|
—
|
|
588.8
|
|
|||||||||
|
Other receivables, net
|
46.9
|
|
84.0
|
|
6.3
|
|
—
|
|
137.2
|
|
|||||||||
|
Total inventories, net
|
—
|
|
193.0
|
|
14.2
|
|
—
|
|
207.2
|
|
|||||||||
|
Other assets, net
|
9.7
|
|
74.2
|
|
10.1
|
|
—
|
|
94.0
|
|
|||||||||
|
Deferred tax assets
|
—
|
|
—
|
|
12.1
|
|
(0.5
|
)
|
11.6
|
|
|||||||||
|
Discontinued operations
|
—
|
|
—
|
|
0.3
|
|
—
|
|
0.3
|
|
|||||||||
|
Intercompany accounts receivable
|
—
|
|
1,522.0
|
|
1,612.9
|
|
(3,134.9
|
)
|
—
|
|
|||||||||
|
Total current assets
|
658.6
|
|
2,846.5
|
|
1,748.3
|
|
(3,135.4
|
)
|
2,118.0
|
|
|||||||||
|
Properties, net
|
27.6
|
|
1,314.0
|
|
88.5
|
|
—
|
|
1,430.1
|
|
|||||||||
|
Goodwill
|
—
|
|
1,033.0
|
|
420.3
|
|
—
|
|
1,453.3
|
|
|||||||||
|
Other intangibles, net
|
—
|
|
4,525.3
|
|
60.7
|
|
—
|
|
4,586.0
|
|
|||||||||
|
Investment in MillerCoors
|
—
|
|
2,487.9
|
|
—
|
|
—
|
|
2,487.9
|
|
|||||||||
|
Net investment in and advances to subsidiaries
|
7,925.2
|
|
1,056.3
|
|
5,363.3
|
|
(14,344.8
|
)
|
—
|
|
|||||||||
|
Deferred tax assets
|
33.1
|
|
149.2
|
|
2.3
|
|
(34.7
|
)
|
149.9
|
|
|||||||||
|
Other assets, net
|
19.8
|
|
155.6
|
|
23.2
|
|
—
|
|
198.6
|
|
|||||||||
|
Total assets
|
$
|
8,664.3
|
|
$
|
13,567.8
|
|
$
|
7,706.6
|
|
$
|
(17,514.9
|
)
|
$
|
12,423.8
|
|
||||
|
Liabilities and equity
|
|
|
|
|
|
||||||||||||||
|
Current liabilities:
|
|
|
|
|
|
||||||||||||||
|
Accounts payable
|
$
|
7.3
|
|
$
|
256.1
|
|
$
|
37.8
|
|
$
|
—
|
|
$
|
301.2
|
|
||||
|
Accrued expenses and other liabilities, net
|
34.6
|
|
579.9
|
|
32.3
|
|
—
|
|
646.8
|
|
|||||||||
|
Derivative hedging instruments
|
—
|
|
107.6
|
|
—
|
|
—
|
|
107.6
|
|
|||||||||
|
Deferred tax liability
|
6.2
|
|
155.6
|
|
—
|
|
(0.5
|
)
|
161.3
|
|
|||||||||
|
Current portion of long-term debt and short-term borrowings
|
—
|
|
44.7
|
|
2.2
|
|
—
|
|
46.9
|
|
|||||||||
|
Discontinued operations
|
—
|
|
—
|
|
13.4
|
|
—
|
|
13.4
|
|
|||||||||
|
Intercompany accounts payable
|
413.8
|
|
1,646.6
|
|
1,074.5
|
|
(3,134.9
|
)
|
—
|
|
|||||||||
|
Total current liabilities
|
461.9
|
|
2,790.5
|
|
1,160.2
|
|
(3,135.4
|
)
|
1,277.2
|
|
|||||||||
|
Long-term debt
|
546.2
|
|
1,368.7
|
|
—
|
|
—
|
|
1,914.9
|
|
|||||||||
|
Pension and postretirement benefits
|
—
|
|
693.6
|
|
3.9
|
|
—
|
|
697.5
|
|
|||||||||
|
Derivative hedging instruments
|
—
|
|
212.5
|
|
—
|
|
—
|
|
212.5
|
|
|||||||||
|
Deferred tax liability
|
—
|
|
—
|
|
490.3
|
|
(34.7
|
)
|
455.6
|
|
|||||||||
|
Other liabilities, net
|
8.3
|
|
53.0
|
|
92.6
|
|
—
|
|
153.9
|
|
|||||||||
|
Discontinued operations
|
—
|
|
—
|
|
22.0
|
|
—
|
|
22.0
|
|
|||||||||
|
Intercompany notes payable
|
—
|
|
1,504.0
|
|
4,971.6
|
|
(6,475.6
|
)
|
—
|
|
|||||||||
|
Total liabilities
|
1,016.4
|
|
6,622.3
|
|
6,740.6
|
|
(9,645.7
|
)
|
4,733.6
|
|
|||||||||
|
MCBC stockholders' equity
|
8,267.8
|
|
11,917.0
|
|
1,807.9
|
|
(14,344.8
|
)
|
7,647.9
|
|
|||||||||
|
Intercompany notes receivable
|
(619.9
|
)
|
(4,971.5
|
)
|
(884.2
|
)
|
6,475.6
|
|
—
|
|
|||||||||
|
Total stockholders' equity
|
7,647.9
|
|
6,945.5
|
|
923.7
|
|
(7,869.2
|
)
|
7,647.9
|
|
|||||||||
|
Noncontrolling interests
|
—
|
|
—
|
|
42.3
|
|
—
|
|
42.3
|
|
|||||||||
|
Total equity
|
7,647.9
|
|
6,945.5
|
|
966.0
|
|
(7,869.2
|
)
|
7,690.2
|
|
|||||||||
|
Total liabilities and equity
|
$
|
8,664.3
|
|
$
|
13,567.8
|
|
$
|
7,706.6
|
|
$
|
(17,514.9
|
)
|
$
|
12,423.8
|
|
||||
142
MOLSON COORS BREWING COMPANY AND SUBSIDIARIES
CONDENSED CONSOLIDATING STATEMENT OF CASH FLOWS
FOR THE YEAR ENDED
DECEMBER 29, 2012
(IN MILLIONS)
|
Parent
Guarantor,
2007 and
2012 Issuer
|
Subsidiary
Guarantors
|
Subsidiary
Non
Guarantors
|
Eliminations
|
Consolidated
|
|||||||||||||||
|
Net cash provided by (used in) operating activities
|
$
|
757.6
|
|
$
|
1,241.6
|
|
$
|
(380.1
|
)
|
$
|
(635.4
|
)
|
$
|
983.7
|
|
||||
|
CASH FLOWS FROM INVESTING ACTIVITIES:
|
|
|
|
|
|
||||||||||||||
|
Additions to properties
|
(6.7
|
)
|
(162.8
|
)
|
(52.8
|
)
|
—
|
|
(222.3
|
)
|
|||||||||
|
Proceeds from sales of properties and other long-lived assets
|
—
|
|
7.9
|
|
7.8
|
|
—
|
|
15.7
|
|
|||||||||
|
Acquisition of businesses, net of cash acquired
|
—
|
|
—
|
|
(2,258.3
|
)
|
—
|
|
(2,258.3
|
)
|
|||||||||
|
Payment on discontinued operations
|
—
|
|
—
|
|
(6.8
|
)
|
—
|
|
(6.8
|
)
|
|||||||||
|
Investment in MillerCoors
|
—
|
|
(1,008.8
|
)
|
—
|
|
—
|
|
(1,008.8
|
)
|
|||||||||
|
Return of capital from MillerCoors
|
—
|
|
942.4
|
|
—
|
|
—
|
|
942.4
|
|
|||||||||
|
Loan repayments
|
—
|
|
22.9
|
|
—
|
|
—
|
|
22.9
|
|
|||||||||
|
Loan advances
|
—
|
|
(9.3
|
)
|
—
|
|
—
|
|
(9.3
|
)
|
|||||||||
|
Payments on settlement of derivative instruments
|
—
|
|
(110.6
|
)
|
—
|
|
—
|
|
(110.6
|
)
|
|||||||||
|
Net intercompany investing activity
|
(2,853.9
|
)
|
(2,621.5
|
)
|
—
|
|
5,475.4
|
|
—
|
|
|||||||||
|
Net cash provided by (used in) investing activities
|
(2,860.6
|
)
|
(2,939.8
|
)
|
(2,310.1
|
)
|
5,475.4
|
|
(2,635.1
|
)
|
|||||||||
|
CASH FLOWS FROM FINANCING ACTIVITIES:
|
|
||||||||||||||||||
|
Exercise of stock options under equity compensation plans
|
34.1
|
|
—
|
|
—
|
|
—
|
|
34.1
|
|
|||||||||
|
Excess tax benefits from share-based compensation
|
4.9
|
|
—
|
|
—
|
|
—
|
|
4.9
|
|
|||||||||
|
Dividends paid
|
(203.5
|
)
|
(628.6
|
)
|
(35.5
|
)
|
635.4
|
|
(232.2
|
)
|
|||||||||
|
Dividends paid to noncontrolling interest holders
|
—
|
|
—
|
|
(5.0
|
)
|
—
|
|
(5.0
|
)
|
|||||||||
|
Payments for purchase of noncontrolling interest
|
—
|
|
—
|
|
(27.9
|
)
|
—
|
|
(27.9
|
)
|
|||||||||
|
Proceeds from issuances of long-term debt
|
2,045.4
|
|
—
|
|
150.0
|
|
—
|
|
2,195.4
|
|
|||||||||
|
Debt issuance costs
|
(39.2
|
)
|
—
|
|
(1.1
|
)
|
—
|
|
(40.3
|
)
|
|||||||||
|
Payments of long-term debt and capital lease obligations
|
(150.0
|
)
|
(44.8
|
)
|
(31.9
|
)
|
—
|
|
(226.7
|
)
|
|||||||||
|
Payments on debt assumed in Acquisition
|
—
|
|
—
|
|
(424.3
|
)
|
—
|
|
(424.3
|
)
|
|||||||||
|
Proceeds from short-term borrowings
|
—
|
|
—
|
|
16.0
|
|
—
|
|
16.0
|
|
|||||||||
|
Payments on short-term borrowings
|
—
|
|
—
|
|
(17.2
|
)
|
—
|
|
(17.2
|
)
|
|||||||||
|
Net proceeds from (payments on) revolving credit facilities
|
—
|
|
—
|
|
7.8
|
|
—
|
|
7.8
|
|
|||||||||
|
Payments on settlements of debt-related derivatives
|
—
|
|
(8.2
|
)
|
—
|
|
—
|
|
(8.2
|
)
|
|||||||||
|
Change in overdraft balances and other
|
—
|
|
—
|
|
(105.0
|
)
|
—
|
|
(105.0
|
)
|
|||||||||
|
Net intercompany financing activity
|
—
|
|
2,193.1
|
|
3,282.3
|
|
(5,475.4
|
)
|
—
|
|
|||||||||
|
Net cash provided by (used in) financing activities
|
1,691.7
|
|
1,511.5
|
|
2,808.2
|
|
(4,840.0
|
)
|
1,171.4
|
|
|||||||||
|
CASH AND CASH EQUIVALENTS:
|
|
|
|
|
|
||||||||||||||
|
Net increase (decrease) in cash and cash equivalents
|
(411.3
|
)
|
(186.7
|
)
|
118.0
|
|
—
|
|
(480.0
|
)
|
|||||||||
|
Effect of foreign exchange rate changes on cash and cash equivalents
|
—
|
|
13.5
|
|
11.6
|
|
—
|
|
25.1
|
|
|||||||||
|
Balance at beginning of year
|
601.1
|
|
422.5
|
|
55.3
|
|
—
|
|
1,078.9
|
|
|||||||||
|
Balance at end of period
|
$
|
189.8
|
|
$
|
249.3
|
|
$
|
184.9
|
|
$
|
—
|
|
$
|
624.0
|
|
||||
143
MOLSON COORS BREWING COMPANY AND SUBSIDIARIES
CONDENSED CONSOLIDATING STATEMENT OF CASH FLOWS
FOR THE YEAR ENDED
DECEMBER 31, 2011
(IN MILLIONS)
|
Parent
Guarantor
2007 and
2012 Issuer
|
Subsidiary
Guarantors
|
Subsidiary
Non
Guarantors
|
Eliminations
|
Consolidated
|
|||||||||||||||
|
Net cash provided by (used in) operating activities
|
$
|
253.1
|
|
$
|
156.6
|
|
$
|
1,761.8
|
|
$
|
(1,303.4
|
)
|
$
|
868.1
|
|
||||
|
CASH FLOWS FROM INVESTING ACTIVITIES:
|
|
|
|
|
|
||||||||||||||
|
Additions to properties
|
(3.7
|
)
|
(207.2
|
)
|
(24.5
|
)
|
—
|
|
(235.4
|
)
|
|||||||||
|
Proceeds from sales of properties and other long-lived assets
|
—
|
|
4.6
|
|
—
|
|
—
|
|
4.6
|
|
|||||||||
|
Acquisition of businesses, net of cash acquired
|
—
|
|
(30.7
|
)
|
(10.6
|
)
|
—
|
|
(41.3
|
)
|
|||||||||
|
Change in restricted cash balances
|
—
|
|
—
|
|
6.7
|
|
—
|
|
6.7
|
|
|||||||||
|
Investment in MillerCoors
|
—
|
|
(800.1
|
)
|
—
|
|
—
|
|
(800.1
|
)
|
|||||||||
|
Return of capital from MillerCoors
|
—
|
|
782.7
|
|
—
|
|
—
|
|
782.7
|
|
|||||||||
|
Investment in and advances to an unconsolidated affiliate
|
—
|
|
(93.9
|
)
|
10.7
|
|
—
|
|
(83.2
|
)
|
|||||||||
|
Loan repayments
|
—
|
|
22.4
|
|
—
|
|
—
|
|
22.4
|
|
|||||||||
|
Loan advances
|
—
|
|
(9.9
|
)
|
—
|
|
—
|
|
(9.9
|
)
|
|||||||||
|
Proceeds from settlements of derivative instruments
|
15.4
|
|
—
|
|
—
|
|
—
|
|
15.4
|
|
|||||||||
|
Net intercompany investing activity
|
15.4
|
|
(800.7
|
)
|
(2,004.5
|
)
|
2,789.8
|
|
—
|
|
|||||||||
|
Net cash provided by (used in) investing activities
|
27.1
|
|
(1,132.8
|
)
|
(2,022.2
|
)
|
2,789.8
|
|
(338.1
|
)
|
|||||||||
|
CASH FLOWS FROM FINANCING ACTIVITIES:
|
|
|
|
|
|
||||||||||||||
|
Exercise of stock options under equity compensation plans
|
11.6
|
|
—
|
|
—
|
|
—
|
|
11.6
|
|
|||||||||
|
Excess tax benefits from share-based compensation
|
2.0
|
|
—
|
|
—
|
|
—
|
|
2.0
|
|
|||||||||
|
Payments for purchase of treasury stock
|
(321.1
|
)
|
—
|
|
—
|
|
—
|
|
(321.1
|
)
|
|||||||||
|
Dividends paid
|
(201.4
|
)
|
(1,192.9
|
)
|
(137.2
|
)
|
1,303.4
|
|
(228.1
|
)
|
|||||||||
|
Dividends paid to noncontrolling interest holders
|
—
|
|
—
|
|
(2.3
|
)
|
—
|
|
(2.3
|
)
|
|||||||||
|
Debt issuance costs
|
(2.2
|
)
|
—
|
|
—
|
|
—
|
|
(2.2
|
)
|
|||||||||
|
Payments of long-term debt and capital lease obligations
|
—
|
|
(0.3
|
)
|
—
|
|
—
|
|
(0.3
|
)
|
|||||||||
|
Proceeds from short-term borrowings
|
—
|
|
11.9
|
|
(5.1
|
)
|
—
|
|
6.8
|
|
|||||||||
|
Payments on short-term borrowings
|
—
|
|
(3.0
|
)
|
(15.3
|
)
|
—
|
|
(18.3
|
)
|
|||||||||
|
Net proceeds from (payments on) revolving credit facilities
|
—
|
|
2.1
|
|
—
|
|
—
|
|
2.1
|
|
|||||||||
|
Payments on settlements of debt-related derivatives
|
—
|
|
(104.5
|
)
|
—
|
|
—
|
|
(104.5
|
)
|
|||||||||
|
Change in overdraft balances and other
|
—
|
|
(10.8
|
)
|
—
|
|
—
|
|
(10.8
|
)
|
|||||||||
|
Net intercompany financing activity
|
—
|
|
2,364.0
|
|
425.8
|
|
(2,789.8
|
)
|
—
|
|
|||||||||
|
Net cash provided by (used in) financing activities
|
(511.1
|
)
|
1,066.5
|
|
265.9
|
|
(1,486.4
|
)
|
(665.1
|
)
|
|||||||||
|
CASH AND CASH EQUIVALENTS:
|
|
|
|
|
|
||||||||||||||
|
Net increase (decrease) in cash and cash equivalents
|
(230.9
|
)
|
90.3
|
|
5.5
|
|
—
|
|
(135.1
|
)
|
|||||||||
|
Effect of foreign exchange rate changes on cash and cash equivalents
|
—
|
|
(17.3
|
)
|
13.7
|
|
—
|
|
(3.6
|
)
|
|||||||||
|
Balance at beginning of year
|
832.0
|
|
349.5
|
|
36.1
|
|
—
|
|
1,217.6
|
|
|||||||||
|
Balance at end of period
|
$
|
601.1
|
|
$
|
422.5
|
|
$
|
55.3
|
|
$
|
—
|
|
$
|
1,078.9
|
|
||||
144
MOLSON COORS BREWING COMPANY AND SUBSIDIARIES
CONDENSED CONSOLIDATING STATEMENT OF CASH FLOWS
FOR THE YEAR ENDED
DECEMBER 25, 2010
(IN MILLIONS)
|
Parent
Guarantor,
2007 and
2012 Issuer
|
Subsidiary
Guarantors
|
Subsidiary
Non
Guarantors
|
Eliminations
|
Consolidated
|
|||||||||||||||
|
Net cash provided by (used in) operating activities
|
$
|
491.2
|
|
$
|
1,432.0
|
|
$
|
(727.9
|
)
|
$
|
(445.6
|
)
|
$
|
749.7
|
|
||||
|
CASH FLOWS FROM INVESTING ACTIVITIES:
|
|
|
|
|
|
||||||||||||||
|
Additions to properties
|
(5.8
|
)
|
(164.8
|
)
|
(7.3
|
)
|
—
|
|
(177.9
|
)
|
|||||||||
|
Proceeds from sales of properties and other long-lived assets
|
—
|
|
5.2
|
|
—
|
|
—
|
|
5.2
|
|
|||||||||
|
Acquisition of businesses, net of cash acquired
|
—
|
|
—
|
|
(19.8
|
)
|
—
|
|
(19.8
|
)
|
|||||||||
|
Change in restricted cash balances
|
—
|
|
—
|
|
(10.8
|
)
|
—
|
|
(10.8
|
)
|
|||||||||
|
Payment on discontinued operations
|
—
|
|
—
|
|
(96.0
|
)
|
—
|
|
(96.0
|
)
|
|||||||||
|
Investment in MillerCoors
|
—
|
|
(1,071.2
|
)
|
—
|
|
—
|
|
(1,071.2
|
)
|
|||||||||
|
Return of capital from MillerCoors
|
—
|
|
1,060.3
|
|
—
|
|
—
|
|
1,060.3
|
|
|||||||||
|
Loan repayments
|
—
|
|
16.6
|
|
—
|
|
—
|
|
16.6
|
|
|||||||||
|
Loan advances
|
—
|
|
(9.1
|
)
|
—
|
|
—
|
|
(9.1
|
)
|
|||||||||
|
Proceeds from settlements of derivative instruments
|
35.1
|
|
—
|
|
—
|
|
—
|
|
35.1
|
|
|||||||||
|
Other
|
—
|
|
0.1
|
|
0.1
|
|
—
|
|
0.2
|
|
|||||||||
|
Net intercompany investing activity
|
(54.7
|
)
|
2,477.8
|
|
(1,367.4
|
)
|
(1,055.7
|
)
|
—
|
|
|||||||||
|
Net cash provided by (used in) investing activities
|
(25.4
|
)
|
2,314.9
|
|
(1,501.2
|
)
|
(1,055.7
|
)
|
(267.4
|
)
|
|||||||||
|
CASH FLOWS FROM FINANCING ACTIVITIES:
|
|
|
|
|
|
||||||||||||||
|
Exercise of stock options under equity compensation plans
|
38.5
|
|
—
|
|
—
|
|
—
|
|
38.5
|
|
|||||||||
|
Excess tax benefits from share-based compensation
|
4.8
|
|
—
|
|
—
|
|
—
|
|
4.8
|
|
|||||||||
|
Dividends paid
|
(177.0
|
)
|
(439.3
|
)
|
(30.4
|
)
|
445.6
|
|
(201.1
|
)
|
|||||||||
|
Dividends paid to noncontrolling interest holders
|
—
|
|
—
|
|
(3.7
|
)
|
—
|
|
(3.7
|
)
|
|||||||||
|
Proceeds from issuances of long-term debt
|
—
|
|
488.4
|
|
—
|
|
—
|
|
488.4
|
|
|||||||||
|
Debt issuance costs
|
—
|
|
(3.3
|
)
|
—
|
|
—
|
|
(3.3
|
)
|
|||||||||
|
Payments on long term-debt and capital lease obligations
|
—
|
|
(300.0
|
)
|
—
|
|
—
|
|
(300.0
|
)
|
|||||||||
|
Proceeds from short-term borrowings
|
—
|
|
—
|
|
12.1
|
|
—
|
|
12.1
|
|
|||||||||
|
Payments on short-term borrowings
|
—
|
|
—
|
|
(8.1
|
)
|
—
|
|
(8.1
|
)
|
|||||||||
|
Payments on settlements of debt-related derivatives
|
—
|
|
(42.0
|
)
|
—
|
|
—
|
|
(42.0
|
)
|
|||||||||
|
Change in overdraft balances and other
|
—
|
|
6.8
|
|
—
|
|
—
|
|
6.8
|
|
|||||||||
|
Net intercompany financing activity
|
107.1
|
|
(3,431.0
|
)
|
2,268.2
|
|
1,055.7
|
|
—
|
|
|||||||||
|
Net cash provided by (used in) financing activities
|
(26.6
|
)
|
(3,720.4
|
)
|
2,238.1
|
|
1,501.3
|
|
(7.6
|
)
|
|||||||||
|
CASH AND CASH EQUIVALENTS:
|
|
|
|
|
|
||||||||||||||
|
Net increase (decrease) in cash and cash equivalents
|
439.2
|
|
26.5
|
|
9.0
|
|
—
|
|
474.7
|
|
|||||||||
|
Effect of foreign exchange rate changes on cash and cash equivalents
|
—
|
|
13.5
|
|
(4.8
|
)
|
—
|
|
8.7
|
|
|||||||||
|
Balance at beginning of year
|
392.8
|
|
309.5
|
|
31.9
|
|
—
|
|
734.2
|
|
|||||||||
|
Balance at end of period
|
$
|
832.0
|
|
$
|
349.5
|
|
$
|
36.1
|
|
$
|
—
|
|
$
|
1,217.6
|
|
||||
145
22. Quarterly Financial Information (Unaudited)
The following summarizes selected quarterly financial information for fiscal years
2012
and
2011
.
|
2012
|
First
|
Second
|
Third
|
Fourth
|
Full Year
|
||||||||||||||
|
|
(In millions, except per share data)
|
||||||||||||||||||
|
Sales
|
$
|
1,008.1
|
|
$
|
1,440.9
|
|
$
|
1,685.8
|
|
$
|
1,480.2
|
|
$
|
5,615.0
|
|
||||
|
Excise taxes
|
(316.7
|
)
|
(441.5
|
)
|
(490.3
|
)
|
(450.0
|
)
|
(1,698.5
|
)
|
|||||||||
|
Net sales
|
691.4
|
|
999.4
|
|
1,195.5
|
|
1,030.2
|
|
3,916.5
|
|
|||||||||
|
Cost of goods sold
|
(438.8
|
)
|
(580.1
|
)
|
(687.0
|
)
|
(646.6
|
)
|
(2,352.5
|
)
|
|||||||||
|
Gross profit
|
$
|
252.6
|
|
$
|
419.3
|
|
$
|
508.5
|
|
$
|
383.6
|
|
$
|
1,564.0
|
|
||||
|
Amounts attributable to MCBC:
|
|
|
|
|
|
||||||||||||||
|
Income from continuing operations
|
$
|
79.4
|
|
$
|
104.3
|
|
$
|
197.7
|
|
$
|
60.1
|
|
$
|
441.5
|
|
||||
|
Gain (loss) from discontinued operations, net of tax
|
0.1
|
|
0.8
|
|
0.7
|
|
(0.1
|
)
|
1.5
|
|
|||||||||
|
Net income
|
$
|
79.5
|
|
$
|
105.1
|
|
$
|
198.4
|
|
$
|
60.0
|
|
$
|
443.0
|
|
||||
|
Basic income (loss) per share:
|
|
|
|
|
|
||||||||||||||
|
From continuing operations
|
$
|
0.44
|
|
$
|
0.58
|
|
$
|
1.09
|
|
$
|
0.33
|
|
$
|
2.44
|
|
||||
|
From discontinued operations
|
—
|
|
—
|
|
—
|
|
—
|
|
0.01
|
|
|||||||||
|
Basic net income per share
|
$
|
0.44
|
|
$
|
0.58
|
|
$
|
1.09
|
|
$
|
0.33
|
|
$
|
2.45
|
|
||||
|
Diluted income (loss) per share:
|
|
|
|
|
|
||||||||||||||
|
From continuing operations
|
$
|
0.44
|
|
$
|
0.57
|
|
$
|
1.09
|
|
$
|
0.33
|
|
$
|
2.43
|
|
||||
|
From discontinued operations
|
—
|
|
—
|
|
—
|
|
—
|
|
0.01
|
|
|||||||||
|
Diluted net income per share
|
$
|
0.44
|
|
$
|
0.57
|
|
$
|
1.09
|
|
$
|
0.33
|
|
$
|
2.44
|
|
||||
|
2011
|
First
|
Second
|
Third
|
Fourth
|
Full Year
|
||||||||||||||
|
|
(In millions, except per share data)
|
||||||||||||||||||
|
Sales
|
$
|
997.3
|
|
$
|
1,383.1
|
|
$
|
1,393.9
|
|
$
|
1,395.6
|
|
$
|
5,169.9
|
|
||||
|
Excise taxes
|
(306.9
|
)
|
(449.5
|
)
|
(439.5
|
)
|
(458.3
|
)
|
(1,654.2
|
)
|
|||||||||
|
Net sales
|
690.4
|
|
933.6
|
|
954.4
|
|
937.3
|
|
3,515.7
|
|
|||||||||
|
Cost of goods sold
|
(427.2
|
)
|
(523.9
|
)
|
(550.5
|
)
|
(547.5
|
)
|
(2,049.1
|
)
|
|||||||||
|
Gross profit
|
$
|
263.2
|
|
$
|
409.7
|
|
$
|
403.9
|
|
$
|
389.8
|
|
$
|
1,466.6
|
|
||||
|
Amounts attributable to MCBC:
|
|
|
|
|
|
||||||||||||||
|
Income from continuing operations
|
$
|
82.6
|
|
$
|
224.3
|
|
$
|
194.7
|
|
$
|
172.4
|
|
$
|
674.0
|
|
||||
|
Gain (loss) from discontinued operations, net of tax
|
0.3
|
|
(1.5
|
)
|
2.7
|
|
0.8
|
|
2.3
|
|
|||||||||
|
Net income
|
$
|
82.9
|
|
$
|
222.8
|
|
$
|
197.4
|
|
$
|
173.2
|
|
$
|
676.3
|
|
||||
|
Basic income (loss) per share:
|
|
|
|
|
|
||||||||||||||
|
From continuing operations
|
$
|
0.44
|
|
$
|
1.20
|
|
$
|
1.05
|
|
$
|
0.95
|
|
$
|
3.65
|
|
||||
|
From discontinued operations
|
—
|
|
(0.01
|
)
|
0.01
|
|
—
|
|
0.01
|
|
|||||||||
|
Basic net income per share
|
$
|
0.44
|
|
$
|
1.19
|
|
$
|
1.06
|
|
$
|
0.95
|
|
$
|
3.66
|
|
||||
|
Diluted income (loss) per share:
|
|
|
|
|
|
||||||||||||||
|
From continuing operations
|
$
|
0.44
|
|
$
|
1.19
|
|
$
|
1.05
|
|
$
|
0.95
|
|
$
|
3.62
|
|
||||
|
From discontinued operations
|
—
|
|
(0.01
|
)
|
0.01
|
|
—
|
|
0.01
|
|
|||||||||
|
Diluted net income per share
|
$
|
0.44
|
|
$
|
1.18
|
|
$
|
1.06
|
|
$
|
0.95
|
|
$
|
3.63
|
|
||||
146
None.
Evaluation of Disclosure Controls and Procedures
Under the supervision and with the participation of our management, including our Chief Executive Officer and Chief Financial Officer, we conducted an evaluation of our disclosure controls and procedures as such item is defined under Rule 13a-15(e) under the Securities Exchange Act of 1934, as amended ("Exchange Act"). We acquired StarBev, which we subsequently renamed Molson Coors Central Europe ("MCCE"), in the second quarter of 2012. As such, the scope of our assessment of the effectiveness of our disclosure controls and procedures did not include the internal controls over financial reporting at MCCE. This exclusion is consistent with the SEC Staff's guidance that an assessment of a recently acquired business may be omitted from the scope of our assessment of the effectiveness of disclosure controls and procedures that are also part of internal control over financial reporting in the year of acquisition. MCCE represented 27% of the Company's total assets and 13% of the Company's net sales as of and for the year ended December 29, 2012. Based on this evaluation, our Chief Executive Officer and Chief Financial Officer concluded that our disclosure controls and procedures were effective as of
December 29, 2012
, to provide reasonable assurance that information required to be disclosed in our reports under the Exchange Act is recorded, processed, summarized and reported within the time periods specified in the SEC rules and forms and that such information is accumulated and communicated to our management, including our Chief Executive Officer and Chief Financial Officer, as appropriate, to allow timely decisions regarding required disclosure. Management necessarily applies its judgment in assessing the costs and benefits of such controls and procedures that, by their nature, can only provide reasonable assurance regarding management's control objectives. Also, we have investments in certain unconsolidated entities that we do not control or manage.
Management's Annual Report on Internal Control over Financial Reporting
Our management is responsible for establishing and maintaining effective internal control over financial reporting as such term is defined in Exchange Act Rule 13a-15(f). Our internal control over financial reporting is a process designed to provide reasonable assurance regarding the reliability of financial reporting and the preparation of financial statements for external purposes in accordance with U. S. generally accepted accounting principles. A company's internal control over financial reporting includes those policies and procedures that (i) pertain to the maintenance of records that, in reasonable detail, accurately and fairly reflect the transactions and dispositions of the assets of the company; (ii) provide reasonable assurance that transactions are recorded as necessary to permit preparation of financial statements in accordance with generally accepted accounting principles, and that receipts and expenditures of the company are being made only in accordance with authorizations of management and directors of the company; and (iii) provide reasonable assurance regarding prevention or timely detection of unauthorized acquisition, use, or disposition of the company's assets that could have a material effect on the financial statements.
Because of the inherent limitations, internal control over financial reporting may not prevent or detect misstatements. Also, projections of any evaluation of effectiveness to future periods are subject to the risk that controls may become ineffective due to changes in conditions, or that the degree of compliance with the policies or procedures may deteriorate.
Our Chief Executive Officer and the Chief Financial Officer, with assistance from other members of management, assessed the effectiveness of our internal control over financial reporting as of
December 29, 2012
, based on the criteria established in
Internal Control—Integrated Framework
issued by the Committee of Sponsoring Organizations of the Treadway Commission. We acquired MCCE in the second quarter of 2012. As such, the scope of our assessment of the effectiveness of our internal control over financial reporting did not include the internal control over financial reporting at MCCE. This exclusion is consistent with the SEC Staff's guidance that an assessment of a recently acquired business may be omitted from the scope of our assessment of the effectiveness of internal control over financial reporting in the year of acquisition. MCCE represented 27% of the Company's total assets and 13% of the Company's net sales as of and for the year ended December 29, 2012. Based on its evaluation, management has concluded that our internal control over financial reporting was effective as of
December 29, 2012
.
Our independent registered public accounting firm has audited the effectiveness of our internal control over financial reporting as of
December 29, 2012
, as stated in the report which appears in Part II—Item 8 Financial Statements and Supplementary Data.
147
Changes in Internal Control over Financial Reporting
There were no changes in our internal control over financial reporting (as defined in Exchange Act Rule 13a-15(f)) during the quarter ended
December 29, 2012
, that have materially affected, or are reasonably likely to materially affect, our internal control over financial reporting. We have commenced a project to incorporate the internal control over financial reporting of StarBev into our internal control over financial reporting framework.
None.
All of Molson Coors' directors and employees, including its Chief Executive Officer, Chief Financial Officer, and other senior financial officers, are bound by Molson Coors' Code of Business Conduct, which complies with the requirements of the New York Stock Exchange and the SEC to ensure that the business of Molson Coors is conducted in a legal and ethical manner. The Code of Business Conduct covers all areas of professional conduct, including employment policies, conflicts of interest, fair dealing, and the protection of confidential information, as well as strict adherence to all laws and regulations applicable to the conduct of our business. A copy of the Code of Business Conduct is available on the Molson Coors website. Molson Coors intends to disclose amendments to, or waivers from, certain provisions of the Code of Business Conduct for executive officers and directors on its website within four business days following the date of such amendment or waiver.
Stockholders and other interested parties may communicate directly with the Chairman of the Board, Chairman of the Audit Committee, the independent Directors as a group or the non-employee Directors as a group by writing to those individuals or the group at the following address: Molson Coors Brewing Company, c/o Corporate Secretary, 1225 17th Street, Suite 3200, Denver, Colorado 80202. Correspondence received by the Corporate Secretary will be forwarded to the appropriate person or persons in accordance with the procedures adopted by a majority of the independent directors of the Board.
Additional information concerning our executive officers, directors and corporate governance is incorporated herein by reference to our definitive proxy statement for our 2013 annual meeting of stockholders, which will be filed no later than 120 days after
December 29, 2012
.
Incorporated by reference to our definitive proxy statement for our 2013 annual meeting of stockholders, which will be filed no later than 120 days after
December 29, 2012
.
Incorporated by reference to our definitive proxy statement for our 2013 annual meeting of stockholders, which will be filed no later than 120 days after
December 29, 2012
.
Equity Compensation Plan Information
The following table summarizes information about the 1990 Adolph Coors Equity Incentive Plan, the Equity Compensation Plan for Non-Employee Directors and the Molson Coors Brewing Company Incentive Compensation Plan (collectively the "Plans") as of December 29, 2012. All outstanding awards shown in the table below relate to our Class B common stock.
148
|
A
|
B
|
C
|
|||
|
Plan category
|
Number of securities to be
issued upon exercise of
outstanding options,
warrants and rights
|
Weighted-average
exercise price of
outstanding options,
warrants and rights
|
Number of securities remaining available for future issuance under equity compensation plans (excluding securities reflected in column A)
|
||
|
Equity compensation plans approved by security holders(1)
|
6,029,701
|
$40.55
|
8,080,427
|
||
|
Equity compensation plans not approved by security holders
|
None
|
None
|
None
|
||
|
(1)
|
We may issue securities under the Plans in forms other than options, warrants or rights. Under the Plans, we may issue restricted stock units ("RSUs"), deferred stock units ("DSUs"), and performance units ("PUs").
|
As of December 29, 2012, there were also RSUs, DSUs and PUs outstanding. See Part II—Item 8 Financial Statements and Supplementary Data, Note 15 "Share-Based Payments" of the Notes to the Consolidated Financial Statements for further discussion.
Incorporated by reference to our definitive proxy statement for our 2013 annual meeting of stockholders, which will be filed no later than 120 days after
December 29, 2012
.
Incorporated by reference to our definitive proxy statement for our 2013 annual meeting of stockholders, which will be filed no later than 120 days after
December 29, 2012
.
149
|
(a)
|
Financial Statements, Financial Statement Schedules and Exhibits
|
The following are filed as a part of this Annual Report on Form 10-K
|
(1)
|
Management's Report
|
Report of Independent Registered Public Accounting Firm
Consolidated Statements of Operations for the three years ended
December 29, 2012
,
December 31, 2011
, and
December 25, 2010
Consolidated Statements of Comprehensive Income for the three years ended
December 29, 2012
,
December 31, 2011
, and
December 25, 2010
Consolidated Balance Sheets at
December 29, 2012
, and
December 31, 2011
Consolidated Statements of Cash Flows for the three years ended
December 29, 2012
,
December 31, 2011
, and
December 25, 2010
Consolidated Statements of Stockholders' Equity and Noncontrolling Interests for the three years ended
December 29, 2012
,
December 31, 2011
, and
December 25, 2010
Notes to Consolidated Financial Statements
|
(2)
|
Schedule II—Valuation and Qualifying Accounts for the three years ended
December 29, 2012
,
December 31, 2011
, and
December 25, 2010
|
|
(3)
|
Exhibit list
|
|
|
Incorporated by Reference
|
Filed Herewith
|
|||||||||
|
Exhibit Number
|
Document Description
|
Form
|
Exhibit
|
Filing Date
|
|||||||
|
2.1
|
Agreement, dated as of April 3, 2012, by and among Molson Coors Brewing Company, Molson Coors Holdco - 2 Inc. and Starbev L.P.
|
8-K
|
2.1
|
April 3, 2012
|
|||||||
|
2.2
|
Amendment and Novation Agreement, dated as of June 14, 2012, by and between Molson Coors Holdco 2 LLC, Molson Coors Netherlands B.V., Molson Coors Brewing Company, Starbev L.P. and the other individuals thereto.
|
8-K
|
10.4
|
June 18, 2012
|
|||||||
|
2.3
|
Management Warranty Deed, dated as of April 3, 2012, by and among the management warrantors named therein, Starbev L.P. and Molson Coors Holdco - 2 Inc.
|
8-K
|
2.2
|
April 3, 2012
|
|||||||
|
3.1
|
Restated Certificate of Incorporation of Molson Coors Brewing Company.
|
Schedule 14A
|
Annex G
|
December 9, 2004
|
|||||||
|
3.2
|
Third Amended and Restated Bylaws of Molson Coors Brewing Company.
|
10-Q
|
3.1
|
August 4, 2009
|
|||||||
|
4.1.1
|
Indenture, dated as of September 22, 2005, among Molson Coors Capital Finance ULC, Molson Coors Brewing Company, Coors Brewing Company, Coors Distributing Company, Coors International Market Development, L.L.L.P., Coors Worldwide, Inc., Coors Global Properties, Inc., Coors Intercontinental, Inc., and Coors Brewing Company International, Inc. and TD Banknorth, National Association and the Canada Trust Company as co-trustees.
|
S-4
|
4.1
|
October 19, 2005
|
|||||||
150
|
|
Incorporated by Reference
|
Filed Herewith
|
|||||||||
|
Exhibit Number
|
Document Description
|
Form
|
Exhibit
|
Filing Date
|
|||||||
|
4.1.2
|
First Supplemental Indenture, dated as of September 22, 2005, among Molson Coors Capital Finance ULC, Molson Coors Brewing Company, Coors Brewing Company, Coors Distributing Company, Coors International Market Development, L.L.L.P., Coors Worldwide, Inc., Coors Global Properties, Inc., Coors Intercontinental, Inc., and Coors Brewing Company International, Inc. and TD Banknorth, National Association as trustee.
|
S-4
|
4.2
|
October 19, 2005
|
|||||||
|
4.1.3
|
Second Supplemental Indenture, dated as of September 22, 2005, among Molson Coors Capital Finance ULC, Molson Coors Brewing Company, Coors Brewing Company, Coors Distributing Company, Coors International Market Development, L.L.L.P., Coors Worldwide, Inc., Coors Global Properties, Inc., Coors Intercontinental, Inc., and Coors Brewing Company International, Inc. and The Canada Trust Company as trustee.
|
S-4
|
4.3
|
October 19, 2005
|
|||||||
|
4.1.4
|
Third Supplemental Indenture, dated as of April 10, 2007, among Molson Coors Capital Finance ULC, Molson Coors Brewing Company, Coors Brewing Company, Coors Distributing Company, Coors International Market Development, L.L.L.P., Coors Worldwide, Inc., Coors Global Properties, Inc., Coors Intercontinental, Inc., and Coors Brewing Company International, Inc. and The Canada Trust Company as trustee.
|
10-Q
|
4.2
|
August 7, 2007
|
|||||||
|
4.1.5
|
Fourth Supplemental Indenture, dated as of February 1, 2008, among Molson Coors Capital Finance ULC, Molson Coors Brewing Company, Coors Brewing Company, Coors Distributing Company, Coors International Market Development, L.L.L.P., Coors Worldwide, Inc., Coors Global Properties, Inc., Coors Intercontinental, Inc., and Coors Brewing Company International, Inc. and The Canada Trust Company as trustee.
|
10-K
|
4.1
|
February 22, 2008
|
|||||||
|
4.1.6
|
Fifth Supplemental Indenture, dated as of May 23, 2008, to the Indenture dated September 22, 2005, among Molson Coors Capital Finance ULC, the guarantors named therein, Bank of New York Trust Company, as trustee, and Computershare Trust Company of Canada, as Canadian trustee.
|
10-Q
|
4.4
|
August 6, 2008
|
|||||||
|
4.1.7
|
Sixth Supplemental Indenture, dated as of June 27, 2008, to the Indenture dated September 22, 2005, among Molson Coors Capital Finance ULC, the guarantors named therein, Bank of New York Trust Company, as trustee, and Computershare Trust Company of Canada, as Canadian trustee.
|
10-Q
|
4.5
|
August 6, 2008
|
|||||||
|
4.1.8
|
Seventh Supplemental Indenture, dated as of June 30, 2008, to the Indenture dated September 22, 2005, among Molson Coors Capital Finance ULC, the guarantors named therein, Bank of New York Trust Company, as trustee, and Computershare Trust Company of Canada, as Canadian trustee.
|
10-Q
|
4.6
|
August 6, 2008
|
|||||||
|
4.1.9
|
Eighth Supplemental Indenture, dated as of December 25, 2010, to the Indenture dated September 22, 2005, among Molson Coors Capital Finance ULC, the guarantors named therein, and Computershare Trust Company of Canada, as Canadian trustee.
|
10-K
|
4.3.9
|
February 27, 2012
|
|||||||
|
4.1.10
|
Ninth Supplemental Indenture, dated as of March 8, 2011, to the Indenture dated September 22, 2005, among Molson Coors Capital Finance ULC, the guarantors named therein, and Computershare Trust Company of Canada, as Canadian trustee.
|
10-K
|
4.3.10
|
February 27, 2012
|
|||||||
151
|
|
Incorporated by Reference
|
Filed Herewith
|
|||||||||
|
Exhibit Number
|
Document Description
|
Form
|
Exhibit
|
Filing Date
|
|||||||
|
4.1.11
|
Tenth Supplemental Indenture, dated as of November 11, 2011, to the Indenture dated September 22, 2005, among Molson Coors Capital Finance ULC, the guarantors named therein, and Computershare Trust Company of Canada, as Canadian trustee.
|
10-K
|
4.3.11
|
February 27, 2012
|
|||||||
|
4.1.12
|
Twelfth Supplemental Indenture, dated as of June 15, 2012, to the Indenture dated September 22, 2005, among Molson Coors Capital Finance ULC, the guarantors named therein, and Computershare Trust Company of Canada, as Canadian trustee.
|
10-Q
|
4.5
|
August 8, 2012
|
|||||||
|
4.2.1
|
Indenture, dated as of June 15, 2007, among Molson Coors Brewing Company, the guarantors party thereto, and Deutsche Bank Trust Company Americas, as Trustee.
|
8-K
|
4.1
|
June 21, 2007
|
|||||||
|
4.2.2
|
First Supplemental Indenture, dated as of June 15, 2007, among Molson Coors Brewing Company, the guarantors party thereto, and Deutsche Bank Trust Company Americas, as Trustee.
|
8-K
|
4.2
|
June 21, 2007
|
|||||||
|
4.2.3
|
Second Supplemental Indenture, dated as of January 31, 2008, among Molson Coors Brewing Company, the guarantors party thereto, and Deutsche Bank Trust Company Americas, as Trustee.
|
10-K
|
4.2
|
February 22, 2008
|
|||||||
|
4.2.4
|
Third Supplemental Indenture, dated as of February 1, 2008, among Molson Coors Brewing Company, the guarantors party thereto, and Deutsche Bank Trust Company Americas, as Trustee.
|
10-K
|
4.2
|
February 22, 2008
|
|||||||
|
4.2.5
|
Fourth Supplemental Indenture, dated as of May 23, 2008, to the Indenture dated June 15, 2007, among Molson Coors Brewing Company, the guarantors named therein, and Deutsche Bank Trust Company Americas, as trustee.
|
10-Q
|
4.7
|
August 6, 2008
|
|||||||
|
4.2.6
|
Fifth Supplemental Indenture, dated as of June 27, 2008, to the Indenture dated June 15, 2007, among Molson Coors Brewing Company, the guarantors named therein, and Deutsche Bank Trust Company Americas, as trustee.
|
10-Q
|
4.8
|
August 6, 2008
|
|||||||
|
4.2.7
|
Sixth Supplemental Indenture, dated as of June 30, 2008, to the Indenture dated June 15, 2007, among Molson Coors Brewing Company, the guarantors named therein, and Deutsche Bank Trust Company Americas, as trustee.
|
10-Q
|
4.9
|
August 6, 2008
|
|||||||
|
4.2.8
|
Seventh Supplemental Indenture, dated as of December 25, 2010, to the Indenture dated June 15, 2007, among Molson Coors Brewing Company, the guarantors named therein, and Deutsche Bank Trust Company Americas, as trustee.
|
10-K
|
4.6.8
|
February 27, 2012
|
|||||||
|
4.2.9
|
Eighth Supplemental Indenture, dated as of March 8, 2011, to the Indenture dated June 15, 2007, among Molson Coors Brewing Company, the guarantors named therein, and Deutsche Bank Trust Company Americas, as trustee.
|
10-K
|
4.6.9
|
February 27, 2012
|
|||||||
|
4.2.10
|
Ninth Supplemental Indenture, dated as of November 11, 2011, to the Indenture dated June 15, 2007, among Molson Coors Brewing Company, the guarantors named therein, and Deutsche Bank Trust Company Americas, as trustee.
|
10-K
|
4.6.10
|
February 27, 2012
|
|||||||
|
4.2.11
|
Eleventh Supplemental Indenture, dated as of June 15, 2012, to the Indenture dated June 15, 2007, among Molson Coors Brewing Company, the guarantors named therein, and Deutsche Bank Trust Company Americas, as trustee.
|
10-Q
|
4.6
|
August 8, 2012
|
|||||||
|
4.3.1
|
Indenture, dated as of October 6, 2010, by and among Molson Coors International LP, the guarantors named therein and Computershare Trust Company of Canada, as trustee.
|
10-K
|
10.38.1
|
February 22, 2011
|
|||||||
152
|
|
Incorporated by Reference
|
Filed Herewith
|
|||||||||
|
Exhibit Number
|
Document Description
|
Form
|
Exhibit
|
Filing Date
|
|||||||
|
4.3.2
|
First Supplemental Indenture, dated as of October 6, 2010, to the Indenture dated October 6, 2012, by and among Molson Coors International LP, the guarantors named therein and Computershare Trust Company of Canada, as trustee.
|
10-K
|
10.38.2
|
February 22, 2011
|
|||||||
|
4.3.3
|
Second Supplemental Indenture, dated as of December 25, 2010, to the Indenture dated October 6, 2010, among Molson Coors International LP, the guarantors named therein and Computershare Trust Company of Canada, as trustee.
|
10-Q
|
4.1.1
|
August 3, 2011
|
|||||||
|
4.3.4
|
Third Supplemental Indenture, dated as of March 8, 2011, to the Indenture dated October 6, 2010, among Molson Coors International LP, the guarantors named therein and Computershare Trust Company of Canada, as trustee.
|
10-Q
|
4.1.2
|
August 3, 2011
|
|||||||
|
4.3.5
|
Fourth Supplemental Indenture, dated as of November 11, 2011, to the Indenture dated October 6, 2010, by and among Molson Coors International LP, the guarantors named therein and Computershare Trust Company of Canada, as trustee.
|
10-K
|
4.7.5
|
February 27, 2012
|
|||||||
|
4.3.6
|
Sixth Supplemental Indenture, dated as of June 15, 2012, to the Indenture dated October 6, 2010, by and among Molson Coors International LP, the guarantors named therein and Computershare Trust Company of Canada, as trustee.
|
10-Q
|
4.7
|
August 8, 2012
|
|||||||
|
4.4.1
|
Indenture, dated as of May 3, 2012, by and among the Company, the guarantors named therein and Deutsche Bank Trust Company Americas, as trustee.
|
8-K
|
4.1
|
May 3, 2012
|
|||||||
|
4.4.2
|
First Supplemental Indenture, dated as of May 3, 2012, to the Indenture dated May 3, 2012, by and among the Company, the guarantors named therein and Deutsche Bank Trust Company Americas, as trustee.
|
8-K
|
4.2
|
May 3, 2012
|
|||||||
|
4.4.3
|
Second Supplemental Indenture, dated as of June 15, 2012, to the Indenture dated May 3, 2012, by and among the Company, the guarantors named therein and Deutsche Bank Trust Company Americas, as trustee.
|
10-Q
|
4.8
|
August 8, 2012
|
|||||||
|
4.5
|
Registration Rights Agreement, dated as of February 9, 2005, among Adolph Coors Company, Pentland Securities (1981) Inc., 4280661 Canada Inc., Nooya Investments Ltd., Lincolnshire Holdings Limited, 4198832 Canada Inc., BAX Investments Limited, 6339522 Canada Inc., Barleycorn Investments Ltd., DJS Holdings Ltd., 6339549 Canada Inc., Hoopoe Holdings Ltd., 6339603 Canada Inc., and The Adolph Coors, Jr. Trust dated September 12, 1969.
|
8-K
|
99.2
|
February 15, 2005
|
|||||||
|
4.6
|
Registration Rights Agreement, dated as of June 15, 2012, among Molson Coors Brewing Company, Molson Coors Holdco Inc. and Starbev L.P.
|
8-K
|
10.2
|
June 18, 2012
|
|||||||
|
4.7
|
CAD 900,000,000 in aggregate principal amount of 5.00% Notes due 2015.
|
10-Q
|
4.5
|
November 4, 2005
|
|||||||
|
4.10
|
€500,000,000 Zero-Coupon Senior Unsecured Convertible Bond due 2013.
|
8-K
|
10.1
|
June 18, 2012
|
|||||||
|
10.1
|
*
|
Adolph Coors Company 1990 Equity Incentive Plan effective August 14, 2003, As Corrected and Conformed June 30, 2004.
|
10-Q
|
10.1
|
August 6, 2004
|
||||||
|
10.2
|
*
|
Adolph Coors Company Equity Compensation Plan for Non-Employee Directors, Amended and Restated effective November 13, 2003, As Corrected and Conformed June 30, 2004.
|
10-Q
|
10.3
|
August 6, 2004
|
||||||
153
|
|
Incorporated by Reference
|
Filed Herewith
|
|||||||||
|
Exhibit Number
|
Document Description
|
Form
|
Exhibit
|
Filing Date
|
|||||||
|
10.3
|
*
|
Adolph Coors Company Deferred Compensation Plan, as Amended and Restated effective January 1, 2002, as Corrected and Conformed June 30, 2004.
|
10-Q
|
10.2
|
August 6, 2004
|
||||||
|
10.4
|
*
|
2009 Long-Term Incentive Performance Unit Plan (under the Molson Coors Brewing Company Incentive Compensation Plan).
|
10-K
|
10.6
|
February 19, 2010
|
||||||
|
10.5
|
*
|
Molson Inc. 1988 Canadian Stock Option Plan, as revised.
|
S-8
|
4.3
|
February 8, 2005
|
||||||
|
10.6
|
*
|
Amended and Restated Directors' Stock Plan effective May 31, 2012.
|
10-Q
|
10.7
|
August 8, 2012
|
||||||
|
10.7.1
|
*
|
Molson Coors Brewing Company Incentive Compensation Plan - Amended and Restated effective June 2, 2010.
|
Schedule 14A
|
Appendix B
|
April 20, 2010
|
||||||
|
10.7.2
|
*
|
Amendment No. 1 to Molson Coors Brewing Company Incentive Compensation Plan.
|
8-K
|
10.1
|
June 4, 2012
|
||||||
|
10.7.3
|
*
|
Form of Performance Share Grant Agreement granted pursuant to the Molson Coors Brewing Company Incentive Compensation Plan.
|
10-Q
|
10.4
|
August 4, 2006
|
||||||
|
10.7.4
|
*
|
Form of Restricted Stock Unit Agreement pursuant to the Molson Coors Brewing Company Incentive Compensation Plan.
|
10-Q
|
10.5
|
August 4, 2006
|
||||||
|
10.7.5
|
*
|
Form of Employee RSU Award Statement pursuant to the Molson Coors Brewing Company Incentive Compensation Plan.
|
10-Q
|
10.3
|
November 7, 2008
|
||||||
|
10.7.6
|
*
|
Form of Performance Share Plan Award Statement pursuant to the Molson Coors Brewing Company Incentive Compensation Plan.
|
10-Q
|
10.4
|
November 7, 2008
|
||||||
|
10.7.7
|
*
|
Form of Director RSU Award Statement pursuant to the Molson Coors Brewing Company Incentive Compensation Plan.
|
10-Q
|
10.6
|
November 7, 2008
|
||||||
|
10.8
|
*
|
Form of Executive Continuity and Protection Program Letter Agreement.
|
10-Q
|
10.7
|
May 11, 2005
|
||||||
|
10.9
|
*
|
Molson Coors Brewing Company Amended and Restated Change in Control Protection Program effective January 1, 2008.
|
10-Q
|
10.8
|
August 8, 2012
|
||||||
|
10.22.1
|
*
|
Employment Agreement between Molson Coors Brewing Company and Peter Swinburn dated April 22, 2008.
|
10-Q
|
10.1
|
May 7, 2008
|
||||||
|
10.22.2
|
*
|
Employment Agreement by and among Molson Coors Brewing Company and Peter Swinburn effective July 1, 2008.
|
10-Q
|
10.1
|
November 7, 2008
|
||||||
|
10.23
|
*
|
Offer Letter to Stewart Glendinning, dated May 7, 2012, regarding assignment as President and Chief Executive Officer of Molson Coors UK.
|
10-Q
|
10.12
|
August 8, 2012
|
||||||
|
10.24
|
*
|
Employment Agreement between Molson Coors Brewing Company and Peter H. Coors dated January 1, 2009.
|
10-Q
|
10.2
|
May 6, 2009
|
||||||
|
10.25
|
*
|
Letter Agreement between Coors Brewing Company, Molson Coors Brewing Company and Peter H. Coors amending (1) the Amended Salary Continuation Agreement between Coors Brewing Company and Peter H. Coors dated July 1, 1991 (as subsequently amended), and (2) the Molson Coors Brewing Excess Benefit Plan, as restated effective June 30, 2008 (as subsequently amended), effective January 1, 2009.
|
10-Q
|
10.1
|
May 6, 2009
|
||||||
|
10.26
|
*
|
Employment Agreement between Molson Coors Brewing Company and Gavin Hattersley dated May 10, 2012.
|
10-Q
|
10.13
|
August 8, 2012
|
||||||
154
|
|
Incorporated by Reference
|
Filed Herewith
|
|||||||||
|
Exhibit Number
|
Document Description
|
Form
|
Exhibit
|
Filing Date
|
|||||||
|
10.27.1
|
Credit Agreement dated, as of April 12, 2011, among Molson Coors Brewing Company, Molson Coors Brewing Company (UK) Limited, Molson Canada 2005, Molson Coors Canada Inc. and Molson Coors International LP; the Lenders party hereto; Deutsche Bank AG New York Branch, as Administrative Agent and Issuing Bank; and Deutsche Bank Ag, as Canadian Administrative Agent; and Bank of Montreal and The Toronto‑Dominion Bank as Issuing Bank.
|
10-Q
|
10.1
|
August 3, 2011
|
|||||||
|
10.27.2
|
Amendment No. 1, dated as of April 23, 2012, to the Credit Agreement dated April 12, 2011, among Molson Coors Brewing Company, Molson Coors Brewing Company (UK) Limited, Molson Canada 2005, Molson Coors Canada Inc., Molson Coors International LP, the Lenders that are signatories to the Amendment, and Deutsche Bank AG New York Branch, as Administrative Agent.
|
X
|
|||||||||
|
10.27.3
|
Amendment No. 2, dated as of June 29, 2012, to the Credit Agreement dated April 12, 2011, among Molson Coors Brewing Company, Molson Coors Brewing Company (UK) Limited, Molson Canada 2005, Molson Coors Canada Inc., Molson Coors International LP, the Lenders that are signatories to the Amendment, and Deutsche Bank AG New York Branch, as Administrative Agent.
|
10-Q
|
10.9
|
August 8, 2012
|
|||||||
|
10.28
|
Subsidiary Guarantee Agreement, dated as of April 12, 2011, among Molson Coors Brewing Company, Molson Coors Brewing Company (UK) Limited, Molson Canada 2005, Molson Coors Canada Inc., Molson Coors International LP, each subsidiary of the Company listed on Schedule I hereto and Deutsche Bank AG New York Branch, as Administrative Agent.
|
10-Q
|
10.2
|
August 3, 2011
|
|||||||
|
10.29.1
|
Term Loan Agreement, dated as of April 3, 2012, by and among Molson Coors Brewing Company, the Lenders party thereto, and Deutsche Bank AG New York Branch, as Administrative Agent.
|
8-K
|
10.1
|
April 3, 2012
|
|||||||
|
10.29.2
|
Amendment No. 1, dated as of April 23, 2012, to the Term Loan Agreement dated April 3, 2012, by and among Molson Coors Brewing Company, the Lenders that are signatories to the Amendment, and Deutsche Bank AG New York Branch, as Administrative Agent.
|
X
|
|||||||||
|
10.29.3
|
Amendment No. 2, dated as of June 29, 2012, to the Term Loan Agreement dated April 3, 2012, by and among Molson Coors Brewing Company, Molson Coors European Financing Company S. a.r.l., the Lenders that are signatories to the Amendment, and Deutsche Bank AG New York Branch, as Administrative Agent.
|
10-Q
|
10.10
|
August 8, 2012
|
|||||||
|
10.30
|
Term Loan Subsidiary Guarantee Agreement, dated as of April 3, 2012, by and among Molson Coors Brewing Company, Molson Canada 2005, Molson Coors International LP, Coors Brewing Company, CBC Holdco LLC, CBC Holdco 2 LLC, MC Holding Company LLC, Molson Coors Capital Finance ULC, Molson Coors International General, ULC, Coors International Holdco, ULC, Molson Coors Callco ULC, Newco3, Inc. and Deutsche Bank AG New York Branch, as Administrative Agent.
|
8-K
|
10.2
|
April 3, 2012
|
|||||||
155
|
|
Incorporated by Reference
|
Filed Herewith
|
|||||||||
|
Exhibit Number
|
Document Description
|
Form
|
Exhibit
|
Filing Date
|
|||||||
|
10.31.1
|
Credit Agreement, dated as of April 3, 2012, by and among Molson Coors Brewing Company, Molson Coors Brewing Company (UK) Limited, Molson Canada 2005, Molson Coors Canada Inc. and Molson Coors International LP, the Lenders party thereto, Deutsche Bank AG New York Branch, as Administrative Agent, and Deutsche Bank AG, Canada Branch, as Canadian Administrative Agent.
|
8-K
|
10.5
|
April 3, 2012
|
|||||||
|
10.31.2
|
Amendment No. 1, dated as of April 23, 2012, to the Credit Agreement dated April 3, 2012, by and among Molson Coors Brewing Company, Molson Coors Brewing Company (UK) Limited, Molson Canada 2005, Molson Coors Canada Inc. and Molson Coors International LP as borrowers, the Lenders that are signatories to the Amendment, and Deutsche Bank AG New York Branch, in its capacity as Administrative Agent.
|
8-K
|
10.3
|
June 18, 2012
|
|||||||
|
10.31.3
|
Amendment No. 2, dated as of June 29, 2012, to the Credit Agreement dated April 3, 2012, by and among Molson Coors Brewing Company, Molson Coors Brewing Company (UK) Limited, Molson Canada 2005, Molson Coors Canada Inc. and Molson Coors International LP as borrowers, the Lenders that are signatories to the Amendment, and Deutsche Bank AG New York Branch, in its capacity as Administrative Agent.
|
10-Q
|
10.11
|
August 8, 2012
|
|||||||
|
10.32
|
Credit Agreement Subsidiary Guarantee Agreement, dated as of April 3, 2012, by and among Molson Coors Brewing Company, Molson Coors Brewing Company (UK) Limited, Molson Canada 2005, Molson Coors Canada Inc., Molson Coors International LP, Coors Brewing Company, CBC Holdco LLC, CBC Holdco 2 LLC, MC Holding Company LLC, Molson Coors Capital Finance ULC, Molson Coors International General, ULC, Coors International Holdco, ULC, Molson Coors Callco ULC, Newco3, Inc., Molson Inc., Molson Coors Holdings Limited, Golden Acquisition and Deutsche Bank AG New York Branch, as Administrative Agent.
|
8-K
|
10.6
|
April 3, 2012
|
|||||||
|
10.33
|
EUR 150,000,000 Unsecured Uncommitted Revolving Facilities Agreement, dated as of September 10, 2012, by and among StarBev Netherlands B.V. and Molson Coors Netherlands B.V., as borrowers; Molson Coors Brewing Company, as guarantor; Unicredit Bank Czech Republic, A.S. and ING Bank N.V., Prague Branch, as mandated lead arrangers; the original lenders thereto; UniCredit Bank AG, London Branch, as agent; and ING Bank N.V., Prague Branch, as issuing bank.
|
8-K
|
10.1
|
September 12, 2012
|
|||||||
|
10.34.1
|
Equity Derivatives Confirmation, dated as of June 11, 2007, with respect to a warrant transaction entered into between Citibank, N.A. and Molson Coors Brewing Company.
|
10-Q
|
10.3
|
August 7, 2007
|
|||||||
|
10.34.2
|
Amendment to Equity Derivatives Confirmation, dated as of June 13, 2007, with respect to a warrant transaction entered into between Citibank, N.A., as its agent, and Molson Coors Brewing Company.
|
10-Q
|
10.9
|
August 7, 2007
|
|||||||
|
10.35.1
|
Equity Derivatives Confirmation, dated as of June 11, 2007, with respect to a share option transaction entered into between Citibank, N.A. and Molson Coors Brewing Company.
|
10-Q
|
10.4
|
August 7, 2007
|
|||||||
|
10.35.2
|
Amendment to Equity Derivatives Confirmation, dated as of June 13, 2007, with respect to a share option transaction entered into between Citibank, N.A., as its agent, and Molson Coors Brewing Company.
|
10-Q
|
10.1
|
August 7, 2007
|
|||||||
156
|
|
Incorporated by Reference
|
Filed Herewith
|
|||||||||
|
Exhibit Number
|
Document Description
|
Form
|
Exhibit
|
Filing Date
|
|||||||
|
10.36.1
|
Equity Derivatives Confirmation, dated as of June 11, 2007, with respect to a warrant transaction entered into between Deutsche Bank AG acting through its London branch and Molson Coors Brewing Company.
|
10-Q
|
10.5
|
August 7, 2007
|
|||||||
|
10.36.2
|
Amendment to Equity Derivatives Confirmation, dated as of June 13, 2007, with respect to warrant transaction entered into between Deutsche Bank AG acting through its London branch and Molson Coors Brewing Company.
|
10-Q
|
10.1
|
August 7, 2007
|
|||||||
|
10.37.1
|
Equity Derivatives Confirmation, dated as of June 11, 2007, with respect to a share option transaction entered into between Deutsche Bank AG acting through its London branch and Molson Coors Brewing Company.
|
10-Q
|
10.6
|
August 7, 2007
|
|||||||
|
10.37.2
|
Amendment to Equity Derivatives Confirmation, dated as of June 13, 2007, with respect to a share option transaction entered into between Deutsche Bank AG acting through its London branch and Molson Coors Brewing Company.
|
10-Q
|
10.1
|
August 7, 2007
|
|||||||
|
10.38.1
|
Equity Derivatives Confirmation, dated as of June 11, 2007, with respect to a warrant transaction entered into between Morgan Stanley & Co. International plc, represented by Morgan Stanley Bank, as its agent, and Molson Coors Brewing Company.
|
10-Q
|
10.7
|
August 7, 2007
|
|||||||
|
10.38.2
|
Amendment to Equity Derivatives Confirmation, dated as of June 13, 2007, with respect to a warrant transaction entered into between Morgan Stanley & Co. International plc, represented by Morgan Stanley Bank, as its agent, and Molson Coors Brewing Company.
|
10-Q
|
10.1
|
August 7, 2007
|
|||||||
|
10.39.1
|
Equity Derivatives Confirmation, dated as of June 11, 2007, with respect to a share option transaction entered into between Morgan Stanley & Co. International plc, represented by Morgan Stanley Bank, as its agent, and Molson Coors Brewing Company.
|
10-Q
|
10.8
|
August 7, 2007
|
|||||||
|
10.39.2
|
Amendment to Equity Derivatives Confirmation, dated as of June 13, 2007, with respect to a share option transaction entered into between Morgan Stanley & Co. International plc, represented by Morgan Stanley Bank, as its agent, and Molson Coors Brewing Company.
|
10-Q
|
10.1
|
August 7, 2007
|
|||||||
|
10.40.1
|
***
|
Joint Venture Agreement, dated December 20, 2007, by and among Molson Coors Brewing Company, Coors Brewing Company, SABMiller plc, Miller Brewing Company, and MillerCoors LLC.
|
8-K
|
10.1
|
December 21, 2007
|
||||||
|
10.40.2
|
Amendment No. 1 to Joint Venture Agreement dated as of April 4, 2008, to the Joint Venture Agreement dated December 20, 2007, by and among Molson Coors Brewing Company, Coors Brewing Company, SABMiller plc, Miller Brewing Company, and MillerCoors LLC.
|
10-Q
|
10.1
|
August 6, 2008
|
|||||||
|
10.40.3
|
***
|
Amendment No. 2 to Joint Venture Agreement dated as of April 4, 2008, to the Joint Venture Agreement dated December 20, 2007, by and among Molson Coors Brewing Company, Coors Brewing Company, SABMiller plc, Miller Brewing Company, and MillerCoors LLC.
|
10-Q
|
10.2
|
August 6, 2008
|
||||||
|
10.40.4
|
***
|
Amendment No. 3 to Joint Venture Agreement dated as of July 1, 2008, to the Joint Venture Agreement dated December 20, 2007, by and among Molson Coors Brewing Company, Coors Brewing Company, SABMiller plc, Miller Brewing Company, and MillerCoors LLC.
|
10-Q
|
10.3
|
August 6, 2008
|
||||||
157
|
|
Incorporated by Reference
|
Filed Herewith
|
|||||||||
|
Exhibit Number
|
Document Description
|
Form
|
Exhibit
|
Filing Date
|
|||||||
|
10.41
|
***
|
Amended and Restated Operating Agreement of MillerCoors LLC, dated as of July 1, 2008.
|
8-K
|
10.1
|
July 2, 2008
|
||||||
|
21
|
Subsidiaries of the Registrant.
|
X
|
|||||||||
|
23.1
|
Consent of Independent Registered Public Accounting Firm.
|
X
|
|||||||||
|
23.2
|
Consent of Independent Registered Public Accounting Firm.
|
X
|
|||||||||
|
31.1
|
Section 302 Certification of Chief Executive Officer.
|
X
|
|||||||||
|
31.2
|
Section 302 Certification of Chief Financial Officer.
|
X
|
|||||||||
|
32
|
Written Statement of Chief Executive Officer and Chief Financial Officer furnished pursuant to Section 906 of the Sarbanes-Oxley Act of 2002 (18 U.S.C. Section 1350).
|
X
|
|||||||||
|
99
|
Audited Consolidated Financial Statements of MillerCoors LLC and Subsidiaries
|
X
|
|||||||||
|
101.INS
|
**
|
XBRL Instance Document
|
X
|
||||||||
|
101.SCH
|
**
|
XBRL Taxonomy Extension Schema Document
|
X
|
||||||||
|
101.CAL
|
**
|
XBRL Taxonomy Extension Calculation Linkbase Document
|
X
|
||||||||
|
101.LAB
|
**
|
XBRL Taxonomy Extension Label Linkbase Document
|
X
|
||||||||
|
101.PRE
|
**
|
XBRL Taxonomy Extension Presentation Linkbase Document
|
X
|
||||||||
|
101.DEF
|
**
|
XBRL Taxonomy Extension Definition Linkbase Document
|
X
|
||||||||
* Represents a management contract or compensatory plan or arrangement.
** Attached as Exhibit 101 to this report are the following documents formatted in XBRL (Extensible Business Reporting Language): (i) the Consolidated Statements of Operations for the years ended
December 29, 2012
,
December 31, 2011
, and
December 25, 2010
, (ii) the Consolidated Statements of Comprehensive Income for the years ended
December 29, 2012
,
December 31, 2011
, and
December 25, 2010
, (iii) the Consolidated Balance Sheets at
December 29, 2012
, and
December 31, 2011
, (iv) the Consolidated Statements of Cash Flows for the years ended
December 29, 2012
,
December 31, 2011
, and
December 25, 2010
, (v) the Consolidated Statements of Stockholders' Equity and Noncontrolling Interests for the years ended
December 29, 2012
,
December 31, 2011
, and
December 25, 2010
, (vi) the Notes to Consolidated Financial Statements, and (vii) document and entity information.
.
*** Schedules have been omitted pursuant to Item 601(b)(2) of Regulation S-K. We hereby undertake to supplementally provide copies of any omitted schedules to the Securities and Exchange Commission upon request.
|
(b)
|
Exhibits
|
The exhibits at Item 15(a)(3) above are filed pursuant to the requirements of Item 601 of Regulation S-K.
|
(c)
|
Other Financial Statement Schedules
|
158
SCHEDULE II
MOLSON COORS BREWING COMPANY AND SUBSIDIARIES
VALUATION AND QUALIFYING ACCOUNTS
(IN MILLIONS)
|
Balance at
beginning
of year
|
Additions
charged to
costs and
expenses
|
Deductions(1)
|
Foreign
exchange
impact
|
Balance at
end of year
|
|||||||||||||||
|
Allowance for doubtful accounts—trade accounts receivable
|
|
|
|
|
|
||||||||||||||
|
Year ended:
|
|
|
|
|
|
||||||||||||||
|
December 29, 2012
|
$
|
10.3
|
|
$
|
10.3
|
|
$
|
(7.6
|
)
|
$
|
0.4
|
|
$
|
13.4
|
|
||||
|
December 31, 2011
|
$
|
7.4
|
|
$
|
3.7
|
|
$
|
(0.7
|
)
|
$
|
(0.1
|
)
|
$
|
10.3
|
|
||||
|
December 25, 2010
|
$
|
10.1
|
|
$
|
3.8
|
|
$
|
(6.2
|
)
|
$
|
(0.3
|
)
|
$
|
7.4
|
|
||||
|
Allowance for doubtful accounts—current trade loans
|
|
|
|
|
|
||||||||||||||
|
Year ended:
|
|
|
|
|
|
||||||||||||||
|
December 29, 2012
|
$
|
1.8
|
|
$
|
0.9
|
|
$
|
(1.1
|
)
|
$
|
—
|
|
$
|
1.6
|
|
||||
|
December 31, 2011
|
$
|
2.5
|
|
$
|
1.6
|
|
$
|
(2.4
|
)
|
$
|
0.1
|
|
$
|
1.8
|
|
||||
|
December 25, 2010
|
$
|
2.8
|
|
$
|
1.4
|
|
$
|
(1.7
|
)
|
$
|
—
|
|
$
|
2.5
|
|
||||
|
Allowance for doubtful accounts—long-term trade loans
|
|
|
|
|
|
||||||||||||||
|
Year ended:
|
|
|
|
|
|
||||||||||||||
|
December 29, 2012
|
$
|
4.4
|
|
$
|
2.2
|
|
$
|
(2.8
|
)
|
$
|
0.2
|
|
$
|
4.0
|
|
||||
|
December 31, 2011
|
$
|
6.6
|
|
$
|
2.5
|
|
$
|
(4.8
|
)
|
$
|
0.1
|
|
$
|
4.4
|
|
||||
|
December 25, 2010
|
$
|
7.3
|
|
$
|
4.0
|
|
$
|
(4.5
|
)
|
$
|
(0.2
|
)
|
$
|
6.6
|
|
||||
|
Allowance for obsolete supplies
|
|
|
|
|
|
||||||||||||||
|
Year ended:
|
|
|
|
|
|
||||||||||||||
|
December 29, 2012
|
$
|
5.9
|
|
$
|
7.0
|
|
$
|
(6.0
|
)
|
$
|
0.3
|
|
$
|
7.2
|
|
||||
|
December 31, 2011
|
$
|
4.1
|
|
$
|
2.0
|
|
$
|
(0.2
|
)
|
$
|
—
|
|
$
|
5.9
|
|
||||
|
December 25, 2010
|
$
|
4.1
|
|
$
|
0.4
|
|
$
|
(0.3
|
)
|
$
|
(0.1
|
)
|
$
|
4.1
|
|
||||
|
Deferred tax valuation account
|
|
|
|
|
|
||||||||||||||
|
Year ended:
|
|
|
|
|
|
||||||||||||||
|
December 29, 2012
|
$
|
29.0
|
|
$
|
136.6
|
|
$
|
(9.2
|
)
|
$
|
1.1
|
|
$
|
157.5
|
|
||||
|
December 31, 2011
|
$
|
39.0
|
|
$
|
2.4
|
|
$
|
(12.3
|
)
|
$
|
(0.1
|
)
|
$
|
29.0
|
|
||||
|
December 25, 2010
|
$
|
19.6
|
|
$
|
18.6
|
|
$
|
(0.3
|
)
|
$
|
1.1
|
|
$
|
39.0
|
|
||||
|
(1)
|
Amounts related to write-offs of uncollectible accounts, claims or obsolete inventories and supplies. Amounts related to the deferred tax asset valuation allowance are primarily due to the utilization of capital loss and operating loss carryforwards and re-evaluations of deferred tax assets.
|
159
SIGNATURES
Pursuant to the requirements of Section 13 or 15(d) of the Securities Exchange Act of 1934, the registrant has duly caused this report to be signed on its behalf by the undersigned, thereunto duly authorized.
MOLSON COORS BREWING COMPANY
|
By
|
|
/s/ PETER SWINBURN
|
|
President and Chief Executive Officer
(Principal Executive Officer)
|
|
Peter Swinburn
|
||||
|
By
|
|
/s/ GAVIN HATTERSLEY
|
|
Chief Financial Officer
(Principal Financial Officer)
|
|
Gavin Hattersley
|
||||
|
By
|
|
/s/ ZAHIR IBRAHIM
|
|
Vice President and Controller
(Chief Accounting Officer)
|
|
Zahir Ibrahim
|
||||
February 22, 2013
Pursuant to the requirements of the Securities Exchange Act of 1934, this report has been signed below by the following persons on behalf of the registrant and in the capacities and on the date indicated.
|
By
|
|
/s/ ANDREW T. MOLSON
|
|
Chairman
|
|
Andrew T. Molson
|
||||
|
By
|
|
/s/ PETER H. COORS
|
|
Vice Chairman
|
|
Peter H. Coors
|
||||
|
By
|
|
/s/ FRANCESCO BELLINI
|
|
Director
|
|
Francesco Bellini
|
||||
|
By
|
|
/s/ BRIAN GOLDNER
|
|
Director
|
|
Brian Goldner
|
||||
|
By
|
|
/s/ LOUIS VACHON
|
|
Director
|
|
Louis Vachon
|
||||
|
By
|
|
/s/ ROGER EATON
|
|
Director
|
|
Roger Eaton
|
||||
|
By
|
|
/s/ CHARLES M. HERINGTON
|
|
Director
|
|
Charles M. Herington
|
||||
|
By
|
|
/s/ FRANKLIN W. HOBBS
|
|
Director
|
|
Franklin W. Hobbs
|
||||
|
By
|
|
/s/ GEOFF MOLSON
|
|
Director
|
|
Geoff Molson
|
||||
|
By
|
|
/s/ IAIN NAPIER
|
|
Director
|
|
Iain Napier
|
||||
|
By
|
|
/s/ CHRISTIEN COORS FICELI
|
|
Director
|
|
Christien Coors Ficeli
|
||||
|
By
|
|
/s/ DOUG TOUGH
|
|
Director
|
|
Doug Tough
|
||||
|
By
|
|
/s/ H. SANFORD RILEY
|
|
Director
|
|
H. Sanford Riley
|
||||
February 22, 2013
160
TABLE OF CONTENTS
Part IItem 1. BusinessItem 1A. Risk FactorsItem 1B. Unresolved Staff CommentsItem 2. PropertiesItem 3. Legal ProceedingsItem 4. Mine Safety DisclosuresPart IIItem 5. Market For Registrant's Common Equity, Related Stockholder Matters, and Issuer Purchases Of Equity SecuritiesItem 6. Selected Financial DataItem 7. Management's Discussion and Analysis Of Financial Condition and Results Of OperationsItem 7A. Quantitative and Qualitative Disclosures About Market RiskItem 8. Financial Statements and Supplementary DataItem 9. Changes in and Disagreements with Accountants on Accounting and Financial DisclosureItem 9A. Controls and ProceduresItem 9B. Other InformationPart IIIItem 10. Directors, Executive Officers and Corporate GovernanceItem 11. Executive CompensationItem 12. Security Ownership Of Certain Beneficial Owners and Management and Related Stockholder MattersItem 13. Certain Relationships and Related Transactions, and Director IndependenceItem 14. Principal Accounting Fees and ServicesPart IVItem 15. Exhibits and Financial Statement Schedules