MOLSON COORS BEVERAGE CO
10-Ks and 10-Qs
|
|
|
|
|
|
|
|
|
|
|
|
|
|
|
|
|
|
|
|
|
|
|
|
|
|
|
|
|
|
|
|
|
|
|
|
|
|
|
|
|
|
|
|
|
|
|
|
|
|
|
|
|
|
|
|
|
|
|
Use these links to rapidly review the document
UNITED STATES
SECURITIES AND EXCHANGE COMMISSION
Washington, D.C. 20549
_______________________________________________________________
FORM 10-Q
|
(Mark One)
|
|
|
ý
|
QUARTERLY REPORT PURSUANT TO SECTION 13 OR 15(d) OF THE SECURITIES EXCHANGE ACT OF 1934
|
|
For the Quarterly period ended March 31, 2018
|
|
|
OR
|
|
|
o
|
TRANSITION REPORT PURSUANT TO SECTION 13 OR 15(d) OF THE SECURITIES EXCHANGE ACT OF 1934
|
|
For the transition period from ______ to ______ .
|
|
Commission File Number: 1-14829

Molson Coors Brewing Company
(Exact name of registrant as specified in its charter)
|
DELAWARE
(State or other jurisdiction of incorporation or organization)
|
84-0178360
(I.R.S. Employer Identification No.)
|
|
|
1801 California Street, Suite 4600, Denver, Colorado, USA
1555 Notre Dame Street East, Montréal, Québec, Canada
(Address of principal executive offices)
|
80202
H2L 2R5
(Zip Code)
|
|
303-927-2337 (Colorado)
514-521-1786 (Québec)
(Registrant's telephone number, including area code)
_______________________________________________________________
Indicate by check mark whether the registrant (1) has filed all reports required to be filed by Section 13 or 15(d) of the Securities Exchange Act of 1934 during the preceding 12 months (or for such shorter period that the registrant was required to file such reports), and (2) has been subject to such filing requirements for the past 90 days. Yes
ý
No
o
Indicate by check mark whether the registrant has submitted electronically and posted on its corporate Web site, if any, every Interactive Data File required to be submitted and posted pursuant to Rule 405 of Regulation S-T (§232.405 of this chapter) during the preceding 12 months (or for such shorter period that the registrant was required to submit and post such files). Yes
ý
No
o
Indicate by check mark whether the registrant is a large accelerated filer, an accelerated filer, a non-accelerated filer, smaller reporting company, or an emerging growth company. See the definitions of "large accelerated filer," "accelerated filer," "smaller reporting company" and "emerging growth company" in Rule 12b-2 of the Exchange Act.
|
Large accelerated filer
ý
|
Accelerated filer
o
|
Non-accelerated filer
o
|
Smaller reporting company
o
|
Emerging growth company
o
|
||||
|
(Do not check if a smaller reporting company)
|
||||||||
If an emerging growth company, indicate by check mark if the registrant has elected not to use the extended transition period for complying with any new or revised financial accounting standards provided pursuant to Section 13(a) of the Exchange Act.
o
Indicate by check mark whether the registrant is a shell company (as defined in Rule 12b-2 of the Exchange Act). Yes
o
No
ý
Indicate the number of shares outstanding of each of the registrant's classes of common stock, as of
April 26, 2018
:
Class A Common Stock — 2,560,668 shares
Class B Common Stock — 195,585,037 shares
Exchangeable shares:
As of
April 26, 2018
, the following number of exchangeable shares were outstanding for Molson Coors Canada, Inc.:
Class A Exchangeable shares — 2,878,432 shares
Class B Exchangeable shares — 14,691,564 shares
The Class A exchangeable shares and Class B exchangeable shares are shares of the share capital in Molson Coors Canada Inc., a wholly-owned subsidiary of the registrant. They are publicly traded on the Toronto Stock Exchange under the symbols TPX.A and TPX.B, respectively. These shares are intended to provide substantially the same economic and voting rights as the corresponding class of Molson Coors common stock in which they may be exchanged. In addition to the registered Class A common stock and the Class B common stock, the registrant has also issued and outstanding one share each of a Special Class A voting stock and Special Class B voting stock. The Special Class A voting stock and the Special Class B voting stock provide the mechanism for holders of Class A exchangeable shares and Class B exchangeable shares to be provided instructions to vote with the holders of the Class A common stock and the Class B common stock, respectively. The holders of the Special Class A voting stock and Special Class B voting stock are entitled to one vote for each outstanding Class A exchangeable share and Class B exchangeable share, respectively, excluding shares held by the registrant or its subsidiaries, and generally vote together with the Class A common stock and Class B common stock, respectively, on all matters on which the Class A common stock and Class B common stock are entitled to vote. The Special Class A voting stock and Special Class B voting stock are subject to a voting trust arrangement. The trustee which holds the Special Class A voting stock and the Special Class B voting stock is required to cast a number of votes equal to the number of then-outstanding Class A exchangeable shares and Class B exchangeable shares, respectively, but will only cast a number of votes equal to the number of Class A exchangeable shares and Class B exchangeable shares as to which it has received voting instructions from the owners of record of those Class A exchangeable shares and Class B exchangeable shares, other than the registrant or its subsidiaries, respectively, on the record date, and will cast the votes in accordance with such instructions so received.
MOLSON COORS BREWING COMPANY AND SUBSIDIARIES
INDEX
|
Page
|
||||
2
Glossary of Terms and Abbreviations
|
Acquisition
|
Refers to the acquisition of SABMiller plc's ("SABMiller") 58% economic interest and 50% voting interest in MillerCoors LLC ("MillerCoors") and all trademarks, contracts and other assets primarily related to the "Miller International Business," as defined in the purchase agreement, outside of the U.S. and Puerto Rico from Anheuser-Busch InBev SA/NV ("ABI"), on October 11, 2016.
|
|
AOCI
|
Accumulated other comprehensive income (loss)
|
|
CAD
|
Canadian dollar
|
|
CZK
|
Czech Koruna
|
|
DBRS
|
A global credit rating agency in Toronto
|
|
DSUs
|
Deferred stock units
|
|
EBITDA
|
Earnings before interest, tax, depreciation and amortization
|
|
EPS
|
Earnings per share
|
|
EUR
|
Euro
|
|
FASB
|
Financial Accounting Standards Board
|
|
GBP
|
British Pound
|
|
HRK
|
Croatian Kuna
|
|
JPY
|
Japanese Yen
|
|
Moody’s
|
Moody’s Investors Service Limited, a nationally recognized statistical rating organization designated by the SEC
|
|
OCI
|
Other comprehensive income (loss)
|
|
OPEB
|
Other postretirement benefit plans
|
|
PSUs
|
Performance share units
|
|
RSD
|
Serbian Dinar
|
|
RSUs
|
Restricted stock units
|
|
S&P 500
|
Standard & Poor’s 500 Index®
|
|
SEC
|
Securities and Exchange Commission
|
|
Standard & Poor’s
|
Standard and Poor’s Ratings Services, a nationally recognized statistical rating organization designated by the SEC
|
|
SOSARs
|
Stock-only stock appreciation rights
|
|
STRs
|
Sales-to-retailers
|
|
STWs
|
Sales-to-wholesalers
|
|
U.K.
|
United Kingdom
|
|
U.S.
|
United States
|
|
U.S. GAAP
|
Accounting principles generally accepted in the United States of America
|
|
USD or $
|
U.S. dollar
|
|
VIEs
|
Variable interest entities
|
3
Cautionary Statement Pursuant to Safe Harbor Provisions of the Private Securities Litigation Reform Act of 1995
This report contains forward-looking statements within the meaning of Section 27A of the Securities Act of 1933, as amended, and Section 21E of the Securities Exchange Act of 1934, as amended (the "Exchange Act"). From time to time, we may also provide oral or written forward-looking statements in other materials we release to the public. Such forward-looking statements are subject to the safe harbor created by the Private Securities Litigation Reform Act of 1995.
Statements that refer to projections of our future financial performance, anticipated trends in our businesses, and other characterizations of future events or circumstances are forward-looking statements, and include, but are not limited to, statements under the headings "Management's Discussion and Analysis of Financial Condition and Results of Operations," and under the heading "Outlook for
2018
" therein, relating to overall volume trends, consumer preferences, pricing trends, industry forces, cost reduction strategies, anticipated results, anticipated synergies, anticipated tax rates and benefits, expectations for funding future capital expenditures and operations, debt service capabilities, shipment levels and profitability, market share and the sufficiency of capital resources. In addition, statements that we make in this report that are not statements of historical fact may also be forward-looking statements. Words such as "expects," "goals," "plans," "believes," "continues," "may," "anticipate," "seek," "estimate," "outlook," "trends," "future benefits," "potential," "projects," "strategies," and variations of such words and similar expressions are intended to identify forward-looking statements.
Forward-looking statements are subject to risks and uncertainties that could cause actual results to be materially different from those indicated (both favorably and unfavorably). These risks and uncertainties include, but are not limited to those described under the heading "Risk Factors," elsewhere throughout this report, and those described from time to time in our past and future reports filed with the SEC, including in our Annual Report on Form 10-K for the year ended
December 31, 2017
. Caution should be taken not to place undue reliance on any such forward-looking statements. Forward-looking statements speak only as of the date when made and we undertake no obligation to update any forward-looking statement, whether as a result of new information, future events or otherwise.
Market and Industry Data
The market and industry data used in this Quarterly Report on Form 10-Q are based on independent industry publications, customers, trade or business organizations, reports by market research firms and other published statistical information from third parties, as well as information based on management’s good faith estimates, which we derive from our review of internal information and independent sources.
4
ITEM 1.
MOLSON COORS BREWING COMPANY AND SUBSIDIARIES
(IN MILLIONS, EXCEPT PER SHARE DATA)
(UNAUDITED)
|
|
Three Months Ended
|
||||||
|
|
March 31, 2018
|
March 31, 2017
|
|||||
|
Sales
|
$
|
2,868.0
|
|
$
|
2,913.8
|
|
|
|
Excise taxes
|
(536.5
|
)
|
(465.1
|
)
|
|||
|
Net sales
|
2,331.5
|
|
2,448.7
|
|
|||
|
Cost of goods sold
|
(1,535.7
|
)
|
(1,372.3
|
)
|
|||
|
Gross profit
|
795.8
|
|
1,076.4
|
|
|||
|
Marketing, general and administrative expenses
|
(681.1
|
)
|
(705.3
|
)
|
|||
|
Special items, net
|
314.8
|
|
(6.7
|
)
|
|||
|
Operating income (loss)
|
429.5
|
|
364.4
|
|
|||
|
Interest income (expense), net
|
(83.2
|
)
|
(96.6
|
)
|
|||
|
Other pension and postretirement benefits (costs), net
|
10.0
|
|
13.3
|
|
|||
|
Other income (expense), net
|
1.1
|
|
(0.2
|
)
|
|||
|
Income (loss) before income taxes
|
357.4
|
|
280.9
|
|
|||
|
Income tax benefit (expense)
|
(74.9
|
)
|
(65.9
|
)
|
|||
|
Net income (loss)
|
282.5
|
|
215.0
|
|
|||
|
Net (income) loss attributable to noncontrolling interests
|
(4.4
|
)
|
(6.5
|
)
|
|||
|
Net income (loss) attributable to Molson Coors Brewing Company
|
$
|
278.1
|
|
$
|
208.5
|
|
|
|
|
|
||||||
|
Net income (loss) attributable to Molson Coors Brewing Company per share:
|
|||||||
|
Basic
|
$
|
1.29
|
|
$
|
0.97
|
|
|
|
Diluted
|
$
|
1.28
|
|
$
|
0.96
|
|
|
|
Weighted-average shares outstanding:
|
|||||||
|
Basic
|
215.8
|
|
215.0
|
|
|||
|
Dilutive effect of share-based awards
|
0.8
|
|
1.5
|
|
|||
|
Diluted
|
216.6
|
|
216.5
|
|
|||
|
Anti-dilutive securities excluded from the computation of diluted EPS
|
0.5
|
|
0.2
|
|
|||
|
Dividends declared and paid per share
|
$
|
0.41
|
|
$
|
0.41
|
|
|
See notes to unaudited condensed consolidated financial statements.
5
MOLSON COORS BREWING COMPANY AND SUBSIDIARIES
CONDENSED CONSOLIDATED STATEMENTS OF COMPREHENSIVE INCOME (LOSS)
(IN MILLIONS)
(UNAUDITED)
|
Three Months Ended
|
|||||||
|
March 31, 2018
|
March 31, 2017
|
||||||
|
Net income (loss) including noncontrolling interests
|
$
|
282.5
|
|
$
|
215.0
|
|
|
|
Other comprehensive income (loss), net of tax:
|
|
|
|||||
|
Foreign currency translation adjustments
|
74.1
|
|
81.6
|
|
|||
|
Unrealized gain (loss) on derivative and non-derivative financial instruments
|
(25.8
|
)
|
(8.6
|
)
|
|||
|
Reclassification of derivative (gain) loss to income
|
1.1
|
|
—
|
|
|||
|
Amortization of net prior service (benefit) cost and net actuarial (gain) loss to income
|
1.7
|
|
(1.0
|
)
|
|||
|
Ownership share of unconsolidated subsidiaries' other comprehensive income (loss)
|
(1.2
|
)
|
1.1
|
|
|||
|
Total other comprehensive income (loss), net of tax
|
49.9
|
|
73.1
|
|
|||
|
Comprehensive income (loss)
|
332.4
|
|
288.1
|
|
|||
|
Comprehensive (income) loss attributable to noncontrolling interests
|
(5.2
|
)
|
(6.9
|
)
|
|||
|
Comprehensive income (loss) attributable to Molson Coors Brewing Company
|
$
|
327.2
|
|
$
|
281.2
|
|
|
See notes to unaudited condensed consolidated financial statements.
6
|
MOLSON COORS BREWING COMPANY AND SUBSIDIARIES
(IN MILLIONS, EXCEPT PAR VALUE)
(UNAUDITED)
|
|||||||
|
|
As of
|
||||||
|
|
March 31, 2018
|
December 31, 2017
|
|||||
|
Assets
|
|
|
|||||
|
Current assets:
|
|
|
|||||
|
Cash and cash equivalents
|
$
|
197.9
|
|
$
|
418.6
|
|
|
|
Accounts receivable, net
|
779.3
|
|
733.8
|
|
|||
|
Other receivables, net
|
168.0
|
|
168.2
|
|
|||
|
Inventories, net
|
665.6
|
|
591.5
|
|
|||
|
Other current assets, net
|
326.2
|
|
277.6
|
|
|||
|
Total current assets
|
2,137.0
|
|
2,189.7
|
|
|||
|
Properties, net
|
4,680.8
|
|
4,673.7
|
|
|||
|
Goodwill
|
8,442.7
|
|
8,405.5
|
|
|||
|
Other intangibles, net
|
14,237.6
|
|
14,296.5
|
|
|||
|
Other assets
|
686.4
|
|
681.5
|
|
|||
|
Total assets
|
$
|
30,184.5
|
|
$
|
30,246.9
|
|
|
|
Liabilities and equity
|
|
|
|||||
|
Current liabilities:
|
|
|
|||||
|
Accounts payable and other current liabilities
|
$
|
2,537.1
|
|
$
|
2,684.5
|
|
|
|
Current portion of long-term debt and short-term borrowings
|
1,591.3
|
|
714.8
|
|
|||
|
Total current liabilities
|
4,128.4
|
|
3,399.3
|
|
|||
|
Long-term debt
|
9,527.0
|
|
10,598.7
|
|
|||
|
Pension and postretirement benefits
|
838.0
|
|
848.5
|
|
|||
|
Deferred tax liabilities
|
1,688.7
|
|
1,648.6
|
|
|||
|
Other liabilities
|
338.9
|
|
316.8
|
|
|||
|
Total liabilities
|
16,521.0
|
|
16,811.9
|
|
|||
|
Commitments and contingencies (Note 14)
|
|
|
|
|
|||
|
Molson Coors Brewing Company stockholders' equity
|
|
|
|||||
|
Capital stock:
|
|
|
|||||
|
Preferred stock, $0.01 par value (authorized: 25.0 shares; none issued)
|
—
|
|
—
|
|
|||
|
Class A common stock, $0.01 par value per share (authorized: 500.0 shares; issued and outstanding: 2.6 shares and 2.6 shares, respectively)
|
—
|
|
—
|
|
|||
|
Class B common stock, $0.01 par value per share (authorized: 500.0 shares; issued: 205.1 shares and 204.7 shares, respectively)
|
2.0
|
|
2.0
|
|
|||
|
Class A exchangeable shares, no par value (issued and outstanding: 2.9 shares and 2.9 shares, respectively)
|
107.7
|
|
107.7
|
|
|||
|
Class B exchangeable shares, no par value (issued and outstanding: 14.7 shares and 14.7 shares, respectively)
|
553.2
|
|
553.2
|
|
|||
|
Paid-in capital
|
6,697.4
|
|
6,688.5
|
|
|||
|
Retained earnings
|
7,367.9
|
|
7,206.1
|
|
|||
|
Accumulated other comprehensive income (loss)
|
(810.9
|
)
|
(860.0
|
)
|
|||
|
Class B common stock held in treasury at cost (9.5 shares and 9.5 shares, respectively)
|
(471.4
|
)
|
(471.4
|
)
|
|||
|
Total Molson Coors Brewing Company stockholders' equity
|
13,445.9
|
|
13,226.1
|
|
|||
|
Noncontrolling interests
|
217.6
|
|
208.9
|
|
|||
|
Total equity
|
13,663.5
|
|
13,435.0
|
|
|||
|
Total liabilities and equity
|
$
|
30,184.5
|
|
$
|
30,246.9
|
|
|
See notes to unaudited condensed consolidated financial statements.
7
MOLSON COORS BREWING COMPANY AND SUBSIDIARIES
(IN MILLIONS)
(UNAUDITED)
|
|
Three Months Ended
|
||||||
|
|
March 31, 2018
|
March 31, 2017
|
|||||
|
Cash flows from operating activities:
|
|
|
|||||
|
Net income (loss) including noncontrolling interests
|
$
|
282.5
|
|
|
$
|
215.0
|
|
|
Adjustments to reconcile net income (loss) to net cash provided by operating activities:
|
|
|
|||||
|
Depreciation and amortization
|
213.7
|
|
197.1
|
|
|||
|
Amortization of debt issuance costs and discounts
|
4.1
|
|
6.5
|
|
|||
|
Share-based compensation
|
14.8
|
|
15.5
|
|
|||
|
(Gain) loss on sale or impairment of properties and other assets, net
|
0.7
|
|
(4.4
|
)
|
|||
|
Unrealized (gain) loss on foreign currency fluctuations and derivative instruments, net
|
83.5
|
|
(62.4
|
)
|
|||
|
Income tax (benefit) expense
|
74.9
|
|
65.9
|
|
|||
|
Income tax (paid) received
|
(8.9
|
)
|
(10.9
|
)
|
|||
|
Interest expense, excluding interest amortization
|
79.3
|
|
91.7
|
|
|||
|
Interest paid
|
(115.2
|
)
|
(120.7
|
)
|
|||
|
Pension expense (benefit)
|
(14.9
|
)
|
(16.3
|
)
|
|||
|
Pension contributions paid
|
(2.5
|
)
|
(36.0
|
)
|
|||
|
Change in current assets and liabilities and other
|
(296.8
|
)
|
(459.3
|
)
|
|||
|
Net cash provided by (used in) operating activities
|
315.2
|
|
(118.3
|
)
|
|||
|
Cash flows from investing activities:
|
|
|
|
|
|||
|
Additions to properties
|
(208.3
|
)
|
(180.0
|
)
|
|||
|
Proceeds from sales of properties and other assets
|
1.6
|
|
42.0
|
|
|||
|
Other
|
(45.4
|
)
|
5.9
|
|
|||
|
Net cash provided by (used in) investing activities
|
(252.1
|
)
|
(132.1
|
)
|
|||
|
Cash flows from financing activities:
|
|
|
|
|
|||
|
Exercise of stock options under equity compensation plans
|
6.1
|
|
0.3
|
|
|||
|
Dividends paid
|
(88.5
|
)
|
(88.3
|
)
|
|||
|
Debt issuance costs
|
—
|
|
(3.7
|
)
|
|||
|
Payments on debt and borrowings
|
(0.8
|
)
|
(1,501.1
|
)
|
|||
|
Proceeds on debt and borrowings
|
—
|
|
1,536.0
|
|
|||
|
Net proceeds from (payments on) revolving credit facilities and commercial paper
|
(248.7
|
)
|
131.0
|
|
|||
|
Change in overdraft balances and other
|
42.0
|
|
6.1
|
|
|||
|
Net cash provided by (used in) financing activities
|
(289.9
|
)
|
80.3
|
|
|||
|
Cash and cash equivalents:
|
|
|
|
|
|||
|
Net increase (decrease) in cash and cash equivalents
|
(226.8
|
)
|
(170.1
|
)
|
|||
|
Effect of foreign exchange rate changes on cash and cash equivalents
|
6.1
|
|
4.2
|
|
|||
|
Balance at beginning of year
|
418.6
|
|
560.9
|
|
|||
|
Balance at end of period
|
$
|
197.9
|
|
$
|
395.0
|
|
|
See notes to unaudited condensed consolidated financial statements.
8
MOLSON COORS BREWING COMPANY AND SUBSIDIARIES
CONDENSED CONSOLIDATED STATEMENTS OF STOCKHOLDERS' EQUITY
AND NONCONTROLLING INTERESTS
(IN MILLIONS)
(UNAUDITED)
|
|
MCBC Stockholders' Equity
|
|
|||||||||||||||||||||||||||||||||||||
|
|
|
Accumulated
|
Common Stock
|
|
|||||||||||||||||||||||||||||||||||
|
|
Common stock
|
Exchangeable
|
other
|
held in
|
Non
|
||||||||||||||||||||||||||||||||||
|
|
issued
|
shares issued
|
Paid-in-
|
Retained
|
comprehensive
|
treasury
|
controlling
|
||||||||||||||||||||||||||||||||
|
Total
|
Class A
|
Class B
|
Class A
|
Class B
|
capital
|
earnings
|
income (loss)
|
Class B
|
interests
|
||||||||||||||||||||||||||||||
|
As of December 31, 2016
|
$
|
11,621.7
|
|
$
|
—
|
|
$
|
2.0
|
|
$
|
108.1
|
|
$
|
571.2
|
|
$
|
6,635.3
|
|
$
|
6,145.3
|
|
$
|
(1,571.8
|
)
|
$
|
(471.4
|
)
|
$
|
203.0
|
|
|||||||||
|
Exchange of shares
|
—
|
|
—
|
|
—
|
|
0.3
|
|
(3.6
|
)
|
3.3
|
|
—
|
|
—
|
|
—
|
|
—
|
|
|||||||||||||||||||
|
Shares issued under equity compensation plan
|
(23.5
|
)
|
—
|
|
—
|
|
—
|
|
—
|
|
(23.5
|
)
|
—
|
|
—
|
|
—
|
|
—
|
|
|||||||||||||||||||
|
Amortization of share-based compensation
|
14.8
|
|
—
|
|
—
|
|
—
|
|
—
|
|
14.8
|
|
—
|
|
—
|
|
—
|
|
—
|
|
|||||||||||||||||||
|
Acquisition of business and purchase of noncontrolling interest
|
2.1
|
|
—
|
|
—
|
|
—
|
|
—
|
|
—
|
|
—
|
|
—
|
|
—
|
|
2.1
|
|
|||||||||||||||||||
|
Net income (loss) including noncontrolling interests
|
215.0
|
|
—
|
|
—
|
|
—
|
|
—
|
|
—
|
|
208.5
|
|
—
|
|
—
|
|
6.5
|
|
|||||||||||||||||||
|
Other comprehensive income (loss), net of tax
|
73.1
|
|
—
|
|
—
|
|
—
|
|
—
|
|
—
|
|
—
|
|
72.7
|
|
—
|
|
0.4
|
|
|||||||||||||||||||
|
Dividends declared and paid
|
(88.3
|
)
|
—
|
|
—
|
|
—
|
|
—
|
|
—
|
|
(88.3
|
)
|
—
|
|
—
|
|
—
|
|
|||||||||||||||||||
|
As of March 31, 2017
|
$
|
11,814.9
|
|
$
|
—
|
|
$
|
2.0
|
|
$
|
108.4
|
|
$
|
567.6
|
|
$
|
6,629.9
|
|
|
$
|
6,265.5
|
|
|
$
|
(1,499.1
|
)
|
|
$
|
(471.4
|
)
|
$
|
212.0
|
|
||||||
|
|
|
|
MCBC Stockholders' Equity
|
|
|
||||||||||||||||||||||||||||||||||
|
|
|
|
|
|
|
|
|
|
|
|
|
Accumulated
|
Common Stock
|
|
|
||||||||||||||||||||||||
|
|
|
|
Common stock
|
|
Exchangeable
|
|
|
other
|
held in
|
|
Non
|
||||||||||||||||||||||||||||
|
|
|
|
issued
|
|
shares issued
|
|
Paid-in-
|
Retained
|
comprehensive
|
treasury
|
|
controlling
|
|||||||||||||||||||||||||||
|
|
Total
|
|
Class A
|
|
Class B
|
|
Class A
|
|
Class B
|
|
capital
|
earnings
|
income (loss)
|
Class B
|
|
interests
|
|||||||||||||||||||||||
|
As of December 31, 2017
|
$
|
13,435.0
|
|
|
$
|
—
|
|
|
$
|
2.0
|
|
|
$
|
107.7
|
|
|
$
|
553.2
|
|
|
$
|
6,688.5
|
|
$
|
7,206.1
|
|
$
|
(860.0
|
)
|
$
|
(471.4
|
)
|
|
$
|
208.9
|
|
|||
|
Shares issued under equity compensation plan
|
(5.8
|
)
|
|
—
|
|
|
—
|
|
|
—
|
|
|
—
|
|
|
(5.8
|
)
|
—
|
|
—
|
|
—
|
|
|
—
|
|
|||||||||||||
|
Amortization of share-based compensation
|
14.7
|
|
|
—
|
|
|
—
|
|
|
—
|
|
|
—
|
|
|
14.7
|
|
—
|
|
—
|
|
—
|
|
|
—
|
|
|||||||||||||
|
Net income (loss) including noncontrolling interests
|
282.5
|
|
|
—
|
|
|
—
|
|
|
—
|
|
|
—
|
|
|
—
|
|
278.1
|
|
—
|
|
—
|
|
|
4.4
|
|
|||||||||||||
|
Other comprehensive income (loss), net of tax
|
49.9
|
|
|
—
|
|
|
—
|
|
|
—
|
|
|
—
|
|
|
—
|
|
—
|
|
49.1
|
|
—
|
|
|
0.8
|
|
|||||||||||||
|
Adoption of new accounting pronouncement (see Note 2)
|
(27.8
|
)
|
—
|
|
—
|
|
—
|
|
—
|
|
—
|
|
(27.8
|
)
|
—
|
|
—
|
|
—
|
|
|||||||||||||||||||
|
Contributions from noncontrolling interests
|
6.4
|
|
—
|
|
—
|
|
—
|
|
—
|
|
—
|
|
—
|
|
—
|
|
—
|
|
6.4
|
|
|||||||||||||||||||
|
Dividends declared and paid
|
(91.4
|
)
|
|
—
|
|
|
—
|
|
|
—
|
|
|
—
|
|
|
—
|
|
(88.5
|
)
|
—
|
|
—
|
|
|
(2.9
|
)
|
|||||||||||||
|
As of March 31, 2018
|
$
|
13,663.5
|
|
|
$
|
—
|
|
|
$
|
2.0
|
|
|
$
|
107.7
|
|
|
$
|
553.2
|
|
|
$
|
6,697.4
|
|
$
|
7,367.9
|
|
$
|
(810.9
|
)
|
$
|
(471.4
|
)
|
|
$
|
217.6
|
|
|||
See notes to unaudited condensed consolidated financial statements.
9
MOLSON COORS BREWING COMPANY AND SUBSIDIARIES
NOTES TO UNAUDITED CONDENSED CONSOLIDATED FINANCIAL STATEMENTS
1. Basis of Presentation and Summary of Significant Accounting Policies
Unless otherwise noted in this report, any description of "we," "us" or "our" includes Molson Coors Brewing Company ("MCBC" or the "Company"), principally a holding company, and its operating and non-operating subsidiaries included within our reporting segments and Corporate. Our reporting segments include: MillerCoors LLC ("MillerCoors" or U.S. segment), operating in the United States; Molson Coors Canada ("MCC" or Canada segment), operating in Canada; Molson Coors Europe (Europe segment), operating in Bulgaria, Croatia, Czech Republic, Hungary, Montenegro, Republic of Ireland, Romania, Serbia, the United Kingdom and various other European countries; and Molson Coors International ("MCI" or International segment), operating in various other countries.
Unless otherwise indicated, information in this report is presented in USD and comparisons are to comparable prior periods. Our primary operating currencies, other than USD, include the CAD, the GBP, and our Central European operating currencies such as the EUR, CZK, HRK and RSD.
The accompanying unaudited condensed consolidated interim financial statements reflect all adjustments which are necessary for a fair statement of the financial position, results of operations and cash flows for the periods presented in accordance with U.S. GAAP. Such unaudited interim condensed consolidated financial statements have been prepared in accordance with the instructions to Form 10-Q pursuant to the rules and regulations of the SEC. Certain information and footnote disclosures normally included in financial statements prepared in accordance with U.S. GAAP have been condensed or omitted pursuant to such rules and regulations.
These unaudited condensed consolidated interim financial statements should be read in conjunction with our Annual Report on Form 10-K for the year ended
December 31, 2017
("Annual Report"), and have been prepared on a consistent basis with the accounting policies described in
Note 1
of the Notes to the Audited Consolidated Financial Statements included in our Annual Report, except as noted below and in
Note 2, "New Accounting Pronouncements"
. We adopted both the FASB's new revenue recognition standard and the presentation of net periodic pension and other postretirement benefit cost standard effective
January 1, 2018
.
Our historical unaudited condensed consolidated financial statements have been revised to reflect the retrospective application of our change in accounting policy for calculating the market-related value of pension plan assets used to determine net periodic pension cost as discussed in our Annual Report.
The results of operations for the
three
months ended
March 31, 2018
, are not necessarily indicative of the results that may be achieved for the full year.
Non-Cash Activity
Non-cash activity includes non-cash issuances of share-based awards, as well as non-cash investing activities related to movements in our guarantee of indebtedness of certain equity method investments. See
Note 4, "Investments"
and
Note 5, "Share-Based Payments"
for further discussion. We also had non-cash activities related to capital expenditures incurred but not yet paid, and the recognition of capital leases. These non-cash activities are excluded from our unaudited condensed consolidated statements of cash flows and were
$155.8 million
and
$176.0 million
for the three months ended
March 31, 2018
, and
March 31, 2017
, respectively.
Discontinued Operations
We no longer present the activity related to foreign exchange movements nor the liabilities associated with our indemnities resulting from the historical sale of the Kaiser business (as discussed in Note 19 of the Notes included in our Annual Report) within discontinued operations and have accordingly reclassified the activity into other income within continuing operations of the unaudited condensed consolidated statements of operations, and the liabilities into other current and long-term liabilities within the unaudited condensed consolidated balance sheets. This change has been applied retrospectively and prospectively. As a result, we reclassified a foreign exchange loss from discontinued operations to other income (expense), net of
$0.6 million
for the three months ended March 31, 2017.
Revenue Recognition
We account for revenue in accordance with Accounting Standards Codification (“ASC”) Topic 606, Revenue from Contracts with Customers, which we adopted on
January 1, 2018
, using the modified retrospective transition approach (see
Note 2, "New Accounting Pronouncements"
for impacts of adoption).
10
Our net sales represent the sale of beer and other malt beverages (including adjacencies, such as cider and hard soda), net of excise tax. Sales are stated net of incentives, discounts and returns. Sales of products are for cash or otherwise agreed upon credit terms. Our payment terms vary by location and customer, however, the time period between when revenue is recognized and when payment is due is not significant. Our revenue generating activities have a single performance obligation and are recognized at the point in time when control transfers and our obligation has been fulfilled, which is when the related goods are shipped or delivered to the customer, depending upon the method of distribution and shipping terms. Where our products are sold under consignment arrangements, revenue is not recognized until control has transferred, which is when the product is sold to the end customer. Revenue is measured as the amount of consideration we expect to receive in exchange for the sale of our product. The cost of various programs, such as price promotions, rebates and coupons are treated as a reduction of sales. In certain of our markets, we make cash payments to customers such as slotting or listing fees, or payments for other marketing or promotional activities. These cash payments are recorded as a reduction of revenue unless we receive a distinct good or service as defined under ASC 606. Specifically, a good or service is considered distinct when it is separately identifiable from other promises in the contract, we receive a benefit from the good or service, and the benefit is separable from the sale of our product to the customer.
Certain payments made to customers are conditional on the achievement of volume targets, marketing commitments, or both. If paid in advance, we record such payments as prepayments and amortize them over the relevant period to which the customer commitment is made (generally up to five years). When the payment is not for a distinct good or service, or fair value cannot be reasonably estimated, the amortization of the prepayment or the cost as incurred is recorded as a reduction of revenue. Where a distinct good or service is received and fair value can be reasonably estimated, the cost is included as marketing, general and administrative expenses. The amounts deferred are reassessed regularly for recoverability over the contract period and are impaired where there is objective evidence that the benefits will not be realized or the asset is otherwise not recoverable. Separately, as discussed below, we analyze whether these advance payments contain a significant financing component for potential adjustment to the transaction price.
Our primary revenue generating activity represents the sale of beer and other malt beverages to customers, including both domestic and exported product sales. Our customer could be a distributor, retail or on-premise outlet, depending on the market. The majority of our revenues are generated from brands that we own and brew ourselves, however, we also import or brew and sell certain non-owned partner brands under licensing and related arrangements. In addition, primarily in the U.K., as well as certain other countries in our Europe segment, we sell other beverage companies' products to on-premise customers to provide them with a full range of products for their retail outlets. We refer to this as the "factored brand business." Sales from this business are included in our net sales and cost of goods sold when ultimately sold. In the factored brand business, we normally purchase inventory, which includes excise taxes charged by the vendor, take orders from customers for such brands, negotiate with the customers on pricing and invoice customers for the product and related costs of delivery. In addition, we incur the risk of loss at times we are in possession of the inventory and for the receivables due from the customers. Revenues for owned brands, partner and imported brands, as well as factored brands are recognized at the point in time when control is transferred to the customer as discussed above.
Other Revenue Generating Activities
We contract manufacture for other brewers in some of our markets. These contractual agreements require us to brew, package and ship certain brands to these brewers, who then sell the products to their own customers in their respective markets. Revenues under contract brewing arrangements are recognized when our obligation related to the finished product is fulfilled and control of the product transfers to these other brewers.
We also have licensing agreements with third party partners who brew and distribute our products in various markets across our segments. Under these agreements, we are compensated based on the amount of products sold by our partners in these markets at an agreed upon royalty rate or profit percentage. We apply the sales-based royalty practical expedient to these licensing arrangements and recognize revenue as product is sold by our partners at the agreed upon rate.
We have evaluated these other revenue generating activities under the disaggregation disclosure criteria outlined within the guidance and concluded that these other revenue generating activities are immaterial for separate disclosure. See
Note 3, "Segment Reporting"
, for disclosure of revenues by geographic segment.
11
Variable Consideration
Our revenue generating activities include variable consideration which is recorded as a reduction of the transaction price based upon expected amounts at the time revenue for the corresponding product sale is recognized. For example, customer promotional discount programs are entered into with certain distributors for certain periods of time. The amount ultimately reimbursed to distributors is determined based upon agreed-upon promotional discounts which are applied to distributors sales to retailers. Other common forms of variable consideration include volume rebates for meeting established sales targets, and coupons and mail-in rebates offered to the end consumer. The determination of the reduction of the transaction price for variable consideration requires that we make certain estimates and assumptions that affect the timing and amounts of revenue and liabilities recorded. We estimate this variable consideration, including analyzing for a potential constraint on variable consideration, by taking into account factors such as the nature of the promotional activity, historical information and current trends, availability of actual results, and expectations of customer and consumer behavior.
We do not have standard terms that permit return of product; however, in certain markets where returns occur we estimate the amount of returns as variable consideration based on historical return experience and adjust our revenue accordingly. Products that do not meet our high quality standards are returned by the customer or recalled and destroyed and are recorded as a reduction of revenue. The reversal of revenue is recorded upon determination that the product will be recalled and destroyed. We estimate the costs required to facilitate product returns and record them in cost of goods sold as required.
During the
three
months ended
March 31, 2018
, adjustments to revenue from performance obligations satisfied in the prior period due to changes in estimates in variable consideration were immaterial.
Significant Financing Component and Costs to Obtain Contracts
In certain of our businesses where such practices are legally permitted, we make loans or advanced payments to retail outlets that sell our brands. For arrangements that do not span greater than one year, we apply the practical expedient available under ASC 606 and do not adjust the transaction price for the effects of a potential significant financing component. We further analyze arrangements that span greater than one year on an ongoing basis to determine whether a significant financing component exists. No such arrangements existed during the
three
months ended
March 31, 2018
.
Advance payments to customers, where legally permitted, are deferred and amortized as a reduction to revenue over the expected period of benefit and tested for recoverability as appropriate. All other costs to obtain contracts and fulfill are expensed as incurred based on the nature, significance and expected benefit of these costs relative to the contract.
Contract Assets and Liabilities
We continually evaluate whether our revenue generating activities and advanced payment arrangements with customers result in the recognition of contract assets or liabilities. No such assets or liabilities existed as of
March 31, 2018
, or
December 31, 2017
. Separately, trade accounts receivable, including affiliate receivables, approximates receivables from contracts with customers.
Shipping and Handling
Freight costs billed to customers for shipping and handling are recorded as revenue. Shipping and handling expense related to costs incurred to deliver product are recognized within cost of goods sold. We account for shipping and handling activities that occur after control has transferred as a fulfillment cost as opposed to a separate performance obligation, and the costs of shipping and handling are recognized concurrently with the related revenue.
Excise Tax
Excise tax remitted to tax authorities are government-imposed excise taxes on beer. Excise taxes are shown in a separate line item in the unaudited condensed consolidated statements of operations as a reduction of sales. Excise taxes are recognized as a current liability within accounts payable and other current liabilities on the unaudited condensed consolidated balance sheets, with the liability subsequently reduced when the taxes are remitted to the tax authority.
12
Net Periodic Pension Cost Revised Accounting Policy
The following table presents the impacts to our quarterly information resulting from the retrospective application of our change in accounting policy for calculating the market-related value of pension plan assets used to determine net periodic pension cost effective in the fourth quarter of 2017 as discussed in Note 1 of the Notes of our Annual Report. The below "As Adjusted" amounts have been further adjusted to reflect the adoption of the accounting standard on the presentation of net periodic pension and postretirement benefit cost. See
Note 2, "New Accounting Pronouncements"
.
|
Three Months Ended
|
Three Months Ended
|
Three Months Ended
|
Three Months Ended
|
||||||||||||||||||||||||||||
|
March 31, 2017
|
June 30, 2017
|
September 30, 2017
|
December 31, 2017
|
||||||||||||||||||||||||||||
|
As Reported
|
As Adjusted
|
As Reported
|
As Adjusted
|
As Reported
|
As Adjusted
|
Under Prior Method
|
As Adjusted
|
||||||||||||||||||||||||
|
(In millions)
|
|||||||||||||||||||||||||||||||
|
Unaudited Condensed Consolidated Statements of Operations:
|
|||||||||||||||||||||||||||||||
|
Cost of goods sold
|
$
|
(1,372.9
|
)
|
$
|
(1,367.7
|
)
|
$
|
(1,756.1
|
)
|
$
|
(1,750.7
|
)
|
$
|
(1,589.6
|
)
|
$
|
(1,584.1
|
)
|
$
|
(1,520.3
|
)
|
$
|
(1,514.7
|
)
|
|||||||
|
Marketing, general and administrative expenses
|
$
|
(702.8
|
)
|
$
|
(699.5
|
)
|
$
|
(781.2
|
)
|
$
|
(777.8
|
)
|
$
|
(782.8
|
)
|
$
|
(779.2
|
)
|
$
|
(779.4
|
)
|
$
|
(775.9
|
)
|
|||||||
|
Special items, net
|
$
|
(3.8
|
)
|
$
|
(3.8
|
)
|
$
|
(16.5
|
)
|
$
|
(16.5
|
)
|
$
|
(4.1
|
)
|
$
|
(4.1
|
)
|
$
|
(3.7
|
)
|
$
|
(3.7
|
)
|
|||||||
|
Income tax benefit (expense)
|
$
|
(64.6
|
)
|
$
|
(65.9
|
)
|
$
|
(123.0
|
)
|
$
|
(125.2
|
)
|
$
|
(145.3
|
)
|
$
|
(147.4
|
)
|
$
|
392.4
|
|
$
|
391.7
|
|
|||||||
|
Net income (loss) attributable to MCBC
|
$
|
201.3
|
|
$
|
208.5
|
|
$
|
323.3
|
|
$
|
329.9
|
|
$
|
280.0
|
|
$
|
287.0
|
|
$
|
580.4
|
|
$
|
588.8
|
|
|||||||
|
Basic net income (loss) attributable to MCBC per share
|
$
|
0.94
|
|
$
|
0.97
|
|
$
|
1.50
|
|
$
|
1.53
|
|
$
|
1.30
|
|
$
|
1.33
|
|
$
|
2.69
|
|
$
|
2.73
|
|
|||||||
|
Diluted net income (loss) attributable to MCBC per share
|
$
|
0.93
|
|
$
|
0.96
|
|
$
|
1.49
|
|
$
|
1.52
|
|
$
|
1.29
|
|
$
|
1.33
|
|
$
|
2.68
|
|
$
|
2.72
|
|
|||||||
13
2. New Accounting Pronouncements
New Accounting Pronouncements Recently Adopted
Pension and Other Postretirement Benefit Plans
In
March 2017
, the FASB issued authoritative guidance intended to improve the consistency, transparency and usefulness of financial information related to defined benefit pension or other postretirement plans. Under the new guidance, an employer must disaggregate the service cost component from the other components of net benefit cost within the statements of operations.
Specifically, the new guidance requires us to report only the service cost component in the same line item as other compensation costs arising from services rendered by the pertinent employees during the period; while the other components of net benefit cost are now presented in the unaudited condensed consolidated statements of operations separately from the service cost component and outside of operating income.
The amendments in this update also allow only the service cost component to be eligible for capitalization when applicable.
We have also determined that only service cost will be reported within each operating segment and all other components will be reported within the Corporate segment.
The guidance related to the income statement presentation of service costs and other pension and postretirement benefit costs is applied retrospectively, while the capitalization of service costs component is applied prospectively. We adopted this guidance as of
January 1, 2018
, which was a classification adjustment only and had no impact to our consolidated net income. The adoption of this guidance resulted in the following retrospective adjustments within our unaudited condensed consolidated results of operations:
|
Three Months Ended March 31, 2017
|
|||||||
|
As Adjusted - Pension Methodology
(1)
|
As Adjusted - Accounting Standard Update
|
||||||
|
(In millions)
|
|||||||
|
Unaudited Condensed Consolidated Statement of Operations:
|
|||||||
|
Cost of goods sold
|
$
|
(1,367.7
|
)
|
$
|
(1,372.3
|
)
|
|
|
Marketing, general and administrative expenses
|
$
|
(699.5
|
)
|
$
|
(705.3
|
)
|
|
|
Special items, net
|
$
|
(3.8
|
)
|
$
|
(6.7
|
)
|
|
|
Operating income (loss)
|
$
|
377.7
|
|
$
|
364.4
|
|
|
|
Other pension and postretirement benefits (costs), net
|
$
|
—
|
|
$
|
13.3
|
|
|
|
(1)
|
As discussed in detail within
Note 1, "Basis of Presentation and Summary of Significant Accounting Policies"
, our historical unaudited condensed consolidated financial statements have been revised to reflect the retrospective application of our change in accounting policy for calculating the market-related value of pension plan assets used to determine net periodic pension cost. The change was effective in the fourth quarter of 2017.
|
The following table shows the (increase) decrease for the respective line item within the unaudited condensed consolidated statement of operations for segment reporting for the three months ended
March 31, 2017
:
|
Corporate
|
Europe
|
U.S.
|
Canada
|
||||||||||||
|
Cost of goods sold
|
$
|
—
|
|
$
|
(6.6
|
)
|
$
|
1.8
|
|
$
|
0.2
|
|
|||
|
Marketing, general and administrative expenses
|
—
|
|
(4.7
|
)
|
(0.8
|
)
|
(0.3
|
)
|
|||||||
|
Special items, net
|
—
|
|
—
|
|
—
|
|
(2.9
|
)
|
|||||||
|
Other pension and postretirement benefits (costs), net
|
13.3
|
|
—
|
|
—
|
|
—
|
|
|||||||
|
Total
|
$
|
13.3
|
|
$
|
(11.3
|
)
|
$
|
1.0
|
|
$
|
(3.0
|
)
|
|||
Revenue Recognition
In
May 2014
, the FASB issued authoritative guidance related to new accounting requirements for the recognition of revenue from contracts with customers. The core principle of the guidance is that an entity should recognize revenue to depict the transfer of promised goods or services to customers in an amount that reflects the consideration to which the entity expects to be entitled to in exchange for the goods or services.
We adopted this guidance and related amendments as of
January 1, 2018
, applying the modified retrospective transition approach to all contracts. Based on our comprehensive assessment of the new guidance, including our evaluation of the five-step approach outlined within the guidance, we concluded that the adoption did not have a significant impact to our core revenue generating activities. However, the adoption resulted in a change in presentation of certain cash payments made to
14
customers as well as the timing of recognition of certain promotional discounts. Specifically, certain cash payments to customers were previously recorded within marketing, general and administrative expenses in the unaudited condensed consolidated statements of operations. Upon the adoption of the new guidance, many of these cash payments did not meet the specific criteria within the new guidance of providing a “distinct” good or service, and therefore, were required to be presented as a reduction of revenue. Based on foreign exchange rates as of
March 31, 2018
, we currently anticipate that the impact of this change will result in a reduction of revenue and marketing, general and administrative expenses by approximately
$70 million
to
$90 million
during
2018
, primarily within our Canada segment, with no impact to net income. However, actual results may differ from these estimates. Furthermore, upon adoption of the new guidance, certain of our promotional discounts which are deemed variable consideration under the new guidance, are now recognized at the time of the related shipment of product, which is earlier than recognized under historical guidance. We anticipate that this change in recognition timing will shift financial statement recognition primarily amongst quarters, however, do not anticipate that the full-year impact will be significant to our financial results. We also evaluated the requirements of the new guidance on our other revenue generating activities such as contract brewing and license arrangements, and concluded that no changes to our historical accounting treatment was required.
As a result of the cumulative impact of adopting the new guidance, we recorded a reduction to opening retained earnings of
$27.8 million
as of
January 1, 2018
, with an offsetting increase primarily within accounts payable and other current liabilities and the related tax effects, related primarily to the accelerated recognition of certain promotional discounts. Results for reporting periods beginning after
January 1, 2018
, are presented under the new guidance, while prior period amounts have not been adjusted and continue to be reported in accordance with historical accounting guidance. The following tables provide a comparison of our current period results of operations and financial position under the new guidance, versus our financial statements if the historical guidance had continued to be applied:
|
Three Months Ended March 31, 2018
|
|||||||||||
|
Under Historical Guidance
|
As Reported Under New Guidance
|
Effect of Change
|
|||||||||
|
(In millions, except per share data)
|
|||||||||||
|
Unaudited Condensed Consolidated Statement of Operations:
|
|||||||||||
|
Sales
|
$
|
2,884.1
|
|
$
|
2,868.0
|
|
$
|
(16.1
|
)
|
||
|
Excise taxes
|
(536.5
|
)
|
(536.5
|
)
|
—
|
|
|||||
|
Net sales
|
2,347.6
|
|
2,331.5
|
|
(16.1
|
)
|
|||||
|
Cost of goods sold
|
(1,535.7
|
)
|
(1,535.7
|
)
|
—
|
|
|||||
|
Gross profit
|
811.9
|
|
795.8
|
|
(16.1
|
)
|
|||||
|
Marketing, general and administrative expenses
|
(694.2
|
)
|
(681.1
|
)
|
13.1
|
|
|||||
|
Special items, net
|
314.8
|
|
314.8
|
|
—
|
|
|||||
|
Operating income (loss)
|
432.5
|
|
429.5
|
|
(3.0
|
)
|
|||||
|
Interest income (expense), net
|
(82.4
|
)
|
(83.2
|
)
|
(0.8
|
)
|
|||||
|
Other pension and postretirement benefits (costs), net
|
10.0
|
|
10.0
|
|
—
|
|
|||||
|
Other income (expense), net
|
1.1
|
|
1.1
|
|
—
|
|
|||||
|
Income (loss) before income taxes
|
361.2
|
|
357.4
|
|
(3.8
|
)
|
|||||
|
Income tax benefit (expense)
|
(75.7
|
)
|
(74.9
|
)
|
0.8
|
|
|||||
|
Net income (loss)
|
285.5
|
|
282.5
|
|
(3.0
|
)
|
|||||
|
Net (income) loss attributable to noncontrolling interests
|
(4.4
|
)
|
(4.4
|
)
|
—
|
|
|||||
|
Net income (loss) attributable to MCBC
|
$
|
281.1
|
|
$
|
278.1
|
|
$
|
(3.0
|
)
|
||
|
Basic net income (loss) attributable to MCBC per share
|
$
|
1.30
|
|
$
|
1.29
|
|
$
|
(0.01
|
)
|
||
|
Diluted net income (loss) attributable to MCBC per share
|
$
|
1.30
|
|
$
|
1.28
|
|
$
|
(0.02
|
)
|
||
15
|
As of March 31, 2018
|
|||||||||||
|
Under Historical Guidance
|
As Reported Under New Guidance
|
Effect of Change
|
|||||||||
|
(In millions)
|
|||||||||||
|
Unaudited Condensed Consolidated Balance Sheet:
|
|||||||||||
|
Assets
|
|||||||||||
|
Accounts receivable, net
|
$
|
779.2
|
|
$
|
779.3
|
|
$
|
0.1
|
|
||
|
Other current assets, net
|
$
|
321.4
|
|
$
|
326.2
|
|
$
|
4.8
|
|
||
|
Liabilities and equity
|
|||||||||||
|
Accounts payable and other current liabilities
|
$
|
2,491.6
|
|
$
|
2,537.1
|
|
$
|
45.5
|
|
||
|
Deferred tax liabilities
|
$
|
1,698.5
|
|
$
|
1,688.7
|
|
$
|
(9.8
|
)
|
||
|
Retained earnings
|
$
|
7,398.7
|
|
$
|
7,367.9
|
|
$
|
(30.8
|
)
|
||
These changes are primarily driven by the reclassification of certain cash payments to customers from marketing, general and administrative expenses to a reduction of revenue, as well as the change in the timing of recognition of certain promotional discounts and cash payments to customers. This adoption had no impact to our cash flows from operating, investing or financing activities. See
Note 1, "Basis of Presentation and Summary of Significant Accounting Policies"
for further details on our significant accounting policies for revenue recognition pursuant to the new guidance.
New Accounting Pronouncements Not Yet Adopted
In
February 2018
, the FASB issued authoritative guidance intended to improve the usefulness of financial information related to the enactment of the
2017
U.S. Tax Cuts and Jobs Act (the "
2017
Tax Act"). This guidance provides an option to reclassify from accumulated other comprehensive income to retained earnings the stranded tax effects resulting from the change in the U.S. federal corporate income tax rate as a result of the
2017
Tax Act. This guidance is effective for annual periods beginning after
December 15, 2018
, including interim periods within those annual periods, with early adoption permitted. We are currently evaluating the potential impact on our financial statements in order to determine whether to elect to make this reclassification upon adoption of this guidance.
In
August 2017
, the FASB issued authoritative guidance intended to refine and expand hedge accounting for both financial and commodity risks. The revised guidance will create more transparency around how economic results are presented, both on the face of the financial statements and in the footnotes. In addition, this guidance makes certain targeted improvements to simplify the application of hedge accounting guidance. This guidance is effective for annual periods beginning after
December 15, 2018
, including interim periods within those annual periods, with early adoption permitted. We are currently evaluating the potential impact on our financial position and results of operations upon adoption of this guidance, and do not anticipate that such impact will be significant.
In February 2016, the FASB issued authoritative guidance intended to increase transparency and comparability among organizations by recognizing lease assets and liabilities on the balance sheet and disclosing key information about leasing arrangements. Under the new guidance, lessees will be required to recognize a right-of-use asset and a lease liability, measured on a discounted basis, at the commencement date for all leases with terms greater than twelve months. Additionally, this guidance will require disclosures to help investors and other financial statement users to better understand the amount, timing, and uncertainty of cash flows arising from leases, including qualitative and quantitative requirements. The guidance should be applied under a modified retrospective transition approach. This guidance is effective for annual reporting periods beginning after December 15, 2018, including interim periods within those annual periods, with early adoption permitted. We are currently evaluating the potential impact on our financial position and results of operations upon adoption of this guidance. This guidance will result in our existing operating leases, for certain real estate and equipment, to be recognized on our balance sheet. We will further analyze our lease arrangements as we complete our assessment and implementation of this new guidance.
Other than the items noted above, there have been no new accounting pronouncements not yet effective or adopted in the current year that we believe have a significant impact, or potential significant impact, to our unaudited condensed consolidated interim financial statements.
3. Segment Reporting
Our reporting segments are based on the key geographic regions in which we operate, which are the basis on which our chief operating decision maker evaluates the performance of the business. Our reporting segments consist of the U.S., Canada, Europe and International. Corporate is not a segment and primarily includes interest and certain other general and
16
administrative costs that are not allocated to any of the operating segments as well as the unrealized changes in fair value on our commodity swaps not designated in hedging relationships recorded within cost of goods sold, which are later reclassified when realized to the segment in which the underlying exposure resides. Additionally, only the service cost component of net periodic pension and OPEB cost are now reported within each operating segment, as discussed in
Note 2, "New Accounting Pronouncements"
, and all other components are reported, retrospectively and prospectively, within the Corporate segment in accordance with how our chief operating decision maker evaluates the performance of our business.
No single customer accounted for more than
10%
of our consolidated sales for the
three
months ended
March 31, 2018
, or
March 31, 2017
. Consolidated net sales represent sales to third-party external customers less excise taxes. Inter-segment transactions impacting net sales revenues and income (loss) before income taxes eliminate in consolidation and are primarily related to U.S. segment sales to the other segments.
The following tables present net sales, income (loss) before income taxes and total assets by segment:
|
Three Months Ended
|
|||||||
|
March 31, 2018
|
March 31, 2017
|
||||||
|
(In millions)
|
|||||||
|
U.S.
|
$
|
1,647.8
|
|
$
|
1,749.9
|
|
|
|
Canada
|
283.8
|
|
291.1
|
|
|||
|
Europe
|
374.3
|
|
381.6
|
|
|||
|
International
|
57.5
|
|
61.8
|
|
|||
|
Corporate
|
0.2
|
|
0.3
|
|
|||
|
Inter-segment net sales eliminations
|
(32.1
|
)
|
(36.0
|
)
|
|||
|
Consolidated net sales
|
$
|
2,331.5
|
|
$
|
2,448.7
|
|
|
|
Three Months Ended
|
|||||||
|
March 31, 2018
|
March 31, 2017
(4)
|
||||||
|
(In millions)
|
|||||||
|
U.S.
|
$
|
261.7
|
|
$
|
316.6
|
|
|
|
Canada
(1)
|
9.1
|
|
20.9
|
|
|||
|
Europe
(2)
|
(29.9
|
)
|
27.0
|
|
|||
|
International
|
3.7
|
|
1.5
|
|
|||
|
Corporate
(3)
|
112.8
|
|
(85.1
|
)
|
|||
|
Consolidated income (loss) before income taxes
|
$
|
357.4
|
|
$
|
280.9
|
|
|
|
(1)
|
During the first quarter of 2017, we received payment and recorded a gain of CAD
10.6 million
, or
$8.1 million
, resulting from a purchase price adjustment related to the historical sale of Molson Inc.’s ownership interest in the Montreal Canadiens, which is considered an affiliate of MCBC.
|
|
(2)
|
During the three months ended March 31, 2017, we recorded a provision for an estimate of uncollectible receivables of approximately
$11 million
related to Agrokor, a large customer in Croatia. The proceedings related to this matter have been formally extended to, and are currently expected to be resolved by, July 2018. Separately, during the first quarter of 2017, we released an indirect tax loss contingency, which was initially recorded in the fourth quarter of 2016, for a benefit of approximately
$50 million
. See
Note 14, "Commitments and Contingencies"
for details.
|
|
(3)
|
During the three months ended March 31, 2018, we recorded a gain of
$328.0 million
related to the Adjustment Amount as defined and further discussed in
Note 6, "Special Items"
. Additionally, related to the unrealized mark-to-market valuation on our commodity hedge positions, we recorded an unrealized loss of $
84.7 million
during the three months ended March 31, 2018, compared to an unrealized gain of $
63.1 million
during the three months ended March 31, 2017.
|
|
(4)
|
Segment results for the three months ended
March 31, 2017
, have been adjusted to reflect the adoption of the new accounting pronouncement for pension and other postretirement benefit costs as well as the reclassification of all non-service costs components of pension and other postretirement costs to Corporate. See
Note 2, "New Accounting Pronouncements"
for further details.
|
17
Income (loss) before income taxes includes the impact of special items. Refer to
Note 6, "Special Items"
for further discussion.
|
As of
|
|||||||
|
March 31, 2018
|
December 31, 2017
|
||||||
|
(In millions)
|
|||||||
|
U.S.
|
$
|
19,319.4
|
|
$
|
19,353.6
|
|
|
|
Canada
|
4,688.5
|
|
|
4,835.7
|
|
||
|
Europe
|
5,691.6
|
|
|
5,522.0
|
|
||
|
International
|
275.6
|
|
|
294.8
|
|
||
|
Corporate
|
209.4
|
|
|
240.8
|
|
||
|
Consolidated total assets
|
$
|
30,184.5
|
|
|
$
|
30,246.9
|
|
4. Investments
Our investments include both equity method and consolidated investments. Those entities identified as VIEs have been evaluated to determine whether we are the primary beneficiary. The VIEs included under "Consolidated VIEs" below are those for which we have concluded that we are the primary beneficiary and accordingly, consolidate these entities. None of our consolidated VIEs held debt as of
March 31, 2018
, or
December 31, 2017
. We have not provided any financial support to any of our VIEs during the year that we were not previously contractually obligated to provide. Amounts due to and due from our equity method investments are recorded as affiliate accounts payable and affiliate accounts receivable.
Authoritative guidance related to the consolidation of VIEs requires that we continually reassess whether we are the primary beneficiary of VIEs in which we have an interest. As such, the conclusion regarding the primary beneficiary status is subject to change and we continually evaluate circumstances that could require consolidation or deconsolidation. As of
March 31, 2018
, and
December 31, 2017
, our consolidated VIEs are Cobra Beer Partnership, Ltd. ("Cobra U.K."), Grolsch U.K. Ltd. ("Grolsch"), Rocky Mountain Metal Container ("RMMC") and Rocky Mountain Bottle Company ("RMBC"). Our unconsolidated VIEs are Brewers Retail Inc. ("BRI") and Brewers' Distributor Ltd. ("BDL").
Both BRI and BDL have outstanding third party debt which is guaranteed by its shareholders. As a result, we have a guarantee liability of
$52.2 million
and
$38.1 million
recorded as of
March 31, 2018
, and
December 31, 2017
, respectively, which is presented within accounts payable and other current liabilities on the unaudited condensed consolidated balance sheets and represents our proportionate share of the outstanding balance of these debt instruments. The carrying value of the guarantee liability equals fair value, which considers an adjustment for our own non-performance risk and is considered a Level 2 measurement. The offset to the guarantee liability was recorded as an adjustment to our respective equity method investment within the unaudited condensed consolidated balance sheets. The resulting change in our equity method investments during the year due to movements in the guarantee represents a non-cash investing activity.
Consolidated VIEs
The following summarizes the assets and liabilities of our consolidated VIEs (including noncontrolling interests):
|
|
As of
|
||||||||||||||
|
|
March 31, 2018
|
December 31, 2017
|
|||||||||||||
|
|
Total Assets
|
Total Liabilities
|
Total Assets
|
Total Liabilities
|
|||||||||||
|
|
(In millions)
|
||||||||||||||
|
Grolsch
|
$
|
4.9
|
|
$
|
0.1
|
|
$
|
4.8
|
|
$
|
0.2
|
|
|||
|
Cobra U.K.
|
$
|
17.7
|
|
$
|
1.2
|
|
$
|
20.2
|
|
$
|
2.1
|
|
|||
|
RMMC
|
$
|
72.9
|
|
$
|
4.7
|
|
$
|
74.4
|
|
$
|
4.4
|
|
|||
|
RMBC
|
$
|
67.6
|
|
$
|
6.4
|
|
$
|
56.2
|
|
$
|
4.6
|
|
|||
5. Share-Based Payments
We have
one
share-based compensation plan, the MCBC Incentive Compensation Plan (the "Incentive Compensation Plan"), as of
March 31, 2018
, and all outstanding awards fall under this plan. During the
three months ended
March 31, 2018
, and
March 31, 2017
, we recognized share-based compensation expense related to the following Class B common stock awards to certain directors, officers and other eligible employees, pursuant to the Incentive Compensation Plan: RSUs, DSUs, PSUs and stock options.
18
|
|
Three Months Ended
|
||||||
|
|
March 31, 2018
|
March 31, 2017
|
|||||
|
|
(In millions)
|
||||||
|
Pretax compensation expense
|
$
|
14.8
|
|
$
|
15.5
|
|
|
|
Tax benefit
|
(1.6
|
)
|
(5.3
|
)
|
|||
|
After-tax compensation expense
|
$
|
13.2
|
|
$
|
10.2
|
|
|
As of
March 31, 2018
, there was
$84.4 million
of total unrecognized compensation expense from all share-based compensation arrangements granted under the Incentive Compensation Plan, related to unvested awards. This total compensation expense is expected to be recognized over a weighted-average period of
2.2
years.
|
|
RSUs and DSUs
|
PSUs
|
|||||||
|
|
Units
|
Weighted-average
grant date fair value
per unit
|
Units
|
Weighted-average
grant date fair value
per unit
|
|||||
|
|
(In millions, except per unit amounts)
|
||||||||
|
Non-vested as of December 31, 2017
|
1.0
|
|
$95.80
|
0.4
|
|
$89.57
|
|||
|
Granted
|
0.4
|
|
$74.20
|
0.2
|
|
$78.30
|
|||
|
Vested
|
(0.3
|
)
|
$91.55
|
(0.1
|
)
|
$75.10
|
|||
|
Forfeited
|
—
|
|
$—
|
—
|
|
$—
|
|||
|
Non-vested as of March 31, 2018
|
1.1
|
|
$89.93
|
0.5
|
|
$86.95
|
|||
The weighted-average fair value per unit for the non-vested PSUs is
$86.76
as of
March 31, 2018
.
|
Stock options and SOSARs
|
|||||||||
|
Awards
|
Weighted-average
exercise price per
share
|
Weighted-average
remaining contractual life
(years)
|
Aggregate
intrinsic value
|
||||||
|
|
(In millions, except per share amounts and years)
|
||||||||
|
Outstanding as of December 31, 2017
|
1.5
|
$63.60
|
4.6
|
$
|
31.3
|
|
|||
|
Granted
|
0.2
|
$78.79
|
|
|
|||||
|
Exercised
|
(0.1)
|
$47.96
|
|
|
|||||
|
Forfeited
|
—
|
$—
|
|
|
|||||
|
Outstanding as of March 31, 2018
|
1.6
|
$66.80
|
5.0
|
$
|
20.3
|
|
|||
|
Expected to vest as of March 31, 2018
|
0.4
|
$85.39
|
9.0
|
$
|
—
|
|
|||
|
Exercisable as of March 31, 2018
|
1.2
|
$61.32
|
3.9
|
$
|
20.3
|
|
|||
The total intrinsic values of stock options and SOSARs exercised during the
three months ended
March 31, 2018
, and
March 31, 2017
, were
$4.6 million
and
$4.8 million
, respectively. During the
three months ended
March 31, 2018
, and
March 31, 2017
, cash received from stock option exercises was
$6.1 million
and
$0.3 million
, respectively, and total tax benefits realized, including excess tax benefits, from share-based awards vested or exercised was
$5.4 million
and
$17.0 million
, respectively.
The fair value of each option granted in the
first quarter
of
2018
and
2017
was determined on the date of grant using the Black-Scholes option-pricing model with the following weighted-average assumptions:
|
|
Three Months Ended
|
||
|
|
March 31, 2018
|
March 31, 2017
|
|
|
Risk-free interest rate
|
2.65%
|
2.04%
|
|
|
Dividend yield
|
2.08%
|
1.64%
|
|
|
Volatility range
|
22.36%-24.14%
|
22.40%-22.88%
|
|
|
Weighted-average volatility
|
22.81%
|
22.52%
|
|
|
Expected term (years)
|
5.3
|
5.1
|
|
|
Weighted-average fair market value
|
$15.44
|
$18.66
|
|
19
The risk-free interest rates utilized for periods throughout the contractual life of the stock options are based on a zero-coupon U.S. Treasury security yield at the time of grant. Expected volatility is based on a combination of historical and implied volatility of our stock. The expected term of stock options is estimated based upon observations of historical employee option exercise patterns and trends of those employees granted options in the respective year.
The fair value of the market metric for each PSU granted in the
first quarter
of
2018
and
2017
was determined on the date of grant using a Monte Carlo model to simulate total stockholder return for MCBC and peer companies with the following weighted-average assumptions:
|
Three Months Ended
|
|||
|
March 31, 2018
|
March 31, 2017
|
||
|
Risk-free interest rate
|
2.34%
|
1.59%
|
|
|
Dividend yield
|
2.08%
|
1.64%
|
|
|
Volatility range
|
13.03%-81.87%
|
13.71%-80.59%
|
|
|
Weighted-average volatility
|
22.76%
|
24.24%
|
|
|
Expected term (years)
|
2.8
|
2.8
|
|
|
Weighted-average fair market value
|
$78.30
|
$97.13
|
|
The risk-free interest rates utilized for periods throughout the expected term of the PSUs are based on a zero-coupon U.S. Treasury security yield at the time of grant. Expected volatility is based on historical volatility of our stock as well as the stock of our peer firms, as shown within the volatility range above, for a period from the grant date consistent with the expected term. The expected term of PSUs is calculated based on the grant date to the end of the performance period.
As of
March 31, 2018
, there were
3.5 million
shares of the Company's Class B common stock available for issuance as awards under the Incentive Compensation Plan.
6. Special Items
We have incurred charges or realized benefits that either we do not believe to be indicative of our core operations, or we believe are significant to our current operating results warranting separate classification. As such, we have separately classified these charges (benefits) as special items.
|
Three Months Ended
|
|||||||
|
March 31, 2018
|
March 31, 2017
|
||||||
|
(In millions)
|
|||||||
|
Employee-related charges
|
|||||||
|
Restructuring
|
$
|
3.9
|
|
$
|
0.9
|
|
|
|
Impairments or asset abandonment charges
|
|||||||
|
U.S. - Asset abandonment
(1)
|
1.5
|
|
2.0
|
|
|||
|
Canada - Asset abandonment
(2)
|
6.1
|
|
1.2
|
|
|||
|
Europe - Asset abandonment
(3)
|
1.7
|
|
2.6
|
|
|||
|
Termination fees and other (gains) losses
|
|||||||
|
Acquisition purchase price adjustment settlement gain
(4)
|
(328.0
|
)
|
—
|
|
|||
|
Total Special items, net
|
$
|
(314.8
|
)
|
$
|
6.7
|
|
|
|
(1)
|
Charges for the three months ended March 31, 2018, relate to the planned closure of the Colfax, California, cidery, and consist primarily of accelerated depreciation in excess of normal depreciation. Charges for the three months ended March 31, 2017, relate to the closure of the Eden, North Carolina, brewery.
|
|
(2)
|
For the
three
months ended
March 31, 2018
, we incurred charges consisting primarily of accelerated depreciation in excess of normal depreciation related to the planned closures of the Vancouver and Montreal breweries, which are currently expected to occur in 2019 and 2021, respectively. Charges for the three months ended
March 31, 2017
, relate primarily to accelerated depreciation in excess of normal depreciation related to the above mentioned planned closure of the Vancouver brewery.
|
20
|
(3)
|
For the
three
months ended
March 31, 2018
, and
March 31, 2017
, we incurred charges consisting primarily of accelerated depreciation in excess of normal depreciation related to the Burton South brewery, which closed during the first quarter of 2018.
|
|
(4)
|
On
October 11, 2016
, we completed the Acquisition for
$12.0 billion
in cash, subject to a downward adjustment as described in the purchase agreement. This purchase price "Adjustment Amount," as defined in the purchase agreement, required payment to MCBC if the unaudited EBITDA for the Miller International Business for the twelve months prior to closing was below
$70 million
.
|
Throughout the process outlined in the purchase agreement, significant uncertainty remained on the ultimate outcome of the Adjustment Amount. As a result, no adjustment to purchase accounting was made through the completion of the measurement period in October 2017. Subsequently, on January 21, 2018, MCBC and ABI entered into a settlement agreement related to the purchase price adjustment under the purchase agreement, and on January 26, 2018, pursuant to the settlement agreement, ABI paid to MCBC
$330.0 million
, of which
$328.0 million
constitutes the Adjustment Amount. As this settlement occurred following the finalization of purchase accounting, we recorded the settlement proceeds related to the Adjustment Amount as a gain within special items, net in our unaudited condensed consolidated statement of operations in our Corporate segment and within cash provided by operating activities within our unaudited condensed consolidated statement of cash flows for the three months ended March 31, 2018. MCBC and ABI also agreed to certain mutual releases as further described in the settlement agreement which was filed as an exhibit to a Current Report on Form 8-K filed January 22, 2018.
Restructuring Activities
Beginning in 2016, restructuring initiatives related to the integration of MillerCoors after the completion of the Acquisition were implemented in order to operate a more efficient business and achieve cost saving targets which to-date resulted in reduced employment levels by approximately
103
employees. Total restructuring costs related to integration initiatives represent the majority of the charges within the table below by segment. Severance costs related to these restructuring activities were recorded as special items within our unaudited condensed consolidated statements of operations. As we continually evaluate our cost structure and seek opportunities for further efficiencies and cost savings as part of these initiatives, we may incur additional restructuring related charges in the future, however, we are unable to estimate the amount of charges at this time.
We have continued our ongoing assessment of our supply chain strategies across our segments in order to align with our cost saving objectives. As part of this strategic review, which began in 2014, we have had restructuring activities related to the closure or planned closure of breweries, as well as activities related to business efficiencies. As a result, we have reduced employment levels by a total of
416
employees. Consequently, we recognized severance and other employee-related charges, which we have recorded as special items within our unaudited condensed consolidated statements of operations. We will continue to evaluate our supply chain network and seek opportunities for further efficiencies and cost savings, and we therefore may incur additional restructuring related charges or adjustments to previously recorded charges in the future, however, we are unable to estimate the amount of charges at this time.
The accrued restructuring balances represent expected future cash payments required to satisfy the remaining severance obligations to terminated employees, the majority of which we expect to be paid in the next
9
months.
|
|
U.S.
|
Canada
|
Europe
|
International
|
Corporate
|
Total
|
|||||||||||||||||
|
|
(In millions)
|
||||||||||||||||||||||
|
As of December 31, 2017
|
$
|
0.6
|
|
$
|
4.3
|
|
$
|
1.8
|
|
$
|
0.2
|
|
$
|
—
|
|
$
|
6.9
|
|
|||||
|
Charges incurred and changes in estimates
|
—
|
|
(0.5
|
)
|
3.4
|
|
1.0
|
|
—
|
|
3.9
|
|
|||||||||||
|
Payments made
|
(0.3
|
)
|
(0.9
|
)
|
(0.6
|
)
|
(0.2
|
)
|
—
|
|
(2.0
|
)
|
|||||||||||
|
Foreign currency and other adjustments
|
—
|
|
(0.1
|
)
|
—
|
|
—
|
|
—
|
|
(0.1
|
)
|
|||||||||||
|
As of March 31, 2018
|
$
|
0.3
|
|
|
$
|
2.8
|
|
$
|
4.6
|
|
$
|
1.0
|
|
$
|
—
|
|
$
|
8.7
|
|
||||
21
|
|
U.S.
|
Canada
|
Europe
|
International
|
Corporate
|
Total
|
|||||||||||||||||
|
|
(In millions)
|
||||||||||||||||||||||
|
As of December 31, 2016
|
$
|
5.1
|
|
$
|
5.9
|
|
$
|
2.8
|
|
$
|
0.2
|
|
$
|
0.7
|
|
$
|
14.7
|
|
|||||
|
Charges incurred and changes in estimates
|
0.5
|
|
—
|
|
—
|
|
0.3
|
|
0.1
|
|
0.9
|
|
|||||||||||
|
Payments made
|
(3.6
|
)
|
(0.4
|
)
|
(0.3
|
)
|
—
|
|
—
|
|
(4.3
|
)
|
|||||||||||
|
Foreign currency and other adjustments
|
—
|
|
—
|
|
—
|
|
—
|
|
—
|
|
—
|
|
|||||||||||
|
As of March 31, 2017
|
$
|
2.0
|
|
|
$
|
5.5
|
|
$
|
2.5
|
|
$
|
0.5
|
|
$
|
0.8
|
|
$
|
11.3
|
|
||||
7. Income Tax
|
Three Months Ended
|
|||||
|
March 31, 2018
|
March 31, 2017
|
||||
|
Effective tax rate
|
21
|
%
|
23
|
%
|
|
The decrease in the effective tax rate during the first quarter of
2018
versus
2017
, is primarily driven by the reduction of the statutory U.S. federal corporate income tax rate from
35%
to
21%
as a result of the
2017
Tax Act. This decrease was partially offset by the impact of discrete items. Specifically, we recognized net discrete tax expense of
$5.5 million
in the first quarter of
2018
, versus an
$8.4 million
net discrete tax benefit recognized in the first quarter of
2017
. This change is driven primarily by the recognition of excess benefits from share-based compensation in the first quarter of
2017
, versus other discrete tax expenses recognized in the first quarter of 2018.
Our tax rate is volatile and may move up or down with changes in, among other things, the amount and source of income or loss, our ability to utilize foreign tax credits, excess tax benefits or deficiencies from share-based compensation, changes in tax laws, and the movement of liabilities established pursuant to accounting guidance for uncertain tax positions as statutes of limitations expire, positions are effectively settled, or when additional information becomes available. There are proposed or pending tax law changes in various jurisdictions and other changes to regulatory environments in countries in which we do business that, if enacted, may have an impact on our effective tax rate.
Additionally, we continue to evaluate the impacts of the
2017
Tax Act. As we further understand its implications, as well as the related, and yet to be issued, regulator rules, regulations and interpretations, our effective tax rate could be impacted. For example, subsequent to the enactment, the FASB staff concluded that companies should make an accounting policy election to account for the tax effects of the global intangible low-taxed income (“GILTI”) either as a component of income tax expense in the future period the tax arises, or as a component of deferred taxes on the related investments in foreign subsidiaries. We are currently evaluating the GILTI provisions of the
2017
Tax Act and the related implications and have not finalized our accounting policy election, however, have preliminarily concluded that we will record as a periodic expense as incurred, and therefore, have not recorded deferred taxes for GILTI. We will continue to evaluate in future periods and will finalize our accounting policy election at that time.
We did not make any material adjustments to the amounts recorded as of
December 31, 2017
, as a result of the 2017 Tax Act, however, we continue to consider these amounts provisional for the reasons discussed above. Additional impacts from the
2017
Tax Act will be recorded as they are identified during the measurement period pursuant to SEC Staff Accounting Bulletin No. 118 ("SAB 118"). Our determination of the tax effects of the
2017
Tax Act will be completed no later than one year from the enactment date as permitted under SAB 118. Any adjustments to provisional amounts that are identified during the measurement period will be recorded and disclosed in the reporting period in which the adjustment is determined. The complexity of the
2017
Tax Act could necessitate the need to use the full one year measurement period to adequately interpret, analyze and conclude upon the tax effects of the
2017
Tax Act as of the enactment date.
8. Goodwill and Intangible Assets
|
U.S.
|
Canada
|
Europe
|
International
|
Consolidated
|
|||||||||||||||
|
Changes in Goodwill:
|
(In millions)
|
||||||||||||||||||
|
As of December 31, 2017
|
$
|
5,928.5
|
|
$
|
932.1
|
|
$
|
1,538.0
|
|
$
|
6.9
|
|
$
|
8,405.5
|
|
||||
|
Business acquisition
(1)
|
—
|
|
—
|
|
9.8
|
|
—
|
|
9.8
|
|
|||||||||
|
Foreign currency translation
|
—
|
|
(23.8
|
)
|
51.3
|
|
(0.1
|
)
|
27.4
|
|
|||||||||
|
As of March 31, 2018
|
$
|
5,928.5
|
|
|
$
|
908.3
|
|
$
|
1,599.1
|
|
$
|
6.8
|
|
$
|
8,442.7
|
|
|||
22
|
(1)
|
During the first quarter of 2018, we completed the acquisition of Aspall Cyder Limited, an established premium cider business in the U.K. As part of the preliminary purchase price accounting in the first quarter of 2018, goodwill generated in conjunction with this acquisition has been recorded within our Europe segment, subject to normal purchase accounting adjustments.
|
The following table presents details of our intangible assets, other than goodwill, as of
March 31, 2018
:
|
Useful life
|
Gross
|
Accumulated
amortization
|
Net
|
||||||||||
|
|
(Years)
|
(In millions)
|
|||||||||||
|
Intangible assets subject to amortization:
|
|
|
|
|
|||||||||
|
Brands
|
10 - 50
|
$
|
5,200.0
|
|
$
|
(567.2
|
)
|
$
|
4,632.8
|
|
|||
|
License agreements and distribution rights
|
15 - 28
|
236.7
|
|
(104.9
|
)
|
131.8
|
|
||||||
|
Other
|
2 - 40
|
149.7
|
|
(46.7
|
)
|
103.0
|
|
||||||
|
Intangible assets not subject to amortization:
|
|
|
|
|
|||||||||
|
Brands
|
Indefinite
|
8,248.2
|
|
—
|
|
8,248.2
|
|
||||||
|
Distribution networks
|
Indefinite
|
784.2
|
|
—
|
|
784.2
|
|
||||||
|
Other
|
Indefinite
|
337.6
|
|
—
|
|
337.6
|
|
||||||
|
Total
|
|
$
|
14,956.4
|
|
$
|
(718.8
|
)
|
$
|
14,237.6
|
|
|||
The following table presents details of our intangible assets, other than goodwill, as of
December 31, 2017
:
|
Useful life
|
Gross
|
Accumulated
amortization
|
Net
|
||||||||||
|
|
(Years)
|
(In millions)
|
|||||||||||
|
Intangible assets subject to amortization:
|
|
|
|
|
|||||||||
|
Brands
|
10 - 50
|
$
|
5,215.3
|
|
$
|
(516.0
|
)
|
$
|
4,699.3
|
|
|||
|
License agreements and distribution rights
|
15 - 28
|
236.3
|
|
(103.9
|
)
|
132.4
|
|
||||||
|
Other
|
2 - 40
|
148.3
|
|
(42.4
|
)
|
105.9
|
|
||||||
|
Intangible assets not subject to amortization:
|
|
|
|
|
|||||||||
|
Brands
|
Indefinite
|
8,216.6
|
|
—
|
|
8,216.6
|
|
||||||
|
Distribution networks
|
Indefinite
|
804.7
|
|
—
|
|
804.7
|
|
||||||
|
Other
|
Indefinite
|
337.6
|
|
—
|
|
337.6
|
|
||||||
|
Total
|
|
$
|
14,958.8
|
|
$
|
(662.3
|
)
|
$
|
14,296.5
|
|
|||
The changes in the gross carrying amounts of intangibles from
December 31, 2017
, to
March 31, 2018
, are primarily driven by the impact of foreign exchange rates, as a significant amount of intangibles are denominated in foreign currencies.
Based on foreign exchange rates as of
March 31, 2018
, the estimated future amortization expense of intangible assets is as follows:
|
Fiscal year
|
Amount
|
|||
|
(In millions)
|
||||
|
2018 - remaining
|
$
|
168.4
|
|
|
|
2019
|
$
|
223.9
|
|
|
|
2020
|
$
|
222.9
|
|
|
|
2021
|
$
|
217.5
|
|
|
|
2022
|
$
|
213.4
|
|
|
Amortization expense of intangible assets was
$56.6 million
and
$55.2 million
for the
three months ended
March 31, 2018
, and
March 31, 2017
, respectively. This expense is primarily presented within marketing, general and administrative expenses on the unaudited condensed consolidated statements of operations.
23
Annual Goodwill Impairment Testing
We completed our required annual goodwill and indefinite-lived intangible impairment testing as of October 1, 2017, the first day of our fourth quarter, and concluded there were no impairments of goodwill within our reporting units or our indefinite-lived intangible assets.
Key Assumptions
Fair value determinations require considerable judgment and are sensitive to changes in underlying assumptions and factors. The key assumptions used to derive the estimated fair values of our reporting units and indefinite-lived intangibles are discussed in Part II—Item 8 Financial Statements, Note 11, "Goodwill and Intangible Assets" in our Annual Report.
Based on known facts and circumstances, we evaluate and consider recent events and uncertain items, as well as related potential implications, as part of our annual assessment and incorporate into the analyses as appropriate. These facts and circumstances are subject to change and may impact future analyses. For example, subsequent to the completion of our annual impairment testing, we considered the implications of the enactment of the 2017 Tax Act on our U.S. reporting unit and indefinite-lived brand valuations. The results of our preliminary analysis indicated that the implications are expected to be favorable, keeping all other assumptions constant.
While historical performance and current expectations have resulted in fair values of our reporting units and indefinite-lived intangible assets in excess of carrying values, if our assumptions are not realized, it is possible that an impairment charge may need to be recorded in the future.
Indefinite and Definite-Lived Intangibles
Regarding indefinite and definite-lived intangibles, we continuously monitor the performance of the underlying assets for potential triggering events suggesting an impairment review should be performed. No such triggering events were identified in the
first quarter
of
2018
that resulted in an impairment.
24
Debt obligations
|
As of
|
|||||||
|
|
March 31, 2018
|
December 31, 2017
|
|||||
|
|
(In millions)
|
||||||
|
Long-term debt:
|
|||||||
|
CAD 400 million 2.25% notes due 2018
|
$
|
310.1
|
|
$
|
318.2
|
|
|
|
CAD 500 million 2.75% notes due 2020
|
387.6
|
|
397.7
|
|
|||
|
CAD 500 million 2.84% notes due 2023
|
387.6
|
|
397.7
|
|
|||
|
CAD 500 million 3.44% notes due 2026
|
387.6
|
|
397.7
|
|
|||
|
$500 million 1.45% notes due 2019
|
500.0
|
|
500.0
|
|
|||
|
$500 million 1.90% notes due 2019
(1)
|
498.8
|
|
498.5
|
|
|||
|
$500 million 2.25% notes due 2020
(1)
|
498.4
|
|
498.2
|
|
|||
|
$1.0 billion 2.10% notes due 2021
|
1,000.0
|
|
1,000.0
|
|
|||
|
$500 million 3.5% notes due 2022
(1)
|
511.5
|
|
512.2
|
|
|||
|
$2.0 billion 3.0% notes due 2026
|
2,000.0
|
|
2,000.0
|
|
|||
|
$1.1 billion 5.0% notes due 2042
|
1,100.0
|
|
1,100.0
|
|
|||
|
$1.8 billion 4.2% notes due 2046
|
1,800.0
|
|
1,800.0
|
|
|||
|
EUR 500 million notes due 2019
|
616.2
|
|
600.3
|
|
|||
|
EUR 800 million 1.25% notes due 2024
|
985.9
|
|
960.4
|
|
|||
|
Other long-term debt
|
52.0
|
|
22.1
|
|
|||
|
Less: unamortized debt discounts and debt issuance costs
|
(73.2
|
)
|
(75.9
|
)
|
|||
|
Total long-term debt (including current portion)
|
10,962.5
|
|
10,927.1
|
|
|||
|
Less: current portion of long-term debt
|
(1,435.5
|
)
|
(328.4
|
)
|
|||
|
Total long-term debt
|
$
|
9,527.0
|
|
$
|
10,598.7
|
|
|
|
Short-term borrowings:
|
|||||||
|
Commercial paper program
(2)
|
$
|
128.0
|
|
$
|
379.0
|
|
|
|
Other short-term borrowings
(3)
|
27.8
|
|
7.4
|
|
|||
|
Current portion of long-term debt
|
1,435.5
|
|
328.4
|
|
|||
|
Current portion of long-term debt and short-term borrowings
|
$
|
1,591.3
|
|
$
|
714.8
|
|
|
|
(1)
|
The fair value hedges related to these notes have been settled and are being amortized over the life of the respective note.
|
|
(2)
|
As of
March 31, 2018
, the outstanding borrowings under our commercial paper program had a weighted-average effective interest rate and tenor of
2.45%
and
11
days, respectively, compared to a weighted-average effective interest rate and tenor of
1.84%
and
45
days, respectively, as of
December 31, 2017
.
|
|
(3)
|
As of
March 31, 2018
, we had
$4.8 million
in bank overdrafts and
$29.3 million
in bank cash related to our cross-border, cross-currency cash pool, for a net positive position of
$24.5 million
. As of
December 31, 2017
, we had
$1.2 million
in bank overdrafts and
$37.8 million
in bank cash related to our cross-border, cross-currency cash pool for a net positive position of
$36.6 million
. We had total outstanding borrowings of
$5.2 million
and
$3.2 million
under our two JPY overdraft facilities as of
March 31, 2018
, and
December 31, 2017
, respectively. In addition, we have GBP and CAD lines of credit. As of
March 31, 2018
, we had
$14.7 million
of bank overdrafts related to our GBP line of credit and no borrowings under our CAD line of credit. As of
December 31, 2017
we had no borrowings under either line of credit. The remaining balance primarily relates to short-term borrowings.
|
Debt Fair Value Measurements
We utilize market approaches to estimate the fair value of certain outstanding borrowings by discounting anticipated future cash flows derived from the contractual terms of the obligations and observable market interest and foreign exchange rates. As of
March 31, 2018
, and
December 31, 2017
, the fair value of our outstanding long-term debt (including the current
25
portion of long-term debt) was approximately
$10.8 billion
and
$11.2 billion
, respectively. All senior notes are valued based on significant observable inputs and classified as Level 2 in the fair value hierarchy. The carrying values of all other outstanding long-term borrowings and our short-term borrowings approximate their fair values and are also classified as Level 2 in the fair value hierarchy.
Revolving Credit Facility
As of
March 31, 2018
, we had approximately
$1.4 billion
available to draw under our
$1.5 billion
revolving multi-currency credit facility, as the borrowing capacity is reduced by borrowings under our commercial paper program. We had no other borrowings drawn on this revolving credit facility as of
March 31, 2018
. The maximum leverage ratio of this facility is
5.25x
debt to EBITDA, with a decline to
4.00x
debt to EBITDA as of the last day of the fiscal quarter ending December 31, 2020.
Under the terms of each of our debt facilities, we must comply with certain restrictions. These include customary events of default and specified representations and warranties and covenants, including, among other things, covenants that restrict our ability to incur certain additional priority indebtedness, create or permit liens on assets, or engage in mergers or consolidations. As of
March 31, 2018
, we were in compliance with all of these restrictions and have met all debt payment obligations. All of our outstanding senior notes as of
March 31, 2018
, rank pari-passu.
10. Inventories
|
|
As of
|
||||||
|
|
March 31, 2018
|
December 31, 2017
|
|||||
|
(In millions)
|
|||||||
|
Finished goods
|
$
|
274.0
|
|
$
|
222.3
|
|
|
|
Work in process
|
95.4
|
|
85.2
|
|
|||
|
Raw materials
|
226.4
|
|
231.7
|
|
|||
|
Packaging materials
|
69.8
|
|
52.3
|
|
|||
|
Inventories, net
|
$
|
665.6
|
|
$
|
591.5
|
|
|
11. Accumulated Other Comprehensive Income (Loss)
|
MCBC shareholders
|
|||||||||||||||||||
|
Foreign
currency
translation
adjustments
|
Gain (loss) on
derivative
instruments
|
Pension and
postretirement
benefit
adjustments
|
Equity method
investments
|
Accumulated
other
comprehensive
income (loss)
|
|||||||||||||||
|
(In millions)
|
|||||||||||||||||||
|
As of December 31, 2017
|
$
|
(314.6
|
)
|
$
|
(110.9
|
)
|
$
|
(375.0
|
)
|
$
|
(59.5
|
)
|
$
|
(860.0
|
)
|
||||
|
Foreign currency translation adjustments
|
83.1
|
|
—
|
|
(1.1
|
)
|
—
|
|
82.0
|
|
|||||||||
|
Unrealized gain (loss) on derivative and non-derivative financial instruments
|
—
|
|
(34.0
|
)
|
—
|
|
—
|
|
(34.0
|
)
|
|||||||||
|
Reclassification of derivative (gain) loss to income
|
—
|
|
1.4
|
|
—
|
|
—
|
|
1.4
|
|
|||||||||
|
Amortization of net prior service (benefit) cost and net actuarial (gain) loss to income
|
—
|
|
—
|
|
1.9
|
|
—
|
|
1.9
|
|
|||||||||
|
Ownership share of unconsolidated subsidiaries' other comprehensive income (loss)
|
—
|
|
—
|
|
—
|
|
(1.6
|
)
|
(1.6
|
)
|
|||||||||
|
Tax benefit (expense)
|
(8.7
|
)
|
7.9
|
|
(0.2
|
)
|
0.4
|
|
(0.6
|
)
|
|||||||||
|
As of March 31, 2018
|
$
|
(240.2
|
)
|
$
|
(135.6
|
)
|
$
|
(374.4
|
)
|
$
|
(60.7
|
)
|
$
|
(810.9
|
)
|
||||
26
Reclassifications from AOCI to income:
|
Three Months Ended
|
|||||||||
|
March 31, 2018
|
March 31, 2017
|
||||||||
|
Reclassifications from AOCI
|
Location of gain (loss)
recognized in income
|
||||||||
|
(In millions)
|
|||||||||
|
Gain/(loss) on cash flow hedges:
|
|||||||||
|
Forward starting interest rate swaps
|
$
|
(0.8
|
)
|
$
|
(1.0
|
)
|
Interest expense, net
|
||
|
Foreign currency forwards
|
—
|
|
(0.9
|
)
|
Other income (expense), net
|
||||
|
Foreign currency forwards
|
(0.6
|
)
|
1.9
|
|
Cost of goods sold
|
||||
|
Total income (loss) reclassified, before tax
|
(1.4
|
)
|
—
|
|
|||||
|
Income tax benefit (expense)
|
0.3
|
|
—
|
|
|||||
|
Net income (loss) reclassified, net of tax
|
$
|
(1.1
|
)
|
$
|
—
|
|
|||
|
Amortization of defined benefit pension and other postretirement benefit plan items:
|
|||||||||
|
Prior service benefit (cost)
|
$
|
(0.2
|
)
|
$
|
(0.2
|
)
|
Other pension and postretirement benefits (costs), net
|
||
|
Curtailment and net actuarial gain (loss)
|
(1.7
|
)
|
1.8
|
|
Other pension and postretirement benefits (costs), net
|
||||
|
Total income (loss) reclassified, before tax
|
(1.9
|
)
|
1.6
|
|
|||||
|
Income tax benefit (expense)
|
0.2
|
|
(0.6
|
)
|
|||||
|
Net income (loss) reclassified, net of tax
|
$
|
(1.7
|
)
|
$
|
1.0
|
|
|||
|
Total income (loss) reclassified, net of tax
|
$
|
(2.8
|
)
|
$
|
1.0
|
|
|||
12. Derivative Instruments and Hedging Activities
Our risk management and derivative accounting policies are presented in Notes 1 and 17 of the Notes included in our Annual Report and did not significantly change during the
first quarter
of 2018. As noted in Note 17 of the Notes included in our Annual Report, due to the nature of our counterparty agreements, and the fact that we are not subject to master netting arrangements, we are not able to net positions with the same counterparty and, therefore, present our derivative positions on a gross basis in our unaudited condensed consolidated balance sheets. Except as noted below, our significant derivative positions have not changed considerably since year-end.
Cross Currency Swap
Effective April 18, 2018, we entered into a cross currency swap agreement having a total notional of approximately EUR
404 million
(
$500.0 million
upon execution) in order to hedge a portion of the foreign currency translational impacts of our European investment. As a result of the swap, we economically converted our
$500 million
2.25%
senior notes due 2020 and associated interest to EUR denominated, which will result in a EUR interest rate to be received at
0.85%
. We have designated this cross currency swap as a net investment hedge and accordingly, record changes in fair value due to fluctuations in the spot rate to AOCI.
27
Derivative Fair Value Measurements
We utilize market approaches to estimate the fair value of our derivative instruments by discounting anticipated future cash flows derived from the derivative's contractual terms and observable market interest, foreign exchange and commodity rates. The fair values of our derivatives also include credit risk adjustments to account for our counterparties' credit risk, as well as our own non-performance risk, as appropriate. The table below summarizes our derivative assets and liabilities that were measured at fair value as of
March 31, 2018
, and
December 31, 2017
.
|
|
Fair value measurements as of March 31, 2018
|
||||||||||||||
|
|
As of
March 31, 2018
|
Quoted prices in
active markets
(Level 1)
|
Significant other
observable inputs
(Level 2)
|
Significant
unobservable
inputs (Level 3)
|
|||||||||||
|
|
(In millions)
|
||||||||||||||
|
Foreign currency forwards
|
$
|
(2.5
|
)
|
$
|
—
|
|
$
|
(2.5
|
)
|
$
|
—
|
|
|||
|
Commodity swaps and options
|
37.1
|
|
—
|
|
37.1
|
|
—
|
|
|||||||
|
Total
|
$
|
34.6
|
|
$
|
—
|
|
$
|
34.6
|
|
$
|
—
|
|
|||
|
|
Fair value measurements as of December 31, 2017
|
||||||||||||||
|
|
As of December 31, 2017
|
Quoted prices in
active markets
(Level 1)
|
Significant other
observable inputs
(Level 2)
|
Significant
unobservable
inputs (Level 3)
|
|||||||||||
|
|
(In millions)
|
||||||||||||||
|
Foreign currency forwards
|
$
|
(10.9
|
)
|
$
|
—
|
|
$
|
(10.9
|
)
|
$
|
—
|
|
|||
|
Commodity swaps and options
|
122.8
|
|
—
|
|
122.8
|
|
—
|
|
|||||||
|
Total
|
$
|
111.9
|
|
$
|
—
|
|
$
|
111.9
|
|
$
|
—
|
|
|||
As of
March 31, 2018
, we had no significant transfers between Level 1 and Level 2. New derivative contracts transacted during the
three
months ended
March 31, 2018
, were all included in Level 2.
Results of Period Derivative Activity
The tables below include the year-to-date results of our derivative activity in the unaudited condensed consolidated balance sheets as of
March 31, 2018
, and
December 31, 2017
, and the unaudited condensed consolidated statements of operations for the
three
months ended
March 31, 2018
, and
March 31, 2017
.
Fair Value of Derivative Instruments in the Unaudited Condensed Consolidated Balance Sheets
(in millions):
|
|
As of March 31, 2018
|
||||||||||||||
|
|
|
Asset derivatives
|
Liability derivatives
|
||||||||||||
|
|
Notional amount
|
Balance sheet location
|
Fair value
|
Balance sheet location
|
Fair value
|
||||||||||
|
Derivatives designated as hedging instruments:
|
|
|
|
||||||||||||
|
Foreign currency forwards
|
$
|
377.3
|
|
Other current assets
|
$
|
1.2
|
|
Accounts payable and other current liabilities
|
$
|
(2.9
|
)
|
||||
|
|
Other non-current assets
|
1.4
|
|
Other liabilities
|
(2.2
|
)
|
|||||||||
|
Total derivatives designated as hedging instruments
|
$
|
2.6
|
|
|
$
|
(5.1
|
)
|
||||||||
|
Derivatives not designated as hedging instruments:
|
|
|
|
||||||||||||
|
Commodity swaps
(1)
|
$
|
858.3
|
|
Other current assets
|
$
|
35.6
|
|
Accounts payable and other current liabilities
|
$
|
(15.2
|
)
|
||||
|
|
Other non-current assets
|
26.6
|
|
Other liabilities
|
(9.9
|
)
|
|||||||||
|
Commodity options
(1)
|
$
|
30.6
|
|
Other current assets
|
0.2
|
|
Accounts payable and other current liabilities
|
(0.2
|
)
|
||||||
|
Other non-current assets
|
—
|
|
Other liabilities
|
—
|
|
||||||||||
|
Total derivatives not designated as hedging instruments
|
$
|
62.4
|
|
|
$
|
(25.3
|
)
|
||||||||
28
|
|
As of December 31, 2017
|
||||||||||||||
|
|
|
Asset derivatives
|
Liability derivatives
|
||||||||||||
|
|
Notional amount
|
Balance sheet location
|
Fair value
|
Balance sheet location
|
Fair value
|
||||||||||
|
Derivatives designated as hedging instruments:
|
|||||||||||||||
|
Foreign currency forwards
|
$
|
326.4
|
|
Other current assets
|
$
|
0.4
|
|
Accounts payable and other current liabilities
|
$
|
(6.1
|
)
|
||||
|
Other non-current assets
|
0.2
|
|
Other liabilities
|
(5.4
|
)
|
||||||||||
|
Total derivatives designated as hedging instruments
|
$
|
0.6
|
|
$
|
(11.5
|
)
|
|||||||||
|
Derivatives not designated as hedging instruments:
|
|||||||||||||||
|
Commodity swaps
(1)
|
$
|
765.0
|
|
Other current assets
|
$
|
70.8
|
|
Accounts payable and other current liabilities
|
$
|
(7.3
|
)
|
||||
|
Other non-current assets
|
63.5
|
|
Other liabilities
|
(4.2
|
)
|
||||||||||
|
Commodity options
(1)
|
$
|
30.6
|
|
Other current and non-current assets
|
0.2
|
|
Accounts payable and other current liabilities and other liabilities
|
(0.2
|
)
|
||||||
|
Total derivatives not designated as hedging instruments
|
$
|
134.5
|
|
$
|
(11.7
|
)
|
|||||||||
|
(1)
|
Notional includes offsetting buy and sell positions, shown in terms of absolute value. Buy and sell positions are shown gross in the asset and/or liability position, as appropriate.
|
The Pretax Effect of Derivative Instruments on the Unaudited Condensed Consolidated Statements of Operations
(in millions):
|
Three Months Ended March 31, 2018
|
||||||||||||||||
|
Derivatives in cash flow hedge relationships
|
|
Amount of gain
(loss) recognized in OCI on derivative (effective portion) |
|
Location of gain (loss)
reclassified from AOCI into income (effective portion) |
|
Amount of gain
(loss) recognized from AOCI on derivative (effective portion) |
|
Location of gain (loss)
recognized in income on derivative (ineffective portion and amount excluded from effectiveness testing) |
|
Amount of gain (loss)
recognized in income on derivative (ineffective portion and amount excluded from effectiveness testing) |
||||||
|
Forward starting interest rate swaps
|
|
$
|
—
|
|
|
Interest expense, net
|
|
$
|
(0.8
|
)
|
|
Interest expense, net
|
|
$
|
—
|
|
|
Foreign currency forwards
|
|
7.5
|
|
|
Cost of goods sold
|
|
(0.6
|
)
|
|
Cost of goods sold
|
|
—
|
|
|||
|
Total
|
|
$
|
7.5
|
|
|
|
|
$
|
(1.4
|
)
|
|
|
|
$
|
—
|
|
|
Three Months Ended March 31, 2018
|
||||||||||||||||
|
Non-derivative financial instruments in net investment hedge relationships
|
|
Amount of gain
(loss) recognized in OCI on derivative (effective portion) |
|
Location of gain (loss)
reclassified from AOCI into income (effective portion) |
|
Amount of gain
(loss) recognized from AOCI on derivative (effective portion) |
|
Location of gain (loss)
recognized in income on derivative (ineffective portion and amount excluded from effectiveness testing) |
|
Amount of gain (loss)
recognized in income on derivative (ineffective portion and amount excluded from effectiveness testing) |
||||||
|
EUR 800 million notes due 2024
|
|
$
|
(25.5
|
)
|
|
Other income (expense), net
|
|
$
|
—
|
|
|
Other income (expense), net
|
|
$
|
—
|
|
|
EUR 500 million notes due 2019
|
(16.0
|
)
|
Other income (expense), net
|
—
|
|
Other income (expense), net
|
—
|
|
||||||||
|
Total
|
|
$
|
(41.5
|
)
|
|
|
|
$
|
—
|
|
|
|
|
$
|
—
|
|
|
Three Months Ended March 31, 2017
|
||||||||||||||||
|
Derivatives in cash flow hedge relationships
|
Amount of gain
(loss) recognized
in OCI on
derivative
(effective
portion)
|
Location of gain (loss)
reclassified from AOCI into
income (effective portion)
|
Amount of gain
(loss) recognized
from AOCI on
derivative
(effective portion)
|
Location of gain (loss)
recognized in income on
derivative (ineffective portion
and amount excluded from
effectiveness testing)
|
Amount of gain (loss)
recognized in income
on derivative
(ineffective portion and
amount excluded from
effectiveness testing)
|
|||||||||||
|
Forward starting interest rate swaps
|
$
|
—
|
|
Interest expense, net
|
$
|
(1.0
|
)
|
Interest expense, net
|
$
|
—
|
|
|||||
|
Foreign currency forwards
|
(5.5
|
)
|
Other income (expense), net
|
(0.9
|
)
|
Other income (expense), net
|
—
|
|
||||||||
|
|
|
Cost of goods sold
|
1.9
|
|
Cost of goods sold
|
—
|
|
|||||||||
|
Total
|
$
|
(5.5
|
)
|
|
$
|
—
|
|
|
$
|
—
|
|
|||||
29
|
Three Months Ended March 31, 2017
|
||||||||||||||||
|
Non-derivative financial instruments in net investment hedge relationships
|
|
Amount of gain
(loss) recognized in OCI on derivative (effective portion) |
|
Location of gain (loss)
reclassified from AOCI into income (effective portion) |
|
Amount of gain
(loss) recognized from AOCI on derivative (effective portion) |
|
Location of gain (loss)
recognized in income on derivative (ineffective portion and amount excluded from effectiveness testing) |
|
Amount of gain (loss)
recognized in income on derivative (ineffective portion and amount excluded from effectiveness testing) |
||||||
|
EUR 800 million notes due 2024
|
|
$
|
(10.8
|
)
|
|
Other income (expense), net
|
|
$
|
—
|
|
|
Other income (expense), net
|
|
$
|
—
|
|
|
EUR 500 million notes due 2019
|
4.1
|
|
Other income (expense), net
|
—
|
|
Other income (expense), net
|
—
|
|
||||||||
|
Total
|
|
$
|
(6.7
|
)
|
|
|
|
$
|
—
|
|
|
|
|
$
|
—
|
|
|
Three Months Ended March 31, 2017
|
||||||
|
Derivatives in fair value hedge relationships
|
Amount of gain (loss) recognized in income on derivative
|
Location of gain (loss) recognized in income
|
||||
|
Interest rate swaps
|
$
|
(0.3
|
)
|
Interest expense, net
|
||
|
Total
|
$
|
(0.3
|
)
|
|||
We expect net losses of approximately
$5 million
(pretax) recorded in AOCI as of
March 31, 2018
, related to cash flow hedges, will be reclassified into earnings within the next
12
months. For derivatives designated in cash flow hedge relationships, the maximum length of time over which forecasted transactions are hedged as of
March 31, 2018
, is approximately
three
years.
Other Derivatives
(in millions):
|
Three Months Ended March 31, 2018
|
||||||
|
Derivatives not in hedging relationships
|
Location of gain (loss) recognized in
income on derivative
|
Amount of gain (loss) recognized in
income on derivative
|
||||
|
Commodity swaps
|
Cost of goods sold
|
$
|
(74.4
|
)
|
||
|
Total
|
|
$
|
(74.4
|
)
|
||
|
Three Months Ended March 31, 2017
|
||||||
|
Derivatives not in hedging relationships
|
Location of gain (loss) recognized in
income on derivative
|
Amount of gain (loss) recognized in
income on derivative
|
||||
|
Commodity swaps
|
Cost of goods sold
|
$
|
65.7
|
|
||
|
Foreign currency forwards
|
Other income (expense), net
|
(8.3
|
)
|
|||
|
Total
|
$
|
57.4
|
|
|||
Lower commodity prices, primarily aluminum, relative to year-end market prices drove the total loss recognized in income related to commodity swaps for the three months ended
March 31, 2018
, compared to the total gain driven by higher commodity prices in the
first quarter
of 2017.
30
13. Pension and Other Postretirement Benefits
|
Three Months Ended
|
|||||||||||||||||||||||
|
|
March 31, 2018
|
March 31, 2017
|
|||||||||||||||||||||
|
|
Pension
|
OPEB
|
Consolidated
|
Pension
|
OPEB
|
Consolidated
|
|||||||||||||||||
|
|
(In millions)
|
||||||||||||||||||||||
|
Service cost:
|
|
||||||||||||||||||||||
|
Service cost
|
$
|
1.4
|
|
$
|
2.3
|
|
$
|
3.7
|
|
$
|
1.8
|
|
$
|
2.6
|
|
$
|
4.4
|
|
|||||
|
Other pension and postretirement costs (benefits), net:
|
|||||||||||||||||||||||
|
Interest cost
|
$
|
41.2
|
|
$
|
6.6
|
|
$
|
47.8
|
|
$
|
51.5
|
|
$
|
7.6
|
|
$
|
59.1
|
|
|||||
|
Expected return on plan assets
|
(59.7
|
)
|
—
|
|
(59.7
|
)
|
(70.7
|
)
|
0.1
|
|
(70.6
|
)
|
|||||||||||
|
Amortization of prior service cost (benefit)
|
0.2
|
|
—
|
|
0.2
|
|
0.2
|
|
—
|
|
0.2
|
|
|||||||||||
|
Amortization of net actuarial loss (gain)
|
1.9
|
|
(0.3
|
)
|
1.6
|
|
1.1
|
|
—
|
|
1.1
|
|
|||||||||||
|
Curtailment and settlement loss (gain)
|
0.1
|
|
—
|
|
0.1
|
|
—
|
|
(2.9
|
)
|
(2.9
|
)
|
|||||||||||
|
Less: expected participant contributions
|
—
|
|
—
|
|
—
|
|
(0.2
|
)
|
—
|
|
(0.2
|
)
|
|||||||||||
|
Total other pension and postretirement cost (benefits), net
|
$
|
(16.3
|
)
|
$
|
6.3
|
|
$
|
(10.0
|
)
|
$
|
(18.1
|
)
|
$
|
4.8
|
|
$
|
(13.3
|
)
|
|||||
|
Net periodic pension and OPEB cost (benefit)
|
$
|
(14.9
|
)
|
$
|
8.6
|
|
$
|
(6.3
|
)
|
$
|
(16.3
|
)
|
$
|
7.4
|
|
$
|
(8.9
|
)
|
|||||
During the
three months ended
March 31, 2018
, employer contributions to the defined benefit pension plans were approximately
$3 million
. Total
2018
employer contributions to the defined benefit plans are expected to be approximately
$10 million
, based on foreign exchange rates as of
March 31, 2018
. BRI and BDL contributions to their defined benefit pension plans are not included above, as they are not consolidated in our financial statements.
Additionally, we have adopted the FASB's new guidance related to defined benefit pension and other postretirement plans.
Specifically, the new guidance requires us to report only the service cost component in the same line item as other compensation costs arising from services rendered by the pertinent employees during the period; while the other components of net benefit cost are now presented in the unaudited condensed consolidated statements of operations separately from the service cost component and outside of operating income.
We have also determined that only service cost will be reported within each operating segment and all other components will be reported within the Corporate segment.
See further discussion in
Note 2, "New Accounting Pronouncements"
.
14. Commitments and Contingencies
Litigation, Environmental and Other Contingencies
Related to litigation, environmental issues and other contingencies we had
$17.3 million
and
$17.8 million
accrued, in aggregate, as of
March 31, 2018
, and
December 31, 2017
, respectively. While we cannot predict the eventual aggregate cost for legal, environmental and other matters in which we are currently involved, we believe adequate reserves have been provided for losses that are probable and estimable. Additionally, we believe that any reasonably possible losses in excess of the amounts accrued are immaterial to our unaudited condensed consolidated interim financial statements. Our legal, environmental and other liabilities are discussed in further detail within Part II—Item 8 Financial Statements, Note 19, "Commitments and Contingencies" in our Annual Report and did not significantly change during the
first quarter
of
2018
.
We are involved in other disputes and legal actions arising in the ordinary course of our business. While it is not feasible to predict or determine the outcome of these proceedings, in our opinion, based on a review with legal counsel, other than as noted, none of these disputes or legal actions are expected to have a material impact on our business, consolidated financial position, results of operations or cash flows. However, litigation is subject to inherent uncertainties and an adverse result in these or other matters may arise from time to time that may harm our business.
As a result of receiving a favorable ruling related to our historical indirect tax calculations in Europe, we released a previously recorded indirect tax provision related to our Europe operations during the first quarter of 2017, resulting in a benefit of approximately
$50 million
, recorded within the excise taxes line item on the unaudited condensed consolidated statement of operations during the quarter ended March, 31, 2017. During the second quarter of 2017, we received formal confirmation from the regulatory authority that they would not appeal the local jurisdictional court ruling, and the regulatory authority has since withdrawn its assessments. As a result, we believe this dispute is fully resolved.
31
Guarantees
We guarantee indebtedness and other obligations to banks and other third parties for some of our equity method investments and consolidated subsidiaries. As of
March 31, 2018
, and
December 31, 2017
, the unaudited condensed consolidated balance sheets include liabilities related to these guarantees of
$56.8 million
and
$42.8 million
, respectively, primarily related to the guarantee of the indebtedness of our equity method investments. See
Note 4, "Investments"
for further detail.
Separately, related to our Kaiser indemnities, we have accrued
$17.3 million
, in aggregate, as of
March 31, 2018
, and
December 31, 2017
. The maximum potential claims amount remaining for the Kaiser-related purchased tax credits was
$105.9 million
, based on foreign exchange rates as of
March 31, 2018
. Our Kaiser liabilities are discussed in further detail within Note 19 of the Notes included in our Annual Report and did not significantly change during the
first quarter
of
2018
.
15. Supplemental Guarantor Information
For purposes of this
Note 15
, including the tables, "Parent Issuer" shall mean MCBC. "Subsidiary Guarantors" shall mean certain Canadian and U.S. subsidiaries reflecting the substantial operations of each of our Canada and U.S. segments.
SEC Registered Securities
On May 3, 2012, MCBC issued
$1.9 billion
of senior notes, in a registered public offering, consisting of
$300 million
2.0%
senior notes due 2017 (subsequently repaid in the second quarter of 2017),
$500 million
3.5%
senior notes due 2022, and
$1.1 billion
5.0%
senior notes due 2042. Additionally, on July 7, 2016, MCBC issued
$500 million
1.45%
senior notes due 2019,
$1.0 billion
2.10%
senior notes due 2021,
$2.0 billion
3.0%
senior notes due 2026,
$1.8 billion
4.2%
senior notes due 2046 and EUR
$800.0 million
1.25%
senior notes due 2024, in a registered public offering. In December 2017, MCBC completed an exchange offer in which it issued publicly registered senior notes in exchange for its
$500 million
1.90%
senior notes due 2019,
$500 million
2.25%
senior notes due 2020 and our EUR
500 million
floating rate senior notes due 2019, which were issued in private placement transactions in March 2017. "Parent Issuer" in the below tables is specifically referring to MCBC in its capacity as the issuer of these 2012, 2016 and 2017 issuances. These senior notes are guaranteed on a senior unsecured basis by the Subsidiary Guarantors. Each of the Subsidiary Guarantors is 100% owned by the Parent Issuer. The guarantees are full and unconditional and joint and several.
None of our other outstanding debt is registered with the SEC, and such other outstanding debt is guaranteed on a senior unsecured basis by the Parent and/or Subsidiary Guarantors. These guarantees are full and unconditional and joint and several. See
Note 9, "Debt"
for details of all debt issued and outstanding as of
March 31, 2018
.
Presentation
Certain amounts have been revised to reflect the retrospective application of our change in accounting policy as discussed in
Note 1, "Basis of Presentation and Summary of Significant Accounting Policies"
.
Effective January 1, 2018, MillerCoors USA LLC, a new entity with no historic activity, was added as a subsidiary guarantor. In addition, effective December 26, 2017, our historical subsidiary guarantor, Jacob Leinenkugel Brewing Co., LLC, was merged with and into the existing subsidiary guarantor, MillerCoors LLC, and, on January 1, 2018, our historical subsidiary guarantors MillerCoors Holdings LLC and MC Holding Company LLC were also merged with and into MillerCoors LLC, a subsidiary guarantor.
In the first quarter of 2018, MillerCoors LLC, a subsidiary guarantor, declared a distribution of approximately
$1.7 billion
to Molson Coors Brewing Company, which was simultaneously non-cash settled via offset to an equal amount of payables that were owed by Molson Coors Brewing Company to MillerCoors LLC.
The following information sets forth the unaudited condensed consolidating statements of operations for the
three
months ended
March 31, 2018
, and
March 31, 2017
, unaudited condensed consolidating balance sheets as of
March 31, 2018
, and
December 31, 2017
, and unaudited condensed consolidating statements of cash flows for the
three months ended
March 31, 2018
, and
March 31, 2017
. Investments in subsidiaries are accounted for under the equity method; accordingly, entries necessary to consolidate the Parent Issuer and all of our guarantor and non-guarantor subsidiaries are reflected in the eliminations column. In the opinion of management, separate complete financial statements of MCBC and the Subsidiary Guarantors would not provide additional material information that would be useful in assessing their financial composition. Certain amounts have been revised to reflect the retrospective application of our change in accounting policy and the new accounting pronouncements recently adopted as discussed in
Note 1, "Basis of Presentation and Summary of Significant Accounting Policies"
and
Note 2, "New Accounting Pronouncements"
.
32
MOLSON COORS BREWING COMPANY AND SUBSIDIARIES
CONDENSED CONSOLIDATING STATEMENT OF OPERATIONS
(IN MILLIONS)
(UNAUDITED)
|
Three Months Ended
|
|||||||||||||||||||
|
March 31, 2018
|
|||||||||||||||||||
|
Parent
Issuer |
Subsidiary
Guarantors
|
Subsidiary
Non
Guarantors
|
Eliminations
|
Consolidated
|
|||||||||||||||
|
Sales
|
$
|
4.9
|
|
$
|
2,234.6
|
|
$
|
742.6
|
|
$
|
(114.1
|
)
|
$
|
2,868.0
|
|
||||
|
Excise taxes
|
—
|
|
(301.4
|
)
|
(235.1
|
)
|
—
|
|
(536.5
|
)
|
|||||||||
|
Net sales
|
4.9
|
|
1,933.2
|
|
507.5
|
|
(114.1
|
)
|
2,331.5
|
|
|||||||||
|
Cost of goods sold
|
(0.5
|
)
|
(1,241.7
|
)
|
(399.7
|
)
|
106.2
|
|
(1,535.7
|
)
|
|||||||||
|
Gross profit
|
4.4
|
|
691.5
|
|
107.8
|
|
(7.9
|
)
|
795.8
|
|
|||||||||
|
Marketing, general and administrative expenses
|
(70.2
|
)
|
(463.3
|
)
|
(155.5
|
)
|
7.9
|
|
(681.1
|
)
|
|||||||||
|
Special items, net
|
—
|
|
321.4
|
|
(6.6
|
)
|
—
|
|
314.8
|
|
|||||||||
|
Equity income (loss) in subsidiaries
|
635.5
|
|
(158.8
|
)
|
4.8
|
|
(481.5
|
)
|
—
|
|
|||||||||
|
Operating income (loss)
|
569.7
|
|
390.8
|
|
(49.5
|
)
|
(481.5
|
)
|
429.5
|
|
|||||||||
|
Interest income (expense), net
|
(85.2
|
)
|
82.0
|
|
(80.0
|
)
|
—
|
|
(83.2
|
)
|
|||||||||
|
Other pension and postretirement benefits (costs), net
|
—
|
|
1.4
|
|
8.6
|
|
—
|
|
10.0
|
|
|||||||||
|
Other income (expense), net
|
(0.2
|
)
|
40.2
|
|
(38.9
|
)
|
—
|
|
1.1
|
|
|||||||||
|
Income (loss) before income taxes
|
484.3
|
|
514.4
|
|
(159.8
|
)
|
(481.5
|
)
|
357.4
|
|
|||||||||
|
Income tax benefit (expense)
|
(206.2
|
)
|
121.9
|
|
9.4
|
|
—
|
|
(74.9
|
)
|
|||||||||
|
Net income (loss)
|
278.1
|
|
636.3
|
|
(150.4
|
)
|
(481.5
|
)
|
282.5
|
|
|||||||||
|
Net (income) loss attributable to noncontrolling interests
|
—
|
|
—
|
|
(4.4
|
)
|
—
|
|
(4.4
|
)
|
|||||||||
|
Net income (loss) attributable to MCBC
|
$
|
278.1
|
|
$
|
636.3
|
|
$
|
(154.8
|
)
|
$
|
(481.5
|
)
|
$
|
278.1
|
|
||||
|
Comprehensive income (loss) attributable to MCBC
|
$
|
327.2
|
|
$
|
743.2
|
|
$
|
(47.3
|
)
|
$
|
(695.9
|
)
|
$
|
327.2
|
|
||||
33
MOLSON COORS BREWING COMPANY AND SUBSIDIARIES
CONDENSED CONSOLIDATING STATEMENT OF OPERATIONS
(IN MILLIONS)
(UNAUDITED)
|
Three Months Ended
|
|||||||||||||||||||
|
March 31, 2017
|
|||||||||||||||||||
|
Parent
Issuer |
Subsidiary
Guarantors
|
Subsidiary
Non
Guarantors
|
Eliminations
|
Consolidated
|
|||||||||||||||
|
Sales
|
$
|
7.0
|
|
$
|
2,376.6
|
|
$
|
650.0
|
|
$
|
(119.8
|
)
|
$
|
2,913.8
|
|
||||
|
Excise taxes
|
—
|
|
(325.7
|
)
|
(139.4
|
)
|
—
|
|
(465.1
|
)
|
|||||||||
|
Net sales
|
7.0
|
|
2,050.9
|
|
510.6
|
|
(119.8
|
)
|
2,448.7
|
|
|||||||||
|
Cost of goods sold
|
—
|
|
(1,140.4
|
)
|
(341.4
|
)
|
109.5
|
|
(1,372.3
|
)
|
|||||||||
|
Gross profit
|
7.0
|
|
910.5
|
|
169.2
|
|
(10.3
|
)
|
1,076.4
|
|
|||||||||
|
Marketing, general and administrative expenses
|
(67.7
|
)
|
(498.5
|
)
|
(149.4
|
)
|
10.3
|
|
(705.3
|
)
|
|||||||||
|
Special items, net
|
(0.5
|
)
|
(3.6
|
)
|
(2.6
|
)
|
—
|
|
(6.7
|
)
|
|||||||||
|
Equity income (loss) in subsidiaries
|
346.0
|
|
(71.7
|
)
|
19.8
|
|
(294.1
|
)
|
—
|
|
|||||||||
|
Operating income (loss)
|
284.8
|
|
336.7
|
|
37.0
|
|
(294.1
|
)
|
364.4
|
|
|||||||||
|
Interest income (expense), net
|
(81.1
|
)
|
58.9
|
|
(74.4
|
)
|
—
|
|
(96.6
|
)
|
|||||||||
|
Other pension and postretirement benefits (costs), net
|
—
|
|
2.0
|
|
11.3
|
|
—
|
|
13.3
|
|
|||||||||
|
Other income (expense), net
|
(8.2
|
)
|
16.7
|
|
(8.7
|
)
|
—
|
|
(0.2
|
)
|
|||||||||
|
Income (loss) before income taxes
|
195.5
|
|
414.3
|
|
(34.8
|
)
|
(294.1
|
)
|
280.9
|
|
|||||||||
|
Income tax benefit (expense)
|
13.0
|
|
(68.1
|
)
|
(10.8
|
)
|
—
|
|
(65.9
|
)
|
|||||||||
|
Net income (loss)
|
208.5
|
|
346.2
|
|
(45.6
|
)
|
(294.1
|
)
|
215.0
|
|
|||||||||
|
Net (income) loss attributable to noncontrolling interests
|
—
|
|
—
|
|
(6.5
|
)
|
—
|
|
(6.5
|
)
|
|||||||||
|
Net income (loss) attributable to MCBC
|
$
|
208.5
|
|
$
|
346.2
|
|
$
|
(52.1
|
)
|
$
|
(294.1
|
)
|
$
|
208.5
|
|
||||
|
Comprehensive income (loss) attributable to MCBC
|
$
|
281.2
|
|
$
|
417.5
|
|
$
|
(9.2
|
)
|
$
|
(408.3
|
)
|
$
|
281.2
|
|
||||
34
MOLSON COORS BREWING COMPANY AND SUBSIDIARIES
CONDENSED CONSOLIDATING BALANCE SHEET
(IN MILLIONS)
(UNAUDITED)
|
As of
|
|||||||||||||||||||
|
March 31, 2018
|
|||||||||||||||||||
|
Parent
Issuer |
Subsidiary
Guarantors
|
Subsidiary
Non
Guarantors
|
Eliminations
|
Consolidated
|
|||||||||||||||
|
Assets
|
|
|
|
|
|
||||||||||||||
|
Current assets:
|
|
|
|
|
|
||||||||||||||
|
Cash and cash equivalents
|
$
|
10.0
|
|
$
|
26.5
|
|
$
|
161.4
|
|
$
|
—
|
|
$
|
197.9
|
|
||||
|
Accounts receivable, net
|
—
|
|
422.4
|
|
356.9
|
|
—
|
|
779.3
|
|
|||||||||
|
Other receivables, net
|
90.7
|
|
50.5
|
|
26.8
|
|
—
|
|
168.0
|
|
|||||||||
|
Inventories, net
|
—
|
|
500.9
|
|
164.7
|
|
—
|
|
665.6
|
|
|||||||||
|
Other current assets, net
|
5.2
|
|
228.5
|
|
92.5
|
|
—
|
|
326.2
|
|
|||||||||
|
Intercompany accounts receivable
|
—
|
|
1,181.1
|
|
57.0
|
|
(1,238.1
|
)
|
—
|
|
|||||||||
|
Total current assets
|
105.9
|
|
2,409.9
|
|
859.3
|
|
(1,238.1
|
)
|
2,137.0
|
|
|||||||||
|
Properties, net
|
16.6
|
|
3,459.5
|
|
1,204.7
|
|
—
|
|
4,680.8
|
|
|||||||||
|
Goodwill
|
—
|
|
6,473.5
|
|
1,969.2
|
|
—
|
|
8,442.7
|
|
|||||||||
|
Other intangibles, net
|
7.5
|
|
12,070.2
|
|
2,159.9
|
|
—
|
|
14,237.6
|
|
|||||||||
|
Net investment in and advances to subsidiaries
|
25,174.8
|
|
4,235.0
|
|
4,598.2
|
|
(34,008.0
|
)
|
—
|
|
|||||||||
|
Other assets
|
96.0
|
|
238.6
|
|
414.7
|
|
(62.9
|
)
|
686.4
|
|
|||||||||
|
Total assets
|
$
|
25,400.8
|
|
$
|
28,886.7
|
|
$
|
11,206.0
|
|
$
|
(35,309.0
|
)
|
$
|
30,184.5
|
|
||||
|
Liabilities and equity
|
|
|
|
|
|
||||||||||||||
|
Current liabilities:
|
|
|
|
|
|
||||||||||||||
|
Accounts payable and other current liabilities
|
$
|
139.7
|
|
$
|
1,566.5
|
|
$
|
830.9
|
|
$
|
—
|
|
$
|
2,537.1
|
|
||||
|
Current portion of long-term debt and short-term borrowings
|
1,241.5
|
|
309.8
|
|
40.0
|
|
—
|
|
1,591.3
|
|
|||||||||
|
Intercompany accounts payable
|
878.2
|
|
117.2
|
|
242.7
|
|
(1,238.1
|
)
|
—
|
|
|||||||||
|
Total current liabilities
|
2,259.4
|
|
1,993.5
|
|
1,113.6
|
|
(1,238.1
|
)
|
4,128.4
|
|
|||||||||
|
Long-term debt
|
8,329.6
|
|
1,159.1
|
|
38.3
|
|
—
|
|
9,527.0
|
|
|||||||||
|
Pension and postretirement benefits
|
3.0
|
|
821.0
|
|
14.0
|
|
—
|
|
838.0
|
|
|||||||||
|
Deferred tax liabilities
|
—
|
|
885.1
|
|
866.5
|
|
(62.9
|
)
|
1,688.7
|
|
|||||||||
|
Other liabilities
|
16.5
|
|
200.4
|
|
122.0
|
|
—
|
|
338.9
|
|
|||||||||
|
Intercompany notes payable
|
1,347.6
|
|
88.2
|
|
6,365.4
|
|
(7,801.2
|
)
|
—
|
|
|||||||||
|
Total liabilities
|
11,956.1
|
|
5,147.3
|
|
8,519.8
|
|
(9,102.2
|
)
|
16,521.0
|
|
|||||||||
|
MCBC stockholders' equity
|
13,445.9
|
|
30,103.6
|
|
3,904.4
|
|
(34,008.0
|
)
|
13,445.9
|
|
|||||||||
|
Intercompany notes receivable
|
(1.2
|
)
|
(6,364.2
|
)
|
(1,435.8
|
)
|
7,801.2
|
|
—
|
|
|||||||||
|
Total stockholders' equity
|
13,444.7
|
|
23,739.4
|
|
2,468.6
|
|
(26,206.8
|
)
|
13,445.9
|
|
|||||||||
|
Noncontrolling interests
|
—
|
|
—
|
|
217.6
|
|
—
|
|
217.6
|
|
|||||||||
|
Total equity
|
13,444.7
|
|
23,739.4
|
|
2,686.2
|
|
(26,206.8
|
)
|
13,663.5
|
|
|||||||||
|
Total liabilities and equity
|
$
|
25,400.8
|
|
$
|
28,886.7
|
|
$
|
11,206.0
|
|
$
|
(35,309.0
|
)
|
$
|
30,184.5
|
|
||||
35
MOLSON COORS BREWING COMPANY AND SUBSIDIARIES
CONDENSED CONSOLIDATING BALANCE SHEET
(IN MILLIONS)
(UNAUDITED)
|
As of
|
|||||||||||||||||||
|
December 31, 2017
|
|||||||||||||||||||
|
Parent
Issuer |
Subsidiary
Guarantors
|
Subsidiary
Non
Guarantors
|
Eliminations
|
Consolidated
|
|||||||||||||||
|
Assets
|
|
|
|
|
|
||||||||||||||
|
Current assets:
|
|
|
|
|
|
||||||||||||||
|
Cash and cash equivalents
|
$
|
6.6
|
|
$
|
140.9
|
|
$
|
271.1
|
|
$
|
—
|
|
$
|
418.6
|
|
||||
|
Accounts receivable, net
|
—
|
|
424.8
|
|
309.0
|
|
—
|
|
733.8
|
|
|||||||||
|
Other receivables, net
|
90.4
|
|
45.2
|
|
32.6
|
|
—
|
|
168.2
|
|
|||||||||
|
Inventories, net
|
—
|
|
457.7
|
|
133.8
|
|
—
|
|
591.5
|
|
|||||||||
|
Other current assets, net
|
9.6
|
|
184.8
|
|
83.2
|
|
—
|
|
277.6
|
|
|||||||||
|
Intercompany accounts receivable
|
—
|
|
2,303.2
|
|
65.6
|
|
(2,368.8
|
)
|
—
|
|
|||||||||
|
Total current assets
|
106.6
|
|
3,556.6
|
|
895.3
|
|
(2,368.8
|
)
|
2,189.7
|
|
|||||||||
|
Properties, net
|
16.8
|
|
3,509.8
|
|
1,147.1
|
|
—
|
|
4,673.7
|
|
|||||||||
|
Goodwill
|
—
|
|
6,487.8
|
|
1,917.7
|
|
—
|
|
8,405.5
|
|
|||||||||
|
Other intangibles, net
|
8.0
|
|
12,183.8
|
|
2,104.7
|
|
—
|
|
14,296.5
|
|
|||||||||
|
Net investment in and advances to subsidiaries
|
26,443.9
|
|
4,297.4
|
|
4,683.1
|
|
(35,424.4
|
)
|
—
|
|
|||||||||
|
Other assets
|
101.7
|
|
253.7
|
|
387.2
|
|
(61.1
|
)
|
681.5
|
|
|||||||||
|
Total assets
|
$
|
26,677.0
|
|
$
|
30,289.1
|
|
$
|
11,135.1
|
|
$
|
(37,854.3
|
)
|
$
|
30,246.9
|
|
||||
|
Liabilities and equity
|
|
|
|
|
|
||||||||||||||
|
Current liabilities:
|
|
|
|
|
|
||||||||||||||
|
Accounts payable and other current liabilities
|
$
|
180.4
|
|
$
|
1,648.9
|
|
$
|
855.2
|
|
$
|
—
|
|
$
|
2,684.5
|
|
||||
|
Current portion of long-term debt and short-term borrowings
|
379.0
|
|
317.8
|
|
18.0
|
|
—
|
|
714.8
|
|
|||||||||
|
Intercompany accounts payable
|
2,131.8
|
|
102.8
|
|
134.2
|
|
(2,368.8
|
)
|
—
|
|
|||||||||
|
Total current liabilities
|
2,691.2
|
|
2,069.5
|
|
1,007.4
|
|
(2,368.8
|
)
|
3,399.3
|
|
|||||||||
|
Long-term debt
|
9,399.7
|
|
1,189.5
|
|
9.5
|
|
—
|
|
10,598.7
|
|
|||||||||
|
Pension and postretirement benefits
|
2.9
|
|
832.1
|
|
13.5
|
|
—
|
|
848.5
|
|
|||||||||
|
Deferred tax liabilities
|
—
|
|
864.7
|
|
845.0
|
|
(61.1
|
)
|
1,648.6
|
|
|||||||||
|
Other liabilities
|
10.7
|
|
200.1
|
|
106.0
|
|
—
|
|
316.8
|
|
|||||||||
|
Intercompany notes payable
|
1,347.6
|
|
227.0
|
|
6,370.5
|
|
(7,945.1
|
)
|
—
|
|
|||||||||
|
Total liabilities
|
13,452.1
|
|
5,382.9
|
|
8,351.9
|
|
(10,375.0
|
)
|
16,811.9
|
|
|||||||||
|
MCBC stockholders' equity
|
13,226.1
|
|
31,275.5
|
|
4,148.9
|
|
(35,424.4
|
)
|
13,226.1
|
|
|||||||||
|
Intercompany notes receivable
|
(1.2
|
)
|
(6,369.3
|
)
|
(1,574.6
|
)
|
7,945.1
|
|
—
|
|
|||||||||
|
Total stockholders' equity
|
13,224.9
|
|
24,906.2
|
|
2,574.3
|
|
(27,479.3
|
)
|
13,226.1
|
|
|||||||||
|
Noncontrolling interests
|
—
|
|
—
|
|
208.9
|
|
—
|
|
208.9
|
|
|||||||||
|
Total equity
|
13,224.9
|
|
24,906.2
|
|
2,783.2
|
|
(27,479.3
|
)
|
13,435.0
|
|
|||||||||
|
Total liabilities and equity
|
$
|
26,677.0
|
|
$
|
30,289.1
|
|
$
|
11,135.1
|
|
$
|
(37,854.3
|
)
|
$
|
30,246.9
|
|
||||
36
MOLSON COORS BREWING COMPANY AND SUBSIDIARIES
CONDENSED CONSOLIDATING STATEMENT OF CASH FLOWS
(IN MILLIONS)
(UNAUDITED)
|
Three Months Ended
|
|||||||||||||||||||
|
March 31, 2018
|
|||||||||||||||||||
|
Parent
Issuer |
Subsidiary
Guarantors
|
Subsidiary
Non
Guarantors
|
Eliminations
|
Consolidated
|
|||||||||||||||
|
Net cash provided by (used in) operating activities
|
$
|
353.0
|
|
$
|
208.1
|
|
$
|
(111.6
|
)
|
$
|
(134.3
|
)
|
$
|
315.2
|
|
||||
|
CASH FLOWS FROM INVESTING ACTIVITIES:
|
|
|
|
|
|
||||||||||||||
|
Additions to properties
|
(1.2
|
)
|
(161.6
|
)
|
(45.5
|
)
|
—
|
|
(208.3
|
)
|
|||||||||
|
Proceeds from sales of properties and other assets
|
—
|
|
0.7
|
|
0.9
|
|
—
|
|
1.6
|
|
|||||||||
|
Other
|
—
|
|
(1.1
|
)
|
(44.3
|
)
|
—
|
|
(45.4
|
)
|
|||||||||
|
Net intercompany investing activity
|
12.7
|
|
(8.2
|
)
|
171.3
|
|
(175.8
|
)
|
—
|
|
|||||||||
|
Net cash provided by (used in) investing activities
|
11.5
|
|
(170.2
|
)
|
82.4
|
|
(175.8
|
)
|
(252.1
|
)
|
|||||||||
|
CASH FLOWS FROM FINANCING ACTIVITIES:
|
|
|
|
|
|
||||||||||||||
|
Exercise of stock options under equity compensation plans
|
6.1
|
|
—
|
|
—
|
|
—
|
|
6.1
|
|
|||||||||
|
Dividends paid
|
(81.2
|
)
|
—
|
|
(141.6
|
)
|
134.3
|
|
(88.5
|
)
|
|||||||||
|
Payments on debt and borrowings
|
—
|
|
(0.5
|
)
|
(0.3
|
)
|
—
|
|
(0.8
|
)
|
|||||||||
|
Net proceeds from (payments on) revolving credit facilities and commercial paper
|
(250.5
|
)
|
—
|
|
1.8
|
|
—
|
|
(248.7
|
)
|
|||||||||
|
Change in overdraft balances and other
|
(2.9
|
)
|
(6.1
|
)
|
51.0
|
|
—
|
|
42.0
|
|
|||||||||
|
Net intercompany financing activity
|
(32.6
|
)
|
(145.4
|
)
|
2.2
|
|
175.8
|
|
—
|
|
|||||||||
|
Net cash provided by (used in) financing activities
|
(361.1
|
)
|
(152.0
|
)
|
(86.9
|
)
|
310.1
|
|
(289.9
|
)
|
|||||||||
|
CASH AND CASH EQUIVALENTS:
|
|
|
|
|
|
||||||||||||||
|
Net increase (decrease) in cash and cash equivalents
|
3.4
|
|
(114.1
|
)
|
(116.1
|
)
|
—
|
|
(226.8
|
)
|
|||||||||
|
Effect of foreign exchange rate changes on cash and cash equivalents
|
—
|
|
(0.3
|
)
|
6.4
|
|
—
|
|
6.1
|
|
|||||||||
|
Balance at beginning of year
|
6.6
|
|
140.9
|
|
271.1
|
|
—
|
|
418.6
|
|
|||||||||
|
Balance at end of period
|
$
|
10.0
|
|
$
|
26.5
|
|
$
|
161.4
|
|
$
|
—
|
|
$
|
197.9
|
|
||||
37
MOLSON COORS BREWING COMPANY AND SUBSIDIARIES
CONDENSED CONSOLIDATING STATEMENT OF CASH FLOWS
(IN MILLIONS)
(UNAUDITED)
|
Three Months Ended
|
|||||||||||||||||||
|
March 31, 2017
|
|||||||||||||||||||
|
Parent
Issuer |
Subsidiary
Guarantors
|
Subsidiary
Non
Guarantors
|
Eliminations
|
Consolidated
|
|||||||||||||||
|
Net cash provided by (used in) operating activities
|
$
|
(172.4
|
)
|
$
|
141.5
|
|
$
|
(87.4
|
)
|
$
|
—
|
|
$
|
(118.3
|
)
|
||||
|
CASH FLOWS FROM INVESTING ACTIVITIES:
|
|
|
|
|
|
||||||||||||||
|
Additions to properties
|
(3.8
|
)
|
(142.1
|
)
|
(34.1
|
)
|
—
|
|
(180.0
|
)
|
|||||||||
|
Proceeds from sales of properties and other assets
|
—
|
|
0.2
|
|
41.8
|
|
—
|
|
42.0
|
|
|||||||||
|
Other
|
—
|
|
—
|
|
5.9
|
|
—
|
|
5.9
|
|
|||||||||
|
Net intercompany investing activity
|
—
|
|
(42.6
|
)
|
—
|
|
42.6
|
|
—
|
|
|||||||||
|
Net cash provided by (used in) investing activities
|
(3.8
|
)
|
(184.5
|
)
|
13.6
|
|
42.6
|
|
(132.1
|
)
|
|||||||||
|
CASH FLOWS FROM FINANCING ACTIVITIES:
|
|
|
|
|
|
|
|
|
|
|
|||||||||
|
Exercise of stock options under equity compensation plans
|
0.3
|
|
—
|
|
—
|
|
—
|
|
0.3
|
|
|||||||||
|
Dividends paid
|
(80.8
|
)
|
—
|
|
(7.5
|
)
|
—
|
|
(88.3
|
)
|
|||||||||
|
Debt issuance costs
|
(3.7
|
)
|
—
|
|
—
|
|
—
|
|
(3.7
|
)
|
|||||||||
|
Payments on debt and borrowings
|
(1,500.0
|
)
|
—
|
|
(1.1
|
)
|
—
|
|
(1,501.1
|
)
|
|||||||||
|
Proceeds on debt and borrowings
|
1,536.0
|
|
—
|
|
—
|
|
—
|
|
1,536.0
|
|
|||||||||
|
Net proceeds from (payments on) revolving credit facilities and commercial paper
|
129.9
|
|
—
|
|
1.1
|
|
—
|
|
131.0
|
|
|||||||||
|
Change in overdraft balances and other
|
(10.9
|
)
|
(7.7
|
)
|
24.7
|
|
—
|
|
6.1
|
|
|||||||||
|
Net intercompany financing activity
|
—
|
|
—
|
|
42.6
|
|
(42.6
|
)
|
—
|
|
|||||||||
|
Net cash provided by (used in) financing activities
|
70.8
|
|
(7.7
|
)
|
59.8
|
|
(42.6
|
)
|
80.3
|
|
|||||||||
|
CASH AND CASH EQUIVALENTS:
|
|
|
|
|
|
||||||||||||||
|
Net increase (decrease) in cash and cash equivalents
|
(105.4
|
)
|
(50.7
|
)
|
(14.0
|
)
|
—
|
|
(170.1
|
)
|
|||||||||
|
Effect of foreign exchange rate changes on cash and cash equivalents
|
—
|
|
0.6
|
|
3.6
|
|
—
|
|
4.2
|
|
|||||||||
|
Balance at beginning of year
|
147.3
|
|
141.5
|
|
272.1
|
|
—
|
|
560.9
|
|
|||||||||
|
Balance at end of period
|
$
|
41.9
|
|
$
|
91.4
|
|
$
|
261.7
|
|
$
|
—
|
|
$
|
395.0
|
|
||||
38
Management's Discussion and Analysis of Financial Condition and Results of Operations ("MD&A") in this Form 10-Q is provided as a supplement to, and should be read in conjunction with, our audited consolidated financial statements, the accompanying notes and the MD&A included in our Annual Report on Form 10-K for the fiscal year ended
December 31, 2017
("Annual Report"), as well as our unaudited condensed consolidated interim financial statements and the accompanying notes included in this Form 10-Q. Due to the seasonality of our operating results, quarterly financial results are not an appropriate basis from which to project annual results.
Unless otherwise noted in this report, any description of "we," "us" or "our" includes Molson Coors Brewing Company ("MCBC" or the "Company"), principally a holding company, and its operating and non-operating subsidiaries included within our reporting segments and Corporate. Our reporting segments include: MillerCoors LLC ("MillerCoors" or U.S. segment), operating in the United States; Molson Coors Canada ("MCC" or Canada segment), operating in Canada; Molson Coors Europe (Europe segment), operating in Bulgaria, Croatia, Czech Republic, Hungary, Montenegro, Republic of Ireland, Romania, Serbia, the United Kingdom and various other European countries; and Molson Coors International ("MCI" or International segment), operating in various other countries.
Unless otherwise indicated, information in this report is presented in USD and comparisons are to comparable prior periods. Our primary operating currencies, other than USD, include the CAD, the GBP, and our Central European operating currencies such as the EUR, CZK, HRK and RSD.
Operational Measures
We have certain operational measures, such as STWs and STRs, which we believe are important metrics. STW is a metric that we use in our U.S. business to reflect the sales from our operations to our direct customers, generally wholesalers. We believe the STW metric is important because it gives an indication of the amount of beer and adjacent products that we have produced and shipped to customers. STR is a metric that we use in our Canada and U.S. businesses to refer to sales closer to the end consumer than STWs, which generally means sales from our wholesalers or our company to retailers, who in turn sell to consumers. We believe the STR metric is important because, unlike STWs, it provides the closest indication of the performance of our brands in relation to market and competitor sales trends.
Executive Summary
We are one of the world's largest brewers and have a diverse portfolio of owned and partner brands, including global priority brands
Blue Moon, Coors Banquet, Coors Light, Miller Genuine Draft, Miller Lite,
and
Staropramen
, regional champion brands
Carling
,
Molson Canadian
and other leading country-specific brands
,
as well as craft and specialty beers such as
Creemore Springs
,
Cobra
,
Doom Bar, Henry's Hard
and
Leinenkugel's
. With centuries of brewing heritage, we have been crafting high-quality, innovative products with the purpose of delighting the world's beer drinkers and with the ambition to be the first choice for our consumers and customers. Our success depends on our ability to make our products available to meet a wide range of consumer segments and occasions.
39
Adoption of Revenue Recognition Guidance
On January 1, 2018, we adopted the FASB's new accounting pronouncement related to revenue recognition. This guidance was adopted using the modified retrospective approach, and therefore, prior period results have not been restated. The following table highlights the impact of this new guidance on summarized components of our unaudited condensed consolidated statement of operations for the three months ended
March 31, 2018
, when comparing our current period results of operations under the new guidance, versus our results of operations if historical guidance had continued to be applied.
|
Three Months Ended March 31, 2018
|
|||||||||||||||||||
|
U.S.
|
Canada
|
Europe
|
International
|
Consolidated
|
|||||||||||||||
|
(In millions)
|
|||||||||||||||||||
|
Impact to Unaudited Condensed Consolidated Statements of Operations - Favorable/(Unfavorable):
|
|||||||||||||||||||
|
Net sales
|
$
|
(4.7
|
)
|
$
|
(11.0
|
)
|
$
|
(0.6
|
)
|
$
|
0.2
|
|
$
|
(16.1
|
)
|
||||
|
Cost of goods sold
|
$
|
—
|
|
$
|
—
|
|
$
|
—
|
|
$
|
—
|
|
$
|
—
|
|
||||
|
Gross profit
|
$
|
(4.7
|
)
|
$
|
(11.0
|
)
|
$
|
(0.6
|
)
|
$
|
0.2
|
|
$
|
(16.1
|
)
|
||||
|
Marketing, general and administrative expenses
|
$
|
0.7
|
|
$
|
11.6
|
|
$
|
0.8
|
|
$
|
—
|
|
$
|
13.1
|
|
||||
|
Operating income (loss)
|
$
|
(4.0
|
)
|
$
|
0.6
|
|
$
|
0.2
|
|
$
|
0.2
|
|
$
|
(3.0
|
)
|
||||
|
Interest income (expense), net
|
$
|
—
|
|
$
|
—
|
|
$
|
(0.8
|
)
|
$
|
—
|
|
$
|
(0.8
|
)
|
||||
|
Income (loss) before income taxes
|
$
|
(4.0
|
)
|
$
|
0.6
|
|
$
|
(0.6
|
)
|
$
|
0.2
|
|
$
|
(3.8
|
)
|
||||
These impacts are primarily driven by the reclassification of certain cash payments to customers from marketing, general and administrative expenses to a reduction of revenue, as well as a change in the timing of recognition of certain promotional discounts and cash payments to customers. See Part I—Item 1. Financial Statements,
Note 1, "Basis of Presentation and Summary of Significant Accounting Policies"
and
Note 2, "New Accounting Pronouncements"
for further discussion on the adoption of this guidance.
Adoption of Pension and Other Postretirement Benefit Guidance
On January 1, 2018, we adopted the FASB's new accounting pronouncement related to the classification of pension and other postretirement benefit costs.
Specifically, the new guidance requires us to report only the service cost component in the same line item as other compensation costs arising from services rendered by the pertinent employees during the period; while the other components of net benefit cost are now presented in the unaudited condensed consolidated statements of operations separately from the service cost component and outside of operating income.
The amendments in this update also allow only the service cost component to be eligible for capitalization when applicable.
We have also determined that only service cost will be reported within each operating segment and all other components will be reported within the Corporate segment.
The guidance related to the income statement presentation of service costs and other pension and postretirement benefit costs is applied retrospectively, while the capitalization of service costs component is applied prospectively. This adjustment is classification only and had no impact to our consolidated net income. See
Note 2, "New Accounting Pronouncements"
for further details including updated historical financial information.
Summary of Consolidated Results of Operations
The following table highlights summarized components of our unaudited condensed consolidated statements of operations for the three months ended
March 31, 2018
, and
March 31, 2017
. See Part I-Item 1. Financial Statements for additional details of our U.S. GAAP results.
|
Three Months Ended
|
||||||||||
|
March 31, 2018
|
March 31, 2017
|
% change
|
||||||||
|
(In millions, except percentages and per share data)
|
||||||||||
|
Financial volume in hectoliters
|
20.813
|
|
21.878
|
|
(4.9
|
)%
|
||||
|
Net sales
|
$
|
2,331.5
|
|
$
|
2,448.7
|
|
(4.8
|
)%
|
||
|
Net income (loss) attributable to MCBC
|
$
|
278.1
|
|
$
|
208.5
|
|
33.4
|
%
|
||
|
Net income (loss) attributable to MCBC per diluted share
|
$
|
1.28
|
|
$
|
0.96
|
|
33.3
|
%
|
||
40
First
Quarter
2018
Financial Highlights
During the
first
quarter of
2018
, we recognized net income attributable to MCBC of
$278.1 million
, or
$1.28
per diluted share, representing an increase of
$69.6 million
versus the prior year. Net sales of approximately
$2.3 billion
in the
first
quarter of
2018
decreased from
$2.4 billion
in the prior year. The increase in net income attributable to MCBC was primarily driven by the
$328.0 million
gain related to settlement proceeds received during the first quarter of 2018 along with positive global pricing, cost savings and lower interest expense, partially offset by unrealized mark-to-market losses in the current quarter compared to unrealized mark-to-market gains in the prior year, lower volume, cycling the impact of the indirect tax provision of approximately $50 million that was released during the first quarter of 2017 and higher input cost inflation.
Regional financial highlights:
|
•
|
In the U.S. segment, income before income taxes of
$261.7 million
decreased compared to
$316.6 million
in the prior year primarily due to the impact of lower shipment volumes, negative sales mix, volume deleverage, cost of goods sold inflation and higher depreciation expense partially offset by higher net pricing, costs savings and lower marketing, general and administrative expenses.
|
|
•
|
In our Canada segment, income before income taxes decreased by
56.5%
to
$9.1 million
in the
first
quarter of
2018
, compared to the prior year, primarily due to brand volume declines, higher accelerated depreciation of brewing assets and the impact of cycling an $8.1 million purchase price adjustment gain in the first quarter of 2017 related to the historical sale of Molson Inc.'s ownership interest in the Montreal Canadiens.
|
|
•
|
In our Europe segment, loss before income taxes was
$29.9 million
in the
first
quarter of
2018
, compared to income of
$27.0 million
in the prior year, primarily due to cycling the impact of the indirect tax provision of approximately $50 million released during the first quarter of 2017, adopting recently revised industry guidelines for calculating excise-tax payments in one market, and increased investment in our first choice agenda this year, partially offset by cycling a 2017 provision for an estimate of uncollectible receivables.
|
|
•
|
In our International segment, income before income taxes increased to
$3.7 million
in the
first
quarter of
2018
, compared to income of
$1.5 million
in the prior year, primarily driven by lower marketing, general and administrative expenses, including $2.0 million of settlement proceeds received related to our Colombia business, and higher net pricing, partially offset by the loss of the
Modelo
contract in Japan.
|
See "Results of Operations" below for further analysis of our segment results.
Core brand highlights:
|
•
|
Global priority brand volume decreased 5.6% in 2018 versus 2017, due to declines across all segments.
|
|
•
|
Blue Moon Belgian White
global brand volume decreased 1.5% in 2018 versus 2017, driven by declines in the U.S., partially offset by growth in International, Canada and Europe.
|
|
•
|
Carling
brand volume in Europe decreased by 2.4% during the
first
quarter of
2018
, versus the
first
quarter of 2017 consistent with a declining market.
|
|
•
|
Coors
global brand volume -
Coors Light
global brand volume decreased 6.5% during the
first
quarter of
2018
versus the
first
quarter of 2017. The overall volume decrease in the
first
quarter of 2018 was due to lower brand volume in the U.S., Canada and International, slightly offset by growth in Europe. Volumes in the U.S. were lower than prior year consistent with the U.S. industry premium and premium light segment performance. The declines in Canada are the result of weak industry performance in the West and high inventory levels in Quebec at the start of the year, along with ongoing competitive pressures in Quebec and Ontario and a continued shift in consumer preference to value brands in the West. The declines in International were the result of reduced promotional activity, balancing volume with pricing, in Mexico.
Coors Banquet
global brand volume decreased 6.5% during the
first
quarter of
2018
versus the
first
quarter of 2017 driven by the U.S. and Canada.
|
|
•
|
Miller
global brand volume
- Miller Lite
global brand volumes decreased 3.6% during the first quarter of 2018 versus prior year, driven by the U.S., Canada and International. However,
Miller Lite
gained share of the U.S. premium light segment for the fourteenth consecutive quarter.
Miller Genuine Draft
global brand volume
decreased 10.5% during the first quarter of 2018 versus prior year, driven by the U.S., Europe and International, partially offset by growth in Canada.
|
|
•
|
Molson Canadian
brand volume in Canada decreased by 6.3% during the
first
quarter of
2018
versus the prior year, primarily driven by weak industry conditions and competitive pressures in the West and high inventory levels in Quebec at the start of the year.
|
41
|
•
|
Staropramen
global brand volume, including royalty volume, decreased 6.4% during the
first
quarter of
2018
, versus the
first
quarter of 2017, due to lower volumes in the Czech Republic, the brand's primary market.
|
Worldwide Brand Volume
Worldwide brand volume (or "brand volume" when discussed by segment) reflects owned brands sold to unrelated external customers within our geographic markets, net of returns and allowances, royalty volume, an adjustment from STWs to STRs and our proportionate share of equity investment brand volume calculated consistently with MCBC owned volume. Contract brewing and wholesaler volume is removed from worldwide brand volume as this is non-owned volume for which we do not directly control performance. We believe this definition of worldwide brand volume more closely aligns with how we measure the performance of our owned brands within the markets in which they are sold. Financial volume represents owned brands sold to unrelated external customers within our geographical markets, net of returns and allowances as well as contract brewing, wholesale non-owned brand volume and company-owned distribution volume. Royalty volume consists of our brands produced and sold by third parties under various license and contract-brewing agreements and because this is owned volume, it is included in worldwide brand volume. The adjustment from STWs to STRs provides the closest indication of the performance of our owned brands in relation to market and competitor sales trends, as it reflects sales volume one step closer to the end consumer and generally means sales from our wholesalers or our company to retailers.
Effective in the first quarter of 2018, we have revised our net sales per hectoliter performance discussions to include a brand volume basis as defined above with the net sales revenue component reflecting owned and actively managed brands as well as royalty revenue consistent with how management views the business. We continue to also discuss net sales per hectoliter performance on a reported basis.
|
Three Months Ended
|
||||||||
|
March 31, 2018
|
March 31, 2017
|
% change
|
||||||
|
(In millions, except percentages)
|
||||||||
|
Volume in hectoliters:
|
|
|
|
|||||
|
Financial volume
|
20.813
|
|
21.878
|
|
(4.9
|
)%
|
||
|
Less: Contract brewing, wholesaler and non-beer volume
|
(1.902
|
)
|
(1.988
|
)
|
(4.3
|
)%
|
||
|
Add: Royalty volume
|
0.716
|
|
0.798
|
|
(10.3
|
)%
|
||
|
Add: STW to STR adjustment
|
(0.526
|
)
|
(0.982
|
)
|
(46.4
|
)%
|
||
|
Total worldwide brand volume
|
19.101
|
|
19.706
|
|
(3.1
|
)%
|
||
Our worldwide brand volume decreased
3.1%
during the
three
months ended
March 31, 2018
, respectively, compared to prior year due to declines in the U.S., Canada and International.
Net Sales Drivers
For the
three
months ended
March 31, 2018
, versus
March 31, 2017
, by segment (in percentages):
|
Volume
|
Price, Product and Geography Mix
(1)
|
Currency
|
Other
(2)
|
Total
|
||||||||||
|
Consolidated
|
(4.9
|
)%
|
(0.4
|
)%
|
2.4
|
%
|
(1.9
|
)%
|
(4.8
|
)%
|
||||
|
U.S.
|
(6.7
|
)%
|
0.9
|
%
|
—
|
%
|
—
|
%
|
(5.8
|
)%
|
||||
|
Canada
|
(4.8
|
)%
|
(2.0
|
)%
|
4.2
|
%
|
0.1
|
%
|
(2.5
|
)%
|
||||
|
Europe
|
1.0
|
%
|
(1.9
|
)%
|
11.9
|
%
|
(12.9
|
)%
|
(1.9
|
)%
|
||||
|
International
|
(1.5
|
)%
|
(5.9
|
)%
|
0.4
|
%
|
—
|
%
|
(7.0
|
)%
|
||||
|
(1)
|
Includes the impacts of the adoption of the new accounting pronouncement related to revenue recognition as discussed above. See Part I—Item 1. Financial Statements,
|
|
(2)
|
Europe "Other" column includes the release of an indirect tax provision further described below.
|
42
Income taxes
|
Three Months Ended
|
|||||
|
March 31, 2018
|
March 31, 2017
|
||||
|
Effective tax rate
|
21
|
%
|
23
|
%
|
|
The decrease in the effective tax rate during the first quarter of
2018
versus
2017
, was primarily driven by the reduction of the statutory U.S. federal corporate income tax rate from
35%
to
21%
as a result of the
2017
U.S. Tax Cuts and Jobs Act (the "
2017
Tax Act"). This decrease was partially offset by the impact of discrete items. Specifically, we recognized net discrete tax expense of
$5.5 million
in the first quarter of
2018
, versus an
$8.4 million
net discrete tax benefit recognized in the first quarter of
2017
. This change was driven primarily by the recognition of excess benefits from share-based compensation in the first quarter of
2017
, versus other discrete tax expenses recognized in the first quarter of
2018
.
Our tax rate is volatile and may move up or down with changes in, among other things, the amount and source of income or loss, our ability to utilize foreign tax credits, excess tax benefits or deficiencies from share-based compensation, changes in tax laws, and the movement of liabilities established pursuant to accounting guidance for uncertain tax positions as statutes of limitations expire, positions are effectively settled, or when additional information becomes available. There are proposed or pending tax law changes in various jurisdictions and other changes to regulatory environments in countries in which we do business that, if enacted, may have an impact on our effective tax rate. Additionally, we continue to evaluate the impacts of the
2017
Tax Act. As we further understand its implications, as well as the related, and yet to be issued, regulator rules, regulations and interpretations, our effective tax rate could be impacted.
Refer to Part I - Item 1. Financial Statements,
Note 7, "Income Tax"
for additional details regarding our effective tax rate as well as our ongoing evaluation of the
2017
Tax Act and its related impacts.
Results of Operations
United States Segment
|
Three Months Ended
|
||||||||||
|
March 31, 2018
|
March 31, 2017
|
% change
|
||||||||
|
(In millions, except percentages)
|
||||||||||
|
Financial volume in hectoliters
(1)
|
14.718
|
|
15.772
|
|
(6.7
|
)%
|
||||
|
Sales
(1)
|
$
|
1,861.7
|
|
$
|
1,991.4
|
|
(6.5
|
)%
|
||
|
Excise taxes
|
(213.9
|
)
|
(241.5
|
)
|
(11.4
|
)%
|
||||
|
Net sales
(1)
|
1,647.8
|
|
1,749.9
|
|
(5.8
|
)%
|
||||
|
Cost of goods sold
(1)
|
(990.1
|
)
|
(1,025.1
|
)
|
(3.4
|
)%
|
||||
|
Gross profit
|
657.7
|
|
724.8
|
|
(9.3
|
)%
|
||||
|
Marketing, general and administrative expenses
|
(393.1
|
)
|
(405.7
|
)
|
(3.1
|
)%
|
||||
|
Special items, net
(2)
|
(1.5
|
)
|
(2.5
|
)
|
(40.0
|
)%
|
||||
|
Operating income (loss)
|
263.1
|
|
316.6
|
|
(16.9
|
)%
|
||||
|
Interest income (expense), net
|
(1.2
|
)
|
—
|
|
N/M
|
|
||||
|
Other income (expense), net
|
(0.2
|
)
|
—
|
|
N/M
|
|
||||
|
Income (loss) before income taxes
|
$
|
261.7
|
|
$
|
316.6
|
|
(17.3
|
)%
|
||
N/M = Not meaningful
|
(1)
|
Includes gross inter-segment sales, purchases, and volumes, which are eliminated in the consolidated totals.
|
|
(2)
|
See Part I—Item 1. Financial Statements,
Note 6, "Special Items"
for detail of special items.
|
Significant events
In order to increase overall operating efficiency, during the first quarter of 2018, the U.S. segment announced plans to close the Colfax, California cidery with the planned closure effective December 2018. Cider production will move to the 10th Street Brewery in Milwaukee, Wisconsin. Total special charges associated with the cidery closure are expected to be
43
approximately $6 million, consisting primarily of accelerated depreciation in excess of normal depreciation and will be recorded through completion of the closure.
Volume and net sales
Brand volume for the
three
months ended
March 31, 2018
, declined
3.8%
compared to prior year, driven by overall industry softness. STWs, excluding contract brewing volume, decreased
6.7%
in the
three
months ended
March 31, 2018
, reflective of lower-than-planned distributor inventory levels which was compounded by the launch of our new ordering system at the Golden, Colorado brewery that took longer to ramp up than anticipated.
Net sales per hectoliter on a brand volume basis for the
three
months ended
March 31, 2018
, increased
1.1%
compared to prior year due to favorable net pricing, partially offset by the impacts resulting from the adoption of the new accounting pronouncement related to revenue recognition and negative sales mix. Net sales per hectoliter on a reported basis increased 0.9% compared to prior year.
Cost of goods sold
Cost of goods sold per hectoliter for the
three
months ended
March 31, 2018
, increased
3.5%
compared to prior year driven by volume deleverage as well as aluminum inflation and higher freight and fuel costs, partially offset by cost savings. Additionally, for the
three
months ended
March 31, 2018
, and March 31, 2017, we recorded
$1.1 million
and
$0.5 million
, respectively, of integration costs related to the Acquisition within cost of goods sold.
Marketing, general and administrative expenses
Marketing, general and administrative expenses for the
three
months ended
March 31, 2018
, decreased
3.1%
compared to prior year due to spending optimization and efficiencies. Marketing, general and administrative expenses also include integration costs related to the Acquisition of
$4.0 million
for the
three
months ended March 31, 2017.
Canada Segment
|
Three Months Ended
|
||||||||||
|
March 31, 2018
|
March 31, 2017
|
% change
|
||||||||
|
(In millions, except percentages)
|
||||||||||
|
Financial volume in hectoliters
(1)
|
1.707
|
|
1.793
|
|
(4.8
|
)%
|
||||
|
Sales
(1)
|
$
|
374.9
|
|
$
|
377.4
|
|
(0.7
|
)%
|
||
|
Excise taxes
|
(91.1
|
)
|
(86.3
|
)
|
5.6
|
%
|
||||
|
Net sales
(1)
|
283.8
|
|
291.1
|
|
(2.5
|
)%
|
||||
|
Cost of goods sold
(1)
|
(187.4
|
)
|
(181.1
|
)
|
3.5
|
%
|
||||
|
Gross profit
|
96.4
|
|
110.0
|
|
(12.4
|
)%
|
||||
|
Marketing, general and administrative expenses
|
(81.0
|
)
|
(96.1
|
)
|
(15.7
|
)%
|
||||
|
Special items, net
(2)
|
(5.6
|
)
|
(1.2
|
)
|
N/M
|
|
||||
|
Operating income (loss)
|
9.8
|
|
12.7
|
|
(22.8
|
)%
|
||||
|
Other income (expense), net
|
(0.7
|
)
|
8.2
|
|
(108.5
|
)%
|
||||
|
Income (loss) before income taxes
|
$
|
9.1
|
|
$
|
20.9
|
|
(56.5
|
)%
|
||
N/M = Not meaningful
|
(1)
|
Includes gross inter-segment sales, purchases and volumes, which are eliminated in the consolidated totals.
|
|
(2)
|
See Part I-Item 1. Financial Statements,
Note 6, "Special Items"
for detail of special items.
|
Foreign currency impact on results
During the
three
months ended
March 31, 2018
, the CAD appreciated versus the USD on an average basis, resulting in a decrease of
$0.3 million
to our USD earnings before income taxes. Included in this amount are both translational and transactional impacts of changes in foreign exchange rates. The impact of transactional foreign currency gains and losses is recorded within other income (expense) in our unaudited condensed consolidated statements of operations.
44
Volume and net sales
Our Canada brand volume decreased
3.3
% during the
three
months ended
March 31, 2018
, versus prior year, as a result of weak industry performance particularly in provinces in the West and high inventory levels in Quebec at the start of the year.
Our net sales per hectoliter on a brand volume basis decreased 2.9% in local currency during the
three
months ended
March 31, 2018
, compared to prior year, driven by the impacts resulting from the adoption of the new accounting pronouncement related to revenue recognition, which requires certain cash payments to customers to now be recognized as a reduction of revenue versus marketing, general and administrative expense. Net sales per hectoliter on a reported basis decreased 2.0% in local currency compared to prior year.
Cost of goods sold
Cost of goods sold per hectoliter in local currency increased
3.9%
during the
three
months ended
March 31, 2018
, versus prior year, due to higher distribution costs, impacts of mix shift and volume deleverage, partially offset by a reduction in brewery costs.
Marketing, general and administrative expenses
Our marketing, general and administrative expenses decreased
19.1%
in local currency for the
three
months ended
March 31, 2018
, compared to prior year, primarily driven by impacts resulting from the adoption of the new accounting pronouncement related to revenue recognition as further discussed above, lower brand investments and amortization expense.
Other income (expense), net
During the first quarter of 2017, we received payment and recorded a gain of CAD
10.6 million
, or
$8.1 million
, resulting from a purchase price adjustment related to the historical sale of Molson Inc.’s ownership interest in the Montreal Canadiens, which is considered an affiliate of MCBC.
Europe Segment
|
Three Months Ended
|
||||||||||
|
March 31, 2018
|
March 31, 2017
|
% change
|
||||||||
|
(In millions, except percentages)
|
||||||||||
|
Financial volume in hectoliters
(1)(2)
|
4.404
|
|
4.359
|
|
1.0
|
%
|
||||
|
Sales
(2)
|
$
|
598.5
|
|
$
|
514.4
|
|
16.3
|
%
|
||
|
Excise taxes
|
(224.2
|
)
|
(132.8
|
)
|
68.8
|
%
|
||||
|
Net sales
(2)
|
374.3
|
|
381.6
|
|
(1.9
|
)%
|
||||
|
Cost of goods sold
|
(267.7
|
)
|
(226.1
|
)
|
18.4
|
%
|
||||
|
Gross profit
|
106.6
|
|
155.5
|
|
(31.4
|
)%
|
||||
|
Marketing, general and administrative expenses
|
(130.4
|
)
|
(126.8
|
)
|
2.8
|
%
|
||||
|
Special items, net
(3)
|
(5.1
|
)
|
(2.6
|
)
|
96.2
|
%
|
||||
|
Operating income (loss)
|
(28.9
|
)
|
26.1
|
|
N/M
|
|
||||
|
Interest income (expense), net
|
(0.7
|
)
|
1.0
|
|
(170.0
|
)%
|
||||
|
Other income (expense), net
|
(0.3
|
)
|
(0.1
|
)
|
200.0
|
%
|
||||
|
Income (loss) before income taxes
|
$
|
(29.9
|
)
|
$
|
27.0
|
|
N/M
|
|
||
N/M = Not meaningful
|
(1)
|
Excludes royalty volume of
0.306 million
hectoliters and
0.325 million
hectoliters for the
three
months ended
March 31, 2018
, and
March 31, 2017
, respectively.
|
|
(2)
|
Includes gross inter-segment sales and volumes, which are eliminated in the consolidated totals.
|
|
(3)
|
See Part I-Item 1. Financial Statements,
Note 6, "Special Items"
for detail of special items.
|
Significant events
In January of 2018, the Europe segment completed the acquisition of Aspall Cyder Limited, an established premium cider business in the U.K.
45
During the three months ended March 31, 2017, we recorded a provision for an estimate of uncollectible receivables of approximately $11 million related to Agrokor, a large customer in Croatia. The proceedings related to this matter have been formally extended to, and are currently expected to be resolved by, July 2018. During the first quarter of 2017, we released an indirect tax loss contingency which was initially recorded in the fourth quarter of 2016, for a benefit of approximately
$50 million
.
Foreign currency impact on results
Our Europe segment operates in numerous countries within Europe and each country's operations utilize distinct currencies. Foreign currency movements unfavorably impacted our Europe USD loss before income taxes by
$4.6 million
for the
three
months ended
March 31, 2018
. Included in this amount are both translational and transactional impacts of changes in foreign exchange rates. The impact of transactional foreign currency gains and losses is recorded within other income (expense) in our unaudited condensed consolidated statements of operations.
Volume and net sales
Our Europe brand volume increased slightly for the
three
months ended
March 31, 2018
, compared to prior year, primarily driven by growth from our above premium brands.
Net sales per hectoliter on a brand volume basis decreased in local currency by
18.3%
for the
three
months ended
March 31, 2018
, compared to prior year, due to cycling the release of the approximate $50 million indirect tax provision, adopting recently revised industry guidelines for calculating excise tax payments in one market and increased investment in our first choice for customer agenda, partially offset by positive sales mix. Net sales per hectoliter on a reported basis decreased 14.7% in local currency compared to prior year.
Cost of goods sold
Cost of goods sold per hectoliter increased
2.9%
in local currency in the
three
months ended
March 31, 2018
, versus prior year, primarily driven by mix shift to higher-cost brands and geographies, input inflation and logistics costs.
Marketing, general and administrative expenses
Marketing, general and administrative expenses decreased
10.4
% in local currency in the
three
months ended
March 31, 2018
, compared to prior year, due to cycling the provision for an estimate of uncollectible receivables recorded in the first quarter of 2017 and adoption of the new accounting pronouncement related to revenue recognition, partially offset by the addition of Aspall brand investments and related overhead costs this year.
International Segment
|
Three Months Ended
|
||||||||||
|
March 31, 2018
|
March 31, 2017
|
% change
|
||||||||
|
(In millions, except percentages)
|
||||||||||
|
Financial volume in hectoliters
(1)
|
0.520
|
|
0.528
|
|
(1.5
|
)%
|
||||
|
Sales
|
$
|
64.8
|
|
$
|
66.3
|
|
(2.3
|
)%
|
||
|
Excise taxes
|
(7.3
|
)
|
(4.5
|
)
|
62.2
|
%
|
||||
|
Net sales
|
57.5
|
|
61.8
|
|
(7.0
|
)%
|
||||
|
Cost of goods sold
(2)
|
(37.8
|
)
|
(39.0
|
)
|
(3.1
|
)%
|
||||
|
Gross profit
|
19.7
|
|
22.8
|
|
(13.6
|
)%
|
||||
|
Marketing, general and administrative expenses
|
(15.1
|
)
|
(21.0
|
)
|
(28.1
|
)%
|
||||
|
Special items, net
(3)
|
(1.0
|
)
|
(0.3
|
)
|
N/M
|
|
||||
|
Operating income (loss)
|
3.6
|
|
1.5
|
|
140.0
|
%
|
||||
|
Other income (expense), net
|
0.1
|
|
—
|
|
N/M
|
|
||||
|
Income (loss) before income taxes
|
$
|
3.7
|
|
$
|
1.5
|
|
|
146.7
|
%
|
|
N/M = Not meaningful
|
(1)
|
Excludes royalty volume of
0.410 million
hectoliters and
0.473 million
hectoliters for the
three
months ended
March 31, 2018
, and
March 31, 2017
, respectively.
|
|
(2)
|
Includes gross inter-segment purchases, which are eliminated in the consolidated totals.
|
46
|
(3)
|
See Part I-Item 1. Financial Statements,
Note 6, "Special Items"
for detail of special items.
|
Foreign currency impact on results
Our International segment operates in numerous countries around the world and each country's operations utilize distinct currencies. Foreign currency movements did not impact our International USD income before income taxes for the three months ended
March 31, 2018
. Included in this amount are both translational and transactional impacts of changes in foreign exchange rates. The impact of transactional foreign currency gains and losses is recorded within other income (expense) in our unaudited condensed consolidated statements of operations.
Volume and net sales
Our International brand volume decreased by
7.1
% in the
three
months ended
March 31, 2018
, compared to prior year, primarily driven by the loss of the
Modelo
contract in Japan in the second quarter of 2017, as well as lower volumes in Mexico due to higher net pricing, partially offset by organic volume growth in many of our focus markets.
Net sales per hectoliter on a brand volume basis remained flat in the
three
months ended
March 31, 2018
, compared to prior year, driven by unfavorable sales mix, offset by positive net pricing. Net sales per hectoliter on a reported basis decreased 5.5% compared to prior year for the
three
months ended
March 31, 2018
, driven by unfavorable sales mix, partially offset by positive net pricing.
Cost of goods sold
Cost of goods sold per hectoliter decreased
1.6%
in the
three
months ended
March 31, 2018
, compared to prior year, primarily driven by sales mix changes.
Marketing, general and administrative expenses
Marketing, general and administrative expenses decreased
28.1%
in the
three
months ended
March 31, 2018
, compared to prior year, primarily due to lower marketing investments and $2.0 million of settlement proceeds related to our Colombia business.
Corporate
|
Three Months Ended
|
||||||||||
|
March 31, 2018
|
March 31, 2017
|
% change
|
||||||||
|
(In millions, except percentages)
|
||||||||||
|
Financial volume in hectoliters
|
—
|
|
—
|
|
—
|
%
|
||||
|
Sales
|
$
|
0.2
|
|
$
|
0.3
|
|
(33.3
|
)%
|
||
|
Excise taxes
|
—
|
|
—
|
|
—
|
%
|
||||
|
Net sales
|
0.2
|
|
0.3
|
|
(33.3
|
)%
|
||||
|
Cost of goods sold
|
(84.8
|
)
|
63.0
|
|
N/M
|
|
||||
|
Gross profit
|
(84.6
|
)
|
63.3
|
|
N/M
|
|
||||
|
Marketing, general and administrative expenses
|
(61.5
|
)
|
(55.7
|
)
|
10.4
|
%
|
||||
|
Special items, net
(1)
|
328.0
|
|
(0.1
|
)
|
N/M
|
|
||||
|
Operating income (loss)
|
181.9
|
|
7.5
|
|
N/M
|
|
||||
|
Interest expense, net
|
(81.3
|
)
|
(97.6
|
)
|
(16.7
|
)%
|
||||
|
Other pension and postretirement benefits (costs), net
|
10.0
|
|
13.3
|
|
(24.8
|
)%
|
||||
|
Other income (expense), net
|
2.2
|
|
(8.3
|
)
|
(126.5
|
)%
|
||||
|
Income (loss) before income taxes
|
$
|
112.8
|
|
$
|
(85.1
|
)
|
N/M
|
|
||
N/M = Not meaningful
|
(1)
|
See Part I-Item 1. Financial Statements,
Note 6, "Special Items"
for detail of special items.
|
Cost of goods sold
The unrealized changes in fair value on our commodity swaps, which are economic hedges, are recorded as cost of goods sold within our Corporate business activities. As the exposure we are managing is realized, we reclassify the gain or loss to the segment in which the underlying exposure resides, allowing our segments to realize the economic effects of the derivative
47
without the resulting unrealized mark-to-market volatility. Lower commodity market prices relative to our hedged positions on our commodity swaps drove the total unrealized mark-to-market loss of
$84.7 million
recognized in cost of goods sold for the
three
months ended
March 31, 2018
, as compared to the unrealized mark-to-market gain of
$63.1 million
recognized in cost of goods sold for the
three
months ended
March 31, 2017
.
Marketing, general and administrative expenses
Marketing, general and administrative expenses increased by
10.4%
during the
three
months ended
March 31, 2018
, compared to prior year, primarily due to incremental investment behind global business capabilities including information technology investments, partially offset by higher integration costs related to the Acquisition recognized in the prior year. Specifically, we recorded
$8.8 million
and
$13.4 million
within marketing, general and administrative expense related to the Acquisition for the three months ended
March 31, 2018
, and
March 31, 2017
, respectively.
Interest expense, net
Net interest expense decreased for the
three
months ended
March 31, 2018
, compared to the prior year, primarily driven by debt repayments. See Part I—Item 1. Financial Statements,
Note 12, "Derivative Instruments and Hedging Activities"
and
Note 9, "Debt"
for further details.
Other income (expense), net
The decrease in other income (expense), net for the
three
months ended
March 31, 2018
, compared to prior year, is primarily driven by losses of $8.3 million on foreign currency forwards entered into and settled in the first quarter of 2017 in connection with the issuance of the 2017 EUR Notes as defined in Note 12 of the Notes included in our Annual Report.
Liquidity and Capital Resources
Our primary sources of liquidity include cash provided by operating activities and access to external capital. We believe that cash flows from operations and cash provided by short-term and long-term borrowings, when necessary, will be more than adequate to meet our ongoing operating requirements, scheduled principal and interest payments on debt, anticipated dividend payments and capital expenditures for the twelve months subsequent to the date of the issuance of this quarterly report, and our long-term liquidity requirements.
A significant portion of our trade receivables are concentrated in Europe. While these receivables are not concentrated in any specific customer and our allowance on these receivables factors in collectibility, we may encounter difficulties in our ability to collect due to the impact to our customers of any further economic downturn within Europe. We continue to have exposure to Agrokor, a company in Croatia, who entered into financial difficulty in 2017. The proceedings related to this matter have been formally extended to, and are currently expected to be resolved by, July 2018.
A significant portion of our cash flows from operating activities are generated outside the U.S. in currencies other than USD. As of
March 31, 2018
, approximately 80% of our cash and cash equivalents were located outside the U.S., largely denominated in foreign currencies. We accrue for tax consequences on the earnings of our foreign subsidiaries upon repatriation. When the earnings are considered indefinitely reinvested outside of the U.S., we do not accrue taxes. However, we will continue to assess the impact of the 2017 Tax Act on the tax consequences of future repatriations. We utilize a variety of tax planning and financing strategies in an effort to ensure that our worldwide cash is available in the locations in which it is needed. We periodically review and evaluate these strategies, including external committed and non-committed credit agreements accessible by MCBC and each of our operating subsidiaries. These financing arrangements, along with the cash generated from the operations of our U.S. segment, are sufficient to fund our current cash needs in the U.S.
Cash Flows and Use of Cash
Our business generates positive operating cash flow each year, and our debt maturities are of a longer-term nature. However, our liquidity could be impacted significantly by the risk factors we described in Part I—Item 1A. "Risk Factors" in our Annual Report.
Cash Flows from Operating Activities
Net cash provided by operating activities was approximately
$315.2 million
for the
three
months ended
March 31, 2018
, compared to net cash used in operating activities of
$118.3 million
for the
three
months ended
March 31, 2017
. This increase in net cash provided by operating activities of
$433.5 million
is primarily related to higher net income largely due to the proceeds received of
$328.0 million
related to the Adjustment Amount as defined and further discussed in Part I—Item 1. Financial Statements,
Note 6, "Special Items"
, working capital improvements and lower pension contributions and interest.
48
Cash Flows from Investing Activities
Net cash used in investing activities of
$252.1 million
for the
three
months ended
March 31, 2018
, increased by
$120.0 million
compared to the
three
months ended
March 31, 2017
, driven primarily by lower proceeds related to asset disposals and higher capital expenditures.
Cash Flows from Financing Activities
Net cash used in financing activities was
$289.9 million
for the
three
months ended
March 31, 2018
, compared to net cash provided by financing activities of approximately
$80.3 million
for the
three
months ended
March 31, 2017
. This decrease was driven primarily by the repayment of borrowings under our commercial paper program during the first quarter of 2018 compared to an increase in borrowings under our commercial paper program during the first quarter of 2017.
Capital Resources
Cash and Cash Equivalents
As of
March 31, 2018
, we had total cash and cash equivalents of
$197.9 million
, compared to
$418.6 million
as of
December 31, 2017
, and
$395.0 million
as of
March 31, 2017
. The decrease in cash and cash equivalents as of
March 31, 2018
, from
December 31, 2017
, was primarily driven by the repayment of borrowings under our commercial paper program and higher capital expenditures, partially offset by the proceeds received of
$328.0 million
related to the Adjustment Amount as defined and further discussed in Part I—Item 1. Financial Statements,
Note 6, "Special Items"
. The decrease in cash and cash equivalents as of
March 31, 2018
, from
March 31, 2017
, was primarily driven by
the repayment of borrowings as well as higher capital expenditures, partially offset by proceeds from operating activities including the Adjustment Amount as previously discussed.
49
Borrowings
During the three months ended
March 31, 2018
, there was no significant borrowing or repayment activity. The following table summarizes the maturities of our long-term debt, excluding short-term borrowings. Notional amounts are presented in USD based on the applicable exchange rate as of
March 31, 2018
.
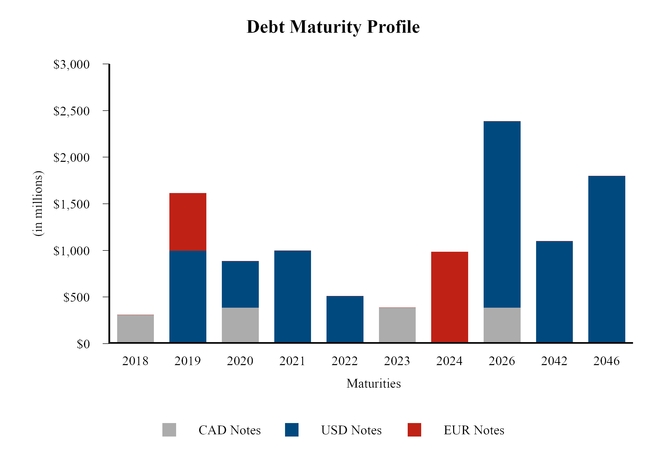
Based on the credit profile of our lenders that are party to our credit facilities, we are confident in our ability to draw on our revolving credit facility if the need arises. As of
March 31, 2018
, we had approximately
$1.4 billion
available to draw under our
$1.5 billion
revolving multi-currency credit facility, as the borrowing capacity is reduced by borrowings under our commercial paper program, and we have no other borrowings drawn on this revolving credit facility. In addition, we also currently utilize and will further utilize our cross-border, cross currency cash pool for liquidity needs. We also have JPY overdraft facilities, CAD and GBP lines of credit with several banks should we need additional short-term liquidity.
Under the terms of each of our debt facilities, we must comply with certain restrictions. These include restrictions on priority indebtedness (certain threshold percentages of secured consolidated net tangible assets), leverage thresholds, liens, and restrictions on certain types of sale lease-back transactions and transfers of assets. As of
March 31, 2018
, we were in compliance with all of these restrictions and have met all debt payment obligations. All of our outstanding senior notes as of
March 31, 2018
, rank pari-passu.
Additionally, under the
$1.5 billion
revolving credit facility, the maximum leverage ratio is
5.25x
debt to EBITDA, with a decline to
4.00x
debt to EBITDA as of the last day of the fiscal quarter ending December 31, 2020.
See Part I—Item 1. Financial Statements,
Note 9, "Debt"
for a complete discussion and presentation of all borrowings and available sources of borrowing, including lines of credit.
Credit Rating
Our current long-term credit ratings are BBB-/Stable Outlook, Baa3/Stable Outlook and BBB(Low)/Stable Outlook with Standard and Poor's, Moody's Investor Services and DBRS, respectively. Our short-term credit ratings are A-3, Prime-3 and R-2(low), respectively. A securities rating is not a recommendation to buy, sell or hold securities, and it may be revised or withdrawn at any time by the applicable rating agency.
50
Foreign Exchange
Foreign exchange risk is inherent in our operations primarily due to the significant operating results that are denominated in currencies other than USD. Our approach is to reduce the volatility of cash flows and reported earnings which result from currency fluctuations rather than business related factors. Therefore, we closely monitor our operations in each country and seek to adopt appropriate strategies that are responsive to foreign currency fluctuations. Our financial risk management policy is intended to offset a portion of the potentially unfavorable impact of exchange rate changes on net income and earnings per share. See Part II—Item 8. Financial Statements and Supplementary Data, Note 17, "Derivative Instruments and Hedging Activities" of our Annual Report for additional information on our financial risk management strategies.
Our consolidated financial statements are presented in USD, which is our reporting currency. Assets and liabilities recorded in foreign currencies that are the functional currencies for the respective operations are translated at the prevailing exchange rate at the balance sheet date. Translation adjustments resulting from this process are reported as a separate component of other comprehensive income. Revenue and expenses are translated at the average exchange rates during the period. Gains and losses from foreign currency transactions are included in earnings for the period. The significant exchange rates to the USD used in the preparation of our consolidated financial results for the primary foreign currencies used in our foreign operations (functional currency) are as follows:
|
Three Months Ended
|
|||||
|
March 31, 2018
|
March 31, 2017
|
||||
|
Weighted-Average Exchange Rate (1 USD equals)
|
|||||
|
Canadian Dollar (CAD)
|
1.29
|
|
|
1.34
|
|
|
Euro (EUR)
|
0.81
|
|
|
0.94
|
|
|
British Pound (GBP)
|
0.72
|
|
|
0.81
|
|
|
Czech Koruna (CZK)
|
20.67
|
|
|
25.37
|
|
|
Croatian Kuna (HRK)
|
6.04
|
|
|
7.05
|
|
|
Serbian Dinar (RSD)
|
96.21
|
|
|
115.96
|
|
|
Romanian Leu (RON)
|
3.80
|
|
|
4.24
|
|
|
Bulgarian Lev (BGN)
|
1.59
|
|
|
1.84
|
|
|
Hungarian Forint (HUF)
|
252.93
|
|
|
290.06
|
|
|
As of
|
|||||
|
March 31, 2018
|
December 31, 2017
|
||||
|
Closing Exchange Rate (1 USD equals)
|
|||||
|
Canadian Dollar (CAD)
|
1.29
|
|
1.26
|
|
|
|
Euro (EUR)
|
0.81
|
|
0.83
|
|
|
|
British Pound (GBP)
|
0.71
|
|
0.74
|
|
|
|
Czech Koruna (CZK)
|
20.56
|
|
21.29
|
|
|
|
Croatian Kuna (HRK)
|
6.03
|
|
6.19
|
|
|
|
Serbian Dinar (RSD)
|
95.88
|
|
98.52
|
|
|
|
Romanian Leu (RON)
|
3.78
|
|
3.89
|
|
|
|
Bulgarian Lev (BGN)
|
1.59
|
|
1.63
|
|
|
|
Hungarian Forint (HUF)
|
253.55
|
|
258.91
|
|
|
The weighted-average exchange rates in the above table have been calculated based on the average of the foreign exchange rates during the relevant period and have been weighted according to the foreign denominated earnings before interest and taxes of the USD equivalent.
Capital Expenditures
We incurred $118.2 million, and have paid
$208.3 million
, for capital improvement projects worldwide in the
three
months ended
March 31, 2018
, excluding capital spending by equity method joint ventures, representing a decrease of $14.5 million from the $132.7 million of capital expenditures incurred in the
three
months ended
March 31, 2017
. This decrease is primarily due to the timing of projects as we currently expect to incur total capital expenditures of approximately
$670 million
51
for full year 2018, based on foreign exchange rates as of
March 31, 2018
. This expectation includes capital expenditures associated with the construction of our new British Columbia and Montreal breweries and excludes capital spending by equity method joint ventures.
We continue to focus on where and how we employ our planned capital expenditures, specifically strengthening our focus on required returns on invested capital as we determine how to best allocate cash within the business.
Contractual Obligations and Commercial Commitments
There were no material changes to our contractual obligations and commercial commitments since December 31, 2017, as reported in Part II - Item 7. Management's Discussion and Analysis, Contractual Obligations and Commercial Commitments in our Annual Report.
Guarantees
We guarantee indebtedness and other obligations to banks and other third parties for some of our equity method investments and consolidated subsidiaries. See Part I - Item 1. Financial Statements,
Note 14, "Commitments and Contingencies"
for further discussion.
Contingencies
We are party to various legal proceedings arising in the ordinary course of business, environmental issues and other contingencies. See Part I—Item 1. Financial Statements,
Note 14, "Commitments and Contingencies"
for further discussion.
Off-Balance Sheet Arrangements
In accordance with U.S. GAAP, our operating leases are not reflected in our unaudited condensed consolidated balance sheets. Refer to Part II—Item 8 Financial Statements, Note 19, "Commitments and Contingencies" in our Annual Report for further discussion of these off-balance sheet arrangements. As of
March 31, 2018
, we did not have any other material off-balance sheet arrangements (as defined in Item 303(a)(4)(ii) of Regulation S-K).
Outlook for
2018
In the U.S., we plan to rebuild distributor inventories in the second half, as we are continuing to drive our portfolio strategy of building distinctive brands across all segments to meet the needs of American beer drinkers. We plan to gain segment share in premium, grow volume in above premium and continue to stabilize our below premium brand volume and share. We gained share in premium lights led by
Miller Lite.
The brand plans to have bolder messaging to further assert its positioning as the original light beer that doesn't compromise on taste. The new creative and refreshed packaging for
Coors Light
have been rolled out and the brand expects to reinforce its role as the "World's Most Refreshing Beer" including the summer collaboration with YETI, a premium outdoor brand. Within above premium, we are seeing strong demand for
Blue Moon Mango Wheat
and
Blue Moon
variety packs, as well as the recently released 15 pack and 24 ounce cans of
Blue Moon Belgian White
. We also plan to build on last year's record-setting performance from
Leinenkugel's Summary Shandy
and compete more assertively within the strongly growing hard seltzers segment with
Henry's Hard Sparkling
, which is now available in the slim can package. Additionally, we plan to continue to expand the geographic footprint of our regional craft brands, and we expect
Terrapin
,
Hop Valley
,
Revolver
and
Saint Archer
, collectively, to continue to outpace the craft segment. We continue to grow share of both segment and industry with our below premium brands, led by the
Keystone
family. Our 2018 U.S. innovation lineup is off to a strong start. In April, we relaunched the
Sol
brand with redesigned packaging supported by an integrated marketing campaign that will be prominently featured throughout the summer, especially during the FIFA World Cup.
Arnold Palmer Spiked Half & Half
distribution is ramping up and will be supported through an expansive media campaign and suite of retail tools. Lastly, retro favorite and 2017 success,
Zima
, will be available for a limited time starting on Memorial Day. Despite the recent headwinds we have been facing, we believe we have the brands, plans and people to drive increases in profit, free cash flow and ultimately reach our goal of volume growth.
In Canada, the team continues to focus on executing our strategy to strengthen our business. Our consumer excellence teams continue to focus on evolving the shape of our brand portfolio, with the objective to stabilize our premium brands performance, accelerate the growth of our above premium portfolio, and simplify our offerings in the economy segment. In below premium, we have seen the recently launched
Miller High Life
brand delivering strong early results, and perfectly complementing our
Pilsner
and
Black Label
brands, as all three brands experienced growth in the first quarter. In the premium segment, as we approach the end of the hockey and basketball seasons, we have already transitioned to baseball, which sees
Coors Light
starting its first season as the beer sponsor of Major League Baseball in Canada. As consumer preference for above premium brands continues to increase, we plan to keep driving an acceleration of the growth of our key import brand,
Heineken
, as well as our owned
Miller Genuine Draft
and
Coors Banquet
brands.
Trou du Diable
, our most recent addition to
52
our craft beer portfolio, is broadening our craft footprint in Quebec, and delivering strong early results. In terms of above premium innovations, we have launched
Henry's Hard Soda
and
Leinenkugel's
from the U.S. in March and plan to soon add
Coors Edge
, a new non-alcoholic product, that will complement our current
Heineken 0.0
offering in this rapidly growing segment. Finally, as we look to ongoing productivity improvements, the build out of our new highly efficient brewery in British Columbia is on track for brewing in the next year and planning for our new brewery in Montreal is advancing quickly.
In Europe, we will continue to use a balanced portfolio approach, disciplined retail execution and optimization of our brewery network and infrastructure. The impact of the recently revised industry guidelines for calculating excise tax payments in one market and the increased investment in strengthening our first choice agenda will continue throughout the balance of 2018, as we seek to grow top and bottom line sustainability. Going forward, changes in pension accounting implemented this year will move a substantial amount of Europe pension income to Corporate results. Our commercial team expects to build on our positive momentum by further strengthening our national champion brands, including
Carling
, our largest brand in Europe. As we approach peak beer and cider selling season, we are excited about the potential we see for the premium cider brand,
Aspall
, as we further premiumize our U.K. portfolio. Our balanced portfolio approach also relies on a continuing commitment to maintain and improve our customer relationships as we continue to drive our first choice agenda.
In 2017, our International business made meaningful progress as we expanded our geographical footprint and added significant brand scale, and we expect additional progress in 2018. We intend to continue to utilize an asset-light model in select markets and our efforts will focus on
Coors Light
,
Miller Genuine Draft
, and
Miller Lite
. Our growth strategy includes several high-potential markets and success in these markets will play a pivotal role in reaching our long-term top- and bottom-line growth targets.
Pension Plans
We currently anticipate approximately
$10 million
of cash contributions to our defined benefit pension plans in
2018
, based on foreign exchange rates as of
March 31, 2018
. BRI and BDL contributions to their respective defined benefit pension plans are excluded here, as they are not consolidated in our financial statements.
Interest
We anticipate
2018
Corporate net interest expense of approximately $330 million, based on foreign exchange and interest rates as of
March 31, 2018
.
Tax
We expect to realize net benefits from the 2017 Tax Act, primarily driven by the lower federal corporate income tax rate of 21% and accelerated depreciation of qualified assets for tax purposes. As an additional result of the 2017 Tax Act, we expect a long-term consolidated effective tax rate in the range of 20% to 24%. However, we will continue to evaluate the impacts of the 2017 Tax Act as we further understand its implications, as well as the related, and yet to be issued, regulator rules, regulations and interpretations which could impact this outlook.
Dividends and Stock Repurchases
As a result of the Acquisition, we plan to maintain our current quarterly dividend of $0.41 per share, and have suspended our share repurchase program as we pay down debt. We will revisit our dividend policy and share repurchase program once deleveraging is well underway.
Critical Accounting Estimates
Our accounting policies and accounting estimates critical to our financial condition and results of operations are set forth in our Annual Report and did not change during the
first quarter
of
2018
. See
Note 2, "New Accounting Pronouncements"
for discussion of recently adopted accounting pronouncements. See also Part I—Item 1. Financial Statements,
Note 8, "Goodwill and Intangible Assets"
for discussion of the results of the
2017
annual impairment testing analysis and the related risks to our indefinite-lived intangible brand assets and goodwill amounts associated with our reporting units.
New Accounting Pronouncements Not Yet Adopted
Leases
In February 2016, the FASB issued authoritative guidance intended to increase transparency and comparability among organizations by recognizing lease assets and liabilities on the balance sheet and disclosing key information about leasing arrangements. Under the new guidance, lessees will be required to recognize a right-of-use asset and a lease liability, measured
53
on a discounted basis, at the commencement date for all leases with terms greater than twelve months. Additionally, this guidance will require disclosures to help investors and other financial statement users to better understand the amount, timing, and uncertainty of cash flows arising from leases, including qualitative and quantitative requirements. The guidance should be applied under a modified retrospective transition approach. This guidance is effective for annual reporting periods beginning after December 15, 2018, including interim periods within those annual periods, with early adoption permitted. We are currently evaluating the potential impact on our financial position and results of operations upon adoption of this guidance. This guidance will result in our existing operating leases, for certain real estate and equipment, to be recognized on our balance sheet. We will further analyze our lease arrangements as we complete our assessment and implementation of this new guidance.
See Part I—Item 1. Financial Statements,
Note 2, "New Accounting Pronouncements"
for a description of all new accounting pronouncements.
In the normal course of business, we actively manage our exposure to various market risks by entering into various supplier-based and market-based hedging transactions, authorized under established risk management policies that place clear controls on these activities. Our objective in managing these exposures is to decrease the volatility of our earnings and cash flows due to changes in underlying rates and costs. The counterparties to our market-based transactions are generally highly rated institutions. We perform assessments of their credit risk regularly. Our market-based transactions include a variety of derivative financial instruments, none of which are used for trading or speculative purposes.
For details of our derivative instruments that are presented on the balance sheet, including their fair values as of period end, see Part I—Item 1. Financial Statements,
Note 12, "Derivative Instruments and Hedging Activities"
. On a rolling twelve-month basis, maturities of derivative financial instruments held on
March 31, 2018
, based on foreign exchange rates as of
March 31, 2018
, are as follows:
|
Total
|
Less than 1 year
|
1 - 3 years
|
3 - 5 years
|
More than 5 years
|
||||||||||||||
|
(In millions)
|
||||||||||||||||||
|
$
|
34.6
|
|
$
|
18.7
|
|
$
|
16.0
|
|
$
|
(0.1
|
)
|
$
|
—
|
|
||||
Sensitivity Analysis
Our market risk sensitive derivative and other financial instruments, as defined by the SEC, are foreign currency forward contracts, debt, commodity swaps and commodity options. We monitor foreign exchange risk, interest rate risk, commodity risk and related derivatives using a sensitivity analysis.
The following table presents the results of the sensitivity analysis, which reflects the impact of a hypothetical 10% adverse change in each of these risks to our derivative and debt portfolio:
|
|
As of
|
||||||
|
March 31, 2018
|
December 31, 2017
|
||||||
|
(In millions)
|
|||||||
|
Estimated fair value volatility
|
|||||||
|
Foreign currency risk:
|
|
|
|||||
|
Forwards
|
$
|
(41.2
|
)
|
$
|
(36.5
|
)
|
|
|
Foreign currency denominated debt
|
$
|
(312.2
|
)
|
$
|
(310.0
|
)
|
|
|
Interest rate risk:
|
|||||||
|
Debt
|
$
|
(305.8
|
)
|
$
|
(311.9
|
)
|
|
|
Commodity price risk:
|
|||||||
|
Commodity swaps
|
$
|
(44.1
|
)
|
$
|
(43.5
|
)
|
|
|
Commodity options
|
$
|
—
|
|
$
|
—
|
|
|
The volatility of the applicable rates and prices are dependent on many factors that cannot be forecast with reliable accuracy. Therefore, actual changes in fair values could differ significantly from the results presented in the table above.
54
Evaluation of Disclosure Controls and Procedures
Under the supervision and with the participation of our management, including our Chief Executive Officer and Chief Financial Officer, we conducted an evaluation of our disclosure controls and procedures as such item is defined under Rule 13a-15(e) under the Exchange Act. Based on this evaluation, our Chief Executive Officer and Chief Financial Officer concluded that our disclosure controls and procedures were effective as of
March 31, 2018
, to provide reasonable assurance that information required to be disclosed in our reports under the Exchange Act is recorded, processed, summarized and reported within the time periods specified in the SEC rules and forms and that such information is accumulated and communicated to our management, including our Chief Executive Officer and Chief Financial Officer, as appropriate, to allow timely decisions regarding required disclosure. Management necessarily applies its judgment in assessing the costs and benefits of such controls and procedures that, by their nature, can only provide reasonable assurance regarding management's control objectives. Also, we have investments in certain unconsolidated entities that we do not control or manage.
Changes in Internal Control over Financial Reporting
There were no changes in our internal control over financial reporting (as defined in Exchange Act Rule 13a-15(f)) during the
three
months ended
March 31, 2018
, that have materially affected, or are reasonably likely to materially affect, our internal control over financial reporting.
For information regarding litigation, other disputes and environmental and regulatory proceedings see Part I—Item 1. Financial Statements,
Note 14, "Commitments and Contingencies"
for additional information.
We are also involved in other disputes and legal actions arising in the ordinary course of our business. While it is not feasible to predict or determine the outcome of these proceedings, in our opinion, based on a review with legal counsel, none of these disputes and legal actions are expected to have a material impact on our business, consolidated financial position, results of operations or cash flows. However, litigation is subject to inherent uncertainties and an adverse result in these or other matters may arise from time to time that may harm our business.
In addition to the other information set forth in this report, you should carefully consider the factors discussed in Part I—Item 1A. "Risk Factors" in our Annual Report, which could materially affect our business, financial condition and/or future results. There have been no material changes to the risk factors contained in our Annual Report. The risks described in our Annual Report are not the only risks facing us. Additional risks and uncertainties not currently known to us or that we currently deem to be immaterial may also materially adversely affect our business, financial condition, cash flows and/or future results.
None.
None.
Not applicable.
None.
55
The following are filed or incorporated by reference as a part of this Quarterly Report on Form 10-Q:
(a) Exhibits
|
Exhibit
Number
|
Document Description
|
||
|
4.1
|
|||
|
4.2
|
|||
|
4.3
|
|||
|
4.4
|
|||
|
4.5
|
|||
|
4.6
|
|||
|
10.1
|
|||
|
10.2
|
|||
|
31.1
|
|||
|
31.2
|
|||
|
32
|
|||
|
101.INS
|
XBRL Instance Document.*
|
||
|
101.SCH
|
XBRL Taxonomy Extension Schema Document.*
|
||
|
101.CAL
|
XBRL Taxonomy Extension Calculation Linkbase Document.*
|
||
|
101.LAB
|
XBRL Taxonomy Extension Label Linkbase Document.*
|
||
|
101.PRE
|
XBRL Taxonomy Extension Presentation Linkbase Document.*
|
||
|
101.DEF
|
XBRL Taxonomy Extension Definition Linkbase Document.*
|
||
|
*
|
Attached as Exhibit 101 to this report are the following documents formatted in XBRL (Extensible Business Reporting Language): (i) the Unaudited Condensed Consolidated Statements of Operations, (ii) the Unaudited Condensed Consolidated Statements of Comprehensive Income (Loss), (iii) the Unaudited Condensed Consolidated Balance Sheets, (iv) the Unaudited Condensed Consolidated Statements of Cash Flows, (v) the Unaudited Condensed Consolidated Statements of Stockholders' Equity and Noncontrolling Interests, (vi) the Notes to Unaudited Condensed Consolidated Financial Statements, and (vii) document and entity information.
|
||
56
SIGNATURE
Pursuant to the requirements of the Securities Exchange Act of 1934, the registrant has duly caused this report to be signed on its behalf by the undersigned thereunto duly authorized.
|
MOLSON COORS BREWING COMPANY
|
|||
|
By:
|
/s/ BRIAN C. TABOLT
|
||
|
Brian C. Tabolt
Vice President and Controller
(Chief Accounting Officer)
May 2, 2018
|
|||
57
TABLE OF CONTENTS
Part I. Financial InformationNote 2, "new Accounting Pronouncements"Note 4, "investments"Note 5, "share-based Payments"Note 3, "segment Reporting"Note 1, "basis Of Presentation and Summary Of Significant Accounting Policies"Note 14, "commitments and Contingencies"Note 6, "special Items"Note 9, "debt"Item 2. Management's Discussion and Analysis Of Financial Condition and Results Of OperationsNote 7, "income Tax"Note 12, "derivative Instruments and Hedging Activities"Note 8, "goodwill and Intangible Assets"Item 3. Quantitative and Qualitative Disclosures About Market RiskItem 4. Controls and ProceduresPart II. Other InformationItem 1. Legal ProceedingsItem 1A. Risk FactorsItem 2. Unregistered Sales Of Equity Securities and Use Of ProceedsItem 3. Defaults Upon Senior SecuritiesItem 4. Mine Safety DisclosuresItem 5. Other InformationItem 6. Exhibits