TURTLE BEACH CORP
10-Ks and 10-Qs
|
|
|
|
|
|
|
|
|
|
|
|
|
|
|
|
|
|
|
|
|
|
|
|
|
|
|
|
|
|
|
|
|
|
|
|
|
|
|
|
|
|
|
|
|
|
|
UNITED STATES
SECURITIES AND EXCHANGE COMMISSION
Washington, D.C. 20549
FORM 10-K
(Mark one)
ý
ANNUAL REPORT PURSUANT TO SECTION 13 OR 15(d) OF THE SECURITIES EXCHANGE ACT OF 1934
For the fiscal year ended
December 31, 2014
or
¨
TRANSITION REPORT PURSUANT TO SECTION 13 OR 15(d) OF THE SECURITIES EXCHANGE ACT OF 1934
For the transition period from to
Commission File Number: 001-35465

TURTLE BEACH CORPORATION
(Exact name of registrant as specified in its charter)
|
Nevada
|
27-2767540
|
|
(State or other jurisdiction of
incorporation or organization)
|
(I.R.S. Employer
Identification Number)
|
100 Summit Lake Drive, Suite 100
Valhalla, New York 10595
(Address of principal executive offices) (Zip Code)
(914) 345-2255
(Registrant's telephone number, including area code)
Securities registered pursuant to Section 12(b) of the Act:
Common Stock, par value $0.01
(Title of Class)
Securities registered pursuant to Section 12(g) of the Act: None
Indicate by check mark if the registrant is a well-known seasoned issuer, as defined in Rule 405 of the Securities Act.
¨
Yes
ý
No
Indicate by check mark if the registrant is not required to file reports pursuant to Section 13 or Section 15(d) of the Act.
¨
Yes
ý
No
Indicate by check mark whether the registrant (1) has filed all reports required to be filed by Section 13 or 15(d) of the Securities Exchange Act of 1934 during the preceding 12 months (or for such shorter period that the registrant was required to file such reports), and (2) has been subject to such filing requirements for the past 90 days.
ý
Yes
¨
No
Indicate by check mark whether the registrant has submitted electronically and posted on its corporate Web site, if any, every Interactive Data File required to be submitted and posted pursuant to Rule 405 of Regulation S-T (§232.405 of this chapter) during the preceding 12 months (or for such shorter period that the registrant was required to submit and post such files).
ý
Yes
¨
No
Indicate by check mark if disclosure of delinquent filers pursuant to Item 405 of Regulation S-K is not contained herein, and will not be contained, to the best of registrant’s knowledge, in definitive proxy or information statements incorporated by reference in Part III of this Form 10-K or any amendment to this Form 10-K.
¨
Indicate by check mark whether the registrant is a large accelerated filer, an accelerated filer, a non-accelerated filer or a smaller reporting company. See the definitions of “large accelerated filer,” “accelerated filer” and “smaller reporting company” in Rule 12b-2 of the Exchange Act.
Large accelerated filer
¨
Accelerated filer
ý
Non-accelerated filer
¨
Smaller reporting company
¨
Indicate by check mark whether the registrant is a shell company (as defined in Rule 12b-2 of the Exchange Act).
¨
Yes
ý
No
The aggregate market value of the registrant’s voting stock held by non-affiliates of the registrant as of June 30,
2014
was $387,212,549.
The number of shares of Common Stock, $0.001 par value, outstanding on
February 28, 2015
was
42,027,991
.
DOCUMENTS INCORPORATED BY REFERENCE
The information required by Part III of this Report is incorporated herein by reference from the registrant’s definitive proxy statement relating to its 2015 annual meeting of stockholders or annual report on Form 10-K/A, to be filed with the Securities and Exchange Commission within 120 days after the close of the registrant’s fiscal year.
The information required by Part III of this Report is incorporated herein by reference from the registrant’s definitive proxy statement relating to its 2015 annual meeting of stockholders or annual report on Form 10-K/A, to be filed with the Securities and Exchange Commission within 120 days after the close of the registrant’s fiscal year.
INDEX
|
|
|
Page
|
|
PART I.
|
||
|
|
|
|
|
Item 1.
|
||
|
Item 1A.
|
||
|
Item 1B.
|
||
|
Item 2.
|
||
|
Item 3.
|
||
|
Item 4.
|
||
|
PART II.
|
||
|
Item 5.
|
||
|
Item 6.
|
||
|
Item 7.
|
||
|
Item 7A.
|
||
|
Item 8.
|
||
|
Item 9.
|
||
|
Item 9A.
|
||
|
Item 9B.
|
||
|
PART III.
|
||
|
Item 10.
|
||
|
Item 11.
|
||
|
Item 12.
|
||
|
Item 13.
|
||
|
Item 14.
|
||
|
|
||
|
PART IV.
|
||
|
|
|
|
|
Item 15.
|
||
|
|
||
|
SIGNATURES
|
||
|
EXHIBIT INDEX
|
||
1
Statement Regarding Forward-Looking Disclosures
This Annual Report on Form 10-K (this “Report”) includes, and incorporates by reference, certain forward-looking statements within the meaning of the federal securities laws. Statements that are not historical facts, including statements about our beliefs and expectations, are forward looking statements. Forward-looking statements include statements preceded by, followed by or that include the words “may,” “could,” “will,” “would,” “should,” “expect,” “plan,” “anticipate,” “believe,” “estimate,” “intend,” “predict,” “seek,” “contemplate,” “potential” or “continue” and similar expressions. These forward-looking statements reflect the current expectations of Turtle Beach Corporation concerning future events and actual results may differ materially from current expectations or historical results. Any such forward-looking statements are subject to various risks and uncertainties, including without limitation those discussed in the sections of this Report entitled “Business Overview,” “Risk Factors” and “Management’s Discussion and Analysis of Financial Condition and Results of Operations.”
Forward-looking statements are only predictions and are not guarantees of performance. These statements are based on our management’s beliefs and assumptions, which in turn are based on currently available information. Important assumptions relating to the forward-looking statements include, among others, assumptions regarding demand for our products, the expansion of product offerings geographically or through new marketing applications, the timing and cost of planned capital expenditures, competitive conditions and general economic conditions. These assumptions could prove inaccurate. Forward-looking statements also involve known and unknown risks and uncertainties, which could cause actual results to differ materially from those contained in any forward-looking statement. In addition, even if our actual results are consistent with the forward-looking statements contained in this Annual Report on Form 10-K, those results may not be indicative of results or developments in subsequent periods. Many of these factors are beyond our ability to control or predict. Such factors include, but are not limited to, the following:
•
Current and future transitions in video gaming console platforms and the potential impact on our business;
•
Continued relationships with our largest customers;
•
Our ability to adapt to new technologies and introduce new products on a timely basis;
•
The impact of competitive products, technologies and pricing;
•
The impact of seasonality on our business;
•
Manufacturing capacity constraints and difficulties;
•
The scope of protection we are able to establish and maintain for intellectual property rights covering our technology;
•
Our ability to forecast demand for our products;
•
Estimates of our future revenues, expenses, capital requirements and our needs for additional financing;
•
Our success at managing the risks involved in the foregoing items;
•
Our financial performance; and
•
Other factors discussed under Item 1A - Risk Factors or elsewhere in this Report.
Except as required by applicable law, including the securities laws of the United States and the rules and regulations of the Securities and Exchange Commission (“SEC”), we are under no obligation to publicly update or revise any forward-looking statements after we file this Annual Report on Form 10-K, whether as a result of any new information, future events or otherwise. Investors, potential investors and other readers are urged to consider the above mentioned factors carefully in evaluating the forward‑looking statements and are cautioned not to place undue reliance on such forward‑looking statements. Although we believe that the expectations reflected in the forward-looking statements are reasonable, we cannot guarantee future results or performance.
Unless the context indicates otherwise, all references in this Report to “we,” “our,” “us,” “the Company,” and “Turtle Beach” refer to Turtle Beach Corporation and its wholly-owned subsidiaries.
Turtle Beach Corporation is a premier audio innovation company with expertise and experience in developing, commercializing and marketing audio technologies across a range of large addressable markets under the Turtle Beach® and HyperSound® brands. Turtle Beach is a worldwide leading provider of feature-rich headset solutions for use across multiple platforms, including video game and entertainment consoles, handheld consoles, personal computers, tablets and mobile devices. HyperSound technology is an innovative patent-protected sound technology that delivers immersive, directional audio offering unique potential benefits in a variety of commercial settings and consumer devices, including improved clarity and comprehension for listeners with hearing loss.
Turtle Beach (f/k/a Parametric Sound Corporation “Parametric”) is headquartered in San Diego, California and was incorporated in the state of Nevada in 2010.
2
VTB Holdings, Inc. (“VTBH”), the parent holding company of the historical business of Voyetra Turtle Beach, Inc. (“VTB”), was incorporated in the state of Delaware in 2010 and is headquartered in Valhalla, New York. Voyetra Turtle Beach, Inc. was incorporated in the state of Delaware in 1975.
In October 2012, VTB acquired Lygo International Limited (“Lygo”), a private limited company organized under the laws of England and Wales, which was subsequently renamed Turtle Beach Europe Limited (“TB Europe”).
Merger with Parametric Sound
On January 15, 2014 (the “Closing Date”), VTBH, which operated the Turtle Beach business, and Parametric, which operated the HyperSound® business, completed the merger (the “Merger”) of Paris Acquisition Corporation (“Merger Sub”) with and into VTBH in accordance with the terms and conditions of the Agreement and Plan of Merger dated August 5, 2013, by and among Parametric, Merger Sub and VTBH (the “Merger Agreement”). As a result of the Merger, VTBH, the accounting acquirer and surviving entity, became a wholly-owned subsidiary of Parametric, a publicly-traded company.
In connection with the Merger, Parametric issued to the former holders of VTBH common stock and Series A Preferred Stock an aggregate of 30,227,100 shares of Parametric Common Stock, par value $0.001 per share (“Parametric Common Stock”). The number of shares of Parametric Common Stock issued was computed in accordance with a formula specified in the Merger Agreement using an exchange ratio of 0.35997 shares of Parametric Common Stock for every one share of VTBH common stock or Series A Preferred Stock. Accordingly, all historical equity accounts and shares have been retroactively adjusted to reflect this exchange ratio. In addition, in accordance with the terms of the Merger Agreement, all outstanding options to purchase shares of VTBH common stock were converted into options to purchase shares of Parametric Common Stock and were assumed by Parametric. These newly issued shares of Parametric Common Stock, together with the converted options, represented approximately 80% of the total issued and outstanding shares of Parametric Common Stock, on a fully-diluted basis, as of the closing date of the Merger.
Headset Business
Turtle Beach launched its first gaming headset in 2005 and has grown to be the leading brand in gaming audio, and designs and markets premium audio peripherals for video game consoles, personal computers and mobile devices, including headsets for PlayStation®4 consoles and officially-licensed headsets for the Xbox One consoles. Turtle Beach branded headsets are distributed internationally across North America, South America, Europe, the Middle East, Africa, Australia, and Asia, and sold at thousands of storefronts, including major retailers such as Amazon, Argos, Best Buy, Carrefour, GameStop, HMV, Sainsbury, Target, Tesco and Walmart.
We offer a variety of headsets, spanning multiple wired and wireless retail price points ranging from $30 to $300 and have offerings across all major gaming platforms. Our price tiers correspond to customer profiles, beginning with “Entry-Level” gamers and progressing through “Casual,” “Enthusiast” and “Core.” Each successive price tier incorporates a higher level of finishing, features and technology, progressing from passive stereo to amplified mono, surround sound, and programmable surround sound. Premium headsets have padded leather headbands, accent stitching, and noise-isolating memory foam ear cups. Other features in certain of our premium headsets include removable microphones, breakaway cables and “charge-and-play” batteries that allow gamers to continue playing even as they recharge their batteries. As gaming consoles have evolved from dedicated video game platforms to home entertainment hubs, and as mobile devices have become platforms for entertainment, we have continued to evolve our headsets to reflect how content is consumed.
Each headset model is designed for a “primary” platform, such as a specific console or for the PC platform, though many can be used with multiple platforms, and most are compatible with mobile devices. A primary platform and unique packaging often results in the products being represented in the applicable platform area by retailers, increasing the prominence of Turtle Beach products in physical retail locations and online catalogs.
Our 2014 was highlighted by:
|
•
|
New product releases that increased the number of next-generation headsets available at retail to eight Xbox One and five PlayStation®4 compatible headsets.
|
|
•
|
The first gaming headsets for the PlayStation®4 and Xbox One with DTS Headphone:X 7.1 surround sound technology, an innovative new sound experience designed to make movies, music and games sound better through headphones.
|
|
•
|
The first gaming headset to provide truly wireless game and chat audio for the Xbox One.
|
|
•
|
The first headset for the PlayStation®4 with noise cancellation and invisible microphones.
|
3
|
•
|
The introduction of a new feature called Superhuman Hearing™ which amplifies soft sounds using audio signal processing technology.
|
HyperSound Business
HyperSound is a pioneering audio solution that directs sound in a narrow beam focusing on a specific location, creating a precise audio zone. HyperSound technology's ability to beam, focus and control sound empowers solutions for commercial applications such as digital signage and kiosks, consumer audio and health care (improving clarity and comprehension for persons who are hard of hearing).
Our products are designed to deliver controlled audible sound along a tightly formed beam as targeted and desired. If the listener is standing outside the path of the beam, the sound is barely audible. This delivery mechanism also maintains sonic clarity and intelligibility over longer distances than traditional speakers. We believe our technology offers a number of advantages, including:
|
•
|
ability to create a beam of sound and place it where it is intended;
|
|
•
|
ability to direct advertising to patrons in sound zones, enhancing video content while limiting the noise that interferes with workers or the conduct of commerce at checkout or other locations;
|
|
•
|
ability to manipulate or selectively position or diffuse the source of sound;
|
|
•
|
ability to deliver a beam of sound over longer distances than conventional speakers, such as down a grocery store aisle or from a tall box store ceiling; and
|
|
•
|
ability to penetrate other competing ambient sounds to more effectively communicate.
|
In 2014, we received clearance from the U.S. Food and Drug Administration, or FDA, to market the HyperSound Audio System to improve the clarity and comprehension of sounds from various sources for listeners with or without hearing loss and with or without the use of hearing aids. In November, we launched the first wide-scale deployment of the commercial product creating virtual reality audio zones in Activision Call of Duty®: Advanced Warfare retail displays in approximately 1,000 Best Buy locations in North America.
Industry Overview
Gaming Headset Market
The video game industry is a global and growing market. Sales in the console accessories market, which includes gaming headsets and other peripherals such as gamepads and specialty controllers, adapters, batteries, memory and interactive gaming toys are significantly influenced by the launch and sales of new game consoles. In 2013, the gaming industry experienced a cyclical event as Microsoft and Sony each announced new consoles for the first time in eight years, and the consumer response to the Xbox One and PlayStation®4 (the “next generation consoles”) has been overwhelmingly positive, creating a growing installed base of gamers and a market for next generation headsets.
The June 2014
Intelligence: Worldwide Console Forecast
report by DFC Intelligence Forecasts, or “DFC,” estimates that combined global spending on console hardware and software will increase to $43 billion in 2017, and in 2014, sales tracking data from The NPD Group, Inc. indicated that console gaming headset sales in the U.S. eclipsed $350 million. Turtle Beach was the number one console gaming headset manufacturer in the U.S. with a 46% dollar share of the market.
DFC’s
World Console Forecast
indicates that North America has approximately 47% of the installed base for sixth- and seventh-generation of gaming consoles, which include the Xbox 360, Playstation®3, Nintendo Wii, Xbox and Playstation®2 (the “previous generation consoles”). Based on these figures, we believe the global console gaming headset market to be approximately $700 million. Industry analysts expect Microsoft and Sony to continue supporting their previous generation consoles over the next few years and, as a result, we anticipate there will continue to be a significant market through at least 2015 for Turtle Beach headsets that are compatible with Xbox 360 and PlayStation®3.
Major console manufacturers such as Sony and Microsoft bundle chat communicators with new console purchases. These chat communicators are mono voice-only devices that do not transmit game audio, but do allow players to communicate with each other. We believe that chat communicators are a lead generator, drawing new customers to fully integrated gaming headsets, as once new players experience the benefits of chat communicators, they often upgrade to a fully integrated gaming headset, which includes audio and chat.
In addition to making chat communicators, both Sony and Microsoft offer a limited range of integrated headsets. Sony makes gaming headsets that compete against our Playstation® compatible headsets and in 2014, Microsoft launched an Xbox One compatible headset.
4
HyperSound Technology Target Markets
We are focusing our product development efforts for HyperSound-based products in three areas: health care, commercial and consumer applications. Additionally, we may explore licensing opportunities.
Health Care.
There are over 48 million people with hearing loss significant enough to require a hearing aid in the United States. Our research indicates that HyperSound technology delivers improved clarity and comprehension for hard of hearing listeners, and we believe that a large percentage of that market may be able to use HyperSound Audio Systems to improve their listening experiences from sources such as TV, CD/DVD players and stereo systems. The HyperSound Audio Systems can work with existing audio systems to provide targeted sound zones for persons with hearing loss.
Commercial Applications.
We are currently marketing our HyperSound technology to retailers and audio-visual integrators for use in settings where directed audio and sound zones are beneficial, such as digital signage and interactive retail displays. Digital signage is a growing form of direct advertising, capturing an increasing share of advertising spending. Restaurants, banks, retail outlets, museums and other outlets and organizations employ commercial displays to communicate with patrons, many of which currently have no audio. Interactive retail displays and related computer terminals such as ATMs, power applications for communication, commerce, entertainment and education and electronic gaming and casino slot machines are also becoming increasingly sophisticated computerized entertainment devices.
Consumer Applications.
Our HyperSound technology has the potential to be developed into consumer products for various applications, including computers, video game consoles, televisions, home theater and home audio. With the advent of flat panel displays for use in televisions and mobile devices, manufacturers have been focused on creating thinner products often at the expense of sound quality. We believe that our ability to create a 3D sound image from two thin emitters, compared to a five- or seven-speaker surround sound set-up using conventional speakers can deliver a compelling and enhanced audio experience.
Business Strategy
We intend to build upon the Turtle Beach brand awareness, sophisticated audio technology and high quality products to grow the core console and casual gaming business to increase sales and profitability and intend to introduce new HyperSound products across several large and growing addressable markets.
|
•
|
Accelerate Console Headset Growth.
We have delivered innovative console gaming headsets in every category. We believe that our brand's image among consumers is a competitive advantage and that our success is attributable to our emphasis on delivering the most innovative and advanced headsets.
|
To maintain our competitive position in our markets, we are focused on the following:
|
•
|
continuing to deliver innovative, high quality console gaming headsets that incorporate advanced audio and wireless technology;
|
|
•
|
maintaining our strategic relationships that provide our brand a larger presence with consumers and create opportunities for retailers to carry our products;
|
|
•
|
growing our gaming headset business in all areas including personal computer headsets;
|
|
•
|
continuing to improve our cost position through increased global sourcing and expanded points of distribution.
|
|
•
|
Accelerate International Expansion.
We have a strong market position in North America, United Kingdom, and Australia, and believe there is further opportunity for growth in the rest of Europe. Asia, in particular China, and Latin America are viewed as additional long-term growth opportunities. The Company intends to continue investing to increase our presence and growth in these regions.
|
|
•
|
Grow HyperSound Business.
We have built the infrastructure to expand our commercial business and launch the hearing healthcare audio business. Our goal is to grow a substantial customer base through key channel partners and continued product development.
|
|
•
|
Expand Our Product Lines.
We intend to increase our sales by continuing to develop internally, or through potential acquisitions, products that we offer to our customers. We are investing the resources necessary to maintain and expand our technical capability to manufacture multiple product lines that incorporate the latest technologies.
|
5
Product Development
We continue to innovate, make improvements to our technology and develop new products, and anticipate that we will continue to devote substantial resources to research and development in the near future. Our product management team takes a disciplined approach to product design that balances iteration, incremental improvement and innovation to achieve a blend of differentiated technology designed to attract customers, maintain product design continuity and exceed expectations as to quality, reliability and profitability. For the year ended December 31, 2014, we invested
$9.4 million
in product development efforts to launch additional gaming headset models for the next generation consoles as well as the continued advancement and enhancement of our HyperSound technology. For the years ended December 31,
2013
and
2012
, we expended
$4.9 million
and
$2.1 million
, respectively.
Intellectual Property
We operate in an industry where innovations, investment in new ideas and protection of resulting intellectual property rights are critical to success. We have a substantial base of intellectual property assets to protect our current and future product development, and intend to vigorously enforce such rights.
As a third-party gaming headset company certain technology used in the newer generation of consoles, such as integrated voice and chat audio from the Xbox One, requires a license to enable products to connect to that platform. While Playstation®4 does not require any license to produce headsets that can connect, the Xbox One connection requires the purchase of proprietary chips to integrate into the locked chat audio.
While we currently believe that we have the necessary licenses, or can obtain the necessary licenses to produce compatible products, there is no guarantee that licenses will be renewed or granted. Moreover, if these licensing parties enter into exclusive license agreements with companies other than us for their “closed systems” or if we are unable to obtain sufficient quantities of these headset adapters or chips, we would be placed at a substantial competitive disadvantage.
Supply Chain and Operations
We have a global network of suppliers that manufacture products to meet our cost objectives and quality standards sought by our customers. We have worked closely with component, manufacturing and global logistic partners to build a supply chain that we consider predictable, scalable and consistent to provide high-quality, reliable products and leading cost management practices. The use of outsourced manufacturing facilities is designed to take advantage of specific expertise and allow for flexibility and scalability to respond to seasonality and changing demands for our products.
In anticipation of new product development and incremental growth, we made additional investments with a focus on making advancements to our planning systems and reconfiguring our supply chain. In addition, in connection with our efforts to improve our operating efficiency and reduce costs, we have begun to focus on company-wide overhead and operating expense cost reduction activities. To date, expenses under this effort relate primarily to the closure of certain production operations in China.
We believe we have solid relationships with our suppliers and that, subject to the discussion in “Risk Factors” and “Management’s Discussion and Analysis of Financial Condition and Results of Operations - Liquidity and Capital Resources,” we will continue to have a sufficient supply of quality products on satisfactory terms.
Retail Distribution
Our headsets are sold in 44 countries, by retailers such as Amazon, Argos, Best Buy, Carrefour, GameStop, HMV, Sainsbury, Target, Tesco and Walmart. We often have a broader assortment and more shelf space than competitors at video game and electronics retailers such as GameStop and Best Buy which we believe reinforces the brand’s authenticity with gaming enthusiasts, and our presence in mass channel retailers such as Walmart and Target enables the brand to reach a wider audience of casual gamers. Our established presence on Amazon.com and other online retail sites, and positive consumer product ratings on those sites, increases the search visibility of products and helps to influence both online and in-store sales. We also have exclusive licensing and sponsorship relationships with some of the biggest players in competitive gaming, including Twitch, the world's leading broadcast platform and community for video game enthusiasts.
TB Europe serves as a sales office and primary warehouse for sales to the European market, and has strengthened Turtle Beach’s European operations with support for sales, marketing, customer service and distribution.
In September 2013, China’s State Council lifted its ban on video game consoles allowing foreign companies to sell consoles for the first time since 2000. In September 2014, sales of our XO Four and XO Seven officially-licensed Xbox One gaming headsets began in China. The launch of the gaming headsets coincided with the launch of the Xbox One console, which debuted in China on September 29, 2014. We believe China offers a growth opportunity over the next several years and
6
therefore, in concert with the introduction of our officially-licensed Xbox One headsets, we created a Chinese language version of the Turtle Beach brand and logo; phonetically pronounced “Huan Jing,” the Chinese language version of the brand name translates as “Fantasy Space.”
TurtleBeach.com is an important focal point for our marketing efforts serving as a destination for paid and earned media. Earned media is favorable publicity gained through promotional efforts other than advertising, as compared with paid media, which refers to publicity gained through advertising. The website acts as a hub for both online and offline activity, and provides a direct sales channel for new and refurbished products.
Customers
Our customer base is comprised primarily of large retailers and distributors, both domestic and international. In 2014, consolidated net sales to our major market channels consisted of $105.2 million to domestic retail customers, $62.3 million to international retail customers, $12.3 million to domestic distributors and $6.4 million to other customers.
Our three largest individual customers accounted for approximately
45%
of our gross sales in 2014,
45%
of our gross sales in 2013 and
46%
of our gross sales in 2012 . During 2014, our three largest customers, Game Stop, Best Buy and Walmart each accounted for
15%
of our consolidated net sales.
Geographic Information
In addition to the traditional markets of the United States and United Kingdom, we have pursued growth in countries such as Germany and France, and have begun to support long-term growth efforts in Asia Pacific and Latin America. The following table presents total net revenues, and percentage of total, based on where customers are physically located for each of the three years ended December 31, 2014:
|
2014
|
2013
|
2012
|
|||||||||||||||
|
(in thousands)
|
|||||||||||||||||
|
United States
|
$
|
117,715
|
|
63.2
|
%
|
$
|
111,514
|
|
62.5
|
%
|
$
|
136,494
|
|
65.9
|
%
|
||
|
United Kingdom
|
29,425
|
|
15.8
|
%
|
26,439
|
|
14.8
|
%
|
27,100
|
|
13.1
|
%
|
|||||
|
Europe
|
24,082
|
|
12.9
|
%
|
18,565
|
|
10.4
|
%
|
19,116
|
|
9.2
|
%
|
|||||
|
Other
|
14,954
|
|
8.1
|
%
|
21,952
|
|
12.3
|
%
|
24,426
|
|
11.8
|
%
|
|||||
|
Total revenues
|
$
|
186,176
|
|
|
|
$
|
178,470
|
|
$
|
207,136
|
|
||||||
Long-lived assets are largely held in the United States, refer to Note
13
,
“Geographic Information”
in the Notes to the Consolidated Financial Statements.
Seasonality
Our gaming headset business is seasonal with a significant portion of sales and profits typically occurring around the holiday period. Historically, more than 50% of headset business revenues are generated during the period from September through December as new headsets are introduced and consumers engage in holiday shopping. In addition, launches of major new online multiplayer games and specific retailer purchasing behavior can drive significant revenue shifts between months and quarters in a given year.
Employees
As of December 31, 2014, Turtle Beach had approximately 161 employees, of which 122 were full-time salaried employees. None of our employees are represented by a labor union. We believe that our relationship with our employees is good.
7
Available Information
We make available free of charge on or through our website, http://corp.turtlebeach.com, our Annual Report on Form 10-K, Quarterly Reports on Form 10-Q, Current Reports on Form 8-K, and all amendments to those reports as soon as reasonably practicable after such material is electronically filed with or furnished to the Securities and Exchange Commission. Information contained on our website is not incorporated by reference unless specifically stated therein.
In addition, the public may read or copy any materials filed with the SEC at the SEC’s Public Reference Room located at 100 F Street NE, Washington, D.C. 20549. The public may also obtain information on the operation of the Public Reference Room by calling the SEC at 1-800-SEC-0330. These reports and other information are also available, free of charge, at
www.sec.gov.
8
Set forth below is a summary of certain material risks related to an investment in our securities, which should be considered carefully in evaluating such an investment. Our business, financial condition, operating results and cash flows can be affected by a number of factors, whether currently known or unknown, including but not limited to those described below, any one or more of which could, directly or indirectly, cause the Company’s actual results of operations and financial condition to vary materially from past, or from anticipated future, results of operations and financial condition. Any of these factors, in whole or in part, could materially and adversely affect the Company’s business, financial condition, results of operations, cash flows and common stock price. Additional risks and uncertainties not presently known to us or that we currently consider immaterial may also impair our business operations.
Because of the following factors, as well as other factors affecting the Company’s financial condition and operating results, past financial performance should not be considered to be a reliable indicator of future performance, and investors should not use historical trends to anticipate results or trends in future periods. Please also see “Statement Regarding Forward-Looking Disclosures” in the section immediately preceding Item 1 of this Report.
Risks Related to Our Operations
We depend upon the success and availability of third-party gaming platforms and software to drive sales of our headset products.
The performance of our headset business is affected by the continued success of third-party gaming platforms, such as Microsoft Xbox and Sony PlayStation®, as well as video games developed by such manufacturers and other third-party publishers. Our business could suffer if any of these parties fail to continue to drive the success of these platforms, develop new or enhanced videogame platforms, develop popular game and entertainment titles for current or future generation platforms or produce and timely release sufficient quantities of such consoles. If a platform is withdrawn from the market or fails to sell, we may be forced to liquidate inventories relating to that platform or accept returns resulting in significant losses.
Further, in order for headsets to receive integrated voice and chat audio from the Xbox One, a Microsoft proprietary hardware adapter is currently required, and in the future a Microsoft proprietary computer chip will be required. As a result, with respect to our products designed for the Xbox One, we are currently reliant on Microsoft to provide us with sufficient quantities of the headset adapters, and in the future will rely on Microsoft or their designated supplier to provide us with sufficient quantities of the chips. If we are unable to obtain sufficient quantities of these headset adapters or chips, sales of our Xbox One headsets and consequently our revenues would be adversely affected.
In addition, we are licensed and approved by Microsoft to develop and sell Xbox One compatible audio products pursuant to a license agreement under which we have the right to manufacture (through third party manufacturers), market and sell audio products for the Xbox One video game console (the “Xbox One Agreement”). Our Xbox One headsets are dependent on this license. Microsoft has the right to terminate the Xbox One Agreement under certain circumstances set forth in the agreement. Should the Xbox One Agreement be terminated, our headset offerings may be limited, thereby significantly reducing our revenues.
Accordingly, Microsoft, Sony and other third-party gaming platform manufacturers may control our ability to manufacture headsets compatible with their platforms, and could cause unanticipated delays in the release of our products as well as increases to projected development, manufacturing, licensing, marketing or distribution costs, any of which could negatively impact our business.
We face significant competition from other consumer electronics companies and this competition could have a material adverse effect on our financial condition and results of operations.
We compete with other producers of personal computers and video game console headsets, including the video game console manufacturers. Our competitors may spend more money and time on developing and testing products, undertake more extensive marketing campaigns, adopt more aggressive pricing policies, pay higher fees to licensors for motion picture, television, sports, music and character properties, or develop more commercially successful products for the personal computer or video game platforms than we do. In addition, competitors with large product lines and popular products, in particular the video game console manufacturers, typically have greater leverage with retailers, distributors and other customers, who may be willing to promote products with less consumer appeal in return for access to those competitors’ more popular products. For example, during 2014 first party gaming headsets realized significant gains in market share in part due to price discounts and bundling.
9
In the event that a competitor reduces prices, we could be forced to respond by lowering our prices to remain competitive. If we are forced to lower prices, we may be required to “price protect” products that remain unsold in our customers’ inventories at the time of the price reduction. Price protection results in our issuing a credit to our customers in the amount of the price reduction for each unsold unit in that customer’s inventory. Our price protection policies, which are customary in the industry, can have a major impact on our sales and profitability.
In addition, if console manufacturers implement new technologies, through hardware or software, which would cause our headsets to become incompatible with that hardware manufacturer’s console it could cause unanticipated delays in the release of our products as well as increases to projected development, manufacturing, marketing or distribution costs, any of which could harm our business and financial results.
Our industry is subject to competition in an environment of rapid technological change, and if we do not adapt to, and appropriately allocate our resources among, emerging technologies, our revenues could be negatively affected.
We must make substantial product development and other investments to align our product portfolio and development efforts in response to market changes in the gaming industry. We must anticipate and adapt our products to emerging technologies in order to keep those products competitive. When we choose to incorporate a new technology into our products or to develop a product for a new platform or operating system, we are often required to make a substantial investment prior to the introduction of the product. If we invest in the development of a new technology or for a new platform that does not achieve significant commercial success, our revenues from those products likely will be lower than anticipated and may not cover our costs.
Further, our competitors may adapt to an emerging technology more quickly or effectively than we do, creating products that are technologically superior to ours, more appealing to consumers, or both. If, on the other hand, we elect not to pursue the development of products incorporating a new technology or for new platforms that achieve significant commercial success, our revenues could also be adversely affected. It may take significant time and resources to shift product development resources to that technology or platform and it may be more difficult to compete against existing products incorporating that technology or for that platform. Any failure to successfully adapt to, and appropriately allocate resources among, emerging technologies could harm our competitive position, reduce our share and significantly increase the time it takes us to bring popular products to market.
There are numerous steps required to develop a product from conception to commercial introduction and to ensure timely shipment to retail customers, including designing, sourcing and testing the electronic components,
receiving approval of hardware and other third-party licensors, factory availability and manufacturing and designing the graphics and packaging. Any difficulties or delays in the product development process will likely result in delays in the contemplated product introduction schedule. It is common in new product introductions or product updates to encounter technical and other difficulties affecting manufacturing efficiency and, at times, the ability to manufacture the product at all. Although these difficulties can be corrected or improved over time with continued manufacturing experience and engineering efforts, if one or more aspects necessary for the introduction of products are not completed as scheduled, or if technical difficulties take longer than anticipated to overcome, the product introductions will be delayed, or in some cases may be terminated. No assurances can be given that Turtle Beach products will be introduced in a timely fashion, and if new Turtle Beach products are delayed, our sales and revenue growth may be limited or impaired.
The on-going console platform transition has adversely affected, and future transitions in console platforms may adversely affect, our headset business.
In 2005, Microsoft released the Xbox 360; in 2006, Sony introduced the PlayStation®3; and in 2012, Nintendo introduced the Wii U. Sony launched its next generation console, PlayStation®4, on November 15, 2013, and Microsoft launched its next generation console, Xbox One, on November 22, 2013. When new console platforms are announced or introduced into the market, consumers have historically reduced their purchases of game console peripherals and accessories, including headsets, for previous generation console platforms in anticipation of new platforms becoming available. During these console transition periods, sales of game console headsets such as those sold by us, related to previous generation consoles slow or decline until new platforms are introduced and achieve wide consumer acceptance, which we cannot guarantee. This decrease or decline may not be offset by increased sales of products for the new console platforms. Over time as the old generation platform user base declines, products for the old platforms are typically discontinued which can result in lower margins, excess inventory, excess parts, or similar costs related to end of life of a product model. In addition, as a third party gaming headset company, we are reliant on working with the console manufacturers for our headsets compatible with any new console platforms, which if not done on a timely basis may adversely affect sales. For example, the headset adapter that was provided to us by Microsoft for inclusion with new gaming headsets for the Xbox One was not available until March 2014, even though the console platform was available starting in November 2013. Sony and Microsoft may make changes to their platforms that impact how headset connect with or work with the new consoles which could create a disruption to consumer
10
buying behavior and/or product life-cycles.
As console hardware moves through its life cycle, hardware manufacturers typically enact price reductions, and decreasing prices may put downward pressure on prices for products for such platforms. During platform transitions, we may simultaneously incur costs both in continuing to develop and market new products for prior-generation video game platforms, which may not sell at premium prices, and also in developing products for current-generation platforms, which will not generate immediate or near-term revenue. As a result, our operating results during platform transitions are more volatile and more difficult to predict than during other times.
Our HyperSound business has not generated significant revenues, has a history of operating losses, expects additional losses and may not achieve or sustain profitability.
Our HyperSound business has incurred operating losses since Parametric's spin-off from LRAD Corporation in 2010, and we expect additional losses in the near-term as we continue to expend significant resources on personnel, consultants, intellectual property protection, research and development, marketing, production and administration. Our ability to achieve future profitability is dependent on a variety of factors, many of which are outside our control. Failure to achieve profitability or sustain profitability, if achieved, may require us to continue to make additional capital investments in our HyperSound business which could materially impact our results of operations.
Substantially all our HyperSound revenues to date have been derived from sales of a limited number of products to a limited number of customers, and we cannot guarantee that we will be able to develop a larger customer base, introduce new products to generate additional revenues or obtain and fulfill increased orders from both existing and new customers. Further, even if we continue to retain existing customers and obtain new customers, we cannot guarantee that those customers will purchase sufficient quantities of our HyperSound products at prices that will enable us to recover our costs in acquiring those customers and fulfilling orders. We also cannot guarantee that we will be able to generate any future license revenues. Our ability to increase sales of our HyperSound products or generate license revenues depends on a number of factors, including:
|
•
|
our ability to timely demonstrate or manufacture reliable products that have the features required by our HyperSound customers;
|
|
•
|
our ability to develop relationships with new customers that will lead to sales of our HyperSound products or licensing opportunities for our HyperSound technology;
|
|
•
|
our ability to develop and expand into new markets for our HyperSound audio products and technology; and
|
|
•
|
our ability to develop international product distribution or licensing directly or through partners.
|
A deterioration in future expected profitability or cash flows could result in an impairment of our recorded goodwill and other intangibles.
At December 31, 2014, recorded goodwill of
$81.0 million
and indefinite lived intangible assets of
$27.1 million
associated with our HyperSound reporting unit. Under US GAAP, the Company reviews its goodwill and intangible assets for impairment when events or changes in circumstances indicate the carrying value may not be recoverable. Additionally, goodwill and indefinite lived intangible assets are required to be tested for impairment at least annually. The valuations used to determine the fair values used to test goodwill or intangible assets are dependent upon various assumptions and reflect management’s best estimates. Net sales growth, discount rates, earnings multiples and future cash flows are critical assumptions used to determine these fair values. Slower net sales growth rates in the dental or medical device industries, an increase in discount rates, unfavorable changes in earnings multiples or a decline in future cash flows, among other factors, may cause a change in circumstances indicating that the carrying value of the Company’s goodwill or intangible assets may not be recoverable. The Company may be required to record a significant charge to earnings in the financial statements during the period in which any impairment of the Company’s goodwill or intangible assets is determined.
Our business could be adversely affected by significant movements in foreign currency exchange rates.
We are exposed to fluctuations in foreign currency transaction exchange rates, particularly with respect to the Euro and British Pound. Any significant change in the value of currencies of the countries in which we do business relative to the value of the U.S. Dollar could affect our ability to sell products competitively and control our cost structure. Additionally, we are subject to foreign exchange translation risk due to changes in the value of foreign currencies in relation to our reporting currency, the U.S. dollar. The translation risk is primarily concentrated in the exchange rate between the U.S. dollar and the British Pound. As the U.S. dollar fluctuates against other currencies in which we transact business, revenue and income can be impacted.
11
A significant portion of our revenue is derived from a few large customers, and the loss of any such customer, or a significant reduction in purchases by such customer, could have a material adverse effect on our business, financial condition and results of operations.
During 2014, our three largest individual customers accounted for approximately
45%
of our gross sales in the aggregate. The loss of, or financial difficulties experienced by, any of these or any of our other significant customers, including as a result of the bankruptcy of a customer, could have a material adverse effect on our business, results of operations, financial condition and liquidity. We do not have long-term agreements with these or other significant customers and our agreements with these customers do not require them to purchase any specific amount of products. All of our customers generally purchase from us on a purchase order basis. As a result, agreements with respect to pricing, returns, cooperative advertising or special promotions, among other things, are subject to periodic negotiation with each customer. No assurance can be given that these or other customers will continue to do business with us or that they will maintain their historical levels of business. In addition, the uncertainty of product orders can make it difficult to forecast our sales and allocate our resources in a manner consistent with actual sales, and our expense levels are based in part on our expectations of future sales. If our expectations regarding future sales are inaccurate, we may be unable to reduce costs in a timely manner to adjust for sales shortfalls. In addition, financial difficulties experienced by a significant customer could increase our exposure to uncollectible receivables and the risk that losses from uncollected receivables exceed the reserves we have set aside in anticipation of this risk.
The manufacture, supply and shipment of our products are dependent upon a limited number of third parties, and our success is dependent upon the ability of these parties to manufacture, supply and ship sufficient quantities of their product components to us in a timely fashion, as well as the continued viability and financial stability of these third-parties.
Because we rely on a limited number of manufacturers and suppliers for our products, we may be materially and adversely affected by the failure of any of those manufacturers and suppliers to perform as expected or supply us with sufficient quantities of their product components to ensure consumer availability of our own products. Our suppliers’ ability to supply products to us is also subject to a number of risks, including the availability of raw materials, their financial instability, the destruction of their facilities, or work stoppages. Any shortage of raw materials or components or an inability to control costs associated with manufacturing could increase our costs or impair our ability to ship orders in a timely and cost-efficient manner. As a result, we could experience cancellations of orders, refusal to accept deliveries or a reduction in our prices and margins, any of which could harm our financial performance and results of operations.
Moreover, there can be no assurance that such manufacturers and suppliers will not refuse to supply us at prices we deem acceptable, independently market their own competing products in the future, or otherwise discontinue their relationships with or support of us. Our failure to maintain these existing manufacturing and supplier relationships, or to establish new relationships on similar terms in the future, could have a material adverse effect on our business, results of operations, financial condition and liquidity.
During 2015, we began to wind down our activities with one of our contract manufacturing partners in China and expand activities with our global manufacturing partner. Delays or issues with this decision could result in incremental costs and/or disrupt product flows.
In particular, our HyperSound products have a number of components and subassemblies produced by outside suppliers. In addition, for certain of these items, we qualify only a single source of supply with long lead times, which can magnify the risk of shortages or result in excess supply and also decreases our ability to negotiate price with our suppliers. For example, in our commercial product we depend on one piezo-film supplier to provide expertise and materials used in our proprietary emitters and one supplier for a majority of our plastic and metal parts. If shortages occur we could lose sales or if we purchase excess inventory, we could be subject to loss from lack of sales or if models change. The manufacturing of our new HyperSound emitter is complex and involves several new processes, and any unexpected issues or delays in setting up those processes could delay the launch of our HyperSound healthcare product. Also if we experience quality problems with suppliers, then our HyperSound production schedules could be significantly delayed or costs significantly increased, which could have an adverse effect on our business, liquidity, results of operation and financial position.
In addition, the ongoing effectiveness of our supply chain is dependent on the timely performance of services by third parties shipping products and materials to and from our warehouse facilities and other locations. If we encounter problems with these shipments, our ability to meet retailer expectations, manage inventory, complete sales and achieve objectives for operating efficiencies could be materially adversely affected. We have experienced some of these problems in the past and we cannot assure you that we will not experience similar problems in the future.
Our net sales and operating income fluctuate on a seasonal basis and decreases in sales or margins during peak seasons could have a disproportionate effect on our overall financial condition and results of operations.
Historically, a majority of our annual revenues have been generated during the holiday season of September to December.
12
If we do not accurately forecast demand for particular products, we could incur additional costs or experience manufacturing delays. Any shortfall in net sales during this period would cause our annual results of operations to suffer significantly.
Demand for our products depends on many factors such as consumer preferences and the introduction or adoption of game platforms and related content, and can be difficult to forecast. If we misjudge the demand for our products, we could face the following problems in our operations, each of which could harm our operating results:
|
•
|
If our forecasts of demand for products are too high, we may accumulate excess inventories of products, which could lead to markdown allowances or write-offs affecting some or all of such excess inventories. We may also have to adjust the prices of our existing products to reduce such excess inventories.
|
|
•
|
If demand for specific products increases beyond what we forecast, our suppliers and third-party manufacturers may not be able to increase production rapidly enough to meet the demand. Our failure to meet market demand may lead to missed opportunities to increase our base of gamers, damage our relationships with retailers or harm our business.
|
|
•
|
The on-going console transition increases the likelihood that we could fail to accurately forecast demand for our next generation console headsets and our existing headsets.
|
|
•
|
Rapid increases in production levels to meet unanticipated demand could result in increased manufacturing errors, as well as higher component, manufacturing and shipping costs, all of which could reduce our profit margins and harm our relationships with retailers and consumers.
|
Loss of our key management and other personnel could impact our business.
Our future success depends largely upon the continued service of our executive officers and other key management and technical personnel and on our ability to continue to attract, retain and motivate qualified personnel. In addition, competition for skilled and non-skilled employees among companies like ours is intense, and the loss of skilled or non-skilled employees or an inability to attract, retain and motivate additional skilled and non-skilled employees required for the operation and expansion of our business could hinder our ability to conduct research activities successfully, develop new products, attract customers and meet customer shipments.
If we are unable to continue to develop innovative and popular headset products, or if our design and marketing efforts do not effectively raise the recognition and reputation of our Turtle Beach brand, we may not be able to successfully implement our headset growth strategy.
We believe that our ability to extend the recognition and favorable perception of our Turtle Beach brand is critical to implement our headset growth strategy, which includes further establishing our position in existing gaming headsets, developing a strong position in new console headsets, expanding beyond existing console, PC and mobile applications to new technology applications, accelerating our international growth and expanding complementary product categories. To extend the reach of our Turtle Beach brand, we believe we must devote significant time and resources to headset product design, marketing and promotions. These expenditures, however, may not result in a sufficient increase in net sales to cover such expenses.
If we are unable to protect our information systems against service interruption, misappropriation of data or breaches of security, our operations could be disrupted, our reputation may be damaged, and we may be financially liable for damages.
We rely heavily on information systems to manage our operations, including a full range of retail, financial, sourcing and merchandising systems. We regularly make investments to upgrade, enhance or replace these systems, as well as leverage new technologies to support our growth strategies. In addition, we have implemented enterprise-wide initiatives that are intended to standardize business processes and optimize performance. Any delays or difficulties in transitioning to new systems or integrating them with current systems or the failure to implement our initiatives in an orderly and timely fashion could result in additional investment of time and resources, which could impair our ability to improve existing operations and support future growth, and ultimately have a material adverse effect on our business.
The reliability and capacity of our information systems are critical. Despite preventative efforts, our systems are vulnerable from time-to-time to damage or interruption from, among other things, natural disasters, technical malfunctions, inadequate systems capacity, human error, power outages, computer viruses and security breaches. Any disruptions affecting our information systems could have a material adverse impact on our business. In addition, any failure to maintain adequate system security controls to protect our computer assets and sensitive data, including associate and client data, from unauthorized access, disclosure or use could damage our reputation with our associates and our clients. While we have implemented measures to prevent security breaches and cyber incidents, our preventative measures and incident response efforts may not be entirely effective. Finally, our ability to continue to operate our business without significant interruption in the event of a disaster or other disruption depends, in part, on the ability of our information systems to operate in accordance with our disaster recovery and business continuity plans.
13
Our reliance on information systems and other technology also gives rise to cybersecurity risks, including security breach, espionage, system disruption, theft and inadvertent release of information.
Our results of operations and financial condition may be adversely affected by global business, political, operational, financial and economic conditions.
We face business, political, operational, financial and economic risks inherent in international business, many of which are beyond our control, including:
|
•
|
trade restrictions, higher tariffs, currency fluctuations or the imposition of additional regulations relating to import or export of our products, especially in China, where all of our Turtle Beach products are manufactured, which could force us to seek alternate manufacturing sources or increase our expenses;
|
|
•
|
difficulties obtaining domestic and foreign export, import and other governmental approvals, permits and licenses, and compliance with foreign laws, which could halt, interrupt or delay our operations if we cannot obtain such approvals, permits and licenses;
|
|
•
|
difficulties encountered by our international distributors or us in staffing and managing foreign operations or international sales, including higher labor costs;
|
|
•
|
transportation delays and difficulties of managing international distribution channels;
|
|
•
|
longer payment cycles for, and greater difficulty collecting, accounts receivable,;
|
|
•
|
political and economic instability, including wars, terrorism, political unrest, boycotts, curtailment of trade and other business restrictions, any of which could materially and adversely affect our net sales and results of operations; and
|
|
•
|
natural disasters.
|
Any of these factors could reduce our net sales, decrease our gross margins, increase our expenses or reduce our profitability. Should we establish our own operations in international territories where we currently utilize a distributor, we will become subject to greater risks associated with operating outside of the United States.
The electronics industry in general has historically been characterized by a high degree of volatility and is subject to substantial and unpredictable variations resulting from changing business cycles. Our operating results will be subject to fluctuations based on general economic conditions, in particular conditions that impact discretionary consumer spending. The audio products sector of the electronics industry has and may continue to experience a slowdown in sales, which adversely impacts our ability to generate revenues and impacts the results of our future operations. A lack of available credit in financial markets may adversely affect the ability of our commercial customers to finance purchases and operations and could result in an absence of orders or spending for our products as well as create supplier disruptions. We are unable to predict the likely duration and severity of any adverse economic conditions and disruptions in financial markets and the effects they will have on our business and its financial condition.
Further, Turtle Beach products are manufactured in China and exported to the United States and worldwide. As a result of opposition to policies of the Chinese government and China’s growing trade surpluses with the United States, there has been, and in the future may be, opposition to the extension of normal trade relations (“NTR”) status for China. The loss of NTR status for China, changes in current tariff structures or adoption in the United States of other trade policies adverse to China could increase our manufacturing expenses and make it more difficult for us to manufacture our products in China.
If we fail to maintain an effective system of internal controls, we may not be able to accurately report financial results or prevent fraud, which could have an adverse effect on our business and financial condition.
Effective internal controls are necessary to provide reliable financial reports and to assist in the effective prevention of fraud. Any inability to provide reliable financial reports or prevent fraud could harm our business. The Sarbanes-Oxley Act requires, among other things, that we perform system and process evaluation and testing of our internal control over financial reporting to allow management and our independent registered public accounting firm to report on the effectiveness of our internal control over financial reporting. If we are not able to comply with the requirements of Section 404 of the Sarbanes-Oxley Act, or if we or our independent registered public accounting firm identifies deficiencies in our internal control over financial reporting that are deemed to be material weaknesses, investors could lose confidence in the accuracy and completeness of our financial reports, the market price of our common stock could decline and we could be subject to sanctions, investigations by NASDAQ, the SEC or other regulatory authorities, or shareholder litigation.
In addition, failure to maintain effective internal controls could result in financial statements that do not accurately reflect our financial condition or results of operations. There can be no assurance that we will be able to maintain a system of internal
14
controls that fully complies with the requirements of the Sarbanes-Oxley Act of 2002 or that our management and independent registered public accounting firm will continue to conclude that our internal controls are effective.
Risks Related to Liquidity
We depend upon the availability of capital under our revolving credit facility to finance our operations. Any additional financing that we may need may not be available on favorable terms or at all.
In addition to cash flow generated from sales, we finance our operations with a revolving credit facility, which we refer to as the “Credit Facility,” provided by Bank of America, N.A, (“BofA”,) as Agent, Sole Lead Arranger and Sole Bookrunner. If we are unable to comply with the restrictive and financial covenants contained in the Credit Facility, and are unable to obtain a waiver under the Credit Facility, BofA may declare the outstanding borrowings under the Credit Facility immediately due and payable. Such an event would have an immediate and material adverse impact on our business, results of operations and financial condition. We would be required to obtain additional financing from other sources, and we cannot predict whether or on what terms, if any, additional financing might be available. If we are required to seek additional financing and are unable to obtain it, we may have to change our business and capital expenditure plans, which may have a materially adverse effect on our business, financial condition and results of operations. In addition, the debt under the Credit Facility could make it more difficult to obtain other debt financing in the future, which could put us at a competitive disadvantage to competitors with less debt.
The Credit Facility contains financial and other covenants that we are obligated to maintain. If we violate any of these covenants, we will be in default under the Credit Facility. If a default occurs and is not timely cured or waived, BofA could seek remedies against us, including termination or suspension of obligations to make loans and issue letters of credit and acceleration of amounts due under the Credit Facility. No assurance can be given that we will be able to maintain compliance with these covenants in the future. The Credit Facility is asset based and can only be drawn down in an amount to which eligible collateral exists and can be negatively impacted by extended collection of accounts receivable, unexpectedly high product returns and slow moving inventory, among other factors. As of the date of this Report, we were in compliance with our covenants.
The Credit Facility provides our lenders with a first-priority lien against substantially all of our working capital assets, including trade accounts receivable, inventories, and intellectual property and contains certain restrictions on our ability to take certain actions.
The Credit Facility contains certain financial covenants and other restrictions that limit our ability, among other things, to incur certain additional indebtedness; pay dividends and repurchase stock; make certain investments and other payments; enter into certain mergers or consolidations; engage in sale and leaseback transactions and transactions with affiliates; and encumber and dispose of assets.
In addition, we have granted the lenders a first-priority lien against substantially all of our working capital assets, including trade accounts receivable, inventories and our intellectual property. Failure to comply with the operating restrictions or financial covenants in the Credit Facility could result in a default which could cause the lenders to accelerate the timing of payments and exercise their lien on substantially all of our working capital assets.
Risks Related to our Intellectual Property and other Legal and Regulatory Matters
Our competitive position will be seriously damaged if our products are found to infringe on the intellectual property rights of others.
Other companies and our competitors may currently own or obtain patents or other proprietary rights that might prevent, limit or interfere with our ability to make, use or sell our products. Although we do not believe that our products infringe the proprietary rights of any third parties, there can be no assurance that infringement or other legal claims will not be asserted against us or that we will not be found to infringe the intellectual property rights of others. The electronics industry is characterized by vigorous protection and pursuit of intellectual property rights or positions, resulting in significant and often protracted and expensive litigation. In the event of a successful claim of infringement against us and our failure or inability to license the infringed technology, our business and operating results could be adversely affected. Any litigation or claims, whether or not valid, could result in substantial costs or a diversion of our resources. An adverse result from intellectual property litigation could force us to do one or more of the following:
|
•
|
cease selling, incorporating or using products or services that incorporate the challenged intellectual property;
|
|
•
|
obtain a license from the holder of the infringed intellectual property right, which license may not be available on reasonable terms, if at all; and/or
|
15
|
•
|
redesign products or services that incorporate the disputed technology.
|
If we are forced to take any of the foregoing actions, we could face substantial costs and shipment delays and our business could be seriously harmed. Although we carry general liability insurance, our insurance may not cover potential claims of this type or may be inadequate to insure us for all liability that may be imposed.
In addition, it is possible that our customers or end users may seek indemnity from us in the event that our products are found or alleged to infringe the intellectual property rights of others. Any such claim for indemnity could result in substantial expenses to us that could harm our operating results.
If we are unable to obtain and maintain intellectual property rights and/or enforce those rights against third parties who are violating those rights, our business could suffer.
We rely on various intellectual property rights, including patents, trademarks, trade secrets and trade dress to protect our Turtle Beach brand name, reputation, product appearance and technology and our proprietary rights in our HyperSound technology. Although we have entered into confidentiality and invention assignment agreements with our employees and contractors, and nondisclosure agreements with selected parties with whom we conduct business to limit access to and disclosure of our proprietary information, these contractual arrangements and the other steps we have taken to protect our intellectual property may not prevent misappropriation of that intellectual property or deter independent third-party development of similar technologies. Monitoring the unauthorized use of proprietary technology and trademarks is costly, and any dispute or other litigation, regardless of outcome, may be costly and time consuming and may divert the attention of management and key personnel from our business operations. The steps taken by us may not prevent unauthorized use of proprietary technology or trademarks. Many features of our products are not protected by patents; and as a consequence, we may not have the legal right to prevent others from reverse engineering or otherwise copying and using these features in competitive products. If we fail to protect or to enforce our intellectual property rights successfully, our competitive position could suffer, which could adversely affect our financial results.
We are susceptible to counterfeiting of our products, which may harm our reputation for producing high-quality products and force us to incur expenses in enforcing our intellectual property rights. Such claims and lawsuits can be expensive to resolve, require substantial management time and resources, and may not provide a satisfactory or timely result, any of which may harm our results of operations. As some of our products are sold internationally, we are also dependent on the laws of a range of countries to protect and enforce our intellectual property rights. These laws may not protect intellectual property rights to the same extent or in the same manner as the laws of the United States.
Further, we are party to licenses that grant us rights to intellectual property, including trademarks, which are necessary or useful to our Turtle Beach business. For example, we license the right to market certain products with the trade names and imagery of brands such as Activision, Marvel and Major League Gaming. One or more of our licensors may allege that we have breached our license agreement with them, and seek to terminate our license. If successful, this could result in our loss of the right to use the licensed intellectual property, which could adversely affect our ability to commercialize our technologies or products, as well as harm our competitive business position and our business prospects.
Our success also depends in part on our ability to obtain and enforce intellectual property protection of our technology, particularly our patents. There is no guarantee any patent will issue on any patent application that we have filed or may file. Claims allowed from existing or pending patents may not be of sufficient scope or strength to protect the economic value of our technologies. Further, any patent that we may obtain will expire, and it is possible that it may be challenged, invalidated or circumvented. If we do not secure and maintain patent protection for our HyperSound technology and products, our competitive position could be significantly harmed. A competitor may independently develop or patent technologies that are substantially similar or superior to our HyperSound technology.
As we expand our HyperSound product line or develop new uses for our HyperSound technology, these products or uses may be outside the protection provided by our current patent applications and other intellectual property rights. In addition, if we develop new HyperSound products or enhancements to existing products we cannot assure you that we will be able to obtain patents to protect them. Even if we do receive patents for our existing or new HyperSound products, these patents may not provide meaningful protection, or may be too costly to enforce protection. In some countries outside of the United States where our HyperSound products may be sold or our HyperSound technology may be licensed, patent protection is not available. Moreover, some countries that do allow for the registration of patents do not provide meaningful redress for violations of patents. As a result, protecting intellectual property in these countries is difficult and our competitors may successfully sell products in these countries that have functions and features that infringe on our intellectual property.
We may initiate claims or litigation against third parties in the future for infringement of our proprietary rights or to determine the scope and validity of our proprietary rights or the proprietary rights of our competitors. These claims could result in costly litigation and divert the efforts of our technical and management personnel. As a result, our operating results could suffer and our financial condition could be harmed.
16
We are dependent upon third-party intellectual property to manufacture some of our products.
As a third-party gaming headset company, the technology used in next generation consoles, such as integrated voice and chat audio from the Xbox One, require that we obtain a license to ensure that our products are compatible with the consoles.
While we currently believe that we have the necessary licenses, or can obtain the necessary licenses, in order to produce compatible products, there is no guarantee that our licenses will be renewed or granted in the first instance. Moreover, if these first parties enter into license agreements with companies other than us for their “closed systems” or if we are unable to obtain sufficient quantities of these headset adapters or chips, we would be placed at a substantial competitive disadvantage.
Our HyperSound technology is subject to government regulation, which could lead to unanticipated expenses and/or enforcement action against us.
Under the Radiation Control for Health and Safety Act of 1968, and the associated regulations promulgated by the Food and Drug Administration (“FDA”), HyperSound technology is regulated as an electrical emitter of ultrasonic vibrations. Under the terms of such regulations, in August 2012 we provided an abbreviated report to the FDA describing the technology. The FDA may respond to the report and request changes or safeguards to the technology, but it has not done so to date. We also are required to notify the FDA in writing should a product be found to have a defect relating to safety of use due to the emission of electronic product radiation. We do not believe our technology poses any human health risks. However, it is possible that we, or one of our customers, could be required to modify the technology, or a product incorporating the technology, to comply with requirements that may be imposed by the FDA. Our HyperSound technology is also regulated by the Federal Communications Commission (the “FCC”).
Our HyperSound technology when sold specifically for hearing aid use is also regulated by the FDA as a medical device pursuant to the Federal Food, Drug, and Cosmetic Act, or FDCA, and implementing regulations. Our HyperSound hearing aid product has received 510(k) clearance permitting over‑the‑counter (“OTC”) commercial distribution for this use. The 510(k) provision of the FDCA allows medical devices to obtain permission for commercial distribution based upon “substantial equivalence” to one or more devices already legally on the market with such clearance or certain grandfather status. Recently, FDA exempted this type of device from the 510(k) requirement. Therefore, we may modify it in the future without seeking additional 510(k) clearance, provided that we do not alter the medical purpose for which it is sold or incorporate a fundamentally different scientific technology, either of which would require a new 510(k) clearance.
We continue to be subject to FDA’s requirements for marketed medical devices, such as the Quality System Regulation, or QSR (which imposes procedural, documentation and record keeping requirements); the Medical Device Reporting regulation (which requires that manufacturers report to the FDA if their device may have caused or contributed to a death or serious injury or malfunctioned in a way that would likely cause or contribute to a death or serious injury if it were to recur); and the Reports of Corrections and Removals regulation (which requires manufacturers to report recalls and field actions to the FDA if initiated to reduce a risk to health posed by the device or to remedy a violation of the FDCA that may pose a risk to health). FDA enforces these requirements by inspection and market surveillance. If the FDA finds a violation, it can institute a wide range of enforcement actions, ranging from a public warning letter to more severe sanctions such as fines, penalties, suspension or withdrawal of regulatory approvals, product recalls, seizure of products, operating restrictions or total shutdown of production, and criminal prosecution.
Even if not subject to enforcement sanctions, we could incur unanticipated expenses in order to comply with any of these governmental regulations or to remedy a failure to comply, which could adversely affect our results of operations. For example, in the event of unanticipated defects in our HyperSound products, we may be required to comply with governmental requirements to remedy the defect and/or notify consumers of the problem. This eventuality could lead to unanticipated expense, and possible product liability litigation against a customer or us.
To market HyperSound products internationally, we must establish and comply with numerous and varying governmental requirements of other countries regarding safety and effectiveness. The time and expense required to obtain approval in other countries might differ from that required to obtain FDA clearance. It may be costly for us to comply with applicable postmarket regulation in each country where we do business. If we fail to do so, we may be subject to fines, suspension or withdrawal of regulatory approvals, product recalls, seizure of products, operating restrictions or total shutdown of production, and criminal prosecution.
Changes in laws or regulations or the manner of their interpretation or enforcement could adversely impact our financial performance and restrict our ability to operate our business or execute our strategies.
New laws or regulations, or changes in existing laws or regulations or the manner of their interpretation or enforcement, may create uncertainty for public companies, increase our cost of doing business and restrict our ability to operate our business or execute our strategies. This could include, among other things, compliance costs and enforcement under the Dodd-Frank Wall Street Reform and Consumer Protection Act. For example, under Section 1502 of the Dodd-Frank Act, the SEC has
17
adopted additional disclosure requirements related to the source of certain “conflict minerals” for issuers for which such “conflict minerals” are necessary to the functionality or production of a product manufactured, or contracted to be manufactured, by that issuer. The metals covered by the rules include tin, tantalum, tungsten and gold. Our suppliers may use some or all of these materials in their production processes. The rules require us to conduct a reasonable country of origin inquiry to determine if we know or have reason to believe any of the minerals used in the production process may have originated from the Democratic Republic of the Congo or an adjoining country. If we are not able to determine the minerals did not originate from a covered country or conclude that there is no reason to believe that the minerals used in the production process may have originated in a covered country, we would be required to perform supply chain due diligence on members of our supply chain. Global supply chains can have multiple layers, thus the costs of complying with these new requirements could be substantial. These new requirements may also reduce the number of suppliers who provide conflict free metals, and may affect our ability to obtain products in sufficient quantities or at competitive prices. Compliance costs such as these could have a material adverse effect on our results of operations.
We continually evaluate and monitor developments with respect to new and proposed laws, regulations, standards and rules and cannot predict or estimate the amount of the additional costs we may incur or the timing of such costs. Any such new or changed laws, regulations, standards and rules may be subject to varying interpretations and as a result, their application in practice may evolve over time as new guidance is provided by regulatory and governing bodies. This could result in continuing uncertainty regarding compliance matters and higher costs necessitated by ongoing revisions to disclosure and governance practices. We are committed to maintaining high standards of corporate governance and public disclosure. If our efforts to comply with new or changed laws, regulations and standards differ from the activities intended by regulatory or governing bodies due to ambiguities related to practice, regulatory authorities may initiate legal proceedings against us and we may be harmed.
We are subject to various environmental laws and regulations that could impose substantial costs on us and may adversely affect our business, operating results and financial condition.
Our operations and some of our products are regulated under various federal, state, local and international environmental laws. In addition, regulatory bodies in many of the jurisdictions in which we operate propose, enact and amend environmental laws and regulations on a regular basis. The environmental laws and regulations applying to our business include those governing the discharge of pollutants into the air and water, the management, disposal and labeling of, and exposure to, hazardous substances and wastes and the cleanup of contaminated sites. If we were to violate or become liable under these environmental laws, we could be required to incur additional costs to comply with such regulations and may incur fines and civil or criminal sanctions, third-party property damage or personal injury claims, or could be required to incur substantial investigation or remediation costs. Liability under environmental laws may be joint and several and without regard to comparative fault. The ultimate costs under environmental laws and the timing of these costs are difficult to predict. Although we cannot predict the ultimate impact of any new environmental laws and regulations, such laws may result in additional costs or decreased revenue, and could require that we redesign or change how we manufacture our products, any of which could have a material adverse effect on our business. Additionally, to the extent that our competitors choose not to abide by these environmental laws and regulations, we may be at a cost disadvantage, thereby hindering our ability to effectively compete in the marketplace.
Failure to comply with the U.S. Foreign Corrupt Practices Act or other applicable anti-corruption legislation could result in fines, criminal penalties and an adverse effect on our business.
We operate in 44 countries, including countries known to have a reputation for corruption. We are committed to doing business in accordance with applicable anti-corruption laws. We are subject, however, to the risk that our officers, directors, employees, agents and collaborators may take action determined to be in violation of such anti-corruption laws, including the U.S. Foreign Corrupt Practices Act of 1977, the U.K. Bribery Act 2010 and the European Union Anti-Corruption Act, or that subjects us to trade sanctions administered by the Office of Foreign Assets Control and the U.S. Department of Commerce. Any such violation could result in substantial fines, sanctions, civil and/or criminal penalties or curtailment of operations in certain jurisdictions, and might adversely affect our results of operations. In addition, actual or alleged violations could damage our reputation and ability to do business.
Risks Related to the Merger
The success of the Merger will depend, in large part, on our ability to realize the anticipated benefits from combining the HyperSound business and Turtle Beach business, and in the near-term will result in additional costs as we devote significant time and resources to integration and compliance with public company regulations.
The Merger involved the integration of two companies that previously operated independently with operating offices in two distinct locations. The failure to integrate successfully or to manage successfully the challenges presented by the
18
integration process may result in the combined company’s failure to achieve some or all of the anticipated benefits.
If we are able to integrate the business operations successfully, there can be no assurance that this integration will result in the realization of the full benefits of the anticipated synergies, innovation and operational efficiencies that may be possible from this integration and that these benefits will be achieved within a reasonable period of time.
Further, prior to the merger, VTB Holdings, Inc., which operated the Turtle Beach business and was the accounting acquirer in the merger, operated as a private company. The Sarbanes-Oxley Act of 2002, the Dodd-Frank Wall Street Reform and Consumer Protection Act as well as rules implemented by the SEC and the NASDAQ Stock Market impose various requirements on public companies, including those related to corporate governance practices. Our management and other personnel have devoted and will need to devote in the future a substantial amount of time to these requirements. Certain members of our management do not have significant experience in addressing these requirements. In addition, certain of our directors have limited experience serving on the boards of public companies. Moreover, these rules and regulations will increase our legal and financial compliance costs relative to those of Turtle Beach prior to the Merger and will make some business activities more time consuming and costly.
We are subject to, and could become subject to in the future, stockholder litigation associated with the Merger, which could harm our business, financial condition and operating results.
Stockholders of companies involved in mergers may at times initiate litigation alleging, among other things, improprieties in the manner in which mergers or dispositions of business units were approved or executed. We have had, and may continue to have, actions brought against us by stockholders in connection with the merger, past transactions, changes in our stock price or other matters. Any such claims, whether or not resolved in our favor, could divert our management and other resources from the operation of our business and otherwise result in unexpected and substantial expenses that would adversely and materially impact our business, financial condition and operating results. For example, and as further described in Item 3, “Legal Proceedings” and Note
14
, “Commitments and Contingencies,” we are involved in legal proceedings related to the merger involving certain of our stockholders, including the holder of VTBH’s Series B Redeemable Preferred Stock, or the Series B Holder, filing a complaint in Delaware Chancery Court alleging breach of contract against VTBH and requesting a declaratory judgment that he is entitled to damages, including the redemption of his stock. The redemption value of VTBH’s Series B Redeemable Preferred Stock was
$14.9 million
as of
December 31, 2014
.
Risks Related to Ownership of our Common Stock
Ownership of our common stock is highly concentrated, and we are a “controlled company” within the meaning of the corporate governance standards of NASDAQ and, as a result, qualify for, and rely on, exemptions from certain corporate governance requirements.
Certain Turtle Beach stockholders acting as a group beneficially own or control approximately 72.6% of our common stock. Accordingly, these stockholders, acting as a group pursuant to a stockholder agreement, have substantial influence over the outcome of our corporate actions requiring stockholder approval, including the election of directors, any merger, consolidation or sale of all or substantially all of our assets or any other significant corporate transaction. These stockholders also may exert influence in delaying or preventing a change in control of the Company, even if such change in control would benefit our other stockholders. In addition, the significant concentration of stock ownership may affect adversely the market value of our common stock due to investors’ perception that such conflicts of interest may exist or arise.
Additionally, we have elected to be treated as a “controlled company” under NASDAQ rules. A “controlled company” under NASDAQ rules is a listed company more than 50% of the voting power of which is held by an individual, a group or another company (and which elects to be treated as a “controlled company”). Certain stockholders of Turtle Beach constitute a group controlling more than 50% of the voting power of our voting stock. As a “controlled company,” we are permitted to, and have, opted out of certain NASDAQ rules that would otherwise require (i) a majority of the members of our board to be independent, (ii) that our compensation committee be comprised entirely of independent directors and (iii) that we establish a nominating and governance committee comprised entirely of independent directors, or otherwise ensure that director nominees are determined or recommended to our board by the independent members of our board. Accordingly, our stockholders may not have the same protections afforded to stockholders of companies that are subject to all of the corporate governance requirements of NASDAQ.
None.
19
The table below describes our principal facilities as of
December 31, 2014
.
|
Location
|
State or Country
|
Principal Business Activity
|
Approx. Square Feet
|
Owned or Expiration Date of Lease
|
|
|
Valhalla
|
NY
|
Administration
|
21,000
|
|
2019
|
|
San Diego
|
CA
|
Administration
|
10,000
|
|
2015
|
|
Basingstoke
|
U.K.
|
Administration
|
6,850
|
|
2021
|
|
Poway
|
CA
|
HyperSound
|
9,650
|
|
2015
|
|
San Jose
|
CA
|
Research & Development
|
3,500
|
|
2015
|
|
Elmsford
|
NY
|
Warehouse
|
6,200
|
|
2016
|
|
Darlington
|
U.K.
|
Warehouse
|
120,000
|
|
2018
|
In January 2015, we entered into a 5 year lease that will commence in May 2015 for an aggregate of approximately 35,000 square feet of office space in San Diego, California, that will consolidate our San Diego and Poway, California locations. The new lease will provide sufficient growth to support the HyperSound business. The initial base rent of $1.0 million per year is subject to a 3% annual increase.
The Company is subject to various legal proceedings and claims that arise in the ordinary course of its business. Although the amount of any liability that could arise with respect to these actions cannot be determined with certainty, in the Company’s opinion, any such liability will not have a material adverse effect on its consolidated financial position, consolidated results of operations or liquidity.
On August 5, 2013, VTBH and the Company (f/k/a Parametric) announced that they had entered into the Merger Agreement pursuant to which VTBH would acquire an approximately
80%
ownership interest and existing shareholders would maintain an approximately
20%
ownership interest in the Company. Following the announcement, several shareholders filed class action lawsuits in California and Nevada seeking to enjoin the Merger. The plaintiffs in each case alleged that members of the Company’s Board of Directors breached their fiduciary duties to the shareholders by agreeing to a Merger that allegedly undervalued the Company. VTBH and the Company were named as a defendant in these lawsuits under the theory that they had aided and abetted Company's Board of Directors in allegedly violating their fiduciary duties. The plaintiffs in both cases sought a preliminary injunction seeking to enjoin closing of the Merger, which by agreement was heard by the Nevada court with the California plaintiffs invited to participate. On December 26, 2013, the court in the Nevada cases denied the plaintiffs’ motion for a preliminary injunction. Following the closing of the Merger, the Nevada plaintiffs filed a second amended complaint, which made essentially the same allegations and seeks monetary damages as well as an order rescinding the Merger. The California plaintiffs dismissed their action without prejudice, and sought to intervene in the Nevada action, which was granted. Subsequent to the intervention, the plaintiffs filed a third amended complaint, which made essentially the same allegations as prior complaints and seeks monetary damages. On June 20, 2014, VTBH and the Company moved to dismiss the action, but that motion was denied on August 28, 2014. That denial is currently under review by the Nevada Supreme Court and a briefing was completed on February 23, 2015. The Company believes that the plaintiffs’ claims are without merit and intends to vigorously defend itself in the litigation. As of
December 31, 2014
and the date of this Report, the Company is unable to estimate a possible loss or range of possible loss in regards to this matter; therefore, no litigation reserve has been recorded in the consolidated financial statements.
On February 18, 2015, Dr. John Bonanno, a minority shareholder of VTBH, filed a complaint in Delaware Chancery Court alleging breach of contract against VTBH. According to the complaint, the Merger purportedly triggered a contractual obligation for VTBH to redeem Dr. Bonanno's stock. Dr. Bonanno requests a declaratory judgment stating that he is entitled damages including a redemption of his stock for the redemption value of $15.1 million (equal to the original issue price of his stock plus accrued dividends) as well as other costs and expenses. VTBH maintains that the Merger did not trigger any obligation to redeem Mr. Bonanno's stock and VTBH intends to vigorously defend itself in the litigation.
Not applicable.
20
The Company's stock is traded on NASDAQ under the symbol “HEAR” and prior to April 14, 2014 traded under the symbol “PAMT.” The following table sets forth the high and low sale prices per share of our common stock on the NASDAQ for the period indicated:
|
Market Price
|
|||||||
|
High
|
Low
|
||||||
|
Fiscal Year 2014
|
|||||||
|
First Quarter
|
$
|
16.36
|
|
$
|
11.82
|
|
|
|
Second Quarter
|
14.75
|
|
7.58
|
|
|||
|
Third Quarter
|
9.67
|
|
6.54
|
|
|||
|
Fourth Quarter
|
7.62
|
|
2.75
|
|
|||
|
High
|
Low
|
||||||
|
Fiscal Year 2013
|
|||||||
|
First Quarter
|
$
|
20.25
|
|
$
|
7.10
|
|
|
|
Second Quarter
|
22.39
|
|
14.15
|
|
|||
|
Third Quarter
|
17.90
|
|
10.57
|
|
|||
|
Fourth Quarter
|
16.70
|
|
10.21
|
|
|||
The closing price of our common stock on February 28, 2015 was $2.36 per share. The number of holders of record of common stock at February 28, 2015 was 960.
Stock Performance Graph
Notwithstanding any statement to the contrary in any of our previous or future filings with the SEC, the following information relating to the price performance of our common stock shall not be deemed to be “filed” with the SEC for purposes of Section 18 of the Securities Exchange Act of 1934, as amended (the “Exchange Act”), to be “soliciting material” or subject to Rule 14A of the Exchange Act, or to be incorporated by reference into any of our filings under the Securities Act of 1933, as amended (the “Securities Act”) or the Exchange Act whether made before or after the date of this Report, except to the extent we specifically incorporate it by reference into such filing.
The following graph shows a comparison from November 15, 2010 (the date our common stock commenced trading on NASDAQ) through December 31, 2014 of the cumulative total return assuming a $100 investment in our common stock, the S&P 500 Index and the S&P 500 Consumer Durables Index. In accordance with the rules of the Securities and Exchange Commission, the returns are indexed to a value of $100 at October 31, 2010 and assume that all dividends, if any, were reinvested. The comparisons in this graph below are based on historical data and are not intended to forecast or be indicative of future performance of our common stock.
21
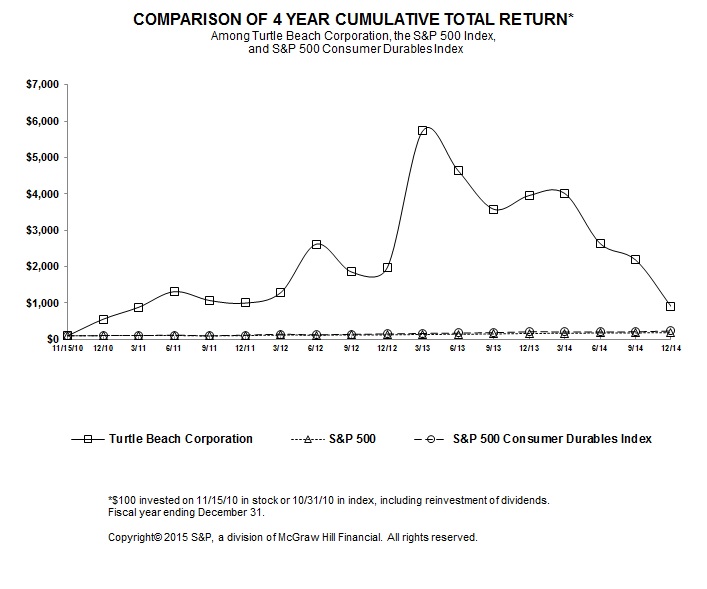
Dividend Policy
We have not paid regular cash dividends on our common stock and do not anticipate paying cash dividends in the foreseeable future. Any future determination to pay cash dividends will be at the discretion of our board of directors and will depend on our financial condition, operating results, capital requirements and such other factors as our board of directors deems relevant.
Unregistered Sale of Equity Securities and Issuer Purchases of Equity Securities
We did not sell any unregistered equity securities or purchase any of our securities during the period ended December 31, 2014.
Securities Authorized for Issuance under Equity Compensation Plans
See Part III, Item 12 of this annual report for disclosure relating to our equity compensation plans. Such information will be included in our Proxy Statement, which is incorporated herein by reference.
22
As a result of the “reverse acquisition” the financial statements of VTB Holdings, Inc. (“VTBH”) representing the Turtle Beach headset business, are treated as our historical financial statements, with the results of the acquired HyperSound business included from January 15, 2014. The following table sets forth selected consolidated financial data for each of the five years ended
December 31, 2014
. This selected financial data should be read in conjunction with “Management’s Discussion and Analysis of Financial Condition and Results of Operations” and the consolidated financial statements and the notes thereto included in this Report.
|
Year Ended December 31,
|
|||||||||||||||||||
|
|
2014
(1)
|
2013
|
2012
|
2011
|
2010
|
||||||||||||||
|
(in thousands, except per share data)
|
|||||||||||||||||||
|
Net Revenue
|
$
|
186,176
|
|
$
|
178,470
|
|
$
|
207,136
|
|
$
|
166,121
|
|
$
|
91,870
|
|
||||
|
Cost of Revenue
|
135,509
|
|
128,141
|
|
132,795
|
|
96,536
|
|
50,556
|
|
|||||||||
|
Gross Profit
|
50,667
|
|
50,329
|
|
74,341
|
|
69,585
|
|
41,314
|
|
|||||||||
|
Gross Margin
|
27.2
|
%
|
28.2
|
%
|
35.9
|
%
|
41.9
|
%
|
45.0
|
%
|
|||||||||
|
Operating income (loss)
|
(13,825
|
)
|
1,598
|
|
42,910
|
|
38,268
|
|
18,287
|
|
|||||||||
|
Operating Margin
|
(7.4
|
)%
|
0.9
|
%
|
20.7
|
%
|
23.0
|
%
|
19.9
|
%
|
|||||||||
|
Net income (loss)
|
$
|
(15,486
|
)
|
$
|
(6,163
|
)
|
$
|
26,460
|
|
$
|
21,554
|
|
$
|
10,122
|
|
||||
|
Net earnings (loss) per share:
|
|||||||||||||||||||
|
Basic
|
$
|
(0.39
|
)
|
$
|
(0.49
|
)
|
$
|
0.13
|
|
$
|
1.70
|
|
$
|
0.80
|
|
||||
|
Diluted
|
$
|
(0.39
|
)
|
$
|
(0.49
|
)
|
$
|
0.13
|
|
$
|
1.70
|
|
$
|
0.80
|
|
||||
|
Weighted average number of shares:
|
|||||||||||||||||||
|
Basic
|
39,665
|
|
12,700
|
|
12,700
|
|
12,700
|
|
12,700
|
|
|||||||||
|
Diluted
|
39,665
|
|
12,700
|
|
12,700
|
|
12,700
|
|
12,700
|
|
|||||||||
|
Balance Sheet Data
|
|||||||||||||||||||
|
Cash and cash equivalents
|
7,908
|
|
6,509
|
|
5,219
|
|
15,942
|
|
7,990
|
|
|||||||||
|
Total Assets
|
246,968
|
|
127,307
|
|
134,195
|
|
105,165
|
|
57,143
|
|
|||||||||
|
Total Debt
|
44,555
|
|
64,578
|
|
74,250
|
|
37,200
|
|
28,000
|
|
|||||||||
|
Series B Redeemable Preferred Stock
|
14,916
|
|
13,713
|
|
12,703
|
|
13,648
|
|
12,637
|
|
|||||||||
|
Series A Convertible Preferred Stock
|
—
|
|
24,345
|
|
24,345
|
|
24,345
|
|
24,345
|
|
|||||||||
(1) In 2014, we completed the Merger with Parametric, which contributed revenue of $0.7 million in the year and $129.1 million of total assets on date of the merger.
23
The following discussion should be read in conjunction with our consolidated financial statements and the notes thereto. This discussion summarizes the significant factors affecting our results of operations and the financial condition of our business during each of the fiscal years in the three-year period ended
December 31, 2014
.
The Merger (the “Merger”) between VTB Holdings, Inc. (“VTBH”) and Parametric Sound Corporation (“Parametric”) was treated as a “reverse acquisition” with VTBH considered the accounting acquirer. Accordingly, VTBH's historical results of operations on a stand-alone basis replace Parametric’s historical results of operations for all periods on or prior to January 15, 2014, and for all periods following the Merger, the results of operations of both companies have been included.
General
Turtle Beach Corporation is a premier audio innovation company with deep expertise and relevant experience in developing, commercializing and marketing audio technologies across a range of large addressable markets under the Turtle Beach® and HyperSound® brands. Turtle Beach is a worldwide leading provider of feature-rich headset solutions for use across multiple platforms, including video game and entertainment consoles, handheld consoles, personal computers, tablets and mobile devices. HyperSound is an innovative patent-protected sound delivery technology that delivers immersive, directional audio offering unique potential benefits in a variety of commercial settings and consumer devices, including improved clarity and comprehension for listeners with hearing loss.
Management Overview
During 2014, the next generation console launches began to transform the surrounding console gaming market. The performance of our next generation console gaming headsets was partially offset by softer than expected sales of previous generation headsets, as the active user bases for Xbox 360 and Playstation®3 (the “previous generation consoles”) continued to decline at a faster pace than initially projected.
In addition, multi-player games have historically been the major driver of gaming headset sales and entering the year there was a strong line up of multi-player games expected to launch that created an expectation of higher attach rates (defined as a headset sale during the year divided by the active installed base of each console platform). However, attach rate expectations were lower than expected through most of the year due to the expected widespread availability of a standalone Microsoft adapter which essentially enabled consumers to utilize previous generation headsets with the Xbox One, delays in the launch of several multi-player gaming titles, and increased attach rates on Sony Playstation®4 but not the extent forecasted. First party gaming headset sales took higher share than expected, in some cases driven by unexpected price reductions on those headsets. Significant price discounting by several competitors also created additional headwinds for certain of our headset products as we chose not to compete on price to protect our brand value and margins.
While industry conditions proved to be more challenging than expected, we were able to grow our business year-over-year and accomplish our key strategic and product objectives including the successful launch of additional products for the next generation consoles. Net revenues increased
$7.7 million
, or
4.3%
, on strong consumer response to our new Xbox One and PlayStation®4 (the “next generation consoles”) compatible headsets, as we developed headsets that included many new and unique features including DTS Headphone:X, full wireless integration with Xbox One, and Superhuman Hearing™. With the release of the Elite 800 for the Playstation®4 and the Stealth 500X for the Xbox One, we have also reentered the high-tier gaming headset market above $200, where we have been largely absent with new models since early 2013 due to the console transition.
Gross profit as a percentage of net revenue, which decreased to
27.2%
from
28.2%
in the prior year, was negatively impacted by several items. We incurred
$2.5 million
of incremental shipping and handling costs in order to accommodate a delay in the release of the Microsoft Xbox One Headset Chat Adapter (which was required to be packed with our first three Xbox One models). In addition, West Coast port issues steadily worsened as the fourth quarter progressed, which resulted in unexpected delays as products were held up in the port. We sought to mitigate these delays by shifting to air freight and expedited ground shipments, resulting in approximately $1.5 million in incremental costs. Excluding the costs related to the Xbox One chat adapter, the incremental air freight and expedited ground costs, and $1.5 million associated with the write-off of certain legacy contracts, gross profit as a percentage of net revenue would have been
30.2%
.
24
For 2014, our reported net loss increased to
$15.5 million
driven largely by our investment in the HyperSound business, incremental shipping and handling costs and certain initial costs to be a public company. Diluted net loss per share of
$0.39
was up
20.4%
compared to the prior year diluted net loss per share of
$0.49
.
In 2015, we anticipate headset attach rates for the Xbox One and Playstation®4 platforms will accelerate from current levels based on continued strong next generation console sales. However, we also anticipate a continued decline of previous generation console headset sales. Given the positive progress in the early commercial deployments of HyperSound and in our product development and market testing for our new HyperSound hearing healthcare product, we see a strong opportunity to create new revenues outside of gaming headsets.
Key Performance Indicators and Non-GAAP Measures
Management routinely reviews key performance indicators including revenue, operating income and margins, earnings per share, among others. In addition, we consider other certain measures to be useful to management and investors evaluating our operating performance for the periods presented, and believe these additional measures provide a tool for evaluating our ongoing operations, liquidity and management of assets. These metrics, however, are not measures of financial performance under accounting principles generally accepted in the United States of America (“GAAP”) and should not be considered a substitute for net income (loss) or other consolidated income statement data as determined in accordance with GAAP. These other measures may not be comparable to similarly titled measures employed by other companies. We consider the following non-GAAP measure, which may not be comparable to similarly titled measures reported by other companies, to be key performance indicators:
Adjusted EBITDA
“Adjusted EBITDA” represents net income (loss) before interest, taxes, depreciation and amortization, stock-based compensation (non-cash), non-cash amortization of payments to founders and certain business transaction expenses and restructuring charges. Management adjusts net income (loss) for business transaction costs because it believes that such items are not representative of core operations. For the year ended
December 31, 2014
, business transaction costs consisted of acquisition-related costs in the amount of
$3.7 million
related to the Merger. The years ended
December 31, 2013
and
2012
included
$3.9 million
and
$0.3 million
, respectively, in merger-related business transaction costs.
We believe Adjusted EBITDA provides useful information to investors about us and our financial condition and results of operations for the following reasons: (i) it is one of the measures used by our board of directors and management team to evaluate our operating performance; (ii) it is one of the measures used by our management team to make day-to-day operating decisions; (iii) the adjustments made in our calculation of Adjusted EBITDA (business transaction costs, payments to our founders, and stock-based compensation) are often viewed as either non-recurring or not reflective of ongoing financial performance or have no cash impact on operations; and (iv) it is used by securities analysts, investors and other interested parties as a common operating performance measure to compare results across companies in our industry by backing out potential differences caused by variations in capital structures (affecting relative interest expense), and the age and book value of facilities and equipment (affecting relative depreciation and amortization expense).
Adjusted EBITDA has limitations as an analytical tool, and when assessing our operating performance, it should not be considered in isolation or as a substitute for net income (loss) or other consolidated income statement data. Some of these limitations include, but are not limited to:
• Adjusted EBITDA does not reflect changes in, or cash requirements for, our working capital needs;
• Adjusted EBITDA does not reflect interest expense, or the cash requirements necessary to service interest or principal payments, on our debt;
• Adjusted EBITDA does not reflect income taxes or the cash requirements for any tax payments; and
• Other companies may calculate Adjusted EBITDA differently than we do, limiting its usefulness as a comparative measure.
25
Adjusted EBITDA (and a reconciliation to
Net income (loss)
, the nearest GAAP financial measure) for the years ended
December 31, 2014
,
2013
and
2012
are as follows:
|
Year Ended
|
||||||||||||
|
December 31,
|
||||||||||||
|
2014
|
|
2013
|
2012
|
|||||||||
|
(in thousands)
|
||||||||||||
|
Net income (loss)
|
$
|
(15,486
|
)
|
$
|
(6,163
|
)
|
$
|
26,460
|
|
|||
|
Interest expense
|
7,209
|
|
6,626
|
|
4,738
|
|
||||||
|
Depreciation and amortization
|
6,866
|
|
5,345
|
|
2,606
|
|
||||||
|
Stock-based compensation
|
5,194
|
|
2,563
|
|
985
|
|
||||||
|
Income tax expense (benefit)
|
(6,272
|
)
|
1,090
|
|
14,008
|
|
||||||
|
Business transaction costs
|
3,744
|
|
3,864
|
|
342
|
|
||||||
|
Restructuring charges
|
747
|
|
—
|
|
—
|
|
||||||
|
Payments to founders
|
—
|
|
527
|
|
527
|
|
||||||
|
Gain on bargain purchase from acquisition
|
—
|
|
—
|
|
(2,303
|
)
|
||||||
|
Adjusted EBITDA
|
$
|
2,002
|
|
$
|
13,852
|
|
$
|
47,363
|
|
|||
Adjusted EBITDA decreased for the year ended
December 31, 2014
as compared to the year ended
December 31, 2013
driven largely by our investment in the HyperSound business and an increased net loss reflecting the negative impact of costs to package the Microsoft Xbox One Headset Chat Adapter with our headsets and ship them to retailers, increased air freight usage to ensure certain new headsets were in the market for the holiday and in response to the labor uncertainty at the West Coast ports, and initial costs to support being a public company.
|
(in thousands)
|
|||
|
2013 Adj EBITDA
|
$
|
13,852
|
|
|
HyperSound Investment
|
(10,011
|
)
|
|
|
Public Company Costs
|
(3,249
|
)
|
|
|
Microsoft Adapter Delay Logistic Costs
|
(2,518
|
)
|
|
|
Extraordinary Air Freight
|
(3,419
|
)
|
|
|
Legacy Contracts Write-off
|
(1,550
|
)
|
|
|
Headset Organic Revenue Growth
|
2,114
|
|
|
|
Headset Margin Improvement
|
3,569
|
|
|
|
Other
|
3,214
|
|
|
|
2014 Adj EBITDA
|
$
|
2,002
|
|
Adjusted EBITDA decreased for the year ended December 31, 2013 as compared to the year ended December 31, 2012 primarily due to lower revenues and mix of business ahead of the Xbox One and PlayStation®4 console roll-outs, increased marketing expenses in connection with the console roll-outs, investments to drive growth in international markets following the acquisition of TB Europe and increased investment in research and development.
26
Results of Operations
The following table sets forth the Company’s statements of operations for the periods presented:
|
|
Year Ended
|
||||||||||
|
December 31,
|
|||||||||||
|
|
2014
|
2013
|
2012
|
||||||||
|
(in thousands)
|
|||||||||||
|
Net Revenue
|
$
|
186,176
|
|
$
|
178,470
|
|
$
|
207,136
|
|
||
|
Cost of Revenue
|
135,509
|
|
128,141
|
|
132,795
|
|
|||||
|
Gross Profit
|
50,667
|
|
50,329
|
|
74,341
|
|
|||||
|
Operating expenses
|
64,492
|
|
48,731
|
|
31,431
|
|
|||||
|
Operating income (loss)
|
(13,825
|
)
|
1,598
|
|
42,910
|
|
|||||
|
Interest expense
|
7,209
|
|
6,626
|
|
4,738
|
|
|||||
|
Other non-operating expense, net
|
724
|
|
45
|
|
7
|
|
|||||
|
Gain on bargain purchase from acquisition
|
—
|
|
—
|
|
(2,303
|
)
|
|||||
|
Earnings (Loss) before income tax expense (benefit)
|
(21,758
|
)
|
(5,073
|
)
|
40,468
|
|
|||||
|
Income tax expense (benefit)
|
(6,272
|
)
|
1,090
|
|
14,008
|
|
|||||
|
Net income (loss)
|
$
|
(15,486
|
)
|
$
|
(6,163
|
)
|
$
|
26,460
|
|
||
Net Revenue
Comparison of Fiscal Years
2014
and
2013
In spite of challenging overall market conditions that included a rapid decline in active user bases for Xbox 360 and PlayStation®3 and a more promotional environment, net revenues for year ended
December 31, 2014
increased
$7.7 million
, or
4.3%
, compared to the prior year on the strength of our next generation headset portfolio and the expansion of our international headset business with strong growth in several markets, including a
11.3%
increase in the United Kingdom business and
29.7%
in Europe, as well as the initial sales of our Xbox One headsets in China. Domestic sales increased
5.6%
on strong consumer response to our new more advanced headsets. These gains were offset in part by a decline in sales to our Canadian distributor as Fiscal 2013 included incremental initial stock orders.
Our strategy to deliver innovative headsets across all price points drove a 6.6% increase in total Xbox compatible headsets sales as next generation console headsets bolstered by the launch of the XO FOUR, XO SEVEN, XO ONE and Stealth 500X outpaced the decline in previous generation headset sales. Sales of PlayStation® compatible headsets remained steady through the console transition on continued positive consumer reaction to the PX22 headset and the release of the ELITE 800, Stealth 500P, Ear Force Stealth 400 and P12 headsets.
Comparison of Fiscal Years
2013
and
2012
Net revenue for the year ended December 31, 2013 totaled
$178.5 million
, representing a decrease of 13.8%, compared to $207.1 million for the year ended December 31, 2012. This decrease was primarily due to the decline in headset purchases for the previous generation consoles and a shift to lower-priced models ahead of the next generation console roll-outs in November 2013 as consumers deferred purchases until the new consoles were released. In addition, Microsoft delayed the release of hardware and software required to make headsets functional with the Xbox One, shifting Xbox One headset purchases out of the fourth quarter of 2013 and into the first half of 2014.
Cost of Revenue and Gross Profit
For the year ended
December 31, 2014
, gross profit as a percentage of net revenue decreased to
27.2%
from
28.2%
in the prior year. In 2014, gross profit as a percentage of net revenue was negatively impacted by
$2.5 million
of incremental shipping and handling costs related to the Microsoft Xbox One Headset Chat Adapter necessary to have our headsets in retail stores for when Microsoft turned on gaming headset audio which had been delayed at the product launch and
$3.4 million
of incremental air freight costs to get certain new products (ELITE 800, Stealth 500X and XO ONE) to market for the holiday and in response to
27
abnormal West Coast port delays due to labor disputes during contract negotiations. Excluding the impact of these additional shipping costs, gross profit as a percentage of net sales would have been
30.2%
driven largely by sales of higher margin headsets.
For the year ended December 31, 2013, gross profit as a percentage of net revenue decreased to
28.2%
from
35.9%
for the year ended December 31, 2012 primarily due to an increase in refurbished products sales, higher freight in and product certification costs and inventory reduction initiatives ahead of the new console introductions.
Operating Expenses
|
|
Year Ended
|
||||||||||
|
December 31,
|
|||||||||||
|
|
2014
|
2013
|
2012
|
||||||||
|
(in thousands)
|
|||||||||||
|
Selling and marketing
|
$
|
33,442
|
|
$
|
31,645
|
|
$
|
22,837
|
|
||
|
Research and development
|
9,400
|
|
4,873
|
|
2,099
|
|
|||||
|
General and administrative
|
17,159
|
|
8,349
|
|
6,153
|
|
|||||
|
Business transaction costs
|
3,744
|
|
3,864
|
|
342
|
|
|||||
|
Restructuring charges
|
747
|
|
—
|
|
—
|
|
|||||
|
Total operating expenses
|
$
|
64,492
|
|
$
|
48,731
|
|
$
|
31,431
|
|
||
Selling and Marketing
Selling and marketing expense for the year ended
December 31, 2014
totaled
$33.4 million
, or
18.0%
as a percentage of net revenues, compared to
$31.6 million
, or
17.7%
as a percentage of net revenues, for the prior year. The increase in expense was primarily due to $5.1 million of incremental costs related to the HyperSound business and higher depreciation driven by the addition of interactive retail display kiosks into two large retailers in the fourth quarter of 2013, partially offset by reduced trade show expenses ($0.7 million), direct media spend ($1.2 million) and, advertising and promotional expenses ($1.6 million) related to the media series headsets post their market launch in 2013.
Selling and marketing expense for the year ended December 31, 2013 totaled $31.6 million, representing an increase of $8.8 million, or 38.6%, compared to $22.8 million for the year ended December 31, 2012. This increase was primarily due to increased depreciation costs primarily related to interactive retail displays as well as additional headcount, trade show expense and international marketing spend as we invested more heavily in marketing ahead of the next generation console roll-outs to better position the Company for the projected demand increase and shift to full feature wireless headsets driven by the next generation gaming consoles and to support the introduction of the Turtle Beach’s first media headsets (i30 and i60) in Apple stores.
Research and Development
The increase in research and development expenses for the year ended
December 31, 2014
versus the comparable prior year was primarily due to HyperSound product development efforts ($3.6 million), increased staffing levels to support the development of technology leading headsets for the next generation consoles and, an investment in product development for an upcoming new product.
Research and development expenses for the year ended December 31, 2013 total $4.9 million, representing an increase of $2.8 million compared to $2.1 million for the year ended December 31, 2012. This increase was primarily due to expenses related to additional headcount and higher consulting expenses.
General and Administrative
General and administrative expenses for the year ended
December 31, 2014
increased
$8.8 million
to
$17.2 million
compared to
$8.3 million
for the year ended December 31, 2013. The year over year increase was primarily driven by increased external expenses to be a public company (
$3.2 million
), incremental costs related to HyperSound ($2.3 million), higher stock
28
compensation expense ($1.1 million) and, additional headcount to build our internal capabilities and higher consultant fees for debt and equity capital activities ($1.4 million).
General and administrative expenses for the year ended December 31, 2013 totaled $8.3 million, representing an increase of $2.1 million, or 33.9%, compared to $6.2 million for the year ended December 31, 2012. The increase was primarily due to a increased stock compensation costs and health insurance expenses.
Business Transaction
Business transaction expenses for the year ended
December 31, 2014
incurred in connection with the Merger included investment banker success fees of
$2.2 million
payable upon the close of the merger and legal and accounting fees required to complete the transaction.
Business transaction expenses of $3.9 million from the
year ended
December 31, 2013
related to due diligence and legal costs related to the acquisition of the HyperSound business that closed in January 2014.
Restructuring Charges
During 2014, we have begun to focus on company-wide overhead and operating expense cost reduction activities, such as closing excess facilities and reducing redundancies. In connection with our efforts to improve our operating efficiency and reduce costs, we started the closure of certain production operations at one of our contract manufacturing operations in China. The wind down is expected to be completed by June 2015.
Interest Expense
Interest expense increased
$0.6 million
for the year ended
December 31, 2014
primarily due to higher deferred finance fees that included the write-off of $2.2 million of unamortized debt issuance costs related to the refinancing of our credit facility on March 31, 2014 and additional interest of $0.8 million related to the issuance of the subordinated notes. These factors were offset by rate reductions and lower average borrowings on our revolving line of credit.
Interest expense increased by $1.9 million for the year ended December 31, 2013, as compared to December 31, 2012, primarily due to the higher average term and revolver loan balance outstanding during the period, as well as charges related to the addition of the subordinated notes.
Income Taxes
Income tax benefit for the year ended
December 31, 2014
was
$6.3 million
at an effective tax rate of
28.8%
compared to
$1.1 million
for the year ended
December 31, 2013
at an effective tax rate of
21.5%
. The Company’s effective tax rate for this year differed from the U.S. federal statutory rate of 35% primarily due to differences in book and tax treatment of transaction costs, interest on the Series B Redeemable Preferred Stock and other non-deductible expenses.
Income tax expense was $1.1 million for the year ended December 31, 2013, which represented a decrease of $12.9 million from the income tax expense of $14.0 million for the year ended December 31, 2012. The Company’s effective tax rate for this year differed from the U.S. federal statutory rate of 35% primarily due to differences in book and tax treatment of stock based compensation and non-deductible expenses.
29
Liquidity and Capital Resources
Our primary source of working capital is cash flow from operations. We have funded operations and acquisitions in recent periods with operating cash flows, and proceeds from debt and equity financings.
The following table summarizes our sources and uses of cash:
|
|
2014
|
2013
|
2012
|
||||||||
|
(in thousands)
|
|||||||||||
|
Cash and cash equivalents at beginning of period
|
$
|
6,509
|
|
$
|
5,219
|
|
$
|
15,942
|
|
||
|
Net cash provided by (used for) operating activities
|
(14,834
|
)
|
18,290
|
|
6,977
|
|
|||||
|
Net cash provided by (used for) investing activities
|
557
|
|
(6,167
|
)
|
(11,280
|
)
|
|||||
|
Net cash provided by (used for) financing activities
|
15,969
|
|
(11,017
|
)
|
(6,341
|
)
|
|||||
|
Effect of foreign exchange on cash
|
(293
|
)
|
184
|
|
(79
|
)
|
|||||
|
Cash and cash equivalents at end of period
|
$
|
7,908
|
|
$
|
6,509
|
|
$
|
5,219
|
|
||
Operating activities
Cash used for operating activities for the year ended
December 31, 2014
was
$14.8 million
, a decline of
$33.1 million
as compared to cash provided by operating activities of
$18.3 million
for the year ended
December 31, 2013
. The year-over-year decrease is primarily the result of lower net income adjusted for non-cash expenses and a reduction in net working capital (defined as accounts receivable and inventories less accounts payable). The reduction in net working capital was driven by payments of accounts payable that had increased during our debt refinancing process that started in late 2013 and was completed in March 2014.
Cash provided by operating activities for the year ended December 31, 2013 was $18.3 million, an increase of $11.3 million as compared to cash provided by operating activities of $7.0 million for the year ended December 31, 2012. The year-over-year increase was a result of higher accounts payable that increased during our debt refinancing process and lower accounts receivable ahead of the launch of the next generation consoles.
Investing activities
Cash provided by investing activities was
$0.6 million
during the year ended
December 31, 2014
compared to
$6.2 million
and
$11.3 million
during the years ended
December 31, 2013
and
2012
, respectively, as a result of
$4.1 million
of cash acquired in the Merger. During 2013 and 2012, we refreshed demonstration units at key retailers and purchased new convention booth equipment in advance of the next generation console releases late last year, and as such capital expenditures declined compared to the prior years for the year ended
December 31, 2014
to
$3.5 million
from
$6.2 million
and
$5.9 million
in 2013 and 2012, respectively.
Cash used for investing activities was $6.2 million during the year ended December 31, 2013 compared to $11.3 million during the years ended December 31, 2012 primarily due to $5.3 million paid for the acquisition of Lygo, net of cash received.
Financing activities
Net cash provided by financing activities was
$16.0 million
during the
year ended
December 31, 2014
compared to net cash used of
$11.0 million
and
$6.3 million
during the years ended
December 31, 2013
and
2012
, respectively. Financing activities in 2014 included
$37.2 million
of proceeds from the sale of common stock, the issuance of
$7.0 million
principal amount of subordinated notes and a $7.7 million term loan borrowing partially offset by (i) net payments on our revolving credit facilities of
$2.9 million
, (ii) repayment of our $14.5 million legacy term loan and (iii) repayment of
$18.5 million
of outstanding subordinated notes. During 2014, we refinanced the former term loan and credit agreement (see below) to provide the necessary capital to support our business growth initiatives at a lower overall cost of capital.
Net cash used in financing activities during the year ended
December 31, 2013
was primarily related to net repayments of the legacy revolving line of credit and term loan, and was partially offset by the issuance of
$10 million
principal amount of subordinated notes.
30
Net cash used in financing activities during the year ended December 31, 2012 was primarily due to the repayment of a
$29.0 million
term loan and dividend payments totaling
$41.0 million
to preferred and common stockholders with borrowings on our then outstanding revolving credit facility and the issuance of a
$45.0 million
term loan.
Management assessment of liquidity
Management believes that its current cash and cash equivalents, proceeds received from the equity offering (described below), the amounts available under the asset-based credit facility and cash flows derived from operations will be sufficient to meet anticipated cash needs for working capital and capital expenditures for at least the next 12 months. Significant assumptions underlie this belief, including, among other things, that there will be no material adverse developments in our business, liquidity or capital requirements.
On April 24, 2014, we entered into an underwriting agreement (the “Underwriting Agreement”) with Needham & Company, LLC, as representative for the several other underwriters named therein, relating to an underwritten public offering (the “Offering”) of 4,000,000 shares of our common stock, at a price to the public of $10.00 per share (the “Offering Price”). We received net proceeds from the Offering of approximately
$37.2 million
after deducting the underwriting discount and estimated offering expenses. The net proceeds from the Offering were used to repay certain indebtedness, including $10 million then outstanding under the Credit Facility (as defined below) as contemplated upon the occurrence of a public offering, and for working capital and other general corporate purposes.
Subject to market conditions and Board approval, we may explore additional financing sources to fund expansion, to respond to competitive pressures, to acquire or to invest in complementary products, businesses or technologies, or to lower our cost of capital, which could include equity and debt financings. There can be no guarantee that any additional financing will be available on acceptable terms, if at all. If additional funds are raised through the issuance of equity or convertible debt, existing stockholders could suffer significant dilution, and if we raise additional funds through the issuance of debt securities or other borrowings, these securities or borrowings could have rights senior to common stock and could contain covenants that could restrict operations.
Foreign cash balances at
December 31, 2014
and
December 31, 2013
were
$2.5 million
and
$1.4 million
, respectively.
As of September 30, 2014, we have begun to transition our refurbishing activities from a revenue sharing arrangement in which an authorized third-party refurbished and resold product in exchange for a share of the revenues to a "Fee For Service" arrangement. Under such an arrangement, Turtle Beach, for an agreed upon per unit cost, would designate certain returned product to be refurbished into a saleable condition and resell the product through our own network of dealers and distributors. As a result, beginning in 2015 the timing of cash flows and write-offs related to our refurbishing activities will differ from the former arrangement, since those items will be recorded upon management's determination of which product to refurbish or to scrap.
Revolving Credit Facility
On March 31, 2014, Turtle Beach and certain of its subsidiaries entered into a new asset-based revolving credit agreement (“Credit Facility”)
with Bank of America, N.A., as Agent, Sole Lead Arranger and Sole Bookrunner, which replaced the then existing loan and security agreement (“the Credit Agreement” as described below). The Credit Facility,
which
expires on
March 31, 2019
, provides for a line of credit of up to
$60 million
inclusive of a
sub-facility limit of
$10 million
for
TB Europe, a wholly owned subsidiary of Turtle Beach. The Credit Facility may be used for working capital,
the issuance of bank guarantees,
letters of credit and other corporate purposes.
The actual credit availability for loans and letters of credit under Credit Facility is governed by a borrowing base determined by the application of specified percentages to certain eligible assets, primarily
eligible trade accounts receivable and inventories, and is subject to discretionary reserves and revaluation adjustments.
Amounts outstanding under the Credit Facility bear interest at a rate equal to
either a rate published by Bank of America or the LIBOR rate,
plus in each case, an applicable margin, which is between
1.00%
to
1.50%
for U.S. base rate loans
and between
2.00%
to
2.50%
for U.S. LIBOR loans and U.K. loans. As of
December 31, 2014
, interest rates for outstanding borrowings were
4.75%
for base rate loans and
2.67%
for LIBOR rate loans. In addition, Turtle Beach is required to pay a commitment fee on the unused revolving loan commitment at a rate ranging from
0.25%
to
0.50%
, and letter of credit fees and agent fees.
31
If certain availability thresholds are not met, meaning that the Company does not have receivables and inventory which are eligible to borrow on under the Credit Facility in excess of amounts borrowed, the Credit Facility requi
res the Company and its restricted subsidiaries to maintain a fixed charge coverage ratio. The fixed charge ratio is defined as the ratio, determined
on a consolidated basis for the most recent four fiscal quarters, of (a) EBITDA minus capital expenditures, excluding those financed through other instruments, and cash taxes paid, and (b) fixed charges defined as the sum of cash interest expense plus scheduled principal payments.
The Credit Facility also contains affirmative and negative covenants that, subject to certain exceptions, limit our ability to take certain actions, including our ability to incur debt, pay dividends and repurchase stock, make certain investments and other payments, enter into certain mergers and consolidations, engage in sale leaseback transactions and transactions with affiliates and encumber and dispose of assets. Obligations under the Credit Facility are secured by a security interest and lien upon substantially all of the Company's assets.
As of
December 31, 2014
, excess borrowing availability was approximately
$15.0 million
.
In March 2015, Bank of America notified the Company that certain events of default had occurred and were continuing under the Credit Agreement, including (i) the Company’s failure to deliver in a timely matter certain monthly financial statements in accordance with the Credit Agreement, (ii) the Company’s failure to deliver in a timely matter certain financial projections in accordance with the Credit Agreement, (iii) the Company’s failure to repay an over-advance of approximately
$100,000
that existed between March 6, 2015 and March 9, 2015, and (iv) the Company’s failure to satisfy the fixed charge coverage ratio under the Credit Agreement for certain measurement dates during the fourth quarter of 2014 (in part as a result of certain retroactive changes to the calculation of such ratio pursuant to the second amendment, dated December 29, 2014) (the “Existing Events of Default”).
Amendments
On December 29, 2014, we amended the Credit Facility to permit the repayment of
$7.7 million
of existing subordinated debt and accrued interest (see the “January Note” below) with the proceeds of an additional loan (the “Term Loan”). The Term Loan will result in modified financial covenants while it is outstanding, will bear interest at a rate of LIBOR for the applicable interest period plus
5%
and will be repaid in equal monthly installments beginning on April 1, 2015 and ending on April 1, 2018.
On March 16, 2015, we entered into a third amendment (the “Third Amendment”) to the Credit Facility pursuant to which Bank of America and the lenders under the Credit Facility agreed to waive the Existing Events of Default. In addition, the Third Amendment amends certain other provisions of the agreement and requires that we maintain an EBITDA ratio at the end of each month beginning April 30, 2015 on a cumulative basis through the remainder of 2015 and thereafter on a trailing twelve-month basis
, our EBITDA (as defined under the Credit Facility) must be in an amount equal to at least 75% of our monthly projected EBITDA as set forth in projections delivered pursuant to the Credit Facility
. The current fixed charge coverage ratio of at least 1.15 to 1.00 on the last day of each month while a Covenant Trigger Period (as defined in the agreement) is in effect will become effective again after the Company has complied with such ratio for six consecutive months.
Credit Agreement
In August 2012, VTBH entered into a loan and security agreement with various financial institutions, which amended and restated the then existing
$28 million
term loan and
$15 million
credit facility. The Credit Agreement, which was to expire on August 22, 2015, increased the borrowing capacity
$55 million
and provided for a
$45 million
term loan that bore interest at VTBH’s option at (i) the Adjusted Base Rate plus the applicable margin ranging from
2.50%
to
3.25%
as determined by VTBH’s total leverage ratio, or (ii) LIBOR, plus the applicable margin ranging from
3.50%
to
4.25%
. The Applicable Base Rate is equal to the highest of (a) the Prime Rate as determined by the syndication agent, (b) the federal funds rate plus
0.5%
and (c) the LIBOR rate plus
1.0%
. VTBH’s obligations under the Credit Agreement were secured by a first priority lien against substantially all of VTBH’s assets. The revolving line of credit was subject to limitations based on specific percentages of eligible accounts receivables and inventory.
32
2013 Amendments
VTBH entered into amendments to the Credit Agreement in July 2013 and August 2013 (the “2013 Amendments”). The 2013 Amendments waived certain defaults of the fixed charge coverage ratio and also provided for a new minimum EBITDA financial covenant, modifications of the fixed charge coverage ratio and maximum total leverage ratio for periods ending on or after September 28, 2013, and a modification of annual clean-down requirements with which VTBH would need to comply in order to provide for an increase in the eligible amount outstanding under the facility. In addition, the 2013 Amendments amended the interest rate on the outstanding term loans and required the issuance of
$10 million
of subordinated notes to reduce the outstanding borrowings on the term loan.
2014 Amendments
On January 15, 2014, in connection with the consummation of the Merger, the Company entered into a Third Amendment to the Credit Agreement in which Parametric became an obligor and guarantor under the loan and security agreement, and to (i) allow the Company to incur an additional
$7 million
of subordinated indebtedness, (ii) provide for the repayment of the term loan portion of the facility by February 28, 2014, (iii) change the maturity of the revolving line of credit portion of the facility to September 27, 2014, (iv) reduce the commitments under the revolving line of credit to
$35 million
after March 1, 2014, (v) increase the margin pursuant to which interest on outstanding amounts under the Credit Agreement was calculated by
0.75%
, and (vi) modify the financial covenants contained in the Credit Agreement.
On March 13, 2014, the Company entered into a Fourth Amendment to the Credit Agreement to (i) increase the maximum principal amount of the lenders’ revolving loan commitment between February 28, 2014 and April 15, 2014 from
$35 million
to approximately
$39 million
, (ii) provide that the borrowers, on or prior to April 15, 2014, would reduce the aggregate dollar amount of revolving loans outstanding under the Credit Agreement to the lesser of
$35 million
or the Company’s borrowing base as of such date, (iii) waive the Company’s obligation to deliver certain certificates regarding its liquidity and borrowing base for the fiscal month ended February 28, 2014, and to specify the delivery date of such certificates during March 2014 and April 2014, (iv) eliminate a requirement that the borrowers reduce the aggregate dollar amount of revolving loans and swing loans outstanding to an amount no greater than
$25 million
for a thirty consecutive day period during the first fiscal quarter of each fiscal year, and (v) eliminate the lenders’ obligation to make additional revolving loan commitments after February 28, 2014.
In connection with the above, on January 15, 2014, we repaid
$7.0 million
of the term loan with proceeds from the issuance of a subordinated note, and on February 28, 2014 repaid the remaining
$7.5 million
principal balance with funds from operations, as required by the “2014 Amendments.”
Invoice Factoring
TB Europe utilized accounts receivable factoring arrangements with a third-party financial institution in order to accelerate its cash collections from product sales. These arrangements provided for the transfer of ownership of eligible trade accounts receivable up to a maximum of
£5.0 million
at any time, without recourse, to the third-party financial institution in exchange for cash. This invoice factoring arrangement was terminated on March 31, 2014, and related borrowings were fully paid with proceeds from the Credit Facility described above.
Subordinated Notes - Related Party
On August 30, 2013, VTBH issued
$10 million
of subordinated notes (the “August Notes”) to SG VTB Holdings, LLC (“SG VTB”), VTBH's largest shareholder, Ronald Doornink, a director of Turtle Beach, and Juergen Stark, Chief Executive Officer, that bore interest at a rate of (i)
10%
per annum for the first year and (ii)
20%
per annum for all periods thereafter, with interest accruing and being added to the principal amount of the August Notes quarterly. Principal and interest on the August Notes were to be due upon maturity, which was to occur on the one year anniversary of the later of (i) the term loan maturity date under the Credit Agreement or (ii) the revolving line of credit termination date thereunder. The proceeds from the August Notes were used to repay an equivalent portion of the then outstanding term loans. In June 2014, we repaid the
$10 million
outstanding principal amount plus related accrued interest of the August Notes with proceeds from the Offering.
In connection with the Third Amendment to the Credit Agreement, on January 15, 2014, the Company issued an additional
$7 million
subordinated note (the “January Note”) to SG VTB, the proceeds of which were applied against the outstanding balance of the term loan under the Credit Agreement. The January Note bore interest at a rate of (i)
10%
per annum until December 31, 2014 (which was to be the maturity date of the January Note) and (ii)
20%
per annum for all periods thereafter, with interest
33
accruing and being added to the principal amount of the January Note quarterly. The other terms of the January Note were substantially similar to the terms of the August Notes. In December 2014, we repaid the
$7 million
outstanding principal amount plus related accrued interest of the January Note with proceeds from an additional loan drawn under the Credit Facility.
Series A convertible stock
In conjunction with the Merger, $24.4 million principal amount of the Series A convertible stock was converted into shares of common stock pursuant to an exchange ratio specified in the Merger agreement.
Series B redeemable preferred stock
In September 2010, VTBH issued 1,000,000 shares of its Series B Redeemable Preferred Stock with a fair value of $12.4 million. We are required to redeem the Series B Redeemable Preferred Stock on the earlier to occur of September 28, 2030 or the occurrence of a liquidation event (as defined in VTBH's Certificate of Incorporation) at its original issue price of $12.425371 per share plus any accrued but unpaid dividends. The redemption value was
$14.9 million
and
$13.7 million
as of
December 31, 2014
and December 31, 2013, respectively.
Critical Accounting Estimates
Our discussion and analysis of our results of operations and capital resources are based on our condensed consolidated financial statements, which have been prepared in conformity with GAAP. The preparation of these condensed consolidated financial statements requires management to make estimates and assumptions that affect the reported amounts of assets, liabilities, revenue and expenses and the disclosure of contingent assets and liabilities. Management bases its estimates, assumptions and judgments on historical experience and on various other factors that it believes to be reasonable under the circumstances.
Different assumptions and judgments would change the estimates used in the preparation of the condensed consolidated financial statements, which, in turn, could change the results from those reported. Management evaluates its estimates, assumptions and judgments on an ongoing basis.
Based on the above, we have determined that our most critical accounting policies are those related to revenue recognition and sales return reserve, inventory valuation, asset impairment, and income taxes.
Revenue Recognition and Sales Return Reserve
Revenue is recognized when products are shipped and title has been transferred to a customer, the sales price is fixed and determinable, and collection is reasonably assured. Product is considered delivered to the customer once it has been shipped and title and risk of loss have been transferred. Net revenue for on-line purchases is recognized when products are shipped from our distribution facilities.
Provisions for cash discounts, quantity rebates, and sales returns in the period the sale is recorded, based upon our prior experience and current trends, as a reduction of revenue. These revenue reductions are established based upon management’s best estimates at the time of sale following the historical trend, adjusted to reflect known changes in the factors that impact such reserves and allowances, and the terms of agreements with customers.
Inventory Valuation
Inventories are valued at the lower of weighted average cost or market, at the individual item level. Market is determined based on the estimated net realizable value, which is generally the selling price. Inventory levels are monitored to identify slow-moving items and markdowns are used to clear such product. Physical inventory counts are performed annually in January and estimates are made for any shortage between the date of the physical inventory count and the balance sheet date.
Asset Impairment
We have significant long-lived tangible and intangible assets, including goodwill with indefinite lives, which are susceptible to valuation adjustments as a result of changes in various factors or conditions. We assess the potential impairment of intangible and fixed assets whenever events or changes in circumstances indicate that full recoverability of net asset balances through future cash flows is in question. Goodwill and indefinite-lived intangible assets are assessed at least annually, but also whenever events or changes in circumstances indicate the carrying values may not be recoverable. Factors we consider important, which could trigger an impairment of such assets include significant underperformance relative to historical or projected future operating results; significant changes in the manner of or use of the acquired assets or the strategy for our overall business;
34
significant negative industry or economic trends; significant decline in our stock price for a sustained period; and a decline in our market capitalization below net book value.
Management estimates future pre-tax cash flows based on historical experience, knowledge and market data. Estimates of future cash flows require that we make assumptions and apply judgment, including forecasting future sales and expenses and estimating useful lives of the assets. These estimates can be affected by factors such as future product development and economic conditions that can be difficult to predict, as well as other factors such as those outlined in “Risk Factors.” If the expected future cash flows related to the long-lived assets are less than the assets’ carrying value, an impairment loss would be recognized for the difference between estimated fair value and carrying value.
In connection with the Merger, we performed a valuation of the acquired goodwill and recorded
$81.0 million
of goodwill based on the fair values of the assets acquired and liabilities assumed. The Company conducted its annual impairment assessment on November 1, 2014 taking a qualitative evaluation approach to determine if there were any adverse market factors or changes in circumstances that would indicate that the carrying value of goodwill as determined in connection with the current year Merger may not be recoverable. Management noted that the markets have not limited access to capital that could potentially alter our investment in and/or development of the HyperSound technology; that the Company has received clearance from the U.S. Food and Drug Administration to market the HyperSound Audio System to improve the clarity and comprehension of sounds from various sources for listeners with hearing loss; and that the Company completed supply chain improvements and product development efforts that have reduced projected cost structures as well as established the framework to generate revenue starting in 2015 with the anticipated hearing health care product launch. However, due to a significant decline in the Company's stock price subsequent to our evaluation, management further conducted a qualitative assessment and concluded that the market capitalization of
$242.9 million
resulted in an implied control premium of
7%
and that goodwill was not impaired. Accordingly, we determined that no events or changes in circumstances indicated that the carrying value may not be recoverable and further consideration of potential goodwill impairment was not considered necessary.
In addition, in-process research and development acquired in connection with the Merger is considered an indefinite-lived intangible asset until the completion or abandonment of the associated efforts. Accordingly, during the development period, the IPR&D is not amortized but rather subject to impairment review, and based on the above qualitative factors, no impairment indicators were noted.
Our forecasts of planned revenue are largely dependent on the final development and launch of the HyperSound hearing healthcare product to generate the projected revenue in subsequent years. If the performance of our HyperSound products in the hearing healthcare market does not meet expectations based on recent market data, a future impairment charge could result for a portion or all of the goodwill noted previously. The amount of any impairment is dependent on the performance of the business which is dependent upon a number of variables which cannot be predicted with certainty.
Income Taxes
We account for income taxes using the asset and liability method. Under the asset and liability method, deferred tax assets and liabilities are recognized based on the differences between the financial statement carrying value of existing assets and liabilities and their respective tax bases. Deferred tax assets and liabilities are measured using enacted tax rates and laws expected to be in effect when the differences are expected to reverse. The effect of a change in tax rates on deferred tax assets and liabilities is recognized in income in the period that includes the enactment date. Inherent in the measurement of these deferred balances are certain judgments and interpretations of existing tax law and other published guidance as applied to our operations. Our effective tax rate considers our judgment of expected tax liabilities in the various jurisdictions within which we are subject to tax.
The determination of the need for a valuation allowance on deferred tax assets, requires Management to make assumptions and to apply judgment, including forecasting future earnings, taxable income, and the mix of earnings in the jurisdictions in which we operate. Our evaluation noted that while the current year resulted in both a pre-tax and net taxable loss it was driven largely by expenses related to the Merger and the initial investment in the HyperSound business as well as incremental shipping and handling costs related to a console manufacture delay and increased air freight usage in response to the labor uncertainty at the West Coast ports. In 2014, the Company received clearance from the U.S. Food and Drug Administration to market the HyperSound Audio System, refinanced debt facilities to reduce our cost of capital, and completed supply chain improvements and product development efforts that have reduced projected cost structures and resulted in an increase in projected revenue growth rates and profitability levels. Our revenues can fluctuate significantly due to a number of factors beyond our control and as such, if the performance of our HyperSound products in the hearing healthcare market does not meet expectations and
35
negatively impacts current estimates that sufficient taxable income will start to be generated within the next year to allow the related tax benefits to reduce taxes otherwise payable, a valuation allowance may be required.
The tax effects of uncertain tax positions taken or expected to be taken in income tax returns are recognized only if they are “more likely-than-not” to be sustained on examination by the taxing authorities, based on the technical merits as of the reporting date. The tax benefits recognized in the financial statements from such positions are measured based on the largest benefit that has a greater than fifty percent likelihood of being realized upon ultimate settlement. We recognize estimated accrued interest and penalties related to uncertain tax positions in income tax expense.
We are currently under examination by certain state and local taxing jurisdictions. Further, at any given time, multiple tax years may be subject to examination by various taxing authorities. The recorded amounts of income tax are subject to adjustment upon examination, changes in interpretation and changes in judgment utilized in determining estimates. While no adjustments to recorded amounts are anticipated, a 1% variance in our effective tax rate would affect net income after taxes by approximately
$0.2 million
for the year ended
December 31, 2014
.
See Note
1
, “Summary of Significant Accounting Policy,” in the notes to the consolidated financial statements for a complete discussion of recent accounting pronouncements. We are currently evaluating the impact of certain recently issued guidance on our financial condition and results of operations in future periods.
Off-Balance Sheet Arrangements
Off balance sheet arrangements are transactions, agreements, or other contractual arrangements with an unconsolidated entity for which we have an obligation to the entity that is not recorded in the consolidated financial statements. As of
December 31, 2014
, there are no significant off-balance sheet arrangements.
Contractual Obligations
Our principal commitments primarily consist of obligations for minimum payment commitments to leases for office space, redeemable preferred stock and the revolving credit facility. As of
December 31, 2014
, the future non-cancelable minimum payments under these commitments were as follows:
|
Payments Due by Period
|
||||||||||||||||||||
|
(in thousands)
|
||||||||||||||||||||
|
Total
|
Less Than One Year
|
1 - 3 Years
|
3 - 5 Years
|
More Than Five Years
|
||||||||||||||||
|
Contractual Obligations: (1)
|
||||||||||||||||||||
|
Operating lease obligations (2)
|
$
|
4,309
|
|
$
|
1,146
|
|
$
|
1,661
|
|
$
|
1,318
|
|
184
|
|
||||||
|
Series B Redeemable Preferred Stock (3)
|
51,928
|
|
—
|
|
—
|
|
—
|
|
51,928
|
|
||||||||||
|
Long term debt (4)
|
44,555
|
|
38,786
|
|
5,128
|
|
641
|
|
—
|
|
||||||||||
|
Total
|
$
|
100,792
|
|
$
|
39,932
|
|
$
|
6,789
|
|
$
|
1,959
|
|
$
|
52,112
|
|
|||||
(1) Contractual obligations exclude tax liabilities of
$4.0 million
related to uncertain tax positions because we are unable to make a reasonably reliable estimate of the timing of settlement, if any, of these future payments.
(2) Operating lease agreements represent obligations to make payments under non-cancelable lease agreements for its facilities. In January 2015, we entered into a 5 year lease for an aggregate of approximately 35,000 square feet of office space in San Diego, California, that will consolidate our San Diego and Poway, California locations. The initial base rent of $1.0 million per year is subject to a 3% annual increase (not included in chart).
(3) In September 2010, VTBH issued shares of its Series B Redeemable Preferred Stock. If the Series B Redeemable Preferred Stock is still outstanding as of October 2030 or if the Company experiences a liquidation event as defined in VTBH's Certification of Incorporation, the Company will be required to redeem the shares for an aggregate of $51.9 million, which is comprised of the aggregate purchase price of $12.4 million plus cumulative preferred dividends of 8.0% per annum, or $39.5 million in the aggregate. See Note
14
,
“Commitments and Contingencies”
for further information.
36
(4) On March 31, 2014 the Company entered into the Credit Facility that expires March 31, 2019. However, due to certain terms of the facility, the indebtedness is required to be classified as a current liability. Long term debt includes scheduled principal payments only. See Note
8
,
“Credit Facilities and Long-Term Debt”
for further information.
Market risk represents the risk of loss that may impact its financial position due to adverse changes in financial market prices and rates. The Company's market risk exposure is primarily a result of fluctuations in interest rates and foreign currency exchange rates and inflation.
To date, the Company has used derivative financial instruments, specifically foreign currency forward and option contracts, to manage exposure to foreign currency risks, by hedging a portion of its forecasted expenses denominated in British Pounds expected to occur within a year. The effect of exchange rate changes on foreign currency forward and option contracts is expected to offset the effect of exchange rate changes on the underlying hedged item. The Company does not use derivative financial instruments for speculative or trading purposes. As of
December 31, 2014
, we do not have any derivative financial instruments.
Interest Rate Risk
The Company's total variable rate debt is comprised of
$36.9 million
outstanding under the Credit Facility and
$7.7 million
presented as a Term Loan. A hypothetical 10% increase in borrowing rates at
December 31, 2014
would have resulted in a $0.2 million annual increase in interest expense on the existing principal balance.
Foreign Currency Exchange Risk
The Company has exchange rate exposure, primarily, with respect to the British Pound. As of
December 31, 2014
, 2013 and 2012, our monetary assets and liabilities which are subject to this exposure are immaterial, therefore the potential immediate loss to us that would result from a hypothetical 10% change in foreign currency exchange rates would not be expected to have a material impact on our earnings or cash flows. This sensitivity analysis assumes an unfavorable 10% fluctuation in the exchange rates affecting the foreign currencies in which monetary assets and liabilities are denominated and does not take into account the offsetting effect of such a change on our foreign currency denominated revenues.
Inflation Risk
The Company is exposed to market risk due to the possibility of inflation, such as increases in the cost of its products. Although the Company does not believe that inflation has had a material impact on its financial position or results of operations to date, a high rate of inflation in the future may have an adverse effect on the Company’s ability to maintain current levels of gross margin and selling, general and administrative expenses as a percentage of net revenue if the selling prices of products do not increase with these increased costs.
37
|
INDEX TO CONSOLIDATED FINANCIAL STATEMENTS
|
|
|
|
Page
|
|
Consolidated Financial Statements:
|
|
38
REPORT OF INDEPENDENT REGISTERED PUBLIC ACCOUNTING FIRM
To the Board of Directors and Stockholders of
Turtle Beach Corporation
Valhalla, New York
We have audited the accompanying consolidated balance sheet of Turtle Beach Corporation, as of
December 31, 2014
and the related consolidated statements of operations, comprehensive loss, convertible preferred stock and stockholders' equity and cash flows for the year then ended. In connection with our audit of the financial statements, we have also audited the financial statement schedule listed in the accompanying index. These financial statements and schedule are the responsibility of the Company’s management. Our responsibility is to express an opinion on these financial statements and schedule based on our audit.
We conducted our audit in accordance with the standards of the Public Company Accounting Oversight Board (United States). Those standards require that we plan and perform the audit to obtain reasonable assurance about whether the financial statements are free of material misstatement. An audit includes examining, on a test basis, evidence supporting the amounts and disclosures in the financial statements, assessing the accounting principles used and significant estimates made by management, as well as evaluating the presentation of the financial statements and schedule. We believe that our audit provides a reasonable basis for our opinion.
In our opinion, the consolidated financial statements referred to above present fairly, in all material respects, the financial position of Turtle Beach Corporation as of
December 31, 2014
, and the results of its operations and its cash flows for the year then ended, in conformity with accounting principles generally accepted in the United States of America.
Also, in our opinion, the financial statement schedule, when considered in relation to the basic consolidated financial statements taken as a whole, presents fairly, in all material respects, the information set forth therein.
We also have audited, in accordance with the standards of the Public Company Accounting Oversight Board (United States), Turtle Beach Corporation‘s internal control over financial reporting as of
December 31, 2014
, based on criteria established in Internal Control – Integrated Framework (2013) issued by the Committee of Sponsoring Organizations of the Treadway Commission (COSO) and our report dated
March 30, 2015
expressed an unqualified opinion thereon.
|
/s/ BDO USA, LLP
|
|
Stamford, Connecticut
|
|
March 30, 2015
|
39
REPORT OF INDEPENDENT REGISTERED PUBLIC ACCOUNTING FIRM
To the Board of Directors and Stockholders
VTB Holdings, Inc.
We have audited the accompanying consolidated balance sheet of VTB Holdings, Inc. as of December 31, 2013 and the related consolidated statements of operations, comprehensive income (loss), convertible preferred stock and stockholders’ equity (deficit), and cash flows for the years ended December 31, 2013 and 2012. Our audits also included the financial statement schedule listed in the accompanying index. These consolidated financial statements and schedule are the responsibility of the Company’s management. Our responsibility is to express an opinion on these consolidated financial statements and schedule based on our audits.
We conducted our audits in accordance with the standards of the Public Company Accounting Oversight Board (United States). Those standards require that we plan and perform the audit to obtain reasonable assurance about whether the financial statements are free of material misstatement. The Company is not required to have, nor were we engaged to perform, an audit of its internal control over financial reporting. Our audits included consideration of internal control over financial reporting as a basis for designing audit procedures that are appropriate in the circumstances, but not for the purpose of expressing an opinion on the effectiveness of the Company’s internal control over financial reporting. Accordingly, we express no such opinion. An audit also includes examining, on a test basis, evidence supporting the amounts and disclosures in the financial statements, assessing the accounting principles used and significant estimates made by management, as well as evaluating the overall financial statement presentation. We believe that our audits provide a reasonable basis for our opinion.
In our opinion, the consolidated financial statements referred to above present fairly, in all material respects, the financial position of VTB Holdings, Inc. as of December 31, 2013, and the results of its operations and its cash flows for the years ended December 31, 2013 and 2012, in conformity with accounting principles generally accepted in the United States of America. Also, in our opinion, the related financial statement schedule, when considered in relation to the basic financial statements taken as a whole, presents fairly in all material respects the information set forth therein.
We have also audited the adjustments to the 2013 and 2012 consolidated financial statements to retrospectively adjust the common shares outstanding on the consolidated balance sheet and consolidated statement of convertible preferred stock and stockholders’ equity and the earnings (loss) per share disclosure (consolidated statements of operations, Notes 10 and 15) as a result of the all-stock merger transaction between Turtle Beach Corporation (formerly Parametric Sound Corporation) and VTB Holdings, Inc. as discussed in Notes 1 and 2 to the consolidated financial statements. Our procedures included (1) comparing the amounts shown in the earnings (loss) per share disclosures for 2013 and 2012 to the Company's underlying accounting analysis, (2) comparing the previously reported shares outstanding and statement of operations amounts per the Company's accounting analysis to the previously issued consolidated financial statements, and (3) recalculating the additional shares to give effect to the merger exchange ratio and testing the mathematical accuracy of the underlying analysis. In our opinion, such retrospective adjustments are appropriate and have been properly applied.
|
/s/ FREED MAXICK CPAs, P.C.
|
|
Buffalo, New York
|
|
March 28, 2014, except for Note 10, 15, and
|
|
Supplemental Schedule as to which the date is March 30, 2015
|
40
Turtle Beach Corporation
|
December 31, 2014
|
|
December 31, 2013
|
|||||
|
ASSETS
|
(in thousands, except par value and share amounts)
|
||||||
|
Current Assets:
|
|
|
|
|
|||
|
Cash and cash equivalents
|
$
|
7,908
|
|
|
$
|
6,509
|
|
|
Accounts receivable, less allowances for $9,806 and $8,980 in 2014 and 2013, respectively
|
61,059
|
|
48,542
|
|
|||
|
Inventories, net
|
38,400
|
|
49,643
|
|
|||
|
Deferred income taxes
|
4,930
|
|
2,214
|
|
|||
|
Prepaid income taxes
|
1,482
|
|
2,925
|
|
|||
|
Prepaid expenses and other current assets
|
3,818
|
|
3,561
|
|
|||
|
Total Current Assets
|
117,597
|
|
113,394
|
|
|||
|
Property and equipment, net
|
6,722
|
|
7,369
|
|
|||
|
Goodwill
|
80,974
|
|
—
|
|
|||
|
Intangible assets, net
|
39,726
|
|
3,972
|
|
|||
|
Deferred income taxes
|
1,128
|
|
827
|
|
|||
|
Other assets
|
821
|
|
1,745
|
|
|||
|
Total Assets
|
$
|
246,968
|
|
$
|
127,307
|
|
|
|
LIABILITIES, CONVERTIBLE PREFERRED STOCK AND
STOCKHOLDERS' EQUITY (DEFICIT)
|
|
|
|||||
|
Current Liabilities:
|
|
|
|||||
|
Revolving credit facilities
|
$
|
36,863
|
|
$
|
39,736
|
|
|
|
Term loan
|
1,923
|
|
14,500
|
|
|||
|
Accounts payable
|
35,546
|
|
44,136
|
|
|||
|
Due to shareholders
|
—
|
|
3,125
|
|
|||
|
Other current liabilities
|
14,525
|
|
9,712
|
|
|||
|
Total Current Liabilities
|
88,857
|
|
111,209
|
|
|||
|
Term loan, long-term portion
|
5,769
|
|
|
—
|
|
||
|
Series B redeemable preferred stock
|
14,916
|
|
13,713
|
|
|||
|
Deferred income taxes
|
648
|
|
850
|
|
|||
|
Subordinated notes - related party
|
—
|
|
10,342
|
|
|||
|
Other liabilities
|
5,592
|
|
1,986
|
|
|||
|
Total Liabilities
|
115,782
|
|
138,100
|
|
|||
|
Commitments and Contingencies
|
|||||||
|
Series A convertible preferred stock, $0.01 par value - 50,000,000 shares authorized;
48,689,555 shares issued and outstanding as of December 31, 2013
|
—
|
|
24,345
|
|
|||
|
Stockholders' Equity (Deficit)
|
|
|
|
|
|||
|
Common stock, $0.001 par value - 50,000,000 shares authorized; 42,027,991 and 12,700,460 shares issued and outstanding as of December 31, 2014 and 2013, respectively
|
42
|
|
13
|
|
|||
|
Additional paid-in capital
|
128,084
|
|
(54,031
|
)
|
|||
|
Retained earnings
|
3,289
|
|
18,775
|
|
|||
|
Accumulated other comprehensive income (loss)
|
(229
|
)
|
105
|
|
|||
|
Total Stockholders' Equity (Deficit)
|
131,186
|
|
(35,138
|
)
|
|||
|
Total Liabilities, Convertible Preferred Stock and Stockholders' Equity (Deficit)
|
$
|
246,968
|
|
$
|
127,307
|
|
|
See accompanying Notes to the Consolidated Financial Statements
41
Turtle Beach Corporation
|
Year Ended
|
|||||||||||
|
|
December 31, 2014
|
|
December 31, 2013
|
December 31, 2012
|
|||||||
|
(in thousands, except per share data)
|
|||||||||||
|
Net Revenue
|
$
|
186,176
|
|
$
|
178,470
|
|
$
|
207,136
|
|
||
|
Cost of Revenue
|
135,509
|
|
128,141
|
|
132,795
|
|
|||||
|
Gross Profit
|
50,667
|
|
50,329
|
|
74,341
|
|
|||||
|
Operating expenses:
|
|||||||||||
|
Selling and marketing
|
33,442
|
|
|
31,645
|
|
22,837
|
|
||||
|
Research and development
|
9,400
|
|
|
4,873
|
|
2,099
|
|
||||
|
General and administrative
|
17,159
|
|
|
8,349
|
|
6,153
|
|
||||
|
Business transaction costs
|
3,744
|
|
|
3,864
|
|
342
|
|
||||
|
Restructuring charges
|
747
|
|
—
|
|
—
|
|
|||||
|
Total operating expenses
|
64,492
|
|
|
48,731
|
|
31,431
|
|
||||
|
Operating income (loss)
|
(13,825
|
)
|
1,598
|
|
42,910
|
|
|||||
|
Interest expense
|
7,209
|
|
6,626
|
|
4,738
|
|
|||||
|
Other non-operating expense, net
|
724
|
|
45
|
|
7
|
|
|||||
|
Gain on bargain purchase from acquisition
|
—
|
|
—
|
|
(2,303
|
)
|
|||||
|
Earnings (Loss) before income tax expense (benefit)
|
(21,758
|
)
|
(5,073
|
)
|
40,468
|
|
|||||
|
Income tax expense (benefit)
|
(6,272
|
)
|
|
1,090
|
|
|
14,008
|
|
|||
|
Net income (loss)
|
$
|
(15,486
|
)
|
|
$
|
(6,163
|
)
|
$
|
26,460
|
|
|
|
Net income (loss) attributable to common stockholders
|
$
|
(15,486
|
)
|
$
|
(6,163
|
)
|
$
|
1,611
|
|
||
|
Net earnings (loss) per share attributable to common stockholders:
|
|||||||||||
|
Basic
|
$
|
(0.39
|
)
|
$
|
(0.49
|
)
|
$
|
0.13
|
|
||
|
Diluted
|
$
|
(0.39
|
)
|
$
|
(0.49
|
)
|
$
|
0.13
|
|
||
|
Weighted average number of shares:
|
|||||||||||
|
Basic
|
39,665
|
|
12,700
|
|
12,700
|
|
|||||
|
Diluted
|
39,665
|
|
12,700
|
|
12,700
|
|
|||||
See accompanying Notes to the Consolidated Financial Statements
42
Turtle Beach Corporation
Consolidated Statements of Comprehensive Income (Loss)
|
Year Ended
|
|||||||||||
|
December 31, 2014
|
December 31, 2013
|
December 31, 2012
|
|||||||||
|
(in thousands)
|
|||||||||||
|
Net income (loss)
|
$
|
(15,486
|
)
|
$
|
(6,163
|
)
|
$
|
26,460
|
|
||
|
Other comprehensive income (loss):
|
|||||||||||
|
Foreign currency translation adjustment
|
(334
|
)
|
184
|
|
(79
|
)
|
|||||
|
Other comprehensive income (loss)
|
(334
|
)
|
184
|
|
(79
|
)
|
|||||
|
Comprehensive income (loss)
|
$
|
(15,820
|
)
|
$
|
(5,979
|
)
|
$
|
26,381
|
|
||
See accompanying Notes to the Consolidated Financial Statements
43
Turtle Beach Corporation
|
|
Year Ended December 31,
|
||||||||||
|
|
2014
|
2013
|
2012
|
||||||||
|
CASH FLOWS FROM OPERATING ACTIVITIES
|
(in thousands)
|
||||||||||
|
Net income (loss)
|
$
|
(15,486
|
)
|
$
|
(6,163
|
)
|
$
|
26,460
|
|
||
|
Adjustments to reconcile net income (loss) to net cash provided by (used for) operating activities:
|
|||||||||||
|
Depreciation and amortization
|
5,800
|
|
4,422
|
|
1,858
|
|
|||||
|
Amortization of intangible assets
|
1,066
|
|
923
|
|
748
|
|
|||||
|
Amortization of deferred financing costs
|
2,621
|
|
1,556
|
|
835
|
|
|||||
|
Stock-based compensation
|
5,194
|
|
2,563
|
|
985
|
|
|||||
|
Accrued interest on Series B redeemable preferred stock
|
1,203
|
|
1,010
|
|
1,032
|
|
|||||
|
Paid in kind interest
|
1,138
|
|
342
|
|
—
|
|
|||||
|
Gain on bargain purchase from acquisition
|
—
|
|
—
|
|
(2,303
|
)
|
|||||
|
Deferred income taxes
|
(9,998
|
)
|
3,353
|
|
(1,598
|
)
|
|||||
|
Provision for (Reversal of) sales returns reserve
|
(2,111
|
)
|
(1,482
|
)
|
1,596
|
|
|||||
|
Provision for (Reversal of) doubtful accounts
|
37
|
|
(235
|
)
|
358
|
|
|||||
|
Provision for obsolete inventory
|
532
|
|
93
|
|
588
|
|
|||||
|
Loss on disposal of property and equipment
|
9
|
|
108
|
|
47
|
|
|||||
|
Changes in operating assets and liabilities:
|
|||||||||||
|
Accounts receivable
|
(10,396
|
)
|
18,761
|
|
(23,461
|
)
|
|||||
|
Inventories
|
11,363
|
|
(9,030
|
)
|
(857
|
)
|
|||||
|
Accounts payable
|
(10,552
|
)
|
19,946
|
|
4,123
|
|
|||||
|
Due to shareholders
|
(3,125
|
)
|
(3,125
|
)
|
(3,125
|
)
|
|||||
|
Prepaid expenses and other assets
|
(212
|
)
|
(1,778
|
)
|
(1,203
|
)
|
|||||
|
Income taxes payable
|
4,704
|
|
(9,780
|
)
|
(534
|
)
|
|||||
|
Other liabilities
|
3,379
|
|
(3,194
|
)
|
1,428
|
|
|||||
|
Net cash provided by (used for) operating activities
|
(14,834
|
)
|
18,290
|
|
6,977
|
|
|||||
|
CASH FLOWS FROM INVESTING ACTIVITIES
|
|||||||||||
|
Purchase of property and equipment
|
(3,536
|
)
|
(6,167
|
)
|
(5,945
|
)
|
|||||
|
Cash acquired (cash paid) in business combinations
|
4,093
|
|
—
|
|
(5,335
|
)
|
|||||
|
Net cash provided by (used for) investing activities
|
557
|
|
(6,167
|
)
|
(11,280
|
)
|
|||||
|
CASH FLOWS FROM FINANCING ACTIVITIES
|
|||||||||||
|
Borrowings on revolving credit facilities
|
157,982
|
|
51,250
|
|
48,000
|
|
|||||
|
Repayment of revolving credit facilities
|
(160,855
|
)
|
(44,514
|
)
|
(27,000
|
)
|
|||||
|
Repayment of capital leases
|
(34
|
)
|
—
|
|
—
|
|
|||||
|
Borrowings on term loan
|
7,692
|
|
—
|
|
45,000
|
|
|||||
|
Repayment of term loan
|
(14,500
|
)
|
(26,750
|
)
|
(28,950
|
)
|
|||||
|
Repayment of subordinated notes
|
(18,481
|
)
|
—
|
|
—
|
|
|||||
|
Proceeds from sale of common stock, net of issuance costs
|
37,230
|
|
—
|
|
—
|
|
|||||
|
Proceeds from exercise of stock options
|
1,618
|
|
—
|
|
—
|
|
|||||
|
Debt financing costs
|
(1,683
|
)
|
(1,003
|
)
|
(2,391
|
)
|
|||||
|
Proceeds from issuance of subordinated notes
|
7,000
|
|
10,000
|
|
—
|
|
|||||
|
Dividends paid on common and preferred stock
|
—
|
|
—
|
|
(41,000
|
)
|
|||||
|
Net cash provided by (used for) financing activities
|
15,969
|
|
(11,017
|
)
|
(6,341
|
)
|
|||||
|
Effect of exchange rate changes on cash and cash equivalents
|
(293
|
)
|
184
|
|
(79
|
)
|
|||||
|
Net increase (decrease) in cash and cash equivalents
|
1,399
|
|
1,290
|
|
(10,723
|
)
|
|||||
|
Cash and cash equivalents - beginning of period
|
6,509
|
|
5,219
|
|
15,942
|
|
|||||
|
Cash and cash equivalents - end of period
|
$
|
7,908
|
|
$
|
6,509
|
|
$
|
5,219
|
|
||
|
SUPPLEMENTAL DISCLOSURE OF INFORMATION
|
|||||||||||
|
Cash paid for interest
|
$
|
3,209
|
|
$
|
3,694
|
|
$
|
4,716
|
|
||
|
Cash paid for income taxes
|
$
|
554
|
|
$
|
8,224
|
|
$
|
16,749
|
|
||
|
Accrual for purchases of property and equipment
|
$
|
1,420
|
|
$
|
1,104
|
|
$
|
457
|
|
||
|
Value of shares issued to acquire HyperSound business
|
$
|
113,782
|
|
$
|
—
|
|
$
|
—
|
|
||
|
Conversion of Series A Preferred Stock
|
$
|
24,345
|
|
$
|
—
|
|
$
|
—
|
|
||
|
Settlement of accounts receivable related to acquisition
|
$
|
—
|
|
$
|
—
|
|
$
|
8,920
|
|
||
See accompanying Notes to the Consolidated Financial Statements
44
Turtle Beach Corporation
Consolidated Statement of Convertible Preferred Stock and Stockholders' Equity (Deficit)
|
Series A Convertible Preferred Stock
|
Common Stock
|
Additional Paid-In Capital
|
Retained Earnings
|
Accumulated Other Comprehensive Income (Loss)
|
Total
|
||||||||||||||||||||||
|
Shares
|
Amount
|
Shares
|
Amount
|
||||||||||||||||||||||||
|
(in thousands)
|
|||||||||||||||||||||||||||
|
Balance at December 31, 2011
|
48,690
|
|
$
|
24,345
|
|
12,700
|
|
$
|
13
|
|
$
|
(57,579
|
)
|
$
|
37,501
|
|
$
|
—
|
|
$
|
(20,065
|
)
|
|||||
|
Net income
|
—
|
|
—
|
|
—
|
|
—
|
|
—
|
|
26,460
|
|
—
|
|
26,460
|
|
|||||||||||
|
Other comprehensive loss
|
—
|
|
—
|
|
—
|
|
—
|
|
—
|
|
—
|
|
(79
|
)
|
(79
|
)
|
|||||||||||
|
Stock-based compensation
|
—
|
|
—
|
|
—
|
|
—
|
|
985
|
|
—
|
|
—
|
|
985
|
|
|||||||||||
|
Cash dividends ($0.46 per share)
|
—
|
|
—
|
|
—
|
|
—
|
|
—
|
|
(39,023
|
)
|
—
|
|
(39,023
|
)
|
|||||||||||
|
Balance at December 31, 2012
|
48,690
|
|
24,345
|
|
12,700
|
|
13
|
|
(56,594
|
)
|
24,938
|
|
$
|
(79
|
)
|
(31,722
|
)
|
||||||||||
|
Net loss
|
—
|
|
—
|
|
—
|
|
—
|
|
—
|
|
(6,163
|
)
|
—
|
|
(6,163
|
)
|
|||||||||||
|
Other comprehensive income
|
—
|
|
—
|
|
—
|
|
—
|
|
—
|
|
—
|
|
184
|
|
184
|
|
|||||||||||
|
Stock-based compensation
|
—
|
|
—
|
|
—
|
|
—
|
|
2,563
|
|
—
|
|
—
|
|
2,563
|
|
|||||||||||
|
Balance at December 31, 2013
|
48,690
|
|
24,345
|
|
12,700
|
|
13
|
|
(54,031
|
)
|
18,775
|
|
$
|
105
|
|
(35,138
|
)
|
||||||||||
|
Net loss
|
—
|
|
—
|
|
—
|
|
—
|
|
—
|
|
(15,486
|
)
|
—
|
|
(15,486
|
)
|
|||||||||||
|
Other comprehensive loss
|
—
|
|
—
|
|
—
|
|
—
|
|
—
|
|
—
|
|
(334
|
)
|
(334
|
)
|
|||||||||||
|
Adjustment for reverse merger
|
7,275
|
|
7
|
|
113,775
|
|
—
|
|
113,782
|
|
|||||||||||||||||
|
Conversion of Series A Preferred
|
(48,690
|
)
|
(24,345
|
)
|
17,527
|
|
18
|
|
24,327
|
|
—
|
|
24,345
|
|
|||||||||||||
|
Cashless exercise of warrants
|
—
|
|
—
|
|
24
|
|
—
|
|
—
|
|
—
|
|
—
|
|
—
|
|
|||||||||||
|
Sale of common stock, net of issuance costs
|
—
|
|
—
|
|
4,000
|
|
4
|
|
37,226
|
|
—
|
|
—
|
|
37,230
|
|
|||||||||||
|
Stock options exercised
|
—
|
|
—
|
|
502
|
|
—
|
|
1,593
|
|
—
|
|
—
|
|
1,593
|
|
|||||||||||
|
Stock-based compensation
|
—
|
|
—
|
|
—
|
|
—
|
|
5,194
|
|
—
|
|
5,194
|
|
|||||||||||||
|
Balance at December 31, 2014
|
—
|
|
$
|
—
|
|
42,028
|
|
$
|
42
|
|
$
|
128,084
|
|
$
|
3,289
|
|
$
|
(229
|
)
|
$
|
131,186
|
|
|||||
See accompanying Notes to the Consolidated Financial Statements
45
Turtle Beach Corporation
Notes to Consolidated Financial Statements
Note
1
. Summary of Significant Accounting Policies
Organization
Turtle Beach Corporation (“Turtle Beach” or the “Company”) is a premier audio innovation company with expertise and experience in developing, commercializing and marketing audio technologies across a range of large addressable markets under the Turtle Beach® and HyperSound® brands. Turtle Beach is a worldwide leading provider of feature-rich headset solutions for use across multiple platforms, including video game and entertainment consoles, handheld consoles, personal computers, Macintosh computers, tablets and mobile devices. HyperSound is a novel patent-protected sound delivery technology that delivers immersive, directional audio offering unique benefits in a variety of commercial and consumer audio devices, including improved clarity and comprehension for hard of hearing listeners.
Turtle Beach (f/k/a Parametric Sound Corporation “Parametric”) is headquartered in San Diego, California and was incorporated in the state of Nevada in 2010.
VTB Holdings, Inc. (“VTBH”), the parent holding company of the historical business of Voyetra Turtle Beach, Inc. (“VTB”), was incorporated in the state of Delaware in 2010 and is headquartered in Valhalla, New York. Voyetra Turtle Beach, Inc. was incorporated in the state of Delaware in 1975.
In October 2012, VTB acquired Lygo International Limited (“Lygo”), a private limited company organized under the laws of England and Wales, which was subsequently renamed Turtle Beach Europe Limited (“TB Europe”).
Merger with Parametric Sound
On
January 15, 2014
(the “Closing Date”), VTB Holdings, Inc., which operated the Turtle Beach business, and Parametric, which operated the HyperSound business, completed the merger (the “Merger”) of Paris Acquisition Corporation (“Merger Sub”) with and into VTBH in accordance with the terms and conditions of the Agreement and Plan of Merger dated August 5, 2013, by and among Parametric, Merger Sub and VTBH (the “Merger Agreement”). As a result of the Merger, VTBH, the accounting acquirer and surviving entity, became a wholly-owned subsidiary of Parametric, a publicly-traded company.
In connection with the Merger, Parametric issued to the former holders of VTBH common stock and Series A Preferred Stock an aggregate of
30,227,100
shares of Parametric Common Stock, par value
$0.001
per share (“Parametric Common Stock”). The number of shares of Parametric Common Stock issued was computed in accordance with a formula specified in the Merger Agreement using an exchange ratio of
0.35997
shares of Parametric Common Stock for every one share of VTBH common stock or Series A Preferred Stock. Accordingly, all historical equity accounts and shares have been retroactively adjusted to reflect this exchange ratio. In addition, in accordance with the terms of the Merger Agreement, all outstanding options to purchase shares of VTBH common stock were converted into options to purchase shares of Parametric Common Stock and were assumed by Parametric. These newly issued shares of Parametric Common Stock, together with the converted options, represented approximately
80%
of the total issued and outstanding shares of Parametric Common Stock, on a fully-diluted basis, as of the closing date of the Merger.
As a result of the
0.35997
exchange ratio pursuant to the Merger, the
35,282,286
shares of VTBH Common Stock presented on its previously filed balance sheet as of December 31, 2013, are presented herein as
12,700,460
shares. On January 15, 2014, upon the close of the Merger, VTBH's Series A Preferred Stock was converted into
17,526,640
shares of Parametric Common Stock, which when added to the outstanding
12,700,460
shares of VTBH common stock then outstanding, comprised the
30,227,100
shares of Parametric Common Stock issued to the former holders discussed above. These shares were combined with
7,274,622
shares of outstanding Parametric Common Stock, to arrive at a total of
37,501,722
shares issued and outstanding as of the closing date of the Merger.
For accounting purposes, the Merger was treated as a “reverse acquisition” and VTBH was considered the accounting acquirer. Accordingly, VTBH’s historical results of operations replace Parametric’s historical results of operations for all periods prior to the Merger, and for all periods following the Merger, the results of operations of both companies will be included.
On May 20, 2014, Parametric filed a Certificate of Amendment to its Articles of Incorporation to change the company's name from “Parametric Sound Corporation” to “Turtle Beach Corporation” effective
May 28, 2014
.
46
Turtle Beach Corporation
Notes to Consolidated Financial Statements - (Continued)
Basis of Presentation
The accompanying consolidated financial statements have been prepared pursuant to the rules and regulations of the Securities and Exchange Commission (“SEC”) and, in the opinion of management, reflect all adjustments (which include normal recurring adjustments) considered necessary for a fair presentation of the financial position, results of operations, and cash flows for the periods presented. All intercompany accounts and transactions have been eliminated in consolidation.
Since VTBH was considered the accounting acquirer, the December 31, 2013 balance sheet and the comparative information for the years ended
December 31, 2013
and
December 31, 2012
contain the results of VTBH only. The results of operations as of, and for the year ended
December 31, 2014
contain the results of the Turtle Beach business and HyperSound business from the
January 15, 2014
acquisition date forward.
Certain prior period amounts in the accompanying consolidated financial statements and related notes have been reclassified to conform to the 2014 presentation.
Uses of Estimates
The preparation of financial statements in conformity with generally accepted accounting principles requires management to use estimates and assumptions that affect the reported amount of assets and liabilities and disclosures of contingent assets and liabilities at the date of the financial statements, as well as the reported amounts of revenue and expenses during the reporting period. The significant estimates and assumptions used by management affect: sales return reserve, allowances for cash discounts, warranty reserve, valuation of inventory, valuation of long-lived assets, goodwill and other intangible assets, depreciation and amortization of long-lived assets, valuation of deferred tax assets, determination of fair value of stock-based awards and share based compensation. The Company evaluates estimates and assumptions on an ongoing basis using historical experience and other factors and adjusts those estimates and assumptions when facts and circumstances dictate. As future events and their effects cannot be determined with precision, actual results could differ from these estimates, and those differences could be material to the consolidated financial statements.
Revenue Recognition and Sales Return Reserve
Net revenue consists primarily of revenue from the sale of gaming headsets and accessories to wholesalers, retailers and to a lesser extent, on-line customers. Revenue from products is recognized when the product has been delivered to a customer, the sales price is fixed and determinable, and collection is reasonably assured. Product is considered delivered to the customer upon passage of title and risk of loss to the customer. Change in title to the product and recognition of revenue occurs upon delivery to the customer when sales terms are free on board (“FOB”) destination and at the time of shipment when the sales terms are FOB shipping point and there is no right of return. Net revenue for on-line purchases is recognized when products are shipped from the Company’s distribution facilities. The Company excludes sales taxes collected from customers from “Net Revenue” in its Consolidated Statements of Operations.
Provisions for cash discounts, quantity rebates, and sales returns are recognized in the period the sale is recorded, based upon our prior experience and current trends, as a reduction of revenue. These revenue reductions are established by the Company based upon management’s best estimates at the time of sale following the historical trend, adjusted to reflect known changes in the factors that impact such reserves and allowances, and the terms of agreements with customers.
47
Turtle Beach Corporation
Notes to Consolidated Financial Statements - (Continued)
Cost of Revenue and Operating Expenses
The following table illustrates the primary costs classified in each major expense category:
|
Cost of Revenue
|
Operating Expenses
|
|
|
Cost to manufacture products;
|
Payroll, bonus and benefit costs;
|
|
|
Freight costs associated with moving product from suppliers to distribution center and to customers;
|
Costs incurred in the research and development of new products and enhancements to existing products;
|
|
|
Costs associated with the movement of merchandise through customs;
|
Depreciation related to demonstration units;
|
|
|
Costs associated with material handling and warehousing;
|
Legal, finance, information systems and other corporate overhead costs;
|
|
|
Product royalty costs.
|
Advertising and marketing costs.
|
|
Product Warranty Obligations
The Company provides for product warranties in accordance with the contract terms given to various customers by accruing estimated warranty costs at the time of revenue recognition. Warranties are generally fulfilled by replacing defective products with new products.
Marketing Costs
Costs associated with the production of advertising, such as print and other costs, as well as costs associated with communicating advertising that has been produced, such as magazine ads, are expensed when the advertising first appears in public. Advertising costs were approximately
$4.8 million
,
$7.7 million
and
$8.2 million
for the years ended December 31, 2014, 2013 and 2012.
The Company also incurs co-operative advertising costs that represent reimbursements to customers for shared marketing expenses for sale of its products. These reimbursements are recorded as reductions of net revenue based on a percentage of sales for all period presented. Co-operative advertising reimbursements were approximately
$6.4 million
,
$4.3 million
and
$3.8 million
for the years ended December 31, 2014, 2013 and 2012.
Deferred Financing Costs
Deferred financing costs represent costs incurred in conjunction with our debt financing activities and are capitalized and amortized over the life of the related financing arrangements. If the debt is retired early, the related unamortized deferred financing costs are written off in the period the debt is retired and are recorded in the statement of operations under the caption “
Interest expense
.”
Stock-Based Compensation
Compensation costs related to stock options and restricted stock grants are calculated based on the fair value of the stock-based
awards on the date of grant, net of estimated forfeitures. The grant date fair value of awards is determined using the Black-Scholes option-pricing model and the related stock-based compensation is recognized on a straight-line basis, over the period in which an employee is required to provide service in exchange for the award, which is generally
four
years.
The Company estimates its forfeiture rate based on an analysis of actual forfeitures and will continue to evaluate the adequacy of the forfeiture rate based on actual forfeiture experience, analysis of employee turnover behavior, and other factors. The impact from any forfeiture rate adjustment would be recognized in the period of adjustment and if the actual number of future forfeitures differs from estimates, the Company might be required to record adjustments to stock-based compensation expense.
For stock-based awards issued to non-employees, including consultants, compensation expense is based on the fair value of the
awards calculated using the Black-Scholes option-pricing model over the service performance period. The fair value of options
granted to non-employees for each reporting period is re-measured over the vesting period and recognized as an expense over the period the services are received.
48
Turtle Beach Corporation
Notes to Consolidated Financial Statements - (Continued)
Exit and Disposal Costs
Management-approved restructuring activities are periodically initiated to achieve cost savings through reduced operational redundancies and to position the Company strategically in the market in response to prevailing economic conditions and associated customer demand. Costs associated with restructuring actions can include severance, infrastructure charges to vacate facilities or consolidate operations, contract termination costs and other related charges. For involuntary separation plans, a liability is recognized when it is probable and reasonably estimable. For one-time termination benefits, such as additional severance pay or benefit payouts, and other exit costs, such as lease termination costs, the liability is measured and recognized initially at fair value in the period in which the liability is incurred, with subsequent changes to the liability recognized as adjustments in the period of change.
Net Earnings (Loss) per Common Share
Basic earnings (loss) per share is calculated by dividing net income (loss) associated with common stockholders by the weighted average number of common shares outstanding during the period. Diluted earnings (loss) per share assumes the issuance of additional shares of common stock by the Company upon exercise of all outstanding stock options and contingently issuable securities if the effect is dilutive, in accordance with the treasury stock method.
Current period and historical weighted-average shares amounts reflect the application of a
0.35997
conversion ratio to historical VTBH share and weighted-average share amounts.
Cash Equivalents
Cash and short-term highly liquid investments with original maturity dates of three months or less at time of purchase and no redemption restrictions are considered cash and cash equivalents. Cash and cash equivalents consist of cash on hand and money market accounts.
Inventories, net
Inventories consist primarily of finished goods and related component parts, and are stated at the lower of weighted average cost or market value (estimated net realizable value). The Company maintains an inventory allowance for returned goods, slow-moving and unused inventories based on the historical trend and estimates. Inventory write-downs, once established, are not reversed as they establish a new cost basis for the inventory. Inventory write-downs are included as a component of cost of revenues in the accompanying consolidated statements of operations.
Property and Equipment, net
Property and equipment are presented at cost less accumulated depreciation and amortization. Repairs and maintenance expenditures are expensed as incurred. Depreciation and amortization are computed on a straight-line basis over the following estimated useful lives:
|
Estimated Life
|
||
|
Machinery and equipment
|
3 years
|
|
|
Software and software development
|
2-3 years
|
|
|
Furniture and fixtures
|
5 years
|
|
|
Tooling
|
2 years
|
|
|
Leasehold improvements
|
5 years or term of lease, if shorter
|
|
|
Demonstration units and convention booths
|
2 years
|
|
49
Turtle Beach Corporation
Notes to Consolidated Financial Statements - (Continued)
Valuation of Long-Lived and Intangible Assets and Goodwill
At acquisition, we estimate and record the fair value of purchased intangible assets, which primarily consists of in-process research and development, customer relationships, trademarks and trade names, and patents. The fair values of these intangible assets are estimated based on our assessment. Goodwill is the excess of the purchase price over the fair value of identifiable net assets acquired in business combinations. Goodwill and certain other intangible assets having indefinite lives are not amortized to earnings, but instead are subject to periodic testing for impairment. Intangible assets determined to have definite lives are amortized over their remaining useful lives.
Long-lived and intangible assets and goodwill are assessed for the potential impairment of intangible and fixed assets whenever events or changes in circumstances indicate that full recoverability of net asset balances through future cash flows is in question. Goodwill and indefinite-lived intangible assets are assessed at least annually, but also whenever events or changes in circumstances indicate the carrying values may not be recoverable. Factors that could trigger an impairment review, include (a) significant underperformance relative to historical or projected future operating results; (b) significant changes in the manner of or use of the acquired assets or the strategy for our overall business; (c) significant negative industry or economic trends; (d) significant decline in our stock price for a sustained period; and a decline in our market capitalization below net book value.
Assessment for possible impairment is based on the Company’s ability to recover the carrying value of the long-lived asset from the expected future pre-tax cash flows. The expected future pre-tax cash flows are estimated based on historical experience, knowledge and market data. Estimates of future cash flows require the Company to make assumptions and to apply judgment, including forecasting future sales and expenses and estimating the useful lives of assets. If the expected future cash flows related to the long-lived assets are less than the assets’ carrying value, an impairment charge is recognized for the difference between estimated fair value and carrying value.
When performing our evaluation of goodwill for impairment, if we conclude qualitatively that it is not more likely than not that the fair value of the reporting unit is less than its carrying amount, then the two-step impairment test is not required. If we are unable to reach this conclusion, then we would perform the two-step impairment test. Initially, the fair value of the reporting unit is compared to its carrying amount. To the extent the carrying amount of a reporting unit exceeds the fair value of the reporting unit; we are required to perform a second step, as this is an indication that the reporting unit goodwill may be impaired. In this step, we compare the implied fair value of the reporting unit goodwill with the carrying amount of the reporting unit goodwill and recognize a charge for impairment to the extent the carrying value exceeds the implied fair value. The implied fair value of goodwill is determined by allocating the fair value of the reporting unit to all of the assets (recognized and unrecognized) and liabilities of the reporting unit in a manner similar to a purchase price allocation. The residual fair value after this allocation is the implied fair value of the reporting unit goodwill. In addition, identifiable intangible assets, except for the IPR&D asset, having indefinite lives are reviewed for impairment on an annual basis using a methodology consistent with that used to evaluate goodwill.
There are inherent assumptions and estimates used in developing future cash flows requiring management judgment in applying these assumptions and estimates to the analysis of identifiable intangible assets and long‑lived asset impairment including projecting revenues, interest rates and the cost of capital. Many of the factors used in assessing fair value are outside our control and it is reasonably likely that assumptions and estimates will change in future periods. These changes can result in future impairments. In the event our planning assumptions were modified resulting in impairment to our assets, the associated expense would be included in the Consolidated Statements of Operations, which could materially impact our business, financial condition and results of operations.
In connection with the Merger, the Company performed a valuation of the acquired goodwill and intangible assets and recorded
$81.0 million
of goodwill based on the fair values of the assets acquired and liabilities assumed. The Company conducted its annual impairment assessment on November 1, 2014 taking a qualitative evaluation approach to determine if there were any adverse market factors or changes in circumstances that would indicate that the carrying value of goodwill as determined in connection with the current year Merger may not be recoverable. Management noted that the markets have not limited access to capital that could potentially alter our investment in and/or development of the HyperSound technology; that the Company has received clearance from the U.S. Food and Drug Administration to market the HyperSound Audio System to improve the clarity and comprehension of sounds from various sources for listeners with hearing loss; and that the Company completed supply chain improvements and product development efforts that have reduced projected cost structures as well as established the framework to generate revenue starting in 2015 with the anticipated hearing health care product launch. However, due to a significant decline in the Company's stock price subsequent to our evaluation, management further conducted a qualitative assessment and concluded that the market capitalization of
$242.9 million
resulted in an implied control premium of
7%
and that goodwill was not impaired. Accordingly, management determined that no events or changes in circumstances indicated that
50
Turtle Beach Corporation
Notes to Consolidated Financial Statements - (Continued)
the carrying value may not be recoverable and further consideration of potential goodwill impairment was not considered necessary.
In addition, in-process research and development acquired in connection with the Merger is considered an indefinite-lived intangible asset until the completion or abandonment of the associated efforts. Accordingly, during the development period, the IPR&D is not amortized but rather subject to impairment review, and based on the above qualitative factors, no impairment indicators were noted.
Management's forecasts of planned revenue are largely dependent on the final development and launch of the HyperSound hearing healthcare product to generate the projected revenue in subsequent years. If the performance of our HyperSound products in the hearing healthcare market does not meet expectations based on recent market data, a future impairment charge could result for a portion or all of the goodwill noted previously as the change in fair value would occur outside the purchase price allocation period. The amount of any impairment is dependent on the performance of the business which is dependent upon a number of variables which cannot be predicted with certainty.
Income Taxes
The Company accounts for income taxes in accordance with the asset and liability method. Under the asset and liability method, deferred tax assets and liabilities are recognized based on the differences between the financial statement carrying value of existing assets and liabilities and their respective tax bases. The Company had elected to record a “deferred charge” for basis differences relating to intra-entity profits as recognition as a deferred tax asset is prohibited.
A valuation allowance is established for deferred tax assets when management anticipates that it is more likely than not that all, or a portion of these assets would not be realized. In determining whether a valuation allowance is warranted, all positive and negative evidence and all sources of taxable income such as prior earnings history, expected future earnings, carryback and carryforward periods and tax strategies are considered to estimate if sufficient future taxable income will be generated to realize the deferred tax asset. The assessment of the adequacy of a valuation allowance is based on estimates of taxable income by jurisdiction and the period over which deferred tax assets will be recoverable. In the event that actual results differ from these estimates, or these estimates are adjusted in future periods for current trends or expected changes in assumptions, the Company may need to modify the level of valuation allowance which could materially impact our business, financial condition and results of operations.
The tax effects of uncertain tax positions taken or expected to be taken in income tax returns are recognized only if they are “more likely-than-not” to be sustained on examination by the taxing authorities, based on the technical merits as of the reporting date. The tax benefits recognized in the financial statements from such positions are measured based on the largest benefit that has a greater than fifty percent likelihood of being realized upon ultimate settlement. The Company recognizes estimated accrued interest and penalties related to uncertain tax positions in income tax expense.
The Company and its domestic subsidiaries file a consolidated federal income tax return, while the Company’s foreign subsidiary files in its respective local jurisdictions.
Fair Value of Financial Instruments
The Company determines fair value as the price that would be received to sell an asset or paid to transfer a liability in an orderly transaction between market participants at the measurement date. The Company uses a hierarchical structure to prioritize the inputs used to measure fair value into three broad levels. The fair value hierarchy gives the highest priority to quoted prices in active markets for identical assets or liabilities (Level 1), then to quoted market prices for similar assets or liabilities in active or inactive markets (Level 2) and gives the lowest priority to unobservable inputs (Level 3).
Financial instruments consist of cash and cash equivalents, accounts receivable, accounts payable, derivative instruments, revolving line of credit and long-term debt. Cash equivalents are stated at amortized cost, which approximated fair value as of the consolidated balance sheet dates, due to the short period of time to maturity; and accounts receivable and accounts payable are stated at their carrying value, which approximates fair value due to the short time to the expected receipt or payment. The revolving line of credit and long-term debt are stated at the carrying value as the stated interest rate approximates market rates currently available to the Company, which are considered Level 2 inputs.
51
Turtle Beach Corporation
Notes to Consolidated Financial Statements - (Continued)
The Company did not have any non-financial assets or non-financial liabilities recognized at fair value on a recurring basis at
December 31, 2014
and
2013
.
Foreign Currency Translation
Balance Sheet accounts of the Company’s Europe subsidiary operations are translated at the exchange rate in effect at the end of each period. Statement of Operations accounts are translated using the weighted average of the prevailing exchange rates during each period. Gains or losses resulting from foreign currency transactions are included in the Company’s Consolidated Statements of Operations under the caption “
Other non-operating expense, net
” whereas, translation adjustments are reflected in the Consolidated Statements of Comprehensive Income (Loss) under the caption “Foreign currency translation adjustment.”
Concentration of Credit Risk
Financial instruments that potentially subject the Company to concentrations of credit risk consist principally of investments in cash, cash equivalents and accounts receivables. The Company is exposed to credit risks and liquidity in the event of default by the financial institutions or issuers of investments in excess of FDIC insured limits. The Company performs periodic evaluations of the relative credit standing of these financial institutions and limits the amount of credit exposure with any institution.
Accounts receivable are unsecured and represent amounts due based on contractual obligations of customers. Our
three
largest individual customers accounted for approximately
45%
of our gross sales in the aggregate for the
year ended
December 31, 2014
, or individually
15%
,
15%
and
15%
, compared to
16%
,
15%
and
14%
in 2013 and
18%
,
16%
and
12%
in 2012. In addition,
two
customers accounted for
26%
and
23%
, respectively, of accounts receivable as of
December 31, 2014
and
24%
and
20%
, respectively, for
December 31, 2013
.
Concentrations of credit risk with respect to accounts receivable are mitigated due to the large number of customers, and by . performing ongoing credit evaluations of customers to assess the probability of collection based on a number of factors, including past transaction experience with the customer, evaluation of their credit history, limiting the credit extended, and review of the invoicing terms of the contract. In addition the Company has credit insurance in place through a third party insurer against defaults by certain domestic and international customers, subject to policy limits. The Company generally does not require customers to provide collateral to support accounts receivable. The Company has recorded an allowance for doubtful accounts for those receivables that were determined not to be collectible.
Foreign cash balances at
December 31, 2014
and
2013
were
$2.5 million
and
$1.4 million
, respectively.
Segment Information
The Company has determined it has
two
operating segments - Voyetra Turtle Beach and HyperSound. The Company’s operating segments are similar in nature of product, as both operate in the audio technologies market offering a variety of commercial and consumer audio devices. The entire business is managed by a single management team whose Chief Operating Decision Maker is the the Chief Executive Officer. Accordingly, the Company has aggregated its operating segments based on the aggregation criteria, which states that two or more operating segments may be aggregated into a single reportable segment if the segments have similar economic characteristics, products, production processes, regulatory environments, clients and methods of distribution.
Recent Accounting Pronouncements
In August 2014, the Financial Accounting Standards Board (“FASB”) issued Accounting Standards Update (“ASU”) 2014-15,
Presentation of Financial Statements-Going Concern (Subtopic 205-40): Disclosure of Uncertainties about an Entity’s Ability to Continue as a Going Concern,
which defines management's responsibility to assess an entity's ability to continue as a going concern, and to provide related footnote disclosures if there is substantial doubt about its ability to continue as a going concern. The pronouncement is effective for annual reporting periods ending after December 15, 2016 with early adoption permitted. The adoption of this guidance is not expected to have a significant impact on the Company's consolidated financial statements.
In May 2014, the FASB issued ASU No. 2014-09,
Revenue from Contracts with Customers
, which requires entities to recognize revenue in a way that depicts the transfer of promised goods or services to customers in an amount that reflects the
52
Turtle Beach Corporation
Notes to Consolidated Financial Statements - (Continued)
consideration to which the entity expects to be entitled to in exchange for those goods or services. The new guidance also requires additional disclosure about the nature, amount, timing and uncertainty of revenue and cash flows arising from customer contracts, including significant judgments and changes in judgments and assets recognized from costs incurred to obtain or fulfill a contract. The amendment is effective for annual reporting periods beginning after December 15, 2016 and interim periods within those annual periods. The Company is currently evaluating the impact, if any, this new standard will have on our consolidated financial statements and has not yet determined the method of adoption.
In April 2014, the FASB issued ASU No. 2014-08,
Reporting Discontinued Operations and Disclosures of Disposals of Components of an Entity
, which changes the criteria for determining which disposals can be presented as discontinued operations and modifies related disclosure requirements. Under the new guidance, a discontinued operation is defined as a disposal of a component or group of components that is disposed of or is classified as held for sale and “represents a strategic shift that has (or will have) a major effect on an entity’s operations and financial results.” The new standard applies prospectively to new disposals and new classifications of disposal groups as held for sale after the effective date. The amendment is effective for annual reporting periods beginning after December 15, 2014 and interim periods within those annual periods. The adoption of this guidance is not expected to have a significant impact on the Company's consolidated financial statements.
Note
2
. Business Combinations
Merger with Parametric Sound
On January 15, 2014, VTBH completed the Merger with and into a wholly-owned subsidiary of Turtle Beach (f/k/a Parametric), a publicly-traded audio technology company focused on developing new directed audio products for commercial, consumer and health care markets, in an all-stock, tax-free reorganization pursuant to the Merger Agreement. VTBH entered into the Merger to acquire and commercialize Parametric’s technology and gain access to capital market opportunities as a public company. The results of Parametric’ operations, including
$0.7 million
of revenue and
$13.5 million
of pre-tax loss, have been included in the consolidated statements of operations from the date of acquisition.
Business Transaction Costs
Business transaction costs as a result of the merger of
$3.7 million
and
$3.9 million
were recognized for the years ended
December 31, 2014
and
December 31, 2013
, respectively. The components of business transaction costs are presented below.
|
Year Ended
|
|||||||
|
December 31,
|
|||||||
|
2014
|
2013
|
||||||
|
(in thousands)
|
|||||||
|
Legal fees
|
$
|
786
|
|
$
|
1,452
|
|
|
|
Accounting fees
|
84
|
|
2,254
|
|
|||
|
Advisory fees
|
2,219
|
|
—
|
|
|||
|
Termination and severance
|
450
|
|
—
|
|
|||
|
Other
|
205
|
|
158
|
|
|||
|
Total Transaction Costs
|
$
|
3,744
|
|
$
|
3,864
|
|
|
Advisory fees include success based fees payable to investment bankers for both merger parties.
Purchase Consideration and Net Assets Acquired
The fair value of Parametric Common Stock used in determining the purchase price was
$14.30
per share, the closing market price on January 15, 2014. The fair value of outstanding stock options included in the purchase consideration was determined by calculating the cumulative vesting attributable to Parametric employees for periods prior to the Merger, using the Black-Scholes option pricing model. Assumptions used in Black-Scholes calculations during such periods included: volatility ranging from 87% to 90%; risk-free interest rates ranging between 0.47% and 0.92%; forfeiture rates ranging from 1.1% to 4.1%; and expected lives ranging from 3.28 to 4.61 years.
53
Turtle Beach Corporation
Notes to Consolidated Financial Statements - (Continued)
The purchase price is as follows:
|
(in thousands)
|
|||
|
Fair Value of Parametric shares outstanding
|
$
|
104,027
|
|
|
Fair Value of Parametric stock options
|
9,755
|
|
|
|
Purchase Price
|
$
|
113,782
|
|
The following presents the allocation of the purchase consideration to the assets acquired and liabilities assumed:
|
(in thousands)
|
|||
|
Cash and cash equivalents
|
$
|
4,093
|
|
|
Accounts receivable
|
47
|
|
|
|
Deferred tax asset
|
6,696
|
|
|
|
Other current assets
|
710
|
|
|
|
Property and equipment
|
206
|
|
|
|
Intangible assets:
|
|||
|
In-process research and development (IPR&D)
|
27,100
|
|
|
|
Developed technology
|
8,880
|
|
|
|
Customer relationships
|
270
|
|
|
|
Trade name
|
170
|
|
|
|
Goodwill
|
80,974
|
|
|
|
Accounts payable and accrued liabilities
|
(1,769
|
)
|
|
|
Capital lease obligation
|
(120
|
)
|
|
|
Deferred tax liabilities
|
(13,475
|
)
|
|
|
Total Net Assets Acquired
|
$
|
113,782
|
|
The amount allocated to in-process research and development represents an estimate of the fair value of purchased in-process technology for research projects (“IPR&D”), primarily related to directed audio solutions that beam sound to a specific listening area without the ambient noise of traditional speakers. IPR&D is considered an indefinite-lived intangible asset until the completion or abandonment of the associated research and development efforts. Accordingly, during the development period, the IPR&D is not amortized but rather subject to impairment review. No amortization of the IPR&D has been reflected in the combined consolidated financial statements as the assets are considered indefinite-lived.
The acquired intangible assets relating to developed technology, customer relationships and trade name are subject to amortization. Developed technology is being amortized over an estimated useful life of approximately
seven
years with the amortization being included within cost of revenue. Customer relationships and trade name are being amortized over an estimated useful life of
two
years and
five
years with the amortization being included within sales and marketing expense.
The excess purchase consideration over the fair values of assets acquired and liabilities assumed is recorded as goodwill. Goodwill is not amortized but tested for impairment on an annual basis or when the indicator for impairment exists.
The goodwill recorded is not tax deductible since the transaction was structured as a tax-free exchange.
Amounts allocated to deferred tax assets of
$6.7 million
and deferred tax liabilities of
$13.5 million
relate to acquired net operating loss carryforwards and indefinite lived intangible assets, respectively.
Pro Forma Financial Information (Unaudited)
The following table summarizes certain supplemental pro forma financial information which was prepared as if the Merger had occurred as of January 1, 2013. The unaudited pro forma financial information was prepared for comparative purposes only and is not necessarily indicative of what would have occurred had the acquisition been made at that time or of results which may occur in the future.
54
Turtle Beach Corporation
Notes to Consolidated Financial Statements - (Continued)
|
Year Ended
|
Year Ended
|
||||||||||||||
|
December 31, 2014
|
December 31, 2013
|
||||||||||||||
|
Reported
|
Proforma
|
Reported
|
Proforma
|
||||||||||||
|
(in thousands)
|
|||||||||||||||
|
Net Revenue
|
$
|
186,176
|
|
$
|
186,176
|
|
$
|
178,470
|
|
$
|
178,992
|
|
|||
|
Net Loss
|
$
|
(15,486
|
)
|
$
|
(17,576
|
)
|
$
|
(6,163
|
)
|
$
|
(15,536
|
)
|
|||
Pro forma results for the year ended
December 31, 2014
include
$1.2 million
in pre-merger business transaction costs in addition to the
$3.7 million
in merger-related business transaction costs recorded in the Consolidated Financial Statements.
Pro forma results for the year ended
December 31, 2013
include
$2.3 million
in pre-merger business transaction costs in addition to the
$3.9 million
in merger-related business transaction costs recorded in the Consolidated Financial Statements.
Acquisition of Lygo
In October 2012, VTB acquired all of the common stock of Lygo International Limited (“Lygo”) for a purchase price of
$14.4 million
, which included
$5.5 million
in cash and the effective settlement of
$8.9 million
of accounts receivable from Lygo, in order to increase its market share by leveraging certain distribution channels to reach new customers and expand to new international markets. Lygo had historically been VTB’s sole distributor in Europe. Subsequent to the acquisition the Lygo business formally changed its name to Turtle Beach Europe (“TB Europe”), and the results of operations are included prospectively from October 1, 2012.
The following presents the allocation of the purchase consideration to the assets acquired and liabilities assumed:
|
(in thousands)
|
|||
|
Cash
|
$
|
133
|
|
|
Accounts receivable
|
4,046
|
|
|
|
Inventory
|
9,957
|
|
|
|
Other current assets
|
321
|
|
|
|
Property and equipment
|
12
|
|
|
|
Intangible assets:
|
|||
|
Customer relationships
|
5,526
|
|
|
|
Non-compete agreement
|
177
|
|
|
|
Accounts payable and accrued liabilities
|
(223
|
)
|
|
|
Other liabilities
|
(1,889
|
)
|
|
|
Derivative liability
|
(1,369
|
)
|
|
|
Total Net Assets Acquired
|
16,691
|
|
|
|
Purchase Price
|
(14,388
|
)
|
|
|
Gain on Bargain Purchase
|
$
|
2,303
|
|
The excess of the net assets acquired over consideration transferred was
$2.3 million
, which is recorded as a gain on bargain purchase from acquisition. As a result of the bargain purchase, the Company reassessed the recognition and measurement of identifiable assets acquired and liabilities assumed and concluded that the valuation procedures and resulting measures were appropriate. The bargain purchase gain was primarily driven from the exclusive nature of the arrangement between the two companies prior to the acquisition whereby Lygo did not generate significant revenue from other vendors’ products. As a result, the value of the customer relationships, the primary intangible asset acquired, was attributed to the difference between the cash flows associated with owning the asset versus building the asset.
For tax purposes, the acquired intangible assets are not amortized. Accordingly, a deferred tax liability was recorded on the acquisition date for the difference between the book and cost basis related to the acquired intangible assets.
55
Turtle Beach Corporation
Notes to Consolidated Financial Statements - (Continued)
In connection with the acquisition, the Company issued
398,010
phantom units under the 2011 Phantom Equity Appreciation Plan, which had an exercise price of
$2.01
per share, to continuing employees of Lygo. The phantom units will vest upon the occurrence of a performance condition and upon the satisfaction of service conditions. These equity awards were not included in the Company’s determination of the total purchase consideration as these equity awards have post-acquisition performance and service conditions.
Note
3
. Equity Offering
On April 24, 2014, the Company entered into an Underwriting Agreement (the “Underwriting Agreement”) with Needham & Company, LLC, as representative for the several other underwriters named therein, relating to an underwritten public offering (the “Offering”) of
4,000,000
shares of our common stock, at a price to the public of
$10.00
per share (the “Offering Price”). Under the terms of the Underwriting Agreement, the Company also granted the underwriters a 30-day option to purchase up to an additional
600,000
shares of common stock at the Offering Price less the underwriting discount and estimated offering expenses payable by Turtle Beach. Total net proceeds received from the Offering totaled approximately
$37.2 million
after deducting the underwriting discount and offering expenses. The net proceeds from the Offering were used to repay certain indebtedness, including
$10 million
then outstanding under the
revolving credit agreement
as contemplated upon the occurrence of a public offering, and for working capital and other general corporate purposes. See Note
8
,
“Credit Facilities and Long-Term Debt”
for further information.
Note
4
. Fair Value Measurement
Cash equivalents are stated at amortized cost, which approximated fair value as of the consolidated balance sheet dates, due to the short period of time to maturity. Cash, accounts receivable and accounts payable are stated at their carrying value, which approximates fair value due to the short time to the expected receipt or payment. The revolving credit facil
ities and long-term debt and subordinated notes are stated at the carrying value, which also approximates fair value as the stated interest rate approximates market rates currently available to the Company. As of
December 31, 2014
and
2013
, the Company has not elected the fair value option for any financial assets and liabilities for which such an election would have been permitted.
The following table sets forth the fair value of financial assets and liabilities by level within the fair value hierarchy:
|
December 31, 2013
|
|||||||||||||||
|
Level I
|
Level II
|
Level III
|
Total
|
||||||||||||
|
(in thousands)
|
|||||||||||||||
|
Financial Assets and Liabilities:
|
|||||||||||||||
|
Cash and cash equivalents - money market funds
|
$
|
19
|
|
$
|
—
|
|
$
|
—
|
|
$
|
19
|
|
|||
|
Total financial assets
|
$
|
19
|
|
$
|
—
|
|
$
|
—
|
|
$
|
19
|
|
|||
|
Other current liabilities - derivative liabilities
|
$
|
—
|
|
$
|
(392
|
)
|
$
|
—
|
|
$
|
(392
|
)
|
|||
|
Total financial liabilities
|
$
|
—
|
|
$
|
(392
|
)
|
$
|
—
|
|
$
|
(392
|
)
|
|||
At
December 31, 2014
, there were no outstanding financial assets and liabilities recorded at fair value on a recurring basis.
56
Turtle Beach Corporation
Notes to Consolidated Financial Statements
Note
5
. Allowance for Sales Returns
The following table provide the changes in our sales return reserve, which is classified as a reduction of accounts receivable:
|
Year Ended
|
|||||||||||
|
December 31,
|
|||||||||||
|
2014
|
2013
|
2012
|
|||||||||
|
(in thousands)
|
|||||||||||
|
Balance, beginning of period
|
$
|
6,266
|
|
$
|
7,748
|
|
$
|
6,152
|
|
||
|
Reserve accrual
|
13,042
|
|
20,146
|
|
19,659
|
|
|||||
|
Recoveries and deductions, net
|
(15,153
|
)
|
(21,628
|
)
|
(18,063
|
)
|
|||||
|
Balance, end of period
|
$
|
4,155
|
|
$
|
6,266
|
|
$
|
7,748
|
|
||
Note
6
. Composition of Certain Financial Statement Items
Inventories, net
Inventories, net consist of the following:
|
December 31, 2014
|
|
December 31, 2013
|
|||||
|
(in thousands)
|
|||||||
|
Raw materials
|
$
|
2,065
|
|
$
|
5,499
|
|
|
|
Finished goods
|
36,335
|
|
44,144
|
|
|||
|
Total inventories, net
|
$
|
38,400
|
|
$
|
49,643
|
|
|
Property and Equipment, net
Property and equipment, net consists of the following:
|
December 31, 2014
|
|
December 31, 2013
|
|||||
|
(in thousands)
|
|||||||
|
Machinery and equipment
|
$
|
599
|
|
$
|
249
|
|
|
|
Software and software development
|
847
|
|
581
|
|
|||
|
Furniture and fixtures
|
226
|
|
144
|
|
|||
|
Tooling
|
2,417
|
|
1,756
|
|
|||
|
Leasehold improvements
|
104
|
|
59
|
|
|||
|
Demonstration units and convention booths
|
13,702
|
|
10,014
|
|
|||
|
Total property and equipment, gross
|
17,895
|
|
12,803
|
|
|||
|
Less: accumulated depreciation and amortization
|
(11,173
|
)
|
(5,434
|
)
|
|||
|
Total property and equipment, net
|
$
|
6,722
|
|
$
|
7,369
|
|
|
Depreciation and amortization expense on property and equipment, for the years ended
December 31, 2014
,
2013
and
2012
was
$5.8 million
,
$4.4 million
and
$1.9 million
, respectively.
57
Turtle Beach Corporation
Notes to Consolidated Financial Statements - (Continued)
Note
7
. Goodwill and Other Intangible Assets
Goodwill
Changes in the carrying values of goodwill for the
year ended
December 31, 2014
are as follows:
|
(in thousands)
|
|||
|
Balance as of January 1, 2014
|
$
|
—
|
|
|
Activity in 2014
|
|||
|
Acquisition of HyperSound business
|
$
|
80,974
|
|
|
Balance as of December 31, 2014
|
$
|
80,974
|
|
Acquired Intangible Assets
Acquired identifiable intangible assets, and related accumulated amortization, as of
December 31, 2014
and
December 31, 2013
consist of:
|
December 31, 2014
|
|||||||||||
|
Gross Carrying Value
|
Accumulated Amortization
|
Net Book Value
|
|||||||||
|
(in thousands)
|
|||||||||||
|
Customer relationships
|
$
|
5,597
|
|
$
|
2,323
|
|
$
|
3,274
|
|
||
|
Non-compete agreements
|
171
|
|
171
|
|
—
|
|
|||||
|
In-process Research and Development
|
27,100
|
|
—
|
|
27,100
|
|
|||||
|
Developed technology
|
8,880
|
|
104
|
|
8,776
|
|
|||||
|
Trade names
|
170
|
|
33
|
|
137
|
|
|||||
|
Patent and trademarks
|
439
|
|
—
|
|
439
|
|
|||||
|
Total Intangible Assets
|
$
|
42,357
|
|
$
|
2,631
|
|
$
|
39,726
|
|
||
|
December 31, 2013
|
|||||||||||
|
Gross Carrying Value
|
Accumulated Amortization
|
Net Book Value
|
|||||||||
|
(in thousands)
|
|||||||||||
|
Customer relationships
|
$
|
5,526
|
|
$
|
1,623
|
|
$
|
3,903
|
|
||
|
Non-compete agreements
|
177
|
|
108
|
|
69
|
|
|||||
|
Total
|
$
|
5,703
|
|
$
|
1,731
|
|
$
|
3,972
|
|
||
In October 2012, VTB acquired Lygo International Limited, subsequently renamed TB Europe. The acquired intangible assets relating to customer relationships and non-compete agreements are being amortized over an estimated useful life of
thirteen
years and
two
years, respectively, with the amortization being included within sales and marketing expense.
In January 2014, the merger between VTBH and Parametric was completed. The acquired intangible assets relating to developed technology, customer relationships and trade name are subject to amortization. Developed technology is being amortized over an estimated economic useful life of approximately
seven
years with the amortization being included within cost of revenue. Customer relationships and trade name are being amortized over an estimated useful life of
two
years and
five
years, respectively, with the amortization being included within sales and marketing expense. IPR&D is considered an indefinite-lived intangible asset until the completion or abandonment of the associated research and development efforts. Accordingly, during the development period, the IPR&D is not amortized but rather subject to impairment review. No impairment indicators were noted.
Amortization expense related to definite lived intangible assets of
$1.1 million
,
$0.9 million
and
$0.7 million
for the years ended
December 31, 2014
,
2013
and
2012
, respectively.
58
Turtle Beach Corporation
Notes to Consolidated Financial Statements - (Continued)
As of
December 31, 2014
, estimated annual amortization expense related to definite lived intangible assets in future periods is as follows:
|
(in thousands)
|
|||
|
2015
|
$
|
2,603
|
|
|
2016
|
2,030
|
|
|
|
2017
|
1,866
|
|
|
|
2018
|
1,789
|
|
|
|
2019
|
1,697
|
|
|
|
Thereafter
|
2,202
|
|
|
|
Total
|
$
|
12,187
|
|
Note
8
. Credit Facilities and Long-Term Debt
|
December 31, 2014
|
December 31, 2013
|
||||||
|
(in thousands)
|
|||||||
|
Revolving credit facility, maturing March 2019
|
$
|
36,863
|
|
$
|
—
|
|
|
|
Revolving line of credit, repaid in March 2014
|
—
|
|
39,736
|
|
|||
|
Term loans
|
7,692
|
|
14,500
|
|
|||
|
Subordinated notes
|
—
|
|
10,342
|
|
|||
|
Total outstanding debt
|
44,555
|
|
64,578
|
|
|||
|
Less: current portion of revolving line of credit
|
(36,863
|
)
|
(39,736
|
)
|
|||
|
Less: current portion of term loan
|
(1,923
|
)
|
(14,500
|
)
|
|||
|
Total noncurrent portion of long-term debt
|
$
|
5,769
|
|
$
|
10,342
|
|
|
Total interest expense, inclusive of amortization of deferred financing costs, on long-term debt obligations was
$6.0 million
,
$5.6 million
and
$3.7 million
for the years ended
December 31, 2014
,
2013
and
2012
, respectively.
Amortization of deferred financing costs was
$2.6 million
,
$1.6 million
and
$0.8 million
for the years ended
December 31, 2014
,
2013
and
2012
, respectively. The amount for the year ended
December 31, 2014
includes the write-off of $
2.2 million
in deferred financing costs associated with the repayment of the Company's former loan and security agreement (see below). Included for the years ended December 31, 2013 and 2012 were the write-offs of
$0.4 million
and
$0.3 million
, respectively, in deferred financing costs related to the partial extinguishment of term notes.
Revolving Credit Facility
On March 31, 2014, Turtle Beach and certain of its subsidiaries entered into a new asset-based revolving credit agreement (“Credit Facility”)
with Bank of America, N.A., as Agent, Sole Lead Arranger and Sole Bookrunner, which replaced the then existing loan and security agreement (“the Credit Agreement” as described below). The Credit Facility,
which
expires on
March 31, 2019
, provides for a line of credit of up to
$60 million
inclusive of a
sub-facility limit of
$10 million
for
TB Europe, a wholly owned subsidiary of Turtle Beach. The Credit Facility may be used for working capital,
the issuance of bank guarantees,
letters of credit and other corporate purposes.
The actual credit availability for loans and letters of credit under Credit Facility is governed by a borrowing base determined by the application of specified percentages to certain eligible assets, primarily
eligible trade accounts receivable and inventories, and is subject to discretionary reserves and revaluation adjustments.
Amounts outstanding under the Credit Facility bear interest at a rate equal to
either a rate published by Bank of America or the LIBOR rate,
plus in each case, an applicable margin, which is between
1.00%
to
1.50%
for U.S. base rate loans
and between
2.00%
to
2.50%
for U.S. LIBOR loans and U.K. loans. As of
December 31, 2014
, interest rates for outstanding borrowings were
4.75%
for base rate loans and
2.67%
for LIBOR rate loans. In addition, Turtle Beach is required to pay a
59
Turtle Beach Corporation
Notes to Consolidated Financial Statements - (Continued)
commitment fee on the unused revolving loan commitment at a rate ranging from
0.25%
to
0.50%
, and letter of credit fees and agent fees.
If certain availability thresholds are not met, meaning that the Company does not have receivables and inventory which are eligible to borrow on under the Credit Facility in excess of amounts borrowed, the Credit Facility requi
res the Company and its restricted subsidiaries to maintain a fixed charge coverage ratio. The fixed charge ratio is defined as the ratio, determined
on a consolidated basis for the most recent four fiscal quarters, of (a) EBITDA minus capital expenditures, excluding those financed through other instruments, and cash taxes paid, and (b) Fixed Charges defined as the sum of cash interest expense plus scheduled principal payments.
The Credit Facility also contains affirmative and negative covenants that, subject to certain exceptions, limit our ability to take certain actions, including our ability to incur debt, pay dividends and repurchase stock, make certain investments and other payments, enter into certain mergers and consolidations, engage in sale leaseback transactions and transactions with affiliates and encumber and dispose of assets. Obligations under the Credit Facility are secured by a security interest and lien upon substantially all of the Company's assets.
As of
December 31, 2014
, excess borrowing availability was approximately
$15.0 million
.
In March 2015, Bank of America notified the Company that certain events of default had occurred and were continuing under the Credit Agreement, including (i) the Company’s failure to deliver in a timely matter certain monthly financial statements in accordance with the Credit Agreement, (ii) the Company’s failure to deliver in a timely matter certain financial projections in accordance with the Credit Agreement, (iii) the Company’s failure to repay an over-advance of approximately
$100,000
that existed between March 6, 2015 and March 9, 2015, and (iv) the Company’s failure to satisfy the fixed charge coverage ratio under the Credit Agreement for certain measurement dates during the fourth quarter of 2014 (in part as a result of certain retroactive changes to the calculation of such ratio pursuant to the second amendment, dated December 29, 2014) (the “Existing Events of Default”).
Amendments
On December 29, 2014, the Company amended the Credit Facility to permit the repayment of
$7.7 million
of existing subordinated debt and accrued interest (see the “January Note” below) with the proceeds of an additional loan (the “Term Loan”). The Term Loan will result in modified financial covenants while it is outstanding, will bear interest at a rate of LIBOR for the applicable interest period plus
5%
and will be repaid in equal monthly installments beginning on April 1, 2015 and ending on April 1, 2018.
On March 16, 2015, the Company entered into a third amendment (the “Third Amendment”) to the Credit Facility pursuant to which Bank of America and the lenders under the Credit Facility agreed to waive the Existing Events of Default. In addition, the Third Amendment amends certain other provisions of the agreement and requires that we maintain an EBITDA ratio at the end of each month beginning April 30, 2015 on a cumulative basis through the remainder of 2015 and thereafter on a trailing twelve-month basis, our EBITDA (as defined under the Credit Facility) must be in an amount equal to at least 75% of our monthly projected EBITDA as set forth in projections delivered pursuant to the Credit Facility. The current fixed charge coverage ratio of at least
1.15
to 1.00 on the last day of each month while a Covenant Trigger Period (as defined in the agreement) is in effect will become effective again after the Company has complied with such ratio for six consecutive months.
Credit Agreement
In August 2012, VTBH entered into a loan and security agreement with various financial institutions, which amended and restated the then existing
$28 million
term loan and
$15 million
credit facility. The Credit Agreement, which was to expire on August 22, 2015, increased the borrowing capacity to
$55 million
and provided for a
$45 million
term loan that bore interest at VTBH’s option at (i) the Adjusted Base Rate plus the applicable margin ranging from
2.50%
to
3.25%
as determined by VTBH’s total leverage ratio, or (ii) LIBOR, plus the applicable margin ranging from
3.50%
to
4.25%
. The Applicable Base Rate is equal to the highest of (a) the Prime Rate as determined by the syndication agent, (b) the federal funds rate plus
0.5%
and (c) the LIBOR rate plus
1.0%
. VTBH’s obligations under the Credit Agreement were secured by a first priority lien against substantially all of VTBH’s assets. The revolving line of credit was subject to limitations based on specific percentages of eligible accounts receivables and inventory.
60
Turtle Beach Corporation
Notes to Consolidated Financial Statements - (Continued)
2013 Amendments
VTBH entered into amendments to the Credit Agreement in July 2013 and August 2013 (the “2013 Amendments”). The 2013 Amendments waived certain defaults of the fixed charge coverage ratio and also provided for a new minimum EBITDA financial covenant, modifications of the fixed charge coverage ratio and maximum total leverage ratio for periods ending on or after September 28, 2013, and a modification of annual clean-down requirements with which VTBH would need to comply in order to provide for an increase in the eligible amount outstanding under the facility. In addition, the 2013 Amendments amended the interest rate on the outstanding term loans and required the issuance of
$10 million
of subordinated notes to reduce the outstanding borrowings on the term loan.
2014 Amendments
On January 15, 2014, in connection with the consummation of the Merger, the Company entered into a Third Amendment to the Credit Agreement in which Parametric became an obligor and guarantor under the loan and security agreement, and to (i) allow the Company to incur an additional
$7 million
of subordinated indebtedness, (ii) provide for the repayment of the term loan portion of the facility by February 28, 2014, (iii) change the maturity of the revolving line of credit portion of the facility to September 27, 2014, (iv) reduce the commitments under the revolving line of credit to
$35 million
after March 1, 2014, (v) increase the margin pursuant to which interest on outstanding amounts under the Credit Agreement were calculated by
0.75%
, and (vi) modify the financial covenants contained in the Credit Agreement.
On March 13, 2014, the Company entered into a Fourth Amendment to the Credit Agreement to (i) increase the maximum principal amount of the lenders’ revolving loan commitment between February 28, 2014 and April 15, 2014 from
$35 million
to approximately
$39 million
, (ii) provide that the borrowers, on or prior to April 15, 2014, would reduce the aggregate dollar amount of revolving loans outstanding under the Credit Agreement to the lesser of
$35 million
or the Company’s borrowing base as of such date, (iii) waive the Company’s obligation to deliver certain certificates regarding its liquidity and borrowing base for the fiscal month ended February 28, 2014, and to specify the delivery date of such certificates during March 2014 and April 2014, (iv) eliminate a requirement that the borrowers reduce the aggregate dollar amount of revolving loans and swing loans outstanding to an amount no greater than
$25 million
for a thirty consecutive day period during the first fiscal quarter of each fiscal year, and (v) eliminate the lenders’ obligation to make additional revolving loan commitments after February 28, 2014.
In connection with the above, on January 15, 2014, we repaid
$7.0 million
of the term loan with proceeds from the issuance of a subordinated note, and on February 28, 2014 repaid the remaining
$7.5 million
principal balance with funds from operations, as required by the “2014 Amendments.”
Invoice Factoring
TB Europe utilized accounts receivable factoring arrangements with a third-party financial institution in order to accelerate its cash collections from product sales. These arrangements provided for the transfer of ownership of eligible trade accounts receivable up to a maximum of
£5.0 million
at any time, without recourse, to the third-party financial institution in exchange for cash. This invoice factoring arrangement was terminated on March 31, 2014, and related borrowings were fully paid with proceeds from the Credit Facility described above.
As of December 31, 2013, TB Europe had sold
$5.7 million
of trade accounts receivable to the third-party financial institution, which were netted against accounts receivable on the accompanying Consolidated Balance Sheet.
Subordinated Notes - Related Party
On August 30, 2013, VTBH issued
$10 million
of subordinated notes (the
“
August Notes
”
)
to SG VTB Holdings, LLC (“SG VTB”), VTBH's largest shareholder, Ronald Doornink, a director of Turtle Beach, and Juergen Stark, Chief Executive Officer,
that bore
interest at a rate of (i)
10%
per annum for the first year and (ii)
20%
per annum for all periods thereafter, with interest accruing and being added to the principal amount of the August Notes quarterly. Principal and interest on the August Notes are due upon maturity, which was to occur on the one year anniversary of the later of (i) the term loan maturity date under the Credit Agreement or (ii) the revolving line of credit termination date thereunder. The proceeds from the August Notes were used to repay an equivalent portion of the then outstanding term loans. In June 2014, we repaid the
$10 million
outstanding principal amount plus related accrued interest of the August Notes with proceeds from an equity offering.
61
Turtle Beach Corporation
Notes to Consolidated Financial Statements - (Continued)
In connection with the Third Amendment to the Credit Agreement, on January 15, 2014, the Company issued an additional
$7 million
subordinated note (the “January Note”) to SG VTB, the proceeds of which were applied against the outstanding balance of the term loan under the Credit Agreement. The January Note bears interest at a rate of (i)
10%
per annum until December 31, 2014 (which is the maturity date of the January Note) and (ii)
20%
per annum for all periods thereafter, with interest accruing and being added to the principal amount of the January Note quarterly. The other terms of the January Note are substantially similar to the terms of the August Notes. In December 2014, we repaid the
$7 million
outstanding principal amount plus related accrued interest of the January Notes with proceeds from an additional loan drawn under the Credit Facility.
Note
9
. Income Taxes
The provision (benefit) for income taxes consists of the following:
|
Year Ended
|
|||||||||||
|
December 31,
|
|||||||||||
|
2014
|
2013
|
2012
|
|||||||||
|
(in thousands)
|
|||||||||||
|
Federal:
|
|||||||||||
|
Current
|
$
|
3,271
|
|
$
|
(2,456
|
)
|
$
|
13,660
|
|
||
|
Deferred
|
(9,424
|
)
|
3,574
|
|
(1,148
|
)
|
|||||
|
Total Federal
|
(6,153
|
)
|
1,118
|
|
12,512
|
|
|||||
|
State and Local:
|
|||||||||||
|
Current
|
455
|
|
54
|
|
1,510
|
|
|||||
|
Deferred
|
(347
|
)
|
190
|
|
(120
|
)
|
|||||
|
Total State and Local
|
108
|
|
244
|
|
1,390
|
|
|||||
|
Foreign
|
|||||||||||
|
Current
|
—
|
|
233
|
|
436
|
|
|||||
|
Deferred
|
(227
|
)
|
(505
|
)
|
(330
|
)
|
|||||
|
Total Foreign
|
(227
|
)
|
(272
|
)
|
106
|
|
|||||
|
Total
|
$
|
(6,272
|
)
|
$
|
1,090
|
|
$
|
14,008
|
|
||
The reconciliation between the provision (benefit) for income taxes and the expected provision (benefit) for income taxes at the U.S. federal statutory rate of
35%
is as follows:
|
Year Ended
|
|||||||||||
|
December 31,
|
|||||||||||
|
2014
|
2013
|
2012
|
|||||||||
|
(in thousands)
|
|||||||||||
|
U.S. Operations
|
$
|
(21,639
|
)
|
$
|
(6,026
|
)
|
$
|
39,626
|
|
||
|
Foreign Operations
|
(119
|
)
|
953
|
|
842
|
|
|||||
|
Income (loss) before income taxes
|
(21,758
|
)
|
(5,073
|
)
|
40,468
|
|
|||||
|
Federal statutory rate
|
35
|
%
|
35
|
%
|
35
|
%
|
|||||
|
Provision for income taxes at federal statutory rate
|
(7,615
|
)
|
(1,776
|
)
|
14,164
|
|
|||||
|
State taxes, net of federal benefit
|
37
|
|
158
|
|
904
|
|
|||||
|
Foreign tax rate differential
|
151
|
|
(282
|
)
|
(49
|
)
|
|||||
|
Research credits
|
(728
|
)
|
—
|
|
—
|
|
|||||
|
Gain on bargain purchase
|
—
|
|
—
|
|
(804
|
)
|
|||||
|
Acquisition costs
|
613
|
|
865
|
|
—
|
|
|||||
|
Interest on Series B Preferred Stock
|
421
|
|
353
|
|
—
|
|
|||||
|
Prior year adjustment
|
27
|
|
1,177
|
|
—
|
|
|||||
|
Change in unrecognized tax benefits
|
875
|
|
—
|
|
—
|
|
|||||
|
Other
|
(53
|
)
|
595
|
|
(207
|
)
|
|||||
|
Provision (benefit) for income taxes
|
$
|
(6,272
|
)
|
$
|
1,090
|
|
$
|
14,008
|
|
||
62
Turtle Beach Corporation
Notes to Consolidated Financial Statements - (Continued)
The income tax provision (benefit) reflects the current and deferred tax consequences of events that have been recognized in the Company’s Consolidated Financial Statements or tax returns. U.S. federal income taxes are provided on unremitted foreign earnings, except those that are considered indefinitely reinvested, which at
December 31, 2014
amounted to approximately
$0.7 million
. However, if these earnings were not considered indefinitely reinvested, the Company believes that it has enough foreign tax credits to offset any potential tax liability. The Company considers the earnings of certain non-U.S. subsidiaries to be indefinitely reinvested outside the United States and the current plans do not demonstrate a need to repatriate them to fund our U.S. operations.
The tax effects of significant items comprising the Company’s deferred tax assets/(liabilities) are as follows:
|
December 31, 2014
|
December 31, 2013
|
||||||
|
(in thousands)
|
|||||||
|
Deferred Tax Assets:
|
|||||||
|
Allowance for doubtful accounts
|
73
|
|
$
|
82
|
|
||
|
Inventories
|
543
|
|
757
|
|
|||
|
Employee benefits
|
3,895
|
|
2,777
|
|
|||
|
Net operating loss
|
11,422
|
|
33
|
|
|||
|
Unrecognized tax benefits
|
3,045
|
|
559
|
|
|||
|
Other
|
677
|
|
(41
|
)
|
|||
|
Total deferred tax assets
|
19,655
|
|
4,167
|
|
|||
|
Deferred Tax Liabilities:
|
|||||||
|
Depreciation and amortization
|
(734
|
)
|
(1,138
|
)
|
|||
|
Intangible assets
|
(13,511
|
)
|
(838
|
)
|
|||
|
Total deferred tax liabilities
|
(14,245
|
)
|
(1,976
|
)
|
|||
|
Net deferred tax assets
|
$
|
5,410
|
|
$
|
2,191
|
|
|
At
December 31, 2014
, the Company has
$29.4 million
of net operating loss carryforwards and
$12.8 million
of state net operating loss carryforwards, which will begin to expire in 2029. An ownership change occurred on January 15, 2014, and
$12.7 million
of federal net operating losses included in the above are pre-change losses subject to Section 382. The Company believes, based on the estimated Section 382 limitation and the net operating loss carryforward period, that the pre ownership change net operating losses will be fully utilized in future years.
The realization of deferred tax assets depends on the generation of future taxable income during the periods in which those temporary differences are deductible. In 2014, the Company reassessed the the realizability of deferred tax assets taking into consideration consecutive years of pre-tax losses. The analysis evaluated all available information, including the historical and forecasted pre-tax profits, as well as the scheduled reversal of deferred tax liabilities, projected taxable income and tax planning strategies in making this assessment.
The evaluation noted that while the current year resulted in both a pre-tax and net taxable loss it was driven largely by expense related to the acquisition and the initial investment in the HyperSound business as well as non-recurring incremental shipping and handling costs related to a console manufacture delay and increased air freight usage in response to the labor uncertainty at the West Coast ports. In 2014, the Company received clearance from the U.S. Food and Drug Administration to market the HyperSound Audio System, refinanced debt facilities to reduce our cost of capital, and completed supply chain improvements and product development efforts that have reduced projected cost structures and resulted in an increase in projected revenue growth rates and profitability levels. Management has noted that revenues can fluctuate significantly due to a number of factors beyond our control and as such, if the performance of our HyperSound products in the hearing healthcare market does not meet expectations and negatively impacts current estimates that sufficient taxable income will start to be generated within the next year to allow the related tax benefits to reduce taxes otherwise payable, a valuation allowance may be required.
The Company recognizes windfall tax benefits associated with the exercise of stock options directly to stockholders’ equity only when realized. Accordingly, deferred tax assets are not recognized for net operating loss carryforwards resulting from windfall tax benefits. At
December 31, 2014
, deferred tax assets do not include excess tax benefits from stock-based compensation of
$0.7 million
.
63
Turtle Beach Corporation
Notes to Consolidated Financial Statements - (Continued)
A reconciliation of the beginning and ending amounts of unrecognized tax benefits is as follows:
|
December 31, 2014
|
December 31, 2013
|
||||||
|
(in thousands)
|
|||||||
|
Gross unrecognized tax benefit, beginning of period
|
$
|
1,468
|
|
$
|
1,468
|
|
|
|
Additions based on tax positions related to the current year
|
2,497
|
|
—
|
|
|||
|
Gross unrecognized tax benefit, end of period
|
$
|
3,965
|
|
$
|
1,468
|
|
|
The Company recognizes only those tax positions that meet the more-likely-than-not recognition threshold, and establish tax reserves for uncertain tax positions that do not meet this threshold. To the extent these unrecognized tax benefits are ultimately recognized, approximately
$2.5 million
will impact the Company’s effective tax rate in a future period. Interest and penalties associated with income tax matters are included in the provision for income taxes. As of December 31, 2014, the Company had uncertain tax positions of
$5.5 million
, inclusive of
$1.5 million
of interest and penalties. The Company believes that it is reasonably possible that a decrease of
$2.5 million
in the Company’s obligations will occur within 12 months of the reporting date due to the closing of an audit with the tax authorities.
The Company files U.S., state and foreign income tax returns in jurisdictions with various statutes of limitations. Below is a summary of the filing jurisdictions and open tax years:
|
Open Years
|
|
|
U.S. Federal
|
2011 - 2013
|
|
California
|
2010 - 2013
|
|
New Jersey
|
2010 - 2013
|
|
New York
|
2011 - 2013
|
|
Pennsylvania
|
2011 - 2013
|
|
Texas
|
2010 - 2013
|
|
United Kingdom
|
2012 - 2013
|
Note
10
. Net Income (Loss) Per Share
The following table sets forth the computation of basic and diluted net loss per share of common stock attributable to common stockholders:
|
Year Ended
|
|||||||||||
|
December 31,
|
|||||||||||
|
2014
|
|
2013
|
2012
|
||||||||
|
(in thousands, expect per-share data)
|
|||||||||||
|
Net Income (Loss)
|
$
|
(15,486
|
)
|
$
|
(6,163
|
)
|
$
|
26,460
|
|
||
|
Noncumulative dividends on Series A Convertible Preferred Stock
|
—
|
|
—
|
|
(22,627
|
)
|
|||||
|
Undistributed earnings allocated to Series A Convertible Preferred Stock
|
—
|
|
—
|
|
(2,222
|
)
|
|||||
|
Net income (loss) attributable to common stockholders
|
$
|
(15,486
|
)
|
$
|
(6,163
|
)
|
$
|
1,611
|
|
||
|
Weighted average common shares outstanding — Basic
|
39,665
|
|
12,700
|
|
12,700
|
|
|||||
|
Plus incremental shares from assumed conversions:
|
|||||||||||
|
Dilutive effect of stock options
|
—
|
|
—
|
|
—
|
|
|||||
|
Weighted average common shares outstanding — Diluted
|
39,665
|
|
12,700
|
|
12,700
|
|
|||||
|
Net earnings (loss) per share attributable to common stockholders:
|
|||||||||||
|
Basic
|
$
|
(0.39
|
)
|
$
|
(0.49
|
)
|
$
|
0.13
|
|
||
|
Diluted
|
$
|
(0.39
|
)
|
$
|
(0.49
|
)
|
$
|
0.13
|
|
||
64
Turtle Beach Corporation
Notes to Consolidated Financial Statements - (Continued)
As described in Note
1
, historical weighted-average shares amounts reflect the application of a
0.35997
conversion ratio to historical VTBH share and weighted-average share amounts.
Incremental shares from stock options and restricted stock awards are computed by the treasury stock method. The weighted average shares listed below were not included in the computation of diluted earnings per share because to do so would have been anti-dilutive for the periods presented or were otherwise excluded under the treasury stock method. The treasury stock method calculates dilution assuming the exercise of all in-the-money options and vesting of restricted stock, reduced by the repurchase of shares with the proceeds from the assumed exercises, unrecognized compensation expense for outstanding awards and the estimated tax benefit of the assumed exercises.
|
Year Ended
|
||||||||
|
December 31,
|
||||||||
|
2014
|
2013
|
2012
|
||||||
|
(in thousands)
|
||||||||
|
Stock options
|
6,081
|
|
3,961
|
|
3,961
|
|
||
|
Warrants
|
36
|
|
—
|
|
—
|
|
||
|
Unvested restricted stock awards
|
6
|
|
—
|
|
—
|
|
||
|
Total
|
6,123
|
|
3,961
|
|
3,961
|
|
||
Note
11
. Preferred Stock
Series A Convertible Preferred Stock
In September 2010, VTBH issued
48,689,555
shares of its Series A Convertible Preferred Stock for aggregate proceeds of
$24.3 million
. In connection with the Merger, all of the issued and outstanding Series A Convertible Preferred Stock were canceled and the former holders were issued
17,526,640
shares of Parametric Common Stock.
There were no dividends declared during the years ended
December 31, 2014
and
2013
. For the year ended December 31, 2012,
$22.6 million
of dividends were declared and paid.
Series B Redeemable Preferred Stock
In September 2010, VTBH issued
1,000,000
shares of non-voting Series B Redeemable Preferred Stock (“Preferred Stock”) with a fair value of
$12.4 million
. We are required to redeem the Preferred Stock on the earlier to occur of September 28, 2030 or the occurrence of a liquidation event at its original issue price of
$12.425371
per share plus any accrued but unpaid dividends. Dividends are cumulative and accrue at a rate of
8.0%
per annum, compounded quarterly, and payable as and when declared by the Board of Directors. The Preferred Stock does not contain any conversion rights.
A liquidation event is defined as any acquisition of the Company by means of merger or other form of corporate reorganization in which the outstanding shares of the corporation are exchanged for securities or other consideration issued, or caused to be issued, by the acquiring corporation or its subsidiary (other than a reincorporation transaction) or a sale of all or substantially all of the assets of the corporation.
For the years ended
December 31, 2014
,
2013
, and
2012
, the Company recognized
$1.2 million
,
$1.0 million
and
$1.0 million
, respectively, of interest expense on the Preferred Stock. The redemption value was
$14.9 million
and
$13.7 million
as of
December 31, 2014
and
2013
, respectively. The Company has recorded the Preferred Stock as a non-current liability due to its mandatory redemption provisions for all periods presented.
There were no dividends declared during the years ended
December 31, 2014
and
2013
. During the year ended December 31, 2012,
$2.0 million
in dividends were declared and paid.
As of
December 31, 2014
,
2013
, and
2012
,
1,000,000
shares of Series B redeemable preferred stock are authorized, issued and outstanding.
65
Turtle Beach Corporation
Notes to Consolidated Financial Statements - (Continued)
Note
12
. Stock-Based Compensation
Our stock-based compensation program is a broad-based program designed to attract and retain employees while also aligning employees’ interests with the interests of our shareholders. In addition, members of our Board of Directors participate in our stock-based compensation program in connection with their service on our board.
On October 30, 2013 the Board of Directors adopted, and on December 27, 2013 the stockholders approved, the 2013 Stock-Based Incentive Compensation Plan (the “2013 Plan”), that became effective upon consummation of the Merger on January 15, 2014. The 2013 Plan succeeds the VTBH 2011 Equity Incentive Plan (the “2011 Plan”) and the Parametric 2012 Stock Option Plan (the “2012 Plan”). The total number of shares of common stock authorized for grant under the 2013 Plan is
2,250,000
shares plus
122,000
shares authorized to be granted but not issued under the 2012 Plan, plus any shares that may become available through forfeitures or otherwise terminate under the 2012 Plan.
The 2011 Plan and 2012 Plan were terminated as to new grants at the Merger but vested and unvested stock options previously granted of
3,960,783
and
1,392,854
, respectively, as of the Merger continued.
Stock option awards outstanding under the Company’s Plans are time-based and granted at exercise prices which are equal to the market value of the Company’s common stock on the grant date (determined in accordance with the applicable Plan), and expire no later than
ten
years of the date of grant, but only to the extent they have vested. The options generally vest as specified in the option agreements subject, in some instances, to acceleration in certain circumstances. The restrictions on restricted stock generally lapse over a three-year period from the date of the grant. In the event a participant terminates employment with the Company, any unvested stock options and any restricted stock still subject to restrictions are generally forfeited if they are not exercised within
90
days.
The following table presents the stock activity and the total number of shares available for grant as of
December 31, 2014
:
|
(in thousands)
|
||
|
Balance at December 31, 2013
|
1,439
|
|
|
VTBH 2011 Plan terminated at Merger
|
(1,439
|
)
|
|
2013 Plan adopted at Merger
|
2,372
|
|
|
Options granted
|
(2,074
|
)
|
|
Restricted Stock granted
|
(6
|
)
|
|
Forfeited/Expired shares added back
|
151
|
|
|
Balance at December 31, 2014
|
443
|
|
Total estimated stock-based compensation expense for employees and non-employees, related to all of the the Company's stock-based awards, was comprised as follows:
|
Year Ended
|
|||||||||||
|
December 31,
|
|||||||||||
|
2014
|
2013
|
2012
|
|||||||||
|
(in thousands)
|
|||||||||||
|
Cost of revenue
|
$
|
310
|
|
$
|
60
|
|
$
|
60
|
|
||
|
Selling and marketing
|
866
|
|
343
|
|
281
|
|
|||||
|
Research and development
|
846
|
|
342
|
|
121
|
|
|||||
|
General and administrative
|
3,172
|
|
1,818
|
|
523
|
|
|||||
|
Total stock-based compensation
|
$
|
5,194
|
|
$
|
2,563
|
|
$
|
985
|
|
||
Forfeitures on option grants are estimated at
10%
based on evaluation of historical and expected future turnover for non-executives and
0%
based for executives. Stock-based compensation expense was recorded net of estimated forfeitures, such that expense was recorded only for those stock-based awards that are expected to vest. The Company reviews this assumption
66
Turtle Beach Corporation
Notes to Consolidated Financial Statements - (Continued)
periodically and will adjust it if it is not representative of future forfeiture data and trends within employee types (executive vs. non-executive).
The associated tax benefit recognized in the Consolidated Statements of Operations for the fiscal years ended
December 31, 2014
,
2013
and
2012
was approximately
$1.9 million
,
$0.9 million
and
$0.4 million
, respectively. In addition, cash flows resulting from tax deductions in excess of the cumulative compensation cost recognized for stock-based compensation arrangements (“excess tax benefits”) are classified as financing cash flows only when realized. As such, for the fiscal year ended
December 31, 2014
, excess tax benefits from stock-based compensation arrangements of
$0.7 million
were not recognized. The Company received
$1.6 million
in cash from the exercise of stock options. None of the Company's stock options were exercised for the years ended December 31, 2013 and 2012.
Stock Option Activity
|
Options Outstanding
|
||||||||||||
|
Number of Shares Underlying Outstanding Options
|
Weighted-Average Exercise Price
|
Weighted-Average Remaining Contractual Term
|
Aggregate Intrinsic Value
|
|||||||||
|
(In years)
|
||||||||||||
|
Outstanding at December 31, 2013
|
3,960,793
|
|
$
|
4.71
|
|
8.45
|
$
|
3,031,094
|
|
|||
|
Granted
|
2,074,377
|
|
10.81
|
|
||||||||
|
Assumed in acquisition
|
1,392,854
|
|
6.02
|
|
||||||||
|
Exercised
|
(502,087
|
)
|
3.22
|
|
||||||||
|
Forfeited
|
(337,840
|
)
|
6.11
|
|
||||||||
|
Outstanding at December 31, 2014
|
6,588,097
|
|
$
|
6.95
|
|
6.96
|
$
|
1,327,366
|
|
|||
|
Vested and expected to vest at December 31, 2014
|
6,408,076
|
|
$
|
6.89
|
|
6.89
|
$
|
1,327,366
|
|
|||
|
Exercisable at December 31, 2014
|
3,215,667
|
|
$
|
4.89
|
|
5.22
|
$
|
1,251,874
|
|
|||
As described in Note
1
, option share and exercise prices reflect the application of the
0.35997
conversion ratio to historical VTBH share and weighted-average share amounts.
Aggregate intrinsic value represents the difference between the estimated fair value of the underlying common stock and the exercise price of outstanding, in-the-money options. The aggregate intrinsic value of options exercised was
$4.0 million
for the year ended
December 31, 2014
.
As of
December 31, 2014
, total unrecognized compensation cost related to non-vested stock options granted to employees was
$12.2 million
, which is expected to be recognized over a remaining weighted average vesting period of
2.9 years
.
Determination of Fair Value
Option valuation models require the input of highly subjective assumptions, including expected stock price volatility. The Black-Scholes option pricing model was developed for use in estimating the fair value of traded options, which have no vesting restrictions and are fully transferable. The fair value of options granted under the Company’s Plans was estimated on the date of grant using the Black-Scholes option pricing model with the following assumptions:
67
Turtle Beach Corporation
Notes to Consolidated Financial Statements - (Continued)
|
Year Ended
|
|||||
|
December 31,
|
|||||
|
2014
|
2013
|
2012
|
|||
|
(in thousands)
|
|||||
|
Expected term (in years)
|
6.1
|
6.0
|
6.0
|
||
|
Risk-free interest rate
|
1.8% - 2.0%
|
1.0% - 1.1%
|
0.8% - 1.1%
|
||
|
Expected volatility
|
47.5% - 49.8%
|
50.4% - 50.5%
|
50.5% - 51.1%
|
||
|
Dividend rate
|
0%
|
0%
|
0%
|
||
Each of these inputs is subjective and generally requires significant judgment to determine. The risk-free rate is based on a zero-coupon U.S. Treasury rate in effect at the time of grant with maturity dates that coincide with the expected life of the options. The expected life of the options is based on a study of several unrelated public peer companies within the Company’s industry that the Company considers to be comparable to its business and the historical data on employee exercises and post-vesting employment termination behavior taking into account the contractual life of the award. Since the Company has a limited trading history for its common stock, the expected volatility was derived from the historical stock volatilities of several unrelated public companies within the Company’s industry that are considered to be comparable to the Company’s business over a period equivalent to the expected term of the stock option grants.
The weighted average grant date fair value of options granted during the years ended
December 31, 2014
,
2013
and
2012
was
$5.27
,
$1.16
and
$1.02
, respectively. The total estimated fair value of employee options vested during the years ended
December 31, 2014
,
2013
and
2012
was
$5.5 million
,
$2.8 million
and
$0.5 million
, respectively.
Restricted Stock Activity
|
Shares
|
Weighted Average Grant Date Fair Value Per Share
|
|||||
|
Nonvested restricted stock at December 31, 2013
|
—
|
|
$
|
—
|
|
|
|
Granted
|
6,396
|
|
15.63
|
|
||
|
Nonvested restricted stock at December 31, 2014
|
6,396
|
|
15.63
|
|
||
As of
December 31, 2014
total unrecognized compensation cost related to the nonvested restricted stock awards granted was
$0.1 million
, which is expected to be recognized over a remaining weighted average vesting period of
3.1 years
.
Phantom Equity Activity
In November 2011, VTBH adopted a 2011 Phantom Equity Appreciation Plan ("the Appreciation Plan") that covers certain employees, consultants, and directors of VTBH (“Participants”) who are entitled to phantom units, as applicable, pursuant to the provisions of their respective award agreements. The Appreciation Plan is shareholder-approved, which permits the granting of phantom units to VTBH’s Participants of up to
1,500,000
units. These units are not exercisable or convertible into shares of common stock but give the holder a right to receive a cash bonus equal to the appreciation in value between the exercise price and value of common stock at the time of a change in control event as defined in the plan.
As of
December 31, 2014
and
2013
,
807,578
, and
1,255,280
phantom units at a weighted-average exercise price of
$0.88
and
$0.89
have been granted and are outstanding. Because these phantom units are not exercisable or convertible into common shares, said amounts and exercise prices were not subject to the exchange ratio provided by the Merger agreement. As of
December 31, 2014
, compensation expense related to the Appreciation Plan units remained unrecognized because a change in control, as defined in the plan, had not occurred.
68
Turtle Beach Corporation
Notes to Consolidated Financial Statements - (Continued)
Note
13
. Geographic Information
The following table represents total net revenue based on where customers are physically located:
|
Year Ended
|
|||||||||||
|
December 31,
|
|||||||||||
|
2014
|
|
2013
|
2012
|
||||||||
|
(in thousands)
|
|||||||||||
|
United States
|
$
|
117,715
|
|
$
|
111,514
|
|
$
|
136,494
|
|
||
|
United Kingdom
|
29,425
|
|
26,439
|
|
27,100
|
|
|||||
|
Europe
|
24,082
|
|
18,565
|
|
19,116
|
|
|||||
|
Other
|
14,954
|
|
21,952
|
|
24,426
|
|
|||||
|
Total net revenue
|
$
|
186,176
|
|
$
|
178,470
|
|
$
|
207,136
|
|
||
The following table represents property and equipment based on physical location:
|
Year Ended
|
|||||||||||
|
December 31,
|
|||||||||||
|
2014
|
2013
|
2012
|
|||||||||
|
(in thousands)
|
|||||||||||
|
United States
|
$
|
6,612
|
|
$
|
7,276
|
|
$
|
5,006
|
|
||
|
International
|
110
|
|
93
|
|
726
|
|
|||||
|
Total
|
$
|
6,722
|
|
$
|
7,369
|
|
$
|
5,732
|
|
||
Note
14
. Commitments and Contingencies
Litigation
The Company is subject to various legal proceedings and claims that arise in the ordinary course of its business. Although the amount of any liability that could arise with respect to these actions cannot be determined with certainty, in the Company’s opinion, any such liability will not have a material adverse effect on its consolidated financial position, consolidated results of operations or liquidity.
On August 5, 2013, VTBH and the Company (f/k/a Parametric) announced that they had entered into the Merger Agreement pursuant to which VTBH would acquire an approximately
80%
ownership interest and existing shareholders would maintain an approximately
20%
ownership interest in the Company. Following the announcement, several shareholders filed class action lawsuits in California and Nevada seeking to enjoin the Merger. The plaintiffs in each case alleged that members of the Company’s Board of Directors breached their fiduciary duties to the shareholders by agreeing to a Merger that allegedly undervalued the Company. VTBH and the Company were named as a defendant in these lawsuits under the theory that they had aided and abetted Company's Board of Directors in allegedly violating their fiduciary duties. The plaintiffs in both cases sought a preliminary injunction seeking to enjoin closing of the Merger, which by agreement was heard by the Nevada court with the California plaintiffs invited to participate. On December 26, 2013, the court in the Nevada cases denied the plaintiffs’ motion for a preliminary injunction. Following the closing of the Merger, the Nevada plaintiffs filed a second amended complaint, which made essentially the same allegations and seeks monetary damages as well as an order rescinding the Merger. The California plaintiffs dismissed their action without prejudice, and sought to intervene in the Nevada action, which was granted. Subsequent to the intervention, the plaintiffs filed a third amended complaint, which made essentially the same allegations as prior complaints and seeks monetary damages. On June 20, 2014, VTBH and the Company moved to dismiss the action, but that motion was denied on August 28, 2014. That denial is currently under review by the Nevada Supreme Court and briefing was completed on February 23, 2015. The Company believes that the plaintiffs’ claims against it are without merit and intends to vigorously defend itself in the litigation. As of
December 31, 2014
and the date of this report, the Company is unable to
69
Turtle Beach Corporation
Notes to Consolidated Financial Statements - (Continued)
estimate a possible loss or range of possible loss in regards to this matter; therefore, no litigation reserve has been recorded in the consolidated financial statements.
On February 18, 2015, Dr. John Bonanno, a minority shareholder of VTBH, filed a complaint in Delaware Chancery Court alleging breach of contract against VTBH. According to the complaint, the Merger purportedly triggered a contractual obligation for VTBH to redeem Dr. Bonanno's stock. Dr. Bonanno requests a declaratory judgment stating that he is entitled damages including a redemption of his stock for the redemption value of
$15.1 million
(equal to the original issue price of his stock plus accrued dividends) as well as other costs and expenses. VTBH maintains that the Merger did not trigger any obligation to redeem Mr. Bonanno's stock and VTBH intends to vigorously defend itself in the litigation.
Operating Leases
The Company leases office and warehouse spaces under operating leases that provide for future minimum rental lease payments under non-cancelable operating leases as of
December 31, 2014
, are as follows:
|
(in thousands)
|
|||
|
2015
|
$
|
1,146
|
|
|
2016
|
859
|
|
|
|
2017
|
802
|
|
|
|
2018
|
733
|
|
|
|
2019
|
585
|
|
|
|
Thereafter
|
184
|
|
|
|
Total
|
$
|
4,309
|
|
In January 2015, we entered into a
5
year lease that will commence in May 2015 for an aggregate of approximately
35,000
square feet of office space in San Diego, California, that will consolidate our San Diego and Poway, California locations. The new lease will provide sufficient growth to support the HyperSound business. The initial base rent of
$1.0 million
per year is subject to a
3%
annual increase.
Warranties
The Company warrants products against certain manufacturing and other defects. These product warranties are provided for specific periods of time depending on the nature of the product. Warranties are generally fulfilled by replacing defective products with new products. The following table provides the changes in our product warranties, which are included in other current liabilities:
|
Year Ended
|
|||||||||||
|
December 31,
|
|||||||||||
|
2014
|
2013
|
2012
|
|||||||||
|
(in thousands)
|
|||||||||||
|
Warranty, beginning of period
|
$
|
139
|
|
$
|
165
|
|
$
|
109
|
|
||
|
Warranty costs accrued
|
850
|
|
614
|
|
618
|
|
|||||
|
Settlements of warranty claims
|
(496
|
)
|
(640
|
)
|
(562
|
)
|
|||||
|
Warranty, end of period
|
$
|
493
|
|
$
|
139
|
|
$
|
165
|
|
||
70
Turtle Beach Corporation
Notes to Consolidated Financial Statements - (Continued)
Note
15
. Selected Quarterly Financial Data - Unaudited
|
Fiscal 2014
|
Quarter
|
||||||||||||||
|
First
|
Second
|
Third
|
Fourth
|
||||||||||||
|
(in thousands, except per share data)
|
|||||||||||||||
|
Net Revenue
|
$
|
38,288
|
|
$
|
22,296
|
|
$
|
33,325
|
|
$
|
92,267
|
|
|||
|
Gross Margin
|
12,276
|
|
4,831
|
|
7,749
|
|
25,811
|
|
|||||||
|
Net Income (Loss)
|
(2,906
|
)
|
(9,302
|
)
|
(5,638
|
)
|
2,360
|
|
|||||||
|
Earnings (Loss) Per Share
|
|||||||||||||||
|
Basic
|
$
|
(0.09
|
)
|
$
|
(0.23
|
)
|
$
|
(0.13
|
)
|
$
|
0.06
|
|
|||
|
Diluted
|
$
|
(0.09
|
)
|
$
|
(0.23
|
)
|
$
|
(0.13
|
)
|
$
|
0.06
|
|
|||
|
Fiscal 2013
|
Quarter
|
||||||||||||||
|
First
|
Second
|
Third
|
Fourth
|
||||||||||||
|
(in thousands, except per share data)
|
|||||||||||||||
|
Net Revenue
|
$
|
29,533
|
|
$
|
24,520
|
|
$
|
38,299
|
|
$
|
86,118
|
|
|||
|
Gross Margin
|
8,625
|
|
6,322
|
|
8,646
|
|
26,736
|
|
|||||||
|
Net Income (Loss)
|
(2,304
|
)
|
(3,338
|
)
|
(1,402
|
)
|
881
|
|
|||||||
|
Earnings (Loss) Per Share
(1)
|
|||||||||||||||
|
Basic
|
$
|
(0.18
|
)
|
$
|
(0.26
|
)
|
$
|
(0.11
|
)
|
$
|
0.07
|
|
|||
|
Diluted
|
$
|
(0.18
|
)
|
$
|
(0.26
|
)
|
$
|
(0.11
|
)
|
$
|
0.07
|
|
|||
(1) In connection with the Merger, the
35,282,286
shares of VTBH Common Stock presented on its previously filed balance sheet as of December 31, 2013, are presented herein as
12,700,460
shares. This share amount is being utilized to calculate earnings per share for all periods prior to the Merger.
None.
Evaluation of Disclosure Controls and Procedures
We maintain disclosure controls and procedures that are designed to ensure that information required to be disclosed in reports we file or submit under the Exchange Act is recorded, processed, summarized and reported within the time periods specified in the SEC’s rules and forms, and that such information is accumulated and communicated to our management, including our Chief Executive Officer and Chief Financial Officer, as appropriate, to allow timely decisions regarding required disclosure.
Under the supervision and with the participation of our management, including our Chief Executive Officer and Chief Financial Officer, we conducted an evaluation of our disclosure controls and procedures, as such term is defined under Rule 13a-15(e) and Rule 15d-15(e) promulgated under the Exchange Act, as of the end of the period covered by this Report. This evaluation also included consideration of our internal controls and procedures for the preparation of our financial statements as required under Section 404 of the Sarbanes-Oxley Act of 2002. Based upon that evaluation, our Chief Executive Officer and Chief Financial Officer concluded that our disclosure controls and procedures were operating and effective as of
December 31, 2014
.
71
Management’s Report on Internal Control over Financial Reporting
Our management is responsible for establishing and maintaining adequate internal control over financial reporting (as defined in Rule 13a-15(f) or 15d-15(f) of the Exchange Act). Our internal control system was designed to provide reasonable assurance to our management and Board of Directors regarding the preparation and fair presentation of published financial statements.
All internal control systems, no matter how well designed, have inherent limitations. Because of these inherent limitations, internal control over financial reporting can provide only reasonable assurance with respect to financial statement preparation and presentation, and may not prevent or detect misstatements. Projections of any evaluation of effectiveness to future periods are subject to the risk that controls may become inadequate because of changes in conditions, or that the degree of compliance with the policies or procedures may deteriorate.
We assessed the effectiveness of the Company’s internal control over financial reporting as of
December 31, 2014
. In making this assessment, we used the framework and criteria established in Internal Control—Integrated Framework (2013), issued by the Committee of Sponsoring Organizations of the Treadway Commission. Based on our assessment using those criteria, we concluded that, as of
December 31, 2014
, our internal control over financial reporting was effective.
BDO USA, LLP, the independent registered public accounting firm that audited the Company’s financial statements included in this Annual Report on Form 10-K, has also audited the Company’s internal control over financial reporting as of
December 31, 2014
as stated in their report
which appears following Item 9B of this Annual Report on Form 10-K
.
Changes in Internal Control over Financial Reporting
There have been no changes in our internal control over financial reporting during the period covered that have materially affected, or are reasonably likely to materially affect, our internal control over financial reporting. Our process for evaluating controls and procedures is continuous and encompasses constant improvement of the design and effectiveness of established controls and procedures and the remediation of any deficiencies, which may be identified during this process.
None noted.
72
REPORT OF INDEPENDENT REGISTERED PUBLIC ACCOUNTING FIRM
Board of Directors and Stockholders of
Turtle Beach Corporation
Valhalla, New York
We have audited Turtle Beach Corporation’s internal control over financial reporting as of December 31, 2014, based on criteria established in Internal Control - Integrated Framework (2013) issued by the Committee of Sponsoring Organizations of the Treadway Commission (the COSO criteria). Turtle Beach Corporation’s management is responsible for maintaining effective internal control over financial reporting and for its assessment of the effectiveness of internal control over financial reporting, included in the accompanying “Item 9A, Management’s Report on Internal Control Over Financial Reporting.” Our responsibility is to express an opinion on the Company’s internal control over financial reporting based on our audit.
We conducted our audit in accordance with the standards of the Public Company Accounting Oversight Board (United States). Those standards require that we plan and perform the audit to obtain reasonable assurance about whether effective internal control over financial reporting was maintained in all material respects. Our audit included obtaining an understanding of internal control over financial reporting, assessing the risk that a material weakness exists, and testing and evaluating the design and operating effectiveness of internal control based on the assessed risk. Our audit also included performing such other procedures as we considered necessary in the circumstances. We believe that our audit provides a reasonable basis for our opinion.
A company’s internal control over financial reporting is a process designed to provide reasonable assurance regarding the reliability of financial reporting and the preparation of financial statements for external purposes in accordance with generally accepted accounting principles. A company’s internal control over financial reporting includes those policies and procedures that (1) pertain to the maintenance of records that, in reasonable detail, accurately and fairly reflect the transactions and dispositions of the assets of the company; (2) provide reasonable assurance that transactions are recorded as necessary to permit preparation of financial statements in accordance with generally accepted accounting principles, and that receipts and expenditures of the company are being made only in accordance with authorizations of management and directors of the company; and (3) provide reasonable assurance regarding prevention or timely detection of unauthorized acquisition, use, or disposition of the company’s assets that could have a material effect on the financial statements.
Because of its inherent limitations, internal control over financial reporting may not prevent or detect misstatements. Also, projections of any evaluation of effectiveness to future periods are subject to the risk that controls may become inadequate because of changes in conditions, or that the degree of compliance with the policies or procedures may deteriorate.
In our opinion, Turtle Beach Corporation maintained, in all material respects, effective internal control over financial reporting as of
December 31, 2014
, based on the COSO criteria.
We also have audited, in accordance with the standards of the Public Company Accounting Oversight Board (United States), the consolidated balance sheet of Turtle Beach Corporation as of
December 31, 2014
, and the related consolidated statements of operations, comprehensive loss, convertible preferred stock and stockholders’ equity, and cash flows for the year ended
December 31, 2014
and our report dated
March 30, 2015
expressed an unqualified opinion thereon.
|
/s/ BDO USA, LLP
|
|
Stamford, Connecticut
|
|
March 30, 2015
|
73
The information required by this Item is incorporated herein by reference to the information in our Definitive Proxy Statement to be filed with the SEC within 120 days after the end of the Company’s fiscal year ended December 31, 2014 in connection with our 2015 Annual Meeting of Stockholders (the “2015 Proxy Statement”) set forth under the captions “Election of Directors,” “Management Information,” “Corporate Governance” and “Section 16(a) Beneficial Ownership Reporting Compliance.”
We have adopted a code of business conduct and ethics that applies to our Chief Executive Officer and Chief Financial Officer. This code of business conduct and ethics is available on the Company’s website corp.turtlebeach.com. The information on our website is not a part of or incorporated by reference into this Report. If the Company makes any amendments to this code other than technical, administrative or other non-substantive amendments, or grants any waivers, including implicit waivers, from a provision of this code to the Company’s Chief Executive Officer or Chief Financial Officer, the Company will disclose the nature of the amendment or waiver, its effective date and to whom it applies by posting such information on the Company’s website at corp.turtlebeach.com.
The information required by this Item is incorporated herein by reference to the information in our 2015 Proxy Statement set forth under captions “Corporate Governance,” “Executive Compensation and Related Information” and “Report of the Compensation and Management Development Committee.”
The information required by this Item is incorporated herein by reference to the information in our 2015 Proxy Statement set forth under the captions “Executive Compensation and Related Information” and “Security Ownership of Certain Beneficial Owners and Management.”
The information required by this Item is incorporated herein by reference to the information in our 2015 Proxy Statement set forth under the captions “Corporate Governance” and “Executive Compensation and Related Information.”
The information required by this Item is incorporated herein by reference to the information in our 2015 Proxy Statement set forth under the captions “Audit and Non-Audit Fees.”
|
a.
|
List of documents filed as part of this Annual Report:
|
|
1.
|
The following Consolidated Financial Statements of the Company are filed as part of this Annual Report:
|
Reports of Independent Registered Public Accounting Firms;
Consolidated Statements of Operations for the Fiscal Years Ended December 31, 2014, 2013 and 2012;
Consolidated Statements of Comprehensive Income (Loss) for the Fiscal Years Ended December 31, 2014, 2013 and 2012;
Consolidated Balance Sheets as of December 31, 2014 and 2013;
Consolidated Statements of Stockholders’ Equity for the Fiscal Years Ended December 31, 2014, 2013 and 2012;
Consolidated Statements of Cash Flows for the Fiscal Years Ended December 31, 2014, 2013 and 2012; and
Notes to the Consolidated Financial Statements.
74
|
2.
|
All schedules have been omitted because they are not applicable, not required or the information has been otherwise supplied in the financial statements or notes thereto.
|
|
3.
|
The exhibits listed in the Exhibit Index attached hereto are filed as part of this Annual Report and incorporated herein by reference
|
|
b.
|
The exhibits listed in the Exhibit Index attached hereto are filed as part of this Annual Report and incorporated herein by reference.
|
|
c.
|
Not applicable.
|
75
SIGNATURES
Pursuant to the requirements of Section 13 or 15(d) of the Securities Exchange Act of 1934, the registrant has duly caused this report to be signed on its behalf by the undersigned, thereunto duly authorized.
|
|
|
TURTLE BEACH CORPORATION
|
|
|
|
|||
|
Date:
|
March 30, 2015
|
By:
|
/S/ JOHN T. HANSON
|
|
|
|
John T. Hanson
Chief Financial Officer, Treasurer and Secretary
|
|
|
|
|
(Principal Financial Officer)
|
|
Pursuant to the requirements of the Securities Exchange Act of 1934, this report has been signed below by the following persons on behalf of the registrant and in the capacities and on the dates indicated.
|
|
||
|
Date:
|
March 30, 2015
|
/s/ JUERGEN STARK
|
|
|
Juergen Stark, Chief Executive Officer, President and Director
|
|
|
|
(Principal Executive Officer)
|
|
|
Date:
|
March 30, 2015
|
/S/ JOHN T. HANSON
|
|
|
John T. Hanson, Chief Financial Officer, Treasurer and Secretary
|
|
|
|
(Principal Financial Officer)
|
|
|
Date:
|
March 30, 2015
|
/S/ RONALD DOORNINK
|
|
|
Ronald Doornink, Non-Executive Chairman of the Board and Director
|
|
|
Date:
|
March 30, 2015
|
/S/ LAUREEN DeBUONO
|
|
|
Laureen DeBuono, Director
|
|
|
Date:
|
March 30, 2015
|
/S/ KENNETH A. FOX
|
|
|
Kenneth A.Fox, Director
|
|
|
Date:
|
March 30, 2015
|
/S/ WILLIAM E. KEITEL
|
|
|
William E. Keitel, Director
|
|
|
Date:
|
March 30, 2015
|
/S/ ANDREW WOLFE
|
|
|
Andrew Wolfe, Director
|
|
76
Exhibits
|
2.1*
|
Agreement and Plan of Merger, dated August 5, 2013, among the Company, Merger Sub and VTBH (Incorporated by reference to Exhibit 2.1 to the Company’s Current Report on Form 8-K originally filed with the SEC on August 5, 2013).
|
|
3.1
|
Articles of Incorporation of Turtle Beach Corporation (Incorporated by reference to Exhibit 3.1 to the Company’s Quarterly Report on Form 10-Q originally filed with the SEC on August 11, 2014).
|
|
3.2
|
Bylaws, as amended, of Turtle Beach Corporation (Incorporated by reference to Exhibit 3.2 to the Company’s Quarterly Report on Form 10-Q originally filed with the SEC on August 11, 2014).
|
|
3.3
|
Third Amended and Restated Certificate of Incorporation of VTBH (Incorporated by reference to Exhibit B to Exhibit 2.1 to the Company’s Current Report on Form 8-K originally filed with the Securities and Exchange Commission on August 5, 2013).
|
|
4.1
|
Stockholder Agreement dated August 5, 2013 among Turtle Beach Corporation and certain of our shareholders. (Incorporated by reference to Exhibit 99.1 to the Company’s Current Report on Form 8-K filed with the Securities and Exchange Commission on August 5, 2013).
|
|
4.2
|
Amendment No. 1 to the Stockholder Agreement, dated July 10, 2014, by and among the Company and the shareholders party thereto (Incorporated by reference to Exhibit 10.2 to the Company’s Current Report on Form 8-K filed with the Securities and Exchange Commission on July 10, 2014).
|
|
4.3
|
Form of Turtle Beach Corporation stock certificate. (Incorporated by reference to Exhibit 4.1 to Form 10/A filed July 27, 2010.)
|
|
10.1
|
Loan, Security and Guarantee Agreement, dated as of March 31, 2014, among Parametric Sound Corporation and Voyetra Turtle Beach, Inc. as US Borrowers and UK Guarantors, Turtle Beach Europe Limited as UK Borrower, PSC Licensing Corp. and VTB Holdings, Inc. as a US Guarantor and a UK Guarantor, and Bank of America, N.A., as Agent, Sole Lead Arranger and Sole Bookrunner (Incorporated by reference to Exhibit 10.1 to the Company’s Current Report on Form 8-K filed with the Securities and Exchange Commission on April 1, 2014).
|
|
10.2**
|
Amendment No. 2 to Loan, Security and Guarantee Agreement, dated as of March 31, 2014, among Parametric Sound Corporation and Voyetra Turtle Beach, Inc. as US Borrowers and UK Guarantors, Turtle Beach Europe Limited as UK Borrower, PSC Licensing Corp. and VTB Holdings, Inc. as a US Guarantor and a UK Guarantor, and Bank of America, N.A., as Agent, Sole Lead Arranger and Sole Bookrunner.
|
|
10.2.1
|
Amendment No. 3 to Loan, Security and Guarantee Agreement, dated as of March 31, 2014, among Parametric Sound Corporation and Voyetra Turtle Beach, Inc. as US Borrowers and UK Guarantors, Turtle Beach Europe Limited as UK Borrower, PSC Licensing Corp. and VTB Holdings, Inc. as a US Guarantor and a UK Guarantor, and Bank of America, N.A., as Agent, Sole Lead Arranger and Sole Bookrunner.(Incorporated by reference to Exhibit 10.1 to the Company’s Current Report on Form 8-K filed with the Securities and Exchange Commission on March 20, 2015).
|
|
10.3†
|
Parametric Sound Corporation 2013 Stock-Based Incentive Compensation Plan (Incorporated by reference to Annex E to the Company’s Definitive Proxy Statement on Schedule 14A originally filed with the SEC on December 3, 2013).
|
|
10.4†
|
Parametric Sound Corporation Annual Incentive Bonus Plan (Incorporated by reference to Annex F to the Company’s Definitive Proxy Statement on Schedule 14A originally filed with the SEC on December 3, 2013).
|
|
10.5
|
Form of Lock-up Agreement, among the Company, VTBH and certain officers and directors of VTBH (Incorporated by reference to Exhibit 10.13 to the Company’s Current Report on Form 8-K filed with the Securities and Exchange Commission on January 16, 2014).
|
77
|
10.6
|
Master Purchasing Agreement, dated December 5, 2011, between the Company and Weifang GoerTek Electronics, Co., Ltd. and GoerTek Inc. (Incorporated by reference to Exhibit 10.11 to the Company’s Current Report on Form 8-K filed with the Securities and Exchange Commission on May12, 2014).
|
|
10.7†
|
VTB Holdings, Inc. 2011 Phantom Equity Appreciation Plan (Incorporated by reference to Exhibit 10.13 to the Company’s Current Report on Form 8-K filed with the Securities and Exchange Commission on May12, 2014).
|
|
10.8†
|
Offer Letter, dated as of August 13, 2012, between Voyetra Turtle Beach, Inc. and Juergen Stark (Incorporated by reference to Exhibit 10.14 to the Company’s Current Report on Form 8-K filed with the Securities and Exchange Commission on May12, 2014).
|
|
10.9†
|
Stock Option Award Agreement, dated as of September 4, 2012, by and between VTB Holdings, Inc. and Juergen Stark (Incorporated by reference to Exhibit 10.15 to the Company’s Current Report on Form 8-K filed with the Securities and Exchange Commission on May12, 2014).
|
|
10.10†
|
Offer Letter, dated as of September 16, 2013, by and between Voyetra Turtle Beach, Inc. and John Hanson (Incorporated by reference to Exhibit 10.26 to the Company’s Current Report on Form 8-K filed with the Securities and Exchange Commission on May12, 2014).
|
|
10.11†
|
Stock Award Agreement, dated as of June 21, 2011, by and between VTB Holdings, Inc. and Ronald Doornink (Incorporated by reference to Exhibit 10.16 to the Company’s Current Report on Form 8-K filed with the Securities and Exchange Commission on May12, 2014).
|
|
10.11.1†
|
First Amendment to Stock Award Agreement, dated as of February 26, 2013, by and between VTB Holdings, Inc. and Ronald Doornink (Incorporated by reference to Exhibit 10.17 to the Company’s Current Report on Form 8-K filed with the Securities and Exchange Commission on May12, 2014).
|
|
10.12†
|
Consulting Agreement, dated as of October 12, 2010, by and between Voyetra Turtle Beach, Inc. and Ronald Doornink (Incorporated by reference to Exhibit 10.18 to the Company’s Current Report on Form 8-K filed with the Securities and Exchange Commission on May12, 2014).
|
|
10.13†
|
Termination of Consulting Agreement and Continued Service on the Board of Directors, dated as of February 26, 2013, by and between Voyetra Turtle Beach, Inc. and Ronald Doornink (Incorporated by reference to Exhibit 10.19 to the Company’s Current Report on Form 8-K filed with the Securities and Exchange Commission on May12, 2014).
|
|
10.14†
|
Performance Bonus Agreement, dated as of October 12, 2010, by and among the Company, Carmine J. Bonnano and Frederick J. Romano (Incorporated by reference to Exhibit 10.20 to the Company’s Current Report on Form 8-K filed with the Securities and Exchange Commission on May12, 2014).
|
|
10.15†
|
Employment Agreement, dated as of October 12, 2010, by and between Voyetra Turtle Beach, Inc. and Carmine J. Bonnano (Incorporated by reference to Exhibit 10.21 to the Company’s Current Report on Form 8-K filed with the Securities and Exchange Commission on May12, 2014).
|
|
10.16†
|
Severance Agreement, dated as of August 2, 2012, by and between Voyetra Turtle Beach, Inc. and Carmine J. Bonnano (Incorporated by reference to Exhibit 10.22 to the Company’s Current Report on Form 8-K filed with the Securities and Exchange Commission on May12, 2014).
|
|
10.17†
|
Employment Agreement, dated as of October 12, 2010, by and between Voyetra Turtle Beach, Inc. and Frederick J. Romano (Incorporated by reference to Exhibit 10.23 to the Company’s Current Report on Form 8-K filed with the Securities and Exchange Commission on May12, 2014).
|
|
10.18†
|
Severance Agreement, dated as of August 2, 2012, by and between Voyetra Turtle Beach, Inc. and Frederick J. Romano (Incorporated by reference to Exhibit 10.24 to the Company’s Current Report on Form 8-K filed with the Securities and Exchange Commission on May12, 2014).
|
|
10.19†
|
Offer Letter, dated as of October 21, 2013, by and between Voyetra Turtle Beach, Inc. and Frederick J. Romano (Incorporated by reference to Exhibit 10.25 to the Company’s Current Report on Form 8-K filed with the Securities and Exchange Commission on May12, 2014).
|
78
|
10.20†**
|
Form of Indemnification Agreement
|
|
10.21†**
|
Form of Turtle Beach Corporation Non-Employee Director Restricted Stock Award
|
|
10.22†**
|
Form of Turtle Beach Corporation Non-Employee Director Incentive Stock Option Agreement
|
|
10.23†**
|
Form of Turtle Beach Corporation Incentive Stock Option Agreement
|
|
21**
|
Subsidiaries of the Company
|
|
23.1**
|
Consent of BDO USA, LLP.
|
|
23.2**
|
Consent of Freed Maxick CPAs, P.C.
|
|
31.1**
|
Certification of Juergen Stark, Principal Executive Officer, pursuant to Rule 13a-14(a) or 15d-14(a) of the Exchange Act, as adopted pursuant to Section 302 of the Sarbanes-Oxley Act of 2002.
|
|
|
|
|
31.2**
|
Certification of John T. Hanson, Principal Financial Officer, pursuant to Rule 13a-14(a) or 15d-14(a) of the Exchange Act, as adopted pursuant to Section 302 of the Sarbanes-Oxley Act of 2002.
|
|
|
|
|
32.1***
|
Certification pursuant to 18 U.S.C. Section 1350, as adopted pursuant to Section 906 of the Sarbanes-Oxley Act of 2002, executed by Juergen Stark, Principal Executive Officer and John Hanson, Principal Financial Officer.
|
|
|
|
|
|
Extensible Business Reporting Language (XBRL) Exhibits
|
|
101.INS
|
XBRL Instance Document**
|
|
101.SCH
|
XBRL Taxonomy Extension Schema Document**
|
|
101.CAL
|
XBRL Taxonomy Extension Calculation Linkbase Document**
|
|
101.DEF
|
XBRL Taxonomy Extension Definition Linkbase Document**
|
|
101.LAB
|
XBRL Taxonomy Extension Labels Linkbase Document**
|
|
101.PRE
|
XBRL Taxonomy Extension Presentation Linkbase Document**
|
|
*
|
All exhibits and schedules to the Agreement and Plan of Merger have been omitted pursuant to Item 601(b)(2) of Regulation S-K. The Company will furnish the omitted exhibits and schedules to the SEC upon request by the SEC.
|
|
**
|
Filed herewith.
|
|
***
|
Furnished herewith.
|
|
†
|
Management contract or compensatory plan.
|
79
Turtle Beach Corporation
Schedule II - Valuation and Qualifying Accounts
Years ended
December 31, 2014
,
2013
and
2012
|
Description
|
Balance - Begin
|
Additions
|
Deductions / Other
|
Balance - End
|
|||||||||||
|
Year Ended December 31, 2014:
|
(in thousands)
|
||||||||||||||
|
Allowance for sales returns
|
$
|
6,266
|
|
$
|
13,042
|
|
$
|
(15,153
|
)
|
$
|
4,155
|
|
|||
|
Allowance for cash discounts
|
2,489
|
|
18,488
|
|
(15,526
|
)
|
5,451
|
|
|||||||
|
Allowance for doubtful accounts
|
225
|
|
$
|
37
|
|
$
|
(62
|
)
|
200
|
|
|||||
|
|
|
$
|
9,806
|
|
|||||||||||
|
Year Ended December 31, 2013:
|
|||||||||||||||
|
Allowance for sales returns
|
$
|
7,748
|
|
$
|
20,146
|
|
$
|
(21,628
|
)
|
$
|
6,266
|
|
|||
|
Allowance for cash discounts
|
6,196
|
|
15,347
|
|
(19,054
|
)
|
2,489
|
|
|||||||
|
Allowance for doubtful accounts
|
460
|
|
125
|
|
(360
|
)
|
225
|
|
|||||||
|
$
|
8,980
|
|
|||||||||||||
|
Year Ended December 31, 2012:
|
|||||||||||||||
|
Allowance for sales returns
|
$
|
6,152
|
|
$
|
19,659
|
|
$
|
(18,063
|
)
|
$
|
7,748
|
|
|||
|
Allowance for cash discounts
|
4,680
|
|
17,293
|
|
(15,777
|
)
|
6,196
|
|
|||||||
|
Allowance for doubtful accounts
|
102
|
|
358
|
|
—
|
|
460
|
|
|||||||
|
$
|
14,404
|
|
|||||||||||||
80
TABLE OF CONTENTS
Part IItem 1 - Business OverviewItem 1A - Risk FactorsItem 1B - Unresolved Staff CommentsItem 2 - PropertiesItem 3 - Legal ProceedingsItem 4 - Mine Safety DisclosuresPart IIItem 5 - Market For The Registrant S Common Equity, Related Stockholder Matters and Issuer Purchases Of Equity SecuritiesItem 6 - Selected Financial DataItem 7. Management's Discussion and Analysis Of Financial Condition and Results Of OperationsItem 7A - Qualitative and Quantitative Disclosures About Market RiskItem 8. Financial Statements and Supplementary DataNote 1 . Summary Of Significant Accounting PoliciesNote 2 . Business CombinationsNote 3 . Equity OfferingNote 4 . Fair Value MeasurementNote 5 . Allowance For Sales ReturnsNote 6 . Composition Of Certain Financial Statement ItemsNote 7 . Goodwill and Other Intangible AssetsNote 8 . Credit Facilities and Long-term DebtNote 9 . Income TaxesNote 10 . Net Income (loss) Per ShareNote 11 . Preferred StockNote 12 . Stock-based CompensationNote 13 . Geographic InformationNote 14 . Commitments and ContingenciesNote 15 . Selected Quarterly Financial Data - UnauditedItem 9 - Changes in and Disagreements with Accountants on Accounting and Financial DisclosureItem 9A - Controls and ProceduresItem 9B - Other InformationPart IIIItem 10 - Directors, Executive Officers and Corporate GovernanceItem 11 - Executive CompensationItem 12 - Security Ownership Of Certain Beneficial Owners and Management and Related Stockholder MattersItem 13 - Certain Relationships and Related Transactions, and Director IndependenceItem 14 - Principal Accounting Fees and ServicesPart IVItem 15. Exhibits and Financial Statement Schedules