TRUEBLUE, INC.
10-Ks and 10-Qs
|
|
|
|
|
|
|
|
|
|
|
|
|
|
|
|
|
|
|
|
|
|
|
|
|
|
|
|
|
|
|
|
|
|
|
|
|
|
|
|
|
|
|
|
|
|
|
|
|
|
|
|
|
|
|
|
|
|
|
UNITED STATES SECURITIES AND EXCHANGE COMMISSION
Washington, D.C. 20549
FORM 10-K
ý
ANNUAL REPORT PURSUANT TO SECTION 13 OR 15(d) OF THE SECURITIES EXCHANGE ACT OF 1934
For the fiscal year ended:
December 28, 2012
or
¨
TRANSITION REPORT PURSUANT TO SECTION 13 OR 15(d) OF THE SECURITIES EXCHANGE ACT OF 1934
Commission File Number: 001-14543
____________________________________
TrueBlue, Inc.
(Exact name of Registrant as specified in its charter)
______________________________________
|
Washington
|
|
91-1287341
|
|
(State of Incorporation)
|
|
(IRS Employer ID)
|
|
1015 A Street, Tacoma, Washington
|
|
98402
|
|
(Address of principal executive offices)
|
|
(Zip Code)
|
Registrant’s telephone number, including area code:
(253) 383-9101
Securities registered pursuant to Section 12(b) of the Act:
|
Title of each class
|
|
Name of each exchange on which registered
|
|
Common Stock without par value
|
|
The New York Stock Exchange
|
Securities registered under Section 12(g) of the Act:
None
Indicate by check mark if the registrant is a well-known seasoned issuer, as defined in Rule 405 of the Securities Act. Yes
¨
No
ý
Indicate by check mark if the registrant is not required to file reports pursuant to Section 13 or Section 15(d) of the Act. Yes
¨
No
ý
Indicate by check mark whether the registrant has submitted electronically and posted on its corporate Web site, if any, every Interactive Data File required to be submitted and posted pursuant to Rule 405 of Regulation S-T (§232.405 of this chapter) during the preceding 12 months (or for such shorter period that the registrant was required to submit and post such files). Yes
ý
No
¨
Indicate by check mark whether the registrant (1) has filed all reports required to be filed by Section 13 or 15 (d) of the Securities Exchange Act of 1934 during the preceding 12 months (or for such shorter period that the registrant was required to file such reports), and (2) has been subject to such filing requirements for the past 90 days. Yes
ý
No
¨
Indicate by check mark if disclosure of delinquent filers pursuant to Item 405 of Regulation S-K is not contained herein and will not be contained, to the best of registrant’s knowledge, in definitive proxy or information statements incorporated by reference in Part III of this Form 10-K or any amendment to this Form 10-K.
ý
Indicate by check mark whether the registrant is a large accelerated filer, an accelerated filer, a non-accelerated filer, or a smaller reporting company. See the definitions of “large accelerated filer,” “accelerated filer” and “smaller reporting company” in Rule 12b-2 of the Exchange Act. Large accelerated filer
¨
Accelerated filer
ý
Non-accelerated filer
¨
(Do not check if a smaller reporting company) Smaller reporting company
¨
Indicate by check mark if the registrant is a shell company (as defined in Rule 12b-2 of the Exchange Act). Yes
¨
No
ý
The aggregate market value (based on the NYSE quoted closing price) of the common stock held by non-affiliates of the registrant as of the last business day of the second fiscal quarter,
June 29, 2012
, was approximately
$0.611 billion
.
As of
February 8, 2013
, there were
40,609,618 shares
of the registrant’s common stock outstanding.
DOCUMENTS INCORPORATED BY REFERENCE
The information required by Part III of this report is incorporated by reference from the registrant’s definitive proxy statement relating to the Annual Meeting of Shareholders scheduled to be held May 15, 2013, which definitive proxy statement will be filed not later than 120 days after the end of the fiscal year to which this report relates.
COMMENT ON FORWARD LOOKING STATEMENTS
This Form 10-K contains forward-looking statements. These statements relate to our expectations for future events and future financial performance. Generally, the words “anticipate,” “believe,” “expect,” “intend,” “plan,” and similar expressions identify forward-looking statements. Forward-looking statements involve risks and uncertainties, and future events and circumstances could differ significantly from those anticipated in the forward-looking statements. These statements are only predictions. Actual events or results may differ materially. Factors which could affect our financial results are described in Item 1A of this Form 10-K. Readers are cautioned not to place undue reliance on these forward-looking statements, which speak only as of the date hereof. Although we believe that the expectations reflected in the forward-looking statements are reasonable, we cannot guarantee future results, levels of activity, performance or achievements. Moreover, neither we nor any other person assume responsibility for the accuracy and completeness of the forward-looking statements. We undertake no duty to update any of the forward-looking statements after the date of this report to conform such statements to actual results or to changes in our expectations.
TrueBlue, Inc.
2012 Annual Report on Form 10-K
Table of Contents
|
|
|
Page
|
|
PART I
|
||
|
Item 1.
|
||
|
Item 1A.
|
||
|
Item 1B.
|
||
|
Item 2.
|
||
|
Item 3.
|
||
|
Item 4.
|
||
|
PART II
|
||
|
Item 5.
|
||
|
Item 6.
|
||
|
Item 7.
|
||
|
Item 7A.
|
||
|
Item 8.
|
||
|
Item 9.
|
||
|
Item 9A.
|
||
|
Item 9B.
|
||
|
PART III
|
||
|
Item 10.
|
||
|
Item 11.
|
||
|
Item 12.
|
||
|
Item 13.
|
||
|
Item 14.
|
||
|
PART IV
|
||
|
Item 15.
|
||
Page -
3
TrueBlue, Inc.
Form 10-K
|
Item 1.
|
BUSINESS
|
TrueBlue, Inc. (“TrueBlue,” “we,” “us,” “our”) is a leading provider of temporary blue-collar staffing services. We provide a wide range of specialized blue-collar staffing services. We operate as Labor Ready for general labor, Spartan Staffing for light industrial services, CLP Resources for skilled trades, PlaneTechs for mechanics and technicians for the aviation and transportation industries, and Centerline Drivers for dedicated and temporary drivers. We have a network of
691
branches in all
50
states, Puerto Rico and Canada, customer on-site locations generally dedicated to one customer, and national service centers, which supply our customers with temporary workers.
We began operations in 1989 under the name Labor Ready, Inc. providing on-demand, general labor staffing services. We became a public company in 1995. In 2004 we began acquiring additional brands to expand our service offerings to customers in the blue-collar staffing market. Effective December 18, 2007, Labor Ready, Inc. changed its name to TrueBlue, Inc. We are headquartered in Tacoma, Washington.
Temporary Staffing Industry
The temporary staffing industry supplies temporary staffing services to minimize the cost and effort of hiring and administering permanent employees in order to rapidly respond to changes in business conditions, to temporarily replace absent employees, to temporarily fill new positions, and to convert fixed or permanent labor costs to variable or flexible costs. Temporary staffing companies act as intermediaries in matching available temporary workers to employer assignments. The demand for a flexible workforce continues to grow with competitive and economic pressures to reduce costs and respond to changing market conditions.
The temporary staffing industry is large and highly fragmented with many competing companies. No single company has a dominant share of the temporary staffing industry. Staffing companies compete both to recruit and retain a supply of temporary workers and to attract and retain customers to employ these workers. Customer demand for temporary staffing services is dependent on the overall strength of the labor market and trends toward greater workforce flexibility. The temporary staffing industry includes a number of markets focusing on business needs that vary widely in duration of assignment and level of technical specialization. We operate within the blue-collar staffing market of the temporary staffing industry.
The blue-collar staffing market is subject to volatility based on overall economic conditions. Historically, in periods of economic growth, the number of companies providing temporary staffing services has increased due to low barriers to entry and during recessionary periods the number of companies has decreased through consolidation, bankruptcies, or other events. The temporary staffing industry is experiencing increased demand in relation to total job growth as customers have placed a greater priority on maintaining a more flexible workforce.
Long-term Strategies
Our long term strategies are clearly focused on creating shareholder value. Creating differentiated services, developing transformational competitive advantages, and increasing the efficiency of our service delivery model are underlying strategic principles that guide our strategies.
Our primary strategic focus is creating specialization in the services we offer. Our customers have a variety of challenges in running their business, many of which are unique to the industry in which they operate. Our objective is to be the leading provider of blue-collar staffing by providing specialized service offerings which will improve the productivity and performance of our customers. We believe that specialization differentiates us from our competition and ensures we deliver industry specific solutions tailored to the specific needs of our customers. We have and continue to invest in building industry expertise in various blue collar markets. Those investments have strengthened our ability to provide compelling workforce solutions for our customers. We have also built our sales and service capabilities for national customers while maintaining our core strength of selling and servicing small to mid-sized businesses at the local level. Our specialization substantially improves our ability to provide quality solutions that customers value.
We believe technology can transform traditional methods of doing business in our industry. We are investing in mobile texting solutions which will drive substantial productivity gains in a variety of ways. We believe mobile solutions will increase the number and quality of potential workers as candidates are increasingly looking for efficient and convenient ways to connect with work
Page -
4
opportunities. We expect it will reduce the amount of time it takes our branches to match and assign temporary workers to jobs; particularly for hard-fill-jobs and large short-notice orders. We believe revenues will increase from new business and from fewer unfilled orders in our current business. Also, we believe the geographic reach of our branches will increase and provide the opportunity to reduce occupancy costs by consolidating local branches.
As we consolidate our branch network, we plan to centralize certain recruiting, placement, and customer service duties in major metropolitan areas. Historically, our branches are staffed by generalist positions performing a variety of sales and service activities. We plan to centralize and specialize selected sales and service activities to further improve the productivity and quality of our service.
Acquisitions continue to be a key growth strategy. We have completed a variety of acquisitions in the past and believe we have developed a strong set of competencies in assessing, valuing, and integrating acquisitions. We are excited about the future of the temporary staffing industry and believe we can continue to create shareholder value through acquisitions.
Operations
We provide a wide range of specialized blue-collar staffing services. We operate as Labor Ready for on-demand general labor, Spartan Staffing for skilled manufacturing and logistics labor, CLP Resources for skilled trades for commercial, industrial and energy construction as well as building and plant maintenance, PlaneTechs for skilled mechanics and technicians to the aviation and transportation industries, and, Centerline Drivers for temporary and dedicated drivers to the transportation and distribution industries. Our operations are all in the blue-collar staffing market of the temporary staffing industry. All our brands:
|
•
|
Provide blue-collar temporary labor services to our customers;
|
|
•
|
Serve customers who have a need for temporary staff to perform blue-collar tasks which do not require a permanent employee;
|
|
•
|
Build a temporary workforce through recruiting, screening and hiring. Temporary workers are dispatched to customers where they work under the supervision of our customers;
|
|
•
|
Drive profitability by managing the bill rates to our customers and the pay rates to our workers. Profitable growth requires increased volume and or bill rates which grow faster than pay rates and leveraging our cost structure; and
|
|
•
|
Use innovative technology to improve our ability to recruit quality workers, effectively match workers to the needs of our customers, and meet our customers' needs more efficiently. We are focused on improving the ease of doing business with us for both our temporary workers and customers.
|
Our long-term financial performance expectations of all our brands are similar as are the underlying financial and economic metrics used to manage those brands. Profitable growth is driven by leveraging our cost structure across all brands to achieve economies of scale and investing in technology that improves our productivity.
Our business is generally conducted through a broad network of local branch locations, customer on-site locations generally dedicated to one customer and national service centers. We have a growing capability to service remote customer needs and work sites where we have no physical location. Management of our temporary staffing operations is coordinated from our headquarters in Tacoma, Washington where we provide support and centralized services to our brands and network of offices.
Customers
Our customer mix consists primarily of small and medium-sized businesses serviced by one or more branch offices. We also serve larger national customers. Our full range of blue-collar temporary staffing services enables us to meet all of the blue-collar staffing needs of our customers.
Methods used to sell temporary staffing services to customers vary depending on the customer’s need for temporary staffing services, the local labor supply, the length of assignment, the number of workers and skills required. We are a business-to-business sales provider. Our sales process takes place at the customer’s location. Success is often based on the experience and skill of the sales person and the strength of relationship with the customer. Retention of customers, exclusive of economic conditions, is dependent on the strength of our relationship with the customer, the skill, quality and tenure of temporary workers, and customer service skills.
During
2012
, we served approximately
140,000
customers in the services, retail, wholesale, manufacturing, transportation, aviation, and construction industries. Our ten largest customers accounted for
22%
of total revenue for
2012
,
19%
for
2011
and
19%
for
2010
. Sales to our largest customer accounted for
7%
of total revenue for
2012
,
8%
for
2011
and
9%
for
2010
.
Page -
5
Employees and Temporary Associates
As of
December 28, 2012
we employed approximately
2,900
full-time and part-time employees. In addition, we placed approximately
350,000
temporary workers on assignments with our customers during
2012
. We recruit temporary workers daily so that we can be responsive to the planned as well as unplanned needs of the customers we serve. We attract our pool of temporary workers through personal referrals, online resources, extensive internal databases, advertising, job fairs, and various other methods. We identify the skills, knowledge, abilities, and personal characteristics of a temporary worker and match their competencies or capabilities to a customer’s requirements. This enables our customers to obtain immediate value by placing a highly productive and skilled employee on the job site. We use a variety of proprietary programs for identifying and assessing the skill level of our temporary workers when selecting a particular individual for a specific assignment and retaining those workers for future assignments. We believe that our assessment systems enable us to offer a higher quality of service by increasing productivity, decreasing turnover, and reducing absenteeism.
We provide a bridge to permanent, full-time employment for thousands of temporary workers each year. Temporary workers come to us to fill a short-term financial need, or as a flexible source of income while also working elsewhere or pursuing education. Many stay because of the flexibility that we offer. In many cases, we enable individuals to pay their rent, buy groceries, and remain self-sufficient. Temporary workers may be assigned to different jobs and job sites, and their assignments could last for as little as a single day or extend for several weeks or months. We provide our temporary workers meaningful work and the opportunity to improve their skills.
Our risk management practices have increased the safety of the work environment for our temporary workers. We have increased the involvement of our customers and temporary workers in our safety program. We have a variety of safety-related programs, provide safety information to temporary employees, and conduct job-site visits to increase the safety of employees while working for our customers.
We are considered the legal employer of our temporary workers and laws regulating the employment relationship are applicable to our operations. We consider our relations with our employees and temporary workers to be good.
Competition
We compete in the temporary staffing industry by offering a full range of blue-collar staffing services. The temporary staffing industry is large and fragmented, comprised of thousands of companies employing millions of people and generating billions of dollars in annual revenues.
We experience competition in attracting customers as well as qualified employment candidates. The staffing business is highly competitive with limited barriers to entry, with a number of firms offering services similar to those provided by us on a national, regional, or local basis. We compete with several multi-national full-service and specialized temporary staffing companies, as well as a multitude of local companies. In most geographic areas, no single company has a dominant share of the market. The majority of temporary staffing companies serving the blue-collar staffing market are locally-owned businesses. In many areas the local companies are the strongest competitors, largely due to their longevity in the market and the strength of their customer relationships.
Competitive forces have historically limited our ability to raise our prices to immediately and fully offset increased costs of doing business; some of which include increased temporary worker wages, costs for workers’ compensation, and unemployment insurance.
The most significant competitive factors in the staffing business are price, ability to promptly fill customer orders, success in meeting customers’ quality expectations of temporary workers, and appropriately addressing customer service issues. We believe we derive a competitive advantage from our service history and commitment to the blue-collar temporary employment market and our specialized approach in serving the industries of our customers. Also, our national presence and proprietary systems and programs including worker safety, risk management, and legal and regulatory compliance are key differentiators from many of our competitors.
Seasonality and Cyclical Nature of our Business
Our business experiences seasonal fluctuations. Our quarterly operating results are affected by the seasonality of our customers’ businesses. Demand for our staffing services is higher during the second and third quarters of the year and peaks in the third quarter. Demand is lower during the first and fourth quarters, in part due to limitations to outside work during the winter months. Our working capital requirements are primarily driven by temporary worker payroll and customer accounts receivable. Since receipts from customers lag payroll to temporary workers, working capital requirements increase substantially in periods of growth.
Page -
6
The staffing industry has historically been cyclical, often acting as an indicator of both economic downturns and upswings. Staffing customers tend to use temporary staffing to supplement their existing workforces and generally hire permanent workers when long-term demand is expected to increase. As a consequence, our revenues tend to increase quickly when the economy begins to grow and, conversely, our revenues also decrease quickly when the economy begins to weaken. While we have longer-term customer relationships, which are not directly dependent upon the economic cycle, these revenues are not significant enough to offset the impact of cyclical economic activity for our temporary staffing services.
Financial Information about Geographic Areas
The following table depicts our revenue earned from within the United States and from international operations for the past three fiscal years (
in millions, except percentages
).
|
|
2012
|
2011
|
2010
|
|||||||||||||||||
|
United States (including Puerto Rico)
|
$
|
1,341.5
|
|
96.5
|
%
|
$
|
1,266.3
|
|
96.2
|
%
|
$
|
1,105.5
|
|
96.2
|
%
|
|||||
|
International operations (Canada)
|
48.0
|
|
3.5
|
%
|
49.7
|
|
3.8
|
%
|
43.9
|
|
3.8
|
%
|
||||||||
|
Total revenue from services
|
$
|
1,389.5
|
|
100.0
|
%
|
$
|
1,316.0
|
|
100.0
|
%
|
$
|
1,149.4
|
|
100.0
|
%
|
|||||
The international operations are dependent on shared information and communications equipment housed and maintained in the United States. Net property and equipment located in international operations was less than 1% of total property and equipment in each of the last three fiscal years.
Available Information
Our Annual Report on Form 10-K, along with all other reports and amendments filed with or furnished to the Securities and Exchange Commission (“SEC”) are publicly available, free of charge, on our website at
www.trueblue.com
or at
www.sec.gov
as soon as reasonably practicable after such reports are filed with or furnished to the SEC. Our Corporate Governance Guidelines, Code of Business Conduct and Ethics, and Board Committee Charters are also posted to our website. The information on our website is not part of this or any other report we file with, or furnish to, the SEC.
Page -
7
|
Item 1A.
|
RISK FACTORS
|
Investing in our securities involves risk. The following risk factors and all other information set forth in this Annual Report on Form 10-K should be considered in evaluating our future prospects. In particular, keep these risk factors in mind when you read “forward-looking” statements elsewhere in this report. Forward-looking statements relate to our expectations for future events and time periods. Generally, the words “anticipate,” “believe,” “expect,” “intend,” “plan” and similar expressions identify forward-looking statements. Forward-looking statements involve risks and uncertainties, and future events and circumstances could differ significantly from those anticipated in the forward-looking statements. If any of the events described below occurs, our business, financial condition, results of operations, liquidity or access to the capital markets could be materially and adversely affected.
Our business is significantly affected by fluctuations in general economic conditions.
The demand for our blue-collar staffing services is highly dependent upon the state of the economy and upon staffing needs of our customers. As economic activity slows, companies tend to reduce their use of temporary employees before terminating their regular employees. Significant declines in demand and corresponding revenues, can result in expense de-leveraging, which would result in lower profit levels. Any variation in the economic condition or unemployment levels of the United States, Puerto Rico and Canada or in the economic condition of any region or specific industry in which we have a significant presence may severely reduce the demand for our services and thereby significantly decrease our revenues and profits.
Our business is subject to extensive government regulation and a failure to comply with regulations could materially harm our business.
Our business is subject to extensive regulation. The cost to comply, and any inability to comply, with government regulation could materially harm our business. Increased government regulation of the workplace or of the employer-employee relationship, or judicial or administrative proceedings related to such regulation, could materially harm our business.
The Patient Protection and Affordable Care Act and the Health Care and Education Reconciliation Act of 2010 (collectively, the “Health Care Reform Laws”) include various health-related provisions to take effect through 2014, including requiring most individuals to have health insurance and establishing new regulations on health plans. Although the Health Care Reform Laws do not mandate that employers offer health insurance, beginning in 2014 tax penalties will be assessed on large employers who do not offer health insurance that meets certain affordability or benefit requirements. Unless modified by regulations or subsequent legislation, providing such additional health insurance benefits to our temporary workers, or the payment of tax penalties if such coverage is not provided, will increase our costs. If we are unable to raise the rates we charge our customers to cover these costs, such increases in costs could materially harm our business.
We may incur employment related and other claims that could materially harm our business.
We employ individuals on a temporary basis and place them in our customers' workplaces. We have minimal control over our customers' workplace environments. As the employer of record of our temporary workers, we incur a risk of liability for various workplace events, including claims for personal injury, wage and hour violations, discrimination or harassment, and other actions or inactions of our temporary workers. In addition, some or all of these claims may give rise to litigation including class action litigation. A material adverse impact on our financial statements also could occur for the period in which the effect of an unfavorable final outcome becomes probable and can be reasonably estimated.
We cannot be certain that our insurance will be sufficient in amount or scope to cover all claims that may be asserted against us. Should the ultimate judgments or settlements exceed our insurance coverage, they could have a material effect on our business. We cannot be certain we will be able to obtain appropriate types or levels of insurance in the future, that adequate replacement policies will be available on acceptable terms or that the companies from which we have obtained insurance will be able to pay claims we make under such policies.
We are dependent on workers' compensation insurance coverage at commercially reasonable terms.
We provide workers' compensation insurance for our temporary workers. Our workers' compensation insurance policies are renewed annually. The majority of our insurance policies are with AIG, formerly known as Chartis. Our insurance carriers require us to collateralize a significant portion of our workers' compensation obligation. The majority of collateral is held in trust by a third party for the payment of these claims. The loss or decline in value of the collateral could require us to seek additional sources of capital to pay our workers' compensation claims. We cannot be certain we will be able to obtain appropriate types or levels of insurance in the future or that adequate replacement policies will be available on acceptable terms. As our business grows or our financial results deteriorate, the amount of collateral required will likely increase and the timing of providing collateral could be accelerated. Resources to meet these requirements may not be available. The loss of our workers' compensation insurance coverage
Page -
8
would prevent us from doing business in the majority of our markets. Further, we cannot be certain that our current and former insurance carriers will be able to pay claims we make under such policies.
Our liquidity may be materially adversely affected by constraints in the capital markets.
The principal sources of our liquidity are funds generated from operating activities, available cash and cash equivalents, and borrowings under our credit facility. We must have sufficient sources of liquidity to fund our working capital requirements, workers' compensation collateral requirements, service our outstanding indebtedness, and finance investment opportunities. Without sufficient liquidity, we could be forced to curtail our operations or we may not be able to pursue promising business opportunities.
Our failure to comply with the restrictive covenants under our revolving credit facility could result in an event of default, which, if not cured or waived, could result in our being required to repay these borrowings before their due date. If we are forced to refinance these borrowings on less favorable terms, or are unable to refinance at all, our results of operations and financial condition could be adversely affected by increased costs and rates.
Acquisitions and new business ventures may have an adverse effect on our business.
We expect to continue making acquisitions and entering into new business ventures or initiatives as part of our long-term business strategy. These acquisitions, new business ventures, and initiatives involve significant challenges and risks, including that they may not advance our business strategy, that we may not realize a satisfactory return on our investment, that we may experience difficulty in integrating operations, or diversion of management's attention from our other business. These events could cause harm to our operating results or financial condition.
We operate in a highly competitive business and may be unable to retain customers or market share.
The staffing services business is highly competitive and the barriers to entry are low. There are new competitors entering the market which may increase pricing pressures. In addition, long-term contracts form only a small portion of our revenue. Therefore, there can be no assurance that we will be able to retain customers or market share in the future. Nor can there be any assurance that we will, in light of competitive pressures, be able to remain profitable or, if profitable, maintain our current profit margins.
Our management information systems are vulnerable to damage and interruption.
The efficient operation of our business is dependent on our management information systems. We rely heavily on proprietary management information systems to manage our order entry, order fulfillment, pricing and collections, as well as temporary worker recruitment, dispatch and payment. Our management information systems, mobile device technology and related services, and other technology may not yield the intended results. Our systems may experience problems with functionality and associated delays. The failure of our systems to perform as we anticipate could disrupt our business and could result in decreased revenue and increased overhead costs, causing our business and results of operations to suffer materially. Our primary computer systems and operations are vulnerable to damage or interruption from power outages, computer and telecommunications failures, computer viruses, security breaches, catastrophic events and errors in usage by our employees. Failure of our systems to perform may require significant additional capital and management resources to resolve, causing material harm to our business.
Our results of operations could materially deteriorate if we fail to attract, develop and retain qualified employees.
Our performance is dependent on attracting and retaining qualified employees who are able to meet the needs of our customers. We believe our competitive advantage is providing unique solutions for each individual customer, which requires us to have highly trained and engaged employees. Our success depends upon our ability to attract, develop and retain a sufficient number of qualified employees, including management, sales, recruiting, service and administrative personnel. The turnover rate in the staffing industry is high, and qualified individuals of the requisite caliber and number needed to fill these positions may be in short supply. Our inability to recruit a sufficient number of qualified individuals may delay or affect the speed of our planned growth or strategy change. Delayed expansion, significant increases in employee turnover rates or significant increases in labor costs could have a material adverse effect on our business, financial condition and results of operations.
We may be unable to attract and retain sufficient qualified temporary workers.
We compete with other temporary staffing companies to meet our customer needs and we must continually attract qualified temporary workers to fill positions. Attracting and retaining some skilled temporary employees depends on factors such as desirability of the assignment, location, and the associated wages and other benefits. We have in the past experienced worker shortages and we may experience such shortages in the future. Further, if there is a shortage of temporary workers, the cost to employ these individuals could increase. If we are unable to pass those costs through to our customers, it could materially and adversely affect our business.
Page -
9
We may have additional tax liabilities that exceed our estimates.
We are subject to federal taxes and a multitude of state and local taxes in the United States and taxes in foreign jurisdictions. In the ordinary course of our business, there are transactions and calculations where the ultimate tax determination is uncertain. We are regularly subject to audit by tax authorities. Although we believe our tax estimates are reasonable, the final determination of tax audits and any related litigation could be materially different from our historical tax provisions and accruals. The results of an audit or litigation could materially harm our business.
Accidental disclosure of our employees' or customers' information could materially harm our business.
Failure to protect the integrity and security of our employees' and customers' information, including proprietary information, could expose us to litigation and materially damage our relationship with our employees and our customers. Further, data privacy is subject to frequently changing rules and regulations, which sometimes conflict among the various jurisdictions. Our failure to adhere to or successfully implement changes in response to the changing regulatory requirements could result in legal liability, additional compliance costs, and damage to our reputation.
Failure to maintain adequate financial and management processes and controls could lead to errors in our financial reporting.
Failure to maintain adequate financial and management processes and controls could lead to errors in our financial reporting. If our management is unable to certify the effectiveness of our internal controls or if our independent registered public accounting firm cannot render an opinion on the effectiveness of our internal control over financial reporting, or if material weaknesses in our internal controls are identified, we could be subject to regulatory scrutiny and a loss of public confidence. In addition, if we do not maintain adequate financial and management personnel, processes and controls, we may not be able to accurately report our financial performance on a timely basis, which could cause our stock price to fall.
Outsourcing certain aspects of our business could result in disruption and increased costs.
We have outsourced certain aspects of our business to third party vendors that subject us to risks, including disruptions in our business and increased costs. For example, we have engaged third parties to host and manage certain aspects of our data center information and technology infrastructure and to provide certain back office support activities. Accordingly, we are subject to the risks associated with the vendor's ability to provide these services to meet our needs. If the cost of these services is more than expected, or if the vendor or we are unable to adequately protect our data and information is lost, or our ability to deliver our services is interrupted, then our business and results of operations may be negatively impacted.
|
Item 1B.
|
UNRESOLVED STAFF COMMENTS
|
None.
|
Item 2.
|
PROPERTIES
|
We lease the building space at all of our branch offices except for two that we own in Florida. Under the majority of these leases, both parties have the right to terminate the lease on 90 days notice. We own an office building in Tacoma, Washington, which serves as our headquarters. Management believes all of our facilities are currently suitable for their intended use.
|
Item 3.
|
LEGAL PROCEEDINGS
|
See discussion of legal contingencies and developments in Note 7 to the consolidated financial statements included in Part II, Item 8 of this Annual Report on Form 10-K.
|
Item 4.
|
MINE SAFETY DISCLOSURES
|
None.
Page -
10
|
Item 5.
|
MARKET FOR REGISTRANT'S COMMON EQUITY, RELATED STOCKHOLDER MATTERS AND ISSUER PURCHASES OF EQUITY SECURITIES
|
Market Information
Our common stock is listed on the New York Stock Exchange under the ticker symbol TBI. The table below sets forth the high and low sales prices for our common stock as reported by the New York Stock Exchange during the last two fiscal years:
|
High
|
Low
|
||||||
|
December 28, 2012
|
|||||||
|
Fourth Quarter
|
$
|
16.51
|
|
$
|
11.84
|
|
|
|
Third Quarter
|
$
|
17.40
|
|
$
|
14.18
|
|
|
|
Second Quarter
|
$
|
18.22
|
|
$
|
13.59
|
|
|
|
First Quarter
|
$
|
18.13
|
|
$
|
14.17
|
|
|
|
December 30, 2011
|
|||||||
|
Fourth Quarter
|
$
|
14.69
|
|
$
|
10.40
|
|
|
|
Third Quarter
|
$
|
16.43
|
|
$
|
10.80
|
|
|
|
Second Quarter
|
$
|
17.58
|
|
$
|
12.84
|
|
|
|
First Quarter
|
$
|
19.25
|
|
$
|
14.68
|
|
|
Holders of the Corporation’s Capital Stock
We had approximately
561
shareholders of record as of
February 8, 2013
.
Dividends
No cash dividends have been declared on our common stock to date nor have any decisions been made to pay a dividend in the future. Payment of dividends is evaluated on a periodic basis and if a dividend were paid, it would be subject to the covenants of our lending facility, which may have the effect of restricting our ability to pay dividends.
Stock Repurchases
Under our authorized stock repurchase programs, we repurchased and retired
0.3 million
shares of our common stock during
2012
for a total amount of
$4.4 million
, including commissions. In July 2011, our Board of Directors approved a program to repurchase
$75 million
of our outstanding common stock. As of
December 28, 2012
,
$35.2 million
remained available for repurchase of common stock under the current authorization, which has no expiration date. We repurchased and retired
4.5 million
shares of our common stock during
2011
for a total amount of
$56.9 million
including commissions.
The table below includes repurchases of our common stock pursuant to publicly announced plans or programs and those not made pursuant to publicly announced plans or programs during the thirteen weeks ended
December 28, 2012
.
|
Period
|
Total number
of shares
purchased (1)
|
Weighted
average price
paid per
share (2)
|
Total number of shares
purchased as part of
publicly announced plans
or programs
|
Maximum number of shares (or
approximate dollar value) that
may yet be purchased under
plans or programs at period
end (3)
|
|||||||
|
9/29/12 through 10/26/12
|
842
|
|
|
$15.86
|
|
—
|
|
$35.2 million
|
|||
|
10/27/12 through 11/23/12
|
1,756
|
|
|
$13.70
|
|
—
|
|
$35.2 million
|
|||
|
11/24/12 through 12/28/12
|
2,880
|
|
|
$14.60
|
|
—
|
|
$35.2 million
|
|||
|
Total
|
5,478
|
|
|
$14.50
|
|
—
|
|
||||
____________________
|
(1)
|
During the thirteen weeks ended
December 28, 2012
, we purchased
5,478
shares in order to satisfy employee tax withholding obligations upon the vesting of restricted stock. These shares were not acquired pursuant to any publicly announced purchase plan or program.
|
|
(2)
|
Weighted average price paid per share does not include any adjustments for commissions.
|
|
(3)
|
Our Board of Directors authorized a
$75 million
share repurchase program in July 2011 that does not have an expiration date. As of
December 28, 2012
,
$35.2 million
remains available for repurchase of our common stock under the current authorization.
|
Page -
11
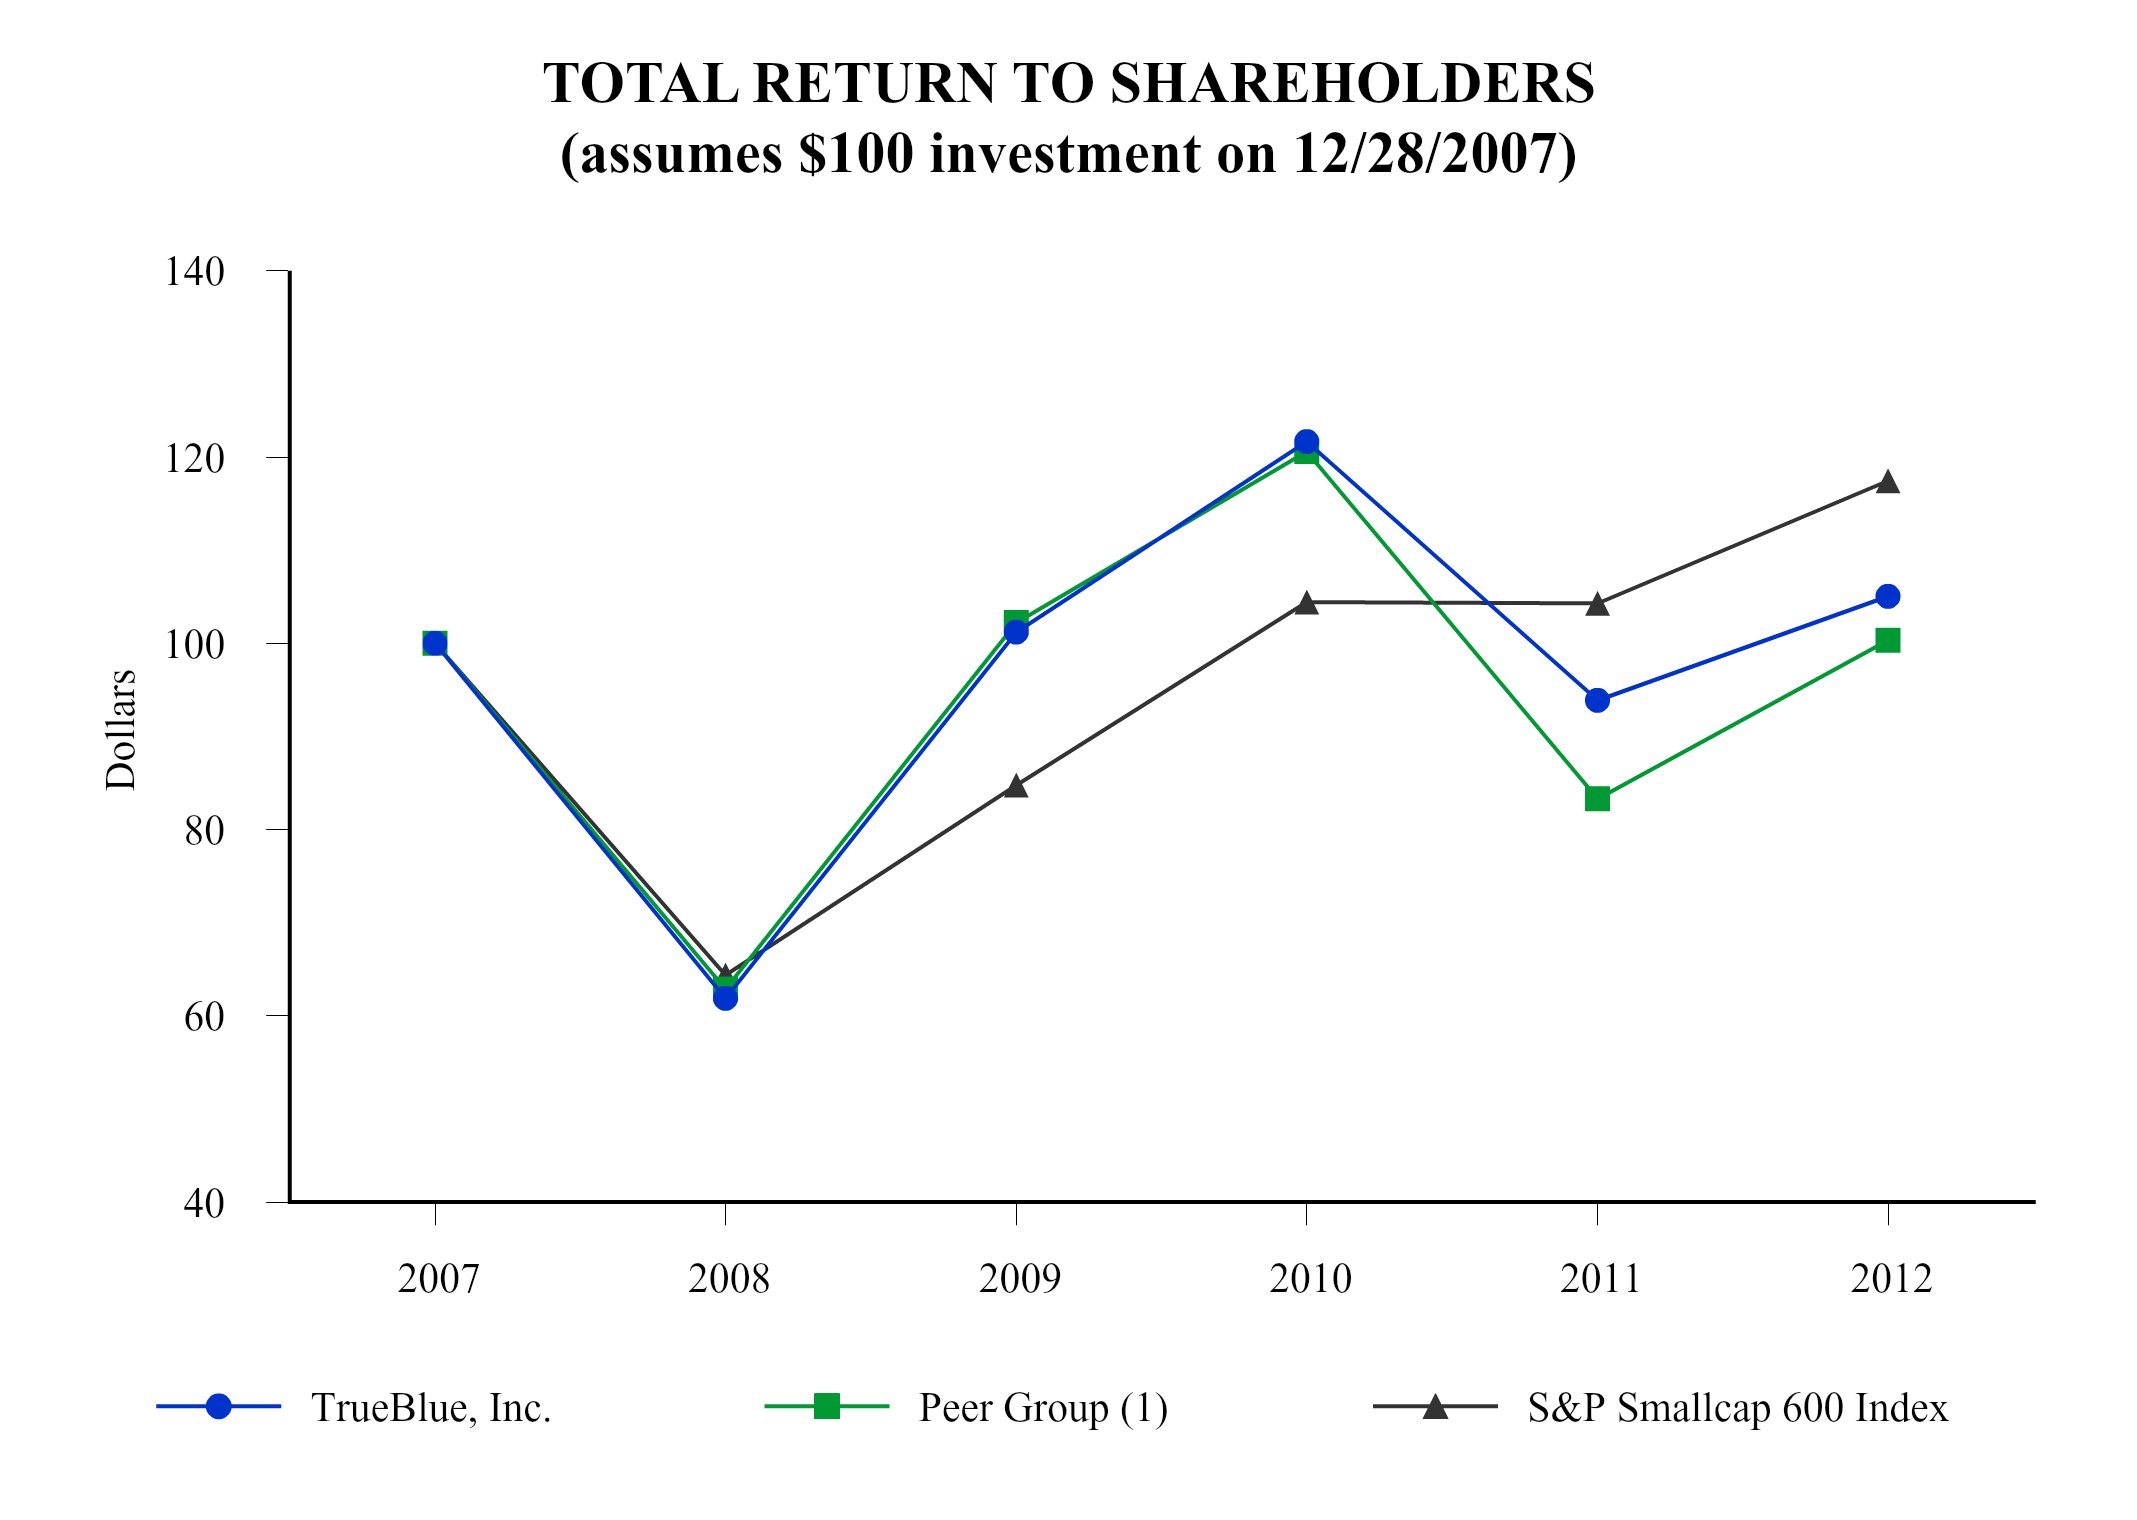
TrueBlue Stock Comparative Performance Graph
The following graph depicts our stock price performance from
December 28, 2007
through
December 28, 2012
, relative to the performance of the S&P Smallcap 600 Index, and a peer group of companies in the temporary staffing industry. All indices shown in the graph have been reset to a base of 100 as of
December 28, 2007
, and assume an investment of $100 on that date and the reinvestment of dividends, if any, paid since that date.
COMPARISON OF 5-YEAR CUMULATIVE TOTAL RETURN
Among TrueBlue, Inc., the S&P Smallcap 600 Index
and Selected Peer Group
|
Total Return Analysis
|
2007
|
2008
|
2009
|
2010
|
2011
|
2012
|
|||||||||||||||||
|
TrueBlue, Inc.
|
$
|
100
|
|
$
|
62
|
|
$
|
101
|
|
$
|
122
|
|
$
|
94
|
|
$
|
105
|
|
|||||
|
Peer Group (1)
|
$
|
100
|
|
$
|
63
|
|
$
|
102
|
|
$
|
121
|
|
$
|
83
|
|
$
|
100
|
|
|||||
|
S&P Smallcap 600 Index (2)
|
$
|
100
|
|
$
|
64
|
|
$
|
85
|
|
$
|
104
|
|
$
|
104
|
|
$
|
117
|
|
|||||
___________________
|
(1)
|
The peer group includes Kelly Services, Inc., Manpower, Inc., Robert Half International, Adecco SA and Randstad.
|
|
(2)
|
In 2012 we selected the S&P Smallcap 600 Index as an index comparison due to our market capitalization being more in line with this index as opposed to the using the S&P Midcap 400 Index. The S&P Midcap 400 Index had a 2012 total return of $116 based on an assumed $100 investment on 12/28/2007.
|
Page -
12
|
Item 6.
|
SELECTED FINANCIAL DATA
|
The following selected consolidated financial information has been derived from our audited Consolidated Financial Statements. The data should be read in conjunction with item 1A “Risk Factors”, Item 7 “Management’s Discussion and Analysis of Financial Condition and Results of Operations” and our Consolidated Financial Statements and the notes included in Item 8 of this Annual Report on Form 10-K.
Summary Consolidated Financial and Operating Data
As of and for the Fiscal Year Ended
(1)
(in millions, except per share data and number of branches)
|
2012
(52 Weeks) |
2011
(52 Weeks) |
2010
(53 Weeks) |
2009
(52 Weeks) |
2008
(52 Weeks) |
|||||||||||||||
|
Statements of Operations Data:
|
|||||||||||||||||||
|
Revenue from services
|
$
|
1,389.5
|
|
$
|
1,316.0
|
|
$
|
1,149.4
|
|
$
|
1,018.4
|
|
$
|
1,384.3
|
|
||||
|
Cost of services
|
1,017.1
|
|
969.0
|
|
845.9
|
|
727.4
|
|
971.8
|
|
|||||||||
|
Gross profit
|
372.4
|
|
347.0
|
|
303.5
|
|
291.0
|
|
412.5
|
|
|||||||||
|
Selling, general and administrative expenses
|
300.5
|
|
282.8
|
|
258.8
|
|
262.2
|
|
332.1
|
|
|||||||||
|
Goodwill and intangible asset impairment
|
—
|
|
—
|
|
—
|
|
—
|
|
61.0
|
|
|||||||||
|
Depreciation and amortization
|
18.9
|
|
16.4
|
|
16.5
|
|
17.0
|
|
16.8
|
|
|||||||||
|
Interest and other income, net
|
1.6
|
|
1.5
|
|
0.9
|
|
2.3
|
|
5.5
|
|
|||||||||
|
Income before tax expenses
|
54.6
|
|
49.3
|
|
29.1
|
|
14.1
|
|
8.1
|
|
|||||||||
|
Income tax expense
|
21.0
|
|
18.5
|
|
9.3
|
|
5.3
|
|
12.3
|
|
|||||||||
|
Net income (loss)
|
$
|
33.6
|
|
$
|
30.8
|
|
$
|
19.8
|
|
$
|
8.8
|
|
$
|
(4.2
|
)
|
||||
|
Net income (loss) per diluted share
|
$
|
0.84
|
|
$
|
0.73
|
|
$
|
0.46
|
|
$
|
0.20
|
|
$
|
(0.10
|
)
|
||||
|
Weighted average diluted shares outstanding
|
39.9
|
|
42.3
|
|
43.5
|
|
43.0
|
|
42.9
|
|
|||||||||
|
|
At Fiscal Year End,
|
||||||||||||||||||
|
2012
|
2011
|
2010
|
2009
|
2008
|
|||||||||||||||
|
Balance Sheet Data:
|
|||||||||||||||||||
|
Working capital
|
$
|
203.6
|
|
$
|
168.3
|
|
$
|
207.6
|
|
$
|
163.2
|
|
$
|
147.5
|
|
||||
|
Total assets
|
$
|
601.7
|
|
$
|
560.8
|
|
$
|
546.5
|
|
$
|
518.1
|
|
$
|
519.7
|
|
||||
|
Long-term liabilities
|
$
|
154.5
|
|
$
|
154.9
|
|
$
|
147.8
|
|
$
|
147.9
|
|
$
|
154.2
|
|
||||
|
Total liabilities
|
$
|
268.1
|
|
$
|
267.2
|
|
$
|
233.8
|
|
$
|
232.7
|
|
$
|
249.5
|
|
||||
|
Branches open at period end
|
691
|
|
712
|
|
721
|
|
754
|
|
850
|
|
|||||||||
____________________
|
(1)
|
Our fiscal year ends on the last Friday in December. The
2012
fiscal year ended on
December 28, 2012
, included 52 weeks. The 2010 fiscal year ended on December 31, 2010, included 53 weeks, with the 53rd week falling in our fourth fiscal quarter. All other prior years presented included 52 weeks.
|
The operating results reported above include the results of acquisitions subsequent to their respective purchase dates. In February 2008, we acquired substantially all of the assets of TLC Services Group, Inc. and in April 2008, we acquired 100% of the common stock of Personnel Management, Inc.
No cash dividends have been declared on our common stock to date nor have any decisions been made to pay a dividend in the future.
Page -
13
|
Item 7.
|
MANAGEMENT'S DISCUSSION AND ANALYSIS OF FINANCIAL CONDITION AND RESULTS OF OPERATION
|
The following discussion should be read in conjunction with, and is qualified in its entirety by, the Consolidated Financial Statements and Notes thereto included in Item 8 in this Annual Report on Form 10-K. This item contains forward-looking statements that involve risks and uncertainties. Actual results may differ materially from those indicated in such forward-looking statements. Factors that may cause such a difference include, but are not limited to, those discussed in “Item 1A, Risk Factors.”
Management’s Discussion and Analysis of Financial Condition and Results of Operations (“MD&A”) is designed to provide the reader of our financial statements with a narrative from the perspective of management on our financial condition, results of operations, liquidity and certain other factors that may affect future results. Our MD&A is presented in six sections:
|
•
|
Overview
|
|
•
|
Results of Operations
|
|
•
|
Liquidity and Capital Resources
|
|
•
|
Contractual Obligations and Commitments
|
|
•
|
Summary of Critical Accounting Policies
|
|
•
|
New Accounting Standards
|
OVERVIEW
TrueBlue is a leading provider of temporary blue-collar staffing. We provide a wide range of specialized blue-collar staffing services. We have a network of
691
branches in all
50
states, Puerto Rico and Canada, customer on-site locations generally dedicated to one customer, and national service centers which supply our customers with temporary workers. In
2012
, we connected approximately
350,000
people to work through the following blue-collar staffing brands: Labor Ready for general labor, Spartan Staffing for light industrial services, CLP Resources for skilled trades, PlaneTechs for aviation and diesel mechanics and technicians, and Centerline Drivers for dedicated and temporary drivers. Headquartered in Tacoma, Washington, we serve approximately
140,000
businesses primarily in the services, construction, transportation, manufacturing, retail and wholesale industries.
Revenue grew to
$1.4 billion
for
2012
, a
5.6%
increase compared to the prior year. Revenue growth slowed in the second half of 2012 due to lower revenue from a large customer and softening growth trends across the business. Services related to this large customer are project based and have been declining throughout the year as the project matures and our customer makes workforce adjustments. Excluding revenue from this customer, revenue grew 8.6%. The growth is driven primarily by our continued success in renewable energy construction projects along with an improving construction market.
Our revenue growth is also due to the continued success of our specialized market sales and service strategy. Our dedicated sales leaders have expertise in the specific industries we serve. They partner with our service teams to meet the specific project needs of our national customers. Likewise, they provide our branches with best practice industry knowledge including sales and service methods for each industry. Our local sales and service teams build strong customer relationships and loyalty in providing tailored solutions that meet the day to day needs of our local customers.
Gross profit as a percent of revenue for fiscal 2012 of 26.8% improved by 0.4% compared to 2011 primarily due to increased bill rates which more than offset increases to minimum wages and unemployment taxes in 2012. We continue to be selective in the customers we serve and diligent in our approach to setting appropriate bill rates.
Selling, general, and administrative expenses as a percentage of revenue remained relatively constant at 21.6% for 2012 as compared to 21.5% for the prior year. Revenue from a large customer declined approximately $30 million compared to 2011. The operations servicing this customer were not reduced as they are located in a national recruiting and service center that is being leveraged to grow other service lines.
Net income grew by
9.2%
to
$34 million
, or
$0.84
per diluted share for fiscal
2012
, compared to a net income of $31 million, or $0.73 per diluted share, for fiscal
2011
.
We are in a strong financial position to fund working capital needs for planned 2013 growth and expansion opportunities. We have cash and cash equivalents of
$130 million
at
December 28, 2012
. As of
December 28, 2012
, the maximum $80 million was available under the Revolving Credit Facility and
$7 million
of letters of credit had been issued against the facility, leaving an unused portion of
$73 million
.
Page -
14
RESULTS OF OPERATIONS
The following table presents selected financial data (
in millions, except percentages and per share amounts
):
|
|
2012
|
2011
|
2010
|
||||||||
|
Revenue from services
|
$
|
1,389.5
|
|
$
|
1,316.0
|
|
$
|
1,149.4
|
|
||
|
Total revenue growth %
|
5.6
|
%
|
14.5
|
%
|
12.9
|
%
|
|||||
|
Gross profit as a % of revenue
|
26.8
|
%
|
26.4
|
%
|
26.4
|
%
|
|||||
|
Selling, general and administrative expenses
|
$
|
300.5
|
|
$
|
282.8
|
|
$
|
258.7
|
|
||
|
Selling, general and administrative expenses as a % of revenue
|
21.6
|
%
|
21.5
|
%
|
22.5
|
%
|
|||||
|
Income from operations
|
$
|
53.0
|
|
$
|
47.8
|
|
$
|
28.3
|
|
||
|
Income from operations as a % of revenue
|
3.8
|
%
|
3.6
|
%
|
2.5
|
%
|
|||||
|
Net Income
|
$
|
33.6
|
|
$
|
30.8
|
|
$
|
19.8
|
|
||
|
Net Income per diluted share
|
$
|
0.84
|
|
$
|
0.73
|
|
$
|
0.46
|
|
||
Our business experiences seasonal fluctuations. Our quarterly operating results are affected by the seasonality of our customers’ businesses as well as timing and duration of project work. Demand for our staffing services is higher during the second and third quarters of the year with demand peaking in the third quarter and lower during the first and fourth quarters, in part due to limitations to outside work during the winter months.
Revenue
Revenue from services in comparison with the same period in the prior year was as follows
(in millions, except percentages)
:
|
|
2012
|
2011
|
2010
|
||||||||
|
Revenue from services
|
$
|
1,389.5
|
|
$
|
1,316.0
|
|
$
|
1,149.4
|
|
||
|
Total revenue growth %
|
5.6
|
%
|
14.5
|
%
|
12.9
|
%
|
|||||
Revenue grew to
$1.4 billion
for
2012
, a
5.6%
increase compared to the prior year. Revenue growth slowed in the second half of 2012 due to manufacturing declines, softening growth trends across the business, and lower revenue from a large customer. Services related to this large customer are project based and have been declining throughout the year as the project matures and our customer makes workforce adjustments. Excluding revenue from this customer revenue grew 8.6%. Our revenue growth is also due to the continued success of our specialized market sales and service strategy. Our dedicated sales leaders have expertise in the specific industries we serve. They partner with our service teams to meet the specific project needs of our national customers. Likewise, they provide our branches with best practice industry knowledge including sales and service methods for each industry. Our local sales and service teams build strong customer relationships and loyalty in providing tailored solutions that meet the day to day needs of our local customers. As a result we have experienced continued success in renewable energy construction projects along with an improving construction market.
For fiscal 2011, revenue grew to $1.3 billion, a 14.5% increase compared to the prior year. The strong revenue growth in 2011 was primarily driven by strong demand for our services across most major industries and geographies. We experienced double digit revenue growth in most of the industry groups we serve.
Gross profit
Gross profit in comparison with the same period in the prior year was as follows (
in millions, except percentages
):
|
|
2012
|
2011
|
2010
|
||||||||
|
Gross profit
|
$
|
372.4
|
|
$
|
347.0
|
|
$
|
303.5
|
|
||
|
Gross profit as a % of revenue
|
26.8
|
%
|
26.4
|
%
|
26.4
|
%
|
|||||
Page -
15
Gross profit represents revenues from services less direct costs of services, which consist of payroll, payroll taxes, workers' compensation insurance costs, and reimbursable costs. Gross profit as a percent of revenue improved by 0.4% for fiscal
2012
primarily due to increased bill rates which more than offset increases to minimum wages and unemployment taxes in 2012. Our team continues to leverage our specialized approach in the blue-collar market along with disciplined pricing to drive higher gross margin. We are selective in the customers we serve and diligent in our approach to setting appropriate bill rates.
Workers’ compensation expense was 3.8% of revenue for fiscal
2012
and 3.9% for fiscal
2011
. We actively manage the safety of our temporary workers with our risk management programs and work together with our network of service providers to control costs. We further reduced accidents for fiscal 2012 and the associated cost of workers' compensation.
For Fiscal 2011, gross profit as a percentage of revenue was unchanged compared to fiscal 2010 due to offsetting factors. Gross profit as a percentage of revenue for fiscal 2010 included the benefit of HIRE Act credits, net of other payroll tax items, of 0.2% of revenue. The HIRE Act provided incentives for hiring and retaining workers by exempting the employer share of the social security tax on wages paid to qualified individuals beginning on March 18, 2010 and expired on December 31, 2010. Excluding the benefit of these net 2010 HIRE Act credits, gross profit as a percent of revenue for 2011 compared to 2010 has improved by 0.2%. The improvement was primarily due to our success with pricing and increased billing rates. Workers’ compensation expense was 3.9% of revenue for fiscal 2011 and 3.8% for fiscal 2010.
Selling, general and administrative expenses
Selling, general and administrative (“SG&A”) expenses were as follows (
in millions, except percentages
):
|
|
2012
|
2011
|
2010
|
||||||||
|
Selling, general and administrative expenses
|
$
|
300.5
|
|
$
|
282.8
|
|
$
|
258.7
|
|
||
|
Percentage of revenue
|
21.6
|
%
|
21.5
|
%
|
22.5
|
%
|
|||||
SG&A as a percentage of revenue remained relatively constant at 21.6% for 2012 as compared to 21.5% for the prior year. The increase in SG&A spending of $17.7 million or 6.2% for fiscal
2012
is primarily due to the variable selling and other operating expenses associated with the revenue increase of $73.5 million or
5.6%
. Excluding revenue from a large customer, revenue increased $103.8 million or 8.6% over the prior year. Revenue from this large customer declined approximately $30 million compared to 2011. The operations servicing this customer were not reduced as they are located in a national recruiting and service center that is being leveraged to grow other service lines. We remain focused on leveraging our cost structure which should produce incremental operating margins with additional future revenue.
We have continued to invest in our specialized vertical market sales and service strategy and projects to further improve our efficiency and effectiveness in recruiting and retaining our temporary workers and attracting and retaining our customers. We completed a major investment in the operating system of our largest brand during 2012. We are seeing the benefits of improved operating efficiency.
For fiscal 2011, SG&A declined to 21.5% as a percentage of revenue as compared to 22.5% for fiscal 2010. During 2011 we produced strong incremental operating margins as we leveraged our fixed cost structure. The increase in SG&A spending for 2011 was primarily due to two factors. First, we experienced an expected increase in variable expenses to support the increased revenue of $167 million over the prior year. Second, we invested in specialized sales and marketing personnel to sell to and serve our vertical market customer groups. Our vertical market specialists and their programs made significant contributions to our revenue growth. We also filled open sales and service positions in local markets and made a variety of market adjustment increases to compensation to retain our key performers.
Depreciation and amortization and interest
Depreciation and amortization and interest were as follows
(in millions, except percentages)
:
|
|
2012
|
2011
|
2010
|
||||||||
|
Depreciation and amortization
|
$
|
18.9
|
|
$
|
16.4
|
|
$
|
16.5
|
|
||
|
Percentage of revenue
|
1.4
|
%
|
1.2
|
%
|
1.4
|
%
|
|||||
Depreciation and amortization for fiscal 2012 increased over the prior year by $2.5 million primarily from increased capital spending on enterprise technology improvement projects. These projects are designed to further improve our efficiency and effectiveness in recruiting and retaining our temporary workers and attracting and retaining our customers.
Page -
16
Interest and other income, net
Depreciation and amortization and interest were as follows
(in millions, except percentages)
:
|
2012
|
2011
|
2010
|
|||||||||
|
Interest and other income, net
|
$
|
1.6
|
|
$
|
1.5
|
|
$
|
0.9
|
|
||
|
Percentage of revenue
|
0.1
|
%
|
0.1
|
%
|
0.1
|
%
|
|||||
Net interest income for
2012
remained relatively flat when compared to 2011. Net interest income for 2011 increased over 2010 due to increased yields on our restricted cash and investments and the 2011 renewal of our revolving credit facility with lower fees and cost to borrow.
Income taxes
The effective income tax rate was as follows
(in millions except percentages)
:
|
2012
|
2011
|
2010
|
|||||||||
|
Income tax expense
|
$
|
21.0
|
|
$
|
18.5
|
|
$
|
9.3
|
|
||
|
Effective income tax rate
|
38.4
|
%
|
37.6
|
%
|
32.0
|
%
|
|||||
Our effective tax rate on earnings for
2012
was
38.4%
compared to
37.6%
for the same period in
2011
. The increase in the effective income tax rate is due primarily to federal Work Opportunity Tax Credits which largely expired at the end of 2011. This income tax credit was designed to encourage employers to hire workers from certain targeted groups with higher-than-average unemployment rates. The principal difference between the statutory federal income tax rate of 35% and our effective income tax rate results from state income taxes, federal tax credits and certain non-deductible expenses. The lower effective tax rate in 2010 was primarily due to the favorable resolution of certain prior year tax matters.
The American Taxpayer Relief Act of 2012 ("the Act") was signed into law on January 2, 2013. The Act retroactively restored the Work Opportunity Tax Credit. Because a change in tax law is accounted for in the period of enactment, the retroactive effect of the Act on the Company's U.S. federal taxes for 2012, a benefit of approximately
$3.2 million
, will be recognized in 2013. In addition, we expect the Act's extension of these provisions through the end of 2013 will reduce our estimated annual effective tax rate for 2013 compared to 2012.
Results of Operations Future Outlook
The following highlights represent our expectations in regard to operating trends for fiscal year
2013
. These expectations are subject to revision as our business changes with the overall economy:
|
•
|
Our top priority remains to increase revenue and leverage our cost structure which should produce incremental operating margins with additional future revenue. We will continue to invest in our specialized sales and customer service programs which we believe will enhance our ability to capitalize on further revenue growth and customer retention. We actively pursue large project opportunities in vertical markets with growth opportunities. One of our largest successes is in the construction of renewable energy projects. While our growth rates have diminished due to more challenging prior year comparisons, renewable energy projects remain an attractive opportunity.
|
|
•
|
Effective February 4, 2013, we acquired MDT Personnel, the third-largest general labor staffing firm in the United States. MDT supplies blue-collar labor to industries similar to those served by TrueBlue, including construction, event staffing, disaster recovery, hospitality, and manufacturing through its network of 105 branches and 15 customer on-site locations in 25 states. TrueBlue will expand the size of its general labor business by merging MDT's operations with those of the Labor Ready brand. Selected branches will be consolidated to leverage our cost structure and produce long term incremental operating margins. The acquisition will enhance TrueBlue's national position as the leading provider of dependable blue-collar temporary labor. The decision to acquire MDT's operations reflects our overall optimism about growth in the staffing industry. We will continue to pursue other opportunities to grow our share of the blue collar market through acquisitions.
|
|
•
|
As the economy grows, we will continue to evaluate opportunities to expand our market presence. All of our multi-location brands have opportunities to expand through new physical locations or by sharing existing locations. Where possible, we plan to expand the presence of our brands by sharing existing locations to achieve cost synergies. We plan to build on our success with centralized recruitment and dispatch of our temporary workers to locations without physical branches and expand our geographic reach.
|
Page -
17
|
•
|
We have been investing in mobile technology solutions. We see compelling opportunities to improve the speed in assigning candidates to jobs and increase the productivity of our branch employees resulting in the consolidation of branches and other benefits to our cost structure. These technologies are currently under development and we expect to deploy them during the middle of 2013. We believe this will position us to begin generating efficiencies during the back half of 2013. The extent of additional efficiencies will be understood after our deployment and evaluation in 2013.
|
|
•
|
Services for a large customer project have been declining throughout 2012 as the project matures and our customer makes workforce adjustments. While we expect continued revenue from this customer, our work is project based and the completion of certain projects will continue to impact our revenue trends. Revenue from this customer was approximately $76 million in 2012. We expect that to continue to decline in 2013.
|
|
•
|
Customer demand for blue-collar staffing services is dependent on the overall strength of the labor market and trends towards greater workforce flexibility within the blue-collar markets in which we operate. Due to our industry's sensitivity to economic factors, the inherent difficulty in forecasting the direction and strength of the economy and the short term nature of staffing assignments, our visibility for future demand is limited. As a result, we monitor a number of economic indicators as well as certain trends to estimate future revenue. Future results will be dependent on whether the underlying economic uncertainty continues, trends in customer preference towards a more flexible workforce continue, and our ability to more effectively and efficiently serve customer needs. Based on these anticipated trends, we expect continued uncertainty in the economy and pressure on revenue in 2013. However, we are encouraged by an improving construction market and diminishing uncertainty.
|
LIQUIDITY AND CAPITAL RESOURCES
Our principal source of liquidity is operating cash flows. Our net income and, consequently, our cash provided from operations are impacted by sales volume, timing of collections, seasonal sales patterns and profit margins. Over the past three fiscal years, net cash provided by operations was approximately $124.9 million.
Cash flows from operating activities
Our cash flows from operating activities were as follows (
in millions
):
|
|
2012
|
2011
|
2010
|
||||||||
|
Net income
|
$
|
33.6
|
|
$
|
30.8
|
|
$
|
19.8
|
|
||
|
Adjustments to reconcile net income to net cash from operating activities:
|
|||||||||||
|
Depreciation and amortization
|
18.9
|
|
16.4
|
|
16.5
|
|
|||||
|
Provision for doubtful accounts
|
7.0
|
|
6.6
|
|
8.2
|
|
|||||
|
Stock-based compensation
|
7.9
|
|
7.4
|
|
7.2
|
|
|||||
|
Deferred income taxes
|
3.1
|
|
(1.9
|
)
|
5.3
|
|
|||||
|
Other operating activities
|
1.9
|
|
(0.5
|
)
|
(0.2
|
)
|
|||||
|
Changes in operating assets and liabilities:
|
|
|
|||||||||
|
Accounts receivable
|
(20.4
|
)
|
(51.8
|
)
|
(11.6
|
)
|
|||||
|
Income taxes
|
(3.7
|
)
|
3.5
|
|
(3.3
|
)
|
|||||
|
Accounts payable and other accrued expenses
|
1.3
|
|
16.2
|
|
3.4
|
|
|||||
|
Workers' compensation claims reserve
|
3.7
|
|
4.5
|
|
(2.2
|
)
|
|||||
|
Other assets and liabilities
|
(1.0
|
)
|
(0.6
|
)
|
(1.1
|
)
|
|||||
|
Net cash provided by operating activities
|
$
|
52.3
|
|
$
|
30.6
|
|
$
|
42.0
|
|
||
Net cash provided by operating activities was
$52.3 million
for fiscal
2012
as compared to net cash provided by operating activities of
$30.6 million
for fiscal
2011
.
|
•
|
The increase in cash from operating activities is primarily due to net income of $33.6 million.
|
|
•
|
In 2012, accounts receivable increased by $20.4 million primarily due to continued revenue growth. In 2011, accounts receivable increased by $51.8 million due to revenue growth and a low beginning balance due to significant customer payments received at the end of 2010.
|
Page -
18
|
•
|
The increase in depreciation and amortization during 2012 is primarily due to increased capital spending focused on enterprise technology improvement projects. These projects are designed to further improve our efficiency and effectiveness in recruiting and retaining our temporary workers and attracting and retaining our customers.
|
|
•
|
Generally our workers' compensation reserve for estimated claims increases as temporary labor services increase and decreases as temporary labor services decline. During the current year, our workers' compensation reserve increased as we increased the delivery of temporary labor services, partially offset by the timing of claim payments.
|
|
•
|
Income taxes receivable increased in 2012 due to over payments of estimated taxes as a result of larger than expected deductions.
|
Cash flows from investing activities
Our cash flows from investing activities were as follows (
in millions
):
|
|
2012
|
2011
|
2010
|
||||||||
|
Capital expenditures
|
$
|
(17.8
|
)
|
$
|
(9.7
|
)
|
$
|
(7.0
|
)
|
||
|
Change in restricted cash and cash equivalents
|
7.6
|
|
68.5
|
|
3.9
|
|
|||||
|
Purchase of restricted investments
|
(33.8
|
)
|
(88.2
|
)
|
—
|
|
|||||
|
Maturities of restricted investments
|
18.1
|
|
9.3
|
|
—
|
|
|||||
|
Other
|
(0.3
|
)
|
(6.8
|
)
|
(0.3
|
)
|
|||||
|
Net cash used in investing activities
|
$
|
(26.2
|
)
|
$
|
(26.9
|
)
|
$
|
(3.4
|
)
|
||
|
•
|
Capital expenditures were higher in 2012 primarily related to investments made to upgrade our proprietary information systems and invest in enterprise technology improvement projects. These projects are designed to further improve our efficiency and effectiveness in recruiting, dispatching and retaining our workers as well as leveraging our centralized service delivery and making it easier for the customer to do business. We anticipate that total capital expenditures will be approximately $10 million in
2013
.
|
|
•
|
Restricted cash and investments consist primarily of collateral that has been provided or pledged to insurance carriers and state workers' compensation programs. The change in restricted cash and cash equivalents is primarily a product of purchasing restricted investments, maturities on restricted investments, and payments to workers' compensation insurance providers.When combining this change with purchases of restricted investments net of maturities of restricted investments, restricted cash and investments increased by $8.1 million for fiscal
2012
. This increase is primarily due to an increase in the collateral requirements by our workers' compensation insurance providers related to growth in operations and due the timing of payments to our insurance providers.
|
In 2011, the changes to restricted cash and investments were primarily due an agreement we entered into with AIG, formerly known as Chartis, and the Bank of New York Mellon creating a trust ("Trust") which holds the majority of our collateral obligations under existing workers' compensation insurance policies previously held directly by AIG. Restricted investments increased by $10.4 million for 2011, primarily due to additional restricted cash and investments required as collateral due to growth.
|
•
|
The 2011 change to Other includes the purchase of a staffing company and a technology company in 2011.
|
Page -
19
Cash flows from financing activities
Our cash flows from financing activities were as follows (
in millions
):
|
|
2012
|
2011
|
2010
|
||||||||
|
Purchases and retirement of common stock
|
$
|
(4.4
|
)
|
$
|
(56.9
|
)
|
$
|
—
|
|
||
|
Net proceeds from stock option exercises and employee stock purchase plans
|
4.2
|
|
1.1
|
|
1.1
|
|
|||||
|
Common stock repurchases for taxes upon vesting of restricted stock
|
(2.2
|
)
|
(1.8
|
)
|
(1.6
|
)
|
|||||
|
Payments on debt
|
(4.5
|
)
|
(0.3
|
)
|
(0.4
|
)
|
|||||
|
Other
|
0.7
|
|
0.7
|
|
0.1
|
|
|||||
|
Net cash used in financing activities
|
$
|
(6.2
|
)
|
$
|
(57.2
|
)
|
$
|
(0.8
|
)
|
||
|
•
|
Under our authorized stock repurchase program, we repurchased and retired
0.3 million
shares of our common stock during fiscal
2012
for a total amount of
$4.4 million
including commissions. We repurchased and retired
4.5 million
shares of our common stock during fiscal
2011
for a total amount of
$56.9 million
including commissions.
|
Future outlook
We are in a strong financial position to fund working capital needs for planned growth. The strength of our current financial position is highlighted as follows:
|
•
|
We have cash and cash equivalents of
$129.5 million
as of
December 28, 2012
.
|
|
•
|
Our borrowing availability under our credit facility is principally based on accounts receivable and the value of our corporate building. We have
$72.8 million
of borrowing available under our credit facility as of
December 28, 2012
. We believe the credit facility provides adequate borrowing availability.
|
|
•
|
The majority of our workers’ compensation payments are made from restricted cash versus cash from operations.
|
|
•
|
On July 25, 2012, we filed a $100 million Shelf Registration Statement with the Securities and Exchange Commission that replaced our previous Shelf Registration which expired in July 2012. The Shelf Registration allows us to sell various securities in amounts and prices determined at the time of sale. The filing enables us to access capital efficiently and quickly if needed, however, we have no current plans to make an offering.
|
We believe that cash provided from operations and our capital resources will be adequate to meet our cash requirements over the next twelve months, and thereafter for the foreseeable future. However, should economic conditions again deteriorate, our financial results could be adversely impacted and we may need to seek additional sources of capital. These additional sources of financing may not be available, or may not be available on commercially reasonable terms.
Capital resources
We have a credit agreement with Bank of America, N.A. and Wells Fargo Capital Finance, LLC for a secured revolving credit facility of up to a maximum of $80 million (the “Revolving Credit Facility”). The Revolving Credit Facility expires in September 2016.
The maximum amount we can borrow under the Revolving Credit Facility is subject to certain borrowing limits. Specifically, we are limited to the sum of 85% of our eligible accounts receivable and the liquidation value of our Tacoma headquarters office building not to exceed $15 million, which is reduced quarterly by $0.4 million. As of
December 28, 2012
, the Tacoma headquarters office building liquidation value totaled
$13.5 million
. This borrowing limit is further reduced by the sum of a reserve in an amount equal to the payroll and payroll taxes for our temporary employees for one payroll cycle and other reserves if deemed applicable. As of
December 28, 2012
, the maximum $80 million was available and letters of credit in the amount of
$7.2 million
had been issued against the facility, leaving an unused portion of
$72.8 million
. The letters of credit collateralize a portion of our workers' compensation obligation.
The Revolving Credit Facility requires that we maintain liquidity in excess of $12 million or be subject to a fixed charge coverage ratio. Liquidity is defined as the amount we are entitled to borrow as advances under the Revolving Credit Facility plus the amount of cash and cash equivalents held in accounts subject to a control agreement benefiting the lenders. The amount we were entitled to borrow at
December 28, 2012
was
$72.8 million
and the amount of cash and cash equivalents under control agreements was
Page -
20
$128.3 million
for a total of
$201.1 million
of liquidity, which is well in excess of the minimum liquidity requirement. We are currently in compliance with all covenants related to the Revolving Credit Facility.
Under the terms of the Revolving Credit Facility, we pay a variable rate of interest on funds borrowed that is based on LIBOR or the Prime Rate, at our option, plus an applicable spread based on excess liquidity as set forth below:
|
Excess Liquidity
|
Prime Rate Loans
|
LIBOR Rate Loans
|
||
|
Greater than $40 million
|
0.50%
|
1.50%
|
||
|
Between $20 million and $40 million
|
0.75%
|
1.75%
|
||
|
Less than $20 million
|
1.00%
|
2.00%
|
||
A fee on borrowing availability of 0.25% is also applied against the unused portion of the Revolving Credit Facility. Letters of credit are priced at the margin in effect for LIBOR loans, plus a fronting fee of 0.125%.
Obligations under the Revolving Credit Facility are secured by substantially all of our domestic personal property and our headquarters located in Tacoma, Washington.
We have agreements with certain financial institutions that allow us to restrict cash and cash equivalents and investments for the purpose of providing collateral instruments to our insurance carriers to satisfy workers' compensation claims. At
December 28, 2012
, we had restricted cash and investments totaling approximately
$136.3 million
.
In 2011, we entered into an agreement with AIG, formerly known as Chartis, and the Bank of New York Mellon creating a trust ("Trust") which holds the majority of our collateral obligations under existing workers' compensation insurance policies previously held directly by AIG. We established investment policy directives for the Trust, with the first priority to be preservation of capital, second to maintain and ensure a high degree of liquidity, and third to maximize after-tax returns.
Trust investments must meet minimum acceptable quality standards. The primary investments include U.S. Treasury Securities, U.S. Agency Debentures, U.S. Agency Mortgages, Corporate Securities, and Municipal Securities. For those investments rated by the Nationally Recognized Statistical Rating Organizations the minimum ratings are:
|
S&P
|
Moody's
|
Fitch
|
||||
|
Short-term Rating
|
A-1/SP-1
|
P-1/MIG-1
|
F-1
|
|||
|
Long-term Rating
|
A
|
A2
|
A
|
|||
Workers’ compensation insurance, collateral and claims reserves
Workers' compensation insurance
We provide workers’ compensation insurance for our temporary and permanent employees. For policy years beginning in July 2003 and thereafter, AIG, formerly known as Chartis, has been our workers' compensation carrier. The policy year is effective July 1 to June 30 and is subject to annual renewal. We completed our renewal with AIG for the 2012 - 2013 policy year in June. For certain states we pay workers’ compensation insurance premiums and obtain full coverage under government-administered programs. The majority of our current workers’ compensation insurance policies cover claims for an event above a $2.0 million deductible limit, on a “per occurrence” basis. This results in our being substantially self-insured. While we have primary responsibility for all claims, our insurance coverage provides reimbursement for certain losses and expenses beyond our deductible limits ("Excess Claims”).
We have full liability for all remaining payments on claims that originated between January 2001 and June 2003, without recourse to any third party insurer as the result of a novation agreement we entered into with Kemper Insurance Company in December 2004. Prior to 2001, we were insured by various carriers who are now insolvent and as a result we are substantially reserved for any claims above the self-insurance limit.
Workers' compensation collateral
Our insurance carriers and certain state workers’ compensation programs require us to collateralize a portion of our workers’ compensation obligation, for which they become responsible should we become insolvent. The collateral typically takes the form of cash and cash-backed instruments, highly rated investment grade securities, letters of credit, and/or surety bonds. On a regular basis, these entities assess the amount of collateral they will require from us relative to our workers’ compensation obligation. Such amounts can increase or decrease independent of our assessments and reserves. We generally anticipate that our collateral
Page -
21
commitments will continue to grow as we grow our business. We pay our premiums and deposit our collateral in installments. AIG is the beneficiary of the Trust held at Bank of New York Mellon, which holds the majority of the restricted cash and investments collateralizing our self-insured workers' compensation policies.
Our total collateral commitments were made up of the following components (
in millions
):
|
2012
|
2011
|
||||||
|
Cash collateral held by insurance carriers
|
$
|
21.5
|
|
$
|
21.3
|
|
|
|
Cash and cash equivalents held in Trust (1)
|
14.8
|
|
19.2
|
|
|||
|
Investments held in Trust
|
91.2
|
|
78.0
|
|
|||
|
Letters of credit (2)
|
9.0
|
|
16.7
|
|
|||
|
Surety bonds (3)
|
16.2
|
|
16.2
|
|
|||
|
Total collateral commitments
|
$
|
152.7
|
|
$
|
151.4
|
|
|
____________________
|
(1)
|
Included in this amount is
$0.9 million
and
$0.8 million
of accrued interest at
December 28, 2012
and
December 30, 2011
, respectively.
|
|
(2)
|
We have agreements with certain financial institutions to issue letters of credit as collateral. We had
$1.8 million
and
$5.9 million
of restricted cash collateralizing our letters of credit at
December 28, 2012
and
December 30, 2011
, respectively.
|
|
(3)
|
Our surety bonds are issued by independent insurance companies on our behalf and bear annual fees based on a percentage of the bond, which is determined by each independent surety carrier, but do not exceed 2.0% of the bond amount, subject to a minimum charge. The terms of these bonds are subject to review and renewal every one to four years and most bonds can be canceled by the sureties with as little as 60 days notice.
|
Workers' compensation reserve
The following table provides a reconciliation of our collateral commitments to our workers’ compensation reserve as of the period end dates presented (
in millions
):
|
|
2012
|
2011
|
|||||
|
Total workers’ compensation reserve
|
$
|
195.6
|
|
$
|
191.8
|
|
|
|
Add back discount on reserves (1)
|
20.4
|
|
18.6
|
|
|||
|
Less excess claims reserve (2)
|
(26.9
|
)
|
(27.2
|
)
|
|||
|
Reimbursable payments to insurance provider (3)
|
6.4
|
|
2.9
|
|
|||
|
Less portion of workers' compensation not requiring collateral (4)
|
(42.8
|
)
|
(34.7
|
)
|
|||
|
Total collateral commitments
|
$
|
152.7
|
|
$
|
151.4
|
|
|
____________________
|
(1)
|
Our workers’ compensation reserves are discounted to their estimated net present value while our collateral commitments are based on the gross, undiscounted reserve.
|
|
(2)
|
Workers’ compensation reserve includes the estimated obligation for claims above our deductible limits. These are the responsibility of the insurance carriers against which there are no collateral requirements.
|
|
(3)
|
This amount is included in restricted cash and represents a timing difference between claim payments made by our insurance carrier and the reimbursement from cash held in the Trust. When claims are paid by our carrier, the amount is removed from the workers' compensation reserve but not removed from collateral until reimbursed to the carrier.
|
|
(4)
|
Represents deductible and self-insured reserves where collateral is not required.
|
Our workers’ compensation reserve is established using estimates of the future cost of claims and related expenses, which are discounted to their estimated net present value. The discounted workers’ compensation claims reserve was
$195.6 million
at
December 28, 2012
.
Our workers' compensation reserve for self-insured claims is established using estimates of the future cost of claims and related expenses that have been reported but not settled, as well as those that have been incurred but not reported. Reserves are estimated for claims incurred in the current year, as well as claims incurred during prior years. Management evaluates the adequacy of the workers’ compensation reserves in conjunction with an independent quarterly actuarial assessment. Factors considered in establishing and adjusting these reserves include, among other things:
|
•
|
Changes in medical and time loss (“indemnity”) costs;
|
|
•
|
Mix changes between medical only and indemnity claims;
|
|
•
|
Regulatory and legislative developments that have increased benefits and settlement requirements;
|
Page -
22
|
•
|
Type and location of work performed;
|
|
•
|
The impact of safety initiatives; and,
|
|
•
|
Positive or adverse development of claim reserves.
|
Our workers’ compensation claims reserves are discounted to their estimated net present value using discount rates based on returns of “risk-free” U.S. Treasury instruments with maturities comparable to the weighted average lives of our workers’ compensation claims.
Our workers’ compensation reserves include estimated expenses related to claims above our deductible limits (“excess claims”), and a corresponding receivable for the insurance coverage on excess claims based on the contractual policy agreements we have with insurance carriers. We discount this reserve and corresponding receivable to its estimated net present value using the discount rates based on average returns of “risk-free” U.S. Treasury instruments available during the year in which the liability was incurred. The discounted workers’ compensation reserve for excess claims and the corresponding receivable for the insurance on excess claims was
$27.1 million
as of
December 28, 2012
.
The following table provides an analysis of changes in our workers’ compensation claims reserves (
in millions
):
|
2012
|
2011
|
2010
|
|||||||||
|
Beginning balance
|
$
|
191.8
|
|
$
|
187.3
|
|
$
|
189.5
|
|
||
|
Self-insurance reserve expenses related to current year, net (1)
|
55.7
|
|
52.4
|
|
49.4
|
|
|||||
|
Payments related to current year claims (2)
|
(11.3
|
)
|
(11.2
|
)
|
(11.9
|
)
|
|||||
|
Payments related to claims from prior years (2)
|
(26.9
|
)
|
(29.3
|
)
|
(27.4
|
)
|
|||||
|
Changes to prior years’ self-insurance reserve, net (3)
|
(13.7
|
)
|
(16.9
|
)
|
(17.1
|
)
|
|||||
|
Amortization of prior years’ discount (4)
|
0.2
|
|
7.9
|
|
4.6
|
|
|||||
|
Net change in excess claims reserve (5)
|
(0.2
|
)
|
1.6
|
|
0.2
|
|
|||||
|
Ending balance
|
195.6
|
|
191.8
|
|
187.3
|
|
|||||
|
Less current portion
|
44.7
|
|
43.5
|
|
42.4
|
|
|||||
|
Long-term portion
|
$
|
150.9
|
|
$
|
148.3
|
|
$
|
144.9
|
|
||
___________________
|
(1)
|
Our self-insurance reserves are discounted to their estimated net present value using discount rates based on returns of “risk-free” U.S. Treasury instruments with maturities comparable to the weighted average lives of our workers’ compensation claims. At
December 28, 2012
, the weighted average rate was
2.4%
.
|
|
(2)
|
Payments made against self-insured claims are made over a weighted average period of approximately
5.5
years.
|
|
(3)
|
Changes in reserve estimates are reflected in the statement of operations in the period when the changes in estimates are made.
|
|
(4)
|
Amortization of discount over the estimated weighted average life. In addition, any changes to the estimated weighted average lives and corresponding discount rates for actual payments made are reflected in the statement of operations in the period when the changes in estimates are made.
|
|
(5)
|
Changes to the workers' compensation reserve for claims above our self-insured limits (“excess claims”) net of discount to its estimated net present value using the risk-free rates associated with the actuarially determined weighted average lives of our excess claims. At
December 28, 2012
, the weighted average rate was
4.4%
. The excess claim payments are made and the corresponding reimbursements from our insurance carriers are received over a weighted average period of approximately
19.7
years. Two of the workers’ compensation insurance companies with which we formerly did business are in liquidation and have failed to pay a number of excess claims to date. We have recorded a valuation allowance against all of the insurance receivables from the insurance companies in liquidation.
|
CONTRACTUAL OBLIGATIONS AND COMMITMENTS
We have various contractual obligations that are recorded as liabilities in our consolidated financial statements. Certain contractual obligations, such as operating leases, are not recognized as liabilities in our consolidated financial statements, but are required to be disclosed. There were no material changes outside the ordinary course of business in our contractual obligations during
2012
.
Page -
23
The following table provides a summary of our contractual obligations as of the end of fiscal
2012
. We expect to fund these commitments with existing cash and cash equivalents, and cash flows from operations.
|
|
Payments Due by Period (in millions)
|
||||||||||||||||||
|
Contractual Obligations
|
Total
|
2013
|
2014
through 2015 |
2016
through 2017 |
2018
and later |
||||||||||||||
|
Operating leases (1)
|
$
|
17.8
|
|
$
|
6.6
|
|
$
|
8.0
|
|
$
|
3.0
|
|
$
|
0.2
|
|
||||
|
Capital leases
|
0.1
|
|
0.1
|
|
—
|
|
—
|
|
—
|
|
|||||||||
|
Purchase obligations (2)
|
7.5
|
|
6.9
|
|
0.6
|
|
—
|
|
—
|
|
|||||||||
|
Other obligations (3)
|
8.3
|
|
6.4
|
|
—
|
|
—
|
|
1.9
|
|
|||||||||
|
Total contractual cash obligations
|
$
|
33.7
|
|
$
|
20.0
|
|
$
|
8.6
|
|
$
|
3.0
|
|
$
|
2.1
|
|
||||
____________________
|
(1)
|
Excludes all payments related to branch leases cancelable within 90 days
|
|
(2)
|
Purchase obligations include agreements to purchase goods and services that are enforceable, legally binding and specify all significant terms. Purchase obligations do not include agreements that are cancelable without significant penalty.
|
|
(3)
|
Includes
$1.9 million
for liability for unrecognized tax benefits and $6.4 million for future payments related to acquisition.
|
SUMMARY OF CRITICAL ACCOUNTING ESTIMATES
Management’s Discussion and Analysis of Financial Condition and Results of Operations discusses our consolidated financial statements, which have been prepared in accordance with accounting principles generally accepted in the United States of America (“U.S. GAAP”). The preparation of these financial statements requires management to make estimates and assumptions that affect the reported amounts of assets and liabilities and the disclosure of contingent assets and liabilities at the date of the consolidated financial statements and the reported amounts of revenue and expenses during the reporting period. On an on-going basis, management evaluates its estimates and judgments. Management bases its estimates and judgments on historical experience and on various other factors that are believed to be reasonable under the circumstances, the results of which form the basis for making judgments about the carrying value of assets and liabilities that are not readily apparent from other sources. Actual results may differ from these estimates under different assumptions or conditions.
Management believes that the following accounting estimates are the most critical to aid in fully understanding and evaluating our reported financial results, and they require management’s most difficult, subjective or complex judgments, resulting from the need to make estimates about the effect of matters that are inherently uncertain.
Workers’ compensation reserves
We maintain reserves for workers’ compensation claims, including the excess claims portion above our deductible, using actuarial estimates of the future cost of claims and related expenses. These estimates include claims that have been reported but not settled and claims that have been incurred but not reported. These reserves, which reflect potential liabilities to be paid in future periods based on estimated payment patterns, are discounted to estimated net present value using discount rates based on average returns on “risk-free” U.S. Treasury instruments, which are evaluated on a quarterly basis. We evaluate the reserves regularly throughout the year and make adjustments accordingly. If the actual cost of such claims and related expenses exceed the amounts estimated, additional reserves may be required. Changes in reserve estimates are reflected in the statement of operations in the period when the changes in estimates are made.
Our workers’ compensation reserves include estimated expenses related to claims above our self-insured limits (“excess claims”) and a corresponding receivable for the insurance coverage on excess claims based on the contractual policy agreements we have with insurance companies. We discount the reserve and its corresponding receivable to its respective estimated net present value using the risk-free rates associated with the actuarially determined weighted average lives of our excess claims. When appropriate, based on our best estimate, we record a valuation allowance against the insurance receivable to reflect amounts that may not be realized.
There are two main factors that impact workers’ compensation expense: the number of claims and the cost per claim. The number of claims is driven by the volume of hours worked, the business mix which reflects the type of work performed, and the safety of the environment where the work is performed. The cost per claim is driven primarily by the severity of the injury, the state in which the injury occurs, related medical costs, and lost-time wage costs. A 10% increase in the cost of claims incurred would result in an increase to workers' compensation expense of $5.5 million.We have not had significant changes in the assumptions used in calculating our reserve balance. However, our reserve balances have been positively impacted primarily by the success of our
Page -
24
accident prevention programs. In the event that we are not able to further reduce our accident rates, the positive impacts to our reserve balance will diminish.
Stock-based compensation
Under various plans, officers, employees and non-employee directors have received or may receive grants of stock, restricted stock awards, performance share units or options to purchase common stock. We also have an employee stock purchase plan (“ESPP”).
Compensation expense for restricted stock and stock units is generally recognized on a straight-line basis over the vesting period, based on the stock’s fair market value on the grant date. For restricted stock grants issued with performance conditions, compensation expense is recognized over each vesting tranche. We recognize compensation expense for only the portion of restricted stock and stock units that is expected to vest, rather than record forfeitures when they occur. If the actual number of forfeitures differs from those estimated by management, additional adjustments to compensation expense may be required in the future periods. We determine the fair value of options to purchase common stock using the Black-Scholes valuation model, which requires the input of subjective assumptions. We recognize expense over the service period for options that are expected to vest and record adjustments to compensation expense at the end of the service period if actual forfeitures differ from original estimates. Based on an analysis using changes in certain assumptions that could be reasonably possible in the near term, management believes the effect on the expense recognized for fiscal
2012
would not have been material.
Allowance for doubtful accounts
We establish an allowance for doubtful accounts for estimated losses resulting from the failure of our customers to make required payments. The allowance for doubtful accounts is determined based on historical write-off experience, expectations of future write-offs and current economic data and represents our best estimate of the amount of probable credit losses. The allowance for doubtful accounts is reviewed quarterly and past due balances are written-off when it is probable the receivable will not be collected. If the financial condition of our customers were to deteriorate, resulting in an impairment of their ability to make payments, additional allowances may be required.
Goodwill and intangible assets
Goodwill is the excess of the purchase price over the fair value of identifiable net assets acquired in business combinations. We allocated goodwill to reporting units based on the reporting units that are expected to benefit from the business combination. We do not amortize goodwill but test it for impairment annually as of the last day of our fiscal third quarter, or when indications of potential impairment exist. We monitor the existence of potential impairment indicators throughout the fiscal year.
We test for goodwill impairment at the reporting unit level. We consider our brands Labor Ready, Spartan Staffing, CLP Resources, PlaneTechs and Centerline to be reporting units for goodwill impairment testing. In fiscal
2012
,
2011
and
2010
, there were no changes to our reporting units. The impairment test involves comparing the fair value of each reporting unit to its carrying value, including goodwill. Fair value reflects the price a market participant would be willing to pay in a potential sale of the reporting unit. If the fair value exceeds carrying value, then we conclude that no goodwill impairment has occurred. If the carrying value of the reporting unit exceeds its fair value, a second step is required to measure possible goodwill impairment loss. The second step includes hypothetically valuing the tangible and intangible assets and liabilities of the reporting unit as if the reporting unit had been acquired in a business combination. Then, the implied fair value of the reporting unit’s goodwill is compared to the carrying value of that goodwill. If the carrying value of the reporting unit’s goodwill exceeds the implied fair value of the goodwill, we recognize an impairment loss in an amount equal to the excess, not to exceed the carrying value. We determine the fair value of each reporting unit primarily using a discounted cash flow model. Based on our test, the fair market value of our reporting units was substantially greater than net carrying value.
Considerable management judgment is necessary to evaluate the impact of operating and macroeconomic changes on each reporting unit. Critical assumptions include projected revenue growth, gross profit rates, selling, general and administrative expense rates, working capital fluctuations, capital expenditures and terminal growth rates, as well as an appropriate risk adjusted discount rate. Discount rates are determined using the capital asset pricing model.
The blue-collar staffing market is subject to volatility based on overall economic conditions. As a consequence, our revenues tend to increase quickly when the economy begins to grow, as occurred during 2011. Conversely, our revenues also decrease quickly when the economy begins to weaken, as occurred during the most recent recession. If actual results were to significantly deviate from management's estimates and assumptions of future performance, we could experience a material impairment to our goodwill.
We also use comparable market earnings multiple data and our company’s market capitalization to corroborate our reporting unit valuations. We base fair value estimates on assumptions we believe to be reasonable but that are unpredictable and inherently uncertain. Actual future results may differ from those estimates.
Page -
25
We have indefinite-lived intangible assets related to our CLP Resources and Spartan Staffing trade names. We test our trade names annually for impairment, or when indications of potential impairment exist. We utilize the relief from royalty method to determine the fair value of each of our trade names. If the carrying value exceeds the fair value, we recognize an impairment loss in an amount equal to the excess. Considerable management judgment is necessary to determine key assumptions, including projected revenue, royalty rates and appropriate discount rates.
An impairment assessment of physical assets is necessary whenever events or circumstances indicate that the carrying value of the assets may not be recoverable. In such cases, the asset must be written down to the greater of the net realizable value or fair market value.
Reserves for contingent legal and regulatory liabilities
From time to time we are subject to compliance audits by federal, state, and local authorities relating to a variety of regulations including wage and hour laws, taxes, workers’ compensation, immigration, and safety. From time to time we are also subject to legal proceedings in the ordinary course of our operations. We have established reserves for contingent legal and regulatory liabilities. We record a liability when our management judges that it is probable that a legal claim will result in an adverse outcome and the amount of liability can be reasonably estimated. To the extent that an insurance company is contractually obligated to reimburse us for a liability, we record a receivable for the amount of the probable reimbursement. We evaluate our reserve regularly throughout the year and make adjustments as needed. If the actual outcome of these matters is different than expected, an adjustment is charged or credited to expense in the period the outcome occurs or the period in which the estimate changes.
Income taxes and related valuation allowances
We account for income taxes by recording taxes payable or refundable for the current year and deferred tax assets and liabilities for the future tax consequences of events that have been recognized in our financial statements or tax returns. We measure these expected future tax consequences based upon the provisions of tax law as currently enacted; the effects of future changes in tax laws are not anticipated. Future tax law changes, such as changes to federal and state corporate tax rates and the mix of states and their taxable income, could have a material impact on our financial condition or results of operations. When appropriate, we record a valuation allowance against deferred tax assets to offset future tax benefits that may not be realized. In determining whether a valuation allowance is appropriate, we consider whether it is more likely than not that all or some portion of our deferred tax assets will not be realized, based in part upon management’s judgments regarding future events and past operating results.
NEW ACCOUNTING STANDARDS
See Note 1 to the consolidated financial statements included in Item 8 of this Annual Report on Form 10-K.
|
Item 7A.
|
QUANTITATIVE AND QUALITATIVE DISCLOSURES ABOUT MARKET RISK
|
We are exposed to market risk related to changes in interest rates and foreign currency exchange rates, each of which could adversely affect the value of our investments. We do not currently use derivative financial instruments.
In 2011, we entered into an agreement with AIG, formerly known as Chartis, and the Bank of New York Mellon creating a trust which holds the majority of our collateral obligations under existing workers' compensation insurance policies previously held by AIG. The Trust now holds a significant portion of our total Restricted cash and investments, much of which is invested in high quality debt instruments. As a result of the shift in our restricted cash and investments portfolio, we are exposed to risk from interest rates and credit exposure. We mitigate these risks through investment policy directives for the Trust, with the first priority to be the preservation of capital, and second to maintain and ensure a high degree of liquidity. The investments are broadly diversified among high quality investments in U.S. Treasury Securities, U.S. Agency Debentures, U.S. Agency Mortgages, Corporate Securities, and Municipal Securities. The individual investments within the Trust are subject to credit risk due to possible rating changes, default or impairment. We monitor the portfolio to ensure this risk does not exceed prudent levels. We consistently apply and adhere to our investment policy of holding high quality, diversified securities.
We have the positive intent and ability to hold all investments until maturity and accordingly all our investments are classified as held-to-maturity. Any fluctuation or change in interest rates would not impact our net income. Furthermore, an increase or decrease in interest rates immediately and uniformly by 10% would not have a material effect on our restricted cash and investments or cash and cash equivalents balances.
We have a certain amount of assets and liabilities denominated in certain foreign currencies related to our international operations. We have not hedged our foreign currency translation risk and we have the ability to hold our foreign-currency
Page -
26
denominated assets indefinitely and do not expect that a sudden or significant change in foreign exchange rates will have a material impact on future operating results or cash flows.
Page -
27
|
Item 8.
|
FINANCIAL STATEMENTS AND SUPPLEMENTARY DATA
|
The following consolidated financial statements of the Company and its subsidiaries are included herein as indicated below:
Report of Independent Registered Public Accounting Firm
Consolidated Financial Statements
|
Consolidated Balance Sheets - December 28, 2012 and December 30, 2011
|
|
Consolidated Statements of Operations & Comprehensive Income - Fiscal years ended December 28, 2012, December 30, 2011 and December 31, 2010
|
|
Consolidated Statements of Shareholders’ Equity - Fiscal years ended December 28, 2012, December 30, 2011 and December 31, 2010
|
|
Consolidated Statements of Cash Flows - Fiscal years ended December 28, 2012, December 30, 2011 and December 31, 2010
|
|
Notes to Consolidated Financial Statements
|
Selected Quarterly Financial Data (unaudited)
Page -
28
REPORT OF INDEPENDENT REGISTERED PUBLIC ACCOUNTING FIRM
To the Board of Directors and Shareholders of TrueBlue, Inc.
Tacoma, Washington
We have audited the accompanying consolidated balance sheets of TrueBlue, Inc. and subsidiaries (the “Company”) as of December 28, 2012 and December 30, 2011, and the related consolidated statements of operations and comprehensive income, shareholders' equity, and cash flows for each of the three years in the period ended December 28, 2012. Our audits also included the financial statement schedules listed in the index at Item 15(a)(2). These financial statements and financial statement schedules are the responsibility of the Company's management. Our responsibility is to express an opinion on these financial statements and financial statement schedules based on our audits.
We conducted our audits in accordance with the standards of the Public Company Accounting Oversight Board (United States). Those standards require that we plan and perform the audit to obtain reasonable assurance about whether the financial statements are free of material misstatement. An audit includes examining, on a test basis, evidence supporting the amounts and disclosures in the financial statements. An audit also includes assessing the accounting principles used and significant estimates made by management, as well as evaluating the overall financial statement presentation. We believe that our audits provide a reasonable basis for our opinion.
In our opinion, such consolidated financial statements present fairly, in all material respects, the financial position of TrueBlue, Inc. and subsidiaries as of December 28, 2012 and December 30, 2011, and the results of their operations and their cash flows for each of the three years in the period ended December 28, 2012, in conformity with accounting principles generally accepted in the United States of America. Also, in our opinion, such financial statement schedules, when considered in relation to the basic consolidated financial statements taken as a whole, presents fairly, in all material respects, the information set forth therein.
We have also audited, in accordance with the standards of the Public Company Accounting Oversight Board (United States), the Company's internal control over financial reporting as of December 28, 2012, based on the criteria established in
Internal Control
-
Integrated Framework
issued by the Committee of Sponsoring Organizations of the Treadway Commission and our report dated February 21, 2013 expressed an unqualified opinion on the Company's internal control over financial reporting.
/s/ Deloitte & Touche LLP
Seattle, Washington
February 21, 2013
Page -
29
TRUEBLUE, INC.
In Thousands (Except Par Values)
|
|
December 28,
2012 |
December 30,
2011 |
|||||
|
ASSETS
|
|||||||
|
Current assets:
|
|||||||
|
Cash and cash equivalents
|
$
|
129,513
|
|
$
|
109,311
|
|
|
|
Accounts receivable, net of allowance for doubtful accounts
|
167,292
|
|
153,878
|
|
|||
|
Prepaid expenses, deposits and other current assets
|
8,541
|
|
9,252
|
|
|||
|
Income tax receivable
|
6,373
|
|
1,874
|
|
|||
|
Deferred income taxes
|
5,447
|
|
6,300
|
|
|||
|
Total current assets
|
317,166
|
|
280,615
|
|
|||
|
Property and equipment, net
|
58,171
|
|
56,239
|
|
|||
|
Restricted cash and investments
|
136,259
|
|
130,498
|
|
|||
|
Deferred income taxes
|
2,562
|
|
4,818
|
|
|||
|
Goodwill
|
48,079
|
|
48,139
|
|
|||
|
Intangible assets, net
|
16,554
|
|
19,433
|
|
|||
|
Other assets, net
|
22,952
|
|
21,027
|
|
|||
|
Total assets
|
$
|
601,743
|
|
$
|
560,769
|
|
|
|
LIABILITIES AND SHAREHOLDERS’ EQUITY
|
|||||||
|
Current liabilities:
|
|||||||
|
Accounts payable and other accrued expenses
|
$
|
27,292
|
|
$
|
25,862
|
|
|
|
Accrued wages and benefits
|
35,102
|
|
35,271
|
|
|||
|
Current portion of workers' compensation claims reserve
|
44,652
|
|
43,554
|
|
|||
|
Other current liabilities
|
6,510
|
|
7,602
|
|
|||
|
Total current liabilities
|
113,556
|
|
112,289
|
|
|||
|
Workers’ compensation claims reserve, less current portion
|
150,937
|
|
148,289
|
|
|||
|
Other long-term liabilities
|
3,576
|
|
6,612
|
|
|||
|
Total liabilities
|
268,069
|
|
267,190
|
|
|||
|
Commitments and contingencies (Note 7)
|
|
|
|||||
|
Shareholders’ equity:
|
|||||||
|
Preferred stock, $0.131 par value, 20,000 shares authorized; No shares issued and outstanding
|
—
|
|
—
|
|
|||
|
Common stock, no par value, 100,000 shares authorized; 40,220 and 39,933 shares issued and outstanding
|
1
|
|
1
|
|
|||
|
Accumulated other comprehensive income
|
2,818
|
|
2,643
|
|
|||
|
Retained earnings
|
330,855
|
|
290,935
|
|
|||
|
Total shareholders’ equity
|
333,674
|
|
293,579
|
|
|||
|
Total liabilities and shareholders’ equity
|
$
|
601,743
|
|
$
|
560,769
|
|
|
See accompanying notes to consolidated financial statements
Page -
30
TRUEBLUE, INC.
FISCAL YEARS ENDED DECEMBER 28, 2012, DECEMBER 30, 2011 AND DECEMBER 31, 2010
In Thousands (Except Per Share Data)
|
|
2012
|
2011
|
2010
|
||||||||
|
Revenue from services
|
$
|
1,389,530
|
|
$
|
1,316,013
|
|
$
|
1,149,367
|
|
||
|
Cost of services
|
1,017,145
|
|
968,967
|
|
845,916
|
|
|||||
|
Gross profit
|
372,385
|
|
347,046
|
|
303,451
|
|
|||||
|
Selling, general and administrative expenses
|
300,459
|
|
282,828
|
|
258,722
|
|
|||||
|
Depreciation and amortization
|
18,890
|
|
16,384
|
|
16,468
|
|
|||||
|
Income from operations
|
53,036
|
|
47,834
|
|
28,261
|
|
|||||
|
Interest expense
|
(1,131
|
)
|
(1,207
|
)
|
(1,515
|
)
|
|||||
|
Interest and other income
|
2,700
|
|
2,697
|
|
2,416
|
|
|||||
|
Interest and other income, net
|
1,569
|
|
1,490
|
|
901
|
|
|||||
|
Income before tax expense
|
54,605
|
|
49,324
|
|
29,162
|
|
|||||
|
Income tax expense
|
20,976
|
|
18,533
|
|
9,323
|
|
|||||
|
Net income
|
$
|
33,629
|
|
$
|
30,791
|
|
$
|
19,839
|
|
||
|
Net income per common share:
|
|||||||||||
|
Basic
|
$
|
0.85
|
|
$
|
0.73
|
|
$
|
0.46
|
|
||
|
Diluted
|
$
|
0.84
|
|
$
|
0.73
|
|
$
|
0.46
|
|
||
|
Weighted average shares outstanding:
|
|||||||||||
|
Basic
|
39,548
|
|
41,961
|
|
43,224
|
|
|||||
|
Diluted
|
39,862
|
|
42,322
|
|
43,540
|
|
|||||
|
Total other comprehensive income, net of tax:
|
|||||||||||
|
Foreign currency translation
|
$
|
175
|
|
$
|
(263
|
)
|
$
|
631
|
|
||
|
Comprehensive income
|
$
|
33,804
|
|
$
|
30,528
|
|
$
|
20,470
|
|
||
See accompanying notes to consolidated financial statements
Page -
31
TRUEBLUE, INC.
CONSOLIDATED STATEMENTS OF SHAREHOLDERS' EQUITY
FISCAL YEARS ENDED DECEMBER 28, 2012, DECEMBER 30, 2011 AND DECEMBER 31, 2010
In Thousands
|
|
Common stock
|
Retained earnings
|
Accumulated other comprehensive income
|
Total shareholders' equity
|
||||||||||||||
|
|
Shares
|
Amount
|
|
|
|
|||||||||||||
|
Balances, December 25, 2009
|
43,833
|
|
$
|
1
|
|
$
|
283,156
|
|
$
|
2,275
|
|
$
|
285,432
|
|
||||
|
Net income
|
19,839
|
|
19,839
|
|
||||||||||||||
|
Foreign currency translation, net of tax
|
631
|
|
631
|
|
||||||||||||||
|
Issuances under equity plans, including tax benefits
|
253
|
|
(354
|
)
|
(354
|
)
|
||||||||||||
|
Stock-based compensation
|
7,159
|
|
7,159
|
|
||||||||||||||
|
Balances, December 31, 2010
|
44,086
|
|
$
|
1
|
|
$
|
309,800
|
|
$
|
2,906
|
|
$
|
312,707
|
|
||||
|
Net income
|
30,791
|
|
30,791
|
|
||||||||||||||
|
Foreign currency translation, net of tax
|
(263
|
)
|
(263
|
)
|
||||||||||||||
|
Purchases and retirement of common stock
|
(4,455
|
)
|
(56,932
|
)
|
(56,932
|
)
|
||||||||||||
|
Issuances under equity plans, including tax benefits
|
302
|
|
(156
|
)
|
(156
|
)
|
||||||||||||
|
Stock-based compensation
|
7,432
|
|
7,432
|
|
||||||||||||||
|
Balances, December 30, 2011
|
39,933
|
|
$
|
1
|
|
$
|
290,935
|
|
$
|
2,643
|
|
$
|
293,579
|
|
||||
|
Net income
|
33,629
|
|
33,629
|
|
||||||||||||||
|
Foreign currency translation, net of tax
|
175
|
|
175
|
|
||||||||||||||
|
Purchases and retirement of common stock
|
(306
|
)
|
(4,386
|
)
|
(4,386
|
)
|
||||||||||||
|
Issuances under equity plans, including tax benefits
|
593
|
|
2,760
|
|
2,760
|
|
||||||||||||
|
Stock-based compensation
|
7,917
|
|
7,917
|
|
||||||||||||||
|
Balances, December 28, 2012
|
40,220
|
|
$
|
1
|
|
$
|
330,855
|
|
$
|
2,818
|
|
$
|
333,674
|
|
||||
See accompanying notes to consolidated financial statements
Page -
32
TRUEBLUE, INC.
FISCAL YEARS ENDED DECEMBER 28, 2012, DECEMBER 30, 2011 AND DECEMBER 31, 2010
In Thousands
|
|
2012
|
2011
|
2010
|
||||||||
|
Cash flows from operating activities:
|
|||||||||||
|
Net income
|
$
|
33,629
|
|
$
|
30,791
|
|
$
|
19,839
|
|
||
|
Adjustments to reconcile net income to net cash from operating activities:
|
|||||||||||
|
Depreciation and amortization
|
18,890
|
|
16,384
|
|
16,468
|
|
|||||
|
Provision for doubtful accounts
|
6,994
|
|
6,638
|
|
8,158
|
|
|||||
|
Stock-based compensation
|
7,917
|
|
7,432
|
|
7,159
|
|
|||||
|
Deferred income taxes
|
3,091
|
|
(1,910
|
)
|
5,322
|
|
|||||
|
Other operating activities
|
1,946
|
|
(473
|
)
|
(202
|
)
|
|||||
|
Changes in operating assets and liabilities:
|
|||||||||||
|
Accounts receivable
|
(20,408
|
)
|
(51,824
|
)
|
(11,604
|
)
|
|||||
|
Income taxes
|
(3,748
|
)
|
3,513
|
|
(3,338
|
)
|
|||||
|
Other assets
|
(1,214
|
)
|
(1,244
|
)
|
(727
|
)
|
|||||
|
Accounts payable and other accrued expenses
|
1,524
|
|
5,423
|
|
747
|
|
|||||
|
Accrued wages and benefits
|
(182
|
)
|
10,793
|
|
2,752
|
|
|||||
|
Workers’ compensation claims reserve
|
3,746
|
|
4,537
|
|
(2,195
|
)
|
|||||
|
Other liabilities
|
138
|
|
529
|
|
(406
|
)
|
|||||
|
Net cash provided by operating activities
|
52,323
|
|
30,589
|
|
41,973
|
|
|||||
|
Cash flows from investing activities:
|
|||||||||||
|
Capital expenditures
|
(17,826
|
)
|
(9,707
|
)
|
(7,050
|
)
|
|||||
|
Change in restricted cash and cash equivalents
|
7,587
|
|
68,504
|
|
3,945
|
|
|||||
|
Purchases of restricted investments
|
(33,778
|
)
|
(88,173
|
)
|
—
|
|
|||||
|
Maturities of restricted investments
|
18,116
|
|
9,238
|
|
—
|
|
|||||
|
Other
|
(250
|
)
|
(6,800
|
)
|
(298
|
)
|
|||||
|
Net cash used in investing activities
|
(26,151
|
)
|
(26,938
|
)
|
(3,403
|
)
|
|||||
|
Cash flows from financing activities:
|
|||||||||||
|
Purchases and retirement of common stock
|
(4,386
|
)
|
(56,932
|
)
|
—
|
|
|||||
|
Net proceeds from stock option exercises and employee stock purchase plans
|
4,164
|
|
1,131
|
|
1,054
|
|
|||||
|
Common stock repurchases for taxes upon vesting of restricted stock
|
(2,154
|
)
|
(1,776
|
)
|
(1,568
|
)
|
|||||
|
Payments on other liabilities
|
(4,548
|
)
|
(302
|
)
|
(382
|
)
|
|||||
|
Other
|
751
|
|
664
|
|
129
|
|
|||||
|
Net cash used in financing activities
|
(6,173
|
)
|
(57,215
|
)
|
(767
|
)
|
|||||
|
Effect of exchange rates on cash
|
203
|
|
(278
|
)
|
973
|
|
|||||
|
Net change in cash and cash equivalents
|
20,202
|
|
(53,842
|
)
|
38,776
|
|
|||||
|
CASH AND CASH EQUIVALENTS, beginning of period
|
109,311
|
|
163,153
|
|
124,377
|
|
|||||
|
CASH AND CASH EQUIVALENTS, end of period
|
$
|
129,513
|
|
$
|
109,311
|
|
$
|
163,153
|
|
||
See accompanying notes to consolidated financial statements
Page -
33
Notes to Consolidated Financial Statements
|
NOTE 1:
|
SUMMARY OF SIGNIFICANT ACCOUNTING POLICIES
|
Description of business
TrueBlue, Inc. (“TrueBlue,” “we,” “us,” “our”) is the leader in temporary blue-collar staffing services. We provide a wide range of specialized blue-collar staffing services. We operate as: Labor Ready for general labor, Spartan Staffing for light industrial services, CLP Resources for skilled trades, PlaneTechs for aviation and diesel mechanics and technicians, and Centerline Drivers for dedicated and temporary drivers. We have a network of
691
branches in all
50
states, Puerto Rico and Canada, customer on-site locations generally dedicated to one customer, and national service centers which supply our customers with temporary workers.
We began operations in 1989 under the name Labor Ready, Inc. providing on-demand, general labor staffing services. We became a public company in 1995. In 2004 we began acquiring additional brands to expand our service offerings to customers in the blue-collar staffing market. Effective December 18, 2007, Labor Ready, Inc. changed its name to TrueBlue, Inc. We are headquartered in Tacoma, Washington.
Basis of presentation
The consolidated financial statements include the accounts of TrueBlue, Inc. and all of its wholly-owned subsidiaries. All significant intercompany balances and transactions have been eliminated in consolidation. The consolidated financial statements and accompanying notes are prepared in accordance with accounting principles generally accepted in the United States of America (“U.S. GAAP”).
TrueBlue operations are
one
reportable segment. Our operations are all in the blue-collar staffing market of the temporary staffing industry and focus on supplying customers with temporary workers. All our brands have the following similar characteristics:
|
•
|
They provide blue-collar temporary labor services;
|
|
•
|
They serve customers who have a need for temporary staff to perform tasks which do not require a permanent employee;
|
|
•
|
They each build a temporary workforce through recruiting, screening and hiring. Temporary workers are dispatched to customers where they work under the supervision of our customers;
|
|
•
|
They each drive profitability by managing the bill rates to our customers and the pay rates to our workers. Profitable growth is also driven by leveraging our cost structure across all brands.
|
Our long-term financial performance expectations of all our brands are similar as are the underlying financial and economic metrics used to manage those brands.
Our international operations are not significant to our total operations for segment reporting purposes. Total revenues from our international operations were
3.5%
,
3.8%
and
3.8%
of our total revenue for fiscal years ended
2012
,
2011
and
2010
, respectively.
Fiscal year end
Our fiscal year ends on the last Friday of December. Fiscal 2010 included
53
weeks; the final quarter consisted of
14
weeks.
Use of estimates
Preparing financial statements in conformity with U.S. GAAP requires management to make estimates and assumptions that affect the reported amounts of assets, liabilities, revenues and expenses. Examples include, but are not limited to, allowance for doubtful accounts, estimates for asset and goodwill impairments, stock-based performance awards, assumptions underlying self-insurance reserves, and the potential outcome of future tax consequences of events that have been recognized in the financial statements. Actual results and outcomes may differ from these estimates and assumptions.
Revenue recognition
Revenue from temporary staffing services is recognized at the time the service is provided and is net of adjustments related to customer credits. Revenue also includes cash dispensing machine fees, billable travel, and other reimbursable costs. Customer discounts or other incentives are recognized in the period the related revenue is earned. We discontinued the use of all domestic cash dispensing machines in fiscal 2012. Revenues are reported net of sales, use or other transaction taxes collected from customers and remitted to taxing authorities.
Page -
34
Notes to Consolidated Financial Statements—(Continued)
We record revenue on a gross basis as a principal versus on a net basis as an agent in the consolidated statement of operations. We have determined that gross reporting as a principal is the appropriate treatment based upon the following key factors:
|
•
|
We maintain the direct contractual relationship with the customer.
|
|
•
|
We have discretion in selecting and assigning the temporary workers to particular jobs and establishing their billing rate.
|
|
•
|
We bear the risk and rewards of the transaction including credit risk if the customer fails to pay for services performed.
|
Cost of services
Cost of services primarily includes wages of temporary workers and related payroll taxes and workers’ compensation expenses. Cost of services also includes billable travel and other reimbursable costs.
Advertising costs
Advertising costs consist primarily of print and other promotional activities. We expense advertisements as of the first date the advertisements take place. Advertising expenses included in selling, general and administrative expenses were
$3.7 million
,
$3.6 million
and
$3.3 million
in
2012
,
2011
and
2010
, respectively.
Cash and cash equivalents
We consider all highly liquid instruments purchased with an original maturity of three months or less at date of purchase to be cash equivalents.
Accounts receivable and allowance for doubtful accounts
Accounts receivable are recorded at the invoiced amount together with interest for certain past due accounts. We establish an allowance for doubtful accounts for estimated losses resulting from the failure of our customers to make required payments. The allowance for doubtful accounts is determined based on current collection efforts, historical collection trends, write-off experience, customer credit risk, and current economic data. The allowance for doubtful accounts is reviewed quarterly and represents our best estimate of the amount of probable credit losses. Past due balances are written-off when it is probable the receivable will not be collected. Our allowance for doubtful accounts was
$5.0 million
and
$5.8 million
as of
December 28, 2012
and
December 30, 2011
, respectively.
Restricted cash and investments
Cash and investments pledged as collateral and restricted to use for workers' compensation insurance programs are included as restricted cash and investments in our Consolidated Balance Sheets. Our investments consist of highly rated investment grade debt securities which are rated A or higher by Nationally Recognized Statistical Rating Organizations. We have the positive intent and ability to hold all these investments until maturity and accordingly all of our investments are classified as held-to-maturity. In the event that an investment is downgraded, it is replaced with a highly rated investment grade security. We review for impairment on a quarterly basis and do not consider temporary unrealized losses to be impaired.
On March 11, 2011, we entered into an agreement with The Bank of New York Mellon as escrow agent and National Union Fire Insurance Company of Pittsburgh, PA on behalf of itself and its insurance company affiliates including but not limited to AIG, formerly known as Chartis Casualty Company (Chartis). The agreement creates a trust (the "Trust") at The Bank of New York Mellon which holds the majority of our collateral obligations under existing workers' compensation insurance policies that were previously held directly by AIG. Placing the collateral in the Trust allows us to manage the investment of the assets and provides greater protection of those assets.
Fair value of financial instruments and investments
The carrying value of cash and cash equivalents and restricted cash approximates fair value because of the short-term maturity of those instruments. The fair value of our restricted investments is based upon the quoted market price on the last business day of the fiscal reporting period. Where an observable quoted market price for a security does not exist, we estimate fair value using a variety of valuation methodologies, which include observable inputs for comparable instruments and unobservable inputs. There are inherent limitations when estimating the fair value of financial instruments and the fair values reported are not necessarily indicative of the amounts that would be realized in current market transactions.
Page -
35
Notes to Consolidated Financial Statements—(Continued)
Property and equipment
Property and equipment are recorded at cost. We compute depreciation using the straight-line method over the estimated useful lives of the assets.
|
|
Years
|
|
Buildings
|
40
|
|
Computers and software
|
3 - 10
|
|
Furniture and equipment
|
3 - 10
|
Leasehold improvements are amortized over the shorter of the related non-cancelable lease term, which is typically 90 days, or their estimated useful lives.
Non-capital expenditures associated with opening new branch locations are expensed as incurred.
When property is retired or otherwise disposed of, the cost and accumulated depreciation are removed from the accounts and any resulting gain or loss is reflected in the Consolidated Statements of Operations & Comprehensive Income.
Repairs and maintenance costs are charged directly to expense as incurred. Major renewals or replacements that substantially extend the useful life of an asset are capitalized and depreciated.
Costs associated with the acquisition or development of software for internal use are capitalized and amortized over the expected useful life of the software, from three to ten years. A subsequent addition, modification or upgrade to internal-use software is capitalized to the extent that it enhances the software's functionality or extends its useful life. Software maintenance and training costs are expensed in the period incurred.
Property under capital lease is comprised of software used in our operations and corporate support functions. The related amortization for capital lease assets is included in amortization expense in the Consolidated Statements of Operations & Comprehensive Income.
Leases
We conduct our branch office operations from leased locations. The leases require payment of real estate taxes, insurance and common area maintenance, in addition to rent. The terms of our lease agreements generally range from three to five years with options to cancel with 90 day notification. Most of the leases contain renewal options and escalation clauses.
For leases that contain predetermined fixed escalations of the minimum rent, we recognize the related rent expense on a straight-line basis from the date we take possession of the property to the end of the minimum lease term. We record any difference between the straight-line rent amounts and amounts payable under the leases as part of deferred rent, in accrued liabilities or long-term liabilities, as appropriate.
Cash or lease incentives received upon entering into certain branch leases ("tenant allowances") are recognized on a straight-line basis as a reduction to rent from the date we take possession of the property through the end of the initial lease term. We record the unamortized portion of tenant allowances as a part of deferred rent, in accrued liabilities or long-term liabilities, as appropriate.
We also lease certain equipment and software under non-cancelable operating and capital leases. Assets acquired under capital leases are depreciated and amortized over the shorter of the useful life of the asset or the lease term, including renewal periods, if reasonably assured.
Goodwill and intangible assets
Goodwill is the excess of the purchase price over the fair value of identifiable net assets acquired in business combinations. We allocated goodwill to reporting units based on the reporting units that are expected to benefit from the business combination. We do not amortize goodwill but test it for impairment annually as of the last day of our fiscal third quarter, or when indications of potential impairment exist. We monitor the existence of potential impairment indicators throughout the fiscal year.
We test for goodwill impairment at the reporting unit level. We consider our brands Labor Ready, Spartan Staffing, CLP Resources, PlaneTechs and Centerline to be reporting units for goodwill impairment testing. In fiscal
2012
,
2011
and
2010
, there were no changes to our reporting units. The impairment test involves comparing the fair value of each reporting unit to its carrying value, including goodwill. Fair value reflects the price a market participant would be willing to pay in a potential sale of the reporting unit. If the fair value exceeds carrying value, then we conclude that no goodwill impairment has occurred. If the carrying value
Page -
36
Notes to Consolidated Financial Statements—(Continued)
of the reporting unit exceeds its fair value, a second step is required to measure possible goodwill impairment loss. The second step includes hypothetically valuing the tangible and intangible assets and liabilities of the reporting unit as if the reporting unit had been acquired in a business combination. Then, the implied fair value of the reporting unit's goodwill is compared to the carrying value of that goodwill. If the carrying value of the reporting unit's goodwill exceeds the implied fair value of the goodwill, we recognize an impairment loss in an amount equal to the excess, not to exceed the carrying value. We determine the fair value of each reporting unit using a discounted cash flow model.
Considerable management judgment is necessary to evaluate the impact of operating and macroeconomic changes on each reporting unit. Critical assumptions include projected revenue growth, gross profit rates, selling, general and administrative expense rates, working capital fluctuations, capital expenditures and terminal growth rates, as well as an appropriate risk adjusted discount rate. Discount rates are determined using the capital asset pricing model.
The blue-collar staffing market is subject to volatility based on overall economic conditions. As a consequence, our revenues tend to increase quickly when the economy begins to grow, as occurred during 2011. Conversely, our revenues also decrease quickly when the economy begins to weaken, as occurred during the most recent recession. If actual results were to significantly deviate from management's estimates and assumptions of future performance, we could experience a material impairment to our goodwill.
We also use comparable market earnings multiple data and our company's market capitalization to corroborate our reporting unit valuations. We base fair value estimates on assumptions we believe to be reasonable but that are unpredictable and inherently uncertain. Actual future results may differ from those estimates.
We have indefinite-lived intangible assets related to our CLP Resources and Spartan Staffing trade names. We test our indefinite-lived intangible assets annually for impairment, or when indications of potential impairment exist. We utilize the relief from royalty method to determine the fair value of each of our trade names. If the carrying value exceeds the fair value, we recognize an impairment loss in an amount equal to the excess. Considerable management judgment is necessary to determine key assumptions, including projected revenue, royalty rates and appropriate discount rates.
Long-lived asset impairment
Long-lived assets include property and equipment and definite-lived intangible assets. Definite-lived intangible assets consist of customer relationships, trade names and non-compete agreements. Long-lived assets are tested for impairment whenever events or changes in circumstances indicate that the carrying value of the assets may not be recoverable. Factors considered important that could result in an impairment review include, but are not limited to, significant underperformance relative to historical or planned operating results, significant changes in the manner of use of the assets or significant changes in our business strategies. Long-lived assets are grouped at the lowest level at which identifiable cash flows are largely independent when assessing impairment. Our branch assets, including property and equipment, and customer relationship intangibles, are grouped and evaluated at the individual branch level. All other property and equipment and definite-lived intangibles are grouped at either the brand or corporate level as appropriate based on the identifiable cash flows. An impairment loss is recognized when the estimated undiscounted cash flows expected to result from the use of the asset plus net proceeds expected from disposition of the asset (if any) are less than the carrying value of the asset. When an impairment loss is recognized the carrying amount of the asset is reduced to its estimated fair value based on quoted market prices or other valuation techniques (e.g., discounted cash flow analysis). Considerable management judgment is necessary to estimate future after-tax cash flows, including cash flows from continuing use and terminal value. Accordingly, actual future results could vary from our estimates.
Branch closures and exit costs
We routinely evaluate our branch network and close under-performing branches. We classify closed branches in discontinued operations when the operations and cash flows of the branch have been or will be eliminated from ongoing operations. To determine if cash flows have been or will be eliminated from ongoing operations, we evaluate a number of qualitative and quantitative factors, including, but not limited to, proximity to remaining open branches and estimates of revenue migration from the closed branch to any branch remaining open. The estimated revenue migration is based on historical estimates of our revenue migration upon opening or closing a branch in a similar market. Branch closings meeting the criteria for discontinued operations were not material individually or cumulatively for any reporting year presented. Assets related to planned branch closures or other exit activities are evaluated for impairment in accordance with our impairment policy, giving consideration to revised estimates of future cash flows.
Workers’ compensation reserves
We maintain reserves for workers’ compensation claims using actuarial estimates of the future cost of claims and related expenses. These estimates include claims that have been reported but not settled and claims that have been incurred but not reported. These reserves, which reflect potential liabilities to be paid in future periods based on estimated payment patterns, are discounted to
Page -
37
Notes to Consolidated Financial Statements—(Continued)
estimated net present value using discount rates based on average returns of “risk-free” U.S. Treasury instruments, which are evaluated on a quarterly basis. We evaluate the reserves regularly throughout the year and make adjustments accordingly. If the actual cost of such claims and related expenses exceed the amounts estimated, additional reserves may be required
.
Changes in reserve estimates are reflected in the Consolidated Statements of Operations & Comprehensive Income in the period when the changes in estimates are made.
Our workers’ compensation reserves include estimated expenses related to claims above our self-insured limits (“excess claims”) and a corresponding receivable for the insurance coverage on excess claims based on the contractual policy agreements we have with insurance companies. We discount the liability and its corresponding receivable to its estimated net present value using the “risk-free” rates associated with the actuarially determined weighted average lives of our excess claims. When appropriate, based on our best estimate, we record a valuation allowance against the insurance receivable to reflect amounts that may not be realized.
Reserves for contingent legal and regulatory liabilities
From time to time we are subject to compliance audits by federal, state and local authorities relating to a variety of regulations including wage and hour laws, taxes, workers’ compensation, immigration and safety. From time to time we are also subject to legal proceedings in the ordinary course of our operations. We establish reserves for contingent legal and regulatory liabilities when our management judges that it is probable that a legal claim will result in an adverse outcome and the amount of liability can be reasonably estimated. To the extent that an insurance company is contractually obligated to reimburse us for a liability, we record a receivable for the amount of the probable reimbursement. We evaluate our reserve regularly throughout the year and make adjustments as needed. If the actual outcome of these matters is different than expected, an adjustment is charged or credited to expense in the period the outcome occurs or the period in which the estimate changes.
Income taxes and related valuation allowance
We account for income taxes by recording taxes payable or receivable for the current year and deferred tax assets and liabilities for the future tax consequences of events that have been recognized in our financial statements or tax returns. These expected future tax consequences are measured based on provisions of tax law as currently enacted; the effects of future changes in tax laws are not anticipated. Future tax law changes, such as changes to the federal and state corporate tax rates and the mix of states and their taxable income, could have a material impact on our financial condition or results of operations. When appropriate, we record a valuation allowance against deferred tax assets to offset future tax benefits that may not be realized. In determining whether a valuation allowance is appropriate, we consider whether it is more likely than not that all or some portion of our deferred tax assets will not be realized, based in part upon management’s judgments regarding future events and past operating results. Based on that analysis, we have determined that a valuation allowance is appropriate for certain foreign net operating losses that we expect will not be utilized within the permitted carry forward periods as of
December 28, 2012
and
December 30, 2011
. See Note 11 for further discussion.
Stock-based compensation
Under various plans, officers, employees and non-employee directors have received or may receive grants of stock, restricted stock awards, performance share units or options to purchase common stock. We also have an employee stock purchase plan (“ESPP”).
Compensation expense for restricted stock and stock units is generally recognized on a straight-line basis over the vesting period, based on the stock’s fair market value on the grant date. For restricted stock grants issued with performance conditions, compensation expense is recognized over each vesting tranche. We recognize compensation expense for only the portion of restricted stock and stock units that is expected to vest, rather than record forfeitures when they occur. If the actual number of forfeitures differs from those estimated by management, additional adjustments to compensation expense may be required in the future periods. We determine the fair value of options to purchase common stock using the Black-Scholes valuation model, which requires the input of subjective assumptions. We recognize expense over the service period for options that are expected to vest and record adjustments to compensation expense at the end of the service period if actual forfeitures differ from original estimates.
Foreign currency
Cumulative foreign currency translation adjustments relate to our consolidated foreign subsidiary. Assets and liabilities recorded in foreign currencies are translated at the applicable exchange rate on the balance sheet date. Revenue and expenses are translated at average rates of exchange prevailing during the year.
Purchases and retirement of our common stock
Purchases of our common stock are not displayed separately as treasury stock on the Consolidated Balance Sheets in accordance with the Washington Business Corporation Act, which requires the retirement of purchased shares. As a result, shares of our
Page -
38
Notes to Consolidated Financial Statements—(Continued)
common stock that we purchase are retired immediately. It is our accounting policy to first record these purchases as a reduction to our Common stock account. Once the Common stock account has been reduced to a nominal balance, remaining purchases are recorded as a reduction to our Retained earnings account. Furthermore, activity in our common stock account related to stock-based compensation is also recorded to Retained earnings until such time as the reduction to Retained earnings due to stock repurchases has been recovered. See Note 9 and Note 10 for further discussion of share purchases and stock-based compensation, respectively.
Shares outstanding
Shares outstanding include shares of unvested restricted stock. Unvested restricted stock included in reportable shares outstanding was
0.6 million
and
0.7 million
shares as of
December 28, 2012
and
December 30, 2011
, respectively. Shares of unvested restricted stock are excluded from our calculation of basic weighted average shares outstanding, but their dilutive impact is added back in the calculation of diluted weighted average shares outstanding.
Recently Adopted Accounting Standards
During the first quarter of 2012, we adopted the accounting standard regarding the presentation of comprehensive income. This standard was issued to increase the prominence of items reported in other comprehensive income. We have presented all non owner changes in shareholders' equity in a single, continuous statement in our financial statements as “Consolidated Statements of Operations & Comprehensive Income.” The standard does not change the following: items that must be reported in other comprehensive income, when an item of other comprehensive income must be reclassified to net income, the requirement to disclose the tax effect for each component of other comprehensive income or how earnings per share is calculated or presented. Our comprehensive income includes primarily foreign currency translation. The adoption of this standard in the first quarter of 2012 impacted our financial statement presentation only.
Recent Accounting Guidance not yet Effective
In July 2012, the Financial Accounting Standards Board issued guidance on testing indefinite-lived intangibles for impairment. The new guidance provides an entity the option to first perform a qualitative assessment to determine whether it is more likely than not that the fair value of its indefinite-lived intangible assets are less than their carrying amounts. If an entity determines that it is more likely than not that the fair value of each asset exceeds its carrying amount, it would not need to calculate the fair value of the asset in that year. If the entity concludes otherwise, it is required to perform an impairment test comparing the carrying value of the intangible asset with its fair value and recognize an impairment loss if necessary. The new guidance will be effective for us beginning in our fiscal year 2013 and early adoption is permitted.
|
NOTE 2:
|
FAIR VALUE MEASUREMENT
|
Fair value is the price that would be received to sell an asset or paid to transfer a liability (an exit price) in the principal or most advantageous market for the asset or liability in an orderly transaction between market participants on the measurement date. We apply a fair value hierarchy that prioritizes the inputs used to measure fair value:
|
•
|
Level 1: Inputs are valued using quoted market prices in active markets for identical assets or liabilities. Our Level 1 assets primarily include cash and cash equivalents, mutual funds and United States Treasury Securities.
|
|
•
|
Level 2: Inputs are valued based upon quoted prices for similar instruments in active markets or quoted prices for identical or similar instruments in markets that are not active. Our Level 2 assets are restricted investments which primarily consist of Municipal Securities, Corporate Securities, U.S. Agency Mortgages and U.S. Agency Debentures. We obtain our inputs from quoted market prices and independent pricing vendors.
|
|
•
|
Level 3: Inputs are generally unobservable and typically reflect management's estimates of assumptions that market participants would use in pricing the asset or liability. We currently have no Level 3 assets or liabilities.
|
The carrying value of our cash and cash equivalents, restricted cash and accounts receivable approximates fair value due to their short term nature. We also hold certain restricted investments which collateralize workers' compensation programs and are classified as held-to-maturity and carried at amortized cost on our Consolidated Balance Sheets. There are inherent limitations when estimating the fair value of financial instruments and the fair values reported are not necessarily indicative of the amounts that would be realized in current market transactions.
Page -
39
Notes to Consolidated Financial Statements—(Continued)
The following table presents the fair value and hierarchy for our cash equivalents and restricted investments (in millions):
|
December 28,
2012 |
December 30,
2011 |
||||||
|
Level 1:
|
|||||||
|
Cash equivalents (1)
|
$
|
94.6
|
|
$
|
55.5
|
|
|
|
Restricted cash equivalents (1)
|
26.8
|
|
31.2
|
|
|||
|
Restricted investments classified as held-to-maturity (2)
|
—
|
|
1.0
|
|
|||
|
Other restricted investments (3)
|
3.5
|
|
2.2
|
|
|||
|
Level 2:
|
|||||||
|
Restricted investments classified as held-to-maturity (4)
|
92.7
|
|
78.0
|
|
|||
____________________
|
(1)
|
Cash equivalents and restricted cash equivalents consist of money market funds, deposits and investments with original maturities of three months or less.
|
|
(2)
|
Level 1 restricted investments classified as held-to-maturity consist of United States Treasury Securities.
|
|
(3)
|
Level 1 other restricted investments consist of deferred compensation investments which are comprised of mutual funds. We have an equal and offsetting accrued liability related to the deferred compensation plan.
|
|
(4)
|
Level 2 restricted investments classified as held-to-maturity consist of Municipal Securities, Corporate Securities, U.S. Agency Mortgages and U.S. Agency Debentures.
|
|
NOTE 3:
|
RESTRICTED CASH AND INVESTMENTS
|
Restricted cash and investments consist principally of collateral that has been provided or pledged to insurance carriers for workers' compensation and state workers' compensation programs. Our insurance carriers and certain state workers' compensation programs require us to collateralize a portion of our workers' compensation obligation. The collateral typically takes the form of cash and cash equivalents and highly rated investment grade securities, primarily in U.S. Treasury Securities, U.S. Agency Debentures, U.S. Agency Mortgages, Corporate Securities and Municipal Securities. The majority of our collateral obligations are held in a trust ("Trust") at the Bank of New York Mellon.
The following is a summary of restricted cash and investments (
in millions
):
|
|
December 28,
2012 |
December 30,
2011 |
|||||
|
Cash collateral held by insurance carriers
|
$
|
21.5
|
|
$
|
21.3
|
|
|
|
Cash and cash equivalents held in Trust (1)
|
14.8
|
|
19.2
|
|
|||
|
Investments held in Trust
|
91.2
|
|
78.0
|
|
|||
|
Cash collateral backing letters of credit
|
1.8
|
|
5.9
|
|
|||
|
Other (2)
|
7.0
|
|
6.1
|
|
|||
|
Total restricted cash and investments
|
$
|
136.3
|
|
$
|
130.5
|
|
|
__________________
|
(1)
|
Included in this amount is
$0.9 million
and
$0.8 million
of accrued interest at
December 28, 2012
and
December 30, 2011
, respectively.
|
|
(2)
|
Primarily consists of restricted cash in money market accounts and deferred compensation plan accounts which are comprised of mutual funds.
|
The following tables present fair value disclosures for our held-to-maturity investments which are carried at amortized cost (
in millions
):
|
December 28, 2012
|
|||||||||||||||
|
Amortized Cost
|
Gross Unrealized Gain
|
Gross Unrealized Loss
|
Fair Value
|
||||||||||||
|
Municipal securities
|
$
|
57.3
|
|
$
|
1.0
|
|
$
|
(0.1
|
)
|
$
|
58.2
|
|
|||
|
Corporate bonds
|
17.9
|
|
0.3
|
|
—
|
|
18.2
|
|
|||||||
|
Asset backed bonds
|
16.0
|
|
0.3
|
|
—
|
|
16.3
|
|
|||||||
|
$
|
91.2
|
|
$
|
1.6
|
|
$
|
(0.1
|
)
|
$
|
92.7
|
|
||||
Page -
40
Notes to Consolidated Financial Statements—(Continued)
|
December 30, 2011
|
|||||||||||||||
|
Amortized Cost
|
Gross Unrealized Gain
|
Gross Unrealized Loss
|
Fair Value
|
||||||||||||
|
Municipal securities
|
$
|
42.8
|
|
$
|
0.8
|
|
$
|
(0.1
|
)
|
$
|
43.5
|
|
|||
|
Corporate bonds
|
16.1
|
|
0.2
|
|
—
|
|
16.3
|
|
|||||||
|
Asset backed bonds
|
13.6
|
|
0.1
|
|
—
|
|
13.7
|
|
|||||||
|
State government and agency securities
|
4.5
|
|
—
|
|
—
|
|
4.5
|
|
|||||||
|
United States Treasury securities
|
1.0
|
|
—
|
|
—
|
|
1.0
|
|
|||||||
|
$
|
78.0
|
|
$
|
1.1
|
|
$
|
(0.1
|
)
|
$
|
79.0
|
|
||||
The amortized cost and fair value by contractual maturity of our held-to-maturity investments are as follows (
in millions
):
|
December 28, 2012
|
|||||||
|
Amortized Cost
|
Fair Value
|
||||||
|
Due in one year or less
|
$
|
11.8
|
|
$
|
11.8
|
|
|
|
Due after one year through five years
|
43.3
|
|
44.1
|
|
|||
|
Due after five years through ten years
|
36.1
|
|
36.8
|
|
|||
|
$
|
91.2
|
|
$
|
92.7
|
|
||
Actual maturities may differ from contractual maturities because the issuers of certain debt securities have the right to call or prepay their obligations without penalty.
|
NOTE 4:
|
PROPERTY AND EQUIPMENT, NET
|
Property and equipment are stated at cost and consist of the following (
in millions
):
|
|
December 28,
2012 |
December 30,
2011 |
|||||
|
Buildings and land
|
$
|
25.9
|
|
$
|
24.5
|
|
|
|
Computers and software
|
91.7
|
|
80.5
|
|
|||
|
Cash dispensing machines
|
1.0
|
|
4.5
|
|
|||
|
Furniture and equipment
|
8.9
|
|
8.7
|
|
|||
|
Construction in progress
|
7.7
|
|
3.6
|
|
|||
|
|
135.2
|
|
121.8
|
|
|||
|
Less accumulated depreciation and amortization
|
(77.0
|
)
|
(65.6
|
)
|
|||
|
$
|
58.2
|
|
$
|
56.2
|
|
||
Capitalized software costs, net of accumulated amortization, were
$30.9 million
and
$34.5 million
as of
December 28, 2012
and
December 30, 2011
, respectively, excluding amounts in Construction in progress. Construction in progress consists primarily of purchased and internally developed software.
Depreciation and amortization of property and equipment totaled
$15.8 million
,
$13.5 million
and
$13.8 million
for
2012
,
2011
and
2010
, respectively.
|
NOTE 5:
|
GOODWILL AND INTANGIBLE ASSETS
|
There have been
no
significant changes in the carrying amount of goodwill for the fiscal year ended
December 28, 2012
. We completed
two
acquisitions during
2011
for a total purchase price of
$17.4 million
of which
$6.4 million
remains to be paid in the future and
$4.6 million
was paid in 2012. The assets acquired and liabilities assumed were recorded at the date of acquisition at their respective estimated fair values. Assets acquired included finite-lived intangible assets of
$1.8 million
with an estimated weighted average useful life of
4.6
years. The excess of the purchase price over the estimated fair values of the net assets acquired in the amount of
$11.2 million
was recorded as goodwill, is entirely deductible for tax purposes, and is primarily due to synergies with our existing business and also the assembled workforce, future technologies and potential new customers. These acquisitions were not individually or in the aggregate material to our consolidated results of operations and as such, pro forma financial statements were not required.
Page -
41
Notes to Consolidated Financial Statements—(Continued)
Changes in the carrying amount of goodwill were as follows
(in millions)
:
|
December 28, 2012
|
December 30, 2011
|
||||||
|
Goodwill prior to impairment
|
$
|
94.3
|
|
$
|
83.1
|
|
|
|
Accumulated impairment losses
|
(46.2
|
)
|
(46.1
|
)
|
|||
|
Beginning Balance - net
|
48.1
|
|
37.0
|
|
|||
|
Goodwill acquired during the year
|
—
|
|
11.2
|
|
|||
|
Ending balance - net
|
$
|
48.1
|
|
$
|
48.2
|
|
|
Intangible assets other than goodwill are broken out separately on our Consolidated Balance Sheets for
2012
and
2011
. The following table presents our purchased intangible assets other than goodwill (
in millions
):
|
|
December 28, 2012
|
December 30, 2011
|
|||||||||||||||||||||
|
|
Gross
Carrying
Amount
|
Accumulated
Amortization
|
Net
Carrying
Amount
|
Gross
Carrying
Amount
|
Accumulated
Amortization
|
Net
Carrying
Amount
|
|||||||||||||||||
|
Amortizable intangible assets (1):
|
|||||||||||||||||||||||
|
Customer relationships
|
$
|
19.1
|
|
$
|
(10.5
|
)
|
$
|
8.6
|
|
$
|
19.1
|
|
$
|
(8.3
|
)
|
$
|
10.8
|
|
|||||
|
Trade name/trademarks
|
3.5
|
|
(1.6
|
)
|
1.9
|
|
3.3
|
|
(1.3
|
)
|
2.0
|
|
|||||||||||
|
Non-compete agreements
|
1.8
|
|
(1.4
|
)
|
0.4
|
|
2.5
|
|
(1.7
|
)
|
0.8
|
|
|||||||||||
|
$
|
24.4
|
|
$
|
(13.5
|
)
|
$
|
10.9
|
|
$
|
24.9
|
|
$
|
(11.3
|
)
|
$
|
13.6
|
|
||||||
|
Indefinite-lived intangible assets:
|
|||||||||||||||||||||||
|
Trade name/trademarks
|
$
|
5.7
|
|
$
|
5.8
|
|
|||||||||||||||||
____________________
(1)
Excludes assets that are fully amortized.
Intangible assets are amortized using the straight-line method over their estimated useful lives. Amortization of our definite-lived intangible assets was
$3.1 million
,
$2.9 million
and
$2.7 million
for
2012
,
2011
and
2010
, respectively.
The following table provides the estimated future amortization of definite-lived intangible assets at
December 28, 2012
(
in millions
):
|
2013
|
$
|
2.7
|
|
|
2014
|
2.7
|
|
|
|
2015
|
2.7
|
|
|
|
2016
|
2.3
|
|
|
|
Thereafter
|
0.5
|
|
|
|
$
|
10.9
|
|
|
Goodwill and indefinite-lived intangible assets are reviewed for impairment annually or when triggering events indicate impairment is more likely than not. Long-lived intangible assets are reviewed for impairment whenever events and circumstances indicate the carrying value may not be recoverable. In fiscal
2012
,
2011
and
2010
we identified no material impairments of goodwill or long-lived intangible assets.
|
NOTE 6:
|
WORKERS’ COMPENSATION INSURANCE AND RESERVES
|
We provide workers’ compensation insurance for our temporary and permanent employees. The majority of our current workers’ compensation insurance policies cover claims for a particular event above a
$2.0 million
deductible limit, on a “per occurrence” basis. This results in our being substantially self-insured. For policy years beginning in July 2003 and after, AIG, formerly known as Chartis, has been our workers' compensation carrier. The policy year is effective July 1 to June 30 and is subject to annual renewal. We completed our renewal with AIG for the 2012 - 2013 policy year in June. For years prior to 2003, we had coverage with other insurance providers. Furthermore, we have full liability for all further payments on claims that originated between January 2001 and June 2003, without recourse to any third party insurer as the result of a novation agreement we entered into with Kemper Insurance Company in December 2004.
Page -
42
Notes to Consolidated Financial Statements—(Continued)
For workers’ compensation claims originating in Washington, North Dakota, Ohio, Wyoming, Canada and Puerto Rico (our “monopolistic jurisdictions”), we pay workers’ compensation insurance premiums and obtain full coverage under government-administered programs (with the exception of our Labor Ready brand in the state of Ohio where we have a self-insured policy). Accordingly, because we are not the primary obligor, our financial statements do not reflect the liability for workers’ compensation claims in these monopolistic jurisdictions.
Our workers’ compensation reserve is established using estimates of the future cost of claims and related expenses that have been reported but not settled, as well as those that have been incurred but not reported. Our workers’ compensation reserve for claims below the deductible limit is discounted to its estimated net present value using discount rates based on average returns of “risk-free” U.S. Treasury instruments available during the year in which the liability was incurred. At
December 28, 2012
, the weighted average rate was
2.4%
. The claim payments are made over an estimated weighted average period of approximately
5.5
years. As of
December 28, 2012
and
December 30, 2011
, the discounted workers’ compensation claims reserves were
$195.6 million
and
$191.8 million
, respectively.
Our workers’ compensation reserve includes estimated expenses related to claims above our deductible limits (“excess claims”), and we record a corresponding receivable for the insurance coverage on excess claims based on the contractual policy agreements we have with insurance carriers. We discount this reserve and corresponding receivable to its estimated net present value using the discount rates based on average returns of “risk-free” U.S. Treasury instruments available during the year in which the liability was incurred. At
December 28, 2012
, the weighted average rate was
4.4%
. The claim payments are made and the corresponding reimbursements from our insurance carriers are received over an estimated weighted average period of approximately
19.7
years. The discounted workers’ compensation reserve for excess claims and the corresponding receivable for the insurance on excess claims were
$27.1 million
and
$27.4 million
as of
December 28, 2012
and
December 30, 2011
, respectively.
Two of the workers’ compensation insurance companies (“Troubled Insurance Companies”) with which we formerly did business are in liquidation and have failed to pay a number of excess claims to date. These excess claims have been presented to the state guaranty funds of the states in which the claims originated. Some of these excess claims have been rejected by the state guaranty funds due to statutory eligibility limitations. We have recorded a valuation allowance of
$5.6 million
and
$7.3 million
against all receivables from Troubled Insurance Companies as of
December 28, 2012
and
December 30, 2011
, respectively. Total discounted receivables from insurance companies, net of the valuation allowance, as of
December 28, 2012
and
December 30, 2011
were
$21.4 million
and
$20.1 million
, respectively and were included in Other assets, net in the accompanying Consolidated Balance Sheets.
Management evaluates the adequacy of the workers’ compensation reserves in conjunction with an independent quarterly actuarial assessment. Factors considered in establishing and adjusting these reserves include, among other things:
|
•
|
Changes in medical and time loss (“indemnity”) costs;
|
|
•
|
Mix changes between medical only and indemnity claims;
|
|
•
|
Regulatory and legislative developments that have increased benefits and settlement requirements;
|
|
•
|
Type and location of work performed;
|
|
•
|
The impact of safety initiatives; and
|
|
•
|
Positive or adverse development of claim reserves.
|
Workers’ compensation expense totaling
$52.3 million
,
$51.2 million
and
$43.3 million
was recorded for
2012
and
2011
,
2010
respectively. Workers’ compensation expense consists of: self-insurance reserves net of changes in discount; monopolistic jurisdictions’ premiums; insurance premiums; changes in the valuation allowance related to receivables from the Troubled Insurance Companies as described above; and other miscellaneous expenses.
|
NOTE 7:
|
COMMITMENTS AND CONTINGENCIES
|
Revolving credit facility
We have a credit agreement with Bank of America, N.A. and Wells Fargo Capital Finance, LLC for a secured revolving credit facility of up to a maximum of
$80 million
(the “Revolving Credit Facility”). The Revolving Credit Facility expires in September 2016.
The maximum amount we can borrow under the Revolving Credit Facility is subject to certain borrowing limits. Specifically, we are limited to the sum of
85%
of our eligible accounts receivable and the liquidation value of our Tacoma headquarters office building not to exceed
$15 million
, which is reduced quarterly by
$0.4 million
. As of
December 28, 2012
, the Tacoma headquarters
Page -
43
Notes to Consolidated Financial Statements—(Continued)
office building liquidation value totaled
$13.5 million
. The borrowing limit is further reduced by the sum of a reserve in an amount equal to the payroll and payroll taxes for our temporary employees for one payroll cycle and other reserves if deemed applicable. As of
December 28, 2012
, the maximum
$80 million
was available and letters of credit in the amount of
$7.2 million
had been issued against the facility, leaving an unused portion of
$72.8 million
. The letters of credit collateralize a portion of our workers' compensation obligation.
The Revolving Credit Facility requires that we maintain liquidity in excess of
$12 million
. We are required to satisfy a fixed charge coverage ratio in the event we do not meet that requirement. Liquidity is defined as the amount we are entitled to borrow as advances under the Revolving Credit Facility plus the amount of cash and cash equivalents held in accounts subject to a control agreement benefiting the lenders. The amount we were entitled to borrow at
December 28, 2012
was
$72.8 million
and the amount of cash and cash equivalents under control agreements was
$128.3 million
for a total of
$201.1 million
, which is well in excess of the liquidity requirement. We are currently in compliance with all covenants related to the Revolving Credit Facility.
Under the terms of the Revolving Credit Facility, we pay a variable rate of interest on funds borrowed that is based on LIBOR or the Prime Rate, at our option, plus an applicable spread based on excess liquidity as set forth below:
|
Excess Liquidity
|
Prime Rate Loans
|
LIBOR Rate Loans
|
||
|
Greater than $40 million
|
0.50%
|
1.50%
|
||
|
Between $20 million and $40 million
|
0.75%
|
1.75%
|
||
|
Less than $20 million
|
1.00%
|
2.00%
|
||
A fee on borrowing availability of
0.25%
is also applied against the unused portion of the Revolving Credit Facility. Letters of credit are priced at the margin in effect for LIBOR loans, plus a fronting fee of
0.125%
.
Obligations under the Revolving Credit Facility are secured by substantially all of our domestic personal property and our headquarters located in Tacoma, Washington.
Workers’ compensation commitments
Our insurance carriers and certain state workers’ compensation programs require us to collateralize a portion of our workers’ compensation obligation, for which they become responsible should we become insolvent. The collateral typically takes the form of cash and cash equivalents, highly rated investment grade debt securities, letters of credit and/or surety bonds. On a regular basis these entities assess the amount of collateral they will require from us relative to our workers' compensation obligation. The majority of our collateral obligations are held in the Trust at the Bank of New York Mellon.
We have provided our insurance carriers and certain states with commitments in the form and amounts listed below (
in millions
):
|
|
December 28,
2012 |
December 30,
2011 |
|||||
|
Cash collateral held by insurance carriers
|
$
|
21.5
|
|
$
|
21.3
|
|
|
|
Cash and cash equivalents held in Trust (1)
|
14.8
|
|
19.2
|
|
|||
|
Investments held in Trust
|
91.2
|
|
78.0
|
|
|||
|
Letters of credit (2)
|
9.0
|
|
16.7
|
|
|||
|
Surety bonds (3)
|
16.2
|
|
16.2
|
|
|||
|
Total collateral commitments
|
$
|
152.7
|
|
$
|
151.4
|
|
|
____________________
|
(1)
|
Included in this amount is
$0.9 million
and
$0.8 million
of accrued interest at
December 28, 2012
and
December 30, 2011
, respectively.
|
|
(2)
|
We have agreements with certain financial institutions to issue letters of credit as collateral. We had
$1.8 million
and
$5.9 million
of restricted cash collateralizing our letters of credit at
December 28, 2012
and
December 30, 2011
, respectively.
|
|
(3)
|
Our surety bonds are issued by independent insurance companies on our behalf and bear annual fees based on a percentage of the bond, which is determined by each independent surety carrier, but do not exceed
2.0%
of the bond amount, subject to a minimum charge. The terms of these bonds are subject to review and renewal every
one
to
four
years and most bonds can be canceled by the sureties with as little as
60
days notice.
|
Capital leases
We have property held under non-cancelable capital leases reported in Property and equipment, net on the Consolidated Balance Sheets totaling
$0.1 million
and
$0.2 million
, net of accumulated depreciation at
December 28, 2012
and
December 30, 2011
,
Page -
44
Notes to Consolidated Financial Statements—(Continued)
respectively. Our capital lease obligations are reported in Other current liabilities in the Consolidated Balance Sheets. Future minimum lease payments under these non-cancelable capital leases as of
December 28, 2012
are
$0.1 million
for 2013.
Operating leases
We have contractual commitments in the form of operating leases related to branch offices and equipment. Future non-cancelable minimum lease payments under our operating lease commitments as of
December 28, 2012
are as follows for each of the next five years and thereafter (
in millions
):
|
2013
|
$
|
6.6
|
|
|
2014
|
4.5
|
|
|
|
2015
|
3.5
|
|
|
|
2016
|
2.3
|
|
|
|
2017
|
0.7
|
|
|
|
Thereafter
|
0.2
|
|
|
|
$
|
17.8
|
|
|
The majority of operating leases pertaining to our branch offices provide for renewal options ranging from
three
to
five
years. Operating leases are generally renewed in the normal course of business, and most of the options are negotiated at the time of renewal. However, for the majority of our leases, both parties to the lease have the right to cancel the lease with
90
days notice. Accordingly, we have not included the leases with
90
day cancellation provisions in our disclosure of future minimum lease payments. Total branch office rent expense for
2012
,
2011
and
2010
was
$22.0 million
,
$22.1 million
and
$22.6 million
, respectively.
Purchase Obligations
Purchase obligations include agreements to purchase goods and services in the ordinary course of business that are enforceable, legally binding and specify all significant terms. Purchase obligations do not include agreements that are cancelable without significant penalty. We had
$7.5 million
of purchase obligations as of
December 28, 2012
of which,
$6.9 million
are expected to be paid in 2013.
Legal contingencies and developments
We are involved in various proceedings arising in the normal course of conducting business. We believe the amounts provided in our financial statements are adequate in consideration of the probable and estimable liabilities. The resolution of those proceedings is not expected to have a material effect on our results of operations or financial condition.
|
NOTE 8:
|
PREFERRED STOCK
|
We have authorized
20 million
shares of blank check preferred stock. The blank check preferred stock is issuable in one or more series, each with such designations, preferences, rights, qualifications, limitations and restrictions as our Board of Directors may determine and set forth in supplemental resolutions at the time of issuance, without further shareholder action.
The initial series of blank check preferred stock authorized by the Board of Directors was designated as Series A Preferred Stock. We had no outstanding shares of preferred stock in any of the years presented.
|
NOTE 9:
|
COMMON STOCK
|
In July 2011, our Board of Directors approved a program to repurchase
$75 million
of our outstanding common stock. As of
December 28, 2012
,
$35.2 million
remained available for repurchase of common stock under the current authorization, which has no expiration date.
Under our authorized stock repurchase program, we repurchased and retired
0.3 million
shares of our common stock during
2012
for a total amount of
$4.4 million
including commissions. We repurchased and retired
4.5 million
shares of our common stock during
2011
for a total amount of
$56.9 million
including commissions.
Purchases of our common stock are not displayed separately as treasury stock on the Consolidated Balance Sheets in accordance with the Washington Business Corporation Act, which requires the retirement of purchased shares. As a result, shares of our common stock that we purchase are retired immediately. It is our policy to first record these purchases as a reduction to our Common
Page -
45
Notes to Consolidated Financial Statements—(Continued)
stock account. Once the Common stock account has been reduced to a nominal balance, remaining purchases are recorded as a reduction to our Retained earnings account.
|
NOTE 10:
|
STOCK-BASED COMPENSATION
|
Stock-based compensation includes expense charges for all stock-based awards to employees and directors. Such awards include restricted and unrestricted stock awards, performance share units, stock options, and shares purchased under an employee stock purchase plan (“ESPP”).
Stock-based compensation expense was as follows (
in millions
):
|
|
2012
|
2011
|
2010
|
||||||||
|
Restricted and unrestricted stock and performance share units expense
|
$
|
7.5
|
|
$
|
6.7
|
|
$
|
5.9
|
|
||
|
Stock option expense
|
0.1
|
|
0.4
|
|
1.0
|
|
|||||
|
ESPP expense
|
0.3
|
|
0.3
|
|
0.3
|
|
|||||
|
Total stock-based compensation expense
|
$
|
7.9
|
|
$
|
7.4
|
|
$
|
7.2
|
|
||
|
Total related tax benefit recognized
|
$
|
2.9
|
|
$
|
2.8
|
|
$
|
2.3
|
|
||
No capitalized stock-based compensation was included in Property and equipment, net on the Consolidated Balance Sheets for
2012
,
2011
or
2010
.
Restricted and unrestricted stock and performance share units
Stock-based awards are issued under our 2005 Amended Long-Term Equity Incentive Plan. Restricted stock is granted to executive officers and key employees and vests annually over periods ranging from
three
to
four
years. Unrestricted stock granted to our directors vests immediately. Restricted and unrestricted stock-based compensation expense is calculated based on the grant-date market value. We recognize compensation expense on a straight-line basis over the vesting period, net of estimated forfeitures.
Performance share units have been granted to executive officers and certain key employees since 2010. Vesting of the performance share units is contingent upon the achievement of revenue and profitability growth goals at the end of each
three
year performance period. Each performance share unit is equivalent to a share of common stock. Compensation expense is calculated based on the grant-date market value of our stock and is recognized ratably over the performance period for the performance share units which are expected to vest. Our estimate of the performance units expected to vest is reviewed and adjusted as appropriate each quarter.
Restricted, unrestricted stock and performance share units activity for the year ended
December 28, 2012
was as follows (
shares in thousands
):
|
|
Shares
|
Price (1)
|
||||
|
Non-vested at beginning of period
|
1,266
|
|
$
|
13.92
|
|
|
|
Granted
|
653
|
|
$
|
16.72
|
|
|
|
Vested
|
(382
|
)
|
$
|
13.79
|
|
|
|
Forfeited
|
(102
|
)
|
$
|
13.86
|
|
|
|
Non-vested at the end of the period
|
1,435
|
|
$
|
15.23
|
|
|
_____________________
|
(1)
|
Weighted average market price on grant-date.
|
As of
December 28, 2012
, total unrecognized stock-based compensation expense related to non-vested restricted stock was approximately
$7.0 million
, of which
$6.3 million
is estimated to be recognized over a weighted average period of
1.6
years through 2016. As of
December 28, 2012
, total unrecognized stock-based compensation expense related to performance share units, assuming achievement of maximum financial goals was approximately
$7.0 million
, of which
$2.8 million
is currently estimated to be recognized over a weighted average period of
1.9
years through 2015. The total fair value of restricted shares vesting during
2012
,
2011
and
2010
was
$5.3 million
,
$5.2 million
and
$5.4 million
, respectively.
Stock options
Our 2005 Amended Long-Term Equity Incentive Plan provides for both nonqualified stock options and incentive stock options (collectively, “stock options”) for directors, officers, and certain employees. We issue new shares of common stock upon exercise
Page -
46
Notes to Consolidated Financial Statements—(Continued)
of stock options. The majority of our unvested stock options “cliff vest” in
three
years from the date of grant and expire if not exercised within
seven
years from the date of grant. The maximum contractual term for our outstanding awards is
ten
years.
The fair value of each stock option granted is estimated on the grant date using the Black-Scholes valuation model, and the resulting expense is recognized over the requisite service period for each separately vesting portion of the award. The assumptions used to calculate the fair value of options granted reflect market conditions and our experience. Compensation expense is recognized only for those options expected to vest, with forfeitures estimated based on our historical experience and future expectations.
There were no stock options granted during
2012
and 2011. A summary of the weighted average assumptions and results for options granted during 2010 is as follows:
|
2010
|
||||
|
Expected life (in years)
|
3.36
|
|
||
|
Expected volatility
|
59.6
|
%
|
||
|
Risk-free interest rate
|
1.3
|
%
|
||
|
Expected dividend yield
|
—
|
%
|
||
|
Weighted average fair value of options granted during the period
|
$
|
6.24
|
|
|
Stock option activity was as follows (
shares in thousands
):
|
|
Shares
|
Weighted Average Exercise Price
|
Weighted Average Remaining Contractual Life
|
Aggregate Intrinsic Value (in millions)
|
||||||||
|
Outstanding, December 30, 2011
|
1,110
|
|
$
|
15.64
|
|
|||||||
|
Granted
|
—
|
|
$
|
—
|
|
|||||||
|
Exercised
|
(262
|
)
|
$
|
9.67
|
|
|||||||
|
Expired/Forfeited
|
(209
|
)
|
$
|
19.22
|
|
|||||||
|
Outstanding, December 28, 2012
|
639
|
|
$
|
16.91
|
|
1.4
|
$
|
0.6
|
|
|||
|
|
||||||||||||
|
Exercisable, December 28, 2012
|
634
|
|
$
|
16.97
|
|
1.4
|
$
|
0.6
|
|
|||
|
Options expected to vest, December 28, 2012
|
5
|
|
$
|
9.08
|
|
1.1
|
$
|
—
|
|
|||
The aggregate intrinsic value in the table above is the amount by which the market value of the underlying stock exceeded the exercise price of outstanding options, before applicable income taxes and represents the amount optionees would have realized if all in-the-money options had been exercised on the last business day of the period indicated. The closing per share market value of the Company’s stock on
December 28, 2012
was
$15.54
.
Total unrecognized stock-based compensation expense related to non-vested stock options was de minimis as of
December 28, 2012
. The total intrinsic value of options exercised during
2012
was
$1.9 million
, was de minimis in
2011
and was
$0.2 million
in
2010
, determined as of the date of exercise.
Cash received from option exercises, net of tax withholdings, during
2012
,
2011
and
2010
was
$2.5 million
,
$0.1 million
and
$0.2 million
, respectively. The actual tax benefit realized for the deduction from option exercises during
2012
was
$0.6 million
and was de minimis for
2011
and
2010
.
Employee stock purchase plan
Our Employee Stock Purchase Plan (“ESPP”) allows eligible employees to contribute up to
10%
of their earnings toward the monthly purchase of the Company's common stock. The employee's purchase price is the lesser of
85%
of the fair market value of shares on either the first day or the last day of each month. Under our ESPP we have reserved for purchase
1.0 million
shares of common stock, of which
0.2 million
shares have been purchased as of
December 28, 2012
. We consider our ESPP to be a component of our stock-based compensation and accordingly we recognize compensation expense over the requisite service period for stock purchases made under the plan. The requisite service period begins on the enrollment date and ends on the purchase date, the duration of which is
one
month.
Page -
47
Notes to Consolidated Financial Statements—(Continued)
The following table summarizes transactions under our ESPP from fiscal year
2010
through
2012
(
shares in thousands
):
|
Shares
|
Average Price Per
Share |
|||||
|
Issued during fiscal year 2012
|
95
|
|
$
|
12.41
|
|
|
|
Issued during fiscal year 2011
|
83
|
|
$
|
11.95
|
|
|
|
Issued during fiscal year 2010
|
81
|
|
$
|
10.75
|
|
|
|
NOTE 11:
|
INCOME TAXES
|
The provision for income taxes is comprised of the following (
in millions
):
|
2012
|
2011
|
2010
|
|||||||||
|
Current taxes:
|
|||||||||||
|
Federal
|
$
|
14.9
|
|
$
|
16.3
|
|
$
|
2.0
|
|
||
|
State
|
2.7
|
|
2.9
|
|
1.6
|
|
|||||
|
Foreign
|
0.3
|
|
0.4
|
|
0.4
|
|
|||||
|
Total current taxes
|
17.9
|
|
19.6
|
|
4.0
|
|
|||||
|
Deferred taxes:
|
|||||||||||
|
Federal
|
2.7
|
|
(1.3
|
)
|
3.9
|
|
|||||
|
State
|
0.4
|
|
0.1
|
|
1.4
|
|
|||||
|
Foreign
|
—
|
|
0.1
|
|
—
|
|
|||||
|
Total deferred taxes
|
3.1
|
|
(1.1
|
)
|
5.3
|
|
|||||
|
Provision for income taxes
|
$
|
21.0
|
|
$
|
18.5
|
|
$
|
9.3
|
|
||
The items accounting for the difference between income taxes computed at the statutory federal income tax rate and income taxes reported in the Consolidated Statements of Operations & Comprehensive Income are as follows (
in millions except percentages
):
|
2012
|
%
|
2011
|
%
|
2010
|
%
|
|||||||||||||||
|
Income tax expense based on statutory rate
|
$
|
19.1
|
|
35.0
|
%
|
$
|
17.2
|
|
35.0
|
%
|
$
|
10.2
|
|
35.0
|
%
|
|||||
|
Increase (decrease) resulting from:
|
||||||||||||||||||||
|
State income taxes, net of federal benefit
|
1.8
|
|
3.3
|
%
|
1.9
|
|
3.9
|
%
|
1.9
|
|
7.0
|
%
|
||||||||
|
Tax credits, net
|
(1.9
|
)
|
(3.5
|
)%
|
(3.5
|
)
|
(7.2
|
)%
|
(4.6
|
)
|
(16.0
|
)%
|
||||||||
|
Nondeductible/nontaxable Items
|
2.3
|
|
4.2
|
%
|
2.9
|
|
5.8
|
%
|
2.3
|
|
8.0
|
%
|
||||||||
|
Other, net
|
(0.3
|
)
|
(0.6
|
)%
|
—
|
|
0.1
|
%
|
(0.5
|
)
|
(2.0
|
)%
|
||||||||
|
Total taxes on income
|
$
|
21.0
|
|
38.4
|
%
|
$
|
18.5
|
|
37.6
|
%
|
$
|
9.3
|
|
32.0
|
%
|
|||||
Our effective tax rate on earnings for
2012
was
38.4%
compared to
37.6%
for the same period in
2011
and
32.0%
in
2010
. The increase in the effective income tax rate is due primarily to federal Work Opportunity Tax Credits which largely expired at the end of 2011. This income tax credit was designed to encourage employers to hire workers from certain targeted groups with higher-than-average unemployment rates. The principal difference between the statutory federal income tax rate of
35.0%
and our
2012
effective income tax rate results from state income taxes, federal tax credits, and certain non-deductible expenses. The lower effective tax rate in
2010
was primarily due to the favorable resolution of certain tax matters.
Page -
48
Notes to Consolidated Financial Statements—(Continued)
The components of deferred tax assets and liabilities were as follows (
in millions
):
|
December 28, 2012
|
December 30, 2011
|
||||||
|
Deferred tax assets:
|
|||||||
|
Allowance for doubtful accounts
|
$
|
2.0
|
|
$
|
2.4
|
|
|
|
Workers’ compensation claims reserve
|
10.1
|
|
9.7
|
|
|||
|
Accounts payable and other accrued expenses
|
2.4
|
|
3.5
|
|
|||
|
Net operating loss carry-forwards
|
0.6
|
|
0.5
|
|
|||
|
Accrued wages and benefits
|
5.9
|
|
4.3
|
|
|||
|
Deferred compensation
|
1.5
|
|
1.1
|
|
|||
|
Other
|
0.5
|
|
0.8
|
|
|||
|
Total
|
23.0
|
|
22.3
|
|
|||
|
Valuation allowance
|
(0.6
|
)
|
(0.5
|
)
|
|||
|
Total deferred tax asset, net of valuation allowance
|
22.4
|
|
21.8
|
|
|||
|
Deferred tax liabilities:
|
|||||||
|
Prepaid expenses, deposits and other current assets
|
(1.6
|
)
|
(1.1
|
)
|
|||
|
Depreciation and amortization
|
(11.9
|
)
|
(8.8
|
)
|
|||
|
Other
|
(0.9
|
)
|
(0.8
|
)
|
|||
|
Total deferred tax liabilities
|
(14.4
|
)
|
(10.7
|
)
|
|||
|
Net deferred tax asset, end of year
|
8.0
|
|
11.1
|
|
|||
|
Net deferred tax asset, current
|
5.4
|
|
6.3
|
|
|||
|
Net deferred tax asset, non-current
|
$
|
2.6
|
|
$
|
4.8
|
|
|
At
December 28, 2012
, Spartan Staffing Puerto Rico, LLC had net operating loss carry-forwards of approximately
$2.8 million
expiring in
2015
through
2022
. A valuation allowance has been established against our carry-forward tax benefits based on our history of past losses.
Deferred taxes related to our foreign currency translation were de minimis for 2012 and 2011 and was
$0.1 million
for 2010.
As of
December 28, 2012
our liability for unrecognized tax benefits was
$1.9 million
, if recognized,
$1.2 million
would impact our effective tax rate. We do not believe the amounts of unrecognized tax benefits will significantly increase or decrease within 12 months of the year ended
December 28, 2012
. This liability is recorded in Other non-current liabilities in our Consolidated Balance Sheets. In general, the tax years
2009
through
2011
remain open to examination by the major taxing jurisdictions where we conduct business.
The following table summarizes the activity related to our unrecognized tax benefits (
in millions
):
|
2012
|
2011
|
2010
|
|||||||||
|
Balance, beginning of fiscal year
|
$
|
1.7
|
|
$
|
1.6
|
|
$
|
1.8
|
|
||
|
Decreases related to settlements
|
—
|
|
—
|
|
(0.5
|
)
|
|||||
|
Increases for tax positions related to the current year
|
0.5
|
|
0.3
|
|
0.2
|
|
|||||
|
Increases for tax positions related to prior years
|
—
|
|
—
|
|
0.1
|
|
|||||
|
Decreases for tax positions related to prior years
|
—
|
|
—
|
|
—
|
|
|||||
|
Reductions due to lapsed statute of limitations
|
(0.3
|
)
|
(0.2
|
)
|
—
|
|
|||||
|
Balance, end of fiscal year
|
$
|
1.9
|
|
$
|
1.7
|
|
$
|
1.6
|
|
||
We recognize interest and penalties related to unrecognized tax benefits within the income tax expense line in the accompanying Consolidated Statements of Operations & Comprehensive Income. Accrued interest and penalties are included within the related tax liability line in the Consolidated Balance Sheets. Related to the unrecognized tax benefits noted above, we accrued
$0.1 million
for interest and de minimis amounts for penalties during
2012
and in total, as of
December 28, 2012
, have recognized a liability for penalties of
$0.2 million
and interest of
$0.7 million
.
Page -
49
Notes to Consolidated Financial Statements—(Continued)
|
NOTE 12.
|
NET INCOME PER SHARE
|
Adjusted net income and diluted common shares were calculated as follows (
in millions, except per share amounts
):
|
|
2012
|
2011
|
2010
|
||||||||
|
Net income
|
$
|
33.6
|
|
$
|
30.8
|
|
$
|
19.8
|
|
||
|
Weighted average number of common shares used in basic net income per common share
|
39.5
|
|
42.0
|
|
43.2
|
|
|||||
|
Dilutive effect of outstanding stock options and non-vested restricted stock
|
0.4
|
|
0.3
|
|
0.3
|
|
|||||
|
Weighted average number of common shares used in diluted net income per common share
|
39.9
|
|
42.3
|
|
43.5
|
|
|||||
|
Net income per common share:
|
|||||||||||
|
Basic
|
$
|
0.85
|
|
$
|
0.73
|
|
$
|
0.46
|
|
||
|
Diluted
|
$
|
0.84
|
|
$
|
0.73
|
|
$
|
0.46
|
|
||
|
Anti-dilutive shares
|
0.7
|
|
1.0
|
|
1.0
|
|
|||||
Basic net income per share is calculated by dividing net income by the weighted average number of common shares outstanding during the period. Diluted net income per share is calculated by dividing net income by the weighted average number of common shares and potential common shares outstanding during the period. Potential common shares include the dilutive effects of outstanding options, non-vested restricted stock and performance share units except where their inclusion would be anti-dilutive.
Anti-dilutive shares include unvested restricted stock, performance share units and in-the-money options for which the sum of the assumed proceeds, including unrecognized compensation expense, exceeds the average stock price during the periods presented. Anti-dilutive shares associated with our stock options relate to those stock options with an exercise price higher than the average market value of our stock during the periods presented.
|
NOTE 13:
|
SUPPLEMENTAL CASH FLOW INFORMATION
|
Supplemental disclosure of cash flow information
(in millions)
:
|
|
2012
|
2011
|
2010
|
||||||||
|
Cash paid during the period for:
|
|||||||||||
|
Interest
|
$
|
0.7
|
|
$
|
0.8
|
|
$
|
1.1
|
|
||
|
Income taxes
|
$
|
21.3
|
|
$
|
16.1
|
|
$
|
6.7
|
|
||
As of
December 28, 2012
and
December 30, 2011
, we had acquired
$1.6 million
and
$1.7 million
, respectively, of property, plant and equipment on account that was not yet paid. During
2012
, we paid
$1.7 million
for capital expenditures acquired on account as of
December 30, 2011
. Amounts for
2010
have not been presented as they were de minimis. These are considered non-cash investing items.
|
NOTE 14:
|
SUBSEQUENT EVENTS
|
On February 4, 2013, we entered into an Asset Purchase Agreement with MDT Personnel, LLC wherein we acquired substantially all of the assets of MDT, a temporary staffing provider with
105
branch locations and more than
15
on-site locations in
25
states. The base purchase price was
$48 million
with
$12 million
paid in cash and
$36 million
in a note payable and assumed debt. An additional amount was paid to reimburse the seller for excess working capital. We are in the process of performing a purchase price allocation for the acquired assets and liabilities.
The American Taxpayer Relief Act of 2012 ("the Act") was signed into law on January 2, 2013. The Act retroactively restored the Work Opportunity Tax Credit. Because a change in tax law is accounted for in the period of enactment, the retroactive effect of the Act on the Company's U.S. federal taxes for 2012, a benefit of approximately
$3.2 million
, will be recognized in 2013. In addition, we expect the Act's extension of these provisions through the end of 2013 will reduce our estimated annual effective tax rate for 2013 as compared to 2012.
Page -
50
Notes to Consolidated Financial Statements—(Continued)
We evaluated other events and transactions occurring after the balance sheet date through the date that the financial statements were issued, and noted no other events that were subject to recognition or disclosure.
Page -
51
SELECTED QUARTERLY FINANCIAL DATA (UNAUDITED)
IN MILLIONS (EXCEPT PER SHARE DATA)
|
First
|
Second
|
Third
|
Fourth
|
||||||||||||
|
2012
|
|||||||||||||||
|
Revenue from services
|
$
|
311.2
|
|
$
|
354.2
|
|
$
|
379.4
|
|
$
|
344.6
|
|
|||
|
Cost of services
|
232.0
|
|
260.7
|
|
274.2
|
|
250.2
|
|
|||||||
|
Gross profit
|
79.2
|
|
93.5
|
|
105.2
|
|
94.4
|
|
|||||||
|
Selling, general and administrative expenses
|
72.1
|
|
71.5
|
|
77.6
|
|
79.2
|
|
|||||||
|
Depreciation and amortization
|
4.8
|
|
4.7
|
|
4.7
|
|
4.7
|
|
|||||||
|
Income from operations
|
2.3
|
|
17.3
|
|
22.9
|
|
10.5
|
|
|||||||
|
Interest expense
|
(0.4
|
)
|
(0.3
|
)
|
(0.3
|
)
|
(0.3
|
)
|
|||||||
|
Interest and other income
|
0.7
|
|
0.7
|
|
0.7
|
|
0.7
|
|
|||||||
|
Interest and other income, net
|
0.3
|
|
0.4
|
|
0.4
|
|
0.4
|
|
|||||||
|
Income before tax expense
|
2.6
|
|
17.7
|
|
23.3
|
|
10.9
|
|
|||||||
|
Income tax expense
|
1.1
|
|
7.4
|
|
9.0
|
|
3.5
|
|
|||||||
|
Net income
|
$
|
1.5
|
|
$
|
10.3
|
|
$
|
14.3
|
|
$
|
7.4
|
|
|||
|
Net income per common share:
|
|||||||||||||||
|
Basic
|
$
|
0.04
|
|
$
|
0.26
|
|
$
|
0.36
|
|
$
|
0.19
|
|
|||
|
Diluted
|
$
|
0.04
|
|
$
|
0.26
|
|
$
|
0.36
|
|
$
|
0.19
|
|
|||
|
2011
|
|||||||||||||||
|
Revenue from services
|
$
|
274.3
|
|
$
|
320.2
|
|
$
|
371.4
|
|
$
|
350.2
|
|
|||
|
Cost of services
|
204.3
|
|
234.9
|
|
271.6
|
|
258.3
|
|
|||||||
|
Gross profit
|
70.0
|
|
85.3
|
|
99.8
|
|
91.9
|
|
|||||||
|
Selling, general and administrative expenses
|
65.1
|
|
67.7
|
|
73.2
|
|
76.8
|
|
|||||||
|
Depreciation and amortization
|
3.9
|
|
3.8
|
|
4.2
|
|
4.4
|
|
|||||||
|
Income from operations
|
1.0
|
|
13.8
|
|
22.4
|
|
10.7
|
|
|||||||
|
Interest expense
|
(0.3
|
)
|
(0.4
|
)
|
(0.4
|
)
|
(0.1
|
)
|
|||||||
|
Interest and other income
|
0.6
|
|
0.6
|
|
0.7
|
|
0.8
|
|
|||||||
|
Interest and other income, net
|
0.3
|
|
0.2
|
|
0.3
|
|
0.7
|
|
|||||||
|
Income before tax expense
|
1.3
|
|
14.0
|
|
22.7
|
|
11.4
|
|
|||||||
|
Income tax expense
|
0.5
|
|
5.4
|
|
8.8
|
|
3.8
|
|
|||||||
|
Net income
|
$
|
0.8
|
|
$
|
8.6
|
|
$
|
13.9
|
|
$
|
7.6
|
|
|||
|
Net income per common share:
|
|||||||||||||||
|
Basic
|
$
|
0.02
|
|
$
|
0.20
|
|
$
|
0.33
|
|
$
|
0.19
|
|
|||
|
Diluted
|
$
|
0.02
|
|
$
|
0.20
|
|
$
|
0.33
|
|
$
|
0.19
|
|
|||
Page -
52
|
Item 9.
|
CHANGES IN AND DISAGREEMENTS WITH ACCOUNTANTS ON ACCOUNTING AND FINANCIAL DISCLOSURE
|
None.
|
Item 9A.
|
CONTROLS AND PROCEDURES
|
Conclusion Regarding the Effectiveness of Disclosure Controls and Procedures.
Under the supervision and with the participation of our management, including the Chief Executive Officer and Chief Financial Officer of the company, we have evaluated the effectiveness of our disclosure controls and procedures as required by Exchange Act Rule 13a-15(e) as of the end of the period covered by this report. Based on that evaluation, the Chief Executive Officer and Chief Financial Officer have concluded that these disclosure controls and procedures are effective.
Management’s Annual Report on Internal Control Over Financial Reporting
. Our management is responsible for establishing and maintaining adequate internal control over financial reporting for the company. Internal control over financial reporting is a process to provide reasonable assurance regarding the reliability of our financial reporting for external purposes in accordance with accounting principles generally accepted in the United States of America. Internal control over financial reporting includes maintaining records that in reasonable detail accurately and fairly reflect our transactions; providing reasonable assurance that transactions are recorded as necessary for preparation of our financial statements; providing reasonable assurance that receipts and expenditures of company assets are made in accordance with management authorization; and providing reasonable assurance that unauthorized acquisition, use, or disposition of company assets that could have a material effect on our financial statements would be prevented or detected on a timely basis. Because of its inherent limitations, internal control over financial reporting may not prevent or detect misstatements.
Management conducted an evaluation of the effectiveness of our internal control over financial reporting based on the framework in
Internal Control – Integrated Framework
issued by the Committee of Sponsoring Organizations of the Treadway Commission. Based on this evaluation, management concluded that the Company’s internal control over financial reporting was effective as of
December 28, 2012
. The effectiveness of our internal control over financial reporting as of
December 28, 2012
has been audited by Deloitte & Touche LLP, an independent registered public accounting firm, as stated in their report, which is included herein.
Page -
53
REPORT OF INDEPENDENT REGISTERED PUBLIC ACCOUNTING FIRM
To the Board of Directors and Shareholders of TrueBlue, Inc.
Tacoma, Washington
We have audited the internal control over financial reporting of TrueBlue, Inc. and subsidiaries (the “Company”) as of December 28, 2012, based on criteria established in
Internal Control - Integrated Framework
issued by the Committee of Sponsoring Organizations of the Treadway Commission. The Company's management is responsible for maintaining effective internal control over financial reporting and for its assessment of the effectiveness of internal control over financial reporting, included in the accompanying Management's Annual Report on Internal Control over Financial Reporting. Our responsibility is to express an opinion on the Company's internal control over financial reporting based on our audit.
We conducted our audit in accordance with the standards of the Public Company Accounting Oversight Board (United States). Those standards require that we plan and perform the audit to obtain reasonable assurance about whether effective internal control over financial reporting was maintained in all material respects. Our audit included obtaining an understanding of internal control over financial reporting, assessing the risk that a material weakness exists, testing and evaluating the design and operating effectiveness of internal control based on the assessed risk, and performing such other procedures as we considered necessary in the circumstances. We believe that our audit provides a reasonable basis for our opinion.
A company's internal control over financial reporting is a process designed by, or under the supervision of, the company's principal executive and principal financial officers, or persons performing similar functions, and effected by the company's board of directors, management, and other personnel to provide reasonable assurance regarding the reliability of financial reporting and the preparation of financial statements for external purposes in accordance with generally accepted accounting principles. A company's internal control over financial reporting includes those policies and procedures that (1) pertain to the maintenance of records that, in reasonable detail, accurately and fairly reflect the transactions and dispositions of the assets of the company; (2) provide reasonable assurance that transactions are recorded as necessary to permit preparation of financial statements in accordance with generally accepted accounting principles, and that receipts and expenditures of the company are being made only in accordance with authorizations of management and directors of the company; and (3) provide reasonable assurance regarding prevention or timely detection of unauthorized acquisition, use, or disposition of the company's assets that could have a material effect on the financial statements.
Because of the inherent limitations of internal control over financial reporting, including the possibility of collusion or improper management override of controls, material misstatements due to error or fraud may not be prevented or detected on a timely basis. Also, projections of any evaluation of the effectiveness of the internal control over financial reporting to future periods are subject to the risk that the controls may become inadequate because of changes in conditions, or that the degree of compliance with the policies or procedures may deteriorate.
In our opinion, the Company maintained, in all material respects, effective internal control over financial reporting as of December 28, 2012, based on the criteria established in
Internal Control - Integrated Framework
issued by the Committee of Sponsoring Organizations of the Treadway Commission.
We have also audited, in accordance with the standards of the Public Company Accounting Oversight Board (United States), the consolidated financial statements and financial statement schedules as of and for the fiscal year ended December 28, 2012 of the Company and our report dated February 21, 2013 expressed an unqualified opinion on those financial statements and financial statement schedules.
/s/ Deloitte & Touche LLP
Seattle, Washington
February 21, 2013
Page -
54
|
Item 9B.
|
OTHER INFORMATION
|
None.
Page -
55
|
Item 10.
|
DIRECTORS, EXECUTIVE OFFICERS AND CORPORATE GOVERNANCE
|
Information regarding our directors and nominees for directorship is presented under the heading “Election of Directors” in our definitive proxy statement for use in connection with the
2013
Annual Meeting of Shareholders (the “Proxy Statement”) to be filed within 120 days after our fiscal year ended
December 28, 2012
, and is incorporated herein by this reference thereto. Information concerning our executive officers is set forth under the heading “Executive Officers” in our Proxy Statement, and is incorporated herein by reference thereto. Information regarding compliance with Section 16(a) of the Exchange Act, our code of business conduct and ethics and certain information related to the Company’s Audit Committee and Governance Committee is set forth under the heading “Corporate Governance” in our Proxy Statement, and is incorporated herein by reference thereto.
|
Item 11.
|
EXECUTIVE COMPENSATION
|
Information regarding the compensation of our directors and executive officers and certain information related to the Company’s Compensation Committee is set forth under the headings “Executive Compensation,” “Director Compensation,” “Compensation Discussion and Analysis,” “Compensation Committee Report” and “Compensation Committee Interlocks and Insider Participation” in our Proxy Statement, and is incorporated herein by this reference thereto.
|
Item 12.
|
SECURITY OWNERSHIP OF CERTAIN BENEFICIAL OWNERS AND MANAGEMENT AND RELATED STOCKHOLDERS
|
Information with respect to security ownership of certain beneficial owners and management is set forth under the headings “Security Ownership of Certain Beneficial Owners and Management” and “Equity Compensation Plan Information” in our Proxy Statement, and is incorporated herein by this reference thereto.
|
Item 13.
|
CERTAIN RELATIONSHIPS AND RELATED TRANSACTIONS, AND DIRECTOR INDEPENDENCE
|
Information regarding certain relationships and related transactions and director independence is presented under the heading “Corporate Governance” in our Proxy Statement, and is incorporated herein by this reference thereto.
|
Item 14.
|
PRINCIPAL ACCOUNTANT FEES AND SERVICE
|
Information concerning principal accounting fees and services is presented under the heading “Fees Paid to Independent Public Accountant for Fiscal Years
2012
and
2011
” in our Proxy Statement, and is incorporated herein by this reference thereto.
Page -
56
|
Item 15.
|
EXHIBITS, FINANCIAL STATEMENT SCHEDULES
|
|
a)
|
Exhibits and Financial Statement Schedules
|
|
1.
|
Financial Statements can be found under Item 8 of Part II of this Form 10-K.
|
|
2.
|
Financial Statement Schedules can be found on Page 59 of this Form 10-K.
|
|
3.
|
The Exhibit Index is found on Page 60 of this Form 10-K.
|
Page -
57
SIGNATURES
Pursuant to the requirements of Section 13 or 15(d) of the Securities Exchange Act of 1934, the registrant has duly caused this report to be signed on its behalf by the undersigned, thereunto duly authorized.
|
|
TrueBlue, Inc.
|
||||
|
|
/s/ Steven C. Cooper
|
2/21/2013
|
|
||
|
|
Signature
|
Date
|
|
||
|
|
By: Steven C. Cooper, Director, Chief Executive
Officer and President
|
||||
|
|
/s/ Derrek L. Gafford
|
2/21/2013
|
|
||
|
|
Signature
|
Date
|
|
||
|
|
By: Derrek L. Gafford, Chief Financial Officer and
Executive Vice President
|
||||
|
|
/s/ Norman H. Frey
|
2/21/2013
|
|
||
|
|
Signature
|
Date
|
|
||
|
|
By: Norman H. Frey, Chief Accounting Officer and
Corporate Controller
|
||||
Pursuant to the requirements of the Securities Exchange Act of 1934, this report has been signed by the following persons on behalf of the registrant and in the capacities and on the dates indicated.
|
/s/ Steven C. Cooper
|
|
2/21/2013
|
|
|
/s/ Joseph P. Sambataro, Jr.
|
|
2/21/2013
|
|
||
|
Signature
|
|
Date
|
|
|
Signature
|
|
Date
|
|
||
|
Steven C. Cooper, Director, Chief Executive Officer and President
|
|
|
Joseph P. Sambataro, Jr., Chairman of the Board
|
|||||||
|
/s/ Craig Tall
|
|
2/21/2013
|
|
|
/s/ Jeffrey B. Sakaguchi
|
|
2/21/2013
|
|
||
|
Signature
|
|
Date
|
|
|
Signature
|
|
Date
|
|
||
|
Craig Tall, Director
|
|
|
|
Jeffrey B. Sakaguchi, Director
|
|
|
||||
|
/s/ Thomas E. McChesney
|
|
2/21/2013
|
|
|
/s/ William W. Steele
|
|
2/21/2013
|
|
||
|
Signature
|
|
Date
|
|
|
Signature
|
|
Date
|
|
||
|
Thomas E. McChesney, Director
|
|
|
|
William W. Steele, Director
|
|
|
||||
|
/s/ Gates McKibbin
|
|
2/21/2013
|
|
|
/s/ Bonnie W. Soodik
|
|
2/21/2013
|
|
||
|
Signature
|
|
Date
|
|
|
Signature
|
|
Date
|
|
||
|
Gates McKibbin, Director
|
|
|
|
Bonnie W. Soodik, Director
|
|
|
||||
Page -
58
FINANCIAL STATEMENT SCHEDULES
Schedule II, Valuation and Qualifying Accounts
(in millions
)
Allowance for doubtful accounts activity was as follows:
|
2012
|
2011
|
2010
|
|||||||||
|
Balance, beginning of the year
|
$
|
5.8
|
|
$
|
6.4
|
|
$
|
6.6
|
|
||
|
Charged to expense
|
7.0
|
|
6.6
|
|
8.2
|
|
|||||
|
Write-offs
|
(7.8
|
)
|
(7.2
|
)
|
(8.4
|
)
|
|||||
|
Balance, end of year
|
$
|
5.0
|
|
$
|
5.8
|
|
$
|
6.4
|
|
||
Insurance receivable valuation allowance activity was as follows:
|
2012
|
2011
|
2010
|
|||||||||
|
Balance, beginning of the year
|
$
|
7.3
|
|
$
|
7.6
|
|
$
|
6.8
|
|
||
|
Charged to expense
|
(1.7
|
)
|
(0.3
|
)
|
0.8
|
|
|||||
|
Balance, end of year
|
$
|
5.6
|
|
$
|
7.3
|
|
$
|
7.6
|
|
||
Income tax valuation allowance additions (reductions) were as follows:
|
2012
|
2011
|
2010
|
|||||||||
|
Balance, beginning of the year
|
$
|
0.5
|
|
$
|
0.7
|
|
$
|
0.6
|
|
||
|
Charged to expense
|
0.1
|
|
(0.2
|
)
|
0.1
|
|
|||||
|
Balance, end of year
|
$
|
0.6
|
|
$
|
0.5
|
|
$
|
0.7
|
|
||
Page -
59
INDEX TO EXHIBITS
|
|
|
|
Incorporated by Reference
|
||||
|
Exhibit
Number
|
|
Exhibit Description
|
Form
|
|
File No.
|
|
Date of First Filing
|
|
3.1
|
|
Amended and Restated Articles of Incorporation
|
8-K
|
|
001-14543
|
|
6/16/2009
|
|
3.2
|
|
Amended and Restated Company Bylaws
|
8-K
|
|
001-14543
|
|
9/17/2008
|
|
10.1
|
|
1996 Employee Stock Option and Incentive Plan
|
DEF 14A
|
|
000-23828
|
|
7/23/1996
|
|
10.2
|
|
2000 Stock Option Plan (Last Amended January 14, 2002)
|
10-K
|
|
001-14543
|
|
3/2/2004
|
|
10.3
|
|
Assumption and Novation Agreement among TrueBlue, Inc. and Lumbermen's Mutual Casualty Company, American Motorist Insurance Company, American Protection Insurance Company and American Manufacturers Mutual Insurance Company and National Union Fire Insurance Company of Pittsburgh, PA, dated December 29, 2004
|
10-K
|
|
001-14543
|
|
3/11/2005
|
|
10.4
|
|
Indemnification Agreement between TrueBlue, Inc. and National Union Fire Insurance Company of Pittsburgh, PA dated December 29, 2004
|
10-K
|
|
001-14543
|
|
3/11/2005
|
|
10.5
|
|
2005 Long Term Equity Incentive Plan
|
8-K
|
|
001-14543
|
|
5/24/2005
|
|
10.6
|
|
Executive Employment Agreement between TrueBlue, Inc. and James E. Defebaugh, dated August 3, 2005
|
8-K
|
|
001-14543
|
|
8/9/2005
|
|
10.7
|
|
First Amendment to the Executive Employment Agreement between TrueBlue, Inc. and James E. Defebaugh, dated December 31, 2006
|
10-Q
|
|
001-14543
|
|
5/4/2007
|
|
10.8
|
|
Executive Employment Agreement and First Amendment to the Executive Employment Agreement between TrueBlue, Inc. and Noel Wheeler, dated December 31, 2006
|
10-Q
|
|
001-14543
|
|
5/4/2007
|
|
10.9
|
|
Executive Employment Agreement between TrueBlue, Inc. and Derrek Gafford, dated December 31, 2006
|
10-Q
|
|
001-14543
|
|
5/4/2007
|
|
10.10
|
|
Executive Employment Agreement between TrueBlue, Inc. and Wayne Larkin, dated December 31, 2006
|
10-Q
|
|
001-14543
|
|
5/4/2007
|
|
10.11
|
|
Form Executive Non-Competition Agreement between TrueBlue, Inc. and Steven Cooper, Jim Defebaugh, Derrek Gafford, Wayne Larkin, and Noel Wheeler
|
10-Q
|
|
001-14543
|
|
5/4/2007
|
|
10.12
|
|
Form Executive Indemnification Agreement between TrueBlue, Inc. and Steven Cooper, Jim Defebaugh, Derrek Gafford, Wayne Larkin, and Noel Wheeler
|
10-Q
|
|
001-14543
|
|
5/4/2007
|
|
10.13
|
|
Form Executive Change in Control Agreement between TrueBlue, Inc. and Steven Cooper, Jim Defebaugh, Derrek Gafford, Wayne Larkin, and Noel Wheeler
|
10-Q
|
|
001-14543
|
|
5/4/2007
|
Page -
60
|
|
|
|
Incorporated by Reference
|
||||
|
Exhibit
Number
|
|
Exhibit Description
|
Form
|
|
File No.
|
|
Date of First Filing
|
|
10.14
|
|
Amended and Restated Executive Employment Agreement between TrueBlue, Inc. and Steven C. Cooper, dated November 16, 2009
|
8-K
|
|
001-14543
|
|
11/19/2009
|
|
10.15
|
|
Amended and Restated Non-Competition Agreement between TrueBlue, Inc. and Steven Cooper, dated November 16, 2009
|
8-K
|
|
001-14543
|
|
11/19/2009
|
|
10.16
|
|
Equity Retainer And Deferred Compensation Plan For Non- Employee Directors, effective January 1, 2010
|
S-8
|
|
333-164614
|
|
2/1/2010
|
|
10.17
|
|
2010 Employee Stock Purchase Plan
|
S-8
|
|
333-167770
|
|
6/25/2010
|
|
10.18
|
Amended and Restated 2005 Long-Term Equity Incentive Plan
|
S-8
|
333-167770
|
6/25/2010
|
|||
|
10.19
|
|
Executive Employment Agreement between TrueBlue, Inc. and Kimberly Cannon, dated November 8, 2010
|
10-K
|
|
001-14543
|
|
2/2/2012
|
|
10.20
|
|
Form Executive Non-Compete Agreement, Form Executive Indemnification Agreement, and Form Executive Change in Control Agreement between TrueBlue, Inc. and Kimberly Cannon
|
10-Q
|
|
001-14543
|
|
5/4/2007
|
|
10.21
|
|
Amended and Restated Credit Agreement between TrueBlue, Inc. and Bank of America and Wells Fargo Capital Finance, dated September 30, 2011
|
8-K
|
|
001-14543
|
|
10/4/2011
|
|
10.22
|
|
TrueBlue, Inc. Nonqualified Deferred Compensation Plan
|
10-K
|
|
001-14543
|
|
2/22/2012
|
|
10.23*
|
|
Executive Employment Agreement between TrueBlue, Inc. and William Grubbs, dated October 15, 2012
|
—
|
|
—
|
|
—
|
|
10.24
|
|
Form Executive Non-Compete Agreement, Form Executive Indemnification Agreement, and Form Executive Change in Control Agreement between TrueBlue, Inc. and William Grubbs
|
10-Q
|
|
001-14543
|
|
5/4/2007
|
|
10.25*
|
|
Asset Purchase Agreement among MDT Personnel, LLC, MDT Personnel Contracts, LLC, MDT Staffing, LLC, Disaster Recovery Support, LLC, Michael D. Traina, TrueBlue, Inc., and Labor Ready Holdings, Inc. dated as of February 4, 2013
|
—
|
|
—
|
|
—
|
|
10.26*
|
|
Term Loan Agreement by and among TrueBlue, Inc., The Lenders That Signatories hereto, and Synovus Bank as of February 4, 2013
|
—
|
|
—
|
|
—
|
|
21*
|
|
Subsidiaries of TrueBlue, Inc.
|
—
|
|
—
|
|
—
|
|
23.1*
|
|
Consent of Deloitte & Touche LLP - Independent Registered Public Accounting Firm
|
—
|
|
—
|
|
—
|
Page -
61
|
|
|
|
Incorporated by Reference
|
||||
|
Exhibit
Number
|
|
Exhibit Description
|
Form
|
|
File No.
|
|
Date of First Filing
|
|
31.1*
|
Certification of Steven C. Cooper, Chief Executive Officer of TrueBlue, Inc., Pursuant to Rule 13a-14(a), as Adopted Pursuant to Section 302 of the Sarbanes-Oxley Act of 2002
|
—
|
—
|
—
|
|||
|
31.2*
|
Certification of Derrek L. Gafford, Chief Financial Officer of TrueBlue, Inc., Pursuant to Rule 13a-14(a), as Adopted Pursuant to Section 302 of the Sarbanes-Oxley Act of 2002
|
—
|
—
|
—
|
|||
|
32.1*
|
Certification of Steven C. Cooper, Chief Executive Officer of TrueBlue, Inc. and Derrek L. Gafford, Chief Financial Officer of TrueBlue, Inc., Pursuant to 18 U.S.C. Section 1350, as Adopted Pursuant to Section 906 of the Sarbanes-Oxley Act of 2002
|
—
|
—
|
—
|
|||
|
101**
|
The following financial information from our Annual Report on Form 10-K for the fiscal year ended December 28, 2012, filed with the SEC on February 21, 2013, formatted in Extensible Business Reporting Language (XBRL): (i) the Consolidated Balance Sheets, (ii) the Consolidated Statements of Operations & Comprehensive Income, (iii) the Consolidated Statements of Cash Flows, and (iv) the Notes to Consolidated Financial Statements.
|
—
|
—
|
—
|
|||
|
*
|
Filed herewith.
|
|
**
|
Furnished herewith.
|
Copies of Exhibits may be obtained upon request directed to Mr. James Defebaugh or Mr. Derrek Gafford, TrueBlue, Inc., PO Box 2910, Tacoma, Washington, 98401 and many are available at the SEC’s website found at www.sec.gov.
Page -
62
TABLE OF CONTENTS
Part IItem 1. BusinessItem 1A. Risk FactorsItem 1B. Unresolved Staff CommentsItem 2. PropertiesItem 3. Legal ProceedingsItem 4. Mine Safety DisclosuresPart IIItem 5. Market For Registrant's Common Equity, Related Stockholder Matters and Issuer Purchases Of Equity SecuritiesItem 6. Selected Financial DataItem 7. Management's Discussion and Analysis Of Financial Condition and Results Of OperationItem 7A. Quantitative and Qualitative Disclosures About Market RiskItem 8. Financial Statements and Supplementary DataNote 1:summary Of Significant Accounting PoliciesNote 2:fair Value MeasurementNote 3:restricted Cash and InvestmentsNote 4:property and Equipment, NetNote 5:goodwill and Intangible AssetsNote 6:workers Compensation Insurance and ReservesNote 7:commitments and ContingenciesNote 8:preferred StockNote 9:common StockNote 10:stock-based CompensationNote 11:income TaxesNote 12. Net Income Per ShareNote 13:supplemental Cash Flow InformationNote 14:subsequent EventsItem 9. Changes in and Disagreements with Accountants on Accounting and Financial DisclosureItem 9A. Controls and ProceduresItem 9B. Other InformationPart IIIItem 10. Directors, Executive Officers and Corporate GovernanceItem 11. Executive CompensationItem 12. Security Ownership Of Certain Beneficial Owners and Management and Related StockholdersItem 13. Certain Relationships and Related Transactions, and Director IndependenceItem 14. Principal Accountant Fees and ServicePart IVItem 15. Exhibits, Financial Statement Schedules