|
|
|
|
|
|
|
|
|
|
|
|
|
|
|
|
|
|
|
|
|
|
|
|
|
|
|
|
|
|
|
|
|
|
|
|
|
|
|
|
|
|
|
|
|
|
|
|
|
|
|
|
|
UNITED STATES
SECURITIES AND EXCHANGE COMMISSION
WASHINGTON, DC 20549
FORM 10-K
| x | Annual Report Pursuant to Section 13 or 15(d) of the Securities Exchange Act of 1934 |
For the Year Ended December 31, 2014
| ¨ | Transition Report Pursuant to Section 13 or 15(d) of the Securities Exchange Act of 1934 |
Commission File Number: 814-00899
TCP CAPITAL CORP.
(Exact Name of Registrant as Specified in Charter)
| Delaware | 56-2594706 | |
|
(State or Other Jurisdiction of Incorporation) |
(IRS Employer Identification No.) |
|
2951 28 th Street, Suite 1000 Santa Monica, California |
90405 | |
| (Address of Principal Executive Offices) | (Zip Code) |
Registrant’s telephone number, including area code (310) 566-1000
Securities registered pursuant to Section 12(b) of the Act:
| Common Stock, par value $0.001 per share | NASDAQ Global Select Market | |
| (Title of each class) | (Name of each exchange where registered) |
Securities registered pursuant to Section 12(g) of the Act: None
Indicate by check mark whether the registrant (1) has filed all reports required to be filed by Section 13 or 15(d) of the Securities Exchange Act of 1934 during the preceding 12 months and (2) has been subject to such filing requirements for the past 90 days: Yes x No ¨
Indicate by check mark whether the registrant has submitted electronically and posted on its corporate Web site, if any, every Interactive Data File required to be submitted and posted pursuant to Rule 405 of Regulation S-T during the preceding 12 months (or for such shorter period that the registrant was required to submit and post such files). Yes ¨ No ¨
Indicate by check mark whether the registrant is a large accelerated filer, an accelerated filer, or a non-accelerated filer. See definition of “accelerated filer and large accelerated filer” in Rule 12b-2 of the Exchange Act. (Check one):
| Large accelerated filer ¨ | Accelerated filer ¨ | |
| Non-accelerated filer x | Smaller Reporting company ¨ |
Indicate by check mark whether the registrant is a shell company (as defined in Rule 12b-2 of the Exchange Act).
Yes ¨ No x
The aggregate market value of the Registrant’s common stock held by non-affiliates of the Registrant at June 30, 2014 (the last business day of the Registrant’s most recently completed second quarter) was $659.2 million based upon the last sales price reported for such date on The NASDAQ Global Select Market. For purposes of this disclosure, shares of common stock beneficially owned by persons who own 5% or more of the outstanding shares of common stock and shares beneficially owned by executive officers and directors of the Registrant and members of their families have been excluded in that such persons may be deemed to be affiliates. This determination of affiliate status is not necessarily conclusive for other purposes. The Registrant has no non-voting common stock.
The number of shares of the Registrant’s common stock, $0.001 par value, outstanding as of March 9, 2015 was 48,710,627.
Documents Incorporated by Reference: Portions of the Registrant’s Proxy Statement relating to the Registrant’s 2014 Annual Meeting of Stockholders to be filed not later than 120 days after the end of the fiscal year covered by this Annual Report on Form 10-K are incorporated by reference into Part III of this Report.
Table of Contents
TCP CAPITAL CORP.
FORM 10-K FOR THE YEAR ENDED DECEMBER 31, 2014
TABLE OF CONTENTS
| Page | |||
| PART I | |||
| Item 1. | Business | 2 | |
| Item 1A. | Risk Factors | 19 | |
| Item 1B. | Unresolved Staff Comments | 41 | |
| Item 2. | Properties | 41 | |
| Item 3. | Legal Proceedings | 41 | |
| Item 4. | Mine Safety Disclosures | 41 | |
| PART II | |||
| Item 5. | Market for Registrant’s Common Equity, Related Stockholder Matters and Issuer Purchases of Equity Securities | 42 | |
| Item 6. | Selected Financial Data | 45 | |
| Item 7. | Management’s Discussion and Analysis of Financial Condition and Results of Operations | 46 | |
| Item 7A. | Quantitative and Qualitative Disclosures about Market Risk | 59 | |
| Item 8. | Financial Statements and Supplementary Data | 60 | |
| Item 9. | Changes in and Disagreements with Accountants on Accounting and Financial Disclosure | 107 | |
| Item 9A. | Controls and Procedures | 107 | |
| Item 9B. | Other Information | 107 | |
| PART III | |||
| Item 10. | Directors, Executive Officers and Corporate Governance | 108 | |
| Item 11. | Executive Compensation | 108 | |
| Item 12. | Security Ownership of Certain Beneficial Owners and Management and Related Stockholder Matters | 108 | |
| Item 13. | Certain Relationships and Related Transactions, and Director Independence | 108 | |
| Item 14. | Principal Accountant Fees and Services | 108 | |
| PART IV | |||
| Item 15. | Exhibits and Financial Statement Schedules | 109 | |
| Signatures | 111 |
| 1 |
In this annual report in Form 10-K, except as otherwise indicated, the terms:
“Holding Company” refers to Special Value Continuation Fund, LLC, a Delaware limited liability company, for the periods prior to the consummation of the Conversion described elsewhere in this report and to TCP Capital Corp. for the periods after the consummation of the Conversion;
“Operating Company” refers to Special Value Continuation Partners, LP, a Delaware limited partnership;
“TCPC Funding” refers to TCPC Funding I LLC, a Delaware limited liability company;
The “Advisor” refers to Tennenbaum Capital Partners, LLC, a Delaware limited liability company and the investment manager; and
“General Partner” and “Administrator” refer to SVOF/MM, LLC, a Delaware limited liability company, the general partner of the Operating Company and an affiliate of the Advisor and administrator of the Holding Company and the Operating Company.
For simplicity, this report uses the terms “Company,” “we,” “us” and “our” to include the Holding Company and, where appropriate in the context, the Operating Company, on a consolidated basis.
The Holding Company is a Delaware corporation formed on April 2, 2012 and is an externally managed, closed-end, non-diversified management investment company. We have elected to be treated as a business development company (“BDC”) under the Investment Company Act of 1940, as amended (the “1940 Act”). Our investment objective is to achieve high total returns through current income and capital appreciation, with an emphasis on principal protection. We seek to achieve our investment objective primarily through investments in debt securities of middle-market companies, which we typically define as those with enterprise values between $100 million and $1.5 billion. While we intend to primarily focus on privately negotiated investments in debt of middle-market companies, we may make investments of all kinds and at all levels of the capital structure, including in equity interests such as preferred or common stock and warrants or options received in connection with our debt investments. Our investment activities will benefit from what we believe are the competitive advantages of our Advisor, including its diverse in-house skills, proprietary deal flow, and consistent and rigorous investment process focused on established, middle-market companies. We expect to generate returns through a combination of the receipt of contractual interest payments on debt investments and origination and similar fees, and, to a lesser extent, equity appreciation through options, warrants, conversion rights or direct equity investments.
Investment operations are conducted in the Operating Company, either directly or in one of the Operating Company’s wholly owned subsidiaries, TCPC Funding I, LLC (“TCPC Funding”) and TCPC SBIC, LP (the “SBIC”). The Holding Company owns 100% of the common limited partner interests of the Operating Company. The Operating Company has also elected to be treated as a BDC under the 1940 Act. The General Partner of the Operating Company is SVOF/MM, LLC (“SVOF/MM”), which also serves as the administrator (the “Administrator”) of the Holding Company and the Operating Company. The managing member of SVOF/MM is Tennenbaum Capital Partners, LLC (the “Advisor”), which serves as the investment manager to both the Holding Company and the Operating Company. Most of the equity interests in the General Partner are owned directly or indirectly by the Advisor and its employees.
The Holding Company has elected to be treated as a regulated investment company (“RIC”) for U.S. federal income tax purposes. As a RIC, we will not be taxed on our income to the extent that we distribute such income each year and satisfy other applicable income tax requirements. The Operating Company has elected to be treated as a partnership for U.S. federal income tax purposes.
On April 2, 2012, the Holding Company converted from a limited liability company to a corporation (the “Conversion”). At the time of the Conversion, all limited liability company interests of Special Value Continuation Fund, LLC (“SVCF”) were exchanged for 15,725,635 shares of common stock in TCP Capital Corp. As a result of the Conversion, the books and records of SVCF became the books and records of the surviving entity.
On April 3, 2012, the Holding Company priced its initial public offering (the “Offering”), selling 5,750,000 shares of its common stock at a public offering price of $14.75 per share.
| 2 |
To qualify as a RIC, we must, among other things, meet certain source-of-income and asset diversification requirements and timely distribute to our stockholders generally at least 90% of our investment company taxable income, as defined by the Internal Revenue Code of 1986, as amended (the “Code”), for each year. Pursuant to this election, we generally will not have to pay corporate level taxes on any income that we distribute to our stockholders provided that we satisfy those requirements.
Tennenbaum Capital Partners, LLC
Our investment activities are managed by the Advisor. The Advisor is a leading investment manager (including specialty lending to middle-market companies). The Advisor is a Delaware limited liability company and is registered as an investment advisor under the Investment Advisers Act of 1940. As of December 31, 2014, the Advisor had in excess of $6.0 billion in committed capital under management, approximately 25% of which consists of the Holding Company’s committed capital, and a team of over 80 people including investment professionals and other personnel that focus on operations, finance, legal, and compliance, accounting and reporting, investor relations, information technology, and administration. The Advisor was founded in 1999 by Michael E. Tennenbaum, Mark K. Holdsworth and Howard M. Levkowitz, and its predecessor entity, formed by the same individuals, commenced operations in 1996. The three founders along with David Adler, David A. Hollander, Michael E. Leitner, Philip M. Tseng, Rajneesh Vig, and Lee Landrum constitute the Advisor’s active partners (the “Advisor Partners”). The Advisor Partners have significant industry experience, including experience investing in middle-market companies. Together, the Advisor Partners have invested approximately $14.8 billion in more than 385 companies since the Advisor’s inception, through multiple business and credit cycles, across all segments of the capital structure and through a broad set of credit-oriented strategies including leveraged loan origination, secondary investments of discounted debt securities, and distressed and control opportunities. We believe the Advisor Partners’ investment perspectives, complementary skills, and collective investment experience provide the Advisor with a strategic and competitive advantage in middle-market investing.
As our investment advisor, the Advisor is responsible for sourcing potential investments, conducting research, analyzing investment opportunities and structuring our investments and monitoring our portfolio companies on an ongoing basis. We believe that the Advisor has a proven long-term track record of positive performance, notwithstanding some periods during which losses were incurred, of sourcing deals, originating loans and successfully investing in middle-market companies and that the relationships of its investment professionals are integral to the Advisor’s success. The Advisor’s investment professionals have long-term working relationships with key sources of investment opportunities and industry expertise, including investment bankers, financial advisors, attorneys, private equity sponsors, other senior lenders, high-yield bond specialists, research analysts, accountants, and senior management teams. Additionally, the Advisor’s structure includes both a board of advisors and a group of Senior Executive Advisors, a team comprised of approximately 17 current and former executives from a variety of industries, which extends the reach of the Advisor’s relationships through a group of seasoned industry leaders and that can enhance our deal sourcing and due diligence activities.
We also benefit from the existing infrastructure and administrative capabilities of an established investment manager. The General Partner, an affiliate of the Advisor, serves as our Administrator and provides us with office space, equipment and office services. The tasks of our Administrator include overseeing our financial records, preparing reports to our stockholders and reports filed with the SEC and generally monitoring the payment of our expenses and the performance of administrative and professional services rendered to us by others.
Since the beginning of 2011, the Advisor executed across its funds approximately $3.3 billion in direct origination leveraged loans primarily to middle-market companies, of which approximately $1.3 billion was for our account. There can be no assurance that similar deal flow or terms will be available in the future for loans in which we may invest.
Operating and Regulatory Tax Structure
The Holding Company elected to be treated for U.S. federal income tax purposes as a RIC under the Code. As a RIC, the Holding Company generally does not have to pay corporate-level federal income taxes on any net ordinary income or capital gain that we distribute to our stockholders as dividends if we meet certain source-of-income, distribution and asset diversification requirements. The Operating Company is not a RIC nor will it seek RIC status and instead is intended to be treated as a partnership for tax purposes. The Holding Company and the Operating Company have elected to be treated as BDCs under the 1940 Act. As a BDC we are required to invest at least 70% of our total assets primarily in securities of private and certain public U.S. companies (other than investment companies and certain financial institutions), cash, cash equivalents, U.S. Government securities, and other high-quality debt investments that mature in one year or less and to comply with other regulatory requirements, including limitations on our use of debt. Because the Holding Company and the Operating Company are each BDCs, their assets, liabilities and results of operations will be consolidated for purposes of this 70% requirement.
| 3 |
Investment Strategy
To achieve our investment objectives, we intend to focus on a subset of the broader investment strategies historically pursued by the Advisor. Our primary investment focus is the ongoing origination of and investments in leveraged loans of performing middle-market companies, building on the Advisor’s established track record of origination and participation in the original syndication of approximately $7.0 billion of leveraged loans to 185 companies since 1999, of which we invested over $1.8 billion in 116 companies. For the purposes of this filing, the term “leveraged loans” refers to senior debt investments that rank ahead of subordinated debt and that generally have the benefit of security interests in the assets of the borrower. Our investments generally range from $10 million to $40 million per company, the size of which may grow over time in proportion with our capital base. We expect to generate current returns through a combination of the receipt of contractual interest payments on debt investments and origination and similar fees, and, to a lesser extent, equity appreciation through options, warrants, conversion rights or direct equity investments. We often receive equity interests such as preferred or common stock and warrants or options in connection with our debt investments. From time to time we may also use other investment strategies, which are not our primary focus, to attempt to enhance the overall return of our portfolio. These investment strategies may include, but are not limited to, the purchase of discounted debt, opportunistic investments, and financial instruments to hedge currency or interest rate risk associated with our portfolio.
Our typical investments are in performing middle-market companies. We believe that middle-market companies are generally less able to secure financing than larger companies and thus offer better return opportunities for those able to conduct the necessary diligence to appropriately evaluate these companies. We focus primarily on U.S. companies where we believe our Advisor’s perspective, complementary skills and investment experience provides us with a competitive advantage and in industries where our Advisor sees an attractive risk reward profile due to macroeconomic trends and existing Advisor industry expertise.
Investment Portfolio
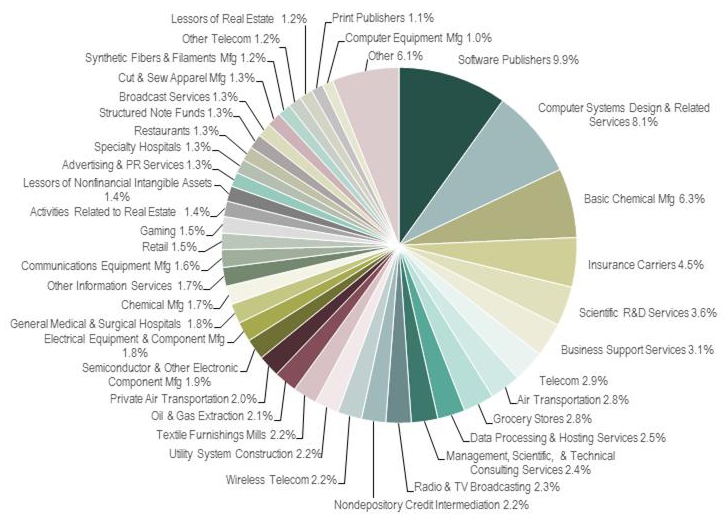
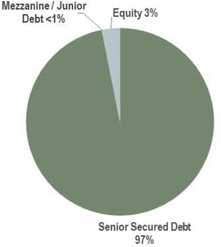
At December 31, 2014, our investment portfolio of $1,146.5 million (at fair value) consisted of 84 portfolio companies and was invested 97% in debt investments, of which 100% was in senior secured debt. In aggregate, our investment portfolio was invested 82% in senior secured loans, 15% in senior secured notes, and 3% in equity investments. Our average portfolio company investment at fair value was approximately $13.6 million. Our largest portfolio company investment by value was approximately $41.8 million and our five largest portfolio company investments by value comprised approximately 14% of our portfolio at December 31, 2014.
The following charts summarize our portfolio mix by industry and type based on the fair value of our investments as of December 31, 2014.
| Investment by Industry | Investment by Asset Type | |
|
|
| 4 |
Investment Process
The Advisor’s investment process is designed to maximize its strategic advantages: a strong brand name as a specialty lender to the middle-market and diverse in-house expertise and skills. The Advisor seeks out opportunities by conducting a rigorous and disciplined investment process that combines the following characteristics:
Deal Sourcing
As a leading middle-market corporate debt investment manager with a 15-year history and in excess of $6.0 billion in committed capital as of December 31, 2014, approximately 25% of which consists of the Holding Company’s committed capital, the Advisor is active in new deal financing opportunities in the middle-market segment. However, we believe that the Advisor’s real deal flow advantage comes from the proprietary network of established relationships of its investment professionals and synergies among its professionals and portfolio companies. Members of the Advisor’s Investment Committee for the Company ( the “Investment Committee”) have long-term relationships with deal sources including investment bankers, restructuring professionals, bankruptcy attorneys, senior lenders, high yield bond specialists, research analysts, accountants, fund management teams, the Advisor’s Advisory Board, Senior Executive Advisors, board members of former clients, former colleagues and other operating professionals to facilitate deal flow. The Investment Committee is currently comprised of five voting members. In total, the Investment Committee consists of approximately 30 members from the Advisor. The number of voting and non-voting members of the Investment Committee is subject to increase or decrease in the sole discretion of the Advisor. All members of the Investment Committee attend investment meetings and are encouraged to participate in discussions. In addition, members of the Investment Committee have relationships with other investors, including insurance companies, bond funds, mezzanine funds, private equity funds, hedge funds and other funds which invest in similar assets. Further, the Advisor regularly calls on both active and recently retired senior executives from the relevant industries to assist with the due diligence of potential investments. Historically, these relationships with retired senior executives have also been a valuable source of transactions and information. The Advisor anticipates that they will continue to provide future opportunities. We believe the Advisor’s strong relationships with its portfolio companies facilitate positive word-of-mouth recommendations to other companies seeking the Advisor’s expertise. The Advisor’s relationships often result in the ability to access investment opportunities earlier than many of its competitors and in some cases on an exclusive basis.
Due Diligence Process
The foundation of the Advisor’s investment process is intensive investment research and analysis by its experienced staff of investment professionals. The Advisor’s senior professionals have worked together for numerous years and we believe that they have a superior level of credit investing knowledge relative to other credit investors. The Advisor supplements its in-house knowledge with industry experts, including CEO/CFO-level executives, with direct management experience in the industries under consideration. The Advisor prefers these industry experts to consultants because of the practical business advice that comes from having managed businesses. The Advisor rigorously and comprehensively analyzes issuers of securities of interest. The process includes a quantitative and qualitative assessment of the issuer’s business, an evaluation of its management, an analysis of the business strategy and industry trends, and an in-depth examination of the company’s capital structure, financial results and projections. The Advisor’s due diligence process includes:
| · | an assessment of the outlook for the industry and general macroeconomic trends; |
| · | discussions with issuer management and other industry executives, including the assessment of management/board strengths and weaknesses; |
| · | an analysis of the fundamental asset values and the enterprise value of the issuer; |
| · | review of the issuer’s key assets, core competencies, competitive advantages, historical and projected financial statements, capitalization, financial flexibility, debt amortization requirements, and tax, environmental, legal and regulatory contingencies; |
| · | review of the issuer’s existing credit documents, including credit agreements, indentures, intercreditor agreements, and security agreements; and |
| · | review of documents governing the issuer, including charter, by-laws, and key contracts. |
| 5 |
Structuring Originations
As an early non-bank participant in the leveraged loan market, we believe that loan origination is a core competency of the Advisor. Supplementing industry deal teams’ experience and competency, the Advisor has six professionals (including investment professionals) with legal experience, two of whom have a quarter-century each of relevant experience in secured credit. Deal teams work with the Advisor’s in-house legal specialists and outside counsel to structure over-collateralized loans with what we believe to be strong creditor protections and contractual controls over borrower operations. In many cases, the Advisor works to obtain contractual governance rights and board seats to protect principal and maximize post-investment returns. Deals usually include original issue discounts, upfront fees and/or equity participations through warrants or direct equity stakes.
Trading and Secondary Market Purchases
A key element in maximizing investment returns in secondary purchases is buying and selling investments at the best available prices. The Advisor has a dedicated trading staff for both the highly specialized traded loan market and for high-yield bonds. Through its trading operations, the Advisor maintains its established relationships with a network of broker-dealers in the debt securities markets. These relationships provide the Advisor with access to the trading dynamics of existing or potential investments and assist it in effectively executing transactions. These relationships may also lead to the early identification of potential investment opportunities for the Company.
Portfolio Management & Monitoring
The Advisor actively monitors the financial performance of its portfolio companies and market developments. This constant monitoring permits the Advisor to update position risk assessments, seek to address potential problems early, refine exit plans, and make follow-on investment decisions quickly. We view active portfolio monitoring as a vital part of our investment process.
We consider board observation and information rights, regular dialogue with company management and sponsors, and detailed internally generated monitoring reports to be critical to our performance. We have developed a monitoring template that seeks to ensure compliance with these standards and that is used as a tool by the Investment Committee to assess investment performance relative to plan.
| · | Deal teams maintain contact with portfolio company management through regularly scheduled and ad hoc conference calls and onsite visits. |
| · | Deal teams review portfolio company progress relative to plan and pre-determined performance benchmarks. |
| · | Adverse or unexpected developments, as well as consequential routine updates, are reported to the Investment Committee and thoroughly discussed at regularly scheduled weekly meetings. If merited, the Investment Committee will hold ad hoc meetings as necessary to address urgent issues. |
| · | Deal teams, with Investment Committee approval, encourage portfolio company managers to catalyze events to monetize holdings for greater return, or where needed, take corrective actions to address shortfalls to plan or benchmarks. |
| · | All existing portfolio holdings are formally reviewed in detail by the entire Investment Committee once per quarter at the Advisor’s quarterly portfolio review. |
Investment Committee and Decision Process
The Advisor’s investment process is organized around the Investment Committee that provides for a centralized, repeatable decision process. The Investment Committee meets weekly and, with respect to each fund the Advisor advises, certain members of the Investment Committee are voting members. The voting members of the Investment Committee for the Company are currently Mark K. Holdsworth, Michael E. Leitner, Howard M. Levkowitz, Philip M. Tseng and Rajneesh Vig. Approval by a simple majority vote of the voting members of the Investment Committee for each respective fund is required for the purchase or sale of any investment, with certain de-minimis exceptions. No voting member has veto power. The Advisor’s investment process is designed to maximize risk-adjusted returns and preserve downside protection.
Regulation
We have filed an election to be regulated as a BDC under the 1940 Act. The 1940 Act contains prohibitions and restrictions relating to transactions between BDCs and their affiliates (including any investment advisors or co-advisors), principal underwriters and affiliates of those affiliates or underwriters and requires that a majority of the directors be persons other than “interested persons,” as that term is defined in the 1940 Act. In addition, the 1940 Act provides that we may not change the nature of our business so as to cease to be, or to withdraw our election as, a BDC unless approved by “a majority of our outstanding voting securities”, which is defined in the 1940 Act as the lesser of a majority of the outstanding voting securities or 67% or more of the securities voting if a quorum of a majority of the outstanding voting securities is present.
| 6 |
We may invest up to 100% of our assets in securities acquired directly from issuers in privately negotiated transactions. With respect to such securities, we may, for the purpose of public resale, be deemed an “underwriter” as that term is defined in the Securities Act of 1933, or the Securities Act. We do not intend to acquire securities issued by any investment company that exceed the limits imposed by the 1940 Act. Under these limits, except for registered money market funds we generally cannot acquire more than 3% of the voting stock of any investment company, invest more than 5% of the value of our total assets in the securities of one investment company or invest more than 10% of the value of our total assets in the securities of more than one investment company. With regard to that portion of our portfolio invested in securities issued by investment companies, it should be noted that such investments might indirectly subject our stockholders to additional expenses as they will indirectly be responsible for the costs and expenses of such companies. None of our investment policies are fundamental and any may be changed without stockholder approval. Pursuant to the 1940 Act, our investment in the Operating Company is not subject to these limits because, among other reasons, (i) the Operating Company is our sole investment and (ii) we “pass-through” our votes on Operating Company matters to our stockholders and vote all of our interests in the Operating Company in the same proportion and manner as our stockholders vote their common stock on such matters.
Qualifying assets
Under the 1940 Act, a BDC may not acquire any asset other than assets of the type listed in section 55(a) of the 1940 Act, which are referred to as qualifying assets, unless, at the time the acquisition is made, qualifying assets represent at least 70% of the Company’s total assets. The principal categories of qualifying assets relevant to our proposed business are the following:
| · | Securities purchased in transactions not involving any public offering from the issuer of such securities, which issuer (subject to certain limited exceptions) is an eligible portfolio company, or from any person who is, or has been during the preceding 13 months, an affiliated person of an eligible portfolio company, or from any other person, subject to such rules as may be prescribed by the SEC. An eligible portfolio company is defined in the 1940 Act as any issuer which: |
| · | is organized under the laws of, and has its principal place of business in, the United States; |
| · | is not an investment company (other than a small business investment company wholly owned by the BDC) or a company that would be an investment company but for certain exclusions under the 1940 Act; and |
| · | satisfies either of the following: |
| · | has a market capitalization of less than $250 million or does not have any class of securities listed on a national securities exchange; or |
| · | is controlled by a BDC or a group of companies including a BDC, the BDC actually exercises a controlling influence over the management or policies of the eligible portfolio company, and, as a result thereof, the BDC has an affiliated person who is a director of the eligible portfolio company. |
| · | Securities of any eligible portfolio company which we control. |
| · | Securities purchased in a private transaction from a U.S. issuer that is not an investment company or from an affiliated person of the issuer, or in transactions incident thereto, if the issuer is in bankruptcy and subject to reorganization or if the issuer, immediately prior to the purchase of its securities was unable to meet its obligations as they came due without material assistance other than conventional lending or financing arrangements. |
| · | Securities of an eligible portfolio company purchased from any person in a private transaction if there is no ready market for such securities and we already own 60% of the outstanding equity of the eligible portfolio company. |
| · | Securities received in exchange for or distributed on or with respect to securities described above, or pursuant to the exercise of warrants or rights relating to such securities. |
| · | Cash, cash equivalents, U.S. Government securities or high-quality debt securities maturing in one year or less from the time of investment. |
| 7 |
Managerial assistance to portfolio companies
A BDC must have been organized and have its principal place of business in the United States and must be operated for the purpose of making investments in the types of securities described in “Qualifying assets” above. However, in order to count portfolio securities as qualifying assets for the purpose of the 70% test, the BDC must either control the issuer of the securities or must offer to make available to the issuer of the securities significant managerial assistance. Where the BDC purchases such securities in conjunction with one or more other persons acting together, the BDC will satisfy this test if one of the other persons in the group makes available such managerial assistance, although reliance on other investors may not be the sole method by which the BDC satisfies the requirement to make available managerial assistance. Making available managerial assistance means, among other things, any arrangement whereby the BDC, through its investment manager, directors, officers or employees, offers to provide, and, if accepted, does so provide, significant guidance and counsel concerning the management, operations or business objectives and policies of a portfolio company.
Small Business Administration Regulations
On April 22, 2014, the SBIC received a license from the Small Business Administration (the “SBA”) to operate as a small business investment company. The SBIC license allows us to borrow funds from the SBA against eligible investments. The Small Business Investment Company regulations currently limit the amount that is available to borrow by any SBIC to $150 million. There is no assurance that we will draw up to the maximum limit available under the Small Business Investment Company program.
Small business investment companies are designed to stimulate the flow of private equity capital to eligible small businesses. Under present Small Business Administration regulations, eligible small businesses include businesses that have a tangible net worth not exceeding $18 million and have average annual fully taxed net income not exceeding $6 million for the two most recent fiscal years. In addition, a small business investment company must devote 25% of its investment activity to “smaller” concerns as defined by the Small Business Administration. A smaller concern is one that has a tangible net worth not exceeding $6 million and has average annual fully taxed net income not exceeding $2 million for the two most recent fiscal years. Small Business Administration regulations also provide alternative size standard criteria to determine eligibility, which depend on the industry in which the business is engaged and are based on such factors as the number of employees and gross sales. According to Small Business Administration regulations, small business investment companies may make long-term loans to small businesses, invest in the equity securities of such businesses and provide them with consulting and advisory services. We plan to provide long-term loans to qualifying small businesses, and in connection therewith, make equity investments.
The SBIC is periodically examined and audited by the Small Business Administration’s staff to determine its compliance with small business investment company regulations.
Taxation of the company
We have elected to be taxed as a RIC under Subchapter M of the Code. To continue to qualify as a RIC, we must, among other things, (a) derive in each taxable year at least 90 percent of our gross income from dividends, interest (including tax-exempt interest), payments with respect to certain securities loans, gains from the sale or other disposition of stock, securities or foreign currencies, other income (including but not limited to gain from options, futures and forward contracts) derived with respect to our business of investing in stock, securities or currencies, or net income derived from an interest in a “qualified publicly traded partnership” (a “QPTP”); and (b) diversify our holdings so that, at the end of each quarter of each taxable year (i) at least 50 percent of the market value of our total assets is represented by cash and cash items, U.S. Government securities, the securities of other RICs and other securities, with other securities limited, in respect of any one issuer, to an amount not greater than five percent of the value of our total assets and not more than 10 percent of the outstanding voting securities of such issuer (subject to the exception described below), and (ii) not more than 25 percent of the market value of our total assets is invested in the securities (other than U.S. Government securities and the securities of other regulated investment companies) (A) of any issuer, (B) of any two or more issuers that we control and that are determined to be engaged in the same business or similar or related trades or businesses, or (C) of one or more QPTPs. The Code provides for certain exceptions to the foregoing diversification requirements. We may generate certain income that might not qualify as good income for purposes of the 90% annual gross income requirement described above. We monitor our transactions to endeavor to prevent our disqualification as a RIC.
If we fail to satisfy the 90% annual gross income requirement or the asset diversification requirements discussed above in any taxable year, we may be eligible for relief provisions if the failures are due to reasonable cause and not willful neglect and if a penalty tax is paid with respect to each failure to satisfy the applicable requirements. Additionally, relief is provided for certain de minimis failures of the asset diversification requirements where we correct the failure within a specified period. If the applicable relief provisions are not available or cannot be met, all of our income would be subject to corporate-level U.S. federal income tax as described below. We cannot provide assurance that we would qualify for any such relief should we fail the 90% annual gross income requirement or the asset diversification requirements discussed above.
| 8 |
As a RIC, in any taxable year with respect to which we timely distribute at least 90% of the sum of our (i) investment company taxable income (which includes, among other items, dividends, interest and the excess of any net short-term capital gain over net long-term capital loss and other taxable income (other than any net capital gain), reduced by deductible expenses) determined without regard to the deduction for dividends and distributions paid and (ii) net tax exempt interest income (which is the excess of our gross tax exempt interest income over certain disallowed deductions) (the “Annual Distribution Requirement”), we (but not our stockholders) generally will not be subject to U.S. federal income tax on investment company taxable income and net capital gain (generally, net long-term capital gain in excess of short-term capital loss) that we distribute to our stockholders. We intend to distribute annually all or substantially all of such income on a timely basis. To the extent that we retain our net capital gain for investment or any investment company taxable income, we will be subject to U.S. federal income tax at the regular corporate income tax rates. We may choose to retain our net capital gains for investment or any investment company taxable income, and pay the associated federal corporate income tax, including the federal excise tax described below.
Certain amounts not distributed during a calendar year are subject to a nondeductible four percent U.S. federal excise tax payable by us. To avoid this tax, we would need to distribute (or be deemed to have distributed) during each calendar year an amount equal to the sum of:
| (1) | at least 98 percent of our ordinary income (not taking into account any capital gains or losses) for the calendar year; |
| (2) | at least 98.2 percent of the amount by which our capital gains exceed our capital losses (adjusted for certain ordinary losses) for a one-year period generally ending on October 31 of the calendar year (unless an election is made by us to use our taxable year); and |
| (3) | certain undistributed amounts from previous years on which we paid no U.S. federal income tax. |
While we intend to distribute any income and capital gains in the manner necessary to minimize imposition of the four percent federal excise tax, sufficient amounts of our taxable income and capital gains may not be distributed to avoid entirely the imposition of the tax. In that event, we will be liable for the tax only on the amount by which we do not meet the foregoing distribution requirement.
If, in any particular taxable year, we do not satisfy the Annual Distribution Requirement or otherwise were to fail to qualify as a RIC (for example, because we fail the 90% annual gross income requirement described above), and relief is not available as discussed above, all of our taxable income (including our net capital gains) will be subject to tax at regular corporate rates without any deduction for distributions to stockholders, and distributions generally will be taxable to the stockholders as ordinary dividends to the extent of our current and accumulated earnings and profits.
We may decide to be taxed as a regular corporation even if we would otherwise qualify as a RIC if we determine that treatment as a corporation for a particular year would be in our best interests.
As a RIC, we are permitted to carry forward a net capital loss realized in a taxable year beginning before December 23, 2010 to offset our capital gain, if any, realized during the eight years following the year of the loss. A capital loss carryforward realized in a taxable year beginning before December 23, 2010 is treated as a short-term capital loss in the year to which it is carried. We are permitted to carry forward a net capital loss realized in taxable years beginning on or after December 23, 2010 to offset capital gain indefinitely. For net capital losses realized in taxable years beginning on or after December 23, 2010, the excess of our net short-term capital loss over our net long-term capital gain is treated as a short-term capital loss arising on the first day of our next taxable year and the excess of our net long-term capital loss over our net short-term capital gain is treated as a long-term capital loss arising on the first day of our next taxable year. If future capital gain is offset by carried forward capital losses, such future capital gain is not subject to fund-level U.S. federal income tax, regardless of whether they are distributed to stockholders. Accordingly, we do not expect to distribute any such offsetting capital gain. A RIC cannot carry back or carry forward any net operating losses.
Investment Structure
Once we determine that a prospective portfolio company is suitable for a direct investment, we work with the management of that company and its other capital providers, including senior and junior lenders, and equity holders, to structure an investment. We negotiate among these parties to agree on how our investment is expected to be structured relative to the other capital in the portfolio company’s capital structure.
| 9 |
Leveraged Loans
We structure our investments primarily as secured leveraged loans. Leveraged loans are generally senior debt instruments that rank ahead of subordinated debt of the portfolio company. Leveraged loans generally have the benefit of security interests on the assets of the portfolio company, which may rank ahead of, or be junior to, other security interests.
High-Yield Securities
The Company’s portfolio currently includes high-yield securities and the Company may invest in high-yield securities in the future. High-yield securities have historically experienced greater default rates than has been the case for investment grade securities and are generally rated below investment grade by one or more nationally recognized statistical rating organizations or will be unrated but of comparable credit quality to obligations rated below investment grade, and have greater credit and liquidity risk than more highly rated obligations. High-yield securities are generally unsecured and may be subordinate to other obligations of the obligor and are often issued in connection with leveraged acquisitions or recapitalizations in which the issuers incur a substantially higher amount of indebtedness than the level at which they had previously operated. The Company’s portfolio also includes mezzanine investments which are generally unsecured and rated below investment grade. Mezzanine investments of the type in which the Company invests in are primarily privately negotiated subordinated debt securities often issued in connection with leveraged transactions, such as management buyouts, acquisitions, re-financings, recapitalizations and later stage growth capital financings, and are generally accompanied by related equity participation features such as options, warrants, preferred and common stock. In some cases, our debt investments may provide for a portion of the interest payable to be paid-in-kind interest. To the extent interest is paid-in-kind, it will be payable through the increase of the principal amount of the obligation by the amount of interest due on the then-outstanding aggregate principal amount of such obligation.
Warrants, Options and Minority Equity
In some cases, we will also receive nominally priced warrants or options to buy a minority equity interest in the portfolio company in connection with a loan. As a result, if a portfolio company appreciates in value, we may achieve additional investment return from this equity interest. We may structure such warrants to include provisions protecting our rights as a minority-interest holder, as well as a “put,” or right to sell such securities back to the issuer, upon the occurrence of specified events. In many cases, we may also seek to obtain registration rights in connection with these equity interests, which may include demand and “piggyback” registration rights.
Distressed Debt
The Company’s portfolio currently includes distressed debt investments and the Company is authorized to continue to invest in the securities and other obligations of distressed and bankrupt issuers, including debt obligations that are in covenant or payment default. As of December 31, 2014, none of the Operating Company’s debt investments were in non-accrual status. The Company does not anticipate distressed debt to be a significant part of its ongoing investment strategy. Such investments generally trade significantly below par and are considered speculative. The repayment of defaulted obligations is subject to significant uncertainties. Defaulted obligations might be repaid only after lengthy workout or bankruptcy proceedings, during which the issuer might not make any interest or other payments. Typically such workout or bankruptcy proceedings result in only partial recovery of cash payments or an exchange of the defaulted obligation for other debt or equity securities of the issuer or its affiliates, which may in turn be illiquid or speculative.
Opportunistic Investments
Opportunistic investments may include, but are not limited to, investments in debt securities of all kinds and at all levels of the capital structure and may include equity securities of public companies that are thinly traded, emerging market debt, structured finance vehicles such as CLO funds and debt of middle-market companies located outside the United States. We do not intend such investments to be our primary focus.
We tailor the terms of each investment to the facts and circumstances of the transaction and the prospective portfolio company, negotiating a structure that protects our rights and manages our risk while creating incentives for the portfolio company to achieve its business plan and improve its operating results. We seek to limit the downside potential of our investments by:
| · | requiring a total return on our investments (including both interest and potential equity appreciation) that we believe will compensate us appropriately for credit risk; |
| · | negotiating covenants in connection with our investments that afford our portfolio companies as much flexibility in managing their businesses as possible, consistent with the preservation of our capital. Such restrictions may include affirmative and negative covenants, default penalties, lien protection, change of control provisions and board rights, including either observation or rights to a seat on the board of directors under some circumstances; and |
| 10 |
| · | selecting investments that we believe have a very low probability of loss. |
We expect to hold most of our investments to maturity or repayment, but we may sell some of our investments earlier if a liquidity event occurs, such as a sale, recapitalization or worsening of the credit quality of the portfolio company.
Code of Ethics
We and the Advisor have each adopted a code of ethics pursuant to Rule 17j-1 under the 1940 Act and Rule 204A-1 under the Investment Advisers Act of 1940 (the “Advisers Act”), respectively, that establishes procedures for personal investments and restricts certain transactions by our personnel. Our codes of ethics generally do not permit investments by our employees in securities that may be purchased or held by us. You may read and copy these codes of ethics at the SEC’s Public Reference Room in Washington, D.C. You may obtain information on the operation of the Public Reference Room by calling the SEC at 1 (800) SEC-0330. In addition, each code of ethics is available on the EDGAR Database on the SEC’s Internet site at http://www.sec.gov. You may also access the codes of ethics by going to our website at http://investors.tcpcapital.com/.
Compliance Policies and Procedures
We and the Advisor have adopted and implemented written policies and procedures reasonably designed to detect and prevent violation of the federal securities laws. We are required to review these compliance policies and procedures annually for their adequacy and the effectiveness of their implementation and to designate a chief compliance officer to be responsible for their administration. Elizabeth Greenwood currently serves as our chief compliance officer.
Proxy Voting Policies and Procedures
We have delegated our proxy voting responsibility to our investment adviser. A summary of the Proxy Voting Policies and Procedures of the Advisor are set forth below. The guidelines are reviewed periodically by the adviser and our non-interested directors, and, accordingly, are subject to change.
The Advisor is registered under the Investment Advisers Act of 1940 and has a fiduciary duty to act solely in the best interests of its clients. As part of this duty, it recognizes that it must vote securities held by its clients in a timely manner free of conflicts of interest. These policies and procedures for voting proxies for investment advisory clients are intended to comply with Section 206 of, and Rule 206(4)-6 under, the Advisers Act.
Our investment adviser votes proxies relating to our portfolio securities in the best interest of our stockholders. The Advisor reviews on a case-by-case basis each proposal submitted for a proxy vote to determine its impact on our investments. Although it generally votes against proposals that may have a negative impact on our investments, it may vote for such a proposal if there exists compelling long-term reasons to do so.
The proxy voting decisions of the Advisor are made by the senior officers who are responsible for monitoring each of our investments. To ensure that our vote is not the product of a conflict of interest, it requires that: (i) anyone involved in the decision making process disclose to the managing member any potential conflict that he or she is aware of and any contact that he or she has had with any interested party regarding a proxy vote; and (ii) employees involved in the decision making process or vote administration are prohibited from revealing how we intend to vote on a proposal in order to reduce any attempted influence from interested parties.
You may obtain information about how we voted proxies by making a written request for proxy voting information to: Tennenbaum Capital Partners, LLC, 2951 28 th Street, Suite 1000, Santa Monica, CA 90405, Attention: Investor Relations.
Privacy Principles
We are committed to maintaining the privacy of our stockholders and to safeguarding their non-public personal information. The following information is provided to help you understand what personal information we collect, how we protect that information and why, in certain cases, we may share information with select other parties.
Generally, we do not receive any non-public personal information relating to our stockholders, although certain non-public personal information of our stockholders may become available to us. We do not disclose any non-public personal information about our stockholders or former stockholders to anyone, except as permitted by law or as is necessary in order to service stockholder accounts (for example, to a transfer agent or third-party administrator).
| 11 |
We restrict access to non-public personal information about our stockholders to employees of the Advisor and its affiliates with a legitimate business need for the information. We maintain physical, electronic and procedural safeguards designed to protect the non-public personal information of our stockholders.
Investment Management Agreements
The Holding Company and the Operating Company have entered into separate but substantially identical investment management agreements with the Advisor, under which the Advisor, subject to the overall supervision of our respective boards of directors, manages the day-to-day operations and provides investment advisory services to the Holding Company and the Operating Company. In addition, pursuant to the Amended and Restated Limited Partnership Agreement, the General Partner directs and executes the day-to-day operational activities of the Operating Company. For providing these services, the Advisor receives a base management fee and, in addition, the Advisor or the General Partner may receive incentive compensation.
The base management fee is currently paid by the Operating Company to the Advisor and the incentive compensation, if any, is paid by the Operating Company to the General Partner or the Advisor. The Holding Company, therefore, indirectly bears these amounts, which are reflected in our consolidated financial statements. If the Operating Company is terminated or for any other reasons incentive compensation is not paid by the Operating Company, such amounts will be paid directly by the Holding Company to the Advisor pursuant to its investment management agreement with the Advisor.
Under the terms of our investment management agreements, the Advisor:
| · | determines the composition of our portfolio, the nature and timing of the changes to our portfolio and the manner of implementing such changes; |
| · | identifies, evaluates and negotiates the structure of the investments we make (including performing due diligence on our prospective portfolio companies); and |
| · | closes, monitors and administers the investments we make, including the exercise of any voting or consent rights. |
The Advisor’s services under the investment management agreements are not exclusive, and it is free to furnish similar services to other entities so long as its services to us are not impaired.
Pursuant to our investment management agreements, we pay the Advisor compensation for investment advisory and management services consisting of base management compensation and a two-part incentive compensation.
Management Fee . The base management fee is calculated at an annual rate of 1.5% of the Holding Company’s total assets (excluding cash and cash equivalents) payable quarterly in arrears. For purposes of calculating the base management fee, “total assets” is determined without deduction for any borrowings or other liabilities. The base management fee is calculated based on the value of our total assets (excluding cash and cash equivalents) at the end of the most recently completed calendar quarter. The base management fee for any partial quarter is appropriately pro-rated.
Incentive Compensation . We also pay incentive compensation to the Advisor or the General Partner. Under the investment management agreements and the Amended and Restated Limited Partnership Agreement, no incentive compensation was incurred until after January 1, 2013.
Beginning January 1, 2013, the incentive compensation equals the sum of (1) 20% of all ordinary income since that date and (2) 20% of all net realized capital gains (net of any net unrealized capital depreciation) since that date, with each component being subject to a total return requirement of 8% of contributed common equity annually. The incentive compensation initially is an equity allocation to the General Partner under the Amended and Restated Limited Partnership Agreement. If the Operating Company is terminated or for any other reasons incentive compensation is not distributed by the Operating Company, it would be paid pursuant to the investment management agreement between the Holding Company and the Advisor.
The incentive compensation has two components, ordinary income and capital gains. Each component is payable or distributable quarterly in arrears (or upon termination of the Advisor as the investment manager or the General Partner as the general partner of the Operating Company, as of the termination date) beginning January 1, 2013 and calculated as follows:
| 12 |
Each of the two components of incentive compensation is separately subject to a total return limitation. Thus, notwithstanding the following provisions, we are not be obligated to pay or distribute any ordinary income incentive compensation or any capital gains incentive compensation if our cumulative total return does not exceed an 8% annual return on daily weighted average contributed common equity. If our cumulative annual total return is above 8%, the total cumulative incentive compensation we pay will not be more than 20% of our cumulative total return, or, if lower, the amount of our cumulative total return that exceeds the 8% annual rate.
Subject to the above limitation, the ordinary income component is the amount, if positive, equal to 20% of the cumulative ordinary income before incentive compensation, less cumulative ordinary income incentive compensation previously paid or distributed.
Subject to the above limitation, the capital gains component is the amount, if positive, equal to 20% of the cumulative realized capital gains (computed net of cumulative realized losses and cumulative net unrealized capital depreciation), less cumulative capital gains incentive compensation previously paid or distributed. For assets held on January 1, 2013, capital gain, loss and depreciation are measured on an asset by asset basis against the value as of December 31, 2012. The capital gains component is paid or distributed in full prior to payment or distribution of the ordinary income component.
For purposes of the foregoing computations and the total return limitation, the following definitions apply:
| · | “cumulative” means amounts for the period commencing January 1, 2013 and ending as of the applicable calculation date . |
| · | “contributed common equity” means the value of net assets attributable to our common stock as of December 31, 2012 plus the proceeds to us of all issuances of common stock less (A) offering costs of any of our securities or leverage facilities, (B) all distributions by us representing a return of capital and (C) the total cost of all repurchases of our common stock by us, in each case after December 31, 2012 and through the end of the preceding calendar quarter in question, in each case as determined on an accrual and consolidated basis. |
| · | “ordinary income before incentive compensation” means our interest income, dividend income and any other income (including any other fees, such as commitment, origination, structuring, diligence, managerial assistance and consulting fees or other fees that we receive from portfolio companies) during the period, (i) minus our operating expenses during the period (including the base management fee, expenses payable under the administration agreement, any interest expense and any dividends paid on any issued and outstanding preferred stock), (ii) plus increases and minus decreases in net assets not treated as components of income, operating expense, gain, loss, appreciation or depreciation and not treated as contributions or distributions in respect of common equity, and (iii) without reduction for any incentive compensation and any organization or offering costs, in each case determined on an accrual and consolidated basis. |
| · | “total return” means the amount equal to the combination of ordinary income before incentive compensation, realized capital gains and losses and unrealized capital appreciation and depreciation of the Company for the period, in each case determined on an accrual and consolidated basis. |
If our total return does not exceed the total return limitation, the limitation will not have the effect of eliminating the possibility of paying such incentive compensation, but rather will postpone any incentive compensation until our cumulative annual total return exceeds the 8% threshold. The nature of the total return limitation may also make it easier for the Advisor to earn incentive compensation in higher interest rate environments or if our net asset value has increased.
Total Return Limitation
(based on cumulative annual total return)
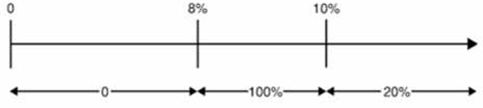
Percentage
of ordinary income and net realized capital gain
separately payable at various levels of total return.
| 13 |
The financial highlights in the notes to our financial statements include a calculation of total return based on the change in the market value of our shares. The financial highlights in the notes to our financial statements also include a calculation of total return based on the change in our net asset value from period to period. The total return limitation for purposes of the incentive compensation calculations is based on the stated elements of return: ordinary income before incentive compensation, realized capital gain and loss and unrealized capital appreciation and depreciation. It differs from the total return based on the market value or net asset value of our shares in that it is a cumulative measurement that is compared to our daily weighted-average contributed common equity rather than a periodic measurement that is compared to our net asset value or market value, and in that it excludes incentive compensation.
Examples of Incentive Compensation Calculation
Example 1: Income Portion of Incentive Compensation:
Assumptions
| · | Total return limitation(1) = 8% |
| · | Management fee(2) = 1.5% |
| · | Other expenses (legal, accounting, custodian, transfer agent, etc.)(3) = 1% |
Alternative 1
Additional Assumptions
| · | cumulative gross ordinary income (including interest, dividends, fees, etc.) = 11.5% |
| · | cumulative ordinary income before incentive compensation (gross ordinary income-(management fee + other expenses)) = 9% |
| · | cumulative annual total return = 7% |
| · | prior ordinary income incentive compensation = 0% |
Cumulative total return does not exceed total return limitation, therefore there is no income incentive compensation.
| (1) | Represents 8.0% annualized total return limitation. |
| (2) | Represents 1.5% annualized management fee, assuming no liabilities. |
| (3) | Excludes organizational and offering costs. |
Alternative 2
Additional Assumptions
| · | cumulative gross ordinary income (including interest, dividends, fees, etc.) = 11% |
| · |
cumulative ordinary income before incentive compensation (gross
ordinary
income–(management fee + other expenses)) = 8.5% |
| · | cumulative annual total return = 9.5% |
| · | prior ordinary income incentive compensation = 0% |
Cumulative ordinary income before incentive compensation is positive and the cumulative total return exceeds the total return limitation, therefore there is income incentive compensation.
Income incentive compensation = ((20% x ordinary income before incentive compensation) but not more than ((100% x (cumulative total return up to 10%–8% total return limitation)) + (20% x cumulative total return above 10%)))
= ((20% x 8.5%) or, if less, ((100% x (9.5%–8%) + (20% x 0%)))
= 1.7% or, if less, 1.5%
= 1.5%
| 14 |
Alternative 3
Additional Assumptions
| · | cumulative gross ordinary income (including interest, dividends, fees, etc.) = 15.5% |
| · | cumulative ordinary income before incentive compensation (gross ordinary income–(management fee + other expenses)) = 13% |
| · | cumulative annual total return = 18% |
| · | prior ordinary income incentive compensation = 1% |
Cumulative ordinary income before incentive compensation is positive and cumulative total return exceeds the total return limitation, therefore there is income incentive compensation.
Income incentive compensation = ((20% x ordinary income before incentive compensation) but not more than ((100% x (cumulative total return up to 10%–8% total return limitation)) + (20% x cumulative total return above 10%))), less income incentive compensation previously paid
= ((20% x 13%) or, if less, ((100% x (10%–8%) + (20% x (18%–10%)))–1%
= (2.6% or, if less, ((2% + (20% x 8%)))–1%
= (2.6% or, if less, (2% + 1.6%))–1%
= (2.6% or, if less, 3.6%)–1%
= 1.6%
Note that due to the priority of capital gains compensation over ordinary income compensation, had the 5%(4) of cumulative unrealized capital gains been realized, the capital gains incentive compensation would have been 1% (i.e. 20% x 5%) and would have reduced ordinary income compensation from 1.6% to 0.6%. Further, if there had been 1.6% or more of prior capital gains compensation, the ordinary income compensation payment would have been zero.
| (4) | 5% of cumulative unrealized capital gains = 18% cumulative annual total return — 13% cumulative ordinary income before incentive compensation |
Example 2: Capital Gains Portion of Incentive Compensation:
Alternative 1:
Assumptions
| · | Year 1: $20 million investment made in Company A (“Investment A’’), and $30 million investment made in Company B (“Investment B”). |
| · | Year 2: Investment A sold for $50 million and fair market value, or FMV, of Investment B determined to be $32 million. Cumulative annual total return of 40%. |
| · | Year 3: FMV of Investment B determined to be $25 million. Cumulative annual total return of 15%. |
| · | Year 4: Investment B sold for $31 million. Cumulative annual total return of 10%. |
The capital gains portion of the incentive compensation would be:
| · | Year 1: None |
| 15 |
| · | Year 2: Capital gains incentive compensation of $6 million ($6 million = $30 million realized capital gains on sale of Investment A multiplied by 20% and total return limitation satisfied) |
| · | Year 3: None; no realized capital gains. |
| · | Year 4: Capital gains incentive compensation of $0.2 million ($31 million cumulative realized capital gains multiplied by 20%, less $6 million of capital gains incentive compensation paid in year 2 and total return limitation satisfied) |
Alternative 2
Assumptions
| · | Year 1: $20 million investment made in Company A (“Investment A’’), $30 million investment made in Company B (“Investment B”) and $25 million investment made in Company C (“Investment C”) |
| · | Year 2: Investment A sold for $50 million, FMV of Investment B determined to be $25 million and FMV of Investment C determined to be $25 million. Cumulative annual total return of 15%. |
| · | Year 3: FMV of Investment B determined to be $27 million and Investment C sold for $30 million. Cumulative annual total return of 7%. |
| · | Year 4: FMV of Investment B determined to be $35 million. Cumulative annual total return of 20%. |
| · | Year 5: Investment B sold for $40 million. Cumulative annual total return of 20%. |
The capital gains portion of the incentive compensation would be:
| · | Year 1: None |
| · | Year 2: Capital gains incentive compensation of $5 million; 20% multiplied by $25 million ($30 million realized capital gains on Investment A less $5 million unrealized capital depreciation on Investment B, and the total return limitation is satisfied) |
| · | Year 3: None as the total return limitation is not satisfied |
| · | Year 4: Capital gains incentive compensation of $2 million ($35 million cumulative realized capital gains (including $5 million of realized capital gains from year 3 at a time when the total return limitation was not satisfied and no cumulative unrealized capital depreciation) multiplied by 20%, less $5 million capital gains incentive compensation paid in year 2, and the total return limitation is satisfied). |
| · | Year 5: Capital gains incentive compensation of $2 million ($45 million cumulative realized capital gains multiplied by 20%, less $7 million in capital gains incentive compensation paid in years 2 and 4, and the total return limitation is satisfied). |
Payment of our expenses
All investment professionals and staff of the Advisor, when and to the extent engaged in providing investment advisory and management services, and the compensation and routine overhead expenses of such personnel allocable to such services (including health insurance, 401(k) plan benefits, payroll taxes and other compensation related matters), are provided and paid for by the Advisor. We bear all other costs and expenses of our operations and transactions, including those relating to:
| · | our organization; |
| · | calculating our net asset value and net asset value per share (including the cost and expenses of any independent valuation firm); |
| · | expenses, including travel expense, incurred by the Advisor or payable to third parties in performing due diligence on prospective portfolio companies, monitoring our investments and, if necessary, enforcing our rights; |
| · | interest payable on debt, if any, incurred to finance our investments; |
| 16 |
| · | the costs of all future offerings of common stock and other securities, if any; |
| · | the base management fee and any incentive management fee; |
| · | distributions on our shares; |
| · | administration fees payable under our administration agreement; |
| · | transfer agent and custody fees and expenses; |
| · | the allocated costs incurred by the General Partner as our Administrator in providing managerial assistance to those portfolio companies that request it; |
| · | amounts payable to third parties relating to, or associated with, evaluating, making and disposing of investments; |
| · | brokerage fees and commissions; |
| · | registration fees; |
| · | listing fees; |
| · | taxes; |
| · | director fees and expenses; |
| · | costs of preparing and filing reports or other documents with the SEC; |
| · | the costs of any reports, proxy statements or other notices to our stockholders, including printing costs; |
| · | costs of holding stockholder meetings; |
| · | our fidelity bond; |
| · | directors and officers/errors and omissions liability insurance, and any other insurance premiums; |
| · | litigation, indemnification and other non-recurring or extraordinary expenses; |
| · | direct costs and expenses of administration and operation, including audit and legal costs; |
| · | dues, fees and charges of any trade association of which we are a member; and |
| · | all other expenses reasonably incurred by us or the Administrator in connection with administering our business, such as the allocable portion of overhead under our administration agreement, including rent and other allocable portions of the cost of certain of our officers and their respective staffs. |
From time to time, the Advisor may pay amounts owed by us to third party providers of goods or services. We will subsequently reimburse the Advisor for such amounts paid on our behalf.
Limitation of liability and indemnification
The investment management agreements provide that the Advisor and its officers, directors, employees and affiliates are not liable to us or any of our stockholders for any act or omission by it or its employees in the supervision or management of our investment activities or for any loss sustained by us or our stockholders, except that the foregoing exculpation does not extend to any act or omission constituting willful misfeasance, bad faith, gross negligence or reckless disregard of its obligations under the investment management agreement. The investment management agreements also provide for indemnification by us of the Advisor’s members, directors, officers, employees, agents and control persons for liabilities incurred by it in connection with their services to us, subject to the same limitations and to certain conditions.
| 17 |
Board and shareholder approval of the investment management agreements
Our board of directors held an in-person meeting on May 7, 2014, in order to consider and reapprove our investment management agreements. In its consideration of the investment management agreement, the board of directors focused on information it had received relating to, among other things: (a) the nature, quality and extent of the advisory and other services to be provided to us by the Advisor; (b) comparative data with respect to advisory fees or similar expenses paid by other business development companies with similar investment objectives; (c) our financial performance, operating expenses and expense ratio compared to business development companies with similar investment objectives; (d) any existing and potential sources of indirect income to the Advisor from its relationships with us and the profitability of those relationships; (e) information about the services performed and the personnel performing such services under the investment management agreements; (f) the organizational capability and financial condition of the Advisor and its affiliates; (g) the Advisor’s practices regarding the selection and compensation of brokers that execute our portfolio transactions and the brokers’ provision of brokerage and research services to our investment advisor; and (h) the possibility of obtaining similar services from other third party service providers or through an internally managed structure.
Based on the information reviewed and the discussions, the board of directors, including a majority of the non-interested directors, concluded that the investment management fee rates are reasonable in relation to the services to be provided.
Duration and termination
The investment management agreements will remain in effect from year to year if approved annually by our board of directors or by the affirmative vote of the holders of a majority of our outstanding voting securities, including, in either case, approval by a majority of our directors who are not interested persons. The investment management agreements will automatically terminate in the event of its assignment. The investment management agreements may be terminated by either party without penalty upon not less than 60 days written notice to the other. Any termination by us must be authorized either by our board of directors or by vote of our stockholders. See “Risk Factors — Risks related to our business — We are dependent upon senior management personnel of the Advisor for our future success, and if the Advisor is unable to retain qualified personnel or if the Advisor loses any member of its senior management team, our ability to achieve our investment objective could be significantly harmed.”
Administration Agreement
We have entered into administration agreements with the Administrator, which we refer to as the administration agreement, under which the Administrator provides administrative services to us. The Administrator provides services including, but not limited to, the arrangement for the services of, and the overseeing of, custodians, depositories, transfer agents, dividend disbursing agents, other stockholder servicing agents, accountants, attorneys, underwriters, brokers and dealers, corporate fiduciaries, insurers, banks, stockholders and such other persons in any such other capacity deemed to be necessary or desirable. The Administrator also makes reports to the board of its performance of obligations under the administration agreement and furnishes advice and recommendations with respect to such other aspects of our business and affairs that we determine to be desirable. The Administrator is responsible for our financial and other records that are required to be maintained and prepares all reports and other materials required by any agreement or to be filed with the Securities and Exchange Commission or any other regulatory authority, including reports on Forms 8-K, 10-Q and periodic reports to stockholders, determining the amounts available for distribution as dividends and distributions to be paid by us to our stockholders, reviewing and implementing any share purchase programs authorized by the board, maintaining or overseeing the maintenance of our books and records as required under the 1940 Act, and maintaining (or overseeing maintenance by other persons) such other books and records required by law or for our proper operation. For providing these services, facilities and personnel, we reimburse the Administrator for expenses incurred by the Administrator in performing its obligations under the administration agreement, including our allocable portion of overhead under the administration agreement and the cost of certain of our officers and the Administrator’s administrative staff and providing, at our request and on our behalf, significant managerial assistance to our portfolio companies to which we are required to provide such assistance. From time to time, the Administrator may pay amounts owed by us to third-party providers of goods or services. We subsequently reimburse the Administrator for such amounts paid on our behalf.
Leverage
Our leverage program is comprised of $116 million in available debt under a senior secured revolving credit facility issued by the Operating Company (the “Operating Company Facility”), $250 million in available debt under a senior secured revolving credit facility issued by TCPC Funding, (the “TCPC Funding Facility,” and, together with the Operating Company Facility, the “Revolving Facilities”), $108 million in convertible senior unsecured notes issued by the Holding Company (the “Convertible Notes”), $75 million in committed leverage from the SBA (the “SBA Program”), and $134 million of outstanding preferred limited partner interests in the Operating Company (the “Preferred Interests,” and, together with the Revolving Facilities, the Convertible Notes, and the SBA Program the “Leverage Program”).
The Operating Company Facility matures on July 31, 2016 and bore interest at an annual rate equal to 0.44% plus either LIBOR or the lender’s cost of funds (subject to a cap of LIBOR plus 20 basis points) through July 31, 2014, and bears interest at an annual rate equal to 2.5% plus either LIBOR or the lender’s cost of funds (subject to a cap of LIBOR plus 20 basis points) from August 1, 2014 through maturity.
| 18 |
The TCPC Funding Facility matures May 15, 2017, subject to extension by the lender at the request of TCPC Funding, and contains an accordion feature which allows for expansion of the facility up to $300 million subject to consent from the lender and other customary conditions. Borrowings under the TCPC Funding Facility bore interest at a rate of LIBOR plus 2.75% per annum through March 14, 2014, and bear interest a rate of LIBOR plus 2.50% per annum from March 15, 2014 through maturity.
The Preferred Interests have a liquidation preference of $20,000 per preferred limited interest, and are redeemable at the option of the Operating Company, subject to certain conditions. The Preferred Interests accrue dividends at an annual rate equal to 0.85% plus either LIBOR or the interestholder’s cost of funds (subject to a cap of LIBOR plus 20 basis points).
On June 11, 2014, the Company issued $108 million of convertible senior unsecured notes that mature on December 15, 2019, unless previously converted or repurchased in accordance with their terms. The Convertible Notes are general unsecured obligations of the Company, and rank structurally junior to the Revolving Facilities and Preferred Interests. The Company does not have the right to redeem the Convertible Notes prior to maturity. The Convertible Notes bear interest at an annual rate of 5.25%, payable semi-annually.
The SBIC is able to issue up to $75 million in SBA Debentures, subject to funded regulatory capital and other customary regulatory requirements. The Partnership has committed $75 million of regulatory capital to the SBIC, $31.5 million of which had been funded at December 31, 2014. SBA Debentures are non-recourse and may be prepaid at any time without penalty. The interest rate on SBA Debentures is fixed at the time of issuance at a market-driven spread over 10-year U.S. Treasury Notes.
The Leverage Program is subject to certain financial or other covenants. As of December 31, 2014, we were in full compliance with such covenants.
Sarbanes-Oxley Act of 2002
The Sarbanes-Oxley Act of 2002 imposes a wide variety of regulatory requirements on publicly-held companies and their insiders. Many of these requirements affect us. For example:
| · | Pursuant to Rule 13a-14 of the 1934 Act, our Chief Executive Officer and Chief Financial Officer must certify the accuracy of the financial statements contained in our periodic reports; |
| · | Pursuant to Item 307 of Regulation S-K, our periodic reports must disclose our conclusions about the effectiveness of our disclosure controls and procedures; |
| · | Pursuant to Rule 13a-15 of the 1934 Act, our management must prepare a report regarding its assessment of our internal control over financial reporting; and |
| · | Pursuant to Item 308 of Regulation S-K and Rule 13a-15 of the 1934 Act, our periodic reports must disclose whether there were significant changes in our internal controls or in other factors that could significantly affect these controls subsequent to the date of their evaluation, including any corrective actions with regard to significant deficiencies and material weaknesses. |
The Sarbanes-Oxley Act requires us to review our current policies and procedures to determine whether we comply with the Sarbanes-Oxley Act and the regulations promulgated thereunder. We will continue to monitor our compliance with all regulations that are adopted under the Sarbanes-Oxley Act and will take actions necessary to ensure that we are in compliance therewith.
An investment in our securities involves certain risks relating to our structure and investment objectives. The risks set forth below are not the only risks we face, and we face other risks which we have not yet identified, which we do not currently deem material or which are not yet predictable. If any of the following risks occur, our business, financial condition and results of operations could be materially adversely affected. In such case, our net asset value and the trading price of our common stock could decline, and you may lose all or part of your investment.
| 19 |
Certain risks in the current environment
Capital markets may experience periods of disruption and instability. Such market conditions may materially and adversely affect debt and equity capital markets in the United States and abroad, which may have a negative impact on our business and operations.
From time to time, capital markets may experience periods of disruption and instability, which may be evidenced by a lack of liquidity in debt capital markets, write-offs in the financial services sector, re-pricing of credit risk and failure of certain major financial institutions. While capital markets have improved, these conditions could deteriorate again and global financial markets could experience significant volatility. During such market disruptions, we may have difficulty raising debt or equity capital especially as a result of regulatory constraints. There can be no assurance that adverse market conditions will not repeat themselves or worsen in the future. Equity capital may be difficult to raise because, subject to some limited exceptions, as a BDC, we are generally not able to issue additional shares of common stock at a price less than net asset value without first obtaining approval for such issuance from our stockholders and our independent directors. At our annual meeting of stockholders held on May 15, 2014, subject to the condition that the maximum number of shares salable below net asset value pursuant to this authority in any particular offering that could result in such dilution is limited to 25% of our then outstanding common stock immediately prior to each such offering, our stockholders approved our ability to sell or otherwise issue shares of our common stock at a price below its then current net asset value per share for a twelve month period expiring on the anniversary of the date of stockholder approval. It should be noted that, theoretically, we may offer up to 25% of our then outstanding common stock each day. In addition, our ability to incur indebtedness (including by issuing preferred stock) is limited by applicable regulations such that our asset coverage, as calculated in accordance with the 1940 Act, must equal at least 200% immediately after each time we incur indebtedness. The debt capital that will be available to us in the future, if at all, may be at a higher cost and on less favorable terms and conditions than our current leverage. Any inability to raise capital could have a negative effect on our business, financial condition and results of operations.
Market conditions may in the future make it difficult to extend the maturity of or refinance our existing indebtedness and any failure to do so could have a material adverse effect on our business. The illiquidity of our investments may make it difficult for us to sell such investments if required. As a result, we may realize significantly less than the value at which we have recorded our investments. In addition, significant changes in the capital markets, including the disruption and volatility, have had, and may in the future have, a negative effect on the valuations of our investments and on the potential for liquidity events involving our investments. An inability to raise capital, and any required sale of our investments for liquidity purposes, could have a material adverse impact on our business, financial condition and results of operations.
Price declines and illiquidity in the corporate debt markets have adversely affected, and may in the future adversely affect, the fair value of our portfolio investments, reducing our net asset value through increased net unrealized depreciation.
As a BDC, we are required to carry our investments at market value or, if no market value is ascertainable, at fair value as determined in good faith by or under the direction of our board of directors. Decreases in the market values or fair values of our investments are recorded as unrealized depreciation, which reduces our net asset value. Depending on market conditions, we could incur substantial realized losses and may suffer additional unrealized losses in future periods, which could have a material adverse impact on our business, financial condition and results of operations.
The downgrade of the U.S. credit rating and economic crisis in Europe could negatively impact our business, financial condition and earnings.
Although U.S. lawmakers passed legislation to raise the federal debt ceiling and Standard & Poor’s Ratings Services affirmed its 'AA+' long-term sovereign credit rating on the United States and revised the outlook on the long-term rating from negative to stable in June of 2013, U.S. debt ceiling and budget deficit concerns together with signs of deteriorating sovereign debt conditions in Europe continue to present the possibility of a credit-rating downgrade, economic slowdowns, or a recession for the United States. The impact of any further downgrades to the U.S. government’s sovereign credit rating or downgraded sovereign credit ratings of European countries or the Russian Federation, or their perceived creditworthiness could adversely affect the U.S. and global financial markets and economic conditions. These developments, along with any further European sovereign debt issues, could cause interest rates and borrowing costs to rise, which may negatively impact our ability to access the debt markets on favorable terms. Continued adverse economic conditions could have a material adverse effect on our business, financial condition and results of operations.
In October 2014, the Federal Reserve announced that it was concluding its bond-buying program. It is unknown what effect, if any, the conclusion of this program will have on credit markets and the value of our investments. These and any future developments and reactions of the credit markets toward these developments could cause interest rates and borrowing costs to rise, which may negatively impact our ability to obtain debt financing on favorable terms.
| 20 |
Rising interest rates may adversely affect the value of our portfolio investments which could have an adverse effect on our business, financial condition and results of operations.
Our debt investments may be based on floating rates, such as London Interbank Offer Rate (“LIBOR”), EURIBOR, the Federal Funds Rate or the Prime Rate. General interest rate fluctuations may have a substantial negative impact on our investments, the value of our common stock and our rate of return on invested capital. A reduction in the interest rates on new investments relative to interest rates on current investments could also have an adverse impact on our net interest income. An increase in interest rates could decrease the value of any investments we hold which earn fixed interest rates, including subordinated loans, senior and junior secured and unsecured debt securities and loans and high yield bonds, and also could increase our interest expense, thereby decreasing our net income. Also, an increase in interest rates available to investors could make investment in our common stock less attractive if we are not able to increase our dividend rate, which could reduce the value of our common stock.
Because we have borrowed money, and may issue preferred stock to finance investments, our net investment income depends, in part, upon the difference between the rate at which we borrow funds or pay distributions on preferred stock and the rate that our investments yield. As a result, we can offer no assurance that a significant change in market interest rates will not have a material adverse effect on our net investment income. In periods of rising interest rates, our cost of funds would increase except to the extent we have issued fixed rate debt or preferred stock, which could reduce our net investment income.
You should also be aware that a change in the general level of interest rates can be expected to lead to a change in the interest rate we receive on many of our debt investments. Accordingly, a change in the interest rate could make it easier for us to meet or exceed the performance threshold and may result in a substantial increase in the amount of incentive fees payable to our Advisor with respect to the portion of the Incentive Fee based on income.
Changes relating to the LIBOR calculation process may adversely affect the value of our portfolio of the LIBOR-indexed, floating-rate debt securities.
In the recent past, concerns have been publicized that some of the member banks surveyed by the British Bankers’ Association (“BBA”) in connection with the calculation of LIBOR across a range of maturities and currencies may have been under-reporting or otherwise manipulating the inter-bank lending rate applicable to them in order to profit on their derivatives positions or to avoid an appearance of capital insufficiency or adverse reputational or other consequences that may have resulted from reporting inter-bank lending rates higher than those they actually submitted. A number of BBA member banks entered into settlements with their regulators and law enforcement agencies with respect to alleged manipulation of LIBOR, and investigations by regulators and governmental authorities in various jurisdictions are ongoing.
Actions by the BBA, regulators or law enforcement agencies as a result of these or future events, may result in changes to the manner in which LIBOR is determined. Potential changes, or uncertainty related to such potential changes may adversely affect the market for LIBOR-based securities, including our portfolio of LIBOR-indexed, floating-rate debt securities. In addition, any further changes or reforms to the determination or supervision of LIBOR may result in a sudden or prolonged increase or decrease in reported LIBOR, which could have an adverse impact on the market for LIBOR-based securities or the value of our portfolio of LIBOR-indexed, floating-rate debt securities.
Risks related to our business
We may not replicate the Company’s historical performance or the historical performance of other entities managed or supported by the Advisor.
We may not be able to replicate the Company’s historical performance or the historical performance of the Advisor’s investments, and our investment returns may be substantially lower than the returns achieved by the Company in the past. We can offer no assurance that the Advisor will be able to continue to implement our investment objective with the same degree of success as it has had in the past.
We may suffer credit losses.
Investment in middle-market companies is highly speculative and involves a high degree of risk of credit loss, and therefore our securities may not be suitable for someone with a low tolerance for risk. These risks are likely to increase during an economic recession, such as the United States and many other economies experienced over the past several years.
| 21 |
Our use of borrowed funds and preferred securities, including under the Leverage Program, to make investments exposes us to risks typically associated with leverage.
The Operating Company borrows money, either directly or indirectly through TCPC Funding, and has the Preferred Interests outstanding through the Leverage Program. As a result:
| · | our common stock is exposed to incremental risk of loss and a decrease in the value of our investments would have a greater negative impact on the value of our common stock than if we did not use leverage; |
| · | adverse changes in interest rates could reduce or eliminate the incremental income we make with the proceeds of any leverage; |
| · | we, and indirectly our common stockholders, bear the entire cost of issuing and paying interest or dividends on any borrowed funds or preferred securities issued by us or the Operating Company; |
| · | our ability to pay dividends on our common stock will be restricted if our asset coverage ratio is not at least 200% and any amounts used to service indebtedness or preferred stock would not be available for such dividends; and |
| · | our ability to amend the Operating Company organizational documents or investment management agreements may be restricted if such amendment could have a material adverse impact on the lenders under our Leverage Program. |
The Preferred Interests have similar risks to our common stockholders as borrowings. The Preferred Interests rank “senior” to common stock in our capital structure, resulting in the Preferred Interests having certain separate voting rights, dividend and liquidation rights, and possibly other rights, preferences or privileges more favorable than those granted to holders of our common stock. For example, payment of dividends and repayment of the liquidation preference of the Preferred Interests takes preference over any dividends or other payments to our common stockholders, and preferred holders are not subject to any of our expenses or losses. Furthermore, our Preferred Interests and the issuance of any additional preferred securities could delay, defer or prevent a transaction or a change of control that might involve a premium price for our common stockholders or otherwise be in your best interest.
The use of leverage creates increased risk of loss and is considered a speculative investment technique. The use of leverage magnifies the potential gains and losses from an investment and increases the risk of loss of capital. To the extent that income derived by us from investments purchased with borrowed funds or the issuances of preferred stock is greater than the cost of borrowing or issuing and servicing the preferred stock, our net income will be greater than if borrowing had not been used. Conversely, if the income from investments purchased from these sources is not sufficient to cover the cost of the leverage, our net investment income will be less than if leverage had not been used, and the amount available for ultimate distribution to the holders of common stock will be reduced. The extent to which the gains and losses associated with leveraged investing are increased will generally depend on the degree of leverage employed. We may, under some circumstances, be required to dispose of investments under unfavorable market conditions in order to maintain our leverage, thus causing us to recognize a loss that might not otherwise have occurred. In the event of a sale of investments upon default under our borrowing arrangements, secured creditors will be contractually entitled to direct such sales and may be expected to do so in their interest, rather than in the interests of the holders of common stock. Holders of common stock will incur losses if the proceeds from a sale in any of the foregoing circumstances are insufficient, after payment in full of amounts due and payable on leverage, including administrative expenses, to repay such holders investments in our common stock. As a result, you could experience a total loss of your investment. Any decrease in our revenue would cause our net income to decline more than it would have had we not borrowed funds and could negatively affect our ability to make distributions on our common stock. The ability to service any debt or the Preferred Interests that we have or may have outstanding depends largely on our financial performance and is subject to prevailing economic conditions and competitive pressures. There is no limitation on the percentage of portfolio investments that can be pledged to secure borrowings. The amount of leverage that we employ at any particular time will depend on our Advisor’s and our board of director’s assessments of market and other factors at the time of any proposed borrowing.
In addition to regulatory restrictions that restrict our ability to raise capital, the Leverage Program contains various covenants which, if not complied with, could accelerate repayment under the Revolving Facilities or require redemption of the Preferred Interests, thereby materially and adversely affecting our liquidity, financial condition and results of operations.
Under the Leverage Program, we must comply with certain financial and operational covenants. These covenants include:
| · | restrictions on the level of indebtedness that we are permitted to incur and the number of Preferred Interests we are permitted to have outstanding in relation to the value of our assets; |
| · | restrictions on our ability to make distributions and other restricted payments under certain circumstances; |
| · | restrictions on extraordinary events, such as mergers, consolidation and sales of assets; |
| · | restrictions on our ability to incur liens and incur indebtedness; and |
| 22 |
| · | maintenance of a minimum level of stockholders’ equity. |
In addition, by limiting the circumstances in which borrowings may occur under the Revolving Facilities, the credit agreements related to the Revolving Facilities, or the Credit Agreements, in effect provides for various asset coverage, credit quality and diversification limitations on our investments. Such limitations may cause us to be unable to make or retain certain potentially attractive investments or to be forced to sell investments at an inappropriate time and consequently impair our profitability or increase losses or result in adverse tax consequences. As of March 9, 2015, we were in compliance with these covenants. However our continued compliance with these covenants depends on many factors, some of which are beyond our control. Accordingly, there are no assurances that we will continue to comply with the covenants in the Credit Agreements. Failure to comply with these covenants would result in a default under the Credit Agreements which, if we were unable to obtain a waiver from the respective lenders thereunder, could result in an acceleration of repayments under the Credit Agreements. In addition, a default under the Operating Company Facility will, in certain circumstances, require the Preferred Interests to be redeemed. As such, failure to comply with these covenants could have a material adverse impact on our business, financial condition and results of operations.
The Operating Company Facility also has certain “key man” provisions. For example, it is an event of default if any of Michael E. Tennenbaum, Howard M. Levkowitz or Mark K. Holdsworth ceases to be actively involved in the management of the Advisor and is not replaced with someone with comparable skills within 180 days. Further, if any two of the individuals cease to be actively involved in management of the Advisor, the administrative agent under the Operating Company’s Credit Agreement may veto a proposed replacement for one of such individuals and may veto any of the Operating Company’s portfolio transactions that are in excess of 15% of its total assets until a replacement has been appointed to fill one of such positions.
The Operating Company Facility matures in July 2016, the TCPC Funding Facility matures in May 2017 and the Preferred Interests will be subject to mandatory redemption in July 2016. Any inability to renew, extend or replace the Revolving Facilities or replace the Preferred Interests could adversely impact our liquidity and ability to find new investments or maintain distributions to our stockholders, subject to extension by the lenders at our request.
The Operating Company Facility matures July 31, 2016, subject to extension by the lenders at our request. Advances under the Operating Company Facility generally bear interest at LIBOR plus 2.50% per annum during the period August 1, 2014 through July 31, 2016, subject to certain limitations. The TCPC Funding Facility matures on May 15, 2017, subject to an extension by the lender at TCPC Funding's request. Advances under the TCPC Funding Facility generally bears interest based on LIBOR plus 2.50% per annum, subject to certain limitations. The Preferred Interests will be subject to mandatory redemption on July 31, 2016. We do not currently know whether we will renew, extend or replace the Revolving Facilities upon their maturities or replace the Preferred Interests, or if we do either or both, whether we will be able to do so on terms that are as favorable as the Revolving Facilities or Preferred Interests, respectively. In addition, we will be required to liquidate assets to repay amounts due under the Revolving Facilities or the Preferred Interests if we do not renew, extend or replace the Revolving Facilities or Preferred Interests prior to their respective maturities.
Upon the termination of the Revolving Facilities, there can be no assurance that we will be able to enter into a replacement facility on terms that are as favorable to us, if at all. We expect that any facility we enter into will likely be on terms less favorable than currently contained in the Operating Company Facility. Our ability to replace the Revolving Facilities may be constrained by then-current economic conditions affecting the credit markets. In the event that we are not able to replace the Revolving Facilities at the time of their maturity, this could have a material adverse effect on our liquidity and ability to fund new investments, our ability to make distributions to our stockholders and our ability to qualify as a RIC.
The creditors under the Revolving Facilities have a first claim on all of the Company’s assets included in the collateral for the respective facilities.
Lenders have fixed dollar claims on our assets that are superior to the claims of our common stockholders or any preferred holders. Substantially all of our current assets have been pledged as collateral under the Revolving Facilities. If an event of default occurs under either of the Revolving Facilities, the respective lenders would be permitted to accelerate amounts due under the respective facilities and liquidate our assets to pay off amounts owed under the respective facilities and limitations would be imposed on us with respect to the purchase or sale of investments. Such limitations may cause us to be unable to make or retain certain potentially attractive investments or to be forced to sell investments at an inappropriate time and consequently impair our profitability or increase our losses or result in adverse tax consequences.
In the event of the dissolution of the Operating Company or otherwise, if the proceeds of the Operating Company’s assets (after payment in full of obligations to any such debtors and of any liquidation preference to any holders of preferred stock) are insufficient to repay capital invested in us by the holders of the common stock, no other assets will be available for the payment of any deficiency. None of our board of directors, the Advisor, the General Partner or any of their respective affiliates, have any liability for the repayment of capital contributions made to the Company by the holders of common stock. Holders of common stock could experience a total loss of their investment in the Company.
| 23 |
Lenders under the Operating Company Facility may have a veto power over the Company’s investment policies.
If a default has occurred under the Operating Company Facility, the lenders under the Operating Company Facility may veto changes in investment policies. The Operating Company Facility also has certain limitations on unusual types of investments such as commodities, real estate and speculative derivatives, which are not part of the Company’s investment strategy or policies in any event.
TCPC SBIC may be unable to make distributions to us that will enable us to meet or maintain RIC status, which could result in the imposition of an entity-level tax.
In order for us to continue to qualify for RIC tax treatment and to minimize corporate-level taxes, we will be required to distribute substantially all of our net ordinary income and net capital gain income, including income from certain of our subsidiaries, which includes the income from TCPC SBIC. We will be partially dependent on TCPC SBIC for cash distributions to enable us to meet the RIC distribution requirements. TCPC SBIC may be limited by the Small Business Investment Act of 1958, and SBA regulations governing SBICs, from making certain distributions to us that may be necessary to enable us to maintain our status as a RIC. We may have to request a waiver of the SBA's restrictions for TCPC SBIC to make certain distributions to maintain our eligibility for RIC status. We cannot assure you that the SBA will grant such a waiver and if TCPC SBIC is unable to obtain a waiver, compliance with the SBA regulations may result in loss of RIC tax treatment and a consequent imposition of an entity-level tax on us.
TCPC SBIC is subject to SBA regulations, and any failure to comply with SBA regulations could have an adverse effect on our operations.
On April 22, 2014, the Operating Company's wholly-owned subsidiary, TCPC SBIC received an SBIC license from the SBA. The SBIC license allows TCPC SBIC to obtain leverage by issuing SBA-guaranteed debentures, subject to the issuance of a capital commitment by the SBA and other customary procedures. SBA-guaranteed debentures are non-recourse, interest only debentures with interest payable semi-annually and have a ten year maturity. The principal amount of SBA-guaranteed debentures is not required to be paid prior to maturity but may be prepaid at any time without penalty. The interest rate of SBA-guaranteed debentures is fixed on a semi-annual basis at a market-driven spread over U.S. Treasury Notes with 10-year maturities. The SBA, as a creditor, will have a superior claim to TCPC SBIC's assets over our stockholders in the event we liquidate TCPC SBIC or the SBA exercises its remedies under the SBA-guaranteed debentures issued by TCPC SBIC upon an event of default.
Under current SBA regulations, a licensed SBIC can provide capital to those entities that have a tangible net worth not exceeding $18.0 million and an average annual net income after Federal income taxes not exceeding $6.0 million for the two most recent fiscal years. In addition, a licensed SBIC must devote 25.0% of its investment activity to those entities that have a tangible net worth not exceeding $6.0 million and an average annual net income after Federal income taxes not exceeding $2.0 million for the two most recent fiscal years. The SBA regulations also provide alternative size standard criteria to determine eligibility, which depend on the industry in which the business is engaged and are based on factors such as the number of employees and gross sales. The SBA regulations permit licensed SBICs to make long term loans to small businesses, invest in the equity securities of such businesses and provide them with consulting and advisory services. The SBA also places certain limitations on the financing terms of investments by SBICs in portfolio companies and prohibits SBICs from providing funds for certain purposes or to businesses in a few prohibited industries. Compliance with SBA requirements may cause TCPC SBIC to forego attractive investment opportunities that are not permitted under SBA regulations.
Further, the SBA regulations require that a licensed SBIC be periodically examined and audited by the SBA to determine its compliance with the relevant SBA regulations. The SBA prohibits, without prior SBA approval, a "change of control" of an SBIC or any transfers of the capital stock of a licensed SBIC. If TCPC SBIC fails to comply with applicable SBA regulations, the SBA could, depending on the severity of the violation, limit or prohibit its use of debentures, declare outstanding debentures immediately due and payable, and/or limit it from making new investments. In addition, the SBA can revoke or suspend a license for willful or repeated violation of, or willful or repeated failure to observe, any provision of the Small Business Investment Act of 1958 or any rule or regulation promulgated thereunder. The Advisor, as TCPC SBIC's investment adviser, does not have any prior experience managing an SBIC. Its lack of experience in complying with SBA regulations may hinder its ability to take advantage of TCPC SBIC's access to SBA-guaranteed debentures. Any failure to comply with SBA regulations could have an adverse effect on our operations.
| 24 |
SBA regulations limit the outstanding dollar amount of SBA-guaranteed debentures that may be issued by an SBIC or group of SBICs under common control.
The SBA regulations currently limit the dollar amount of SBA-guaranteed debentures that can be issued by any one SBIC to $150.0 million or to a group of SBICs under common control to $225.0 million. A proposed bill in the U.S. Senate, the Expanding Access to Capital for Entrepreneurial Act, or Senate Bill 511, would increase the total SBIC leverage capacity for affiliated SBIC funds from $225 million to $350 million. However, the ultimate form and likely outcome of such legislation or any similar legislation cannot be predicted.
An SBIC may not borrow an amount in excess of two times (and in certain cases, up to three times) its regulatory capital. As of December 31, 2014, TCPC SBIC had $28 million in SBA-guaranteed debentures outstanding. If we reach the maximum dollar amount of SBA-guaranteed debentures permitted, and if we require additional capital, our cost of capital may increase, and there is no assurance that we will be able to obtain additional financing on acceptable terms.
Moreover, the current status of TCPC SBIC as an SBIC does not automatically assure that TCPC SBIC will continue to receive SBA-guaranteed debenture funding. Receipt of SBA leverage funding is dependent upon TCPC SBIC continuing to be in compliance with SBA regulations and policies and available SBA funding. The amount of SBA leverage funding available to SBICs is dependent upon annual Congressional authorizations and in the future may be subject to annual Congressional appropriations. There can be no assurance that there will be sufficient debenture funding available at the times desired by TCPC SBIC.
The debentures guaranteed by the SBA have a maturity of ten years and require semi-annual payments of interest. TCPC SBIC will need to generate sufficient cash flow to make required interest payments on the debentures. If TCPC SBIC is unable to meet their financial obligations under the debentures, the SBA, as a creditor, will have a superior claim to TCPC SBIC's assets over our stockholders in the event we liquidate TCPC SBIC or the SBA exercises its remedies under such debentures as the result of a default by us.
If we incur additional leverage, it will increase the risk of investing in shares of our common stock.
The Company has indebtedness and the Preferred Interests outstanding pursuant to the Leverage Program and expects, in the future, to borrow additional amounts under the Revolving Facilities and may increase the size of the Revolving Facilities or enter into other borrowing arrangements.
Illustration . The following table illustrates the effect of leverage on returns from an investment in our common stock assuming various annual returns, net of expenses and preferred dividends. The calculations in the table below are hypothetical and actual returns may be higher or lower than those appearing below. The calculation is based on our level of leverage at December 31, 2014, which represented borrowings and preferred stock equal to 38.4% of our total assets. On such date, we also had $1,205.9 million in total assets; an average cost of funds of 2.86%; $462.7 million aggregate principal amount of debt and liquidation preference of the Preferred Interests outstanding; and $731.1 million of total net assets. In order to compute the ‘‘Corresponding Return to Common Stockholders,” the ‘‘Assumed Return on Portfolio (Net of Expenses Other than Interest and Preferred Dividends)” is multiplied by the total value of our investment portfolio at December 31, 2014 to obtain an assumed return to us. From this amount, the sum of interest expense and preferred dividends calculated by multiplying the combined rate of interest and dividends of 2.86% by the $462.7 million of debt and preferred stock is subtracted to determine the return available to stockholders. The return available to stockholders is then divided by the total value of our net assets at December 31, 2014 to determine the “Corresponding Return to Common Stockholders.” Actual interest payments and preferred dividends may vary.
|
Assumed Return on Portfolio (Net of Expenses Other
than Interest and Preferred Dividends) |
-10 | % | -5 | % | 0 | % | 5 | % | 10 | % | ||||||||||
| Corresponding Return to Common Stockholders | -17 | % | -10 | % | -2 | % | 6 | % | 14 | % |
The assumed portfolio return in the table is based on SEC regulations and is not a prediction of, and does not represent, our projected or actual performance. The table also assumes that we will maintain a constant level of leverage. The amount of leverage that we use will vary from time to time.
The lack of liquidity in substantially all of our investments may adversely affect our business.
Our investments generally are made and will continue to be made in private companies. Substantially all of these securities will be subject to legal and other restrictions on resale or will be otherwise less liquid than publicly traded securities. The illiquidity of our investments may make it difficult for us to sell such investments if the need arises. In addition, if we are required to liquidate all or a portion of our portfolio quickly, we may realize significantly less than the value at which we had previously recorded our investments. Further, we may face other restrictions on our ability to liquidate an investment in a portfolio company to the extent that we or an affiliated manager has material non-public information regarding such portfolio company.
| 25 |
A substantial portion of our portfolio investments may be recorded at fair value as determined using a consistently applied valuation process in accordance with our documented valuation policy that has been reviewed and approved by our board of directors, who also approve in good faith the valuation of such securities and, as a result, there may be uncertainty regarding the value of our portfolio investments.
The debt and equity investments that we make for which market quotations are not readily available will be valued at fair value as determined using a consistently applied valuation process in accordance with our documented valuation policy that has been reviewed and approved by our board of directors, who also approve in good faith the valuation of such securities. Due to the inherent uncertainty of determining the fair value of investments that do not have a readily available market value, the fair value of our investments may differ significantly from the values that would have been used had a readily available market value existed for such investments, and the differences could be material. Our net asset value could be adversely affected if determinations regarding the fair value of these investments were materially higher than the values ultimately realized upon the disposal of such investments.
We are exposed to risks associated with changes in interest rates.
General interest rate fluctuations may have a substantial negative impact on our investments, the value of our common stock and our rate of return on invested capital. A reduction in the interest rates on new investments relative to interest rates on current investments could also have an adverse impact on our net investment income. An increase in interest rates could decrease the value of any investments we hold that earn fixed interest rates, including subordinated loans, senior and junior secured and unsecured debt securities and loans and high-yield bonds, and also could increase our interest expense, thereby decreasing our net income. Also, an increase in interest rates available to investors could make investment in our common stock less attractive if we are not able to increase our dividend rate, which could reduce the value of our common stock.
The Advisor may face conflicts in allocating investment opportunities between us and certain other entities that could adversely impact our investment returns.
The Advisor and its affiliates, employees and associates currently do and in the future may manage other funds and accounts, including for other accounts in which certain holders of our common stock have investments, which we refer to as Other Advisor Accounts. Other Advisor Accounts invest in assets that are also eligible for purchase by us. Our investment policies, fee arrangements and other circumstances may vary from those of Other Advisor Accounts. Accordingly, conflicts may arise regarding the allocation of investments or opportunities among us and Other Advisor Accounts. In general, the Advisor and its affiliates will allocate investment opportunities pro rata among us and Other Advisor Accounts (assuming the investment satisfies the objectives of each) based on the amount of committed capital each then has available. The allocation of certain investment opportunities in private placements is subject to independent director approval pursuant to the terms of the co-investment exemptive order applicable to us and described below. In certain cases, investment opportunities may be made other than on a pro rata basis. For example, we may desire to retain an asset at the same time that one or more Other Advisor Accounts desire to sell it or we may not have additional capital to invest at a time Other Advisor Accounts do. When our investment allocations are made on a basis other than pro rata our investment performance may be less favorable when compared to the investment performance of Other Advisor Accounts with respect to those investments. The Advisor and its affiliates intend to allocate investment opportunities to us and Other Advisor Accounts in a manner that they believe in their judgment and based upon their fiduciary duties to be appropriate given the investment objectives, size of transaction, investable assets, alternative investments potentially available, prior allocations, liquidity, maturity, expected holding period, diversification, lender covenants and other limitations of ours and the Other Advisor Accounts. See “— Risks related to our operations as a BDC — While our ability to enter into transactions with our affiliates is restricted under the 1940 Act, we have received an exemptive order from the SEC permitting certain affiliated investments subject to certain conditions. As a result, the Advisor may face conflicts of interests and investments made pursuant to the exemptive order conditions could in certain circumstances adversely affect the price paid or received by us or the availability or size of the position purchased or sold by us.”
There may be situations in which Other Advisor Accounts and the Company might invest in different securities issued by the same portfolio company. It is possible that if the portfolio company’s financial performance and condition deteriorates such that one or both investments are or could be impaired, the Advisor might face a conflict of interest given the difference in seniority of the respective investments. In such situations, the Advisor would review the conflict on a case-by-case basis and implement procedures consistent with its fiduciary duty to enable it to act fairly to the Other Advisor Accounts and the Company in the circumstances. Any steps by the Advisor will take into consideration the interests of each of the affected clients, the circumstances giving rise to the conflict, the procedural efficacy of various methods of addressing the conflict and applicable legal requirements.
Moreover, the Advisor’s investment professionals, its Investment Committee (as defined below), its senior management and employees serve or may serve as officers, directors or principals of entities that operate in the same or a related line of business. Accordingly, these individuals may have obligations to investors in those entities or funds, the fulfillment of which might not be in our best interests or the best interests of our stockholders. In addition, certain of the personnel employed by the Advisor or focused on our business may change in ways that are detrimental to our business.
| 26 |
We have limited operating history as a BDC and, if the Advisor is unable to manage our investments effectively, we may be unable to achieve our investment objective.
Our ability to achieve our investment objective will depend on our ability to manage our business, which will depend, in turn, on the ability of the Advisor to identify, invest in and monitor companies that meet our investment criteria. Accomplishing this result will largely be a function of the Advisor's investment process. Although the Advisor manages closed-end funds with similar restrictions, the 1940 Act imposes numerous constraints on the operations of BDCs. The Advisor's limited experience in operating under these constraints may hinder the Advisor's ability to help us take advantage of attractive investment opportunities and to achieve our investment objectives. For example, BDCs are prohibited from making any nonqualifying investment unless at least 70% of their total assets are primarily in qualifying investments, which are primarily securities of private or thinly-traded U.S. companies (excluding certain financial companies), cash, cash equivalents, U.S. Government securities and other high quality debt investments that mature in one year or less. The Advisor has limited experience investing under these constraints. In addition, the General Partner has limited experience administering a BDC.
The Advisor and its partners, officers, directors, members, managers, employees, affiliates and agents may be subject to certain potential or actual conflicts of interest in connection with the activities of, and investments by, us.
The Advisor and its affiliates may spend substantial time on other business activities, including investment management and advisory activities for entities with the same or overlapping investment objectives, investing for their own account, financial advisory services (including services for entities in which we invest), and acting as directors, officers, creditor committee members or in similar capacities. Subject to the requirements of the 1940 Act and other applicable laws, the Advisor and its affiliates and associates intend to engage in such activities and may receive compensation from third parties for their services. Subject to the same requirements, such compensation may be payable by entities in which we invest in connection with actual or contemplated investments, and the Advisor may receive fees and other compensation in connection with structuring investments which they will share.
The Advisor’s management fee is based on a percentage of our total assets (other than cash or cash equivalents) and the Advisor may have conflicts of interest in connection with decisions that could affect our total assets, such as decisions as to whether to incur additional debt to increase management fees paid and to recoup the Advisor’s payment of half of the sales load in connection with our initial public offering in April 2012.
Our incentive compensation may induce our Advisor to make certain investments, including speculative investments.
The incentive compensation payable by us to the Advisor and the General Partner may create an incentive for the Advisor to make investments on our behalf that are risky or more speculative than would be the case in the absence of such compensation arrangement. The way in which the incentive compensation payable to the Advisor is determined may encourage the Advisor to increase the use of leverage or take additional risk to increase the return on our investments. Under certain circumstances, the use of leverage may increase the likelihood of default, which would disfavor the holders of our common stock, or of securities convertible into our common stock or warrants representing rights to purchase our common stock or securities convertible into our common stock. A rise in the general level of interest rates can be expected to lead to higher interest rates applicable to certain of our debt investments and may accordingly result in a substantial increase in the amount of incentive compensation payable to the Advisor with respect to our cumulative investment income. Although the incentive compensation payable to the General Partner or the Advisor is subject to a total return limitation, the Advisor may have some ability to accelerate the realization of gains to obtain incentive compensation earlier than it otherwise would when it may be in our best interests to not yet realize gains. Our directors monitor our use of leverage and the Advisor’s management of our investment program in the best interests of our common stockholders.
We may invest, to the extent permitted by law, in the securities and instruments of other investment companies, including private funds, and, to the extent we so invest, we will bear our ratable share of any such investment company’s expenses, including management and performance fees. We will also remain obligated to pay management and incentive compensation to the Advisor with respect to the assets invested in the securities and instruments of other investment companies. With respect to each of these investments, each of our common stockholders will bear his or her share of our management and incentive compensation as well as indirectly bear the management and performance fees and other expenses of any investment companies in which we invest.
| 27 |
We may be obligated to pay the Advisor incentive compensation payments in excess of the amounts we would have paid if such compensation was subject to clawback arrangements.
The Advisor or the General Partner is entitled to incentive compensation for each fiscal quarter after January 1, 2013 in an amount equal to a percentage of our ordinary income (before deducting incentive compensation) since that date and, separately, a percentage of our realized capital gains (net of realized capital losses and unrealized depreciation) since that date, in each case subject to a cumulative total return requirement. If we pay incentive compensation and thereafter experience additional realized capital losses or unrealized capital depreciation such that we would no longer have been required to provide incentive compensation, we will not be able to recover any portion of the incentive compensation previously paid or distributed because our incentive compensation arrangements do not contain any clawback provisions. As a result, the incentive compensation could exceed 20% of our cumulative total return, depending on the timing of unrealized appreciation, net unrealized depreciation and net realized capital losses. For example, part of the incentive compensation payable or distributable by us that relates to our ordinary income is computed on income that may include interest that has been accrued but not yet received in cash. If a portfolio company defaults on a loan, it is possible that accrued interest previously used in the calculation of the incentive compensation will become uncollectible. Similarly, the income component is measured against a total return limitation that includes unrealized gains. Such gains may not be realized or may be realized at a lower amount. Consequently, we may have paid incentive compensation on income in circumstances where we otherwise would not have done so and with respect to which we do not have a clawback right against the Advisor or the General Partner.
The General Partner may have certain interests that conflict with the interests of the board of directors in the governance of the Operating Company.
The General Partner, an affiliate of the Advisor, is responsible for the day-to-day operations of the Operating Company subject to the general supervision of the board of directors including various significant matters such as the issuance of additional classes of securities of the Operating Company and the determination of the timing and amounts of distributions payable by the Operating Company. The decisions of the General Partner with respect to these and other matters may be subject to various conflicts of interest arising out of its relationship with us and its affiliates. The General Partner could be confronted with decisions where it will, directly or indirectly, have an economic incentive to place its interests or the interests of its affiliates above ours.
The procedures for the appointment and removal of directors from the board of directors of the Operating Company differ from those of the Holding Company, which may result in the boards of directors of the Operating Company and the Holding Company consisting of different members.
The procedures for the appointment and removal of directors from the board of directors of the Operating Company differ from those of the Holding Company, which may result in the boards of directors of the Operating Company and the Holding Company consisting of different members. If the boards of directors of the Operating Company and the Holding Company consist of different members, the objectives of the boards of directors may differ and decisions regarding the management of the Operating Company may adversely affect the Holding Company.
We are dependent upon senior management personnel of the Advisor for our future success, and if the Advisor is unable to retain qualified personnel or if the Advisor loses any member of its senior management team, our ability to achieve our investment objective could be significantly harmed.
The success of the Company is highly dependent on the financial and managerial expertise of the Advisor. The loss of one or more of the voting members of the Investment Committee could have a material adverse effect on the performance of the Company. Although the Advisor and the voting members of the Investment Committee devote a significant amount of their respective efforts to the Company, they actively manage investments for other clients and are not required to (and will not) devote all of their time to the Company’s affairs.
The Advisor or its affiliates may, from time to time, possess material non-public information, limiting our investment discretion.
The Advisor’s investment professionals, Investment Committee or their respective affiliates may serve as directors of, or in a similar capacity with, companies in which we invest. In the event that material non-public information is obtained with respect to such companies, or we became subject to trading restrictions under the internal trading policies of those companies or as a result of applicable law or regulations, we could be prohibited for a period of time from purchasing or selling the securities of such companies, and this prohibition may have an adverse effect on us and, consequently, your interests as a stockholder.
The Advisor can resign on 60 days’ notice, and we may not be able to find a suitable replacement within that time, resulting in a disruption in our operations that could adversely affect our financial condition, business and results of operations.
The Advisor has the right, under our investment management agreement, to resign at any time upon not more than 60 days’ written notice, whether we have found a replacement or not. If the Advisor resigns, we may not be able to find a new investment advisor or hire internal management with similar expertise and ability to provide the same or equivalent services on acceptable terms within 60 days, or at all. If we are unable to do so quickly, our operations are likely to experience a disruption, our financial condition, business and results of operations as well as our ability to pay distributions are likely to be adversely affected and the market price of our shares may decline. In addition, the coordination of our internal management and investment activities is likely to suffer if we are unable to identify and reach an agreement with a single institution or group of executives having the expertise possessed by the Advisor and its affiliates. Even if we are able to retain comparable management, whether internal or external, the integration of such management and their lack of familiarity with our investment objective may result in additional costs and time delays that may adversely affect our financial condition, business and results of operations.
| 28 |
We may experience fluctuations in our periodic operating results.
We could experience fluctuations in our periodic operating results due to a number of factors, including the interest rates payable on the debt securities we acquire, the default rate on such securities, the level of our expenses (including the interest rates payable on our borrowings), the dividend rates payable on preferred stock we issue, variations in and the timing of the recognition of realized and unrealized gains or losses, the degree to which we encounter competition in our markets and general economic conditions. As a result of these factors, results for any period should not be relied upon as being indicative of performance in future periods.
If we fail to maintain our status as a business development company, our business and operating flexibility could be significantly reduced.
We qualify as business development companies under the 1940 Act. The 1940 Act imposes numerous constraints on the operations of business development companies. For example, BDCs are prohibited from making any unqualifying investments unless at least 70% of their total assets are invested in qualifying investments which are primarily securities of private or thinly-traded U.S. companies, cash, cash equivalents, U.S. government securities and other high quality debt investments that mature in one year or less. Failure to comply with the requirements imposed on business development companies by the 1940 Act could cause the SEC to bring an enforcement action against us and/or expose us to claims of private litigants. In addition, any such failure could cause an event of default under the Leverage Program, which could have a materially adverse effect on our business, financial conditions or results of operations.
Because we intend to distribute substantially all of our income to our stockholders to maintain our status as a RIC, we will continue to need additional capital to finance growth. If additional funds are unavailable or not available on favorable terms, our ability to grow will be impaired.
In order for the Holding Company to qualify for the tax benefits available to RICs and to avoid payment of excise taxes, we intend to distribute to our stockholders substantially all of our annual taxable income, except that we may retain certain net capital gains for reinvestment in common interests of the Operating Company, and treat such amounts as deemed distributions to our stockholders. If we elect to treat any amounts as deemed distributions, we must pay income taxes at the corporate rate on such deemed distributions on behalf of our stockholders and our stockholders will receive a tax credit for such amounts and an increase in basis. A stockholder that is not subject to U.S. federal income tax or otherwise is not required to file a U.S. federal income tax return would be required to file a U.S. federal income tax return on the appropriate form in order to claim a refund for the taxes we paid. As a result of these requirements, we will likely need to raise capital from other sources to grow our business. Unfavorable economic or capital market conditions may increase our funding costs, limit our access to the capital markets or could result in a decision by lenders not to extend credit to us. An inability to successfully access the capital markets could limit our ability to grow our business and fully execute our business strategy and could decrease our earnings, if any.
As a BDC, we are not able to incur senior securities unless after giving effect thereto we meet a coverage ratio of total assets, less liabilities and indebtedness not represented by senior securities, to total senior securities, which includes all of our borrowings and any outstanding preferred interests, of at least 200%. These requirements limit the amount that we may borrow. Because we will continue to need capital to grow our investment portfolio, these limitations may prevent us from incurring debt and require us to raise additional equity at a time when it may be disadvantageous to do so. While we expect we will be able to borrow and to issue additional debt securities and expect that we will be able to issue additional equity securities, we cannot assure you that debt and equity financing will be available to us on favorable terms, or at all. In addition, as a business development company, we generally will not be permitted to issue equity securities priced below net asset value without stockholder approval. If additional funds are not available to us, we could be forced to curtail or cease new investment activities and our net asset value or common stock price could decline.
The highly competitive market in which we operate may limit our investment opportunities.
A number of entities compete with us to make the types of investments that we make. We compete with other BDCs, public and private funds, commercial and investment banks, commercial financing companies, and, to the extent they provide an alternative form of financing, private equity funds. Additionally, because competition for investment opportunities generally has increased among alternative investment vehicles, such as hedge funds, those entities now invest in areas in which they have not traditionally invested. As a result of these new entrants, competition for investment opportunities intensified over the past several years and may intensify further in the future. Some of our existing and potential competitors are substantially larger and have considerably greater financial, technical and marketing resources than we do. For example, some competitors may have a lower cost of funds and access to funding sources that are not available to us. In addition, some of our competitors may have higher risk tolerances or different risk assessments, which could allow them to consider a wider variety of investments and establish more relationships than us. Furthermore, many of our competitors are not subject to the regulatory restrictions and valuation requirements that the 1940 Act imposes on us as a BDC and that the Code imposes on us as a RIC. We cannot assure you that the competitive pressures we face will not have a material adverse effect on our business, financial condition and results of operations. Also, as a result of this existing and potentially increasing competition, we may not be able to take advantage of attractive investment opportunities from time to time, and we can offer no assurance that we will be able to identify and make investments that are consistent with our investment objective.
| 29 |
We do not seek to compete primarily based on the interest rates we offer, and we believe that some of our competitors make loans with interest rates that are comparable to or lower than the rates we offer.
We may lose investment opportunities if we do not match our competitors’ pricing, terms and structure. If we match our competitors’ pricing, terms and structure, we may experience decreased net interest income and increased risk of credit loss. As a result of operating in such a competitive environment, we may make investments that are on better terms to our portfolio companies than what we may have originally anticipated, which may impact our return on these investments.
Our board of directors may change our operating policies and strategies without prior notice or stockholder approval.
Our board of directors has the authority to modify or waive our operating policies and strategies without prior notice and without stockholder approval. We cannot predict the effect any changes to our current operating policies and strategies would have on our business, operating results or value of our stock. Nevertheless, the effects could adversely affect our business and impact our ability to make distributions and cause you to lose all or part of your investment.
Risks related to our investments
Our investments may be risky, and you could lose all or part of your investment.
We invest primarily in middle-market companies primarily through leveraged loans.
Risks Associated with middle-market companies . Investing in private middle-market companies involves a number of significant risks, including:
| · | these companies may have limited financial resources and may be unable to meet their obligations under their debt securities that we hold, which may be accompanied by a deterioration in the value of any collateral; |
| · | they typically have shorter operating histories, narrower product lines and smaller market shares than larger businesses, which tend to render them more vulnerable to competitors’ actions and market conditions, as well as general economic downturns; |
| · | they are more likely to depend on the management talents and efforts of a small group of persons; therefore, the death, disability, resignation or termination of one or more of these persons could have a material adverse impact on the portfolio company and, in turn, on us; |
| · | they generally have less predictable operating results, may from time to time be parties to litigation, may be engaged in rapidly changing businesses with products subject to a substantial risk of obsolescence, and may require substantial additional capital to support their operations, finance expansion or maintain their competitive position; |
| · | our executive officers, directors and the Advisor may, in the ordinary course of business, be named as defendants in litigation arising from our investments in the portfolio companies; |
| · | changes in laws and regulations, as well as their interpretations, may adversely affect their respective businesses, financial structures or prospects; and |
| · | they may have difficulty accessing the capital markets to meet future capital needs. |
Little public information exists about private middle-market companies, and we expect to rely on the Advisor’s investment professionals to obtain adequate information to evaluate the potential returns from investing in these companies. These companies and their financial information are not subject to the Sarbanes-Oxley Act of 2002 and other rules that govern disclosures and financial controls of public companies. If we are unable to uncover all material information about these companies, we may not make a fully informed investment decision, and we may lose money on our investment.
| 30 |
Lower Credit Quality Obligations . Most of our debt investments are likely to be in lower grade obligations. The lower grade investments in which we invest may be rated below investment grade by one or more nationally-recognized statistical rating agencies at the time of investment or may be unrated but determined by the Advisor to be of comparable quality. Debt securities rated below investment grade are commonly referred to as “junk bonds” and are considered speculative with respect to the issuer’s capacity to pay interest and repay principal. The debt that we invest in typically is not rated prior to our investment by any rating agency, but we believe that if such investments were rated, they would be below investment grade (rated lower than “Baa3” by Moody’s Investors Service, lower than “BBB-” by Fitch Ratings or lower than “BBB-” by Standard & Poor’s). We may invest without limit in debt of any rating, as well as debt that has not been rated by any nationally recognized statistical rating organization.
Investment in lower grade investments involves a substantial risk of loss. Lower grade securities or comparable unrated securities are considered predominantly speculative with respect to the issuer’s ability to pay interest and principal and are susceptible to default or decline in market value due to adverse economic and business developments. The market values for lower grade debt tend to be very volatile and are less liquid than investment grade securities. For these reasons, your investment in our company is subject to the following specific risks:
| · | increased price sensitivity to a deteriorating economic environment; |
| · | greater risk of loss due to default or declining credit quality; |
| · | adverse company specific events are more likely to render the issuer unable to make interest and/or principal payments; and |
| · | if a negative perception of the lower grade debt market develops, the price and liquidity of lower grade securities may be depressed. This negative perception could last for a significant period of time. |
Adverse changes in economic conditions are more likely to lead to a weakened capacity of a lower grade issuer to make principal payments and interest payments than an investment grade issuer. The principal amount of lower grade securities outstanding has proliferated in the past decade as an increasing number of issuers have used lower grade securities for corporate financing. An economic downturn could severely affect the ability of highly leveraged issuers to service their debt obligations or to repay their obligations upon maturity. Similarly, downturns in profitability in specific industries could adversely affect the ability of lower grade issuers in that industry to meet their obligations. The market values of lower grade debt tend to reflect individual developments of the issuer to a greater extent than do higher quality investments, which react primarily to fluctuations in the general level of interest rates. Factors having an adverse impact on the market value of lower grade debt may have an adverse effect on our net asset value and the market value of our common stock. In addition, we may incur additional expenses to the extent we are required to seek recovery upon a default in payment of principal of or interest on our portfolio holdings. In certain circumstances, we may be required to foreclose on an issuer’s assets and take possession of its property or operations. In such circumstances, we would incur additional costs in disposing of such assets and potential liabilities from operating any business acquired.
The secondary market for lower grade debt is unlikely to be as liquid as the secondary market for more highly rated debt, a factor which may have an adverse effect on our ability to dispose of a particular instrument. There are fewer dealers in the market for lower grade securities than investment grade obligations. The prices quoted by different dealers may vary significantly and the spread between the bid and asked price is generally larger than for higher quality instruments. Under adverse market or economic conditions, the secondary market for lower grade debt could contract further, independent of any specific adverse changes in the condition of a particular issuer, and these instruments may become highly illiquid. As a result, we could find it more difficult to sell these instruments or may be able to sell the securities only at prices lower than if such instruments were widely traded. Prices realized upon the sale of such lower rated or unrated securities, under these circumstances, may be less than the prices used in calculating our net asset value.
Since investors generally perceive that there are greater risks associated with lower grade debt of the type in which we may invest a portion of our assets, the yields and prices of such debt may tend to fluctuate more than those for higher rated instruments. In the lower quality segments of the fixed income markets, changes in perceptions of issuers’ creditworthiness tend to occur more frequently and in a more pronounced manner than do changes in higher quality segments of the income securities market, resulting in greater yield and price volatility.
Distressed Debt Securities Risk . At times, distressed debt obligations may not produce income and may require us to bear certain extraordinary expenses (including legal, accounting, valuation and transaction expenses) in order to protect and recover our investment. Therefore, our ability to achieve current income for our stockholders may be diminished. We also will be subject to significant uncertainty as to when and in what manner and for what value the distressed debt we invest in will eventually be satisfied (e.g., through a liquidation of the obligor’s assets, an exchange offer or plan of reorganization involving the distressed debt securities or a payment of some amount in satisfaction of the obligation). In addition, even if an exchange offer is made or plan of reorganization is adopted with respect to distressed debt we hold, there can be no assurance that the securities or other assets received by us in connection with such exchange offer or plan of reorganization will not have a lower value or income potential than may have been anticipated when the investment was made. Moreover, any securities received by us upon completion of an exchange offer or plan of reorganization may be restricted as to resale. As a result of our participation in negotiations with respect to any exchange offer or plan of reorganization with respect to an issuer of distressed debt, we may be restricted from disposing of such securities.
| 31 |
Payment-in-kind Interest Risk . Our loans may contain a payment-in-kind, or PIK, interest provision. PIK investments carry additional risk as holders of these types of securities receive no cash until the cash payment date unless a portion of such securities is sold. If the issuer defaults the Company may obtain no return on its investment. The PIK interest, computed at the contractual rate specified in each loan agreement, is added to the principal balance of the loan and recorded as interest income. To avoid the imposition of corporate-level tax on us, this non-cash source of income needs to be paid out to stockholders in cash distributions or, in the event that we determine to do so and in certain cases, in shares of our common stock, even though we have not yet collected and may never collect the cash relating to the PIK interest. As a result, we may have to distribute a taxable stock dividend to account for PIK interest even though we have not yet collected the cash.
Preferred Stock Risk . To the extent we invest in preferred securities, there are special risks, including:
Deferral . Preferred securities may include provisions that permit the issuer, at its discretion, to defer distributions for a stated period without any adverse consequences to the issuer. If we own a preferred security that is deferring its distributions, we may be required to report income for tax purposes although we have not yet received such income.
Subordination . Preferred securities are subordinated to bonds and other debt instruments in a company’s capital structure in terms of priority to corporate income and liquidation payments, and therefore will be subject to greater credit risk than more senior debt instruments.
Liquidity . Preferred securities may be substantially less liquid than many other securities, such as common stocks or U.S. Government securities.
Limited Voting Rights . Generally, preferred security holders have no voting rights with respect to the issuing company unless preferred dividends have been in arrears for a specified number of periods, at which time the preferred security holders may elect a number of directors to the issuer’s board. Generally, once all the arrearages have been paid, the preferred security holders no longer have voting rights.
Equity Security Risk . We may have exposure to equity securities. Although equity securities have historically generated higher average total returns than fixed-income securities over the long term, equity securities also have experienced significantly more volatility in those returns. The equity securities that we acquire may fail to appreciate and may decline in value or become worthless.
Hedging Transactions . We may employ hedging techniques to minimize currency exchange rate risks or interest rate risks, but we can offer no assurance that such strategies will be effective. If we engage in hedging transactions, we may expose ourselves to risks associated with such transactions. Hedging against a decline in the values of our portfolio positions does not eliminate the possibility of fluctuations in the values of such positions or prevent losses if the values of such positions decline. Moreover, it may not be possible to hedge against an exchange rate or interest rate fluctuation that is so generally anticipated that we are not able to enter into a hedging transaction at an acceptable price. Additionally, engaging in certain hedging transactions could result in adverse tax consequences, e.g. giving rise to income that does not qualify for the 90% annual gross income requirement applicable to RICs.
Economic recessions or downturns could impair our portfolio companies and harm our operating results.
Many of our portfolio companies may be susceptible to economic slowdowns or recessions and may be unable to repay our loans during these periods. Therefore, our non-performing assets may increase and the value of our portfolio may decrease during these periods as we are required to record the values of our investments. Adverse economic conditions also may decrease the value of collateral securing some of our loans and the value of our equity investments. Economic slowdowns or recessions could lead to financial losses in our portfolio and a decrease in revenues, net income and assets. Unfavorable economic conditions also could increase our funding costs, limit our access to the capital markets or result in a decision by lenders not to extend credit to us. These events could prevent us from increasing investments and harm our operating results.
A portfolio company’s failure to satisfy financial or operating covenants imposed by us or other lenders could lead to defaults and, potentially, termination of its loans and foreclosure on its secured assets, which could trigger cross-defaults under other agreements and jeopardize our portfolio company’s ability to meet its obligations under the debt securities that we hold. We may incur expenses to the extent necessary to seek recovery upon default or to negotiate new terms with a defaulting portfolio company. In addition, if one of our portfolio companies were to go bankrupt, even though we or one of our affiliates may have structured our interest in such portfolio company as senior debt, depending on the facts and circumstances, including the extent to which we actually provided managerial assistance to that portfolio company, a bankruptcy court might re-characterize our debt holding as equity and subordinate all or a portion of our claim to claims of other creditors.
| 32 |
We may not be in a position to exercise control over our portfolio companies or to prevent decisions by management of our portfolio companies that could decrease the value of our investments.
We do not generally intend to take controlling equity positions in our portfolio companies. To the extent that we do not hold a controlling equity interest in a portfolio company, we are subject to the risk that such portfolio company may make business decisions with which we disagree, and the stockholders and management of such portfolio company may take risks or otherwise act in ways that are adverse to our interests. Due to the lack of liquidity for the debt and equity investments that we typically hold in our portfolio companies, we may not be able to dispose of our investments in the event we disagree with the actions of a portfolio company, and may therefore suffer a decrease in the value of our investments.
In addition, we may not be in a position to control any portfolio company by investing in its debt securities. As a result, we are subject to the risk that a portfolio company in which we invest may make business decisions with which we disagree and the management of such company, as representatives of the holders of their common equity, may take risks or otherwise act in ways that do not serve our interests as debt investors.
Our portfolio companies may incur debt that ranks equally with, or senior to, our investments in such companies.
The portfolio companies we invest in usually have, or may be permitted to incur, other debt that ranks equally with, or senior to, the debt securities in which we invest. By their terms, such debt instruments may provide that the holders are entitled to receive payment of interest or principal on or before the dates on which we are entitled to receive payments in respect of the debt securities in which we invest. Also, in the event of insolvency, liquidation, dissolution, reorganization or bankruptcy of a portfolio company, holders of debt instruments ranking senior to our investment in that portfolio company would typically be entitled to receive payment in full before we receive any distribution in respect of our investment. After repaying such senior creditors, such portfolio company may not have any remaining assets to use for repaying its obligation to us. In the case of debt ranking equally with debt securities in which we invest, we would have to share any distributions on an equal and ratable basis with other creditors holding such debt in the event of an insolvency, liquidation, dissolution, reorganization or bankruptcy of the relevant portfolio company.
Additionally, certain loans that we make to portfolio companies may be secured on a second priority basis by the same collateral securing senior secured debt of such companies. The first priority liens on the collateral will secure the portfolio company’s obligations under any outstanding senior debt and may secure certain other future debt that may be permitted to be incurred by the portfolio company under the agreements governing the loans. The holders of obligations secured by the first priority liens on the collateral will generally control the liquidation of and be entitled to receive proceeds from any realization of the collateral to repay their obligations in full before us. In addition, the value of the collateral in the event of liquidation will depend on market and economic conditions, the availability of buyers and other factors. There can be no assurance that the proceeds, if any, from the sale or sales of all of the collateral would be sufficient to satisfy the loan obligations secured by the second priority liens after payment in full of all obligations secured by the first priority liens on the collateral. If such proceeds are not sufficient to repay amounts outstanding under the loan obligations secured by the second priority liens, then we, to the extent not repaid from the proceeds of the sale of the collateral, will only have an unsecured claim against the portfolio company’s remaining assets, if any.
The rights we may have with respect to the collateral securing the loans we make to our portfolio companies with senior debt outstanding may also be limited pursuant to the terms of one or more intercreditor agreements that we enter into with the holders of senior debt. Under such an intercreditor agreement, at any time that obligations that have the benefit of the first priority liens are outstanding, any of the following actions that may be taken in respect of the collateral will be at the direction of the holders of the obligations secured by the first priority liens: the ability to cause the commencement of enforcement proceedings against the collateral; the ability to control the conduct of such proceedings; the approval of amendments to collateral documents; releases of liens on the collateral; and waivers of past defaults under collateral documents. We may not have the ability to control or direct such actions, even if our rights are adversely affected.
We may also make unsecured loans to portfolio companies, meaning that such loans will not benefit from any interest in collateral of such companies. Liens on such portfolio companies’ collateral, if any, will secure the portfolio company’s obligations under its outstanding secured debt and may secure certain future debt that is permitted to be incurred by the portfolio company under its secured loan agreements. The holders of obligations secured by such liens will generally control the liquidation of, and be entitled to receive proceeds from, any realization of such collateral to repay their obligations in full before us. In addition, the value of such collateral in the event of liquidation will depend on market and economic conditions, the availability of buyers and other factors. There can be no assurance that the proceeds, if any, from sales of such collateral would be sufficient to satisfy our unsecured loan obligations after payment in full of all secured loan obligations. If such proceeds were not sufficient to repay the outstanding secured loan obligations, then our unsecured claims would rank equally with the unpaid portion of such secured creditors’ claims against the portfolio company’s remaining assets, if any.
| 33 |
Our portfolio companies may prepay loans, which prepayment may reduce stated yields in the future if capital returned cannot be invested in transactions with equal or greater expected yields.
Certain of the loans we make are prepayable at any time, some of them of them at no premium to par. We cannot predict when such loans may be prepaid. Whether a loan is prepaid will depend both on the continued positive performance of the portfolio company and the existence of favorable financing market conditions that permit such company to replace existing financing with less expensive capital. As market conditions change frequently, it is unknown when, and if, this may be possible for each portfolio company. In the case of some of these loans, having the loan prepaid early may reduce the achievable yield for the Company in the future below the current yield disclosed for our portfolio if the capital returned cannot be invested in transactions with equal or greater expected yields.
Our failure to make follow-on investments in our portfolio companies could impair the value of our portfolio.
Following an initial investment in a portfolio company, we may make additional investments in that portfolio company as “follow-on” investments in order to: (1) increase or maintain in whole or in part our equity ownership percentage; (2) exercise warrants, options or convertible securities that were acquired in the original or subsequent financing; or (3) attempt to preserve or enhance the value of our initial investment.
We may elect not to make follow-on investments or otherwise lack sufficient funds to make those investments. Our failure to make follow-on investments may, in some circumstances, jeopardize the continued viability of a portfolio company and our initial investment, or may result in a missed opportunity for us to increase our participation in a successful operation. Even if we have sufficient capital to make a desired follow-on investment, we may elect not to make such follow-on investment because we may not want to increase our concentration of risk, because we prefer other opportunities, because we are inhibited by compliance with BDC requirements or because we desire to maintain our tax status.
Our investments in foreign securities may involve significant risks in addition to the risks inherent in U.S. investments.
Our investment strategy contemplates that a portion of our investments may be in securities of foreign companies in order to provide diversification or to complement our U.S. investments, although we are required generally to invest at least 70% of our assets in companies organized and having their principal place of business within the U.S. and its possessions. Investing in foreign companies may expose us to additional risks not typically associated with investing in U.S. companies. These risks include changes in exchange control regulations, political and social instability, expropriation, imposition of foreign taxes, less liquid markets and less available information than is generally the case in the United States, higher transaction costs, less government supervision of exchanges, brokers and issuers, less developed bankruptcy laws, difficulty in enforcing contractual obligations, lack of uniform accounting and auditing standards and greater price volatility. These risks may be more pronounced for portfolio companies located or operating primarily in emerging markets, whose economies, markets and legal systems may be less developed.
Although it is anticipated that most of our investments will be denominated in U.S. dollars, our investments that are denominated in a foreign currency will be subject to the risk that the value of a particular currency may change in relation to the U.S. dollar. Among the factors that may affect currency values are trade balances, the level of short-term interest rates, differences in relative values of similar assets in different currencies, long-term opportunities for investment and capital appreciation and political developments. We may employ hedging techniques to minimize these risks, but we can offer no assurance that we will, in fact, hedge currency risk or, that if we do, such strategies will be effective. As a result, a change in currency exchange rates may adversely affect our profitability.
Cyclicality within the energy sector may adversely affect some of our portfolio companies.
Industries within the energy sector are cyclical with fluctuations in commodity prices and demand for, and production of commodities driven by a variety of factors. The highly cyclical nature of the industries within the energy sector may lead to volatile changes in commodity prices, which may adversely affect the earnings of energy companies in which we may invest and the performance and valuation of our portfolio.
The effect of global climate change may impact the operations of our portfolio companies.
There may be evidence of global climate change. Climate change creates physical and financial risk and some of our portfolio companies may be adversely affected by climate change. For example, the needs of customers of energy companies vary with weather conditions, primarily temperature and humidity. To the extent weather conditions are affected by climate change, energy use could increase or decrease depending on the duration and magnitude of any changes. Increases in the cost of energy could adversely affect the cost of operations of our portfolio companies if the use of energy products or services is material to their business. A decrease in energy use due to weather changes may affect some of our portfolio companies’ financial condition, through decreased revenues. Extreme weather conditions in general require more system backup, adding to costs, and can contribute to increased system stresses, including service interruptions.
| 34 |
Risks related to our operations as a BDC
While our ability to enter into transactions with our affiliates is restricted under the 1940 Act, we have received an exemptive order from the SEC permitting certain affiliated investments subject to certain conditions. As a result, the Advisor may face conflicts of interests and investments made pursuant to the exemptive order conditions could in certain circumstances adversely affect the price paid or received by us or the availability or size of the position purchased or sold by us.
Any person that owns, directly or indirectly, 5% or more of our outstanding voting securities or is managed by the Advisor will generally be our affiliate for purposes of the 1940 Act and we are generally prohibited from participating in certain transactions such as co-investing with, or buying or selling any security from or to, such affiliate, absent the prior approval of our independent directors and, in some cases, of the SEC. However, the Advisor and the funds managed by the Advisor have received an exemption from certain SEC regulations prohibiting transactions with affiliates. The exemptive order requires that certain procedures be followed prior to making an investment subject to the order and such procedures could in certain circumstances adversely affect the price paid or received by us or the availability or size of the position purchased or sold by us. The Advisor may also face conflicts of interest in making investments pursuant to the exemptive order. See “Risks related to our business — We have limited operating history as a BDC, and if the Advisor is unable to manage our investments effectively, we may be unable to achieve our investment objective. In addition, the Advisor may face conflicts in allocating investment opportunities between us and certain other entities that could impact our investment returns."
The 1940 Act also prohibits certain "joint" transactions with certain of our affiliates, which could include investments in the same portfolio company (whether at the same or different times), without prior approval of our independent directors and, in some cases, of the SEC. We are prohibited from buying or selling any security from or to any person who owns more than 25% of our voting securities and from or to certain of that person's affiliates, or entering into prohibited joint transactions with such persons, absent the prior approval of the SEC (other than certain limited situations pursuant to current regulatory guidance). The analysis of whether a particular transaction constitutes a joint transaction requires a review of the relevant facts and circumstances relating to the particular transaction. Similar restrictions limit our ability to transact business with our officers or directors or their affiliates.
Regulations governing our operation as a BDC may limit our ability to, and the way in which we raise additional capital, which could have a material adverse impact on our liquidity, financial condition and results of operations.
Our business may in the future require a substantial amount of capital. We may acquire additional capital from the issuance of additional shares of our common stock or from the additional issuance of senior securities (including debt and preferred stock). However, we may not be able to raise additional capital in the future on favorable terms or at all.
Our board of directors may decide to issue common stock to finance our operations rather than issuing debt or other senior securities. As a BDC, we are generally not able to issue our common stock at a price below net asset value without first obtaining required approvals from our stockholders and our independent directors. If our common stock trades at a discount to net asset value, those restrictions could adversely affect our ability to raise equity capital. Except in connection with the exercise of warrants or the conversion of convertible securities, in any such case the price at which our securities are to be issued and sold may not be less than a price, that in the determination of our board of directors, closely approximates the market value of such securities at the relevant time. We may also make rights offerings to our stockholders at prices per share less than the net asset value per share, subject to the requirements of the 1940 Act. If we raise additional funds by issuing more common stock or senior securities convertible into, or exchangeable for, our common stock, the percentage ownership of our stockholders at that time would decrease, and such stockholders may experience dilution.
We may only issue senior securities up to the maximum amount permitted by the 1940 Act. The 1940 Act permits us to issue senior securities only in amounts such that our asset coverage, as defined in the 1940 Act, equals at least 200% after such issuance or incurrence. If our assets decline in value and we fail to satisfy this test or any stricter test under the terms of our leverage instruments, we may be required to liquidate a portion of our investments and repay a portion of our indebtedness at a time when such sales or repayment may be disadvantageous, which could have a material adverse impact on our liquidity, financial condition and results of operations.
| 35 |
Changes in the laws or regulations governing our business or the business of our portfolio companies, or changes in the interpretations thereof or newly enacted legislation and regulations, and any failure by us or our portfolio companies to comply with these laws or regulations, could have a material adverse effect on our business, results of operations or financial condition of us or our portfolio companies.
We are subject to changing rules and regulations of federal and state governments, as well as the stock exchange in which our common stock is listed. These entities, including the Public Company Accounting Oversight Board, the SEC and The Nasdaq Global Select Market, have issued a significant number of new and increasingly complex requirements and regulations over the course of the last several years and continue to develop additional regulations.
Changes in the laws or regulations or the interpretations of the laws and regulations that govern BDCs, RICs or non-depository commercial lenders could significantly affect our operations and our cost of doing business. We are subject to federal, state and local laws and regulations and are subject to judicial and administrative decisions that affect our operations, including our loan originations, maximum interest rates, fees and other charges, disclosures to portfolio companies, the terms of secured transactions, collection and foreclosure procedures and other trade practices. If these laws, regulations or decisions change, or if we expand our business into jurisdictions that have adopted more stringent requirements than those in which we currently conduct business, we may have to incur significant expenses in order to comply, or we might have to restrict our operations. In addition, if we do not comply with applicable laws, regulations and decisions, we may lose licenses needed for the conduct of our business and may be subject to civil fines and criminal penalties, any of which could have a material adverse effect upon our business, results of operations of financial condition.
If we do not invest a sufficient portion of our assets in qualifying assets, we could be precluded from investing in certain assets or could be required to dispose of certain assets, which could have a material adverse effect on our business, financial condition and results of operations.
As a BDC, we are prohibited from acquiring any assets other than “qualifying assets” unless, at the time of and after giving effect to such acquisition, at least 70% of our total assets are qualifying assets. As of December 31, 2014, approximately $116.9 million, or approximately 9.8%, of our total assets were not “qualifying assets.” If we do not invest a sufficient portion of our assets in qualifying assets, we will be prohibited from investing in additional non-qualifying assets, which could have a material adverse effect on our business, financial condition and results of operations. Similarly, these rules could prevent us from making follow-on investments in existing portfolio companies (which could result in the dilution of our position) or could require us to dispose of investments at inopportune times in order to come into compliance with the 1940 Act. If we need to dispose of these investments quickly, it may be difficult to dispose of such investments on favorable terms. For example, we may have difficulty in finding a buyer and, even if a buyer is found, we may have to sell the investments at a substantial loss.
We will be subject to corporate-level U.S. federal income tax on all of our income if we are unable to qualify as a RIC under the Code, which would have a material adverse effect on our financial performance.
Although we are currently qualified as a RIC, no assurance can be given that we will be able to maintain RIC status. To maintain RIC status and be relieved of U.S. federal income taxes on income and gains distributed to its stockholders, we generally must meet the annual distribution, source-of-income and asset diversification requirements described below. In addition, our Leverage Program prohibits us from making distributions if doing so causes us to fail to maintain the asset coverage ratios stipulated by the 1940 Act or the Leverage Program.
To qualify as a RIC under the Code, we generally must meet certain source-of-income, asset diversification and annual distribution requirements. The annual distribution requirement for a RIC is satisfied if we distribute at least 90% of our ordinary income and net short-term capital gain in excess of net long-term capital loss, if any, to our stockholders. Since we use debt financing and have Preferred Interests outstanding, we are subject to certain asset coverage ratio requirements and other financial covenants under the terms of the Leverage Program, and we are, in some circumstances, also subject to similar requirements under the 1940 Act. The requirements could, under certain circumstances, restrict us from making distributions necessary to qualify as a RIC. If we are unable to obtain cash from other sources, we may fail to qualify as a RIC and, thus, may be subject to corporate-level income tax. To qualify as a RIC, we generally must also meet certain asset diversification requirements at the end of each calendar quarter. Failure to meet these tests may result in our having to dispose of certain investments quickly in order to prevent the loss of RIC status. Because we anticipate that most of our investments will be in private companies, any such dispositions could be made at disadvantageous prices and may result in substantial losses.
If we fail to qualify as a RIC for any reason and become subject to corporate-level income tax, the resulting corporate-level income taxes could substantially reduce our net assets, the amount of income available for distribution and the amount of our distributions.
| 36 |
We may have difficulty paying our required distributions if we recognize income before or without receiving cash representing such income.
For U.S. federal income tax purposes, we may include in income certain amounts that we have not yet received in cash, such as original issue discount, which may arise if we receive warrants in connection with the making of a loan or possibly in other circumstances, or PIK interest, which represents contractual interest added to the loan balance and due in the future, often only at the end of the loan. Such original issue discount, which could be significant relative to our overall investment activities, or increases in loan balances as a result of PIK arrangements are generally included in our taxable income before we receive any corresponding cash payments. We also may be required to include in income certain other amounts that we do not receive in cash.
Since we may recognize taxable income before or without receiving cash representing such income, if we invest to a substantial extent in non-cash paying debt instruments we may have difficulty meeting the tax requirement to distribute at least 90% of our ordinary income and net short-term capital gain in excess of net long-term capital loss, if any, to maintain our status as a RIC. Accordingly, we may have to sell some of our investments at times we would not consider advantageous, raise additional debt or equity capital or reduce new investment originations to meet these distribution requirements.
There is a risk that you may not receive distributions or that our distributions may not grow over time and a portion of our distributions may be a return of capital.
We intend to make distributions on a quarterly basis to our stockholders out of assets legally available for distribution. We cannot assure you that we will achieve investment results that will allow us to make a specified level of cash distributions or year-to-year increases in cash distributions. Our ability to pay distributions might be adversely affected by the impact of one or more of the risk factors described in this filing. Due to the asset coverage test applicable to us under the 1940 Act as a BDC, we may be limited in our ability to make distributions.
If we fail to maintain an effective system of internal control over financial reporting, we may not be able to accurately report our financial results or prevent fraud. As a result, stockholders could lose confidence in our financial and other public reporting, which would harm our business and the trading price of our common stock.
Effective internal controls over financial reporting are necessary for us to provide reliable financial reports and, together with adequate disclosure controls and procedures, are designed to prevent fraud. Any failure to implement required new or improved controls, or difficulties encountered in their implementation could cause us to fail to meet our reporting obligations. In addition, any testing by us conducted in connection with Section 404 of the Sarbanes-Oxley Act, or the subsequent testing by our independent registered public accounting firm (when undertaken, as noted below), may reveal deficiencies in our internal controls over financial reporting that are deemed to be material weaknesses or that may require prospective or retroactive changes to our consolidated financial statements or identify other areas for further attention or improvement. Inferior internal controls could also cause investors and lenders to lose confidence in our reported financial information, which could have a negative effect on the trading price of our common stock.
We face cyber-security risks.
Our business operations rely upon secure information technology systems for data processing, storage and reporting. Despite careful security and controls design, implementation and updating, our information technology systems could become subject to cyber-attacks. Network, system, application and data breaches could result in operational disruptions or information misappropriation, which could have a material adverse effect on our business, results of operations and financial condition.
The failure in cyber-security systems, as well as the occurrence of events unanticipated in our disaster recovery systems and management continuity planning could impair our ability to conduct business effectively.
The occurrence of a disaster such as a cyber-attack, a natural catastrophe, an industrial accident, a terrorist attack or war, events unanticipated in our disaster recovery systems, or a support failure from external providers, could have an adverse effect on our ability to conduct business and on our results of operations and financial condition, particularly if those events affect our computer-based data processing, transmission, storage, and retrieval systems or destroy data. If a significant number of our managers were unavailable in the event of a disaster, our ability to effectively conduct our business could be severely compromised.
We depend heavily upon computer systems to perform necessary business functions. Despite our implementation of a variety of security measures, our computer systems could be subject to cyber-attacks and unauthorized access, such as physical and electronic break-ins or unauthorized tampering. Like other companies, we may experience threats to our data and systems, including malware and computer virus attacks, unauthorized access, system failures and disruptions. If one or more of these events occurs, it could potentially jeopardize the confidential, proprietary and other information processed and stored in, and transmitted through, our computer systems and networks, or otherwise cause interruptions or malfunctions in our operations, which could result in damage to our reputation, financial losses, litigation, increased costs, regulatory penalties and/or customer dissatisfaction or loss.
| 37 |
We are dependent on information systems and systems failures could significantly disrupt our business, which may, in turn, negatively affect the market price of our common stock and our ability to pay dividends.
Our business is dependent on our and third parties’ communications and information systems. Any failure or interruption of those systems, including as a result of the termination of an agreement with any third-party service providers, could cause delays or other problems in our activities. Our financial, accounting, data processing, backup or other operating systems and facilities may fail to operate properly or become disabled or damaged as a result of a number of factors including events that are wholly or partially beyond our control and adversely affect our business. There could be:
| — | sudden electrical or telecommunications outages; |
| — | natural disasters such as earthquakes, tornadoes and hurricanes; |
| — | disease pandemics; |
| — | events arising from local or larger scale political or social matters, including terrorist acts; and |
| — | cyber-attacks. |
These events, in turn, could have a material adverse effect on our operating results and negatively affect the market price of our common stock and our ability to pay dividends to our stockholders.
Risks related to our common stock
Shares of our common stock may trade at a discount to our net asset value per share.
Common stock of BDCs, like that of closed-end investment companies, frequently trades at a discount to current net asset value, which could adversely affect the ability to raise capital. In the past, shares of our common stock have traded at a discount to our net asset value. The risk that shares of our common stock may continue to trade at a discount to our net asset value is separate and distinct from the risk that our net asset value per share may decline.
If we sell shares of our common stock at a discount to our net asset value per share, stockholders who do not participate in such sale will experience immediate dilution in an amount that may be material.
The issuance or sale by us of shares of our common stock at a discount to net asset value poses a risk of dilution to our stockholders. In particular, stockholders who do not purchase additional shares of common stock at or below the discounted price in proportion to their current ownership will experience an immediate decrease in net asset value per share (as well as in the aggregate net asset value of their shares of common stock if they do not participate at all). These stockholders will also experience a disproportionately greater decrease in their participation in our earnings and assets and their voting power than the increase we experience in our assets, potential earning power and voting interests from such issuance or sale. In addition, such sales may adversely affect the price at which our common stock trades.
Your interest in us may be diluted if you do not fully acquire your proportionate share of any warrants, options or other rights to subscribe for, convert to, or purchase our common stock that we sell. In addition, in such circumstances, if the price at which we sell such warrants, options or other rights to subscribe for, convert to, or purchase our common stock, together with the exercise price, is less than our net asset value per share, then you will experience dilution of the net asset value of your shares.
We received authority from our stockholders at our 2013 annual meeting to issue warrants, options or other rights to subscribe for, convert to, or purchase shares of our common stock, which may include convertible preferred stock and convertible debentures. In the event we issue warrants, options or other rights to subscribe for, convert into, or purchase our common stock, stockholders who do not exercise such rights will own a smaller proportional interest in us than would otherwise be the case, thereby diluting the proportionate ownership interest and voting power of such stockholder. We cannot state precisely the amount of any such dilution in share ownership or voting power because we have no current intention of making any such offering and do not know at this time the terms or amount of such rights. The amount of dilution that a stockholder will experience could be substantial and the market price and net asset value per share of our common stock could be adversely affected. Our common stockholders will also indirectly bear the expenses associated with any rights offering we may conduct, regardless of whether they elect to exercise any rights.
| 38 |
In addition, if the price at which we sell such warrants, options or other rights to subscribe for, convert to, or purchase our common stock, together with the exercise price, is less than the net asset value per share of our common stock, then our stockholders who do not acquire their proportionate share of such rights will experience dilution of the aggregate net asset value of their shares as a result of the offering. The amount of any such decrease in net asset value is not predictable because it is not known at this time what the price of the warrants, options or other rights to subscribe for, convert into, or purchase our common stock and net asset value per share will be.
Our common stock price may be volatile and may fluctuate substantially.
As with any stock, the price of our common stock will fluctuate with market conditions and other factors. If you sell shares, the price received may be more or less than the original investment. Net asset value will be reduced immediately following our offering by the amount of the sales load and selling expenses paid by us. At our 2014 annual meeting of stockholders held on May 15, 2014, our stockholders approved our ability, subject to the condition that the maximum number of shares salable below net asset value pursuant to this authority in any particular offering that could result in such dilution is limited to 25% of our then outstanding common stock immediately prior to each such offering, to sell shares of our common stock at any level of discount from net asset value per share during the 12 month period following the date of the meeting. It should be noted that, theoretically, we may offer up to 25% of our then outstanding common stock each day. We intend to seek stockholder approval at our 2015 annual meeting to continue for an additional year our ability to issue shares of common stock below net asset value, subject to the condition that the maximum number of shares salable below net asset value pursuant to this authority in any particular offering that could result in such dilution is limited to 25% of our then outstanding common stock immediately prior to each such offering. Our common stock is intended for long-term investors and should not be treated as a trading vehicle. Shares of BDCs and closed-end management investment companies, which are structured similarly to us, frequently trade at a discount from their net asset value. This characteristic of closed-end investment companies is separate and distinct from the risk that our net asset value per share of common stock may decline. We cannot predict whether our common stock will trade at, above or below net asset value. This risk of loss associated with this characteristic of BDCs and closed-end management investment companies may be greater for investors who sell their shares in a relatively short period of time after completion of an offering.
The market price of our common stock may fluctuate significantly.
The market price and liquidity of the market for our common stock may be significantly affected by numerous factors, some of which are beyond our control and may not be directly related to our operating performance. These factors include:
| • | significant volatility in the market price and trading volume of securities of BDCs or other companies in the sector in which we operate, which are not necessarily related to the operating performance of these companies; |
| • | price and volume fluctuations in the overall stock market from time to time; |
| • | changes in law, regulatory policies or tax guidelines, particularly with respect to SBICs, RICs or BDCs; |
| • | our loss of RIC status or TCPC SBIC's loss of SBIC status; |
| • | changes in earnings or variations in operating results; |
| • | changes in the value of our portfolio of investments; |
| • | any shortfall in revenue or net income or any increase in losses from levels expected by investors or securities analysts; |
| • | departure of key personnel from the Advisor; |
| • | operating performance of companies comparable to us; |
| • | short-selling pressure with respect to shares of our common stock or BDCs generally; |
| • | future sales of our securities convertible into or exchangeable or exercisable for our common stock or the conversion of such securities; |
| 39 |
| • | uncertainty surrounding the strength of the U.S. economic recovery; |
| • | general economic trends and other external factors; and |
| • | loss of a major funding source. |
| • |
| 40 |
Item 1B. Unresolved Staff Comments
None
We do not own any real estate or other physical properties materially important to our operation. Our executive offices are located at 2951 28 th Street Suite 1000, Santa Monica, CA 90405, and are provided by the Advisor in accordance with the terms of the Administration Agreement. We believe that our office facilities are suitable and adequate for our business as it is contemplated to be conducted.
We and the Advisor are not currently subject to any material pending legal proceedings threatened against us. From time to time, we may be a party to certain legal proceedings incidental to the normal course of our business including the enforcement of our rights under contracts with our portfolio companies. While the outcome of these legal proceedings cannot be predicted with certainty, we do not expect that these proceedings will have a material effect upon our business, financial condition or results of operations.
Item 4. Mine Safety Disclosures
Not applicable.
| 41 |
Item 5. Market for Registrant’s Common Equity, Related Stockholder Matters and Issuer Purchases of Equity Securities
Price Range of Common Stock
Our common stock began trading on April 5, 2012 and is currently traded on The Nasdaq Global Select Market under the symbol “TCPC.” The following table lists the high and low closing sale price for our common stock, the closing sale price as a percentage of net asset value, or NAV, and quarterly distributions per share since shares of our common stock began being regularly quoted on The Nasdaq Global Select Market. Our common stock historically has traded at prices both above and below its net asset value. There can be no assurance, however, that such premium or discount, as applicable, to net asset value will be maintained.
| Stock Price |
Premium/
(Discount) of High Sales Price |
Premium/
(Discount) of Low Sales Price to |
Declared | |||||||||||||||||||||
| NAV (1) | High (2) | Low (2) | to NAV (3) | NAV (3) | Dividends | |||||||||||||||||||
| Fiscal year ended December 31, 2013 | ||||||||||||||||||||||||
| First Quarter | $ | 14.91 | $ | 16.16 | $ | 14.64 | 8.4 | % | (1.8 | )% | $ 0.40 | (4) | ||||||||||||
| Second Quarter | 14.94 | 16.77 | 15.01 | 12.2 | % | 0.5 | % | 0.36 | ||||||||||||||||
| Third Quarter | 15.06 | 16.80 | 14.99 | 11.6 | % | (0.5 | )% | 0.36 | ||||||||||||||||
| Fourth Quarter | 15.18 | 17.42 | 15.98 | 14.8 | % | 5.3 | % | 0.41 | (4) | |||||||||||||||
| Fiscal year ended December 31, 2014 | ||||||||||||||||||||||||
| First Quarter | 15.32 | 17.97 | 16.36 | 17.3 | % | 6.8 | % | 0.36 | ||||||||||||||||
| Second Quarter | 15.31 | 18.31 | 15.80 | 19.6 | % | 3.2 | % | 0.41 | (4) | |||||||||||||||
| Third Quarter | 15.43 | 18.31 | 16.07 | 18.7 | % | 4.1 | % | 0.36 | ||||||||||||||||
| Fourth Quarter | 15.01 | 17.47 | 15.25 | 16.4 | % | 1.6 | % | 0.41 | (4) | |||||||||||||||
| (1) | NAV per share is determined as of the last day in the relevant quarter and therefore may not reflect the NAV per share on the date of the high and low sales prices. The NAVs shown are based on outstanding shares at the end of each period. |
| (2) | The High/Low Stock Price is calculated as of the closing price on a given day in the applicable quarter. |
| (3) | Calculated as the respective High/Low Stock Price minus the quarter end NAV, divided by the quarter end NAV. |
| (4) | Includes a special dividend of $0.05 per share. |
As of March 9, 2015, we had 35 stockholders of record, and we had approximately 28,800 beneficial owners whose shares are held in the names of the brokers, dealers and clearing agencies. On March 9, 2015, the last reported sales price of our common stock was $16.14 per share.
The table below sets forth each class of our outstanding securities as of March 9, 2015.
| Title of Class | Amount Authorized |
Amount Held by Registrant or
for its Account |
Amount Outstanding | |||||||||
| Common Stock | 200,000,000 | - | 48,710,627 | |||||||||
| 42 |
Distributions
Our quarterly dividends and distributions to common stockholders are recorded on the ex-dividend date and are determined by our board of directors. Distributions are declared considering our estimate of annual taxable income available for distribution to stockholders and the amount of taxable income carried over from the prior year for distribution in the current year. We do not have a policy to pay distributions at a specific level and expect to continue to distribute substantially all of our taxable income. Changes in investment results or focus, expense levels and other factors may have an effect on the amount of distributions we pay in the future. We cannot assure stockholders that they will receive any distributions or distributions at a particular level.
The following table summarizes the Company’s dividends declared for the year ended December 31, 2014:
| Date Declared | Record Date | Payment Date | Type | Amount Per Share | Total Amount | |||||||||
| March 6, 2014 | March 17, 2014 | March 31, 2014 | Regular | $ | 0.36 | $ | 13,031,970 | |||||||
| May 7, 2014 | June 18, 2014 | June 30, 2014 | Regular | 0.36 | 13,032,007 | |||||||||
| May 7, 2014 | June 18, 2014 | June 30, 2014 | Special | 0.05 | 1,810,001 | |||||||||
| August 7, 2014 | September 16, 2014 | September 30, 2014 | Regular | 0.36 | 15,267,647 | |||||||||
| November 5, 2014 | December 8, 2014 | December 31, 2014 | Regular | 0.36 | 17,535,779 | |||||||||
| November 5, 2014 | December 8, 2014 | December 31, 2014 | Special | 0.05 | 2,435,525 | |||||||||
| $ | 1.54 | $ | 63,112,929 | |||||||||||
The following table summarizes the Company’s dividends declared for the year ended December 31, 2013:
| Date Declared | Record Date | Payment Date | Type | Amount Per Share | Total Amount | |||||||||
| March 7, 2013 | March 18, 2013 | March 29, 2013 | Regular | $ | 0.35 | $ | 7,517,170 | |||||||
| March 7, 2013 | March 18, 2013 | March 29, 2013 | Special | 0.05 | 1,073,881 | |||||||||
| May 8, 2013 | June 7, 2013 | June 28, 2013 | Regular | 0.36 | 9,595,344 | |||||||||
| August 8, 2013 | September 9, 2014 | September 30, 2013 | Regular | 0.36 | 9,595,692 | |||||||||
| November 7, 2013 | December 10, 2013 | December 31, 2013 | Regular | 0.36 | 11,168,929 | |||||||||
| November 7, 2013 | December 10, 2013 | December 31, 2013 | Special | 0.05 | 1,551,240 | |||||||||
| $ | 1.53 | $ | 40,502,256 | |||||||||||
Tax characteristics of all dividends are reported to stockholders on Form 1099-DIV or Form 1042-S after the end of the calendar year.
We have elected to be taxed as a RIC under Subchapter M of the Code. In order to maintain favorable RIC tax treatment, we must distribute annually to our stockholders at least 90% of our ordinary income and realized net short-term capital gains in excess of realized net long-term capital losses, if any, out of the assets legally available for distribution. In order to avoid certain excise taxes imposed on RICs, we must distribute during each calendar year an amount at least equal to the sum of:
| · | 98% of our ordinary income (not taking into account any capital gains or losses) for the calendar year; |
| · | 98.2% of the amount by which our capital gains exceed our capital losses (adjusted for certain ordinary losses) for the one-year period generally ending on October 31 of the calendar year; and |
| · | certain undistributed amounts from previous years on which we paid no U.S. federal income tax. |
We may, at our discretion, carry forward taxable income in excess of calendar year distributions and pay a 4% excise tax on this income. If we choose to do so, all other things being equal, this would increase expenses and reduce the amounts available to be distributed to our stockholders. We will accrue excise tax on estimated taxable income as required. In addition, although we currently intend to distribute realized net capital gains (i.e., net long-term capital gains in excess of short-term capital losses), if any, at least annually, out of the assets legally available for such distributions, we may in the future decide to retain such capital gains for investment.
We have adopted an “opt in” dividend reinvestment plan for our common stockholders. As a result, if we declare a dividend or other distribution payable in cash, each stockholder that has not “opted in” to our dividend reinvestment plan will receive such dividends in cash, rather than having their dividends automatically reinvested in additional shares of our common stock.
| 43 |
We may not be able to achieve operating results that will allow us to make dividends and distributions at a specific level or to increase the amount of these dividends and distributions from time to time. Also, we may be limited in our ability to make dividends and distributions due to the asset coverage test applicable to us as a BDC under the 1940 Act and due to provisions in our existing and future credit facilities. If we do not distribute a certain percentage of our income annually, we will suffer adverse tax consequences, including possible loss of favorable RIC tax treatment. In addition, in accordance with U.S. generally accepted accounting principles and tax regulations, we include in income certain amounts that we have not yet received in cash, such as PIK interest, which represents contractual interest added to the loan balance that becomes due at the end of the loan term, or the accrual of original issue or market discount. Since we may recognize income before or without receiving cash representing such income, we may have difficulty meeting the requirement to distribute at least 90% of our investment company taxable income to obtain tax benefits as a RIC and may be subject to an excise tax.
In order to satisfy the annual distribution requirement applicable to RICs, we have the ability to declare a large portion of a dividend in shares of our common stock instead of in cash. As long as a portion of such dividend is paid in cash (which portion can be as low as 10% for dividends paid on or before December 31, 2014 with respect to any taxable year ending on or before December 31, 2013) and certain requirements are met, the entire distribution would be treated as a dividend for U.S. federal income tax purposes.
| 44 |
The selected consolidated financial and other data below reflects the consolidated historical operations of the Company.
The selected consolidated financial data below for the years ended December 31, 2014, 2013, 2012, 2011, and 2010 has been derived from the consolidated financial statements that were audited by our independent registered public accounting firm. This selected financial data should be read in conjunction with our financial statements and related notes thereto.
| For the Year Ended December 31, | ||||||||||||||||||||
| 2014 | 2013 | 2012 | 2011 | 2010 | ||||||||||||||||
| Performance Data: | ||||||||||||||||||||
| Interest income | $ | 100,923,265 | $ | 66,979,064 | $ | 49,243,332 | $ | 42,113,358 | $ | 32,410,819 | ||||||||||
| Dividend income | 1,968,748 | - | 1,811,189 | 10,610,159 | 13,547,924 | |||||||||||||||
| Lease income | 1,334,330 | 1,121,614 | 823,030 | 832,843 | 182,288 | |||||||||||||||
| Other income | 2,355,105 | 1,508,368 | 315,208 | 1,301,316 | 1,660,181 | |||||||||||||||
| Total investment income | 106,581,448 | 69,609,046 | 52,192,759 | 54,857,676 | 47,801,212 | |||||||||||||||
| Interest and credit agreement expenses | 9,821,751 | 2,339,447 | 857,757 | 942,288 | 893,806 | |||||||||||||||
| Investment advisory expense | 13,646,064 | 8,820,229 | 6,908,942 | 6,787,188 | 6,787,188 | |||||||||||||||
| Other expenses | 5,012,257 | 3,141,484 | 2,625,722 | 1,520,474 | 1,213,685 | |||||||||||||||
| Total expenses | 28,480,072 | 14,301,160 | 10,392,421 | 9,249,950 | 8,894,679 | |||||||||||||||
| Net investment income before taxes | 78,101,376 | 55,307,886 | 41,800,338 | 45,607,726 | 38,906,533 | |||||||||||||||
| Excise tax expense | 808,813 | 977,624 | 1,479,978 | - | - | |||||||||||||||
| Net investment income | 77,292,563 | 54,330,262 | 40,320,360 | 45,607,726 | 38,906,533 | |||||||||||||||
| Realized and unrealized gains (losses) | (27,304,578 | ) | 9,071,361 | (12,784,251 | ) | (38,878,881 | ) | 31,621,019 | ||||||||||||
| Dividends to preferred interest holders | (1,438,172 | ) | (1,494,552 | ) | (1,602,799 | ) | (1,545,555 | ) | (1,519,759 | ) | ||||||||||
| Distributions of incentive allocation | (14,002,294 | ) | (12,381,416 | ) | - | - | - | |||||||||||||
| Net increase in net assets from operations | $ | 34,547,519 | $ | 49,525,655 | $ | 25,933,310 | $ | 5,183,290 | $ | 69,007,793 | ||||||||||
| Per Share Data (at the end of the period):* | ||||||||||||||||||||
| Net increase in net assets from operations | $ | 0.88 | $ | 1.91 | $ | 1.21 | $ | 12.37 | $ | 164.72 | ||||||||||
| Distributions declared per share | (1.54 | ) | (1.53 | ) | (1.43 | ) | (75.19 | ) | (89.99 | ) | ||||||||||
| Average weighted shares outstanding for the period | 39,395,671 | 25,926,493 | 21,475,847 | 418,956 | 418,956 | |||||||||||||||
| Assets and Liabilities Data: | ||||||||||||||||||||
| Investments | $ | 1,146,535,886 | $ | 766,262,959 | $ | 517,683,087 | $ | 378,960,536 | $ | 453,034,872 | ||||||||||
| Other assets | 59,330,911 | 37,066,243 | 31,559,015 | 24,492,967 | 20,604,286 | |||||||||||||||
| Total assets | 1,205,866,797 | 803,329,202 | 549,242,102 | 403,453,503 | 473,639,158 | |||||||||||||||
| Amount drawn on credit facility | 328,696,830 | 95,000,000 | 74,000,000 | 29,000,000 | 50,000,000 | |||||||||||||||
| Other liabilities | 11,543,149 | 23,045,112 | 24,728,267 | 2,116,211 | 25,050,178 | |||||||||||||||
| Total liabilities | 340,239,979 | 118,045,112 | 98,728,267 | 31,116,211 | 75,050,178 | |||||||||||||||
| Preferred Stock | - | - | - | - | 23,527 | |||||||||||||||
| Preferred limited partnership interest | 134,497,790 | 134,504,252 | 134,526,285 | 134,466,418 | 134,377,869 | |||||||||||||||
| Non-controlling interest | - | 1,168,583 | - | - | - | |||||||||||||||
| Net assets | $ | 731,129,028 | $ | 549,611,255 | $ | 315,987,550 | $ | 237,870,874 | $ | 264,187,584 | ||||||||||
| Investment Activity Data: | ||||||||||||||||||||
| No. of portfolio companies at period end | 84 | 67 | 54 | 41 | 44 | |||||||||||||||
| Acquisitions | $ | 669,515,626 | $ | 471,087,319 | $ | 359,020,926 | $ | 237,870,874 | $ | 262,837,727 | ||||||||||
| Sales, repayments, and other disposals | $ | 266,008,974 | $ | 235,641,665 | $ | 211,216,033 | $ | 216,916,444 | $ | 192,419,667 | ||||||||||
| Weighted-average effective yield at end of period | 10.9 | % | 10.9 | % | 11.3 | % | 14.2 | % | 13.1 | % | ||||||||||
| * | Per share amounts prior to 2012 were calculated based on 418,986 pre-Conversion shares outstanding. Per share amounts starting in 2012 are calculated on weighted-average shares outstanding for each period. |
| 45 |
Item 7. Management’s Discussion and Analysis of Financial Condition and Results of Operations
The information contained in this section should be read in conjunction with our unaudited consolidated financial statements and related notes thereto appearing elsewhere in this annual report on Form 10-K. Some of the statements in this report (including in the following discussion) constitute forward-looking statements within the meaning of the Private Securities Litigation Reform Act of 1995, which relate to future events or the future performance or financial condition of TCP Capital Corp. (the “Holding Company,” “we,” “us,” or “our”). The forward-looking statements contained in this report involve a number of risks and uncertainties, including statements concerning:
| • | our, or our portfolio companies’, future business, operations, operating results or prospects; |
| • | the return or impact of current and future investments; |
| • | the impact of a protracted decline in the liquidity of credit markets on our business; |
| • | the impact of fluctuations in interest rates on our business; |
| • | the impact of changes in laws or regulations governing our operations or the operations of our portfolio companies; |
| • | our contractual arrangements and relationships with third parties; |
| • | the general economy and its impact on the industries in which we invest; |
| • | the financial condition of and ability of our current and prospective portfolio companies to achieve their objectives; |
| • | our expected financings and investments; |
| • | the adequacy of our financing resources and working capital; |
| • | the ability of our investment adviser to locate suitable investments for us and to monitor and administer our investments; |
| • | the timing of cash flows, if any, from the operations of our portfolio companies; |
| • | the timing, form and amount of any dividend distributions; and |
| • | our ability to maintain our qualification as a regulated investment company and as a business development company. |
We use words such as “anticipate,” “believe,” “expect,” “intend,” “will,” “should,” “could,” “may,” “plan” and similar words to identify forward-looking statements. The forward looking statements contained in this annual report involve risks and uncertainties. Our actual results could differ materially from those implied or expressed in the forward-looking statements for any reason, including the factors set forth as “Risk Factors” in this report.
We have based the forward-looking statements included in this report on information available to us on the date of this report, and we assume no obligation to update any such forward-looking statements. Although we undertake no obligation to revise or update any forward-looking statements, whether as a result of new information, future events or otherwise, you are advised to consult any additional disclosures that we may make directly to you or through reports that we have filed or in the future may file with the SEC, including annual reports on Form 10-K, registration statements on Form N-2, quarterly reports on Form 10-Q and current reports on Form 8-K.
Overview
The Holding Company is a Delaware corporation formed on April 2, 2012 and is an externally managed, closed-end, non-diversified management investment company. The Holding Company elected to be treated as a business development company (“BDC”) under the Investment Company Act of 1940, as amended (the “1940 Act”). Our investment objective is to seek to achieve high total returns through current income and capital appreciation, with an emphasis on principal protection. We invest primarily in the debt of middle-market companies as well as small businesses, including senior secured loans, junior loans, mezzanine debt and bonds. Such investments may include an equity component, and, to a lesser extent, we may make equity investments directly. Investment operations are conducted either in Special Value Continuation Partners, LP, a Delaware Limited Partnership (the “Operating Company”), of which the Holding Company owns 100% of the common limited partner interests, or in one of the Operating Company’s wholly-owned subsidiaries, TCPC Funding I, LLC (“TCPC Funding”) and TCPC SBIC, LP (the “SBIC”). The Operating Company has also elected to be treated as a BDC under the 1940 Act. The General Partner of the Operating Company is SVOF/MM, LLC (“SVOF/MM”), which also serves as the administrator (“Administrator”) of the Holding Company and the Operating Company. The managing member of SVOF/MM is Tennenbaum Capital Partners, LLC (the “Advisor”), which serves as the investment manager to the Holding Company, the Operating Company, TCPC Funding, and the SBIC. Most of the equity interests in the General Partner are owned directly or indirectly by the Advisor and its employees.
| 46 |
The SBIC was organized as a Delaware limited partnership in June 2013. On April 22, 2014, the SBIC received a license from the United States Small Business Administration (the “SBA”) to operate as a small business investment company under the provisions of Section 301(c) of the Small Business Investment Act of 1958.
The Holding Company has elected to be treated as a regulated investment company (“RIC”) for U.S. federal income tax purposes. As a RIC, the Holding Company will not be taxed on its income to the extent that it distributes such income each year and satisfies other applicable income tax requirements. The Operating Company, TCPC Funding, and the SBIC have elected to be treated as partnerships for U.S. federal income tax purposes.
On April 2, 2012, Special Value Continuation Fund, LLC (“SVCF”) converted from a limited liability company to a corporation, leaving the Holding Company as the surviving entity (the “Conversion”). At the time of the Conversion, all limited liability company interests were exchanged for 15,725,635 shares of common stock in the Holding Company. As a result of the Conversion, the books and records of SVCF have become the books and records of the surviving entity and the Operating Company became a wholly owned subsidiary of the Holding Company. On April 3, 2012, the Holding Company completed its initial public offering.
Our leverage program is comprised of $116 million in available debt under a senior secured revolving credit facility issued by the Operating Company (the “Operating Company Facility”), $250 million in available debt under a senior secured revolving credit facility issued by TCPC Funding (the “TCPC Funding Facility,” and, together with the Operating Company Facility, the “Revolving Facilities”), $108 million in convertible senior unsecured notes issued by the Holding Company (the “Convertible Notes”), $75 million in committed leverage from the SBA (the “SBA Program”), and $134 million of outstanding preferred limited partner interests in the Operating Company (the “Preferred Interests,” and, together with the Revolving Facilities, the Convertible Notes, and the SBA Program, the “Leverage Program”).
To qualify as a RIC, we must, among other things, meet certain source-of-income and asset diversification requirements and timely distribute to our stockholders generally at least 90% of our investment company taxable income, as defined by the Internal Revenue Code of 1986, as amended, for each year. Pursuant to this election, we generally will not have to pay corporate level taxes on any income that we distribute to our stockholders provided that we satisfy those requirements.
Investments
Our level of investment activity can and does vary substantially from period to period depending on many factors, including the amount of debt and equity capital available to middle-market companies, the level of merger and acquisition activity, the general economic environment and the competitive environment for the types of investments we make.
As a BDC, we are required to comply with certain regulatory requirements. For instance, we generally have to invest at least 70% of our total assets in “qualifying assets,” including securities and indebtedness of private U.S. companies, public U.S. operating companies whose securities are not listed on a national securities exchange or registered under the Securities Exchange Act of 1934, as amended, public domestic operating companies having a market capitalization of less than $250 million, cash, cash equivalents, U.S. government securities and high-quality debt investments that mature in one year or less. We are also permitted to make certain follow-on investments in companies that were eligible portfolio companies at the time of initial investment but that no longer meet the definition. As of December 31, 2014, 90.2% of our total assets were invested in qualifying assets.
Revenues
We generate revenues primarily in the form of interest on the debt we hold. We also generate revenue from dividends on our equity interests and capital gains on the sale of warrants and other debt or equity interests that we acquire. Our investments in fixed income instruments generally have an expected maturity of three to five years, although we have no lower or upper constraint on maturity. Interest on our debt investments is generally payable quarterly or semi-annually. Payments of principal of our debt investments may be amortized over the stated term of the investment, deferred for several years or due entirely at maturity. In some cases, our debt investments and preferred stock investments may defer payments of cash interest or dividends or PIK. Any outstanding principal amount of our debt investments and any accrued but unpaid interest will generally become due at the maturity date. In addition, we may generate revenue in the form of prepayment fees, commitment, origination, structuring or due diligence fees, fees for providing significant managerial assistance, consulting fees and other investment related income.
| 47 |
Expenses
Our primary operating expenses include the payment of a base management fee and, depending on our operating results, incentive compensation, expenses reimbursable under the management agreement, administration fees and the allocable portion of overhead under the administration agreement. The base management fee and incentive compensation remunerates the Advisor for work in identifying, evaluating, negotiating, closing and monitoring our investments. Our administration agreement with SVOF/MM, LLC (the “Administrator”) provides that the Administrator may be reimbursed for costs and expenses incurred by the Administrator for office space rental, office equipment and utilities allocable to us under the administration agreement, as well as any costs and expenses incurred by the Administrator or its affiliates relating to any non-investment advisory, administrative or operating services provided by the Administrator or its affiliates to us. We also bear all other costs and expenses of our operations and transactions (and the Holding Company’s common stockholders indirectly bear all of the costs and expenses of the Holding Company, the Operating Company, TCPC Funding and the SBIC), which may include those relating to:
| • | our organization; |
| • | calculating our net asset value (including the cost and expenses of any independent valuation firms); |
| • | interest payable on debt, if any, incurred to finance our investments; |
| • | costs of future offerings of our common stock and other securities, if any; |
| • | the base management fee and any incentive compensation; |
| • | dividends and distributions on our preferred shares, if any, and common shares; |
| • | administration fees payable under the administration agreement; |
| • | fees payable to third parties relating to, or associated with, making investments; |
| • | transfer agent and custodial fees; |
| • | registration fees; |
| • | listing fees; |
| • | taxes; |
| • | director fees and expenses; |
| • | costs of preparing and filing reports or other documents with the SEC; |
| • | costs of any reports, proxy statements or other notices to our stockholders, including printing costs; |
| • | our fidelity bond; |
| • | directors and officers/errors and omissions liability insurance, and any other insurance premiums; |
| • | indemnification payments; |
| • | direct costs and expenses of administration, including audit and legal costs; and |
| • | all other expenses reasonably incurred by us and the Administrator in connection with administering our business, such as the allocable portion of overhead under the administration agreement, including rent and other allocable portions of the cost of certain of our officers and their respective staffs. |
The investment management agreement provides that the base management fee be calculated at an annual rate of 1.5% of our total assets (excluding cash and cash equivalents) payable quarterly in arrears. For purposes of calculating the base management fee, “total assets” is determined without deduction for any borrowings or other liabilities. The base management fee is calculated based on the value of our total assets (excluding cash and cash equivalents) at the end of the most recently completed calendar quarter.
| 48 |
Additionally, the investment management agreement and the Amended and Restated Limited Partnership Agreement provide that the Advisor or its affiliates may be entitled to incentive compensation under certain circumstances. No incentive compensation was incurred prior to January 1, 2013. Beginning January 1, 2013, the incentive compensation equals the sum of (1) 20% of all ordinary income since January 1, 2013 and (2) 20% of all net realized capital gains (net of any net unrealized capital depreciation) since January 1, 2013, with each component being subject to a total return requirement of 8% of contributed common equity annually. The incentive compensation is payable to the General Partner by the Operating Company pursuant to the Amended and Restated Limited Partnership Agreement. If the Operating Company is terminated or for any other reason incentive compensation is not paid by the Operating Company, it would be paid pursuant to the investment management agreement between us and the Advisor. The determination of incentive compensation is subject to limitations under the 1940 Act and the Advisers Act.
Critical accounting policies
Our discussion and analysis of our financial condition and results of operations are based upon our financial statements, which have been prepared in accordance with GAAP. The preparation of these financial statements requires management to make estimates and assumptions that affect the reported amounts of assets, liabilities, revenues and expenses. Changes in the economic environment, financial markets and any other parameters used in determining such estimates could cause actual results to differ. Management considers the following critical accounting policies important to understanding the financial statements. In addition to the discussion below, our critical accounting policies are further described in the notes to our financial statements.
Valuation of portfolio investments
We value our portfolio investments at fair value based upon the principles and methods of valuation set forth in policies adopted by our board of directors. Fair value is defined as the price that would be received to sell an asset in an orderly transaction between market participants at the measurement date. Market participants are buyers and sellers in the principal (or most advantageous) market for the asset that (i) are independent of us, (ii) are knowledgeable, having a reasonable understanding about the asset based on all available information (including information that might be obtained through due diligence efforts that are usual and customary), (iii) are able to transact for the asset, and (iv) are willing to transact for the asset or liability (that is, they are motivated but not forced or otherwise compelled to do so).
Investments for which market quotations are readily available are valued at such market quotations unless the quotations are deemed not to represent fair value. We generally obtain market quotations from recognized exchanges, market quotation systems, independent pricing services or one or more broker-dealers or market makers. However, short term debt investments with remaining maturities within 90 days are generally valued at amortized cost, which approximates fair value. Debt and equity securities for which market quotations are not readily available, which is the case for many of our investments, or for which market quotations are deemed not to represent fair value, are valued at fair value using a consistently applied valuation process in accordance with our documented valuation policy that has been reviewed and approved by our board of directors, who also approve in good faith the valuation of such securities as of the end of each quarter. Due to the inherent uncertainty and subjectivity of determining the fair value of investments that do not have a readily available market value, the fair value of our investments may differ significantly from the values that would have been used had a readily available market value existed for such investments and may differ materially from the values that we may ultimately realize. In addition, changes in the market environment and other events may have differing impacts on the market quotations used to value some of our investments than on the fair values of our investments for which market quotations are not readily available. Market quotations may be deemed not to represent fair value in certain circumstances where we believe that facts and circumstances applicable to an issuer, a seller or purchaser, or the market for a particular security cause current market quotations to not reflect the fair value of the security. Examples of these events could include cases where a security trades infrequently causing a quoted purchase or sale price to become stale, where there is a “forced” sale by a distressed seller, where market quotations vary substantially among market makers, or where there is a wide bid-ask spread or significant increase in the bid-ask spread.
The valuation process approved by our board of directors with respect to investments for which market quotations are not readily available or for which market quotations are deemed not to represent fair value is as follows:
| • | The investment professionals of the Advisor provide recent portfolio company financial statements and other reporting materials to independent valuation firms approved by our board of directors. |
| • | Such firms evaluate this information along with relevant observable market data to conduct independent appraisals each quarter, and their preliminary valuation conclusions are documented and discussed with senior management of the Advisor. |
| 49 |
| • | The fair value of smaller investments comprising in the aggregate less than 5% of our total capitalization may be determined by the Advisor in good faith in accordance with our valuation policy without the employment of an independent valuation firm. |
| • | The audit committee of the board of directors discusses the valuations, and the board of directors approves the fair value of the investments in our portfolio in good faith based on the input of the Advisor, the respective independent valuation firms (to the extent applicable) and the audit committee of the board of directors. |
Those investments for which market quotations are not readily available or for which market quotations are deemed not to represent fair value are valued utilizing a market approach, an income approach, or both approaches, as appropriate. The market approach uses prices and other relevant information generated by market transactions involving identical or comparable assets or liabilities (including a business). The income approach uses valuation techniques to convert future amounts (for example, cash flows or earnings) to a single present amount (discounted). The measurement is based on the value indicated by current market expectations about those future amounts. In following these approaches, the types of factors that we may take into account in determining the fair value of our investments include, as relevant and among other factors: available current market data, including relevant and applicable market trading and transaction comparables, applicable market yields and multiples, security covenants, call protection provisions, information rights, the nature and realizable value of any collateral, the portfolio company’s ability to make payments, its earnings and discounted cash flows, the markets in which the portfolio company does business, comparisons of financial ratios of peer companies that are public, merger and acquisition comparables, our principal market (as the reporting entity) and enterprise values.
When valuing all of our investments, we strive to maximize the use of observable inputs and minimize the use of unobservable inputs. Inputs refer broadly to the assumptions that market participants would use in pricing an asset, including assumptions about risk. Inputs may be observable or unobservable. Observable inputs are inputs that reflect the assumptions market participants would use in pricing an asset or liability developed based on market data obtained from sources independent of us. Unobservable inputs are inputs that reflect our assumptions about the assumptions market participants would use in pricing an asset or liability developed based on the best information available in the circumstances.
Our investments may be categorized based on the types of inputs used in their valuation. The level in the GAAP valuation hierarchy in which an investment falls is based on the lowest level input that is significant to the valuation of the investment in its entirety. Investments are classified by GAAP into the three broad levels as follows:
Level 1 — Investments valued using unadjusted quoted prices in active markets for identical assets.
Level 2 — Investments valued using other unadjusted observable market inputs, e.g. quoted prices in markets that are not active or quotes for comparable instruments.
Level 3 — Investments that are valued using quotes and other observable market data to the extent available, but which also take into consideration one or more unobservable inputs that are significant to the valuation taken as a whole.
As of December 31, 2014, 0.0% of our investments were categorized as Level 1, 18.5% were categorized as Level 2, 80.9% were Level 3 investments valued based on valuations by independent third party sources, and 0.6% were Level 3 investments valued based on valuations by the Advisor.
Determination of fair value involves subjective judgments and estimates. Accordingly, the notes to our financial statements express the uncertainty with respect to the possible effect of such valuations, and any change in such valuations, on the financial statements.
Revenue recognition
Interest and dividend income, including income paid in kind, is recorded on an accrual basis to the extent that such amounts are determined to be collectible. Origination, structuring, closing, commitment and other upfront fees earned with respect to capital commitments are generally amortized or accreted into interest income over the life of the respective debt investment. Other fees, including certain amendment fees, prepayment fees and commitment fees on broken deals, are recognized as earned. Prepayment fees and similar income received upon the early repayment of a loan or debt security are included in interest income.
Certain of our debt investments are purchased at a considerable discount to par as a result of the underlying credit risks and financial results of the issuer, as well as general market factors that influence the financial markets as a whole. GAAP generally requires that discounts on the acquisition of corporate bonds, municipal bonds and treasury bonds be amortized using the effective-interest or constant-yield method. GAAP also requires that we consider the collectability of interest when making accruals. Accordingly, when accounting for purchase discounts, we recognize discount accretion income when it is probable that such amounts will be collected.
| 50 |
Net realized gains or losses and net change in unrealized appreciation or depreciation
We measure realized gains or losses by the difference between the net proceeds from the repayment or sale and the amortized cost basis of the investment, without regard to unrealized appreciation or depreciation previously recognized. Realized gains and losses are computed using the specific identification method. Net change in unrealized appreciation or depreciation reflects the change in portfolio investment values during the reporting period, including the reversal of previously recorded unrealized appreciation or depreciation when gains or losses are realized.
Portfolio and investment activity
During the year ended December 31, 2014, we invested approximately $669.5 million, comprised of new investments in 33 new and 16 existing portfolio companies, as well as draws made on existing commitments and PIK received on prior investments. Of these investments, 99.3% were in senior secured debt comprised of senior loans ($606.0 million, or 90.5% of the total) and senior secured notes ($58.8 million, or 8.8% of the total). The remaining $4.8 million (0.7% of the total) were comprised of five equity investments which were received in connection with debt investments made during the period. Additionally, we received approximately $266.0 million in proceeds from sales or repayments of investments during the year ended December 31, 2014. During the year ended December 31, 2013, we invested approximately $471.1 million across 34 new and 10 existing portfolio companies. Of these investments, 98% were in senior secured debt comprised of senior loans ($381.9 million, or 81% of the total) and senior secured notes ($81.9 million, or 17% of the total). The remaining $7.3 million (2% of the total) were comprised of two equity investments and PIK payments received on investments in unsecured debt. Additionally, we received approximately $235.6 million in proceeds from sales or repayments of investments during the year ended December 31, 2013.
At December 31, 2014, our investment portfolio of $1,146.5 million (at fair value) consisted of 84 portfolio companies and was invested 97% in debt investments, of which 100% was in senior secured debt. In aggregate, our investment portfolio was invested 82% in senior secured loans, 15% in senior secured notes, and 3% in equity investments. Our average portfolio company investment at fair value was approximately $13.6 million. Our largest portfolio company investment by value was approximately $41.8 million and our five largest portfolio company investments by value comprised approximately 14% of our portfolio at December 31, 2014.
At December 31, 2013, our investment portfolio of $766.3 million (at fair value) consisted of 67 portfolio companies and was invested 95% in debt investments, of which 98% was in senior secured debt and 2% in unsecured or subordinated debt. In aggregate, our investment portfolio was invested 76% in senior secured loans, 17% in senior secured notes, 2% in unsecured or subordinated debt, and 5% in equity investments. Our average portfolio company investment at fair value was approximately $11.4 million. Our largest portfolio company investment by value was approximately $21.3 million and our five largest portfolio company investments by value comprised approximately 13% of our portfolio at December 31, 2013.
| 51 |
The industry composition of our portfolio at fair value at December 31, 2014 was as follows:
| Percent of Total | ||||
| Industry | Investments | |||
| Software Publishers | 9.9 | % | ||
| Computer Systems Design and Related Services | 8.1 | % | ||
| Basic Chemical Manufacturing | 6.3 | % | ||
| Insurance Carriers | 4.5 | % | ||
| Scientific Research and Development Services | 3.6 | % | ||
| Business Support Services | 3.1 | % | ||
| Wired Telecommunications Carriers | 2.9 | % | ||
| Scheduled Air Transportation | 2.8 | % | ||
| Grocery Stores | 2.8 | % | ||
| Data Processing, Hosting, and Related Services | 2.5 | % | ||
| Management, Scientific, and Technical Consulting Services | 2.4 | % | ||
| Radio and Television Broadcasting | 2.3 | % | ||
| Nondepository Credit Intermediation | 2.2 | % | ||
| Wireless Telecommunications | 2.2 | % | ||
| Utility System Construction | 2.2 | % | ||
| Textile Furnishings Mills | 2.2 | % | ||
| Oil and Gas Extraction | 2.1 | % | ||
| Nonscheduled Air Transportation | 2.0 | % | ||
| Semiconductor and Other Electronic Component Manufacturing | 1.9 | % | ||
| Electrical Equipment and Component Manufacturing | 1.8 | % | ||
| General Medical and Surgical Hospitals | 1.8 | % | ||
| Chemical Manufacturing | 1.7 | % | ||
| Other Information Services | 1.7 | % | ||
| Communications Equipment Manufacturing | 1.6 | % | ||
| Retail | 1.5 | % | ||
| Gaming Industries | 1.5 | % | ||
| Activities Related to Real Estate | 1.4 | % | ||
| Lessors of Nonfinancial Intangible Assets | 1.4 | % | ||
| Advertising, Public Relations, and Related Services | 1.3 | % | ||
| Specialty Hospitals | 1.3 | % | ||
| Full-Service Restaurants | 1.3 | % | ||
| Structured Note Funds | 1.3 | % | ||
| Motion Picture and Video Industries | 1.3 | % | ||
| Cut and Sew Apparel Manufacturing | 1.3 | % | ||
| Artificial Synthetic Fibers and Filaments Manufacturing | 1.2 | % | ||
| Other Telecommunications | 1.2 | % | ||
| Lessors of Real Estate | 1.2 | % | ||
| Newspaper, Periodical, Book, and Directory Publishers | 1.1 | % | ||
| Computer Equipment Manufacturing | 1.0 | % | ||
| Other | 6.1 | % | ||
| Total | 100.0 | % | ||
The weighted average effective yield of the debt securities in our portfolio was 10.9% at December 31, 2014 and 10.9% at December 31, 2013. At December 31, 2014, 78.3% of our debt investments bore interest based on floating rates, such as LIBOR, EURIBOR, the Federal Funds Rate or the Prime Rate, and 21.7% bore interest at fixed rates. The percentage of our floating rate debt investments that bore interest based on an interest rate floor was 83.1% at December 31, 2014. At December 31, 2013, 71.2% of our debt investments bore interest based on floating rates, and 28.8% bore interest at fixed rates. The percentage of our floating rate debt investments that bore interest based on an interest rate floor was 92.1% at December 31, 2013.
| 52 |
Results of operations
Investment income
Investment income totaled $106.6 million, $69.6 million and $52.2 million, respectively, for the years ended December 31, 2014, 2013 and 2012, of which $100.9 million, $67.0 million and $49.3 million were attributable to interest and fees on our debt investments, $2.0 million, $0.0 million and $1.8 million to dividends from equity securities, $1.3 million, $1.1 million and $0.8 million to lease income, and $2.4 million, $1.5 million and $0.3 million to other income, respectively. The increase in investment income in the year ended December 31, 2014 compared to the year ended December 31, 2013 reflects an increase in interest income due to the larger investment portfolio and a higher percentage of the portfolio in income-producing assets in the year ended December 31, 2014 compared to the year ended December 31, 2013 and an increase in dividend income. The increase in investment income in the year ended December 31, 2013 compared to the year ended December 31, 2012 reflects an increase in interest income due to the larger investment portfolio and a higher percentage of the portfolio in income-producing assets in the year ended December 31, 2013 compared to the year ended December 31, 2012 and an increase in other income, offset somewhat by a decrease in dividend income.
Expenses
Total operating expenses for the years ended December 31, 2014, 2013 and 2012 were $28.5 million, $14.3 million and $10.4 million respectively, comprised of $13.6 million, $8.8 million and $6.9 million in base management fees, $7.9 million, $1.5 million and $0.4 million in interest expense and fees related to the Revolving Facilities, $1.9 million, $0.9 million and $0.4 million in amortization of debt issuance costs, $1.4 million, $0.8 million and $1.6 million in legal and professional fees (including professional fees related to the Conversion), and $3.7 million, $2.3 million and $1.5 million in other expenses, respectively. The increase in expenses in the year ended December 31, 2014 compared to the year ended December 31, 2013 primarily reflects the increase in management fees due to the larger portfolio and the increase in interest expense and other costs related to the increase in available and outstanding debt and the higher average interest rate following the issuance of the Convertible Notes. The increase in expenses in the year ended December 31, 2013 compared to the year ended December 31, 2012 primarily reflects the increase in management fees due to the larger portfolio, the increase in interest expense and fees related to the increase in available and outstanding debt, and approximately $0.8 million in administration expenses previously waived by the Administrator.
Net investment income
Net investment income was $77.3 million, $54.3 million and $40.3 million respectively, for the years ended December 31, 2014, 2013 and 2012. The increase in in net investment income in the year ended December 31, 2014 compared to the year ended December 31, 2013 primarily reflects the increased interest income in the year ended December 31, 2014, partially offset by the increase in expenses. The increase in in net investment income in the year ended December 31, 2013 compared to the year ended December 31, 2012 primarily reflects the increased interest income in the year ended December 31, 2013, partially offset by the increase in expenses.
Net realized and unrealized gain or loss
Net realized losses for the years ended December 31, 2014, 2013 and 2012 were $(21.1) million, $(47.4) million and $(16.0) million respectively. Net realized losses during the year ended December 31, 2014 were primarily due the exit of two investments. We realized a loss of $11.5 million from Doral Financial Corp, an investment acquired as part of our legacy strategy. The loss recognition had a de minimis impact on net asset value as the loss was previously included in unrealized losses at the beginning of the year. Additionally, we realized a $5.2 million loss on Real Mex Holdco, LLC. This investment was initially acquired as part of our legacy distressed debt strategy. The overall Real Mex investment has generated substantial cash interest income.
Net realized losses during the year ended December 31, 2013 were primarily due to a charge of $45.1 million from the tender of all of our shares of common stock of Bally Total Fitness Holding Corporation ("BTF"). The tender price was slightly higher than the fair value as of December 31, 2012 and had a de minimis impact on net asset value. This charge was previously included in unrealized losses at the beginning of the year. The initial BTF investment was acquired at a significant discount as part of our legacy distressed debt strategy and generated substantial cash interest income. Additionally, we took a charge of $7.0 million on the recapitalization of AGY Holding Corp. (“AGY”), a transaction in which we received both new debt and preferred equity in a deleveraged company. The initial AGY investment was also part of our legacy distressed debt strategy and has generated substantial cash interest income. Excluding these charges, net realized gains for the year ended December 31, 2013 were $4.7 million.
The net realized losses during the year ended December 31, 2012 were due to a charge of $33.8 million on a restructuring of Bulgaria Telecom, $29.3 million of which were previously included in unrealized losses, and a reorganization charge on one other debt investment of $(5.5) million, partially offset by a gain of $17.0 million from the sale of International Wire Group Holdings, Inc. equity, and net gains of $6.3 million primarily from three debt investments.
For the years ended December 31, 2014, 2013 and 2012, the change in net unrealized appreciation/depreciation was $(6.2) million, $56.5 million and $3.2 million, respectively. The change in net unrealized depreciation for the year ended December 31, 2014 was primarily a result of unrealized losses on two investments which performed below expectations, Edmentum ($10.4 million) and Iracore ($6.2 million), partially offset by a $10.9 million reversal of the prior unrealized loss on the Doral investment. The change in net unrealized appreciation for the year ended December 31, 2013 was primarily due to the reversal of unrealized depreciation on our BTF and AGY investments. The change in net unrealized appreciation for the year ended December 31, 2012 was primarily due to reversals of prior period net unrealized losses.
| 53 |
Income tax expense, including excise tax
The Holding Company has elected to be treated as a RIC under Subchapter M of the Internal Revenue Code (“the Code”) and operates in a manner so as to qualify for the tax treatment applicable to RICs. To qualify as a RIC, the Holding Company must, among other things, timely distribute to its stockholders generally at least 90% of its investment company taxable income, as defined by the Code, for each year. The Holding Company has made and intends to continue to make the requisite distributions to its stockholders which will generally relieve the Holding Company from U.S. federal income taxes.
Depending on the level of taxable income earned in a tax year, we may choose to carry forward taxable income in excess of current year dividend distributions from such current year taxable income into the next tax year and pay a 4% excise tax on such income. Any excise tax expense is recorded at year end as such amounts are known. For the year ended December 31, 2014, an expense of $0.8 million was recorded for U.S. federal excise tax, which related to 2014 income. For the year ended December 31, 2013, an expense of $1.0 million was recorded for U.S. federal excise tax, which related to 2013 income. For the year ended December 31, 2012, an expense of $1.5 million was recorded for U.S. federal excise tax, which related to 2012 and 2011 income.
Dividends to preferred equity holders
Dividends on the Preferred Interests for the years ended December 31, 2014, 2013 and 2012 were $1.4 million, $1.5 million and $1.6 million, respectively, as average LIBOR rates for the periods were similar.
Incentive compensation
Incentive compensation distributable to the General Partner for the years ended December 31, 2014 and 2013 was $15.2 million and $11.2 million, respectively. No incentive compensation was incurred prior to January 1, 2013. Incentive compensation for the years ended December 31, 2014 and 2013 was distributable due to our performance exceeding the total return threshold. The change in reserve for incentive compensation to the General Partner for the years ended December 31, 2014 and December 31, 2013 was $(1.2) million and $1.2 million, respectively. The change in reserve for incentive compensation for the years ended December 31, 2014 and 2013 represents the change in the amount in excess of distributable incentive compensation which would have been earned by the General Partner had we liquidated at net asset value at December 31, 2014 and December 31, 2013, respectively.
Net increase or decrease in net assets resulting from operations
The net increase in net assets resulting from operations was $34.5 million, $49.5 million and $25.9 million for the years ended December 31, 2014, 2013 and 2012, respectively. The lower net increase in net assets resulting from operations during the year ended December 31, 2014 is primarily due to the net realized and unrealized loss during the year ended December 31, 2014 compared to the net realized and unrealized gain during the year ended December 31, 2013. The higher net increase in net assets resulting from operations for the year ended December 31, 2013 compared to the year ended December 31, 2012 primarily reflects the increase in net investment income and the increase in net realized and unrealized gains, partially offset by the commencement of incentive compensation.
Liquidity and capital resources
Since our inception, our liquidity and capital resources have been generated primarily through the initial private placement of common shares of SVCF (the predecessor entity) which were subsequently converted to common stock of the Holding Company, the net proceeds from the initial and secondary public offerings of our common stock, amounts outstanding under our Leverage Program, and cash flows from operations, including investments sales and repayments and income earned from investments and cash equivalents. The primary uses of cash have been investments in portfolio companies, cash distributions to our equity holders, payments to service our Leverage Program and other general corporate purposes.
The following table summarizes the total shares issued and proceeds received in the public offering of the Company’s common stock net of underwriting discounts and offering costs as well as shares issued in connection with the Company’s dividend reinvestment plan for the year ended December 31, 2014.
| 54 |
| Shares Issued | Price Per Share | Net Proceeds | ||||||||||
| August 1, 2014 public offering | 6,210,000 | $ | 17.33 | $ | 103,940,721 | |||||||
| November 26, 2014 public offering | 5,900,000 | 17.05 | 97,198,756 | |||||||||
| Shares issued from dividend reinvestment plan | 456 | 16.86 | * | 7,687 | ||||||||
The following table summarizes the total shares issued and proceeds received in the public offering of the Company’s common stock net of underwriting discounts and offering costs as well as shares issued in connection with the Company’s dividend reinvestment plan for the year ended December 31, 2013:
| Shares Issued | Price Per Share | Net Proceeds | ||||||||||
| May 21, 2013 public offering | 5,175,000 | $ | 15.63 | $ | 78,176,790 | |||||||
| October 1, 2013 public offering | 4,370,000 | 15.76 | 66,473,600 | |||||||||
| December 18, 2013 public offering | 5,175,000 | 16.00 | 79,912,500 | |||||||||
| Shares issued from dividend reinvestment plan | 2,288 | 16.35 | * | 37,416 | ||||||||
* Weighted-average price per share.
On October 3, 2014, we entered into an at-the-market equity offering program (the “ATM Program”) with Raymond James & Associates Inc. and Cantor Fitzgerald & Co. through which we may offer and sell, by means of at-the-market offerings from time to time, shares of our common stock having an aggregate offering price of up to $100,000,000. During the year ended December 31, 2014, we sold 400,225 shares of our common stock at an average price of $16.04 per share under the ATM Program, raising $6,420,426 in net proceeds.
Amounts outstanding and available under the combined Leverage Program at December 31, 2014 were as follows:
| Rate | Carrying Value ** | Available | Total Capacity | |||||||||||||
| Operating Company Facility | L+2.5 | % * | $ | 70,000,000 | $ | 46,000,000 | $ | 116,000,000 | ||||||||
| TCPC Funding Facility | L+2.5 | % * | 125,000,000 | 125,000,000 | 250,000,000 | |||||||||||
| Convertible Notes ($108 million par) | 5.25 | % | 105,696,830 | - | 105,696,830 | |||||||||||
| SBA Program | 3.015 | % † | 28,000,000 | 47,000,000 | 75,000,000 | |||||||||||
| Preferred Interests | L+0.85 | % * | 134,000,000 | - | 134,000,000 | |||||||||||
| Total Leverage Program | $ | 462,696,830 | $ | 218,000,000 | $ | 680,696,830 | ||||||||||
*
Based on either LIBOR or the lender’s cost of funds, subject to certain limitations.
** Except for the Convertible Notes, all carrying values are the same as the principal amounts outstanding.
† Interest rate on pooled loans, excluding fees of 0.355%. As of December 31, 2014, $9.5 million of the outstanding amount bore interest at a temporary rate of 0.555% plus fees of 0.355% through March 25, 2015, the date of the next SBA pooling.
Net cash used in operating activities during the year ended December 31, 2014 was $368.1 million. Our primary use of cash in operating activities during this period consisted of the settlement of acquisitions of investments (net of dispositions) of $397.5 million, partially offset by net investment income less preferred dividends and incentive allocation (net of non-cash income and expenses) of approximately $29.4 million.
Net cash provided by financing activities was $372.4 million during the year ended December 31, 2014, consisting primarily of $236.0 million of net borrowings and $207.6 million of net proceeds from the public offering of our common stock on August 1, 2014 and November 26, 2014, reduced by $58.9 million in regular dividends on common equity, $4.2 million in special dividends on common equity, payment of $6.7 million in debt issuance costs, and $1.4 million in dividends on the Preferred Interests.
At December 31, 2014, we had $27.3 million in cash and cash equivalents.
The Revolving Facilities are secured by substantially all of the assets in our portfolio, including cash and cash equivalents, and are subject to compliance with customary affirmative and negative covenants, including the maintenance of a minimum shareholders’ equity, the maintenance of a ratio of not less than 200% of total assets (less total liabilities other than indebtedness) to the sum of total preferred equity and indebtedness, and restrictions on certain payments and issuance of debt. Unfavorable economic conditions may result in a decrease in the value of our investments, which would affect both the asset coverage ratios and the value of the collateral securing the Revolving Facilities, and may therefore impact our ability to borrow under the Revolving Facilities. In addition to regulatory restrictions that restrict our ability to raise capital, the Leverage Program contains various covenants which, if not complied with, could accelerate repayment of debt or require redemption of the Preferred Interests, thereby materially and adversely affecting our liquidity, financial condition and results of operations. At December 31, 2014, we were in compliance with all financial and operational covenants required by the Leverage Program.
| 55 |
Unfavorable economic conditions, while potentially creating attractive opportunities for us, may decrease liquidity and raise the cost of capital generally, which could limit our ability to renew, extend or replace the Leverage Program on terms as favorable as are currently included therein. If we are unable to renew, extend or replace the Leverage Program upon the various dates of maturity, we expect to have sufficient funds to repay the outstanding balances in full from our net investment income and sales of, and repayments of principal from, our portfolio company investments, as well as from anticipated debt and equity capital raises, among other sources. Unfavorable economic conditions may limit our ability to raise capital or the ability of the companies in which we invest to repay our loans or engage in a liquidity event, such as a sale, recapitalization or initial public offering. The Operating Company Facility, the TCPC Funding Facility and the Convertible Notes mature in July 2016, May 2017, and December 2019, respectively, and the Preferred Interests will be subject to mandatory redemption in July 2016. Any inability to renew, extend or replace the Leverage Program could adversely impact our liquidity and ability to find new investments or maintain distributions to our stockholders.
Challenges in the market are intensified for us by certain regulatory limitations under the Code and the 1940 Act. To maintain our qualification as a RIC, we must satisfy, among other requirements, an annual distribution requirement to pay out at least 90% of our ordinary income and short-term capital gains to our stockholders. Because we are required to distribute our income in this manner, and because the illiquidity of many of our investments may make it difficult for us to finance new investments through the sale of current investments, our ability to make new investments is highly dependent upon external financing. While we anticipate being able to continue to satisfy all covenants and repay the outstanding balances under the Leverage Program when due, there can be no assurance that we will be able to do so, which could lead to an event of default.
Contractual obligations
In addition to obligations under our Leverage Program, we have entered into several contracts under which we have future commitments. Pursuant to an investment management agreement, the Advisor manages our day-to-day operations and provides investment advisory services to us. Payments under the investment management agreement will be equal to a percentage of the value of our gross assets (excluding cash and cash equivalents) and an incentive compensation, plus reimbursement of certain expenses incurred by the Advisor. Under our administration agreement, the Administrator provides us with administrative services, facilities and personnel. Payments under the administration agreement are equal to an allocable portion of overhead and other expenses incurred by the Administrator in performing its obligations to us, and may include rent and our allocable portion of the cost of certain of our officers and their respective staffs. We are responsible for reimbursing the Advisor for due diligence and negotiation expenses, fees and expenses of custodians, administrators, transfer and distribution agents, counsel and directors, insurance, filings and registrations, proxy expenses, expenses of communications to investors, compliance expenses, interest, taxes, portfolio transaction expenses, costs of responding to regulatory inquiries and reporting to regulatory authorities, costs and expenses of preparing and maintaining our books and records, indemnification, litigation and other extraordinary expenses and such other expenses as are approved by the directors as being reasonably related to our organization, offering, capitalization, operation or administration and any portfolio investments, as applicable. The Advisor is not responsible for any of the foregoing expenses and such services are not investment advisory services under the 1940 Act. Either party may terminate each of the investment management agreement and administration agreement without penalty upon not less than 60 days’ written notice to the other.
Distributions
Our quarterly dividends and distributions to common stockholders are recorded on the ex-dividend date. Distributions are declared considering our estimate of annual taxable income available for distribution to stockholders and the amount of taxable income carried over from the prior year for distribution in the current year. We do not have a policy to pay distributions at a specific level and expect to continue to distribute substantially all of our taxable income. We cannot assure stockholders that they will receive any distributions or distributions at a particular level.
| 56 |
The following tables summarize dividends declared for the year ended December 31, 2014 and December 31, 2013:
| Date Declared | Record Date | Payment Date | Type | Amount Per Share | Total Amount | |||||||||
| March 6, 2014 | March 17, 2014 | March 31, 2014 | Regular | $ | 0.36 | $ | 13,031,970 | |||||||
| May 7, 2014 | June 18, 2014 | June 30, 2014 | Regular | 0.36 | 13,032,007 | |||||||||
| May 7, 2014 | June 18, 2014 | June 30, 2014 | Special | 0.05 | 1,810,001 | |||||||||
| August 7, 2014 | September 16, 2014 | September 30, 2014 | Regular | 0.36 | 15,267,647 | |||||||||
| November 5, 2014 | December 8, 2014 | December 31, 2014 | Regular | 0.36 | 17,535,779 | |||||||||
| November 5, 2014 | December 8, 2014 | December 31, 2014 | Special | 0.05 | 2,435,525 | |||||||||
| $ | 1.54 | $ | 63,112,929 | |||||||||||
| Date Declared | Record Date | Payment Date | Type | Amount Per Share | Total Amount | |||||||||
| March 7, 2013 | March 18, 2013 | March 29, 2013 | Regular | $ | 0.35 | $ | 7,517,170 | |||||||
| March 7, 2013 | March 18, 2013 | March 29, 2013 | Special | 0.05 | 1,073,881 | |||||||||
| May 8, 2013 | June 7, 2013 | June 28, 2013 | Regular | 0.36 | 9,595,344 | |||||||||
| August 8, 2013 | September 9, 2014 | September 30, 2013 | Regular | 0.36 | 9,595,692 | |||||||||
| November 7, 2013 | December 10, 2013 | December 31, 2013 | Regular | 0.36 | 11,168,929 | |||||||||
| November 7, 2013 | December 10, 2013 | December 31, 2013 | Special | 0.05 | 1,551,240 | |||||||||
| $ | 1.53 | $ | 40,502,256 | |||||||||||
The following table summarizes the total shares issued in connection with our dividend reinvestment plan for the year ended December 31, 2014 and 2013:
| 2014 | 2013 | |||||||
| Shares Issued | 456 | 2,288 | ||||||
| Average Price Per Share | $ | 16.86 | $ | 16.35 | ||||
| Proceeds | $ | 7,687 | $ | 37,416 | ||||
We have elected to be taxed as a RIC under Subchapter M of the Code. In order to maintain favorable RIC tax treatment, we must distribute annually to our stockholders at least 90% of our ordinary income and realized net short-term capital gains in excess of realized net long-term capital losses, if any, out of the assets legally available for distribution. In order to avoid certain excise taxes imposed on RICs, we must distribute during each calendar year an amount at least equal to the sum of:
| • | 98% of our ordinary income (not taking into account any capital gains or losses) for the calendar year; |
| • | 98.2% of the amount by which our capital gains exceed our capital losses (adjusted for certain ordinary losses) for the one-year period generally ending on October 31 of the calendar year; and |
| • | certain undistributed amounts from previous years on which we paid no U.S. federal income tax. |
We may, at our discretion, carry forward taxable income in excess of calendar year distributions and pay a 4% excise tax on this income. If we choose to do so, all other things being equal, this would increase expenses and reduce the amounts available to be distributed to our stockholders. We will accrue excise tax on estimated taxable income as required. In addition, although we currently intend to distribute realized net capital gains (i.e., net long-term capital gains in excess of short-term capital losses), if any, at least annually, out of the assets legally available for such distributions, we may in the future decide to retain such capital gains for investment.
We have adopted an “opt in” dividend reinvestment plan for our common stockholders. As a result, if we declare a dividend or other distribution payable in cash, each stockholder that has not “opted in” to our dividend reinvestment plan will receive such dividends in cash, rather than having their dividends automatically reinvested in additional shares of our common stock.
We may not be able to achieve operating results that will allow us to make dividends and distributions at a specific level or to increase the amount of these dividends and distributions from time to time. Also, we may be limited in our ability to make dividends and distributions due to the asset coverage test applicable to us as a BDC under the 1940 Act and due to provisions in our existing and future credit facilities. If we do not distribute a certain percentage of our income annually, we will suffer adverse tax consequences, including possible loss of favorable RIC tax treatment. In addition, in accordance with U.S. generally accepted accounting principles and tax regulations, we include in income certain amounts that we have not yet received in cash, such as PIK interest, which represents contractual interest added to the loan balance that becomes due at the end of the loan term, or the accrual of original issue or market discount. Since we may recognize income before or without receiving cash representing such income, we may have difficulty meeting the requirement to distribute at least 90% of our investment company taxable income to obtain tax benefits as a RIC and may be subject to an excise tax.
| 57 |
In order to satisfy the annual distribution requirement applicable to RICs, we have the ability to declare a large portion of a dividend in shares of our common stock instead of in cash. As long as a portion of such dividend is paid in cash and certain requirements are met, the entire distribution would be treated as a dividend for U.S. federal income tax purposes.
Related Parties
We have entered into a number of business relationships with affiliated or related parties, including the following:
| • | Each of the Holding Company, the Operating Company, TCPC Funding, and the SBIC has entered into an investment management agreement with the Advisor. |
| • | The Administrator provides us with administrative services necessary to conduct our day-to-day operations. For providing these services, facilities and personnel, the Administrator may be reimbursed by us for expenses incurred by the Administrator in performing its obligations under the administration agreement, including our allocable portion of the cost of certain of our officers and the Administrator’s administrative staff and providing, at our request and on our behalf, significant managerial assistance to our portfolio companies to which we are required to provide such assistance. |
| • | We have entered into a royalty-free license agreement with the Advisor, pursuant to which the Advisor has agreed to grant us a non-exclusive, royalty-free license to use the name “TCP.” |
| • | Pursuant to its limited partnership agreement, the general partner of the Operating Company is SVOF/MM, LLC. SVOF/MM, LLC is an affiliate of the Advisor and the general partners or managing member of certain other funds managed by the Advisor. |
The Advisor and its affiliates, employees and associates currently do and in the future may manage other funds and accounts. The Advisor and its affiliates may determine that an investment is appropriate for us and for one or more of those other funds or accounts. Accordingly, conflicts may arise regarding the allocation of investments or opportunities among us and those accounts. In general, the Advisor will allocate investment opportunities pro rata among us and the other funds and accounts (assuming the investment satisfies the objectives of each) based on the amount of committed capital each then has available. The allocation of certain investment opportunities in private placements is subject to independent director approval pursuant to the terms of the co-investment exemptive order applicable to us. In certain cases, investment opportunities may be made other than on a pro rata basis. For example, we may desire to retain an asset at the same time that one or more other funds or accounts desire to sell it or we may not have additional capital to invest at a time the other funds or accounts do. If the Advisor is unable to manage our investments effectively, we may be unable to achieve our investment objective. In addition, the Advisor may face conflicts in allocating investment opportunities between us and certain other entities that could impact our investment returns. While our ability to enter into transactions with our affiliates is restricted under the 1940 Act, we have received an exemptive order from the SEC permitting certain affiliated investments subject to certain conditions. As a result, we may face conflict of interests and investments made pursuant to the exemptive order conditions which could in certain circumstances affect adversely the price paid or received by us or the availability or size of the position purchased or sold by us.
Recent Developments
From January 1, 2015 through March 6, 2015, the Operating Company has invested approximately $93.0 million in two senior secured loans and seven add-on investments with a combined effective yield of approximately 12.2%. $63.6 million of those investments were purchased from affiliates. All of the transfers were consummated at fair value in accordance with the provisions of the Exemptive Order as discussed in Note 6 to the consolidated financial statements.
On February 24, 2015, the Company’s Board of Directors approved a stock repurchase plan (the “Company 10b5-1 Plan”) to acquire up to $50 million in the aggregate of the Company’s common stock at prices at certain thresholds below the Company’s net asset value per share, in accordance with the guidelines specified in Rule 10b-18 and Rule 10b5-1 of the Securities Exchange Act of 1934.
The Company Repurchase Plan is designed to allow TCPC to repurchase its common stock at times when it otherwise might be prevented from doing so under insider trading laws. The Company Repurchase Plan will require an agent selected by TCPC to repurchase shares of common stock on TCPC’s behalf if and when the market price per share is at certain thresholds below the most recently reported net asset value per share. Under the plan, the agent will increase the volume of purchases made if the price of TCPC’s common stock declines, subject to volume restrictions. The timing and amount of any stock repurchases will depend on the terms and conditions of the Company Repurchase Plan, the market price of the common stock and trading volumes, and no assurance can be given that any particular amount of common stock will be repurchased.
Unless extended or terminated by its board of directors, TCPC expects that the Company Repurchase Plan will be in effect through the earlier of two trading days after TCPC’s first quarter 2015 earnings release or such time as the approved $50 million repurchase amount has been fully utilized, subject to certain conditions.
| 58 |
On March 6, 2015, the Company expanded the TCPC Funding Facility by $50 million to $300 million, increased the accordion feature by $50 million to $350 million and extended the maturity date to March 6, 2019.
On March 10, 2015, the Company’s board of directors declared a first quarter regular dividend of $0.36 per share payable on March 31, 2015 to stockholders of record as of the close of business on March 19, 2015.
Item 7A: Quantitative and qualitative disclosure about market risk
We are subject to financial market risks, including changes in interest rates. At December 31, 2014, 78.3% of our debt investments bore interest based on floating rates, such as LIBOR, EURIBOR, the Federal Funds Rate or the Prime Rate. The interest rates on such investments generally reset by reference to the current market index after one to six months. At December 31, 2014, the percentage of our floating rate debt investments that bore interest based on an interest rate floor was 83.1%. Floating rate investments subject to a floor generally reset by reference to the current market index after one to six months only if the index exceeds the floor.
Interest rate sensitivity refers to the change in earnings that may result from changes in the level of interest rates. Because we fund a portion of our investments with borrowings, our net investment income is affected by the difference between the rate at which we invest and the rate at which we borrow. As a result, there can be no assurance that a significant change in market interest rates will not have a material adverse effect on our net investment income. We assess our portfolio companies periodically to determine whether such companies will be able to continue making interest payments in the event that interest rates increase. There can be no assurances that the portfolio companies will be able to meet their contractual obligations at any or all levels of increases in interest rates.
Based on our December 31, 2014 balance sheet, the following table shows the annual impact on net income (excluding the related incentive compensation impact) of base rate changes in interest rates (considering interest rate floors for variable rate instruments) assuming no changes in our investment and borrowing structure:
| Basis Point Change | Interest income | Interest Expense | Net Income | |||||||||
| Up 300 basis points | $ | 21,387,577 | $ | (10,710,000 | ) | $ | 10,677,577 | |||||
| Up 200 basis points | 12,382,495 | (7,140,000 | ) | 5,242,495 | ||||||||
| Up 100 basis points | 3,622,612 | (3,570,000 | ) | 52,612 | ||||||||
| Down 100 basis points | (370,769 | ) | 877,149 | 506,380 | ||||||||
| Down 200 basis points | (370,769 | ) | 877,149 | 506,380 | ||||||||
| Down 300 basis points | (370,769 | ) | 877,149 | 506,380 | ||||||||
| 59 |
INDEX TO CONSOLIDATED FINANCIAL STATEMENTS
| Page | |
| Report of Independent Registered Public Accounting Firm | 61 |
| Consolidated Statements of Assets and Liabilities as of December 31, 2014 and 2013 | 62 |
| Consolidated Statements of Investments as of December 31, 2014 and 2013 | 63 |
| Consolidated Statements of Operations for the years ended December 31, 2014, 2013 and 2012 | 73 |
| Consolidated Statements of Changes in Net Assets for the years ended December 31, 2014, 2013 and 2012 | 74 |
| Consolidated Statements of Cash Flows for the years ended December 31, 2014, 2013 and 2012 | 75 |
| Notes to Consolidated Financial Statements | 76 |
| Consolidated Schedules of Changes in Investments in Affiliates as of December 31, 2014 and 2013 | 98 |
| Consolidated Schedules of Restricted Securities of Unaffiliated Issuers as of December 31, 2014 and 2013 | 100 |
| Consolidating Statements of Assets and Liabilities as of December 31, 2014 and 2013 | 102 |
| Consolidating Statements of Operations for the years ended December 31, 2014, 2013 and 2012 | 104 |
| 60 |
Report of Independent Registered Public Accounting Firm
The Board of Directors and Shareholders of
TCP Capital Corp.
We have audited the accompanying consolidated statements of assets and liabilities of TCP Capital Corp. (the Company), including the consolidated statement of investments, as of December 31, 2014 and 2013, and the related consolidated statements of operations, changes in net assets and cash flows for each of the three years in the period ended December 31, 2014. Our audits also included the financial statement schedules listed in the Index at Item 15(a). These financial statements and schedules are the responsibility of the Company’s management. Our responsibility is to express an opinion on these financial statements and schedules based on our audits.
We conducted our audits in accordance with the standards of the Public Company Accounting Oversight Board (United States). Those standards require that we plan and perform the audit to obtain reasonable assurance about whether the financial statements are free of material misstatement. We were not engaged to perform an audit of the Company’s internal control over financial reporting. Our audits included consideration of internal control over financial reporting as a basis for designing audit procedures that are appropriate in the circumstances, but not for the purpose of expressing an opinion on the effectiveness of the Company’s internal control over financial reporting. Accordingly, we express no such opinion. An audit also includes examining, on a test basis, evidence supporting the amounts and disclosures in the financial statements, assessing the accounting principles used and significant estimates made by management, and evaluating the overall financial statement presentation. Our procedures included confirmation of securities owned as of December 31, 2014 by correspondence with the custodian and brokers, or by other appropriate auditing procedures where replies from these parties, as applicable, were not received. We believe that our audits provide a reasonable basis for our opinion.
In our opinion, the financial statements referred to above present fairly, in all material respects, the consolidated financial position of TCP Capital Corp. at December 31, 2014 and 2013 and the consolidated results of its operations, changes in its net assets and its cash flows for each of the three years in the period ended December 31, 2014, in conformity with U.S. generally accepted accounting principles. Also, in our opinion, the related financial statement schedules, when considered in relation to the basic financial statements taken as a whole, present fairly in all material aspects the information set forth therein.
The accompanying consolidating statements of assets and liabilities as of December 31, 2014 and 2013 of the Company and the related consolidating statements of operations for each of the three years in the period ended December 31, 2014 have been subjected to audit procedures performed in conjunction with the audit of Company’s consolidated financial statements. Such information is the responsibility of the Company’s management. Our audit procedures included determining whether the information reconciles to the financial statements or the underlying accounting and other records, as applicable, and performing procedures to test the completeness and accuracy of the information. In our opinion, the information is fairly stated, in all material respects, in relation to the financial statements as a whole.
/s/ Ernst & Young LLP
Los Angeles, California
March 9, 2015
| 61 |
Consolidated Statements of Assets and Liabilities
| December 31, 2014 | December 31, 2013 | |||||||
| Assets | ||||||||
| Investments, at fair value: | ||||||||
| Companies less than 5% owned (cost of $1,097,181,753 and $684,569,508, respectively) | $ | 1,081,901,384 | $ | 678,326,915 | ||||
| Companies 5% to 25% owned (cost of $52,103,511 and $73,946,547, respectively) | 48,716,425 | 69,068,808 | ||||||
| Companies more than 25% owned (cost of $40,213,258 and $42,588,724 respectively) | 15,918,077 | 18,867,236 | ||||||
| Total investments (cost of $1,189,498,522 and $801,104,779, respectively) | 1,146,535,886 | 766,262,959 | ||||||
| Cash and cash equivalents | 27,268,792 | 22,984,182 | ||||||
| Receivable for investments sold | 10,961,369 | 3,605,964 | ||||||
| Accrued interest income: | ||||||||
| Companies less than 5% owned | 9,222,001 | 6,282,353 | ||||||
| Companies 5% to 25% owned | 253,987 | 415,061 | ||||||
| Companies more than 25% owned | 28,450 | 41,691 | ||||||
| Deferred debt issuance costs | 7,700,988 | 2,969,085 | ||||||
| Unrealized appreciation on swaps | 1,717,610 | - | ||||||
| Options (cost $51,750) | 497 | 14,139 | ||||||
| Prepaid expenses and other assets | 2,177,217 | 753,768 | ||||||
| Total assets | 1,205,866,797 | 803,329,202 | ||||||
| Liabilities | ||||||||
| Debt | 328,696,830 | 95,000,000 | ||||||
| Incentive allocation payable | 4,303,040 | 3,318,900 | ||||||
| Payable for investments purchased | 2,049,518 | 14,706,942 | ||||||
| Interest payable | 1,510,981 | 430,969 | ||||||
| Payable to the Investment Manager | 459,827 | 1,121,108 | ||||||
| Unrealized depreciation on swaps | - | 331,183 | ||||||
| Accrued expenses and other liabilities | 3,219,783 | 3,136,010 | ||||||
| Total liabilities | 340,239,979 | 118,045,112 | ||||||
| Commitments and contingencies (Note 5) | ||||||||
| Preferred equity facility | ||||||||
| Series A preferred limited partner interests in Special Value Continuation Partners, LP; $20,000/interest liquidation preference; 6,700 interests authorized, issued and outstanding | 134,000,000 | 134,000,000 | ||||||
| Accumulated dividends on Series A preferred equity facility | 497,790 | 504,252 | ||||||
| Total preferred limited partner interests | 134,497,790 | 134,504,252 | ||||||
| Non-controlling interest | ||||||||
| General Partner interest in Special Value Continuation Partners, LP | - | 1,168,583 | ||||||
| Net assets applicable to common shareholders | $ | 731,129,028 | $ | 549,611,255 | ||||
| Composition of net assets applicable to common shareholders | ||||||||
| Common stock, $0.001 par value; 200,000,000 shares authorized, 48,710,627 and 36,199,916 shares issued and outstanding as of December 31, 2014 and December 31, 2013, respectively | 48,710 | 36,200 | ||||||
| Paid-in capital in excess of par | 877,103,880 | 667,842,020 | ||||||
| Accumulated net investment income | 21,884,381 | 24,016,095 | ||||||
| Accumulated net realized losses | (126,408,033 | ) | (105,800,278 | ) | ||||
| Accumulated net unrealized depreciation | (41,499,910 | ) | (35,314,199 | ) | ||||
| Non-controlling interest | - | (1,168,583 | ) | |||||
| Net assets applicable to common shareholders | $ | 731,129,028 | $ | 549,611,255 | ||||
| Net assets per share | $ | 15.01 | $ | 15.18 | ||||
See accompanying notes.
| 62 |
Consolidated Statement of Investments
December 31, 2014
Showing Percentage of Total Cash and Investments of the Company
| % of | ||||||||||||||||||||||||||||||||||||
| Issuer | Instrument | Ref | Floor | Spread | All-In Rate | Maturity | Principal | Cost | Value | Portfolio | Notes | |||||||||||||||||||||||||
| Debt Investments (A) | ||||||||||||||||||||||||||||||||||||
| Accounting, Tax Preparation, Bookkeeping, and Payroll Services | ||||||||||||||||||||||||||||||||||||
| EGS Holdings, Inc. | Holdco PIK Notes | LIBOR (A) | 3.00% | 10.00% | 13.00% | 10/3/2018 | $ | 57,238 | $ | 57,238 | $ | 56,237 | - | |||||||||||||||||||||||
| Expert Global Solutions, LLC | Second Lien Term Loan | LIBOR (Q) | 1.50% | 11.00% | 12.50% | 10/3/2018 | $ | 7,124,902 | 6,959,593 | 7,096,403 | 0.60 | % | ||||||||||||||||||||||||
| 7,016,831 | 7,152,640 | 0.60 | % | |||||||||||||||||||||||||||||||||
| Activities Related to Real Estate | ||||||||||||||||||||||||||||||||||||
| Greystone Select Holdings, LLC | First Lien Term Loan | LIBOR (Q) | 1.00% | 8.00% | 9.00% | 3/26/2021 | $ | 16,470,084 | 16,261,549 | 16,511,259 | 1.41 | % | ||||||||||||||||||||||||
| Advertising, Public Relations, and Related Services | ||||||||||||||||||||||||||||||||||||
| Doubleplay III Limited (United Kingdom) | First Lien Facility A1 Term Loan | EURIBOR (Q) | 1.25% | 6.25% | 7.50% | 3/18/2018 | € | 13,165,705 | 16,791,646 | 15,450,034 | 1.32 | % | D/H | |||||||||||||||||||||||
| Artificial Synthetic Fibers and Filaments Manufacturing | ||||||||||||||||||||||||||||||||||||
| AGY Holding Corp. | Sr Secured Term Loan | Fixed | - | 12.00% | 12.00% | 9/15/2016 | $ | 4,869,577 | 4,869,577 | 4,869,577 | 0.41 | % | B | |||||||||||||||||||||||
| AGY Holding Corp. | Second Lien Notes | Fixed | - | 11.00% | 11.00% | 11/15/2016 | $ | 9,268,000 | 7,586,318 | 9,017,764 | 0.77 | % | B/E | |||||||||||||||||||||||
| 12,455,895 | 13,887,341 | 1.18 | % | |||||||||||||||||||||||||||||||||
| Basic Chemical Manufacturing | ||||||||||||||||||||||||||||||||||||
| BioAmber, Inc. | Sr Secured Term Loan | LIBOR (M) | 0.23% | 9.27% | 9.50% | 12/1/2017 | $ | 25,000,000 | 24,505,108 | 25,050,000 | 2.13 | % | ||||||||||||||||||||||||
| Green Biologics, Inc. | Sr Secured Term Loan | Prime Rate | 3.25% | 7.75% | 11.00% | 5/1/2018 | $ | 15,000,000 | 14,503,743 | 14,730,000 | 1.25 | % | L | |||||||||||||||||||||||
| M&G Chemicals S.A. (Luxembourg) | Sr Secured Term Loan | LIBOR (Q) | 0.23% | 8.50% | 8.73% | 3/18/2016 | $ | 15,632,077 | 15,632,077 | 15,632,077 | 1.33 | % | H | |||||||||||||||||||||||
| PeroxyChem, LLC | First Lien Term Loan | LIBOR (Q) | 1.00% | 6.50% | 7.50% | 2/28/2020 | $ | 8,932,500 | 8,783,187 | 8,932,500 | 0.76 | % | ||||||||||||||||||||||||
| VitAG Holdings, LLC | Sr Secured Term Loan | LIBOR (M) | 0.23% | 10.27% | 10.50% | 2/1/2018 | $ | 7,700,000 | 7,555,099 | 7,646,000 | 0.65 | % | L | |||||||||||||||||||||||
| 70,979,214 | 71,990,577 | 6.12 | % | |||||||||||||||||||||||||||||||||
| Beverage Manufacturing | ||||||||||||||||||||||||||||||||||||
| Carolina Beverage Group, LLC | Secured Notes | Fixed | - | 10.63% | 10.63% | 8/1/2018 | $ | 4,780,000 | 4,780,000 | 4,851,700 | 0.41 | % | E/G | |||||||||||||||||||||||
| Business Support Services | ||||||||||||||||||||||||||||||||||||
| Enerwise Global Technologies, Inc. | Sr Secured Revolving Loan | LIBOR (Q) | 0.23% | 8.52% | 8.75% | 11/30/2017 | $ | – | (106,405 | ) | (60,000 | ) | (0.01 | %) | ||||||||||||||||||||||
| Enerwise Global Technologies, Inc. | Sr Secured Term Loan | LIBOR (Q) | 0.23% | 9.27% | 9.50% | 11/30/2019 | $ | 17,500,000 | 17,158,899 | 17,360,000 | 1.48 | % | L | |||||||||||||||||||||||
| STG-Fairway Acquisitions, Inc. | Second Lien Term Loan | LIBOR (Q) | 1.25% | 9.25% | 10.50% | 8/28/2019 | $ | 14,643,455 | 14,036,428 | 14,863,107 | 1.27 | % | ||||||||||||||||||||||||
| 31,088,922 | 32,163,107 | 2.74 | % | |||||||||||||||||||||||||||||||||
| Chemical Manufacturing | ||||||||||||||||||||||||||||||||||||
| Archroma | Term Loan B | LIBOR (Q) | 1.25% | 8.25% | 9.50% | 9/30/2018 | $ | 19,896,228 | 19,593,258 | 19,747,006 | 1.68 | % | ||||||||||||||||||||||||
| Communications Equipment Manufacturing | ||||||||||||||||||||||||||||||||||||
| Globecomm Systems, Inc. | First Lien Term Loan | LIBOR (Q) | 1.25% | 7.63% | 8.88% | 12/11/2018 | $ | 14,850,000 | 14,701,500 | 14,656,950 | 1.25 | % | B | |||||||||||||||||||||||
| Computer Equipment Manufacturing | ||||||||||||||||||||||||||||||||||||
| ELO Touch Solutions, Inc. | Second Lien Term Loan | LIBOR (Q) | 1.50% | 10.50% | 12.00% | 12/1/2018 | $ | 12,000,000 | 11,638,008 | 11,520,000 | 0.98 | % | ||||||||||||||||||||||||
| Computer Systems Design and Related Services | ||||||||||||||||||||||||||||||||||||
| Autoalert, LLC | First Lien Term Loan | LIBOR (Q) | 0.25% |
4.75%
Cash
+ 4% PIK |
9.00% | 3/31/2019 | $ | 30,926,035 | 30,399,049 | 31,080,665 | 2.65 | % | ||||||||||||||||||||||||
| Blue Coat Systems, Inc. | First Lien Revolver | LIBOR (Q) | 1.00% | 3.50% | 4.50% | 5/31/2018 | $ | – | (727,290 | ) | (660,240 | ) | (0.06 | %) | K | |||||||||||||||||||||
| Blue Coat Systems, Inc. | Second Lien Term Loan | LIBOR (Q) | 1.00% | 8.50% | 9.50% | 6/28/2020 | $ | 15,000,000 | 14,878,125 | 14,775,000 | 1.26 | % | ||||||||||||||||||||||||
| MSC Software Corporation | Second Lien Term Loan | LIBOR (M) | 1.00% | 7.50% | 8.50% | 5/29/2021 | $ | 11,993,035 | 11,880,123 | 11,753,175 | 1.00 | % | ||||||||||||||||||||||||
| OnX Enterprise Solutions, Ltd. (Canada) | First Lien Term Loan B | LIBOR (Q) | - | 8.00% | 8.23% | 9/3/2018 | $ | 2,361,467 | 2,361,467 | 2,341,394 | 0.20 | % | ||||||||||||||||||||||||
| OnX Enterprise Solutions, Ltd. (Canada) | First Lien Term Loan | LIBOR (Q) | - | 7.00% | 7.23% | 9/3/2018 | $ | 10,533,333 | 10,415,821 | 10,259,467 | 0.87 | % | ||||||||||||||||||||||||
| OnX USA, LLC | First Lien Term Loan B | LIBOR (Q) | - | 8.00% | 8.23% | 9/3/2018 | $ | 4,722,933 | 4,722,933 | 4,682,788 | 0.40 | % | ||||||||||||||||||||||||
| OnX USA, LLC | First Lien Term Loan | LIBOR (Q) | - | 7.00% | 7.23% | 9/3/2018 | $ | 5,266,667 | 5,211,626 | 5,129,733 | 0.44 | % | ||||||||||||||||||||||||
| Vistronix, LLC | First Lien Revolver | LIBOR (Q) | 0.50% | 8.00% | 8.50% | 12/4/2018 | $ | – | (5,809 | ) | - | 0.00 | % | |||||||||||||||||||||||
| Vistronix, LLC | First Lien Term Loan | LIBOR (M) | 0.50% | 8.00% | 8.50% | 12/4/2018 | $ | 6,535,333 | 6,466,509 | 6,551,671 | 0.56 | % | ||||||||||||||||||||||||
| Websense, Inc. | Second Lien Term Loan | LIBOR (Q) | 1.00% | 7.25% | 8.25% | 12/27/2020 | $ | 7,200,000 | 7,164,000 | 6,930,000 | 0.59 | % | ||||||||||||||||||||||||
| 92,766,554 | 92,843,653 | 7.91 | % | |||||||||||||||||||||||||||||||||
| Cut and Sew Apparel Manufacturing | ||||||||||||||||||||||||||||||||||||
| Jones Apparel, LLC | First Lien FILO Term Loan | LIBOR (M) | 1.00% | 9.60% | 10.60% | 4/8/2019 | $ | 14,329,403 | 14,202,296 | 14,429,709 | 1.23 | % | ||||||||||||||||||||||||
| Data Processing, Hosting, and Related Services | ||||||||||||||||||||||||||||||||||||
| Asset International, Inc. | Delayed Draw Term Loan | LIBOR (M) | 1.00% | 7.00% | 8.00% | 7/31/2020 | $ | – | (42,880 | ) | (29,158 | ) | 0.00 | % | K | |||||||||||||||||||||
| Asset International, Inc. | Revolver | LIBOR (M) | 1.00% | 7.00% | 8.00% | 7/31/2020 | $ | 484,752 | 475,358 | 477,885 | 0.04 | % | ||||||||||||||||||||||||
| Asset International, Inc. | First Lien Term Loan | LIBOR (M) | 1.00% | 7.00% | 8.00% | 7/31/2020 | $ | 8,191,755 | 8,037,946 | 8,122,125 | 0.69 | % | ||||||||||||||||||||||||
| Rightside Group, Ltd. | Second Lien Term Loan | LIBOR (Q) | 0.50% | 8.75% | 9.25% | 8/6/2019 | $ | 5,000,000 | 4,042,549 | 4,775,000 | 0.41 | % | ||||||||||||||||||||||||
| The Telx Group, Inc. | Senior Notes | Fixed | - | 13.5% PIK | 13.50% | 7/9/2021 | $ | 4,446,651 | 4,446,651 | 4,611,177 | 0.39 | % | E | |||||||||||||||||||||||
| United TLD Holdco, Ltd. (Cayman Islands) | Second Lien Term Loan | LIBOR (Q) | 0.50% | 8.75% | 9.25% | 8/6/2019 | $ | 10,000,000 | 8,085,098 | 9,550,000 | 0.81 | % | H | |||||||||||||||||||||||
| 25,044,722 | 27,507,029 | 2.34 | % | |||||||||||||||||||||||||||||||||
| Electrical Equipment and Component Manufacturing | ||||||||||||||||||||||||||||||||||||
| NEXTracker, Inc. | Sr Secured Revolver | LIBOR (M) | - | 8.00% | 8.00% | 7/1/2016 | $ | 2,500,000 | 508,086 | 1,126,250 | 0.10 | % | ||||||||||||||||||||||||
| NEXTracker, Inc. | Sr Secured Term Loan | LIBOR (M) | - | 9.50% | 9.50% | 12/16/2016 | $ | 2,500,000 | 2,216,771 | 2,303,750 | 0.20 | % | L | |||||||||||||||||||||||
| Palladium Energy, Inc. | First Lien Term Loan | LIBOR (Q) | 1.00% | 9.00% | 10.00% | 12/26/2017 | $ | 16,153,317 | 15,942,351 | 16,234,084 | 1.38 | % | ||||||||||||||||||||||||
| 18,667,208 | 19,664,084 | 1.68 | % | |||||||||||||||||||||||||||||||||
| Electrical Equipment Manufacturing | ||||||||||||||||||||||||||||||||||||
| API Technologies Corp. | First Lien Term Loan | LIBOR (Q) | 1.50% | 7.50% | 9.00% | 2/6/2018 | $ | 6,687,055 | 6,631,621 | 6,610,154 | 0.56 | % | ||||||||||||||||||||||||
| Fabricated Metal Product Manufacturing | ||||||||||||||||||||||||||||||||||||
| Constellation Enterprises, LLC | First Lien Notes | Fixed | - | 10.63% | 10.63% | 2/1/2016 | $ | 2,900,000 | 2,858,907 | 2,392,500 | 0.20 | % | E | |||||||||||||||||||||||
| Financial Investment Activities | ||||||||||||||||||||||||||||||||||||
| Institutional Shareholder Services, Inc. | Second Lien Term Loan | LIBOR (Q) | 1.00% | 7.50% | 8.50% | 4/30/2022 | $ | 6,471,492 | 6,411,582 | 6,374,420 | 0.54 | % | ||||||||||||||||||||||||
| Marsico Capital Management | First Lien Term Loan | LIBOR (M) | - | 5.00% | 5.25% | 12/31/2022 | $ | 10,500,040 | 13,220,948 | 2,274,991 | 0.19 | % | I | |||||||||||||||||||||||
| 19,632,530 | 8,649,411 | 0.73 | % | |||||||||||||||||||||||||||||||||
| 63 |
TCP Capital Corp.
Consolidated Statement of Investments (Continued)
December 31, 2014
Showing Percentage of Total Cash and Investments of the Company
| % of | ||||||||||||||||||||||||||||||||||||
| Issuer | Instrument | Ref | Floor | Spread | All-In Rate | Maturity | Principal | Cost | Value | Portfolio | Notes | |||||||||||||||||||||||||
| Debt Investments (continued) | ||||||||||||||||||||||||||||||||||||
| Full-Service Restaurants | ||||||||||||||||||||||||||||||||||||
| RM OpCo, LLC | Convertible Second Lien Term Loan Tranche B-1 | Fixed | - | 8.50% | 8.50% | 3/30/2018 | $ | 1,636,314 | $ | 1,614,711 | $ | 1,636,314 | 0.14 | % | B | |||||||||||||||||||||
| RM OpCo, LLC | First Lien Term Loan Tranche A | Fixed | - | 7.00% | 7.00% | 3/21/2016 | $ | 3,900,025 | 3,898,911 | 3,900,025 | 0.33 | % | B | |||||||||||||||||||||||
| RM OpCo, LLC | Second Lien Term Loan Tranche B | Fixed | - | 8.50% | 8.50% | 3/30/2018 | $ | 8,153,188 | 8,153,188 | 6,457,325 | 0.55 | % | B | |||||||||||||||||||||||
| RM OpCo, LLC | Second Lien Term Loan Tranche B-1 | Fixed | - | 8.50% | 8.50% | 3/30/2018 | $ | 2,567,717 | 2,546,166 | 2,567,717 | 0.22 | % | B | |||||||||||||||||||||||
| RM OpCo, LLC | Sr Convertible Second Lien Term Loan B | Fixed | - | 8.50% | 8.50% | 3/30/2018 | $ | 631,164 | 631,164 | 631,164 | 0.05 | % | B | |||||||||||||||||||||||
| 16,844,140 | 15,192,545 | 1.29 | % | |||||||||||||||||||||||||||||||||
| Gaming Industries | ||||||||||||||||||||||||||||||||||||
| AP Gaming I, LLC | First Lien Revolver | LIBOR (Q) | - | 8.25% | 8.41% | 12/20/2018 | $ | 5,000,000 | 2,931,716 | 2,812,500 | 0.24 | % | ||||||||||||||||||||||||
| AP Gaming I, LLC | First Lien Term Loan B | LIBOR (Q) | 1.00% | 8.25% | 9.25% | 12/20/2020 | $ | 14,850,000 | 14,450,326 | 14,850,000 | 1.27 | % | ||||||||||||||||||||||||
| 17,382,042 | 17,662,500 | 1.51 | % | |||||||||||||||||||||||||||||||||
| General Medical and Surgical Hospitals | ||||||||||||||||||||||||||||||||||||
| RegionalCare Hospital Partners, Inc. | Second Lien Term Loan | LIBOR (M) | 1.00% | 9.50% | 10.50% | 10/23/2019 | $ | 21,017,525 | 20,729,782 | 20,964,981 | 1.79 | % | ||||||||||||||||||||||||
| Grocery Stores | ||||||||||||||||||||||||||||||||||||
| Bashas, Inc. | First Lien FILO Term Loan | LIBOR (M) | 1.50% | 7.00% | 8.50% | 10/8/2019 | $ | 10,632,845 | 10,592,167 | 10,616,895 | 0.90 | % | ||||||||||||||||||||||||
| The Great Atlantic & Pacific Tea Company, Inc. | Term Loan Tranche B | LIBOR (M) | 1.00% | 8.85% | 9.85% | 9/17/2019 | $ | 20,966,890 | 20,619,519 | 20,945,923 | 1.78 | % | ||||||||||||||||||||||||
| 31,211,686 | 31,562,818 | 2.68 | % | |||||||||||||||||||||||||||||||||
| Insurance Carriers | ||||||||||||||||||||||||||||||||||||
| Acrisure, LLC | Second Lien Additional Notes | LIBOR (Q) | 1.00% | 10.50% | 11.50% | 3/31/2020 | $ | 2,520,198 | 2,391,227 | 2,527,200 | 0.22 | % | ||||||||||||||||||||||||
| Acrisure, LLC | Second Lien Notes | LIBOR (Q) | 1.00% | 10.50% | 11.50% | 3/31/2020 | $ | 29,288,298 | 28,725,701 | 29,317,586 | 2.50 | % | ||||||||||||||||||||||||
| US Apple Holdco, LLC | First Lien Term Loan | LIBOR (Q) | 0.50% | 11.50% | 12.00% | 8/29/2019 | $ | 20,000,000 | 19,247,507 | 19,940,000 | 1.70 | % | ||||||||||||||||||||||||
| 50,364,435 | 51,784,786 | 4.42 | % | |||||||||||||||||||||||||||||||||
| Insurance Related Activities | ||||||||||||||||||||||||||||||||||||
| Confie Seguros Holding II Co. | Second Lien Term Loan | LIBOR (M) | 1.25% | 9.00% | 10.25% | 5/8/2019 | $ | 7,861,809 | 7,776,100 | 7,859,372 | 0.67 | % | ||||||||||||||||||||||||
| Lessors of Nonfinancial Intangible Assets | ||||||||||||||||||||||||||||||||||||
| ABG Intermediate Holdings 2, LLC | Second Lien Term Loan | LIBOR (S) | 1.00% | 8.00% | 9.00% | 5/27/2022 | $ | 15,990,714 | 15,838,253 | 16,110,644 | 1.37 | % | ||||||||||||||||||||||||
| Lessors of Real Estate | ||||||||||||||||||||||||||||||||||||
| Hunt Companies, Inc. | Senior Secured Notes | Fixed | - | 9.63% | 9.63% | 3/1/2021 | $ | 13,084,000 | 12,935,462 | 13,476,520 | 1.15 | % | E/G | |||||||||||||||||||||||
| Management, Scientific, and Technical Consulting Services | ||||||||||||||||||||||||||||||||||||
| Dodge Data & Analytics, LLC | First Lien Term Loan | LIBOR (Q) | 1.00% | 8.75% | 9.75% | 10/31/2019 | $ | 27,923,077 | 27,174,478 | 27,853,269 | 2.37 | % | ||||||||||||||||||||||||
| Merchant Wholesalers | ||||||||||||||||||||||||||||||||||||
| Envision Acquisition Company, LLC | Second Lien Term Loan | LIBOR (Q) | 1.00% | 8.75% | 9.75% | 11/4/2021 | $ | 9,079,011 | 8,914,869 | 9,044,964 | 0.77 | % | ||||||||||||||||||||||||
| Motion Picture and Video Industries | ||||||||||||||||||||||||||||||||||||
| CORE Entertainment, Inc. | First Lien Term Loan | Fixed | - | 9.00% | 9.00% | 6/21/2017 | $ | 9,462,231 | 9,402,044 | 8,203,755 | 0.70 | % | ||||||||||||||||||||||||
| CORE Entertainment, Inc. | Second Lien Term Loan | Fixed | - | 13.50% | 13.50% | 6/21/2018 | $ | 7,569,785 | 7,518,166 | 6,233,718 | 0.53 | % | ||||||||||||||||||||||||
| 16,920,210 | 14,437,473 | 1.23 | % | |||||||||||||||||||||||||||||||||
| Newspaper, Periodical, Book, and Directory Publishers | ||||||||||||||||||||||||||||||||||||
| MediMedia USA, Inc. | First Lien Revolver | LIBOR (Q) | - | 6.75% | 6.99% | 5/20/2018 | $ | 3,875,000 | 3,065,963 | 3,596,543 | 0.31 | % | ||||||||||||||||||||||||
| MediMedia USA, Inc. | First Lien Term Loan | LIBOR (Q) | 1.25% | 6.75% | 8.00% | 11/20/2018 | $ | 9,591,911 | 9,372,798 | 9,376,093 | 0.80 | % | ||||||||||||||||||||||||
| 12,438,761 | 12,972,636 | 1.11 | % | |||||||||||||||||||||||||||||||||
| Nondepository Credit Intermediation | ||||||||||||||||||||||||||||||||||||
| Caribbean Financial Group (Cayman Islands) | Sr Secured Notes | Fixed | - | 11.50% | 11.50% | 11/15/2019 | $ | 10,000,000 | 9,846,274 | 10,300,000 | 0.88 | % | E/G/H | |||||||||||||||||||||||
| Trade Finance Funding I, Ltd. (Cayman Islands) | Secured Class B Notes | Fixed | - | 10.75% | 10.75% | 11/13/2018 | $ | 15,084,000 | 15,084,000 | 15,008,580 | 1.28 | % | E/H | |||||||||||||||||||||||
| 24,930,274 | 25,308,580 | 2.16 | % | |||||||||||||||||||||||||||||||||
| Nonscheduled Air Transportation | ||||||||||||||||||||||||||||||||||||
| One Sky Flight, LLC | Second Lien Term Loan | Fixed | - |
12%
Cash +
3% PIK |
15.00% | 6/3/2019 | $ | 18,660,646 | 17,417,637 | 19,220,465 | 1.64 | % | ||||||||||||||||||||||||
| Oil and Gas Extraction | ||||||||||||||||||||||||||||||||||||
| Jefferson Gulf Coast Energy Partners, LLC | First Lien Term Loan B | LIBOR (M) | 1.00% | 8.00% | 9.00% | 2/27/2018 | $ | 14,962,500 | 14,824,074 | 14,289,188 | 1.22 | % | ||||||||||||||||||||||||
| MD America Energy, LLC | Second Lien Term Loan | LIBOR (Q) | 1.00% | 8.50% | 9.50% | 8/4/2019 | $ | 10,000,000 | 9,533,785 | 9,600,000 | 0.82 | % | ||||||||||||||||||||||||
| 24,357,859 | 23,889,188 | 2.04 | % | |||||||||||||||||||||||||||||||||
| Other Information Services | ||||||||||||||||||||||||||||||||||||
| TCH-2 Holdings, LLC | Second Lien Term Loan | LIBOR (M) | 1.00% | 7.75% | 8.75% | 11/6/2021 | $ | 19,988,392 | 19,704,946 | 19,288,799 | 1.64 | % | ||||||||||||||||||||||||
| Other Telecommunications | ||||||||||||||||||||||||||||||||||||
| Securus Technologies, Inc. | Second Lien Term Loan | LIBOR (Q) | 1.25% | 7.75% | 9.00% | 4/30/2021 | $ | 14,000,000 | 13,860,000 | 13,790,000 | 1.17 | % | ||||||||||||||||||||||||
| 64 |
TCP Capital Corp.
Consolidated Statement of Investments (Continued)
December 31, 2014
Showing Percentage of Total Cash and Investments of the Company
| % of | ||||||||||||||||||||||||||||||||||||
| Issuer | Instrument | Ref | Floor | Spread | All-In Rate | Maturity | Principal | Cost | Value | Portfolio | Notes | |||||||||||||||||||||||||
| Debt Investments (continued) | ||||||||||||||||||||||||||||||||||||
| Petroleum and Coal Products Manufacturing | ||||||||||||||||||||||||||||||||||||
| Boomerang Tube, LLC | Second Lien Term Loan | LIBOR (Q) | 1.50% | 9.50% | 11.00% | 10/11/2017 | $ | 3,825,453 | $ | 3,778,669 | $ | 3,318,581 | 0.28 | % | ||||||||||||||||||||||
| Plastics Products Manufacturing | ||||||||||||||||||||||||||||||||||||
| Iracore International, Inc. | Sr Secured Notes | Fixed | - | 9.50% | 9.50% | 6/1/2018 | $ | 13,600,000 | 13,600,000 | 8,194,000 | 0.70 | % | E/G | |||||||||||||||||||||||
| Radio and Television Broadcasting | ||||||||||||||||||||||||||||||||||||
| SiTV, Inc. | Sr Secured Notes | Fixed | - | 10.38% | 10.38% | 7/1/2019 | $ | 7,312,000 | 7,312,000 | 6,818,440 | 0.58 | % | E/G | |||||||||||||||||||||||
| The Tennis Channel, Inc. | First Lien Term Loan | LIBOR (Q) | - | 8.50% | 8.75% | 5/29/2017 | $ | 18,250,825 | 17,914,285 | 18,369,455 | 1.56 | % | ||||||||||||||||||||||||
| 25,226,285 | 25,187,895 | 2.14 | % | |||||||||||||||||||||||||||||||||
| Retail | ||||||||||||||||||||||||||||||||||||
| Kenneth Cole Productions, Inc. | First Lien FILO Term Loan | LIBOR (M) | 1.00% | 10.40% | 11.40% | 9/25/2017 | $ | 10,590,909 | 10,434,633 | 10,643,863 | 0.91 | % | ||||||||||||||||||||||||
| Connexity, Inc. | Second Lien Term Loan | LIBOR (Q) | - | 12.50% | 12.73% | 3/31/2016 | $ | 6,630,353 | 6,536,895 | 6,600,516 | 0.56 | % | ||||||||||||||||||||||||
| Shop Holding, LLC | Convertible Promissory Note | Fixed | - | 5.00% | 5.00% | 8/5/2015 | $ | 73,140 | 73,140 | 67,691 | 0.01 | % | E | |||||||||||||||||||||||
| 17,044,668 | 17,312,070 | 1.48 | % | |||||||||||||||||||||||||||||||||
| Satellite Telecommunications | ||||||||||||||||||||||||||||||||||||
| Avanti Communications Group, PLC (United Kingdom) | Sr Secured Notes | Fixed | - | 10.00% | 10.00% | 10/1/2019 | $ | 9,914,000 | 9,914,000 | 9,492,655 | 0.81 | % | E/G/H | |||||||||||||||||||||||
| Scheduled Air Transportation | ||||||||||||||||||||||||||||||||||||
| Aircraft Leased to Delta Air Lines, Inc. | ||||||||||||||||||||||||||||||||||||
| N913DL | Aircraft Secured Mortgage | Fixed | - | 8.00% | 8.00% | 3/15/2017 | $ | 205,106 | 205,106 | 209,168 | 0.02 | % | F | |||||||||||||||||||||||
| N918DL | Aircraft Secured Mortgage | Fixed | - | 8.00% | 8.00% | 8/15/2018 | $ | 313,694 | 313,694 | 320,440 | 0.03 | % | F | |||||||||||||||||||||||
| N954DL | Aircraft Secured Mortgage | Fixed | - | 8.00% | 8.00% | 3/20/2019 | $ | 429,007 | 429,007 | 437,679 | 0.04 | % | F | |||||||||||||||||||||||
| N955DL | Aircraft Secured Mortgage | Fixed | - | 8.00% | 8.00% | 6/20/2019 | $ | 451,165 | 451,165 | 460,258 | 0.04 | % | F | |||||||||||||||||||||||
| N956DL | Aircraft Secured Mortgage | Fixed | - | 8.00% | 8.00% | 5/20/2019 | $ | 448,792 | 448,792 | 457,902 | 0.04 | % | F | |||||||||||||||||||||||
| N957DL | Aircraft Secured Mortgage | Fixed | - | 8.00% | 8.00% | 6/20/2019 | $ | 455,112 | 455,112 | 464,283 | 0.04 | % | F | |||||||||||||||||||||||
| N959DL | Aircraft Secured Mortgage | Fixed | - | 8.00% | 8.00% | 7/20/2019 | $ | 461,378 | 461,378 | 470,601 | 0.04 | % | F | |||||||||||||||||||||||
| N960DL | Aircraft Secured Mortgage | Fixed | - | 8.00% | 8.00% | 10/20/2019 | $ | 483,873 | 483,873 | 493,258 | 0.04 | % | F | |||||||||||||||||||||||
| N961DL | Aircraft Secured Mortgage | Fixed | - | 8.00% | 8.00% | 8/20/2019 | $ | 475,489 | 475,489 | 484,908 | 0.04 | % | F | |||||||||||||||||||||||
| N976DL | Aircraft Secured Mortgage | Fixed | - | 8.00% | 8.00% | 2/15/2018 | $ | 308,103 | 308,103 | 314,588 | 0.03 | % | F | |||||||||||||||||||||||
| Aircraft Leased to United Airlines, Inc. | ||||||||||||||||||||||||||||||||||||
| N659UA | Aircraft Secured Mortgage | Fixed | - | 12.00% | 12.00% | 2/28/2016 | $ | 1,582,136 | 1,582,136 | 1,659,003 | 0.14 | % | F | |||||||||||||||||||||||
| N661UA | Aircraft Secured Mortgage | Fixed | - | 12.00% | 12.00% | 5/4/2016 | $ | 1,788,182 | 1,788,181 | 1,899,950 | 0.16 | % | F | |||||||||||||||||||||||
| Mesa Air Group, Inc. | Acquisition Delayed Draw Loan | LIBOR (M) | - | 7.25% | N/A | 7/15/2022 | $ | – | (271,500 | ) | (135,750 | ) | (0.01 | %) | K | |||||||||||||||||||||
| Mesa Air Group, Inc. | Acquisition Loan | LIBOR (M) | - | 7.25% | 7.44% | 7/15/2022 | $ | 17,810,658 | 17,469,814 | 17,632,552 | 1.50 | % | ||||||||||||||||||||||||
| 24,600,350 | 25,168,840 | 2.15 | % | |||||||||||||||||||||||||||||||||
| Scientific Research and Development Services | ||||||||||||||||||||||||||||||||||||
| BPA Laboratories, Inc. | Senior Secured Notes | Fixed | - | 12.25% | 12.25% | 4/1/2017 | $ | 38,932,000 | 39,001,750 | 41,754,570 | 3.56 | % | E/G | |||||||||||||||||||||||
| Semiconductor and Other Electronic Component Manufacturing | ||||||||||||||||||||||||||||||||||||
| Soraa, Inc. | Sr Secured Term Loan | LIBOR (M) | 0.23% | 10.27% | 10.50% | 9/1/2017 | $ | 22,500,000 | 21,822,817 | 21,633,750 | 1.84 | % | L | |||||||||||||||||||||||
| SunEdison, Inc. | Senior Secured Letters of Credit | Fixed | - | 3.75% | N/A | 2/28/2017 | $ | – | (1,031,717 | ) | (750,340 | ) | (0.06 | %) | J/K | |||||||||||||||||||||
| 20,791,100 | 20,883,410 | 1.78 | % | |||||||||||||||||||||||||||||||||
| Software Publishers | ||||||||||||||||||||||||||||||||||||
| Acronis International GmbH (Switzerland) | First Lien Term Loan | LIBOR (Q) | 1.00% | 13.00% | 14.00% | 2/21/2017 | $ | 30,634,068 | 30,429,609 | 28,949,194 | 2.47 | % | H | |||||||||||||||||||||||
| ArcServe (USA), LLC | Second Lien Term Loan | LIBOR (Q) | 0.50% | 8.50% | 9.00% | 1/31/2020 | $ | 30,000,000 | 29,439,740 | 30,015,000 | 2.57 | % | H | |||||||||||||||||||||||
| BlackLine Systems, Inc. | First Lien Term Loan | LIBOR (Q) | 1.50% |
0.4%
Cash +
7.6% PIK |
9.50% | 9/25/2018 | $ | 13,577,457 | 12,859,373 | 13,781,119 | 1.17 | % | ||||||||||||||||||||||||
| Coreone Technologies, LLC | First Lien Term Loan | LIBOR (Q) | 1.00% |
3.75%
Cash
+ 5% PIK |
9.75% | 9/4/2018 | $ | 14,257,231 | 14,028,252 | 13,865,157 | 1.18 | % | ||||||||||||||||||||||||
| Deltek, Inc. | Second Lien Term Loan | LIBOR (Q) | 1.25% | 8.75% | 10.00% | 10/10/2019 | $ | 15,000,000 | 14,831,408 | 15,099,975 | 1.29 | % | ||||||||||||||||||||||||
| Edmentum, Inc. | Second Lien Term Loan | LIBOR (Q) | 1.50% | 9.75% | 11.25% | 5/17/2019 | $ | 21,500,000 | 21,361,215 | 11,287,500 | 0.96 | % | ||||||||||||||||||||||||
| 122,949,597 | 112,997,945 | 9.64 | % | |||||||||||||||||||||||||||||||||
| Specialty Hospitals | ||||||||||||||||||||||||||||||||||||
| Bioventus, LLC | Second Lien Term Loan | LIBOR (Q) | 1.00% | 10.00% | 11.00% | 4/10/2020 | $ | 11,000,000 | 10,786,339 | 10,945,000 | 0.93 | % | ||||||||||||||||||||||||
| UBC Healthcare Analytics, Inc. | First Lien Term Loan | LIBOR (Q) | 1.00% | 9.00% | 10.00% | 7/1/2018 | $ | 4,401,081 | 4,379,076 | 4,390,078 | 0.37 | % | ||||||||||||||||||||||||
| 15,165,415 | 15,335,078 | 1.30 | % | |||||||||||||||||||||||||||||||||
| Structured Note Funds | ||||||||||||||||||||||||||||||||||||
| Magnolia Finance V plc (Cayman Islands) | Asset-Backed Credit Linked Notes | Fixed | - | 13.13% | 13.13% | 8/2/2021 | $ | 15,000,000 | 15,000,000 | 15,123,000 | 1.29 | % | E/H | |||||||||||||||||||||||
| 65 |
TCP Capital Corp.
Consolidated Statement of Investments (Continued)
December 31, 2014
Showing Percentage of Total Cash and Investments of the Company
| Principal or | % | |||||||||||||||||||||||||||||||||||
| Issuer | Instrument | Ref | Floor | Spread | All-In Rate | Maturity | Shares | Cost | Value | Portfolio | Notes | |||||||||||||||||||||||||
| Debt Investments (continued) | ||||||||||||||||||||||||||||||||||||
| Textile Furnishings Mills | ||||||||||||||||||||||||||||||||||||
| Lexmark Carpet Mills, Inc. | First Lien Term Loan | LIBOR (Q) | 1.00% | 10.00% | 11.00% | 12/19/2019 | $ | 25,000,000 | $ | 25,000,000 | $ | 24,925,000 | 2.12 | % | ||||||||||||||||||||||
| Utility System Construction | ||||||||||||||||||||||||||||||||||||
| Kawa Solar Holdings Limited | Revolving Credit Facility | Fixed | - | 8.00% | 8.00% | 7/2/2017 | $ | 25,000,000 | 25,000,000 | 25,000,000 | 2.13 | % | ||||||||||||||||||||||||
| Wired Telecommunications Carriers | ||||||||||||||||||||||||||||||||||||
| Alpheus Communications, LLC | Delayed Draw Term Loan | LIBOR (Q) | 1.00% | 6.92% | 7.92% | 5/31/2018 | $ | 372,616 | 361,456 | 371,494 | 0.03 | % | ||||||||||||||||||||||||
| Alpheus Communications, LLC | First Lien FILO Term Loan | LIBOR (Q) | 1.00% | 6.92% | 7.92% | 5/31/2018 | $ | 8,145,022 | 8,064,048 | 8,136,877 | 0.70 | % | ||||||||||||||||||||||||
| Integra Telecom Holdings, Inc. | Second Lien Term Loan | LIBOR (Q) | 1.25% | 8.50% | 9.75% | 2/22/2020 | $ | 15,000,000 | 14,737,750 | 14,943,750 | 1.28 | % | ||||||||||||||||||||||||
| 23,163,254 | 23,452,121 | 2.01 | % | |||||||||||||||||||||||||||||||||
| Wireless Telecommunications Carriers | ||||||||||||||||||||||||||||||||||||
| Gogo, LLC | First Lien Term Loan | LIBOR (Q) | 1.50% | 9.75% | 11.25% | 6/21/2017 | $ | 19,083,140 | 18,579,398 | 19,655,634 | 1.67 | % | ||||||||||||||||||||||||
| Gogo, LLC | First Lien Term Loan B-2 | LIBOR (Q) | 1.00% | 6.50% | 7.50% | 3/21/2018 | $ | 5,510,950 | 5,414,893 | 5,345,622 | 0.46 | % | ||||||||||||||||||||||||
| 23,994,291 | 25,001,256 | 2.13 | % | |||||||||||||||||||||||||||||||||
| Total Debt Investments | 1,128,140,974 | 1,113,593,115 | 94.87 | % | ||||||||||||||||||||||||||||||||
| Equity Securities | ||||||||||||||||||||||||||||||||||||
| Architectural, Engineering, and Related Services | ||||||||||||||||||||||||||||||||||||
| Alion Science & Technology Corporation | Warrants | 300 | - | 3 | - | C | ||||||||||||||||||||||||||||||
| Basic Chemical Manufacturing | ||||||||||||||||||||||||||||||||||||
| Green Biologics, Inc. | Warrants to Purchase Stock | 376,147 | 272,594 | 276,882 | 0.02 | C/E | ||||||||||||||||||||||||||||||
| Business Support Services | ||||||||||||||||||||||||||||||||||||
| Findly Talent, LLC | Membership Units | 708,229 | 230,938 | 162,184 | 0.01 | % | C/E | |||||||||||||||||||||||||||||
| STG-Fairway Holdings, LLC | Class A Units | 841,479 | 943,287 | 2,917,492 | 0.25 | % | C/E | |||||||||||||||||||||||||||||
| 1,174,225 | 3,079,676 | 0.26 | % | |||||||||||||||||||||||||||||||||
| Communications Equipment Manufacturing | ||||||||||||||||||||||||||||||||||||
| Wasserstein Cosmos Co-Invest, L.P. | Limited Partnership Units | 5,000,000 | 5,000,000 | 4,175,000 | 0.36 | % | B/C/E | |||||||||||||||||||||||||||||
| Data Processing, Hosting, and Related Services | ||||||||||||||||||||||||||||||||||||
| Anacomp, Inc. | Class A Common Stock | 1,255,527 | 26,711,048 | 916,535 | 0.08 | % | C/E/F | |||||||||||||||||||||||||||||
| Rightside Group, Ltd. | Warrants | 498,855 | 2,778,622 | 693,748 | 0.06 | % | C/E | |||||||||||||||||||||||||||||
| 29,489,670 | 1,610,283 | 0.14 | % | |||||||||||||||||||||||||||||||||
| Electrical Equipment and Component Manufacturing | ||||||||||||||||||||||||||||||||||||
| NEXTracker, Inc. | Series B Preferred Stock | 268,817 | 999,999 | 999,999 | 0.09 | % | C/E | |||||||||||||||||||||||||||||
| NEXTracker, Inc. | Warrants to Purchase Stock | 357,022 | 370,118 | 385,013 | 0.03 | % | C/E | |||||||||||||||||||||||||||||
| 1,370,117 | 1,385,012 | 0.12 | % | |||||||||||||||||||||||||||||||||
| Financial Investment Activities | ||||||||||||||||||||||||||||||||||||
| Marsico Holdings, LLC | Common Interest Units | 168,698 | 172,694 | 16,870 | - | C/E/I | ||||||||||||||||||||||||||||||
| Full-Service Restaurants | ||||||||||||||||||||||||||||||||||||
| RM Holdco, LLC | Equity Participation | 24 | - | 792 | - | B/C/E | ||||||||||||||||||||||||||||||
| RM Holdco, LLC | Membership Units | 13,161,000 | 2,010,777 | - | - | B/C/E | ||||||||||||||||||||||||||||||
| 2,010,777 | 792 | - | ||||||||||||||||||||||||||||||||||
| Machine Shops; Turned Product; and Screw, Nut, and Bolt Manufacturing | ||||||||||||||||||||||||||||||||||||
| Precision Holdings, LLC | Class C Membership Interest | 33 | - | 1,469 | - | C/E | ||||||||||||||||||||||||||||||
| Nonmetallic Mineral Mining and Quarrying | ||||||||||||||||||||||||||||||||||||
| EPMC HoldCo, LLC | Membership Units | 1,312,720 | - | 682,614 | 0.06 | % | B/E | |||||||||||||||||||||||||||||
| Nonscheduled Air Transportation | ||||||||||||||||||||||||||||||||||||
| Flight Options Holdings I, Inc. | Warrants to Purchase Common Stock | 1,843 | 1,274,000 | 3,311,430 | 0.28 | % | C/E | |||||||||||||||||||||||||||||
| Radio and Television Broadcasting | ||||||||||||||||||||||||||||||||||||
| SiTV, Inc. | Warrants to Purchase Common Stock | 233,470 | 300,322 | 331,527 | 0.03 | % | C/E | |||||||||||||||||||||||||||||
| Retail | ||||||||||||||||||||||||||||||||||||
| Shop Holding, LLC | Class A Units | 507,167 | 480,049 | 379,665 | 0.03 | % | C/E | |||||||||||||||||||||||||||||
| Shop Holding, LLC | Warrants to Purchase Class A Units | 326,691 | - | 3 | - | C/E | ||||||||||||||||||||||||||||||
| 480,049 | 379,668 | 0.03 | % | |||||||||||||||||||||||||||||||||
| Scheduled Air Transportation | ||||||||||||||||||||||||||||||||||||
| Aircraft Leased to Delta Air Lines, Inc. | ||||||||||||||||||||||||||||||||||||
| N913DL | Trust Beneficial Interests | 1,009 | 87,287 | 117,497 | 0.01 | % | E/F | |||||||||||||||||||||||||||||
| N918DL | Trust Beneficial Interests | 829 | 94,907 | 135,890 | 0.01 | % | E/F | |||||||||||||||||||||||||||||
| N954DL | Trust Beneficial Interests | 775 | 110,643 | 72,604 | 0.01 | % | E/F | |||||||||||||||||||||||||||||
| N955DL | Trust Beneficial Interests | 749 | 109,549 | 111,010 | 0.01 | % | E/F | |||||||||||||||||||||||||||||
| N956DL | Trust Beneficial Interests | 756 | 109,486 | 106,801 | 0.01 | % | E/F | |||||||||||||||||||||||||||||
| N957DL | Trust Beneficial Interests | 749 | 110,163 | 107,682 | 0.01 | % | E/F | |||||||||||||||||||||||||||||
| N959DL | Trust Beneficial Interests | 743 | 110,838 | 108,579 | 0.01 | % | E/F | |||||||||||||||||||||||||||||
| N960DL | Trust Beneficial Interests | 726 | 113,477 | 107,865 | 0.01 | % | E/F | |||||||||||||||||||||||||||||
| N961DL | Trust Beneficial Interests | 737 | 112,742 | 102,826 | 0.01 | % | E/F | |||||||||||||||||||||||||||||
| N976DL | Trust Beneficial Interests | 883 | 97,111 | 102,006 | 0.01 | % | E/F | |||||||||||||||||||||||||||||
| Aircraft Leased to United Airlines, Inc. | ||||||||||||||||||||||||||||||||||||
| United N659UA-767, LLC (N659UA) | Trust Beneficial Interests | 525 | 2,548,939 | 3,177,822 | 0.27 | % | E/F | |||||||||||||||||||||||||||||
| United N661UA-767, LLC (N661UA) | Trust Beneficial Interests | 509 | 2,495,032 | 3,078,923 | 0.26 | % | E/F | |||||||||||||||||||||||||||||
| 6,100,174 | 7,329,505 | 0.63 | % | |||||||||||||||||||||||||||||||||
| 66 |
TCP Capital Corp.
Consolidated Statement of Investments (Continued)
December 31, 2014
Showing Percentage of Total Cash and Investments of the Company
| % of | ||||||||||||||||||||||||||||||||||||
| Issuer | Instrument | Ref | Floor | Spread | All-In Rate | Maturity | Shares | Cost | Value | Portfolio | Notes | |||||||||||||||||||||||||
| Equity Securities (continued) | ||||||||||||||||||||||||||||||||||||
| Resin, Synthetic Rubber, and Artificial Synthetic Fibers and Filaments Manufacturing | ||||||||||||||||||||||||||||||||||||
| KAGY Holding Company, Inc. | Series A Preferred Stock | 9,778 | $ | 1,091,200 | $ | 121,975 | 0.01 | % | B/C/E | |||||||||||||||||||||||||||
| Semiconductor and Other Electronic Component Manufacturing | ||||||||||||||||||||||||||||||||||||
| Ichor Systems Holdings, LLC | Membership Units | 352 | - | 229,504 | 0.02 | % | C/E | |||||||||||||||||||||||||||||
| Soraa, Inc. | Warrants to Purchase Common Stock | 315,000 | 408,987 | - | - | C/E | ||||||||||||||||||||||||||||||
| 408,987 | 229,504 | 0.02 | % | |||||||||||||||||||||||||||||||||
| Software Publishers | ||||||||||||||||||||||||||||||||||||
| Blackline Intermediate, Inc. | Warrants to Purchase Common Stock | 1,232,731 | 522,678 | 789,441 | 0.07 | % | C/E | |||||||||||||||||||||||||||||
| Wired Telecommunications Carriers | ||||||||||||||||||||||||||||||||||||
| Integra Telecom, Inc. | Common Stock | 1,274,522 | 8,433,885 | 5,295,511 | 0.44 | % | C/E | |||||||||||||||||||||||||||||
| Integra Telecom, Inc. | Warrants | 346,939 | 19,920 | 226,482 | 0.02 | % | C/E | |||||||||||||||||||||||||||||
| V Telecom Investment S.C.A. (Luxembourg) | Common Shares | 1,393 | 3,236,256 | 3,699,127 | 0.32 | % | C/D/E/H | |||||||||||||||||||||||||||||
| 11,690,061 | 9,221,120 | 0.78 | % | |||||||||||||||||||||||||||||||||
| Total Equity Securities | 61,357,548 | 32,942,771 | 2.81 | % | ||||||||||||||||||||||||||||||||
| Total Investments | 1,189,498,522 | 1,146,535,886 | ||||||||||||||||||||||||||||||||||
| Cash and Cash Equivalents | ||||||||||||||||||||||||||||||||||||
| Union Bank of California | Commercial Paper | Fixed | - | 0.03% | 1/2/2015 | 6,999,994 | 0.60 | % | ||||||||||||||||||||||||||||
| Cash Denominated in Foreign Currencies | 192,187 | 0.02 | % | |||||||||||||||||||||||||||||||||
| Cash Held on Account at Various Institutions | 20,076,611 | 1.70 | % | |||||||||||||||||||||||||||||||||
| Cash and Cash Equivalents | 27,268,792 | 2.32 | % | |||||||||||||||||||||||||||||||||
| Total Cash and Investments | $ | 1,173,804,678 | 100.00 | % | M | |||||||||||||||||||||||||||||||
Notes to Consolidated Statement of Investments:
| (A) | Investments in bank debt generally are bought and sold among institutional investors in transactions not subject to registration under the Securities Act of 1933. Such transactions are generally subject to contractual restrictions, such as approval of the agent or borrower. |
| (B) | Non-controlled affiliate – as defined under the Investment Company Act of 1940 (ownership of between 5% and 25% of the outstanding voting securities of this issuer). See Consolidated Schedule of Changes in Investments in Affiliates. |
| (C) | Non-income producing security. |
| (D) | Principal amount denominated in foreign currency. Amortized cost and fair value converted from foreign currency to US dollars. (See Note 2) |
| (E) | Restricted security. (See Note 2) |
| (F) | Controlled issuer – as defined under the Investment Company Act of 1940 (ownership of 25% or more of the outstanding voting securities of this issuer). Investment is not more than 50% owned nor deemed to be a significant subsidiary. See Consolidated Schedule of Changes in Investments in Affiliates. |
| (G) | Investment has been segregated to collateralize certain unfunded commitments. |
| (H) | Non-U.S. company or principal place of business outside the U.S. and as a result the investment is not a qualifying asset under Section 55(a) of the Investment Company Act. Under the Investment Company Act, the Company may not acquire any non-qualifying asset unless, at the time such acquisition is made, qualifying assets represent at least 70% of the Company's total assets. |
| (I) | Deemed an investment company under Section 3(c) of the Investment Company Act and as a result the investment is not a qualifying asset under Section 55(a) of the Investment Company Act. Under the Investment Company Act, the Company may not acquire any non-qualifying asset unless, at the time such acquisition is made, qualifying assets represent at least 70% of the Company's total assets. |
| (J) | Publicly traded company with a market capitalization greater than $250 million and as a result the investment is not a qualifying asset under Section 55(a) of the Investment Company Act. Under the Investment Company Act, the Company may not acquire any non-qualifying asset unless, at the time such acquisition is made, qualifying assets represent at least 70% of the Company's total assets. |
| (K) | Negative balances relate to an unfunded commitment that was acquired and valued at a discount. |
| (L) | In addition to the stated coupon, investment has a back-end fee payable upon repayment of the loan in the amount of 4.0% for Soraa, 8.0% for VitAg, 1.5% for Enerwise, 2.5% for NEXTracker, and 7.0% for Green Biologics. |
| (M) | All cash and investments, except those referenced in Notes G above, are pledged as collateral under certain debt as described in Note 4 to the Consolidated Financial Statements. |
LIBOR or EURIBOR resets monthly (M), quarterly (Q), semiannually (S), annually (A).
Aggregate acquisitions and aggregate dispositions of investments, other than government securities, totaled $669,515,626, and $266,008,974 respectively, for the twelve months ended December 31, 2014. Aggregate acquisitions includes investment assets received as payment in kind. Aggregate dispositions includes principal paydowns on and maturities of debt investments. The total value of restricted securities and bank debt as of December 31, 2014 was $1,146,535,883, or 97.7% of total cash and investments of the Company.
Options and swaps at December 31, 2014 were as follows:
| Investment | Notional Amount | Fair Value | ||||||
| Interest Rate Cap, 4%, expires 5/15/2016 | $ | 25,000,000 | $ | 497 | ||||
| Euro/US Dollar Cross-Currency Basis Swap, Pay Euros/Receive USD, Expires 3/31/2017 | $ | 4,289,018 | $ | 1,717,610 | ||||
See accompanying notes.
| 67 |
TCP Capital Corp.
Consolidated Statement of Investments
December 31, 2013
Showing Percentage of Total Cash and Investments of the Company
| % of | ||||||||||||||||||||||||||||||||
| Issuer | Instrument | Ref | Floor | Spread | Maturity | Principal | Cost | Value | Portfolio | Notes | ||||||||||||||||||||||
| Debt Investments (A) | ||||||||||||||||||||||||||||||||
| Accounting, Tax Preparation, Bookkeeping, and Payroll Services | ||||||||||||||||||||||||||||||||
| Expert Global Solutions, LLC | First Lien Term Loan | LIBOR (Q) | 1.25% | 7.25% | 4/3/2018 | $ | 699,754 | $ | 701,280 | $ | 703,691 | 0.09 | % | |||||||||||||||||||
| Expert Global Solutions, LLC | Second Lien Term Loan | LIBOR (Q) | 1.50% | 11.00% | 10/3/2018 | $ | 7,434,877 | 7,228,004 | 7,382,833 | 0.94 | % | |||||||||||||||||||||
| 7,929,284 | 8,086,524 | 1.03 | % | |||||||||||||||||||||||||||||
| Advertising, Public Relations, and Related Services | ||||||||||||||||||||||||||||||||
| Doubleplay III Limited (United Kingdom) | First Lien Facility A1 Term Loan | EURIBOR (Q) | 1.25% | 6.25% | 3/18/2018 | € | 13,165,705 | 16,428,630 | 16,736,606 | 2.12 | % | D/J | ||||||||||||||||||||
| Architectural, Engineering, and Related Services | ||||||||||||||||||||||||||||||||
| ESP Holdings, Inc. | Jr Unsecured Subordinated Promissory Notes | Fixed | - |
6%
Cash
+ 10% PIK |
12/31/2019 | $ | 7,959,369 | 7,959,369 | 7,959,369 | 1.01 | % | B/E | ||||||||||||||||||||
| Artificial Synthetic Fibers and Filaments Manufacturing | ||||||||||||||||||||||||||||||||
| AGY Holding Corp. | Sr Secured Term Loan | Fixed | 12.00% | 9/15/2016 | $ | 2,056,927 | 2,056,927 | 2,056,927 | 0.26 | % | B | |||||||||||||||||||||
| AGY Holding Corporation | Second Lien Term Loan | Fixed | - | 11.00% | 11/15/2016 | $ | 9,268,000 | 7,586,317 | 9,268,000 | 1.17 | % | B/E | ||||||||||||||||||||
| 9,643,244 | 11,324,927 | 1.43 | % | |||||||||||||||||||||||||||||
| Beverage Manufacturing | ||||||||||||||||||||||||||||||||
| Carolina Beverage Group, LLC | Secured Notes | Fixed | - | 10.625% | 8/1/2018 | $ | 7,780,000 | 7,780,000 | 8,207,900 | 1.04 | % | E | ||||||||||||||||||||
| Business Support Services | ||||||||||||||||||||||||||||||||
| STG-Fairway Acquisitions, Inc. | Second Lien Term Loan | LIBOR (Q) | 1.25% | 9.25% | 8/28/2019 | $ | 14,643,455 | 13,944,123 | 14,929,002 | 1.89 | % | |||||||||||||||||||||
| Chemical Manufacturing | ||||||||||||||||||||||||||||||||
| Archroma | Term Loan B | LIBOR (Q) | 1.25% | 8.25% | 9/30/2018 | $ | 17,456,250 | 17,107,125 | 17,401,699 | 2.20 | % | |||||||||||||||||||||
| Communications Equipment Manufacturing | ||||||||||||||||||||||||||||||||
| Globecomm Systems Inc. | First Lien Term Loan | LIBOR (Q) | 1.25% | 7.625% | 12/11/2018 | $ | 15,000,000 | 14,850,000 | 15,097,500 | 1.91 | % | B | ||||||||||||||||||||
| Computer Equipment Manufacturing | ||||||||||||||||||||||||||||||||
| ELO Touch Solutions, Inc. | Second Lien Term Loan | LIBOR (Q) | 1.50% | 10.50% | 12/1/2018 | $ | 10,000,000 | 9,666,672 | 9,100,000 | 1.15 | % | |||||||||||||||||||||
| Converted Paper Products Manufacturing | ||||||||||||||||||||||||||||||||
| Ranpak Corp. | Second Lien Term Loan | LIBOR (Q) | 1.25% | 7.25% | 4/23/2020 | $ | 3,469,573 | 3,434,877 | 3,573,660 | 0.45 | % | |||||||||||||||||||||
| Computer Systems Design and Related Services | ||||||||||||||||||||||||||||||||
| Blue Coat Systems | First Lien Revolver | LIBOR (Q) | 1.00% | 3.50% | 5/31/2018 | $ | 4,500,000 | 3,540,000 | 4,060,800 | 0.51 | % | L | ||||||||||||||||||||
| Blue Coat Systems | Second Lien Term Loan | LIBOR (Q) | 1.00% | 8.50% | 6/28/2020 | $ | 15,000,000 | 14,878,125 | 15,300,000 | 1.94 | % | |||||||||||||||||||||
| OnX Enterprise Solutions, Ltd. | First Lien Term Loan | LIBOR (Q) | - | 7.00% | 9/3/2018 | $ | 10,640,000 | 10,483,300 | 10,709,160 | 1.36 | % | |||||||||||||||||||||
| OnX USA, LLC | First Lien Term Loan | LIBOR (Q) | - | 7.00% | 9/3/2018 | $ | 5,320,000 | 5,244,790 | 5,354,580 | 0.68 | % | |||||||||||||||||||||
| Websense, Inc. | Second Lien Term Loan | LIBOR (Q) | 1.00% | 7.25% | 12/27/2020 | $ | 7,200,000 | 7,164,000 | 7,218,000 | 0.91 | % | |||||||||||||||||||||
| 41,310,215 | 42,642,540 | 5.40 | % | |||||||||||||||||||||||||||||
| Data Processing, Hosting, and Related Services | ||||||||||||||||||||||||||||||||
| The Telx Group, Inc. | Senior Unsecured Notes | Fixed | - |
10%
Cash
+ 2% PIK |
9/26/2019 | $ | 7,098,916 | 6,960,435 | 7,631,335 | 0.97 | % | E | ||||||||||||||||||||
| Electric Power Generation, Transmission and Distribution | ||||||||||||||||||||||||||||||||
| Panda Sherman Power, LLC | First Lien Term Loan | LIBOR (Q) | 1.50% | 7.50% | 9/14/2018 | $ | 11,070,172 | 10,932,474 | 11,402,277 | 1.44 | % | |||||||||||||||||||||
| Panda Temple Power II, LLC | First Lien Term Loan | LIBOR (Q) | 1.25% | 6.00% | 4/3/2019 | $ | 5,892,970 | 5,834,041 | 6,069,759 | 0.77 | % | |||||||||||||||||||||
| 16,766,515 | 17,472,036 | 2.21 | % | |||||||||||||||||||||||||||||
| Electrical Equipment and Component Manufacturing | ||||||||||||||||||||||||||||||||
| Palladium Energy, Inc. | First Lien Term Loan | LIBOR (Q) | 1.00% | 9.00% | 12/26/2027 | $ | 16,500,317 | 16,225,541 | 16,426,066 | 2.08 | % | |||||||||||||||||||||
| Fabricated Metal Product Manufacturing | ||||||||||||||||||||||||||||||||
| Constellation Enterprises, LLC | First Lien Notes | Fixed | - | 10.625% | 2/1/2016 | $ | 12,500,000 | 12,322,875 | 10,875,000 | 1.38 | % | E/G | ||||||||||||||||||||
| Financial Investment Activities | ||||||||||||||||||||||||||||||||
| Marsico Capital Management | First Lien Term Loan | LIBOR (M) | - | 5.00% | 12/31/2022 | $ | 10,637,623 | 13,394,183 | 3,882,732 | 0.49 | % | K | ||||||||||||||||||||
| Freight Transportation Arrangement | ||||||||||||||||||||||||||||||||
| Livingston International, Inc. (Canada) | Second Lien Term Loan | LIBOR (Q) | 1.25% | 7.75% | 4/18/2020 | $ | 3,665,217 | 3,597,620 | 3,756,848 | 0.48 | % | J | ||||||||||||||||||||
| Full-Service Restaurants | ||||||||||||||||||||||||||||||||
| RM Holdco, LLC | Subordinated Convertible Term Loan | Fixed | - |
1.12%
PIK |
3/21/2018 | $ | 5,164,796 | 5,164,796 | 2,197,621 | 0.28 | % | B | ||||||||||||||||||||
| RM OpCo, LLC | Convertible First Lien Term Loan Tranche B-1 | Fixed | - |
12%
Cash
+ 7% PIK |
3/21/2016 | $ | 1,370,199 | 1,339,883 | 1,370,199 | 0.17 | % | B | ||||||||||||||||||||
| RM OpCo, LLC | First Lien Term Loan Tranche A | Fixed | - | 11.00% | 3/21/2016 | $ | 3,626,947 | 3,626,947 | 3,626,947 | 0.46 | % | B | ||||||||||||||||||||
| RM OpCo, LLC | First Lien Term Loan Tranche B | Fixed | - |
12%
Cash
+ 7% PIK |
3/21/2016 | $ | 6,825,328 | 6,825,328 | 6,825,328 | 0.86 | % | B | ||||||||||||||||||||
| RM OpCo, LLC | First Lien Term Loan Tranche B-1 | Fixed | - |
12%
Cash
+ 7% PIK |
3/21/2016 | $ | 2,150,088 | 2,109,019 | 2,150,088 | 0.27 | % | B | ||||||||||||||||||||
| 19,065,973 | 16,170,183 | 2.04 | % | |||||||||||||||||||||||||||||
| 68 |
TCP Capital Corp.
Consolidated Statement of Investments (Continued)
December 31, 2013
Showing Percentage of Total Cash and Investments of the Company
| % of | ||||||||||||||||||||||||||||||||
| Issuer | Instrument | Ref | Floor | Spread | Maturity | Principal | Cost | Value | Portfolio | Notes | ||||||||||||||||||||||
| Debt Investments (continued) | ||||||||||||||||||||||||||||||||
| Gaming Industries | ||||||||||||||||||||||||||||||||
| AP Gaming I, LLC | First Lien Term Loan B | LIBOR (Q) | 1.00% | 8.25% | 12/20/2020 | $ | 15,000,000 | $ | 14,550,000 | $ | 14,737,500 | 1.87 | % | |||||||||||||||||||
| Grocery Stores | ||||||||||||||||||||||||||||||||
| Bashas, Inc. | First Lien FILO Term Loan | LIBOR (M) | 1.50% | 9.35% | 12/28/2015 | $ | 14,843,788 | 14,802,168 | 15,066,445 | 1.91 | % | |||||||||||||||||||||
| Inland Water Transportation | ||||||||||||||||||||||||||||||||
| US Shipping Corp | First Lien Term Loan B | LIBOR (Q) | 1.25% | 7.75% | 4/30/2018 | $ | 12,603,333 | 12,477,300 | 12,965,679 | 1.64 | % | |||||||||||||||||||||
| Insurance Related Activities | ||||||||||||||||||||||||||||||||
| Confie Seguros Holding II Co. | Second Lien Term Loan | LIBOR (Q) | 1.25% | 9.00% | 5/8/2019 | $ | 6,341,809 | 6,245,733 | 6,391,370 | 0.81 | % | |||||||||||||||||||||
| Merchant Wholesalers | ||||||||||||||||||||||||||||||||
| Envision Acquisition Company, LLC | Second Lien Term Loan | LIBOR (Q) | 1.00% | 8.75% | 11/4/2021 | $ | 9,079,011 | 8,897,430 | 9,192,498 | 1.16 | % | |||||||||||||||||||||
| Metal Ore Mining | ||||||||||||||||||||||||||||||||
| St Barbara Ltd. (Australia) | First Priority Senior Secured Notes | Fixed | - | 8.875% | 4/15/2018 | $ | 7,359,000 | 7,326,651 | 6,144,765 | 0.78 | % | E | ||||||||||||||||||||
| Motion Picture and Video Industries | ||||||||||||||||||||||||||||||||
| CORE Entertainment, Inc. | First Lien Term Loan | Fixed | - | 9.00% | 6/21/2017 | $ | 9,462,231 | 9,381,116 | 8,610,631 | 1.09 | % | |||||||||||||||||||||
| CORE Entertainment, Inc. | Second Lien Term Loan | Fixed | - | 13.50% | 6/21/2018 | $ | 7,569,785 | 7,502,054 | 6,858,225 | 0.88 | % | |||||||||||||||||||||
| 16,883,170 | 15,468,856 | 1.97 | % | |||||||||||||||||||||||||||||
| Newspaper, Periodical, Book, and Directory Publishers | ||||||||||||||||||||||||||||||||
| Hanley-Wood, LLC | First Lien FILO Term Loan | LIBOR (Q) | 1.25% | 6.75% | 7/15/2018 | $ | 16,707,600 | 16,707,600 | 16,699,246 | 2.13 | % | |||||||||||||||||||||
| MediMedia USA, Inc. | First Lien Revolver | LIBOR (M) | - | 6.75% | 5/20/2018 | $ | 4,960,000 | 3,797,500 | 4,523,908 | 0.57 | % | |||||||||||||||||||||
| MediMedia USA, Inc. | First Lien Term Loan | LIBOR (M) | 1.25% | 6.75% | 11/20/2018 | $ | 9,701,250 | 9,433,029 | 9,458,719 | 1.20 | % | |||||||||||||||||||||
| 29,938,129 | 30,681,873 | 3.90 | % | |||||||||||||||||||||||||||||
| Nondepository Credit Intermediation | ||||||||||||||||||||||||||||||||
| Caribbean Financial Group (Cayman Islands) | Senior Secured Notes | Fixed | - | 11.50% | 11/15/2019 | $ | 10,000,000 | 9,824,072 | 10,700,000 | 1.35 | % | E | ||||||||||||||||||||
| Trade Finance Funding I, Ltd. (Cayman Islands) | Secured Class B Notes | Fixed | - | 10.75% | 11/13/2018 | $ | 15,000,000 | 15,000,000 | 14,962,500 | 1.90 | % | E/J | ||||||||||||||||||||
| 24,824,072 | 25,662,500 | 3.25 | % | |||||||||||||||||||||||||||||
| Nonresidential Building Construction | ||||||||||||||||||||||||||||||||
| NCM Group Holdings, LLC | First Lien Term Loan | LIBOR (Q) | 1.00% | 11.50% | 8/29/2018 | $ | 10,000,000 | 9,620,619 | 9,875,000 | 1.25 | % | |||||||||||||||||||||
| Nonscheduled Air Transportation | ||||||||||||||||||||||||||||||||
| One Sky Flight, LLC | Second Lien Term Loan | Fixed | - |
12%
Cash
+ 3% PIK |
5/4/2019 | $ | 18,200,000 | 16,929,086 | 17,708,600 | 2.24 | % | |||||||||||||||||||||
| Oil and Gas Extraction | ||||||||||||||||||||||||||||||||
| Willbros Group, Inc. | First Lien Term Loan | LIBOR (Q) | 1.25% | 9.75% | 8/7/2019 | $ | 15,426,118 | 15,051,713 | 15,657,510 | 1.98 | % | |||||||||||||||||||||
| Other Telecommunications | ||||||||||||||||||||||||||||||||
| Securus Technologies, Inc. | Second Lien Term Loan | LIBOR (Q) | 1.25% | 7.75% | 4/30/2021 | $ | 14,000,000 | 13,860,000 | 13,925,660 | 1.76 | % | |||||||||||||||||||||
| Petroleum and Coal Products Manufacturing | ||||||||||||||||||||||||||||||||
| Boomerang Tube, LLC | Second Lien Term Loan | LIBOR (Q) | 1.50% | 9.50% | 10/11/2017 | $ | 7,749,023 | 7,563,978 | 7,477,807 | 0.95 | % | |||||||||||||||||||||
| Plastics Products Manufacturing | ||||||||||||||||||||||||||||||||
| Iracore International, Inc. | Senior Secured Notes | Fixed | - | 9.50% | 6/1/2018 | $ | 13,600,000 | 13,600,000 | 14,426,622 | 1.83 | % | E | ||||||||||||||||||||
| Professional, Scientific, and Technical Services | ||||||||||||||||||||||||||||||||
| Connolly, LLC | Second Lien Term Loan | LIBOR (Q) | 1.25% | 9.25% | 7/15/2019 | $ | 12,000,000 | 11,829,534 | 12,270,000 | 1.55 | % | |||||||||||||||||||||
| ConvergeOne Holdings | First Lien Term Loan | LIBOR (Q) | 1.25% | 8.00% | 5/8/2019 | $ | 12,654,643 | 12,464,823 | 12,570,236 | 1.59 | % | |||||||||||||||||||||
| 24,294,357 | 24,840,236 | 3.14 | % | |||||||||||||||||||||||||||||
| Promoters of Performing Arts, Sports, and Similar Events | ||||||||||||||||||||||||||||||||
| Stadium Management Group | Second Lien Term Loan | LIBOR (M) | 1.25% | 9.50% | 12/7/2018 | $ | 11,000,000 | 10,817,390 | 11,055,000 | 1.40 | % | |||||||||||||||||||||
| Radio and Television Broadcasting | ||||||||||||||||||||||||||||||||
| SiTV, Inc. | First Lien Term Loan | LIBOR (Q) | 2.00% |
6%
Cash
+ 4% PIK |
8/3/2016 | $ | 6,995,124 | 6,648,634 | 6,774,778 | 0.86 | % | |||||||||||||||||||||
| The Tennis Channel, Inc. | First Lien Term Loan | LIBOR (Q) | - | 8.50% | 5/29/2017 | $ | 17,589,459 | 17,134,705 | 17,615,843 | 2.23 | % | |||||||||||||||||||||
| 23,783,339 | 24,390,621 | 3.09 | % | |||||||||||||||||||||||||||||
| Retail | ||||||||||||||||||||||||||||||||
| Kenneth Cole Productions, Inc. | First Lien FILO Term Loan | LIBOR (M) | 1.00% | 10.40% | 9/25/2017 | $ | 11,272,727 | 11,051,496 | 11,329,090 | 1.44 | % | |||||||||||||||||||||
| Shopzilla, Inc. | Second Lien Term Loan | LIBOR (Q) | - | 9.50% | 3/31/2016 | $ | 6,710,057 | 6,525,027 | 6,683,216 | 0.85 | % | |||||||||||||||||||||
| 17,576,523 | 18,012,306 | 2.29 | % | |||||||||||||||||||||||||||||
| Satellite Telecommunications | ||||||||||||||||||||||||||||||||
| Avanti Communications Group, PLC (United Kingdom) | Senior Secured Notes | Fixed | - | 10.00% | 10/1/2019 | $ | 9,914,000 | 9,914,000 | 10,335,345 | 1.31 | % | E/H/J | ||||||||||||||||||||
| 69 |
TCP Capital Corp.
Consolidated Statement of Investments (Continued)
December 31, 2013
Showing Percentage of Total Cash and Investments of the Company
| % of | ||||||||||||||||||||||||||||||||
| Issuer | Instrument | Ref | Floor | Spread | Maturity | Principal | Cost | Value | Portfolio | Notes | ||||||||||||||||||||||
| Debt Investments (continued) | ||||||||||||||||||||||||||||||||
| Scheduled Air Transportation | ||||||||||||||||||||||||||||||||
| Aircraft Leased to Delta Air Lines, Inc. | ||||||||||||||||||||||||||||||||
| N913DL | Aircraft Secured Mortgage | Fixed | - | 8.00% | 3/15/2017 | $ | 289,048 | $ | 289,048 | $ | 296,820 | 0.04 | % | F | ||||||||||||||||||
| N918DL | Aircraft Secured Mortgage | Fixed | - | 8.00% | 8/15/2018 | $ | 388,001 | 388,001 | 397,290 | 0.05 | % | F | ||||||||||||||||||||
| N954DL | Aircraft Secured Mortgage | Fixed | - | 8.00% | 3/20/2019 | $ | 514,375 | 514,375 | 524,620 | 0.07 | % | F | ||||||||||||||||||||
| N955DL | Aircraft Secured Mortgage | Fixed | - | 8.00% | 6/20/2019 | $ | 533,283 | 533,283 | 543,320 | 0.07 | % | F | ||||||||||||||||||||
| N956DL | Aircraft Secured Mortgage | Fixed | - | 8.00% | 5/20/2019 | $ | 532,275 | 532,275 | 542,640 | 0.07 | % | F | ||||||||||||||||||||
| N957DL | Aircraft Secured Mortgage | Fixed | - | 8.00% | 6/20/2019 | $ | 537,947 | 537,947 | 548,250 | 0.07 | % | F | ||||||||||||||||||||
| N959DL | Aircraft Secured Mortgage | Fixed | - | 8.00% | 7/20/2019 | $ | 543,573 | 543,573 | 553,520 | 0.07 | % | F | ||||||||||||||||||||
| N960DL | Aircraft Secured Mortgage | Fixed | - | 8.00% | 10/20/2019 | $ | 564,855 | 564,855 | 574,430 | 0.07 | % | F | ||||||||||||||||||||
| N961DL | Aircraft Secured Mortgage | Fixed | - | 8.00% | 8/20/2019 | $ | 558,427 | 558,427 | 568,310 | 0.07 | % | F | ||||||||||||||||||||
| N976DL | Aircraft Secured Mortgage | Fixed | - | 8.00% | 2/15/2018 | $ | 394,360 | 394,360 | 404,600 | 0.05 | % | F | ||||||||||||||||||||
| Aircraft Leased to United Airlines, Inc. | ||||||||||||||||||||||||||||||||
| N510UA | Aircraft Secured Mortgage | Fixed | - | 20.00% | 10/26/2016 | $ | 328,848 | 328,848 | 404,605 | 0.05 | % | B | ||||||||||||||||||||
| N512UA | Aircraft Secured Mortgage | Fixed | - | 20.00% | 10/26/2016 | $ | 334,535 | 334,535 | 414,010 | 0.05 | % | B | ||||||||||||||||||||
| N536UA | Aircraft Secured Mortgage | Fixed | - | 16.00% | 9/29/2014 | $ | 108,845 | 108,845 | 114,000 | 0.01 | % | B | ||||||||||||||||||||
| N545UA | Aircraft Secured Mortgage | Fixed | - | 16.00% | 8/29/2015 | $ | 249,695 | 249,695 | 275,405 | 0.03 | % | B | ||||||||||||||||||||
| N585UA | Aircraft Secured Mortgage | Fixed | - | 20.00% | 10/25/2016 | $ | 392,794 | 392,794 | 486,115 | 0.06 | % | B | ||||||||||||||||||||
| N659UA | Aircraft Secured Mortgage | Fixed | - | 12.00% | 2/28/2016 | $ | 2,708,150 | 2,708,150 | 2,948,986 | 0.37 | % | F | ||||||||||||||||||||
| N661UA | Aircraft Secured Mortgage | Fixed | - | 12.00% | 5/4/2016 | $ | 2,880,186 | 2,880,186 | 3,171,026 | 0.40 | % | F | ||||||||||||||||||||
| 11,859,197 | 12,767,947 | 1.60 | % | |||||||||||||||||||||||||||||
| Scientific Research and Development Services | ||||||||||||||||||||||||||||||||
| BPA Laboratories, Inc. | Senior Secured Notes | Fixed | - | 12.25% | 4/1/2017 | $ | 17,200,000 | 16,536,295 | 17,630,000 | 2.23 | % | E | ||||||||||||||||||||
| Semiconductor and Other Electronic Component Manufacturing | ||||||||||||||||||||||||||||||||
| Isola USA Corporation | Senior Secured Term Loan B | LIBOR (Q) | 1.00% | 8.25% | 11/29/2018 | $ | 14,583,333 | 14,366,560 | 14,729,167 | 1.87 | % | |||||||||||||||||||||
| Software Publishers | ||||||||||||||||||||||||||||||||
| BlackLine Systems, Inc. | First Lien Term Loan | LIBOR (Q) | 1.50% |
0.4%
Cash
+ 7.6% PIK |
9/25/2018 | $ | 12,579,747 | 11,811,044 | 12,183,485 | 1.56 | % | |||||||||||||||||||||
| Coreone Technologies, LLC | First Lien Term Loan | LIBOR (Q) | 1.00% |
3.75%
Cash
+5% PIK |
9/14/2018 | $ | 13,556,801 | 13,243,533 | 13,455,125 | 1.72 | % | |||||||||||||||||||||
| Deltek, Inc. | Second Lien Term Loan | LIBOR (Q) | 1.25% | 8.75% | 10/10/2019 | $ | 15,000,000 | 14,805,253 | 15,300,000 | 1.94 | % | |||||||||||||||||||||
| Edmentum, Inc. | Second Lien Term Loan | LIBOR (Q) | 1.50% | 9.75% | 5/17/2019 | $ | 15,000,000 | 14,748,486 | 15,112,500 | 1.91 | % | |||||||||||||||||||||
| 54,608,316 | 56,051,110 | 7.13 | % | |||||||||||||||||||||||||||||
| Specialty Hospitals | ||||||||||||||||||||||||||||||||
| UBC Healthcare Analytics, Inc. | First Lien Term Loan | LIBOR (Q) | 1.00% | 9.00% | 7/1/2018 | $ | 5,526,021 | 5,498,391 | 5,559,177 | 0.70 | % | |||||||||||||||||||||
| Vantage Oncology, LLC | Senior Secured Notes | - | 9.50% | 6/15/2017 | $ | 5,000,000 | 5,000,000 | 5,137,500 | 0.65 | % | E | |||||||||||||||||||||
| 10,498,391 | 10,696,677 | 1.35 | % | |||||||||||||||||||||||||||||
| Structured Note Funds | ||||||||||||||||||||||||||||||||
| Magnolia Finance V plc (Cayman Islands) | Asset-Backed Credit Linked Notes | Fixed | - | 13.125% | 8/2/2021 | $ | 15,000,000 | 15,000,000 | 15,000,000 | 1.90 | % | E/J | ||||||||||||||||||||
| Textile Furnishings Mills | ||||||||||||||||||||||||||||||||
| Lexmark Carpet Mills, Inc. | First Lien Term Loan | LIBOR (Q) | 1.00% | 10.00% | 9/30/2018 | $ | 16,351,467 | 15,942,680 | 16,392,346 | 2.08 | % | |||||||||||||||||||||
| Wired Telecommunications Carriers | ||||||||||||||||||||||||||||||||
| Integra Telecom Holdings, Inc. | Second Lien Term Loan | LIBOR (Q) | 1.25% | 8.50% | 2/22/2020 | $ | 15,000,000 | 14,701,027 | 15,459,375 | 1.96 | % | |||||||||||||||||||||
| Wireless Telecommunications Carriers | ||||||||||||||||||||||||||||||||
| Alpheus Communications, LLC | First Lien Delayed FILO Term Loan | LIBOR (Q) | 1.00% | 6.92% | 5/31/2018 | $ | – | (11,183 | ) | (8,437 | ) | - | M | |||||||||||||||||||
| Alpheus Communications, LLC | First Lien FILO Term Loan | LIBOR (Q) | 1.00% | 6.92% | 5/31/2018 | $ | 8,248,124 | 8,166,127 | 8,186,263 | 1.04 | % | |||||||||||||||||||||
| Globalive Wireless Management Corp. (Canada) | First Lien Term Loan | LIBOR (Q) | - | 10.90% | 4/30/2014 | $ | 3,037,292 | 2,933,872 | 3,067,665 | 0.39 | % | J | ||||||||||||||||||||
| Gogo, LLC | First Lien Term Loan | LIBOR (Q) | 1.50% | 9.75% | 6/21/2017 | $ | 19,587,428 | 18,707,700 | 21,252,360 | 2.69 | % | |||||||||||||||||||||
| 29,796,516 | 32,497,851 | 4.12 | % | |||||||||||||||||||||||||||||
| Total Debt Investments | 720,651,321 | 726,514,593 | 92.05 | % | ||||||||||||||||||||||||||||
| 70 |
TCP Capital Corp.
Consolidated Statement of Investments (Continued)
December 31, 2013
Showing Percentage of Total Cash and Investments of the Company
| % of | ||||||||||||||||||||||||||||||||
| Issuer | Instrument | Ref | Floor | Spread | Maturity | Shares | Cost | Value | Portfolio | Notes | ||||||||||||||||||||||
| Equity Securities | ||||||||||||||||||||||||||||||||
| Architectural, Engineering, and Related Services | ||||||||||||||||||||||||||||||||
| ESP Holdings, Inc. | Cumulative Preferred 15% | 20,297 | $ | 2,249,930 | $ | 3,947,862 | 0.51 | % | B/C/E | |||||||||||||||||||||||
| ESP Holdings, Inc., Common Stock | Common Stock | 88,670 | 9,311,782 | 2,856,346 | 0.36 | % | B/C/E | |||||||||||||||||||||||||
| 11,561,712 | 6,804,208 | 0.87 | % | |||||||||||||||||||||||||||||
| Business Support Services | ||||||||||||||||||||||||||||||||
| STG-Fairway Holdings | Class A Units | 841,479 | 1,174,225 | 1,722,508 | 0.22 | % | C/E | |||||||||||||||||||||||||
| Wasserstein Cosmos Co-Invest, L.P. | Limited Partnership Units | 5,000,000 | 5,000,000 | 5,000,000 | 0.64 | % | B/C/E | |||||||||||||||||||||||||
| 6,174,225 | 6,722,508 | 0.86 | % | |||||||||||||||||||||||||||||
| Data Processing, Hosting, and Related Services | ||||||||||||||||||||||||||||||||
| Anacomp, Inc. | Class A Common Stock | 1,255,527 | 26,711,048 | 1,004,422 | 0.13 | % | B/C/E | |||||||||||||||||||||||||
| Depository Credit Intermediation | ||||||||||||||||||||||||||||||||
| Doral Financial Corporation | Common Stock | 53,890 | 11,699,417 | 843,913 | 0.11 | % | C/L | |||||||||||||||||||||||||
| Financial Investment Activities | ||||||||||||||||||||||||||||||||
| Marsico Holdings, LLC | Common Interest Units | 168,698 | 172,694 | 4,302 | - | C/E/K | ||||||||||||||||||||||||||
| Full-Service Restaurants | ||||||||||||||||||||||||||||||||
| RM Holdco, LLC | Membership Units | 13,161,000 | 2,010,777 | - | - | B/C/E | ||||||||||||||||||||||||||
| Machine Shops; Turned Product; and Screw, Nut, and Bolt Manufacturing | ||||||||||||||||||||||||||||||||
| Precision Holdings, LLC | Class C Membership Interests | 33 | - | 41,645 | 0.01 | % | C/E | |||||||||||||||||||||||||
| Nonmetallic Mineral Mining and Quarrying | ||||||||||||||||||||||||||||||||
| EPMC HoldCo, LLC | Membership Units | 1,312,720 | - | 1,562,137 | 0.20 | % | B/E | |||||||||||||||||||||||||
| Nonscheduled Air Transportation | ||||||||||||||||||||||||||||||||
| Flight Options Holdings I, Inc. | Warrants to Purchase Common Stock | 1,843 | 1,274,000 | 1,268,904 | 0.16 | % | C/E | |||||||||||||||||||||||||
| Radio and Television Broadcasting | ||||||||||||||||||||||||||||||||
| SiTV, Inc. | Warrants to Purchase Common Stock | 233,470 | 300,322 | 354,874 | 0.04 | % | C/E | |||||||||||||||||||||||||
| Retail | ||||||||||||||||||||||||||||||||
| Shop Holding, LLC | Class A Unit | 490,037 | 462,576 | 532,919 | 0.07 | % | C/E | |||||||||||||||||||||||||
| Shop Holding, LLC | Warrants to Purchase Class A Unit | 326,691 | - | 38,258 | - | C/E | ||||||||||||||||||||||||||
| 462,576 | 571,177 | 0.07 | % | |||||||||||||||||||||||||||||
| Scheduled Air Transportation | ||||||||||||||||||||||||||||||||
| Aircraft Leased to Delta Air Lines, Inc. | ||||||||||||||||||||||||||||||||
| N913DL | Trust Beneficial Interests | 727 | 97,376 | 125,970 | 0.02 | % | E/F | |||||||||||||||||||||||||
| N918DL | Trust Beneficial Interests | 623 | 109,938 | 142,970 | 0.02 | % | E/F | |||||||||||||||||||||||||
| N954DL | Trust Beneficial Interests | 591 | 133,027 | 68,000 | 0.01 | % | E/F | |||||||||||||||||||||||||
| N955DL | Trust Beneficial Interests | 576 | 133,868 | 113,560 | 0.01 | % | E/F | |||||||||||||||||||||||||
| N956DL | Trust Beneficial Interests | 580 | 133,907 | 108,800 | 0.01 | % | E/F | |||||||||||||||||||||||||
| N957DL | Trust Beneficial Interests | 576 | 134,785 | 109,650 | 0.01 | % | E/F | |||||||||||||||||||||||||
| N959DL | Trust Beneficial Interests | 573 | 135,658 | 110,500 | 0.01 | % | E/F | |||||||||||||||||||||||||
| N960DL | Trust Beneficial Interests | 563 | 139,173 | 109,650 | 0.01 | % | E/F | |||||||||||||||||||||||||
| N961DL | Trust Beneficial Interests | 570 | 138,350 | 103,870 | 0.01 | % | E/F | |||||||||||||||||||||||||
| N976DL | Trust Beneficial Interests | 654 | 113,413 | 103,033 | 0.01 | % | E/F | |||||||||||||||||||||||||
| Aircraft Leased to United Airlines, Inc. | ||||||||||||||||||||||||||||||||
| N510UA | Trust Beneficial Interests | 54 | 197,409 | 465,625 | 0.06 | % | B/E | |||||||||||||||||||||||||
| N512UA | Trust Beneficial Interests | 53 | 193,046 | 458,277 | 0.06 | % | B/E | |||||||||||||||||||||||||
| N536UA | Trust Beneficial Interests | 81 | 396,289 | 656,766 | 0.08 | % | B/E | |||||||||||||||||||||||||
| N545UA | Trust Beneficial Interests | 67 | 348,071 | 641,840 | 0.08 | % | B/E | |||||||||||||||||||||||||
| N585UA | Trust Beneficial Interests | 53 | 214,737 | 571,706 | 0.07 | % | B/E | |||||||||||||||||||||||||
| United N659UA-767, LLC (N659UA) | Trust Beneficial Interests | 412 | 2,097,640 | 2,840,323 | 0.36 | % | E/F | |||||||||||||||||||||||||
| United N661UA-767, LLC (N661UA) | Trust Beneficial Interests | 400 | 2,066,062 | 2,852,677 | 0.36 | % | E/F | |||||||||||||||||||||||||
| 6,782,749 | 9,583,217 | 1.19 | % | |||||||||||||||||||||||||||||
| Resin, Synthetic Rubber, and Artificial Synthetic Fibers and Filaments Manufacturing | ||||||||||||||||||||||||||||||||
| KAGY Holding Company, Inc. | Series A Preferred Stock | 9,778 | 1,091,200 | 662,134 | 0.08 | % | B/C/E | |||||||||||||||||||||||||
| Semiconductor and Other Electronic Component Manufacturing | ||||||||||||||||||||||||||||||||
| AIP/IS Holdings, LLC | Membership Units | 352 | - | 229,504 | 0.03 | % | C/E | |||||||||||||||||||||||||
| Software Publishers | ||||||||||||||||||||||||||||||||
| SLS Breeze Intermediate Holdings, Inc. | Warrants to Purchase Common Stock | 1,232,731 | 522,678 | 561,632 | 0.07 | % | C/E | |||||||||||||||||||||||||
| Wired Telecommunications Carriers | ||||||||||||||||||||||||||||||||
| Integra Telecom, Inc. | Common Stock | 1,274,522 | 8,433,884 | 5,583,686 | 0.72 | % | C/E | |||||||||||||||||||||||||
| Integra Telecom, Inc. | Warrants | 346,939 | 19,920 | 194,050 | 0.02 | % | C/E | |||||||||||||||||||||||||
| V Telecom Investment S.C.A (Luxembourg) | Common Shares | 1,393 | 3,236,256 | 3,756,053 | 0.48 | % | C/D/E/J | |||||||||||||||||||||||||
| 11,690,060 | 9,533,789 | 1.22 | % | |||||||||||||||||||||||||||||
| Total Equity Securities | 80,453,458 | 39,748,366 | 5.04 | % | ||||||||||||||||||||||||||||
| Total Investments | 801,104,779 | 766,262,959 | ||||||||||||||||||||||||||||||
| 71 |
TCP Capital Corp.
Consolidated Statement of Investments (Continued)
December 31, 2013
Showing Percentage of Total Cash and Investments of the Company
| % of | ||||||||||||||||||||||||||||||||
| Issuer | Instrument | Ref | Floor | Spread | Maturity | Shares | Cost | Value | Portfolio | Notes | ||||||||||||||||||||||
| Cash and Cash Equivalents | ||||||||||||||||||||||||||||||||
| Wells Fargo & Company | Overnight Repurchase Agreement | Fixed | - | 0.09% | 1/2/2014 | $ | 10,501,688 | 1.33 | % | |||||||||||||||||||||||
| Union Bank of California | Commercial Paper | Fixed | - | 0.10% | 1/2/2014 | 8,499,976 | 1.07 | % | ||||||||||||||||||||||||
| Cash Denominated in Foreign Currencies | 121,389 | 0.02 | % | |||||||||||||||||||||||||||||
| Cash Denominated in Foreign Currencies | 0.00 | % | ||||||||||||||||||||||||||||||
| Cash Held on Account at Various Institutions | 3,861,129 | 0.49 | % | |||||||||||||||||||||||||||||
| Cash and Cash Equivalents | 22,984,182 | 2.91 | % | |||||||||||||||||||||||||||||
| Total Cash and Investments | $ | 789,247,141 | 100.00 | % | I | |||||||||||||||||||||||||||
Notes to Consolidated Statement of Investments:
| (A) | Investments in bank debt generally are bought and sold among institutional investors in transactions not subject to registration under the Securities Act of 1933. Such transactions are generally subject to contractual restrictions, such as approval of the agent or borrower. |
| (B) | Non-controlled affiliate – as defined under the Investment Company Act of 1940 (ownership of between 5% and 25% of the outstanding voting securities of this issuer). See Consolidated Schedule of Changes in Investments in Affiliates. |
| (C) | Non-income producing security. |
| (D) | Principal amount denominated in foreign currency. Amortized cost and fair value converted from foreign currency to US dollars. (See Note 2) |
| (E) | Restricted security. (See Note 2) |
| (F) | Controlled issuer – as defined under the Investment Company Act of 1940 (ownership of 25% or more of the outstanding voting securities of this issuer). Investment is not more than 50% owned nor deemed to be a significant subsidiary. See Consolidated Schedule of Changes in Investments in Affiliates. |
| (G) | Investment has been segregated to collateralize certain unfunded commitments. |
| (H) | $2,000,000 principal amount of this investment has been segregated to collateralize certain unfunded commitments. |
| (I) | All cash and investments, except those referenced in Notes G and H above, are pledged as collateral under the Revolving Facilities as described in Note 4 to the Consolidated Financial Statements. |
| (J) | Non-U.S. company or principal place of business outside the U.S. and as a result the investment is not a qualifying asset under Section 55(a) of the Investment Company Act. Under the Investment Company Act, the Company may not acquire any non-qualifying asset unless, at the time such acquisition is made, qualifying assets represent at least 70% of the Company's total assets. |
| (K) | Deemed an investment company under Section 3(c) of the Investment Company Act and as a result the investment is not a qualifying asset under Section 55(a) of the Investment Company Act. Under the Investment Company Act, the Company may not acquire any non-qualifying asset unless, at the time such acquisition is made, qualifying assets represent at least 70% of the Company's total assets. |
| (L) | Publicly traded company with a market capitalization greater than $250 million and as a result the investment is not a qualifying asset under Section 55(a) of the Investment Company Act. Under the Investment Company Act, the Company may not acquire any non-qualifying asset unless, at the time such acquisition is made, qualifying assets represent at least 70% of the Company's total assets. |
| (M) | Negative balances relate to an unfunded commitment that was acquired at a discount. |
LIBOR or EURIBOR resets monthly (M), quarterly (Q), or semiannually (S).
Aggregate acquisitions and aggregate dispositions of investments, other than government securities, totaled $471,087,319, and $235,641,665, respectively for the year ended December 31, 2013. Aggregate acquisitions includes investment assets received as payment in kind. Aggregate dispositions includes principal paydowns on and maturities of debt investments. The total value of restricted securities and bank debt as of December 31, 2013 was $765,419,046, or 97.0% of total cash and investments of the Company.
Options and Swaps at December 31, 2013 were as follows:
| Investment | Notional Amount | Fair Value | ||||||||||
| Interest Rate Cap, 4%, expires 5/15/2016 | $ | 25,000,000 | $ | 14,139 | ||||||||
| Euro/US Dollar Cross-Currency Basis Swap, Pay Euros/Receive USD, Expires 3/31/17 | $ | 4,289,019 | $ | (331,183 | ) | |||||||
See accompanying notes.
| 72 |
Consolidated Statements of Operations
| Year Ended December 31, | ||||||||||||
| 2014 | 2013 | 2012 (1) | ||||||||||
| Investment income | ||||||||||||
| Interest income: | ||||||||||||
| Companies less than 5% owned | $ | 94,632,495 | $ | 60,323,117 | $ | 42,139,023 | ||||||
| Companies 5% to 25% owned | 5,394,075 | 5,445,021 | 5,850,394 | |||||||||
| Companies more than 25% owned | 896,695 | 1,210,926 | 1,253,915 | |||||||||
| Dividend income: | ||||||||||||
| Companies 5% to 25% owned | 1,968,748 | – | 1,811,189 | |||||||||
| Lease income: | ||||||||||||
| Companies 5% to 25% owned | 320,277 | 420,375 | 332,964 | |||||||||
| Companies more than 25% owned | 1,014,053 | 701,239 | 490,066 | |||||||||
| Other income: | ||||||||||||
| Companies less than 5% owned | 2,328,980 | 1,470,116 | 289,073 | |||||||||
| Companies 5% to 25% owned | 26,125 | 38,252 | 26,135 | |||||||||
| Total investment income | 106,581,448 | 69,609,046 | 52,192,759 | |||||||||
| Operating expenses | ||||||||||||
| Management and advisory fees | 13,646,064 | 8,820,229 | 6,908,942 | |||||||||
| Interest expense | 7,010,215 | 1,194,158 | 190,702 | |||||||||
| Amortization of deferred debt issuance costs | 1,926,040 | 852,618 | 441,495 | |||||||||
| Administrative expenses | 1,421,863 | 849,228 | – | |||||||||
| Legal fees, professional fees and due diligence expenses | 1,355,370 | 797,568 | 1,165,318 | |||||||||
| Commitment fees | 885,496 | 292,671 | 225,560 | |||||||||
| Director fees | 357,050 | 288,336 | 199,333 | |||||||||
| Insurance expense | 288,156 | 189,139 | 130,140 | |||||||||
| Custody fees | 229,254 | 149,860 | 99,947 | |||||||||
| Professional fees relating to the Conversion | – | – | 411,523 | |||||||||
| Other operating expenses | 1,360,564 | 867,353 | 619,461 | |||||||||
| Total operating expenses | 28,480,072 | 14,301,160 | 10,392,421 | |||||||||
| Net investment income before taxes | 78,101,376 | 55,307,886 | 41,800,338 | |||||||||
| Excise tax expense | 808,813 | 977,624 | 1,479,978 | |||||||||
| Net investment income | 77,292,563 | 54,330,262 | 40,320,360 | |||||||||
| Net realized and unrealized gain (loss) on investments and foreign currency | ||||||||||||
| Net realized loss: | ||||||||||||
| Investments in companies less than 5% owned | (16,370,638 | ) | (40,379,889 | ) | (29,574,293 | ) | ||||||
| Investments in companies 5% to 25% owned | (4,748,229 | ) | (7,004,857 | ) | 13,584,105 | |||||||
| Net realized loss | (21,118,867 | ) | (47,384,746 | ) | (15,990,188 | ) | ||||||
| Net change in net unrealized appreciation/depreciation | (6,185,711 | ) | 56,456,107 | 3,205,937 | ||||||||
| Net realized and unrealized gain (loss) | (27,304,578 | ) | 9,071,361 | (12,784,251 | ) | |||||||
| Dividends on Series A preferred equity facility | (1,444,634 | ) | (1,516,585 | ) | (1,542,932 | ) | ||||||
| Net change in accumulated dividends on Series A preferred equity facility | 6,462 | 22,033 | (59,867 | ) | ||||||||
| Distributions of incentive allocation to the General Partner from: | ||||||||||||
| Net investment income | (15,170,877 | ) | (10,567,142 | ) | – | |||||||
| Net realized gains | – | (645,691 | ) | – | ||||||||
| Net change in reserve for incentive allocation | 1,168,583 | (1,168,583 | ) | – | ||||||||
| Net increase in net assets applicable to common shareholders resulting from operations | $ | 34,547,519 | $ | 49,525,655 | $ | 25,933,310 | ||||||
| Basic and diluted earnings per common share | $ | 0.88 | $ | 1.91 | $ | 1.21 | ||||||
| Basic and diluted weighted average common shares outstanding | 39,395,671 | 25,926,493 | 21,475,847 | |||||||||
See accompanying notes.
(1) Prior to the Conversion on April 2, 2012, the Company’s portfolio had different objectives.
| 73 |
Consolidated Statements of Changes in Net Assets
| Paid in | Accumulated | Accumulated | ||||||||||||||||||||||||||||||
| Common Stock | Capital | Net | Accumulated | Net | Non- | |||||||||||||||||||||||||||
| Shares |
Par
Amount |
in Excess of
Par |
Investment
Income |
Net Realized
Losses |
Unrealized
Depreciation |
controlling
Interest |
Total Net
Assets |
|||||||||||||||||||||||||
| Balance at December 31, 2011 | 418,956 | $ | 419 | $ | 364,742,957 | $ | 13,515,239 | $ | (45,411,498 | ) | $ | (94,976,243 | ) | $ | — | $ | 237,870,874 | |||||||||||||||
| Retirement of old common stock in the Conversion | (418,956 | ) | (419 | ) | 419 | — | — | — | — | — | ||||||||||||||||||||||
| Issuance of common stock in the Conversion | 15,725,635 | 15,726 | (15,726 | ) | — | — | — | — | — | |||||||||||||||||||||||
| Issuance of common stock in public offering | 5,750,000 | 5,750 | 80,956,005 | — | — | — | — | 80,961,755 | ||||||||||||||||||||||||
| Issuance of common stock from dividend reinvestment plan | 1,993 | 2 | 30,383 | — | — | — | — | 30,385 | ||||||||||||||||||||||||
| Net investment income | — | — | — | 40,320,360 | — | — | — | 40,320,360 | ||||||||||||||||||||||||
| Realized and unrealized gains (losses) | — | — | — | — | (15,990,188 | ) | 3,205,937 | — | (12,784,251 | ) | ||||||||||||||||||||||
| Dividends on Series A preferred equity facility | — | — | — | (1,602,799 | ) | — | — | — | (1,602,799 | ) | ||||||||||||||||||||||
| General Partner incentive allocation | — | — | — | — | — | — | — | — | ||||||||||||||||||||||||
| Regular dividends paid to common shareholders | — | — | — | (27,734,951 | ) | — | — | — | (27,734,951 | ) | ||||||||||||||||||||||
| Special dividends paid to common shareholders | — | — | — | (1,073,823 | ) | — | — | — | (1,073,823 | ) | ||||||||||||||||||||||
| Tax reclassification of stockholders' equity in accordance with generally accepted accounting principles | — | — | (1,479,978 | ) | (897,847 | ) | 2,377,825 | — | — | — | ||||||||||||||||||||||
| Balance at December 31, 2012 | 21,477,628 | $ | 21,478 | $ | 444,234,060 | $ | 22,526,179 | $ | (59,023,861 | ) | $ | (91,770,306 | ) | $ | — | $ | 315,987,550 | |||||||||||||||
| Issuance of common stock in public offering, net | 14,720,000 | 14,720 | 224,548,170 | — | — | — | — | 224,562,890 | ||||||||||||||||||||||||
| Issuance of common stock from dividend reinvestment plan | 2,288 | 2 | 37,414 | — | — | — | — | 37,416 | ||||||||||||||||||||||||
| Net investment income | — | — | — | 54,330,262 | — | — | — | 54,330,262 | ||||||||||||||||||||||||
| Realized and unrealized gains (losses) | — | — | — | — | (47,384,746 | ) | 56,456,107 | — | 9,071,361 | |||||||||||||||||||||||
| Dividends on Series A preferred equity facility | — | — | — | (1,494,552 | ) | — | — | — | (1,494,552 | ) | ||||||||||||||||||||||
| General Partner incentive allocation | — | — | — | (10,567,142 | ) | (645,691 | ) | — | (1,168,583 | ) | (12,381,416 | ) | ||||||||||||||||||||
| Regular dividends paid to common shareholders | — | — | — | (37,877,134 | ) | — | — | — | (37,877,134 | ) | ||||||||||||||||||||||
| Special dividends paid to common shareholders | (2,625,122 | ) | (2,625,122 | ) | ||||||||||||||||||||||||||||
| Tax reclassification of stockholders' equity in accordance with generally accepted accounting principles | — | — | (977,624 | ) | (276,396 | ) | 1,254,020 | — | — | — | ||||||||||||||||||||||
| Balance at December 31, 2013 | 36,199,916 | $ | 36,200 | $ | 667,842,020 | $ | 24,016,095 | $ | (105,800,278 | ) | $ | (35,314,199 | ) | $ | (1,168,583 | ) | $ | 549,611,255 | ||||||||||||||
| Issuance of common stock in public offering, net | 12,110,000 | 12,110 | 201,127,367 | — | — | — | — | 201,139,477 | ||||||||||||||||||||||||
| Issuance of common stock from at the market offerings, net | 400,255 | 400 | 6,420,026 | 6,420,426 | ||||||||||||||||||||||||||||
| Issuance of common stock from dividend reinvestment plan | 456 | — | 7,687 | — | — | — | — | 7,687 | ||||||||||||||||||||||||
| Issuance of convertible debt | — | — | 2,515,594 | — | — | — | — | 2,515,594 | ||||||||||||||||||||||||
| Net investment income | — | — | — | 77,292,563 | — | — | — | 77,292,563 | ||||||||||||||||||||||||
| Realized and unrealized gains (losses) | — | — | — | — | (21,118,867 | ) | (6,185,711 | ) | — | (27,304,578 | ) | |||||||||||||||||||||
| Dividends on Series A preferred equity facility | — | — | — | (1,438,172 | ) | — | — | — | (1,438,172 | ) | ||||||||||||||||||||||
| General Partner incentive allocation | — | — | — | (15,170,877 | ) | — | — | 1,168,583 | (14,002,294 | ) | ||||||||||||||||||||||
| Regular dividends paid to common shareholders | — | — | — | (58,867,403 | ) | — | — | — | (58,867,403 | ) | ||||||||||||||||||||||
| Special dividends paid to common shareholders | — | — | — | (4,245,526 | ) | — | — | — | (4,245,526 | ) | ||||||||||||||||||||||
| Tax reclassification of stockholders' equity in accordance with generally accepted accounting principles | — | — | (808,813 | ) | 297,701 | 511,112 | — | — | — | |||||||||||||||||||||||
| Balance at December 31, 2014 | 48,710,627 | $ | 48,710 | $ | 877,103,880 | $ | 21,884,381 | $ | (126,408,033 | ) | $ | (41,499,910 | ) | $ | — | $ | 731,129,028 | |||||||||||||||
See accompanying notes.
| 74 |
Consolidated Statements of Cash Flows
| Year Ended December 31, | ||||||||||||
| 2014 | 2013 | 2012 | ||||||||||
| Operating activities | ||||||||||||
| Net increase in net assets applicable to common shareholders resulting from operations | $ | 34,547,519 | $ | 49,525,655 | $ | 25,933,310 | ||||||
| Adjustments to reconcile net increase in net assets applicable to common shareholders resulting from operations to net cash used in operating activities: | ||||||||||||
| Net realized loss | 21,118,867 | 47,384,746 | 15,990,188 | |||||||||
| Net change in unrealized appreciation/depreciation of investments | 6,085,664 | (55,997,303 | ) | (3,450,486 | ) | |||||||
| Dividends paid on Series A preferred equity facility | 1,444,634 | 1,516,585 | 1,542,932 | |||||||||
| Net change in accumulated dividends on Series A preferred equity facility | (6,462 | ) | (22,033 | ) | 59,867 | |||||||
| Net change in reserve for incentive allocation | (1,168,583 | ) | 1,168,583 | – | ||||||||
| Accretion of original issue discount on investments | (4,843,641 | ) | (2,017,458 | ) | (1,176,644 | ) | ||||||
| Net accretion of market discount/premium | (1,162,316 | ) | (2,007,794 | ) | (2,287,656 | ) | ||||||
| Accretion of original issue discount on convertible debt | 212,424 | – | – | |||||||||
| Interest and dividend income paid in kind | (6,045,878 | ) | (2,620,046 | ) | (2,769,478 | ) | ||||||
| Amortization of deferred debt issuance costs | 1,926,040 | 852,618 | 441,495 | |||||||||
| Changes in assets and liabilities: | ||||||||||||
| Purchases of investment securities | (663,469,748 | ) | (468,467,273 | ) | (356,251,448 | ) | ||||||
| Proceeds from sales, maturities and paydowns of investments | 266,008,974 | 235,641,665 | 211,216,033 | |||||||||
| Decrease (increase) in accrued interest income - companies less than 5% owned | (2,939,648 | ) | (2,243,204 | ) | 1,466,278 | |||||||
| Decrease in accrued interest income - companies 5% to 25% owned | 161,074 | 67,573 | 300,741 | |||||||||
| Decrease (increase) in accrued interest income - companies more than 25% owned | 13,241 | 11,833 | (53,524 | ) | ||||||||
| Decrease (increase) in receivable for investments sold | (7,355,405 | ) | 4,121,451 | (3,430,145 | ) | |||||||
| Decrease (increase) in prepaid expenses and other assets | (1,423,449 | ) | (408,046 | ) | 1,419,558 | |||||||
| Increase (decrease) in payable for investments purchased | (12,657,424 | ) | (7,107,877 | ) | 21,546,908 | |||||||
| Increase (decrease) in payable to the Investment Manager | (661,281 | ) | 1,011,908 | (116,900 | ) | |||||||
| Decrease in management and advisory fees payable | – | – | (565,599 | ) | ||||||||
| Increase in interest payable | 1,080,012 | 311,736 | 43,565 | |||||||||
| Increase in incentive allocation payable | 984,140 | 3,318,900 | – | |||||||||
| Increase (decrease) in accrued expenses and other liabilities | 83,773 | 450,995 | 1,704,082 | |||||||||
| Net cash used in operating activities | (368,067,473 | ) | (195,506,786 | ) | (88,436,923 | ) | ||||||
| Financing activities | ||||||||||||
| Borrowings | 671,500,000 | 283,000,000 | 184,000,000 | |||||||||
| Repayments of debt | (435,500,000 | ) | (262,000,000 | ) | (139,000,000 | ) | ||||||
| Payments of debt issuance costs | (6,657,943 | ) | (3,125,685 | ) | – | |||||||
| Dividends paid on Series A preferred equity facility | (1,444,634 | ) | (1,516,585 | ) | (1,542,932 | ) | ||||||
| Regular dividends paid to common shareholders | (58,867,403 | ) | (37,877,134 | ) | (27,734,951 | ) | ||||||
| Special dividends paid to common shareholders | (4,245,526 | ) | (2,625,122 | ) | (1,073,823 | ) | ||||||
| Proceeds from shares issued in connection with dividend reinvestment plan | 7,687 | 37,416 | 30,385 | |||||||||
| Proceeds from common shares sold, net of underwriting and offering costs | 207,559,903 | 224,562,890 | 80,961,755 | |||||||||
| Net cash provided by financing activities | 372,352,084 | 200,455,779 | 95,640,434 | |||||||||
| Net increase in cash and cash equivalents | 4,284,610 | 4,948,993 | 7,203,511 | |||||||||
| Cash and cash equivalents at beginning of period | 22,984,182 | 18,035,189 | 10,831,678 | |||||||||
| Cash and cash equivalents at end of period | $ | 27,268,792 | $ | 22,984,182 | $ | 18,035,189 | ||||||
| Supplemental cash flow information | ||||||||||||
| Interest payments | $ | 5,717,779 | $ | 352,084 | $ | 147,137 | ||||||
| Excise tax payments | 938,460 | 969,946 | 502,978 | |||||||||
See accompanying notes.
| 75 |
Notes to Consolidated Financial Statements
December 31, 2014
1. Organization and Nature of Operations
TCP Capital Corp. (the “Company”) is a Delaware corporation formed on April 2, 2012 as an externally managed, closed-end, non-diversified management investment company. The Company elected to be treated as a business development company (“BDC”) under the Investment Company Act of 1940, as amended (the “1940 Act”). The Company’s investment objective is to achieve high total returns through current income and capital appreciation, with an emphasis on principal protection. The Company invests primarily in the debt of middle-market companies as well as small businesses, including senior secured loans, junior loans, mezzanine debt and bonds. Such investments may include an equity component, and, to a lesser extent, the Company may make equity investments directly.
The Company was formed through the conversion on April 2, 2012 of the Company’s predecessor, Special Value Continuation Fund, LLC (“SVCF”), from a limited liability company to a corporation in a non-taxable transaction, leaving the Company as the surviving entity (the “Conversion”). At the time of the Conversion, all limited liability company interests were exchanged for 15,725,635 shares of common stock in the Company. As a result of the Conversion, the books and records of SVCF have become the books and records of the surviving entity. On April 3, 2012, the Company completed its initial public offering. For periods prior to April 2, 2012, the consolidated financial statements and related footnotes reflect the performance of SVCF. Per share amounts prior to the conversion are not considered useful and have been marked as “N/A” in the consolidated financial statements.
Investment operations are conducted in Special Value Continuation Partners, LP, a Delaware limited partnership (the “Partnership”), of which the Company owns 100% of the common limited partner interests, or in one of the Partnership’s wholly owned subsidiaries, TCPC Funding I, LLC, a Delaware limited liability company (“TCPC Funding”) and TCPC SBIC, LP, a Delaware limited partnership (the “SBIC”). The Partnership has also elected to be treated as a BDC under the 1940 Act. The SBIC was organized in June 2013, and on April 22, 2014, received a license from the United States Small Business Administration (the “SBA”) to operate as a small business investment company under the provisions of Section 301(c) of the Small Business Investment Act of 1958. These consolidated financial statements include the accounts of the Company, the Partnership, TCPC Funding and the SBIC. All significant intercompany transactions and balances have been eliminated in the consolidation.
The Company has elected to be treated as a regulated investment company (“RIC”) for U.S. federal income tax purposes. As a RIC, the Company will not be taxed on its income to the extent that it distributes such income each year and satisfies other applicable income tax requirements. The Partnership, TCPC Funding, and the SBIC have elected to be treated as partnerships for U.S. federal income tax purposes.
The general partner of the Partnership is SVOF/MM, LLC, which also serves as the administrator of the Company and the Partnership (the “Administrator” or the “General Partner”). The managing member of the General Partner is Tennenbaum Capital Partners, LLC (the “Advisor”), which serves as the Investment Manager to the Company, the Partnership, TCPC Funding, and the SBIC. Most of the equity interests in the General Partner are owned directly or indirectly by the Advisor and its employees.
| 76 |
TCP Capital Corp.
Notes to Consolidated Financial Statements (Continued)
December 31, 2014
1. Organization and Nature of Operations
Company management consists of the Investment Manager and the Board of Directors. Partnership management consists of the General Partner and the Board of Directors. The Investment Manager and the General Partner direct and execute the day-to-day operations of the Company and the Partnership, respectively, subject to oversight from the respective Board of Directors, which sets the broad policies of the Company and performs certain functions required by the 1940 Act in the case of the Partnership.
The Board of Directors of the Partnership has delegated investment management of the Partnership’s assets to the Investment Manager. Each Board of Directors consists of five persons, three of whom are independent. If the Company or the Partnership has preferred equity interests outstanding, as the Partnership currently does, the holders of the preferred interests voting separately as a class are entitled to elect two of the Directors. The remaining directors will be subject to election by holders of the common shares and preferred interests voting together as a single class.
2. Summary of Significant Accounting Policies
Basis of Presentation
The consolidated financial statements of the Company have been prepared in accordance with accounting principles generally accepted in the United States (“GAAP”). The Company is an investment company following accounting and reporting guidance in Accounting Standards Codification (“ASC”) Topic 946, Financial Services – Investment Companies . The following is a summary of the significant accounting policies of the Company and the Partnership.
Reclassifications
Certain prior period amounts have been reclassified to conform to the current period presentation.
Use of Estimates
The preparation of the financial statements requires management to make estimates and assumptions that affect the reported amounts of assets and liabilities and disclosure of contingent assets and liabilities at the date of the financial statements, as well as the reported amounts of revenues and expenses during the reporting period. Although management believes these estimates and assumptions to be reasonable, actual results could differ from those estimates and differences could be material.
Investment Valuation
The Company’s investments are generally held by the Partnership, TCPC Funding, or the SBIC. Management values investments at fair value in accordance with GAAP, based upon the principles and methods of valuation set forth in policies adopted by the Partnership’s Board of Directors and in conformity with procedures set forth in the Revolving Facilities and the statement of preferences for the Preferred Interests, as defined in Note 4, below.
| 77 |
TCP Capital Corp.
Notes to Consolidated Financial Statements (Continued)
December 31, 2014
2. Summary of Significant Accounting Policies (continued)
Fair value is generally defined as the amount for which an investment would be sold in an orderly transaction between market participants at the measurement date.
All investments are valued at least quarterly based on affirmative pricing or quotations from independent third- party sources, with the exception of investments priced directly by the Investment Manager which together comprise, in total, less than 5% of the capitalization of the Partnership. Investments listed on a recognized exchange or market quotation system, whether U.S. or foreign, are valued for financial reporting purposes as of the last business day of the reporting period using the closing price on the date of valuation. Liquid investments not listed on a recognized exchange or market quotation system are valued using prices provided by a nationally recognized pricing service or by using quotations from broker-dealers. Investments not priced by a pricing service or for which market quotations are either not readily available or are determined to be unreliable are valued using affirmative valuations performed by independent valuation services or, for investments aggregating less than 5% of the total capitalization of the Partnership, directly by the Investment Manager.
Fair valuations of investments are determined under our documented valuation policy that has been reviewed and approved by the Boards of Directors of the Company and the Partnership, and are subject to their approval in good faith. Generally, to increase objectivity in valuing the investments, the Investment Manager will utilize external measures of value, such as public markets or third-party transactions, whenever possible. The Investment Manager’s valuation is not based on long-term work-out value, immediate liquidation value, nor incremental value for potential changes that may take place in the future. The values assigned to investments that are valued by the Investment Manager are based on available information and do not necessarily represent amounts that might ultimately be realized, as these amounts depend on future circumstances and cannot reasonably be determined until the individual investments are actually liquidated. The foregoing policies apply to all investments, including those in companies and groups of affiliated companies aggregating more than 5% of the Company’s assets.
Fair valuations of investments in each asset class are determined using one or more methodologies including the market approach, income approach, or, in the case of recent investments, the cost approach, as appropriate. The market approach uses prices and other relevant information generated by market transactions involving identical or comparable assets. The income approach uses valuation techniques to convert future amounts (for example, cash flows or earnings) to a single present value amount (discounted). The measurement is based on the value indicated by current market expectations about those future amounts. In following these approaches, the types of factors that may be taken into account include, as relevant: available current market data, including relevant and applicable market trading and transaction comparables, applicable market yields and multiples, security covenants, call protection provisions, information rights, the nature and realizable value of any collateral, the portfolio company’s ability to make payments, its earnings and discounted cash flows, the markets in which the portfolio company does business, comparisons of financial ratios of peer companies that are public, merger and acquisition comparables, the principal market in which the investment trades and enterprise values, among other factors.
| 78 |
TCP Capital Corp.
Notes to Consolidated Financial Statements (Continued)
December 31, 2014
2. Summary of Significant Accounting Policies (continued)
Unobservable inputs used in the fair value measurement of Level 3 investments as of December 31, 2014 included the following:
| Asset Type | Fair Value | Valuation Technique | Unobservable Input | Range (Weighted Avg.) | ||||||
| Bank Debt | $ | 600,260,796 | Market rate approach | Market yields | 4.2% - 21.4% (11.8%) | |||||
| 213,981,543 | Market quotations | Indicative bid/ask quotes | 1 - 2 (1) | |||||||
| 15,192,545 | Market comparable companies | Revenue multiples | 0.4x (0.4x) | |||||||
| 11,103,295 | Market comparable companies | EBITDA multiples | 6.5x - 7.8x (7.0x) | |||||||
| Other Corporate Debt | 67,691 | Market rate approach | Market yields | 19.8% (19.8%) | ||||||
| 47,536,522 | Market quotations | Indicative bid/ask quotes | 1 - 6 (2) | |||||||
| 13,628,940 | Market comparable companies | EBITDA multiples | 7.8x – 10.5x (8.7x) | |||||||
| Equity | 7,329,504 | Market rate approach | Market yields | 6.0% - 18.0% (7.7 %) | ||||||
| 4,463,532 | Market quotations | Indicative bid/ask quotes | 1 - 2 (1) | |||||||
| 916,535 | Market comparable companies | Revenue multiples | 0.4x - 1.1x (1.1x) | |||||||
| 20,233,200 | Market comparable companies | EBITDA multiples | 4.6x – 8.0x (6.6x) | |||||||
| $ | 934,714,103 | |||||||||
Generally, a change in an unobservable input may result in a change to the value of an investment as follows:
| Input |
Impact to Value if
Input Increases |
Impact to Value if
Input Decreases |
||
| Market yields | Decrease | Increase | ||
| Revenue multiples | Increase | Decrease | ||
| EBITDA multiples | Increase | Decrease |
Investments may be categorized based on the types of inputs used in valuing such investments. The level in the GAAP valuation hierarchy in which an investment falls is based on the lowest level input that is significant to the valuation of the investment in its entirety. Transfers between levels are recognized as of the beginning of the reporting period.
At December 31, 2014, the Company’s investments were categorized as follows:
| Level | Basis for Determining Fair Value | Bank Debt |
Other
Corporate Debt |
Equity
Securities |
||||||||||
| 1 | Quoted prices in active markets for identical assets | $ | - | $ | - | $ | - | |||||||
| 2 | Other observable market inputs * | 131,946,338 | 79,875,445 | - | ||||||||||
| 3 | Independent third-party pricing sources that employ significant unobservable inputs | 840,538,179 | 56,621,975 | 30,618,142 | ||||||||||
| 3 | Investment Manager valuations with significant unobservable inputs | - | 4,611,178 | 2,324,629 | ||||||||||
| Total | $ | 972,484,517 | $ | 141,108,598 | $ | 32,942,771 | ||||||||
* For example, quoted prices in inactive markets or quotes for comparable investments.
| 79 |
TCP Capital Corp.
Notes to Consolidated Financial Statements (Continued)
December 31, 2014
2. Summary of Significant Accounting Policies (continued)
Changes in investments categorized as Level 3 during the year ended December 31, 2014 were as follows:
| Independent Third-Party Valuation | ||||||||||||
| Bank Debt |
Other
Corporate Debt |
Equity
Securities |
||||||||||
| Beginning balance | $ | 515,953,643 | $ | 53,334,634 | $ | 36,066,746 | ||||||
| Net realized and unrealized gains (losses) | (16,044,779 | ) | (6,935,629 | ) | (2,582,999 | ) | ||||||
| Acquisitions | 567,677,189 | 7,470,587 | 7,136,219 | |||||||||
| Dispositions | (171,906,580 | ) | (22,549,239 | ) | (9,646,950 | ) | ||||||
| Transfers out of Level 3 † | (59,202,094 | ) | - | - | ||||||||
| Transfers into Level 3 ‡ | - | 25,301,622 | - | |||||||||
| Reclassifications within Level 3 § | 4,060,800 | - | (354,874 | ) | ||||||||
| Ending balance | $ | 840,538,179 | $ | 56,621,975 | $ | 30,618,142 | ||||||
| Net change in unrealized appreciation/ depreciation during the period on investments still held at period end (included in net realized and unrealized gains/losses, above) | $ | (8,158,271 | ) | $ | (5,915,319 | ) | $ | (779,140 | ) | |||
† Comprised of six investments that transferred to Level 2 due to increased observable market activity.
‡ Comprised of two investments that transferred from Level 2 due to reduced trading volumes.
§ Comprised of one investment that reclassified from Investment Manager Valuation and one that reclassified to Investment Manager Valuation.
| Investment Manager Valuation | ||||||||||||
| Bank Debt |
Other
Corporate Debt |
Equity
Securities |
||||||||||
| Beginning balance | $ | 4,060,800 | $ | 7,631,335 | $ | 2,837,707 | ||||||
| Net realized and unrealized losses | - | (506,374 | ) | (101,443 | ) | |||||||
| Acquisitions | - | 4,585,133 | 230,939 | |||||||||
| Dispositions | - | (7,098,916 | ) | (997,448 | ) | |||||||
| Reclassifications within Level 3 ** | (4,060,800 | ) | - | 354,874 | ||||||||
| Ending balance | $ | - | $ | 4,611,178 | $ | 2,324,629 | ||||||
| Net change in unrealized appreciation/ depreciation during the period on investments still held at period end (included in net realized and unrealized gains/losses, above) | $ | - | $ | 164,526 | $ | (1,098,891 | ) | |||||
** Comprised of one investment that reclassified to Independent Third-Party Valuation and one that reclassified from Independent Third-Party Valuation.
There were no transfers between Level 1 and 2 during the year ended December 31, 2014.
| 80 |
TCP Capital Corp.
Notes to Consolidated Financial Statements (Continued)
December 31, 2014
2. Summary of Significant Accounting Policies (continued)
At December 31, 2013, the Company’s investments were categorized as follows:
| Level | Basis for Determining Fair Value | Bank Debt |
Other
Corporate Debt |
Equity
Securities |
||||||||||
| 1 | Quoted prices in active markets for identical assets | $ | - | $ | - | $ | 843,913 | |||||||
| 2 | Other observable market inputs * | 68,221,814 | 77,312,367 | - | ||||||||||
| 3 | Independent third-party pricing sources that employ significant unobservable inputs | 515,953,643 | 53,334,634 | 36,066,746 | ||||||||||
| 3 | Investment Manager valuations with significant unobservable inputs | 4,060,800 | 7,631,335 | 2,837,707 | ||||||||||
| Total | $ | 588,236,257 | $ | 138,278,336 | $ | 39,748,366 | ||||||||
* For example, quoted prices in inactive markets or quotes for comparable investments.
Changes in investments categorized as Level 3 during the year ended December 31, 2013 were as follows:
| Independent Third-Party Valuation | ||||||||||||
| Bank Debt |
Other
Corporate Debt |
Equity
Securities |
||||||||||
| Beginning balance | $ | 359,343,326 | $ | 17,171,637 | $ | 32,675,370 | ||||||
| Net realized and unrealized gains (losses) | 1,250,413 | 7,294,073 | (4,419,997 | ) | ||||||||
| Acquisitions | 303,602,832 | 38,349,618 | 18,222,765 | |||||||||
| Dispositions | (138,765,762 | ) | (15,172,634 | ) | (8,258,531 | ) | ||||||
| Transfers out of Level 3 † | (58,651,283 | ) | (10,300,000 | ) | - | |||||||
| Transfers into Level 3 ‡ | 49,174,117 | 15,991,940 | - | |||||||||
| Reclassifications within Level 3 § | - | - | (2,152,861 | ) | ||||||||
| Ending balance | $ | 515,953,643 | $ | 53,334,634 | $ | 36,066,746 | ||||||
| Net change in unrealized appreciation/ depreciation during the period on investments still held at period end (included in net realized and unrealized gains/losses, above) | $ | 3,649,723 | $ | 1,090,962 | $ | 745,675 | ||||||
† Comprised of nine investments that transferred to Level 2 due to increased observable market activity.
‡ Comprised of six investments that transferred from Level 2 due to reduced trading volumes.
§ Comprised of one investment that was reclassified to Investment Manager Valuation.
| 81 |
TCP Capital Corp.
Notes to Consolidated Financial Statements (Continued)
December 31, 2014
2. Summary of Significant Accounting Policies (continued)
| Investment Manager Valuation | ||||||||||||
| Bank Debt |
Other
Corporate Debt |
Equity
Securities |
||||||||||
| Beginning balance | $ | - | $ | 7,167,458 | $ | 1,424,764 | ||||||
| Net realized and unrealized gains (losses) | 520,800 | 323,658 | 904,068 | |||||||||
| Acquisitions | 3,540,000 | 140,219 | - | |||||||||
| Dispositions | - | - | (1,643,986 | ) | ||||||||
| Reclassifications within Level 3 § | - | - | 2,152,861 | |||||||||
| Ending balance | $ | 4,060,800 | $ | 7,631,335 | $ | 2,837,707 | ||||||
| Net change in unrealized appreciation/ depreciation during the period on investments still held at period end (included in net realized and unrealized gains/losses, above) | $ | 520,800 | $ | 323,658 | $ | (659,522 | ) | |||||
§ Comprised of one investment that was reclassified from Independent Third-Party Valuation.
There were no transfers between Level 1 and 2 during the year ended December 31, 2013.
Investment Transactions
Investment transactions are recorded on the trade date, except for private transactions that have conditions to closing, which are recorded on the closing date. The cost of investments purchased is based upon the purchase price plus those professional fees which are specifically identifiable to the investment transaction. Realized gains and losses on investments are recorded based on the specific identification method, which typically allocates the highest cost inventory to the basis of investments sold.
Cash and Cash Equivalents
Cash consists of amounts held in accounts with brokerage firms and the custodian bank. Cash equivalents consist of highly liquid investments with an original maturity of generally three months or less.
Repurchase Agreements
In connection with transactions in repurchase agreements, it is the Company’s policy that the custodian take possession of the underlying collateral, the fair value of which is required to exceed the principal amount of the repurchase transaction, including accrued interest, at all times. If the seller defaults, and the fair value of the collateral declines, realization of the collateral may be delayed or limited.
Restricted Investments
The Company may invest without limitation
in instruments that are subject to legal or contractual restrictions on resale. These instruments generally may be resold to institutional
investors in transactions exempt from registration or to the public if the securities are registered. Disposal of these investments
may involve time-
| 82 |
TCP Capital Corp.
Notes to Consolidated Financial Statements (Continued)
December 31, 2014
2. Summary of Significant Accounting Policies (continued)
consuming negotiations and additional expense, and prompt sale at an acceptable price may be difficult. Information regarding restricted investments is included at the end of the Consolidated Statement of Investments. Restricted investments, including any restricted investments in affiliates, are valued in accordance with the investment valuation policies discussed above.
Foreign Investments
The Company may invest in instruments traded in foreign countries and denominated in foreign currencies. Foreign currency denominated investments comprised approximately 1.7% and 2.7% of total investments at December 31, 2014 and December 31, 2013, respectively. Such positions were converted at the respective closing rate in effect at December 31, 2014 and December 31, 2013 and reported in U.S. dollars. Purchases and sales of investments and income and expense items denominated in foreign currencies, when they occur, are translated into U.S. dollars on the respective dates of such transactions. The portion of gains and losses on foreign investments resulting from fluctuations in foreign currencies is included in net realized and unrealized gain or loss from investments.
Investments in foreign companies and securities of foreign governments may involve special risks and considerations not typically associated with investing in U.S. companies and securities of the U.S. government. These risks include, among other things, revaluation of currencies, less reliable information about issuers, different transaction clearance and settlement practices, and potential future adverse political and economic developments. Moreover, investments in foreign companies and securities of foreign governments and their markets may be less liquid and their prices more volatile than those of comparable U.S. companies and the U.S. government.
Derivatives
In order to mitigate certain currency exchange and interest rate risks, the Partnership has entered into certain swap and option transactions. All derivatives are recognized as either assets or liabilities in the Consolidated Statement of Assets and Liabilities. The transactions entered into are accounted for using the mark-to-market method with the resulting change in fair value recognized in earnings for the current period. Risks may arise upon entering into these contracts from the potential inability of counterparties to meet the terms of their contracts and from unanticipated movements in interest rates and the value of foreign currency relative to the U.S. dollar.
The Partnership did not enter into any new derivative transactions during the year ended December 31, 2014. At December 31, 2014, the Partnership held an interest rate cap with a notional amount of $25,000,000 and a cross currency basis swap with a notional amount of $4,289,019. Gains and losses from derivatives during the year ended December 31, 2014 were included in net realized and unrealized loss on investments in the Consolidated Statement of Operations as follows:
| 83 |
TCP Capital Corp.
Notes to Consolidated Financial Statements (Continued)
December 31, 2014
2. Summary of Significant Accounting Policies (continued)
| Instrument |
Realized Gains
(Losses) |
Unrealized Gains
(Losses) |
||||||
| Cross currency basis swap | $ | - | $ | 2,048,793 | ||||
| Interest rate cap | - | (13,642 | ) | |||||
During the year ended December 31, 2013, the Partnership purchased an interest rate cap with a notional amount of $25,000,000. During the year ended December 31, 2013, the Partnership exited a cross currency basis swap with a notional amount of $6,040,944, and entered into a new cross currency basis swap with a notional amount of $4,289,019. Gains and losses from derivatives during the year ended December 31, 2013 were included in net realized and unrealized loss on investments in the Consolidated Statement of Operations as follows:
| Instrument |
Realized Gains
(Losses) |
Unrealized Gains
(Losses) |
||||||
| Cross currency basis swap | $ | - | $ | (331,183 | ) | |||
| Interest rate cap | (37,611 | ) | ||||||
Valuations of derivatives held at December 31, 2014 and December 31, 2013 were determined using observable market inputs other than quoted prices in active markets for identical assets and, accordingly, are classified as Level 2 in the GAAP valuation hierarchy.
Costs of approximately $1.5 million were incurred during 2013 in connection with the extension of the Partnership’s revolving credit facility (see Note 4). Costs of approximately $1.6 million and $1.8 million were incurred during 2013 and 2014 in connection with placing and extending TCPC Funding’s revolving credit facility (see Note 4), respectively. Costs of approximately $3.4 million were incurred in June 2014 in connection with placing the Company’s unsecured convertible notes (see Note 4). Costs of approximately $1.5 million were incurred during 2014 in connection with placing TCPC SBIC’s SBA debentures (see Note 4). These costs were deferred and are being amortized on a straight-line basis over the estimated life of the respective instruments. The impact of utilizing the straight-line amortization method versus the effective-interest method is not material to the operations of the Company or the Partnership.
Revenue Recognition
Interest and dividend income, including income paid in kind, is recorded on an accrual basis. Origination, structuring, closing, commitment and other upfront fees, including original issue discounts, earned with respect to capital commitments are generally amortized or accreted into interest income over the life of the respective debt investment. Other fees, including certain amendment fees, prepayment fees and commitment fees on broken deals, are recognized as earned. Prepayment fees and similar income received upon the early repayment of a loan or debt security are included in interest income.
Certain debt investments are purchased at a discount to par as a result of the underlying credit risks and financial results of the issuer, as well as general market factors that influence the financial markets as a whole. GAAP generally requires that discounts on the acquisition of corporate bonds, municipal bonds and treasury bonds be amortized using the effective-interest or constant-yield method assuming there are no questions as to collectability. When principal payments on a loan are received in an amount in excess of the loan’s amortized cost, the excess principal payments are recorded as interest income.
| 84 |
TCP Capital Corp.
Notes to Consolidated Financial Statements (Continued)
December 31, 2014
2. Summary of Significant Accounting Policies (continued)
Income Taxes
The Company intends to comply with the applicable provisions of the Internal Revenue Code of 1986, as amended, pertaining to regulated investment companies and to make distributions of taxable income sufficient to relieve it from substantially all federal income taxes. Accordingly, no provision for income taxes is required in the consolidated financial statements. The income or loss of the Partnership, TCPC Funding and the SBIC is reported in the respective partners’ income tax returns. In accordance with ASC Topic 740 – Income Taxes , the Company recognizes in its consolidated financial statements the effect of a tax position when it is determined that such position is more likely than not, based on the technical merits, to be sustained upon examination. As of December 31, 2014, all tax years of the Company, the Partnership, TCPC Funding and the SBIC since January 1, 2011 remain subject to examination by federal tax authorities. No such examinations are currently pending.
During the year ended December 31, 2014, the Company accrued $808,813 in excise taxes related to income earned in 2014 and paid $938,460 in excise taxes related to income earned in 2013. During the year ended December 31, 2013, the Company paid $969,946 in excise taxes related to income earned in 2012. During the year ended December 31, 2012, the Company paid $502,978 in excise taxes related to income earned in 2011.
Income and capital gain distributions are determined in accordance with income tax regulations, which may differ from GAAP. Capital accounts within the financial statements are adjusted at year end for permanent book and tax differences. At December 31, 2014, the Company reclassified $808,813 in excise tax expenses from accumulated net investment income to paid-in capital, $17,846 in foreign currency gains from accumulated net realized losses to accumulated net investment income, and $528,959 in certain investment income from accumulated net investment income to accumulated net realized losses. At December 31, 2013, the Company reclassified $977,624 in excise tax expenses from accumulated net investment income to paid-in capital, $47,326 in foreign currency losses from accumulated net realized losses to accumulated net investment income, and $1,206,694 in certain investment income from accumulated net investment income to accumulated net realized losses. At December 31, 2012, the Company reclassified $2,377,825 in foreign currency losses from accumulated net realized losses to accumulated net investment income and $1,479,978 in excise tax expenses from accumulated net investment income to paid-in capital. Temporary differences are primarily attributable to differing book and tax treatments for the timing of the recognition of gains and losses on certain investment transactions, and will reverse in subsequent periods.
2. Summary of Significant Accounting Policies (continued)
The tax-basis components of distributable earnings (accumulated deficit) applicable to the common shareholders of the Company and the cost and unrealized appreciation and depreciation of investments (including derivatives) for U.S. federal income tax purposes at December 31, 2014 and December 31, 2013 were as follows:
| 85 |
TCP Capital Corp.
Notes to Consolidated Financial Statements (Continued)
December 31, 2014
2. Summary of Significant Accounting Policies (continued)
| December 31, 2014 | December 31, 2013 | |||||||
| Undistributed ordinary income | $ | 23,253,013 | $ | 24,219,834 | ||||
| Capital loss carryforwards | (109,786,977 | ) | (60,301,810 | ) | ||||
| Post-October capital loss deferrals | (16,301,455 | ) | (45,178,866 | ) | ||||
| Unrealized appreciation | $ | 32,342,656 | $ | 31,095,792 | ||||
| Unrealized depreciation | (73,638,935 | ) | (66,306,406 | ) | ||||
| Net unrealized depreciation | (41,296,279 | ) | (35,210,614 | ) | ||||
| Cost | $ | 1,189,550,272 | $ | 801,156,529 | ||||
The Company’s capital loss carryforwards may be used to offset capital gains in succeeding taxable years. Of the carryforwards, $2,987,224 and $34,759,833 will expire after 2017 and 2018, respectively. The remaining $72,039,920 will carry forward indefinitely until used. Distributions to holders of the Series A Preferred are treated, on an accrual basis, as distributions of ordinary income for federal tax purposes.
3. Management Fees, Incentive Compensation and Other Expenses
The Company’s management fee is calculated at an annual rate of 1.5% of total assets (excluding cash and cash equivalents) on a consolidated basis as of the beginning of each quarter and is payable to the Investment Manager quarterly in arrears.
Incentive compensation is only paid to the extent the total performance of the Company exceeds a cumulative 8% annual return since January 1, 2013 (the “Total Return Hurdle”). Beginning January 1, 2013, the incentive compensation equals 20% of net investment income (reduced by preferred dividends) and 20% of net realized gains (reduced by any net unrealized losses), subject to the Total Return Hurdle. The incentive compensation is payable quarterly in arrears as an allocation and distribution to the General Partner and is calculated as the difference between cumulative incentive compensation earned since January 1, 2013 and cumulative incentive compensation paid since January 1, 2013. No incentive compensation was incurred prior to January 1, 2013. A reserve for incentive compensation is accrued based on the amount of additional incentive compensation that would have been distributable to the General Partner assuming a hypothetical liquidation of the Company at net asset value on the balance sheet date. At December 31, 2014 and December 31, 2013, the General Partner’s equity interest in the Partnership was comprised entirely of such reserve amount, if any, and is reported as a non-controlling interest in the consolidated financial statements of the Company.
The Company and the Partnership bear all respective expenses incurred in connection with the business of the Company and the Partnership, including fees and expenses of outside contracted services, such as custodian, administrative, legal, audit and tax preparation fees, costs of valuing investments, insurance costs, brokers’ and finders’ fees relating to investments, and any other transaction costs associated with the purchase and sale of investments.
| 86 |
TCP Capital Corp.
Notes to Consolidated Financial Statements (Continued)
December 31, 2014
4. Leverage
Leverage is comprised of convertible senior unsecured notes issued by the Company (the “Convertible Notes”), amounts outstanding under senior secured revolving credit facilities issued by the Partnership (the “Partnership Facility”) and TCPC Funding (the “TCPC Funding Facility,” and, together with the Partnership Facility, the “Revolving Facilities”), debentures guaranteed by the SBA (the “SBA Debentures”), and amounts outstanding under a preferred equity facility issued by the Partnership (the “Preferred Interests”), at December 31, 2014 as follows:
| Maturity | Rate | Carrying Value ** | Available | Total Capacity | ||||||||||||||
| Operating Company Facility | 2017 | L+2.5% * | $ | 70,000,000 | $ | 46,000,000 | $ | 116,000,000 | ||||||||||
| TCPC Funding Facility | 2017 | L+2.5% * | 125,000,000 | 125,000,000 | 250,000,000 | |||||||||||||
| Convertible Notes ($108 million par) | 2019 | 5.25% | 105,696,830 | - | 105,696,830 | |||||||||||||
| SBA Program | 2024-2025 | 3.015% † | 28,000,000 | 47,000,000 | 75,000,000 | |||||||||||||
| Preferred Interests | 2016 | L+0.85% * | 134,000,000 | - | 134,000,000 | |||||||||||||
| Total leverage | $ | 462,696,830 | $ | 218,000,000 | $ | 680,696,830 | ||||||||||||
* Based on either LIBOR or the lender’s cost of funds, subject to certain limitations.
** Except for the Convertible Notes, all carrying values are the same as the principal amounts outstanding.
† Interest rate on pooled loans, excluding fees of 0.355%. As of December 31, 2014, $9.5 million of the outstanding amount bore interest at a temporary rate of 0.555% plus fees of 0.355% through March 25, 2015, the date of the next SBA pooling.
Total leverage outstanding and available at December 31, 2013 were as follows:
| Maturity | Rate | Carrying Value | Available | Total Capacity | ||||||||||||
| Operating Company Facility | 2016 | L+0.44% * | $ | 45,000,000 | $ | 71,000,000 | $ | 116,000,000 | ||||||||
| TCPC Funding Facility | 2016 | L+2.75% * | 50,000,000 | 50,000,000 | 100,000,000 | |||||||||||
| Preferred Interests | 2016 | L+0.85% * | 134,000,000 | - | 134,000,000 | |||||||||||
| Total leverage | $ | 229,000,000 | $ | 121,000,000 | $ | 350,000,000 | ||||||||||
* Based on either LIBOR or the lender’s cost of funds, subject to certain limitations.
The combined weighted-average interest and dividend rates on total leverage outstanding at December 31, 2014 and December 31, 2013 were 2.86% and 1.38%, respectively.
Total expenses related to our debt include:
| Year Ended December 31, | ||||||||||||
| 2014 | 2013 | 2012 | ||||||||||
| Interest expense | $ | 7,010,215 | $ | 1,194,158 | $ | 190,702 | ||||||
| Amortization of deferred debt issuance costs | 1,926,040 | 852,618 | 441,495 | |||||||||
| Commitment fees | 885,496 | 292,671 | 225,560 | |||||||||
| Total | $ | 9,821,751 | $ | 2,339,447 | $ | 857,757 | ||||||
| 87 |
TCP Capital Corp.
Notes to Consolidated Financial Statements (Continued)
December 31, 2014
4. Leverage (continued)
Amounts outstanding under the Revolving Facilities, the Convertible Notes and the SBA Debentures are carried at amortized cost in the Statement of Assets and Liabilities. As of December 31, 2014, the estimated fair value of the Partnership Facility and the SBA Debentures approximated its carrying value, and the TCPC Funding Facility and Convertible Notes had estimated fair values of $126.4 million and $108.2 million, respectively. The estimated fair values of the Revolving Facilities, the Convertible Notes and the SBA Debentures are determined by discounting projected remaining payments using market interest rates for our borrowings and entities with similar credit risks at the measurement date. At December 31, 2014, the fair values of the Revolving Facilities, the Convertible Notes and the SBA Debentures as prepared for disclosure purposes were deemed to be Level 3 in the GAAP valuation hierarchy.
Convertible Notes
On June 11, 2014, the Company issued $108 million of convertible senior unsecured notes that mature on December 15, 2019, unless previously converted or repurchased in accordance with their terms. The Convertible Notes are general unsecured obligations of the Company, and rank structurally junior to the Revolving Facilities and Preferred Interests. The Company does not have the right to redeem the Convertible Notes prior to maturity. The Convertible Notes bear interest at an annual rate of 5.25%, payable semi-annually. In certain circumstances, the Convertible Notes will be convertible into cash, shares of the Company’s common stock or a combination of cash and shares of common stock (such combination to be at the Company’s election), at an initial conversion rate of 50.9100 shares of common stock per one thousand dollar principal amount of the Convertible Notes, which is equivalent to an initial conversion price of approximately $19.64 per share of common stock, subject to customary anti-dilution adjustments. The initial conversion price was approximately 12.5% above the $17.46 per share closing price of the Company’s common stock on June 11, 2014. At December 31, 2014, the principal amount of the Convertible Notes exceeded the value of the conversion rate multiplied by the per share closing price of the Company’s common stock. Therefore, no additional shares have been added to the calculation of diluted earnings per common share and weighted average common shares outstanding.
Prior to the close of business on the business day immediately preceding June 15, 2019, holders may convert their Convertible Notes only under certain circumstances set forth in the indenture governing the terms of the Convertible Notes (the “Indenture”). On or after June 15, 2019 until the close of business on the scheduled trading day immediately preceding December 15, 2019, holders may convert their Convertible Notes at any time. Upon conversion, the Company will pay or deliver, as the case may be, at its election, cash, shares of the Company’s common stock or a combination of cash and shares of the Company’s common stock, subject to the requirements of the Indenture.
| 88 |
TCP Capital Corp.
Notes to Consolidated Financial Statements (Continued)
December 31, 2014
4. Leverage (continued)
The Convertible Notes are accounted for in accordance with ASC Topic 470-20 – Debt with Conversion and Other Options . Upon conversion of any Convertible Note, the Company intends to pay the outstanding principal amount in cash and to the extent that the conversion value exceeds the principal amount, has the option to pay the excess amount in cash or shares of our common stock (or a combination of cash and shares), subject to the requirements of the Indenture. The Company has determined that the embedded conversion option in the Convertible Notes is not required to be separately accounted for as a derivative under GAAP. At the time of issuance the estimated values of the debt and equity components of the Convertible Notes were approximately 97.7% and 2.3%, respectively. The original issue discount equal to the equity component of the Convertible Notes was recorded in “paid-in-capital in excess of par” in the accompanying Consolidated Statement of Assets and Liabilities. As a result, the Company will record interest expense comprised of both stated interest and accretion of the original issue discount. At the time of issuance, the equity component was $2,515,594. As of December 31, 2014, the components of the carrying value of the Convertible Notes were as follows:
| Principal amount of debt | $ | 108,000,000 | ||
| Original issue discount, net of accretion | (2,303,170 | ) | ||
| Carrying value of debt | $ | 105,696,830 |
For the year ended December 31, 2014, the components of interest expense for the Convertible Notes were as follows:
| Stated interest expense | $ | 3,039,750 | ||
| Accretion of original issue discount | 212,424 | |||
| Total interest expense | $ | 3,252,174 |
The estimated effective interest rate of the debt component of the Convertible Notes, equal to the stated interest of 5.25% plus the accretion of the original issue discount, was approximately 5.75% for the year ended December 31, 2014.
Partnership Facility
The Partnership Facility provides for amounts to be drawn up to $116 million, subject to certain collateral and other restrictions. The Partnership Facility matures on July 31, 2016. Most of the cash and investments held directly by the Partnership, as well as the net assets of TCPC Funding and the SBIC, are included in the collateral for the facility.
Advances under the Partnership Facility through July 31, 2014 bore interest at an annual rate equal to 0.44% plus either LIBOR or the lender’s cost of funds (subject to a cap of LIBOR plus 20 basis points). Advances under the Partnership Facility for periods from July 31, 2014 through the maturity date of the facility bear interest at an annual rate equal to 2.5% plus either LIBOR or the lender’s cost of funds (subject to a cap of LIBOR plus 20 basis points). In addition to amounts due on outstanding debt, the facility accrues commitment fees of 0.20% per annum on the unused portion of the facility, or 0.25% per annum when less than $46.4 million in borrowings are outstanding. The facility may be terminated, and any outstanding amounts thereunder may become due and payable, should the Partnership fail to satisfy certain financial or other covenants. As of December 31, 2014, the Partnership was in full compliance with such covenants.
| 89 |
TCP Capital Corp.
Notes to Consolidated Financial Statements (Continued)
December 31, 2014
4. Leverage (continued)
SBA Debentures
As of December 31, 2014 the SBIC is able to issue up to $75 million in SBA Debentures, subject to funded regulatory capital and other customary regulatory requirements. As of December 31, 2014, the Partnership had committed $75 million of regulatory capital to the SBIC, $31.5 million of which had been funded. SBA Debentures are non-recourse and may be prepaid at any time without penalty. Once drawn, the SBIC debentures bear an interim interest rate of LIBOR plus 30 basis points. The rate then becomes fixed at the time of SBA pooling, which occurs twice each year, and is set to the then-current 10-year treasury rate plus a spread and an annual SBA charge.
SBA Debentures outstanding as of December 31, 2014 were as follows:
| Issuance Date | Maturity | Debenture Amount | Fixed Interest Rate | SBA Annual Charge | ||||||||||
| September 24, 2014 | September 1, 2024 | $ | 18,500,000 | 3.015 | % | 0.355 | % | |||||||
| December 11, 2014 | March 25, 2015 | 9,500,000 | 0.555 | %* | 0.355 | % | ||||||||
| $ | 28,000,000 | |||||||||||||
* Interest rate on pooled loans, excluding fees of 0.355%. As of December 31, 2014, $9.5 million of the outstanding amount bore interest at a temporary rate of 0.555% plus fees of 0.355% through March 25, 2015, the date of the next SBA pooling.
TCPC Funding Facility
The TCPC Funding Facility, issued on May 15, 2013, provides for amounts to be drawn up to $250 million, subject to certain collateral and other restrictions. The TCPC Funding Facility matures on May 15, 2017, subject to extension by the lender at the request of TCPC Funding. The facility contains an accordion feature which allows for expansion of the facility up to $300 million subject to consent from the lender and other customary conditions. The cash and investments of TCPC Funding are included in the collateral for the facility.
As of December 31, 2014, borrowings under the TCPC Funding Facility bore interest at a rate of LIBOR plus 2.50% per annum. In addition to amounts due on outstanding debt, the facility accrues commitment fees of 0.75% per annum on the unused portion of the facility, or 1.00% per annum when the unused portion is greater than 33% of the total facility. The facility may be terminated, and any outstanding amounts thereunder may become due and payable, should TCPC Funding fail to satisfy certain financial or other covenants. As of December 31, 2014, TCPC Funding was in full compliance with such covenants.
Preferred Interests
At December 31, 2014, the Preferred Interests were comprised of 6,700 Series A preferred limited partner interests issued and outstanding with a liquidation preference of $20,000 per interest. The Preferred Interests accrue dividends at an annual rate equal to 0.85% plus either LIBOR or the interestholder’s cost of funds (subject to a cap of LIBOR plus 20 basis points). The Preferred Interests are redeemable at the option of the Partnership, subject to certain conditions. Additionally, under certain conditions, the Partnership may be required to either redeem certain of the Preferred Interests or repay indebtedness, at the Partnership’s option. Such conditions would include a failure by the Partnership to maintain adequate collateral as required by its credit facility agreement or by the Statement of Preferences of the Preferred Interests or a failure by the Partnership to maintain sufficient asset coverage as required by the 1940 Act. As of December 31, 2014, the Partnership was in full compliance with such requirements.
| 90 |
TCP Capital Corp.
Notes to Consolidated Financial Statements (Continued)
December 31, 2014
5. Commitments, Contingencies, Concentration of Credit Risk and Off-Balance Sheet Risk
The Partnership, TCPC Funding and the SBIC conduct business with brokers and dealers that are primarily headquartered in New York and Los Angeles and are members of the major securities exchanges. Banking activities are conducted with a firm headquartered in the San Francisco area.
In the normal course of business, investment activities involve executions, settlement and financing of various transactions resulting in receivables from, and payables to, brokers, dealers and the custodian. These activities may expose the Company, the Partnership, TCPC Funding and the SBIC to risk in the event that such parties are unable to fulfill contractual obligations. Management does not anticipate any material losses from counterparties with whom it conducts business. Consistent with standard business practice, the Company, the Partnership, TCPC Funding and the SBIC enter into contracts that contain a variety of indemnifications, and are engaged from time to time in various legal actions. The maximum exposure under these arrangements and activities is unknown. However, management expects the risk of material loss to be remote.
The Consolidated Statement of Investments includes certain revolving loan facilities and other commitments held by the Partnership with unfunded balances at December 31, 2014 as follows:
| Revolving Loan Facilities | $ | 46,769,163 | ||
| Delayed Draw Loans and Notes | 28,426,687 | |||
| Letters of Credit | 9,379,246 | |||
| Total Unfunded Commitments | $ | 84,575,096 |
6. Related Parties
The Company, the Partnership, TCPC Funding, the SBIC, the Investment Manager, the General Partner and their members and affiliates may be considered related parties. From time to time, the Partnership advances payments to third parties on behalf of the Company which are reimbursable through deductions from distributions to the Company. At December 31, 2014, no such amounts were outstanding. From time to time, the Investment Manager advances payments to third parties on behalf of the Company and the Partnership and receives reimbursement from the Company and the Partnership. At December 31, 2014, amounts reimbursable to the Investment Manager totaled $459,827, as reflected in the Consolidated Statement of Assets and Liabilities.
| 91 |
TCP Capital Corp.
Notes to Consolidated Financial Statements (Continued)
December 31, 2014
6. Related Parties (continued)
Pursuant to administration agreements between the Administrator and each of the Company and the Partnership (the “Administration Agreements”), the Administrator may be reimbursed for costs and expenses incurred by the Administrator for office space rental, office equipment and utilities allocable to the Company or the Partnership, as well as costs and expenses incurred by the Administrator or its affiliates relating to any administrative, operating, or other non-investment advisory services provided by the Administrator or its affiliates to the Company or the Partnership. For the years ended December 31, 2014 and 2013, expenses allocated pursuant to the Administration Agreements totaled $1,421,863 and $849,228, respectively. The Administrator waived reimbursement of all administrative expenses prior to January 1, 2013.
On November 25, 2014, the Company and the Partnership obtained an exemptive order (the “Exemptive Order”) from the Securities and Exchange Commission permitting the Company and the Partnership to purchase certain investments from affiliated investment companies at fair value. The Exemptive Order exempts the Company and the Partnership from provisions of Sections 17(a) and 57(a) of the 1940 Act which would otherwise restrict such transfers. All such purchases are subject to the conditions set forth in the Exemptive Order, which among others include certain procedures to verify that each purchase is done at the current fair value of the respective investment. During the year ended December 31, 2014, the Company purchased approximately $26.5 million of investments from affiliates (as defined in the 1940 Act), which were classified as Level 2 in the GAAP valuation hierarchy at the time of the transfer and the selling party has no continuing involvement in the transferred assets. All of the transfers were consummated in accordance with the provisions of the Exemptive Order and were accounted for as a purchase in accordance with ASC 860, Transfers and Servicing.
7. Stockholders’ Equity and Dividends
The following table summarizes the total shares issued and proceeds received in the public offering of the Company’s common stock net of underwriting discounts and offering costs as well as shares issued in connection with the Company’s dividend reinvestment plan for the year ended December 31, 2014.
| Shares Issued | Price Per Share | Net Proceeds | ||||||||||
| August 1, 2014 public offering | 6,210,000 | $ | 17.33 | $ | 103,940,721 | |||||||
| November 26, 2014 public offering | 5,900,000 | 17.05 | 97,198,756 | |||||||||
| At-the-market offerings | 400,225 | 16.04 | * | 6,420,426 | ||||||||
| Shares issued from dividend reinvestment plan | 456 | 16.86 | * | 7,687 | ||||||||
The following table summarizes the total shares issued and proceeds received in the public offering of the Company’s common stock net of underwriting discounts and offering costs as well as shares issued in connection with the Company’s dividend reinvestment plan for the year ended December 31, 2013:
| Shares Issued | Price Per Share | Net Proceeds | ||||||||||
| May 21, 2013 public offering | 5,175,000 | $ | 15.63 | $ | 78,176,790 | |||||||
| October 1, 2013 public offering | 4,370,000 | 15.76 | 66,473,600 | |||||||||
| December 18, 2013 public offering | 5,175,000 | 16.00 | 79,912,500 | |||||||||
| Shares issued from dividend reinvestment plan | 2,288 | 16.35 | * | 37,416 | ||||||||
* Weighted-average price per share.
| 92 |
TCP Capital Corp.
Notes to Consolidated Financial Statements (Continued)
December 31, 2014
7. Stockholders’ Equity and Dividends (continued)
The Company’s dividends are recorded on the ex-dividend date. The following table summarizes the Company’s dividends declared for the year ended December 31, 2014:
| Date Declared | Record Date | Payment Date | Type | Amount Per Share | Total Amount | |||||||||
| March 6, 2014 | March 17, 2014 | March 31, 2014 | Regular | $ | 0.36 | $ | 13,031,970 | |||||||
| May 7, 2014 | June 18, 2014 | June 30, 2014 | Regular | 0.36 | 13,032,007 | |||||||||
| May 7, 2014 | June 18, 2014 | June 30, 2014 | Special | 0.05 | 1,810,001 | |||||||||
| August 7, 2014 | September 16, 2014 | September 30, 2014 | Regular | 0.36 | 15,267,647 | |||||||||
| November 5, 2014 | December 8, 2014 | December 31, 2014 | Regular | 0.36 | 17,535,779 | |||||||||
| November 5, 2014 | December 8, 2014 | December 31, 2014 | Special | 0.05 | 2,435,525 | |||||||||
| $ | 1.54 | $ | 63,112,929 | |||||||||||
The following table summarizes the Company’s dividends declared for the year ended December 31, 2013:
| Date Declared | Record Date | Payment Date | Type | Amount Per Share | Total Amount | |||||||||
| March 7, 2013 | March 18, 2013 | March 29, 2013 | Regular | $ | 0.35 | $ | 7,517,170 | |||||||
| March 7, 2013 | March 18, 2013 | March 29, 2013 | Special | 0.05 | 1,073,881 | |||||||||
| May 8, 2013 | June 7, 2013 | June 28, 2013 | Regular | 0.36 | 9,595,344 | |||||||||
| August 8, 2013 | September 9, 2014 | September 30, 2013 | Regular | 0.36 | 9,595,692 | |||||||||
| November 7, 2013 | December 10, 2013 | December 31, 2013 | Regular | 0.36 | 11,168,929 | |||||||||
| November 7, 2013 | December 10, 2013 | December 31, 2013 | Special | 0.05 | 1,551,240 | |||||||||
| $ | 1.53 | $ | 40,502,256 | |||||||||||
8. Earnings Per Share
The following information sets forth the computation of the net increase in net assets per share resulting from operations for the years ended December 31, 2014, December 31, 2013 and December 31, 2012:
|
Year Ended
December 31, 2014 |
Year Ended
December 31, 2013 |
Year Ended
December 31, 2012 |
||||||||||
| Net increase in net assets applicable to common shareholders resulting from operations | $ | 34,547,519 | $ | 49,525,655 | $ | 25,933,310 | ||||||
| Weighted average shares outstanding | 39,395,671 | 25,926,493 | 21,475,847 | |||||||||
| Earnings per share | $ | 0.88 | $ | 1.91 | $ | 1.21 | ||||||
| 93 |
TCP Capital Corp.
Notes to Consolidated Financial Statements (Continued)
December 31, 2014
9. Subsequent Events
On February 24, 2015, the Company’s Board of Directors approved a stock repurchase plan (the “Company 10b5-1 Plan”) to acquire up to $50 million in the aggregate of the Company’s common stock at prices at certain thresholds below the Company’s net asset value per share, in accordance with the guidelines specified in Rule 10b-18 and Rule 10b5-1 of the Securities Exchange Act of 1934.
The Company Repurchase Plan is designed to allow TCPC to repurchase its common stock at times when it otherwise might be prevented from doing so under insider trading laws. The Company Repurchase Plan will require an agent selected by TCPC to repurchase shares of common stock on TCPC’s behalf if and when the market price per share is at certain thresholds below the most recently reported net asset value per share. Under the plan, the agent will increase the volume of purchases made if the price of TCPC’s common stock declines, subject to volume restrictions. The timing and amount of any stock repurchases will depend on the terms and conditions of the Company Repurchase Plan, the market price of the common stock and trading volumes, and no assurance can be given that any particular amount of common stock will be repurchased.
Unless extended or terminated by its board of directors, TCPC expects that the Company Repurchase Plan will be in effect through the earlier of two trading days after TCPC’s first quarter 2015 earnings release or such time as the approved $50 million repurchase amount has been fully utilized, subject to certain conditions.
On March 6, 2015, the company expanded the TCPC Funding Facility by $50 million to $300 million, increased the accordion feature by $50 million to $350 million and extended the maturity date to March 6, 2019.
On March 10, 2015, the Company’s board of directors declared a first quarter regular dividend of $0.36 per share payable on March 31, 2015 to stockholders of record as of the close of business on March 19, 2015.
| 94 |
TCP Capital Corp.
Notes to Consolidated Financial Statements (Continued)
December 31, 2014
10. Financial Highlights
The financial highlights below show the Company's results of operations for the years ended December 31, 2014, December 31, 2013 and December 31, 2012. Per share amounts are calculated assuming the common shares issued in the Conversion on April 2, 2012 and those sold in the initial public offering on April 3, 2012 had been issued as of the beginning of the year.
| Year Ended December 31, | ||||||||||||
| 2014 | 2013 | 2012 | ||||||||||
| Per Common Share | ||||||||||||
| Per share NAV at beginning of period (1) | $ | 15.18 | $ | 14.71 | $ | 14.84 | ||||||
| Investment operations: | ||||||||||||
| Net investment income before income taxes | 1.98 | 2.13 | 1.95 | |||||||||
| Excise taxes | (0.02 | ) | (0.03 | ) | (0.07 | ) | ||||||
| Net investment income | 1.96 | 2.10 | 1.88 | |||||||||
| Net realized and unrealized gain | (0.69 | ) | 0.35 | (0.60 | ) | |||||||
| Dividends on Series A preferred equity facility | (0.04 | ) | (0.06 | ) | (0.07 | ) | ||||||
| Incentive allocation reserve and distributions | (0.35 | ) | (0.48 | ) | - | |||||||
| Total from investment operations | 0.88 | 1.91 | 1.21 | |||||||||
| Issuance of common stock | 0.43 | 0.09 | - | |||||||||
| Issuance of convertible debt | 0.06 | - | - | |||||||||
| Distributions to common shareholders from: | ||||||||||||
| Net investment income | (1.54 | ) | (1.53 | ) | (1.34 | ) | ||||||
| Per share NAV at end of period | $ | 15.01 | $ | 15.18 | $ | 14.71 | ||||||
| Per share market price at end of period | $ | 16.78 | $ | 16.78 | $ | 14.74 | ||||||
| Total return based on market value (1), (2) | 9.2 | % | 24.2 | % | 9.0 | % | ||||||
| Total return based on net asset value (1) | 9.0 | % | 13.6 | % | 8.2 | % | ||||||
| Shares outstanding at end of period | 48,710,627 | 36,199,916 | 21,477,628 | |||||||||
| 95 |
TCP Capital Corp.
Notes to Consolidated Financial Statements (Continued)
December 31, 2014
10. Financial Highlights (continued)
| Year Ended December 31, | ||||||||||||||||
| 2014 | 2013 | 2012 | 2011 | |||||||||||||
| Ratios to average common equity: (3) | ||||||||||||||||
| Net investment income (4) | 10.2 | % | 10.9 | % | 13.6 | % | 17.6 | % | ||||||||
| Expenses (5) | 4.7 | % | 3.6 | % | 3.5 | % | 3.6 | % | ||||||||
| Expenses and incentive allocation (6) | 7.2 | % | 6.5 | % | N/A | N/A | ||||||||||
| Ending common shareholder equity | $ | 731,129,028 | $ | 549,553,354 | $ | 315,987,550 | $ | 237,870,874 | ||||||||
| Portfolio turnover rate | 28.4 | % | 38.9 | % | 48.3 | % | 42.8 | % | ||||||||
| Weighted-average debt outstanding | $ | 209,095,352 | $ | 88,471,233 | $ | 25,374,317 | $ | 42,038,356 | ||||||||
| Weighted-average interest rate on debt | 3.4 | % | 1.3 | % | 0.7 | % | 80.0 | % | ||||||||
| Weighted-average number of common shares | 39,395,671 | 25,926,493 | 21,475,847 | N/A | ||||||||||||
| Average debt per share | $ | 5.31 | $ | 3.44 | $ | 1.18 | N/A | |||||||||
| Asset Coverage: | As of December 31, | |||||||||||||||
| 2014 | 2013 | 2012 | 2012 | |||||||||||||
| Series A Preferred Equity Facility: | ||||||||||||||||
| Interests outstanding | 6,700 | 6,700 | 6,700 | 6,700 | ||||||||||||
| Involuntary liquidation value per interest | $ | 20,074 | $ | 20,075 | $ | 20,079 | $ | 20,070 | ||||||||
| Asset coverage per interest | $ | 51,592 | $ | 68,125 | $ | 50,475 | $ | 49,251 | ||||||||
| . | ||||||||||||||||
| Revolving Facilities | ||||||||||||||||
| Debt outstanding | $ | 328,696,830 | $ | 95,000,000 | $ | 74,000,000 | $ | 29,000,000 | ||||||||
| Asset coverage per $1,000 of debt outstanding | $ | 8,973 | $ | 8,176 | $ | 7,077 | $ | 13,803 | ||||||||
(1) 2012 total return calculated assuming the Conversion and the initial public offering occurred on January 1, 2012.
(2) 2012 total return is based on an initial public offering price of $14.75.
(3) These ratios include interest expense but do not reflect the effect of dividends on the preferred equity facility.
(4) Net of incentive allocation and excise taxes.
(5) Excludes excise taxes.
(6) Includes incentive allocation payable to the General Partner and all Company expenses.
| 96 |
TCP Capital Corp.
Notes to Consolidated Financial Statements (Continued)
December 31, 2014
11. Select Quarterly Data (Unaudited)
| 2014 | ||||||||||||||||
| Q4 | Q3 | Q2 | Q1 | |||||||||||||
| Total investment income | $ | 32,135,038 | $ | 27,190,466 | $ | 24,587,300 | $ | 22,668,644 | ||||||||
| Net investment income before taxes | 22,684,324 | 19,200,190 | 18,426,208 | 17,790,654 | ||||||||||||
| Excise taxes | 808,813 | - | - | - | ||||||||||||
| Net investment income | 21,875,511 | 19,200,190 | 18,426,208 | 17,790,654 | ||||||||||||
| Net realized and unrealized gain | (24,967,480 | ) | (4,505,178 | ) | (3,011,938 | ) | 5,180,018 | |||||||||
| Preferred dividends | (360,303 | ) | (362,169 | ) | (357,060 | ) | (358,640 | ) | ||||||||
| Incentive allocation reserve and distributions | (3,601,876 | ) | (2,866,569 | ) | (3,011,442 | ) | (4,522,407 | ) | ||||||||
| Net increase in net assets resulting from operations | $ | (7,054,148 | ) | $ | 11,466,274 | $ | 12,045,768 | $ | 18,089,625 | |||||||
| Basic and diluted earnings per common share | $ | (0.16 | ) | $ | 0.29 | $ | 0.33 | $ | 0.50 | |||||||
| 2013 | ||||||||||||||||
| Q4 | Q3 | Q2 | Q1 | |||||||||||||
| Total investment income | $ | 20,985,737 | $ | 17,288,371 | $ | 14,469,195 | $ | 16,865,743 | ||||||||
| Net investment income before taxes | 16,262,265 | 13,587,979 | 11,461,529 | 13,996,113 | ||||||||||||
| Excise taxes | 977,624 | - | - | - | ||||||||||||
| Net investment income | 15,284,641 | 13,587,979 | 11,461,529 | 13,996,113 | ||||||||||||
| Net realized and unrealized gain | 3,120,563 | 2,937,047 | 658,362 | 2,355,389 | ||||||||||||
| Preferred dividends | (355,610 | ) | (387,982 | ) | (373,558 | ) | (377,402 | ) | ||||||||
| Incentive allocation reserve and distributions | (3,609,920 | ) | (3,227,409 | ) | (2,349,267 | ) | (3,194,820 | ) | ||||||||
| Net increase in net assets resulting from operations | $ | 14,439,674 | $ | 12,909,635 | $ | 9,397,066 | $ | 12,779,280 | ||||||||
| Basic and diluted earnings per common share | $ | 0.46 | $ | 0.48 | $ | 0.40 | $ | 0.60 | ||||||||
| 97 |
TCP Capital Corp.
Consolidated Schedule of Change in Investments in Affiliates (1)
Year Ended December 31, 2014
| Security |
Dividends or
Interest (2) |
Fair Value at
January 1, 2014 |
Acquisitions (3) | Dispositions (4) |
Fair Value at
December 31, 2014 |
|||||||||||||||
| AGY Holding Corp., Senior Secured Term Loan, 12%, due 9/15/16 | $ | 327,716 | $ | 2,056,927 | $ | 2,812,650 | $ | - | $ | 4,869,577 | ||||||||||
| AGY Holding Corporation, Senior Secured 2nd Lien Notes, 11%, due 11/15/16 | 1,019,480 | 9,268,000 | - | (250,236 | ) | 9,017,764 | ||||||||||||||
| Anacomp, Inc., Class A Common Stock | - | 1,004,422 | - | (87,887 | ) | 916,535 | ||||||||||||||
| EPMC HoldCo, LLC, Membership Units | - | 1,562,137 | 969,968 | (1,849,491 | ) | 682,614 | ||||||||||||||
| ESP Holdings, Inc., Cumulative Preferred 15% | 1,968,748 | 3,947,862 | 239,170 | (4,187,032 | ) | - | ||||||||||||||
| ESP Holdings, Inc., Common Stock | 289,315 | 2,856,346 | 6,981,836 | (9,838,181 | ) | - | ||||||||||||||
| ESP Holdings, Inc., Junior Unsecured Subordinated Promissory Notes, | ||||||||||||||||||||
| 6% Cash + 10% PIK, due 12/31/19 | 205,175 | 7,959,369 | - | (7,959,369 | ) | - | ||||||||||||||
| Globecomm Systems Inc., Senior Secured 1st Lien Term Loan, LIBOR + 7.625%, | ||||||||||||||||||||
| 1.25% LIBOR Floor, due 12/11/18 | 1,344,702 | 15,097,500 | 1,500 | (442,050 | ) | 14,656,950 | ||||||||||||||
| KAGY Holding Company, Inc., Series A Preferred Stock | - | 662,134 | - | (540,159 | ) | 121,975 | ||||||||||||||
| N510UA Aircraft Secured Mortgage, 20%, due 10/26/16 | 52,092 | 404,605 | - | (404,605 | ) | - | ||||||||||||||
| N512UA Aircraft Secured Mortgage, 20%, due 10/26/16 | 53,275 | 414,010 | - | (414,010 | ) | - | ||||||||||||||
| N536UA Aircraft Secured Mortgage, 16%, due 9/29/14 | 4,678 | 114,000 | - | (114,000 | ) | - | ||||||||||||||
| N545UA Aircraft Secured Mortgage, 16%, due 8/29/15 | 25,964 | 275,405 | - | (275,405 | ) | - | ||||||||||||||
| N585UA Aircraft Secured Mortgage, 20%, due 10/25/16 | 27,571 | 486,115 | - | (486,115 | ) | - | ||||||||||||||
| N659UA Aircraft Secured Mortgage, 12%, due 2/28/16 | 262,962 | 2,948,986 | - | (1,289,983 | ) | 1,659,003 | ||||||||||||||
| N661UA Aircraft Secured Mortgage, 12%, due 5/4/16 | 274,461 | 3,171,026 | - | (1,271,076 | ) | 1,899,950 | ||||||||||||||
| N510UA Equipment Trust Beneficial Interests | 86,342 | 465,625 | 285,805 | (751,430 | ) | - | ||||||||||||||
| N512UA Equipment Trust Beneficial Interests | 85,549 | 458,277 | 281,999 | (740,276 | ) | - | ||||||||||||||
| N536UA Equipment Trust Beneficial Interests | 40,259 | 656,766 | 80,397 | (737,163 | ) | - | ||||||||||||||
| N545UA Equipment Trust Beneficial Interests | 107,483 | 641,840 | 163,935 | (805,775 | ) | - | ||||||||||||||
| N585UA Equipment Trust Beneficial Interests | 31,098 | 571,706 | 322,126 | (893,832 | ) | - | ||||||||||||||
| N913DL Aircraft Secured Mortgage, 8%, due 3/15/17 | 19,714 | 296,820 | - | (87,652 | ) | 209,168 | ||||||||||||||
| N918DL Aircraft Secured Mortgage, 8%, due 8/15/18 | 28,023 | 397,290 | - | (76,850 | ) | 320,440 | ||||||||||||||
| N954DL Aircraft Secured Mortgage, 8%, due 3/20/19 | 37,801 | 524,620 | - | (86,941 | ) | 437,679 | ||||||||||||||
| N955DL Aircraft Secured Mortgage, 8%, due 6/20/19 | 39,443 | 543,320 | - | (83,062 | ) | 460,258 | ||||||||||||||
| N956DL Aircraft Secured Mortgage, 8%, due 5/20/19 | 39,309 | 542,640 | - | (84,738 | ) | 457,902 | ||||||||||||||
| N957DL Aircraft Secured Mortgage, 8%, due 6/20/19 | 39,787 | 548,250 | - | (83,967 | ) | 464,283 | ||||||||||||||
| N959DL Aircraft Secured Mortgage, 8%, due 7/20/19 | 40,262 | 553,520 | - | (82,919 | ) | 470,601 | ||||||||||||||
| N960DL Aircraft Secured Mortgage, 8%, due 10/20/19 | 42,013 | 574,430 | - | (81,172 | ) | 493,258 | ||||||||||||||
| N961DL Aircraft Secured Mortgage, 8%, due 8/20/19 | 41,423 | 568,310 | - | (83,402 | ) | 484,908 | ||||||||||||||
| N976DL Aircraft Secured Mortgage, 8%, due 2/15/18 | 28,046 | 404,600 | - | (90,012 | ) | 314,588 | ||||||||||||||
| N913DL Equipment Trust Beneficial Interests | 18,477 | 125,970 | 85,559 | (94,032 | ) | 117,497 | ||||||||||||||
| N918DL Equipment Trust Beneficial Interests | 14,907 | 142,970 | 82,257 | (89,336 | ) | 135,890 | ||||||||||||||
| N954DL Equipment Trust Beneficial Interests | 14,119 | 68,000 | 112,356 | (107,752 | ) | 72,604 | ||||||||||||||
| N955DL Equipment Trust Beneficial Interests | 13,186 | 113,560 | 103,886 | (106,436 | ) | 111,010 | ||||||||||||||
| N956DL Equipment Trust Beneficial Interests | 13,244 | 108,800 | 105,904 | (107,904 | ) | 106,800 | ||||||||||||||
| N957DL Equipment Trust Beneficial Interests | 12,996 | 109,650 | 105,488 | (107,456 | ) | 107,682 | ||||||||||||||
| N959DL Equipment Trust Beneficial Interests | 12,756 | 110,500 | 105,095 | (107,016 | ) | 108,579 | ||||||||||||||
| N960DL Equipment Trust Beneficial Interests | 11,868 | 109,650 | 104,892 | (106,676 | ) | 107,865 | ||||||||||||||
| N961DL Equipment Trust Beneficial Interests | 12,161 | 103,870 | 107,504 | (108,548 | ) | 102,826 | ||||||||||||||
| N976DL Equipment Trust Beneficial Interests | 13,666 | 103,033 | 101,533 | (102,560 | ) | 102,006 | ||||||||||||||
| RM Holdco, LLC, Equity Participation | - | - | - | - | - | |||||||||||||||
| RM Holdco, LLC, Membership Units | - | - | - | - | - | |||||||||||||||
| RM Holdco, LLC, Subordinated Convertible Term Loan, 1.12% PIK, due 3/21/18 | 58,663 | 2,197,621 | 3,026,338 | (5,223,959 | ) | - | ||||||||||||||
| RM OpCo, LLC, Senior Secured 1st Lien Term Loan Tranche A, 7%, due 3/21/16 | 400,651 | 3,626,947 | 465,190 | (192,112 | ) | 3,900,025 | ||||||||||||||
| RM OpCo, LLC, Senior Secured 2nd Lien Term Loan Tranche B, 8.5%, due 3/30/18 | 1,349,228 | 6,825,328 | 1,327,860 | (1,695,863 | ) | 6,457,325 | ||||||||||||||
| RM OpCo, LLC, Senior Secured 2nd Lien Term Loan Tranche B-1, 8.5%, due 3/30/18 | 444,445 | 2,150,088 | 437,146 | (19,517 | ) | 2,567,717 | ||||||||||||||
| RM OpCo, LLC, Convertible 2nd Lien Term Loan Tranche B-1, 8.5%, due 3/30/18 | 279,505 | 1,370,199 | 274,827 | (8,712 | ) | 1,636,314 | ||||||||||||||
| RM OpCo, LLC, Senior Convertible 2nd Lien Term Loan B, 8.5%, due 3/30/18 | 6,107 | - | 631,164 | 631,164 | ||||||||||||||||
| United N659UA-767, LLC (N659UA) | 443,575 | 2,840,323 | 1,126,014 | (788,515 | ) | 3,177,822 | ||||||||||||||
| United N661UA-767, LLC (N661UA) | 436,533 | 2,852,677 | 1,092,004 | (865,758 | ) | 3,078,923 | ||||||||||||||
| Wasserstein Cosmos Co-Invest, L.P., Limited Partnership Units | - | 5,000,000 | - | (825,000 | ) | 4,175,000 | ||||||||||||||
Notes to Consolidated Schedule of Changes in Investments in Affiliates:
| (1) | The issuers of the securities listed on this schedule are considered affiliates under the Investment Company Act of 1940 due to the ownership by the Company of 5% or more of the issuers' voting securities. |
| (2) | Also includes fee and lease income as applicable. |
| (3) | Acquisitions include new purchases, PIK income and net unrealized appreciation. |
| (4) | Dispositions include decreases in the cost basis from sales, paydowns, mortgage amortizations, aircraft depreciation and net unrealized depreciation. |
| 98 |
TCP Capital Corp.
Consolidated Schedule of Changes in Investments in Affiliates (1)
Year Ended December 31, 2013
| Security |
Dividends or
Interest (2) |
Fair Value at
January 1, 2013 |
Acquisitions (3) | Dispositions (4) |
Fair Value at
December 31, 2013 |
|||||||||||||||
| AGY Holding Corp., Senior Secured Term Loan, 12%, due 9/15/16 | $ | 128,215 | $ | - | $ | 2,056,927 | $ | - | $ | 2,056,927 | ||||||||||
| AGY Holding Corporation, Senior Secured 2nd Lien Notes, 11%, due 11/15/16 | 640,007 | - | 9,268,000 | - | 9,268,000 | |||||||||||||||
| Anacomp, Inc., Class A Common Stock | - | 1,255,527 | - | (251,105 | ) | 1,004,422 | ||||||||||||||
| EPMC HoldCo, LLC, Membership Units | - | 2,730,458 | 1,481,930 | (2,650,251 | ) | 1,562,137 | ||||||||||||||
| ESP Holdings, Inc., Cumulative Preferred 15% | - | 3,643,088 | 304,776 | - | 3,947,862 | |||||||||||||||
| ESP Holdings, Inc., Common Stock | 32,627 | 2,263,124 | 593,222 | - | 2,856,346 | |||||||||||||||
| ESP Holdings, Inc., Junior Unsecured Subordinated Promissory Notes, | ||||||||||||||||||||
| 6% Cash + 10% PIK, due 12/31/19 | 1,199,575 | 7,134,137 | 825,232 | - | 7,959,369 | |||||||||||||||
| Globecomm Systems Inc., Senior Secured 1st Lien Term Loan, LIBOR + 7.625%, | ||||||||||||||||||||
| 1.25% LIBOR Floor, due 12/11/18 | 83,281 | - | 15,097,500 | - | 15,097,500 | |||||||||||||||
| International Wire Group Holdings, Inc., Senior Secured Notes, 8.5%, due 10/15/17 | 443,715 | 15,450,000 | 759,750 | (16,209,750 | ) | - | ||||||||||||||
| KAGY Holding Company, Inc., Series A Preferred Stock | - | - | 8,096,057 | (7,433,923 | ) | 662,134 | ||||||||||||||
| N510UA Aircraft Secured Mortgage, 20%, due 10/26/16 | 74,646 | 548,340 | - | (143,735 | ) | 404,605 | ||||||||||||||
| N512UA Aircraft Secured Mortgage, 20%, due 10/26/16 | 75,593 | 556,225 | - | (142,215 | ) | 414,010 | ||||||||||||||
| N536UA Aircraft Secured Mortgage, 16%, due 9/29/14 | 29,100 | 277,780 | - | (163,780 | ) | 114,000 | ||||||||||||||
| N545UA Aircraft Secured Mortgage, 16%, due 8/29/15 | 50,422 | 436,810 | - | (161,405 | ) | 275,405 | ||||||||||||||
| N585UA Aircraft Secured Mortgage, 20%, due 10/25/16 | 88,705 | 653,220 | - | (167,105 | ) | 486,115 | ||||||||||||||
| N659UA Aircraft Secured Mortgage, 12%, due 2/28/16 | 390,117 | 4,264,148 | - | (1,315,162 | ) | 2,948,986 | ||||||||||||||
| N661UA Aircraft Secured Mortgage, 12%, due 5/4/16 | 401,041 | 4,351,424 | - | (1,180,398 | ) | 3,171,026 | ||||||||||||||
| N510UA Equipment Trust Beneficial Interests | 72,866 | 479,682 | 81,562 | (95,619 | ) | 465,625 | ||||||||||||||
| N512UA Equipment Trust Beneficial Interests | 72,497 | 473,761 | 79,808 | (95,292 | ) | 458,277 | ||||||||||||||
| N536UA Equipment Trust Beneficial Interests | 104,929 | 624,746 | 143,097 | (111,077 | ) | 656,766 | ||||||||||||||
| N545UA Equipment Trust Beneficial Interests | 92,525 | 616,897 | 128,359 | (103,415 | ) | 641,840 | ||||||||||||||
| N585UA Equipment Trust Beneficial Interests | 80,203 | 583,392 | 93,707 | (105,392 | ) | 571,706 | ||||||||||||||
| N913DL Aircraft Secured Mortgage, 8%, due 3/15/17 | 26,248 | 367,370 | 6,959 | (77,509 | ) | 296,820 | ||||||||||||||
| N918DL Aircraft Secured Mortgage, 8%, due 8/15/18 | 33,806 | 454,580 | 11,322 | (68,612 | ) | 397,290 | ||||||||||||||
| N954DL Aircraft Secured Mortgage, 8%, due 3/20/19 | 44,415 | 597,720 | 5,725 | (78,825 | ) | 524,620 | ||||||||||||||
| N955DL Aircraft Secured Mortgage, 8%, due 6/20/19 | 45,803 | 612,000 | 7,144 | (75,824 | ) | 543,320 | ||||||||||||||
| N956DL Aircraft Secured Mortgage, 8%, due 5/20/19 | 45,775 | 612,850 | 6,875 | (77,085 | ) | 542,640 | ||||||||||||||
| N957DL Aircraft Secured Mortgage, 8%, due 6/20/19 | 46,204 | 617,440 | 7,297 | (76,487 | ) | 548,250 | ||||||||||||||
| N959DL Aircraft Secured Mortgage, 8%, due 7/20/19 | 46,629 | 622,030 | 7,386 | (75,896 | ) | 553,520 | ||||||||||||||
| N960DL Aircraft Secured Mortgage, 8%, due 10/20/19 | 48,285 | 640,730 | 8,476 | (74,776 | ) | 574,430 | ||||||||||||||
| N961DL Aircraft Secured Mortgage, 8%, due 8/20/19 | 47,846 | 636,990 | 7,902 | (76,582 | ) | 568,310 | ||||||||||||||
| N976DL Aircraft Secured Mortgage, 8%, due 2/15/18 | 34,759 | 473,280 | 10,967 | (79,647 | ) | 404,600 | ||||||||||||||
| N913DL Equipment Trust Beneficial Interests | 12,045 | 111,520 | 108,482 | (94,032 | ) | 125,970 | ||||||||||||||
| N918DL Equipment Trust Beneficial Interests | 9,213 | 120,530 | 111,778 | (89,338 | ) | 142,970 | ||||||||||||||
| N954DL Equipment Trust Beneficial Interests | 7,578 | 113,390 | 78,825 | (124,215 | ) | 68,000 | ||||||||||||||
| N955DL Equipment Trust Beneficial Interests | 6,891 | 160,650 | 75,824 | (122,914 | ) | 113,560 | ||||||||||||||
| N956DL Equipment Trust Beneficial Interests | 6,845 | 163,200 | 77,085 | (131,485 | ) | 108,800 | ||||||||||||||
| N957DL Equipment Trust Beneficial Interests | 6,648 | 163,880 | 76,487 | (130,717 | ) | 109,650 | ||||||||||||||
| N959DL Equipment Trust Beneficial Interests | 6,456 | 164,390 | 75,896 | (129,785 | ) | 110,500 | ||||||||||||||
| N960DL Equipment Trust Beneficial Interests | 5,662 | 169,660 | 74,776 | (134,786 | ) | 109,650 | ||||||||||||||
| N961DL Equipment Trust Beneficial Interests | 5,805 | 171,360 | 76,582 | (144,072 | ) | 103,870 | ||||||||||||||
| N967DL Equipment Trust Beneficial Interests | 7,056 | 83,300 | 122,293 | (102,560 | ) | 103,033 | ||||||||||||||
| RM Holdco, LLC, Membership Units | - | 849,478 | - | (849,478 | ) | - | ||||||||||||||
| RM Holdco, LLC, Subordinated Convertible Term Loan, 1.12% PIK, due 3/21/18 | 57,992 | 5,106,805 | 57,991 | (2,967,175 | ) | 2,197,621 | ||||||||||||||
| RM OpCo, LLC, Senior Secured 1st Lien Term Loan Tranche A, 11%, due 3/19/16 | 413,430 | 3,759,156 | 16,974 | (149,183 | ) | 3,626,947 | ||||||||||||||
| RM OpCo, LLC, Senior Secured 1st Lien Term Loan Tranche B, | ||||||||||||||||||||
| 12% Cash + 7% PIK, due 3/19/16 | 1,258,016 | 6,258,122 | 567,206 | - | 6,825,328 | |||||||||||||||
| RM OpCo, LLC, Senior Secured 1st Lien Term Loan Tranche B-1, | ||||||||||||||||||||
| 12% Cash + 7% PIK, due 3/19/16 | 410,004 | 1,976,470 | 186,901 | (13,283 | ) | 2,150,088 | ||||||||||||||
| RM OpCo, LLC, Convertible 1st Lien Term Loan Tranche B-1, | ||||||||||||||||||||
| 12% Cash + 7% PIK, due 3/21/16 | 182,711 | - | 1,370,199 | - | 1,370,199 | |||||||||||||||
| United N659UA-767, LLC (N659UA) | 316,842 | 2,771,428 | 999,280 | (930,385 | ) | 2,840,323 | ||||||||||||||
| United N661UA-767, LLC (N661UA) | 313,627 | 2,789,809 | 969,098 | (906,231 | ) | 2,852,677 | ||||||||||||||
| Wasserstein Cosmos Co-Invest, L.P., Limited Partnership Units | - | - | 5,000,000 | - | 5,000,000 | |||||||||||||||
Notes to Schedule of Changes in Investments in Affiliates:
| (1) | The issuers of the securities listed on this schedule are considered affiliates under the Investment Company Act of 1940 due to the ownership by the Company of 5% or more of the issuers' voting securities. |
| (2) | Also includes fee and lease income as applicable. |
| (3) | Acquisitions include new purchases, PIK income and net unrealized appreciation. |
| (4) | Dispositions include decreases in the cost basis from sales, paydowns, mortgage amortizations, aircraft depreciation and net unrealized depreciation. |
| 99 |
Consolidated Schedule of Restricted Securities of Unaffiliated Issuers
December 31, 2014
| Investment | Acquisition Date | |
| Avanti Communications Group, PLC, Senior Secured Notes, 10%, due 10/1/19 | 9/26/13 | |
| BlackLine Intermediate, Inc., Warrants to Purchase Common Stock | 9/25/13 | |
| BPA Laboratories, Inc., Senior Secured Notes, 12.25%, due 4/1/17 | 3/5/12 | |
| Caribbean Financial Group, Senior Secured Notes, 11.5%, due 11/15/19 | 10/19/12 | |
| Carolina Beverage Group, LLC, Secured Notes, 10.625%, due 8/1/18 | 7/26/13 | |
| Constellation Enterprises, LLC, Senior Secured 1st Lien Notes, 10.625%, due 2/1/16 | 1/20/11 | |
| Findly Talent, LLC, Membership Units | 1/1/14 | |
| Flight Options Holdings I, Inc., Warrants to Purchase Common Stock | 12/4/13 | |
| Green Biologics, Inc., Warrants to purchase Stock | 12/22/14 | |
| Hunt Companies, Inc., Senior Secured Notes, 9.625%, due 3/1/21 | 2/25/14 | |
| Ichor Systems Holdings, LLC, Membership Units | Var. 2009 & 2010 | |
| Integra Telecom, Inc., Common Stock | 11/19/09 | |
| Integra Telecom, Inc., Warrants | 11/19/09 | |
| Iracore International, Inc., Senior Secured Notes, 9.5%, due 6/1/18 | 5/8/13 | |
| Magnolia Finance V plc, Asset-Backed Credit Linked Notes, 13.125%, due 8/2/21 | 8/1/13 | |
| Marsico Holdings, LLC Common Interest Units | 9/10/12 | |
| NEXTracker, Inc., Series B Preferred Stock | 12/17/14 | |
| NEXTracker, Inc., Warrants to purchase Stock | 12/17/14 | |
| Precision Holdings, LLC, Class C Membership Interests | Var. 2010 & 2011 | |
| Rightside Group, Ltd, Warrants | 8/6/14 | |
| Shop Holdings, LLC, Convertible Promissory Note, 5%, due 8/5/15 | 2/5/14 | |
| Shop Holding, LLC, Class A Units | 6/2/11 | |
| Shop Holding, LLC, Warrants to Purchase Class A Units | 6/2/11 | |
| SiTV, Inc., Senior Secured Notes, 10.375%, due 7/1/19 | 6/18/14 | |
| SiTV, Inc., Warrants to Purchase Common Stock | 8/3/12 | |
| Soraa, Inc., Warrants to Purchase Common Stock | 8/29/14 | |
| STG-Fairway Holdings, LLC, Class A Units | 12/30/10 | |
| The Telx Group, Inc., Senior Notes, 13.5% PIK, due 7/9/21 | 4/9/14 | |
| Trade Finance Funding I, Ltd., Secured Class B Notes, 10.75%, due 11/13/18 | 11/13/13 | |
| V Telecom Investment S.C.A, Common Shares | 11/9/12 |
| 100 |
TCP Capital Corp.
Consolidated Schedule of Restricted Securities of Unaffiliated Issuers
December 31, 2013
| Investment | Acquisition Date | |
| AIP/IS Holdings, LLC, Membership Units | Var. 2009 & 2010 | |
| Avanti Communications Group, PLC, Senior Secured Notes, 10%, due 10/1/19 | 9/26/13 | |
| BPA Laboratories, Inc., Senior Secured Notes, 12.25%, due 4/1/17 | 3/5/12 | |
| Caribbean Financial Group, Senior Secured Notes, 11.5%, due 11/15/19 | 10/19/12 | |
| Carolina Beverage Group, LLC, Secured Notes, 10.625%, due 8/1/18 | 7/26/13 | |
| Constellation Enterprises, LLC, Senior Secured 1st Lien Notes, 10.625%, due 2/1/16 | 1/20/11 | |
| Flight Options Holdings I, Inc., Warrants to Purchase Common Stock | 12/4/13 | |
| Integra Telecom, Inc., Common Stock | 11/19/09 | |
| Integra Telecom, Inc., Warrants | 11/19/09 | |
| Iracore International, Inc., Senior Secured Notes, 9.5%, due 6/1/18 | 5/8/13 | |
| Magnolia Finance V plc, Asset-Backed Credit Linked Notes, 13.125%, due 8/2/21 | 8/1/13 | |
| Marsico Holdings, LLC Common Interest Units | 9/10/12 | |
| Precision Holdings, LLC, Class C Membership Interests | Var. 2010 & 2011 | |
| Shop Holding, LLC, Class A Units | 6/2/11 | |
| Shop Holding, LLC, Warrants to Purchase Class A Units | 6/2/11 | |
| SiTV, Inc., Warrants to Purchase Common Stock | 8/3/12 | |
| SLS Breeze Intermediate Holdings, Inc., Warrants to Purchase Common Stock | 9/25/13 | |
| St Barbara Ltd., 1st Priority Senior Secured Notes, 8.875%, due 4/15/18 | 3/22/13 | |
| STG-Fairway Holdings, LLC, Class A Units | 12/30/10 | |
| The Telx Group, Inc., Senior Unsecured Notes, 10% Cash + 2% PIK, due 9/26/19 | 9/26/11 | |
| Trade Finance Funding I, Ltd., Secured Class B Notes, 10.75%, due 11/13/18 | 11/13/13 | |
| V Telecom Investment S.C.A, Common Shares | 11/9/12 | |
| Vantage Oncology, LLC, Senior Secured Notes, 9.5%, due 6/15/17 | 6/6/13 |
| 101 |
Consolidating Statement of Assets and Liabilities
December 31, 2014
| Special Value | ||||||||||||||||
| TCP | Continuation | TCP | ||||||||||||||
| Capital Corp. | Partners, LP | Capital Corp. | ||||||||||||||
| Standalone | Consolidated | Eliminations | Consolidated | |||||||||||||
| Assets | ||||||||||||||||
| Investments: | ||||||||||||||||
| Companies less than 5% owned | $ | - | $ | 1,081,901,384 | $ | - | $ | 1,081,901,384 | ||||||||
| Companies 5% to 25% owned | - | 48,716,425 | - | 48,716,425 | ||||||||||||
| Companies more than 25% owned | - | 15,918,077 | - | 15,918,077 | ||||||||||||
| Investment in subsidiary | 833,816,090 | - | (833,816,090 | ) | - | |||||||||||
| Total investments | 833,816,090 | 1,146,535,886 | (833,816,090 | ) | 1,146,535,886 | |||||||||||
| Cash and cash equivalents | - | 27,268,792 | - | 27,268,792 | ||||||||||||
| Receivable for investment securities sold | - | 10,961,369 | - | 10,961,369 | ||||||||||||
| Accrued interest income | - | 9,504,438 | - | 9,504,438 | ||||||||||||
| Deferred debt issuance costs | 3,058,913 | 4,642,075 | - | 7,700,988 | ||||||||||||
| Unrealized appreciation on swaps | - | 1,717,610 | - | 1,717,610 | ||||||||||||
| Options (cost $51,750) | - | 497 | - | 497 | ||||||||||||
| Receivable from subsidiary | 1,031,498 | - | (1,031,498 | ) | - | |||||||||||
| Prepaid expenses and other assets | 176,692 | 2,000,525 | - | 2,177,217 | ||||||||||||
| Total assets | 838,083,193 | 1,202,631,192 | (834,847,588 | ) | 1,205,866,797 | |||||||||||
| Liabilities | ||||||||||||||||
| Debt | 105,696,830 | 223,000,000 | - | 328,696,830 | ||||||||||||
| Incentive allocation payable | - | 4,303,040 | - | 4,303,040 | ||||||||||||
| Payable for investment securities purchased | - | 2,049,518 | - | 2,049,518 | ||||||||||||
| Interest payable | 247,917 | 1,263,064 | - | 1,510,981 | ||||||||||||
| Payable to the Investment Manager | 130,967 | 328,860 | - | 459,827 | ||||||||||||
| Payable to parent | - | 1,031,498 | (1,031,498 | ) | - | |||||||||||
| Accrued expenses and other liabilities | 878,451 | 2,341,332 | - | 3,219,783 | ||||||||||||
| Total liabilities | 106,954,165 | 234,317,312 | (1,031,498 | ) | 340,239,979 | |||||||||||
| Preferred equity facility | ||||||||||||||||
| Series A preferred limited partner interests | - | 134,000,000 | - | 134,000,000 | ||||||||||||
| Accumulated dividends on Series A preferred equity facility | - | 497,790 | - | 497,790 | ||||||||||||
| Total preferred limited partner interests | - | 134,497,790 | - | 134,497,790 | ||||||||||||
| Non-controlling interest | ||||||||||||||||
| General Partner interest in Special Value Continuation Partners, LP | - | - | - | - | ||||||||||||
| Net assets | $ | 731,129,028 | $ | 833,816,090 | $ | (833,816,090 | ) | $ | 731,129,028 | |||||||
| Composition of net assets | ||||||||||||||||
| Common stock | $ | 48,710 | $ | - | $ | - | $ | 48,710 | ||||||||
| Additional paid-in capital | 877,103,880 | 978,731,888 | (978,731,888 | ) | 877,103,880 | |||||||||||
| Accumulated deficit | (146,023,562 | ) | (144,915,798 | ) | 144,915,798 | (146,023,562 | ) | |||||||||
| Non-controlling interest | - | - | - | - | ||||||||||||
| Net assets | $ | 731,129,028 | $ | 833,816,090 | $ | (833,816,090 | ) | $ | 731,129,028 | |||||||
| 102 |
TCP Capital Corp.
Consolidating Statement of Assets and Liabilities
December 31, 2013
| Special Value | ||||||||||||||||
| TCP | Continuation | TCP | ||||||||||||||
| Capital Corp. | Partners, LP | Capital Corp. | ||||||||||||||
| Standalone | Consolidated | Eliminations | Consolidated | |||||||||||||
| Assets | ||||||||||||||||
| Investments: | ||||||||||||||||
| Companies less than 5% owned | $ | - | $ | 678,326,915 | $ | - | $ | 678,326,915 | ||||||||
| Companies 5% to 25% owned | - | 69,068,808 | - | 69,068,808 | ||||||||||||
| Companies more than 25% owned | - | 18,867,236 | - | 18,867,236 | ||||||||||||
| Investment in subsidiary | 551,095,042 | - | (551,095,042 | ) | - | |||||||||||
| Total investments | 551,095,042 | 766,262,959 | (551,095,042 | ) | 766,262,959 | |||||||||||
| Cash and cash equivalents | - | 22,984,182 | - | 22,984,182 | ||||||||||||
| Accrued interest income | - | 6,739,105 | - | 6,739,105 | ||||||||||||
| Receivable for investments sold | - | 3,605,964 | - | 3,605,964 | ||||||||||||
| Deferred debt issuance costs | - | 2,969,085 | - | 2,969,085 | ||||||||||||
| Interest rate cap option | - | 14,139 | - | 14,139 | ||||||||||||
| Receivable from subsidiary | 531,717 | - | (531,717 | ) | - | |||||||||||
| Prepaid expenses and other assets | 30,493 | 723,275 | - | 753,768 | ||||||||||||
| Total assets | 551,657,252 | 803,298,709 | (551,626,759 | ) | 803,329,202 | |||||||||||
| Liabilities | ||||||||||||||||
| Debt | - | 95,000,000 | - | 95,000,000 | ||||||||||||
| Payable for investment securities purchased | - | 14,706,942 | - | 14,706,942 | ||||||||||||
| Incentive allocation payable | - | 3,318,900 | - | 3,318,900 | ||||||||||||
| Payable to the Investment Manager | 833,737 | 287,371 | - | 1,121,108 | ||||||||||||
| Interest payable | - | 430,969 | - | 430,969 | ||||||||||||
| Unrealized depreciation on swaps | - | 331,183 | - | 331,183 | ||||||||||||
| Payable to parent | - | 531,717 | (531,717 | ) | - | |||||||||||
| Accrued expenses and other liabilities | 1,212,260 | 1,923,750 | - | 3,136,010 | ||||||||||||
| Total liabilities | 2,045,997 | 116,530,832 | (531,717 | ) | 118,045,112 | |||||||||||
| Preferred equity facility | ||||||||||||||||
| Series A preferred limited partner interests | - | 134,000,000 | - | 134,000,000 | ||||||||||||
| Accumulated dividends on Series A preferred equity facility | - | 504,252 | - | 504,252 | ||||||||||||
| Total preferred limited partner interests | - | 134,504,252 | - | 134,504,252 | ||||||||||||
| Non-controlling interest | ||||||||||||||||
| General Partner interest in Special Value Continuation Partners, LP | - | - | 1,168,583 | 1,168,583 | ||||||||||||
| Net assets | $ | 549,611,255 | $ | 552,263,625 | $ | (552,263,625 | ) | $ | 549,611,255 | |||||||
| Composition of net assets | ||||||||||||||||
| Common stock | $ | 36,200 | $ | - | $ | - | $ | 36,200 | ||||||||
| Additional paid-in capital | 667,842,020 | 666,530,318 | (666,530,318 | ) | 667,842,020 | |||||||||||
| Accumulated deficit | (118,266,965 | ) | (114,266,693 | ) | 115,435,276 | (117,098,382 | ) | |||||||||
| Non-controlling interest | - | - | (1,168,583 | ) | (1,168,583 | ) | ||||||||||
| Net assets | $ | 549,611,255 | $ | 552,263,625 | $ | (552,263,625 | ) | $ | 549,611,255 | |||||||
| 103 |
Consolidating Statement of Operations
Year Ended December 31, 2014
| Special Value | ||||||||||||||||
| TCP | Continuation | TCP | ||||||||||||||
| Capital Corp. | Partners, LP | Capital Corp. | ||||||||||||||
| Standalone | Consolidated | Eliminations | Consolidated | |||||||||||||
| Investment income | ||||||||||||||||
| Interest income: | ||||||||||||||||
| Companies less than 5% owned | $ | - | $ | 94,632,495 | $ | - | $ | 94,632,495 | ||||||||
| Companies 5% to 25% owned | - | 5,394,075 | - | 5,394,075 | ||||||||||||
| Companies more than 25% owned | - | 896,695 | - | 896,695 | ||||||||||||
| Dividend income: | ||||||||||||||||
| Companies 5% to 25% owned | - | 1,968,748 | - | 1,968,748 | ||||||||||||
| Lease income: | ||||||||||||||||
| Companies 5% to 25% owned | - | 320,277 | - | 320,277 | ||||||||||||
| Companies more than 25% owned | - | 1,014,053 | - | 1,014,053 | ||||||||||||
| Other income: | ||||||||||||||||
| Companies less than 5% owned | - | 2,328,980 | - | 2,328,980 | ||||||||||||
| Companies 5% to 25% owned | - | 26,125 | - | 26,125 | ||||||||||||
| Total interest and related investment income | - | 106,581,448 | - | 106,581,448 | ||||||||||||
| Operating expenses | ||||||||||||||||
| Management and advisory fees | - | 13,646,064 | - | 13,646,064 | ||||||||||||
| Interest expense | 3,252,174 | 3,758,041 | - | 7,010,215 | ||||||||||||
| Amortization of deferred debt issuance costs | 372,487 | 1,553,553 | - | 1,926,040 | ||||||||||||
| Administration expenses | - | 1,421,863 | - | 1,421,863 | ||||||||||||
| Legal fees, professional fees and due diligence expenses | 402,086 | 953,284 | - | 1,355,370 | ||||||||||||
| Commitment fees | - | 885,496 | - | 885,496 | ||||||||||||
| Director fees | 117,943 | 239,107 | - | 357,050 | ||||||||||||
| Insurance expense | 95,988 | 192,168 | - | 288,156 | ||||||||||||
| Custody fees | 3,500 | 225,754 | - | 229,254 | ||||||||||||
| Other operating expenses | 803,544 | 557,020 | - | 1,360,564 | ||||||||||||
| Total expenses | 5,047,722 | 23,432,350 | - | 28,480,072 | ||||||||||||
| Net investment income (loss) before income taxes | (5,047,722 | ) | 83,149,098 | - | 78,101,376 | |||||||||||
| Excise tax expense | 808,813 | - | - | 808,813 | ||||||||||||
| Net investment income (loss) | (5,856,535 | ) | 83,149,098 | - | 77,292,563 | |||||||||||
| Net realized and unrealized gain (loss) on investments and foreign currency | ||||||||||||||||
| Net realized gain (loss): | ||||||||||||||||
| Investments in companies less than 5% owned | - | (16,370,638 | ) | - | (16,370,638 | ) | ||||||||||
| Investments in companies 5% to 25% owned | - | (4,748,229 | ) | - | (4,748,229 | ) | ||||||||||
| Net realized loss | - | (21,118,867 | ) | - | (21,118,867 | ) | ||||||||||
| Net change in unrealized appreciation/depreciation | - | (6,185,711 | ) | - | (6,185,711 | ) | ||||||||||
| Net realized and unrealized gain | - | (27,304,578 | ) | - | (27,304,578 | ) | ||||||||||
| Interest in earnings of subsidiary | 40,404,054 | - | (40,404,054 | ) | - | |||||||||||
| Dividends paid on Series A preferred equity facility | - | (1,444,634 | ) | - | (1,444,634 | ) | ||||||||||
| Net change in accumulated dividends on Series A preferred equity facility | - | 6,462 | - | 6,462 | ||||||||||||
| Distributions of incentive allocation to the General Partner from net investment income | - | - | (15,170,877 | ) | (15,170,877 | ) | ||||||||||
| Net change in reserve for incentive allocation | - | - | 1,168,583 | 1,168,583 | ||||||||||||
| Net increase in net assets resulting from operations | $ | 34,547,519 | $ | 54,406,348 | $ | (54,406,348 | ) | $ | 34,547,519 | |||||||
| 104 |
TCP Capital Corp.
Consolidating Statement of Operations
Year Ended December 31, 2013
| Special Value | ||||||||||||||||
| TCP | Continuation | TCP | ||||||||||||||
| Capital Corp. | Partners, LP | Capital Corp. | ||||||||||||||
| Standalone | Consolidated | Eliminations | Consolidated | |||||||||||||
| Investment income | ||||||||||||||||
| Interest income: | ||||||||||||||||
| Companies less than 5% owned | $ | - | $ | 60,323,117 | $ | - | $ | 60,323,117 | ||||||||
| Companies 5% to 25% owned | - | 5,445,021 | - | 5,445,021 | ||||||||||||
| Companies more than 25% owned | - | 1,210,926 | - | 1,210,926 | ||||||||||||
| Lease income: | ||||||||||||||||
| Companies 5% to 25% owned | - | 420,375 | - | 420,375 | ||||||||||||
| Companies more than 25% owned | - | 701,239 | - | 701,239 | ||||||||||||
| Other income: | ||||||||||||||||
| Companies less than 5% owned | - | 1,470,116 | - | 1,470,116 | ||||||||||||
| Companies 5% to 25% owned | - | 38,252 | - | 38,252 | ||||||||||||
| Companies more than 25% owned | - | - | - | - | ||||||||||||
| Total interest and related investment income | - | 69,609,046 | - | 69,609,046 | ||||||||||||
| Operating expenses | ||||||||||||||||
| Management and advisory fees | - | 8,820,229 | - | 8,820,229 | ||||||||||||
| Interest expense | - | 1,194,158 | - | 1,194,158 | ||||||||||||
| Amortization of deferred debt issuance costs | - | 852,618 | - | 852,618 | ||||||||||||
| Administration expenses | - | 849,228 | - | 849,228 | ||||||||||||
| Legal fees, professional fees and due diligence expenses | 397,529 | 400,039 | - | 797,568 | ||||||||||||
| Commitment fees | - | 292,671 | - | 292,671 | ||||||||||||
| Director fees | 95,926 | 192,410 | - | 288,336 | ||||||||||||
| Insurance expense | 62,901 | 126,238 | - | 189,139 | ||||||||||||
| Custody fees | 3,500 | 146,360 | - | 149,860 | ||||||||||||
| Other operating expenses | 472,481 | 394,872 | - | 867,353 | ||||||||||||
| Total expenses | 1,032,337 | 13,268,823 | - | 14,301,160 | ||||||||||||
| Net investment income (loss) before income taxes | (1,032,337 | ) | 56,340,223 | - | 55,307,886 | |||||||||||
| Excise tax expense | 977,624 | - | - | 977,624 | ||||||||||||
| Net investment income (loss) | (2,009,961 | ) | 56,340,223 | - | 54,330,262 | |||||||||||
| Net realized and unrealized gain (loss) on investments and foreign currency | ||||||||||||||||
| Net realized loss: | ||||||||||||||||
| Investments in companies less than 5% owned | - | (40,379,889 | ) | - | (40,379,889 | ) | ||||||||||
| Investments in companies 5% to 25% owned | - | (7,004,857 | ) | - | (7,004,857 | ) | ||||||||||
| Net change in unrealized appreciation/depreciation | - | 56,456,107 | - | 56,456,107 | ||||||||||||
| Net realized and unrealized gain | - | 9,071,361 | - | 9,071,361 | ||||||||||||
| Interest in earnings of subsidiary | 51,535,616 | - | (51,535,616 | ) | - | |||||||||||
| Dividends paid on Series A preferred equity facility | - | (1,516,585 | ) | - | (1,516,585 | ) | ||||||||||
| Net change in accumulated dividends on Series A preferred equity facility | - | 22,033 | - | 22,033 | ||||||||||||
| Distributions of incentive allocation to the General Partner from net investment income | - | - | (10,567,142 | ) | (10,567,142 | ) | ||||||||||
| Distributions of incentive allocation to the General Partner from net realized gains | - | - | (645,691 | ) | (645,691 | ) | ||||||||||
| Net change in reserve for incentive allocation | - | - | 1,168,583 | ) | (1,168,583 | ) | ||||||||||
| Net increase in net assets resulting from operations | $ | 49,525,655 | $ | 63,917,032 | $ | 63,917,032 | ) | $ | 49,525,655 | |||||||
| 105 |
TCP Capital Corp.
Consolidating Statement of Operations
Year Ended December 31, 2012
| TCP | Special Value | TCP | ||||||||||||||
| Capital Corp. | Continuation | Capital Corp. | ||||||||||||||
| Standalone | Partners, LP | Eliminations | Consolidated | |||||||||||||
| Investment income | ||||||||||||||||
| Interest income: | ||||||||||||||||
| Companies less than 5% owned | - | $ | 42,139,023 | - | $ | 42,139,023 | ||||||||||
| Companies 5% to 25% owned | - | 5,850,394 | - | 5,850,394 | ||||||||||||
| Companies more than 25% owned | - | 1,253,915 | - | 1,253,915 | ||||||||||||
| Dividend income: | ||||||||||||||||
| Companies 5% to 25% owned | - | 1,811,189 | - | 1,811,189 | ||||||||||||
| Lease income: | ||||||||||||||||
| Companies 5% to 25% owned | - | 332,964 | - | 332,964 | ||||||||||||
| Companies more than 25% owned | - | 490,066 | - | 490,066 | ||||||||||||
| Other income: | ||||||||||||||||
| Companies less than 5% owned | - | 289,073 | - | 289,073 | ||||||||||||
| Companies 5% to 25% owned | - | 26,135 | - | 26,135 | ||||||||||||
| Total interest and related investment income | - | 52,192,759 | - | 52,192,759 | ||||||||||||
| Operating expenses | ||||||||||||||||
| Management and advisory fees | 1,292 | 6,907,650 | - | 6,908,942 | ||||||||||||
| Professional fees relating to the Conversion | - | 411,523 | - | 411,523 | ||||||||||||
| Amortization of deferred debt issuance costs | - | 441,495 | - | 441,495 | ||||||||||||
| Legal fees, professional fees and due diligence expenses | 376,309 | 789,009 | - | 1,165,318 | ||||||||||||
| Commitment fees | - | 225,560 | - | 225,560 | ||||||||||||
| Director fees | 66,444 | 132,889 | - | 199,333 | ||||||||||||
| Interest expense | - | 190,702 | - | 190,702 | ||||||||||||
| Insurance expense | 43,279 | 86,861 | - | 130,140 | ||||||||||||
| Custody fees | 3,500 | 96,447 | - | 99,947 | ||||||||||||
| Other operating expenses | 181,971 | 437,490 | - | 619,461 | ||||||||||||
| Total operating expenses | 672,795 | 9,719,626 | - | 10,392,421 | ||||||||||||
| Net investment income (loss) before income taxes | (672,795 | ) | 42,473,133 | - | 41,800,338 | |||||||||||
| Excise tax expense | 1,479,978 | - | - | 1,479,978 | ||||||||||||
| Net investment income (loss) | (2,152,772 | ) | 42,473,133 | - | 40,320,360 | |||||||||||
| Net realized and unrealized gain (loss) on investments and foreign currency | ||||||||||||||||
| Net realized gain (loss): | ||||||||||||||||
| Investments in companies less than 5% owned | - | (29,574,293 | ) | - | (29,574,293 | ) | ||||||||||
| Investments in companies 5% to 25% owned | - | 13,584,105 | - | 13,584,105 | ||||||||||||
| Net realized loss | - | (15,990,188 | ) | - | (15,990,188 | ) | ||||||||||
| Net change in unrealized appreciation/depreciation | 28,086,083 | 3,205,937 | (28,086,083 | ) | 3,205,937 | |||||||||||
| Net realized and unrealized gain (loss) | 28,086,083 | (12,784,251 | ) | (28,086,083 | ) | (12,784,251 | ) | |||||||||
| Dividends paid on Series A preferred equity facility | - | (1,542,932 | ) | - | (1,542,932 | ) | ||||||||||
| Net change in accumulated dividends on Series A preferred equity facility | - | (59,867 | ) | - | (59,867 | ) | ||||||||||
| Net increase in net assets resulting from operations | $ | 25,933,310 | $ | 28,086,083 | $ | (28,086,083 | ) | $ | 25,933,310 | |||||||
| 106 |
| Item 9. | Changes in Disagreements with Accountants on Accounting and Financial Disclosure |
None
| Item 9A. | Controls and Procedures |
| (a) | Evaluation of Disclosure Controls and Procedures |
As of December 31, 2014 (the end of the period covered by this report), we, including our Chief Executive Officer and Chief Financial Officer, evaluated the effectiveness of the design and operation of our disclosure controls and procedures (as defined in Rule 13a-15(e) of the 1934 Act). Based on that evaluation, our management, including the Chief Executive Officer and Chief Financial Officer, concluded that our disclosure controls and procedures were effective and provided reasonable assurance that information required to be disclosed in our periodic SEC filings is recorded, processed, summarized and reported within the time periods specified in the SEC’s rules and forms, and that such information is accumulated and communicated to our management, including our Chief Executive Officer and Chief Financial Officer, as appropriate, to allow timely decisions regarding required disclosure. However, in evaluating the disclosure controls and procedures, management recognized that any controls and procedures, no matter how well designed and operated can provide only reasonable assurance of achieving the desired control objectives, and management necessarily was required to apply its judgment in evaluating the cost-benefit relationship of such possible controls and procedures.
| (b) | Management’s Report on Internal Control Over Financial Reporting |
Management is responsible for establishing and maintaining adequate internal control over financial reporting, and for performing an assessment of the effectiveness of internal control over financial reporting as of December 31, 2014. Internal control over financial reporting is a process designed by, or under the supervision of, our principal executive and principal financial officers, or persons performing similar functions, and effected by our Board of Directors, management and other personnel, to provide reasonable assurance regarding the reliability of financial reporting and the preparation of financial statements for external purposes in accordance with generally accepted accounting principles. Our internal control over financial reporting includes those policies and procedures that (i) pertain to the maintenance of records that in reasonable detail accurately and fairly reflect the transactions and dispositions of assets of the company; (ii) provide reasonable assurance that transactions are recorded as necessary to permit preparation of financial statements in accordance with generally accepted accounting principles, and that receipts and expenditures are being made only in accordance with authorizations; and (iii) provide reasonable assurance regarding prevention or timely detection of unauthorized acquisition, use, or disposition of our assets that could have a material effect on the financial statements. Because of its inherent limitations, internal control over financial reporting may not prevent or detect misstatements. Therefore, even those systems determined to be effective can provide only reasonable assurance with respect to financial statement preparation and presentation. Management performed an assessment of the effectiveness of our internal control over financial reporting as of December 31, 2014 based upon the criteria set forth in Internal Control—Integrated Framework issued by the Committee of Sponsoring Organizations of the Treadway Commission (“COSO”). Based on our assessment, management determined that our internal control over financial reporting was effective as of December 31, 2014.
| (c) | Changes in Internal Control Over Financial Reporting |
There have been no changes in our internal control over financial reporting (as defined in Rules 13a-15(f) and 15d-15(f) of the Exchange Act) during our most recently completed fiscal quarter, that have materially affected, or are reasonably likely to materially affect, our internal control over financial reporting.
| Item 9B. | Other Information |
None
| 107 |
| Item 10. | Directors, Executive Officers and Corporate Governance |
The information required by this item is contained in the Registrant’s definitive Proxy Statement for its 2015 Annual Stockholders Meeting to be filed with the Securities and Exchange Commission within 120 days after December 31, 2014 and is incorporated herein by reference.
| Item 11. | Executive Compensation |
The information required by this item is contained in the Registrant’s definitive Proxy Statement for its 2015 Annual Stockholders Meeting to be filed with the Securities and Exchange Commission within 120 days after December 31, 2014 and is incorporated herein by reference.
| Item 12. | Security Ownership of Certain Beneficial Owners and Management and Related Stockholder Matters |
The information required by this item is contained in the Registrant’s definitive Proxy Statement for its 2015 Annual Stockholders Meeting to be filed with the Securities and Exchange Commission within 120 days after December 31, 2014 and is incorporated herein by reference.
| Item 13. | Certain Relationships and Related Transactions, and Director Independence |
The information required by this item is contained in the Registrant’s definitive Proxy Statement for its 2015 Annual Stockholders Meeting to be filed with the Securities and Exchange Commission within 120 days after December 31, 2014 and is incorporated herein by reference.
| Item 14. | Principal Accountant Fees and Services |
The information required by this item is contained in the Registrant’s definitive Proxy Statement for its 2015 Annual Stockholders Meeting to be filed with the Securities and Exchange Commission within 120 days after December 31, 2014 and is incorporated herein by reference.
| 108 |
| Item 15. | Exhibits and Consolidated Financial Statement Schedules |
| a. | Documents Filed as Part of this Report |
The following reports and consolidated financial statements are set forth in Item 8:
| Page | |
| Report of Independent Registered Public Accounting Firm | 61 |
| Consolidated Statements of Assets and Liabilities as of December 31, 2014 and 2013 | 62 |
| Consolidated Statements of Investments as of December 31, 2014 and 2013 | 63 |
| Consolidated Statements of Operations for the years ended December 31, 2014, 2013 and 2012 | 73 |
| Consolidated Statements of Changes in Net Assets for the years ended December 31, 2014, 2013 and 2012 | 74 |
| Consolidated Statements of Cash Flows for the years ended December 31, 2014, 2013 and 2012 | 75 |
| Notes to Consolidated Financial Statements | 76 |
| Consolidated Schedules of Changes in Investments in Affiliates as of December 31, 2014 and 2013 | 98 |
| Consolidated Schedules of Restricted Securities of Unaffiliated Issuers as of December 31, 2014 and 2013 | 100 |
| Consolidating Statements of Assets and Liabilities as of December 31, 2014 and 2013 | 102 |
| Consolidating Statements of Operations for the years ended December 31, 2014, 2013 and 2012 | 104 |
| b. | Exhibits |
The following exhibits are filed as part of this report or hereby incorporated by reference to exhibits previously filed with the SEC:
| Number | Description | |
| 3.1 | Articles of Incorporation of the Registrant (1) | |
| 3.2 | Bylaws of the Registrant (2) | |
| 10.1 | Form of Investment Management Agreement By and Between Registrant and Tennenbaum Capital Partners, LLC (3) | |
| 10.2 | Form of Amended and Restated Investment Management Agreement By and Between Special Value Continuation Partners, LP and Tennenbaum Capital Partners, LLC (4) | |
| 10.3 | Form of Administration Agreement of the Registrant (5) | |
| 10.4 | Custodial Agreement dated as of July 31, 2006 (6) | |
| 10.5 | Form of Transfer Agency and Registrar Services Agreement (7) | |
| 10.6 | Form of License Agreement (8) | |
| 10.7 | Credit Agreement dated July 31, 2006 (9) | |
| 10.8 | Form of First Amendment to Credit Agreement dated February 28, 2011 (10) | |
| 10.9 | Form of Second Amendment to Credit Agreement dated September 18, 2013 (11) | |
| 10.10 | Form of Amended and Restated Partnership Agreement of Special Value Continuation Partners, LP (12) | |
| 10.11 | Form of Administration Agreement of Special Value Continuation Partners, LP (13) | |
| 10.12 | Form of Loan Financing and Servicing Agreement dated May 15, 2013 (14) | |
| 10.13 | Form of Amendment No. 1 to Loan Financing and Servicing Agreement dated August 13, 2013 (15) | |
| 10.14 | Form of Amendment No. 2 to Loan Financing and Servicing Agreement dated September 10, 2013 (16) | |
| 10.15 | Form of Sale and Contribution Agreement dated May 15, 2013 (17) | |
| 10.16 | Form of Co-Management Agreement of Special Value Continuation Partners, LP (18) | |
| 10.17 | Form of Amendment No. 3 to Loan Financing and Servicing Agreement, dated as of February 19, 2014, by and among TCPC Funding I, LLC, as borrower, each lender and agent from time to time party thereto, Deutsche Bank AG, New York Branch, as administrative agent, and Wells Fargo Bank, National Association, as collateral agent and collateral custodian(20) | |
| 10.18 | Form of Amendment No. 4 to Loan Financing and Servicing Agreement, dated as of June 9, 2014, by and among TCPC Funding I, LLC, as borrower, each lender and agent from time to time party thereto, Deutsche Bank AG, New York Branch, as administrative agent, and Wells Fargo Bank, National Association, as collateral agent and collateral custodian(21) | |
| 10.19 | Indenture, dated as of June 17, 2014, by and between the Registrant and U.S Bank National Association, as the Trustee(22) | |
| 10.20 | Form of Global Note of 5.25% Convertible Senior Notes Due 2019 (included as part of Exhibit (d)(4))(22) | |
| 11 | Computation of Per Share Earnings (included in the notes to the financial statements contained in this report) |
| 109 |
| 12 | Computation of Ratios (included in the notes to the financial statements contained in this report) | |
| 14.1 | Consolidated Code of Ethics of the Registrant and the Advisor (19) | |
| 21.1 | Subsidiaries of the Registrant* | |
| 31.1 | Certification of Chief Executive Officer Pursuant to Rule 13a-14(a) under the Securities Exchange Act of 1934* | |
| 31.2 | Certification of Chief Financial Officer Pursuant to Rule 13a-14(a) under the Securities Exchange Act of 1934* | |
| 32.1 | Certification of Chief Executive Officer and Chief Financial Officer Pursuant to Section 906 of the Sarbanes-Oxley Act of 2002 (18 U. S. C. 1350)* |
________________________
* Filed herewith.
| (1) | Incorporated by reference to Exhibit (a)(2) to the Registrant's Registration Statement under the Securities Act of 1933 (File No. 333-172669), on Form N-2, filed on May 13, 2011. |
| (2) | Incorporated by reference to Exhibit (b)(2) to the Registrant's Registration Statement under the Securities Act of 1933 (File No. 333-172669), on Form N-2, filed on May 13, 2011. |
| (3) | Incorporated by reference to Exhibit (g) to the Registrant's Registration Statement under the Securities Act of 1933 (File No. 333-172669), on Form N-2, filed on May 13, 2011. |
| (4) | Incorporated by reference to Exhibit (k)(8) to the Registrant's Registration Statement under the Securities Act of 1933 (File No. 333-172669), on Form N-2, filed on May 13, 2011. |
| (5) | Incorporated by reference to Exhibit (k)(1) to the Registrant's Registration Statement under the Securities Act of 1933 (File No. 333-172669), on Form N-2, filed on May 13, 2011. |
| (6) | Incorporated by reference to Exhibit 10.2 to Form 10-12G of Special Value Continuation Partners, LP (File No. 000-54393), filed May 6, 2011. |
| (7) | Incorporated by reference to Exhibit (k)(2) to the Registrant's Registration Statement under the Securities Act of 1933 (File No. 333-172669), on Form N-2, filed on March 5, 2012 |
| (8) | Incorporated by reference to Exhibit (k)(3) to the Registrant's Registration Statement under the Securities Act of 1933 (File No. 333-172669), on Form N-2, filed on March 5, 2012. |
| (9) | Incorporated by reference to Exhibit 10.5 to Form 10-12G of Special Value Continuation Partners, LP (File No. 000-54393), filed May 6, 2011. |
| (10) | Incorporated by reference to Exhibit 10.6 to Form 10-12G of Special Value Continuation Partners, LP (File No. 000-54393), filed May 6, 2011. |
| (11) | Incorporated by reference to Exhibit 10.01 to Registrant's Form 8-K, filed September 19, 2013. |
| (12) | Incorporated by reference to Exhibit (k)(6) to the Registrant's Registration Statement under the Securities Act of 1933 (File No. 333-172669), on Form N-2, filed on May 13, 2011. |
| (13) | Incorporated by reference to Exhibit (k)(9) to the Registrant's Registration Statement under the Securities Act of 1933 (File No. 333-172669), on Form N-2, filed on May 13, 2011. |
| (14) | Incorporated by reference to Exhibit 10.01 to Registrant's Form 8-K filed on May 17, 2013. |
| (15) | Incorporated by reference to Exhibit 10.02 to Registrant's Form 8-K filed on September 10, 2013. |
| (16) | Incorporated by reference to Exhibit 10.01 to Registrant's Form 8-K filed on September 10, 2013. |
| (17) | Incorporated by reference to Exhibit 10.02 to Registrant's Form 8-K filed on May 17, 2013. |
| (18) | Incorporated by reference to Exhibit (g)(2) to Special Value Continuation Partner, LP's Registration Statement under the Securities Act of 1933, as amended, on Form N-2 (File No. 811-21935), filed on October 31, 2006. |
| (19) | Incorporated by reference to Exhibit (r)(1) to the Registrant's Registration Statement under the Securities Act of 1933 (File No. 333-172669), on Form N-2, filed on March 5, 2012. |
| (20) | Incorporated by reference to Exhibit 10.01 of the Registrant's Form 8-K filed on February 21, 2014. |
| (21) | Incorporated by reference to Exhibit 10.01 of the Registrant's Form 8-K filed on June 9, 2014. |
| (22) | Incorporated by reference to Exhibit 4.1 of the Registrant's Form 8-K filed on June 17, 2014. |
| 110 |
Pursuant to the requirements of Section 13 or 15(d) of the Securities Act of 1934, the Registrant has duly caused this report to be signed on its behalf by the undersigned, there unto duly authorized.
| TCP Capital Corp. | |
| By: | |
| /s/ Howard M. Levkowitz | |
| Howard M. Levkowitz | |
| Chief Executive Officer |
Pursuant to the requirements of the Securities Exchange Act of 1934, this report has been signed below by the following persons on behalf of the registrant and in the capacity and on the dates indicated.
| Date | Signature | Title | ||
| March 10, 2015 |
/s/ Howard M. Levkowitz |
Chief Executive Officer, Chairman of | ||
| Howard M. Levkowitz | the Board and Director (Principal | |||
| Executive Officer) | ||||
| March 10, 2015 | /s/ Eric J. Draut | Director | ||
| Eric J. Draut | ||||
| March 10, 2015 | /s/ Franklin R. Johnson | Director | ||
| Franklin R. Johnson | ||||
| March 10, 2015 | /s/ Peter E. Schwab | Director | ||
| Peter E. Schwab | ||||
| March 10, 2015 | /s/ Rajneesh Vig | President | ||
| Rajneesh Vig | ||||
| March 10, 2015 | /s/ Paul L. Davis | Chief Financial Officer (Principal | ||
| Paul L. Davis | Financial Officer) |
| 111 |