TELEPHONE & DATA SYSTEMS INC /DE/
10-Ks and 10-Qs
|
|
|
|
|
|
|
|
|
|
|
|
|
|
|
|
|
|
|
|
|
|
|
|
|
|
|
|
|
|
|
|
|
|
|
|
|
|
|
|
|
|
|
|
|
|
|
|
|
|||||||||||||||||
UNITED STATES
SECURITIES AND EXCHANGE COMMISSION
Washington, D.C. 20549
FORM 10-K
(Mark One)
|
[x]
|
ANNUAL REPORT PURSUANT TO SECTION 13 OR 15(d) OF THE SECURITIES EXCHANGE ACT OF 1934
|
For the
fiscal year ended
December 31, 2018
OR
|
[ ]
|
TRANSITION REPORT PURSUANT TO SECTION 13 OR 15(d) OF THE SECURITIES EXCHANGE ACT OF 1934
|
|
For the transition period from to
|
|
Commission file number 001-14157

TELEPHONE AND DATA SYSTEMS, INC.
(Exact name of Registrant as specified in its charter)
|
Delaware
|
36-2669023
|
||||||||||||||||
|
(State or other jurisdiction of incorporation or organization)
|
(IRS Employer Identification No.)
|
||||||||||||||||
30 North LaSalle Street, Suite 4000, Chicago, Illinois 60602
(Address of principal executive offices) (Zip code)
Registrant’s telephone number, including area code: (312) 630-1900
Securities registered pursuant to Section 12(b) of the Act:
|
Title of each class
|
Name of each exchange on which registered
|
||||||||||||||||
|
Common Shares, $.01 par value
|
New York Stock Exchange
|
||||||||||||||||
|
6.625% Senior Notes due 2045
|
New York Stock Exchange
|
||||||||||||||||
|
6.875% Senior Notes due 2059
|
New York Stock Exchange
|
||||||||||||||||
|
7.000% Senior Notes due 2060
|
New York Stock Exchange
|
||||||||||||||||
|
5.875% Senior Notes due 2061
|
New York Stock Exchange
|
||||||||||||||||
Securities registered pursuant to Section 12(g) of the Act: None
|
|
Yes
|
No
|
|
Indicate by check mark if the registrant is a well-known seasoned issuer, as defined in Rule 405 of the Securities Act.
|
[x]
|
[ ]
|
|
|
|
|
|
Indicate by check mark if the registrant is not required to file reports pursuant to Section 13 or Section 15(d) of the Exchange Act.
|
[ ]
|
[x]
|
|
|
|
|
|
Indicate by check mark whether the registrant (1) has filed all reports required to be filed by Section 13 or 15(d) of the Securities Exchange Act of 1934 during the preceding 12 months (or for such shorter period that the registrant was required to file such reports), and (2) has been subject to such filing requirements for the past 90 days.
|
[x]
|
[ ]
|
|
|
|
|
|
Indicate by check mark whether the registrant has submitted electronically every Interactive Data File required to be submitted pursuant to Rule 405 of Regulation S-T during the preceding 12 months (or for such shorter period that the registrant was required to submit such files).
|
[x]
|
[ ]
|
|
|
|
|
|
Indicate by check mark if disclosure of delinquent filers pursuant to Item 405 of Regulation S-K is not contained herein, and will not be contained, to the best of registrant's knowledge, in definitive proxy or information statements incorporated by reference in Part III of this Form 10-K or any amendment to this Form 10-K.
|
[ ]
|
|
|
|
|
|
|
Indicate by check mark whether the registrant is a large accelerated filer, an accelerated filer, a non-accelerated filer, a smaller reporting company, or an emerging growth company. See the definitions of “large accelerated filer,” “accelerated filer,” “smaller reporting company,” and "emerging growth company" in Rule 12b-2 of the Exchange Act.
|
|||||
|
Large accelerated filer
|
[x]
|
|
Accelerated filer
|
[ ]
|
|
|
Non-accelerated filer
|
[ ]
|
Smaller reporting company
|
[ ]
|
||
|
|
|
|
Emerging growth company
|
[ ]
|
|
|
|
|
|
|
|
|
|
If an emerging growth company, indicate by check mark if the registrant has elected not to use the extended transition period for complying with any new or revised financial accounting standards provided pursuant to Section 13(a) of the Exchange Act.
|
[ ]
|
||||
|
|
|
|
|
Yes
|
No
|
|
Indicate by check mark whether the registrant is a shell company (as defined in Rule 12b-2 of the Exchange Act).
|
[ ]
|
[x]
|
|||
As of
June 30, 2018
, the aggregate market values of the registrant’s Common Shares and Series A Common Shares held by non-affiliates were approximately
$2 billion
and
$2 million
, respectively. For purposes hereof, it was assumed that each director, executive officer and holder of 10% or more of any class of voting equity security of Telephone and Data Systems, Inc. (TDS) is an affiliate. The
June 30, 2018
, closing price of the Common Shares was
$27.42
as reported by the New York Stock Exchange. Because trading in the Series A Common Shares is infrequent, the registrant has assumed for purposes hereof that each Series A Common Share has a market value equal to one Common Share because the Series A Common Shares are convertible on a share-for-share basis into Common Shares.
The number of shares outstanding of each of the registrant’s classes of common stock, as of
January 31, 2019
, is
106,539,000
Common Shares, $.01 par value, and
7,284,900
Series A Common Shares, $.01 par value.
DOCUMENTS INCORPORATED BY REFERENCE
Those sections or portions of the registrant's
2018
Annual Report to Shareholders (Annual Report), filed as Exhibit 13 hereto, and of the registrant’s Notice of Annual Meeting of Shareholders and Proxy Statement (Proxy Statement) to be filed prior to
April 30, 2019
, for the
2019
Annual Meeting of Shareholders scheduled to be held May 23, 2019, are herein incorporated by reference into Parts II and III of this report.
|
|
|||||||||||||||||
Telephone and Data Systems, Inc.
Annual Report on Form 10-K
For the Period Ended
December 31, 2018
TABLE OF CONTENTS
|
Page No.
|
||||
|
|
||||
|
|
||||
|
|
||||
|
|
||||
|
|
||||
|
|
||||
|
|
|
|||
|
|
||||
|
|
||||
|
|
||||
|
|
||||
|
|
||||
|
|
||||
|
|
||||
|
|
||||
|
|
||||
|
|
|
|||
|
|
|
|||
|
|
||||
|
|
||||
|
|
||||
|
|
||||
|
|
||||
|
|
|
|
||
|
|
||||
|
|
||||
|
|
||||
|
Telephone and Data Systems, Inc.
30 NORTH LASALLE STREET, SUITE 4000,
CHICAGO, ILLINOIS 60602
TELEPHONE (312) 603-1900
|

|
PART I
Item 1. Business
Telephone and Data Systems, Inc. (TDS) is a diversified telecommunications company providing high-quality communications services to customers with
5.0 million
wireless connections and
1.2 million
wireline and cable connections at
December 31, 2018
. TDS conducts all of its wireless operations through its majority-owned subsidiary, United States Cellular Corporation (U.S. Cellular). As of
December 31, 2018
, TDS owned
82%
of the combined total of the outstanding Common Shares and Series A Common Shares of U.S. Cellular and controlled
96%
of the combined voting power of both classes of U.S. Cellular common stock. TDS provides broadband, video and voice services through its wholly-owned subsidiary, TDS Telecommunications LLC (TDS Telecom). TDS was incorporated in 1968 and is incorporated in Delaware. TDS Common Shares trade under the ticker symbol “TDS” on the New York Stock Exchange (NYSE). U.S. Cellular Common Shares trade on the NYSE under the ticker symbol “USM.”
Under listing standards of the NYSE, TDS is a “controlled company” as such term is defined by the NYSE. TDS is a controlled company because over 50% of the voting power for the election of directors of TDS is held by the trustees of the TDS Voting Trust.
TDS has three business segments: U.S. Cellular and TDS Telecom’s Wireline and Cable. TDS operations also include the operations of its wholly-owned hosted and managed services (HMS) subsidiary, which operates under the OneNeck IT Solutions brand, and its wholly-owned printing subsidiary Suttle-Straus, Inc. (Suttle-Straus). HMS' and Suttle-Straus’ financial results were not significant to TDS’ operations. All of TDS’ segments operate only in the United States, except for HMS, which includes an insignificant foreign operation.
TDS re-evaluated internal reporting roles with regard to its HMS business unit and, as a result, changed its reportable segments. Effective January 1, 2018, HMS was considered a non-reportable segment and is no longer being reported under TDS Telecom. Additional information about TDS’ segments is incorporated herein by reference from Note
18
—
Business Segment Information
in TDS’ Annual Report to Shareholders, filed as Exhibit 13 hereto.
The map below highlights TDS’ consolidated areas of operations:

1
U.S. CELLULAR OPERATIONS
General
U.S. Cellular, incorporated under the state laws of Delaware in 1983, provides wireless telecommunications services to customers with
5.0 million
connections in
22
states collectively representing a total population of
31 million
. U.S. Cellular operates in one reportable segment, and all of its wireless operating markets are in the United States. U.S. Cellular’s strategy is to attract and retain wireless customers through a value proposition comprised of a high-quality network, outstanding customer service, and competitive devices, plans, and pricing, all provided with a local focus.
Customers, Services and Products
Customers.
U.S. Cellular provides service to postpaid and prepaid customers from a variety of demographic segments. U.S. Cellular focuses on retail consumers, government entities, and small-to-mid-size business customers in industries such as construction, retail, agriculture, professional services and real estate. These customers are served primarily through U.S. Cellular’s retail and direct sales channels. U.S. Cellular builds customer loyalty by offering high-quality network services, outstanding customer-focused support services, competitive pricing, and other benefits as discussed further in “Marketing, Customer Service, and Sales and Distribution Channels” below.
Services.
U.S. Cellular’s customers are able to choose from a variety of national plans with voice, messaging and data usage options and pricing that are designed to fit different customer needs, usage patterns and budgets. Helping a customer find the right plan is an important element of U.S. Cellular’s brand positioning. In 2018, U.S. Cellular introduced the Unlimited with Payback plan that provides a monthly bill credit to postpaid customers if they have used less than 3 gigabytes of data per line. U.S. Cellular’s national plans price all domestic calls as local calls, regardless of where they are made or received in the United States, with no long distance or roaming charges, made possible by roaming agreements with other wireless carriers. See “Network Technology, Roaming, and System Design” section below for further discussion related to roaming.
U.S. Cellular’s portfolio of smartphones, tablets and other connected devices is a key part of its strategy to deliver wireless devices that allow customers to stay productive, entertained and connected on the go; these devices are backed by U.S. Cellular’s high-speed fourth generation (4G) Long-Term Evolution (LTE) network. U.S. Cellular’s 4G LTE network features smartphone messaging, data and internet services that allow customers to access the internet; text, picture and video message; utilize GPS navigation; and browse and download thousands of applications to customize their wireless devices to fit their lifestyles. U.S. Cellular’s Voice over Long-Term Evolution (VoLTE) technology, which has been launched successfully in multiple markets, enables customers to utilize the 4G LTE network for both voice and data services, and offers enhanced services such as high definition voice and simultaneous voice and data sessions. U.S. Cellular also offers advanced wireless solutions to consumers and business and government customers, including a growing suite of connected machine-to-machine (M2M) solutions and software applications across the categories of monitor and control (e.g., sensors and cameras), business automation/operations (e.g., e-forms), communication (e.g., enterprise messaging, back-up router for business continuity services) and asset management (e.g., telematics, fleet management). U.S. Cellular intends to continue to further enhance these offerings for customers in 2019 and beyond.
Devices and Products.
U.S. Cellular offers a comprehensive range of wireless devices such as handsets, tablets, mobile hotspots, home phones and routers for use by its customers. U.S. Cellular offers wireless devices that are compatible with its 4G LTE and third generation (3G) networks and are compliant with the Federal Communications Commission (FCC) enhanced wireless 911 requirements. In addition, U.S. Cellular also offers a wide range of accessories, including wireless essentials such as cases, screen protectors, chargers, and memory cards as well as an assortment of consumer electronics such as headphones, smart speakers, wearables and home automation products (e.g., cameras, sensors, and thermostats).
Throughout 2018, new postpaid handset sales to retail consumers were made primarily under equipment installment plans (EIP); business and government customers may continue to purchase equipment under alternative plans subject to a service contract. For certain installment plans, after a specified period of time or number of payments, the customer may have the right to upgrade to a new device prior to reaching the end of the installment term, thus enabling customers to access the latest smartphones and provide a better overall customer experience.
U.S. Cellular also offers accessories for purchase on installment plans. These plans allow new and existing postpaid customers to purchase certain accessories payable over a specified time period. These accessory installment plans are available through U.S. Cellular company-owned retail stores, telesales channels, and agent channels using direct fulfillment with U.S. Cellular’s inventory.
U.S. Cellular continues to offer device service programs that provide customers a simple process to replace a defective device. U.S. Cellular also offers its Trade-In program where U.S. Cellular buys consumers’ used equipment, Device Protection+ program, which includes overnight delivery of a replacement device for damaged, lost and stolen devices, Device Protection+ Advanced program, which includes 100GB of data backup, TechSupport+, and AppleCare services for Apple iOS customers.
U.S. Cellular offers a full array of iconic smartphones with options for both Android and iOS customers. U.S. Cellular continues to bolster its expanding smartphone portfolio with the Samsung Galaxy S® 9/9+ and Note 9, the iPhone® XS/XS Max and XR, the LG V40 ThinQ, and the Motorola Z3 Play. Along with the iconic devices, U.S. Cellular supports the larger ecosystem of Samsung and Apple devices, such as the Samsung Galaxy Watch, the Samsung Gear Sport and the Apple Watch Series 4. For tablets, U.S. Cellular offers the full complement of iPads and the Samsung Galaxy Tab series. U.S. Cellular’s smartphone offerings play a significant role in attracting customers and driving data service usage and revenues. U.S. Cellular also offers additional services and products that utilize U.S. Cellular's network, including feature phones, mobile hotspots, LTE wireless routers, LTE wireless cameras, and home phones.
2
U.S. Cellular purchases wireless devices and accessory products from a number of original equipment manufacturers and distributors, including Samsung, Apple, Motorola, LG, Kyocera, Inseego, Netgear, Tessco, Voicecomm and Superior. U.S. Cellular manages relationships with its suppliers to ensure best possible pricing and identifies opportunities for promotional support. U.S. Cellular does not own significant product warehousing and distribution infrastructure; rather, it contracts with third party providers for the majority of its product warehousing, distribution and direct customer fulfillment activities. U.S. Cellular also contracts with third party providers for services related to its device service programs.
U.S. Cellular continuously monitors the financial condition of its wireless device and accessory suppliers. Since U.S. Cellular has a diversified portfolio of products from more than one supplier, U.S. Cellular does not expect the financial condition of any single supplier to affect its ability to offer a competitive portfolio of wireless devices and accessories for sale to customers.
Marketing, Customer Service, and Sales and Distribution Channels
Marketing and Advertising.
U.S. Cellular’s marketing plan is focused on acquiring, retaining and growing customer relationships by maintaining a high-quality wireless network, providing outstanding customer service, and offering a comprehensive portfolio of services and products built around customer needs at fair prices with a local focus. U.S. Cellular believes that creating positive relationships with its customers enhances their wireless experience and builds customer loyalty. U.S. Cellular currently offers several customer-centric programs and services to customers.
To attract potential new customers and retain existing customers, and increase their usage of U.S. Cellular’s services, U.S. Cellular’s advertising is directed at increasing the public awareness of the U.S. Cellular brand, knowledge of the outstanding network that works in places where other carriers do not have coverage, and understanding of the wireless services it offers. U.S. Cellular supplements its advertising with a focused public relations program that improves overall brand sentiment and awareness, encourages engagement, supports sales of services and products, and builds preference and loyalty for the U.S. Cellular brand. The approach combines national and local media relations in mainstream and social media channels with market-wide activities, events, and sponsorships.
U.S. Cellular focuses its charitable giving on initiatives relevant to consumers in its service areas. These initiatives include programs that focus on STEM (Science, Technology, Engineering and Math) activities for youth in the communities U.S. Cellular serves and often involve collaboration with organizations such as the Boys and Girls Clubs of America.
Customer Service.
U.S. Cellular manages customer retention by focusing on outstanding customer service through the development of processes that are customer-friendly, extensive training of frontline sales and support associates and the implementation of retention programs.
U.S. Cellular currently operates four regional customer care centers in its operating markets with personnel who are responsible for customer service activities, and a national financial services center with personnel who perform credit and other customer payment activities. U.S. Cellular also contracts with third parties that provide additional customer care and financial services support.
Sales and Distribution Channels.
U.S. Cellular supports a multi-faceted distribution program, including retail sales, direct sales, third-party national retailers, and independent agents, plus a website and telesales.
Company retail store locations are designed to market wireless services and products to the consumer and small business segments in a setting familiar to these types of customers. As of
December 31, 2018
, retail sales associates work in 259 U.S. Cellular-operated retail stores and kiosks. Direct sales representatives sell traditional wireless services as well as Internet of Things (IoT) and M2M products and solutions to medium- and large-sized businesses and government entities. Additionally, the U.S. Cellular website enables customers to purchase wireless devices online.
U.S. Cellular maintains an ongoing training program to improve the effectiveness of retail sales associates and direct sales representatives by focusing their efforts on obtaining customers by facilitating the sale of appropriate packages for the customer’s expected usage and value-added services that meet the individual needs of the customer.
U.S. Cellular has relationships with exclusive and non-exclusive agents (collectively “agents”), which are independent businesses that obtain customers for U.S. Cellular on a commission basis. At
December 31, 2018
, U.S. Cellular had contracts with these businesses aggregating 436 locations. U.S. Cellular provides support and training to its agents to increase customer satisfaction and to ensure a consistent customer experience. U.S. Cellular’s agents are generally in the business of selling wireless devices, wireless service packages and other related products. No single agent accounted for 10% or more of U.S. Cellular’s operating revenues during the past three years.
U.S. Cellular services and products also are offered through third-party national and on-line retailers. Wal-Mart, Sam’s Club, Family Dollar and Dollar General offer U.S. Cellular services and products at select retail locations in U.S. Cellular’s service areas. U.S. Cellular continues to explore new relationships with additional third-party retailers as part of its strategy to expand distribution.
Seasonality.
Seasonality in operating expenses may cause operating income to vary from quarter to quarter. U.S. Cellular’s operating expenses tend to be higher in the fourth quarter due to increased marketing and promotional activities during the holiday season.
3
Competition
The wireless telecommunication industry is highly competitive. U.S. Cellular competes directly with several wireless service providers in each of its markets. In general, there are between two and four competitors in each wireless market in which U.S. Cellular provides service, excluding resellers and mobile virtual network operators (MVNO). In its footprint, U.S. Cellular competes to varying degrees against each of the national wireless companies: Verizon Wireless, AT&T Mobility, Sprint, and T-Mobile USA, in addition to a few smaller regional carriers in specific areas of its footprint. All of the national competitors have substantially greater financial and other resources than U.S. Cellular. In addition, U.S. Cellular competes with other companies that use alternative communication technology and services to provide similar services and products.
Since each of these wireless competitors operates on systems using spectrum licensed by the FCC and has comparable technology and facilities, competition among wireless service providers for customers is principally on the basis of types of services and products, price, size of area covered, network quality, network speed and responsiveness of customer service. U.S. Cellular employs a customer satisfaction strategy that includes maintaining an outstanding wireless network throughout its markets. U.S. Cellular owns and operates low-band spectrum (less than 1 GHz) that covers the majority of its footprint and enables more efficient coverage in rural areas (compared to spectrum above 1 GHz), which strengthens its network quality positioning. To the extent existing competitors or new entrants hold or acquire such spectrum in U.S. Cellular markets, U.S. Cellular could face increased competition over time. In addition, industry deployment of fifth generation (5G) technology could introduce increased competition from industry participants on bases such as network speed and new product offerings.
The use of national advertising and promotional programs by the top four wireless service providers is a source of additional competitive and pricing pressures in all U.S. Cellular markets, even if those operators do not provide direct service in a particular market. Over the past year, competition among top carriers has continued to be robust, with the top four carriers offering unlimited plans as well as device price reductions. In addition, in the current wireless environment, U.S. Cellular’s ability to compete depends on its ability to continue to offer national voice and data plans. U.S. Cellular provides wireless services comparable to the national competitors, but the national wireless companies operate in a wider geographic area and are able to provide such services over a wider area on their own networks than U.S. Cellular can offer on its network. Although U.S. Cellular offers similar coverage area as these competitors, U.S. Cellular incurs roaming charges for data sessions and calls made in portions of the coverage area which are not part of its network, thereby increasing its cost of operations. U.S. Cellular depends on roaming agreements with other wireless carriers to provide voice and data roaming capabilities in areas not covered by U.S. Cellular’s network. Similarly, U.S. Cellular provides roaming services on its network to other wireless carriers’ customers who travel within U.S. Cellular’s coverage areas and receives revenue from other carriers for the provision of these services.
Convergence of connectivity is taking place on many levels, including wireless devices that can act as wireless or wireline replacement devices and the incorporation of wireless “hot spot” technology in wireless devices making internet access seamless regardless of location. Although less directly a substitute for other wireless services, wireless data services such as Wi-Fi may be adequate for those who do not need mobile wide-area roaming or full two-way voice services. If the trend toward convergence continues, U.S. Cellular is at a competitive disadvantage to larger competitors, including the national wireless carriers, traditional cable companies, MVNOs and other potential large new entrants with much greater financial and other resources in adapting to such convergence. Cable companies have begun to compete in the wireless market. Most notably, Comcast and Charter currently offer wireless services.
U.S. Cellular’s approach in 2019 and in future years will be to focus on the unique needs and attitudes of its customers towards wireless service. U.S. Cellular will deliver high-quality services and products at competitive prices and intends to continue to differentiate itself by seeking to provide an overall outstanding customer experience, founded on a high-quality network. U.S. Cellular’s ability to compete successfully in the future will depend upon its ability to anticipate and respond to changes related to new service offerings, consumer preferences, competitors’ pricing strategies and new product offerings, technology, demographic trends, economic conditions and its access to adequate spectrum resources.
Network Technology, Roaming, and System Design
Technology.
Wireless telecommunication systems transmit voice, data, graphics and video through the transmission of signals over networks of radio towers using radio spectrum licensed by the FCC. Access to local, regional, national and worldwide telecommunications networks is provided through system interconnections. A high-quality network, supported by continued investments in that network, will remain an important factor for U.S. Cellular to remain competitive.
VoLTE technology allows customers to utilize a 4G LTE network for both voice and data services, and offers enhanced services such as high definition voice and simultaneous voice and data sessions. In addition, the deployment of VoLTE technology expands U.S. Cellular’s ability to offer roaming services to other wireless carriers. VoLTE technology has been launched successfully in California, Iowa, Oregon, Washington and Wisconsin, and deployments in several additional operating markets will occur in 2019.
5G technology is expected to help address customers’ growing demand for data services as well as create opportunities for new services requiring high speed and reliability as well as low latency. U.S. Cellular is committed to continuous technology innovation and continues to prepare for deployment of 5G technology beginning in 2019, including commencing a trial utilizing 5G standards and equipment on its core LTE network in the fourth quarter of 2018. U.S. Cellular is partnering with leading companies in the wireless infrastructure and handset ecosystem to provide rich 5G experiences for customers. In addition, in the markets where U.S. Cellular commercially deploys 5G technology, which will include communities of various sizes, customers using U.S. Cellular’s 4G LTE network will experience increased network speed due to U.S. Cellular's modernization efforts. The deployment of 5G technology will require substantial investments in spectrum and U.S. Cellular’s networks to remain competitive.
4
Roaming.
A secondary source of revenue for U.S. Cellular is from customers of other wireless operators who roam on its network. Inter-carrier roaming agreements are negotiated between the wireless operators to enable customers who are in a wireless service area other than the customer’s home service area to place or receive a call or text message, or to use data services, in that service area. U.S. Cellular has entered into reciprocal roaming agreements with operators of other wireless systems covering virtually all systems with Code Division Multiple Access (CDMA) technology in the United States. In addition, U.S. Cellular has entered into reciprocal 4G LTE roaming agreements with national wireless companies and, as a result, a majority of U.S. Cellular customers currently have access to nationwide 4G LTE service.
Another digital technology, Global System for Mobile Communication (GSM), has a larger installed base of customers worldwide. U.S. Cellular customers now have the ability to roam on GSM carriers with voice, data and text messaging in Canada, Mexico and internationally. Both CDMA and GSM technologies are being succeeded by 4G LTE, VoLTE and 5G technology.
System Design and Construction.
U.S. Cellular designs and constructs its systems in a manner it believes will permit it to provide high-quality service to substantially all types of compatible wireless devices. Designs are based on engineering studies which relate to specific markets, in support of the larger network. Network reliability is given careful consideration and extensive backup redundancy is employed in many aspects of U.S. Cellular’s network design. Route diversity, redundant equipment, ring topology and extensive use of emergency standby power also are used to enhance network reliability and minimize service disruption from any particular network element failure.
In accordance with its strategy of building and strengthening its operating market areas, U.S. Cellular has selected high-capacity, carrier-class digital wireless switching systems that are capable of serving multiple markets through a single mobile telephone switching office. Centralized equipment, used for network and data management, is located in high-availability facilities supported by multiple levels of power and network redundancy. U.S. Cellular’s systems are designed to incorporate Internet Protocol (IP) packet-based Ethernet technology, which allows for increased data capacity and a more efficient network. Interconnection between the mobile telephone switching office and the cell sites utilizes Ethernet technology for nearly all 4G LTE sites, over fiber or microwave links.
As a result of increasing demand for high–speed data and the deployment of 5G technology, U.S. Cellular expects to acquire additional spectrum licenses and to make significant investments in its network to provide sufficient capacity and throughput.
Construction of wireless systems is capital-intensive, requiring substantial investment for land and improvements, buildings, towers, mobile telephone switching offices, cell site equipment, transport equipment, engineering and installation. U.S. Cellular primarily uses its own personnel to engineer each wireless system it owns and operates, and engages contractors to construct the facilities.
The costs (inclusive of the costs to acquire licenses) to develop the systems which U.S. Cellular operates have historically been financed primarily through proceeds from debt offerings, with cash generated by operations, and proceeds from the sales of wireless interests and other non-strategic assets.
Business Development Strategy
U.S. Cellular operates a regional wireless network. U.S. Cellular’s interests in wireless licenses include both direct interests whereby U.S. Cellular is the licensee and investment interests in entities which are licensees; together, these direct and investment interests involve operating and non-operating licenses covering 30 states and a total population of approximately 50 million at
December 31, 2018
.
U.S. Cellular’s business development strategy is to obtain interests in or access to wireless licenses in its current operating markets and in areas that are adjacent to or in close proximity to its other wireless licenses, thereby building larger geographic operating market areas. U.S. Cellular believes that the acquisition of additional licenses within its current operating markets will enhance its network capacity and speed to meet its customers’ growing demand for data services. From time to time, U.S. Cellular has divested outright or included in exchanges for other wireless interests certain consolidated and investment interests that were considered less essential to its current and expected future operations. As part of its business development strategy, U.S. Cellular may periodically be engaged in negotiations relating to the acquisition, exchange or disposition of companies, strategic properties, investment interests or wireless spectrum.
The FCC conducts auctions through which additional spectrum is made available for the provision of wireless services. Historically, U.S. Cellular has participated in certain FCC auctions both directly and indirectly through its limited partnership interests. At its open meeting on August 2, 2018, the FCC adopted a public notice establishing procedures for two auctions of Millimeter Wave spectrum licenses in the 28 GHz and 24 GHz bands. The 28 GHz auction (Auction 101), which commenced on November 14, 2018 and closed on January 24, 2019, offered two 425 MHz licenses in the 28 GHz band over portions of the United States that do not have incumbent licensees. The 24 GHz auction (Auction 102) will offer up to seven 100 MHz licenses in the 24 GHz band in Partial Economic Areas covering most of the United States. Upfront payments for Auction 102 were due by February 19, 2019, and bidding in Auction 102 is scheduled to begin on March 14, 2019. U.S. Cellular filed applications to participate in both auctions on September 18, 2018, and was announced as a qualified bidder for Auction 101 on October 31, 2018. The FCC has not announced qualified bidders for Auction 102. Also, at the open meeting on August 2, 2018, the FCC adopted a Further Notice of Proposed Rulemaking in preparation for an additional Millimeter Wave auction offering licenses in the 37, 39 and 47 GHz bands. FCC statements indicate plans to hold this auction in the second half of 2019. The spectrum auctioned in each of these Millimeter Wave auctions is expected to be used primarily to deliver 5G technology.
5
TDS TELECOM OPERATIONS
General
TDS Telecom operates Wireline and Cable subsidiaries that provide communications services to
1.2 million
connections. TDS Telecom’s business objective is to provide a wide range of communications services to both residential and commercial customers.
Growth Strategy
Both Wireline and Cable share a common growth strategy to provide high-speed data services bundled with video entertainment and voice services. In Wireline, TDS Telecom is focused on investing in fiber to the home technologies to provide high-speed internet services of up to 1 G
igabit per second (Gbps)
to new and existing markets. Increased fiber deployment provides the opportunity to deliver more robust residential and commercial products which drives future growth. F
iber builds in locations outside of its current markets allows TDS Telecom to target the most attractive markets to increase its total footprint. TDS Telecom has completed the construction of a fiber network in an initial out-of-territory market which has provided the basis for expanding this strategy. Therefore, several additional new locations are currently being built with fiber to expand its footprint into attractive markets that are underserved today.
Similarly, in its Cable markets, TDS Telecom is also focused on providing high-speed data services, offering up to 600 Megabits per second (Mbps) data speeds over its DOCSIS 3.0 network, and investing in fiber-to-home construction in new housing developments in these fast growing markets.
TDS Telecom may also seek to grow its operations through the acquisition of businesses that support and complement its existing
markets or create entirely new clusters of markets where TDS Telecom can succeed.
TDS Telecom intends to avoid markets served by other fiber overbuilders or municipalities which have constructed their own
networks with fiber to the home
.
Core Network
In order to provide IP-based services, TDS Telecom has developed and deployed an inter-regional data routing infrastructure using owned and leased fiber capacity which allows it to leverage its multi-terabit core network in both Wireline and Cable operations. This configuration, along with the continued development of an IP network that interconnects substantially all the existing service territories, allows for next generation IP service offerings.
The TDS Telecom core network continues to standardize equipment and processes to increase efficiency in maintaining its network. TDS Telecom utilizes centralized monitoring and management of its network to reduce costs and improve service reliability. Network standardization has aided TDS Telecom in operating its 24-hours-a-day / 7-days-per-week Network Management Center, which continuously monitors the network in an effort to proactively identify and correct network faults prior to any customer impact.
Wireline
Operations
TDS Telecom is a broadband-centric telecommunications company that operates as an Incumbent Local Exchange Carrier (ILEC) in 25 states and as a Competitive Local Exchange Carrier (CLEC) in Illinois, Michigan, Minnesota, New Hampshire, and Wisconsin. Wireline operations provide telecommunications services to both residential and commercial customers. Wireline also provides services to wholesale customers, which are primarily interexchange carriers (companies that provide long-distance telephone and data services between local exchange areas) and wireless carriers that compensate TDS Telecom for the use of its facilities to originate and terminate their voice and data transmissions. Wireline operations are located across nearly 900 rural, suburban, and metropolitan communities within the U.S, with the largest concentrations of customers in the Upper Midwest and the Southeast.
Customers, Services and Products
Wireline generates revenues by providing the following services and products:
|
▪
|
Broadband: Fiber technology is being deployed to select markets to provide internet speeds of up to 1 Gbps. In certain non-fiber markets, TDS Telecom is deploying fiber-to-the-node and copper-based vectoring / pair bonding technology to increase data speeds reaching up to 100 Mbps. Premium security and support services are available to enhance the customers’ high-speed internet experience.
|
|
▪
|
Video: TDS TV is a comprehensive all-digital TV service available in select TDS markets that provides customers with connected-home digital video recorders (DVR), video-on-demand (VOD), TV Everywhere (TVE) and other enhanced applications and features. Where TDS TV is not available, TDS Telecom partners with a satellite TV provider to offer digital television.
|
|
▪
|
Voice: Call plans include local and long-distance telephone service, VoIP and enhanced services like find me follow me, collaboration, instant messaging and more. Many features are bundled with calling plans to give customers the best value.
|
|
▪
|
Network access services are provided to interexchange and wireless carriers for transporting data and voice traffic on TDS Telecom’s network.
|
6
Wireline is focusing its investments on broadband as the core growth component of its service offerings. Wireline believes that its residential and business customers have a strong preference to purchase complementary telecommunications services from a single provider. The Wireline residential customer strategy is to provide broadband, video and voice services either individually or through value-added bundling of these services. Wireline has found that by delivering the best broadband speeds combined with a robust video experience, it can build customer loyalty and promote growth. The commercial focus is to provide a suite of advanced IP-based data and voice services to customers primarily ranging in size from sole proprietors to small- and medium-sized businesses.
To attract and retain customers in the video business, TDS Telecom is developing a next generation video platform called TDS TV+ which will enhance the customer experience by adding interfaces to mobile devices, personalized content recommendations, and network-based DVR functionality. TDS TV+ will be offered in its Wireline and Cable operations and will offer video content and features not available on existing TDS platforms.
Residential
. Wireline residential customer operations provide high-speed data, video and voice services. TDS Telecom features a wide range of reliable, affordable speeds to fit every lifestyle and every budget, including 1 Gbps internet. In selected residential markets, Wireline’s marketing and promotional strategies include a focus on its Internet Protocol Television (IPTV) service offering under the brand TDS TV. This IP based video offering is intended to counter intensifying competition for video services. In markets where IPTV is not offered, TDS Telecom has partnered with a satellite TV provider to allow for triple or double play bundling. Approximately 78% of ILEC customers have at least two services.
Commercial
. Wireline commercial customer operations provide broadband, IP-based services, and hosted voice and collaboration services to small- to medium-sized businesses. Wireline operations provide commercial customers with secure and reliable internet access, data connections and advanced voice service with VoIP features. TDS Telecom's commercial service focus is to lead with superior broadband bundled with a voice product from a suite of solutions.
Wholesale
. Wireline operations continue to provide a high level of service to traditional interexchange and wireless carriers. Wireline’s wholesale market focus is on access revenues, which is the compensation received from the interexchange carriers for carrying data and voice traffic on TDS Telecom’s networks. Federal Connect America Fund (CAF) and state Universal Service Fund (USF) revenues, which support the cost of providing telecommunication services in underserved high cost areas, are also included in wholesale service revenues.
In 2017, TDS began receiving $75 million per year for 10 years (with incremental funding for transition in the early years for certain states) for operating and maintaining its network along with the obligation to provide broadband service at various speeds to about 160,000 locations. In 2018, the FCC authorized and issued an order for TDS Telecom to receive an additional $3 million of support per year for ten years retroactive to January 2017. Continuing regulatory changes may affect the amounts of future Wireline wholesale revenues. See additional information in Risk Factors and information incorporated by reference from Exhibit 13 to this Form 10-K, Annual Report section “Regulatory Matters”.
Access Technology and System Design
Wireline operates an integrated, highly-reliable network that consists of central office host and remote sites, primarily equipped with digital and IP switches. Fiber optic and copper cable connect the host central offices with remote switches and ultimately with end customers. Wireline continues to upgrade and expand its telecommunications network to respond to the needs of its customers for greater bandwidth and advanced technologies. Broadband service is provided to 96% of Wireline’s ILEC service addresses. The network is transitioning from its legacy circuit-switched network to a highly reliable IP-based broadband network to facilitate the integration of broadband, video and voice services.
Wireline pursues a plan to deploy fiber-to-the-home technology, which enables significantly greater broadband speeds to selected residential subdivisions and to commercial customers, when the investment is economically justified. Fiber technology is deployed to provide internet speeds of up to 1 Gbps. In addition, in non-fiber markets, data speeds are increased through the use of fiber-to-the-node and copper bonding / vectoring technology. Approximately 49% of Wireline service addresses were capable of 25 Mbps or greater broadband speeds at the end of
2018
.
Competition
The competitive environment in the telecommunications industry has changed significantly as a result of technological advances, customer expectations, and changes to regulation. Wireline continues to seek to develop and maintain an efficient cost structure to ensure that it can compete with price-based initiatives from competitors. Wireline faces significant challenges, including competition from cable, low-cost voice providers, other wireline and wireless providers as well as decreases in compensation received for the use of TDS Telecom’s networks.
Wireline has experienced customer connection and access minute declines due to competition from wireless carriers offering local and nationwide voice and data plans, from cable providers offering voice and data services via cable modems, from fiber overbuilders, and from other low cost voice providers.
7
Cable companies have developed technological improvements that have allowed them to extend their competitive operations beyond major markets and have enabled them to provide a broader range of data and voice services over their cable networks. Cable companies have aggressively pursued the bundling of data, video and voice products at discounted prices to attract customers from traditional telephone companies. In addition, cable companies continue to add value to their internet offerings by increasing speeds at little to no additional cost to the customer. Wireline estimates that 80% of its ILEC service addresses face active competition from cable providers at
December 31, 2018
. Cable companies are increasingly targeting commercial customers.
Wireless telephone service providers offering feature-rich wireless devices and improved network quality constitute a significant source of voice and broadband competition. A growing segment of customers have chosen to completely forego the use of traditional wireline telephone service and instead rely solely on wireless service for voice communications services. This trend is more pronounced among residential customers, which comprise approximately 66% of Wireline connections as of
December 31, 2018
. Some small businesses have followed the residential path by choosing wireless service and disconnecting wireline voice service.
While TDS Telecom positions itself as a high-quality telecommunications provider, it is also experiencing competition from Regional Bell Operating Companies (RBOCs) in areas where TDS Telecom competes as a CLEC. Approximately 20% of TDS Telecom's customer connections are within CLEC operations. The RBOCs are continuing to implement technological changes that could impede TDS Telecom’s access to facilities used to provide CLEC telecommunications services. In addition, the RBOCs have petitioned the FCC to stop enforcing requirements that allow CLECs to access that infrastructure at wholesale rates. To mitigate these risks, TDS Telecom has refocused the business on serving customers who do not require leased facilities.
Cable
Operations
TDS Telecom entered the cable business with TDS' acquisition of Baja Broadband in 2013. Subsequently, in 2014, TDS acquired substantially all of the assets of a group of companies operating as BendBroadband, headquartered in Bend, Oregon. TDS Telecom’s cable business leverages its Wireline core competencies in network management and customer focus, and operates under two brand names: TDS Cable in Colorado, New Mexico, Texas, and Utah; and BendBroadband in Oregon.
Similar to Wireline, the Cable strategy is to expand its broadband services and leverage that growth by bundling with video and voice services. Through investment in plant upgrades and improvements in programming and customer service levels, TDS Telecom intends to strengthen its markets and continue to grow its revenue base.
Customers, Services and Products
Residential.
Cable offers advanced broadband, video and voice services. These services are actively bundled at competitive prices to encourage cross-selling within Cable’s customer base and to attract new customers. Approximately 56% of residential customers subscribe to a bundle of services.
|
•
|
Broadband: DOCSIS 3.0 technology is deployed to nearly all of Cable’s service addresses which allows it to offer enhanced transmission speeds. TDS Telecom is offering 600 Mbps in almost all its markets with up to 1 Gbps service available in select markets. Access to 24/7 technical support and security features is also provided to broadband customers. The implementation of DOCSIS 3.1 technology is currently underway and will offer significantly higher speeds of up to 1 Gbps.
|
|
•
|
Video: Customers have access to basic service, premium programming and high-definition television combined with DVR service. Cable introduced “CatchTV,” a branded whole-home DVR solution.
|
|
•
|
To attract and retain customers in the video business, TDS Telecom is developing a next generation video platform called TDS TV+ which will enhance the customer experience by adding interfaces to mobile devices, personalized content recommendations and network-based DVR functionality. TDS TV+ will be offered in its Wireline and Cable operations and will offer video content and features not available on existing TDS platforms.
|
|
•
|
Voice: Telephony service uses IP to transport digitized voice signals over the same private network that brings cable television and broadband services to customers. All residential voice service customers have access to direct international calling and can subscribe to various long distance plans.
|
Commercial.
Business services are delivered over a robust network to provide broadband products, multi-line phone solutions and video. Cable provides advanced business services, including data networking, Ethernet, broadband access and VoIP services, to small- and medium-sized businesses.
Access Technology and System Design
Cable’s telecommunication systems are designed to transmit broadband, video and voice services using a hybrid fiber-coaxial network that consists of optical fiber transport from a headend facility to nodes where coaxial cable is then used to reach residential and business customers. In certain markets, Cable has an all-fiber network to the home or business. These fiber-rich networks offer substantial bandwidth capacity and, through the use of DOCSIS 3.0 and next generation DOCSIS 3.1 technology, enable Cable to offer robust broadband and voice services as well as traditional and two-way video services. All Cable markets are connected to TDS Telecom’s core network. This allows Cable to leverage existing internet connectivity, voice services, and support systems, which enhances reliability and redundancy and builds greater dependability as a service provider.
8
Competition
The strategy of the Cable segment is focused on broadband to capitalize on the data needs of consumers. Cable seeks to be the leading provider of broadband and video services in its targeted markets. From a broadband perspective, Cable competes against the incumbent local telephone providers which primarily offer DSL-based services. Cable offers a superior, higher bandwidth data product using its DOCSIS technology. Video competition is primarily from satellite providers, and on a limited basis, telephone companies that offer video services and compete for broadband and voice customers. Other telecommunications providers, including internet-based VoIP providers and wireless providers may compete directly for both residential and commercial voice and broadband service customers. Changes in consumer behavior or new technologies or both could cause consumers to reduce or cancel their cable video services and instead seek to obtain video on demand over the internet or through new technologies. Cable systems are operated under non-exclusive franchises; therefore, competing cable systems may be built in the same area.
TDS — REGULATION
TDS’ operations are subject to federal, state and local regulation. Key regulatory considerations are discussed below.
U.S. Cellular
TDS provides various wireless services, including voice and data services, pursuant to licenses granted by the FCC. The construction, operation and transfer of wireless systems in the United States are regulated to varying degrees by the FCC pursuant to the Communications Act of 1934, as amended (Communications Act). The FCC currently does not require wireless carriers to comply with a number of statutory provisions otherwise applicable to common carriers that provide, originate or terminate interstate or international telecommunications. However, the FCC has enacted regulations governing construction and operation of wireless systems, licensing (including renewal of licenses) and technical standards for the provision of wireless services under the Communications Act.
Wireless licenses segmented by geographic areas are granted by the FCC. The completion of acquisitions, involving the transfer of control of all or a portion of a wireless system, requires prior FCC approval. The FCC determines on a case-by-case basis whether an acquisition of wireless licenses is in the public interest. Wireless licenses are granted generally for a ten year term or, in some cases, for a twelve or fifteen year term. The FCC establishes the standards for conducting comparative renewal proceedings between a wireless license holder seeking renewal of its license and challengers filing competing applications. All of U.S. Cellular’s licenses for which it applied for renewal since 1995 have been renewed. U.S. Cellular expects to continue to meet the criteria of the FCC’s license renewal process.
As part of its data services, U.S. Cellular provides internet access. Such internet access services may be subject to different regulatory requirements than other wireless services.
Although the Communications Act generally pre-empts state and local governments from regulating the entry of, or the rates charged by, wireless carriers, certain state and local governments regulate other terms and conditions of wireless services, including billing, termination of service arrangements, imposition of early termination fees, advertising, network outages, the use of handsets while driving, zoning, land use, privacy, data security and consumer protection. Further, the Federal Aviation Administration also regulates the siting, lighting and construction of transmitter towers and antennae.
Wireline
The FCC generally exercises jurisdiction over all facilities of, and services offered by, TDS Telecom’s ILECs as telecommunications common carriers, to the extent they provide, originate or terminate interstate or international telecommunications. State public utility commissions generally exercise jurisdiction over intrastate telecommunications facilities and services. In addition, the Wireline business is subject to various other state and local laws, including laws relating to privacy, data security and consumer protection.
The Communications Act requires, among other things, that telecommunications common carriers offer interstate services when requested at just and reasonable rates at terms and conditions that are non-discriminatory. Maximum rates for regulated interstate services are prescribed by the FCC. In many states, local rates paid by end user customers and intrastate access charges paid by carriers continue to be subject to state commission approval.
TDS Telecom’s CLEC operations are subject to similar but reduced regulation compared to ILECs.
In addition to traditional circuit-switched voice service that is fully regulated as a telecommunications common carrier service, TDS Telecom also provides interconnected VoIP, which is currently subject to less regulation.
Cable
As a cable multiple systems operator (MSO), Cable is subject to regulation by the FCC, covering matters such as technical operations, administrative requirements, consumer protection, access by people with disabilities, customer privacy and content. The operation of cable systems requires the MSO to obtain franchises from state or local governmental authorities to occupy public rights of way with network facilities. These franchises typically are nonexclusive and limited in time, contain various conditions and limitations, and provide for the payment of fees to the local authority, determined generally as a standard percentage of revenues.
TDS’ Cable operations also provide interconnected VoIP and broadband services, including internet access. The interconnected VoIP and internet regulatory matters and issues described above under “Wireline” are substantially similar for cable providers.
9
General
Reference is made to Exhibit 13 to this Form 10-K under “Regulatory Matters” for information regarding any significant recent developments and proposals relating to the foregoing regulatory matters.
TDS — OTHER ITEMS
Debt Securities
The following securities trade on the NYSE: TDS’ 6.625% Senior Notes due 2045 trade under the symbol “TDI,” TDS’ 6.875% Senior Notes due 2059 trade under the symbol “TDE,” TDS’ 7.0% Senior Notes due 2060 trade under the symbol “TDJ” and TDS’ 5.875% Senior Notes due 2061 trade under the symbol “TDA.”
Employees
TDS had approximately
9,400
full-time and part-time employees as of
December 31, 2018
, less than
1%
of whom were represented by labor organizations. TDS considers its relationship with its employees to be good.
Location and Company Information
TDS executive offices are located at 30 North LaSalle Street, Suite 4000, Chicago, Illinois 60602. TDS’ telephone number is 312-630-1900. TDS’ website address is www.tdsinc.com. TDS files with, or furnishes to, the Securities and Exchange Commission (SEC) annual reports on Form 10-K, quarterly reports on Form 10-Q, current reports on Form 8-K, as well as various other information. Investors may access, free of charge, through the Investor Relations portion of the website, TDS' annual reports on Form 10-K, quarterly reports on Form 10-Q, current reports on Form 8-K and amendments to such reports filed or furnished pursuant to Section 13(a) or 15(d) of the Securities Exchange Act of 1934, as amended (Exchange Act), as soon as reasonably practical after such material is filed electronically with the SEC. The public may also view electronic filings of TDS by accessing SEC filings at www.sec.gov.
U.S. Cellular executive offices are located at 8410 West Bryn Mawr Avenue, Chicago, Illinois 60631. U.S. Cellular’s telephone number is 773-399-8900. U.S. Cellular’s website address is www.uscellular.com. U.S. Cellular files with, or furnishes to, the SEC annual reports on Form 10-K, quarterly reports on Form 10-Q, current reports on Form 8-K, as well as various other information. Investors may access, free of charge, through the Investor Relations portion of the website, U.S. Cellular’s annual reports on Form 10-K, quarterly reports on Form 10-Q, current reports on Form 8-K, and amendments to such reports filed or furnished pursuant to Section 13(a) or 15(d) of the Exchange Act as soon as reasonably practical after such material is filed electronically with the SEC. The public may also view electronic filings of U.S. Cellular by accessing SEC filings at www.sec.gov.
10
Item 1A. Risk Factors
PRIVATE SECURITIES LITIGATION REFORM ACT OF 1995
SAFE HARBOR CAUTIONARY STATEMENT
This Annual Report on Form 10-K, including exhibits, contains statements that are not based on historical facts and represent forward-looking statements, as this term is defined in the Private Securities Litigation Reform Act of 1995. All statements, other than statements of historical facts, that address activities, events or developments that TDS intends, expects, projects, believes, estimates, plans or anticipates will or may occur in the future are forward-looking statements. The words “believes,” “anticipates,” “estimates,” “expects,” “plans,” “intends,” “projects” and similar expressions are intended to identify these forward-looking statements, but are not the exclusive means of identifying them. Such forward-looking statements involve known and unknown risks, uncertainties and other factors that may cause actual results, events or developments to be significantly different from any future results, events or developments expressed or implied by such forward-looking statements. Such risks, uncertainties and other factors include those set forth below under “Risk Factors” in this Form 10-K. Each of the following risks could have a material adverse effect on TDS’ business, financial condition or results of operations. However, such factors are not necessarily all of the important factors that could cause actual results, performance or achievements to differ materially from those expressed in, or implied by, the forward-looking statements contained in this document. Other unknown or unpredictable factors also could have material adverse effects on future results, performance or achievements. TDS undertakes no obligation to update publicly any forward-looking statements whether as a result of new information, future events or otherwise. You should carefully consider the following risk factors and other information contained in, or incorporated by reference into, this Form 10-K to understand the material risks relating to TDS’ business.
Risk Factors
|
1)
|
Intense competition in the markets in which TDS operates could adversely affect TDS’ revenues or increase its costs to compete.
|
Competition in the wireless industry is intense and is expected to intensify in the future due to multiple factors such as increasing market penetration, decreasing customer churn rates, introduction of new products, new competitors and changing prices. There is competition in pricing; handsets and other devices; network quality, coverage, speed and technologies, including 5G technology; distribution; new entrants; and other categories. In particular, wireless competition includes aggressive promotional pricing to induce customers to switch carriers, which could result in switching activity and churn. TDS’ ability to compete effectively will depend, in part, on its ability to anticipate and respond to various competitive factors affecting the telecommunications industry. In addition, unlimited plans and other data pricing constructs across the industry may limit TDS’ ability to monetize future growth in data usage. TDS anticipates that these competitive factors may cause the prices for services and products to decline and the costs to compete to increase. Most of TDS’ competitors are national or global telecommunications companies that are larger than TDS, possess greater financial and other resources, possess more extensive coverage areas and more spectrum within their coverage areas, and market other services with their communications services that TDS does not offer. TDS' competitors are actively marketing their deployment of 5G and as a result, are raising consumer awareness of the technology. If TDS cannot keep pace with its competitors in deploying 5G or other comparable offerings, or if TDS' deployment of 5G technology does not result in significant incremental revenues, TDS' financial condition, results of operations or ability to do business could be adversely affected. Further, other companies that currently are less competitive may also add more efficient low-band spectrum to become more competitive in TDS’ primary markets. In particular, to the extent that existing competitors or new entrants acquired low-band (600 MHz) spectrum or deploy newer wireless technologies in TDS markets, TDS could face increased competition over time. In addition, TDS may face competition from technologies that may be introduced in the future. New technologies, services and products that are more commercially effective than the technologies, services and products offered by TDS may be developed. Further, new technologies may be proprietary such that TDS is not able to adopt such technologies. There can be no assurance that TDS will be able to compete successfully in this environment.
Sources of competition to TDS’ wireless business typically include two to four competing wireless telecommunications service providers in each market, wireline telecommunications service providers, cable companies, resellers (including MVNO), and providers of other alternate telecommunications services. Many of TDS’ wireless competitors and other competitors have substantially greater financial, technical, marketing, sales, purchasing and distribution resources than TDS.
Sources of competition to TDS’ Wireline ILEC business include, but are not limited to, resellers of local exchange services, interexchange carriers, RBOCs, direct broadcast satellite providers, wireless communications providers, cable companies, access providers, CLECs, fiber overbuilders, VoIP providers and providers using other emerging technologies. The Wireline CLEC business sources of competition include the sources identified above as well as the ILEC in each market, which enjoys competitive advantages, including its wireline connection to virtually all of the customers and potential customers of Wireline’s CLEC business, its established brand name, its lower overhead costs, and its substantial financial resources. Wireline’s CLEC business is typically required to discount services to win potential customers. Further, this business may be negatively impacted if it cannot provide levels of bandwidth prospective customers demand due in large part to lack of availability of IP-based wholesale services at competitive prices. In the future, TDS expects the number of its physical access lines served to continue to be adversely affected by wireless voice and broadband substitution, by cable company competition, and potentially by fiber overbuilders.
11
Some of the specific risks presented by certain Wireline competitors include:
|
▪
|
Cable companies - continued deployment of broadband technologies such as DOCSIS 3.0 and 3.1 and their further evolution that substantially increase broadband speeds, and offering these speeds to customers at relatively low prices, including speed upgrades for no additional charge, and competition for video services.
|
|
▪
|
Wireless - the trend of customers “substituting” their wireline voice and broadband connections with a wireless device and wireless voice and broadband services continues.
|
|
▪
|
RBOCs - continue to be formidable competitors given their full suite of services, experience and strong financial resources.
|
|
▪
|
VoIP providers - are able to offer voice service at a very low price point.
|
|
▪
|
Fiber overbuilders - municipalities, neighboring ILECs, or other providers offering the same or higher data speeds at similar or lower price points.
|
|
▪
|
Other providers - competition to IPTV and broadband from broadcast television, satellite providers and on-line video services.
|
TDS’ Cable business also provides broadband, video and voice services. Cable’s business faces sources of competition similar to the Wireline business, but with some differences. In particular, Cable does not typically compete against another cable company for broadband services, but competes against fiber overbuilders and ILECs that primarily offer DSL-based services and may also offer fiber-based and other premium and enhanced data services. Cable provides VoIP services rather than traditional wireline voice connections and faces competition from other VoIP providers, but also faces competition from ILECs providing traditional wireline voice connections. With respect to video, Cable also competes against broadcast television, direct broadcast satellite providers, on-line video services, and wireline providers which have begun to upgrade their networks to provide video services in addition to voice and high-speed internet access services.
Sources of competition for HMS’ business primarily include large technology companies, as well as smaller independent firms that focus on mid-market companies. In addition, new entrants may emerge and grow rapidly creating additional sources of competition or companies may choose to insource their IT services. The IT services market is large and complex, with a diverse array of segments in which performance and market dynamics vary considerably. As a result of these dynamics the IT services market is a highly competitive environment. Due to the competitive environment, in order to win new customer engagements, HMS may be required to assume greater potential contractual risk obligations, such as risks relating to the consequences of data breaches or unauthorized disclosure of confidential customer information. In the event of such incidents, the HMS business could be materially adversely affected.
If TDS does not adapt to compete effectively in such a highly competitive environment, such competitive factors could result in product, service, pricing or cost disadvantages and could have an adverse effect on TDS’ business, financial condition or results of operations.
|
2)
|
A failure by TDS to successfully execute its business strategy (including planned acquisitions, spectrum acquisitions, fiber builds, divestitures and exchanges) or allocate resources or capital effectively could have an adverse effect on TDS’ business, financial condition or results of operations.
|
The successful execution of business strategies, the optimal allocation within TDS’ portfolio of assets and optimal capital allocation decisions depend on various internal and external factors, many of which are not in TDS’ control. TDS’ ability to achieve projected financial results by implementing and executing its business strategies and optimally allocating its assets and capital could be affected by such factors. Such factors include but are not limited to pricing practices by competitors, relative scale, purchasing power, roaming and other strategic agreements, wireless device availability, timing of introduction of wireless devices, access to spectrum, emerging technologies, programming and retransmission costs, mid-market demand for cloud and hosted services, changes in tax or import tariff regulations and other factors. In addition, there is no assurance that U.S. Cellular’s, TDS Telecom’s or HMS' strategies will be successful. Even if TDS executes its business strategies as intended, such strategies may not be successful in the long term at achieving growth in customers, revenues, net income, or generating portfolio returns greater than TDS’ cost of capital. In addition, if at some point a change in asset allocation is desired, TDS may be unable to alter asset allocation to meet growth and return goals in a timely and efficient manner. In such case, there would be an adverse effect on TDS’ business, financial condition and results of operations. TDS’ current forecast indicates that TDS will not achieve a return on capital that exceeds its cost of capital in the foreseeable future. See Item 1. Business for additional information on TDS’ business strategy.
U.S. Cellular is a regional wireless carrier, but competes primarily against much larger national wireless carriers with much greater resources. Its business strategy in attempting to attract and retain wireless customers through a value proposition comprised of a high-quality network, outstanding customer service, and competitive devices, plans and pricing, all provided with a local focus has not resulted in, and in the future may not result in, performance that achieves returns in line with or above its cost of capital. U.S. Cellular’s current forecast indicates that U.S. Cellular will not achieve a return on capital that exceeds its cost of capital in the foreseeable future. U.S. Cellular also might be unable to adopt technologies, services and products as fast as its larger competitors. As a result, consumers who are eager to adopt new technologies, services and products more quickly may select U.S. Cellular’s competitors rather than U.S. Cellular as their service provider. To the extent that U.S. Cellular does not attract or retain these types of customers, U.S. Cellular could be at a competitive disadvantage and have a customer base that generates lower profit margins relative to its competition.
12
Wireline and Cable each provide broadband, video and voice services and, as a result, have certain risks in common, but also have certain risks that are specific to that segment. Both Wireline and Cable strive to offer the most competitive broadband connection in its markets in order to capitalize on data growth and the customers’ need for higher broadband speeds. Wireline’s DSL-based services have several limitations compared to DOCSIS technologies employed by cable companies. Where it is cost-effective, Wireline is deploying fiber technology which offers advantages over cable to provide broadband. Wireline is also faced with other significant challenges, including customer connection and access minute declines in traditional wireline voice services as well as decreases in intercarrier compensation received for the use of its networks. Wireline must continually adjust its cost structure as a result of these challenges. A failure to develop and maintain an efficient cost structure would have an adverse effect on the Wireline and Cable businesses. The inability to execute timely on its fiber deployments could have an adverse effect on Wireline’s business. In addition, failure to deploy plant upgrades and new technology could result in opportunities for overbuilders to move into Wireline and Cable territories that are not upgraded and build similar or superior networks, which could have an adverse effect on TDS’ business. Wireline and Cable’s current forecasts indicate that Wireline and Cable will not achieve returns on capital that exceed their costs of capital in the foreseeable future.
Wireline’s IPTV product and Cable’s video service have significant costs and risks relating to programming and retransmission. Such costs have been increasing and these costs may not be able to be fully passed on to customers. In addition, both businesses are limited in their ability to obtain programming at favorable costs and terms due to their small scale. If Wireline or Cable fails to negotiate agreeable costs or terms with certain broadcast TV stations and cable networks, any resulting service interruptions could have an adverse effect on TDS' business. Further, changes in consumer behavior and/or new technologies are causing consumers to reduce or cancel their video services and instead seek to obtain video on demand over the internet or through new technologies. A wide range of regulatory or other issues also affect both businesses, including matters pertaining to set-top boxes, equipment connectivity, content regulation, closed captioning, pole attachments, privacy, copyright, technical standards, and municipal entry into video and broadband.
Although Cable’s business development strategy includes evaluating opportunities for possible further acquisitions of desirable cable companies on attractive terms to increase the scale of its business, there is no assurance that such acquisitions will be available, or that this strategy will be successful.
HMS provides a wide range of IT services and has risks that are not shared with the other business segments. HMS’ business strategy is to create, deliver and support a platform of IT products and services tailored for mid-sized business customers. HMS’ current forecast indicates that it will not achieve a return on capital that exceeds its cost of capital in the foreseeable future. The HMS business is faced with a number of risks in its pursuit of its strategy, including: the rate of outsourcing IT needs and moving to the cloud by mid-sized business customers; the ability to sell recurring revenue services; the ability to attract new or retain existing customers; whether potential customers ascribe sufficient value to HMS’ more customized cloud and hosted services compared to more commodity based offerings of larger competitors; HMS’ limited scale when competing with larger competitors; and the impact of IT wage inflation on the profitability of on-shore support services.
A failure by TDS to execute its business strategies successfully or to allocate resources or capital optimally could have an adverse effect on TDS’ businesses, financial condition or results of operations.
|
3)
|
Uncertainty in TDS’ future cash flow and liquidity or the inability to access capital, deterioration in the capital markets, other changes in TDS’ performance or market conditions, changes in TDS’ credit ratings or other factors could limit or restrict the availability of financing on terms and prices acceptable to TDS, which could require TDS to reduce its construction, development or acquisition programs, reduce the amount of spectrum licenses acquired, and/or reduce or cease share repurchases and/or the payment of dividends.
|
TDS and its subsidiaries operate capital-intensive businesses. Historically, TDS has used internally-generated funds and also has obtained substantial funds from external sources for general corporate purposes. In the past, TDS’ existing cash and investment balances, funds available under its revolving credit agreements, receivables securitization agreement, funds from other financing sources, including a term loan and other long-term debt, and cash flows from operating and certain investing and financing activities, including sales of assets or businesses, provided sufficient liquidity and financial flexibility for TDS to meet its normal day-to-day operating needs and debt service requirements, to finance the build-out and enhancement of markets and to fund acquisitions. There is no assurance that this will be the case in the future. It may be necessary from time to time to increase the size of the existing revolving credit agreements, to put in place new credit agreements, or to obtain other forms of financing in order to fund potential expenditures. TDS’ liquidity would be adversely affected if, among other things, TDS is unable to obtain short or long-term financing on acceptable terms, TDS makes significant spectrum license purchases, TDS makes significant capital investments, TDS makes significant business acquisitions, the Los Angeles SMSA Limited Partnership (LA Partnership) discontinues or significantly reduces distributions compared to historical levels, or Federal USF and/or other regulatory support payments decline.
13
TDS’ credit rating currently is sub-investment grade. TDS has incurred negative free cash flow (defined as Cash flows from operating activities less Cash paid for additions to property, plant and equipment) at times in the past and this could occur in the future. TDS may require substantial additional capital for, among other uses, funding day-to-day operating needs including working capital, acquisitions of providers of cable, wireless or wireline telecommunications services, IT services or other businesses, spectrum license or system acquisitions, capital expenditures, debt service requirements, the repurchase of shares, the payment of dividends, or making additional investments. There can be no assurance that sufficient funds will continue to be available to TDS or its subsidiaries on terms or at prices acceptable to TDS. Insufficient cash flows from operating activities, changes in TDS' credit ratings, defaults of the terms of debt or credit agreements, uncertainty of access to capital, deterioration in the capital markets, reduced regulatory capital at banks which in turn limits their ability to borrow and lend, other changes in the performance of TDS or in market conditions or other factors could limit or restrict the availability of financing on terms and prices acceptable to TDS, which could require TDS to reduce its acquisition, capital expenditure and business development programs, reduce the acquisition of spectrum licenses, and/or reduce or cease share repurchases and/or the payment of dividends. TDS cannot provide assurance that circumstances that could have a material adverse effect on its liquidity or capital resources will not occur. Any of the foregoing would have an adverse impact on TDS’ businesses, financial condition or results of operations.
|
4)
|
TDS has a significant amount of indebtedness which could adversely affect its financial performance and in turn adversely affect its ability to make payments on its indebtedness, comply with terms of debt covenants and incur additional debt.
|
TDS has a significant amount of indebtedness and may need to incur additional indebtedness. TDS’ level of indebtedness could have important consequences. For example, it (i) may limit TDS’ ability to obtain additional financing for working capital, capital expenditures or general corporate purposes, particularly if the ratings assigned to its debt securities by rating organizations are revised downward; (ii) will require TDS to dedicate a substantial portion of its cash flow from operations to the payment of interest and principal on its debt, reducing the funds available to TDS for other purposes including expansion through acquisitions, capital expenditures, marketing spending and expansion of its business; and (iii) may limit TDS’ flexibility to adjust to changing business and market conditions and make TDS more vulnerable to a downturn in general economic conditions as compared to TDS’ competitors. TDS’ ability to make scheduled payments on its indebtedness or to refinance it will depend on its financial and operating performance, which, in turn, is subject to prevailing economic and competitive conditions and other factors beyond its control. In addition, TDS’ leverage may put it at a competitive disadvantage to some of its competitors that are not as leveraged.
The TDS and U.S. Cellular revolving credit agreements, the U.S. Cellular term loan agreement and the U.S. Cellular receivables securitization agreement require TDS or U.S. Cellular, as applicable, to comply with certain affirmative and negative covenants, including certain financial covenants. Depending on the actual financial performance of TDS and U.S. Cellular, there is a risk that TDS and/or U.S. Cellular could fail to satisfy the required financial covenants. If TDS or U.S. Cellular breach a financial or other covenant of any of these agreements, it would result in a default under that agreement, and could involve a cross-default under other debt instruments. This could in turn cause the affected lenders to accelerate the repayment of principal and accrued interest on any outstanding debt under such agreements and, if they choose, terminate the agreement. If appropriate, TDS and U.S. Cellular may request the applicable lenders for an amendment of financial covenants in the TDS and/or U.S. Cellular agreements, in order to provide additional financial flexibility to TDS and U.S. Cellular, and may also seek other changes to such agreements. There is no assurance that the lenders will agree to any amendments. If the lenders agree to amendments, this may result in additional payments or higher interest rates payable to the lenders and/or additional restrictions. Restrictions in such debt instruments may limit TDS’ operating and financial flexibility.
As a result, TDS’ level of indebtedness, restrictions contained in debt instruments and/or possible breaches of covenants, defaults, and acceleration of indebtedness could have an adverse effect on TDS’ business, financial condition, revenues, results of operations and cash flows.
|
5)
|
Changes in roaming practices or other factors could cause TDS’ roaming revenues to decline from current levels, roaming expenses to increase from current levels and/or impact TDS’ ability to service its customers in geographic areas where TDS does not have its own network, which could have an adverse effect on TDS’ business, financial condition or results of operations.
|
TDS’ revenues include roaming revenues related to the use of TDS’ network by other wireless carriers’ customers who travel within TDS’ coverage areas. Changes in FCC rules or actions, industry practices or the network footprints of carriers due to mergers, acquisitions or network expansions could have an adverse effect on TDS’ roaming revenues. For example, consolidation among other carriers which have network footprints that currently overlap TDS’ network could decrease the amount of roaming revenues for TDS.
Similarly, TDS’ wireless customers can access another carrier’s digital system automatically only if the other carrier allows TDS’ customers to roam on its network. TDS relies on roaming agreements with other carriers to provide roaming capability to its customers in areas of the U.S. and internationally outside of its service areas and to improve coverage within selected areas of TDS’ network footprint. Such agreements cover traditional voice services as well as data services. Although TDS currently has long-term roaming agreements with certain other carriers, these agreements generally are subject to renewal and termination if certain events occur. FCC rules and orders impose certain requirements on wireless carriers to offer certain roaming arrangements to other carriers. However, carriers frequently disagree on what is required. Although TDS has entered into 4G LTE and VoLTE roaming agreements with national carriers, there is no assurance that TDS will be able to maintain these agreements and/or enter into new agreements with other carriers to provide roaming services using 4G LTE or other technologies or that it will be able to do so on reasonable or cost-effective terms. Additionally, as other carriers begin to deploy 5G on their respective networks, there is no assurance that TDS will be able to enter into 5G roaming agreements with other carriers at reasonable or cost-effective terms.
14
Some competitors may be able to obtain lower roaming rates than TDS is able to obtain because they have larger data usage or call volumes or may be able to reduce roaming charges by providing service principally over their own networks. In addition, the quality of service that a wireless carrier delivers to a TDS customer while roaming may be inferior to the quality of service TDS provides, the price charged for an international roaming call may not be competitive with prices other wireless carriers charge for such call, TDS’ customers may not be able to use some of the advanced features, such as voicemail notification or data applications, that TDS customers enjoy when making calls on TDS’ network, and TDS customers’ service experience may be negatively impacted, particularly when accessing data services, upon reaching a defined allotment of high-speed usage. TDS’ rate of adoption of new technologies, such as those enabling high-speed data and voice services, could affect its ability to enter into or maintain roaming agreements with other carriers. In addition, TDS’ wireless technology may not be compatible with technologies used by other carriers, which may limit the ability of TDS to enter into voice or data roaming agreements with such other carriers. Carriers whose customers roam on TDS’ network could switch their business to new operators or, over time, to their own networks. Changes in roaming usage patterns, rates for roaming usage, or roaming relationships with other carriers could have an adverse effect on TDS’ roaming revenues and/or expenses.
To the extent that other carriers expand their networks in TDS’ service areas, the roaming arrangements between TDS and these other carriers could become less strategic for them. That is, these other carriers will have fewer or less extensive geographic areas where roaming services are required by their customers and, as a result, the roaming arrangements could become less critical to serving their customer base. This presents a risk to TDS in that, to the extent TDS is not able to enter into economically viable roaming arrangements with these other carriers, this could impact TDS’ ability to service its customers in geographic areas where TDS does not have its own network.
If TDS’ roaming revenues decline, or its roaming expenses increase, or if TDS is unable to obtain or maintain roaming agreements with other carriers that contain pricing and other terms that are competitive and acceptable to TDS and that satisfy TDS’ quality and interoperability requirements, its business, financial condition or results of operations could be adversely affected.
|
6)
|
A failure by TDS to obtain access to adequate radio spectrum to meet current or anticipated future needs and/or to accurately predict future needs for radio spectrum could have an adverse effect on TDS’ business, financial condition or results of operations.
|
TDS’ wireless business depends on the ability to use portions of the radio spectrum licensed by the FCC. TDS could fail to obtain access to sufficient spectrum capacity, including spectrum needed to support 5G technology, in new or existing markets, whether through FCC auctions or other transactions, in order to meet the anticipated spectrum requirements associated with increased demand for existing services, especially increases in customer demand for data services, and to enable deployment of next-generation services. TDS believes that this increased demand for data services reflects a trend that will continue for the foreseeable future. Data usage, including usage under unlimited plans, could exceed current forecasts resulting in a need for increased investment in spectrum or network. TDS could fail to accurately forecast its future spectrum requirements considering changes in plan offerings, customer usage patterns, technology requirements and the expanded demands of new services. Such a failure could have an adverse impact on the quality of TDS’ services or TDS’ ability to roll out such future services in some markets, or could require that TDS curtail existing services in order to make spectrum available for next-generation services. Spectrum constrained providers could be effectively capped in increasing market share. As spectrum constrained providers gain customers, they use up their network capacity. Since they lack spectrum, they can respond to demand only by adding cell sites, which is capital intensive, adds fixed operating costs, is limited by zoning considerations, and ultimately may not be cost effective.
TDS may acquire access to spectrum through a number of alternatives, including acquisitions, exchanges and participation in spectrum auctions. TDS may participate in spectrum auctions conducted by the FCC in the future. As required by law, the FCC has conducted auctions for licenses to use some parts of the radio spectrum. The decision to conduct auctions, and the determination of what spectrum frequencies will be made available for auction and the determination of geographic size of licenses, are made by the FCC pursuant to laws that it administers. The FCC may not be able to allocate spectrum sufficient to meet the demands of all those wishing to obtain licenses for new market entry or to expand their spectrum holdings to meet the expanding demand for data services or to address other spectrum constraints. Due to factors such as geographic size of licenses and auction bidders that may raise prices beyond acceptable levels, TDS may not be successful in FCC auctions in obtaining access to the spectrum that it believes is necessary to implement its business and technology strategies.
In addition, newly auctioned spectrum may not be compatible with existing spectrum, and vendors may not create suitable products to use such spectrum. Further, access to spectrum licenses won in FCC auctions may not be available on a timely basis. Such access is dependent upon the FCC actually granting licenses won, which can be delayed for various reasons. Furthermore, newly licensed spectrum may not be available for immediate use since the radio operations of incumbent users, including in some cases government agencies, may need to be relocated to other portions of the radio spectrum, and/or the newly licensed spectrum may be subject to sharing and coordination obligations. TDS also may seek to acquire radio spectrum through purchases and exchanges with other spectrum licensees. However, TDS may not be able to acquire sufficient spectrum through these types of transactions, and TDS may not be able to complete any of these transactions on favorable terms.
15
|
7)
|
To the extent conducted by the FCC, TDS may participate in FCC auctions for additional spectrum or for funding in certain Universal Service programs in the future directly or indirectly and, during certain periods, will be subject to the FCC’s anti-collusion rules, which could have an adverse effect on TDS.
|
From time to time, the FCC has conducted auctions through which additional spectrum is made available for the provision of wireless services, or through which universal service support funding is dispersed. TDS has participated in such auctions in the past and may participate in other auctions conducted by the FCC in the future. FCC anti-collusion rules place certain restrictions on business communications and disclosures by participants in an FCC auction. These anti-collusion rules may restrict the normal conduct of TDS’ business, TDS’ acquisition, divestiture, exchange and other corporate development activity and/or disclosures by TDS relating to an FCC auction. The restrictions could have an adverse effect on TDS’ business, financial condition or results of operations.
|
8)
|
Failure by TDS to timely or fully comply with any existing applicable legislative and/or regulatory requirements or changes thereto could adversely affect TDS’ business, financial condition or results of operations.
|
TDS’ operations are subject to varying degrees of regulation by the FCC, state public utility commissions and other federal, state and local regulatory agencies and legislative bodies. Changes in the administration of the various regulatory agencies and legislative bodies could result in different policies with respect to many federal laws and regulations, including but not limited to changes to fiscal and tax policies, trade policies and tariffs on import goods. New or amended regulatory requirements could increase TDS’ costs and divert resources from other initiatives. Adverse decisions, increased regulation, or changes to existing regulation by regulatory bodies could negatively impact TDS’ operations by, among other things, permitting greater competition or limiting TDS’ ability to engage in certain sales or marketing activities, or retention and recruitment of skilled resources. New regulatory mandates or enforcement may require unexpected or increased capital expenditures, lost revenues, higher operating expenses or other changes. Court decisions and rulemakings could have a substantial impact on TDS’ operations, including rulemakings on broadband access to the internet, intercarrier access compensation, state and federal support funding, and treatment of VoIP traffic or unbundled network elements. Litigation and different objectives among federal and state regulators could create uncertainty and delay TDS’ ability to respond to new regulations. Further, wireless licenses are subject to renewal by the FCC and could be revoked in the event of a violation of applicable laws or regulatory requirements. Also, although FCC rules relating to net neutrality have been repealed, some state legislators and regulators are seeking to or have already enacted state laws to reinstate net neutrality regulations and other rules. Interpretation and application of these rules, including conflicts between federal and state laws, may result in additional costs for compliance and may limit opportunities to derive profits from certain business practices or resources. Additionally, in June 2018, California adopted the California Consumer Privacy Act (CCPA). The CCPA is a broad data privacy law which grants consumers new rights over their own personal data and allows access, porting, and data deletion. The CCPA also authorizes the California State Attorney General to enforce those rights including assessing civil penalties. TDS is required to comply with the CCPA requirements by January 1, 2020. TDS is evaluating the effects that compliance with the CCPA will have on its business. Compliance with the CCPA, and with similar legislation that could be adopted by other states or the federal government, could increase U.S. Cellular’s costs and divert resources from other initiatives. For additional information related to TDS’ regulatory environment, see Risk Factor Number 15 below and “Regulatory Matters” in Exhibit 13 to this Form 10-K.
TDS attempts to timely and fully comply with all regulatory requirements. However, TDS is unable to predict the future actions of the various legislative and regulatory bodies that govern TDS, but such actions could have adverse effects on TDS’ business. Any failure by TDS to timely or fully comply with any regulatory requirements could adversely affect TDS’ financial condition, results of operations or ability to do business.
|
9)
|
An inability to attract people of outstanding talent throughout all levels of the organization, to develop their potential through education and assignments, and to retain them by keeping them engaged, challenged and properly rewarded could have an adverse effect on TDS' business, financial condition or results of operations.
|
TDS’ businesses are highly technical and competition for skilled talent in the telecommunications and IT services industries is intense. Due to competition and/or limited supply for qualified management, technical, sales and other personnel, there can be no assurance that TDS will be able to continue to attract and/or retain people of outstanding potential for the development of its business. The loss of the services of existing key personnel due to competition and/or retirements as well as the failure to recruit additional qualified personnel in a timely manner could have an adverse effect on TDS’ business, financial condition or results of operations.
The market for highly skilled leaders in the telecommunications industry also is extremely competitive. The future success of TDS and its businesses depends in substantial part on TDS’ ability to recruit, hire, motivate, develop, and retain talented and highly skilled leaders for all areas of its organization. The loss of any of TDS’ key leaders could have an adverse effect on its business, financial condition or results of operations. Effective succession planning is also important to TDS’ long-term success. Failure to ensure effective transfer of knowledge and smooth transition involving key employees could also adversely affect TDS’ business, financial condition and results of operations.
|
10)
|
TDS’ assets and revenue are concentrated primarily in the U.S. telecommunications industry. Consequently, its operating results may fluctuate based on factors related primarily to conditions in this industry.
|
The U.S. telecommunications industry is facing significant change and an uncertain operating environment. TDS’ focus on the U.S. telecommunications industry, together with its positioning relative to larger competitors with greater resources within the industry, may represent increased risk for investors due to the lack of diversification. This could have an adverse effect on TDS’ ability to attain and sustain long-term, profitable revenue growth and could have an adverse effect on its business, financial condition or results of operations.
16
|
11)
|
TDS’ smaller scale relative to larger competitors that may have greater financial and other resources than TDS could cause TDS to be unable to compete successfully, which could adversely affect its business, financial condition or results of operations.
|
There has been a trend in the telecommunications, IT services and related industries towards consolidation of service providers through acquisitions, reorganizations and joint ventures. This trend could continue, leading to larger competitors over time. TDS has smaller scale efficiencies compared to larger competitors. TDS may be unable to compete successfully with larger companies that have substantially greater financial, technical, marketing, sales, purchasing and distribution resources or that offer more services than TDS, which could adversely affect TDS’ revenues and costs of doing business. Specifically, TDS’ smaller scale relative to most of its competitors could have the following impacts, among others:
|
▪
|
Low profit margins and returns on investment that are below TDS’ cost of capital;
|
|
▪
|
Increased operating costs due to lack of leverage with vendors;
|
|
▪
|
Inability to successfully deploy 5G or other wireless technologies,
or to realize significant incremental revenues from their deployment
;
|
|
▪
|
Limited opportunities for strategic partnerships as potential partners are focused on wireless, wireline, cable and IT services companies with greater scale and scope;
|
|
▪
|
Limited access to content and programming;
|
|
▪
|
Limited ability to influence industry standards;
|
|
▪
|
Reduced ability to invest in research and development of new services and products;
|
|
▪
|
Vendors may deem TDS non-strategic and not develop or sell services and products to TDS, particularly where technical requirements differ from those of larger companies;
|
|
▪
|
Limited access to intellectual property; and
|
|
▪
|
Other limited opportunities such as for software development or third party distribution.
|
TDS’ telecommunications businesses increasingly depend on access to content for data and access to new wireless devices being developed by vendors. TDS’ ability to obtain such access depends in part on other parties. If TDS is unable to obtain timely access to new content or wireless devices being developed by vendors, its business, financial condition or results of operations could be adversely affected.
As a result of the foregoing, TDS’ smaller scale relative to larger competitors could adversely affect TDS’ business, financial condition or results of operations.
|
12)
|
Changes in various business factors, including changes in demand, customer preferences and perceptions, price competition, churn from customer switching activity and other factors, could have an adverse effect on TDS’ business, financial condition or results of operations.
|
Changes in any of several factors could have an adverse effect on TDS’ business, financial condition or results of operations. These factors include, but are not limited to:
|
▪
|
Demand for or usage of services, particularly data services;
|
|
▪
|
Customer preferences, including internet speed and type of wireless devices;
|
|
▪
|
Customer perceptions of network quality and performance;
|
|
▪
|
The pricing of services, including an increase in price-based competition;
|
|
▪
|
Access to and cost of programming;
|
|
▪
|
The overall size and growth rate of TDS’ customer base;
|
|
▪
|
Penetration rates;
|
|
▪
|
Churn rates;
|
|
▪
|
Selling expenses;
|
|
▪
|
Net customer acquisition and retention costs;
|
|
▪
|
Customers’ ability to pay for services and the potential impact on bad debts expense;
|
|
▪
|
Roaming agreements and rates;
|
|
▪
|
Third-party vendor support;
|
|
▪
|
Capacity constraints;
|
|
▪
|
The mix of services and products offered by TDS and purchased by customers;
|
|
▪
|
The costs of providing services and products; and
|
|
▪
|
Mid-market demand for cloud and hosted services.
|
17
|
13)
|
Advances or changes in technology could render certain technologies used by TDS obsolete, could put TDS at a competitive disadvantage, could reduce TDS’ revenues or could increase its costs of doing business.
|
The telecommunications and IT services industries are experiencing significant changes in technologies and services expected by customers. In the telecommunications industry, this is evidenced by evolving industry standards, ongoing improvements in the capacity and quality of digital technology, shorter development cycles for new services and products, and enhancements and changes in end-user requirements and preferences. Widespread deployment of new technologies, including 5G technology, could cause the technology used on TDS’ wireless networks, traditional circuit-switched or IP-based networks, and cable networks to become less competitive or obsolete. Also, high-speed wireless networks (wireless broadband) represent a product offering and opportunity for TDS’ wireless business, but also represent a risk for TDS’ Wireline and Cable businesses as customers may elect to substitute their wireline or cable broadband connection for wireless broadband. Further, fixed-mobile convergence services that combine wireline broadband services with mobile services represent a competitive threat. If the trend toward convergence continues, TDS is at a competitive disadvantage to larger competitors, including the national wireless carriers and other potential large new entrants with much greater financial and other resources in adapting to such convergence. In addition, the IT services market is characterized by rapidly changing technology and services. Future technological changes or advancements may enable other technologies to equal or exceed TDS’ current levels of service and render its system infrastructure obsolete. For example, the timing, cost, and availability of CDMA enabled devices and other CDMA ecosystem support needs, including voice roaming on other carrier networks, may inhibit TDS’ ability to maintain 3G wireless voice service until it is fully replaced by VoLTE. TDS may not be able to respond to such changes and implement new technology on a timely or cost-effective basis, which could reduce its revenues or increase its costs of doing business. If TDS cannot keep pace with these technological changes or other changes in the telecommunications or IT services industries over time, its financial condition, results of operations or ability to do business could be adversely affected.
|
14)
|
Complexities associated with deploying new technologies present substantial risk and TDS’ investments in unproven technologies may not produce the benefits that TDS expects.
|
TDS’ wireless business has completed the transition to 4G LTE and has implemented 4G LTE as well as VoLTE roaming agreements with national carriers. VoLTE technology has been launched successfully in California, Iowa, Oregon, Washington and Wisconsin, and deployments in several additional markets will occur in 2019. In addition, TDS’ wireless business has successfully tested 5G technology in both indoor and outdoor environments. The deployment of 5G technology will require substantial investments in TDS' wireless networks to remain competitive in the industry. Transition to 5G or other new technologies involves significant time, cost and risk, and anticipated products and revenues may not be realized. Furthermore, the wireless business experiences rapid technology changes and new services and products. If TDS fails to effectively deploy new wireless technologies, services or products on a timely basis, this could have an adverse impact on TDS’ business, financial condition and results of operations.
TDS’ Wireline business is deploying fiber-to-the-home technology, advanced wireline, broadband, and TDS TV+ services through fiber-to-the-node, copper bonding and vectoring technology. A significant amount of the product development and integration risks are borne by TDS. Further, the simultaneous rollout of these advanced services and technologies increases the execution risk. If TDS fails to effectively deploy new technologies and products on a timely basis, this could have an adverse impact on TDS’ business, financial condition and results of operations.
Cable’s business is also subject to complexities associated with deploying new technologies, such as DOCSIS 3.1, and involves substantial risk, including rapid technology changes. If Cable’s business does not respond appropriately to technology changes, its competitive position may be adversely affected.
The HMS business is also continuously evaluating and deploying advances in technology relating to IT services. If HMS fails to effectively deploy new technologies and products on a timely basis, this could have an adverse impact on its business, financial condition and results of operations.
Furthermore, it is not certain that TDS’ investments in various new, unproven technologies and the related service and product offerings will be effective. The markets for some of these services, products and solutions may still be emerging and the overall potential for these markets, including revenues to be realized, may be uncertain. If customer demand for these new services, products and solutions does not develop as expected, TDS’ business, financial condition or results of operations could be adversely affected.
|
15)
|
TDS receives regulatory support and is subject to numerous surcharges and fees from federal, state and local governments, and the applicability and the amount of the support and fees are subject to great uncertainty, which could have an adverse effect on TDS’ business, financial condition or results of operations.
|
Telecommunications companies may be designated by states, or in some cases by the FCC, as an Eligible Telecommunications Carrier (ETC) to receive universal service support payments if they provide specified services in “high cost” areas. U.S. Cellular has been designated as an ETC in certain states and received
$92 million
in high cost support for service to high cost areas in 2018. TDS Telecom also received support under the Connect America Fund support program. In 2018, TDS Telecom received $86 million under all federal regulatory support programs.
In 2011, the FCC released an order (USF Order) to: reform its universal service and intercarrier compensation mechanisms; establish a new, broadband-focused support mechanism; and propose further rules to advance reform. For a discussion of the USF Order and risks to such regulatory support, see “Regulatory Matters - FCC Mobility Fund Phase II Order” in Exhibit 13 to this Form 10-K, which is incorporated by reference herein. If the foregoing regulatory support is reduced from current levels, this could have an adverse effect on TDS’ business, financial condition or operating results.
18
In 2016, the FCC released an order modifying the existing USF program under which TDS Telecom receives annual support
revenue
in exchange for meeting defined build-out obligations. Build-out obligations under this program will require capital expenditures which are expected to be significant. There is no assurance that these build-outs will be fully funded by the support revenue received under the program. In addition, failure to meet the defined build-out obligations could result in reduced support
revenue
. For developments that will result in changes to the FCC’s Alternative Connect America Cost Model (A-CAM) program see “Regulatory Matters - FCC Connect America Fund,” in Exhibit 13 to this Form 10-K, which is incorporated by reference herein.
Telecommunications providers pay a variety of surcharges and fees on their gross revenues from interstate and intrastate services, including USF fees and common carrier regulatory fees.
The division of services between interstate services and intrastate services, including the divisions associated with Federal USF fees, is a matter of interpretation and may in the future be contested by the FCC or state authorities. The FCC also may change in the future the basis on which Federal USF fees are charged. The Federal government and many states also apply transaction-based taxes to sales of telecommunications services and products and to purchases of telecommunications services from various carriers. In addition, state regulators and local governments have imposed and may continue to impose various surcharges, taxes and fees on telecommunications services. The applicability of these surcharges and fees to TDS’ services is uncertain in many cases and jurisdictions may contest whether TDS has assessed and remitted those monies correctly. Periodically, state and federal regulators may increase or change the surcharges and fees TDS currently pays. In some instances, TDS passes through these charges to its customers. However, Congress, the FCC, state regulatory agencies or state legislatures may limit the ability to pass through transaction-based tax liabilities, regulatory surcharges and regulatory fees imposed on TDS to customers. TDS may or may not be able to recover some or all of those taxes from its customers and the amount of taxes may deter demand for its services or increase its cost to provide service which could have an adverse effect on its business, financial condition or operating results.
|
16)
|
Performance under device purchase agreements could have a material adverse impact on TDS' business, financial condition or results of operations.
|
TDS has entered into purchase commitments with certain vendors and may enter into similar purchase commitments with other vendors in the future. If TDS is unable to sell all of the devices that it is required to purchase under such agreements, or if it is unable to sell them at the prices it projects, its business, financial condition or results of operations could be adversely affected.
|
17)
|
Changes in TDS’ enterprise value, changes in the market supply or demand for wireless licenses, wireline or cable markets or IT service providers, adverse developments in the businesses or the industries in which TDS is involved and/or other factors could require TDS to recognize impairments in the carrying value of its licenses, goodwill, franchise rights and/or physical assets or require re-evaluation of the indefinite-lived nature of such assets.
|
A large portion of TDS’ assets consists of indefinite-lived intangible assets in the form of licenses and goodwill. TDS also has substantial investments in long-lived assets such as property, plant and equipment and franchise rights. TDS reviews its licenses, goodwill and other long-lived assets for impairment annually or whenever events or circumstances indicate that the carrying amount of such assets may not be fully recoverable. An impairment loss may need to be recognized to the extent the carrying value of the assets exceeds the fair value of such assets. The amount of any such impairment loss could be significant and could have an adverse effect on TDS’ reported financial results for the period in which the loss is recognized. The estimation of fair values requires assumptions by management about factors that are uncertain. Different assumptions for these factors could create materially different results.
|
18)
|
Costs, integration problems or other factors associated with acquisitions, divestitures or exchanges of properties or licenses and/or expansion of TDS’ businesses could have an adverse effect on TDS’ business, financial condition or results of operations.
|
As part of TDS’ operating strategy, TDS from time to time may be engaged in the acquisition, divestiture or exchange of companies, businesses, strategic properties, wireless spectrum or other assets. TDS may change the markets in which it operates and the services that it provides through such acquisitions, divestitures and/or exchanges. In general, TDS may not disclose the negotiation of such transactions until a definitive agreement has been reached. These transactions commonly involve a number of risks, including:
|
▪
|
Identification of attractive companies, businesses, properties, spectrum or other assets for acquisition or exchange, and/or the selection of TDS’ businesses or assets for divestiture or exchange;
|
|
▪
|
Competition for acquisition targets and the ability to acquire or exchange businesses at reasonable prices;
|
|
▪
|
Inability to make acquisitions that would achieve sufficient scale to be competitive with competitors with greater scale;
|
|
▪
|
Possible lack of buyers for businesses or assets that TDS desires to divest and the ability to divest or exchange such businesses or assets at reasonable prices;
|
|
▪
|
Ability to negotiate favorable terms and conditions for acquisitions, divestitures and exchanges;
|
|
▪
|
Significant expenditures associated with acquisitions, divestitures and exchanges;
|
|
▪
|
Risks associated with integrating new businesses or markets, including risks relating to cybersecurity and privacy;
|
|
▪
|
Ability to enter markets in which TDS has limited or no direct prior experience and competitors have stronger positions;
|
|
▪
|
Ability to integrate and manage TDS’ different business operations and services, including wireless services, traditional wireline services, cable businesses and hosted and managed services businesses;
|
|
▪
|
Uncertain revenues and expenses associated with acquisitions, with the result that TDS may not realize the growth in revenues, anticipated cost structure, profitability, or return on investment that it expects;
|
|
▪
|
Difficulty of integrating the technologies, services, products, operations and personnel of the acquired businesses, or of separating such matters for divested businesses or assets;
|
|
▪
|
Diversion of management’s attention;
|
19
|
▪
|
Disruption of ongoing business;
|
|
▪
|
Impact on TDS’ cash and available credit lines for use in financing future growth and working capital needs;
|
|
▪
|
Inability to retain key personnel;
|
|
▪
|
Inability to successfully incorporate acquired assets and rights into TDS’ service offerings;
|
|
▪
|
Inability to maintain uniform standards, controls, procedures and policies;
|
|
▪
|
Possible conditions to approval by the FCC, the Federal Trade Commission and/or the Department of Justice; and
|
|
▪
|
Impairment of relationships with employees, customers or vendors.
|
No assurance can be given that TDS will be successful with respect to its acquisition, divestiture or exchange strategies or initiatives. If TDS is not successful with respect to its acquisitions, divestitures or exchanges, its business, financial condition or results of operations could be adversely affected.
|
19)
|
A failure by TDS to complete significant network construction and systems implementation activities as part of its plans to improve the quality, coverage, capabilities and capacity of its network, support and other systems and infrastructure could have an adverse effect on its operations.
|
TDS’ business plan includes significant construction activities and enhancements to its network, support and other systems and infrastructure. Additionally, the deployment of new wireless technologies, including 5G, may require substantial investments in TDS' wireless network. As TDS deploys, expands and enhances its wireless network, it may need to acquire additional spectrum. Also, as TDS continues to build out and enhance its network, TDS must, among other things, continue to:
|
▪
|
Lease, acquire or otherwise obtain rights to cell and switch sites, transport facilities, data centers relating to IT services or other facilities;
|
|
▪
|
Obtain zoning variances or other local governmental or third-party approvals or permits for network construction;
|
|
▪
|
Complete and update the radio frequency design, including cell site design, frequency planning and network optimization, for each of TDS’ wireless markets; and
|
|
▪
|
Improve, expand and maintain customer care, network management, billing and other financial and management systems.
|
Any difficulties encountered in completing these activities, as well as problems in vendor equipment availability, technical resources, system performance or system adequacy, could delay implementation and deployment of new technologies, delay expansion of operations and product capabilities in new or existing markets or result in increased costs. Failure to successfully deploy new technologies, including 5G, and/or build-out and enhance TDS’ network, support facilities and other systems and infrastructure in a cost-effective manner, and in a manner that satisfies customer expectations, could have an adverse effect on TDS’ business, business prospects, financial condition or results of operations.
TDS’ Wireline and Cable businesses are devoting an increasing amount of capital for fiber overbuilds and out of territory construction. Difficulties in gaining acceptance from new market communities could cause delays or additional costs. Any difficulties in scaling up project management, engineering and construction resources could delay construction and expansion of operations in new or existing markets or result in increased costs. Failure to gain acceptance in new communities and successfully scale up resources could have an adverse effect on TDS’ business, business prospects, financial condition or results of operations.
|
20)
|
Difficulties involving third parties with which TDS does business, including changes in TDS’ relationships with or financial or operational difficulties of key suppliers or independent agents and third party national retailers who market TDS’ services, could adversely affect TDS’ business, financial condition or results of operations.
|
TDS has relationships with independent agents and third party national retailers who market TDS’ services. If such relationships are seriously harmed or if such parties experience financial difficulties, including bankruptcy, TDS’ business, financial condition or results of operations could be adversely affected.
TDS depends upon certain vendors to provide it with equipment (including wireless devices), services or content to continue its network construction and upgrades, and to operate its business. TDS does not have operational or financial control over such key suppliers and has limited influence with respect to the manner in which these key suppliers conduct their businesses. If these key suppliers experience financial difficulties or file for bankruptcy or experience other operational difficulties, they may be unable to provide equipment, services or content to TDS on a timely basis, or at all, or they may otherwise fail to honor their obligations to TDS. Furthermore, consolidation among key suppliers may result in less competition and higher prices or the discontinuation of support for equipment owned by TDS.
Regulations regarding the use of “conflict minerals” mined from the Democratic Republic of Congo and adjoining countries may affect some of TDS’ suppliers. These regulations may limit the availability of conflict free minerals and, as a result, TDS may not be able to obtain products in sufficient quantities or at competitive prices from its vendors who utilize such minerals in the manufacture of products. In such cases, TDS may be unable to maintain and upgrade its network or provide services and products to its customers in a competitive manner, or could suffer other disruptions to its business. In that event, TDS’ business, financial condition or results of operations could be adversely affected.
In addition, operation of TDS’ supply chain and management of its inventory require accurate forecasting of customer growth and demand, which has become increasingly challenging. If overall demand for wireless devices or the mix of demand for wireless devices is significantly different than TDS’ expectations, TDS could face inadequate or excess supplies of particular models of wireless devices. This could result in lost sales opportunities or an excess supply of inventory. Either of these situations could adversely affect TDS’ revenues, costs of doing business, results of operations or financial condition.
20
Also, TDS has other arrangements with third parties, including arrangements pursuant to which TDS outsources certain support functions to third party vendors. Operational problems associated with such functions, including any failure by the vendor to provide the required level of service under the outsourcing arrangements, including possible cyber-attacks or other breaches of network or information technology security or privacy, could have adverse effects on TDS’ business, financial condition or results of operations.
|
21)
|
TDS has significant investments in entities that it does not control. Losses in the value of such investments could have an adverse effect on TDS’ financial condition or results of operations.
|
TDS has significant investments in entities that it does not control, including equity investments and interests in certain variable interest entities. TDS’ interests in such entities do not provide TDS with control over the business strategy, financial goals, network build-out plans or other operational aspects of these entities. TDS cannot provide assurance that these entities will operate in a manner that will increase or maintain the value of TDS’ investments, that TDS’ proportionate share of income from these investments will continue at the current level in the future or that TDS will not incur losses from the holding of such investments. Losses in the values of such investments or a reduction in income from these investments could adversely affect TDS’ financial condition or results of operations. In addition, certain investments have historically contributed significant cash flows to TDS and a reduction or suspension of such cash flows could adversely affect TDS’ financial condition.
|
22)
|
A failure by TDS to maintain flexible and capable telecommunication networks or information technology, or a material disruption thereof, could have an adverse effect on TDS’ business, financial condition or results of operations.
|
TDS relies extensively on its telecommunication networks and information technology to operate and manage its businesses, process transactions and summarize and report results. These networks and technology become obsolete over time and must be upgraded, replaced and/or otherwise enhanced over time. Enhancements must be more flexible and dependable than ever before. All of this is capital intensive and challenging. A failure by TDS to maintain flexible and capable telecommunication networks or information technology could have an adverse effect on TDS’ business, financial condition or results of operations.
The increased provision of data services, including IPTV, has introduced significant new demands on TDS’ network and also has increased complexities related to network management. As it relates to Wireline’s networks, the transition to new IP-based networks from well-established time-division multiplexing networks requires new support tools and technician skills. Further, this transition requires the use of more leased facilities and partnerships which require enhanced network monitoring and controls. The IP-based networks also generally require more electronics on customers’ premises which introduces more technical risks and makes diagnostics and repairs more difficult.
Further, the increased provision of data services on TDS’ networks has created an increased level of risk related to quality of service. This is due to the fact that many customers increasingly rely on data communications to execute and validate transactions. As a result, redundancy and geographical diversity of TDS’ network facilities are critical to providing uninterrupted service. Also, the speed of repair and maintenance procedures in the event of network interruptions is critical to maintaining customer satisfaction. TDS’ ability to maintain high-quality, uninterrupted service to its customers is critical, particularly given the increasingly competitive environment and customers’ ability to choose other service providers.
In addition, TDS’ networks and information technology and the networks and information technology of vendors on which TDS relies are subject to damage or interruption due to various events, including power outages, computer, network and telecommunications failures, computer viruses, security breaches, hackers and other cyber security risks, catastrophic events, natural disasters, errors or unauthorized actions by employees and vendors, flawed conversion of systems, disruptive technologies and technology changes.
|
23)
|
TDS has experienced and, in the future, expects to experience cyber-attacks or other breaches of network or information technology security of varying degrees on a regular basis, which could have an adverse effect on TDS' business, financial condition or results of operations.
|
TDS experiences cyber-attacks of varying degrees on a regular basis. These include cyber-attacks intended to wrongfully obtain private and valuable information, or cause other types of malicious events, including denial of service attacks which may cause TDS' services to be disrupted or unavailable to customers. TDS maintains administrative, technical and physical controls, as well as other preventative actions, to reduce the risk of security breaches. Although to date TDS has not discovered a material security breach, these efforts may be insufficient to prevent a material security breach stemming from future cyber-attacks. If TDS’ or its vendors’ networks and information technology are not adequately adapted to changes in technology or are damaged or fail to function properly, and/or if TDS’ or its vendors’ security is breached or otherwise compromised, TDS could suffer adverse consequences, including theft, destruction or other loss of critical and private data, including customer and/or employee data, interruptions or delays in its operations, inaccurate billings, inaccurate financial reporting, and significant costs to remedy the problems. If TDS’ or its vendors’ systems become unavailable or suffer a security breach of customer or other data, TDS may be required to expend significant resources and take various actions to address the problems, including notification under data privacy laws and regulations, may be subject to fines, sanctions and litigation, and its reputation and operating results could be adversely affected. Such events may also cause TDS to fail to satisfy service level commitments or trigger contractual obligations to customers of its IT services. TDS continues to experience denial of service attacks. Although TDS has implemented and continues to enhance its protection and recovery measures in response to such attacks, these efforts may be insufficient to prevent a material denial of service attack in the future. Any material disruption in TDS’ networks or information technology, including security breaches, could have an adverse effect on TDS’ business, financial condition or results of operations.
21
|
24)
|
Changes in facts or circumstances, including new or additional information, could require TDS to record adjustments to amounts reflected in the financial statements, which could have an adverse effect on TDS’ business, financial condition or results of operations.
|
The preparation of financial statements requires TDS to make estimates and assumptions that affect the reported amounts of assets and liabilities at the date of the financial statements and the reported amounts of revenues and expenses during the reporting period. TDS bases its estimates on historical experience and on various other assumptions and information that are believed to be reasonable under the circumstances, the results of which form the basis for making judgments about the carrying values of assets and liabilities. Actual results may differ from estimates under different assumptions or conditions. Changes in facts or circumstances, including new or additional information, could require TDS to record charges in excess of amounts accrued in the financial statements, if any, which could have an adverse effect on TDS’ business, financial condition or results of operations.
|
25)
|
Disruption in credit or other financial markets, a deterioration of U.S. or global economic conditions or other events could, among other things, impede TDS’ access to or increase the cost of financing its operating and investment activities and/or result in reduced revenues and lower operating income and cash flows, which would have an adverse effect on TDS’ business, financial condition or results of operations.
|
Disruptions in the credit and financial markets, declines in consumer confidence, increases in unemployment, declines in economic growth, increased tariffs on import goods and uncertainty about corporate earnings could have a significant negative impact on the U.S. and global financial and credit markets and the overall economy. Such events could have an adverse impact on financial institutions resulting in limited access to capital and credit for many companies. Furthermore, economic uncertainties make it very difficult to accurately forecast and plan future business activities. Changes in economic conditions, changes in financial markets, changes in U.S. trade policies, deterioration in the capital markets or other factors could have an adverse effect on TDS’ business, financial condition, revenues, results of operations and cash flows.
|
26)
|
Settlements, judgments, restraints on its current or future manner of doing business and/or legal costs resulting from pending and future litigation could have an adverse effect on TDS’ business, financial condition or results of operations.
|
TDS is regularly involved in a number of legal and policy proceedings before the FCC and various state and federal courts. Such legal and policy proceedings can be complex, costly, protracted and highly disruptive to business operations by diverting the attention and energies of management and other key personnel.
The assessment of legal and policy proceedings is a highly subjective process that requires judgments about future events. Additionally, amounts ultimately received or paid upon settlement or resolution of litigation and other contingencies may differ materially from amounts accrued in the financial statements. Depending on a range of factors, these or similar proceedings could impose restraints on TDS’ current or future manner of doing business. Such potential outcomes could have an adverse effect on TDS’ financial condition, results of operations or ability to do business.
|
27)
|
The possible development of adverse precedent in litigation or conclusions in professional studies to the effect that radio frequency emissions from wireless devices and/or cell sites cause harmful health consequences, including cancer or tumors, or may interfere with various electronic medical devices such as pacemakers, could have an adverse effect on TDS’ wireless business, financial condition or results of operations.
|
Media reports and certain professional studies have suggested that certain radio frequency emissions from wireless devices may be linked to various health problems, including cancer or tumors, and may interfere with various electronic medical devices, including hearing aids and pacemakers. TDS is a party to and may in the future be a party to lawsuits against wireless carriers and other parties claiming damages for alleged health effects, including cancer or tumors, arising from wireless phones or radio frequency transmitters. Concerns over radio frequency emissions may discourage use of wireless devices or expose TDS to potential litigation. In addition, the FCC or other regulatory authorities may adopt regulations in response to concerns about radio frequency emissions. Any resulting decrease in demand for wireless services, costs of litigation and damage awards or regulation could have an adverse effect on TDS’ business, financial condition or results of operations.
In addition, some studies have indicated that some aspects of using wireless devices while driving may impair drivers’ attention in certain circumstances, making accidents more likely. These concerns could lead to potential litigation relating to accidents, deaths or serious bodily injuries, any of which could have an adverse effect on TDS’ business, financial condition or results of operations.
22
|
28)
|
Claims of infringement of intellectual property and proprietary rights of others, primarily involving patent infringement claims, could prevent TDS from using necessary technology to provide products or services or subject TDS to expensive intellectual property litigation or monetary penalties, which could have an adverse effect on TDS’ business, financial condition or results of operations.
|
TDS faces possible effects of industry litigation relating to patents, other intellectual property or otherwise, that may restrict TDS’ access to devices or network equipment critical to providing services to customers. If technology that TDS uses in products or services were determined by a court to infringe a patent or other intellectual property right held by another person, TDS could be precluded from using that technology and could be required to pay significant monetary damages. TDS also may be required to pay significant royalties to such person to continue to use such technology in the future. The successful enforcement of any intellectual property rights, or TDS’ inability to negotiate a license for such rights on acceptable terms, could force TDS to cease using the relevant technology and offering services incorporating the technology. Any litigation to determine the validity of claims that TDS’ products or services infringe or may infringe intellectual property rights of another, regardless of their merit or resolution, could be costly and divert the effort and attention of TDS’ management and technical personnel. Regardless of the merits of any specific claim, TDS cannot give assurance that it would prevail in litigation because of the complex technical issues and inherent uncertainties in intellectual property litigation. Although TDS generally seeks to obtain indemnification agreements from vendors that provide it with technology, there can be no assurance that any claim of infringement will be covered by an indemnity or that TDS will be able to recover all or any of its losses and costs under any available indemnity agreements. Any claims of infringement of intellectual property and proprietary rights of others could prevent TDS from using necessary technology to provide its services or subject TDS to expensive intellectual property litigation or monetary penalties, which could have an adverse effect on TDS’ business, financial condition or results of operations.
|
29)
|
Certain matters, such as control by the TDS Voting Trust and provisions in the TDS Restated Certificate of Incorporation, may serve to discourage or make more difficult a change in control of TDS or have other consequences.
|
The TDS Restated Certificate of Incorporation and the TDS bylaws contain provisions which may serve to discourage or make more difficult a change in control of TDS without the support of the TDS Voting Trust and the TDS Board of Directors or without meeting various other conditions.
The TDS Restated Certificate of Incorporation authorizes the issuance of different series of common stock, which have different voting rights. The TDS Series A Common Shares have the power to elect approximately 75% (less one) of the directors and have ten votes per share in matters other than the election of directors. The TDS Common Shares (with one vote per share) vote as a separate group only with respect to the election of 25% (plus one) of the directors. In addition, the total percentage voting power in matters other than the election of directors of the Series A Common Shares and Common Shares are fixed, at 56.7% and 43.3%, respectively, subject to adjustment due to changes in the number of outstanding Series A Common Shares.
A substantial majority of the outstanding TDS Series A Common Shares are held in the TDS Voting Trust which expires on June 30, 2035. The TDS Voting Trust was created to facilitate the long-standing relationships among the trustees’ certificate holders. By virtue of the number of shares held by them, the voting trustees have the power to elect eight directors based on the current TDS Board of Directors’ size of twelve directors, and control a majority of the voting power of TDS with respect to matters other than the election of directors.
The existence of the TDS Voting Trust is likely to deter any potential unsolicited or hostile takeover attempts or other efforts to obtain control of TDS and may make it more difficult for shareholders to sell shares of TDS at higher than market prices. The trustees of the TDS Voting Trust have advised TDS that they intend to maintain the ability to keep or dispose of voting control of TDS.
The TDS Restated Certificate of Incorporation also authorizes the TDS Board of Directors to designate and issue TDS Undesignated Shares in one or more classes or series of preferred or common stock from time to time. Generally, no further action or authorization by the shareholders is necessary prior to the designation or issuance of the additional TDS Undesignated Shares authorized pursuant to the TDS Restated Certificate of Incorporation unless applicable laws or regulations would require such approval in a given instance. Such TDS Undesignated Shares could be issued in circumstances that would serve to preserve control of TDS’ then existing management.
In addition, the TDS Restated Certificate of Incorporation includes a provision which authorizes the TDS Board of Directors to consider various factors, including effects on customers, taxes, and the long-term and short-term interests of TDS, in the context of a proposal or offer to acquire or merge the corporation, or to sell its assets, and to reject such offer if the TDS Board of Directors determines that the proposal is not in the best interests of the corporation based on such factors.
The provisions of the TDS Restated Certificate of Incorporation and the TDS bylaws and the existence of various classes of capital stock could prevent shareholders from profiting from an increase in the market value of their shares as a result of a change in control of TDS by delaying or preventing such change in control.
The provisions of the TDS Restated Certificate of Incorporation and the existence of different classes of capital stock and voting rights could result in the exclusion of TDS Common Shares from certain major stock indices at some point in the future, unless TDS is grandfathered by such stock indices or qualifies for some other exception.
23
|
30)
|
The market price of TDS’ Common Shares is subject to fluctuations due to a variety of factors.
|
Factors that may affect the future market price of TDS’ Common Shares include:
|
▪
|
General economic conditions, including conditions in the credit and financial markets;
|
|
▪
|
Industry conditions;
|
|
▪
|
Fluctuations in TDS’ quarterly customer additions, churn rate, revenues, results of operations or cash flows;
|
|
▪
|
Variations between TDS’ actual financial and operating results and those expected by analysts and investors; and
|
|
▪
|
Announcements by TDS’ competitors.
|
Any of these or other factors could adversely affect the future market price of TDS’ Common Shares, or could cause the future market price of TDS’ Common Shares to fluctuate from time to time.
|
31)
|
Any of the foregoing events or other events could cause revenues, earnings, capital expenditures and/or any other financial or statistical information to vary from TDS’ forward-looking estimates by a material amount.
|
From time to time, TDS may disclose forward-looking information, including estimates of future operating revenues; various measures of income before income taxes; and/or capital expenditures. Any such forward-looking information includes consideration of known or anticipated changes to the extent disclosed, but dynamic market conditions and/or other unknown or unanticipated events, including but not limited to the risks discussed above, could cause such estimates to differ materially from the actual amounts.
24
Item 1B. Unresolved Staff Comments
None.
Item 2. Properties
TDS has properties located throughout the United States. As of
December 31, 2018
, TDS’ Property, plant and equipment, net of accumulated depreciation, was as follows:
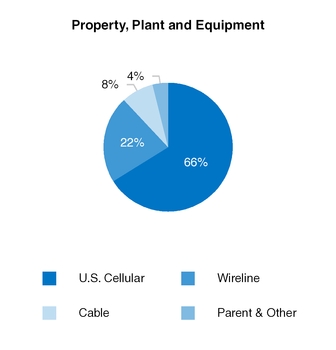
U.S. Cellular’s mobile telephone switching offices, cell sites, cell site equipment, call centers and retail stores are located primarily in U.S. Cellular’s operating markets and are either owned or leased by U.S. Cellular.
Wireline owns or leases its physical assets consisting of telephone distribution networks, network electronic equipment and land and buildings.
Cable owns or leases its physical assets consisting of cable distribution networks, headends, customer premises equipment, and land and buildings.
Parent and Other fixed assets consist of assets, which are either owned or leased, at TDS Corporate, HMS, and Suttle-Straus.
As of
December 31, 2018
, Property, plant and equipment, net of accumulated depreciation, totaled
$2,202 million
at U.S. Cellular,
$751 million
at Wireline,
$266 million
at Cable, and
$128 million
at Parent & Other. See Note
9
—
Property, Plant and Equipment
in the Notes to Consolidated Financial Statements for additional information.
Item 3. Legal Proceedings
TDS is involved or may be involved from time to time in legal proceedings before the FCC, other regulatory authorities, and/or various state and federal courts. If TDS believes that a loss arising from such legal proceedings is probable and can be reasonably estimated, an amount is accrued in the financial statements for the estimated loss. If only a range of loss can be determined, the best estimate within that range is accrued; if none of the estimates within that range is better than another, the low end of the range is accrued. The assessment of the expected outcomes of legal proceedings is a highly subjective process that requires judgments about future events. The legal proceedings are reviewed at least quarterly to determine the adequacy of accruals and related financial statement disclosures. The ultimate outcomes of legal proceedings could differ materially from amounts accrued in the financial statements. See Note
13
—
Commitments and Contingencies
in the Notes to Consolidated Financial Statements for further information.
Item 4. Mine Safety Disclosures
Not applicable.
25
PART II
Item 5. Market for Registrant’s Common Equity, Related Stockholder Matters and Issuer Purchases of Equity Securities
Market, holder, dividend and performance graph information is incorporated by reference from Exhibit 13 to this Form 10-K, Annual Report section entitled “Shareholder Information.”
TDS paid quarterly dividends per outstanding share of
$0.160
in
2018
,
$0.155
in
2017
and
$0.148
in
2016
. TDS increased the dividend per share to $0.165 in the first quarter of
2019
. TDS has no current plans to change its policy of paying dividends.
Information relating to Issuer Purchases of Equity Securities is set forth below.
On August 2, 2013, the Board of Directors of TDS authorized, and TDS announced by Form 8-K, a $250 million stock repurchase program for TDS Common Shares. Depending on market conditions, such shares may be repurchased in compliance with Rule 10b-18 of the Exchange Act, pursuant to Rule 10b5-1 under the Exchange Act, or pursuant to accelerated share repurchase arrangements, prepaid share repurchases, private transactions or as otherwise authorized. This authorization does not have an expiration date. TDS did not determine to terminate the foregoing Common Share repurchase program, or cease making further purchases thereunder, during the fourth quarter of
2018
.
TDS determines whether to repurchase shares from time to time based on many considerations, including cash needed for other known or possible requirements, the stock price, market conditions, debt rating considerations, business forecasts, business plans, macroeconomic conditions, share issuances under compensation plans, provisions in governing and legal documents and other legal requirements, and other facts and circumstances. Subject to these considerations, TDS may approve the repurchase of its shares from time to time when circumstances warrant.
The maximum dollar value of shares that may yet be purchased under this program was $
199
million as of
December 31, 2018
. There were no purchases made by or on behalf of TDS, and no open market purchases made by any “affiliated purchaser” (as defined by the SEC) of TDS, of TDS Common Shares during the quarter ended
December 31, 2018
.
Item 6. Selected Financial Data
Incorporated by reference from Exhibit 13 to this Form 10-K, Annual Report section entitled “Selected Consolidated Financial Data.”
Item 7. Management’s Discussion and Analysis of Financial Condition and Results of Operations
Incorporated by reference from Exhibit 13 to this Form 10-K, Annual Report section entitled “Management’s Discussion and Analysis of Financial Condition and Results of Operations.”
Item 7A. Quantitative and Qualitative Disclosures About Market Risk
Incorporated by reference from Exhibit 13 to this Form 10-K, Annual Report section entitled “Market Risk.”
Item 8. Financial Statements and Supplementary Data
Incorporated by reference from Exhibit 13 to this Form 10-K, Annual Report sections entitled “Consolidated Statement of Operations,” “Consolidated Statement of Comprehensive Income,” “Consolidated Statement of Cash Flows,” “Consolidated Balance Sheet,” “Consolidated Statement of Changes in Equity,” “Notes to Consolidated Financial Statements,” “Management’s Report on Internal Control Over Financial Reporting,” “Report of Independent Registered Public Accounting Firm,” and “Consolidated Quarterly Information (Unaudited).”
Item 9. Changes in and Disagreements with Accountants on Accounting and Financial Disclosure
None.
26
Item 9A. Controls and Procedures
Evaluation of Disclosure Controls and Procedures
TDS maintains disclosure controls and procedures (as defined in Rules 13a-15(e) and 15d-15(e) under the Exchange Act) that are designed to ensure that information required to be disclosed in its reports filed or submitted under the Exchange Act is processed, recorded, summarized and reported within the time periods specified in the SEC’s rules and forms, and that such information is accumulated and communicated to TDS’ management, including its principal executive officer and principal financial officer, as appropriate, to allow for timely decisions regarding required disclosure. In designing and evaluating the disclosure controls and procedures, management recognizes that any controls and procedures, no matter how well designed and operated, can provide only reasonable assurance of achieving the desired control objectives.
As required by SEC Rule 13a-15(b), TDS carried out an evaluation, under the supervision and with the participation of management, including its principal executive officer and principal financial officer, of the effectiveness of the design and operation of TDS’ disclosure controls and procedures as of the end of the period covered by this Annual Report. Based on this evaluation, the principal executive officer and principal financial officer have concluded that TDS’ disclosure controls and procedures were effective as of
December 31, 2018
, at the reasonable assurance level.
Management’s Report on Internal Control over Financial Reporting
Management is responsible for establishing and maintaining adequate internal control over financial reporting, as such term is defined in Rules 13a-15(f) and 15d-15(f) under the Exchange Act. TDS’ internal control over financial reporting is a process designed to provide reasonable assurance regarding the reliability of financial reporting and the preparation of financial statements for external purposes in accordance with accounting principles generally accepted in the United States of America (GAAP). TDS’ internal control over financial reporting includes those policies and procedures that (i) pertain to the maintenance of records that, in reasonable detail, accurately and fairly reflect the transactions and dispositions of the assets of the issuer; (ii) provide reasonable assurance that transactions are recorded as necessary to permit preparation of financial statements in accordance with GAAP, and that receipts and expenditures of the issuer are being made only in accordance with authorizations of management and, where required, the board of directors of the issuer; and (iii) provide reasonable assurance regarding prevention or timely detection of unauthorized acquisition, use, or disposition of the issuer’s assets that could have a material effect on the interim or annual consolidated financial statements.
Because of its inherent limitations, internal control over financial reporting may not prevent or detect misstatements. Also, projections of any evaluation of effectiveness to future periods are subject to the risk that controls may become inadequate because of changes in conditions, or that the degree of compliance with the policies or procedures may deteriorate.
Under the supervision and with the participation of TDS’ management, including its principal executive officer and principal financial officer, TDS conducted an evaluation of the effectiveness of its internal control over financial reporting as of
December 31, 2018
, based on the criteria established in the 2013 version of
Internal Control — Integrated Framework
issued by the Committee of Sponsoring Organizations of the Treadway Commission (COSO). Management has concluded that TDS maintained effective internal control over financial reporting as of
December 31, 2018
, based on criteria established in the 2013 version of
Internal Control — Integrated Framework
issued by the COSO.
The effectiveness of TDS’ internal control over financial reporting as of
December 31, 2018
, has been audited by PricewaterhouseCoopers LLP, an independent registered public accounting firm, as stated in the firm’s report which is incorporated by reference into Item 8 of this Annual Report on Form 10-K from Exhibit 13 filed herewith.
Changes in Internal Control over Financial Reporting
There were no changes in TDS’ internal control over financial reporting during the fourth quarter of
2018
that have materially affected, or are reasonably likely to materially affect, TDS’ internal control over financial reporting, except as follows: TDS implemented internal controls during the fourth quarter of
2018
to ensure that, upon adoption of the new lease accounting standard, leases will be properly evaluated and any impacts to the financial statements will be recognized in accordance with this new accounting standard effective January 1, 2019.
Item 9B. Other Information
The following information is being provided to update prior disclosures made pursuant to the requirements of Form 8-K, Item 2.03 – Creation of a Direct Financial Obligation or an Obligation Under an Off-Balance Sheet Arrangement of a Registrant.
TDS entered into a revolving credit agreement on May 10, 2018. A description of TDS' revolving credit agreement is included in TDS' Current Report on Form 8-K dated May 10, 2018, and is incorporated by reference herein.
Neither TDS nor U.S. Cellular borrowed or repaid any cash amounts under their revolving credit facilities in the fourth quarter of
2018
or through the filing date of this Form 10-K, and had no cash borrowings outstanding under their revolving credit facilities as of
December 31, 2018
, or as of the filing date of this Form 10-K.
Further, U.S. Cellular did not borrow or repay any cash amounts under its receivables securitization facility in the fourth quarter of
2018
or through the filing date of this Form 10-K, and had no cash borrowings outstanding under its receivables securitization facility as of
December 31, 2018
, or as of the filing date of this Form 10-K.
27
PART III
Item 10. Directors, Executive Officers and Corporate Governance
Incorporated by reference from Proxy Statement sections entitled “Election of Directors,” “Corporate Governance,” “Executive Officers” and “Section 16(a) Beneficial Ownership Reporting Compliance.”
Item 11. Executive Compensation
Incorporated by reference from Proxy Statement section entitled “Executive and Director Compensation.”
Item 12. Security Ownership of Certain Beneficial Owners and Management and Related Stockholder Matters
Incorporated by reference from Proxy Statement sections entitled “Security Ownership of Certain Beneficial Owners and Management” and “Securities Authorized for Issuance under Equity Compensation Plans.”
Item 13. Certain Relationships and Related Transactions, and Director Independence
Incorporated by reference from Proxy Statement sections entitled “Corporate Governance” and “Certain Relationships and Related Transactions.”
Item 14. Principal Accountant Fees and Services
Incorporated by reference from Proxy Statement section entitled “Fees Paid to Principal Accountants.”
28
PART IV
Item 15. Exhibits and Financial Statement Schedules
|
(a)
|
The following documents are filed as part of this report:
|
||
|
|
(1)
|
Financial Statements
|
|
|
|
|
Consolidated Statement of Operations
|
Annual Report*
|
|
|
|
Consolidated Statement of Comprehensive Income
|
Annual Report*
|
|
|
|
Consolidated Statement of Cash Flows
|
Annual Report*
|
|
|
|
Consolidated Balance Sheet
|
Annual Report*
|
|
|
|
Consolidated Statement of Changes in Equity
|
Annual Report*
|
|
|
|
Notes to Consolidated Financial Statements
|
Annual Report*
|
|
|
|
Management's Report on Internal Control Over Financial Reporting
|
Annual Report*
|
|
|
|
Report of Independent Registered Public Accounting Firm — PricewaterhouseCoopers LLP
|
Annual Report*
|
|
|
|
Consolidated Quarterly Information (Unaudited)
|
Annual Report*
|
|
|
|
*Incorporated by reference from Exhibit 13.
|
|
|
|
(2)
|
Financial Statement Schedules
|
|
|
|
|
|
Location
|
|
|
|
Los Angeles SMSA Limited Partnership and Subsidiary Financial Statements
|
S-1
|
|
|
|
Report of Independent Registered Public Accounting Firm — Ernst & Young LLP
|
S-2
|
|
|
|
Consolidated Balance Sheets
|
S-3
|
|
|
|
Consolidated Statements of Income
|
S-4
|
|
|
|
Consolidated Statements of Changes in Partners’ Capital
|
S-5
|
|
|
|
Consolidated Statements of Cash Flows
|
S-6
|
|
|
|
Notes to Consolidated Financial Statements
|
S-7
|
|
|
|
All other schedules have been omitted because they are not applicable or not required or because the required information is shown in the financial statements or notes thereto.
|
|
|
|
(3)
|
Exhibits
|
|
|
|
|
The exhibits set forth below are filed as a part of this Report. Compensatory plans or arrangements are identified below with an asterisk.
|
|
29
|
Exhibit Number
|
Description of Documents
|
|
3.1
|
|
|
3.2
|
|
|
4.1
|
|
|
4.2
|
|
|
4.3(a)
|
|
|
4.3(b)
|
|
|
4.3(c)
|
|
|
4.3(d)
|
|
|
4.3(e)
|
|
|
4.4(a)
|
|
|
4.4(b)
|
|
|
4.5(a)
|
|
|
4.5(b)
|
|
|
4.6(a)
|
|
|
4.6(b)
|
|
|
4.6(c)
|
|
|
4.6(d)
|
|
|
4.6(e)
|
|
|
4.6(f)
|
|
30
|
4.7
|
|
|
4.8
|
|
|
4.9(a)
|
|
|
4.9(b)
|
|
|
4.9(c)
|
|
|
4.10
|
|
|
4.11
|
|
|
9.1
|
|
|
10.1(a)*
|
|
|
10.1(b)*
|
|
|
10.1(c)*
|
|
|
10.1(d)*
|
|
|
10.2(a)*
|
|
|
10.2(b)*
|
|
|
10.2(c)*
|
|
|
10.3(a)*
|
|
|
10.3(b)*
|
|
|
10.3(c)*
|
|
|
10.4*
|
|
|
10.5*
|
|
|
10.6*
|
|
31
32
|
10.7(b)*
|
|
|
10.7(c)*
|
|
|
10.8(a)*
|
|
|
10.8(b)*
|
|
|
10.8(c)*
|
|
|
10.8(d)*
|
|
|
10.9*
|
|
|
10.10(a)*
|
|
|
10.10(b)*
|
|
|
10.11*
|
|
|
10.12*
|
|
|
10.13*
|
|
|
10.14*
|
|
|
10.15*
|
|
|
10.16*
|
|
|
10.17*
|
|
|
10.18*
|
|
|
10.19*
|
|
|
10.20*
|
|
|
10.21*
|
|
|
10.22*
|
|
|
10.23(a)*
|
|
33
|
10.23(b)*
|
|
|
10.24*
|
|
|
10.25*
|
|
|
10.26*
|
|
|
10.27*
|
|
|
10.28*
|
|
|
10.29**
|
|
|
10.30**
|
|
|
10.31**
|
|
|
10.32
|
|
|
10.33
|
|
|
10.34
|
|
|
10.35*
|
|
|
10.36*
|
|
|
13
|
|
|
21
|
|
|
23.1
|
|
|
23.2
|
|
|
31.1
|
|
|
31.2
|
|
34
|
32.1
|
|
|
32.2
|
|
|
101.INS
|
XBRL Instance Document
|
|
101.SCH
|
XBRL Taxonomy Extension Schema Document
|
|
101.PRE
|
XBRL Taxonomy Extension Presentation Linkbase Document
|
|
101.CAL
|
XBRL Taxonomy Extension Calculation Linkbase Document
|
|
101.LAB
|
XBRL Taxonomy Extension Label Linkbase Document
|
|
101.DEF
|
XBRL Taxonomy Extension Definition Linkbase Document
|
|
*
|
Indicates a management contract or compensatory plan or arrangement
|
|
**
|
Portions of this Exhibit have been omitted and filed separately with the Securities and Exchange Commission as part of an application for confidential treatment pursuant to the Securities Exchange Act of 1934, as amended. The application for confidential treatment has been granted.
|
35
Item 16. Form 10-K Summary
None.
36
LOS ANGELES SMSA LIMITED PARTNERSHIP AND SUBSIDIARY
FINANCIAL STATEMENTS
TDS’ subsidiary, U.S. Cellular, owns a 5.5% limited partnership interest in the Los Angeles SMSA Limited Partnership and Subsidiary, and accounts for such interest by the equity method. The partnership’s consolidated financial statements were obtained by U.S. Cellular as a limited partner.
S-1
Report of Independent Registered Public Accounting Firm
To the Partners of Los Angeles SMSA Limited Partnership
Opinion on the Financial Statements
We have audited the accompanying consolidated balance sheets of Los Angeles SMSA Limited Partnership and Subsidiary (the Partnership) as of December 31, 2018 and 2017, the related consolidated statements of income, changes in partners' capital and cash flows for each of the three years in the period ended December 31, 2018, and the related notes (collectively referred to as the "consolidated financial statements"). In our opinion, the consolidated financial statements present fairly, in all material respects, the financial position of the Partnership at December 31, 2018 and 2017, and the results of its operations and its cash flows for each of the three years in the period ended December 31, 2018 in conformity with U.S. generally accepted accounting principles.
Adoption of New Accounting Standards
ASU No. 2016-15
As discussed in Note 2 to the consolidated financial statements, on January 1, 2018 the Partnership retrospectively changed its method of presenting certain cash receipts and cash payments in the accompanying consolidated statements of cash flows as a result of the adoption of Financial Accounting Standards Board (FASB) Accounting Standards Update (ASU) No. 2016-15,
Statement of Cash Flows (Topic 230): Classification of Certain Cash Receipts and Cash Payments.
ASU No. 2014-09
As discussed in Note 2 to the consolidated financial statements, effective January 1, 2018 the Partnership changed its method for recognizing revenue as a result of the adoption of ASU No. 2014-09,
Revenue from Contracts with Customers (Topic 606)
, and the amendments in ASUs 2015-14, 2016-08, 2016-10 and 2016-12, using the modified retrospective method.
Basis for Opinion
These financial statements are the responsibility of the Partnership's management. Our responsibility is to express an opinion on the Partnership’s financial statements based on our audits. We are a public accounting firm registered with the Public Company Accounting Oversight Board (United States) (PCAOB) and are required to be independent with respect to the Partnership in accordance with the U.S. federal securities laws and the applicable rules and regulations of the Securities and Exchange Commission and the PCAOB.
We conducted our audits in accordance with the standards of the PCAOB and in accordance with auditing standards generally accepted in the United States of America. Those standards require that we plan and perform the audit to obtain reasonable assurance about whether the financial statements are free of material misstatement, whether due to error or fraud. Our audits included performing procedures to assess the risks of material misstatement of the financial statements, whether due to error or fraud, and performing procedures that respond to those risks. Such procedures included examining, on a test basis, evidence regarding the amounts and disclosures in the financial statements. Our audits also included evaluating the accounting principles used and significant estimates made by management, as well as evaluating the overall presentation of the financial statements. We believe that our audits provide a reasonable basis for our opinion.
/s/ Ernst & Young LLP
We have served as the Partnership’s auditor since 2014.
Orlando, Florida
February 22, 2019
S-2
Los Angeles SMSA Limited Partnership and Subsidiary
Consolidated Balance Sheets - As of
December 31, 2018
and
2017
|
(Dollars in Thousands)
|
2018
|
2017
|
|||||
|
ASSETS
|
|||||||
|
CURRENT ASSETS:
|
|||||||
|
Due from affiliate
|
$
|
256,812
|
|
$
|
218,838
|
|
|
|
Accounts receivable, net of allowances of $21,886 and $26,916
|
434,399
|
|
423,285
|
|
|||
|
Prepaid expenses and other
|
203,571
|
|
40,916
|
|
|||
|
Total current assets
|
894,782
|
|
683,039
|
|
|||
|
PROPERTY, PLANT AND EQUIPMENT - NET
|
1,998,538
|
|
1,936,038
|
|
|||
|
WIRELESS LICENSES
|
2,075,448
|
|
2,075,448
|
|
|||
|
OTHER ASSETS - NET
|
432,483
|
|
349,484
|
|
|||
|
TOTAL ASSETS
|
$
|
5,401,251
|
|
$
|
5,044,009
|
|
|
|
LIABILITIES AND PARTNERS' CAPITAL
|
|||||||
|
CURRENT LIABILITIES:
|
|||||||
|
Accounts payable and accrued liabilities
|
$
|
142,805
|
|
$
|
158,099
|
|
|
|
Contract liabilities and other
|
175,863
|
|
174,965
|
|
|||
|
Financing obligation
|
13,185
|
|
12,926
|
|
|||
|
Deferred rent
|
13,347
|
|
8,360
|
|
|||
|
Total current liabilities
|
345,200
|
|
354,350
|
|
|||
|
LONG TERM LIABILITIES:
|
|||||||
|
Financing obligation
|
111,868
|
|
111,318
|
|
|||
|
Deferred rent
|
143,586
|
|
141,410
|
|
|||
|
Other liabilities
|
29,264
|
|
7,841
|
|
|||
|
Total long term liabilities
|
284,718
|
|
260,569
|
|
|||
|
Total liabilities
|
629,918
|
|
614,919
|
|
|||
|
PARTNERS' CAPITAL
|
|||||||
|
General Partner's interest
|
1,908,533
|
|
1,771,636
|
|
|||
|
Limited Partners' interest
|
2,862,800
|
|
2,657,454
|
|
|||
|
Total partners' capital
|
4,771,333
|
|
4,429,090
|
|
|||
|
TOTAL LIABILITIES AND PARTNERS' CAPITAL
|
$
|
5,401,251
|
|
$
|
5,044,009
|
|
|
See notes to consolidated financial statements.
S-3
Los Angeles SMSA Limited Partnership and Subsidiary
Consolidated Statements of Income - For the Years Ended
December 31, 2018
,
2017
, and
2016
|
(Dollars in Thousands)
|
2018
|
2017
|
2016
|
||||||||
|
OPERATING REVENUES:
|
|
|
|
||||||||
|
Service revenues
|
$
|
3,766,062
|
|
$
|
3,791,371
|
|
$
|
3,996,989
|
|
||
|
Equipment revenues
|
1,153,954
|
|
982,251
|
|
930,690
|
|
|||||
|
Other
|
275,896
|
|
246,322
|
|
256,917
|
|
|||||
|
Total operating revenues
|
5,195,912
|
|
5,019,944
|
|
5,184,596
|
|
|||||
|
OPERATING EXPENSES:
|
|||||||||||
|
Cost of service (exclusive of depreciation)
|
1,115,475
|
|
1,107,614
|
|
1,070,302
|
|
|||||
|
Cost of equipment
|
1,212,952
|
|
1,174,858
|
|
1,193,924
|
|
|||||
|
Depreciation
|
369,874
|
|
355,696
|
|
356,848
|
|
|||||
|
Selling, general and administrative
|
1,095,048
|
|
1,168,978
|
|
1,278,205
|
|
|||||
|
Total operating expenses
|
3,793,349
|
|
3,807,146
|
|
3,899,279
|
|
|||||
|
OPERATING INCOME
|
1,402,563
|
|
1,212,798
|
|
1,285,317
|
|
|||||
|
OTHER INCOME:
|
|||||||||||
|
Interest income (expense), net
|
13,332
|
|
2,857
|
|
(6,552
|
)
|
|||||
|
Other
|
2,702
|
|
1,631
|
|
–
|
|
|||||
|
Total other income
|
16,034
|
|
4,488
|
|
(6,552
|
)
|
|||||
|
NET INCOME
|
$
|
1,418,597
|
|
$
|
1,217,286
|
|
$
|
1,278,765
|
|
||
|
Allocation of Net Income:
|
|||||||||||
|
General Partner
|
$
|
567,439
|
|
$
|
486,914
|
|
$
|
511,507
|
|
||
|
Limited Partners
|
$
|
851,158
|
|
$
|
730,372
|
|
$
|
767,258
|
|
||
See notes to consolidated financial statements.
S-4
Los Angeles SMSA Limited Partnership and Subsidiary
Consolidated Statements of Changes in Partners' Capital - For the Years Ended
December 31, 2018
,
2017
, and
2016
|
(Dollars in Thousands)
|
|||||||||||||||||||
|
|
General
Partner
|
Limited Partners
|
|
||||||||||||||||
|
|
AirTouch
Cellular Inc.
|
AirTouch
Cellular Inc.
|
Cellco
Partnership
|
United States
Cellular
Investment
Corporation of
Los Angeles
|
Total Partners'
Capital
|
||||||||||||||
|
BALANCE - January 1, 2016
|
$
|
1,433,215
|
|
$
|
1,515,626
|
|
$
|
437,131
|
|
$
|
197,067
|
|
$
|
3,583,039
|
|
||||
|
Distributions
|
(210,000
|
)
|
(222,075
|
)
|
(64,050
|
)
|
(28,875
|
)
|
(525,000
|
)
|
|||||||||
|
Net Income
|
511,507
|
|
540,917
|
|
156,009
|
|
70,332
|
|
1,278,765
|
|
|||||||||
|
BALANCE - January 1, 2017
|
$
|
1,734,722
|
|
$
|
1,834,468
|
|
$
|
529,090
|
|
$
|
238,524
|
|
$
|
4,336,804
|
|
||||
|
Distributions
|
(450,000
|
)
|
(475,875
|
)
|
(137,250
|
)
|
(61,875
|
)
|
(1,125,000
|
)
|
|||||||||
|
Net Income
|
486,914
|
|
514,912
|
|
148,509
|
|
66,951
|
|
1,217,286
|
|
|||||||||
|
BALANCE - December 31, 2017
|
$
|
1,771,636
|
|
$
|
1,873,505
|
|
$
|
540,349
|
|
$
|
243,600
|
|
$
|
4,429,090
|
|
||||
|
ASC 606 opening balance sheet adjustment
|
67,058
|
|
70,914
|
|
20,453
|
|
9,221
|
|
167,646
|
|
|||||||||
|
Distributions
|
(497,600
|
)
|
(526,212
|
)
|
(151,768
|
)
|
(68,420
|
)
|
(1,244,000
|
)
|
|||||||||
|
Net Income
|
567,439
|
|
600,067
|
|
173,069
|
|
78,022
|
|
1,418,597
|
|
|||||||||
|
BALANCE - December 31, 2018
|
$
|
1,908,533
|
|
$
|
2,018,274
|
|
$
|
582,103
|
|
$
|
262,423
|
|
$
|
4,771,333
|
|
||||
See notes to consolidated financial statements.
S-5
Los Angeles SMSA Limited Partnership and Subsidiary
Consolidated Statements of Cash Flows - For the Years Ended
December 31, 2018
,
2017
, and
2016
|
(Dollars in Thousands)
|
2018
|
2017
|
2016
|
||||||||
|
CASH FLOWS FROM OPERATING ACTIVITIES:
|
|
|
|
||||||||
|
Net Income
|
$
|
1,418,597
|
|
$
|
1,217,286
|
|
$
|
1,278,765
|
|
||
|
Adjustments to reconcile net income to net cash provided by operating activities:
|
|||||||||||
|
Depreciation
|
369,874
|
|
355,696
|
|
356,848
|
|
|||||
|
Imputed interest on financing obligation
|
11,686
|
|
12,374
|
|
12,284
|
|
|||||
|
Provision for uncollectible accounts
|
43,847
|
|
56,505
|
|
71,925
|
|
|||||
|
Changes in operating assets and liabilities:
|
|||||||||||
|
Accounts receivable
|
(39,867
|
)
|
(36,907
|
)
|
(153,704
|
)
|
|||||
|
Prepaid expenses and other
|
(614,263
|
)
|
(388,907
|
)
|
(68,871
|
)
|
|||||
|
Accounts payable and accrued liabilities
|
(2,541
|
)
|
(54,321
|
)
|
24,685
|
|
|||||
|
Contract liabilities and other
|
25,715
|
|
14,531
|
|
(6,099
|
)
|
|||||
|
Deferred rent
|
8,956
|
|
(5,159
|
)
|
(4,010
|
)
|
|||||
|
Other liabilities
|
22,716
|
|
7,683
|
|
41
|
|
|||||
|
Net cash provided by operating activities
|
1,244,720
|
|
1,178,781
|
|
1,511,864
|
|
|||||
|
CASH FLOWS FROM INVESTING ACTIVITIES:
|
|||||||||||
|
Capital expenditures
|
(575,351
|
)
|
(434,350
|
)
|
(449,005
|
)
|
|||||
|
Fixed asset transfers out
|
130,228
|
|
15,648
|
|
23,453
|
|
|||||
|
Acquisition of wireless licenses
|
—
|
|
—
|
|
(1,697
|
)
|
|||||
|
Collections on deferred purchase price and purchased receivables
|
9,331
|
|
86,009
|
|
83,453
|
|
|||||
|
Collection on beneficial interest - net
|
483,924
|
|
229,330
|
|
—
|
|
|||||
|
Change in due from affiliate
|
(37,974
|
)
|
63,008
|
|
(281,846
|
)
|
|||||
|
Net cash provided by (used in) investing activities
|
10,158
|
|
(40,355
|
)
|
(625,642
|
)
|
|||||
|
CASH FLOWS FROM FINANCING ACTIVITIES:
|
|||||||||||
|
Change in due to affiliate
|
—
|
|
—
|
|
(348,724
|
)
|
|||||
|
Repayments of financing obligation
|
(10,878
|
)
|
(13,426
|
)
|
(12,498
|
)
|
|||||
|
Distributions
|
(1,244,000
|
)
|
(1,125,000
|
)
|
(525,000
|
)
|
|||||
|
Net cash used in financing activities
|
(1,254,878
|
)
|
(1,138,426
|
)
|
(886,222
|
)
|
|||||
|
CHANGE IN CASH
|
—
|
|
—
|
|
—
|
|
|||||
|
CASH - Beginning of year
|
—
|
|
—
|
|
—
|
|
|||||
|
CASH - End of year
|
$
|
—
|
|
$
|
—
|
|
$
|
—
|
|
||
|
CASH PAID FOR INTEREST
|
$
|
—
|
|
$
|
—
|
|
$
|
2,576
|
|
||
|
NONCASH TRANSACTIONS FROM INVESTING ACTIVITIES:
|
|||||||||||
|
Accruals for capital expenditures
|
$
|
13,004
|
|
$
|
25,757
|
|
$
|
15,621
|
|
||
See notes to consolidated financial statements.
S-6
Los Angeles SMSA
Limited Partnership
and Subsidiary
Notes to Consolidated Financial Statements – For the Years Ended
December 31, 2018
,
2017
, and
2016
(Dollars in Thousands)
|
1.
|
ORGANIZATION AND MANAGEMENT
|
The consolidated financial statements include the accounts of the Los Angeles SMSA Limited Partnership (Los Angeles SMSA) and Los Angeles Edge LLC, a wholly owned subsidiary of Los Angeles SMSA (collectively, the “Partnership”). The principal activity of Los Angeles SMSA, formed in 1984, is to provide cellular service in the Los Angeles metropolitan statistical area. Los Angeles Edge LLC was formed during 2015 and was a bankruptcy remote special purpose entity (SPE), created for the purpose of selling wireless device payment plan agreement receivables to third parties (see Note 4). The Los Angeles Edge LLC entity was dissolved on March 29, 2018 and as of this date the Partnership consists of only Los Angeles SMSA.
In accordance with the partnership agreement, AirTouch Cellular Inc., an affiliate of Cellco Partnership (Cellco), and general partner of the Partnership, is responsible for managing the operations of the Partnership.
The partners and their respective ownership percentages of the Partnership as of December 31, 2018 were as follows:
|
General Partner:
|
|
|
|
AirTouch Cellular Inc.
|
40
|
%
|
|
|
||
|
Limited Partners:
|
||
|
AirTouch Cellular Inc.
|
42.3
|
%
|
|
Cellco Partnership
|
12.2
|
%
|
|
United States Cellular Investment Corporation of Los Angeles
|
5.5
|
%
|
Cellco is an indirect, wholly owned subsidiary of Verizon Communications Inc. (Verizon). Substantially all of the Partnership’s transactions represent transactions with, or processed by, Cellco and/or certain other affiliates (collectively, Verizon Wireless).
|
2.
|
SIGNIFICANT ACCOUNTING POLICIES
|
Consolidation –
The method of accounting applied to investments involves an evaluation of all significant terms of the investments that explicitly grant or suggest evidence of control or influence over the operations of the investee. The consolidated financial statements include the Partnership’s subsidiary which was a variable interest entity (VIE) where Los Angeles SMSA was deemed to be the primary beneficiary. All significant intercompany accounts and transactions have been eliminated (see Note 4).
Use of estimates
– The consolidated financial statements are prepared using U.S. generally accepted accounting principles (GAAP), which requires management to make estimates and assumptions that affect reported amounts and disclosures. Actual results could differ from those estimates.
Examples of significant estimates include: the allowance for uncollectible accounts, the recoverability of property, plant and equipment, the recoverability of wireless licenses and other long-lived assets, fair values of financial instruments, and beneficial interest.
Revenue recognition
– The Partnership earns revenue from contracts with customers, primarily through the provision of telecommunications services and through the sale of wireless equipment. These revenues are accounted for under Accounting Standards Update (ASU) 2014-09,
Revenue from Contracts with Customers
(Topic 606), which we adopted on January 1, 2018, using the modified retrospective approach. This standard update, along with related subsequently issued updates, clarifies the principles for recognizing revenue and develops a common revenue standard for GAAP. The standard update also amended the guidance for the recognition of costs to obtain customer contracts such that incremental costs of obtaining customer contracts will be deferred and amortized consistent with the transfer of the related good or service.
We also earn revenues that are not accounted for under Topic 606 from leasing arrangements (such as those from towers) and the interest on equipment financed under a device payment plan agreement when sold to the customer by an authorized agent.
The Partnership earns revenue primarily by providing access to and usage of our telecommunications network and selling equipment. Performance obligations in a typical contract, as determined in accordance with Topic 606, with a customer include service and equipment.
We offer our wireless services through a variety of plans on a postpaid or prepaid basis. For wireless service, we recognize revenue using an output method, either as the service allowance units are used or as time elapses, because it reflects the pattern by which we satisfy our performance obligation through the transfer of service to the customer. Monthly service is generally billed in advance, which results in a contract liability. See Note 3 for additional information. For postpaid plans where monthly usage exceeds the allowance, the overage usage represents options held by the customer for incremental services and the usage-based fee is recognized when the customer exercises the option (typically on a month-to-month basis), which is recorded as a contract asset.
S-7
We sell wireless devices and accessories. Equipment revenue is generally recognized when the products are delivered to and accepted by the customer, as this is when control passes to the customer. In addition to offering the sale of equipment on a standalone basis, we have two primary offerings through which customers pay for a wireless device, in connection with a service contract: fixed-term plans and device payment plans.
Under a fixed-term plan, the customer is sold the wireless device without any upfront charge or at a discounted price in exchange for entering into a fixed-term service contract (typically for a term of 24 months or less). This plan is currently only offered to business channel customers.
Under a device payment plan, the customer is sold the wireless device in exchange for a non-interest bearing installment note, which is repaid by the customer, typically over a 24-month term, and concurrently enters into a month-to-month contract for wireless service. Customers may be offered certain promotions that provide billing credits applied over a specified term, contingent upon the customer maintaining service. The credits are included in the transaction price, which are allocated to the performance obligations based on their relative selling price, and are recognized when earned.
A financing component exists in both our fixed-term plans and device payment plans because the timing of the payment for the device, which occurs over the contract term, differs from the satisfaction of the performance obligation, which occurs at contract inception upon transfer of device to the customer. We periodically assess, at the contract level, the significance of the financing component inherent in our fixed-term and device payment plan receivable based on qualitative and quantitative considerations related to our customer classes. These considerations include assessing the commercial objective of our plans, the term and duration of financing provided, interest rates prevailing in the marketplace, and credit risks of our customer classes, all of which impact our selection of appropriate discount rates. Based on current facts and circumstances, we determined that the financing component in our existing Wireless direct channel device payments and fixed-term contracts with customers is not significant and therefore is not accounted for separately. See Note 4 for additional information on the interest on equipment financed on a device payment plan agreement when sold to the customer by an authorized agent in our indirect channel.
Roaming revenue reflects service revenue earned by the Partnership when customers not associated with the Partnership operate in the service area of the Partnership and use the Partnership’s network. The roaming rates with third-party carriers associated with those customers are based on agreements with such carriers. The roaming rates and methodology to determine roaming revenues charged by the Partnership to Verizon Wireless are established by Verizon Wireless on a periodic basis and may not reflect current market rates (see Note 8).
Other revenues primarily consist of certain fees billed to customers for surcharges and elected services. The Partnership recognizes taxes imposed by governmental authorities on revenue-producing transactions between the Partnership and its customers, which are passed through to the customers, on a net basis.
Wireless contracts
– Total contract revenue, which represents the transaction price for service and equipment, is allocated between service and equipment revenue based on their estimated standalone selling prices. The Partnership estimates the standalone selling price of the device or accessory to be its retail price excluding subsidies or conditional purchase discounts. The Partnership estimates the standalone selling price of service to be the price that is offered to customers on month-to-month contracts that can be cancelled at any time without penalty (i.e., when there is no fixed-term for service) or when service is procured without the concurrent purchase of a device. In addition, the Partnership also assesses whether the service term is impacted by certain legally enforceable rights and obligations in the contract with customers, such as penalties that a customer would have to pay to early terminate a fixed-term contract or billing credits that would cease if the month-to-month wireless service is canceled. The assessment of these legally enforceable rights and obligations involves judgment and impacts the determination of the transaction price and related disclosures.
From time to time, customers may be offered certain promotions that provide customers on device payment plans with the right to upgrade to a new device after paying a specified portion of their device payment plan agreement amount and trading in their device in good working order. The Partnership accounts for this trade-in right as a guarantee obligation. The full amount of the trade-in right's fair value is recognized as a guarantee liability and results in a reduction to the revenue recognized upon the sale of the device. The guarantee obligation was insignificant to the consolidated financial statements at December 31, 2018 and 2017. The total transaction price is reduced by the guarantee obligation, which is accounted for outside the scope of Topic 606, and the remaining transaction price is allocated between the performance obligations within the contract.
Fixed-term plans generally include the sale of a wireless device at subsidized prices. This results in the creation of a contract asset at the time of sale, which represents the recognition of equipment revenue in excess of amounts billed.
For device payment plans, billing credits are accounted for as consideration payable to a customer and are included in the determination of total transaction price, resulting in a contract liability.
Verizon Wireless may provide a right of return on products and services for a short time period after a sale. These rights are accounted for as variable consideration when determining the transaction price, and accordingly the Partnership recognizes revenue based on the estimated amount to which the Partnership expects to be entitled after considering expected returns. Returns and credits are estimated at contract inception and updated at the end of each reporting period as additional information becomes available. Verizon Wireless also may provide credits or incentives on our products and services for contracts with resellers, which are accounted for as variable consideration when estimating the amount of revenue to recognize. These amounts are insignificant to the consolidated financial statements.
S-8
For certain bundled offerings/transactions involving third-party service providers, the Partnership evaluates gross versus net considerations by assessing indicators of control. These promotions have not been significant.
Operating expenses
– Operating expenses include expenses incurred directly by the Partnership, as well as an allocation of selling, general and administrative, and other operating expenses incurred by Verizon Wireless on behalf of the Partnership. Employees of Verizon Wireless provide services on behalf of the Partnership. These employees are not employees of the Partnership, therefore, operating expenses include direct and allocated charges of salary and employee benefit costs for the services provided to the Partnership. Verizon Wireless believes such allocations are calculated in accordance with the Partnership agreement and are determined using a reasonable method of allocating such costs (see Note 8). In 2018 and 2017, allocations were principally based on total subscribers; in 2016, allocations were based on total subscribers, the Partnership’s percentage of certain revenue streams, and customer gross additions or minutes-of-use. The impact of the change in allocation factors was insignificant to the consolidated financial statements.
Cost of roaming, included in cost of service, reflects costs incurred by the Partnership when customers associated with the Partnership operate and use a network in a service area not associated with the Partnership. The roaming rates with third-party carriers are based on agreements with such carriers. The roaming rates and methodology to determine roaming costs charged to the Partnership by Verizon Wireless are established by Verizon Wireless on a periodic basis and may not reflect current market rates (see Note 8).
Cost of equipment is recorded upon sale of the related equipment at Verizon Wireless’s cost basis. Inventory is wholly owned by Verizon Wireless until the moment of sale and is not recorded in the consolidated financial statements of the Partnership.
Maintenance and repairs
– The cost of maintenance and repairs, including the cost of replacing minor items not constituting substantial betterments, is charged principally to cost of service as these costs are incurred.
Advertising costs
–
Costs for advertising products and services as well as other promotional and sponsorship costs are allocated from Verizon Wireless and are charged to selling, general and administrative expenses in the periods, in which they are incurred (see Note 8).
Income taxes
– The Partnership is treated as a pass-through entity for income tax purposes and, therefore, is not subject to federal, state or local income taxes. Accordingly, no provision has been recorded for income taxes in the Partnership’s consolidated financial statements. The results of operations, including taxable income, gains, losses, deductions and credits, are allocated to and reflected on the income tax returns of the respective partners.
The Partnership files partnership income tax returns in the U.S. federal jurisdiction and various state and local jurisdictions. The Partnership remains subject to examination by tax authorities for tax years as early as 2015. It is reasonably possible that various current tax examinations will conclude or require reevaluations of the Partnership’s tax positions during this period. An estimate of the range of the possible change cannot be made until these tax matters are further developed or resolved.
Due from affiliate
– Due to/from affiliate principally represents the Partnership’s cash position with Verizon Wireless. Verizon Wireless manages, on behalf of the Partnership, all operating, investing and financing activities, of the Partnership. As such, the change in due from affiliate is reflected as an investing activity in the consolidated statements of cash flows.
In addition, cost of equipment and other operating expenses incurred by Verizon Wireless on behalf of the Partnership, as well as property, plant and equipment and wireless license transactions with affiliates, are charged to the Partnership through this account. Interest income on due from affiliate is based on the short term Applicable Federal Rate which was approximately 2.3%, 1.2% and 0.7% for the years ended December 31, 2018, 2017 and 2016, respectively. Interest expense on balances due to affiliate is based on the short-term Applicable Federal Rate of approximately 2.3% in 2018. In previous years, interest expense on due to affiliate balances was based on Verizon Wireless’s average cost of borrowing from Verizon which was approximately 4.7% and 4.8% in 2017 and 2016, respectively. Included in interest income (expense), net is interest income of $12,666, $5,928, and $1,390 for the years ended December 31, 2018, 2017 and 2016, respectively, related to due to from affiliate. Interest expense of $0, $0, and $2,683 was incurred during the years ended December 31, 2018, 2017, and 2016, respectively, all of which was capitalized.
Allowance for uncollectible accounts
– Accounts receivable are recorded in the consolidated financial statements at cost, net of an allowance for credit losses, with the exception of indirect-channel device payment plan loans. We maintain allowances for uncollectible accounts receivable, including our direct-channel device payment plan agreement receivables, for estimated losses resulting from the failure or inability of customers to make required payments. Indirect-channel device payment loans are considered financial instruments and are initially recorded at fair value net of imputed interest, and credit losses are recorded as incurred. However, loan balances are assessed annually for impairment and an allowance is recorded if the loan is considered impaired.
S-9
The Partnership’s allowance for uncollectible accounts receivable is based on management’s assessment of the collectability of specific customer accounts and includes consideration of the credit worthiness and financial condition of those customers. The Partnership records an allowance to reduce the receivables to the amount that is reasonably believed to be collectible. The Partnership also records an allowance for all other receivables based on multiple factors including historical experience with bad debts, the general economic environment and the aging of such receivables. Similar to traditional service revenue accounting treatment, the Partnership records direct device payment plan agreement bad debt expense based on an estimate of the percentage of equipment revenue that will not be collected. This estimate is based on a number of factors including historical write-off experience, credit quality of the customer base and other factors such as macroeconomic conditions. The Partnership monitors the aging of accounts with device payment plan agreement receivables and writes-off account balances if collection efforts are unsuccessful and future collection is unlikely.
Property, plant and equipment, and depreciation
– Property, plant and equipment is recorded at cost. Property, plant and equipment is depreciated on a straight-line basis.
Leasehold improvements are amortized over the shorter of the estimated life of the improvement or the remaining term of the related lease, calculated from the time the asset was placed in service.
When depreciable assets are retired or otherwise disposed of, the related cost and accumulated depreciation are deducted from the property, plant and equipment accounts and any gains or losses on disposition are recognized in income. Transfers of property, plant and equipment between Verizon Wireless and affiliates are recorded at net book value on the date of the transfer with an offsetting entry included in due from affiliate.
Interest associated with the construction of network-related assets is capitalized. Capitalized interest is reported as a reduction in interest expense and depreciated as part of the cost of the network-related assets.
Verizon Wireless continues to assess the estimated useful lives of property, plant and equipment and though the timing and extent of current deployment plans are subject to ongoing analysis and modification, we believe that the current estimates of useful lives are reasonable.
Other assets
– Other assets, net primarily includes beneficial interest and long-term device payment plan agreement receivables, net of allowances of $13,142 and $12,261 at December 31, 2018 and 2017, respectively (see Note 4).
Impairment
– All long-lived assets are reviewed for impairment whenever events or changes in circumstances indicate that the carrying amount of the asset may not be recoverable. If any indications of impairment are present, the Partnership would test for recoverability by comparing the carrying amount of the asset group to the net undiscounted cash flows expected to be generated from the asset group. If those net undiscounted cash flows do not exceed the carrying amount, the next step would be to determine the fair value of the asset and record an impairment, if any. The Partnership re-evaluates the useful-life determinations for these long-lived assets each year to determine whether events and circumstances warrant a revision to their remaining useful lives.
Wireless licenses
– Wireless licenses provide the Partnership with the exclusive right to utilize the designated radio frequency spectrum to provide wireless communications services. In addition, Verizon Wireless maintains wireless licenses that provide the Partnership with the right to utilize the designated radio frequency spectrum to provide wireless communications services to the Partnership’s customers. While licenses are issued for a fixed time, generally ten years, such licenses are subject to renewal by the Federal Communications Commission (FCC). License renewals, which are managed by Verizon Wireless, have historically occurred routinely and at nominal cost. Moreover, Verizon Wireless determined that there are currently no legal, regulatory, contractual, competitive, economic or other factors that limit the useful life of the wireless licenses. As a result, wireless licenses are treated as an indefinite-lived intangible asset. The useful life determination for wireless licenses is re-evaluated each year to determine whether events and circumstances continue to support an indefinite useful life. When evaluating for impairment, Verizon Wireless and the Partnership (to the extent it owns more than one license) aggregate wireless licenses into one single unit of accounting, since they are utilized on an integrated basis.
The average remaining renewal period of the Partnership’s wireless license portfolio was 7.6 years as of December 31, 2018.
Interest expense, if any, incurred while qualifying activities are performed to ready wireless licenses for their intended use is capitalized as part of wireless licenses. The capitalization period ends when the development is discontinued or substantially complete and the license is ready for its intended use.
Verizon Wireless, tests its’ wireless licenses balance for potential impairment annually or more frequently if impairment indicators are present. In 2018, Verizon Wireless performed a quantitative impairment assessment for its aggregate wireless licenses, which consisted of comparing the estimated fair value of its aggregate wireless licenses to the aggregated carrying amount as of the test date.
S-10
In 2017 and 2016, Verizon Wireless performed a qualitative impairment assessment to determine whether it is more likely than not that the fair value of aggregate wireless licenses was less than the carrying amount. As part of the assessment, several qualitative factors were considered, including market transactions, the business enterprise value of Verizon Wireless, macroeconomic conditions (including changes in interest rates and discount rates), industry and market considerations (including industry revenue and EBITDA (earnings before interest, taxes, depreciation and amortization) margin projections), the projected financial performance of Verizon Wireless, as well as other factors.
In addition, Verizon Wireless allocates to the Partnership, based on a reasonable methodology, any impairment loss recognized by Verizon Wireless for licenses included in Verizon Wireless’s national footprint. Verizon Wireless’s impairment assessments in 2018, 2017, and 2016 indicated that the fair value of its wireless licenses exceeded the carrying value and, therefore did not result in an impairment.
In 2018, 2017 and 2016, the Partnership also performed a qualitative impairment assessment similar to that described for its aggregate wireless licenses and confirmed the licenses were not impaired.
Financial instruments
– The carrying value of the Partnership’s wireless device payment plan agreement receivables and beneficial interest approximates fair value.
Fair value measurements
– Fair value of financial and non-financial assets and liabilities is defined as an exit price, representing the amount that would be received to sell an asset or paid to transfer a liability in an orderly transaction between market participants. The three-tier hierarchy for inputs used in measuring fair value, which prioritizes the inputs used in the methodologies of measuring fair value for assets and liabilities, is as follows:
Level 1 - Quoted prices in active markets for identical assets or liabilities
Level 2 - Observable inputs other than quoted prices in active markets for identical assets and liabilities
Level 3 - No observable pricing inputs in the market
Financial assets and financial liabilities are classified in their entirety based on the lowest level of input that is significant to the fair value measurements. The assessment of the significance of a particular input to the fair value measurements requires judgment, and may affect the valuation of the assets and liabilities being measured and their categorization within the fair value hierarchy. As of December 31, 2018, 2017, and 2016, the Partnership did not have any assets or liabilities measured at fair value on a recurring basis.
Distributions
– The Partnership is required to make distributions to its partners based upon the Partnership’s operating results, due to/from affiliate status and financing needs as determined by the General Partner at the date of the distribution, which are typically made in arrears.
Variable interest entities (VIEs)
– VIEs are entities that lack sufficient equity to permit the entity to finance its activities without additional subordinated financial support from other parties, have equity investors that do not have the ability to make significant decisions relating to the entity’s operations through voting rights, do not have the obligation to absorb the expected losses or do not have the right to receive the residual returns of the entity. The Partnership consolidates the assets and liabilities of VIEs when it is deemed to be the primary beneficiary. The primary beneficiary is the party that has the power to make the decisions that most significantly affect the economic performance of the VIE and has the obligation to absorb losses or the right to receive benefits that could potentially be significant to the VIE.
Recently adopted accounting standards
– In August 2016, the Financial Accounting Standards Board (FASB) issued Accounting Standards Update (ASU) 2016-15,
Statement of Cash Flows (Topic 230): Classification of Certain Cash Receipts and Cash Payments
. This standard update addresses eight specific cash flow issues with the objective of reducing the existing diversity in practice for these issues. Among the updates, this standard update requires cash receipts from payments on a transferor’s beneficial interests in securitized trade receivables to be classified as cash inflows from investing activities. This standard update is effective as of the first quarter of 2019; however, early adoption is permitted, and as allowed the Partnership early adopted in the first quarter of 2018. The amendment relating to beneficial interests in securitization transactions impacted the Partnership’s presentation of collections of certain beneficial interest from sales of wireless device payment plan agreement receivables in the Partnership’s consolidated statements of cash flows. Upon adoption of this standard update in the first quarter of 2018, the Partnership retrospectively reclassified approximately $39,848 and $212,987 of deferred purchase price and beneficial interest collections, respectively, from cash flows from operating activities to cash flows from investing activities in the Partnership’s consolidated statements of cash flows for the year ended December 31, 2017 and $81,670 of deferred purchase price for the year ended December 31, 2016.
S-11
In May 2014, the FASB issued ASU 2014-09,
Revenue from Contracts with Customers (Topic 606)
. This standard update, along with related subsequently issued updates, clarifies the principles for recognizing revenue and develops a common revenue standard for GAAP. The standard update also amends current guidance for the recognition of costs to obtain customer contracts such that incremental costs of obtaining customer contracts are deferred and amortized consistent with the transfer of the related good or service. The standard update intends to provide a more robust framework for addressing revenue issues; improve comparability of revenue recognition practices across entities, industries, jurisdictions and capital markets; and provide more useful information to users of financial statements through improved disclosure requirements. The Partnership adopted this standard update on January 1, 2018 using the modified retrospective method. As this method requires that the cumulative effect of initially applying the standard be recognized at the date of adoption, the Partnership recorded the cumulative effect of $167,646 as an adjustment to the January 1, 2018 opening balance of Partners’ capital.
See Note 3 for additional information related to revenues and contract costs, including qualitative and quantitative disclosures required under Topic 606.
The cumulative effect of the changes made to our consolidated balance sheet for the adoption of Topic 606 was as follows:
|
(dollars in thousands)
|
At December 31, 2017
|
Adjustments due to Topic 606
|
At January 1, 2018
|
|||
|
Accounts receivable, net of allowances
|
423,285
|
|
313
|
|
423,598
|
|
|
Prepaid expenses and other
|
40,916
|
|
84,068
|
|
124,984
|
|
|
Other assets - net
|
349,484
|
|
59,194
|
|
408,678
|
|
|
Contract liabilities and other
|
174,965
|
|
(24,816
|
)
|
150,149
|
|
|
Other liabilities
|
7,841
|
|
745
|
|
8,586
|
|
|
Partners' capital
|
4,429,090
|
|
167,646
|
|
4,596,736
|
|
Recently issued accounting standards
–
In June 2016, the FASB issued ASU 2016-13,
Financial Instruments - Credit Losses (Topic 326): Measurement of Credit Losses on Financial Instruments.
This standard update requires that certain financial assets be measured at amortized cost net of an allowance for estimated credit losses such that the net receivable represents the present value of expected cash collection. In addition, this standard update requires that certain financial assets be measured at amortized cost reflecting an allowance for estimated credit losses expected to occur over the life of the assets. The estimate of credit losses must be based on all relevant information including historical information, current conditions and reasonable and supportable forecasts that affect the collectability of the amounts. This standard update is effective as of the first quarter of 2020; however, early adoption is permitted. The Partnership is currently evaluating the impact that this standard update will have on its various financial instruments that include, but are not limited to, device payment plan agreement receivables and service receivables.
In February 2016, the FASB issued ASU 2016-02,
Leases (Topic 842)
. This standard update was issued to increase transparency and improve comparability by requiring entities to recognize assets and liabilities on the balance sheet for all leases, with certain exceptions. In addition, through improved disclosure requirements, the standard update will enable users of financial statements to further understand the amount, timing, and uncertainty of cash flows arising from leases. This standard update allows for a modified retrospective application and is effective as of the first quarter of 2020; however, early adoption is permitted. Entities are allowed to apply the modified retrospective approach (1) retrospectively to each prior reporting period presented in the financial statements with the cumulative-effect adjustment recognized at the beginning of the earliest comparative period presented or (2) retrospectively at the beginning of the period of adoption through a cumulative-effect adjustment. The Partnership will adopt this standard on January 1, 2019 using the modified retrospective approach with a cumulative-effect adjustment to opening retained earnings recorded at the beginning of the period of adoption. Therefore, upon adoption, the Partnership will recognize and measure leases without revising comparative period information or disclosure. The modified retrospective approach includes a number of optional practical expedients that entities may elect to apply.
The Partnership has completed its assessment of the transition practical expedients offered by the standard. These practical expedients lessen the transitional burden of implementing the standard update by not requiring a reassessment of certain conclusions reached under existing lease accounting guidance. Accordingly, we will apply these practical expedients and will not reassess: (1) whether an expired or existing contract is a lease or contains an embedded lease; (2) lease classification of an expired or existing lease; (3) initial direct costs for an existing lease; and (4) whether an existing or expired land easement is or contains a lease if it has not historically been accounted for as a lease. We have identified and implemented a new system solution to meet the requirements of the new standard and have identified and implemented processes and internal controls to meet the standards reporting and disclosure requirements.
Upon adoption of this standard, there will be a significant impact in our consolidated balance sheet as the Partnership expects to recognize a right-of-use asset and liability related to substantially all operating lease arrangements of between $665 million and $765 million. The Partnership’s current operating lease portfolio included in this range is primarily comprised of network equipment including towers, distributed antenna systems and small cells, real estate, and equipment leases. In addition, the Partnership expects a lower amount of lease costs to qualify as initial direct costs under the new standard which will result in an immediate recognition of expense instead of recognition of expense over time.
Subsequent events
– Events subsequent to December 31, 2018 have been evaluated through February 22, 2019, the date the consolidated financial statements were available to be issued.
S-12
|
3.
|
REVENUE AND CONTRACT COSTS
|
The Partnership earns revenue from contracts with customers, primarily through the provision of telecommunications and other services and through the sale of wireless equipment. The Partnership accounts for these revenues under Topic 606, which was adopted on January 1, 2018, using the modified retrospective approach. Revenue is disaggregated on the consolidated Statements of Income by products and services, which we view as the relevant categorization of revenues for the Partnership. There are also revenues earned that are not accounted for under Topic 606 including from leasing arrangements (such as those for towers), and the interest on equipment financed on a device payment plan agreement when sold to the customer by an authorized agent. During 2018, revenues from arrangements that were not accounted for under Topic 606 were insignificant to the consolidated financial statements.
The Partnership applied the new revenue recognition standard to customer contracts not completed at the date of initial adoption. For incomplete contracts that were modified before the date of adoption, the Partnership elected to use the practical expedient available under the modified retrospective method, which allows us to aggregate the effect of all modifications when identifying satisfied and unsatisfied performance obligations, determining the transaction price and allocating transaction price to the satisfied and unsatisfied performance obligations for the modified contract at transition. Results for reporting periods beginning after January 1, 2018 are presented under Topic 606, while amounts reported for prior periods have not been adjusted and continue to be reported under accounting standards in effect for those periods.
Prior to the adoption of Topic 606, we were required to limit the revenue recognized when a wireless device was sold to the amount of consideration that was not contingent on the provision of future services, which was typically limited to the amount of consideration received from the customer at the time of sale. Under Topic 606, the total consideration in the contract is allocated between wireless equipment and service based on their relative standalone selling prices. This change primarily impacts our arrangements that include sales of wireless devices at subsidized prices in conjunction with a fixed-term plan, also known as the subsidy model, for service. Accordingly, under Topic 606, generally more equipment revenue is recognized upon sale of the equipment to the customer and less service revenue is recognized over the contract term than was previously recognized under the prior "
Revenue Recognition
" (Topic 605) standard. At the time the equipment is sold, this allocation results in the recognition of a contract asset equal to the difference between the amount of revenue recognized and the amount of consideration received from the customer. As of January 2017, we no longer offer consumers new fixed-term plans with subsidized equipment pricing; however, we continue to offer fixed-term plans to our business customers.
Topic 606 also requires the deferral of incremental costs incurred to obtain a customer contract, which are then amortized to expense, as a component of selling, general and administrative expense, over the respective periods of expected benefit. As a result, a significant amount of our sales commission costs, which were historically expensed as incurred under previous accounting, are now deferred and amortized under Topic 606.
Finally, under Topic 605, at the time of the sale of a device, we imputed risk adjusted interest on the device payment plan agreement receivables. We recorded the imputed interest as a reduction to the related accounts receivable and interest income was recognized over the financed device payment term. Under Topic 606, while there continues to be a financing component in both the fixed-term plans and device payment plans, also known as the installment model, we have determined that this financing component for our customer classes in the direct channel is not significant and therefore we no longer impute interest for these contracts. This change results in additional revenue recognized upon the sale of wireless devices and no interest income recognized over the device payment term.
A reconciliation of the adjustments from the adoption of Topic 606 relative to Topic 605 on certain impacted financial statement line items in our consolidated statement of income and balance sheet were as follows:
S-13
|
At December 31, 2018
|
|||||||||
|
(dollars in thousands)
|
As reported
|
Balances without adoption of Topic 606
|
Adjustments
|
||||||
|
ASSETS
|
|||||||||
|
CURRENT ASSETS:
|
|||||||||
|
Due from affiliate
|
$
|
346,326
|
|
$
|
331,618
|
|
$
|
14,708
|
|
|
Accounts receivable, net of allowances
|
434,399
|
|
423,383
|
|
11,016
|
|
|||
|
Prepaid expenses and other
|
177,520
|
|
55,387
|
|
122,133
|
|
|||
|
OTHER ASSETS NET
|
369,021
|
|
280,809
|
|
88,212
|
|
|||
|
LIABILITIES AND PARTNERS' CAPITAL
|
|||||||||
|
Contract liabilities and other
|
$
|
175,863
|
|
$
|
198,085
|
|
$
|
(22,222
|
)
|
|
LONG TERM LIABILITIES:
|
|||||||||
|
Other liabilities
|
29,264
|
|
35,443
|
|
(6,179
|
)
|
|||
|
PARTNERS' CAPITAL
|
|||||||||
|
General Partners' interest
|
$
|
1,908,533
|
|
$
|
1,802,744
|
|
$
|
105,789
|
|
|
Limited Partners' interest
|
2,862,800
|
|
2,704,118
|
|
158,682
|
|
|||
|
Twelve Months Ended December 31, 2018
|
|||||||||
|
(dollars in thousands)
|
As reported
|
Balances without adoption of Topic 606
|
Adjustments
|
||||||
|
OPERATING REVENUE:
|
|||||||||
|
Service revenues
|
$
|
3,766,062
|
|
$
|
3,818,424
|
|
$
|
(52,362
|
)
|
|
Equipment revenues
|
1,153,954
|
|
1,060,106
|
|
93,848
|
|
|||
|
Other
|
275,896
|
|
278,334
|
|
(2,438
|
)
|
|||
|
Total Operating Revenues
|
5,195,912
|
|
5,156,864
|
|
39,048
|
|
|||
|
OPERATING EXPENSES:
|
|||||||||
|
Cost of equipment
|
$
|
1,212,952
|
|
$
|
1,206,710
|
|
$
|
6,242
|
|
|
Selling, general and administrative
|
1,095,048
|
|
1,159,066
|
|
(64,018
|
)
|
|||
|
NET INCOME
|
$
|
1,418,597
|
|
$
|
1,321,773
|
|
$
|
96,824
|
|
Remaining performance obligations
– When allocating the total contract transaction price to identified performance obligations, a portion of the total transaction price may relate to service performance obligations which were not satisfied or are partially satisfied as of the end of the reporting period. Below we disclose information relating to these unsatisfied performance obligations. The Partnership has elected to apply certain practical expedients available under Topic 606, including the option to exclude the expected revenues arising from unsatisfied performance obligations related to contracts that have an original expected duration of one year or less, which primarily relate to certain month-to-month service contracts.
Additionally, certain contracts provide customers the option to purchase additional services. The fee related to the additional services is recognized when the customer exercises the option (typically on a month-to-month basis).
Customer contracts are generally either month-to-month and cancellable at any time (typically under a device payment plan) or contain terms greater than one month (typically under a fixed-term plan). Additionally, customers may incur charges based on usage or may purchase additional optional services in conjunction with entering into a contract which can be cancelled at any time and therefore are not included in the transaction price. When a service contract is longer than one month, the service contract term will generally be two years or less.
The customers also include other telecommunications companies who utilize Verizon Wireless’s network to resell wireless service to their respective end customers. Reseller arrangements occur on a month-to-month basis or include a stated contract term, which generally extends longer than two years. Arrangements with a stated contract term generally include an annual minimum revenue commitment over the term of the contract for which revenues will be recognized in future periods.
S-14
At December 31, 2018, the transaction price related to unsatisfied performance obligations expected to be recognized for 2019, 2020 and thereafter was $445,832, $162,829 and insignificant, respectively.
Accounts receivable and contract balances
– The timing of revenue recognition may differ from the time of billing to the customers. Receivables presented in the consolidated balance sheet represent an unconditional right to consideration. Contract balances represent amounts from an arrangement when either the Partnership has performed, by transferring goods or services to the customer in advance of receiving all or partial consideration for such goods and services from the customer, or the customer has made payment to the Partnership in advance of obtaining control of the goods and/or services promised to the customer in the contract.
Contract assets primarily relate to the Partnership’s rights to consideration for goods or services provided to the customers but for which there is not an unconditional right at the reporting date. Under a fixed-term plan, the total contract revenue is allocated between wireless services and equipment revenues, as discussed above. In conjunction with these arrangements, a contract asset is created, which represents the difference between the amount of equipment revenue recognized upon sale and the amount of consideration received from the customer. The contract asset is recognized as accounts receivable as wireless services are provided and billed. The Partnership has the right to bill the customer as service is provided over time, which results in the right to the payment being unconditional. The contract asset balances are presented in the consolidated balance sheet as prepaid expenses and other and other assets - net. The Partnership assesses the contract assets for impairment on an annual basis and will recognize an impairment charge to the extent the carrying amount is not recoverable. The impairment charge related to contract assets was insignificant for the year ended December 31, 2018. The December 31, 2018 contract asset balance included increases throughout the year resulting from new contracts offset by contract assets reclassified to a receivable and insignificant other changes.
Contract liabilities arise when customers are billed and the Partnership receives consideration in advance of providing the goods or services promised in the contract. The majority of the contract liability at January 1, 2018 was recognized during 2018 as these contract liabilities primarily relate to advanced billing for fixed monthly fees for service that are recognized within the following month. Other insignificant contract liabilities include deferrals of upfront fees that are recognized straight line over the contract term or material right period. The contract liability balances are presented in the consolidated balance sheet as contract liabilities and other and other liabilities.
The balance of receivables, contract assets and contract liabilities recorded in our consolidated balance sheet were as follows:
|
(dollars in thousands)
|
At January 1, 2018
|
At December 31, 2018
|
||||
|
Receivables
(1)
|
$
|
211,388
|
|
$
|
206,856
|
|
|
Device payment plan agreement receivables
(2)
|
1,678
|
|
162,619
|
|
||
|
Contract assets
|
46,964
|
|
41,193
|
|
||
|
Contract liabilities
|
148,797
|
|
178,905
|
|
||
(1) Balances do not include receivables related to the following contracts: leasing arrangements (such as towers) and the interest on equipment financed on a device payment plan agreement when sold to the customer by an authorized agent.
(2) Included in device payment plan agreement receivables presented in Note 4. Balances do not include receivables related to contracts completed prior to January 1, 2018 and receivables derived from the sale of equipment on a device payment plan through an authorized agent.
Contract costs
– As discussed in Note 2, Topic 606 requires the recognition of an asset for incremental costs to obtain a customer contract, which are then amortized to expense, over the respective periods of expected benefit. The Partnership recognizes a contract asset for incremental deferred commission expenses paid to internal sales personnel and agents in conjunction with obtaining customer contracts, as well as a contract asset for incremental deferred commission expense paid to affiliated markets when customers purchase equipment from affiliated markets. The costs are only deferred when it is determined the commissions are, in fact, incremental and would not have been incurred absent the customer contract. Costs to obtain a contract are amortized and recorded ratably as commission expense over the period representing the transfer of goods or services to which the assets relate. Costs to obtain contracts are amortized over two to three years, as such costs are typically incurred each time a customer upgrades.
We determine the amortization periods for our costs incurred to obtain a customer contract at a portfolio level due to the similarities within these customer contract portfolios.
Other costs, such as general costs or costs related to past performance obligations, are expensed as incurred.
Deferred contract costs are classified as current or non-current within prepaid expenses and other assets, respectively. The balances of deferred contract costs as of December 31, 2018, included in our consolidated balance sheet were as follows:
|
(dollars in thousands)
|
2018
|
||
|
Prepaid expenses
|
$
|
99,062
|
|
|
Other assets
|
70,062
|
|
|
|
Total
|
$
|
169,124
|
|
For the year ended December 31, 2018, the Partnership recognized expense of $97,782 associated with the amortization of deferred contract costs, primarily within selling, general and administrative expense in the consolidated statements of income.
S-15
The Partnership assesses deferred contract costs for impairment on an annual basis. An impairment charge is recognized to the extent the carrying amount of a deferred cost exceeds the remaining amount of consideration expected to be received in exchange for the goods and services related to the cost, less the expected costs related directly to providing those goods and services that have not yet been recognized as expenses. There have been no impairment charges recognized for the year ended December 31, 2018.
|
4.
|
WIRELESS DEVICE
PAYMENT
PLANS
|
Under the Verizon Wireless device payment program, eligible Partnership customers can purchase wireless devices under a device payment plan agreement. Customers that activate service on devices purchased under the device payment program pay lower service fees as compared to those under fixed-term service plans, and their device payment plan charge is included on their wireless monthly bill. As of January 2017, the Partnership no longer offers consumers new fixed-term service plans for phones; however, the Partnership continues to offer fixed-term plans to business customers.
Wireless device payment plan agreement receivables
– The following table displays device payment plan agreement receivables, net, that are recognized in the accompanying consolidated balance sheets as of December 31, 2018 and 2017:
|
|
2018
|
2017
|
|||||
|
Device payment plan agreement receivables, gross
|
$
|
332,680
|
|
$
|
311,677
|
|
|
|
Unamortized imputed interest
|
(7,196
|
)
|
(15,430
|
)
|
|||
|
Device payment plan agreement receivables, net of unamortized imputed interest
|
325,484
|
|
296,247
|
|
|||
|
Allowance for credit losses
|
(24,869
|
)
|
(33,897
|
)
|
|||
|
Device payment plan agreement receivables, net
|
$
|
300,615
|
|
$
|
262,350
|
|
|
|
Classified on the consolidated balance sheets:
|
|||||||
|
Accounts receivable, net
|
$
|
159,289
|
|
$
|
140,895
|
|
|
|
Other assets, net
|
$
|
141,326
|
|
$
|
121,455
|
|
|
|
Device payment plan agreement receivables, net
|
$
|
300,615
|
|
$
|
262,350
|
|
|
Verizon Wireless may offer certain promotions that allow a customer to trade in their owned device in connection with the purchase of a new device. Under these types of promotions, the customer receives a credit for the value of the trade-in device. In addition, Verizon Wireless may provide the customer with additional future credits that will be applied against the customer’s monthly bill as long as service is maintained. The Partnership recognizes a liability for the trade-in device measured at fair value, which is determined by considering several factors, including the weighted-average selling prices obtained in recent resales of similar devices eligible for trade-in. Future credits are recognized when earned by the customer. Device payment plan agreement receivables, net does not reflect the trade-in device liability. At December 31, 2018 and 2017, the amount of trade-in liability was insignificant to the consolidated financial statements.
From time to time, customers may be offered certain marketing promotions that allow customers to upgrade to a new device after paying down a specified portion of the required device payment plan agreement amount as well as trading in their device in good working order. When a customer enters into a device payment plan agreement with the right to upgrade to a new device, the Partnership accounts for this trade-in right as a guarantee obligation. At December 31, 2018 and 2017, the amount of the trade-in right guarantee obligation was insignificant to the consolidated financial statements.
For indirect channel contracts with customers, we impute risk adjusted interest on the device payment plan agreement receivables. We record the imputed interest as a reduction to the related accounts receivable. Interest income, which is included within other revenue in the consolidated statements of income, is recognized over the financed device payment term. See Note 3 for additional information on financing considerations with respect to direct channel contracts with customers.
When originating device payment plan agreements, Verizon Wireless uses internal and external data sources to create a credit risk score to measure the credit quality of a customer and to determine eligibility for the device payment program. If a customer is either new to Verizon Wireless or has less than 210 days of customer tenure (a new customer), the credit decision process relies more heavily on external data sources. If the customer has 210 days or more of customer tenure (an existing customer), the credit decision process relies on internal data sources. The Partnership’s experience has been that the payment attributes of longer-tenured customers are highly predictive in estimating their ability to pay in the future. External data sources include obtaining a credit report from a national consumer credit reporting agency, if available. Internal data and/or credit data obtained from the credit reporting agencies is used to create a custom credit risk score. The custom credit risk score is generated automatically (except with respect to a small number of applications where the information needs manual intervention) from the applicant’s credit data using Verizon Wireless proprietary custom credit models, which are empirically derived and demonstrably and statistically sound. The credit risk score measures the likelihood that the potential customer will become severely delinquent and be disconnected for non-payment. For a small portion of new customer applications, a traditional credit report is not available from one of the national credit reporting agencies because the potential customer does not have sufficient credit history. In those instances, alternate credit data is used for the risk assessment.
S-16
Based on the custom credit risk score, we assign each customer to a credit class, each of which has specified offers of credit including an account level spending limit and either a maximum amount of credit allowed per device or a required down payment percentage. During the fourth quarter of 2018 the Partnership moved all customers, new and existing, from a required down payment percentage, between zero and 100%, to a maximum amount of credit per device.
Subsequent to origination, the Partnership monitors delinquency and write-off experience as key credit quality indicators for its portfolio of device payment plan agreement receivables and fixed-term service plans. The extent of collection efforts with respect to a particular customer are based on the results of proprietary custom empirically derived internal behavioral-scoring models that analyze the customer’s past performance to predict the likelihood of the customer falling further delinquent. These customer-scoring models assess a number of variables, including origination characteristics, customer account history and payment patterns. Based on the score derived from these models, accounts are grouped by risk category to determine the collection strategy to be applied to such accounts. The Partnership continuously monitors collection performance results and the credit quality of device payment plan agreement receivables based on a variety of metrics, including aging. The Partnership considers an account to be delinquent and in default status if there are unpaid charges remaining on the account on the day after the bill’s due date.
As of December 31, 2018 and 2017, the balance and aging of the device payment plan agreement receivables on a gross basis was as follows:
|
|
2018
|
2017
|
|||||
|
Unbilled
|
$
|
317,307
|
|
$
|
292,834
|
|
|
|
Billed:
|
|||||||
|
Current
|
12,270
|
|
15,500
|
|
|||
|
Past Due
|
3,103
|
|
3,343
|
|
|||
|
Device payment plan agreement receivables, gross
|
$
|
332,680
|
|
$
|
311,677
|
|
|
Activity in the allowance for credit losses for the device payment plan agreement receivables was as follows:
|
|
2018
|
2017
|
|||||
|
Balance at January 1
|
$
|
33,897
|
|
$
|
36,026
|
|
|
|
Provision for uncollectible accounts
|
23,932
|
|
42,873
|
|
|||
|
Write-offs
|
(21,035
|
)
|
(40,181
|
)
|
|||
|
Allowance related to receivables sold
|
(16,803
|
)
|
(3,800
|
)
|
|||
|
Other
|
4,878
|
|
(1,021
|
)
|
|||
|
Balance at December 31
|
$
|
24,869
|
|
$
|
33,897
|
|
|
Receivables purchase agreement
– In 2015 and 2016, Verizon Wireless established programs pursuant to a Receivables Purchase Agreement (original RPA), to sell from time to time, on an uncommitted basis, eligible device payment plan agreement receivables to a group of primarily relationship banks (Purchasers) on both a revolving and non-revolving basis, collectively the Programs. Under the Programs, Los Angeles SMSA would transfer the eligible receivables to Los Angeles Edge (Seller or SPE), who would transfer the device payment plan agreement receivables to the Purchasers for upfront cash proceeds and additional consideration upon settlement of the receivables, referred to as the deferred purchase price. In December 2017, the original RPA and all other related transaction documents were terminated and as of December 31, 2017 neither Verizon Wireless nor the Los Angeles SMSA have continuing involvement with any of the receivables sold under the original RPA program.
There were no sales of device payment plan agreement receivables under the Programs during 2017. During 2016, the Partnership sold $178,981 of receivables, net of allowance and imputed interest, under the original RPA. The Partnership received cash proceeds from new transfers of $132,483 and cash proceeds from reinvested collections of $36,855 and recorded a deferred purchase price of $23,873. The deferred purchase price assets obtained as a result of sales under the original RPA were recorded in our consolidated balance sheets as an other asset at fair value, based on the remaining device payment amounts expected to be collected, adjusted, as applicable, for the time value of money and by the timing and estimated value of the device trade-in in connection with upgrades. The estimated value of the device trade-in considered prices expected to be offered to the Partnership by independent third parties. This estimate contemplated changes in value after the launch of a device. The fair value measurements were considered to be Level 3 measurements within the fair value hierarchy. The collection of the deferred purchase price was contingent on collections from customers.
The sales of receivables under the original RPA did not have a significant impact on our consolidated statements of income. The cash proceeds received from the Purchasers were recorded within Cash flows provided by operating activities on the consolidated statements of cash flows.
S-17
Collections of deferred purchase price were $86,009 during 2017, and $83,453 during 2016. During 2017, Verizon Wireless repurchased all outstanding receivables previously sold to the Purchasers in exchange for the obligation to pay the associated deferred purchase price to the wholly-owned subsidiaries that are bankruptcy remote special purpose entities (Sellers). At December 31, 2017, the deferred purchase price receivable was fully satisfied. Collections following the repurchase of receivables was $9,331 during 2018, and insignificant during 2017. Collections of both deferred purchase price and repurchased receivables were recorded within cash flows used in investing activities in the consolidated statements of cash flows.
Asset Backed Securities
– Beginning in September of 2016, Verizon Wireless (through its affiliates) has and continues to offer notes and enter into financing facilities collateralized by device payment plan agreement receivables (collectively, “Asset Backed Securities” or “ABS” arrangements) with a number of financial institutions, and through registered debt. In connection with these ABS arrangements, Los Angeles SMSA transfers device payment plan receivables to a Trust entity through a two-step transfer - in which Los Angeles SMSA first sells eligible device payment plan receivables to Verizon ABS LLC, a securitization SPE wholly owned and consolidated by Verizon Wireless pursuant to a Receivable Purchase Agreement (RPA), and from Verizon ABS LLC to a designated Trust entity (also wholly owned and consolidated by Verizon Wireless). Los Angeles SMSA has also entered into Transfer and Servicing Agreements with the Verizon ABS LLC and Verizon Wireless governing the ongoing servicing of the receivables after their sale to Verizon ABS LLC.
The receivables sold to the Trust entities through this two step transfer are no longer considered assets of the Partnership. The proceeds received from the ABS arrangements are recorded within cash flows from operating activities on the consolidated statements of cash flows.
Under the terms of the ABS arrangements, the lenders make advances under asset-backed loans backed by device payment plan agreement receivables. There is a two year revolving period, which may be extended, during which Verizon Wireless may transfer additional receivables to Verizon ABS LLC. Subject to certain conditions, Verizon Wireless may also remove receivables from Verizon ABS LLC. Verizon Wireless may prepay the outstanding amounts of the loans without penalty, but in certain cases, with breakage costs. In such instances, as a result of the True-up Trust agreements between Verizon Wireless, Los Angeles SMSA, and the other Verizon legal entities originating device payment plan receivables (collectively, the “Originators”), each Originator is required to contribute a proportional portion of the prepayment based on its respective share of the debt. In consideration for any such prepayment contributions, the Partnership receives additional beneficial interest in the sold receivables. Additionally, the Partnership may receive repayments of beneficial interest in the form of proportional draw downs as well as excess cash collections.The Partnership collections on beneficial interest - net are recorded within cash flows from investing activities on the Partnership’s consolidated statement of cash flows.
During 2018, 2017 and 2016, Verizon Wireless sold $830,795, $706,729 and $389,800, respectively, of device payment plan agreement receivables related to the Partnership, net of allowances and imputed interest, to Verizon ABS LLC, and received proceeds of $358,148, $368,238 and $331,454 respectively, beneficial interest and insignificant gains and losses. The Partnership recorded a short-term beneficial interest of $43,684 in prepaid expenses and other for 2018, none in 2017 or 2016, as well as a long-term beneficial interest of $138,074, $174,077 and $56,359 for 2018, 2017, and 2016, respectively, which was recorded within other assets - net on the consolidated balance sheets.
Variable interest entities (VIEs)
– Under the ABS arrangements, the Trust’s sole business consists of holding collected receivables that are sold by the Partnership to Verizon Wireless affiliates under the terms of the ABS arrangements. The activity of servicing the receivables and distribution of the cash collected is the activity that has the most significant impact on the Trust. Verizon Wireless is the master and special servicer for the receivables but does not have a direct variable interest in the Trust. The Partnership holds a beneficial interest in the Trust, which represents the residual interest in the Trust and, as such are, variable interests. Since Verizon Wireless maintains decision making rights as servicer and has an obligation to absorb losses, it is the primary beneficiary in the Trust.
Beneficial interest
–
Under the ABS arrangements, the beneficial interest is initially recorded at fair value, based on the remaining device payment amounts expected to be collected, adjusted, as applicable, for the time value of money and credit risk. The initial fair value measurements are considered to be Level 3 measurements within the fair value hierarchy. The collection of the beneficial interest is contingent on collections from customers.
Continuing involvement
– Verizon Wireless has continuing involvement with the sold receivables as it services the receivables pursuant to the ABS arrangements on behalf of the Partnership. Verizon Wireless services the related receivables, including facilitating customer payment collection in exchange of an insignificant servicing fee. While servicing the receivables, the same policies and procedures are applied to the sold receivables that apply to owned receivables, and the Partnership continues to maintain normal relationships with its customers. The credit quality of the customers Verizon Wireless continues to service was consistent throughout the periods presented.
In addition, the Partnership has continuing involvement related to the sold receivables as the Partnership is responsible for absorbing additional credit losses pursuant to the agreements. Credit losses on receivables sold were $17,359 during 2018, $11,176 during 2017 and insignificant to the consolidated financial statements during 2016. The Partnership’s maximum exposure to loss related to the sold receivables is limited to the amount of the outstanding beneficial interest, which was $181,757 and $174,077 as of December 31, 2018 and 2017, respectively. The maximum exposure to loss represents an estimated loss that would be incurred under severe, hypothetical circumstances whereby the Partnership would not receive the total portion of the proceeds withheld by the Trust. As the Partnership believes the probability of these circumstances occurring is remote, the maximum exposure to loss is not an indication of the Partnership’s expected loss.
The outstanding device payment plan agreement receivables derecognized from the Partnership’s consolidated balance sheets, but which Verizon Wireless continues to service, was $690,576 and $629,686 at December 31, 2018 and 2017, respectively.
S-18
|
5.
|
PROPERTY, PLANT AND EQUIPMENT, NET
|
Property, plant and equipment consists of the following at December 31, 2018 and 2017:
|
|
2018
|
2017
|
|||||
|
Land
|
$
|
7,716
|
|
$
|
7,716
|
|
|
|
Buildings and improvements (15-45 years)
|
1,108,936
|
|
1,031,746
|
|
|||
|
Wireless plant and equipment (3-50 years)
|
4,084,825
|
|
4,383,737
|
|
|||
|
Furniture, fixtures and equipment (3-10 years)
|
58,986
|
|
62,653
|
|
|||
|
Leasehold improvements (5-7 years)
|
494,914
|
|
466,657
|
|
|||
|
|
5,755,377
|
|
5,952,509
|
|
|||
|
Less: accumulated depreciation
|
(3,756,839
|
)
|
(4,016,471
|
)
|
|||
|
Property, plant and equipment, net
|
$
|
1,998,538
|
|
$
|
1,936,038
|
|
|
Capitalized network engineering costs of $28,812 and $23,414, were recorded during the years ended December 31, 2018 and 2017, respectively. Construction in progress, included in certain classifications shown above, principally consisting of wireless plant and equipment, and amounted to $156,637 and $122,335, as of December 31, 2018 and 2017, respectively. Depreciation expense of $369,869, $355,692 and $354,329 was recorded during the years ended December 31, 2018, 2017and 2016, respectively.
|
6.
|
TOWER MONETIZATION TRANSACTION
|
During March 2015, Verizon completed a transaction with American Tower Corporation (ATC), pursuant to which, ATC acquired exclusive rights to lease and operate approximately 11,300 of Verizon Wireless’s wireless towers and corresponding ground leases for an upfront payment of $5.0 billion (not in thousands). Under the terms of the lease agreements, ATC has exclusive rights to lease and operate the towers over an average term of approximately 28 years. As the ATC leases expire, ATC has fixed-price purchase options to acquire these towers based on their fair market values at the end of the lease terms. Verizon Wireless has subleased capacity on the towers from ATC for a minimum of ten years at current market rates, with options to renew. The Partnership participated in this arrangement and has leased 538 towers to ATC for an upfront payment of $221,653, which was accounted for as deferred rent and as a financing obligation. The $95,634 accounted for as deferred rent represents unearned rental income and relates to the portion of the towers for which the right-of-use has passed to ATC. The deferred rent is being recognized on a straight-line basis over the Partnership’s average lease term of 30 years. The $126,635 accounted for as a financing obligation relates to the portion of the towers that continue to be occupied and used for the Partnership’s network operations. The Partnership makes a sublease payment to ATC of $1.9 per month per site, with annual increases of 2%. During 2018, 2017, and 2016, the Partnership made $12,914, $13,426 and $12,498, respectively, of sublease payments to ATC, which are recorded as repayments of financing obligation on the consolidated statements of cash flows. The Partnership continues to include the towers in property, plant and equipment, net in the consolidated balance sheets and depreciates them accordingly. In addition, the minimum future payments for the ground leases of approximately $227,408 have been included in our operating lease commitments. As part of the rights obtained during the transaction, ATC is responsible for the payment of the leases, and we do not expect to be required to make payments unless ATC becomes unable to do so.
At December 31, 2018 and 2017, the balance of deferred rent was $84,944 and $85,618, respectively. At December 31, 2018 and 2017, the balance of the financing obligation was $125,053 and $124,244, respectively.
|
7.
|
CURRENT LIABILITIES
|
Accounts payable and accrued liabilities consist of the following as of December 31, 2018 and 2017.
|
|
2018
|
2017
|
|||||
|
Accounts payable
|
$
|
130,669
|
|
$
|
144,549
|
|
|
|
Accrued liabilities
|
12,137
|
|
13,550
|
|
|||
|
Accounts payable and accrued liabilities
|
$
|
142,806
|
|
$
|
158,099
|
|
|
S-19
Contract liabilities and other consists of the following as of December 31, 2018 and 2017:
|
|
2018
|
2017
|
|||||
|
Contract liabilities
|
$
|
160,626
|
|
$
|
145,795
|
|
|
|
Customer deposits
|
14,737
|
|
26,693
|
|
|||
|
Guarantee liability, net
|
500
|
|
2,477
|
|
|||
|
Contract liabilities and other
|
$
|
175,863
|
|
$
|
174,965
|
|
|
|
8.
|
TRANSACTIONS WITH AFFILIATES AND
RELATED PARTIES
|
In addition to fixed-asset purchases, substantially all of service revenues, equipment revenues, other revenues, cost of service, cost of equipment and selling, general and administrative expenses of the Partnership represent transactions processed by Verizon Wireless, on behalf of the Partnership, or represent transactions with affiliates. These transactions consist of: (1) revenues and expenses that pertain to the Partnership, which are processed by Verizon Wireless and directly attributed to or directly charged to the Partnership; (2) roaming revenue when customers of Verizon Wireless use the network of the Partnership or roaming cost when the Partnership’s customers use the network of Verizon Wireless; (3) certain revenues and expenses that are processed or incurred by Verizon Wireless, that are allocated to the Partnership principally based on total subscribers in 2018 and 2017 and based on factors such as total subscribers, the Partnership’s percentage of revenue streams, and gross customer additions or minutes of use in 2016; and (4) service arrangements with Verizon Wireless where the Partnership has the ability to utilize certain spectrum. These transactions do not necessarily represent arm’s-length transactions and may not represent all revenues and costs that would be present if the Partnership operated on a stand-alone basis. Verizon Wireless periodically reviews the methodology and allocation bases for allocating certain revenues, operating costs and selling, general and administrative expenses to the Partnership. Resulting changes, if any, in the allocated amounts have historically not been significant, other than the roaming revenue and cost impacts discussed below.
Service revenues
– Service revenues include monthly customer billings processed by Verizon Wireless on behalf of the Partnership and roaming revenues relating to customers of other affiliated markets that are specifically identified to the Partnership. For the years ended December 31, 2018, 2017 and 2016, roaming revenues were $527,038, $510,521, and $486,262, respectively. During 2017, Verizon Wireless updated its roaming rates and methodology for determining roaming volumes charged for postpaid, prepaid and reseller roaming revenue, resulting in a net decrease of $145,797 in roaming revenue as compared to prior periods. Service revenues also include usage and certain revenue reductions, including revenue concessions and bill incentive credits, that are processed by Verizon Wireless, and allocated to the Partnership based on certain factors deemed appropriate by Verizon Wireless.
Equipment revenues
– Equipment revenues include equipment sales processed by Verizon Wireless and specifically identified to the Partnership, as well as certain handset and accessory revenues, contra-revenues including equipment concessions, and equipment manufacturer rebates that are processed by Verizon Wireless and allocated to the Partnership based on certain factors deemed appropriate by Verizon Wireless. The Partnership also recognizes commission revenue on the sale of devices to customers whose service contract is with an affiliate market.
Cost of service
– Cost of service includes roaming costs relating to the Partnership’s customers roaming in other affiliated markets. For the years ended December 31, 2018, 2017 and 2016 roaming costs were $651,083, $637,264, and $619,985, respectively. During 2017, Verizon Wireless updated its roaming rates and methodology for determining roaming amounts charged for postpaid, prepaid and reseller roaming cost, resulting in a net decrease of $182,169 to roaming cost as compared to prior periods. Cost of service also includes cost of telecom and long-distance that are incurred by Verizon Wireless and allocated to the Partnership based on certain factors deemed appropriate by Verizon Wireless. The Partnership also has service arrangements to utilize additional spectrum owned by Verizon Wireless. See Notes 2 and 9 for further information regarding these arrangements.
Cost of equipment
– Cost of equipment is recorded at Verizon Wireless’s cost basis (see Note 2). Cost of equipment includes certain costs related to handsets, accessories and other costs incurred by Verizon Wireless and allocated to the Partnership based on certain factors deemed appropriate by Verizon Wireless.
Selling, general and administrative
– Selling, general and administrative expenses include commissions, customer billing, customer care, and salaries that are specifically identified to the Partnership, as well as costs incurred by Verizon Wireless and allocated to the Partnership based on certain factors deemed appropriate by Verizon Wireless. The Partnership was allocated $94,132, $100,183, and $113,300 in advertising costs for the years ended December 31, 2018, 2017 and 2016, respectively.
Property, plant and equipment
– Property, plant and equipment includes assets purchased by Verizon Wireless and directly charged to the Partnership as well as assets transferred between Verizon Wireless and the Partnership (see Note 2).
S-20
|
9.
|
COMMITMENTS
|
Verizon Wireless, on behalf of the Partnership, and the Partnership itself have entered into operating leases for facilities and equipment used in their operations. Lease contracts include renewal options that include rent payment adjustments based on the Consumer Price Index, as well as annual and end-of-lease term adjustments. Rent expense is recorded on a straight-line basis. The noncancellable lease term used to calculate the amount of the straight-line rent expense is generally determined to be the initial lease term, including any optional renewal terms that are reasonably assured of occurring. Leasehold improvements related to these operating leases are amortized over the shorter of their estimated useful lives or the noncancellable lease term. For the years ended December 31, 2018, 2017 and 2016, the Partnership incurred a total of $147,944, $134,337 and $125,754 respectively, of rent expense related to these operating leases, which is included in cost of service and selling, general and administrative expenses in the accompanying statements of income depending on the nature of the facility and equipment.
Aggregate future minimum rental commitments under noncancellable operating leases, excluding renewal options that are not reasonably assured of occurring, for the years shown are as follows:
|
Years
|
Amount
|
||
|
|
|
||
|
2019
|
$
|
140,933
|
|
|
2020
|
120,811
|
|
|
|
2021
|
101,862
|
|
|
|
2022
|
85,934
|
|
|
|
2023
|
72,359
|
|
|
|
2024 and thereafter
|
406,711
|
|
|
|
|
|||
|
Total minimum payments
|
$
|
928,610
|
|
The Partnership has also entered into certain agreements with Verizon Wireless to utilize certain spectrum from Verizon Wireless that overlaps the Los Angeles metropolitan statistical area. Total expense under these spectrum service arrangements amounted to $126,288 in 2018, $125,608 in 2017, and $124,943 in 2016 which is included in cost of service in the consolidated statements of income.
Based on the terms of these service arrangements as of December 31, 2018, future spectrum service arrangement obligations to Verizon Wireless are as follows:
|
Years
|
Amount
|
||
|
|
|
||
|
2019
|
$
|
116,359
|
|
|
2020
|
106,439
|
|
|
|
2021
|
106,996
|
|
|
|
2022
|
107,562
|
|
|
|
2023
|
108,138
|
|
|
|
2024 and thereafter
|
867,690
|
|
|
|
|
|||
|
Total minimum payments
|
$
|
1,413,184
|
|
|
10.
|
CONTINGENCIES
|
Verizon Wireless and the Partnership are subject to lawsuits and other claims, including class actions, product liability, patent infringement, intellectual property, antitrust, partnership disputes and claims involving relations with resellers and agents. Verizon Wireless is also currently defending lawsuits filed against it and other participants in the wireless industry, alleging various adverse effects as a result of wireless phone usage. Various consumer class-action lawsuits allege that Verizon Wireless violated certain state consumer-protection laws and other statutes and defrauded customers through misleading billing practices or statements. These matters may involve indemnification obligations by third parties and/or affiliated parties covering all or part of any potential damage awards against Verizon Wireless and the Partnership and/or insurance coverage. All of the above matters are subject to many uncertainties, and the outcomes are not currently predictable.
S-21
The Partnership may incur or be allocated a portion of the damages that may result upon adjudication of these matters if the claimants prevail in their actions. At December 31, 2018 and 2017, the Partnership had no accrual for any pending matters. An estimate of the reasonably possible loss or range of loss with respect to these matters as of December 31, 2018 cannot be made at this time due to various factors typical in contested proceedings, including: (1) uncertain damage theories and demands; (2) a less-than-complete, factual record; (3) uncertainty concerning legal theories and their resolution by courts or regulators and (4) the unpredictable nature of the opposing party and its demands. Verizon Wireless and the Partnership continuously monitor these proceedings as they develop and will adjust any accrual or disclosure as needed. It is not expected that the ultimate resolution of any pending regulatory or legal matter in future periods will have a material effect on the financial condition of the Partnership, but it could have a material effect on the results of operations for a given reporting period.
S-22
SIGNATURES
Pursuant to the requirements of Section 13 or 15(d) of the Securities Exchange Act of 1934, the registrant has duly caused this report to be signed on its behalf by the undersigned, thereunto duly authorized.
|
|
TELEPHONE AND DATA SYSTEMS, INC.
|
|
|
|
|
|
|
|
By:
|
/s/ LeRoy T. Carlson, Jr.
|
|
|
|
LeRoy T. Carlson, Jr.
|
|
|
|
President and Chief Executive Officer
|
|
|
|
(principal executive officer)
|
|
|
|
|
|
|
By:
|
/s/ Douglas W. Chambers
|
|
|
|
Douglas W. Chambers
|
|
|
|
Senior Vice President - Finance and Chief Accounting Officer
|
|
|
|
(principal financial officer and principal accounting officer)
|
|
|
|
|
|
|
By:
|
/s/ Anita J. Kroll
|
|
|
|
Anita J. Kroll
|
|
|
|
Vice President and Controller
|
Dated:
February 22, 2019
Power of Attorney
Each person whose signature appears below constitutes and appoints LeRoy T. Carlson, Jr. as his or her true and lawful attorney-in-fact and agent, with full power of substitution and resubstitution for him or her and in his or her name, place, and stead, in any and all capacities to sign any and all amendments to this Annual Report on Form 10-K under the Securities Exchange Act of 1934, as amended, and to file the same, with all exhibits thereto, and other documents in connection therewith with the Securities and Exchange Commission, granting unto said attorney-in-fact and agent full power and authority to do so and perform each and every act and thing requisite or necessary to be done in and about the premises, as fully to all intents and purposes as he or she might or could do in person, hereby ratifying and confirming all the said attorney-in fact and agent or any of them, or their or his substitute or substitutes, may lawfully do or cause to be done by virtue hereof.
Pursuant to the requirements of the Securities Exchange Act of 1934, this report has been signed below by the following persons on behalf of the registrant and in the capacities and on the dates indicated.
|
Signature
|
|
Title
|
|
Date
|
|
|
|
|
|
|
|
/s/ LeRoy T. Carlson, Jr.
|
|
Director
|
|
February 22, 2019
|
|
LeRoy T. Carlson, Jr.
|
|
|
|
|
|
|
|
|
|
|
|
/s/ Letitia G. Carlson, M.D.
|
|
Director
|
|
February 22, 2019
|
|
Letitia G. Carlson, M.D.
|
|
|
|
|
|
|
|
|
|
|
|
/s/ Prudence E. Carlson
|
|
Director
|
|
February 22, 2019
|
|
Prudence E. Carlson
|
|
|
|
|
|
|
|
|
|
|
|
/s/ Walter C. D. Carlson
|
|
Director
|
|
February 22, 2019
|
|
Walter C. D. Carlson
|
|
|
|
|
|
|
|
|
|
|
|
/s/ James W. Butman
|
|
Director
|
|
February 22, 2019
|
|
James W. Butman
|
|
|
|
|
|
/s/ Clarence A. Davis
|
|
Director
|
|
February 22, 2019
|
|
Clarence A. Davis
|
|
|
|
|
|
|
|
|
|
|
|
/s/ Kim D. Dixon
|
|
Director
|
|
February 22, 2019
|
|
Kim D. Dixon
|
|
|
|
|
|
|
|
|
|
|
|
/s/ Kenneth R. Meyers
|
|
Director
|
|
February 22, 2019
|
|
Kenneth R. Meyers
|
|
|
|
|
|
|
|
|
|
|
|
/s/ George W. Off
|
|
Director
|
|
February 22, 2019
|
|
George W. Off
|
|
|
|
|
|
|
|
|
|
|
|
/s/ Christopher D. O’Leary
|
|
Director
|
|
February 22, 2019
|
|
Christopher D. O’Leary
|
|
|
|
|
|
|
|
|
|
|
|
/s/ Mitchell H. Saranow
|
|
Director
|
|
February 22, 2019
|
|
Mitchell H. Saranow
|
|
|
|
|
|
|
|
|
|
|
|
/s/ Gary L. Sugarman
|
|
Director
|
|
February 22, 2019
|
|
Gary L. Sugarman
|
|
|
|
|
TABLE OF CONTENTS
Part IItem 1. BusinessItem 1A. Risk FactorsItem 1B. Unresolved Staff CommentsItem 2. PropertiesItem 3. Legal ProceedingsItem 4. Mine Safety DisclosuresPart IIItem 5. Market For Registrant S Common Equity, Related Stockholder Matters and Issuer Purchases Of Equity SecuritiesItem 6. Selected Financial DataItem 7. Management S Discussion and Analysis Of Financial Condition and Results Of OperationsItem 7A. Quantitative and Qualitative Disclosures About Market RiskItem 8. Financial Statements and Supplementary DataItem 9. Changes in and Disagreements with Accountants on Accounting and Financial DisclosureItem 9A. Controls and ProceduresItem 9B. Other InformationPart IIIItem 10. Directors, Executive Officers and Corporate GovernanceItem 11. Executive CompensationItem 12. Security Ownership Of Certain Beneficial Owners and Management and Related Stockholder MattersItem 13. Certain Relationships and Related Transactions, and Director IndependenceItem 14. Principal Accountant Fees and ServicesPart IVItem 15. Exhibits and Financial Statement SchedulesItem 16. Form 10-k Summary