TELEPHONE & DATA SYSTEMS INC /DE/
10-Qs and 10-Ks
PROXIES
UNITED STATES
SECURITIES AND EXCHANGE COMMISSION
Washington, D.C. 20549
FORM
10-Q
| (Mark One) | ||||||||
|
|
QUARTERLY REPORT PURSUANT TO SECTION 13 OR 15(d) OF THE SECURITIES EXCHANGE ACT OF 1934 | |||||||
For the quarterly period ended
September 30, 2022
OR
|
|
TRANSITION REPORT PURSUANT TO SECTION 13 OR 15(d) OF THE SECURITIES EXCHANGE ACT OF 1934 | |||||||
For the transition period from to
Commission file number
001-14157

|
|
||||||||
| (Exact name of Registrant as specified in its charter) | ||||||||
|
|
|
|||||||
| (State or other jurisdiction of incorporation or organization) | (IRS Employer Identification No.) | |||||||
(Address of principal executive offices) (Zip code)
Registrant's telephone number, including area code:
(312)
630-1900
| Securities registered pursuant to Section 12(b) of the Act: | ||||||||||||||||||||
| Title of each class | Trading Symbol | Name of each exchange on which registered | ||||||||||||||||||
|
|
|
|
||||||||||||||||||
|
|
|
|
||||||||||||||||||
|
|
|
|
||||||||||||||||||
| Indicate by check mark whether the registrant (1) has filed all reports required to be filed by Section 13 or 15(d) of the Securities Exchange Act of 1934 during the preceding 12 months (or for such shorter period that the registrant was required to file such reports), and (2) has been subject to such filing requirements for the past 90 days. |
|
☒ | No | ☐ | |||||||||||||||||||
| Indicate by check mark whether the registrant has submitted electronically every Interactive Data File required to be submitted pursuant to Rule 405 of Regulation S-T during the preceding 12 months (or for such shorter period that the registrant was required to submit such files). |
|
☒ | No | ☐ | |||||||||||||||||||
| Indicate by check mark whether the registrant is a large accelerated filer, an accelerated filer, a non-accelerated filer, a smaller reporting company, or an emerging growth company. See the definitions of “large accelerated filer,” “accelerated filer,” “smaller reporting company,” and “emerging growth company” in Rule 12b-2 of the Exchange Act. | |||||||||||||||||||||||
|
|
☒ | Accelerated filer | ☐ | ||||||||||||||||||||
| Non-accelerated filer | ☐ | Smaller reporting company |
|
||||||||||||||||||||
| Emerging growth company |
|
||||||||||||||||||||||
| If an emerging growth company, indicate by check mark if the registrant has elected not to use the extended transition period for complying with any new or revised financial accounting standards provided pursuant to Section 13(a) of the Exchange Act. | ☐ | ||||||||||||||||||||||
| Indicate by check mark whether the registrant is a shell company (as defined in Rule 12b-2 of the Exchange Act). | Yes |
|
No
|
☒
|
|||||||||||||||||||
The number of shares outstanding of each of the issuer's classes of common stock, as of September 30, 2022, is
106,181,800
Common Shares, $.01 par value, and
7,383,300
Series A Common Shares, $.01 par value.
Telephone and Data Systems, Inc.
Quarterly Report on Form 10-Q
For the Period Ended September 30, 2022
| Index | Page No. | ||||
|
|
Telephone and Data Systems, Inc.
Management’s Discussion and Analysis of
Financial Condition
and Results of Operations
|
||||
Executive Overview
The following discussion and analysis compares Telephone and Data Systems, Inc.’s (TDS) financial results for the three and nine months ended September 30, 2022, to the three and nine months ended September 30, 2021. It should be read in conjunction with TDS’ interim consolidated financial statements and notes included herein, and with the description of TDS’ business, its audited consolidated financial statements and Management's Discussion and Analysis of Financial Condition and Results of Operations (MD&A) included in TDS’ Annual Report on Form 10-K (Form 10-K) for the year ended December 31, 2021. Certain numbers included herein are rounded to millions for ease of presentation; however, certain calculated amounts and percentages are determined using the unrounded numbers.
This report contains statements that are not based on historical facts, including the words “believes,” “anticipates,” “estimates,” “expects,” “plans,” “intends,” “projects” and similar expressions. These statements constitute and represent “forward looking statements” as this term is defined in the Private Securities Litigation Reform Act of 1995. Such forward looking statements involve known and unknown risks, uncertainties and other factors that may cause actual results, events or developments to be significantly different from any future results, events or developments expressed or implied by such forward looking statements. See Private Securities Litigation Reform Act of 1995 Safe Harbor Cautionary Statement for additional information.
TDS uses certain “non-GAAP financial measures” and each such measure is identified in the MD&A. A discussion of the reasons TDS determines these metrics to be useful and reconciliations of these measures to their most directly comparable measures determined in accordance with accounting principles generally accepted in the United States of America (GAAP) are included in the Supplemental Information Relating to Non-GAAP Financial Measures section within the MD&A of this Form 10-Q Report.
General
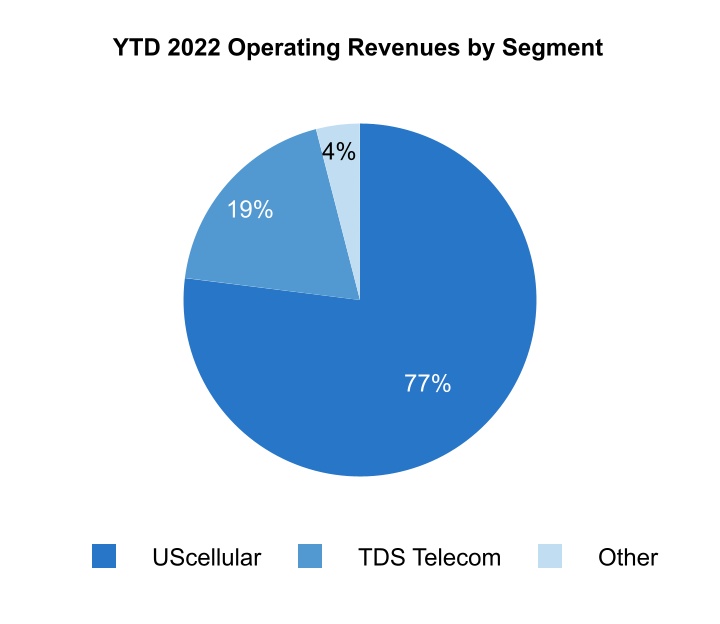
TDS is a diversified telecommunications company that provides high-quality communications services to approximately 6 million connections nationwide. TDS provides wireless services through its 83%-owned subsidiary, United States Cellular Corporation (UScellular). TDS also provides broadband, video and voice services through its wholly-owned subsidiary, TDS Telecommunications LLC (TDS Telecom). TDS operates entirely in the United States.
1
TDS Mission and Strategy
TDS’ mission is to provide outstanding communications services to its customers and meet the needs of its shareholders, its people, and its communities. In pursuing this mission, TDS seeks to grow its businesses, create opportunities for its associates, support the communities it serves, and build value over the long-term for its shareholders. Across all of its businesses, TDS is focused on providing exceptional customer experiences through best-in-class services and products and superior customer service. Since its founding, TDS has been committed to bringing high-quality communications services to rural and underserved communities. TDS continues to make progress on developing and enhancing its Environmental, Social and Governance (ESG) program, including the publication of the most recent TDS ESG Report in September 2022.
TDS’ long-term strategy calls for the majority of its operating capital to be reinvested in its businesses to strengthen their competitive positions and financial performance, while also returning value to TDS shareholders primarily through the payment of a regular quarterly cash dividend.
TDS plans to build shareholder value by continuing to execute on its strategies to build strong, competitive businesses providing high-quality, data-focused services and products. Strategic efforts include:
▪
UScellular offers economical and competitively priced service plans and devices to its customers and is focused on increasing revenues from sales of related products such as device protection plans and from new services such as fixed wireless home internet. In addition, UScellular is focused on increasing revenues from prepaid plans, tower rent revenues and expanding its solutions available to business and government customers.
▪
UScellular continues to enhance its network capabilities, including by deploying 5G technology. 5G technology helps address customers’ growing demand for data services and creates opportunities for new services requiring high speed and reliability as well as low latency. UScellular's 5G deployment is initially focused on mobility services using its low band spectrum. UScellular has acquired high-band and mid-band spectrum, deployed high-band spectrum on a limited basis, and will further deploy high-band and mid-band in the future to further enable the delivery of 5G services. UScellular has launched 5G services in portions of substantially all of its markets and will continue to expand to additional areas in the coming years.
▪
UScellular assesses its existing wireless interests on an ongoing basis with a goal of improving the competitiveness of its operations and maximizing its long-term return on capital. As part of this strategy, UScellular actively seeks attractive opportunities to acquire wireless spectrum, including pursuant to FCC auctions.
▪
TDS Telecom strives to be the preferred broadband provider in its markets with the ability to provide value-added bundling with video and voice service options. TDS Telecom focuses on driving growth by investing in fiber deployment in its expansion markets and in its incumbent markets that have historically utilized copper and coaxial cable technologies.
▪
TDS Telecom seeks to grow its operations and expand its total footprint by creating new clusters of markets in attractive, growing locations and may seek to acquire businesses that support and complement its existing markets.
2
Terms Used by TDS
The following is a list of definitions of certain industry terms that are used throughout this document:
▪
5G
– fifth generation wireless technology that helps address customers’ growing demand for data services and creates opportunities for new services requiring high speed and reliability as well as low latency.
▪
Account
– represents an individual or business financially responsible for one or multiple associated connections. An account may include a variety of types of connections such as handsets and connected devices.
▪
Alternative Connect America Cost Model (A-CAM)
– a USF support mechanism for certain carriers, which provides revenue support through 2028. This support comes with an obligation to build defined broadband speeds to a certain number of locations.
▪
Auctions 105, 107, 108 and 110
– Auction 105 was an FCC auction of 3.5 GHz wireless spectrum licenses that started in July 2020 and concluded in September 2020. Auction 107 was an FCC auction of 3.7-3.98 GHz wireless spectrum licenses that started in December 2020 and concluded in February 2021. Auction 110 was an FCC auction of 3.45-3.55 GHz wireless spectrum licenses that started in October 2021 and concluded in January 2022. Auction 108 is an FCC auction of 2.5 GHz wireless spectrum licenses that started in July 2022 and concluded in August 2022.
▪
Broadband Connections
– refers to the individual customers provided high-speed internet access through various transmission technologies, including fiber, coaxial and copper.
▪
Broadband Penetration
– metric which is calculated by dividing total broadband connections by total service addresses.
▪
Churn Rate
– represents the percentage of the connections that disconnect service each month. These rates represent the average monthly churn rate for each respective period.
▪
Connected Devices
– non-handset devices that connect directly to the UScellular network. Connected devices include products such as tablets, wearables, modems, and hotspots.
▪
Coronavirus Aid, Relief, and Economic Security (CARES) Act
– economic relief package signed into law on March 27, 2020 to address the public health and economic impacts of COVID-19, including a variety of tax provisions.
▪
EBITDA
– refers to earnings before interest, taxes, depreciation, amortization and accretion and is used in the non-GAAP metric Adjusted EBITDA throughout this document. See Supplemental Information Relating to Non-GAAP Financial Measures within this MD&A for additional information.
▪
Expansion Markets
– markets utilizing fiber networks in areas where TDS does not serve as the incumbent service provider.
▪
Free Cash Flow
– non-GAAP metric defined as Cash flows from operating activities less Cash paid for additions to property, plant and equipment. See Supplemental Information Relating to Non-GAAP Financial Measures within this MD&A for additional information.
▪
Gross Additions
– represents the total number of new connections added during the period, without regard to connections that were terminated during that period.
▪
Incumbent Markets
– markets where TDS is positioned as the traditional local telephone or cable company.
▪
IPTV
– internet protocol television.
▪
Net Additions (Losses)
– represents the total number of new connections added during the period, net of connections that were terminated during that period.
▪
OIBDA
– refers to operating income before depreciation, amortization and accretion and is used in the non-GAAP metric Adjusted OIBDA throughout this document. See Supplemental Information Relating to Non-GAAP Financial Measures within this MD&A for additional information.
▪
Postpaid Average Revenue per Account (Postpaid ARPA)
– metric which is calculated by dividing total postpaid service revenues by the average number of postpaid accounts and by the number of months in the period.
▪
Postpaid Average Revenue per User (Postpaid ARPU)
– metric which is calculated by dividing total postpaid service revenues by the average number of postpaid connections and by the number of months in the period.
▪
Residential Revenue per Connection
– metric which is calculated by dividing total residential revenue by the average number of residential connections and by the number of months in the period.
▪
Retail Connections
– individual lines of service associated with each device activated by a postpaid or prepaid customer. Connections are associated with all types of devices that connect directly to the UScellular network.
▪
Service Addresses
– number of single residence homes, multi-dwelling units, and business locations that are capable of being connected to the TDS network, based on best available information.
▪
Universal Service Fund (USF)
– a system of telecommunications collected fees and support payments managed by the FCC intended to promote universal access to telecommunications services in the United States.
▪
Video Connections
– represents the individual customers provided video services.
▪
Voice Connections
– refers to the individual circuits connecting a customer to TDS' central office facilities that provide voice services or the billable number of lines into a building for voice services.
3
Results of Operations — TDS Consolidated
|
Three Months Ended
September 30, |
Nine Months Ended
September 30, |
||||||||||||||||||||||||||||||||||
| 2022 | 2021 | 2022 vs. 2021 | 2022 | 2021 | 2022 vs. 2021 | ||||||||||||||||||||||||||||||
| (Dollars in millions) | |||||||||||||||||||||||||||||||||||
| Operating revenues | |||||||||||||||||||||||||||||||||||
| UScellular | $ | 1,083 | $ | 1,016 | 7 | % | $ | 3,120 | $ | 3,053 | 2 | % | |||||||||||||||||||||||
| TDS Telecom | 256 | 252 | 2 | % | 763 | 752 | 1 | % | |||||||||||||||||||||||||||
|
All other
1
|
53 | 60 | (13) | % | 173 | 152 | 14 | % | |||||||||||||||||||||||||||
| Total operating revenues | 1,392 | 1,328 | 5 | % | 4,056 | 3,957 | 3 | % | |||||||||||||||||||||||||||
| Operating expenses | |||||||||||||||||||||||||||||||||||
| UScellular | 1,098 | 971 | 13 | % | 3,024 | 2,888 | 5 | % | |||||||||||||||||||||||||||
| TDS Telecom | 246 | 224 | 10 | % | 702 | 665 | 6 | % | |||||||||||||||||||||||||||
|
All other
1
|
59 | 64 | (9) | % | 183 | 167 | 9 | % | |||||||||||||||||||||||||||
| Total operating expenses | 1,403 | 1,259 | 11 | % | 3,909 | 3,720 | 5 | % | |||||||||||||||||||||||||||
| Operating income (loss) | |||||||||||||||||||||||||||||||||||
| UScellular | (15) | 45 | N/M | 96 | 165 | (42) | % | ||||||||||||||||||||||||||||
| TDS Telecom | 10 | 27 | (63) | % | 61 | 87 | (30) | % | |||||||||||||||||||||||||||
|
All other
1
|
(6) | (3) | (66) | % | (10) | (15) | 35 | % | |||||||||||||||||||||||||||
| Total operating income (loss) | (11) | 69 | N/M | 147 | 237 | (38) | % | ||||||||||||||||||||||||||||
| Investment and other income (expense) | |||||||||||||||||||||||||||||||||||
| Equity in earnings of unconsolidated entities | 40 | 48 | (16) | % | 123 | 138 | (11) | % | |||||||||||||||||||||||||||
| Interest and dividend income | 4 | 3 | 39 | % | 10 | 9 | 16 | % | |||||||||||||||||||||||||||
| Interest expense | (46) | (54) | 13 | % | (118) | (193) | 38 | % | |||||||||||||||||||||||||||
| Other, net | — | — | N/M | 1 | (1) | N/M | |||||||||||||||||||||||||||||
| Total investment and other income (expense) | (2) | (3) | 17 | % | 16 | (47) | N/M | ||||||||||||||||||||||||||||
| Income (loss) before income taxes | (13) | 66 | N/M | 163 | 190 | (15) | % | ||||||||||||||||||||||||||||
| Income tax expense (benefit) | (3) | 19 | N/M | 62 | 38 | 59 | % | ||||||||||||||||||||||||||||
| Net income (loss) | (10) | 47 | N/M | 101 | 152 | (33) | % | ||||||||||||||||||||||||||||
| Less: Net income (loss) attributable to noncontrolling interests, net of tax | (2) | 7 | N/M | 14 | 26 | (46) | % | ||||||||||||||||||||||||||||
| Net income (loss) attributable to TDS shareholders | (8) | 40 | N/M | 87 | 126 | (30) | % | ||||||||||||||||||||||||||||
| TDS Preferred Share dividends | 17 | 12 | 44 | % | 52 | 21 | N/M | ||||||||||||||||||||||||||||
| Net income (loss) attributable to TDS common shareholders | $ | (25) | $ | 28 | N/M | $ | 35 | $ | 105 | (66) | % | ||||||||||||||||||||||||
|
Adjusted OIBDA (Non-GAAP)
2
|
$ | 227 | $ | 290 | (22) | % | $ | 853 | $ | 923 | (8) | % | |||||||||||||||||||||||
|
Adjusted EBITDA (Non-GAAP)
2
|
$ | 271 | $ | 341 | (21) | % | $ | 987 | $ | 1,069 | (8) | % | |||||||||||||||||||||||
|
Capital expenditures
3
|
$ | 305 | $ | 279 | 9 | % | $ | 938 | $ | 726 | 29 | % | |||||||||||||||||||||||
Numbers may not foot due to rounding.
N/M - Percentage change not meaningful
1
Consists of corporate and other operations and intercompany eliminations.
2
Refer to Supplemental Information Relating to Non-GAAP Financial Measures within this MD&A for a reconciliation of this measure.
3
Refer to Liquidity and Capital Resources within this MD&A for additional information on Capital expenditures.
Refer to individual segment discussions in this MD&A for additional details on operating revenues and expenses at the segment level.
4
Equity in earnings of unconsolidated entities
Equity in earnings of unconsolidated entities represents TDS’ share of net income from entities in which it has a noncontrolling interest and that are accounted for using the equity method or the net asset value practical expedient. TDS’ investment in the Los Angeles SMSA Limited Partnership (LA Partnership) contributed pre-tax income of $18 million and $22 million for the three months ended September 30, 2022 and 2021, respectively and $52 million and $63 million for the nine months ended September 30, 2022 and 2021, respectively. See Note 8 — Investments in Unconsolidated Entities in the Notes to Consolidated Financial Statements for additional information.
Interest expense
Interest expense decreased for the three and nine months ended September 30, 2022, due
primarily to the write-off of unamortized debt issuance costs related to Senior Notes redeemed during 2021 and replaced by other debt facilities with lower interest rates
.
Income tax expense
Income tax expense decreased for the three months ended September 30, 2022 due primarily to the decrease in Income (loss) before income taxes.
Income tax expense increased for the nine months ended September 30, 2022 due primarily to the 2021 reduction of tax accruals resulting from expiration of state statutes of limitations of prior tax years, which did not recur in 2022. This was partially offset by the tax effect of the decrease in Income (loss) before income taxes.
During the nine months ended September 30, 2022, TDS received a federal income tax refund of $125 million related to the 2020 net operating loss carryback enabled by the CARES Act.
Net income (loss) attributable to noncontrolling interests, net of tax
|
Three Months Ended
September 30, |
Nine Months Ended
September 30, |
||||||||||||||||||||||
| 2022 | 2021 | 2022 | 2021 | ||||||||||||||||||||
| (Dollars in millions) | |||||||||||||||||||||||
| UScellular noncontrolling public shareholders’ | $ | (2) | $ | 6 | $ | 10 | $ | 23 | |||||||||||||||
| Noncontrolling shareholders’ or partners’ | — | 1 | 4 | 3 | |||||||||||||||||||
| Net income (loss) attributable to noncontrolling interests, net of tax | $ | (2) | $ | 7 | $ | 14 | $ | 26 | |||||||||||||||
Net income (loss) attributable to noncontrolling interests, net of tax includes the noncontrolling public shareholders’ share of UScellular’s net income (loss), the noncontrolling shareholders’ or partners’ share of certain UScellular subsidiaries’ net income (loss) and other TDS noncontrolling interests.
TDS Preferred Share dividends
TDS Preferred Share dividends increased for the three and nine months ended September 30, 2022, due to quarterly dividends for Series UU Preferred Shares issued in March 2021 and Series VV Preferred Shares issued in August 2021.
5
Earnings
(Dollars in millions)
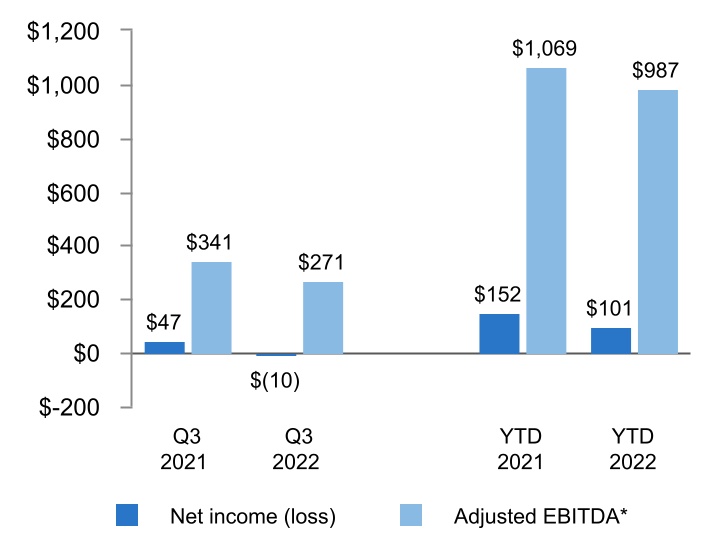
Three Months Ended
Net income (loss) decreased due primarily to higher operating expenses, partially offset by higher operating revenues and lower income tax expense. Adjusted EBITDA decreased due primarily to higher operating expenses, partially offset by higher operating revenues.
Nine Months Ended
Net income (loss) decreased due primarily to higher operating and income tax expenses, partially offset by higher operating revenues and lower interest expense. Adjusted EBITDA decreased due primarily to higher operating expenses, partially offset by higher operating revenues.
*Represents a non-GAAP financial measure. Refer to Supplemental Information Relating to Non-GAAP Financial Measures within this MD&A for a reconciliation of this measure.
6

|
UScellular OPERATIONS | ||||
Business Overview
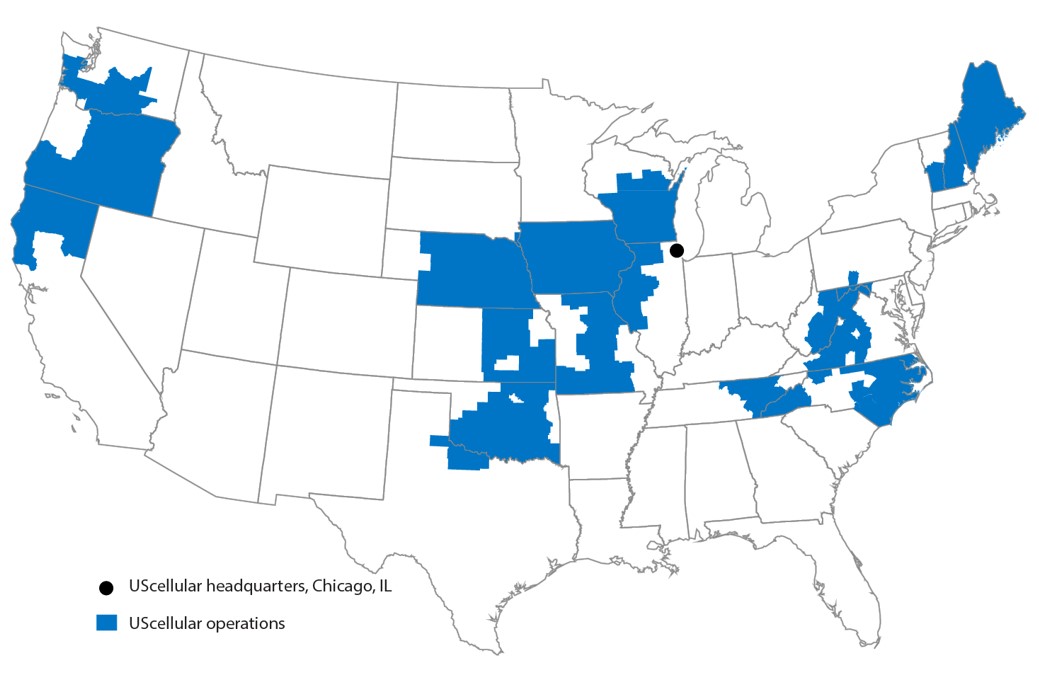
UScellular owns, operates, and invests in wireless markets throughout the United States. UScellular is an 83%-owned subsidiary of TDS. UScellular’s strategy is to attract and retain wireless customers through a value proposition comprised of a high-quality network, outstanding customer service, and competitive devices, plans, and pricing - all provided with a community focus.
OPERATIONS
|
||
▪
Serves customers with 4.8 million retail connections including 4.3 million postpaid and 0.5 million prepaid connections
▪
Operates in 21 states
▪
Employs approximately 4,900 associates
▪
4,329 owned towers
▪
6,933 cell sites in service
7
Operational Overview — UScellular

| As of September 30, | 2022 | 2021 | |||||||||||||||
| Retail Connections – End of Period | |||||||||||||||||
| Postpaid | 4,264,000 | 4,391,000 | |||||||||||||||
| Prepaid | 493,000 | 518,000 | |||||||||||||||
| Total | 4,757,000 | 4,909,000 | |||||||||||||||
| Q3 2022 | Q3 2021 | Q3 2022 vs. Q3 2021 | YTD 2022 | YTD 2021 | YTD 2022 vs. YTD 2021 | |||||||||||||||||||||||||||
| Postpaid Activity and Churn | ||||||||||||||||||||||||||||||||
| Gross Additions | ||||||||||||||||||||||||||||||||
| Handsets | 107,000 | 105,000 | 2 | % | 292,000 | 309,000 | (6) | % | ||||||||||||||||||||||||
| Connected Devices | 44,000 | 40,000 | 10 | % | 113,000 | 118,000 | (4) | % | ||||||||||||||||||||||||
| Total Gross Additions | 151,000 | 145,000 | 4 | % | 405,000 | 427,000 | (5) | % | ||||||||||||||||||||||||
| Net Additions (Losses) | ||||||||||||||||||||||||||||||||
| Handsets | (22,000) | (5,000) | N/M | (89,000) | (8,000) | N/M | ||||||||||||||||||||||||||
| Connected Devices | (9,000) | (3,000) | N/M | (26,000) | (11,000) | N/M | ||||||||||||||||||||||||||
| Total Net Additions (Losses) | (31,000) | (8,000) | N/M | (115,000) | (19,000) | N/M | ||||||||||||||||||||||||||
| Churn | ||||||||||||||||||||||||||||||||
| Handsets | 1.15 | % | 0.95 | % | 1.12 | % | 0.92 | % | ||||||||||||||||||||||||
| Connected Devices | 3.40 | % | 2.59 | % | 2.94 | % | 2.60 | % | ||||||||||||||||||||||||
| Total Churn | 1.42 | % | 1.15 | % | 1.34 | % | 1.13 | % | ||||||||||||||||||||||||
N/M - Percentage change not meaningful
Total postpaid handset net losses increased for the three and nine months ended September 30, 2022, when compared to the same period last year due primarily to higher defections resulting from aggressive industry-wide competition and an increase in non-pay customers.
Total postpaid connected device net losses increased for the three and nine months ended September 30, 2022, when compared to the same period last year due primarily to higher defections of devices activated by schools and local municipalities during the pandemic, which were partly funded by various government subsidies which have since ended.
Macroeconomic factors have caused some supply chain disruption and delays, including constraints on certain devices. These supply constraints are due primarily to component availability, resulting in extended lead times and additional uncertainty, which may negatively impact UScellular in future periods.
8
Postpaid Revenue
|
Three Months Ended
September 30, |
Nine Months Ended
September 30, |
||||||||||||||||||||||||||||||||||
| 2022 | 2021 | 2022 vs. 2021 | 2022 | 2021 | 2022 vs. 2021 | ||||||||||||||||||||||||||||||
| Average Revenue Per User (ARPU) | $ | 50.21 | $ | 48.12 | 4 | % | $ | 49.99 | $ | 47.83 | 5 | % | |||||||||||||||||||||||
| Average Revenue Per Account (ARPA) | $ | 130.27 | $ | 125.99 | 3 | % | $ | 130.20 | $ | 125.50 | 4 | % | |||||||||||||||||||||||
Postpaid ARPU and Postpaid ARPA increased for the three and nine months ended September 30, 2022, when compared to the same period last year, due to (i) favorable plan and product offering mix, (ii) an increase in cost recovery surcharges, (iii) other price plan products and fees and (iv) an increase in device protection plan revenues. These increases were partially offset by an increase in promotional discounts.
2021 Postpaid ARPU and ARPA amounts exclude $9 million of postpaid revenue related to a third quarter out-of-period error. See Note 2 — Revenue Recognition in the Notes to Consolidated Financial Statements for additional information.
9
Financial Overview — UScellular
|
Three Months Ended
September 30, |
Nine Months Ended
September 30, |
||||||||||||||||||||||||||||||||||
| 2022 | 2021 | 2022 vs. 2021 | 2022 | 2021 | 2022 vs. 2021 | ||||||||||||||||||||||||||||||
| (Dollars in millions) | |||||||||||||||||||||||||||||||||||
|
Retail service
1
|
$ | 696 | $ | 697 | — | $ | 2,098 | $ | 2,064 | 2 | % | ||||||||||||||||||||||||
| Inbound roaming | 17 | 30 | (43) | % | 56 | 86 | (36) | % | |||||||||||||||||||||||||||
|
Other
1
|
68 | 61 | 11 | % | 197 | 183 | 8 | % | |||||||||||||||||||||||||||
| Service revenues | 781 | 788 | (1) | % | 2,351 | 2,333 | 1 | % | |||||||||||||||||||||||||||
| Equipment sales | 302 | 228 | 32 | % | 769 | 720 | 7 | % | |||||||||||||||||||||||||||
| Total operating revenues | 1,083 | 1,016 | 7 | % | 3,120 | 3,053 | 2 | % | |||||||||||||||||||||||||||
| System operations (excluding Depreciation, amortization and accretion reported below) | 197 | 205 | (4) | % | 574 | 594 | (3) | % | |||||||||||||||||||||||||||
| Cost of equipment sold | 354 | 252 | 40 | % | 887 | 786 | 13 | % | |||||||||||||||||||||||||||
| Selling, general and administrative | 369 | 346 | 7 | % | 1,032 | 984 | 5 | % | |||||||||||||||||||||||||||
| Depreciation, amortization and accretion | 177 | 160 | 10 | % | 520 | 510 | 2 | % | |||||||||||||||||||||||||||
| Loss on impairment of licenses | — | — | — | 3 | — | N/M | |||||||||||||||||||||||||||||
| (Gain) loss on asset disposals, net | 1 | 8 | (89) | % | 9 | 15 | (43) | % | |||||||||||||||||||||||||||
| (Gain) loss on sale of business and other exit costs, net | — | — | 8 | % | (1) | (1) | 40 | % | |||||||||||||||||||||||||||
| Total operating expenses | 1,098 | 971 | 13 | % | 3,024 | 2,888 | 5 | % | |||||||||||||||||||||||||||
| Operating income (loss) | $ | (15) | $ | 45 | N/M | $ | 96 | $ | 165 | (42) | % | ||||||||||||||||||||||||
| Net income (loss) | $ | (12) | $ | 35 | N/M | $ | 62 | $ | 132 | (53) | % | ||||||||||||||||||||||||
|
Adjusted OIBDA (Non-GAAP)
2
|
$ | 163 | $ | 213 | (23) | % | $ | 627 | $ | 689 | (9) | % | |||||||||||||||||||||||
|
Adjusted EBITDA (Non-GAAP)
2
|
$ | 205 | $ | 262 | (22) | % | $ | 754 | $ | 831 | (9) | % | |||||||||||||||||||||||
|
Capital expenditures
3
|
$ | 136 | $ | 185 | (27) | % | $ | 541 | $ | 458 | 18 | % | |||||||||||||||||||||||
N/M - Percentage change not meaningful
1
For the three and nine months ended September 30, 2021, amounts have been adjusted to reclassify $2 million and $5 million, respectively, of Internet of Things (IoT) and Reseller revenues from Retail service to Other.
2
Refer to Supplemental Information Relating to Non-GAAP Financial Measures within this MD&A for a reconciliation of this measure.
3
Refer to Liquidity and Capital Resources within this MD&A for additional information on Capital expenditures.
10
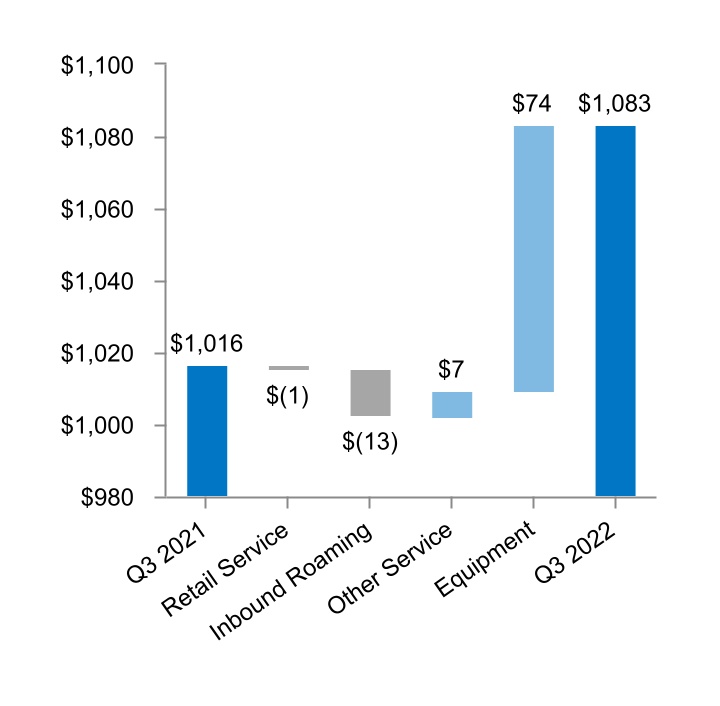
Operating Revenues
Three Months Ended September 30, 2022 and 2021
(Dollars in millions)
Operating Revenues
Nine Months Ended September 30, 2022 and 2021
(Dollars in millions)

Service revenues consist of:
▪
Retail Service - Postpaid and prepaid charges for voice, data and value-added services and cost recovery surcharges
▪
Inbound Roaming - Charges to other wireless carriers whose customers use UScellular’s wireless systems when roaming
▪
Other Service - Amounts received from the Federal USF, tower rental revenues, miscellaneous other service revenues and Internet of Things (IoT)
Equipment revenues consist of
:
▪
Sales of wireless devices and related accessories to new and existing customers, agents, and third-party distributors
Key components of changes in the statement of operations line items were as follows:
Total operating revenues
Retail service revenues decreased for the three months ended September 30, 2022 partially due to a $9 million out-of-period error that increased revenue recognized in the three months ended September 30, 2021. Excluding this impact, retail service revenues increased primarily as a result of an increase in Postpaid ARPU as previously discussed in the Operational Overview section, partially offset by a decrease in average postpaid connections.
Retail service revenues increased for the nine months ended September 30, 2022 as a result of an increase in Postpaid ARPU, partially offset by a decrease in average postpaid connections, as well as a $9 million out-of-period error that increased revenue recognized in the nine months ended September 30, 2021. See Note 2 — Revenue Recognition in the Notes to Consolidated Financial Statements for additional information.
Inbound roaming revenues decreased for the three and nine months ended September 30, 2022, primarily driven by lower data revenues resulting from lower rates, partially offset by higher usage. UScellular expects inbound roaming revenues to continue to decline for the remainder of 2022 relative to prior year levels.
Other service revenues increased for the three and nine months ended September 30, 2022, resulting from increases in tower rental revenues, miscellaneous revenues, and IoT revenues.
11
Equipment sales revenues increased for the three and nine months ended September 30, 2022, due primarily to increased customer upgrades driven by more promotional activity, combined with a higher average price of new smartphone sales.
In recent periods, wireless service providers have increased promotional aggressiveness to attract new customers and retain existing customers. Operating revenues and Operating income (loss) may be negatively impacted in future periods by the competitive response to offer increased promotional discounts to new and existing customers.
Systems operations expenses
System operations expenses decreased for the three and nine months ended September 30, 2022, due primarily to decreases in roaming and customer usage expenses, partially offset by an increase in maintenance, utility, and cell site expenses.
Cost of equipment sold
Cost of equipment sold increased for the three and nine months ended September 30, 2022, due primarily to increased customer upgrades driven by more promotional activity, combined with higher average cost per unit sold.
Selling, general and administrative expenses
Selling, general and administrative expenses increased for the three and nine months ended September 30, 2022, due primarily to increases in bad debts expense, partially offset by a decrease in advertising expense.
Bad debts expense was $42 million and $13 million for the three months ended September 30, 2022 and 2021, respectively, and $93 million and $34 million for the nine months ended September 30, 2022 and 2021, respectively, as customer payment behavior and the corresponding rate of involuntary churn, which had been favorable in the prior year due to the continuing impacts of the pandemic, which included government stimulus payments and higher consumer savings rates, returned to pre-pandemic trends in the 2022 periods. In addition, customers have purchased higher priced devices in recent periods, which has resulted in higher write-off amounts per uncollectible account in the 2022 periods relative to the corresponding 2021 periods.
Depreciation, amortization and accretion
Depreciation, amortization and accretion increased for the three and nine months ended September 30, 2022 due to increased capital expenditures in recent years relative to historical periods.
12

|
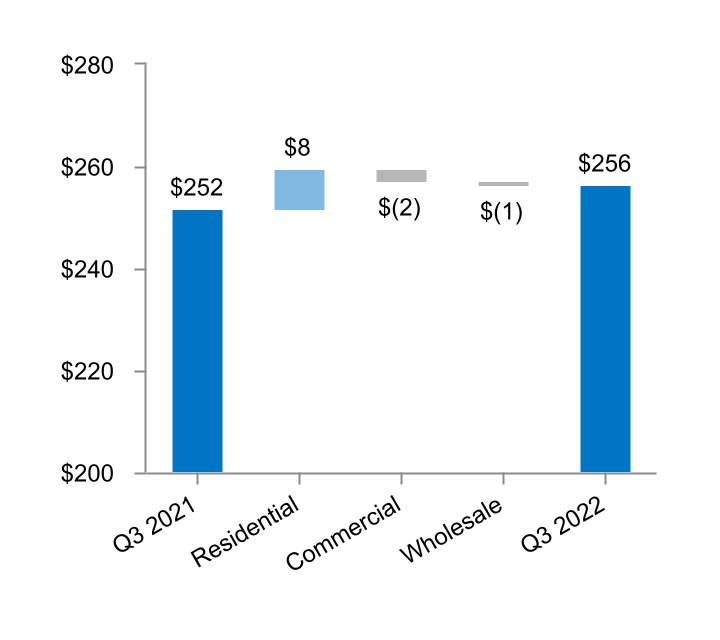
TDS TELECOM OPERATIONS | ||||
Business Overview
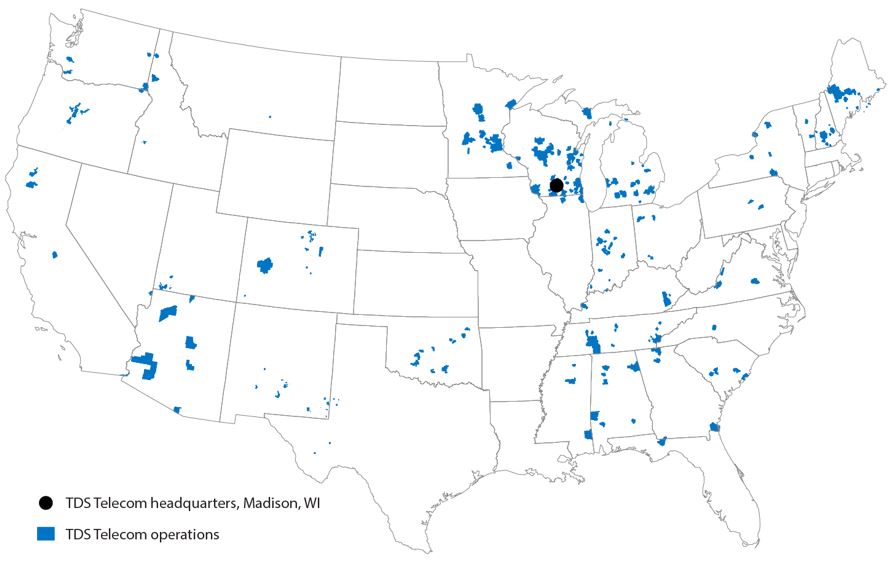
TDS Telecom owns, operates and invests in communications services in a mix of rural and suburban communities throughout the United States. TDS Telecom is a wholly-owned subsidiary of TDS and provides a wide range of broadband, video and voice communications services to residential, commercial and wholesale customers. TDS Telecom's strategic goal is to be the preferred broadband provider in the markets it serves. TDS Telecom invests in high-quality networks, services and products, with the constant focus on delivering a best-in-class customer experience.
OPERATIONS
|
||
▪
Serves 1.2 million connections in 32 states
▪
Employs approximately 3,300 associates
13
Operational Overview — TDS Telecom
Total Service Address Mix
As of September 30,
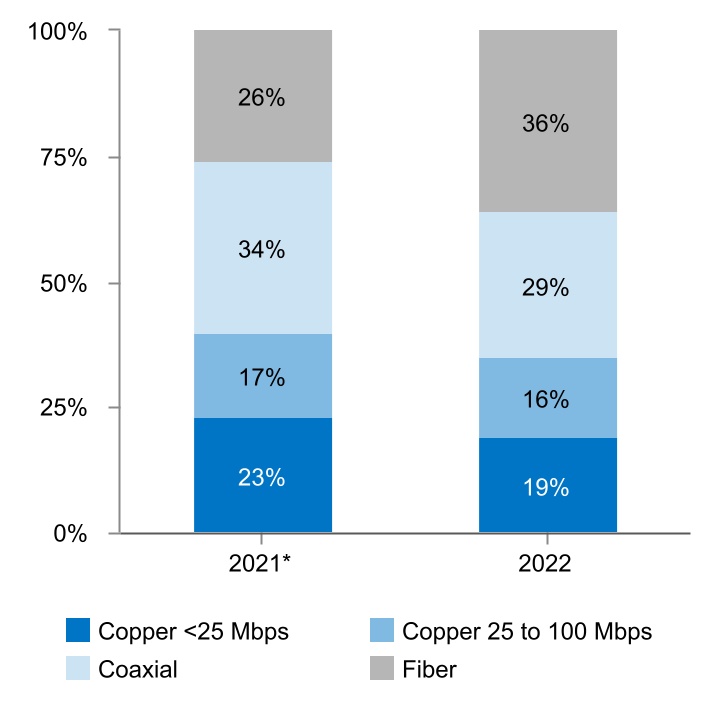
*2021 fiber addresses in cable markets are included in Coaxial.
As of September 30, 2022, TDS Telecom increased its service addresses 7% to 1.5 million through network expansion.
TDS Telecom offers 1Gig service to 64% of its total footprint as of September 30, 2022, compared to 57% a year ago.
In 2022, TDS Telecom began measuring fiber service addresses in its cable markets. Including cable, 36% of service addresses are served by fiber.
|
As of September 30,
|
2022 | 2021 | 2022 vs. 2021 | ||||||||||||||
| Residential connections | |||||||||||||||||
| Broadband | |||||||||||||||||
| Wireline, Incumbent | 252,600 | 252,100 | — | ||||||||||||||
| Wireline, Expansion | 49,400 | 32,600 | 52 | % | |||||||||||||
| Cable | 204,500 | 202,700 | 1 | % | |||||||||||||
| Total Broadband | 506,500 | 487,400 | 4 | % | |||||||||||||
| Video | 136,600 | 143,100 | (5) | % | |||||||||||||
| Voice | 295,500 | 306,300 | (4) | % | |||||||||||||
| Total Residential Connections | 938,600 | 936,800 | — | ||||||||||||||
| Commercial connections | 242,800 | 269,000 | (10) | % | |||||||||||||
| Total connections | 1,181,400 | 1,205,700 | (2) | % | |||||||||||||
Numbers may not foot due to rounding.
Total connections decreased due to legacy voice, video, and competitive local exchange carrier (CLEC) commercial connections declines, partially offset by broadband connection growth.
A majority of TDS Telecom's residential customers take advantage of bundling options as 61% of customers subscribe to more than one service.
14
Residential Broadband Connections by Speed
As of September 30,
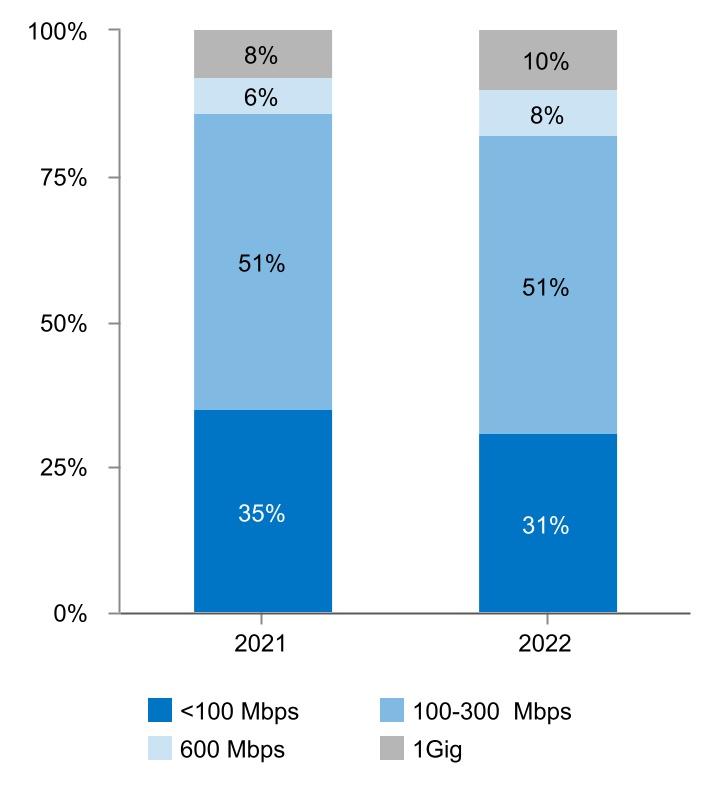
Residential broadband customers continue to choose higher speeds with 69% taking speeds of 100 Mbps or greater and 10% choosing 1Gig.
Residential Revenue per Connection
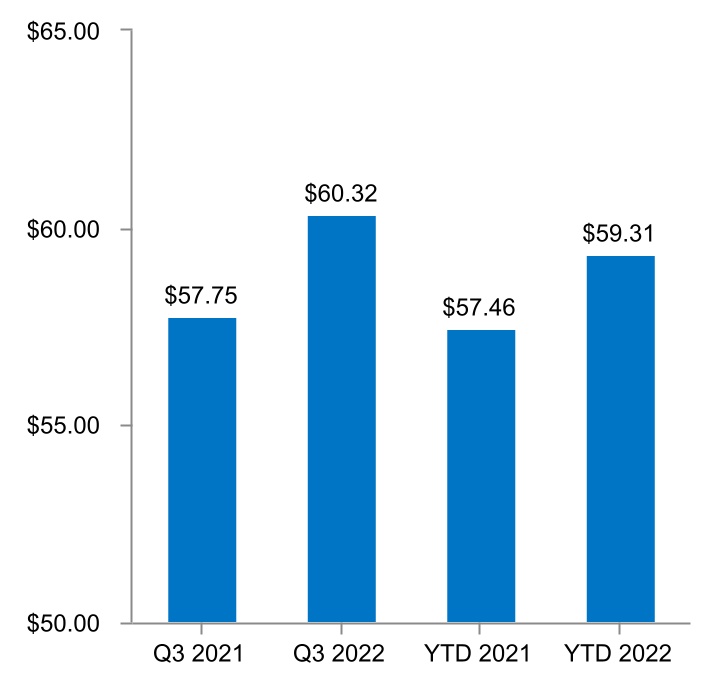
Total residential revenue per connection increased 4% for the three months ended September 30, 2022, and 3% for the nine months ended September 30, 2022, due to price increases and product mix changes.
15
Financial Overview — TDS Telecom
|
Three Months Ended
September 30, |
Nine Months Ended
September 30, |
||||||||||||||||||||||||||||||||||
| 2022 | 2021 | 2022 vs. 2021 | 2022 | 2021 | 2022 vs. 2021 | ||||||||||||||||||||||||||||||
| (Dollars in millions) | |||||||||||||||||||||||||||||||||||
| Residential | |||||||||||||||||||||||||||||||||||
| Wireline, Incumbent | $ | 89 | $ | 87 | 2 | % | $ | 262 | $ | 258 | 2 | % | |||||||||||||||||||||||
| Wireline, Expansion | 13 | 9 | 43 | % | 35 | 24 | 48 | % | |||||||||||||||||||||||||||
| Cable | 68 | 66 | 3 | % | 203 | 197 | 3 | % | |||||||||||||||||||||||||||
| Total residential | 170 | 162 | 5 | % | 500 | 479 | 4 | % | |||||||||||||||||||||||||||
| Commercial | 43 | 45 | (5) | % | 130 | 138 | (6) | % | |||||||||||||||||||||||||||
| Wholesale | 43 | 44 | (2) | % | 132 | 135 | (2) | % | |||||||||||||||||||||||||||
| Total service revenues | 256 | 251 | 2 | % | 763 | 751 | 1 | % | |||||||||||||||||||||||||||
| Equipment revenues | — | — | (13) | % | 1 | 1 | (8) | % | |||||||||||||||||||||||||||
| Total operating revenues | 256 | 252 | 2 | % | 763 | 752 | 1 | % | |||||||||||||||||||||||||||
| Cost of services (excluding Depreciation, amortization and accretion reported below) | 109 | 102 | 7 | % | 308 | 301 | 2 | % | |||||||||||||||||||||||||||
| Cost of equipment and products | — | — | 49 | % | 1 | — | 21 | % | |||||||||||||||||||||||||||
| Selling, general and administrative | 81 | 72 | 12 | % | 231 | 216 | 7 | % | |||||||||||||||||||||||||||
| Depreciation, amortization and accretion | 53 | 49 | 8 | % | 158 | 147 | 8 | % | |||||||||||||||||||||||||||
| (Gain) loss on asset disposals, net | 3 | 1 | N/M | 4 | 2 | N/M | |||||||||||||||||||||||||||||
| Total operating expenses | 246 | 224 | 10 | % | 702 | 665 | 6 | % | |||||||||||||||||||||||||||
| Operating income | $ | 10 | $ | 27 | (63) | % | $ | 61 | $ | 87 | (30) | % | |||||||||||||||||||||||
| Net income | $ | 10 | $ | 21 | (54) | % | $ | 51 | $ | 68 | (24) | % | |||||||||||||||||||||||
|
Adjusted OIBDA (Non-GAAP)
1
|
$ | 66 | $ | 77 | (14) | % | $ | 224 | $ | 235 | (5) | % | |||||||||||||||||||||||
|
Adjusted EBITDA (Non-GAAP)
1
|
$ | 66 | $ | 77 | (13) | % | $ | 226 | $ | 235 | (4) | % | |||||||||||||||||||||||
|
Capital expenditures
2
|
$ | 166 | $ | 91 | 82 | % | $ | 391 | $ | 260 | 50 | % | |||||||||||||||||||||||
Numbers may not foot due to rounding.
1
Refer to Supplemental Information Relating to Non-GAAP Financial Measures within this MD&A for a reconciliation of this measure.
2
Refer to Liquidity and Capital Resources within this MD&A for additional information on Capital expenditures.
16
Operating Revenues
Three Months Ended September 30, 2022 and 2021
(Dollars in millions)
Numbers may not foot due to rounding.
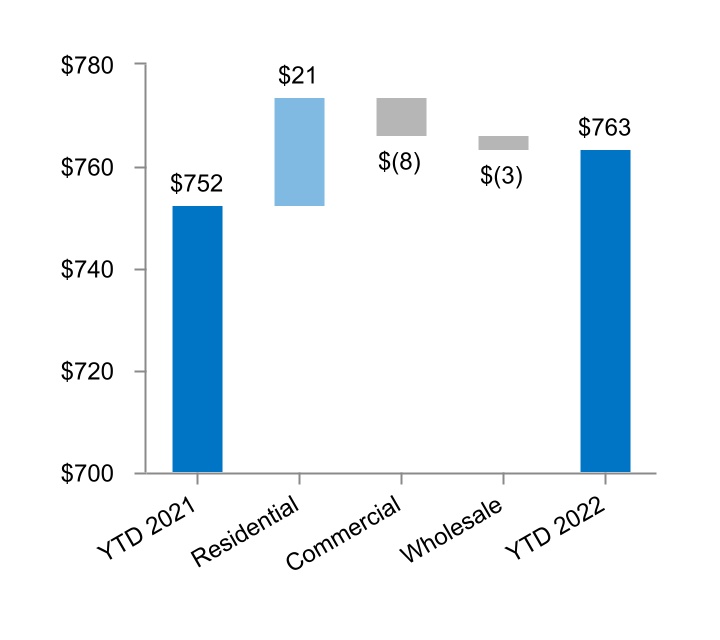
Operating Revenues
Nine Months Ended September 30, 2022 and 2021
(Dollars in millions)
Residential revenues consist of:
•
Broadband services, including security and support services
•
Video services, including IPTV, traditional cable programming and satellite offerings
•
Voice services
Commercial revenues consist of:
•
High-speed and dedicated business internet services
•
Video services
•
Voice services
Wholesale revenues consist of:
•
Network access services primarily to interexchange and wireless carriers for carrying data and voice traffic on TDS Telecom's networks
•
Federal and state regulatory support, including A-CAM
Key components of changes in the statement of operations items were as follows:
Total operating revenues
Residential revenues increased for the three and nine months ended September 30, 2022, due primarily to price increases and growth in broadband connections, partially offset by a decline in video and voice connections and federal universal service charges.
Commercial revenues decreased for the three and nine months ended September 30, 2022, due primarily to declining connections in CLEC markets and declining video connections, partially offset by an increase in broadband connections.
Cost of services
Cost of services increased for the three and nine months ended September 30, 2022, due primarily to higher employee-related expenses, vehicle expenses, video programming costs, and storm damage repair costs.
Selling, general and administrative
Selling, general and administrative expenses increased for the three and nine months ended September 30, 2022, due primarily to increases to support current and future growth, including employee-related expenses, advertising and marketing expenses, and software-related costs, partially offset by decreases to federal universal service charges.
17
Depreciation, amortization and accretion
Depreciation, amortization and accretion increased for the three and nine months ended September 30, 2022, due primarily to increased capital expenditures on new fiber assets and customer-related equipment.
18
Liquidity and Capital Resources
Sources of Liquidity
TDS and its subsidiaries operate capital-intensive businesses. In the past, TDS’ existing cash and investment balances, funds available under its financing agreements, preferred share offerings, and cash flows from operating and certain investing and financing activities, including sales of assets or businesses, provided sufficient liquidity and financial flexibility for TDS to meet its normal day-to-day operating needs and debt service requirements, to finance the build-out and enhancement of markets and to fund acquisitions. There is no assurance that this will be the case in the future. See Market Risk for additional information regarding maturities of long-term debt.
TDS has incurred negative free cash flow at times in the past and this could occur in the future. However, TDS believes that existing cash and investment balances, funds available under its financing agreements, expected future tax refunds and expected cash flows from operating and investing activities will provide sufficient liquidity for TDS to meet its normal day-to-day operating needs and debt service requirements for the foreseeable future. TDS will continue to monitor the rapidly changing business and market conditions and plans to take appropriate actions, as necessary, to meet its liquidity needs.
TDS may require substantial additional capital for, among other uses, funding day-to-day operating needs including working capital, acquisitions of providers of telecommunications services, wireless spectrum license acquisitions, capital expenditures, agreements to purchase goods or services, leases, debt service requirements, repurchases of shares, payment of dividends, or making additional investments, including new technologies and fiber deployments. It may be necessary from time to time to increase the size of the existing credit facilities, to put in place new credit agreements, or to obtain other forms of financing in order to fund potential expenditures.
Cash and Cash Equivalents
Cash and cash equivalents include cash and money market investments. The primary objective of TDS’ Cash and cash equivalents investment activities is to preserve principal. TDS does not have direct access to UScellular cash.
Cash and Cash Equivalents
(Dollars in millions)
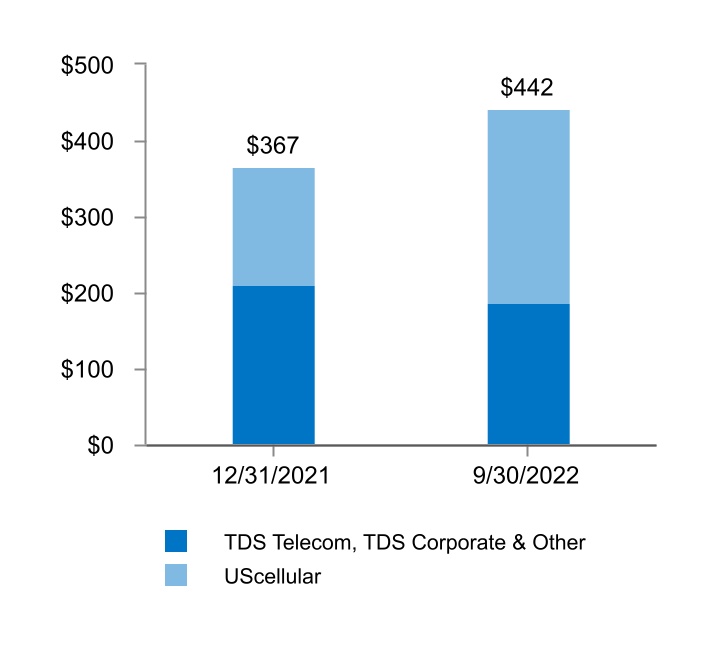
The majority of TDS’ Cash and cash equivalents are held in bank deposit accounts and in money market funds that purchase only debt issued by the U.S. Treasury or U.S. government agencies. Refer to the Consolidated Cash Flow Analysis for additional information related to changes in Cash and cash equivalents.
19
In addition to Cash and cash equivalents, TDS and UScellular had undrawn borrowing capacity from the following debt facilities at September 30, 2022. See the Financing section below for further details.
| TDS | UScellular | |||||||||||||
| (Dollars in millions) | ||||||||||||||
| Revolving Credit Agreement | $ | 399 | $ | 300 | ||||||||||
| Receivables Securitization Agreement | — | 250 | ||||||||||||
| Repurchase Agreement | — | 140 | ||||||||||||
| Total undrawn borrowing capacity | $ | 399 | $ | 690 | ||||||||||
Financing
Revolving Credit Agreements
TDS and UScellular have unsecured revolving credit agreements with maximum borrowing capacities of $400 million and $300 million, respectively. Amounts under the revolving credit agreements may be borrowed, repaid and reborrowed from time to time until maturity in July 2026. During the nine months ended September 30, 2022, UScellular borrowed and repaid $75 million under its revolving credit agreement. As of September 30, 2022, there were no outstanding borrowings under the revolving credit agreements, except for letters of credit, and TDS' and UScellular's unused borrowing capacity was $399 million and $300 million, respectively.
Term Loan Agreements
TDS and UScellular have term loan agreements with maximum borrowing capacities of $500 million and $800 million, respectively. The maturity dates for the term loan agreements range from July 2026 to July 2031. During the nine months ended September 30, 2022, TDS borrowed $300 million under its term loan credit agreements and UScellular borrowed $500 million under its term loan credit agreements. As of September 30, 2022, TDS and UScellular have borrowed the full amounts available under the agreements and the outstanding borrowings were $498 million and $797 million, respectively.
Export Credit Financing Agreement
In December 2021, UScellular entered into a $150 million term loan credit facility with Export Development Canada to finance (or refinance) imported equipment, including equipment purchased prior to entering the term loan credit facility agreement. During the nine months ended September 30, 2022, UScellular borrowed $150 million, which is the full amount available under the agreement and is due in January 2027.
Receivables Securitization Agreement
UScellular, through its subsidiaries, has a receivables securitization agreement to permit securitized borrowings using its equipment installment plan receivables. In March 2022, UScellular amended the agreement to extend the maturity date to March 2024. Amounts under the agreement may be borrowed, repaid and reborrowed from time to time until the maturity date. During the nine months ended September 30, 2022, UScellular repaid $250 million under the agreement. As of September 30, 2022, the outstanding borrowings under the agreement were $200 million and the unused borrowing capacity under the agreement was $250 million, subject to sufficient collateral to satisfy the asset borrowing base provisions of the agreement.
Repurchase Agreement
In January 2022, UScellular, through a subsidiary (the repo subsidiary), entered into a repurchase agreement to borrow up to $200 million, subject to the availability of eligible equipment installment plan receivables and the agreement of the lender. The transaction is accounted for as a one-month secured borrowing. The expiration date of the repurchase agreement is in January 2023. During the nine months ended September 30, 2022, the repo subsidiary borrowed $110 million and repaid $50 million under the repurchase agreement. As of September 30, 2022, the outstanding borrowings under the agreement were $60 million and the unused borrowing capacity was $140 million.
Financial Covenants
TDS and UScellular believe they were in compliance with all of the financial covenants and requirements set forth in their revolving credit agreements, term loan credit agreements, export credit financing agreement and receivables securitization agreement as of September 30, 2022.
Other Long-Term Financing
TDS and UScellular have in place effective shelf registration statements on Form S-3 to issue senior or subordinated securities, preferred shares and depositary shares.
See Note 10 — Debt in the Notes to Consolidated Financial Statements for additional information related to the financing agreements.
20
Capital Expenditures
Capital expenditures (i.e., additions to property, plant and equipment and system development expenditures; excludes wireless spectrum license additions), which include the effects of accruals and capitalized interest, for the nine months ended September 30, 2022 and 2021, were as follows:
Capital Expenditures
(Dollars in millions)
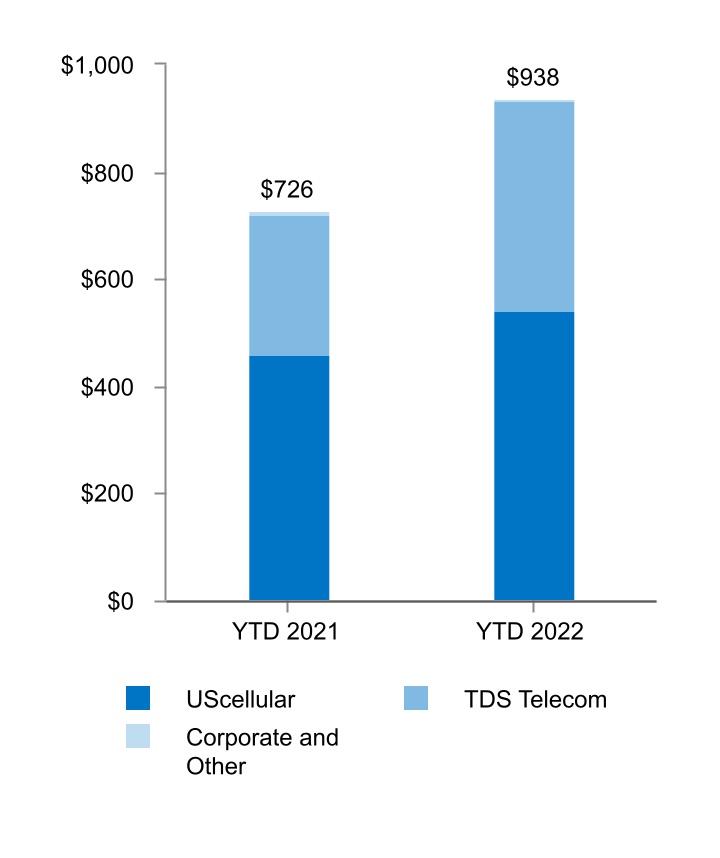
UScellular’s capital expenditures for the nine months ended September 30, 2022 and 2021, were $541 million and $458 million, respectively.
Capital expenditures for the full year 2022 are expected to be between $700 million and $800 million. These expenditures are expected to be used principally for the following purposes:
▪
Continue network modernization and 5G deployment;
▪
Enhance and maintain UScellular's network coverage, including providing additional speed and capacity to accommodate increased data usage by current customers; and
▪
Invest in information technology to support existing and new services and products.
TDS Telecom’s capital expenditures for the nine months ended September 30, 2022 and 2021, were $391 million and $260 million, respectively.
Capital expenditures for the full year 2022 are expected to be between $500 million and $550 million. These expenditures are expected to be used principally for the following purposes:
▪
Continue to expand fiber deployment in incumbent and expansion markets;
▪
Maintain and enhance existing infrastructure including build-out requirements to meet state broadband and A-CAM programs;
▪
Upgrade broadband capacity and speeds; and
▪
Support success-based spending for broadband growth.
Macroeconomic factors may impact the acquisition or cost of products and materials as well as contribute to internal and external labor shortages.
TDS intends to finance its capital expenditures for 2022 using primarily Cash flows from operating activities, existing cash balances and, as required, additional debt financing from its existing agreements and/or other forms of financing.
Acquisitions, Divestitures and Exchanges
TDS may be engaged from time to time in negotiations (subject to all applicable regulations) relating to the acquisition, divestiture or exchange of companies, properties, wireless spectrum licenses (including pursuant to FCC auctions) and other possible businesses. In general, TDS may not disclose such transactions until there is a definitive agreement.
Other Obligations
TDS will require capital for future spending on existing contractual obligations, including long-term debt obligations; dividend obligations; lease commitments; commitments for device purchases, network facilities and transport services; agreements for software licensing; long-term marketing programs; commitments for wireless spectrum licenses acquired through FCC auctions; and other agreements to purchase goods or services.
21
Variable Interest Entities
TDS consolidates certain “variable interest entities” as defined under GAAP. See Note 11 — Variable Interest Entities in the Notes to Consolidated Financial Statements for additional information related to these variable interest entities. TDS may elect to make additional capital contributions and/or advances to these variable interest entities in future periods in order to fund their operations.
Common Share Repurchase Programs
During the nine months ended September 30, 2022, TDS repurchased 1,595,293 Common Shares for $26 million at an average cost per share of $16.19. As of September 30, 2022, the maximum dollar value of TDS Common Shares that may yet be repurchased under TDS’ program was $152 million. For additional information related to the current TDS repurchase authorization, see Unregistered Sales of Equity Securities and Use of Proceeds.
During the nine months ended September 30, 2022, UScellular repurchased 1,011,177 Common Shares for $29 million at an average cost per share of $28.53. As of September 30, 2022, the total cumulative amount of UScellular Common Shares authorized to be repurchased is 2,506,000.
22
Consolidated Cash Flow Analysis
TDS operates a capital-intensive business. TDS makes substantial investments to acquire wireless spectrum licenses and properties and to construct and upgrade communications networks and facilities as a basis for creating long-term value for shareholders. In recent years, rapid changes in technology and new opportunities have required substantial investments in potentially revenue‑enhancing and cost-saving upgrades to TDS’ networks. Cash flows may fluctuate from quarter to quarter and year to year due to seasonality, timing and other factors. The following discussion summarizes TDS' cash flow activities for the nine months ended September 30, 2022 and 2021.
2022 Commentary
TDS’ Cash, cash equivalents and restricted cash increased $67 million. Net cash provided by operating activities was $901 million due to net income of $101 million adjusted for non-cash items of $768 million, distributions received from unconsolidated entities of $100 million, including $37 million in distributions from the LA Partnership, and changes in working capital items which decreased net cash by $68 million. The working capital changes were primarily driven by an increase in customer and agent receivables, increases in inventory purchases and the timing of vendor payments, partially offset by a federal income tax refund of $125 million received during the first quarter.
Cash flows used for investing activities were $1,408 million, which included payments for property, plant and equipment of $794 million and payments for wireless spectrum licenses of $575 million. Cash payments for property, plant and equipment are lower than the total capital expenditures in the nine months ended September 30, 2022 due primarily to future obligations of certain software license agreements that are recorded as current year capital expenditures but are paid over time.
Cash flows provided by financing activities were $574 million, due primarily to $800 million borrowed under the term loan facilities, $150 million borrowed under the UScellular export credit financing agreement, $110 million borrowed under the UScellular EIP receivables repurchase agreement, and $75 million borrowed under the UScellular revolving credit agreement. These were partially offset by $250 million of repayments on the UScellular receivables securitization agreement, a $75 million repayment on the UScellular revolving credit agreement, a $50 million repayment on the UScellular EIP receivables repurchase agreement, the payment of dividends and repurchase of TDS and UScellular Common Shares.
2021 Commentary
TDS’ Cash, cash equivalents and restricted cash decreased $691 million. Net cash provided by operating activities was $863 million due to net income of $152 million adjusted for non-cash items of $725 million and distributions received from unconsolidated entities of $107 million, including $32 million in distributions from the LA Partnership. This was partially offset by changes in working capital items which decreased net cash by $121 million. The working capital changes were primarily influenced by a decrease to accrued taxes and the timing of vendor payments and an increase in customer and agent receivables.
Cash flows used for investing activities were $2,006 million, which included payments for wireless spectrum licenses of $1,283 million and payments for property, plant and equipment of $726 million.
Cash flows provided by financing activities were $452 million, due primarily to the issuance of $1,110 million of TDS Preferred Shares, the issuance of $500 million of 5.5% UScellular Senior Notes, $500 million borrowed under the UScellular receivables securitization agreement, $217 million borrowed under the UScellular term loan, $125 million borrowed under the TDS revolving credit agreement, and $76 million borrowed under the TDS term loan. These were partially offset by the redemption of $641 million of TDS Senior Notes, $917 million of UScellular Senior Notes, a $200 million repayment on the receivables securitization agreement, a $125 million repayment on the TDS revolving credit agreement, the repurchase of TDS and UScellular Common Shares, the payment of dividends and the payment of debt and equity issuance costs.
23
Consolidated Balance Sheet Analysis
The following discussion addresses certain captions in the consolidated balance sheet and changes therein. This discussion is intended to highlight the significant changes and is not intended to fully reconcile the changes. Notable balance sheet changes during 2022 were as follows:
Inventory, net
Inventory, net increased $74 million due primarily to increased inventory levels to support new promotions and ensure adequate device supply.
Income taxes receivable
Income taxes receivable decreased $124 million due primarily to a federal income tax refund received related to the 2020 net operating loss carryback enabled by the CARES Act.
Accrued compensation
Accrued compensation decreased $30 million due primarily to associate bonus payments in March 2022.
Other current liabilities
Other current liabilities increased $176 million due primarily to an increase in the short-term accrual for Auction 107 relocation fees, net borrowings under the EIP receivables repurchase agreement and accruals related to software license agreements.
Long-term debt, net
The following table presents the components of the $680 million increase in Long-term debt, net:
| Long-term debt, net | |||||
| (Dollars in millions) | |||||
| Balance at December 31, 2021 | $ | 2,928 | |||
| Borrowings under Revolving Credit Agreements | 75 | ||||
| Borrowings under Term Loan Agreements | 800 | ||||
| Borrowings under Export Credit Financing Agreement | 150 | ||||
| Repayments under Revolving Credit Agreements | (75) | ||||
| Repayments under Receivables Securitization Agreement | (250) | ||||
| Other | (20) | ||||
| Balance at September 30, 2022 | $ | 3,608 | |||
24
Supplemental Information Relating to Non-GAAP Financial Measures
TDS sometimes uses information derived from consolidated financial information but not presented in its financial statements prepared in accordance with GAAP to evaluate the performance of its business. Specifically, TDS has referred to the following measures in this Form 10-Q Report:
▪
EBITDA
▪
Adjusted EBITDA
▪
Adjusted OIBDA
▪
Free cash flow
These measures are considered “non-GAAP financial measures” under U.S. Securities and Exchange Commission Rules. Following are explanations of each of these measures.
EBITDA, Adjusted EBITDA and Adjusted OIBDA
EBITDA, Adjusted EBITDA and Adjusted OIBDA are defined as net income (loss) adjusted for the items set forth in the reconciliation below. EBITDA, Adjusted EBITDA and Adjusted OIBDA are not measures of financial performance under GAAP and should not be considered as alternatives to Net income (loss) or Cash flows from operating activities, as indicators of cash flows or as measures of liquidity. TDS does not intend to imply that any such items set forth in the reconciliation below are non-recurring, infrequent or unusual; such items may occur in the future.
Adjusted EBITDA is a segment measure reported to the chief operating decision maker for purposes of assessing the segments' performance. See Note 13 — Business Segment Information in the Notes to Consolidated Financial Statements for additional information.
Management uses Adjusted EBITDA and Adjusted OIBDA as measurements of profitability, and therefore reconciliations to applicable GAAP income measures are deemed appropriate. Management believes Adjusted EBITDA and Adjusted OIBDA are useful measures of TDS’ operating results before significant recurring non-cash charges, gains and losses, and other items as presented below as they provide additional relevant and useful information to investors and other users of TDS’ financial data in evaluating the effectiveness of its operations and underlying business trends in a manner that is consistent with management’s evaluation of business performance. Adjusted EBITDA shows adjusted earnings before interest, taxes, depreciation, amortization and accretion, and gains and losses, while Adjusted OIBDA reduces this measure further to exclude Equity in earnings of unconsolidated entities and Interest and dividend income in order to more effectively show the performance of operating activities excluding investment activities. The following tables reconcile EBITDA, Adjusted EBITDA and Adjusted OIBDA to the corresponding GAAP measures, Net income (loss) and Operating income (loss).
|
Three Months Ended
September 30, |
Nine Months Ended
September 30, |
||||||||||||||||||||||
| TDS - CONSOLIDATED | 2022 | 2021 | 2022 | 2021 | |||||||||||||||||||
| (Dollars in millions) | |||||||||||||||||||||||
| Net income (loss) (GAAP) | $ | (10) | $ | 47 | $ | 101 | $ | 152 | |||||||||||||||
| Add back: | |||||||||||||||||||||||
| Income tax expense (benefit) | (3) | 19 | 62 | 38 | |||||||||||||||||||
| Interest expense | 46 | 54 | 118 | 193 | |||||||||||||||||||
| Depreciation, amortization and accretion | 234 | 213 | 691 | 670 | |||||||||||||||||||
| EBITDA (Non-GAAP) | 267 | 333 | 972 | 1,053 | |||||||||||||||||||
| Add back or deduct: | |||||||||||||||||||||||
| Loss on impairment of licenses | — | — | 3 | — | |||||||||||||||||||
| (Gain) loss on asset disposals, net | 4 | 8 | 13 | 17 | |||||||||||||||||||
| (Gain) loss on sale of business and other exit costs, net | — | — | (1) | (1) | |||||||||||||||||||
| Adjusted EBITDA (Non-GAAP) | 271 | 341 | 987 | 1,069 | |||||||||||||||||||
| Deduct: | |||||||||||||||||||||||
| Equity in earnings of unconsolidated entities | 40 | 48 | 123 | 138 | |||||||||||||||||||
| Interest and dividend income | 4 | 3 | 10 | 9 | |||||||||||||||||||
| Other, net | — | — | 1 | (1) | |||||||||||||||||||
| Adjusted OIBDA (Non-GAAP) | 227 | 290 | 853 | 923 | |||||||||||||||||||
| Deduct: | |||||||||||||||||||||||
| Depreciation, amortization and accretion | 234 | 213 | 691 | 670 | |||||||||||||||||||
| Loss on impairment of licenses | — | — | 3 | — | |||||||||||||||||||
| (Gain) loss on asset disposals, net | 4 | 8 | 13 | 17 | |||||||||||||||||||
| (Gain) loss on sale of business and other exit costs, net | — | — | (1) | (1) | |||||||||||||||||||
| Operating income (loss) (GAAP) | $ | (11) | $ | 69 | $ | 147 | $ | 237 | |||||||||||||||
25
|
Three Months Ended
September 30, |
Nine Months Ended
September 30, |
||||||||||||||||||||||
| UScellular | 2022 | 2021 | 2022 | 2021 | |||||||||||||||||||
| (Dollars in millions) | |||||||||||||||||||||||
| Net income (loss) (GAAP) | $ | (12) | $ | 35 | $ | 62 | $ | 132 | |||||||||||||||
| Add back: | |||||||||||||||||||||||
| Income tax expense (benefit) | (3) | 14 | 46 | 31 | |||||||||||||||||||
| Interest expense | 42 | 45 | 115 | 144 | |||||||||||||||||||
| Depreciation, amortization and accretion | 177 | 160 | 520 | 510 | |||||||||||||||||||
| EBITDA (Non-GAAP) | 204 | 254 | 743 | 817 | |||||||||||||||||||
| Add back or deduct: | |||||||||||||||||||||||
| Loss on impairment of licenses | — | — | 3 | — | |||||||||||||||||||
| (Gain) loss on asset disposals, net | 1 | 8 | 9 | 15 | |||||||||||||||||||
| (Gain) loss on sale of business and other exit costs, net | — | — | (1) | (1) | |||||||||||||||||||
| Adjusted EBITDA (Non-GAAP) | 205 | 262 | 754 | 831 | |||||||||||||||||||
| Deduct: | |||||||||||||||||||||||
| Equity in earnings of unconsolidated entities | 40 | 48 | 122 | 137 | |||||||||||||||||||
| Interest and dividend income | 2 | 1 | 5 | 5 | |||||||||||||||||||
| Adjusted OIBDA (Non-GAAP) | 163 | 213 | 627 | 689 | |||||||||||||||||||
| Deduct: | |||||||||||||||||||||||
| Depreciation, amortization and accretion | 177 | 160 | 520 | 510 | |||||||||||||||||||
| Loss on impairment of licenses | — | — | 3 | — | |||||||||||||||||||
| (Gain) loss on asset disposals, net | 1 | 8 | 9 | 15 | |||||||||||||||||||
| (Gain) loss on sale of business and other exit costs, net | — | — | (1) | (1) | |||||||||||||||||||
| Operating income (loss) (GAAP) | $ | (15) | $ | 45 | $ | 96 | $ | 165 | |||||||||||||||
|
Three Months Ended
September 30, |
Nine Months Ended
September 30, |
||||||||||||||||||||||
|
TDS TELECOM
|
2022 | 2021 | 2022 | 2021 | |||||||||||||||||||
|
(Dollars in millions)
|
|||||||||||||||||||||||
|
Net income (GAAP)
|
$ | 10 | $ | 21 | $ | 51 | $ | 68 | |||||||||||||||
| Add back: | |||||||||||||||||||||||
| Income tax expense | 3 | 7 | 18 | 22 | |||||||||||||||||||
| Interest expense | (2) | (1) | (5) | (3) | |||||||||||||||||||
| Depreciation, amortization and accretion | 53 | 49 | 158 | 147 | |||||||||||||||||||
| EBITDA (Non-GAAP) | 63 | 76 | 222 | 233 | |||||||||||||||||||
| Add back or deduct: | |||||||||||||||||||||||
| (Gain) loss on asset disposals, net | 3 | 1 | 4 | 2 | |||||||||||||||||||
| Adjusted EBITDA (Non-GAAP) | 66 | 77 | 226 | 235 | |||||||||||||||||||
| Deduct: | |||||||||||||||||||||||
| Interest and dividend income | 1 | — | 1 | 1 | |||||||||||||||||||
| Other, net | — | — | 1 | (1) | |||||||||||||||||||
| Adjusted OIBDA (Non-GAAP) | 66 | 77 | 224 | 235 | |||||||||||||||||||
| Deduct: | |||||||||||||||||||||||
| Depreciation, amortization and accretion | 53 | 49 | 158 | 147 | |||||||||||||||||||
| (Gain) loss on asset disposals, net | 3 | 1 | 4 | 2 | |||||||||||||||||||
|
Operating income (GAAP)
|
$ | 10 | $ | 27 | $ | 61 | $ | 87 | |||||||||||||||
Numbers may not foot due to rounding.
26
Free Cash Flow
The following table presents Free cash flow, which is defined as Cash flows from operating activities less Cash paid for additions to property, plant and equipment. Free cash flow is a non-GAAP financial measure which TDS believes may be useful to investors and other users of its financial information in evaluating liquidity, specifically, the amount of net cash generated by business operations after deducting Cash paid for additions to property, plant and equipment.
|
Nine Months Ended
September 30, |
|||||||||||
| 2022 | 2021 | ||||||||||
| (Dollars in millions) | |||||||||||
| Cash flows from operating activities (GAAP) | $ | 901 | $ | 863 | |||||||
| Less: Cash paid for additions to property, plant and equipment | 794 | 726 | |||||||||
| Free cash flow (Non-GAAP) | $ | 107 | $ | 137 | |||||||
27
Application of Critical Accounting Policies and Estimates
TDS prepares its consolidated financial statements in accordance with GAAP. TDS’ significant accounting policies are discussed in detail in Note 1 — Summary of Significant Accounting Policies, Note 2 — Revenue Recognition and Note 10 — Leases in the Notes to Consolidated Financial Statements and TDS’ Application of Critical Accounting Policies and Estimates is discussed in detail in Management’s Discussion and Analysis of Financial Condition and Results of Operations, both of which are included in TDS’ Form 10-K for the year ended December 31, 2021.
Regulatory Matters
Spectrum Auctions
On March 2, 2020, the FCC released a Public Notice establishing procedures for an auction offering wireless spectrum licenses in the 3.5 GHz band (Auction 105). On September 2, 2020, the FCC announced by way of public notice that UScellular was the provisional winning bidder for 243 wireless spectrum licenses for a purchase price of $14 million. On July 15, 2022, the FCC released a Consent Decree related to its spectrum aggregation and ownership attribution rules in which UScellular agreed to relinquish its rights to 27 wireless spectrum licenses awarded in Auction 105 and subsequently received a full refund of $2 million. The remaining 216 wireless spectrum licenses were granted by the FCC on July 26, 2022.
On August 7, 2020, the FCC released a Public Notice establishing procedures for an auction offering wireless spectrum licenses in the 3.7-3.98 GHz bands (Auction 107). On February 24, 2021, the FCC announced by way of public notice that UScellular was the provisional winning bidder for 254 wireless spectrum licenses for $1,283 million. UScellular paid $30 million of this amount in 2020 and the remainder in March 2021. The wireless spectrum licenses from Auction 107 were granted by the FCC in July 2021. Additionally, UScellular expects to be obligated to pay approximately $185 million in total from 2021 through 2024 related to relocation costs and accelerated relocation incentive payments. Such additional costs were accrued and capitalized at the time the licenses were granted, and adjusted as necessary if the estimated obligation changes. UScellular paid $36 million and $8 million related to the additional costs in October 2021 and September 2022, respectively. The spectrum must be cleared by incumbent providers before UScellular can access it. UScellular does not expect to have access to this spectrum until late 2023.
On June 9, 2021, the FCC released a Public Notice establishing procedures for an auction offering wireless spectrum licenses in the 3.45-3.55 GHz band (Auction 110). On January 14, 2022, the FCC announced by way of public notice that UScellular was the provisional winning bidder for 380 wireless spectrum licenses for $580 million. UScellular paid $20 million of this amount in 2021 and the remainder in January and February 2022. The wireless spectrum licenses from Auction 110 were granted by the FCC on May 4, 2022.
On March 21, 2022, the FCC released a Public Notice establishing procedures for an auction offering wireless spectrum licenses in the 2.5 GHz band (Auction 108). On September 1, 2022, the FCC announced by way of public notice that UScellular was the provisional winning bidder for 34 wireless spectrum licenses for $3 million. The wireless spectrum licenses from Auction 108 have not yet been granted by the FCC.
28
Private Securities Litigation Reform Act of 1995
Safe Harbor Cautionary Statement
This Form 10-Q, including exhibits, contains statements that are not based on historical facts and represent forward-looking statements, as this term is defined in the Private Securities Litigation Reform Act of 1995. All statements, other than statements of historical facts, that address activities, events or developments that TDS intends, expects, projects, believes, estimates, plans or anticipates will or may occur in the future are forward-looking statements. The words “believes,” “anticipates,” “estimates,” “expects,” “plans,” “intends,” “projects” and similar expressions are intended to identify these forward-looking statements, but are not the exclusive means of identifying them. Such forward-looking statements involve known and unknown risks, uncertainties and other factors that may cause actual results, events or developments to be significantly different from any future results, events or developments expressed or implied by such forward-looking statements. Such risks, uncertainties and other factors include, but are not limited to, those set forth below, as more fully described under “Risk Factors” in TDS’ Form 10-K for the year ended December 31, 2021 and in this Form 10-Q. Each of the following risks could have a material adverse effect on TDS’ business, financial condition or results of operations. However, such factors are not necessarily all of the important factors that could cause actual results, performance or achievements to differ materially from those expressed in, or implied by, the forward-looking statements contained in this document. Other unknown or unpredictable factors also could have material adverse effects on future results, performance or achievements. TDS undertakes no obligation to update publicly any forward-looking statements whether as a result of new information, future events or otherwise. You should carefully consider the Risk Factors in TDS’ Form 10-K for the year ended December 31, 2021, the following factors and other information contained in, or incorporated by reference into, this Form 10-Q to understand the material risks relating to TDS’ business, financial condition or results of operations.
Operational Risk Factors
▪
Intense competition involving products, services, pricing, promotions and network speed and technologies could adversely affect TDS’ revenues or increase its costs to compete.
▪
Changes in roaming practices or other factors could cause TDS’ roaming revenues to decline from current levels, roaming expenses to increase from current levels and/or impact TDS’ ability to service its customers in geographic areas where TDS does not have its own network, which could have an adverse effect on TDS’ business, financial condition or results of operations.
▪
A failure by TDS to obtain access to adequate radio spectrum to meet current or anticipated future needs and/or to accurately predict future needs for radio spectrum could have an adverse effect on TDS’ business, financial condition or results of operations.
▪
An inability to attract people of outstanding talent throughout all levels of the organization, to develop their potential through education and assignments, and to retain them by keeping them engaged, challenged and properly rewarded could have an adverse effect on TDS' business, financial condition or results of operations.
▪
TDS’ smaller scale relative to larger competitors that may have greater financial and other resources than TDS could cause TDS to be unable to compete successfully, which could adversely affect its business, financial condition or results of operations.
▪
Changes in various business factors, including changes in demand, consumer preferences and perceptions, price competition, churn from customer switching activity and other factors, could have an adverse effect on TDS’ business, financial condition or results of operations.
▪
Advances or changes in technology could render certain technologies used by TDS obsolete, could put TDS at a competitive disadvantage, could reduce TDS’ revenues or could increase its costs of doing business.
▪
Complexities associated with deploying new technologies present substantial risk and TDS’ investments in unproven technologies may not produce the benefits that TDS expects.
▪
Costs, integration problems or other factors associated with acquisitions, divestitures or exchanges of properties or wireless spectrum licenses and/or expansion of TDS’ businesses could have an adverse effect on TDS’ business, financial condition or results of operations.
▪
A failure by TDS to complete significant network construction and systems implementation activities as part of its plans to improve the quality, coverage, capabilities and capacity of its network, support and other systems and infrastructure could have an adverse effect on its operations.
▪
Difficulties involving third parties with which TDS does business, including changes in TDS’ relationships with or financial or operational difficulties, including supply chain disruptions, of key suppliers or independent agents and third party national retailers who market TDS’ services, could adversely affect TDS’ business, financial condition or results of operations.
▪
A failure by TDS to maintain flexible and capable telecommunication networks or information technologies, or a material disruption thereof, could have an adverse effect on TDS’ business, financial condition or results of operations.
29
Financial Risk Factors
▪
Uncertainty in TDS’ future cash flow and liquidity or the inability to access capital, deterioration in the capital markets, changes in interest rates, other changes in TDS’ performance or market conditions, changes in TDS’ credit ratings or other factors could limit or restrict the availability of financing on terms and prices acceptable to TDS, which could require TDS to reduce its construction, development or acquisition programs, reduce the amount of wireless spectrum licenses acquired, and/or reduce or cease share repurchases and/or the payment of dividends.
▪
TDS has a significant amount of indebtedness which could adversely affect its financial performance and in turn adversely affect its ability to make payments on its indebtedness, comply with terms of debt covenants and incur additional debt.
▪
TDS’ assets and revenue are concentrated primarily in the U.S. telecommunications industry. Consequently, its operating results may fluctuate based on factors related primarily to conditions in this industry.
▪
TDS has significant investments in entities that it does not control. Losses in the value of such investments could have an adverse effect on TDS’ financial condition or results of operations.
Regulatory, Legal and Governance Risk Factors
▪
Failure by TDS to timely or fully comply with any existing applicable legislative and/or regulatory requirements or changes thereto could adversely affect TDS’ business, financial condition or results of operations.
▪
TDS receives significant regulatory support, and is also subject to numerous surcharges and fees from federal, state and local governments – the applicability and the amount of the support and fees are subject to great uncertainty, including the ability to pass through certain fees to customers, and this uncertainty could have an adverse effect on TDS’ business, financial condition or results of operations.
▪
Settlements, judgments, restraints on its current or future manner of doing business and/or legal costs resulting from pending and future litigation could have an adverse effect on TDS’ business, financial condition or results of operations.
▪
The possible development of adverse precedent in litigation or conclusions in professional studies to the effect that radio frequency emissions from wireless devices and/or cell sites cause harmful health consequences, including cancer or tumors, or may interfere with various electronic medical devices or frequencies used by other industries, could have an adverse effect on TDS’ wireless business, financial condition or results of operations.
▪
Claims of infringement of intellectual property and proprietary rights of others, primarily involving patent infringement claims, could prevent TDS from using necessary technology to provide products or services or subject TDS to expensive intellectual property litigation or monetary penalties, which could have an adverse effect on TDS’ business, financial condition or results of operations.
▪
Certain matters, such as control by the TDS Voting Trust and provisions in the TDS Restated Certificate of Incorporation, may serve to discourage or make more difficult a change in control of TDS or have other consequences.
General Risk Factors
▪
TDS has experienced, and in the future expects to experience, cyber-attacks or other breaches of network or information technology security of varying degrees on a regular basis, which could have an adverse effect on TDS' business, financial condition or results of operations.
▪
Disruption in credit or other financial markets, a deterioration of U.S. or global economic conditions or other events could, among other things, impede TDS’ access to or increase the cost of financing its operating and investment activities and/or result in reduced revenues and lower operating income and cash flows, which would have an adverse effect on TDS’ business, financial condition or results of operations.
▪
The impact of public health emergencies, such as the COVID-19 pandemic, on TDS' business is uncertain, but depending on duration and severity could have a material adverse effect on TDS' business, financial condition or results of operations.
30
Risk Factors
In addition to the information set forth in this Form 10-Q, you should carefully consider the factors discussed in Part I, “Item 1A. Risk Factors” in TDS’ Form 10-K for the year ended December 31, 2021, which could materially affect TDS’ business, financial condition or future results. The risks described in this Form 10-Q and the Form 10-K for the year ended December 31, 2021, may not be the only risks that could affect TDS. Additional unidentified or unrecognized risks and uncertainties could materially adversely affect TDS’ business, financial condition and/or operating results. Subject to the foregoing, TDS has not identified for disclosure any material changes to the risk factors as previously disclosed in TDS’ Form 10-K for the year ended December 31, 2021.
Quantitative and Qualitative Disclosures about Market Risk
Market Risk
As of September 30, 2022, approximately 60% of TDS' long-term debt was in fixed-rate senior notes and approximately 40% in variable-rate debt. Fluctuations in market interest rates can lead to volatility in the fair value of fixed-rate notes and interest expense on variable-rate debt.
The following table presents the scheduled principal payments on long-term debt, lease obligations, and the related weighted average interest rates by maturity dates at September 30, 2022.
| Principal Payments Due by Period | |||||||||||
|
Long-Term Debt Obligations
1
|
Weighted-Avg. Interest Rates on Long-Term Debt Obligations
2
|
||||||||||
| (Dollars in millions) | |||||||||||
| Remainder of 2022 | $ | 3 | 5.3 | % | |||||||
| 2023 | 18 | 4.9 | % | ||||||||
| 2024 | 18 | 4.9 | % | ||||||||
| 2025 | 18 | 4.9 | % | ||||||||
| 2026 | 288 | 4.3 | % | ||||||||
| Thereafter | 3,152 | 5.7 | % | ||||||||
| Total | $ | 3,497 | 5.6 | % | |||||||
1
The total long-term debt obligation differs from Long-term debt in the Consolidated Balance Sheet due to unamortized debt issuance costs on all non-revolving debt instruments, unamortized discounts related to UScellular's 6.7% Senior Notes, and outstanding borrowings under the receivables securitization agreement, which principal repayments are not scheduled but are instead based on actual receivable collections.
2
Represents the weighted average stated interest rates at September 30, 2022, for debt maturing in the respective periods.
See Note 3 — Fair Value Measurements in the Notes to Consolidated Financial Statements for additional information related to the fair value of TDS’ Long-term debt as of September 30, 2022.
31
Financial Statements
Telephone and Data Systems, Inc.
Consolidated Statement of Operations
(Unaudited)
|
Three Months Ended
September 30, |
Nine Months Ended
September 30, |
||||||||||||||||||||||
| 2022 | 2021 | 2022 | 2021 | ||||||||||||||||||||
| (Dollars and shares in millions, except per share amounts) | |||||||||||||||||||||||
| Operating revenues | |||||||||||||||||||||||
| Service | $ |
|
$ |
|
$ |
|
$ |
|
|||||||||||||||
| Equipment and product sales |
|
|
|
|
|||||||||||||||||||
| Total operating revenues |
|
|
|
|
|||||||||||||||||||
| Operating expenses | |||||||||||||||||||||||
| Cost of services (excluding Depreciation, amortization and accretion reported below) |
|
|
|
|
|||||||||||||||||||
| Cost of equipment and products |
|
|
|
|
|||||||||||||||||||
| Selling, general and administrative |
|
|
|
|
|||||||||||||||||||
| Depreciation, amortization and accretion |
|
|
|
|
|||||||||||||||||||
| Loss on impairment of licenses |
|
|
|
|
|||||||||||||||||||
| (Gain) loss on asset disposals, net |
|
|
|
|
|||||||||||||||||||
| (Gain) loss on sale of business and other exit costs, net |
|
|
(
|
(
|
|||||||||||||||||||
| Total operating expenses |
|
|
|
|
|||||||||||||||||||
| Operating income (loss) |
(
|
|
|
|
|||||||||||||||||||
| Investment and other income (expense) | |||||||||||||||||||||||
| Equity in earnings of unconsolidated entities |
|
|
|
|
|||||||||||||||||||
| Interest and dividend income |
|
|
|
|
|||||||||||||||||||
| Interest expense |
(
|
(
|
(
|
(
|
|||||||||||||||||||
| Other, net |
|
|
|
(
|
|||||||||||||||||||
| Total investment and other income (expense) |
(
|
(
|
|
(
|
|||||||||||||||||||
| Income (loss) before income taxes |
(
|
|
|
|
|||||||||||||||||||
| Income tax expense (benefit) |
(
|
|
|
|
|||||||||||||||||||
| Net income (loss) |
(
|
|
|
|
|||||||||||||||||||
| Less: Net income (loss) attributable to noncontrolling interests, net of tax |
(
|
|
|
|
|||||||||||||||||||
| Net income (loss) attributable to TDS shareholders |
(
|
|
|
|
|||||||||||||||||||
| TDS Preferred Share dividends |
|
|
|
|
|||||||||||||||||||
| Net income (loss) attributable to TDS common shareholders | $ |
(
|
$ |
|
$ |
|
$ |
|
|||||||||||||||
| Basic weighted average shares outstanding |
|
|
|
|
|||||||||||||||||||
| Basic earnings (loss) per share attributable to TDS common shareholders | $ |
(
|
$ |
|
$ |
|
$ |
|
|||||||||||||||
| Diluted weighted average shares outstanding |
|
|
|
|
|||||||||||||||||||
| Diluted earnings (loss) per share attributable to TDS common shareholders | $ |
(
|
$ |
|
$ |
|
$ |
|
|||||||||||||||
The accompanying notes are an integral part of these consolidated financial statements.
32
Telephone and Data Systems, Inc.
Consolidated Statement of Comprehensive Income
(Unaudited)
|
Three Months Ended
September 30, |
Nine Months Ended
September 30, |
||||||||||||||||||||||
| 2022 | 2021 | 2022 | 2021 | ||||||||||||||||||||
| (Dollars in millions) | |||||||||||||||||||||||
| Net income (loss) | $ |
(
|
$ |
|
$ |
|
$ |
|
|||||||||||||||
| Net change in accumulated other comprehensive income | |||||||||||||||||||||||
| Change related to retirement plan | |||||||||||||||||||||||
| Amounts included in net periodic benefit cost for the period | |||||||||||||||||||||||
| Amortization of prior service cost |
|
|
|
|
|||||||||||||||||||
| Comprehensive income (loss) |
(
|
|
|
|
|||||||||||||||||||
| Less: Net income (loss) attributable to noncontrolling interests, net of tax |
(
|
|
|
|
|||||||||||||||||||
| Comprehensive income (loss) attributable to TDS shareholders | $ |
(
|
$ |
|
$ |
|
$ |
|
|||||||||||||||
The accompanying notes are an integral part of these consolidated financial statements.
33
Telephone and Data Systems, Inc.
Consolidated Statement of Cash Flows
(Unaudited)
|
Nine Months Ended
September 30, |
|||||||||||
| 2022 | 2021 | ||||||||||
| (Dollars in millions) | |||||||||||
| Cash flows from operating activities | |||||||||||
| Net income | $ |
|
$ |
|
|||||||
| Add (deduct) adjustments to reconcile net income to net cash flows from operating activities | |||||||||||
| Depreciation, amortization and accretion |
|
|
|||||||||
| Bad debts expense |
|
|
|||||||||
| Stock-based compensation expense |
|
|
|||||||||
| Deferred income taxes, net |
|
|
|||||||||
| Equity in earnings of unconsolidated entities |
(
|
(
|
|||||||||
| Distributions from unconsolidated entities |
|
|
|||||||||
| Loss on impairment of licenses |
|
|
|||||||||
| (Gain) loss on asset disposals, net |
|
|
|||||||||
| (Gain) loss on sale of business and other exit costs, net |
(
|
(
|
|||||||||
| Other operating activities |
|
|
|||||||||
| Changes in assets and liabilities from operations | |||||||||||
| Accounts receivable |
(
|
|
|||||||||
| Equipment installment plans receivable |
(
|
(
|
|||||||||
| Inventory |
(
|
|
|||||||||
| Accounts payable |
|
(
|
|||||||||
| Customer deposits and deferred revenues |
|
|
|||||||||
| Accrued taxes |
|
(
|
|||||||||
| Accrued interest |
|
|
|||||||||
| Other assets and liabilities |
|
(
|
|||||||||
| Net cash provided by operating activities |
|
|
|||||||||
| Cash flows from investing activities | |||||||||||
| Cash paid for additions to property, plant and equipment |
(
|
(
|
|||||||||
| Cash paid for intangible assets |
(
|
(
|
|||||||||
| Cash received from investments |
|
|
|||||||||
| Cash received from divestitures and exchanges |
|
|
|||||||||
| Advance payments for license acquisitions |
|
(
|
|||||||||
| Other investing activities |
(
|
|
|||||||||
| Net cash used in investing activities |
(
|
(
|
|||||||||
| Cash flows from financing activities | |||||||||||
| Issuance of long-term debt |
|
|
|||||||||
| Repayment of long-term debt |
(
|
(
|
|||||||||
| Issuance of short-term debt |
|
|
|||||||||
| Repayment of short-term debt |
(
|
|
|||||||||
| Issuance of TDS Preferred Shares |
|
|
|||||||||
| TDS Common Shares reissued for benefit plans, net of tax payments |
(
|
(
|
|||||||||
| UScellular Common Shares reissued for benefit plans, net of tax payments |
(
|
(
|
|||||||||
| Repurchase of TDS Common Shares |
(
|
(
|
|||||||||
| Repurchase of UScellular Common Shares |
(
|
(
|
|||||||||
| Dividends paid to TDS shareholders |
(
|
(
|
|||||||||
| Payment of debt and equity issuance costs |
(
|
(
|
|||||||||
| Distributions to noncontrolling interests |
(
|
(
|
|||||||||
| Other financing activities |
(
|
(
|
|||||||||
| Net cash provided by financing activities |
|
|
|||||||||
| Net increase (decrease) in cash, cash equivalents and restricted cash |
|
(
|
|||||||||
| Cash, cash equivalents and restricted cash | |||||||||||
| Beginning of period |
|
|
|||||||||
| End of period | $ |
|
$ |
|
|||||||
The accompanying notes are an integral part of these consolidated financial statements.
34
Telephone and Data Systems, Inc.
Consolidated Balance Sheet — Assets
(Unaudited)
| September 30, 2022 | December 31, 2021 | ||||||||||
| (Dollars in millions) | |||||||||||
| Current assets | |||||||||||
| Cash and cash equivalents | $ |
|
$ |
|
|||||||
| Accounts receivable | |||||||||||
|
Customers and agents, less allowances of $
|
|
|
|||||||||
|
Other, less allowances of $
|
|
|
|||||||||
| Inventory, net |
|
|
|||||||||
| Prepaid expenses |
|
|
|||||||||
| Income taxes receivable |
|
|
|||||||||
| Other current assets |
|
|
|||||||||
| Total current assets |
|
|
|||||||||
| Assets held for sale |
|
|
|||||||||
| Licenses |
|
|
|||||||||
| Goodwill |
|
|
|||||||||
|
Other intangible assets, net of accumulated amortization of $
|
|
|
|||||||||
| Investments in unconsolidated entities |
|
|
|||||||||
| Property, plant and equipment | |||||||||||
| In service and under construction |
|
|
|||||||||
| Less: Accumulated depreciation and amortization |
|
|
|||||||||
| Property, plant and equipment, net |
|
|
|||||||||
| Operating lease right-of-use assets |
|
|
|||||||||
| Other assets and deferred charges |
|
|
|||||||||
|
Total assets
1
|
$ |
|
$ |
|
|||||||
The accompanying notes are an integral part of these consolidated financial statements.
35
Telephone and Data Systems, Inc.
Consolidated Balance Sheet — Liabilities and Equity
(Unaudited)
| September 30, 2022 | December 31, 2021 | ||||||||||
| (Dollars and shares in millions, except per share amounts) | |||||||||||
| Current liabilities | |||||||||||
| Current portion of long-term debt | $ |
|
$ |
|
|||||||
| Accounts payable |
|
|
|||||||||
| Customer deposits and deferred revenues |
|
|
|||||||||
| Accrued interest |
|
|
|||||||||
| Accrued taxes |
|
|
|||||||||
| Accrued compensation |
|
|
|||||||||
| Short-term operating lease liabilities |
|
|
|||||||||
| Other current liabilities |
|
|
|||||||||
| Total current liabilities |
|
|
|||||||||
| Deferred liabilities and credits | |||||||||||
| Deferred income tax liability, net |
|
|
|||||||||
| Long-term operating lease liabilities |
|
|
|||||||||
| Other deferred liabilities and credits |
|
|
|||||||||
| Long-term debt, net |
|
|
|||||||||
| Commitments and contingencies |
|
|
|||||||||
| Noncontrolling interests with redemption features |
|
|
|||||||||
| Equity | |||||||||||
| TDS shareholders’ equity | |||||||||||
| Series A Common and Common Shares | |||||||||||
|
Authorized
|
|||||||||||
|
Issued
|
|||||||||||
|
Outstanding
|
|||||||||||
|
Par Value ($
|
|
|
|||||||||
| Capital in excess of par value |
|
|
|||||||||
|
Preferred Shares,
|
|
|
|||||||||
|
Treasury shares, at cost,
|
(
|
(
|
|||||||||
| Accumulated other comprehensive income |
|
|
|||||||||
| Retained earnings |
|
|
|||||||||
| Total TDS shareholders' equity |
|
|
|||||||||
| Noncontrolling interests |
|
|
|||||||||
| Total equity |
|
|
|||||||||
|
Total liabilities and equity
1
|
$ |
|
$ |
|
|||||||
The accompanying notes are an integral part of these consolidated financial statements.
1
The consolidated total assets as of September 30, 2022 and December 31, 2021, include assets held by consolidated variable interest entities (VIEs) of $
1,240
million and $
1,456
million, respectively, which are not available to be used to settle the obligations of TDS. The consolidated total liabilities as of September 30, 2022 and December 31, 2021, include certain liabilities of consolidated VIEs of $
21
million for which the creditors of the VIEs have no recourse to the general credit of TDS. See Note 11 — Variable Interest Entities for additional information.
36
Telephone and Data Systems, Inc.
Consolidated Statement of Changes in Equity
(Unaudited)
| TDS Shareholders | |||||||||||||||||||||||||||||||||||||||||||||||||||||
|
Series A
Common and
Common
shares
|
Capital in
excess of
par value
|
Preferred Shares |
Treasury
shares
|
Accumulated
other comprehensive income |
Retained
earnings
|
Total TDS
shareholders'
equity
|
Noncontrolling
interests |
Total equity | |||||||||||||||||||||||||||||||||||||||||||||
| (Dollars in millions, except per share amounts) | |||||||||||||||||||||||||||||||||||||||||||||||||||||
| June 30, 2022 | $ |
|
$ |
|
$ |
|
$ |
(
|
$ |
|
$ |
|
$ |
|
$ |
|
$ |
|
|||||||||||||||||||||||||||||||||||
| Net income (loss) attributable to TDS shareholders | — | — | — | — | — |
(
|
(
|
— |
(
|
||||||||||||||||||||||||||||||||||||||||||||
| Net income (loss) attributable to noncontrolling interests classified as equity | — | — | — | — | — | — |
|
(
|
(
|
||||||||||||||||||||||||||||||||||||||||||||
| Other comprehensive income | — | — | — | — |
|
— |
|
— |
|
||||||||||||||||||||||||||||||||||||||||||||
|
TDS Common and Series A Common share dividends ($
|
— | — | — | — | — |
(
|
(
|
— |
(
|
||||||||||||||||||||||||||||||||||||||||||||
|
TDS Preferred share dividends ($
|
— | — | — | — | — |
(
|
(
|
— |
(
|
||||||||||||||||||||||||||||||||||||||||||||
| Repurchase of Common Shares | — | — | — |
(
|
— | — |
(
|
— |
(
|
||||||||||||||||||||||||||||||||||||||||||||
| Dividend reinvestment plan | — |
|
— | — | — |
(
|
|
— |
|
||||||||||||||||||||||||||||||||||||||||||||
|
Incentive and compensation plans
|
— |
|
— | — | — | — |
|
— |
|
||||||||||||||||||||||||||||||||||||||||||||
|
Adjust investment in subsidiaries for repurchases, issuances and other compensation plans
|
— |
|
— | — | — | — |
|
(
|
(
|
||||||||||||||||||||||||||||||||||||||||||||
|
Distributions to noncontrolling interests
|
— | — | — | — | — | — |
|
(
|
(
|
||||||||||||||||||||||||||||||||||||||||||||
| September 30, 2022 | $ |
|
$ |
|
$ |
|
$ |
(
|
$ |
|
$ |
|
$ |
|
$ |
|
$ |
|
|||||||||||||||||||||||||||||||||||
The accompanying notes are an integral part of these consolidated financial statements.
37
Telephone and Data Systems, Inc.
Consolidated Statement of Changes in Equity
(Unaudited)
| TDS Shareholders | |||||||||||||||||||||||||||||||||||||||||||||||||||||
|
Series A
Common and
Common
shares
|
Capital in
excess of
par value
|
Preferred Shares |
Treasury
shares
|
Accumulated
other
comprehensive
income (loss)
|
Retained
earnings
|
Total TDS
shareholders'
equity
|
Noncontrolling
interests
|
Total equity | |||||||||||||||||||||||||||||||||||||||||||||
| (Dollars in millions, except per share amounts) | |||||||||||||||||||||||||||||||||||||||||||||||||||||
| June 30, 2021 | $ |
|
$ |
|
$ |
|
$ |
(
|
$ |
(
|
$ |
|
$ |
|
$ |
|
$ |
|
|||||||||||||||||||||||||||||||||||
|
Net income attributable to TDS shareholders
|
— | — | — | — | — |
|
|
— |
|
||||||||||||||||||||||||||||||||||||||||||||
|
Net income attributable to noncontrolling interests classified as equity
|
— | — | — | — | — | — |
|
|
|
||||||||||||||||||||||||||||||||||||||||||||
|
TDS Common and Series A Common share dividends ($
|
— | — | — | — | — |
(
|
(
|
— |
(
|
||||||||||||||||||||||||||||||||||||||||||||
| Issuance of TDS Preferred Shares, net of costs | — | — |
|
— | — | — |
|
— |
|
||||||||||||||||||||||||||||||||||||||||||||
|
TDS Preferred share dividends ($
|
— | — | — | — | — |
(
|
(
|
— |
(
|
||||||||||||||||||||||||||||||||||||||||||||
| Repurchase of Common Shares | — | — | — |
(
|
— | — |
(
|
— |
(
|
||||||||||||||||||||||||||||||||||||||||||||
|
Dividend reinvestment plan
|
— | — | — | — | — |
(
|
(
|
— |
(
|
||||||||||||||||||||||||||||||||||||||||||||
|
Incentive and compensation plans
|
— |
|
— | — | — | — |
|
— |
|
||||||||||||||||||||||||||||||||||||||||||||
|
Adjust investment in subsidiaries for repurchases, issuances and other compensation plans
|
— |
|
— | — | — | — |
|
(
|
(
|
||||||||||||||||||||||||||||||||||||||||||||
| September 30, 2021 | $ |
|
$ |
|
$ |
|
$ |
(
|
$ |
(
|
$ |
|
$ |
|
$ |
|
$ |
|
|||||||||||||||||||||||||||||||||||
The accompanying notes are an integral part of these consolidated financial statements.
38
Telephone and Data Systems, Inc.
Consolidated Statement of Changes in Equity
(Unaudited)
| TDS Shareholders | |||||||||||||||||||||||||||||||||||||||||||||||||||||
|
Series A
Common and
Common
shares
|
Capital in
excess of
par value
|
Preferred Shares |
Treasury
shares
|
Accumulated
other comprehensive income |
Retained
earnings
|
Total TDS
shareholders'
equity
|
Noncontrolling
interests
|
Total equity | |||||||||||||||||||||||||||||||||||||||||||||
| (Dollars in millions, except per share amounts) | |||||||||||||||||||||||||||||||||||||||||||||||||||||
| December 31, 2021 | $ |
|
$ |
|
$ |
|
$ |
(
|
$ |
|
$ |
|
$ |
|
$ |
|
$ |
|
|||||||||||||||||||||||||||||||||||
|
Net income attributable to TDS shareholders
|
— | — | — | — | — |
|
|
— |
|
||||||||||||||||||||||||||||||||||||||||||||
|
Net income attributable to noncontrolling interests classified as equity
|
— | — | — | — | — | — |
|
|
|
||||||||||||||||||||||||||||||||||||||||||||
| Other comprehensive income | — | — | — | — |
|
— |
|
— |
|
||||||||||||||||||||||||||||||||||||||||||||
|
TDS Common and Series A Common share dividends ($
|
— | — | — | — | — |
(
|
(
|
— |
(
|
||||||||||||||||||||||||||||||||||||||||||||
|
TDS Preferred share dividends ($
|
— | — | — | — | — |
(
|
(
|
— |
(
|
||||||||||||||||||||||||||||||||||||||||||||
| Repurchase of Common Shares | — | — | — |
(
|
— | — |
(
|
— |
(
|
||||||||||||||||||||||||||||||||||||||||||||
| Dividend reinvestment plan | — |
|
— |
|
— |
(
|
|
— |
|
||||||||||||||||||||||||||||||||||||||||||||
|
Incentive and compensation plans
|
— |
|
— |
|
— |
(
|
|
— |
|
||||||||||||||||||||||||||||||||||||||||||||
|
Adjust investment in subsidiaries for repurchases, issuances and other compensation plans
|
— |
|
— | — | — | — |
|
(
|
(
|
||||||||||||||||||||||||||||||||||||||||||||
|
Distributions to noncontrolling interests
|
— | — | — | — | — | — |
|
(
|
(
|
||||||||||||||||||||||||||||||||||||||||||||
| September 30, 2022 | $ |
|
$ |
|
$ |
|
$ |
(
|
$ |
|
$ |
|
$ |
|
$ |
|
$ |
|
|||||||||||||||||||||||||||||||||||
The accompanying notes are an integral part of these consolidated financial statements.
39
Telephone and Data Systems, Inc.
Consolidated Statement of Changes in Equity
(Unaudited)
| TDS Shareholders | |||||||||||||||||||||||||||||||||||||||||||||||||||||
|
Series A
Common and
Common
shares
|
Capital in
excess of
par value
|
Preferred Shares |
Treasury
shares
|
Accumulated
other
comprehensive
income (loss)
|
Retained
earnings
|
Total TDS
shareholders'
equity
|
Noncontrolling
interests
|
Total equity | |||||||||||||||||||||||||||||||||||||||||||||
| (Dollars in millions, except per share amounts) | |||||||||||||||||||||||||||||||||||||||||||||||||||||
| December 31, 2020 | $ |
|
$ |
|
$ |
|
$ |
(
|
$ |
(
|
$ |
|
$ |
|
$ |
|
$ |
|
|||||||||||||||||||||||||||||||||||
|
Net income attributable to TDS shareholders
|
— | — | — | — | — |
|
|
— |
|
||||||||||||||||||||||||||||||||||||||||||||
|
Net income attributable to noncontrolling interests classified as equity
|
— | — | — | — | — | — |
|
|
|
||||||||||||||||||||||||||||||||||||||||||||
| Other comprehensive income | — | — | — | — |
|
— |
|
— |
|
||||||||||||||||||||||||||||||||||||||||||||
|
TDS Common and Series A Common share dividends ($
|
— | — | — | — | — |
(
|
(
|
— |
(
|
||||||||||||||||||||||||||||||||||||||||||||
| Issuance of TDS Preferred Shares, net of costs | — | — |
|
— | — | — |
|
— |
|
||||||||||||||||||||||||||||||||||||||||||||
|
TDS Preferred share dividends ($
|
— | — | — | — | — |
(
|
(
|
— |
(
|
||||||||||||||||||||||||||||||||||||||||||||
| Repurchase of Common Shares | — | — | — |
(
|
— | — |
(
|
— |
(
|
||||||||||||||||||||||||||||||||||||||||||||
|
Dividend reinvestment plan
|
— | — | — |
|
— |
(
|
|
— |
|
||||||||||||||||||||||||||||||||||||||||||||
|
Incentive and compensation plans
|
— |
|
— |
|
— |
(
|
|
— |
|
||||||||||||||||||||||||||||||||||||||||||||
|
Adjust investment in subsidiaries for repurchases, issuances and other compensation plans
|
— |
(
|
— | — | — | — |
(
|
|
(
|
||||||||||||||||||||||||||||||||||||||||||||
|
Distributions to noncontrolling interests
|
— | — | — | — | — | — |
|
(
|
(
|
||||||||||||||||||||||||||||||||||||||||||||
| September 30, 2021 | $ |
|
$ |
|
$ |
|
$ |
(
|
$ |
(
|
$ |
|
$ |
|
$ |
|
$ |
|
|||||||||||||||||||||||||||||||||||
The accompanying notes are an integral part of these consolidated financial statements.
40
Telephone and Data Systems, Inc.
Notes to Consolidated Financial Statements
Note 1 Basis of Presentation
The accounting policies of Telephone and Data Systems, Inc. (TDS) conform to accounting principles generally accepted in the United States of America (GAAP) as set forth in the Financial Accounting Standards Board (FASB) Accounting Standards Codification (ASC). Unless otherwise specified, references to accounting provisions and GAAP in these notes refer to the requirements of the FASB ASC. The consolidated financial statements include the accounts of TDS and subsidiaries in which it has a controlling financial interest, including TDS’
83
%-owned subsidiary, United States Cellular Corporation (UScellular) and TDS’ wholly-owned subsidiary, TDS Telecommunications LLC (TDS Telecom). In addition, the consolidated financial statements include certain entities in which TDS has a variable interest that requires consolidation under GAAP. Intercompany accounts and transactions have been eliminated.
TDS’ business segments reflected in this Quarterly Report on Form 10-Q for the period ended September 30, 2022, are UScellular and TDS Telecom. TDS’ non-reportable other business activities are presented as “Corporate, Eliminations and Other”, which includes the operations of TDS’ wholly-owned hosted and managed services (HMS) subsidiary, which operates under the OneNeck IT Solutions brand, and its wholly-owned subsidiary Suttle-Straus, Inc. (Suttle-Straus). HMS’ and Suttle-Straus’ financial results were not significant to TDS’ operations. All of TDS’ segments operate only in the United States. See Note 13 — Business Segment Information for summary financial information on each business segment.
The unaudited consolidated financial statements included herein have been prepared by TDS pursuant to the rules and regulations of the Securities and Exchange Commission (SEC). Certain information and disclosures normally included in annual financial statements prepared in accordance with GAAP have been condensed or omitted pursuant to such rules and regulations. However, TDS believes that the disclosures included herein are adequate to make the information presented not misleading. Certain numbers included herein are rounded to millions for ease of presentation; however, certain calculated amounts and percentages are determined using the unrounded numbers. These unaudited consolidated financial statements should be read in conjunction with the consolidated financial statements and the notes thereto included in TDS’ Annual Report on Form 10-K (Form 10-K) for the year ended December 31, 2021.
The accompanying unaudited consolidated financial statements contain all adjustments (consisting of normal recurring items, unless otherwise disclosed) necessary for the fair statement of TDS’ financial position as of September 30, 2022 and December 31, 2021 and its results of operations, comprehensive income and changes in equity for the three and nine months ended September 30, 2022 and 2021, and its cash flows for the nine months ended September 30, 2022 and 2021. These results are not necessarily indicative of the results to be expected for the full year. TDS has not changed its significant accounting and reporting policies from those disclosed in its Form 10-K for the year ended December 31, 2021.
Software License Agreements
Certain software licenses are recorded as acquisitions of property, plant and equipment and the incurrence of a liability to the extent that the license fees are not fully paid at acquisition, and are treated as non-cash activity in the Consolidated Statement of Cash Flows. Such acquisitions of software licenses that are not reflected as Cash paid for additions to property, plant and equipment were $
135
million and $
16
million for the nine months ended September 30, 2022 and 2021, respectively.
Restricted Cash
TDS presents restricted cash with cash and cash equivalents in the Consolidated Statement of Cash Flows. Restricted cash primarily consists of balances required under the receivables securitization agreement. See Note 10 — Debt for additional information related to the receivables securitization agreement.
The following table provides a reconciliation of Cash and cash equivalents and restricted cash reported in the Consolidated Balance Sheet to the total of the amounts in the Consolidated Statement of Cash Flows.
| September 30, 2022 | December 31, 2021 | ||||||||||
| (Dollars in millions) | |||||||||||
| Cash and cash equivalents | $ |
|
$ |
|
|||||||
| Restricted cash included in Other current assets |
|
|
|||||||||
| Cash, cash equivalents and restricted cash in the statement of cash flows | $ |
|
$ |
|
|||||||
41
Note 2 Revenue Recognition
Disaggregation of Revenue
In the following table, TDS' revenues are disaggregated by type of service, which represents the relevant categorization of revenues for TDS' reportable segments, and timing of recognition. Service revenues are recognized over time and Equipment and product sales are point in time.
| Three Months Ended September 30, 2022 | UScellular | TDS Telecom | Corporate, Eliminations and Other | Total | |||||||||||||||||||
| (Dollars in millions) | |||||||||||||||||||||||
| Revenues from contracts with customers: | |||||||||||||||||||||||
| Type of service: | |||||||||||||||||||||||
| Retail service | $ |
|
$ |
|
$ |
|
$ |
|
|||||||||||||||
| Inbound roaming |
|
|
|
|
|||||||||||||||||||
| Residential |
|
|
|
|
|||||||||||||||||||
| Commercial |
|
|
|
|
|||||||||||||||||||
| Wholesale |
|
|
|
|
|||||||||||||||||||
| Other service |
|
|
|
|
|||||||||||||||||||
| Service revenues from contracts with customers |
|
|
|
|
|||||||||||||||||||
| Equipment and product sales |
|
|
|
|
|||||||||||||||||||
| Total revenues from contracts with customers |
|
|
|
|
|||||||||||||||||||
| Operating lease income |
|
|
|
|
|||||||||||||||||||
| Total operating revenues | $ |
|
$ |
|
$ |
|
$ |
|
|||||||||||||||
| Three Months Ended September 30, 2021 | UScellular | TDS Telecom | Corporate, Eliminations and Other | Total | |||||||||||||||||||
| (Dollars in millions) | |||||||||||||||||||||||
| Revenues from contracts with customers: | |||||||||||||||||||||||
| Type of service: | |||||||||||||||||||||||
|
Retail service
1,2
|
$ |
|
$ |
|
$ |
|
$ |
|
|||||||||||||||
| Inbound roaming |
|
|
|
|
|||||||||||||||||||
| Residential |
|
|
|
|
|||||||||||||||||||
| Commercial |
|
|
|
|
|||||||||||||||||||
| Wholesale |
|
|
|
|
|||||||||||||||||||
|
Other service
1
|
|
|
|
|
|||||||||||||||||||
| Service revenues from contracts with customers |
|
|
|
|
|||||||||||||||||||
| Equipment and product sales |
|
|
|
|
|||||||||||||||||||
| Total revenues from contracts with customers |
|
|
|
|
|||||||||||||||||||
| Operating lease income |
|
|
|
|
|||||||||||||||||||
| Total operating revenues | $ |
|
$ |
|
$ |
|
$ |
|
|||||||||||||||
42
| Nine Months Ended September 30, 2022 | UScellular | TDS Telecom | Corporate, Eliminations and Other | Total | |||||||||||||||||||
| (Dollars in millions) | |||||||||||||||||||||||
| Revenues from contracts with customers: | |||||||||||||||||||||||
| Type of service: | |||||||||||||||||||||||
| Retail service | $ |
|
$ |
|
$ |
|
$ |
|
|||||||||||||||
| Inbound roaming |
|
|
|
|
|||||||||||||||||||
| Residential |
|
|
|
|
|||||||||||||||||||
| Commercial |
|
|
|
|
|||||||||||||||||||
| Wholesale |
|
|
|
|
|||||||||||||||||||
| Other service |
|
|
|
|
|||||||||||||||||||
| Service revenues from contracts with customers |
|
|
|
|
|||||||||||||||||||
| Equipment and product sales |
|
|
|
|
|||||||||||||||||||
| Total revenues from contracts with customers |
|
|
|
|
|||||||||||||||||||
| Operating lease income |
|
|
|
|
|||||||||||||||||||
| Total operating revenues | $ |
|
$ |
|
$ |
|
$ |
|
|||||||||||||||
| Nine Months Ended September 30, 2021 | UScellular | TDS Telecom | Corporate, Eliminations and Other | Total | |||||||||||||||||||
| (Dollars in millions) | |||||||||||||||||||||||
| Revenues from contracts with customers: | |||||||||||||||||||||||
| Type of service: | |||||||||||||||||||||||
|
Retail service
1,2
|
$ |
|
$ |
|
$ |
|
$ |
|
|||||||||||||||
| Inbound roaming |
|
|
|
|
|||||||||||||||||||
| Residential |
|
|
|
|
|||||||||||||||||||
| Commercial |
|
|
|
|
|||||||||||||||||||
| Wholesale |
|
|
|
|
|||||||||||||||||||
|
Other service
1
|
|
|
|
|
|||||||||||||||||||
| Service revenues from contracts with customers |
|
|
|
|
|||||||||||||||||||
| Equipment and product sales |
|
|
|
|
|||||||||||||||||||
| Total revenues from contracts with customers |
|
|
|
|
|||||||||||||||||||
| Operating lease income |
|
|
|
|
|||||||||||||||||||
| Total operating revenues | $ |
|
$ |
|
$ |
|
$ |
|
|||||||||||||||
Numbers may not foot due to rounding.
1
For the three and nine months ended September 30, 2021, amounts have been adjusted to reclassify $
2
million and $
5
million, respectively, of Internet of Things (IoT) and Reseller revenues from Retail service to Other service.
2
During the three months ended September 30, 2021, UScellular recorded a $
9
million out-of-period error related to the timing of recognition of regulatory fee billings. This adjustment had the impact of increasing Service revenue by $
9
million for the three and nine months ended September 30, 2021. UScellular determined that this adjustment was not material to any of the periods impacted.
Contract Balances
| September 30, 2022 | December 31, 2021 | ||||||||||
| (Dollars in millions) | |||||||||||
| Contract assets | $ |
|
$ |
|
|||||||
| Contract liabilities | $ |
|
$ |
|
|||||||
Revenue recognized related to contract liabilities existing at January 1, 2022 was $
193
million for the nine months ended September 30, 2022.
43
Transaction price allocated to the remaining performance obligations
The following table includes estimated service revenues expected to be recognized related to performance obligations that are unsatisfied (or partially unsatisfied) at the end of the reporting period. These estimates represent service revenues to be recognized when services are delivered to customers pursuant to service plan contracts and under certain roaming agreements with other carriers. These estimates are based on contracts in place as of September 30, 2022 and may vary from actual results.
As practical expedients, revenue related to contracts of less than one year, generally month-to-month contracts, and contracts with a fixed per-unit price and variable quantity, are excluded from these estimates.
| Service Revenues | |||||
| (Dollars in millions) | |||||
| Remainder of 2022 | $ |
|
|||
| 2023 |
|
||||
| Thereafter |
|
||||
|
Total
|
$ |
|
|||
Contract Cost Assets
| September 30, 2022 | December 31, 2021 | ||||||||||
| (Dollars in millions) | |||||||||||
| Costs to obtain contracts | |||||||||||
| Sales commissions | $ |
|
$ |
|
|||||||
| Fulfillment costs | |||||||||||
| Installation costs |
|
|
|||||||||
| Total contract cost assets | $ |
|
$ |
|
|||||||
Amortization of contract cost assets was $
28
million and $
85
million for the three and nine months ended September 30, 2022, respectively, and $
29
million and $
87
million for the three and nine months ended September 30, 2021, respectively, and was included in Selling, general and administrative expenses and Cost of services expenses.
44
Note 3 Fair Value Measurements
As of September 30, 2022 and December 31, 2021, TDS did not have any material financial or nonfinancial assets or liabilities that were required to be recorded at fair value in its Consolidated Balance Sheet in accordance with GAAP.
The provisions of GAAP establish a fair value hierarchy that contains three levels for inputs used in fair value measurements. Level 1 inputs include quoted market prices for identical assets or liabilities in active markets. Level 2 inputs include quoted market prices for similar assets and liabilities in active markets or quoted market prices for identical assets and liabilities in inactive markets. Level 3 inputs are unobservable. A financial instrument’s level within the fair value hierarchy is based on the lowest level of any input that is significant to the fair value measurement. A financial instrument’s level within the fair value hierarchy is not representative of its expected performance or its overall risk profile and, therefore, Level 3 assets are not necessarily higher risk than Level 2 assets or Level 1 assets.
TDS has applied the provisions of fair value accounting for purposes of computing the fair value of financial instruments for disclosure purposes as displayed below.
| Level within the Fair Value Hierarchy | September 30, 2022 | December 31, 2021 | |||||||||||||||||||||||||||
| Book Value | Fair Value | Book Value | Fair Value | ||||||||||||||||||||||||||
| (Dollars in millions) | |||||||||||||||||||||||||||||
| Long-term debt | |||||||||||||||||||||||||||||
| Retail | 2 | $ |
|
$ |
|
$ |
|
$ |
|
||||||||||||||||||||
| Institutional | 2 |
|
|
|
|
||||||||||||||||||||||||
| Other | 2 |
|
|
|
|
||||||||||||||||||||||||
Long-term debt excludes lease obligations, the current portion of Long-term debt and debt financing costs. The fair value of “Retail” Long-term debt was estimated using market prices for UScellular Senior Notes, which are traded on the New York Stock Exchange. TDS’ “Institutional” debt consists of UScellular’s
6.7
% Senior Notes which are traded over the counter. TDS’ “Other” debt consists of term loan credit agreements, receivables securitization agreement and in 2022, export credit financing agreement. TDS estimated the fair value of its Institutional and Other debt through a discounted cash flow analysis using the interest rates or estimated yield to maturity for each borrowing, which ranged from
3.70
% to
8.50
% and
1.31
% to
4.40
% at September 30, 2022 and December 31, 2021, respectively.
The fair values of Cash and cash equivalents, restricted cash and short-term debt approximate their book values due to the short-term nature of these financial instruments.
45
Note 4 Equipment Installment Plans
UScellular sells devices to customers under equipment installment plans over a specified time period. For certain equipment installment plans, after a specified period of time or amount of payments, the customer may have the right to upgrade to a new device and have the remaining unpaid equipment installment contract balance waived, subject to certain conditions, including trading in the original device in good working condition and signing a new equipment installment contract.
The following table summarizes equipment installment plan receivables.
| September 30, 2022 | December 31, 2021 | ||||||||||
| (Dollars in millions) | |||||||||||
| Equipment installment plan receivables, gross | $ |
|
$ |
|
|||||||
| Allowance for credit losses |
(
|
(
|
|||||||||
| Equipment installment plan receivables, net | $ |
|
$ |
|
|||||||
| Net balance presented in the Consolidated Balance Sheet as: | |||||||||||
| Accounts receivable — Customers and agents (Current portion) | $ |
|
$ |
|
|||||||
| Other assets and deferred charges (Non-current portion) |
|
|
|||||||||
| Equipment installment plan receivables, net | $ |
|
$ |
|
|||||||
UScellular uses various inputs, including internal data, information from credit bureaus and other sources, to evaluate the credit profiles of its customers. From this evaluation, a credit class is assigned to the customer that determines the number of eligible lines, the amount of credit available, and the down payment requirement, if any. These credit classes are grouped into four credit categories: lowest risk, lower risk, slight risk and higher risk. A customer's assigned credit class is reviewed periodically and a change is made, if appropriate. An equipment installment plan billed amount is considered past due if not paid within 30 days.
The balance and aging of the equipment installment plan receivables on a gross basis by credit category were as follows:
| September 30, 2022 | December 31, 2021 | ||||||||||||||||||||||||||||||||||||||||||||||||||||||||||
|
Lowest Risk
|
Lower Risk
|
Slight Risk
|
Higher Risk
|
Total
|
Lowest Risk
|
Lower Risk
|
Slight Risk
|
Higher Risk
|
Total
|
||||||||||||||||||||||||||||||||||||||||||||||||||
| (Dollars in millions) | |||||||||||||||||||||||||||||||||||||||||||||||||||||||||||
| Unbilled | $ |
|
$ |
|
$ |
|
$ |
|
$ |
|
$ |
|
$ |
|
$ |
|
$ |
|
$ |
|
|||||||||||||||||||||||||||||||||||||||
| Billed — current |
|
|
|
|
|
|
|
|
|
|
|||||||||||||||||||||||||||||||||||||||||||||||||
| Billed — past due |
|
|
|
|
|
|
|
|
|
|
|||||||||||||||||||||||||||||||||||||||||||||||||
| Total | $ |
|
$ |
|
$ |
|
$ |
|
$ |
|
$ |
|
$ |
|
$ |
|
$ |
|
$ |
|
|||||||||||||||||||||||||||||||||||||||
The balance of the equipment installment plan receivables as of September 30, 2022 on a gross basis by year of origination were as follows:
| 2019 | 2020 | 2021 | 2022 |
Total
|
|||||||||||||||||||||||||
| (Dollars in millions) | |||||||||||||||||||||||||||||
| Lowest Risk | $ |
|
$ |
|
$ |
|
$ |
|
$ |
|
|||||||||||||||||||
| Lower Risk |
|
|
|
|
|
||||||||||||||||||||||||
| Slight Risk |
|
|
|
|
|
||||||||||||||||||||||||
| Higher Risk |
|
|
|
|
|
||||||||||||||||||||||||
| Total | $ |
|
$ |
|
$ |
|
$ |
|
$ |
|
|||||||||||||||||||
Activity for the nine months ended September 30, 2022 and 2021, in the allowance for credit losses for equipment installment plan receivables was as follows:
| September 30, 2022 | September 30, 2021 | ||||||||||
| (Dollars in millions) | |||||||||||
| Allowance for credit losses, beginning of period | $ |
|
$ |
|
|||||||
| Bad debts expense |
|
|
|||||||||
| Write-offs, net of recoveries |
(
|
(
|
|||||||||
| Allowance for credit losses, end of period | $ |
|
$ |
|
|||||||
46
Note 5 Income Taxes
The effective tax rate on Income (loss) before income taxes for the three and nine months ended September 30, 2022 was
24.4
% and
37.7
%, respectively. These effective tax rates reflect a combined rate of federal and state taxes, adjusted for impacts of nondeductible compensation and interest expense. The effective tax rates also varied during the interim periods due to fluctuations in Income (loss) before income taxes.
Note 6 Earnings Per Share
Basic earnings (loss) per share attributable to TDS common shareholders is computed by dividing Net income (loss) attributable to TDS common shareholders by the weighted average number of Common Shares outstanding during the period. Diluted earnings (loss) per share attributable to TDS common shareholders is computed by dividing Net income (loss) attributable to TDS common shareholders by the weighted average number of Common Shares outstanding during the period adjusted to include the effects of potentially dilutive securities. Potentially dilutive securities primarily include incremental shares issuable upon the exercise of outstanding stock options and the vesting of performance and restricted stock units.
The amounts used in computing basic and diluted earnings (loss) per share attributable to TDS common shareholders were as follows:
|
Three Months Ended
September 30, |
Nine Months Ended
September 30, |
||||||||||||||||||||||
| 2022 | 2021 | 2022 | 2021 | ||||||||||||||||||||
| (Dollars and shares in millions, except per share amounts) | |||||||||||||||||||||||
| Net income (loss) attributable to TDS common shareholders used in basic earnings (loss) per share | $ |
(
|
$ |
|
$ |
|
$ |
|
|||||||||||||||
| Adjustments to compute diluted earnings (loss): | |||||||||||||||||||||||
| Noncontrolling interest adjustment |
|
(
|
|
(
|
|||||||||||||||||||
| Net income (loss) attributable to TDS common shareholders used in diluted earnings (loss) per share | $ |
(
|
$ |
|
$ |
|
$ |
|
|||||||||||||||
| Weighted average number of shares used in basic earnings (loss) per share: | |||||||||||||||||||||||
| Common Shares |
|
|
|
|
|||||||||||||||||||
| Series A Common Shares |
|
|
|
|
|||||||||||||||||||
| Total |
|
|
|
|
|||||||||||||||||||
| Effects of dilutive securities |
|
|
|
|
|||||||||||||||||||
| Weighted average number of shares used in diluted earnings (loss) per share |
|
|
|
|
|||||||||||||||||||
| Basic earnings (loss) per share attributable to TDS common shareholders | $ |
(
|
$ |
|
$ |
|
$ |
|
|||||||||||||||
| Diluted earnings (loss) per share attributable to TDS common shareholders | $ |
(
|
$ |
|
$ |
|
$ |
|
|||||||||||||||
Certain Common Shares issuable upon the exercise of stock options or vesting of performance and restricted stock units were not included in weighted average diluted shares outstanding for the calculation of Diluted earnings (loss) per share attributable to TDS common shareholders because their effects were antidilutive. The number of such Common Shares excluded was
4
million for both the three and nine months ended September 30, 2022, and
4
million for both the three and nine months ended September 30, 2021.
47
Note 7 Intangible Assets
Activity related to Licenses for the nine months ended September 30, 2022, is presented below:
| Licenses | |||||
| (Dollars in millions) | |||||
| Balance at December 31, 2021 | $ |
|
|||
| Acquisitions |
|
||||
| Impairment |
(
|
||||
| Transferred to Assets held for sale |
|
||||
| Exchanges - Licenses received |
|
||||
| Capitalized interest |
|
||||
| Balance at September 30, 2022 | $ |
|
|||
In February 2021, the FCC announced by way of public notice that UScellular was the provisional winning bidder for
254
wireless spectrum licenses in the 3.7-3.98 GHz bands (Auction 107) for $
1,283
million. UScellular paid $
30
million of this amount in 2020 and the remainder in March 2021. The wireless spectrum licenses from Auction 107 were granted by the FCC in July 2021. Additionally, UScellular expects to be obligated to pay approximately $
185
million in total from 2021 through 2024 related to relocation costs and accelerated relocation incentive payments. Such additional costs were accrued and capitalized at the time the licenses were granted, and adjusted as necessary if the estimated obligation changes. UScellular paid $
36
million and $
8
million related to the additional costs in October 2021 and September 2022, respectively. The spectrum must be cleared by incumbent providers before UScellular can access it. UScellular does not expect to have access to this spectrum
until late 2023.
In January 2022, the FCC announced by way of public notice that UScellular was the provisional winning bidder for
380
wireless spectrum licenses in the 3.45-3.55 GHz band (Auction 110) for $
580
million. UScellular paid $
20
million of this amount in 2021 and the remainder in January and February 2022. The advance payment was included in Other assets and deferred charges in the December 31, 2021 Consolidated Balance Sheet. The wireless spectrum licenses from Auction 110 were granted by the FCC on May 4, 2022.
Note 8 Investments in Unconsolidated Entities
Investments in unconsolidated entities consist of amounts invested in entities in which TDS holds a noncontrolling interest.
TDS’ Investments in unconsolidated entities are accounted for using the equity method, measurement alternative method or net asset value practical expedient method as shown in the table below. The carrying value of measurement alternative method investments represents cost minus any impairments plus or minus any observable price changes.
| September 30, 2022 | December 31, 2021 | ||||||||||
| (Dollars in millions) | |||||||||||
| Equity method investments | $ |
|
$ |
|
|||||||
| Measurement alternative method investments |
|
|
|||||||||
| Investments recorded using the net asset value practical expedient |
|
|
|||||||||
| Total investments in unconsolidated entities | $ |
|
$ |
|
|||||||
The following table, which is based on unaudited information provided in part by third parties, summarizes the combined results of operations of TDS’ equity method investments.
|
Three Months Ended
September 30, |
Nine Months Ended
September 30, |
||||||||||||||||||||||
| 2022 | 2021 | 2022 | 2021 | ||||||||||||||||||||
| (Dollars in millions) | |||||||||||||||||||||||
| Revenues | $ |
|
$ |
|
$ |
|
$ |
|
|||||||||||||||
| Operating expenses |
|
|
|
|
|||||||||||||||||||
| Operating income |
|
|
|
|
|||||||||||||||||||
| Other income (expense), net |
(
|
|
(
|
|
|||||||||||||||||||
| Net income | $ |
|
$ |
|
$ |
|
$ |
|
|||||||||||||||
48
Note 9 Asset Retirement Obligations
Asset retirement obligations are included in Other deferred liabilities and credits in the Consolidated Balance Sheet.
During the three months ended September 30, 2022, UScellular and TDS Telecom performed a review of the assumptions and estimated future costs related to asset retirement obligations. The results of the reviews and other changes in asset retirement obligations during the nine months ended September 30, 2022 were as follows:
| Asset Retirement Obligations | |||||
| (Dollars in millions) | |||||
| Balance at December 31, 2021 | $ |
|
|||
| Additional liabilities accrued |
|
||||
| Revisions in estimated cash outflows |
|
||||
| Disposition of assets |
(
|
||||
| Accretion expense |
|
||||
| Balance at September 30, 2022 | $ |
|
|||
Note 10 Debt
Revolving Credit Agreements
The following table summarizes the revolving credit agreements as of September 30, 2022:
| TDS | UScellular | ||||||||||
| (Dollars in millions) | |||||||||||
| Maximum borrowing capacity | $ |
|
$ |
|
|||||||
| Letters of credit outstanding | $ |
|
$ |
|
|||||||
| Amount borrowed | $ |
|
$ |
|
|||||||
| Amount available for use | $ |
|
$ |
|
|||||||
Borrowings under the TDS revolving credit agreement bear interest at a rate of London Inter-bank Offered Rate (LIBOR) plus
1.50
%.
Borrowings under the UScellular revolving credit agreement bear interest at a rate of Secured Overnight Financing Rate (SOFR) plus
1.60
%.
During the nine months ended September 30, 2022, UScellular borrowed and repaid $
75
million under its revolving credit agreement.
TDS and UScellular believe that they were in compliance with all of the financial and other covenants and requirements set forth in their revolving credit agreements as of September 30, 2022.
Term Loan Agreements
The following table summarizes the term loan credit agreements as of September 30, 2022:
| TDS | UScellular | ||||||||||
| (Dollars in millions) | |||||||||||
| Maximum borrowing capacity | $ |
|
$ |
|
|||||||
| Amount borrowed and outstanding | $ |
|
$ |
|
|||||||
| Amount borrowed and repaid | $ |
|
$ |
|
|||||||
| Amount available for use | $ |
|
$ |
|
|||||||
Borrowings under the TDS term loan agreements bear interest at a rate of LIBOR plus
2.00
% or LIBOR plus
2.50
%. The maturity dates of the TDS term loan agreements are July 2028 and July 2031. During the nine months ended September 30, 2022, TDS borrowed $
300
million under the term loan agreements.
Borrowings under the UScellular term loan agreements bear interest at a rate of SOFR plus
1.60
%, SOFR plus
2.10
% or SOFR plus
2.60
%. The maturity dates of the UScellular term loan agreements are July 2026, July 2028 and July 2031. During the nine months ended September 30, 2022, UScellular borrowed $
500
million under the term loan agreements.
49
TDS and UScellular believe that they were in compliance with all of the financial and other covenants and requirements set forth in their term loan credit agreements as of September 30, 2022.
Export Credit Financing Agreement
In December 2021, UScellular entered into a $
150
million term loan credit facility with Export Development Canada to finance (or refinance) imported equipment, including equipment purchased prior to entering the term loan credit facility agreement. Borrowings bear interest at a rate of SOFR plus
1.60
% and are due and payable on the five-year anniversary of the first borrowing, which is in January 2027. During the nine months ended September 30, 2022, UScellular borrowed $
150
million, which is the full amount available under the agreement.
TDS believes that UScellular was in compliance with all of the financial and other covenants and requirements set forth in their export credit financing agreement as of September 30, 2022.
Receivables Securitization Agreement
UScellular, through its subsidiaries, has a receivables securitization agreement for securitized borrowings using its equipment installment receivables. In March 2022, UScellular amended the agreement to extend the maturity date to March 2024. There were no significant changes to other terms of the receivable securitization agreement. Amounts under the receivables securitization agreement may be borrowed, repaid and reborrowed from time to time until the maturity date, which may be extended from time to time as specified therein. The outstanding borrowings bear interest at a rate that approximates SOFR plus
0.90
%. During the nine months ended September 30, 2022, UScellular repaid $
250
million under the agreement. As of September 30, 2022, the outstanding borrowings under the agreement were $
200
million and the unused borrowing capacity under the agreement was $
250
million, subject to sufficient collateral to satisfy the asset borrowing base provisions of the agreement. As of September 30, 2022, the USCC Master Note Trust held $
386
million of assets available to be pledged as collateral for the receivables securitization agreement.
TDS believes that UScellular was in compliance with all of the financial and other covenants and requirements set forth in their receivables securitization agreement as of September 30, 2022.
Repurchase Agreement
In January 2022, UScellular, through a subsidiary (the repo subsidiary), entered into a repurchase agreement to borrow up to $
200
million, subject to the availability of eligible equipment installment plan receivables and the agreement of the lender. The transaction form involves the sale of receivables by the repo subsidiary and the commitment to repurchase at the end of the applicable repurchase term, which may extend up to one month. The transaction is accounted for as a one-month secured borrowing. The outstanding borrowings bear interest at a rate of SOFR plus
1.25
%. Although the lender holds a security interest in the receivables, the repo subsidiary retains effective control and collection risk of the receivables, and therefore, any activity associated with the repurchase agreement will be treated as a secured borrowing. UScellular will continue to report equipment installment plan receivables and any related balances on the Consolidated Balance Sheet. The expiration date of the repurchase agreement is in January 2023. During the nine months ended September 30, 2022, the repo subsidiary borrowed $
110
million and repaid $
50
million under the repurchase agreement. As of September 30, 2022, the outstanding borrowings under the agreement were $
60
million and the unused borrowing capacity was $
140
million. The outstanding borrowings are included in Other current liabilities in the September 30, 2022 Consolidated Balance Sheet. As of September 30, 2022, UScellular held $
558
million of assets available for inclusion in the repurchase facility; these assets are distinct from the assets held by the USCC Master Note Trust for UScellular's receivables securitization agreement.
Note 11 Variable Interest Entities
Consolidated VIEs
UScellular formed USCC EIP LLC (Seller/Sub-Servicer), USCC Receivables Funding LLC (Transferor) and the USCC Master Note Trust (Trust), collectively the special purpose entities (SPEs), to facilitate a securitized borrowing using its equipment installment plan receivables. Under a Receivables Sale Agreement, UScellular wholly-owned, majority-owned and unconsolidated entities, collectively referred to as “affiliated entities”, transfer device equipment installment plan contracts to the Seller/Sub-Servicer. The Seller/Sub-Servicer aggregates device equipment installment plan contracts, and performs servicing, collection and all other administrative activities related to accounting for the equipment installment plan contracts. The Seller/Sub-Servicer sells the eligible equipment installment plan receivables to the Transferor, a bankruptcy remote entity, which subsequently sells the receivables to the Trust. The Trust, which is bankruptcy remote and isolated from the creditors of UScellular, will be responsible for issuing asset-backed variable funding notes (Notes), which are collateralized by the equipment installment plan receivables owned by the Trust. Given that UScellular has the power to direct the activities of these SPEs, and that these SPEs lack sufficient equity to finance their activities, UScellular is deemed to have a controlling financial interest in the SPEs and, therefore, consolidates them. All transactions with third parties (e.g., issuance of the asset-backed variable funding notes) will be accounted for as a secured borrowing due to the pledging of equipment installment plan contracts as collateral, significant continuing involvement in the transferred assets, subordinated interests of the cash flows, and continued evidence of control of the receivables.
50
The following VIEs were formed to participate in FCC auctions of wireless spectrum licenses and to fund, establish, and provide wireless service with respect to any FCC wireless spectrum licenses won in the auctions:
▪
Advantage Spectrum, L.P. (Advantage Spectrum) and Sunshine Spectrum, Inc., the general partner of Advantage Spectrum; and
▪
King Street Wireless, L.P. (King Street Wireless) and King Street Wireless, Inc., the general partner of King Street Wireless.
These particular VIEs are collectively referred to as designated entities. The power to direct the activities that most significantly impact the economic performance of these VIEs is shared. Specifically, the general partner of these VIEs has the exclusive right to manage, operate and control the limited partnerships and make all decisions to carry on the business of the partnerships. The general partner of each partnership needs the consent of the limited partner, an indirect TDS subsidiary, to sell or lease certain wireless spectrum licenses, to make certain large expenditures, admit other partners or liquidate the limited partnerships. Although the power to direct the activities of these VIEs is shared, TDS has the most significant level of exposure to the variability associated with the economic performance of the VIEs, indicating that TDS is the primary beneficiary of the VIEs. Therefore, in accordance with GAAP, these VIEs are consolidated.
TDS also consolidates other VIEs that are limited partnerships that provide wireless service. A limited partnership is a variable interest entity unless the limited partners hold substantive participating rights or kick-out rights over the general partner. For certain limited partnerships, UScellular is the general partner and manages the operations. In these partnerships, the limited partners do not have substantive kick-out or participating rights and, further, such limited partners do not have the authority to remove the general partner. Therefore, these limited partnerships also are recognized as VIEs and are consolidated under the variable interest model.
The following table presents the classification and balances of the consolidated VIEs’ assets and liabilities in TDS’ Consolidated Balance Sheet.
| September 30, 2022 | December 31, 2021 | ||||||||||
| (Dollars in millions) | |||||||||||
| Assets | |||||||||||
| Cash and cash equivalents | $ |
|
$ |
|
|||||||
| Accounts receivable |
|
|
|||||||||
| Inventory, net |
|
|
|||||||||
| Other current assets |
|
|
|||||||||
| Licenses |
|
|
|||||||||
| Property, plant and equipment, net |
|
|
|||||||||
| Operating lease right-of-use assets |
|
|
|||||||||
| Other assets and deferred charges |
|
|
|||||||||
| Total assets | $ |
|
$ |
|
|||||||
| Liabilities | |||||||||||
| Current liabilities | $ |
|
$ |
|
|||||||
| Long-term operating lease liabilities |
|
|
|||||||||
| Other deferred liabilities and credits |
|
|
|||||||||
|
Total liabilities
1
|
$ |
|
$ |
|
|||||||
1
Total liabilities does not include amounts borrowed under the receivables securitization agreement. See Note 10 – Debt for additional information.
Unconsolidated VIEs
TDS manages the operations of and holds a variable interest in certain other limited partnerships, but is not the primary beneficiary of these entities and, therefore, does not consolidate them under the variable interest model.
TDS’ total investment in these unconsolidated entities was $
5
million and $
4
million at September 30, 2022 and December 31, 2021, respectively, and is included in Investments in unconsolidated entities in TDS’ Consolidated Balance Sheet. The maximum exposure from unconsolidated VIEs is limited to the investment held by TDS in those entities.
Other Related Matters
TDS made contributions, loans or advances to its VIEs totaling $
291
million and $
64
million, during the nine months ended September 30, 2022 and 2021, respectively, of which $
269
million in 2022 and $
32
million in 2021, are related to USCC EIP LLC as discussed above. TDS may agree to make additional capital contributions and/or advances to these or other VIEs and/or to their general partners to provide additional funding for operations or the development of wireless spectrum licenses granted in various auctions. TDS may finance such amounts with a combination of cash on hand, borrowings under its revolving credit or receivables securitization agreements and/or other long-term debt. There is no assurance that TDS will be able to obtain additional financing on commercially reasonable terms or at all to provide such financial support.
51
Note 12 Noncontrolling Interests
The following schedule discloses the effects of Net income attributable to TDS shareholders and changes in TDS’ ownership interest in UScellular on TDS’ equity:
| Nine Months Ended September 30, | 2022 | 2021 | |||||||||
| (Dollars in millions) | |||||||||||
| Net income attributable to TDS shareholders | $ |
|
$ |
|
|||||||
| Transfers (to) from noncontrolling interests | |||||||||||
| Change in TDS' Capital in excess of par value from UScellular's issuance of UScellular shares |
(
|
(
|
|||||||||
| Change in TDS' Capital in excess of par value from UScellular's repurchases of UScellular shares |
|
|
|||||||||
| Net transfers (to) from noncontrolling interests |
|
(
|
|||||||||
| Net income attributable to TDS shareholders after transfers (to) from noncontrolling interests | $ |
|
$ |
|
|||||||
52
Note 13 Business Segment Information
UScellular and TDS Telecom are billed for services they receive from TDS, consisting primarily of information processing, accounting, finance, and general management services. Such billings are based on expenses specifically identified to UScellular and TDS Telecom and on allocations of common expenses. Management believes the method used to allocate common expenses is reasonable and that all expenses and costs applicable to UScellular and TDS Telecom are reflected in the accompanying business segment information on a basis that is representative of what they would have been if UScellular and TDS Telecom operated on a stand-alone basis.
Financial data for TDS’ reportable segments for the three and nine month periods ended, or as of September 30, 2022 and 2021, is as follows. See Note 1 — Basis of Presentation for additional information.
| Three Months Ended or as of September 30, 2022 | UScellular | TDS Telecom | Corporate, Eliminations and Other | Total | |||||||||||||||||||
| (Dollars in millions) | |||||||||||||||||||||||
| Operating revenues | |||||||||||||||||||||||
| Service | $ |
|
$ |
|
$ |
|
$ |
|
|||||||||||||||
| Equipment and product sales |
|
|
|
|
|||||||||||||||||||
| Total operating revenues |
|
|
|
|
|||||||||||||||||||
|
Cost of services (excluding Depreciation, amortization and accretion reported below)
|
|
|
|
|
|||||||||||||||||||
| Cost of equipment and products |
|
|
|
|
|||||||||||||||||||
| Selling, general and administrative |
|
|
|
|
|||||||||||||||||||
| Depreciation, amortization and accretion |
|
|
|
|
|||||||||||||||||||
| (Gain) loss on asset disposals, net |
|
|
|
|
|||||||||||||||||||
| Operating income (loss) |
(
|
|
(
|
(
|
|||||||||||||||||||
| Equity in earnings of unconsolidated entities |
|
|
|
|
|||||||||||||||||||
| Interest and dividend income |
|
|
|
|
|||||||||||||||||||
| Interest expense |
(
|
|
(
|
(
|
|||||||||||||||||||
| Income (loss) before income taxes |
(
|
|
(
|
(
|
|||||||||||||||||||
| Income tax expense (benefit) |
(
|
|
(
|
(
|
|||||||||||||||||||
| Net income (loss) |
(
|
|
(
|
(
|
|||||||||||||||||||
| Add back: | |||||||||||||||||||||||
| Depreciation, amortization and accretion |
|
|
|
|
|||||||||||||||||||
| (Gain) loss on asset disposals, net |
|
|
|
|
|||||||||||||||||||
| Interest expense |
|
(
|
|
|
|||||||||||||||||||
| Income tax expense (benefit) |
(
|
|
(
|
(
|
|||||||||||||||||||
|
Adjusted EBITDA
1
|
$ |
|
$ |
|
$ |
|
$ |
|
|||||||||||||||
| Investments in unconsolidated entities | $ |
|
$ |
|
$ |
|
$ |
|
|||||||||||||||
| Total assets | $ |
|
$ |
|
$ |
|
$ |
|
|||||||||||||||
| Capital expenditures | $ |
|
$ |
|
$ |
|
$ |
|
|||||||||||||||
53
| Three Months Ended or as of September 30, 2021 | UScellular | TDS Telecom | Corporate, Eliminations and Other | Total | |||||||||||||||||||
| (Dollars in millions) | |||||||||||||||||||||||
| Operating revenues | |||||||||||||||||||||||
| Service | $ |
|
$ |
|
$ |
|
$ |
|
|||||||||||||||
| Equipment and product sales |
|
|
|
|
|||||||||||||||||||
| Total operating revenues |
|
|
|
|
|||||||||||||||||||
|
Cost of services (excluding Depreciation, amortization and accretion reported below)
|
|
|
|
|
|||||||||||||||||||
| Cost of equipment and products |
|
|
|
|
|||||||||||||||||||
| Selling, general and administrative |
|
|
|
|
|||||||||||||||||||
| Depreciation, amortization and accretion |
|
|
|
|
|||||||||||||||||||
| (Gain) loss on asset disposals, net |
|
|
(
|
|
|||||||||||||||||||
| Operating income (loss) |
|
|
(
|
|
|||||||||||||||||||
| Equity in earnings of unconsolidated entities |
|
|
|
|
|||||||||||||||||||
| Interest and dividend income |
|
|
|
|
|||||||||||||||||||
| Interest expense |
(
|
|
(
|
(
|
|||||||||||||||||||
| Income (loss) before income taxes |
|
|
(
|
|
|||||||||||||||||||
| Income tax expense (benefit) |
|
|
(
|
|
|||||||||||||||||||
| Net income (loss) |
|
|
(
|
|
|||||||||||||||||||
| Add back: | |||||||||||||||||||||||
| Depreciation, amortization and accretion |
|
|
|
|
|||||||||||||||||||
| (Gain) loss on asset disposals, net |
|
|
(
|
|
|||||||||||||||||||
| Interest expense |
|
(
|
|
|
|||||||||||||||||||
| Income tax expense (benefit) |
|
|
(
|
|
|||||||||||||||||||
|
Adjusted EBITDA
1
|
$ |
|
$ |
|
$ |
|
$ |
|
|||||||||||||||
| Investments in unconsolidated entities | $ |
|
$ |
|
$ |
|
$ |
|
|||||||||||||||
| Total assets | $ |
|
$ |
|
$ |
|
$ |
|
|||||||||||||||
| Capital expenditures | $ |
|
$ |
|
$ |
|
$ |
|
|||||||||||||||
54
| Nine Months Ended or as of September 30, 2022 | UScellular | TDS Telecom | Corporate, Eliminations and Other | Total | |||||||||||||||||||
| (Dollars in millions) | |||||||||||||||||||||||
| Operating revenues | |||||||||||||||||||||||
| Service | $ |
|
$ |
|
$ |
|
$ |
|
|||||||||||||||
| Equipment and product sales |
|
|
|
|
|||||||||||||||||||
| Total operating revenues |
|
|
|
|
|||||||||||||||||||
|
Cost of services (excluding Depreciation, amortization and accretion reported below)
|
|
|
|
|
|||||||||||||||||||
| Cost of equipment and products |
|
|
|
|
|||||||||||||||||||
| Selling, general and administrative |
|
|
|
|
|||||||||||||||||||
| Depreciation, amortization and accretion |
|
|
|
|
|||||||||||||||||||
| Loss on impairment of licenses |
|
|
|
|
|||||||||||||||||||
| (Gain) loss on asset disposals, net |
|
|
|
|
|||||||||||||||||||
| (Gain) loss on sale of business and other exit costs, net |
(
|
|
|
(
|
|||||||||||||||||||
| Operating income (loss) |
|
|
(
|
|
|||||||||||||||||||
| Equity in earnings of unconsolidated entities |
|
|
|
|
|||||||||||||||||||
| Interest and dividend income |
|
|
|
|
|||||||||||||||||||
| Interest expense |
(
|
|
(
|
(
|
|||||||||||||||||||
| Other, net |
|
|
|
|
|||||||||||||||||||
| Income (loss) before income taxes |
|
|
(
|
|
|||||||||||||||||||
| Income tax expense (benefit) |
|
|
(
|
|
|||||||||||||||||||
| Net income (loss) |
|
|
(
|
|
|||||||||||||||||||
| Add back: | |||||||||||||||||||||||
| Depreciation, amortization and accretion |
|
|
|
|
|||||||||||||||||||
| Loss on impairment of licenses |
|
|
|
|
|||||||||||||||||||
| (Gain) loss on asset disposals, net |
|
|
|
|
|||||||||||||||||||
| (Gain) loss on sale of business and other exit costs, net |
(
|
|
|
(
|
|||||||||||||||||||
| Interest expense |
|
(
|
|
|
|||||||||||||||||||
| Income tax expense (benefit) |
|
|
(
|
|
|||||||||||||||||||
|
Adjusted EBITDA
1
|
$ |
|
$ |
|
$ |
|
$ |
|
|||||||||||||||
| Capital expenditures | $ |
|
$ |
|
$ |
|
$ |
|
|||||||||||||||
55
| Nine Months Ended or as of September 30, 2021 | UScellular | TDS Telecom | Corporate, Eliminations and Other | Total | |||||||||||||||||||
| (Dollars in millions) | |||||||||||||||||||||||
| Operating revenues | |||||||||||||||||||||||
| Service | $ |
|
$ |
|
$ |
|
$ |
|
|||||||||||||||
| Equipment and product sales |
|
|
|
|
|||||||||||||||||||
| Total operating revenues |
|
|
|
|
|||||||||||||||||||
|
Cost of services (excluding Depreciation, amortization and accretion reported below)
|
|
|
|
|
|||||||||||||||||||
| Cost of equipment and products |
|
|
|
|
|||||||||||||||||||
| Selling, general and administrative |
|
|
|
|
|||||||||||||||||||
| Depreciation, amortization and accretion |
|
|
|
|
|||||||||||||||||||
| (Gain) loss on asset disposals, net |
|
|
|
|
|||||||||||||||||||
| (Gain) loss on sale of business and other exit costs, net |
(
|
|
|
(
|
|||||||||||||||||||
| Operating income (loss) |
|
|
(
|
|
|||||||||||||||||||
| Equity in earnings of unconsolidated entities |
|
|
|
|
|||||||||||||||||||
| Interest and dividend income |
|
|
|
|
|||||||||||||||||||
| Interest expense |
(
|
|
(
|
(
|
|||||||||||||||||||
| Other, net |
|
(
|
|
(
|
|||||||||||||||||||
| Income (loss) before income taxes |
|
|
(
|
|
|||||||||||||||||||
| Income tax expense (benefit) |
|
|
(
|
|
|||||||||||||||||||
| Net income (loss) |
|
|
(
|
|
|||||||||||||||||||
| Add back: | |||||||||||||||||||||||
| Depreciation, amortization and accretion |
|
|
|
|
|||||||||||||||||||
| (Gain) loss on asset disposals, net |
|
|
|
|
|||||||||||||||||||
| (Gain) loss on sale of business and other exit costs, net |
(
|
|
|
(
|
|||||||||||||||||||
| Interest expense |
|
(
|
|
|
|||||||||||||||||||
| Income tax expense (benefit) |
|
|
(
|
|
|||||||||||||||||||
|
Adjusted EBITDA
1
|
$ |
|
$ |
|
$ |
|
$ |
|
|||||||||||||||
| Capital expenditures | $ |
|
$ |
|
$ |
|
$ |
|
|||||||||||||||
Numbers may not foot due to rounding.
1
Adjusted earnings before interest, taxes, depreciation, amortization and accretion (Adjusted EBITDA) is a segment measure reported to the chief operating decision maker for purposes of assessing segments' performance. Adjusted EBITDA is defined as net income, adjusted for the items set forth in the reconciliation above. TDS believes Adjusted EBITDA is a useful measure of TDS’ operating results before significant recurring non-cash charges, gains and losses, and other items as presented above as they provide additional relevant and useful information to investors and other users of TDS' financial data in evaluating the effectiveness of its operations and underlying business trends in a manner that is consistent with management's evaluation of business performance.
56
Telephone and Data Systems, Inc.
Additional Required Information
Controls and Procedures
Evaluation of Disclosure Controls and Procedures
TDS maintains disclosure controls and procedures (as defined in Rules 13a-15(e) and 15d-15(e) under the Securities Exchange Act of 1934, as amended (the Exchange Act)) that are designed to ensure that information required to be disclosed in its reports filed or submitted under the Exchange Act is processed, recorded, summarized and reported within the time periods specified in the SEC’s rules and forms, and that such information is accumulated and communicated to TDS’ management, including its principal executive officer and principal financial officer, as appropriate, to allow for timely decisions regarding required disclosure. In designing and evaluating the disclosure controls and procedures, management recognizes that any controls and procedures, no matter how well designed and operated, can provide only reasonable assurance of achieving the desired control objectives.
As required by SEC Rules 13a-15(b), TDS carried out an evaluation, under the supervision and with the participation of management, including its principal executive officer and principal financial officer, of the effectiveness of the design and operation of TDS’ disclosure controls and procedures as of the end of the period covered by this Quarterly Report. Based on this evaluation, TDS’ principal executive officer and principal financial officer concluded that TDS' disclosure controls and procedures were effective as of September 30, 2022, at the reasonable assurance level.
Changes in Internal Control Over Financial Reporting
There have been no changes in internal controls over financial reporting that have occurred during the three months ended September 30, 2022, that have materially affected, or are reasonably likely to materially affect, TDS’ internal control over financial reporting.
Legal Proceedings
In April 2018, the United States Department of Justice (DOJ) notified TDS that it was conducting inquiries of UScellular and TDS under the federal False Claims Act relating to UScellular’s participation in wireless spectrum license auctions 58, 66, 73 and 97 conducted by the FCC. UScellular is/was a limited partner in several limited partnerships which qualified for the 25% bid credit in each auction. The investigation arose from civil actions under the Federal False Claims Act brought by private parties in the U.S. District Court for the Western District of Oklahoma. In November and December 2019, following the DOJ’s investigation, the DOJ informed TDS and UScellular that it would not intervene in the above-referenced actions. Subsequently, the private party plaintiffs filed amended complaints in both actions in the U.S. District Court for the Western District of Oklahoma and are continuing the action on their own. In July 2020, these actions were transferred to the U.S. District Court for the District of Columbia. TDS and UScellular believe that UScellular’s arrangements with the limited partnerships and the limited partnerships’ participation in the FCC auctions complied with applicable law and FCC rules. At this time, TDS cannot predict the outcome of any proceeding.
Refer to the disclosure under Legal Proceedings in TDS’ Form 10-K for the year ended December 31, 2021, for additional information. There have been no material changes to such information since December 31, 2021.
57
Unregistered Sales of Equity Securities and Use of Proceeds
On August 2, 2013, the Board of Directors of TDS authorized, and TDS announced by Form 8-K, a $250 million stock repurchase program for TDS Common Shares. Depending on market conditions, such shares may be repurchased in compliance with Rule 10b-18 of the Exchange Act, pursuant to Rule 10b5-1 under the Exchange Act, or pursuant to accelerated share repurchase arrangements, prepaid share repurchases, private transactions or as otherwise authorized. This authorization does not have an expiration date. TDS did not determine to terminate the foregoing Common Share repurchase program, or cease making further purchases thereunder, during the third quarter of 2022.
The following table provides certain information with respect to all purchases made by or on behalf of TDS, and any open market purchases made by any "affiliated purchaser" (as defined by the SEC) of TDS, of TDS Common Shares during the quarter covered by this Form 10-Q.
| Period | Total Number of Shares Purchased | Average Price Paid per Share | Total Number of Shares Purchased as Part of Publicly Announced Plans or Programs | Maximum Dollar Value of Shares that May Yet Be Purchased Under the Plans or Programs | ||||||||||
| July 1 - 31, 2022 | 31,114 | $ | 15.80 | 31,114 | $ | 156,541,699 | ||||||||
| August 1 - 31, 2022 | — | $ | — | — | $ | 156,541,699 | ||||||||
| September 1 - 30, 2022 | 343,953 | $ | 14.54 | 343,953 | $ | 151,541,710 | ||||||||
| Total for or as of the end of the quarter ended September 30, 2022 | 375,067 | $ | 14.64 | 375,067 | $ | 151,541,710 | ||||||||
58
Exhibits
| Exhibit Number | Description of Documents | ||||
| Exhibit 3.1 | |||||
| Exhibit 31.1 | |||||
| Exhibit 31.2 | |||||
| Exhibit 32.1 | |||||
| Exhibit 32.2 | |||||
| Exhibit 101.INS | XBRL Instance Document - the instance document does not appear in the Interactive Data File because its XBRL tags are embedded within the Inline XBRL document. | ||||
| Exhibit 101.SCH | Inline XBRL Taxonomy Extension Schema Document | ||||
| Exhibit 101.PRE | Inline XBRL Taxonomy Presentation Linkbase Document | ||||
| Exhibit 101.CAL | Inline XBRL Taxonomy Calculation Linkbase Document | ||||
| Exhibit 101.LAB | Inline XBRL Taxonomy Label Linkbase Document | ||||
| Exhibit 101.DEF | Inline XBRL Taxonomy Extension Definition Linkbase Document | ||||
| Exhibit 104 | Cover Page Interactive Data File - the cover page interactive data file does not appear in the Interactive Data File because its XBRL tags are embedded within the inline document. | ||||
59
Form 10-Q Cross Reference Index
| Item Number | Page No. | ||||||||||||||||
| Part I. | Financial Information | ||||||||||||||||
| - | |||||||||||||||||
| - | |||||||||||||||||
| - | |||||||||||||||||
| Part II. | Other Information | ||||||||||||||||
60
SIGNATURES
Pursuant to the requirements of the Securities Exchange Act of 1934, the registrant has duly caused this report to be signed on its behalf by the undersigned thereunto duly authorized.
| TELEPHONE AND DATA SYSTEMS, INC. | |||||||||||||||||
| (Registrant) | |||||||||||||||||
| Date: | November 3, 2022 | /s/ LeRoy T. Carlson, Jr. | |||||||||||||||
|
LeRoy T. Carlson, Jr.
President and Chief Executive Officer (principal executive officer) |
|||||||||||||||||
| Date: | November 3, 2022 | /s/ Vicki L. Villacrez | |||||||||||||||
|
Vicki L. Villacrez
Executive Vice President and Chief Financial Officer (principal financial officer) |
|||||||||||||||||
61
TABLE OF CONTENTS
Note 1 Basis Of PresentationprintNote 2 Revenue RecognitionprintNote 3 Fair Value MeasurementsprintNote 4 Equipment Installment PlansprintNote 5 Income TaxesprintNote 6 Earnings Per ShareprintNote 7 Intangible AssetsprintNote 8 Investments in Unconsolidated EntitiesprintNote 9 Asset Retirement ObligationsprintNote 10 DebtprintNote 11 Variable Interest EntitiesprintNote 12 Noncontrolling InterestsprintNote 13 Business Segment Informationprint