As filed with the Securities and Exchange Commission on April 29, 2011
UNITED STATES
SECURITIES AND EXCHANGE COMMISSION
WASHINGTON, D.C. 20549
FORM 20-F
|
(Mark One)
|
||
| o |
REGISTRATION STATEMENT PURSUANT TO SECTION 12(b)
OR (g) OF THE SECURITIES EXCHANGE ACT OF 1934
|
|
|
OR
|
||
| x |
ANNUAL REPORT PURSUANT TO SECTION 13 OR 15(d)
OF THE SECURITIES EXCHANGE ACT OF 1934
For the fiscal year ended December 31, 2010
|
|
|
OR
|
||
| o |
TRANSITION REPORT PURSUANT TO SECTION 13 OR 15(d)
OF THE SECURITIES EXCHANGE ACT OF 1934
For the transition period from _____ to _____
|
|
|
OR
|
||
| o |
SHELL COMPANY REPORT PURSUANT TO SECTION 13 OR 15(d)
OF THE SECURITIES EXCHANGE ACT OF 1934
|
Commission file number: 001-09531
TELEFÓNICA, S.A.
(Exact name of Registrant as specified in its charter)
KINGDOM OF SPAIN
(Jurisdiction of incorporation or organization)
Distrito C, Ronda de la Comunicación, s/n
28050 Madrid, Spain
(Address of principal executive offices)
Lucila Rodriguez Jorge, Securities Legal Department
Distrito C, Ronda de la Comunicación, s/n, 28050 Madrid, Spain
Tel. +34 91 482 3734, Fax. +34 91 482 3768, e-mail: amv@telefonica.es
María García-Legaz Ponce, Head of Investor Relations,
Distrito C, Ronda de la Comunicación, s/n, 28050 Madrid, Spain
Tel. +34 91 482 8700, Fax. +34 91 482 8600, e-mail: ir@telefonica.es
(Name, Telephone, E-Mail and/or Facsimile number and Address of Company Contact Person)
Securities registered or to be registered pursuant to Section 12(b) of the Act:
|
Title of each class
|
Name of each exchange on which registered
|
|
|
Ordinary Shares, nominal value €1.00 per share*
American Depositary Shares, each representing one
Ordinary Share
|
New York Stock Exchange
New York Stock Exchange
|
|
|
Guarantees** by Telefónica, S.A. of the $1,000,000,000 Fixed Rate Guaranteed Senior Notes Due 2011; $750,000,000 Fixed Rate Guaranteed Senior Notes Due 2013; $850,000,000 Floating Rate Guaranteed Senior Notes Due 2013; $1,200,000,000 Fixed Rate Guaranteed Senior Notes Due 2013; $1,250,000,000 Fixed Rate Notes Due 2015; $900,000,000 Fixed Rate Guaranteed Senior Notes Due 2015; $1,250,000,000 Fixed Rate Guaranteed Senior Notes Due 2016; $1,250,000,000 Fixed Rate Guaranteed Senior Notes Due 2016; $700,000,000 Fixed Rate Guaranteed Senior Notes Due 2017; $1,000,000,000 Fixed Rate Notes Due
|
New York Stock Exchange
|
| 2019; $1,400,000,000 Fixed Rate Guaranteed Senior Notes Due 2020; $1,500,000,000 Fixed Rate Guaranteed Senior Notes Due 2021; $2,000,000,000 Fixed Rate Guaranteed Senior Notes Due 2036; each of Telefónica Emisiones, S.A.U. |
|
*
|
Not for trading, but only in connection with the listing of American Depositary Shares, pursuant to the requirements of the New York Stock Exchange.
|
|
**
|
Not for trading, but only in connection with the listing of the $1,000,000,000 Fixed Rate Guaranteed Senior Notes Due 2011; $750,000,000 Fixed Rate Guaranteed Senior Notes Due 2013; $850,000,000 Floating Rate Guaranteed Senior Notes Due 2013; $1,200,000,000 Fixed Rate Guaranteed Senior Notes Due 2013; $1,250,000,000 Fixed Rate Notes Due 2015; $900,000,000 Fixed Rate Guaranteed Senior Notes Due 2015; $1,250,000,000 Fixed Rate Guaranteed Senior Notes Due 2016; $1,250,000,000 Fixed Rate Guaranteed Senior Notes Due 2016; $700,000,000 Fixed Rate Guaranteed Senior Notes Due 2017; $1,000,000,000 Fixed Rate Notes Due 2019; ; $1,400,000,000 Fixed Rate Guaranteed Senior Notes Due 2020; $1,500,000,000 Fixed Rate Guaranteed Senior Notes Due 2021; $2,000,000,000 Fixed Rate Guaranteed Senior Notes Due 2036;each of Telefónica Emisiones, S.A.U. (a wholly-owned subsidiary of Telefónica, S.A.)
|
Securities registered or to be registered pursuant to Section 12(g) of the Act: None
Securities for which there is a reporting obligation pursuant to Section 15(d) of the Act: None
The number of outstanding shares of each class of capital stock of Telefónica, S.A. at December 31, 2010 was:
Ordinary Shares, nominal value €1.00 per share: 4,563,996,485
Indicate by check mark if the registrant is a well-known seasoned issuer, as defined in Rule 405 of the Securities Act.
Yes
x
No
o
If this report is an annual or transition report, indicate by check mark if the registrant is not required to file reports pursuant to Section 13 or 15(d) of the Securities Exchange Act of 1934.
Yes
o
No
x
Indicate by check mark whether the registrant (1) has filed all reports required to be filed by Section 13 or 15(d) of the Securities Exchange Act of 1934 during the preceding 12 months (or for such shorter period that the registrant was required to file such reports) and (2) has been subject to such filing requirements for the past 90 days.
Yes
x
No
o
Indicate by check mark whether the registrant has submitted electronically and posted on its corporate Web site, if any, every Interactive Data File required to be submitted and posted pursuant to Rule 405 of Regulation S-T (Section 232.405 of this chapter) during the preceding 12 months (or for such shorter period that the registrant was required to submit and post such files).
Yes
o
No
o
Indicate by check mark whether the registrant is a large accelerated filer, an accelerated filer, or a non-accelerated filer. See definition of “accelerated filer” and “large accelerated filer” in Rule 12b-2 of the Exchange Act.
Large accelerated filer
x
Accelerated filer
o
Non-accelerated filer
o
Indicate by check mark which basis of accounting the registrant has used to prepare the financial statements included in this filing:
|
U.S. GAAP
o
International Financial Reporting Standards as Issued by the international Accounting Standards Board
x
Other
o
|
If “Other” has been checked in response to the previous question, indicate by check mark which financial statement item the registrant has elected to follow.
Item 17
o
Item 18
o
If this is an annual report indicate by check mark whether the registrant is a shell company (as defined in Rule 12b-2 of the Exchange Act).
Yes
o
No
x
Page
|
1
|
||
|
3
|
||
|
6
|
||
|
7
|
||
|
Identity of Directors, Senior Management and Advisors
|
7
|
|
|
Directors and Senior Management
|
7
|
|
|
Advisers
|
7
|
|
|
Auditors
|
7
|
|
|
Offer Statistics and Expected Timetable
|
7
|
|
|
Key Information
|
7
|
|
|
Selected Financial Data
|
7
|
|
|
Capitalization and Indebtedness
|
9
|
|
|
Reasons for the Offer and Use of Proceeds
|
10
|
|
|
Risk Factors
|
10
|
|
|
Information on the Company
|
16
|
|
|
History and Development of the Company
|
16
|
|
|
Business Overview
|
22
|
|
|
Organizational Structure
|
75
|
|
|
Property, Plant and Equipment
|
75
|
|
|
Unresolved Staff Comments
|
77
|
|
|
Operating and Financial Review and Prospects
|
77
|
|
|
Operating Results
|
77
|
|
|
Liquidity and Capital Resources
|
115
|
|
|
Research and Development, Patents and Licenses, etc.
|
119
|
|
|
Trend Information
|
121
|
|
|
Off-Balance Sheet Arrangements
|
122
|
|
|
Tabular Disclosure of Contractual Obligations
|
122
|
|
|
Directors, Senior Management and Employees
|
123
|
|
|
Directors and Senior Management
|
123
|
|
|
Compensation
|
131
|
|
|
Board Practices
|
136
|
|
|
Employees
|
137
|
|
|
Share Ownership
|
137
|
|
|
Major Shareholders and Related Party Transactions
|
138
|
|
|
Major Shareholders
|
138
|
|
|
Related Party Transactions
|
139
|
|
|
Interests of Experts and Counsel
|
140
|
|
|
Financial Information
|
140
|
|
|
The Offering and Listing
|
144
|
|
|
Offer and Listing Details
|
144
|
|
|
Plan of Distribution
|
148
|
|
|
Markets
|
148
|
|
|
Selling Shareholders
|
148
|
|
|
Dilution
|
148
|
|
|
Expenses of the Issue
|
148
|
|
|
Additional Information
|
149
|
|
|
Share Capital
|
149
|
|
|
Memorandum and Articles of Association
|
149
|
|
|
Material Contracts
|
152
|
|
|
Exchange Controls
|
155
|
|
|
Taxation
|
156
|
|
|
Dividends and Paying Agents
|
161
|
|
|
Statements by Experts
|
161
|
|
|
Documents on Display
|
161
|
|
|
Subsidiary Information
|
161
|
|
|
Quantitative and Qualitative Disclosures About Market Risk
|
161
|
|
|
Description of Securities Other Than Equity Securities
|
162
|
|
|
American Depositary Shares
|
162
|
|
|
165
|
||
|
Defaults, Dividend Arrearages and Delinquencies
|
165
|
|
|
Material Modifications to the Rights of Security Holders and Use of Proceeds
|
165
|
|
|
Controls and Procedures
|
165
|
|
|
[Reserved]
|
165
|
|
|
Audit Committee Financial Expert
|
165
|
|
|
Code of Ethics
|
165
|
|
|
Principal Accountant Fees and Services
|
166
|
|
|
Exemptions from the Listing Standards for Audit Committees
|
167
|
|
|
Purchases of Equity Securities by the Issuer and Affiliated Purchasers
|
167
|
|
|
Change in Registrant’s Certifying Accountant
|
167
|
|
|
Corporate Governance
|
168
|
|
|
169
|
||
|
Financial Statements
|
169
|
|
|
Financial Statements
|
170
|
|
|
Exhibits
|
171
|
|
This Annual Report contains statements that constitute forward-looking statements within the meaning of Section 27A of the Securities Act of 1933, as amended, Section 21E of the Securities Exchange Act of 1934, as amended, and the safe harbor provisions of the Private Securities Litigation Reform Act of 1995. The forward-looking statements in this Annual Report can be identified, in some instances, by the use of words such as “will,” “expect,” “aim,” “hope,” “anticipate,” “intend,” “believe” and similar language or the negative thereof or by the forward-looking nature of discussions of strategy, plans or intentions. These statements appear in a number of places in this Annual Report including, without limitation, certain statements made in “Item 3. Key Information—Risk Factors,” “Item 4. Information on the Company,” “Item 5. Operating and Financial Review and Prospects” and “Item 11. Quantitative and Qualitative Disclosures About Market Risk” and include statements regarding our intent, belief or current expectations with respect to, among other things:
|
|
·
|
the effect on our results of operations of competition in telecommunications markets;
|
|
|
·
|
trends affecting our financial condition or results of operations;
|
|
|
·
|
acquisitions or investments which we may make in the future;
|
|
|
·
|
our capital expenditures plan;
|
|
|
·
|
our estimated availability of funds;
|
|
|
·
|
our ability to repay debt with estimated future cash flows;
|
|
|
·
|
our shareholder remuneration policies;
|
|
|
·
|
supervision and regulation of the telecommunications sectors where we have significant operations;
|
|
|
·
|
our strategic partnerships; and
|
|
|
·
|
the potential for growth and competition in current and anticipated areas of our business.
|
Such forward-looking statements are not guarantees of future performance and involve numerous risks and uncertainties, and actual results may differ materially from those anticipated in the forward-looking statements as a result of various factors. The risks and uncertainties involved in our business that could affect the matters referred to in such forward-looking statements include but are not limited to:
|
|
·
|
changes in general economic, business or political conditions in the domestic or international markets (particularly in Latin America) in which we operate or have material investments that may affect demand for our services;
|
|
|
·
|
changes in currency exchange rates, interest rates or in credit risk in our treasury investments or in some of our financial transactions;
|
|
|
·
|
general economic conditions in the countries in which we operate;
|
|
|
·
|
existing or worsening conditions in the international financial markets;
|
|
|
·
|
the actions of existing and potential competitors in each of our markets;
|
|
|
·
|
the impact of current, pending or future legislation and regulation in countries where we operate;
|
|
|
·
|
failure to renew or obtain the necessary licenses, authorizations and concessions to carry out our operations;
|
|
|
·
|
the potential effects of technological changes;
|
|
|
·
|
the impact of limitations in spectrum capacity;
|
|
|
·
|
failure of suppliers to provide necessary equipment and services on a timely basis;
|
|
|
·
|
the impact of unanticipated network interruptions;
|
|
|
·
|
the effect of reports suggesting that radio frequency emissions cause health problems;
|
|
|
·
|
the impact of impairment charges on our goodwill and assets as a result of changes in the regulatory, business or political environment; and
|
|
|
·
|
the outcome of pending litigation.
|
Readers are cautioned not to place undue reliance on those forward-looking statements, which speak only as of the date of this Annual Report. We undertake no obligation to release publicly the result of any revisions to these forward-looking statements which may be made to reflect events or circumstances after the date of this Annual Report including, without limitation, changes in our business or acquisition strategy or planned capital expenditures, or to reflect the occurrence of unanticipated events.
Our ordinary shares, nominal value €1.00 per share, are currently listed on each of the Madrid, Barcelona, Bilbao and Valencia stock exchanges and are quoted through the Automated Quotation System under the symbol “TEF.” They are also listed on various foreign stock exchanges such as the London, Buenos Aires and Tokyo stock exchanges. American Depositary Shares (“ADSs”), each representing the right to receive one ordinary share, are listed on the New York Stock Exchange and on the Lima Stock Exchange. ADSs are evidenced by American Depositary Receipts (“ADRs”) issued under a Deposit Agreement with Citibank, N.A., as Depositary. Brazilian Depositary Receipts (“BDRs”), each representing the right to receive one ordinary share, are listed on the São Paulo Stock Exchange and are issued under a deposit agreement with Banco Bradesco, S.A., as Depositary. On March 30, 2011, we initiated a plan to cancel the BDR Program and delist our securities from the São Paulo Stock Exchange. We expect that the BDR Program cancellation and delisting process will be completed in the second half of 2011.
As used herein, “Telefónica,” “Telefónica Group,” “Group” and terms such as “we,” “us” and “our” mean Telefónica, S.A. and its consolidated subsidiaries, unless the context requires otherwise.
As used herein, “Atento” means Atento Holding, Inversiones y Teleservicios, S.A. and its consolidated subsidiaries, unless the context requires otherwise.
Below are definitions of certain technical terms used in this Annual Report:
|
·
|
“Access” refers to a connection to any of the telecommunications services offered by us. We present our customer base using this model because the integration of telecommunications services in bundled service packages has changed the way residential and corporate customers contract for our services. Because a single customer may contract for multiple services, we believe it is more accurate to count the number of accesses, or services a customer has contracted for, as opposed to only counting the number of our customers. For example, a customer that has fixed line telephony service and broadband service represents two accesses rather than a single customer. In addition, we fully count the accesses of all companies over which we exercise control or joint control. The following are the main categories of accesses:
|
|
|
·
|
Fixed telephony accesses: includes public switched telephone network, or PSTN, lines (including public use telephony), and integrated services digital network, or ISDN, lines and circuits. For purposes of calculating our number of fixed line accesses, we multiply our lines in service as follows: PSTN (x1); basic ISDN (x1); primary ISDN (x30, x20 or x10); 2/6 digital accesses (x30).
|
|
|
·
|
Internet and data accesses: includes broadband accesses (retail asymmetrical digital subscriber line “ADSL,” satellite, fiber optic and circuits over 2 Mbps), narrowband accesses (Internet service through the PSTN lines) and other accesses, including the remaining non-broadband final client circuits. “Naked ADSL” allows customers to subscribe for a broadband connection without a monthly fixed line fee.
|
|
|
·
|
Pay TV: includes cable TV, direct to home satellite TV, or DTH, and Internet Protocol TV, or IPTV.
|
|
|
·
|
Mobile accesses: includes accesses to mobile network for voice and/or data services (including connectivity). Mobile broadband includes internet access from devices used to make voice calls and smartphones (mobile internet), and internet access from devices that complement fixed broadband, such as PCCards/dongles, and enable large amounts of data to be downloaded on the move (mobile connectivity). In 2009 in order to align the criteria for the key performance indicators of our mobile operations, the definition of mobile accesses (and, therefore, of total accesses) was revised to include machine-to-machine accesses. Mobile accesses are categorized into contract and prepay accesses. In addition, we revised the accounting criteria for pre-pay mobile accesses at Telefónica O2 Czech Republic and Telefónica O2 Slovakia to conform to the accounting criteria for pre-pay mobile accesses throughout the Group. In order to count a pre-pay mobile access, such access must have been active in the most recent three months prior to counting, through a revenue-generating event for our Group from whatsoever source. As a result of both revisions, we restated 2008 mobile accesses.
|
|
|
·
|
Unbundled local loop, or ULL: includes accesses to both ends of the copper local loop leased to other operators to provide voice and DSL services (fully unbundled loop, fully UL) or only DSL service (shared unbundled loop, “shared UL”).
|
|
|
·
|
Wholesale ADSL: means wholesale asymmetrical digital subscriber line.
|
|
|
·
|
Other: includes other circuits for other operators.
|
Certain technical terms used with respect to our business are as follows:
|
|
·
|
“ARPU” is the average revenue per user per month. ARPU is calculated by dividing total service revenue (excluding inbound roaming revenue) from sales to customers for the preceding 12 months by the weighted average number of accesses for the same period, and then divided by 12 months. ARPU is calculated using gross service revenue before deduction of wholesale discounts.
|
|
|
·
|
“CDMA” means Code Division Multiple Access, which is a type of radio communication technology.
|
|
|
·
|
“Commercial activity” includes the addition of new lines, replacement of handsets, migrations and changes in types of contracts.
|
|
|
·
|
“Customer revenue” means service revenue less interconnection revenue.
|
|
|
·
|
“Duo bundle” means broadband plus voice and/or TV service. We measure “duo bundles” in terms of units, where each bundle of broadband and voice service counts as one unit.
|
|
|
·
|
“Digital Dividend” refers to the amount of spectrum that will be freed up in the switchover from analogue to digital terrestrial TV.
|
|
|
·
|
“FTTx” is a generic term for any broadband network architecture that uses optical fiber to replace all or part of the metal local loop typically used for the last mile of telecommunications wiring.
|
|
|
·
|
“Final client accesses” means accesses provided to residential and corporate clients.
|
|
|
·
|
“Gross adds” means the gross increase in the customer base measured in terms of accesses in a period.
|
|
|
·
|
“HSDPA” means High Speed Downlink Packet Accesses, which is a 3G mobile telephony communications protocol in the High-Speed Packet Access (HSPA) family, which allows networks based on UMTS to have higher data transfers speeds and capacity.
|
|
|
·
|
“Interconnection revenue” means revenues received from other operators which use our networks to connect to our customers.
|
|
|
·
|
“ISP” means Internet service provider.
|
|
|
·
|
“IT”, or information technology, is the acquisition, processing, storage and dissemination of vocal, pictorial, textual and numerical information by a microelectronics-based combination of computing and telecommunications.
|
|
|
·
|
“LMDS” means local multipoint distribution service.
|
|
|
·
|
“LTE” means Long Term Evolution, a wireless access technology.
|
|
|
·
|
“Local loop” means the physical circuit connecting the network termination point at the subscriber’s premises to the main distribution frame or equivalent facility in the fixed public telephone network.
|
|
|
·
|
“M2M”, or machine to machine, refers to technologies that allow both wireless and wired systems to communicate with other devices of the same ability.
|
|
|
·
|
“MOU,” or minutes of use, is calculated by dividing the total number of voice minutes for the preceding 12 months by the weighted average number of mobile accesses for the same period, and then divided by 12 months. Over the past several years, we have experienced strong growth in mobile accesses related
|
primarily to data services (such as accesses related to machine-to-machine and mobile broadband devices). Such growth in mobile accesses related to data services limits the use of MOU as an indicator of usage as it increases the total number of mobile accesses in the relevant period without any corresponding increase in the number of voice minutes related to such accesses for the relevant period. As a result, we no longer publish MOU for years after 2008 and instead publish traffic evolution in absolute minutes of use.
|
|
·
|
“MVNO” means mobile virtual network operator, which is a mobile operator that is not entitled to use spectrum for the provision of mobile services. Consequently, an MVNO must subscribe to an access agreement with a mobile network operator in order to provide mobile access to their customers. An MVNO pays such mobile network operator for using the infrastructure to facilitate coverage to their customers.
|
|
|
·
|
“Net adds” means the difference between the customer base measured in terms of accesses
at the end of the period and the beginning of a period.
|
|
|
·
|
“Revenues” means net sales and revenues from rendering of services.
|
|
|
·
|
“Service revenues” means revenues less revenues from handset sales.
|
|
|
·
|
“Traffic” means voice minutes used by our customers over a given period, both outbound and inbound. On-net traffic is only included once (outbound), and promotional traffic (free minutes included in commercial promotions) is included. Traffic not associated with our mobile customers (roaming-in; MVNOs; interconnection of third parties and other business lines) is excluded. To arrive at the aggregate traffic for a given period, the individual components of traffic are not rounded.
|
|
|
·
|
“Trio bundle” means broadband plus voice service plus TV. We measure “trio bundles” in terms of units, where each bundle of broadband, voice service and TV counts as one unit.
|
|
|
·
|
“UMTS” means Universal Mobile Telecommunications System.
|
|
|
·
|
“VoIP” means voice over Internet protocol.
|
|
|
·
|
“Wholesale accesses” means accesses we provide to our competitors, who then sell services over such accesses to their residential and corporate clients.
|
In this Annual Report we make certain comparisons in local currency or on a “constant euro basis” or “excluding foreign exchange rate effects” in order to present an analysis of the development of our results of operations from year-to-year without the effects of currency fluctuations. To make comparisons on a local currency basis, we compare financial items in the relevant local currency for the periods indicated as recorded in the relevant local currency for such periods. To make comparisons on a “constant euro basis” or “excluding foreign exchange rate effects,” we convert the relevant financial item into euros using the prior year’s average euro to relevant local currency exchange rate. In addition, we present certain financial information excluding the effects of Venezuela being considered a hyperinflationary economy in 2010 and 2009 by eliminating all adjustments made as a result of such consideration.
In this Annual Report, references to “US dollars,” “dollars” or “$,” are to United States dollars, references to “pounds sterling,” “sterling” or “£” are to British pounds sterling, references to “reais” refer to Brazilian reais and references to “euro” or “€” are to the single currency of the participating member states in the Third Stage of the European Economic and Monetary Union pursuant to the treaty establishing the European Community, as amended from time to time.
Our consolidated financial statements as of December 31, 2009 and 2010, and for the years ended December 31, 2008, 2009 and 2010 included elsewhere in this Annual Report including the notes thereto (the “Consolidated Financial Statements”), are prepared in conformity with International Financial Reporting Standards (“IFRS”) as issued by the International Accounting Standards Board (“IASB”).
Not applicable.
Not applicable.
Not applicable.
Not applicable.
The following table presents certain selected consolidated financial data. It is to be read in conjunction with “Item 5. Operating and Financial Review and Prospects” and the Consolidated Financial Statements. The consolidated income statement and cash flow data for the years ended December 31, 2008, 2009 and 2010 and the consolidated statement of financial position data as of December 31, 2009 and 2010 set forth below are derived from, and are qualified in their entirety by reference to the Consolidated Financial Statements. The consolidated income statement and cash flow data for the years ended December 31, 2006 and 2007 and the consolidated statement of financial position data as of December 31, 2006, 2007 and 2008 set forth below are derived from Telefónica, S.A.’s consolidated financial statements for such years, which are not included herein.
Our Consolidated Financial Statements have been prepared in accordance with IFRS as issued by the IASB.
The basis of presentation and principles of consolidation are described in detail in Notes 2 and 3.q., respectively, to our Consolidated Financial Statements.
|
As of or for the year ended December 31,
|
||||||||||||||||||||
|
2006(1)
|
2007
|
2008
|
2009
|
2010
|
||||||||||||||||
|
(in millions of euros, except share data)
|
||||||||||||||||||||
|
Revenues
|
52,901 | 56,441 | 57,946 | 56,731 | 60,737 | |||||||||||||||
|
Other income
|
1,571 | 4,264 | 1,865 | 1,645 | 5,869 | |||||||||||||||
|
Supplies
|
(16,629 | ) | (17,907 | ) | (17,818 | ) | (16,717 | ) | (17,606 | ) | ||||||||||
|
Personnel expenses
|
(7,622 | ) | (7,893 | ) | (6,762 | ) | (6,775 | ) | (8,409 | ) | ||||||||||
|
Other expenses
|
(11,095 | ) | (12,081 | ) | (12,312 | ) | (12,281 | ) | (14,814 | ) | ||||||||||
|
Depreciation and amortization
|
(9,704 | ) | (9,436 | ) | (9,046 | ) | (8,956 | ) | (9,303 | ) | ||||||||||
|
Operating income
|
9,422 | 13,388 | 13,873 | 13,647 | 16,474 | |||||||||||||||
|
Share of profit (loss) of associates
|
76 | 140 | (161 | ) | 47 | 76 | ||||||||||||||
|
Net financial expense
|
(2,795 | ) | (2,851 | ) | (2,821 | ) | (2,767 | ) | (2,537 | ) | ||||||||||
|
Net exchange differences
|
61 | 7 | 24 | (540 | ) | (112 | ) | |||||||||||||
|
Net financial income (expense)
|
(2,734 | ) | (2,844 | ) | (2,797 | ) | (3,307 | ) | (2,649 | ) | ||||||||||
|
Profit before taxes from continuing operations
|
6,764 | 10,684 | 10,915 | 10,387 | 13,901 | |||||||||||||||
|
Corporate income tax
|
(1,781 | ) | (1,565 | ) | (3,089 | ) | (2,450 | ) | (3,829 | ) | ||||||||||
|
Profit for the year from continuing operations
|
4,983 | 9,119 | 7,826 | 7,937 | 10,072 | |||||||||||||||
|
Profit from discontinued operations after taxes
|
1,596 | — | — | — | — | |||||||||||||||
|
Profit for the year
|
6,579 | 9,119 | 7,826 | 7,937 | 10,072 | |||||||||||||||
|
Non-controlling interests
|
(346 | ) | (213 | ) | (234 | ) | (161 | ) | 95 | |||||||||||
|
Profit for the year attributable to equity holders of the parent
|
6,233 | 8,906 | 7,592 | 7,776 | 10,167 | |||||||||||||||
|
Weighted average number of shares (thousands)
|
4,778,999 | 4,758,707 | 4,645,852 | 4,552,656 | 4,522,228 | |||||||||||||||
|
Basic and diluted earnings per share from continuing operations attributable to equity holders (euros)(2)
|
0.97 | 1.87 | 1.63 | 1.71 | 2.25 | |||||||||||||||
|
Basic and diluted earnings per share attributable to equity holders of the parent (euros)(2)
|
1.30 | 1.87 | 1.63 | 1.71 | 2.25 | |||||||||||||||
|
Earnings per ADS (euros)(2)(3)
|
1.30 | 1.87 | 1.63 | 1.71 | 2.25 | |||||||||||||||
|
Weighted average number of ADS (thousands) (3)
|
4,778,999 | 4,758,707 | 4,645,852 | 4,552,656 | 4,522,228 | |||||||||||||||
|
Cash dividends per ordinary share (euros)
|
0.55 | 0.65 | 0.90 | 1.00 | 1.30 | |||||||||||||||
|
Consolidated Statement of Financial Position Data
|
||||||||||||||||||||
|
Cash and cash equivalents
|
3,792 | 5,065 | 4,277 | 9,113 | 4,220 | |||||||||||||||
|
Property, plant and equipment
|
33,887 | 32,460 | 30,545 | 31,999 | 35,797 | |||||||||||||||
|
Total assets
|
108,982 | 105,873 | 99,896 | 108,141 | 129,775 | |||||||||||||||
|
Non-current liabilities
|
62,645 | 58,044 | 55,202 | 56,931 | 64,599 | |||||||||||||||
|
Equity (net)
|
20,001 | 22,855 | 19,562 | 24,274 | 31,684 | |||||||||||||||
|
Capital stock
|
4,921 | 4,773 | 4,705 | 4,564 | 4,564 | |||||||||||||||
|
Consolidated Cash Flow Data
|
||||||||||||||||||||
|
Net cash from operating activities
|
15,414 | 15,551 | 16,366 | 16,148 | 16,672 | |||||||||||||||
|
Net cash used in investing activities
|
(28,052 | ) | (4,592 | ) | (9,101 | ) | (9,300 | ) | (15,861 | ) | ||||||||||
|
Net cash (used in) from financing activities
|
14,572 | (9,425 | ) | (7,765 | ) | (2,281 | ) | (5,248 | ) | |||||||||||
|
(1)
|
Telefónica Publicidad e Información, S.A. (TPI) was sold in 2006 and its results of operations for 2006 and the gain we recorded on its sale are included under “Profit from discontinued operations after taxes” for 2006.
|
|
(2)
|
The per share and per ADS computations for all periods presented have been presented using the weighted average number of shares and ADSs, respectively, outstanding for each period, and have been adjusted to reflect the stock dividends which occurred during the periods presented, as if these had occurred at the beginning of the earliest period presented.
|
|
(3)
|
Until January 20, 2011, each ADS represented the right to receive three ordinary shares. Since January 21, 2011, each ADS represents the right to receive one ordinary share. The above figures have been restated accordingly. Figures do not include any charges of the Depositary.
|
Exchange Rate Information
As used in this Annual Report, the term “Noon Buying Rate” refers to the rate of exchange for euros, expressed in U.S. dollars per euro, in the City of New York for cable transfers payable in foreign currencies as certified by the Federal Reserve Bank of New York for customs purposes. The Noon Buying Rate certified by the New York Federal Reserve Bank for the euro on April 22, 2011 was $1.4545 =€1.00. The following tables describe, for the periods and dates indicated, information concerning the Noon Buying Rate for the euro. Amounts are expressed in U.S. dollars per €1.00.
|
Noon Buying Rate
|
||||||||||||||||
|
Year ended December 31,
|
Period end
|
Average(1)
|
High
|
Low
|
||||||||||||
|
2006
|
1.3197 | 1.2661 | 1.3327 | 1.1860 | ||||||||||||
|
2007
|
1.4603 | 1.3797 | 1.4862 | 1.2904 | ||||||||||||
|
2008
|
1.3919 | 1.4698 | 1.6010 | 1.2446 | ||||||||||||
|
2009
|
1.4332 | 1.3955 | 1.5100 | 1.2547 | ||||||||||||
|
2010
|
1.3269 | 1.3261 | 1.4536 | 1.1959 | ||||||||||||
|
2011 (through April 22, 2011)
|
1.4545 | 1.3840 | 1.4585 | 1.2944 | ||||||||||||
Source: Federal Reserve Bank of New York.
|
(1)
|
The average of the Noon Buying Rates for the euro on the last day reported of each month during the relevant period.
|
|
Noon Buying Rate
|
||||||||
|
Month ended
|
High
|
Low
|
||||||
|
October 31, 2010
|
1.4066 | 1.3688 | ||||||
|
November 30, 2010
|
1.4224 | 1.3036 | ||||||
|
December 31, 2010
|
1.3395 | 1.3089 | ||||||
|
January 31, 2011
|
1.3715 | 1.2944 | ||||||
|
February 28, 2011
|
1.3794 | 1.3474 | ||||||
|
March 31, 2011
|
1.4212 | 1.3813 | ||||||
|
April 30, 2011 (through April 22, 2011)
|
1.4585 | 1.4211 | ||||||
Source: Federal Reserve Bank of New York.
Monetary policy within the member states of the euro zone is set by the European Central Bank. The European Central Bank has set the objective of containing inflation and will adjust interest rates in line with this policy without taking account of other economic variables such as the rate of unemployment. It has further declared that it will not set an exchange rate target for the euro.
Our ordinary shares are quoted on the Spanish stock exchanges in euro. Currency fluctuations may affect the dollar equivalent of the euro price of our shares listed on the Spanish stock exchanges and, as a result, the market price of our ADSs, which are listed on the New York Stock Exchange. Currency fluctuations may also affect the dollar amounts received by holders of ADSs on conversion by the depositary of any cash dividends paid in euro on the underlying shares.
Our consolidated results are affected by fluctuations between the euro and the currencies in which the revenues and expenses of some of our consolidated subsidiaries are denominated (principally the Brazilian real, the Venezuelan Bolivar fuerte (see “Item 5. Operating and Financial Review and Prospects—A. Operating Results—Significant Factors Affecting the Comparability of our Results of Operations in the Periods Under Review—Classification of Venezuela as a hyperinflationary economy” and “Item 5. Operating Results—Significant Factors Affecting the Comparability of our Results of Operations in the Periods Under Review—Devaluation of the Venezuelan bolivar”), the pound sterling, the Czech koruna (crown), the Argentine peso, the Chilean peso, the Peruvian nuevo sol, the Mexican peso and the Colombian peso).
Not applicable.
Not applicable.
In addition to the other information contained in this Annual Report, prospective investors should carefully consider the risks described below before making any investment decision. The risks described below are not the only ones that we face. Additional risks not currently known to us or that we currently deem immaterial may also impair our business and results of operations. Our business, financial condition, results of operations and cash flow could be materially adversely affected by any of these risks, and investors could lose all or part of their investment.
Risks Relating to Our Business
A material portion of our operations and investments are located in Latin America, and we are therefore exposed to risks inherent in operating and investing in Latin America.
At December 31, 2010, approximately 50.6% of our assets were located in our Latin America segment. In addition, approximately 42.9% of our revenues for 2010 were derived from our Latin American segment operations. At December 31, 2010, 56.4% of Latin America assets and 42.7% of Latin America revenues were derived from our operations in Brazil. Our business is thus particularly sensitive to any of the risks relating to Latin America discussed in this section to the extent they arise or manifest themselves in Brazil. Our operations and investments in Latin America (including the revenues generated by these operations, their market value and the dividends and management fees expected to be received therefrom) are subject to various risks linked to the economic, political and social conditions of these countries, including risks related to the following:
|
|
·
|
government regulation or administrative polices may change unexpectedly and negatively affect our interests in such countries;
|
|
|
·
|
currencies may be devalued or may depreciate or currency restrictions and other restraints on transfer of funds may be imposed;
|
|
|
·
|
the effects of inflation or currency depreciation may result in certain of our subsidiaries having negative equity, which would require them to undertake a mandatory recapitalization or commence dissolution proceedings;
|
|
|
·
|
governments may expropriate or nationalize assets or increase their participation in the economy and companies;
|
|
|
·
|
governments may impose burdensome taxes or tariffs;
|
|
|
·
|
political changes may lead to changes in the economic conditions and business environment in which we operate; and
|
|
|
·
|
economic downturns, political instability and civil disturbances may negatively affect our operations.
|
In addition, our operations are dependent, in many cases, on concessions and other agreements with existing governments in the countries in which we operate. These concessions and agreements, including their renewal, could be directly affected by economic and political instability, altering the terms and conditions under which we operate.
Our financial condition and results of operations may be adversely affected if we do not effectively manage our exposure to foreign currency exchange rate, interest rate or financial investment risks.
We are exposed to various types of market risk in the normal course of our business, including the impact of changes in foreign currency exchange rates and the impact of changes in interest rates, as well as the impact of changes of credit risk in our treasury investments (in cash and cash equivalents) or in some of our financial
transactions. We employ risk management strategies to manage this exposure, in part through the use of financial derivatives such as foreign currency forwards, currency swap agreements and interest rate swap agreements. If the financial derivatives market is not sufficiently liquid for our risk management purposes, or if we cannot enter into arrangements of the type and for the amounts necessary to limit our exposure to currency exchange rate fluctuations and interest rate fluctuations or if our counterparties fail to deliver on their commitments due to lack of solvency or otherwise, such failure could adversely affect our financial condition, results of operations and cash flow. Also, our other risk management strategies may not be successful, which could adversely affect our financial condition, results of operations and cash flow. Finally, if the rating of our counterparties in treasury investments or in our structured financial transactions deteriorates significantly or if any of such counterparties were to fail in its obligations to us, we may suffer a loss of value in our investments, incur unexpected losses and assume additional financial obligations under these transactions, and such failure could adversely affect our business, financial condition, results of operations and cash flow.
For a more detailed description of our financial derivatives transactions, see “Item 11. Quantitative and Qualitative Disclosures about Market Risk” and Note 16 to our Consolidated Financial Statements.
Adverse economic conditions could reduce purchases of our products and services.
Our business is impacted by general economic conditions and other similar factors in each of the countries in which we operate. The current uncertainty about an economic recovery may negatively affect the level of demand of existing and prospective customers, as our services may not be deemed critical for these customers. Additional factors that could influence customer demand include access to credit, unemployment rates, consumer confidence and other general macroeconomic factors. Specifically, in this respect the continuation of the economic situation in Spain, according to the forecasts contained in the Spanish economic ministry’s Stability Program for 2009-2013, could have an adverse affect on the Telefónica Group’s results in Spain. In addition, other related effects of the financial crisis could impact our business, including insolvency of key suppliers or customers. A loss of customers or a reduction in purchases by our current customers could have a material adverse effect on our business, financial condition, results of operations and cash flow and may therefore negatively affect our ability to meet our growth targets.
Existing or worsening conditions in the international financial markets may limit our ability to carry out our business plan.
The development and distribution of our services as well as the operation, expansion and upgrading of our networks, require substantial financing. Moreover, our liquidity and capital resource requirements may increase if we participate in other fixed line or mobile license award processes or make acquisitions. We also have major capital resource requirements relating to, among other things, the development of distribution channels in new countries of operations and the development and implementation of new technologies.
If our ability to generate cash flow were to decrease, whether due to an economic crisis or otherwise, we may need to incur additional debt or raise other forms of capital to support our liquidity and capital resource requirements for the ongoing development and expansion of our business.
The state of international financial markets in terms of liquidity, cost of credit, access and volatility continues to be affected by current uncertainties surrounding the pace of economic recovery, the health of the international banking system and increasing concerns regarding burgeoning public deficits in certain countries, among other factors. Worsening conditions in the international credit markets due to any of these factors may make it more difficult and more expensive to refinance our financial debt or to incur additional debt.
In addition, our capacity to raise capital in the international capital markets would be impaired if our credit ratings were downgraded, whether due to decreases in our cash flow or otherwise. Further, current market conditions may make it more difficult to renew our unused bilateral credit facilities, 35% of which as of December 31, 2010 are scheduled to mature prior to December 31, 2011. The current financial situation may also make it more difficult and costly for us to launch a rights issue to our current shareholders or to raise additional equity capital if further funds were needed for pursuing our business plans.
Risks Relating to Our Industry
We face intense competition in most of our markets, which could result in decreases in current and potential customers, revenues and profitability.
We face significant competition in all of the markets in which we operate, and we are therefore subject to the effects of actions by our competitors in these markets. Our competitors could:
|
|
·
|
offer lower prices, more attractive discount plans or better services and features;
|
|
|
·
|
develop and deploy more rapidly new or improved technologies, services and products;
|
|
|
·
|
launch bundle offerings of one type of service with others;
|
|
|
·
|
in the case of the mobile industry, subsidize handset procurement; or
|
|
|
·
|
expand and enhance their networks more rapidly.
|
Furthermore, some of our competitors in certain markets have, and some potential competitors may enjoy, in certain markets, competitive advantages, including the following:
|
|
·
|
greater brand name recognition;
|
|
|
·
|
greater financial, technical, marketing and other resources;
|
|
|
·
|
dominant position or significant market power;
|
|
|
·
|
better strategic alliances;
|
|
|
·
|
larger customer bases; and
|
|
|
·
|
well-established relationships with current and potential customers.
|
To compete effectively with our competitors, we need to successfully market our products and services and to anticipate and respond to various competitive factors affecting the relevant markets, such as the introduction of new products and services by our competitors, pricing strategies adopted by our competitors and changes in consumer preferences and in general economic, political and social conditions. If we are unable to effectively compete, it could result in price reductions, lower revenues, under-utilization of our services, reduced operating margins and loss of market share, any of which could have a material adverse effect on our business, financial condition, results of operations and cash flow.
We operate in a highly regulated industry, which could adversely affect our businesses.
As a multinational telecommunications company that operates in regulated markets, we are subject to different laws and regulations in each of the jurisdictions in which we provide services. Such laws and regulations are promulgated and enforced to varying degrees by supranational regulators such as the European Union and national, state, regional and local authorities. Regulation may be especially strict in the markets of those countries in which we hold a significant market position. In this respect, regulatory authorities regularly intervene in the retail and wholesale offering and pricing of our products and services. Furthermore, such authorities may also adopt further regulations or take additional actions that could adversely affect us, including revocation of or failure to renew any of our licenses, authorizations or concessions, implementation of changes to the spectrum allocated to us or the granting or new licenses, authorizations or concessions to our competitors to offer services in the relevant markets. Furthermore, regulations could require us to reduce roaming prices and termination rates in mobile and/or fixed line networks, require us to offer access to our network to other operators
,
and result in the imposition of fines if we fail to fulfill our service commitments. Such regulations and regulatory actions could place significant competitive and pricing pressure on our operations, and could have a material adverse effect on our business, financial condition, results of operations and cash flow.
In addition, since we hold a leading market share in many of the counties where we operate, we could face regulatory actions by antitrust or competition authorities designed to enhance competition in the relevant markets. These authorities could prohibit us from taking further actions such as making further acquisitions or continuing to engage in particular practices or impose fines or other penalties on us, which, if significant, could result in loss of market share and harm to our financial performance and future growth.
We expect that the regulatory landscape in the European Union will change as a consequence of the recent passage of a common regulatory framework that is to be implemented by Member States before May 2011. We believe, based on the principles set forth in such regulatory framework, that the regulations adopted by Member States could result in an increased focus on the development and maintenance of competitive markets. This regulatory framework proposes the adoption of certain measures, in specific circumstances, by national authorities to establish functional separation between the retail and wholesale operations of vertically integrated operators with significant market power, by requiring such operators to offer equal wholesale conditions to related and third party operators that buy wholesale products. The adoption of such regulatory framework in Spain and other European Union Member States where we operate could result in requirements that force us to modify our internal organization in the relevant markets, which could result in additional costs to us. Additionally, our industry may face new regulatory initiatives regarding lowering mobile termination rates and the provision of data and audiovisual services.
Furthermore, we may face pressure from regulatory initiatives in some European countries that seek to reallocate spectrum rights and modify spectrum allocation policies that may result, among other things, in new tender processes for spectrum allocation in the European Union.
Finally, the European Commission’s recommendation concerning the implementation of European regulation of next-generation broadband networks may reduce incentives for operators to invest in broadband networks over the short and medium term because operators that invest in broadband networks could be required to provide third parties access to such networks. This could affect competition, business performance and future growth in such services. The European Commission is also considering further recommendations concerning cost accounting and non-discrimination that could increase regulatory pressure on fixed operators.
For further information regarding the matters discussed above and other aspects of the regulatory environments in which our businesses operate, see “Item 4. Information on the Company—Business Overview—Regulation.”
We operate under licenses, authorizations and concessions granted by government authorities.
Most of our operating companies require licenses, authorizations or concessions from the governmental authorities of the countries in which they operate. These licenses, authorizations and concessions specify the types of services permitted to be offered by the operating company holding such license, authorization or concession. The continued existence and terms of our licenses, authorizations and concessions are subject to review by regulatory authorities in each country and to interpretation, modification or termination by these authorities. Moreover, authorizations, licenses and concessions as well as their renewal terms and conditions may be affected by political and regulatory factors.
The terms of these licenses, authorizations and concessions granted to our operating companies and conditions of the renewals of such licenses, authorizations and concessions vary from country to country. Although license, authorization and concession renewal is not usually guaranteed, most licenses, authorizations and concessions do address the renewal process and terms, which is usually related to the fulfillment of the commitments that were assumed by the grantee. As licenses, authorizations and concessions approach the end of their terms, we intend to pursue their renewal to the extent provided by the relevant licenses, authorizations or concessions and, under certain circumstances, we will operate under technically expired licenses, authorizations or concessions under preexisting terms during the renewal process. Failure to complete the renewal process successfully could adversely affect our business, financial condition, results of operations and cash flow.
Many of our licenses, authorizations and concessions are revocable for public interest reasons. The rules of some of the regulatory authorities with jurisdiction over our operating companies require us to meet specified network build-out requirements and schedules. In particular, our existing licenses, authorizations and concessions
typically require us to satisfy certain obligations, including, amongst others, minimum specified quality standards, service and coverage conditions and capital investment. Failure to comply with these obligations could result in the imposition of fines or revocation or forfeiture of the license, authorization or concession for the relevant area. In addition, the need to meet scheduled deadlines may require our companies to expend more resources than otherwise budgeted for a particular network build-out.
For further information regarding the licenses and concessions of our operating companies, see “Item 4. Information on the Company—Business Overview—Regulation.”
The industry in which we operate is subject to rapid technological changes, which requires us to continuously adapt to such changes and to upgrade our existing networks. If we are unable to adapt to such changes, our ability to provide competitive services could be materially adversely affected.
Our future success depends, in part, on our ability to anticipate and adapt in a timely manner to technological changes. We expect that new products and technologies will emerge on a continuous basis and that existing products and technologies will further develop. These new products and technologies may reduce the prices for our existing services or may be superior to, and render obsolete, the products and services we offer and the technologies we use and may consequently reduce the revenues generated by our products and services and require investment in new technology. In addition, we may be subject to competition in the future from other companies that are not subject to regulation as a result of the convergence of telecommunications technologies. As a result, it may be very expensive for us to upgrade our products and technology in order to continue to compete effectively with new or existing competitors. Such increased costs could adversely affect our business, financial condition, results of operations and cash flow.
In particular, we must continue to upgrade our existing mobile and fixed line telephony networks in a timely and satisfactory manner in order to retain and expand our customer base in each of our markets, to enhance our financial performance and to satisfy regulatory requirements. Among other things, we could be required to upgrade the functionality of our networks to accommodate increased customization of services, to increase coverage in some of our markets, or to expand and maintain customer service, network management and administrative systems.
Many of these tasks are not entirely under our control and may be affected by applicable regulations. If we fail to execute these tasks successfully, our services and products may be less attractive to new customers and we may lose existing customers to our competitors, which would adversely affect our business, financial condition, results of operations and cash flow.
Spectrum capacity may become a limiting and costly factor.
Our mobile operations in a number of countries may rely on spectrum availability. Failure to obtain sufficient or adequate spectrum coverage and the costs related to obtaining this capacity could have a material adverse impact on the quality of our services, on our ability to provide new services and on our cash flow, adversely affecting our business, financial condition and results of operations.
Our business could be adversely affected if our suppliers fail to provide necessary equipment and services on a timely basis.
We depend upon a small number of major suppliers for essential products and services, mainly network infrastructure and mobile handsets. These suppliers may, among other things, extend delivery times, raise prices and limit supply due to their own shortages and business requirements. If these suppliers fail to deliver products and services on a timely basis, our business and results of operations could be adversely affected. Similarly, interruptions in the supply of telecommunications equipment for our networks could impede network development and expansion, which in some cases could adversely affect our ability to satisfy our license terms and requirements.
We may be adversely affected by unanticipated network interruptions.
Unanticipated network interruptions as a result of system failures whether accidental or otherwise, including due to network, hardware or software failures, which affect the quality of or cause an interruption in our service, could result in customer dissatisfaction, reduced revenues and traffic and costly repairs, penalties or other measures
imposed by regulatory authorities, and could harm our reputation. We attempt to mitigate these risks through a number of measures, including backup systems and protective systems such as firewalls, virus scanners and building security. However, these measures are not effective under all circumstances and cannot avert every action or event that could damage or disrupt our technical infrastructure. Although we carry business interruption insurance, our insurance policy may not provide coverage in amounts sufficient to compensate us for any losses we may incur.
The mobile industry may be harmed by concerns stemming from actual or perceived health risks associated with radio frequency emissions.
Over the last few years, the debate about the alleged potential effects of radio frequency emissions on human health has increased significantly. In many cases, this has hindered the deployment of the infrastructures necessary to ensure quality of service.
Institutions and organizations, such as the World Health Organization (WHO), have stated that exposure to radio frequency emissions generated by mobile telephony, within the limits established, has no adverse effects on health. In fact, a number of European countries, including Spain among others, have drawn up complete regulations reflecting the Recommendation of the Council of the European Union dated July 12, 1999. These add planning criteria for new networks, thus ensuring compliance with the limits on exposure to radio frequency emissions.
New research is underway. Specifically, the WHO has announced that in 2011 it will issue new recommendations in connection with the release of its Radio Frequency Environment Health Criteria. Regardless of any conclusions drawn from such research, popular concerns about radio frequency emissions may discourage the use of mobile communication devices and may result in significant restrictions on both the location and operation of cell sites, either or both of which could have a detrimental impact on our mobile companies and consequently on our financial condition, results of operations and cash flow. While we are not currently aware of any evidence confirming a link between radio frequency emissions and health problems and we continue to comply with good practices codes and relevant regulations, there can be no assurance of what future medical research may suggest.
Developments in the telecommunications sector have resulted, and may in the future result, in substantial write-downs of the carrying value of certain of our assets.
We review on an annual basis or more frequently where the circumstances require, the value of each of our assets and cash generating units to assess whether their carrying values can be supported by the future cash flows expected to be derived from such assets and cash generating units, including in some cases synergies included in their acquisition costs. Changes in the regulatory, business, economic or political environment may result in the necessity of recognizing impairment charges on our goodwill, intangible assets or fixed assets.
Although the recognition of impairments of tangible, intangible and financial assets result in a non-cash charge on the income statement, such charge would adversely affect our results of operations and consequently, our ability to achieve our growth targets.
Other Risks
We are involved in disputes and litigation with regulators, competitors and third parties.
We are party to lawsuits and other legal, regulatory and antitrust proceedings in the ordinary course of our business, the final outcome of which is generally uncertain. Litigation and regulatory proceedings are inherently unpredictable. An adverse outcome in, or any settlement of, these or other proceedings (including any that may be asserted in the future) may have a material adverse effect on our business, financial condition, results of operations and cash flow.
For a more detailed description of current legal proceedings, see “Item 8. Financial Information—Legal Proceedings.”
Overview
Telefónica, S.A., is a corporation duly organized and existing under the laws of the Kingdom of Spain, incorporated on April 19, 1924. We are:
|
|
·
|
a diversified telecommunications group which provides a comprehensive range of services through one of the world’s largest and most modern telecommunications networks;
|
|
|
·
|
mainly focused on providing fixed and mobile telephony services; and
|
|
|
·
|
present principally in Spain, Europe and Latin America.
|
The following significant events occurred in 2010:
|
|
·
|
On February 16, 2010, we completed, through our subsidiary Telefónica Deutschland GmbH, the acquisition of the German telecommunications operator HanseNet Telekommunikation GmbH (“HanseNet”).
|
|
|
·
|
On May 20, 2010, Telefónica O2 Germany GmbH & Co OHG (“Telefónica O2 Germany”) secured two blocks in the 800 MHz spectrum at the German frequency auction. Telefónica O2 Germany also secured one block of the 2.0 GHz and four blocks of the 2.6 GHz spectrums. The total investment in new frequencies by Telefónica O2 Germany was approximately €1,379 million.
|
|
|
·
|
On July 28, 2010, we signed an agreement with Portugal Telecom, SGPS, S.A. (“Portugal Telecom”) for the acquisition by Telefónica of the 50% of the capital stock of Brasilcel, N.V. (“Brasilcel”) owned by Portugal Telecom. Brasilcel owned approximately 60% of Vivo Participaçoes, S.A. (“Vivo Participaçoes”). The acquisition price of the aforementioned capital stock of Brasilcel was €7,500 million, €4,500 million of which was paid at the closing of the transaction on September 27, 2010 and €1,000 million of which was paid on December 30, 2010, with the remaining €2,000 million due on October 31, 2011 (though Portugal Telecom may request for this final payment to be made on July 29, 2011, in which case such final payment, and correspondingly, the price of the aquisition would be reduced by €25 million). Coincident with the closing of the transaction, the agreements signed in 2002 between Telefónica and Portugal Telecom, relating to their joint venture in Brazil (Subscription Agreement and Shareholders Agreement), were terminated.
|
|
|
·
|
On July 28, 2010, we executed a syndicated facility agreement with several domestic and international financial entities in an aggregate amount up to €8,000 million. This facility agreement is divided into two tranches: the first is a three-year term loan facility, in an aggregate amount up to €5,000 million and the second is a five-year revolving credit facility, in an aggregate amount up to €3,000 million.
|
|
|
·
|
On October 26, 2010, following the completion of the acquisition of Portugal Telecom’s 50% stake in Brasilcel, we announced a tender offer for all the outstanding voting shares of Vivo Participaçoes not held by Brasilcel, which represented approximately 3.8% of Vivo’s equity. This offer was approved by the Brazilian market regulator (C.V.M.) on February 11, 2011, and was completed on March 18, 2011.
|
|
|
·
|
On December 28, 2010, Telefónica, S.A., through its subsidiary, Telefónica de Contenidos, S.A.U., completed the acquisition of 22% of the capital stock of Distribuidora de Televisión Digital S.A. (“DTS”) for approximately €488 million, €228 million of which was settled by cancelling the subordinated loan between Telefónica de Contenidos, S.A.U. (as creditor) and Sogecable, S.A. (currently Prisa Televisión, S.A.U., as debtor).
|
Business areas
We have implemented a regional, integrated management model based on three business areas, with each area in charge of the fixed and mobile
telephone and other businesses within its borders:
|
|
·
|
Telefónica Spain: oversees the fixed and mobile telephony services in Spain.
|
|
|
·
|
Telefónica Europe: oversees the fixed and mobile telephony services in the United Kingdom, Germany, Ireland, the Czech Republic and Slovakia.
|
|
|
·
|
Telefónica Latin America: oversees the fixed and mobile telephony services in Latin America. In addition, Telefónica Latin America’s other members include: Telefónica Empresas, Telefónica International Wholesale Services (TIWS), the business unit responsible for other telecommunications operators and for managing our international services and the network which supports these services, and Terra Networks Latin América.
|
We are also involved in the media and contact center segments through Telefónica de Contenidos and Atento, respectively.
The following chart shows the organizational structure of the principal subsidiaries of the Telefónica Group at December 31, 2010, including their jurisdictions of incorporation and our ownership interest. For further detail, see Exhibit 8.1 to this Annual Report.
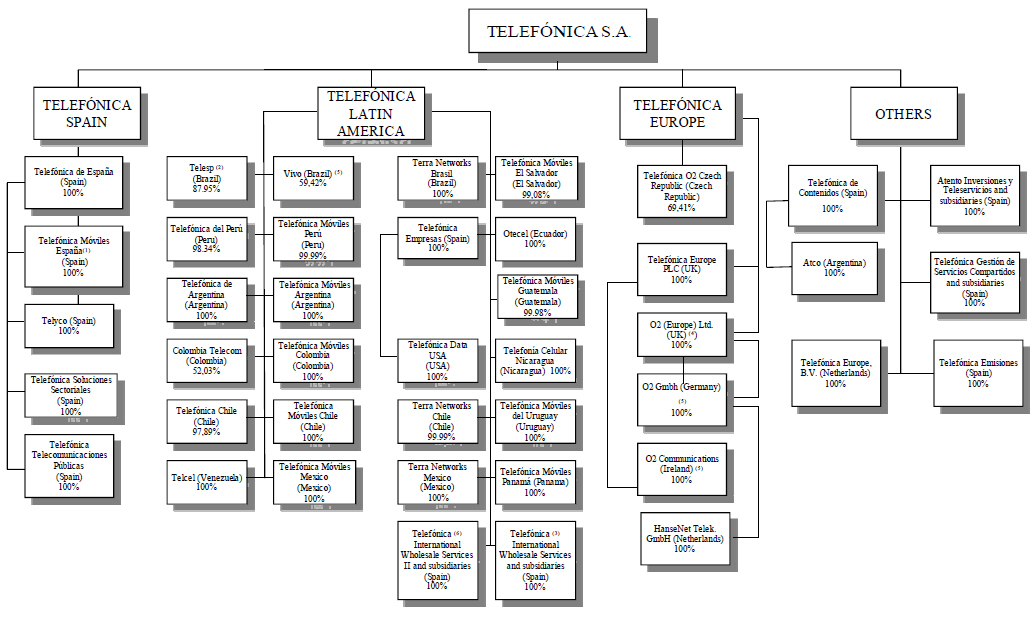
(1) Ownership in Telefónica Móviles España, S.A.U. is held directly by Telefónica, S.A.
|
(2)
|
85.57% representing voting interest.
|
|
(3)
|
Ownership in Telefónica International Wholesale Services, S.L. (Spain) is held 92.51% by Telefónica, S.A. (Spain) and 7.49% by Telefónica Datacorp, S.A.U. (Spain).
|
|
(4)
|
Ownership in O2 (Europe) Ltd. is held directly by Telefónica, S.A.
|
|
(5)
|
Companies held indirectly by Telefónica, S.A.
|
|
(6)
|
Ownership in Telefónica International Wholesale Services II is held directly by Telefónica, S.A.
|
Telefónica, S.A., the parent company of the Telefónica Group, also operates as a holding company with the following objectives:
|
|
·
|
coordinate the Group’s activities;
|
|
|
·
|
allocate resources efficiently among the Group;
|
|
|
·
|
provide managerial guidelines for the Group;
|
|
|
·
|
manage the Group’s portfolio of businesses;
|
|
|
·
|
foster cohesion within the Group; and
|
|
|
·
|
foster synergies among the Group’s subsidiaries.
|
Our principal executive offices are located at Distrito C, Ronda de la Comunicación, s/n, 28050 Madrid, Spain, and our registered offices are located at Gran Vía, 28, 28013 Madrid, Spain. Our telephone number is +34 900 111 004.
Capital Expenditures and Divestitures
Our principal capital expenditures during the three years ended December 31, 2010 consisted of additions to property, plant and equipment and additions to intangible assets, including spectrum. In 2010, 2009 and 2008, we made capital expenditures of €10,844 million, €7,257 million and €8,401 million, respectively.
Year ended December 31, 2010
Our capital expenditures increased 49.4% to €10,844 million in 2010 compared to €7,257 million in 2009, mainly as a result of the acquisition of spectrum in Germany (€1,379 million) and Mexico (€1,237 million) and the full consolidation in the fourth quarter of 2010 of Vivo. Excluding such spectrum acquisitions, capital expenditures growth would have been 13.4%. Our investments in Spain were directed toward further developing the fixed broadband business with a selective roll-out of fiber optics, Imagenio and data services for large corporate customers and expanding mobile third generation, or 3G, offerings. In Latin America, capital expenditures were directed toward the transformation of the fixed telephony business and continuing to expand coverage and capacity of 3G and GSM networks in our mobile telephony business. In Europe, capital expenditures were directed toward improving the capacity and coverage of our mobile networks and greater investments in the ADSL business.
Year ended December 31, 2009
Our capital expenditures decreased 13.6% to €7,257 million in 2009 compared to €8,401 million in 2008, mainly as a result of investment containment in our three regions of activity. Our investments in Spain were directed toward further developing the broadband business and expanding 3G.
In Latin America capital expenditures were directed toward satisfying increased customer demand in broadband and pay TV and increasing coverage and capacity of our second generation, or GSM, and mobile 3G networks. In Europe capital expenditures were directed toward
expanding the mobile 3G network coverage, developing the broadband business and undertaking IT projects.
Year ended December 31, 2008
Our capital expenditures increased 4.7% to €8,401 million in 2008 compared to €8,027 million in 2007, mainly as a result of investments made to support the growth in Telefónica Latin Americas broadband and pay TV businesses and to further develop ADSL and adapt existing loops to FTTx (fiber optic) technology in order to enhance coverage for new services in Spain and expand the coverage and capacity of our mobile networks in all regions.
Financial Investments and Divestitures
Our principal financial investments in 2010 relate to the acquisition of 50% of Brasilcel (approximately €7,500 million), the acquisition of HanseNet (approximately €275 million) and the acquisition of a 22% stake in DTS (approximately €488 million). Our principal divesture in 2010 was the reduction of our stake in Portugal Telecom by 7.98%, resulting in cash inflow of €631 million, though we retained a certain amount of economic exposure to fluctuations in the value of Portugal Telecom’s shares through the use of derivative instruments.
Our principal financial investment in 2009 was the acquisition of an additional stake in China Unicom (Hong Kong) Limited (“China Unicom”) (approximately $1,000 million as a consequence of a mutual share exchange). Our principal divestiture in 2009 was the sale of Medi Telecom (€400 million) as described above.
Our principal financial investments in 2008 were made by Inversiones Telefónica Internacional Holding, Ltda., which invested €640 million for the acquisition of the additional 51.85% of Telefónica Chile, S.A., or Telefónica Chile, and Vivo, which invested Brazilian reais 1,163 million (equivalent to approximately €429 million at the transaction date) for the acquisition of 53.90% of the voting stock and 4.27% of the preferred stock of Telemig Celular Participaçoes, S.A.
Public Takeover Offers
The principal public takeover offers which occurred in 2010 and in 2011 through the date of this Annual Report were the following:
|
|
·
|
On July 28, 2010, Telefónica and Portugal Telecom signed an agreement for the acquisition by Telefónica of 50% of the capital stock of Brasilcel (a company then jointly owned by Telefónica and Portugal Telecom, which owned shares representing approximately 60% of the capital stock of Vivo (the “Brasilcel Acquisition Agreement”). The acquisition price for the aforementioned capital stock of Brasilcel was €7,500 million, of which €4,500 million was paid at the closing of the transaction on September 27, 2010, €1,000 million on December 30, 2010, with the remaining €2,000 million due October 31, 2011 (though Portugal Telecom may request for this last payment to be made on July 29, 2011, in which case the price of the acquisition and the final payment would be reduced by €25 million).
|
|
|
·
|
On December 21, 2010, the merger between Telefónica and Brasilcel was registered in the Madrid Mercantile Register, with the company becoming a direct shareholder of the Brazilian consolidated group Vivo, by virtue of its ownership of approximately 60% of Vivo Participaçoes’s capital stock.
|
Pursuant to Brazilian legislation, on October 26, 2010, Telefónica announced a tender offer for the acquisition of all outstanding voting shares of Vivo not already owned or controlled by Telefónica, representing approximately 3.8% of Vivo Participaçoes’s capital stock, for an amount equivalent to 80% of the price per share to be paid to Portugal Telecom pursuant to the Brasilcel Acquisition Agreement, subject to regulatory approval. This offer was approved by the Brazilian market regulator (C.V.M.) on February 11, 2011 and completed on March 18, 2011.
Recent Developments
The principal events that have occurred since December 31, 2010 are set forth below:
|
|
·
|
On January 23, 2011, Telefónica and China Unicom signed an extension to their strategic alliance agreement, pursuant to which both companies agreed to strengthen and deepen their strategic cooperation in certain business areas, and committed to investing the equivalent of $500 million in ordinary shares of the other party toward the alliance. Telefónica will acquire, through its subsidiary Telefónica Internacional, S.A.U, a number of China Unicom shares amounting to $500 million from third parties, within nine months of the date of the agreement.
|
Following the completion of the transaction, Telefónica will hold, through its subsidiary Telefónica Internacional, S.A.U., approximately 9.7% of China Unicom’s voting share capital. Telefonica is in the process of making the required investment in China Unicom and its final ownership percentage of
China Unicom's voting capital after such investment may vary from the foregoing as it will depend upon the prevailing share prices at which the investment is made. In recognition of China Unicom’s stake in Telefónica, Telefónica has committed to proposing the appointment of a board member to be selected by China Unicom at our next General Shareholders’ Meeting, in accordance with applicable legislation and our bylaws.
China Unicom completed its acquisition of Telefónica shares on January 28, 2011, resulting in its ownership of 1.37% of our capital. For information related to this acquisition, see “Item 5. Operating and Financial Review and Prospects —Business Overview—Strategic Partnership”, “Item 5. Operating and Financial Review and Prospects – Significant Factors Affecting the Comparability of our Results of Operations in the Periods Under Review.” and Note 24 to our consolidated financial statements.
|
|
·
|
On February 11, 2011, the Brazilian market regulator (C.V.M.) approved the tender offer made by Telefónica, S.A. to holders of all outstanding voting shares of Vivo Participaçoes not already held or controlled by Telefónica. For information related to this tender offer, see “Item 5. Operating and Financial Review and Prospects – Significant Factors Affecting the Comparability of our Results of Operations in the Periods Under Review.”
|
|
|
·
|
On February 24, 2011, we announced that we are considering a possible divestiture of our subsidiary, Atento Inversiones y Teleservicios, S.A.U., contemplating, among other alternatives, a potential public offering of shares of that company.
|
|
|
·
|
On March 25, 2011, the Board of Directors of each of our controlled subsidiaries, Vivo Participações and Telecomunicações de São Paulo, S.A.—Telesp (“Telesp”), respectively, approved the terms and conditions of a restructuring whereby all shares of Vivo Participações that Telesp does not own will merge into Telesp in exchange for Telesp shares, converting Vivo Participações into a wholly-owned subsidiary of Telesp (the “Restructuring”). The Restructuring was approved by shareholders of Vivo Participações at an Extraordinary General Shareholders’ Meeting held on April 27, 2011 and by shareholders of Telesp at an Extraordinary General Shareholders’ Meeting held on that same date.
|
|
|
·
|
On March 30, 2011, we announced that the Brazilian market regulator (C.V.M) authorized the termination of Telefónica’s BDRs Program in Brazil and the subsequent delisting of Telefónica shares from the São Paulo stock exchange. The termination and delisting process started on March 30, 2011 and it is expected to conclude in the second half of 2011.
|
|
|
·
|
On April 12, 2011, our Board of Directors resolved to call Telefónica’s 2011 General Shareholders’ Meeting to be held on May 17, on first call, or on May 18, 2011 on second call. The main items included in the agenda of this meeting are the following:
|
|
|
-
|
Examination and approval, if applicable, of the Individual Annual Accounts, the Consolidated Annual Accounts and the Management Report of Telefónica, and of its consolidated group of companies, as well as of the proposed allocation of the profits/losses of Telefónica, S.A. and the management of its Board of Directors, all with respect to Fiscal Year 2010.
|
|
|
-
|
Compensation of shareholders: Distribution of dividends to be charged to Unrestricted Reserves.
|
|
|
-
|
Amendment of the By-Laws principally for adjustments related to the latest legislative developments.
|
|
|
-
|
Amendment of the Regulations for the General Shareholders' Meeting principally for adjustments related to the latest legislative developments.
|
|
|
-
|
Re-election, appointment and ratification, as applicable, of the following Directors: Mr. Isidro Fainé Casas, Mr. Vitalino Manuel Nafría Aznar, Mr. Julio Linares López, Mr. David Arculus, Mr. Carlos Colomer Casellas, Mr. Peter Erskine, Mr. Alfonso Ferrari Herrero, Mr. Antonio Massanell Lavilla, and Mr. Chang Xiaobing. (Determination of the number of Directors)
|
|
|
-
|
Authorization to increase the share capital pursuant to the terms and conditions of Section 297.1.b) of the Companies Act, over a maximum period of five years, delegating the power to exclude pre-emptive rights pursuant to Section 506 of the Companies Act.
|
|
|
-
|
Long-term share incentive plans including: (i) approval of a long-term incentive plan aimed at members of the executive team of the Telefónica Group (including executive Directors); (ii) restricted share plan aimed at employees and executive personnel; (iii) global incentive share purchase plan for the employees of the Telefónica Group.
|
For information related to our significant financing transactions completed in 2010 and through the date of this Annual Report, see “Item 5. Operating and Financial Review and Prospects – Liquidity and Capital Resources – Anticipated Sources of Liquidity.”
We increased our customer base, measured in terms of total accesses, by 8.7% to 287.6 million accesses at December 31, 2010 from 264.6 million accesses at December 31, 2009, which was a 2.1% increase from the 259.1 million accesses we had at December 31, 2008. This growth from December 31, 2009 to December 31, 2010 was primarily driven by an 8.9% increase in mobile accesses, a 27.0% increase in broadband accesses and a 12.0% increase in pay TV accesses. Growth in our total number of accesses from December 31, 2008 to December 31, 2009 was primarily driven by growth in mobile accesses, broadband accesses and pay TV accesses.
The following table shows our total accesses at the dates indicated. The classifications and explanatory notes below also apply, to the extent applicable, to the tables detailing our accesses by business area and country elsewhere in this section.
|
At December 31,
|
||||||||||||
|
2008
|
2009
|
2010
|
||||||||||
|
(in thousands)
|
||||||||||||
|
Fixed telephony accesses(1)
|
42,930.8 | 40,606.0 | 41,355.7 | |||||||||
|
Internet and data accesses
|
14,654.3 | 15,082.5 | 18,611.4 | |||||||||
|
Narrowband accesses
|
1,997.2 | 1,427.5 | 1,314.1 | |||||||||
|
Broadband accesses(2)
|
12,472.1 | 13,492.6 | 17,129.6 | |||||||||
|
Other accesses(3)
|
185.0 | 162.4 | 167.8 | |||||||||
|
Mobile accesses(4)(5)
|
195,818.6 | 202,332.5 | 220,240.5 | |||||||||
|
Pay TV accesses
|
2,267.5 | 2,489.2 | 2,787.4 | |||||||||
|
Final clients accesses
|
255,671.1 | 260,510.2 | 282,994.9 | |||||||||
|
Unbundled local loop accesses
|
1,748.1 | 2,206.0 | 2,529.2 | |||||||||
|
Shared UL accesses
|
602.3 | 447.7 | 264.0 | |||||||||
|
Full UL accesses
|
1,145.8 | 1,758.3 | 2,265.3 | |||||||||
|
Wholesale ADSL accesses(6)
|
534.7 | 463.4 | 687.4 | |||||||||
|
Other accesses(7)
|
1,150.1 | 1,426.0 | 1,420.7 | |||||||||
|
Wholesale accesses
|
3,433.0 | 4,095.3 | 4,637.4 | |||||||||
|
Total accesses
|
259,104.1 | 264,605.5 | 287,632.3 | |||||||||
|
(1)
|
PSTN (including public use telephony) x1; ISDN basic access x1; ISDN primary access; 2/6 access x30. Includes our accesses for internal use. It also includes VoIP and naked ADSL accesses.
|
|
(2)
|
Includes ADSL, satellite, fiber optic, cable modem and broadband circuits and naked ADSL accesses.
|
|
(3)
|
Includes remaining non-broadband final client circuits.
|
|
(4)
|
Includes accesses of Telemig. Medi Telecom accesses are excluded at December 31,
2009.
|
|
(5)
|
In 2009 in order to align the criteria for the key performance indicators of our mobile operations, the definition of mobile accesses (and, therefore, of total accesses) was revised to include machine-to-machine accesses. In addition, we revised
the accounting criteria for pre-pay mobile accesses at Telefónica O2 Czech Republic and Telefónica O2 Slovakia to conform to the accounting criteria for pre-pay mobile
|
accesses throughout the Group. In order to count a pre-pay mobile access, such access must have been active in the most recent three months prior to counting. As a result of both revisions, we restated 2008 mobile accesses, adding 0.2 million accesses in the aggregate.
|
(6)
|
Includes unbundled lines by Telefónica O2 Germany.
|
|
(7)
|
Includes circuits for other operators
.
|
Our Services and Products
Fixed business
The principal services we offer in our fixed businesses in Spain, Europe and Latin America are:
|
|
·
|
Traditional fixed telecommunication services
. Our principal traditional fixed telecommunication services include PSTN lines; ISDN accesses; public telephone services; local, domestic and international long distance and fixed-to-mobile communications services; corporate communications services; supplementary value-added services (including call waiting, call forwarding, voice and text messaging, advanced voicemail services and conference-call facilities); video telephony; business-oriented value-added services; intelligent network services; leasing and sale of handset equipment; and telephony information services.
|
|
|
·
|
Internet and broadband multimedia services
. Our principal Internet and broadband multimedia services include Internet service provider service; portal and network services; retail and wholesale broadband access through ADSL; naked ADSL ( broadband connection without the monthly fixed line fee); narrowband switched access to Internet for universal service, and other technologies; residential-oriented value-added services (including instant messaging, concerts and video clips by streaming video, e-learning, parental control, firewall protection, anti-virus protection, content delivery and personal computer sales); television services such as
Imagenio
, our IPTV business, cable television and satellite television; companies-oriented value-added services, like
puesto integral o puesto informático
, which includes ADSL, computer and maintenance for a fixed price and VoIP services. Also, in some regions, (Spain and Brazil) we are providing services based on Fiber to the Home (FTTH), including a new range of products and services. This line of products includes high speed Internet access (currently up to 30 Mb), which allows Telefónica Spain to provide its customers with advanced IPTV services, such as high definition channels (HDTV), and in Spain, Multiroom (allowing clients to watch different TV channels in different rooms) and Digital Video Recording (DVR).
|
|
|
·
|
Data and business-solutions services
. Our data and business-solutions services principally include leased lines; virtual private network, or VPN, services; fiber optics services; the provision of hosting and application, or ASP, service, including web hosting, managed hosting, content delivery and application, and security services; outsourcing and consultancy services, including network management, or CGP; and desktop services and system integration and professional services.
|
|
|
·
|
Wholesale services for telecommunication operators.
Our wholesale services for telecommunication operators principally include domestic interconnection services; international wholesale services; leased lines for other operators’ network deployment; and local loop leasing under the unbundled local loop regulation framework. It also includes bit stream services, bit stream naked, wholesale line rental accesses and leased ducts for other operators’ fiber deployment.
|
Mobile business
We offer a wide variety of mobile and related services and products to personal and business customers. Although the services and products available vary from country to country, the following are our principal services and products:
|
|
·
|
Mobile voice services
. Our principal service in all of our markets is mobile voice telephony.
|
|
|
·
|
Value added services
. Customers in most of our markets have access to a range of enhanced mobile calling features, including voice mail, call hold, call waiting, call forwarding and three-way calling.
|
|
|
·
|
Mobile data and Internet services
. Current data services offered include Short Messaging Services, or SMS, and Multimedia Messaging Services, or MMS, which allow customers to send messages with images, photographs and sounds. Customers may also receive selected information, such as news, sports scores and stock quotes. We also provide mobile broadband connectivity and Internet access. Through mobile broadband and Internet access, our customers are able to send and receive e-mail, browse the Internet, download contents (like games), purchase goods and services in m-commerce transactions and use our other data services.
|
|
|
·
|
Wholesale services
. We have signed network usage agreements with several MVNOs in different countries.
|
|
|
·
|
Corporate services
. We provide business solutions, including mobile infrastructure in offices, private networking and portals for corporate customers that provide flexible on line billing.
|
|
|
·
|
Roaming
. We have roaming agreements that allow our customers to use their mobile handsets when they are outside of our service territories, including on an international basis.
|
|
|
·
|
Fixed wireless
. We provide fixed voice telephony services through mobile networks in Venezuela, Argentina, Peru, Mexico, Ecuador, El Salvador, Guatemala and Nicaragua.
|
|
|
·
|
Trunking and paging
. In Spain and Guatemala, we provide digital mobile services for closed user groups of clients and paging services.
|
The following sections provide a description of the main markets in which we operate. Customer information on the markets in which we operate, including our market share based on accesses, are estimates that we have made based on annual reports and press releases made public by our competitors or information from local regulators in the respective markets.
Telefónica Spain Operations
Telefónica Spain provides fixed and mobile telephony services in Spain.
Telefónica Spain’s total accesses increased by 1.7% to 47.6 million accesses at December 31, 2010 from 46.8 million accesses at December 31, 2009. Total accesses at December 31, 2010 included 24.3 million mobile accesses, 13.3 million fixed telephony accesses, 5.9 million Internet and data accesses and 0.8 million pay TV accesses. Additionally, it included 2.5 million unbundled local loop accesses and 0.6 million of wholesale ADSL accesses.
The following table presents, at the dates indicated, selected statistical data relating to our operations in Spain.
|
At December 31,
|
||||||||||||
|
2008
|
2009
|
2010
|
||||||||||
|
(in thousands)
|
||||||||||||
|
Fixed telephony accesses
|
15,326.3 | 14,200.1 | 13,279.7 | |||||||||
|
Internet and data accesses
|
5,670.0 | 5,722.5 | 5,879.8 | |||||||||
|
Narrowband accesses
|
388.0 | 219.5 | 136.1 | |||||||||
|
Broadband accesses
|
5,246.4 | 5,476.8 | 5,722.3 | |||||||||
|
Other accesses
|
35.6 | 26.2 | 21.4 | |||||||||
|
Mobile accesses
|
23,604.8 | 23,538.6 | 24,309.6 | |||||||||
|
Pre-pay accesses
|
9,037.0 | 8,204.5 | 7,919.8 | |||||||||
|
Pay TV accesses
|
612.5 | 703.0 | 788.2 | |||||||||
|
Final clients accesses
|
45,213.6 | 44,164.2 | 44,257.4 | |||||||||
|
Wholesale accesses
|
2,136.1 | 2,614.0 | 3,333.8 | |||||||||
|
Total accesses
|
47,349.7 | 46,778.2 | 47,591.2 | |||||||||
Telefónica Spain - Fixed business
Telefónica Spain provides fixed telephony services in Spain.
Operations
The following table presents, at the dates indicated, selected statistical data relating to the operations of Telefónica Spain’s fixed business:
|
At December 31,
|
||||||||||||
|
2008
|
2009
|
2010
|
||||||||||
|
(in thousands)
|
||||||||||||
|
Fixed telephony accesses
|
15,326.3 | 14,200.1 | 13,279.7 | |||||||||
|
Internet and data accesses
|
5,670.0 | 5,722.5 | 5,879.8 | |||||||||
|
Narrowband accesses
|
388.0 | 219.5 | 136.1 | |||||||||
|
Broadband accesses
|
5,246.4 | 5,476.8 | 5,722.3 | |||||||||
|
Other accesses
|
35.6 | 26.2 | 21.4 | |||||||||
|
Pay TV accesses
|
612.5 | 703.0 | 788.2 | |||||||||
|
Final clients accesses
|
21,608.8 | 20,625.6 | 19,947.8 | |||||||||
|
Wholesale line rental accesses
|
9.5 | 97.4 | 294.5 | |||||||||
|
Unbundled local loop accesses
|
1,698.0 | 2,153.8 | 2,477.1 | |||||||||
|
Shared UL accesses
|
602.3 | 447.7 | 264.0 | |||||||||
|
Full UL accesses
|
1,095.7 | 1,706.1 | 2,213.1 | |||||||||
|
Wholesale ADSL accesses
|
423.8 | 359.0 | 561.3 | |||||||||
|
Other accesses
|
4.7 | 3.7 | 0.9 | |||||||||
|
Wholesale accesses
|
2,136.1 | 2,614.0 | 3,333.8 | |||||||||
|
Total accesses
|
23,744.8 | 23,239.6 | 23,281.6 | |||||||||
Telefónica Spain’s fixed telephony accesses decreased by 6.5% to 13.3 million accesses at December 31, 2010, from 14.2 million accesses at December 31, 2009. Telefónica Spain had net fixed telephony accesses losses of 0.9 million in 2010, lower than the 1.1 million net fixed telephony accesses losses recorded in 2009.
Telefónica Spain’s broadband accesses increased 4.5% to 5.7 million at December 31, 2010 from 5.5 million accesses at December 31, 2009.
Unbundled local loops at December 31, 2010 amounted to 2.5 million accesses, of which nearly 10.7% were shared access loops, while the remainder were full unbundled loops (including 602 thousand naked shared loops). Decreasing growth rates in 2010 contributed to fewer net additions for the full year (323 thousand loops), 29.1% below net additions in 2009. Shared loops decreased by 184 thousand accesses in 2010, while full unbundled loops increased by 507 thousand.
Telefónica Spain’s total wholesale ADSL accesses were 0.6 million accesses at December 31, 2010, an increase of 56.4% compared to the accesses at December 31, 2009, mainly due to new modalities and price reductions.
In 2010, Telefónica Spain continued to increase its presence in the pay TV market, achieving a customer base of 0.8 million accesses at December 31, 2010, up from 0.7 million accesses at December 31, 2009, an increase of 12.1%.
Since 2005 Telefónica Spain has bundled its ADSL services with other products in Duo bundles, which include voice services, and Trio bundles, which include voice and IPTV services. At December 31, 2010, approximately 89% of Telefónica Spain’s broadband accesses were included in Duo or Trio bundles compared to 88% at December 31, 2009.
Sales and marketing
One of our main priorities has been to satisfy customer needs and increase customer loyalty by improving the quality of our customer service and offering a wide range of integrated telecommunications services. We have reinforced our strategy of customer segmentation in order to tailor our services to best meet the specific needs of each customer segment.
In 2010, we rebranded in connection with our customer-focused strategy. In May 2010, Movistar was launched as the sole trademark for all residential and business customers, in order to foster emotional connections with customers.
In order to boost the value of its services, in June 2010 Telefónica Spain added to its broadband bundles the option for free fixed-to-mobile calls for customers on weekends.
In addition, on October 1, 2010 a new type of broadband access called “
hasta 6Mb
” was launched. This allows each customer to enjoy increased network speed.
In addition to these measures aimed at improving the products and services offered to broadband customers, ADSL speeds are being increased without concurrent price increases.
We also implemented a local strategy involving different offers adapted to local conditions in each area. Pursuant to this strategy, we focus on areas where competition is particularly high, creating comprehensive plans and outstanding commercial processes such as the establishment of a Convergent Customer Service Centre.
The value of fixed lines was also enhanced by redesigning our fixed line catalogue and launching new types of contracts for fixed line customers that offer more favorably priced packages for access plus calls, which addresses basic domestic communication needs (“
Contrato Básico Hogar”
, “
Planazo Hogar a Fijos y Móviles”
).
In the business segment, we continued to promote our Puesto de Trabajo services, which is a package of services designed to meet the voice (fixed and/or mobile), data and IT needs of self-employed, and small- and medium-sized businesses. During 2010 we advanced this initiative with the roll out of Aplicateca services, focusing mainly on management, localization, security and office automation software.
The customer service model employed by Telefónica Spain, which is focused on achieving the highest degree of efficiency in customer service, has the following features:
|
|
·
|
a 24-hour personal customer service line for purchasing any type of product and service and handling customer queries;
|
|
|
·
|
Telefónica stores
(
Tiendas Telefónica
), where customers can test and buy the products we market, the highlight of which is our flagship store at the historic Telefónica headquarters building on the Gran Vía (Madrid), which is the largest telecommunications store in Spain. We also continue to work to improve our stores, equipping them with the resources to meet the needs of residential and business customers. Special attention has been given to the Telyco stores to improve the customer experience;
|
|
|
·
|
the Telefónica On Line Store, accessible by Internet (
www.telefonica.es
), which offers customers clear and accessible information regarding the services and products we offer and the ability to purchase these services and products online, as well as manage their accounts and access their bills, easily and securely;
|
|
|
·
|
a dedicated customer service system for corporate and residential customers, to ensure each customer’s particular needs are met. The technical service centers also help customers resolve possible service problems, and offer enhanced service to customers via specialized and highly-skilled staff.
|
Competition
Telefónica Spain’s principal competitors in the fixed telephony market fall within three main categories:
|
|
·
|
cable operators, such as Spanish nationwide cable operator ONO, which offers bundles of voice, broadband and pay TV services triple play, and regional cable operators (Euskaltel, Telecable and Grupo R);
|
|
|
·
|
ULL operators, such as Orange, Jazztel and Vodafone; and
|
|
|
·
|
large-business oriented operators, such as British Telecom and Colt, which offer voice and data virtual private networks (VPNs).
|
Telefónica Spain’s estimated market share at December 31, 2010 was as follows:
|
|
·
|
fixed telephony accesses market share amounted to approximately 69% of retail accesses;
|
|
|
·
|
broadband market share amounted to approximately 53% of retail accesses; and
|
|
|
·
|
pay TV market share amounted to approximately 19% of the market in terms of accesses.
|
In November 2008, the CMT approved “Wholesale Access for Telephone Lines,” or AMLT, a new product that allows operators to resell telephone lines to their final customers. After more than two years on the market, this service has been consolidated and continues to grow and function correctly, both at systems and operational level.
Network and technology
Telefónica Spain continued to further
develop the fixed broadband business with a selective roll-out of fiber optics, Imagenio and data services for large corporate customers
, as well as improvements in capacity and security of its aggregation, transport and data network.
Telefónica Spain - Mobile business (Spain)
Telefónica Spain provides mobile services in Spain.
Operations
The estimated penetration of the Spanish mobile market reached 125% at December 2010. The Spanish mobile market showed growth primarily as a result of the growth of data services.
The following table presents, at the dates or for the periods indicated, selected statistical data relating to Telefónica Spain’s mobile business.
|
At or for the year ended December 31,
|
||||||||||||
|
2008
|
2009
|
2010
|
||||||||||
|
Total mobile accesses (in thousands)
|
23,604.8 | 23,538.6 | 24,309.6 | |||||||||
|
Pre-pay accesses (in thousands)
|
9,037.0 | 8,204.5 | 7,919.8 | |||||||||
|
MOU (minutes)
|
156 |
n.a.
|
n.a.
|
|||||||||
|
Traffic (millions of minutes)
|
43,568 | 42,039 | 41,700 | |||||||||
|
ARPU (in euros)
|
30.4 | 27.5 | 25.4 | |||||||||
Our mobile customer base in Spain, measured in terms of accesses, stood at 24.3 million accesses at December 31, 2010, an increase of 3.3% from 23.5 million at December 31, 2009. This evolution was primarily driven by a 6.9% increase in accesses in the contract segment, which offset the decrease of 3.5% in the prepaid segment. In May 2010 we disconnected 113 thousand prepaid accesses from our customer base, without a significant impact on our economic results.
In the context of an increasingly competitive market, with strong competition in number portability and pressure on pricing, Telefónica Móviles España continues to maintain its leadership in difference between revenue and access share, due to its strong focus on high value customers. Telefónica Spain’s mobile business achieved net adds of 771 thousand accesses in 2010, compared to negative net adds of 66 thousand accesses in 2009, with a noteworthy number of net accesses gains in the contract segment: 1.1 million accesses in 2010, up from 0.8 million in 2009.
At December 31, 2010, approximately 67.4% of our mobile accesses in Spain were contract, which represents an increase of 2.3 percentage points from December 31, 2009.
ARPU for Telefónica Spain’s mobile business decreased 7.3% to €25.4 in 2010 from €27.5 in 2009, primarily due to by mobile termination rate cuts (-19.2% year-on-year following the cuts implemented in October and April 2010), lower usage by customers in the current environment and increased price-oriented competition, offsetting higher contribution from connectivity revenue.
Traffic for 2010 decreased 0.8% to 41,700 million minutes compared to 42,039 million minutes in 2009 mainly due to lower voice usage.
Sales and marketing
Telefónica Spain is focused on key initiatives to preserve its position as a leading mobile operator in the market, leading it to increase commercial efforts with measures including:
|
|
·
|
in-depth market segmentation, with a focus on customer value;
|
|
|
·
|
programs to promote customer loyalty;
|
|
|
·
|
pricing policies to stimulate usage, including launching segmented packages and innovative tariff options; and
|
|
|
·
|
a focus on the latest market trends involving mobile Internet access, either from devices used to make voice calls or from devices that complement fixed broadband and enable large amounts of data to be downloaded on the move.
|
Since Telefónica Spain began providing mobile services in Spain, its sales and marketing strategy has focused on generating increased brand awareness and customer satisfaction to achieve customer growth. Telefónica Spain utilizes several types of marketing channels, including television, radio, exterior billboards, telemarketing, direct mail and Internet advertising. Telefónica Spain also sponsors several cultural and sporting events in order to increase its brand recognition.
During 2010 Telefónica Spain’s main marketing campaigns focused on boosting demand for mobile broadband, with the launch of data flat rates for browsing the web using a smartphone or mobile internet to access (content, music, television, etc) as well as browsing the web using a laptop or mobile conectivity device, developing new concepts such as “try and buy”. In addition, Telefónica Spain offers access to mobile broadband services with HSPA technology. These favorable data rates and mobile broadband capable devices have been bundled by Telefónica Spain in order to promote an increase in the number of accesses and level of use of mobile broadband services in Spain. In order to help achieve this goal:
|
|
·
|
In 2010, Telefónica Spain launched complementary mobile and fixed broadband services at very competitive prices.
|
|
|
·
|
In 2010, Telefónica Spain advanced its portfolio of data tariffs for the residential segment, launching tariffs that address technology needs such as multi-device flat-rate data plans enabling users to browse with tablets and smartphones at no extra cost, and new tranches to existing plans that better meet customer needs. The main innovations in our mobile voice portfolio for corporate customers have focused on increasing voice time allotments. We have also initiated plans to bundle mobile voice and data, which offers single-contract advantages.
|
Competition
Telefónica Spain’s main competitors in the Spanish market for mobile communications service are: Vodafone España, a subsidiary of Vodafone plc, Orange, which is the trade name of France Telecom España S.A., Yoigo, whose principal shareholder is TeliaSonera, and other MVNO operators.
Telefónica Spain’s estimated market share in Spain in terms of mobile accesses was approximately 41.4% at December 31, 2010.
Network and technology
Telefónica Spain’s digital network in Spain is based upon the GSM/UMTS standard. The prevalence of the GSM standard, together with Telefónica Spain’s international roaming agreements, enable its mobile customers to make and receive calls in more than 200 countries worldwide. Telefónica Spain’s GSM/UMTS based network provides its customers with access to many of the most advanced mobile handsets and a full range of services and products.
In 2010, Telefónica Spain invested in and expanding mobile third generation, or 3G, in Spain and developing its technological platforms and information systems.
Telefónica Europe
Telefónica Europe’s principal activities are the provision of fixed and mobile telephony services, Internet and data services in the United Kingdom, Germany and the Czech Republic, Internet, data and mobile telecommunications services in Ireland, mobile telecommunications services in Slovakia and pay TV services in Czech Republic and Germany.
The following table presents, at the dates indicated, selected statistical data relating to our operations in Europe.
|
At December 31,
|
||||||||||||
|
2008
|
2009
|
2010
|
||||||||||
|
(in thousands)
|
||||||||||||
|
Fixed telephony accesses
|
1,952.7 | 1,827.5 | 3,672.4 | |||||||||
|
Internet and data accesses
|
1,354.5 | 1,754.7 | 4,496.4 | |||||||||
|
Narrowband accesses
|
163.4 | 137.3 | 503.2 | |||||||||
|
Broadband accesses
|
1,158.7 | 1,589.1 | 3,964.9 | |||||||||
|
Other accesses
|
32.4 | 28.3 | 28.3 | |||||||||
|
Mobile accesses
|
41,401.8 | 44,095.0 | 46,675.5 | |||||||||
|
Pay TV accesses
|
114.5 | 137.6 | 206.4 | |||||||||
|
Final clients accesses
|
44,823.5 | 47,814.9 | 55,050.6 | |||||||||
|
Wholesale accesses
|
1,237.9 | 1,425.2 | 1,247.7 | |||||||||
|
Total accesses
|
46,061.4 | 49,240.1 | 56,298.3 | |||||||||
Telefónica Europe’s total accesses increased 14.3% to 56.3 million accesses at December 31, 2010 from 49.2 million accesses at December 31, 2009. This increase was mainly driven by the inclusion of accesses from HanseNet into Telefónica Europe’s accesses during 2010. Total accesses at December 31, 2010 included 46.7 million mobile accesses, 3.7 million fixed telephony accesses, 4.5 million Internet and data accesses and 0.2 million pay TV accesses. Additionally, it included 1.2 million ADSL wholesale accesses.
United Kingdom – Telefónica O2 UK
Operations
The following tables present, at the dates or for the periods indicated, selected statistical data relating to our operations in the United Kingdom.
|
At December 31,
|
||||||||||||
|
2008
|
2009
|
2010
|
||||||||||
|
(in thousands)
|
||||||||||||
|
Internet and data accesses
|
340.9 | 591.5 | 671.6 | |||||||||
|
Broadband accesses
|
340.9 | 591.5 | 671.6 | |||||||||
|
Mobile accesses
|
20,274.7 | 21,299.3 | 22,211.5 | |||||||||
|
Pre-pay accesses
|
11,862.5 | 11,740.3 | 11,712.3 | |||||||||
|
Final clients accesses
|
20,615.6 | 21,890.8 | 22,883.1 | |||||||||
|
Total accesses
|
20,615.6 | 21,890.8 | 22,883.1 | |||||||||
|
Year ended December 31,
|
||||||||||||
|
2008
|
2009
|
2010
|
||||||||||
|
MOU (minutes)
|
207 |
n.a.
|
n.a
|
|||||||||
|
Traffic (millions of minutes)
|
46,585 | 53,856 | 58,143 | |||||||||
|
ARPU (in euros)
|
29.0 | 24.7 | 25.1 | |||||||||
The estimated mobile penetration rate in the United Kingdom was approximately 133% at December 31, 2010, compared to approximately 126% at December 31, 2009.
Total accesses for Telefónica O2 UK, Telefónica Europe’s operating company in the United Kingdom, increased 4.5% to 22.9 million accesses at December 31, 2010 compared to 21.9 million accesses at December 31, 2009 (excluding the Tesco mobile customer base, which is the result of a joint venture in which Telefónica O2 UK holds a 50% stake and whose customers use the Telefónica O2 UK network). Telefónica O2 UK, had net adds of 0.9
million accesses in 2010, 11% less than its net additions in 2009.
Telefónica O2 UK added 0.9 million mobile contract accesses in 2010, bringing the total at December 31, 2010 to 10.5 million mobile contract accesses, an increase of 9.8% from December 31, 2009. Pre-pay mobile accesses decreased from 11.74 million accesses at December 31, 2009 to 11.71 million accesses at December 31, 2010. At December 31, 2010 mobile contract accesses made up 47.3% of Telefónica O2 UK’s mobile customer base, compared to 44.9% at December 31, 2009. At December 31, 2010 Telefónica O2 UK had 0.7 million broadband accesses compared to 0.6 million broadband accesses at December 31, 2009.
ARPU was €25.1 in 2010 up from €24.7 in 2009 (a decrease of 2.1% in local currency). The decrease in local currency ARPU was caused by the impact of lower mobile termination rates, or MTRs, which was partially offset by the increased demand for data from smartphone users. Traffic in 2010 increased 8% to 58,143 million minutes compared to 53,856 million minutes in 2009.
Sales and marketing
In the United Kingdom, we use a broad range of marketing channels, including television, radio, billboards, telemarketing, direct mail, internet advertising and sponsorship to market Telefónica O2 UK’s products and services.
In 2010, Telefónica O2 UK continued its focus on high-value customers across various segments and offered a wide range of smartphones such as the iPhone 4 and a range of android devices, in addition to mobile broadband, representing one of the key drivers of revenue growth in 2010.
Competition
Telefónica O2 UK’s estimated market share was approximately 26.6% at December 31, 2010 compared with approximately 26.2% at December 31, 2009, based on the number of mobile accesses.
In addition to Telefónica O2 UK, other significant network operators in the UK mobile telecommunications market are: Vodafone UK, a subsidiary of Vodafone plc, Everything Everywhere, a joint venture between Deutsche Telecom AG and France Telecom, and 3, owned by Hutchison Whampoa. MVNOs operating in the UK market include Virgin Mobile and Talk-Talk, owned by Virgin Media and The Carphone Warehouse Group respectively, which respectively use the T-Mobile UK and Vodafone network, and Tesco Mobile, a
joint venture
in which Telefónica O2 UK holds a 50% stake, and which uses the Telefónica O2 UK network.
Since December 31, 2009, Telefónica O2 UK also provides the network infrastructure for LycaMobile, a mobile virtual network operator (MVNO) who competes with us and pays Telefónica O2 UK to use its network.
Network and technology
Telefónica O2 UK’s digital network in the United Kingdom is based upon the GSM/UMTS standard. The prevalence of the GSM standard, together with Telefónica O2 UK’s international roaming agreements, enables Telefónica O2 UK’s customers to make and receive calls in more than 200 countries worldwide.
Germany – Telefónica O2 Germany
Operations
The following tables present, at the dates or for the periods indicated, selected statistical data relating to our operations in Germany (2010 data includes HanseNet figures).
|
At December 31,
|
||||||||||||
|
2008
|
2009
|
2010
|
||||||||||
|
(in thousands)
|
||||||||||||
|
Fixed telephony accesses
|
— | — | 1,916.4 | |||||||||
|
Internet and data accesses
|
214.8 | 285.1 | 2,914.7 | |||||||||
|
Narrowband accesses
|
— | — | 385.7 | |||||||||
|
Broadband accesses
|
214.8 | 285.1 | 2,529.1 | |||||||||
|
Mobile accesses
|
14,198.5 | 15,507.4 | 17,049.2 | |||||||||
|
Pre-pay accesses
|
7,231.5 | 7,807.0 | 8,795.2 | |||||||||
|
Pay TV accesses
|
— | — | 77.2 | |||||||||
|
Final clients accesses
|
14,413.3 | 15,792.5 | 21,957.5 | |||||||||
|
Wholesale accesses
|
1,128.4 | 1,316.8 | 1,116.5 | |||||||||
|
Total accesses
|
15,541.7 | 17,109.3 | 23,074.0 | |||||||||
|
Year ended December 31,
|
||||||||||||
|
2008
|
2009
|
2010
|
||||||||||
|
MOU (minutes)
|
138 |
n.a.
|
n.a. | |||||||||
|
Traffic (millions of minutes)
|
22,313 | 23,257 | 25,543 | |||||||||
|
ARPU (in euros)
|
17.4 | 15.6 | 14.8 | |||||||||
The estimated mobile penetration rate in Germany was approximately 131% at December 31, 2010, compared to approximately 132% at December 31, 2009.
The total customer base of Telefónica O2 Germany, Telefónica Europe’s operating company in Germany, increased by 6.0 million accesses from December 31, 2009 to 23.1 million accesses at December 31, 2010, due primarily to our acquisition of HanseNet.
Telefónica O2 Germany had net adds of 0.6 million mobile contract accesses and 1.0 million mobile pre-pay accesses in 2010, bringing the contract and pre-pay customer base at December 31, 2010 to 8.3 million accesses and 8.8 million accesses respectively.
At December 31, 2010, Telefónica O2 Germany had a customer base of 2.5 million broadband accesses. Telefónica O2 Germany reported 1.1 million ULL lines at December 31, 2010, a decrease of 15.2% from 1.3 million ULL lines at December 31, 2009. The decrease in ULL lines was due to the absorption of former HanseNet lines.
During March 2010 and following the acquisition of HanseNet, Telefónica O2 Germany added 2.1 million broadband accesses, 1.8 million fixed telephony accesses, 0.4 million narrowband accesses and 0.1 million pay TV accesses to its portfolio.
Mobile ARPU continued to decline in 2010, decreasing 5.5% to €14.8 in 2010 from €15.6 in 2009, mainly as a result of an approximately 62% regulated cut in MTRs in the last two years, through December 2010. Traffic in 2010 increased 9.8% to 25,543 million minutes compared to 23,257 million minutes in 2009.
Sales and marketing
During 2010, Telefónica O2 Germany bolstered its commercial model with the introduction of the iPhone to its portfolio. In addition, Telefónica O2 Germany unveiled its O2 Blue tariff, specifically targeted at Smartphone users and providing simple and affordable tariffs for this growing segment of the market.
Competition
Telefónica O2 Germany’s estimated market share in Germany was approximately 15.7% at December 31, 2010 compared to approximately 14.6% at December 31, 2009, based on number of mobile accesses.
Telefónica O2 Germany competes primarily with three other companies in the German market for communication services. These are Vodafone Germany, which is owned by Vodafone plc. , T-Mobile, a subsidiary of Deutsche Telecom AG, and E-Plus, which is owned by KPN. Telefónica O2 Germany also competes with several MVNOs, Cable and DSL operators.
Telefónica O2 Germany purchased spectrum licenses in 2010 for approximately €1,379 million in connection with its efforts to provide next-generation mobile services.
Network and technology
Telefónica O2 Germany’s digital network in Germany is based upon the GSM/UMTS standard. The prevalence of the GSM standard, together with Telefónica O2 Germany’s international roaming agreements, enables Telefónica O2 Germany customers to make and receive calls in more than 200 countries worldwide.
Czech Republic and Slovakia – Telefónica O2 Czech Republic and Telefónica O2 Slovakia
Telefónica Europe provides fixed line, Internet and data accesses, pay TV, and mobile services in the Czech Republic and mobile services in Slovakia, where it launched operations during the first quarter of 2007.
Operations
The following tables present, at the dates or for the periods indicated, selected statistical data relating to our operations in the Czech Republic (data excludes Slovakia).
|
At December 31,
|
||||||||||||
|
2008
|
2009
|
2010
|
||||||||||
|
(in thousands)
|
||||||||||||
|
Fixed telephony accesses
|
1,893.4 | 1,770.6 | 1,669.2 | |||||||||
|
Internet and data accesses
|
779.5 | 848.7 | 898.8 | |||||||||
|
Narrowband accesses
|
163.4 | 137.6 | 117.5 | |||||||||
|
Broadband accesses
|
583.7 | 683.1 | 753.0 | |||||||||
|
Other accesses
|
32.4 | 28.3 | 28.3 | |||||||||
|
Mobile accesses
|
4,802.1 | 4,944.6 | 4,838.6 | |||||||||
|
Pre-pay accesses
|
2,282.8 | 2,130.2 | 1,975.0 | |||||||||
|
Pay TV accesses
|
114.5 | 137.6 | 129.2 | |||||||||
|
Final clients accesses
|
7,589.5 | 7,701.5 | 7,535.8 | |||||||||
|
Wholesale accesses
|
109.5 | 108.4 | 131.2 | |||||||||
|
Total accesses
|
7,698.9 | 7,810.0 | 7,667.0 | |||||||||
|
Year ended December 31,
|
||||||||||||
|
2008
|
2009
|
2010
|
||||||||||
|
MOU (minutes)
|
121 |
n.a.
|
n.a.
|
|||||||||
|
Traffic (millions of minutes)
|
7,420 | 8,232 | 8,790 | |||||||||
|
ARPU (in euros)
|
22.8 | 19.3 | 18.5 | |||||||||
The estimated mobile penetration rate in the Czech Republic based on registered customers was approximately 135% at December 31, 2010, compared to approximately 134% at December 31, 2009.
Fixed telephony accesses for Telefónica O2 Czech Republic, Telefónica Europe’s operating company in the Czech Republic, decreased by 5.7% to 1.7 million accesses at December 31, 2010 from 1.8 million accesses at December 31, 2009, mainly due to the challenging environment.
Telefónica O2 Czech Republic’s broadband accesses increased 10.2% compared to December 31, 2009 to 0.8 million accesses at December 31, 2010. These increases are primarily as a result of increased demand for accesses in the Czech Republic. Meanwhile, the pay TV customer base decreased 6.1% to 0.1 million accesses at December 31, 2010.
Telefónica O2 Czech Republic’s mobile accesses decreased 2.1% to 4.8 million accesses at December 31, 2010, from 4.9 million accesses at December 31, 2009. Contract mobile accesses accounted for 59.2% of these accesses at December 31, 2010, up from 56.9% at December 31, 2009. The number of pre-pay mobile accesses decreased 7.3%, to 2.0 million accesses at December 31, 2010, from 2.1 million accesses at December 31, 2009.
ARPU decreased to €18.5 in 2010 from €19.3 in 2009 (a reduction of 8.1% in local currency), primarily due to MTR cuts and reduced roaming rates. Traffic in 2010 increased 6.8% to 8,790 million minutes compared to 8,232 million minutes in 2009.
Sales and marketing
Continued uptake of “O2 Neon” tariffs, a postpaid tariff with attractive prices, an increased retail fixed broadband customer base as well as a stabilization of fixed line losses contributed to solid commercial momentum in 2010, despite the challenging economic environment.
Competition
Telefónica O2 Czech Republic had an estimated mobile market share of approximately 38.5% at December 31, 2010, compared to approximately 39.2% at December 31, 2009, based on number of mobile accesses.
There are currently two other primary competitors in the Czech Republic mobile telecommunications market, Vodafone Czech Republic, which is owned by Vodafone plc., and T-Mobile, which is part of Deutsche Telecom AG.
The fixed telephony market in the Czech Republic consists of six large operators and a number of other smaller providers. In voice the major competitors are U:fon, UPC and other cable operators which also provide integrated voice, Internet and pay TV offers. Internet service is offered by all major mobile operators as well as a large volume of WiFi providers. Pay TV is dominated by a number of cable and satellite companies, the biggest being UPC.
Network and technology
Telefónica O2 Czech Republic’s digital network in the Czech Republic is based upon the GSM/UMTS standard. The prevalence of the GSM standard, together with Telefónica O2 Czech Republic’s international roaming agreements, enables its customers to make and receive calls in more than 200 countries worldwide.
Slovakia
At December 31, 2010, Telefónica O2 Slovakia’s total number of mobile accesses amounted to 0.9 million accesses, an increase of 59.2% compared to December 31, 2009. Contract mobile accesses accounted for 38.0% of these accesses at December 31, 2010 compared to 35.4% at December 31, 2009. Throughout 2010, Telefónica O2 Slovakia continued with “O2 Fér” plan, a simple tariff which unifies pre-pay and contract mobile rates and offers SIM-only products without a handset subsidy.
Ireland – Telefónica O2 Ireland
Operations
The following tables present, at the dates or for the periods indicated, selected statistical data relating to our operations in Ireland:
|
At December 31,
|
||||||||||||
|
2008
|
2009
|
2010
|
||||||||||
|
(in thousands)
|
||||||||||||
|
Total mobile accesses
|
1,727.7 | 1,714.3 | 1,695.8 | |||||||||
|
Pre-pay accesses
|
1,084.6 | 1,022.5 | 966.5 | |||||||||
|
Year ended December 31,
|
||||||||||||
|
2008
|
2009
|
2010
|
||||||||||
|
MOU (minutes)
|
245 |
n.a.
|
n.a.
|
|||||||||
|
Traffic (millions of minutes)
|
4,867 | 4,672 | 4,732 | |||||||||
|
ARPU (in euros)
|
43.2 | 39.6 | 37.0 | |||||||||
The estimated mobile penetration rate in Ireland was approximately 118% at December 31, 2010, compared to 120% at December 31, 2009.
Telefónica O2 Ireland had net losses of
18
thousand mobile accesses in 2010. Telefónica O2 Ireland’s customer base, in terms of mobile accesses, decreased 1.1% from December 31, 2009 to 1.7 million mobile accesses at December 31, 2010.
Telefónica O2 Ireland had net adds of 38 thousand contract mobile accesses in its mobile business in 2010, a decrease of 22.7% on December 31, 2009.
ARPU decreased by 6.6% in 2010 to €37.0 from €39.6 in 2009 as a result of MTR cuts and continued mobile usage optimization by customers, including reduced roaming activity. Traffic in 2010 increased 1.3% to 4,732 million minutes compared to 4,672 million minutes in 2009.
Sales and marketing
During 2010, despite Telefónica O2 Ireland’s performance being impacted by difficult economic conditions, intense competition and MTR cuts, Telefónica O2 Ireland posted growth in mobile postpay.
Competition
There are currently three other primary competitors in the Irish mobile telecommunications market: Vodafone Ireland, which is part of Vodafone plc, Meteor, which is part of Eircom, and 3 Ireland, which is part of Hutchison Whampoa Ltd.
Telefónica O2 Ireland’s estimated market share was approximately 32.0% at December 31, 2010 compared to approximately 32.3% at December 31, 2009 based on number of mobile accesses.
Network and technology
Telefónica O2 Ireland’s digital network in Ireland is based upon the GSM/UMTS standard. The prevalence of the GSM standard, together with Telefónica O2 Ireland’s international roaming agreements, enables Telefónica O2 Ireland customers to make and receive calls in more than 200 countries worldwide.
Telefónica Latin America
Telefónica Latin America provides fixed and mobile telephony services through the operators described in the following sections in the main Latin American markets. In addition, Telefónica Latin America’s other members include: Telefónica Empresas, TIWS, the business unit responsible for other telecommunications operators and for managing our international services and the network which supports these services, and Terra Networks Latin América.
The following table presents statistical data relating to our operations in Latin America:
|
At December 31,
|
||||||||||||
|
2008
|
2009
|
2010
|
||||||||||
|
(in thousands)
|
||||||||||||
|
Fixed telephony accesses
|
25,644.5 | 24,578.3 | 24,403.6 | |||||||||
|
Internet and data accesses
|
7,629.8 | 7,605.2 | 8,235.1 | |||||||||
|
Narrowband accesses
|
1,445.8 | 1,070.6 | 674.8 | |||||||||
|
Broadband accesses
|
6,067.0 | 6,426.8 | 7,442.3 | |||||||||
|
Other accesses
|
117.0 | 107.8 | 118.0 | |||||||||
|
Mobile accesses
|
123,385.2 | 134,698.9 | 149,255.4 | |||||||||
|
Pay TV accesses
|
1,540.5 | 1,648.6 | 1,792.7 | |||||||||
|
Final clients accesses
|
158,200.1 | 168,531.1 | 183,686.9 | |||||||||
|
Wholesale accesses
|
59.0 | 56.1 | 55.9 | |||||||||
|
Total accesses
|
158,259.0 | 168,587.2 | 183,742.8 | |||||||||
Telefónica Latin America’s total accesses increased 9.0% to 183.7 million accesses at December 31, 2010 from 168.6 million accesses at December 31, 2009. Total accesses at December 31, 2010 include 149.3 million mobile accesses, 24.4 million fixed telephony accesses, 8.2 million Internet and data accesses and 1.8 million pay TV accesses. Additionally, it includes 56 thousand wholesale accesses.
The following table sets forth certain information at December 31, 2010 regarding the principal Latin American operating companies of Telefónica Latin America
.
|
Country
|
Company
|
Population
|
Interest
|
|||||||
|
(in millions)
|
(%)
|
|||||||||
|
Brazil
|
Telecomunicações de São Paulo, S.A.—Telesp
|
41.3 | (*) | 87.95 | ||||||
|
Vivo Participaçoes S.A.
|
194.0 | 59.42 | ||||||||
|
Mexico
|
Telefónica Móviles México, S.A. de C.V.
|
110.6 | 100.00 | |||||||
|
Panama
|
Telefónica Móviles Panamá, S.A.
|
3.5 | 100.00 | |||||||
|
Nicaragua
|
Telefónica Móviles Nicaragua, S.A.
|
5.6 | 100.00 | |||||||
|
Guatemala
|
Telefónica Móviles Guatemala, S.A.
|
13.9 | 99.98 | |||||||
|
El Salvador
|
Telefónica Móviles El Salvador, S.A. de C.V.
|
6.0 | 99.08 | |||||||
|
Venezuela
|
Telcel, S.A.
|
28.8 | 100.00 | |||||||
|
Colombia
|
Colombia Telecomunicaciones, S.A. ESP.
|
45.5 | 52.03 | |||||||
|
Telefónica Móviles Colombia, S.A.
|
100.00 | |||||||||
|
Peru
|
Telefónica del Perú, S.A.A.
|
29.6 | 98.34 | |||||||
|
Telefónica Móviles Perú, S.A.C.
|
99.99 | |||||||||
|
Ecuador
|
Otecel, S.A.
|
14.3 | 100.00 | |||||||
|
Argentina
|
Telefónica de Argentina, S.A.
|
40.4 | 100.00 | |||||||
|
Telefónica Móviles Argentina S.A.
|
100.00 | |||||||||
|
Chile
|
Telefónica Chile, S.A.
|
16.9 | 97.89 | |||||||
|
Telefónica Móviles Chile, S.A.
|
100.00 | |||||||||
|
Uruguay
|
Telefónica Móviles Uruguay, S.A.
|
3.4 | 100.00 | |||||||
|
(*)
|
Concession area only.
|
Brazil
The following table presents, at the dates indicated, selected statistical data relating to our operations in Brazil.
|
At December 31,
|
||||||||||||
|
2008
|
2009
|
2010
|
||||||||||
|
(in thousands)
|
||||||||||||
|
Fixed telephony accesses
|
11,661.9 | 11,253.8 | 11,292.6 | |||||||||
|
Internet and data accesses
|
3,625.8 | 3,440.2 | 3,848.2 | |||||||||
|
Narrowband accesses
|
996.4 | 723.1 | 446.2 | |||||||||
|
Broadband accesses
|
2,557.8 | 2,638.4 | 3,319.2 | |||||||||
|
Other accesses
|
71.6 | 78.7 | 82.8 | |||||||||
|
Mobile accesses
|
44,945.0 | 51,744.4 | 60,292.5 | |||||||||
|
Pre-pay accesses
|
36,384.0 | 41,960.7 | 47,658.6 | |||||||||
|
Pay TV accesses
|
472.2 | 487.2 | 486.3 | |||||||||
|
Final clients accesses
|
60,704.9 | 66,925.7 | 75,919.6 | |||||||||
|
Wholesale accesses
|
34.1 | 34.2 | 33.9 | |||||||||
|
Total accesses
|
60,739.1 | 66,959.8 | 75,953.5 | |||||||||
Telefónica Latin America’s accesses in Brazil increased 13.4% to 76.0 million accesses at December 31, 2010 from 67.0 million accesses at December 31, 2009. This growth reflects a 16.5% year-on-year increase in Vivo’s customer base and, to a lesser extent, the expansion of Telesp’s (Telefónica Latin America’s Brazilian fixed line business) fixed telephony accesses and broadband business, while pay TV accesses were largely unchanged.
Brazil Fixed Business – Telecomunicações de São Paulo, S.A. – Telesp
Operations
Telesp provides fixed telephony and other telecommunications services in the Brazilian state of São Paulo under concessions and licenses from Brazil’s federal government.
Telesp achieved significant operating and commercial improvements in 2010, a year during which the company reoriented its management focus and repositioned its commercial efforts, attaining improvements in quality and customer loyalty levels. As a result of this, Telesp’s fixed telephony, Internet and data and pay TV accesses increased 2.9% to 15.7 million accesses at December 31, 2010 from 15.2 million accesses at December 31, 2009 primarily due to sharp increases in broadband accesses. Telesp’s fixed telephony accesses increased 0.3% to 11.29 million accesses at December 31, 2010 from 11.25 million accesses at December 31, 2009. Of these, 29.9% were pre-pay accesses or accesses with consumption limits.
The Brazilian broadband market continued to grow in 2010. Telesp increased its broadband customer base by 25.8% to 3.3 million accesses at December 31, 2010 compared to 2.6 million accesses at December 31, 2009, recovering market share in this business.
Telesp offers pay TV mainly through a DTH solution and, since the fourth quarter of 2007 after the acquisition of Navy Tree, also offers MMDS technology, reaching 0.5 million accesses at December 31, 2010.
Sales and marketing
In Brazil, we employ a differentiated approach to marketing whereby we use a mix of human and technological resources (a specialized team and business intelligence tools, respectively), in addition to specific studies that allow us to target various market segments according to the relevant needs of the customers in each segment. We continuously monitor market trends in an effort to develop new products and services that may address the future needs of our customers.
Telefónica Latin America employs direct sales, telesale and indirect channels to deliver fixed telephony and other telecommunications solutions to residential, small and medium enterprises, or SMEs, and corporate customers in Brazil.
We offer bundled products, which include both local and long-distance traffic and minutes bundled with broadband. We believe that the trend towards bundled offers in Brazil will continue to grow, and that further developing such offers will be important to maintaining our competitiveness in the market. Also, since 2009 Telesp launched its “X-treme” products, based on FTTx technology.
Competition
Our fixed telephony business in Brazil currently faces strong competition in the corporate and premium residential segments in respect of several types of services. In the corporate segment, there is strong competition in both voice services (local and long distance) and data transmission, resulting in greater retention costs to maintain client relationships. We also face fierce competition in IT services from multinational companies with considerable experience in this business.
Our main competitors in the corporate fixed telephony line segment are Oi, Intelig and Embratel, a subsidiary of Telmex Internacional. In the high-income residential service segment, we compete for long-distance customers with Embratel and for broadband customers with cable TV providers, mainly NET Serviços de Comunicação S.A. The niche operator owned by Vivendi, GVT, started operating in the state of São Paulo in 2010. For the local voice and high-income segments, we also face increasing competition from mobile operators. To defend ourselves from increasing competition, we focus on improving our broadband products, offering bundled services that include voice, broadband and pay TV, and we are increasing the access speed offered to our clients. In addition, we are improving our market segmentation and developing more competitive products intended to defend our client base from our competitors’ product offerings and to defend our market share.
In the low-income fixed local telephony segment, we face less direct competition due to the low profitability of this market. The most significant competition is from pre-pay mobile telecommunications providers.
Telesp had an estimated market share in the fixed telephony market in the State of São Paulo of approximately 72.7% at December 31, 2010 based on the number of fixed telephony accesses, down from approximately 74.4% at December 31, 2009.
Brazil mobile business –Vivo
Operations
With approximately 203.1 million mobile accesses, Brazil ranked first in Latin America in terms of number of mobile accesses at December 31, 2010. At December 31, 2010, Brazil had an estimated mobile market penetration rate of approximately 104.7% compared to approximately 90.5% at December 31, 2009.
Since September 2010, Telefónica has control of Vivo, after acquiring Portugal Telecom’s stake in Brasilcel. The license of Vivo considers the Brazilian market on a nationwide basis with an aggregate population of approximately 194 million people. Vivo is the leading operator in Brazil, with an approximate 29.7% market share in terms of mobile accesses.
Vivo’s customer base, in terms of number of accesses, increased 16.5% to 60.3 million accesses at December 31, 2010 from 51.7 million accesses at December 31, 2009. Of these, 12.6 million were mobile contract accesses. The primary factors contributing to this growth include new mobile broadband accesses, the wider range of handsets available, Vivo’s leadership in terms of brand and distribution chain, ongoing marketing campaigns for pre-pay mobile traffic and an improved capacity to attract contract accesses with the
Vivo Voçe
plans launched at the end of 2009.
|
Year ended December 31,
|
||||||||||||
|
2008
|
2009
|
2010
|
||||||||||
|
Traffic (millions of minutes)
|
40,547 | 52,134 | 77,463 | |||||||||
|
ARPU (in euros)
|
11.2 | 9.9 | 11.0 | |||||||||
Traffic in 2010 increased 48.6% to 77,463 million minutes compared to 52,134 million minutes in 2009 due to the characteristics of the promotions that Vivo offered in 2010, focusing on pre-pay and control segments, which require minimum consumption and a prepaid recharge when such consumption is complete.
ARPU was €11.0 in 2010 compared to €9.9 in 2009 (a decrease of 6.0% in local currency), reflecting the increased proportion of “SIM only” accesses and a strong growth in the customer base.
Sales and marketing
Vivo actively manages its distribution channels, which consisted of approximately 11,834 points of sale at December 31, 2010. Also, pre-pay mobile customers have access to a wide range of top up points. Credit top ups can also be made by electronic transfers through an automatic teller machine. At December 31, 2010, approximately 21.0% of Vivo’s customer base were contract mobile accesses and the remaining 79.0% were pre-pay accesses. Contract mobile accesses growth was driven by customer acquisition and retention campaigns focused on high-value customers, with an emphasis on the
Vivo
Voçe
plans and mobile internet offers.
Vivo voçe
plans are customized plans that allow customers to choose among various service mixes and include free voice minutes, messaging, and/ or mobile Internet access.
Vivo Voçe
also aims to increase customer loyalty by encouraging increased usage and advertising competitive prices. These plans are divided into different categories depending on the number of minutes included, and feature additional upgrades, such as extra SMS, extra long distance minutes and extra MMS as well as a 3G Internet upgrade option.
Competition
Vivo was the leading mobile operator in Brazil in terms of number of accesses at December 31, 2010. The growth of the Brazilian market was considerable during the past years while being accompanied by an increase in competition due to the introduction of new competitors in the regions in which Vivo operates. Vivo’s major competitors are subsidiaries of TIM Brasil (a subsidiary of Telecom Italia), Claro (a subsidiary of America Móvil) and Oi.
Vivo’s estimated market share in terms of mobile accesses in the Brazilian mobile markets in which it operates was approximately 29.7% at December 31, 2010, largely unchanged from December 31, 2009.
Network and technology
The licenses granted to the companies integrated under the Vivo brand allow operations over the WCDMA, GSM, CDMA, CDMA 1XRTT, CDMA EVDO and TDMA systems. Vivo offers both analog and digital services in the bands of 800 MHz, 1900 MHz and 2100 MHz. In 2010 migration from the CDMA to the GSM network continued, increasing Vivo’s GSM customer base at December 31, 2010 to 49.6 million accesses, 82.3% of its total customer base.
Venezuela
Venezuela mobile business – Telcel, S.A. – Telcel
Operations
The following table presents, at the dates indicated, selected statistical data relating to our operations in Venezuela.
|
At December 31,
|
||||||||||||
|
2008
|
2009
|
2010
|
||||||||||
|
(in thousands)
|
||||||||||||
|
Total mobile accesses
|
10,584.0 | 10,531.4 | 9,514.7 | |||||||||
|
Pre-pay accesses
|
9,970.7 | 9,891.1 | 8,740.3 | |||||||||
|
Fixed wireless accesses
|
1,312.8 | 1,214.3 | 966.2 | |||||||||
|
Pay TV
|
8.5 | 62.8 | 69.3 | |||||||||
|
Total accesses
|
11,905.3 | 11,808.5 | 10,550.2 | |||||||||
The mobile penetration rate in Venezuela stood at an estimated 101% at December 31, 2010, an increase of 0.3 percentage points from December 31, 2009.
Telefónica Latin America operates in Venezuela through Telcel, S.A., or Telcel, whose accesses decreased 10.7% to 10.5 million accesses at December 31, 2010 from 11.8 million accesses at December 31, 2009, mainly due to higher handset prices as a consequence of the devaluation of the Venezuelan bolivar.
|
Year ended December 31,
|
||||||||||||
|
2008
|
2009
|
2010
|
||||||||||
|
Traffic (millions of minutes)
|
14,993 | 14,951 | 14,195 | |||||||||
|
ARPU (in euros)
|
16.9 | 21.2 | 14.3 | |||||||||
Traffic in 2010 decreased 5.1% to 14.195 million minutes from 14,951 million minutes in 2009, due primarily to lower pre-pay accesses.
ARPU for 2010 was €14.3 compared to €21.2 in 2009, primarily explained by the effects of the devaluation of the Venezuelan bolivar (an increase of 26.3% in local currency, which reflects the increased proportion of contract mobile accesses in the customer base and the continued growth in data revenues).
Sales and marketing
In Venezuela, we use a broad range of marketing channels, including television, radio, billboards, telemarketing, direct mail and Internet advertising to market our products. At December 31, 2010, 8% of our mobile accesses in Venezuela were contract mobile accesses, while approximately 92% were pre-pay mobile accesses.
In 2010, Telcel reinforced its position as a leading company in the data business, known for developing new, innovative products and services.
Competition
The major competitors in the Venezuela mobile business are Movilnet and Digitel. Movilnet is a mobile services communication provider owned by the public operator CANTV. Movilnet currently uses CDMA and GSM technologies. Digitel is a mobile communications provider that uses GSM technology and focuses its strategy on mobile internet services based on 3G.
Telefónica’s estimated market share in the Venezuelan mobile market, in terms of mobile accesses, was approximately 32.7% at December 31, 2010, down from approximately 36.9% at December 31, 2009. This decrease was due principally to higher handset prices as a consequence of the devaluation of the Venezuelan bolivar, which limited our competitiveness and our ability to increase gross adds.
Argentina
The following table presents, at the dates indicated, selected statistical data relating to our operations in Argentina.
|
At December 31,
|
||||||||||||
|
2008
|
2009
|
2010
|
||||||||||
|
(in thousands)
|
||||||||||||
|
Fixed telephony accesses
|
4,603.1 | 4,607.7 | 4,621.5 | |||||||||
|
Fixed wireless accesses
|
22.4 | 36.2 | 35.5 | |||||||||
|
Internet and data accesses
|
1,284.3 | 1,351.0 | 1,505.4 | |||||||||
|
Narrowband accesses
|
182.8 | 112.7 | 65.7 | |||||||||
|
Broadband accesses
|
1,082.0 | 1,238.3 | 1,439.7 | |||||||||
|
Other accesses
|
19.5 | — | ||||||||||
|
Mobile accesses
|
14,829.6 | 15,931.9 | 16,148.9 | |||||||||
|
Pre-pay accesses
|
9,687.6 | 10,736.8 | 10,370.4 | |||||||||
|
Final clients accesses
|
20,717.0 | 21,890.7 | 22,275.8 | |||||||||
|
Wholesale accesses
|
10.0 | 9.3 | 13.0 | |||||||||
|
Total accesses
|
20,726.9 | 21,900.0 | 22,288.8 | |||||||||
Telefónica Latin America managed a total of 22.3 million accesses in Argentina at December 31, 2010, an increase of 1.8% from December 31, 2009. This increase was underpinned by growth in mobile accesses, which increased by 1.4% to 16.1 million accesses at December 31, 2010 from 15.9 million accesses at December 31, 2009, and in the number of broadband accesses, which increased by 16.3% to 1.4 million accesses at December 31, 2010 from 1.2 million accesses at December 31, 2009.
Argentina fixed business – Telefónica de Argentina S.A.
Operations
Telefónica Latin America conducts its Argentine fixed business through Telefónica de Argentina, S.A., or Telefónica de Argentina, the leading provider of fixed telephony services in Argentina in 2010 based on number of accesses, according to information provided by its competitors and regulatory authorities.
Telefónica de Argentina’s accesses increased 2.9% to 6.1 million accesses at December 31, 2010 from 6.0 million accesses at December 31, 2009. This modest growth was primarily driven by a 16.3% increase in broadband accesses to 1.4 million accesses at December 31, 2010 from 1.2 million accesses at December 31, 2009. The growth in broadband accesses was accompanied by a slight increase in fixed telephony accesses of 0.3% to 4.6 million accesses at December 31, 2010.
Sales and marketing
In Argentina, Telefónica de Argentina uses a broad range of marketing channels, including television, radio, billboards, telemarketing, direct mail and Internet advertising to market its fixed telephony products and services. Telefónica de Argentina continued answering customers’ needs through the development of its broadband business and by providing them new value added services. Telefónica de Argentina also focused its product strategy on bundles, such as flat-rate plans (
tarifa plana
). In 2010, we continued commercializing long distance flat-rate plans. The flat-rate plan was primarily sold with the bundling of broadband access together with a local traffic plan. At December 31, 2010 approximately 72% of the broadband customer base subscribed to broadband through a bundled package.
Competition
Telefónica de Argentina is the incumbent provider of fixed telephony services in the southern region of Argentina. However, other licensees currently providing local telephony services include Telecom Argentina, S.A. and Telecentro. Claro, a mobile phone company owned by America Móvil, also competes in the fixed telephony market.
Telefónica de Argentina is using its expanded fiber-optic network in the northern region of Argentina to carry long-distance traffic and a multiservice network to provide local service in the three most important cities in the northern region of Argentina where Telecom Argentina, S.A. is the incumbent provider. Telefónica de Argentina expanded and improved its network capacity by the construction of fixed wireless networks and the activation of new lines.
Telefónica de Argentina also competes with Grupo Clarín, a company with a growing broadband and TV businesses as a result of the merger of its affiliate Cablevisión with Multicanal in 2007.
Telefónica had an estimated market share in the Argentine fixed telephony market of approximately 47.1% at December 31, 2010 based on number of fixed telephony accesses, down from approximately 47.8% at December 31, 2009.
Network and technology
Telefónica de Argentina invested in 2010 to develop its broadband access business through ADSL technology, increasing the network coverage and capacity.
Argentina mobile business – Telefónica Móviles Argentina S.A.
Operations
The Argentine mobile market continued to grow in 2010, with an increase in its penetration to 128.6% at December 31, 2010, from 120.3% at December 31, 2009, based on number of mobile accesses.
Telefónica Latin America conducts its Argentine mobile business through Telefónica Móviles Argentina, S.A., or Telefónica Móviles Argentina, whose accesses increased 1.4% to 16.1 million accesses at December 31, 2010 from 15.9 million accesses at December 31, 2009. Telefónica Móviles Argentina also increased its number of contract accesses by 11.2% to 5.8 million accesses at December 31, 2010 from 5.2 million accesses at December 31, 2009.
|
Year ended December 31,
|
||||||||||||
|
2008
|
2009
|
2010
|
||||||||||
|
Traffic (millions of minutes)
|
12,941 | 15,562 | 17,550 | |||||||||
|
ARPU (in euros)
|
8.7 | 8.6 | 9.2 | |||||||||
Traffic reached 17,550 million minutes in 2010, an increase of 12.8% compared to 15,562 million minutes in 2009, mainly driven by the growth in on-net traffic.
ARPU was €9.2 in 2010 compared to €8.6 in 2009 (an increase of 6.7% in local currency), which was due mainly to higher unit voice consumption and increasing data usage.
Sales and marketing
In Argentina, Telefónica Móviles Argentina uses a broad range of marketing channels, including television, radio, billboards, telemarketing, direct mail and Internet advertising to market its products. At December 31, 2010, approximately 35.8% of our accesses in Argentina were contract mobile accesses. During 2010, Telefónica Móviles Argentina continued to pursue its objective of leading the 3G mobile data market and continuing to drive traditional customer revenue growth through greater levels of traditional consumption.
Competition
We currently have three competitors in the Argentine market for mobile communications services, each of which provides services on a nationwide basis: Telecom Personal, which is controlled by Telecom Argentina; Claro, controlled by América Móvil; and Nextel, owned by NII Holdings Inc.
Telefónica Móviles Argentina’s estimated market share in the Argentine mobile market in terms of mobile accesses was approximately 31.0% at December 31, 2010, down from approximately 33.0% at December 31, 2009.
Network and technology
In Argentina we operate on digital networks based upon GSM and UMTS technology. At December 31, 2010, GSM accesses represented 96.7% of Telefónica Móviles Argentina’s accesses. Also, Telefónica Móviles Argentina developed its mobile broadband business through UMTS technology, increasing coverage.
Chile
The following table presents, at the dates indicated, selected statistical data relating to our operations in Chile.
|
At December 31,
|
||||||||||||
|
2008
|
2009
|
2010
|
||||||||||
|
(in thousands)
|
||||||||||||
|
Fixed telephony accesses
|
2,121.0 | 2,028.0 | 1,939.3 | |||||||||
|
Internet and data accesses
|
743.8 | 807.2 | 836.0 | |||||||||
|
Narrowband accesses
|
18.7 | 15.9 | 6.6 | |||||||||
|
Broadband accesses
|
716.6 | 783.2 | 821.5 | |||||||||
|
Other accesses
|
8.6 | 8.1 | 7.9 | |||||||||
|
Mobile accesses
|
6,875.0 | 7,524.7 | 8,794.0 | |||||||||
|
Pre-pay accesses
|
4,956.0 | 5,435.9 | 6,179.3 | |||||||||
|
Pay TV accesses
|
263.0 | 285.1 | 341.2 | |||||||||
|
Final clients accesses
|
10,002.7 | 10,645.0 | 11,910.5 | |||||||||
|
Wholesale accesses
|
11.5 | 8.9 | 5.3 | |||||||||
|
Total accesses
|
10,014.3 | 10,653.8 | 11,915.8 | |||||||||
At December 31, 2010 Telefónica Latin America managed a total of 11.9 million accesses in Chile, 11.8% more than at December 31, 2009, underpinned by growth in mobile accesses, which increased by 16.9% to 8.8 million accesses at December 31, 2010 from 7.5 million accesses at December 31, 2009. Growth was also driven by a 4.9% increase in final clients broadband accesses to 0.8 million accesses at December 31, 2010, and a 19.7% increase in pay TV accesses to 0.3 million accesses at December 31, 2010. Fixed telephony accesses decreased 4.4% to 1.9 million accesses at December 31, 2010 from 2.0 million accesses at December 31, 2009.
Chilean fixed business – Telefónica Chile S.A.
Operations
Telefónica Latin America conducts its Chilean fixed business through Telefónica Chile, the leading fixed line telecommunications operator in Chile based on number of accesses, according to information provided by its competitors and regulatory authorities.
Telefónica Chile’s accesses decreased 0.2% to 3.1 million accesses at December 31, 2010. Telefónica Chile’s fixed telephony accesses decreased 4.4% from December 31, 2009 to 1.9 million accesses at December 31, 2010. Broadband and pay TV accesses continued to grow in 2010, and Telefónica Chile managed 821 thousand broadband accesses at December 31, 2010 compared to 783 thousand at December 31, 2009.
Telefónica Chile’s pay TV business grew to 0.3 million accesses at December 31, 2010. Telefónica Chile established itself as the third pay TV operator in Chile, by number of accesses.
Sales and marketing
Telefónica Chile launched bundle services of broadband and voice to satisfy customers’ demand. Also, double and triple play bundles represented one of the drivers of revenue growth. The integration of the fixed and mobile businesses also led to the bundling of the services of both businesses, enabling us to market a greater range of products and permitting customers to combine packages to meet their needs.
The customer service model developed by Telefónica Chile, features the following characteristics:
|
|
·
|
personal customer service lines for purchasing any type of product and service and handling customer queries;
|
|
|
·
|
Telefónica stores (
Tiendas Telefónica
) where customers can test and buy products marketed by Telefónica;
|
|
|
·
|
Telefónica’s “virtual” store, accessible by Internet, which offers customers the ability to order and purchase online the majority of services and products offered by Telefónica; and
|
|
|
·
|
a sophisticated customer service system for corporate clients, ranging from a telephone help line for small and medium-sized businesses to the assignment of sales managers to address the needs of larger corporate clients.
|
Since October 25, 2009, all fixed and/or mobile businesses products and services have been marketed under the brand “Movistar,” formerly used exclusively by the mobile business.
Competition
VTR is our principal competitor in the Chilean fixed telephony market.
Telefónica Chile’s estimated market share at December 31, 2010 was approximately 57.7% of retail fixed telephony accesses, down from approximately 58.4% at December 31, 2009.
Network and technology
Telefónica Chile made improvements on its network to support broadband and TV accesses growth, while updating it to be ready for the development of the VDSL and fiber optic, or FTTx, access networks.
Chilean mobile business – Telefónica Móviles Chile, S.A.
Operations
The mobile penetration rate in Chile stood at an estimated 125.8% at December 31, 2010, an increase of approximately 20.2 percentage points from December 31, 2009, when such rate was estimated at approximately
105.6%. This increase was primarily due to a recovery of the mobile market during 2010, compared with 2009, when mobile market activity was lower due to an unstable economy and less consumption.
Telefónica Latin America conducts its Chilean mobile business through Telefónica Móviles Chile, S.A., or Telefónica Móviles Chile, whose customer base increased 16.9% to 8.8 million accesses at December 31, 2010. The number of contract accesses rose by 25.2% to 2.6 million accesses at December 31, 2010 from 2.1 million accesses at December 31, 2009.
|
Year ended December 31,
|
||||||||||||
|
2008
|
2009
|
2010
|
||||||||||
|
Traffic (millions of minutes)
|
9,703 | 10,521 | 11,791 | |||||||||
|
ARPU (in euros)
|
12.3 | 10.7 | 12.1 | |||||||||
Traffic in 2010 increased 12.1% to 11,791 million minutes at December 31, 2010 from 10,521 million minutes at December 31, 2009, mainly driven by outgoing traffic, primarily on-net.
ARPU was €12.1 in 2010 compared to €10.7 in 2009 (a decrease of 1.8% in local currency). The decrease in local currency was largely due to MTR cuts, which came into effect on January 23, 2009 (a 3% decrease every January for the subsequent three years).
Sales and marketing
Telefónica Móviles Chile offered promotional campaigns associated with top-ups and prepaid sales while developing mobile broadband service.
Competition
We currently have three primary competitors in the Chilean market for mobile telephony, each of which provides services on a nationwide basis: Entel, Claro and Nextel.
Telefónica Móviles Chile’s estimated market share in the Chilean mobile sector in terms of mobile accesses was approximately 41.4% at December 31, 2010, down from approximately 42.8% at December 31, 2009.
Network and technology
In Chile, Telefónica Móviles Chile operates with GSM and 3G network, launched in December 2007.
Mexico
Mexico mobile business – Telefónica Móviles México, S.A. de C.V.
Operations
The following table presents, at the dates indicated, selected statistical data relating to our operations in Mexico.
|
At December 31,
|
||||||||||||
|
2008
|
2009
|
2010
|
||||||||||
|
(in thousands)
|
||||||||||||
|
Total mobile accesses
|
15,330.6 | 17,400.5 | 19,661.6 | |||||||||
|
Pre-pay accesses
|
14,432.4 | 16,328.3 | 18,061.3 | |||||||||
|
Fixed wireless accesses
|
133.6 | 334.3 | 565.5 | |||||||||
|
Total accesses
|
15,464.2 | 17,734.8 | 20,227.1 | |||||||||
The mobile penetration rate in Mexico was approximately 82.3% at December 31, 2010 an increase of 7 percentage points from December 31, 2009.
Telefónica Latin America conducts its Mexican mobile business through Telefónica Móviles México, S.A. de C.V., or Telefónica Móviles México. Telefónica Móviles Mexico’s customer base increased 14.1% to 20.2 million accesses at December 31, 2010 from 17.7 million accesses at December 31, 2009. At December 31, 2010,
approximately 91.9% of our mobile customers in Mexico were pre-pay mobile accesses while 8.1% were contract mobile accesses.
|
Year ended December 31,
|
||||||||||||
|
2008
|
2009
|
2010
|
||||||||||
|
Traffic (millions of minutes)
|
22,431 | 23,186 | 23,232 | |||||||||
|
ARPU (in euros)
|
8.2 | 6.9 | 6.9 | |||||||||
Traffic in 2010 was virtually unchanged from 2009 (+0.2% year-on-year), affected by the introduction of a 3% special production and service tax, the 1% hike in VAT, which was passed directly to the consumer, and changes in the company’s commercial offers made in the first half of the year. ARPU was flat (decreasing by 10.8% in local currency).
Sales and marketing
In Mexico, we use a broad range of marketing channels, including television, radio, billboards, telemarketing, direct mail and Internet advertising to market our products and services.
Telefónica Móviles México’s offer was completed with the “
Prepago 1.18
” plan in the pre-pay segment, based on a price-per-call offer, which aims to boost our competitiveness without reducing profitability.
Competition
Telefónica Móviles México is the second largest mobile operator in Mexico based on the number of mobile accesses, and competes with various mobile operators at the national level. Telefónica Móviles México’s principal competitor is Telcel, a subsidiary of América Móvil. Other significant competitors are Nextel and Iusacell.
Telefónica Móviles México’s estimated market share in the Mexican mobile market in terms of mobile accesses was approximately 21.6% at December 31, 2010, an improvement from approximately 20.8% at December 31, 2009.
Network and technology
Telefónica Móviles México has 100% of its accesses on its GSM network. Also, Telefónica Móviles México provides UMTS services.
Peru
The following table presents, at the dates indicated, selected statistical data relating to our operations in Peru.
|
At December 31,
|
||||||||||||
|
2008
|
2009
|
2010
|
||||||||||
|
(in thousands)
|
||||||||||||
|
Fixed telephony accesses
|
2,986.5 | 2,971.2 | 2,871.2 | |||||||||
|
Fixed wireless accesses
|
485.5 | 582.7 | 537.8 | |||||||||
|
Internet and data accesses
|
728.9 | 800.6 | 885.4 | |||||||||
|
Narrowband accesses
|
17.7 | 16.9 | 15.4 | |||||||||
|
Broadband accesses
|
698.4 | 768.0 | 850.8 | |||||||||
|
Other accesses
|
12.8 | 15.6 | 19.2 | |||||||||
|
Mobile accesses
|
10,612.7 | 11,458.2 | 12,507.1 | |||||||||
|
Pre-pay accesses
|
9,575.2 | 10,214.2 | 10,104.4 | |||||||||
|
Pay TV accesses
|
654.5 | 686.3 | 690.6 | |||||||||
|
Final clients accesses
|
14,982.6 | 15,916.3 | 16,954.3 | |||||||||
|
Wholesale accesses
|
0.4 | 0.5 | 0.5 | |||||||||
|
Total accesses
|
14,983.0 | 15,916.8 | 16,954.8 | |||||||||
At December 31, 2010, Telefónica Latin America had 17.0 million accesses in Peru, which represents an increase of 6.5% from December 31, 2009. This growth in accesses was primarily driven by a 9.2% increase in mobile accesses from December 31, 2009 to 12.5 million mobile accesses at December 31, 2010, mostly in the contract segment.
Peruvian fixed business – Telefónica del Perú, S.A.A.
Operations
Telefónica Latin America conducts its Peruvian fixed telephony business through Telefónica del Perú, S.A.A., or Telefónica del Perú, which at December 31, 2010 was the leading fixed line telecommunications operator in Peru based on number of fixed telephony accesses.
Telefónica del Perú had total accesses of 4.4 million at December 31, 2010, a decrease of 0.2% from December 31, 2009, due primarily to decreases in fixed wireless telephony accesses. Fixed telephony accesses decreased 3.4% from December 31, 2009 to 2.9 million accesses at December 31, 2010. Broadband accesses grew by 10.8% from December 31, 2009 to 0.9 million accesses at December 31, 2010.
Sales and marketing
Telefónica del Perú’s commercial strategy is based on achieving and maintaining high levels of market penetration by offering customized services to different customer segments, with marketing campaigns focused on maintaining customer loyalty and increasing the options available to potential customers. The primary products offered by Telefónica del Perú include fixed telephony, broadband, pay TV, data and IT services.
Telefónica del Perú focuses its commercial strategy on penetration by targeting specific market segments, commercializing Duos and Trios and leveraging on its customer retention campaign.
Competition
In 2010, Telmex and Americatel (now operating under the Claro brand), Telefónica del Perú’s two primary competitors, focused on offering bundled products (local and long distance telephony together with broadband and pay TV).
Telefónica del Perú had an estimated market share in the Peruvian fixed telephony market of approximately 89.9% at December 31, 2010, based on number of fixed telephony accesses, down from approximately 93.8% at December 31, 2009.
Network and technology
Telefónica del Peru continued to develop ADSL technology, increasing coverage and speed of its broadband business.
Peruvian mobile business – Telefónica Móviles Perú, S.A.C.
Operations
The estimated Peruvian mobile penetration rate reached 66.7% approximately at December 31, 2010, an increase of 2 percentage points compared to December 31, 2009.
Telefónica Latin America conducts its Peruvian mobile business through Telefónica Móviles Perú, S.A.C., or Telefónica Móviles Perú, whose customer base increased 9.2% from December 31, 2009 to 12.5 million accesses at December 31, 2010. This increase was primarily driven by a 93.1% increase in the number of contract mobile accesses from December 31, 2009 to December 31, 2010.
|
Year ended December 31,
|
||||||||||||
|
2008
|
2009
|
2010
|
||||||||||
|
Traffic (millions of minutes)
|
10,039 | 11,460 | 13,662 | |||||||||
|
ARPU (in euros)
|
6.0 | 5.5 | 6.2 | |||||||||
Traffic in 2010 increased 19.2% to 13,662 million minutes compared to 11,460 million minutes in 2009, primarily due to increases in on-net traffic, corresponding to our strategy of offering better tariffs to this type of traffic as a benefit of belonging to the largest mobile network of the country.
ARPU was €6.2 in 2010 compared to €5.5 in 2009 (an increase of 0.3% in local currency), primarily due to an increased focus on contract customers.
Sales and marketing
Telefónica Móviles Perú uses a broad range of marketing channels, including television, radio, billboards, telemarketing, direct mail and Internet advertising to market its products. At December 31, 2010, approximately 80.8% of Telefónica Móviles Perú’s mobile accesses were pre-pay accesses, while approximately 19.2% were contract accesses.
In May 2009, it started to commercialize mobile broadband and launched
push to talk
in September 2009, which allows instant communications from a mobile device. Since November 2009, pre-pay commercial offers were changed to focus on each of the pre-pay clusters (defined by recharge frequency and money spent) in order to avoid revenue cannibalization.
In 2010, mobile business growth was driven by the increase of our contract customer base, driven by additional plans and migrations from pre-pay to contract. For pre-pay customers, we shifted from conducting mass campaigns to campaigns focusing on customer behavior through the
Descubre tu Promo
campaign, which offers free minutes, weekend calls and text messages.
Competition
Telefónica Móviles Perú currently has two primary competitors in the Peruvian market for mobile telephony services: Claro, owned by América Móvil, and Nextel Perú.
Telefónica’s estimated market share in the Peruvian mobile market in terms of mobile accesses was approximately 63.4% at December 31, 2010, up from approximately 62.9% at December 31, 2009.
Network and technology
At December 31, 2010 Telefónica Móviles Perú operated UMTS, GSM and CDMA technology. Its digital network is based upon the CDMA/CDMA 1XRTT standard. Telefónica Móviles Perú continued the migration to GSM technology, and at December 31, 2010, GSM accesses accounted for 93.8 % of its total customer base, which represents an increase of 0.4 percentage points from December 31, 2009.
Colombia
The following table presents, at the dates indicated, selected statistical data related to our operations in Colombia.
|
At December 31,
|
||||||||||||
|
2008
|
2009
|
2010
|
||||||||||
|
(in thousands)
|
||||||||||||
|
Fixed telephony accesses
|
2,299.2 | 1,639.8 | 1,586.9 | |||||||||
|
Internet and data accesses
|
395.9 | 428.4 | 553.6 | |||||||||
|
Narrowband accesses
|
0.3 | 5.9 | 5.6 | |||||||||
|
Broadband accesses
|
393.9 | 420.3 | 548.0 | |||||||||
|
Other accesses
|
1.7 | 2.2 | 0.0 | |||||||||
|
Mobile accesses
|
9,963.1 | 8,964.6 | 10,004.5 | |||||||||
|
Pre-pay accesses
|
8,327.3 | 7,203.2 | 7,679.1 | |||||||||
|
Pay TV accesses
|
142.3 | 127.2 | 205.3 | |||||||||
|
Final clients accesses
|
12,800.5 | 11,159.9 | 12,350.3 | |||||||||
|
Wholesale accesses
|
2.9 | 3.3 | 3.3 | |||||||||
|
Total accesses
|
12,803.4 | 11,163.2 | 12,353.6 | |||||||||
Telefónica Latin America managed a total of 12.4 million accesses in Colombia at December 31, 2010, an increase of 10.7% from December 31, 2009.
This improvement was underpinned by an increase in mobile accesses, which rose 11.6% to 10.0 million at December 31, 2010 from 9.0 million accesses at December 31, 2009. This growth was also driven by a 30.4% increase in broadband accesses to 0.5 million and a 61.4% increase in pay TV accesses to 0.2 million at December 31, 2010. Fixed telephony accesses decreased 3.2% to 1.59 million accesses at December 31, 2010 from 1.64 million accesses at December 31, 2009.
Colombian fixed business - Colombia Telecomunicaciones, S.A. ESP
Operations
Telefónica Latin America conducts its Colombian fixed telephony business through Colombia Telecomunicaciones, S.A. ESP, or Colombia Telecom, which is present in approximately 1,000 municipalities in Colombia.
Colombia Telecom reached 2.3 million accesses at December 31, 2010, which represents an increase of 6.8% from 2.2 million accesses at December 31, 2009, primarily due to the increase of 30.4% in broadband accesses to 0.5 million at December 31, 2010 from 0.4 million accesses at December 31, 2009. Fixed telephony accesses decreased 3.2% from December 31, 2009 to 1.59 million at December 31, 2010.
Colombia Telecom also launched a pay TV product using satellite technology at the beginning of 2007, allowing it to begin offering Trio bundles (voice, broadband and pay TV). As of December 31, 2010, Colombia Telecom had 0.2 million pay TV accesses, a 61.4% increase compared to December 31, 2009.
Colombia Telecom has a finance lease agreement with PARAPAT. PARAPAT is the consortium which owns the telecommunications assets and manages the pension funds for the entities which were predecessors to Colombia Telecom and regulates the operation of assets, goods and rights relating to the provision of telecommunications services by Colombia Telecom. This finance lease agreement includes the lease of the telecommunications assets and the transfer of these assets to Colombia Telecom once the last installment of the lease has been paid which, in accordance with the payment schedule, is expected to be in 2022. We are currently engaged in discussions with the Colombian government, the minority shareholder in Colombia Telecom, in order to explore different strategic alternatives and measures that could maximize value for shareholders and reinforce the capital structure of the company. These conversations include the PARAPAT lease payments structure corresponding to the usage of telecom assets.
Sales and marketing
In Colombia, Colombia Telecom uses a broad range of marketing channels, including television, radio, billboards, telemarketing, direct mail and Internet advertising to market its products. Additionally, Colombia Telecom is currently pursuing a strategy to increase market penetration, by restructuring distribution and communication channels, and by offering bundled products such as “Trio Telefónica.” Also, it restructured the commercial offer to strengthen the quality and quantity of television channels and improving broadband quality.
Competition
Colombia Telecom’s principal competitors in the Colombian market are Telmex and ETB.
Colombia Telecom had an estimated market share in the Colombian fixed telephony market of approximately 22.3% at December 31, 2010 based on number of fixed telephony accesses, virtually unchanged from approximately 22.4% at December 31, 2009.
Network and technology
Colombia Telecom continued expanding and upgrading the network to support a broader range of product and services in 2010.
Colombian mobile business – Telefónica Móviles Colombia, S.A.
Operations
At December 31, 2010 the Colombian mobile market had an estimated penetration rate of 98.3%, an increase of 5.4 percentage points from December 31, 2009.
Telefónica Latin America conducts its Colombian mobile business through Telefónica Móviles Colombia, S.A., or Telefónica Móviles Colombia, whose customer base increased by 11.6% from December 31, 2009 to 10.0 million accesses at December 31, 2010. At December 31, 2010, approximately 23.2% of our mobile accesses in Colombia were contract accesses, compared to 19.6% at December 31, 2009.
|
Year ended December 31,
|
||||||||||||
|
2008
|
2009
|
2010
|
||||||||||
|
Traffic (millions of minutes)
|
13,568 | 13,665 | 16,226 | |||||||||
|
ARPU (in euros)
|
6.8 | 5.9 | 7.2 | |||||||||
Traffic in 2010 increased 18.7% to 16,226 million minutes compared to 2009.
ARPU was €7.2 in 2010 compared to €5.9 in 2009 (an increase of 2.0% in local currency).
Sales and marketing
Telefónica Móviles Colombia uses a broad range of marketing channels, including television, radio, billboards, telemarketing, direct mail and Internet advertising to market its products.
Competition
Telefónica Móviles Colombia currently has two primary competitors in the Colombian market for mobile communications services: Comcel, which is owned by América Móvil, and Colombia Móvil, who operates under the brand “Tigo” and is owned by Millicom.
Telefónica Móviles Colombia’s estimated market share in the Colombian mobile market in terms of mobile accesses was approximately 22.4% at December 31, 2010, up from approximately 21.3% at December 31, 2009.
Network and technology
TDMA was switched off during 2008 and the CDMA network was switched off in 2010. The GSM network continued to increase coverage.
Atento—Contact Center Business
Atento offers a wide range of services and solutions aimed at managing companies’ relations with customers throughout their life cycle. In addition to offering customer services, Atento provides back-office services, technical support, credit and collection management, and tailor-made solutions for the various business segments it serves. During 2010, Atento continued to diversify its client base, serving companies in the telecom, financial, consumer and energy sectors, as well as public institutions. At December 31, 2010, Atento operated more than 100 contact centers and had 151,896 contact center personnel in 17 countries on three continents, including Europe (Spain and Czech Republic), Latin America, the United States and North Africa (Morocco).
Strategic Partnerships
China Unicom
Since 2005, we have had a stake in China Unicom and its predecessor company. On September 6, 2009 we entered into a strategic alliance agreement with China Unicom, which provides for, among other areas for cooperation, joint procurement of infrastructure and client equipment, common development of mobile service platforms, joint provisions of service to multinational customers, roaming, research and development, sharing of best practices and technical, operational and management know-how, joint development of strategic initiatives in the area of network evolution, joint participation in international alliances and exchanges of senior management. In furtherance of this strategic alliance we entered into a subscription agreement with China Unicom, pursuant to which we increased our voting interest in the share capital of China Unicom to 8.06% and China Unicom obtained 0.87% voting interest in our share capital in October 2009.
Pursuant to the strategic alliance agreement mentioned above, China Unicom has agreed to use its best endeavors to maintain a listing of all the issued ordinary shares of China Unicom on the Hong Kong Stock Exchange. For so long as the strategic alliance agreement with us is in effect, China Unicom shall not (i) offer, issue or sell any significant number of its ordinary shares (including treasury shares), or any securities convertible into or other rights to subscribe for or purchase a significant number of China Unicom’s ordinary shares (including treasury shares), to any current major competitor of Telefónica or (ii) make any significant investment, directly or indirectly, in any current major competitor of Telefónica. We have made similar undertakings.
The strategic alliance agreement between us and China Unicom terminates on September 6, 2012 subject to automatic annual renewal, subject to either party’s right to terminate on six months’ notice. Also, the strategic alliance agreement may be terminated by China Unicom if our shareholding in China Unicom drops below 5% of its issued share capital or if China Unicom’s shareholding in us drops below 0.5% of our issued share capital. In addition, the strategic alliance agreement is subject to termination in the event either party is in default and automatically terminates on a change in control of China Unicom.
To enhance our already existing strategic alliance with China Unicom, on January 23, 2011, Telefónica and China Unicom entered into the Enhanced Strategic Alliance Agreement pursuant to which both companies agreed to strengthen and deepen their strategic cooperation in certain business areas and each party agreed to invest the equivalent of $500 million ordinary shares of the other party into the alliance. The transaction was completed by China Unicom on January 28, 2011 with its acquisition of 21,827,499 Telefónica shares, which represents approximately 1.37% of Telefónica’s voting share capital. Furthermore, we have undertaken to propose at our next General Shareholders’ Meeting the appointment of a director nominated by China Unicom. We have a nine-month period following the execution of this agreement to complete the acquisition from third parties of such a number of China Unicom shares representing an aggregate consideration of $500 million. Following completion of the transaction, we will own approximately a 9.7% of China Unicom’s voting share capital. Telefonica is in the process of making the required investment in China Unicom, and its final ownership percentage of China Unicom's voting capital after such investment may vary from the foregoing as it will depend upon the prevailing share prices at which the investment is made. As of the date of such Agreement, we held shares representing 8.37% of China Unicom’s voting share capital and since 2008 Mr. Cesar Alierta is a member of its board of directors.
Telecom Italia
Through a series of transactions from 2007 through 2009, we acquired an indirect holding of 10.49% in the voting shares of Telecom Italia (7.21% of the dividend rights) through our holdings in Telco. The Telecom Italia group is principally engaged in the communications sector and, particularly, in telephone and data services on fixed lines for final and wholesale customers, in the development of fiber optic networks for wholesale customers in the provision of broadband services and Internet services, in domestic and international mobile telecommunications (especially in Brazil), in the television sector using both analog and digital terrestrial technology and in the office products sector. Telecom Italia operates primarily in Europe, the Mediterranean basin and in South America.
For more information, please see “Item 4. Information on the Company —History and Development of the Company—Recent Developments,” “Item 5. Operating and Financial Review and Prospects —Operating Results—
Significant Factors Affecting the Comparability of our Results of Operations in the Period Under Review” and “Item 10. Additional Information—Material Contracts.” Telco, through which we hold our stake in Telecom Italia, is included in our consolidated financial statements using the equity method.
Regulation
As a telecommunications operator, we are subject to sector-specific telecommunications regulations, general competition law and a variety of other regulations. The extent to which telecommunications regulations apply to us depends largely on the nature of our activities in a particular country, with traditional fixed telephony services usually subject to more extensive regulations, which can have a direct and material effect on our business areas, particularly in countries that favor regulatory intervention.
To operate our networks, we must obtain general authorizations, concessions or licenses from national regulatory authorities, or NRAs, in those countries in which we operate. Licensing procedures also apply to our mobile operations with respect to radio frequencies. The duration of any particular license or spectrum right depends on the legal framework in the relevant country.
Electronic Communication Regulation in the EU
The EU legal framework for electronic communications services has been developed with the aim of reinforcing the liberalization of the market and improving the functioning of the EU internal market for telecommunications networks and services, which culminated in the adoption of the 2002 EU regulatory framework for electronic communications sector (the “EU Framework”). Such regulatory framework has been subsequently modified in order to take into account technological changes through the adoption of certain new rules by the European Parliament and the Council during the end of 2009. On December 18, 2009 Regulation 1211/2009/EC was published, establishing the framework for the creation of a European regulatory body for the telecommunications industry. The Directive of Better Regulation (Directive 2009/136/EC), which was also published on the same date, modifies the following directives: (i) Directive 2002/21/EC of 7 March 2002 on a common regulatory framework for electronic communications networks and service (“Framework Directive”); (ii) Directive 2002/20/EC of the European Parliament and of the Council of 7 March 2002 on the authorization of electronic communications networks and services (“Authorization Directive”); (iii) Directive 2002/19/EC of the European Parliament and of the Council of 7 March 2002 on access to, and interconnection of, electronic communications networks and associated facilities (“Access Directive”).
The passage and subsequent publication on December 18, 2009 of Directive 2009/140/EC, on citizens’ rights (“Citizens’ Rights Directive”) modifies Directive 2002/22/EC of the European Parliament and of the Council of 7 March 2002 on universal service and users’ rights relating to electronic communications networks and services (“Universal Service Directive”) and the e-Privacy Directive (2002/58/EC) (the “e-Privacy Directive”) complements and supplements the more general provisions of the Data Protection Directive in the area of electronic communications. It provides for basic obligations to ensure the security and confidentiality of communications over EU electronic communications networks and gives consumers a set of tools to protect their privacy and personal data. These Directives set forth the main principles and procedures that NRAs should follow with respect to regulation for the provision of electronic communications services. The EU Framework establishes an authorization regime containing measures to ensure the universal provision of basic services to consumers and sets out the terms on which providers may access each other’s networks and services.
In 2006, the European Union established a new regulation regarding retention of electronic communications data in order to ensure that electronic communication data are available for the purpose of the investigation, detection and prosecution of serious crimes. These data retention rules set minimum standards for the type of data to be retained and the retention period. The initial impact of this new regulation is estimated to be significant, although it will depend on the requirements established at the national level and the extent to which operators will be compensated for the costs associated with its implementation. Some European countries, such as Spain and Germany, have already adopted the new regulation at the national level. In Spain, operators shall retain data from their pre-pay customers and extend the data retention period. In Germany the implementation of such regulations has been legally challenged for constitutional reasons and until a decision is made, it will not be applicable. For
further information regarding the matters discussed above and other aspects of the regulatory risks derived from the new regulation, see “Item 3. Key Information—Risk Factors—Risks related to our business.”
Notably, the EU Framework also harmonizes the rules for deciding when regulation may be imposed on electronic communications providers. In particular, it provides that electronic communications providers can generally only be subject to specific regulation in markets in which they have “significant market power,” or SMP. The concept of SMP, for these purposes, has been aligned to the competition law concept of dominance, which essentially means a market position which allows a company to act independently of customers, suppliers and competitors.
Accordingly, the European Commission has identified in a Recommendation a list of relevant markets whose conditions may justify the application of
ex ante
specific regulation. The Recommendation was published on February 2003 and it has been modified by another Recommendation published in December 2007, which reduces the relevant markets from 18 to seven. In order to determine whether a company has SMP in any of the markets identified in the Recommendations, NRAs must conduct a market analysis for the relevant market. When an NRA determines a company has SMP in a relevant market, that NRA must impose at least one obligation relating to price control, transparency, non-discrimination, accounting separation or access obligations.
Regulation with respect to voice roaming tariffs in the EU entered into force on June 30, 2007. The regulation introduces a maximum level for the charges that operators may levy at wholesale level as well as maximum retail ceilings (referred to “Eurotariff”) for making and receiving calls while roaming in the EU. In 2009 Regulation 544/2009 was also adopted, which extended tariff regulation through 2012 and also extended the scope of the previous roaming regulation to cover SMS and data services. The wholesale tariff price cap has been set at €0.26 per minute (excluding VAT) from July 2009 and will continue to decrease to €0.22 and €0.18 from July 2010 and from July 2011, respectively. The retail tariff price cap (excluding VAT) has been set at €0.43 per minute for making a call and €0.19 per minute for receiving a call from July 2009, and these prices will continue to decrease for making a call to €0.39 and €0.35, and for receiving a call to €0.15 and €0.11 from July 2010 and from July 2011, respectively. In addition, the new regulation mentioned above limits the price for sending a text message for wholesale and for customers roaming within the EU at €0.04 and at €0.11, respectively. Moreover, the regulation subjects the cost of data transfers to a maximum wholesale cap of €1.00 per megabyte downloaded from August 2009. This cap will be reduced to €0.80 from July 2010 and to €0.50 from July 2011. Receiving an SMS in another EU country will remain free of charge. The new rules will also require that operators protect consumers from “bill shocks” by introducing a cut-off mechanism once a customer’s bill reaches €50 (unless a customer chose another cut-off limit). This cut-off mechanism, along with per second billing after the first 30 seconds for calls made and immediately for calls received must be implemented by March 31, 2010. The Commission will complete a full review of the EU roaming rules by June 30, 2011 and will assess the extent to which the objectives of the rules, including addressing competition in roaming services, have been met.
In addition, the European Parliament and the Council approved Directive 372/87/EC amending Council Directive 87/372/EEC on the frequency band 900 MHz in order to allow the use of such band by systems capable of providing electronic communication services not limited to GSM. Finally, the Commission also adopted a Recommendation on termination rates for mobile and fixed networks.
EU Competition Law
The EU’s competition rules have the force of law in EU Member States and are, therefore, applicable to our operations in EU Member States.
The EC Treaty prohibits “concerted practices” and all agreements for undertakings that may affect trade between Member States and which restrict, or are intended to restrict, competition within the EU. It also prohibits any abuse of a dominant competitive position within the common market of the EU, or any substantial part of it, that may affect trade between Member States.
The EU Merger Regulation requires that all mergers, acquisitions and joint ventures involving participants meeting certain turnover thresholds be submitted to the EU Commission for review, rather than to the national competition authorities. Under the amended EU Merger Regulation, market concentrations will be prohibited if they
significantly impede effective competition in the EU common market. European Commission and the EU Competition Commissioner are granted the authority to apply the European Competition framework.
Similar competition rules are set forth in each EU Member State’s legislation and are enforced by each of their national competition authorities, or NCAs. All European countries where we have activities and referred to below are Member States of the EU.
Telefónica Spain
Spain
General regulatory framework
The legal framework for the regulation of the telecommunications sector in Spain is principally governed by the General Telecommunications Law (32/2003) and several Royal Decrees. The General Telecommunications Law, among other things, sets forth rules regarding the new system of notification for electronic communications services, establishes the terms by which operators interconnect their networks, defines the universal service provision regime and subjects providers with SMP in particular telecommunications markets to specific obligations.
The Spanish Government has produced a draft which amends the current General Telecommunications Law (32/2003) and implements the new European Telecomm Package. The principal change is the introduction of functional separation as a measure that can be imposed in exceptional circumstances upon operators with a dominant position.
Regulatory supervision
The Telecommunications Market Commission, or the CMT, is the NRA responsible for regulating the telecommunications and audiovisual service markets in Spain. The CMT supervises the specific obligations imposed on operators in the telecommunications market, and it has the requisite power to enforce its decisions whenever necessary.
The Framework Directive requires that NRAs have the power to issue binding decisions to resolve disputes arising in connection with obligations imposed under the regulatory framework.
The Spanish regulatory framework explicitly acknowledges the right for third parties who are affected by a Spanish NRA decision to challenge this decision before the appeal body.
Licenses and concessions
Pursuant to the EU Framework, parties intending to operate a telecommunications network or engage in the provision of electronic communication services must notify the CMT prior to commencing such activity. The CMT will register the telecommunications operator in the Public Operator Registry. Every three years, operators must notify the CMT of their intention to continue offering electronic communications services or operating telecommunications networks.
Concessions to use spectrum are awarded on a non-discriminatory basis by way of a competitive procedure. Telefónica Móviles España is entitled to provide mobile services on several spectrum bands. Our main concessions are:
|
Technology
|
Duration
|
Ending Date
|
Extension Period
|
|||
|
GSM 900
|
5 years
|
February 3, 2015
|
--
|
|||
|
E-GSM 900
|
15 years
|
June 6, 2020
|
5 years
|
|||
|
DCS-1800
|
25 years
|
July 24, 2023
|
5 years
|
|||
|
UMTS
|
20 years
|
April 18, 2020
|
10 years
|
Telefónica Móviles España has obtained the extension of the GSM 900 right of use until February 3, 2015.
In April 2011, the Spanish Government has adopted a Royal Decree that includes the procedures for the refarming of the 900 and 1800 MHz bands (technology and service neutrality) and announces new award procedures for the 900, 800, 1800 and 2600 MHz bands within the second quarter of 2011.
The Government will assign by an auction process two blocks (of 5 and 4.8 MHz) in the 900 MHz band (available in February 2015). The initial auction price per block in the 900 MHz band will be €169 million. As part of the Digital Dividend, it will also assign by an auction process six blocks of 5 MHz in the 800 MHz band, which will not be available before the end of 2014.The initial auction price per block in the 800 MHz band will be €170 million. Finally in the 2.6 GHz band, the Government will assign by an auction process 2x70 MHz (FDD) and 50 MHz (TDD), with national and regional coverage (available in 2011).
This Royal Decree has established a spectrum cap of 20 MHz below 1GHz and another spectrum cap of 115 MHz spectrum above one GHz (in 1800, 2100 and 2600 MHz bands). The principle of neutrality will apply to technology and services, moreover spectrum trade will be allowed in those bands.
Market analysis
In accordance with the EU Framework, the CMT should identify those markets which lack effective competition, in which case it would impose specific obligations upon operators with SMP. During 2008, the CMT conducted a second round of market analyses to determine which operators have SMP in which markets, the results of which are described below.
Fixed markets
Retail access to the public telephone network at a fixed location market; Retail market for calls at a fixed location and Retail lease lines market
In March 2006, and following a market analysis, the CMT concluded that Telefónica de España is an operator with SMP in the provision of retail access to the public telephone network service at a fixed location market. As an SMP operator, Telefónica de España has certain specific obligations and is subject to certain restrictions, the most relevant of which are maximum price caps for installation and monthly fees. Telefónica de España also has obligations regarding carrier selection, cost accounting and accounting separation.
Offerings of Telefónica de España are also subject to limitations regarding the maximum and minimum amounts in connection with promotions. These limits are updated every 6 months.
Wholesale fixed call origination market
On March 22, 2007, the CMT adopted new regulations concerning call origination on the wholesale fixed call origination market, introducing additional obligations for Telefónica de España to provide wholesale access to its fixed network to other operators, allowing competitors to use its networks to provide access services and other associated services to their customers.
In December 2008, the CMT concluded that Telefónica de España is an operator with SMP in this market and it has requested that Telefónica de España offer wholesale service to assist other operators in offering IP telephony services and provide transparent information of migration to Next Generation Networks, or NGN, centrals, which implies the provision of broad information to competitors about network evolution.
Fixed call termination market on individual networks
As an operator with SMP in fixed call termination market on individual networks, Telefónica de España is required to submit an “Interconnection Reference Offer (OIR)” outlining the terms and conditions under which it will interconnect with other operators.
In December 2008, the CMT concluded that Telefónica de España is an operator with SMP in this market. The CMT maintained its obligations for Telefónica de España to submit an Interconnection Reference Offer (OIR). The
CMT also added the obligation that Telefónica de España provide transparent information with respect to migration to NGN centrals, which implies the provision of broad information to competitors about network evolution.
In addition, on November 25, 2010 the CMT approved a modification of the Telefónica Interconnection Reference Offer (RIO), reducing interconnection prices paid by alternative operators for call termination in Telefónica network.
Mobile market
Mobile voice call termination
In September 2006, the CMT established a progressive reduction schedule for MTRs (the “glide path”) from October 2006 to September 2009. In July 2009, the CMT established a new glide path for mobile voice call termination rates with an objective price of €0.04 per minute by April 2012, through which the mobile voice call termination rates of the four Spanish mobile operators will converge by 2012.
In December 2008, Telefónica Móviles España was again identified by the CMT as an operator with SMP in mobile voice call termination on individual mobile networks, and therefore continues to be subject to the obligations already imposed on it by the CMT and as well as the additional obligation to charge for seconds of usage according to a single termination price established by the CMT.
Mobile voice call origination
MVNOs are mobile operators that are not entitled to use spectrum for the provision of mobile services. Consequently, they must reach an access agreement with a mobile network operator in order to provide mobile access to their customers.
On February 2, 2006, the CMT established that mobile network operators collectively hold a dominant position in the mobile access and voice call origination market. Mobile operators are, therefore, obliged to negotiate reasonable access to their network upon request from an MVNO, charging reasonable prices for access services provided. MVNOs and mobile operators negotiate an access agreement on a commercial basis. If parties are unable to reach an agreement independently, the CMT may intervene to resolve the dispute.
Wholesale (physical) network infrastructures access
In January 2009, the CMT concluded that Telefónica de España is an operator with SMP in the wholesale (physical) network infrastructures access market, and imposed the following obligations on Telefónica de España: access to full and shared unbundled access to copper loops, sub-loops and ducts, cost oriented tariffs and accounting separation, transparency and non-discrimination obligations including an “Unbundling Reference Offer” and a “Ducts Reference Offer.” In February 2008, the CMT imposed similar obligations with respect to vertical access to buildings.
Wholesale broadband access
In January 2009, the CMT identified Telefónica de España as an operator with SMP in the wholesale broadband access market, and consequently the CMT has imposed on Telefónica de España the obligation to provide wholesale broadband access service until 30 Mbps to other operators in copper and fiber infrastructure. The CMT also obliges Telefónica de España to publish a wholesale broadband access reference offer, provide cost-oriented tariffs and accounting separation, non-discrimination in network access and to communicate broadband retail changes in services prior to offering them in the market.
On November 16, 2010 the CMT approved a new wholesale broadband offer (new broadband ethernet service, or NEBA), which will allow alternative operators to provide retail services to consumers more independently from Telefónica retail offers. Telefónica proposed prices for these wholesale services in March 2011 and we are currently awaiting approval by the CMT
.
Until the NEBA service is available, Telefónica will offer its FTTH retail services for resale through third parties.
Universal service obligations
The General Telecommunications Law outlines provisions to ensure that certain basic telecommunications services are guaranteed to all Spanish citizens.
Universal service is defined, under the law, as a set of communication services guaranteed to all end users, irrespective of their geographic location, of a determined quality and at an affordable price. Universal service ensures that all citizens receive a connection to the fixed line public network and network services, a telephone directory service, a sufficient number of public telephones and functional Internet access. Additional provisions are included under the scope of universal service obligation, or USO, in order to ensure that users with disabilities and special social needs, including those with low incomes, have access to the services enjoyed by the majority of users.
In December 2008, following applications by three operators, Telefónica de España was awarded a tender for the provision of directory enquiry services for a period of three years and it has also been designated for the provision of the remaining universal service elements until a new tender process takes place. A new tender process is expected to take place during the third quarter of 2011.
To finance the USO, the General Telecommunications Law stipulates that the CMT must determine whether the net cost to provide universal service implies an unfair burden for the operators. On September 2008, the CMT published a resolution which established net cost of USO for the years 2003, 2004 and 2005, the obligation of operators to contribute to USO funding and the amount of contributions these operators must make. During 2009, the CMT established the net cost of USO for the years 2006 and 2007.
The Sustainable Economy Law, adopted in March 2011, has introduced the obligation to offer a data connection of broadband at a 1 Mb speed as part of the universal service scope
.
Protection of consumers
On December 29, 2006, Law 44/2006 regarding the protection of consumers and users was approved. Under this law, users may only be charged for services actually used. Consequently, operators can only charge for the exact seconds of usage. On May 22, 2009 a set of User’s Rights was adopted through secondary legislation and it constitutes a holistic approach to users’ rights. Most of the content has been extracted from the General Telecommunications Law 32/2003 (LGT), Royal Decree 424/2005 of April 15, 2005 (RSU) and Order ITC/912/2006 (Quality Order).
Service quality
On March 29, 2006, a regulation was approved which established certain quality of service, or QoS, obligations for electronic communications service providers such as including service level agreements, or SLAs, commitments in electronic communication retail contracts. This regulation also requires operators to provide adequate information to customers in relation to service quality levels and detailed billing disclosure to customers. Additionally, a standardized process for billing customers has been implemented under this regulation.
Data retention for law enforcement purposes
The 2006 Directive 2006/24/EC of the European Parliament and of the Council on the retention of data generated or processed in connection with the provision of publicly available electronic communications services or of public communications networks (“Data Retention Directive”) was incorporated into Spanish legislation on November 9, 2007. Electronic communications operators are obliged to ensure the retention of data on electronic communications for a period of twelve months.
Additionally, Spain has implemented a register of pre-pay mobile customers in conjunction with these requirements. Existing pre-pay customers have a period of two years for the registration since the law entered into force and the new clients must be registered immediately.
Public Broadcasting TV funding mechanism
In August 2009, the Spanish Parliament approved a new funding policy for public television, Radio Televisión Española (“RTVE”), which includes the discontinuation of advertising on public television. The law includes a tax on telecommunications companies and television stations to help fund the phasing out of advertising on RTVE.
The law applies a tax of 0.9% on the gross revenue of telecommunications companies providing audiovisual services in Spain and 3.0% in the case of regular TV broadcasters. Pay television stations will pay 1.5% of their gross revenue. Both the Spanish regulator and competition authority questioned the legality of this funding mechanism in light of the national and European regulatory framework. The EU Directorate General of Competition concluded that such funding mechanism did not constitute illegal state aid. Without prejudice to the state aid investigation initiated in December 2009, the European Commission sent on March 18, 2010 a formal request for information to the Spanish government over the new charge imposed on telecommunications operators to offset the discontinuation of advertising on RTVE. The Commission is concerned that this administrative charge, based on authorized operators’ gross revenue, may be incompatible with EU law since it does not appear to be related to costs arising from regulatory supervision. In March 2011, the Commission issued its decision to continue with the infringement procedure and referred the case to the European Court of Justice.
General Audiovisual Law
In May 2010, the Spanish Parliament approved a new General Audiovisual Law, supplanting the EU legal framework (Audiovisual Media Services Directive), which regulates the audiovisual service market (linear and non-linear services). It provides the rights and obligations in connection with the provision of different types of audiovisual services and creates a new National Audiovisual Counsel in charge of ensuring the fulfillment of such obligations by operators.
Telefónica Europe
United Kingdom
The EU Regulatory Framework was implemented in the United Kingdom by the Communications Act in 2003. Under this act, responsibility for the regulation of electronic communications networks and services rests with the Office of Communications, or Ofcom.
Licenses and concessions
Telefónica O2 UK has provided GSM services since July 1994. In January 2011 its license was re-issued to allow UMTS to be deployed at both 900MHz (2 x 17.4 MHz) and 1800MHz (2 x 5.8MHz) frequencies. The license was also amended to extend the minimum notice period to five years; the license retains its indefinite duration. In April 2000 Telefónica O2 UK was awarded a UMTS license, which expires on December 31, 2021 (2 x 10 MHz + 5 MHz). On February 2, 2011, Ofcom issued a notice proposing to amend this license to provide for an indefinite duration (subject to five years notice after the end 2021) in exchange for a commitment to provide greater population coverage. Telefónica O2 UK is not obliged to accept this variation, but may opt to apply for it. Such negotiation is still pending.
The license can be surrendered by the operator at any time. However, Ofcom can only revoke the license if the licensee does not pay its fees, there has been a breach of the license or for reasons related to the management of the radio spectrum, provided that in such case the power to revoke may only be exercised after one year’s notice is given in writing and after Ofcom has considered any pertinent factors. The UK government may also revoke the license for national security reasons or in order to comply with the United Kingdom’s EU or other international obligations.
Future spectrum
Ofcom has published its proposals for the award of 800MHz and 2.6GHz spectrum. In these proposals, Ofcom seeks to ensure that at least four carriers hold a minimum spectrum portfolio deemed sufficient to provide high
quality data services. Ofcom plans to pursue these goals through an elaborate auction structure that incorporates spectrum “floors” and safeguard caps. Ofcom has scheduled the auction for the first quarter of 2012.
Market reviews
Currently, the mobile termination charges that Telefónica O2 UK, Vodafone and Everything Everywhere (the merged entity operating the T-Mobile and Orange brands) levy must not exceed 4.42ppm, on average. H3G must not exceed 4.75ppm.
The current regime expires on 31 March 2011. Ofcom has recently decided to reduce termination rates to 0.69 pence per minute (in real 2008/09 terms), starting with a reduction to 2.984 pence per minute from April 1, 2011. In each of the subsequent three years (i.e. from April 1, 2012, 2013 and 2014), termination rates will fall by 37.4% minus inflation.
Germany
The EU Regulatory Framework was implemented in Germany at the end of June 2004 by the Telecommunications Act. Responsibility for regulation of electronic communications networks and services rests with the telecommunications regulator, Budesnetzagentur, or BNetzA.
Licenses, concessions and frequency usage rights
Telefónica O2 Germany was awarded a GSM license for 1800 MHz spectrum in October 1998, and in February 2007 Telefónica O2 Germany was awarded 900 MHz GSM spectrum for GSM use. Accordingly, Telefónica O2 Germany is now licensed to use GSM900 (2 x 5 MHz) and GSM 1800 (2 x 17.4MHz). The GSM license expires on December 31, 2016.
Under Section 58 VIII TKG (the “German Telecommunications Act”) frequency assignments are limited in time, although a renewal or extension of the term is possible. The federal network agency has not yet decided on the conditions for renewing the frequency assignments. However, before expiration, we expect there to be a public hearing, and for BNetzA to set out its approach to renewal, including the terms on which the licenses will be extended (pricing, technology neutrality, etc.).
In August 2000, Telefónica O2 Germany was awarded a UMTS license, which expires on December 31, 2020 (2 x 9.9 MHz).
In May 2010, Telefónica O2 Germany was awarded spectrum for an amount of approximately €1,379 million, including 10 MHz of Digital Dividend, 20 MHz of 2.6 GHz (paired), 10 MHz 2.6 GHz (unpaired), 5 MHz 2.0 (paired), 20 MHz 2.0 (unpaired), frequency usage rights expire on December 31, 2025. This spectrum is technologically neutral (can be used for each technology).
In March 2011, the German Federal Administrative Court granted in part an appeal by Eplus, challenging the auction decision and has referred the claim to a lower court.
Market reviews
In August 2006, BNetzA completed its review of voice call termination on individual mobile networks and concluded that, as an operator with SMP, the charges Telefónica O2 Germany made to other operators for terminating calls on Telefónica O2 Germany network had to be reduced, requiring Telefónica O2 Germany to lower its call termination charges from €1.24 per minute to €0.994 per minute. In 2007, Telefónica O2 Germany was required to reduce further its termination charges from €0.994 per minute to €0.880 per minute. Telefónica O2 Germany has brought legal challenges against BNetzA’s 2006 and 2007 decision that Telefónica O2 Germany has significant market power and against the imposition of regulatory remedies. The Federal Administrative Court, as the highest level of appeal, confirmed all regulatory remedies meaning that the price controls stay in force for all mobile operators. All four German mobile operators filed a Constitutional Complaint in order to challenge the decision regarding significant market power. All other actions (regarding the amount of MTRs) are pending and a decision by the Constitutional Court. The new market analysis of BNetzA in 2008 again concluded that all mobile
network operators have SMP, and the decision on remedies does not contain changes in comparison to 2006. This 2008 decision has also been challenged by Telefónica O2 Germany. The claim has been suspended until a decision of the Constitutional Court has been issued
.
In March 31, 2009 and as of April 1, 2009, BNetzA approved MTR for Telefónica O2 Germany at €0.714 per minute for a period of 20 months (until November 30, 2010) Telefónica O2 Germany challenged that decision and the claim has been suspended pending the Constitutional Court’s decision.
Subsequently BNetzA developed its own cost model and imposed it on all 4 MNOs to be the basis for the calculation of MTRs in 2010.
Since December 2010, BNetzA decreased MTRs significantly: 3.39 c/min for Telefónica O2 Germany; 3.36 c/min for Vodafone and Eplus; 3.38 c/min for T-Mobile. Telefónica O2 Germany challenged that decision and its claim is pending. These prices will be applicable until November 2012.
Spectrum
BNetzA decided in February 2006 that Telefónica O2 Germany may use GSM 900 spectrum in exchange for GSM 1800 spectrum. This decision is under the condition that Telefónica O2 Germany provides access to spectrum to German Railways if it is necessary for the European Train Control System (ETCS). Telefónica O2 Germany took legal action against this condition. In the meantime, this condition was repealed by BNetzA in April 2009, and therefore, Telefónica O2 Germany declared the case as settled. However, German Railways, Airdata and Inquam (providers of local networks) appealed the decision. All cases have been dismissed in the first instance in December 2007 and each party appealed its decision. In the German Railways case, the Higher Administrative Court dismissed the appeal of German Railways on September 16, 2009. German Railways did not appeal this decision at the Federal Administrative Court, and the decision is legally binding. In the Airdata case, the appeal to the Higher Administrative Court has been dismissed. Airdata is now appealing at the Federal Administrative Court. The appeal was dismissed by the Federal Administrative Court on January 16, 2011. The decision is legally binding and no further challenge is possible. In the Inquam case, the Administrative Court dismissed the claim of Inquam on October 21, 2009, and the decision is legally binding with no further challenge possible.
Czech Republic
The EU Regulatory Framework was implemented in the Czech Republic in 2005 by the Electronic Communications Act. Responsibility for regulation of electronic communications networks and services rests with the Czech Telecommunication Office, or CTO. Governmental responsibility for the area of electronic communications lies with the Ministry of Industry and Trade.
Telefónica O2 Czech Republic performs communication activities under the Electronic Communications Act pursuant to a notification to and a certificate Number 516 from the CTO, as amended by Numbers 616/1, 516/2 and 516/3.
Several changes occurred in the legal environment of the electronic communications market in the Czech Republic in 2010. Act No. 127/2005 Coll. on electronic communications and on amendment of related laws was amended by the Act No. 153/2010 Coll., mainly in respect of spectrum allocation and universal service financing. Furthermore, the Decree No. 105/2010 Coll., pertaining to frequency band allocation (national frequency table), the Decree No. 318/2010 Coll., pertaining to the collection of traffic and localization data statistics and their submission to be submitted to the Czech Telecommunication Office, the Decree No. 360/2010 Coll. pertaining to the draft electronic form complaint to be submitted to the Czech Telecommunication Office and the Decree No. 22/2011 Coll., pertaining to measuring the coverage of radio and television broadcasting were enacted.
Licenses and concessions
Telefónica O2 Czech Republic provides mobile electronic communications services in the 900 and 1800 MHz frequency bands under the GSM standard on the basis of radio frequency assignments from CTO valid until February 7, 2016; in the 2100 MHz frequency band under the UMTS standard on the basis of radio frequency assignments from CTO valid until January 1, 2022; and in the 450 MHz frequency band using CDMA 2000 (Code Division Multiple Access, or CDMA) technology on the basis of radio frequency individual authorization from CTO valid until November 30, 2013. The CDMA 2000 (450 MHz) frequency assignment expired on February 7, 2011. Telefónica O2 Czech Republic applied for prolongation in accordance with the assignment on August 7, 2010. CTO rejected the application primarily on procedural grounds, despite the fact that the assignment grants the holder
a specific right to apply for prolongation. Telefónica O2 Czech Republic appealed to the CTO Council. A decision on the appeal is pending.
In March 2009 CTO conducted a tender for 32 free channels in the former E-GSM band. Telefónica O2 Czech Republic was awarded seven channels in June 2009 with the same conditions as former GSM900 allotment (including date of expiration). The fee for Telefónica O2 Czech Republic’s seven channels was CZK 29,654,000.
Market reviews
CTO finished its second review of relevant markets in 2010. Following these analyses, Telefónica O2 Czech Republic was designated as an SMP entity in 7 relevant markets: 1 retail market (access to the public telephone network at a fixed location) and 6 wholesale markets (call origination on the public telephone network provided at a fixed location; call termination on individual public telephone networks provided at a fixed location; wholesale (physical) network infrastructure access (including shared or fully unbundled access) at a fixed location; wholesale broadband access; wholesale terminating segments of leased lines; and voice call termination on individual mobile networks).
On April 21, 2010 CTO issued a decision requiring mobile operators to gradually reduce call termination charges (to 1.66 Czech Koruna per minute from July 1, 2010, to 1.37 Czech Koruna per minute from January 1, 2011 and to 1.08 Czech Koruna per minute from July 1, 2011).
In May 2010 CTO requested proposals for consultancy services for the development and implementation of an LRIC model (regulation of mobile call termination charges is currently based on an FAHC model) for the regulation of mobile call termination charges, won by PricewaterhouseCoopers Ceska republika. It is expected that CTO will set mobile call termination charges based on the LRIC model at the end of 2012 or beginning of 2013.
Future spectrum
CTO held a public consultation on spectrum strategy in 2010. Subsequently, CTO submitted to the Government for approval a document outlining the main principles applicable to the upcoming auction of spectrum bands dedicated to mobile broadband services. The document was approved by the Government in January 2011. CTO will organize a combined auction for available spectrum in 800MHz (Digital Dividend), 1800MHz (GSM1800) and 2.6 GHz bands. A spectrum cap per operator is proposed for spectrum below 1GHz (i.e. combined cap for 800MHz and 900MHz band assignments). Specific auction conditions and spectrum caps have not been defined thus far and are expected in the third quarter of 2011.
Slovakia
Telefónica O2 Slovakia performs electronic communication activities under Act No. 610/2003 Coll., the Electronic Communications Act, (as amended) and General Authorization (as amended) issued by the Slovak NRA (the Telecommunications Office of Slovak Republic) based on a notification, as well as a number of allocation certificates issued by the NRA.
Responsibility for regulation of electronic communications networks and services rests with the Telecommunication Office of Slovakia. Governmental responsibility for the area of electronic communications lies with the Ministry of Transport, Construction and Regional Development of Slovakia.
Licenses and concessions
On September 7, 2006, Telefónica O2 Slovakia was granted a license to provide electronic communications services by the means of the public electronic communications network using the GSM and UMTS mobile telephone network standards and became a third mobile operator in Slovakia after 10 years of duopoly of two original mobile operators. The license has been granted for 20 years and expires in September 2026. The commercial operations were launched on February 2, 2007.
Market analysis
In accordance with the market review performed by the NRA, Telefónica O2 Slovakia has been designated an SMP operator on the wholesale mobile termination market, the only regulated mobile market in Slovakia. Wholesale termination price regulation is effective from August 2009, and since February 2010 the wholesale termination price regulation is based on the EU benchmarking methodology. From September 2009, Telefónica O2 Slovakia as a new entrant and market challenger also benefits from a shorter mobile number portability process, a maximum length of which was set by the regulator to five working days. No retail price regulation is applicable in Slovakia.
Future mobile spectrum
A tender for 800MHz and 2600MHz bands suitable for 4G/LTE is expected in 2011.
Ireland
In Ireland responsibility for the regulation of electronic communications networks and services rests with the Commission for Communications Regulation, or ComReg. The main legislation under which Telefónica O2 Ireland operates includes: the Wireless Telegraphy Act 1926, as amended, (45 of 1926), Post and Telecommunications Services Act 1983 as amended, (24 of 1983), Communications Regulation Acts 2002 (20 of 2002) and 2007 (22 of 2007), 3G Mobile Telephony Licensing Regulations (340 of 2003) and GSM Mobile Telephony Licensing Regulations (339 of 2003).
Licenses and concessions
Telefónica O2 Ireland has provided GSM services since March 1997 after having been awarded a license in May 1996. Its GSM900 license has a duration of 15 years (GSM900: 2 x 7.2 MHz) from 1996. In 2000 it was awarded an additional GSM 1800 license (2 x 14.4 MHz), which also has a term of 15 years. In October 2002 Telefónica O2 Ireland was granted a UMTS license, which has duration of 20 years (2 x 15 MHz + 5 MHz).
The license can be surrendered by the operator at any time. However, ComReg can only revoke the license before its expiration date if the licensee does not pay its fees or if there has been a substantial breach of the terms of the license.
The Minister for Communications, Energy and Natural Resources may also revoke the license for national security reasons, or in order to comply with EU or other international obligations.
Future mobile spectrum
ComReg has proposed during the third and fourth quarters of 2011 to hold an auction to determine the future licenses in the 800MHz, 900MHz, and 1800MHz bands. The spectrum rights bought at auction will be service and technology neutral (subject to requirements to prevent interference) and the spectrums will be available for commercial service by February 2013. ComReg has also proposed to grant O2 an interim license in the 900MHz band to provide continuity until the availability of the new spectrum assigned under auction. The draft text of this license has been provided for comment. ComReg has yet to decide on its approach to licensing of the 2.6GHz band.
Market reviews
Telefónica O2 Ireland has been found to have SMP in the market for mobile termination. ComReg has previously decided to forebear from the imposition of regulated pricing so long as it could reach agreement with the main operators for a “glide path” for annual reductions in mobile termination rates. ComReg has started to collect data for a revised mobile termination market review and in the interim has set the Irish MTR rate in line with the BEREC Europe MTR average. The Irish rate changed to 5.36c in January 2011 and will be revised further in July 2011. The market review with revised SMP designations is expected to be completed in 2012.
Telefónica Latin America
Brazil
Regulatory framework
The delivery of telecommunications services in Brazil is subject to regulation under the regulatory framework provided in the General Telecommunications Law enacted in July 1997.
The National Agency for Telecommunications, ANATEL, is the principal regulatory authority for the Brazilian telecommunications sector.
Licenses and concessions
Concessions are granted for services provided in the public regime and authorizations are granted for services provided in the private regime. The only service provided in both regimes is the switched fixed telephone service, or STFC. All other services are provided only in the private regime.
The main differences between the public regime and the private regime relate to the obligations imposed on the companies. The concessionaires in the public regime, such as Telesp, have network expansion obligations (universal services obligations) and continuity of service obligations. These obligations are not imposed on the companies which provide services in the private regime.
In the state of São Paulo, Telesp provides local and long distance STFC under the public regime. In the other Brazilian states, Telesp provides local and long distance STFC under the private regime and broadband services under the private regime.
Telesp’s concession agreements (local and long distance) were extended in December 2005 for an additional period of 20 years. These agreements contemplate possible revisions in their terms by ANATEL in 2010, 2015 and 2020. In 2009, Telesp presented comments and suggestions to ANATEL’s public consultation regarding the 2010 concession contract revision, but ANATEL has not presented the final version of the contract yet. Telesp’s terms of authorization (local and long distance) were granted for an unlimited period of time.
Under the renewed concession agreements and during the 20-year renewal period, Telesp will be required to pay a biannual fee equal to 2% of its annual net revenue (excluding taxes and social contributions), for the provision of fixed-line public telecommunications services in its concession area (State of São Paulo) for the prior year.
Brazilian telecommunications regulations require ANATEL to authorize private regime companies to provide local, national, and international long distance STFC.
On November 20, 2008, the Presidential Decree 6,654 altered the General Concessions’ Plan, enabling one economic group to hold two of the four existing area concessions for providing STFC services. Thus, the Decree increased the flexibility of telecommunications provider groups as STFC concessionaries by allowing such providers to provide services in up to two General Plan regions. Prior to the Decree telecommunications provider groups could offer STFC services in only one region.
Telesp also has an authorization to provide data and broadband services in the private regime in the State of São Paulo.
On December 4, 2002, ANATEL authorized the migration from the cellular mobile service, or SMC, regime to a new licensing regime, personal mobile service. Brasilcel’s operators replaced all their old licensing titles granted under the old SMC regime with new personal mobile service authorization titles. The new personal mobile service licenses include the right to provide mobile services for an unlimited period of time but restrict the right to use the spectrum according to certain schedules included in the licenses. All Telefónica’s Brazilian mobile operating companies (the existing ones and some new acquisitions) were renamed “Vivo” with the exception of Vivo Participações (the latter being the result of the ANATEL-authorized merger of Telemig Celular into Vivo
Participações in March 2010). The following licenses are held by our Brazilian mobile operating company, Vivo Participações:
|
|
·
|
Vivo-Rio Grande do Sul (“A” Band) until 2022 (renewed in 2006);
|
|
|
·
|
Vivo-Rio de Janeiro (“A” Band) until 2020 (renewed in 2005);
|
|
|
·
|
Vivo-Espírito Santo (“A” Band) until 2023 (renewed in 2008);
|
|
|
·
|
Vivo-Bahia (“A” Band) and Vivo-Sergipe (“A” Band) until 2023 (renewed in 2008);
|
|
|
·
|
Vivo-São Paulo (“A” Band) until 2023 or 2024, for the cities of Ribeirão Preto and Guatapará (renewed in 2008);
|
|
|
·
|
Vivo-Paraná/Santa Catarina (“B” Band) until 2013;
|
|
|
·
|
Vivo-Distrito Federal (“A” Band) until 2021, (renewed in 2006);
|
|
|
·
|
Vivo-Acre (“A” Band), Vivo-Rondônia (“A” Band), Vivo-Mato Grosso (“A” Band) and Vivo-Mato Grosso do Sul (“A” Band) until 2024 (renewed in 2008);
|
|
|
·
|
Vivo-Goiás/Tocantins (“A” Band) until 2023 (renewed in 2008);
|
|
|
·
|
Vivo-Amazonas/Roraima/Amapá/Pará/Maranhão (“B” Band) until 2013;
|
|
|
·
|
Vivo Participações (Minas Gerais) (“A” Band) until 2023 (renewed in 2007);
|
|
|
·
|
Vivo Participações (for the cities where CTBC Telecom operates in the state of Minas Gerais) (“E” Band) until 2020.
|
For “A” and “B” Bands, the renewal of licenses must be solicited 30 months before expiration. Spectrum rights may be renewed only once for a 15-year period, after which title to the license must be renegotiated.
For “E” Band, the renewal of licenses must be solicited between 36 and 48 months before expiration. Spectrum rights may be renewed only once for a 15-year period, after which title to the license must be renegotiated. In December 2007, ANATEL auctioned fifteen new licenses in the 1900 MHz radio frequency band, denominated as “L” Band. Vivo acquired 13 spectrum licenses in “L” Band.
|
|
·
|
Vivo-Rio Grande do Sul (“L” Band) until 2022 (renewed in 2006) or 2022 for the cities of the metropolitan area of Pelotas;
|
|
|
·
|
Vivo-Rio de Janeiro (“L” Band) until 2020 (renewed in 2005);
|
|
|
·
|
Vivo-Espírito Santo (“L” Band) until 2023 (renewed in 2008);
|
|
|
·
|
Vivo-Bahia (“L” Band) and Vivo-Sergipe (“L” Band) until 2023 (renewed in 2008);
|
|
|
·
|
Vivo-São Paulo (“L” Band) until 2023 or 2024, for the cities of Ribeirão Preto and Guatapará (renewed in 2008) or 2022 for the cities where CTBC Telecom operates in the state of São Paulo;
|
|
|
·
|
Vivo-Paraná (excluding the cities of Londrina and Tamarana)/Santa Catarina (“L” Band) until 2013;
|
|
|
·
|
Vivo-Distrito Federal (“L” Band) until 2021, (renewed in 2006);
|
|
|
·
|
Vivo-Acre (“L” Band), Vivo-Rondônia (“L” Band), Vivo-Mato Grosso (“L” Band) and Vivo-Mato Grosso do Sul (“L” Band) until 2024 (renewed in 2008) or 2022 for the city of Paranaíba of Mato Grosso do Sul; and
|
|
|
·
|
Vivo-Goiás/Tocantins (“L” Band) until 2023 (renewed in 2008) or 2022 for the cities where CTBC Telecom operates in the state of Goiás; and
Vivo-Alagoas/Ceará/Paraíba/Piauí/Pernambuco/Rio Grande do Norte (“L” Band), until 2022.
|
For “L” Band, the renewal of licenses must be solicited between 36 and 48 months before expiration. Spectrum rights may be renewed only once for a 15-year period, after which title to the license must be renegotiated.
In April 2008, ANATEL auctioned 36 new licenses in the 1900-2100 MHz radio frequency bands (3G licenses). Vivo was awarded seven spectrum licenses in Band J and Vivo Participações was awarded two licenses.
|
|
·
|
Vivo-Rio Grande do Sul (including the cities of the metropolitan area of Pelotas) (“J” Band) until 2023;
|
|
|
·
|
Vivo-Rio de Janeiro (“J” Band) until 2023;
|
|
|
·
|
Vivo-Espírito Santo (“J” Band) until 2023;
|
|
|
·
|
Vivo-Bahia (“J” Band) and Vivo-Sergipe (“J” Band) until 2023;
|
|
|
·
|
Vivo-São Paulo (including the cities of Ribeirão Preto and Guatapará and the cities where CTBC Telecom operates in the state of São Paulo) (“J” Band) until 2023;
|
|
|
·
|
Vivo-Paraná (including the cities of Londrina and Tamarana)/Santa Catarina (“J” Band) until 2023;
|
|
|
·
|
Vivo-Distrito Federal (“J” Band) until 2023;
|
|
|
·
|
Vivo-Acre (“J” Band), Vivo-Rondônia (“J” Band), Vivo-Mato Grosso (“J” Band) and Vivo-Mato Grosso do Sul (including the city of Paranaíba) (“J” Band) until 2023;
|
|
|
·
|
Vivo-Goiás (including the cities where CTBC Telecom operates in the state of Goiás)/Tocantins (“J” Band) until 2023;
|
|
|
·
|
Vivo-Alagoas/Ceará/Paraíba/Piauí/Pernambuco/Rio Grande do Norte (“J” Band), until 2023;
|
|
|
·
|
Vivo-Amazonas/Roraima/Amapá/Pará/Maranhão (“J” Band) until 2023; and
|
|
|
·
|
Vivo Participações (including the cities where CTBC Telecom operates in the state of Minas Gerais) (“J” Band) until 2023.
|
For “J” Band, the renewal of licenses must be solicited between 36 and 48 months before expiration. Spectrum rights may be renewed only once for a 15-year period, after which title to the license must be renegotiated.
In December 2010, Vivo was awarded 23 licenses (14 spectrum licenses in 1800 MHz bands (“D”, “E”, “M” and extension bands) and 9 spectrum licenses in 900 MHz extension bands). The agreements related to the frequencies we acquired in this auction have not yet been executed:
|
|
·
|
“M” band (1800 MHz) of the Federal District and the states of Paraná, Santa Catarina, Rio Grande do Sul, Goiás, Tocantins, Mato Grosso do Sul, Mato Grosso, Rondônia and Acre;
|
|
|
·
|
1800 MHz extension band of the state of São Paulo;
|
|
|
·
|
“D” band (1800 MHz) of the cities of Pelotas, Morro Redondo, Capão do Leão and Turuçu in the state of Rio Grande do Sul;
|
|
|
·
|
“E” band (1800 MHz) of the states of Alagoas, Ceará, Paraíba, Piauí, Pernambuco and Rio Grande do Norte;
|
|
|
·
|
900 MHz extension band of the state of Rio de Janeiro;
|
|
|
·
|
900 MHz extension band of the state of Espírito Santo;
|
|
|
·
|
900 MHz extension band of the states of Goiás, Tocantins, Mato Grosso do Sul, Mato Grosso, Rondônia, Acre and the Federal District, with the exception of the cities of Paranaíba, in the state of Mato Grosso do Sul, and the cities of Buriti Alegre, Cachoeira Dourada, Inaciolândia, Itumbiara, Paranaiguara and São Simão, in the state of Goiás;
|
|
|
·
|
900 MHz extension band of the state of Rio Grande do Sul, with the exception of the cities of Pelotas, Morro Redondo, Capão do Leão and Turuçu;
|
|
|
·
|
900 MHz extension band of the cities of the registration area number 43 of the state of Paraná, with exception of the cities of Londrina and Tamarana;
|
|
|
·
|
900 MHz extension band of the states of Paraná and Santa Catarina, with exception of the cities of the registration area number 43 of the state of Paraná and the cities of Londrina and Tamarana;
|
|
|
·
|
900 MHz extension band of the state of Bahia;
|
|
|
·
|
900 MHz extension band of the state of Sergipe;
|
|
|
·
|
900 MHz extension band of the states of Amazonas, Amapá, Maranhão, Pará and Roraima;
|
|
|
·
|
1800 MHz extension band of the state of São Paulo, with exception of the cities of the metropolitan region of São Paulo and the cities where CTBC Telecom operates in the state of São Paulo;
|
|
|
·
|
1800 MHz extension band of the states of Amazonas, Amapá, Maranhão, Pará and Roraima;
|
|
|
·
|
1800 MHz extension band of the city of Paranaíba, in the state of Mato Grosso do Sul;
|
|
|
·
|
1800 MHz extension band of the cities of Buriti Alegre, Cachoeira Dourada, Inaciolândia, Itumbiara, Paranaiguara and São Simão, in the state of Goiás;
|
|
|
·
|
other 1800 MHz extension band of the cities of Buriti Alegre, Cachoeira Dourada, Inaciolândia, Itumbiara, Paranaiguara and São Simão, in the state of Goiás;
|
|
|
·
|
1800 MHz extension band of the states of Rio de Janeiro, Espírito Santo, Bahia and Sergipe;
|
|
|
·
|
1800 MHz extension band of the states of Amazonas, Amapá, Maranhão, Pará and Roraima;
|
|
|
·
|
1800 MHz extension band of the states of Alagoas, Ceará, Paraíba, Piauí, Pernambuco and Rio Grande do Norte;
|
|
|
·
|
1800 MHz extension band of the city of Paranaíba, in the state of Mato Grosso do Sul, and the cities of Buriti Alegre, Cachoeira Dourada, Inaciolândia, Itumbiara, Paranaiguara and São Simão, in the state of Goiás;
|
|
|
·
|
1800 MHz extension band of the cities of Londrina and Tamarana, in the state of Paraná. Prices and tariffs
|
ANATEL regulates rates for the STFC provided in the public regime. Operators with licenses to operate under the personal mobile regime are authorized to increase basic plan tariffs only for inflation and only on an annual basis. Operators are also allowed to establish non-basic tariffs and modify them without ANATEL’s prior approval.
Interconnection
In July 2005, ANATEL published a new regulation for interconnection among providers of telecommunications services, which require operators to issue a public document disclosing all of the conditions for the establishment of interconnection for all classes and types of services.
The SMP regime allows operators to freely negotiate interconnection rates with other operators. If they fail to reach an agreement, each operator may call upon ANATEL to determine the terms and conditions of interconnection.
Competition law
Brazilian competition regulation is based on Law No. 8,884 of June 11, 1994 which prohibits any practice aimed at restricting free competition, dominating the relevant market of goods or services, arbitrarily increasing profits, or abusively exercising dominant market position. The Economic Law Office, or SDE, the Secretariat for Economic Monitoring, or SEAE, and the Administrative Council for Economic Defense, or CADE, are the agencies authorized to enforce the competition rules.
Mexico
Regulatory framework
The provision of all telecommunication services in Mexico is governed by the Federal Telecommunication Law and various service-specific regulations. The governmental agencies which oversee the telecommunications industry in Mexico are the Secretariat of Communications and Transportation, or SCT, and the Federal Telecommunications Commission, or COFETEL.
Licenses and concessions
In Mexico, authorizations to provide mobile telephony services (mobile and personal communication services, or PCS, for the 800 MHz and 1.9 GHz bands, respectively) are granted through concessions. Currently, regarding the mobile concessions (800 MHz), only one Band A and one Band B service provider may provide mobile telephony services in each of the nine regions of the country. Regarding PCS concessions, there is no exclusivity in the provision of service, in each region by more than one operator. In fact, there are currently four operators in each region (including “Nextel,” which in 2010 was granted one concession in Region 4, with 10 MHz). These concessions were granted in 1998, 2005 and 2010 for a period of twenty years, and may be renewed for additional 20-year periods, subject to the fulfillment by the operator of certain terms and conditions.
In total, Telefónica Móviles México, and its subsidiaries and participated companies have 40 licenses granted by SCT, which enable it to provide telecommunications services:
Telefónica Móviles México’s mobile operating companies have been granted concessions to operate mobile telephony services on Band A until 2010. SCT granted licenses to Baja Celular Mexicana, S.A. de C.V., or Bajacel, dated July 17, 1990; Movitel del Noroeste, S.A. de C.V., or Movitel, also dated July 17, 1990; Telefonía Celular del Norte, S.A. de C.V., or Norcel, dated July 23, 1990; and Celular de Telefonía, S.A. de C.V., or Cedetel, dated August 2, 1990. The renewal of these four concessions was requested in 2005. We presented in 2005 four requests for extension of these concessions before SCT. The concessions of Bajacel, Movitel Norcel and Cedetel have been renewed for 15 years from 2010; all of them were granted on May 28, 2010. The terms and conditions of the renewed concessions are consistent with those concessions that SCT has recently assigned and to those terms and conditions that it will establish in future concessions, with the exception that the new renewal terms are established at 15 years rather than 20 years. The SCT granted one additional concession to each of the aforementioned four firms, to install, operate and exploit one public telecommunications network with the same valid concessions included in the spectrum license.
Furthermore, SCT granted to Telefónica Móviles México, through Pegaso Comunicaciones y Sistemas, S.A. de C.V. a concession to provide public telecommunications services, on June 23, 1998, and nine spectrum licenses, dated October 7, 1998, in the 1900 MHz band to provide personal communication services in each of the nine PCS service region, and valid until 2018. Those licenses may be extended for additional twenty-year periods. For all of these licenses renewal was requested in 2008, the renewal decision is still pending, and we are permitted to continue operating under the terms of the expired licenses until the renewal has been approved. On April 21, 2005, SCT granted Telefónica México four more spectrum licenses in the same 1900 MHz band, to provide the PCS service and have more bandwidth in regions 3, 5, 7 and 8, valid for 20 years, and with the possibility be renewed for up to 20
additional years. On September 7, 2009, a modification to Pegaso’s concession was authorized to provide trunked radio services.
On July 22, 2010, SCT granted to Telefónica Móviles México, through Pegaso Comunicaciones y Sistemas, S.A. de C.V., 8 more spectrum licenses in 1,900MHz band to provide PCS service and offer additional bandwidth in regions 1, 2, 3, 4, 5, 6, 7 and 9, each with a 20 year validity and a right to be renewed for a maximum term of twenty years.
On November 8, 2010, SCT granted to Telefónica Móviles México, through Pegaso Comunicaciones y Sistemas, S.A. de C.V., 6 spectrum licenses in 1.7-2.1GHz band to provide AWS service in regions 2, 3, 4, 6, 7 and 9, each with a 20 year validity and a right to be renewed for a maximum term of twenty years.
SCT also granted to Grupo de Telecomunicaciones Mexicanas, S.A. de C.V., or GTM, a company in which Telefónica Móviles México has an interest, several licenses:
|
|
·
|
on June 24, 1998, to install microwave links in 23 GHz frequencies, for a period of 20 years;
|
|
|
·
|
on December 13, 1999, to install microwave links in 7 GHz frequencies, for a period of 20 years, and that can be renewed;
|
|
|
·
|
on June 5, 2003, to install a public telecommunication network to provide domestic and international long distance service granted, for a period of 15 years, and that can be renewed; and
|
|
|
·
|
on March 28, 2006, GTM was authorized a renewal of the concession to provide fixed telephony and public telephony, nationwide for a period of 15 years, that can be renewed.
|
|
|
·
|
on January 6, 2011, GTM was granted a concession to install a public telecommunication network to provide pay-tv and data transmission by satellite for a period of 30 years, which can be renewed.
|
Prices and tariffs
Tariffs charged to customers are not regulated. They are set by mobile operating companies and must be registered with COFETEL. Rates do not enter into force until registered by COFETEL.
Interconnection
Mexican telecommunications regulations obligate all telecommunications network concessionaires to execute interconnection agreements on specific terms when requested by other concessionaires. Interconnection rates and conditions may be negotiated by the parties. However, should the parties fail to agree, COFETEL must fix the unresolved issues, including tariffs.
Foreign ownership/restrictions on transfer of ownership
Mexican foreign investment law restricts foreign investment in local fixed service and other telecommunications services to a maximum of 49% of the voting stock, unless the Mexican National Commission of Foreign Investment approves a higher percentage participation, which it can do only in the case of mobile telecommunications companies.
Bajacel, Movitel, Norcel, Cedetel and Pegaso, as mobile telecommunications companies, received the required approvals from the National Commission of Foreign Investment permitting our ownership of more than 49% of their outstanding voting capital.
GTM, a company in which Telefónica México has an interest, provides local fixed and long distance services. This operator complies with Mexican foreign investment law, and has a stock structure that includes the participation of its Mexican partner, Enlaces del Norte S.A. de C.V., which owns 51% of the voting stock.
Competition law
The Federal Economic Competition Law enacted in 1992 and amended on June 28, 2006 prohibits monopolies and any practices that tend to diminish, harm or impede competition in the production, processing, distribution or marketing of goods and services. The Federal Competition Commission, or COFECO, is the administrative body empowered to enforce the Law.
Venezuela
On December 2009, a new regulation applicable to all subscription TV service providers was enacted by CONATEL in order to stipulate a new obligation concerning a mandatory percentage of inclusion (12%) of national production services (channels in which both reception and diffusion of sound and images take place in the country to later transmit it by means of subscription TV service providers) in the regular programming packages. The calculation of the mandatory percentage is to be made on the basis of the totality of the TV channels. Qualification of a channel as a “national productions service” is a task of CONATEL, who must keep an updated record of those services.
An Administrative Decision on Services Agreements (
Providencia n° 1302 sobre Condiciones Generales de los Contratos de Servicios de Telecomunicaciones)
was adopted. As a consequence of this regulation (2009), Telcel proceeded to adapt all of its nine services agreements to fulfill all the conditions and impositions established, mainly related to consumer protection. We have currently received regulator observations of two of the agreements (TV service and radio localization service), and we are in process of including the modifications based on the observations.
An Amendment to the Organic Telecommunications Law (June 1, 2000) was published on December 28, 2010 in Official Gazette No. 6.015. The principal aspects to consider and/or changes with respect to the Law of 2000 are summarized as follows:
|
|
·
|
Telecommunications are defined as “a public service and interest”
|
|
|
·
|
Licenses and concessions are defined as personal in nature, and therefore, such instruments may not be assigned or transferred, nor acquired by succession or contract, as a result of mergers or by limitation. Such actions are grounds for revocation of the license and/or concession.
|
|
|
·
|
The Law provides a new maximum term for licenses and concessions of 15 years, renewable for equal periods. In the Law of 2000 the maximum term was up to 25 years. In the opinion of the company’s management, the licenses and concessions granted to Telcel, C.A. and currently in force will not be affected by the new provision; however, it will be applicable to the new administrative certificates resulting from the renewal application process of the general license and concessions by Timetrac, and to the renewal of the General Concessions of 806-890 MHz and 890-902 MHz bands to be applied for in March 2011.
|
|
|
·
|
Licenses and Concessions shall not be granted to former holders whose concession was revoked, to persons providing services without the corresponding certificates, or the shareholders, members, partners, interest owners or directors thereof.
|
|
|
·
|
The free-pricing system for telecommunication services remains the same, except for basic telephony services (Local, LDN and LDI) and services rendered under the universal service obligations; however, the regulatory entity may, considering CONATEL’s opinion, set the prices for telecommunication services for “public interest reasons.” The amendment does not define the term “public interest reasons.”
|
|
|
·
|
The provision enabling CONATEL to set the maximum and minimum prices for services provided by companies involved in cartels, monopolies, oligopolies, etc., was repealed.
|
|
|
·
|
It is expressly provided that CONATEL may impose universal service obligations directly on the State’s operator of basic telephony.
|
|
|
·
|
First-level domain names “.ve” are included in the management, control and regulation of the national numbering plan. The management of such domain names shall entail payment of one tax unit per annum.
|
|
|
·
|
The sale of satellite capacity to authorized operators for rendering services to third parties shall require a permit for satellite capacity provision.
|
Law on Social Responsibility in Radio, Television and Electronic Media
On December 22, 2010, in the Official Gazette No. 39.579, it was published the Law on Social Responsibility in Radio, Television and Electronic Media, which purpose is to establish, in the broadcasting and reception of messages, the social responsibility of radio and television service providers, electronic media providers, advertisers, national independent producers, and users within the national territory. Among the most important aspects of the Law, it is worth mentioning the following:
|
|
·
|
It is clear that the most important change is the inclusion of the electronic media (which are not defined in the Law) and electronic media providers in the regulatory framework.
|
|
|
·
|
The hour-block rating structure for radio and television remains the same (all-user block, supervised block and adult block).
|
|
|
·
|
It establishes the obligation to broadcast at least 50% of nationally produced programming in the all-user and supervised blocks. Promotion of programs intended to the adult block must be broadcasted during hour blocks in which such programs are permitted. Live-and-direct messages presenting actual or graphic images of violence may be broadcasted during the all-user and supervised blocks, subject to the terms and conditions set forth in the Law.
|
|
|
·
|
The Law creates the Television Programming Commission, which role is to establish the terms and conditions for the allocation of programming spaces to national independent produces in order to guarantee the democratization of the radio-electric spectrum, diversity, freedom of creation and effective conditions for free competition.
|
|
|
·
|
Electronic media providers (this is, media or access providers, not content providers) must establish mechanisms to restrict, without delay, the dissemination of messages that: incite or promote intolerance, hatred, xenophobia; endorse and incite criminal acts, constitute war propaganda, foment citizens’ anxiety or alter public order, or disrespect authorities.
|
Providers will be liable to the extent that they had originated the transmission, modified the data to select addressees or had failed to limit the access.
Accordingly, CONATEL may order the Internet service providers to restrict the access to prohibited messages and services disseminated through the Internet or other electronic media pursuant to this Law (Art. 27), in which case, it will be applicable the procedure set forth for precautionary measures (Art. 33).
In addition, according to the Law, content providers are banned from disseminating messages that:
|
|
a)
|
Incite or promote hatred or intolerance based on religion, political opinion, sex, race or xenophobia.
|
|
|
b)
|
Incite, endorse or promote criminal acts.
|
|
|
c)
|
Constitute war propaganda.
|
|
|
d)
|
Foment citizens’ anxiety or alter public order.
|
|
|
e)
|
Disrespect legal authorities.
|
|
|
f)
|
Encourage assassination.
|
|
|
g)
|
Incite or promote disobedience of the laws in force.
|
|
|
h)
|
Promote discrimination.
|
|
|
i)
|
Are expressed under anonymity.
|
|
|
j)
|
Are contrary to the security of the nation.
|
Failure to comply with this law may be punished by the following penalties:
|
|
o
|
Fines between 50 and 200 Tax Units (a – g).
|
|
|
o
|
Fine up to 10 percent of the previous year’s gross income and up to 72 hours of continuous suspension (a, b, c, d, e, h, i).
|
|
|
o
|
Revocation of Licenses and Concession (c, f, j).
|
|
|
·
|
Failure to comply with precautionary measures: Failure to comply with precautionary measures issued by CONATEL (including statutory and non-statutory measures) shall be punished by revocation of the license.
|
Licenses and concessions
Telcel has been granted a mobile telephony concession to operate and offer mobile services in the 800 MHz band with national coverage, granted in 1991 and expiring on May 31, 2011. Telcel, in accordance with the relevant legal provisions in force, applied before CONATEL for the renewal of general concessions of 806-890 MHz and 890-902 MHz within 90 days following expiration of the relevant concessions. This took place February 28, 2011. In the opinion of Telecel management, all the obligations derived from the general license and general concessions have been met, and it is expected that the renewal application process will result in a favorable decision for Telcel.
Telcel also holds a private network services concession, granted in 1993 and renewed on November 28, 2007, until December 15, 2025, that allows Telcel to offer point-to-point or point-to-multipoint private telecommunication services to corporations. In 2000, Telcel was granted a general license (
Habilitación General
) to offer local telephony services, national long distance services and international long distance services and to otherwise operate telecommunications networks for a 25-year period expiring on December 15, 2025. In 2001, Telcel obtained a concession to offer fixed wireless access services nationwide using mobile local loop technology.
On November 28, 2007, the National Telecommunications Commission, or CONATEL, in accordance with the Telecommunications Law, incorporated into the general license the rest of the services provided by Telcel: mobile, private networks, Internet access and transport. On that same date, Telcel was granted a concession to operate in the 1990 MHz band for a period of 15 years, until November 22, 2022, renewable for a period of ten years.
Prices and tariffs
As mentioned above, under new Venezuelan regulations, the free-pricing system for telecommunication services remains the same, except for basic telephony services (Local, LDN and LDI) and services rendered under universal service obligations; however, the regulatory entity may, considering CONATEL’s opinion, alter prices for telecommunication services for “public interest reasons.” The amendment does not define the term “public interest reasons.”
Competition law
Venezuelan law governing competition is the Promotion and Protection of Free Competition Act 1992. It prohibits monopolistic and oligarchic practices and other means that could impede, restrict, falsify, or limit the enjoyment of economic freedom. The Office of the Superintendent for the Promotion and Protection of Free Competition is the agency empowered to apply the Competition Act.
Chile
Regulatory framework
The General Telecommunications Law No. 18,168 of 1982, as amended, establishes the legal framework for the provision of telecommunications services in Chile.
The main regulatory authority in Chile is the Under-Secretary of Telecommunications, or SUBTEL.
Licenses and concessions
Under the General Telecommunications Law, companies must obtain licenses in order to provide fixed telecommunications services. Licenses granted for public and intermediate services generally have 30-year terms and may be renewed indefinitely for 30-year periods at the request of the operator, though certain licenses held by Telefónica Chile have longer terms.
Telefónica Chile holds the following licenses for the provision of telecommunications services:
|
|
·
|
Local telephony public service licenses
. Telefónica Chile holds a license for local telephone service in all regions of Chile for a 50-year renewable period which began on December 1982, except Regions X and XI, which were incorporated to such license in 1995. In addition, Telefónica Chile holds various other renewable license for nationwide local telephone services oriented, exclusively, to rural localities. Telefónica Chile also holds a nationwide public service renewable license for data transmission for a 30-year period beginning as of July 1995, and four other public service renewable licenses for data transmission for a 30-year period beginning as of June 2008. Telefónica Chile also holds a nationwide public VoIP service renewable license, for a 30-year period beginning August 2010.
|
|
|
·
|
Multicarrier long-distance licenses
. Under the Multicarrier System, Telefónica Chile’s former long-distance subsidiary, Telefónica Mundo Larga Distancia S.A. (before Telefónica Mundo), held 30-year renewable licenses, for a period beginning as of November 1989, to install and operate a nationwide fiber-optic network, a network of base stations and other transmission equipment, and to provide domestic and international long-distance services, including voice, data and image transmission, throughout Chile. In addition, Telefónica Mundo Larga Distancia S.A. held 30-year renewable licenses, for a period beginning as of June 1993, to nationwide public service data transmission. Telefónica Chile’s other long-distance subsidiary, Globus, also held licenses for an indefinite term to provide domestic and international long-distance services through central switches and cable and fiber-optic networks nationwide. After the merger of these subsidiaries in 2006, all the aforementioned licenses remain under the ownership of the same company, which is now known as Telefónica Larga Distancia.
|
|
|
·
|
Public service data transmission
. In addition to the 30-year data transmission license previously mentioned, Telefónica Chile, through Telefónica Empresas, holds, as of March 1987, nationwide public service data transmission licenses for an indefinite term.
|
|
|
·
|
Public service mobile telephony licenses
. Telefónica Móviles Chile holds licenses with indefinite terms, beginning as of November 1989, to provide public service mobile telephony services throughout Chile in the 800 megahertz frequency range. Telefónica Móviles Chile also holds three concessions for the provision of mobile telecommunications services nationwide in the 1900 MHz band. These concessions may be renewed for successive thirty-year periods as of 2002 at the request of the holder.
|
|
|
·
|
Limited television license
. Telefónica Chile’s subsidiary Telefónica Multimedia, has a license to establish, operate, and use a part of the spectrum of the 2.6 GHz bandwidth in Santiago, Chile, for an intermediate telecommunications service concession, authorizing the frequencies used to communicate voice, data and images, for a 30-year period beginning as of May 2008 Telefónica Multimedia also holds a license authorized by Resolution No. 47 enacted on November 28, 1990, amended by Resolution No. 1536 of 1994, and Resolution 1453 of 2002, to provide limited television service in 2,6 GHz. Since December 2005, Telefónica Chile, through
|
Telefónica Multimedia, holds a nationwide 10-year renewable license to provide limited satellite television service. Additionally, in January of 2006, Telefónica Chile, through Telefónica Multimedia, was assigned a limited television service license to provide the service nationwide in the main municipalities, except Region III, through Telefónica Chile’s xDSL broadband network for an indefinite period. Moreover, in March 2007, a limited television service license was granted in order to provide this service, through the DSL broadband network, in the Santiago Metropolitan area, for an indefinite period.
Prices and tariffs
Under the General Telecommunications Law, maximum tariffs for telephony services are set every five years by the Ministry of Transport and Telecommunications and the Ministry of Economy. In addition, the Competition Tribunal may subject any telephony service to price regulation, except for mobile telephone services to the public that are expressly exempted under the General Telecommunications Law.
The Competition Tribunal ruled in January 2009 that only some local telephone services were to be subject to tariff regulation (line connections, monthly fixed charges, variable traffics charges, and public payphone services are excluded). Accordingly, it was determined that every local telephone company, within its service zones, would be regulated with respect to tariff levels and structure. In addition, Telefónica Chile, in its capacity as a “dominant operator” (except in regions where other companies are the dominant operators), is regulated on a non-price basis, with requirements that it not engage in discriminatory pricing and that it give previous notice of plans and packages.
Interconnection
Interconnection is obligatory for all license holders with the same type of public telecommunications services and between telephony public services and intermediate services that provide long distance services. The same requirement applies to holders of those intermediate service licenses, who are required to interconnect their networks to the local telephone network.
A “calling party pays” tariff structure was implemented on February 23, 1999. Under this tariff structure, local telephone companies pay mobile telephone companies an access charge for calls placed from fixed networks to mobile networks. Local telephone companies may pass this interconnection charge on to their customers. Every five years, SUBTEL sets the applicable tariffs for services provided through the interconnected networks.
Competition law
The principal regulation concerning competition in Chile is Decree No. 211 of 1973, whose current text was established in Decree Nº 1 of 2005. Pursuant to the provisions of this law, acts or behavior involving economic activities that constitute abuse of a dominant market position, or limit, restrain, or distort free competition in a manner that injures the common economic interest in the national territory are prohibited. The Competition Tribunal deals with infringements of competition law.
Argentina
Regulatory framework
The basic legal framework for the provision of telecommunications services in Argentina is set forth in the National Telecommunications Law (No. 19,798) of 1972 and in the specific regulations governing each type of telecommunications service. Also, Decree 264/98 established a transitory period from a monopolistic market towards a free market, promoting the protection of small operators while imposing obligations on basic services licensees. Decree 764/00 established the new and actual regulatory framework rules for a free market, and includes interconnection, licenses, universal service and spectrum rules.
The following regulatory authorities oversee the Argentine telecommunications industry:
|
|
·
|
the National Communications Commission, or CNC, supervises compliance with licenses and regulations, and approves changes to mandatory goal and service requirements; and
|
|
|
·
|
the Secretariat of Communications, or SECOM, grants new licenses, regulates the bidding and selection processes for radio-spectrum authorizations, and approves the related bidding terms and conditions.
|
Licenses and concessions
Telefónica de Argentina holds licenses for fixed line services, all granted for an unlimited period of time, which entitle it to provide fixed line telecommunications services; international telecommunications services; local services in the northern and southern regions; long distance, international and data transmission telecommunications services in the northern region; and Internet access and international data transmission services.
Telefónica Móviles de Argentina’s licenses for the provision of mobile services include PCS licenses and corresponding authorizations for use of spectrum for different regions, licenses and corresponding authorizations for use of spectrum for mobile telephone services for different regions; and licenses for trunking, or closed user group, services for different cities.
These licenses do not expire, but may be cancelled by the SECOM
as the result of failure to comply with the terms of its license.
Prices and tariffs
On October 21, 2003, Law No. 25,790 became effective, extending the term for the renegotiation of concession or licensing agreements with public utilities until December 31, 2004, which was subsequently extended until December 31, 2011. This law also established that the decisions made by the Argentine government during the renegotiation process shall not be limited by, nor subject to, the stipulations contained in the regulatory frameworks currently governing concession or licensing agreements for the respective public utilities. Renegotiated agreements may cover some aspects of concession or licensing agreements and may contain formulas to adjust such agreements or temporarily amend them. As an investor in Argentina through Telefónica de Argentina, we commenced arbitration proceedings against the Republic of Argentina based on the Reciprocal Protection of Investments Treaty between Spain and Argentina for damages suffered by us because of the measures adopted by the Argentine government. On August 21, 2009, the parties requested the Tribunal, in accordance with Rule 43 of the ICSID Arbitration Rules, declare a resolution of the termination of the proceedings. The agreement of the parties envisages the possibility of a new request for arbitration under the ICSID Convention being submitted by Telefónica. Such request would be processed in accordance with the ICSID Convention and the Center’s normal rules and procedures taking note of the discontinuance issued by the Tribunal on September 24, 2009.
Additionally, Decree No. 764/00 established that providers of telephone services may freely set rates and/or prices for their service which shall be applied on a non-discriminatory basis. However, until the Secretary of Communications determines that there is effective competition for telecommunications services, the “dominant” providers in the relevant areas (which include Telefónica de Argentina) must respect the maximum tariffs established in the general tariff structure. Providers may freely set their rates by areas, routes, long distance legs and/or customer groups so long as they are below the amounts established by the general tariff structure.
Also, the guidelines set forth in article 26 of Decree No. 1185/90 continue in effect for operators with significant market power. These guidelines establish information obligations with which operators must comply with respect to tariffs, both toward clients and the national regulator. This Decree also establishes the powers the regulator has to revise or revoke such tariffs.
Tariffs charged to customers for mobile services are not regulated in Argentina.
Interconnection
Decree No. 764/00 approved new rules for national interconnection and established interconnection standards and conditions with which telephone service providers must comply regardless of pre-existing agreements. The rules for national interconnection set forth that interconnection agreements are to be freely negotiated between the relevant service providers, on a non-discriminatory basis. The regulations also establish the obligation for dominant and significant market operators to unbundle their local loops and to allow competitors to use them on a reasonable basis.
Competition law
Law 25,156, on Protection of Competition prohibits any acts or behaviors related to the production or trade of goods or services, whose purpose or effect is to prevent, restrict or distort competition or market access, or that constitute abuse of dominant position in a market. The National Commission for the Defense of Competition is the authority entrusted with application of the law.
Colombia
Regulatory framework
In Colombia, telecommunications are a public service, subject to state regulation and oversight. Law 1341/09 (“
Technologies of Information and Communications Law
”) reformed the legal framework, establishing the general regime for information and communication technologies. Under this law, providers of network and telecommunications services in Colombia must register with the Information and Communication Technologies Minister. In addition, operators must obtain a concession from the National Television Commission in order to provide television services.
Law 1341/09 established a transition period in which operators can: (i) preserve the original titles (licenses, contracts, permissions, authorizations) until their expiration or (ii) adopt the regime of general authorization stated by the law and the corresponding registration and preserve the necessary permissions in order to use the spectrum.
During 2009 the Colombian telecommunications regulator,
Comisión de Regulación de Comunicaciones
or CRC, identified the telecommunications relevant markets and operators with dominant position and established some remedies via ex ante regulations.
In 2010 the telecommunications authority made a review of relevant markets and published drafts concerning certain markets and projects , such as the migration to NGN networks (where interconnection prices between traditional networks and NGN networks were proposed), a review of the mobile voice market (where modifications of mobile termination rates were proposed) and a review of end user protection measures.
Licenses and concessions
Concessions for mobile services in the Eastern Region, the Caribbean Coast Region and the Western Region were granted in March 1994 for a ten-year period and extended for ten years until March 28, 2014. Before 2014 and because of the transition period set forth under Law 1341/2009, Telefónica Móviles Colombia can renounce its concessions, renew the permission for spectrum use for one period of ten years and subsequently renegotiate an extension. If Telefónica Móviles Colombia continues with its current concessions until 2014, in that year it must register as a telecommunications provider and request permission for spectrum use.
Additionally, Telefónica Móviles Colombia holds concessions for carrier services nationwide, granted in June and November 1998 (initially for ten years and extended once for an additional ten years). Due to decree 2870 of 2007, these concessions were transformed into a convergent title. The Ministry of Communications granted Telefónica Móviles Colombia on November 6, 2008 a convergent title to render carrier services for an additional ten-year period (which can be extended for an additional ten years). Like in the case of concessions for mobile services, these licenses are in force until the end of their validity, or Telefónica Móviles can decide to renounce and register as an operator under the general authorization granted by law.
With respect to fixed line services, Law 1341/2009 preserves the indefinite permission for all operators to operate as local exchange carriers in the national area that Law 142/94 had established. Colombia Telecom must register as a telecommunication provider before the CRC. This registration also covers the general authorization to provide other telecommunications services like long-distance carrier services, value added services, carrier services nationwide and mobile services, among others.
Interconnection
Mobile and fixed operators in Colombia have the right to interconnect to other operators’ networks. Before the intervention of regulatory authorities, operators must attempt direct negotiations. Interconnection must assure compliance with the objectives of non-discriminatory treatment, transparency, prices based on costs plus a reasonable profit and promotion of competition.
Prices and tariffs
The Technologies of Information and Communications Law, provides for free pricing for voice and Internet access services. Therefore, mobile tariffs charged to customers are not regulated, although they may not be discriminatory. Nevertheless fixed-to-mobile tariffs are subject to a price cap. Rates are fixed by mobile operating companies and must be registered with the
Comisión de Regulación de Telecomunicaciones
. The regulator set a price cap of 392 Colombian pesos per minute for fixed to mobile tariffs since November 1, 2006, and in 2009 the CRC reduced the tariff to 198.4 Colombian pesos per minute.
Television services
In January 2007, Colombia Telecom signed a concession agreement with the National Television Commission to provide DTH services for ten years. This is a concession granted with a national scope.
In December 2008, the National Television Commission published Agreement No. 006. By this disposition the carry obligations of operators of closed television has been modified to require that regional channels be broadcast only in the cover area of the channel and only if it is possible technically.
In December 2010, the National Television Commission published Agreement Number 006 to modify the fees payable to exploit closed television. Before Agreement Number 006, operators paid 10% of gross incomes; now the percentage has been reduced to 7% of gross incomes.
Finally, in January 2011,Colombia Telecom signed with the National Television Commission an amendment to its concession agreement with the effect of including an arbitration clause.
Competition law
The Colombian Competition Law is incorporated in the Law No. 155/59, Decree No 2153/92 and Law 1340/09 on Restrictive Trade Practices. The law prohibits entering in any agreement or engaging in any type of practice, procedure, or system that aims to limit free competition and abuse of a dominant position. The Superintendent of Industry and Commerce is the Colombian competition authority.
Peru
Regulatory framework
The provision of telecommunications services in Peru is governed by the Telecommunications Law and related regulations.
Licenses and concessions
Telefónica del Perú provides fixed line telecommunications services based on concessions granted by the Ministry of Transportation and Communications, or TMC. The concession term is for 20 years, which may be renewed totally or partially at Telefónica del Perú’s request. Total renewal is for an additional 20-year period. Partial renewal is for periods of up to five additional years. Three partial renewals have been approved, extending the concession term until 2027.
Providers of mobile services seeking to operate in Peru must obtain a non-exclusive license from the TMC. Licenses are granted by means of a license agreement entered into between the TMC and the licensee and set forth the licensee’s rights and obligations, including the regions where the licensee is authorized to operate. Licenses are granted either by application or through a bidding process.
Telefónica Móviles Perú has a concession for the provision of mobile services on Sub Band A of the 850 MHz Band and Sub Band of 1900 MHz (in these bands, Telefónica Móviles Perú can also provide fixed wireless services) for a 20-year period, renewable upon request for identical periods. It also holds concessions for offering international and domestic long distance carrier services, granted in February 2002 for a 20-year period. Additionally, it has a concession for the provision of wireless fixed telephony services on the 450 MHz and 900 MHz band for a 20-year period. Both concessions were granted on March 3, 2008. It also holds the concessions for local carrier services, which expire between 2016 and 2022. Concessions for domestic and international carrier services expire on February 5, 2019. In addition, it has a concession for local fixed telephony services for national coverage, granted on August 10, 1999 for a 20 year period. These concessions may be renewed for an additional 20-year period.
Under the concessions to provide mobile services, mobile operators are obligated to meet certain quality service requirements with respect to call failure, radio-electric coverage and quality of communications. These requirements are established on a yearly basis and are gradually increased in order to improve the quality of the service provided.
Prices and tariffs
Tariffs for fixed telephony services must be approved by the National Regulatory Authority, the Organization for Supervision of Private Investment in Telecommunications, or OSIPTEL, in accordance with a price cap formula based on a productivity factor. Rates charged by mobile providers to their customers have been subject to a free tariff regime supervised by OSIPTEL. Tariffs must be reported to OSIPTEL prior to implementation.
Interconnection
Mobile service providers are required, upon request, to interconnect with other concession holders. According to the principles of neutrality and non-discrimination contemplated in the Telecommunications Law, the conditions agreed upon in any interconnection agreement will apply to third parties in the event that those conditions are more beneficial than terms and conditions agreed upon separately.
Competition law
The general competition framework in Peru is based on the Legislative Decree No. 1034. This law prohibits any monopolistic practices, controls, and restraints on free competition and it is applied, in the telecommunication sector, by OSIPTEL.
Seasonality
Our main business is not significantly affected by seasonal trends.
Patents
Our business is not materially dependent upon the ownership of patents, commercial or financial contracts or new manufacturing processes.
See “—History and Development of the Company” and “—Business Overview.”
In 2007, we moved to our new central headquarters for the Telefónica Group, “Distrito C,” in Las Tablas (Madrid), Spain.
Fixed Networks
We own fixed networks in Spain, Latin America and Europe, having an incumbent role in Spain, Argentina (the greater Buenos Aires metropolitan area and the southern portion of the country), Brazil (São Paulo), Chile, Peru, Colombia and the Czech Republic.
Following market trends, competitive environments, evolution of technologies and new multimedia and broadband services demanded by our customers, we have upgraded our networks in recent years in the following manners:
|
|
·
|
progressive introduction of broadband access technologies over copper: ADSL, ADSL2+, VDSL2, etc., increasing the bandwidth capacity provided to our broadband clients several times in the last seven years;
|
|
|
·
|
introduction of fiber access technologies (xPON) across different deployment scenarios: fiber to the home (FTTH), fiber to the building (FTTB), fiber to the curb (FTTC), fiber to the node (FTTN), etc., increasing the access speed up to 100 Mbps;
|
|
|
·
|
service support based on powerful Internet Protocol/ Multiprotocol Label Switching (IP/MPLS) backbones, providing full connectivity to the rest of the network layers, such as access and control, to support services for business and customer market segments (fixed and mobile);
|
|
|
·
|
migration of the legacy time division multiplexing (TDM) switching networks (PSTN and ISDN) to new generation network (NGN) over all-IP packet networks;
|
|
|
·
|
migration from legacy transport technologies, such as asynchronous transfer mode (ATM), frame relay (FR), low-rate leased lines, plesiochronous digital hierarchy (PDH) and synchronous digital hierarchy (SDH), to the new generation of optical transport ones, such as dense wavelength division multiplexing (DWDM), coarse wavelength division multiplexing (CWDM) and new generation - synchronous digital hierarchy (NG-SDH);
|
|
|
·
|
introduction of IMS (Internet Multimedia Subsystem) in many countries to simplify the control of the network and ease the deployment of new services over the all-IP converged network;
|
|
|
·
|
empowerment of the intelligence of the network to better manage its use, to avoid saturations and frauds and to identify new business opportunities;
|
|
|
·
|
convergence of fixed and mobile networks, services and support systems from both technological and operational points of view; and
|
|
|
·
|
deployment of new services such as pay TV, to customers connected through broadband accesses in Spain, Czech Republic, Peru, Chile, Colombia and Brazil.
|
Mobile Networks
We operate mobile networks in Spain, the United Kingdom, Germany, Ireland, the Czech Republic, Slovakia, Brazil, Argentina, Venezuela, Chile, Peru, Colombia, Mexico, Guatemala, Panama, El Salvador, Nicaragua, Costa Rica, Ecuador and Uruguay.
We use a number of mobile technologies in the countries in which we operate, namely: GSM and UMTS in Spain, the United Kingdom, Ireland, Germany, Czech Republic, Slovakia and Latin America; CDMA 1X in other countries in Latin America (such as, Brazil, Venezuela and Colombia) and, in the Czech Republic (CDMA 450 MHz). We continue the work of upgrading our mobile networks in line with market trends, the demand of new services from customers and the evolution of technologies. The main steps we are currently taking include:
|
|
·
|
progressive migration from CDMA technologies to GSM or UMTS technologies in markets where we still exploit these legacy technologies;
|
|
|
·
|
introduction of broadband into mobile access using technologies such as UMTS, HSDPA, HSUPAHSPA+ and LTE;
|
|
|
·
|
deployment of new services such as mobile television and distribution services for next generation music, video and games;
|
|
|
·
|
exploration of the adequacy of new technologies such as HSPA and LTE to provide mobile accesses with increased bandwidth, in particular:
|
|
|
-
|
HSPA: we have been committed to the deployment of this technology in countries in which we have a presence and as of December 31, 2010, we have extended our coverage up to the majority of the urban/suburban areas, and we have increased the capacity of the network by upgrading the network technology to the latest available releases of UMTS standards 3GPP REL 6 and REL 7;
|
|
|
-
|
LTE: together with main vendors and sharing experience with other operators, we have extensively analyzed the opportunities LTE will bring as 4G mobile technology is used to complement current network technology by creating higher capacity at lower relative cost by user/traffic unit, and, in this regard, during 2010 we tested the technology in several operations, both in Europe and in Latin America, with successful results; and
|
|
|
-
|
convergence of fixed and mobile networks, services and support systems from both technological and operational points of view.
|
Satellite communications
We hold a 13.23% interest in Hispasat, which leases capacity to Eutelsat, Intelsat, New Sky Satellite and occasionally ArabSat.
The services provided using satellite platforms include television contribution signal to feed cable and IPTV head ends, DTH television, VSAT mainly for telephony and Internet access in rural areas, emergency solutions, corporate communications and international communications with some countries in Africa and in Asia.
Submarine cables
We are one of the world’s largest submarine cable operators. We participate in approximately 25 international underwater cable systems (nine of which are moored in Spain) and own eleven domestic fiber optic cables.
There are submarine cable connections between Spain and Africa, America, Asia and Europe, respectively, which are jointly owned by us with other telecom operators. The SAM-1 cable, which we own, has a length of approximately 22,000 kilometers underwater and 3,000 kilometers terrestrial and links different countries such as the United States, Puerto Rico, Ecuador, Guatemala, Peru, Chile, Brazil, Argentina and Colombia.
The principal services using the capacity of submarine cables are voice circuits, Internet and dedicated circuits for international traffic and for corporations and business customers.
Not applicable.
Overview
We have implemented a regional, integrated management model based on three business areas, with each area in charge of the fixed and mobile
telephone and other businesses within its borders. Our areas are:
|
|
·
|
Telefónica Spain: oversees the fixed and mobile telephony services in Spain.
|
|
|
·
|
Telefónica Europe: oversees the fixed and mobile telephony services in the United Kingdom, Germany, Ireland, the Czech Republic and Slovakia.
|
|
|
·
|
Telefónica Latin America: oversees the fixed and mobile telephone services in Latin America.
|
We are also involved in the media and contact center segments through Telefónica de Contenidos and Atento, respectively.
Presentation of Financial Information
The information in this section should be read in conjunction with our Consolidated Financial Statements and the notes thereto, included elsewhere in this Annual Report. Our Consolidated Financial Statements have been prepared in accordance with IFRS as issued by the IASB.
At its meeting on July 26, 2006, our Board of Directors agreed to restructure the way in which we are managed in order to respond to the increasing convergence of fixed and mobile telephony in the markets in which we operate. In order to adapt to this new environment, we have developed a regional, integrated management model, combining fixed line and mobile telephony services in order to offer customers the best integrated solutions and support in an era of fixed-mobile convergence. We are managed as three business areas: Telefónica Spain, Telefónica Europe and Telefónica Latin America, each of which oversees the integrated fixed and mobile
telephone and other businesses in its region. Our three business areas form the basis of our segment reporting in our Consolidated Financial Statements.
Non-GAAP financial information
Operating income before depreciation and amortization
Operating income before depreciation and amortization, or OIBDA, is calculated by excluding depreciation and amortization expenses from our operating income in order to eliminate the impact of generally long-term capital investments that cannot be significantly influenced by our management in the short term. Our management believes that OIBDA is meaningful for investors because it provides an analysis of our operating results and our segment profitability using the same measure used by our management. OIBDA also allows us to compare our results with those of other companies in the telecommunications sector without considering their asset structure. We use OIBDA to track our business evolution and establish operational and strategic targets. OIBDA is also a measure commonly reported and widely used by analysts, investors and other interested parties in the telecommunications industry. OIBDA is not an explicit measure of financial performance under IFRS and may not be comparable to other similarly titled measures for other companies. OIBDA should not be considered an alternative to operating income as an indicator of our operating performance, or an alternative to cash flows from operating activities as a measure of our liquidity.
The following table provides a reconciliation of our OIBDA to operating income for the periods indicated.
|
Year ended December 31,
|
||||||||||||
|
2008
|
2009
|
2010
|
||||||||||
|
(in millions of euros)
|
||||||||||||
|
Operating income before depreciation and amortization
|
22,919 | 22,603 | 25,777 | |||||||||
|
Depreciation and amortization expense
|
(9,046 | ) | (8,956 | ) | (9,303 | ) | ||||||
|
Operating income
|
13,873 | 13,647 | 16,474 | |||||||||
The following tables provide a reconciliation of OIBDA to operating income for us and each of our business areas for the periods indicated.
|
Year ended December 31, 2010
|
||||||||||||||||||||
|
Telefónica Spain
|
Telefónica Latin America
|
Telefónica
Europe
|
Others and Eliminations
|
Total
|
||||||||||||||||
|
(in millions of euros)
|
||||||||||||||||||||
|
Operating income before depreciation and amortization
|
8,520 | 13,782 | 4,014 | (539 | ) | 25,777 | ||||||||||||||
|
Depreciation and amortization expense
|
(2,009 | ) | (4,061 | ) | (3,091 | ) | (142 | ) | (9,303 | ) | ||||||||||
|
Operating income
|
6,511 | 9,721 | 923 | (681 | ) | 16,474 | ||||||||||||||
|
Year ended December 31, 2009
|
||||||||||||||||||||
|
Telefónica Spain
|
Telefónica Latin America
|
Telefónica
Europe
|
Others and Eliminations
|
Total
|
||||||||||||||||
|
(in millions of euros)
|
||||||||||||||||||||
|
Operating income before depreciation and amortization
|
9,757 | 9,143 | 3,910 | (207 | ) | 22,603 | ||||||||||||||
|
Depreciation and amortization expense
|
(2,140 | ) | (3,793 | ) | (2,895 | ) | (128 | ) | (8,956 | ) | ||||||||||
|
Operating income
|
7,617 | 5,350 | 1,015 | (335 | ) | 13,647 | ||||||||||||||
|
Year ended December 31, 2008
|
||||||||||||||||||||
|
Telefónica Spain
|
Telefónica Latin America
|
Telefónica
Europe
|
Others and Eliminations
|
Total
|
||||||||||||||||
|
(in millions of euros)
|
||||||||||||||||||||
|
Operating income before depreciation and amortization
|
10,285 | 8,445 | 4,180 | 9 | 22,919 | |||||||||||||||
|
Depreciation and amortization expense
|
(2,239 | ) | (3,645 | ) | (3,035 | ) | (127 | ) | (9,046 | ) | ||||||||||
|
Operating income
|
8,046 | 4,800 | 1,145 | (118 | ) | 13,873 | ||||||||||||||
Net financial debt and net debt
We calculate net financial debt by deducting the positive mark-to-market value of derivatives with a maturity beyond one year from the relevant balance sheet date and other interest-bearing assets (each of which are components of non-current financial assets in our consolidated statement of financial position), current financial assets and cash and cash equivalents from the sum of (i) current and non-current interest-bearing debt (which includes the negative mark-to-market value of derivatives with a maturity beyond one year) and (ii) other payables (a component of non-current trade and other payables in our consolidated statement of financial position). We calculate net debt by adding to net financial debt those commitments related to financial guarantees, not considered as net financial debt, and those related to workforce reduction. We believe that net financial debt and net debt are meaningful for investors because they provide an analysis of our solvency using the same measures used by our management. We use net financial debt and net debt to calculate internally certain solvency and leverage ratios used by management. Neither net debt nor net financial debt as calculated by us should be considered an alternative to gross financial debt (the sum of current and non-current interest-bearing debt) as a measure of our liquidity.
The following table provides a reconciliation of our net financial debt and net debt to gross financial debt at the dates indicated:
|
As of December 31,
|
||||||||||||
|
2008
|
2009
|
2010
|
||||||||||
|
(in millions of euros)
|
||||||||||||
|
Non-current interest-bearing debt
|
45,088 | 47,607 | 51,356 | |||||||||
|
Current interest-bearing debt
|
8,100 | 9,184 | 9,744 | |||||||||
|
Gross financial debt
|
53,188 | 56,791 | 61,100 | |||||||||
|
Other non-current payables
|
477 | 515 | 1,718 | |||||||||
|
Other current payables (deferred payment for the acquisition of Brasilcel, N.V.)
|
— | — | 1,977 | |||||||||
|
Non-current financial assets(1)
|
(4,439 | ) | (2,736 | ) | (3,408 | ) | ||||||
|
Current financial assets
|
(2,216 | ) | (1,906 | ) | (1,574 | ) | ||||||
|
Cash and cash equivalents
|
(4,277 | ) | (9,113 | ) | (4,220 | ) | ||||||
|
As of December 31,
|
||||||||||||
|
2008
|
2009
|
2010
|
||||||||||
|
(in millions of euros)
|
||||||||||||
|
Net financial debt
|
42,733 | 43,551 | 55,593 | |||||||||
|
Commitments related to financial guarantees
|
365 | 71 | — | |||||||||
|
Net commitments related to workforce reduction
|
2,687 | 2,261 | 1,710 | |||||||||
|
Net debt
|
45,785 | 45,883 | 57,303 | |||||||||
|
(1)
|
Positive mark-to-market value of derivatives with a maturity beyond one year from the relevant statement of financial position date and other interest-bearing assets.
|
Significant Factors Affecting the Comparability of our Results of Operations in the Periods Under Review
During the years ended December 31, 2008, 2009 and 2010, various changes occurred in our composition that affect the comparability of our operating results between the periods. See Appendix I to our Consolidated Financial Statements for a detailed description of the principal changes in our composition affecting our financial statements during the periods under review covered by our Consolidated Financial Statements. The most significant factors affecting the comparability of our results of operations in the periods under review are discussed below.
Acquisition of 50% of Brasilcel, N.V.
On July 28, 2010, Telefónica and Portugal Telecom signed an agreement for the acquisition by Telefónica, S.A. of 50% of the share capital of Brasilcel owned by Portugal Telecom. Brasilcel owned, approximately, 60% of Vivo Participaçoes. This transaction was completed on September 27, 2010, terminating the joint venture agreements entered into by us and Portugal Telecom in 2002. As a result of the foregoing, our accounting treatment of Vivo Participaçoes has been changed from the proportionate to full consolidation method within the scope of consolidation from September 27, 2010.
Additionally, in accordance with IFRS 3 (see “— Significant Changes in Accounting Policies” below), we remeasured the previously held 50% investment in Brasilcel, generating a capital gain of €3,797 million, which is recognized under “Other income” in our accompanying consolidated income statement (for further information, see Note 19 to our consolidated financial statements).
The principal impacts of this transaction are explained in “Item 4. Information on the Company —Business Overview—Strategic Partnerships” and Note 5 to our consolidated financial statements.
Acquisition of HanseNet Telekommunikation GmbH
On December 3, 2009, our subsidiary in Germany, Telefónica Deutschland, GmbH, signed an agreement to acquire all of the shares of the German company HanseNet. The transaction was completed on February 16, 2010. The amount initially paid out was approximately €913 million, which included €638 million of refinanced debt, and an acquisition cost in the amount of €275 million, which was ultimately reduced by €40 million upon completion of the transaction (see Note 5 to our consolidated financial statements).
The company is included in our consolidation scope under the full consolidation method from its date of acquisition.
Reduction of stake in Portugal Telecom
In June 2010, we reduced our ownership interest in Portugal Telecom by 7.98%, resulting in cash inflow of €631 million from the sale of the ownership interests. In addition, we entered into three equity swap contracts on the trading price of Portugal Telecom shares with a number of financial institutions, subject to net settlement, which grant us the economic returns on such investments
.
The investment is no longer reflected in the scope of consolidation through the equity method of accounting (see Note 9 to our consolidated financial statements).
Acquisition of DTS Distribuidora de Televisión Digital, S.A.
On December 28, 2010, we completed the acquisition of a 22% stake in DTS, the provider of the pay-TV services offered by the PRISA Group. The acquisition cost amounted to approximately €488 million, of which €228 million was used to repay the outstanding balance on the subordinated loan between Telefónica de Contenidos, S.A.U. and Sogecable, S.A. This company has been included within the scope of consolidation through the equity method of accounting (see Note 9 to our consolidated financial statements).
Devaluation of the Venezuelan bolivar
On January 8, 2010 the Venezuelan bolivar was devalued, impacting our 2010 financial statements in the following regards:
|
|
·
|
Decreasing our net assets in Venezuela as a result of the new exchange rate, with a balancing entry in translation differences under our equity, which generated an effect of approximately €1,810 million at the date of devaluation.
|
|
|
·
|
Translating results and cash flows from Venezuela at the new devalued closing exchange rate.
|
On January 19, 2010, the Venezuelan government announced that it would grant a preferential rate of 2.60 Bolivar fuerte per dollar for new items, among which payment of dividends is included, provided that a request for Authorization of Acquisition of Foreign Exchange was filed before January 8, 2010. As of that date, we had in fact requested authorizations related to the distribution of dividends of prior years (for further explanation, see Note 16 to our Consolidated Financial Statements).
Classification of Venezuela as a hyperinflationary economy
Throughout 2009 and in the early part of 2010, a number of factors arose in the Venezuelan economy that led us to reconsider the treatments we follow with the respect to the translation of the financial statements of our investees, as well as the recovery of our financial investments in that country. Within these factors it is worth highlighting the level of inflation reached in 2009 and the cumulative inflation over the last three years, the restrictions to the official foreign exchange market and, finally, the devaluation of the Bolivar fuerte on January 8, 2010.
As a result, in accordance with IFRS Venezuela must be considered a hyperinflationary economy in 2009. The main implications of this are as follows:
|
|
·
|
Adjustment of the historical cost of non-monetary assets and liabilities and the various items of equity of Venezuelan companies from the date of acquisition or inclusion in Telefónica’s consolidated statement of financial position to the end of the year to reflect the changes in purchasing power of the currency caused by inflation.
|
|
|
·
|
The cumulative impact of the accounting restatement to adjust for the effects of hyperinflation for years prior to 2009 is reflected in the translation differences at the beginning of the 2009 financial year.
|
|
|
·
|
Adjustment of the income statement to reflect the financial loss caused by the impact of inflation in the year on net monetary assets (loss of purchasing power).
|
|
|
·
|
The various components in the income statement and statement of cash flows have been adjusted for the inflation index since their generation, with a balancing entry in financial results and offsetting reconciling item in the statement of cash flows, respectively.
|
|
|
·
|
All components of the financial statements of the Venezuelan companies have been translated at the closing exchange rate.
|
The main effects on the Telefónica Group’s consolidated financial statements for 2009 derived from the items mentioned above are as follows:
|
Million of euros
|
||||
|
Revenue
|
267 | |||
|
Operating income excluding the impact of depreciation and amortization cost
|
64 | |||
|
Net loss
|
(548 | ) | ||
|
Translation differences
|
1,224 | |||
|
Impact on equity
|
676 | |||
Tax amortization of goodwill
In December 2007, the European Commission opened an investigation involving the Kingdom of Spain relating to the potential consideration of the deduction for tax amortization of financial goodwill arising on certain foreign shareholding acquisitions as government aid under the provisions of article 12.5 of the revised Spanish Income Tax Law (“TRLIS”). This investigation led to widespread uncertainties regarding the effect any decision by the European Commission would have on, among others, the Telefónica Group.
In the case of the Telefónica Group, as a result of this uncertainty we deemed it necessary to recognize a liability as the deduction had been applied in the consolidated financial statements pending completion of the investigation.
In December 2009, the European Commission released its decision regarding the investigation, deeming the deduction as state aid. However, this decision does not affect investments made before December 21, 2007, which is the case with the investments made by the Telefónica Group in companies such as O2, Bellsouth’s Latin America operators, Colombia Telecomunicaciones, S.A. ESP and Cesky Telecom. As a result of this decision, and considering the corporate structure of these investments, income tax in our consolidated income statement for the year ended December 31, 2009 is €591 million lower due to the reversal of this liability.
Share exchange between Telefónica, S.A. and China Unicom Limited, and signing of strategic alliance.
On September 6, 2009, we entered into a broad strategic alliance with the Chinese telecommunications company, China Unicom, which includes, among other areas the joint procurement of infrastructure and client equipment; common development of mobile service platforms; joint provision of services to multinational customers; roaming; research and development; co-operation and sharing of best practices and technical, operational and management know-how; joint development of strategic initiatives in the area of the network evolution and joint participation in international alliances; and exchange of senior management.
In addition, on the same date, we executed a mutual share exchange agreement with China Unicom, which was implemented on October 21, 2009 through the subscription by us, through our wholly owned subsidiary Telefónica Internacional, S.A.U., of 693,912,264 newly issued shares of China Unicom, satisfied by a contribution in kind to China Unicom of 40,730,735 shares of Telefónica, S.A. (see Note 12 to our consolidated financial statements).
Following the completion of the transaction, we increased our ownership of China Unicom’s voting share capital from 5.38% to 8.06% and obtained the right to appoint a member to its board of directors, while China Unicom became owner of approximately 0.87% of our voting share capital at that date. Subsequently, after the capital reduction carried out by China Unicom, we reached a shareholding equivalent of 8.37% of its voting share capital.
The investment in China Unicom was included in the consolidation scope through the equity method of accounting.
On January 23, 2011, we broadened our Strategic Alliance Agreement with China Unicom. For more information, please see “Item 4. Information on the Company —History and Development of the Company—Recent Developments” and “Item 5. Operating and Financial Review and Prospects —Business Overview—Strategic Partnership” and Note 24 to our consolidated financial statements.
Significant Changes in Accounting Policies
In the preparation of our consolidated annual financial statements for the year ended December 31, 2010 we applied the following new standards, amendments to standards and interpretations, published by the IASB (International Accounting Standards Board) and the IFRIC (International Financial Reporting Interpretations Committee), for the first time:
IFRS 3 (2008) Business Combinations
The revised version of IFRS3 introduces significant changes in the accounting for business combinations. The main impacts have been:
|
|
·
|
to allow a choice on a transaction-by-transaction basis for the measurement of non-controlling interests either at fair value or at the non-controlling interests’ share of the fair value of the identifiable net assets of the acquiree;
|
|
|
·
|
to change the recognition and subsequent accounting requirements for contingent consideration. Under the revised Standard, contingent consideration is measured at fair value at the acquisition date; subsequent adjustments to the consideration are recognized against goodwill only to the extent that they arise from better information about the fair value at the acquisition date, and they occur within the ‘measurement period’ (a maximum of 12 months from the acquisition date). All other subsequent adjustments are recognized in profit or loss;
|
|
|
·
|
to require that acquisition-related costs be accounted for separately from the business combination, generally leading to those costs being recognized as an expense in profit or loss as incurred, whereas previously they were accounted for as part of the cost of the acquisition;
|
|
|
·
|
to require that in a business combination achieved in stages, the acquirer re-measures its previously held equity interest in the acquiree at its acquisition-date fair value and recognise the resulting gain or loss, if any, in profit or loss;
|
|
|
·
|
to require that in business combinations in which the acquisition date is prior to January 1, 2010, the acquirer recognises changes in acquired deferred tax benefits of the acquiree as an adjustment to profit or loss.
|
Its adoption has affected the accounting for business combination transactions occurred in the current period (see “—Significant Factors Affecting the Comparability of our Results of Operations in the Periods Under Review”).
Amendment to IAS 27, Consolidated and Separate Financial Statements
IAS 27 (Amended) requires that a change in the ownership interest of a subsidiary without loss of control be accounted for as a transaction with owners in their capacity as owners. Therefore, such transactions will no longer give rise to goodwill, nor will they give rise to a gain or loss. Furthermore, the amended standard changes the accounting for the loss of control of a subsidiary, meaning that any retained interest in the former subsidiary is remeasured at its fair value at the date control is lost, with any resulting gain or loss recognized in profit or loss.
The changes by IAS 27 (Amended) will affect future transactions with non-controlling interests and future transactions that result in the loss of control of subsidiaries.
Improvements to IFRS (April 2009)
This text introduces a number of improvements to IFRS, primarily eliminating inconsistencies and clarifying the wording of some of these standards. These improvements have not impacted our operating results or our financial position.
Amendments to IFRS 2, Share-based Payment – Group Cash-settled Share-based Payment Transactions
The standard has been amended to clarify the accounting for group cash-settled payment transactions. The amendment also supersedes IFRIC 8 and IFRIC 11. The adoption of this amendment did not have any impact on our financial position or performance.
Amendment of IAS 39, Financial Instruments: Recognition and Measurement – Eligible hedge items
The amendment clarifies two issues in relation with hedge accounting: designation of inflation as a hedged risk in a hedging relationship and designation of call options as hedging instruments to hedge financial or non-financial items. The adoption of this amendment did not have any impact on our financial position or performance.
IFRIC 17, Distribution of non-cash assets to owners
This interpretation provides guidance on accounting for dividends in kind, by clarifying when to recognise the dividend payable, the measurement requirements for this kind of dividends and how to account for the differences between the carrying amount of the assets distributed and the carrying amount of the payment obligation that can arise when the dividend in kind is settled. The application of this interpretation has had no impact on our financial position or performance.
Finally, the following IFRS and IFRIC interpretations were issued but not effective as of the date of this Annual Report:
|
Standards and amendments to standards
|
Effective for annual periods beginning on or after
|
||
|
IFRS 9
|
Financial Instruments
|
January 1, 2013
|
|
|
Revised IAS 24
|
Related Party Disclosures
|
January 1, 2011
|
|
|
Amendments to IAS 32
|
Classification of Rights Issues
|
February 1, 2010
|
|
|
Improvements to IFRS (May 2010)
|
January 1, 2010 (*)
|
||
|
Amendments to IFRS 7
|
Disclosures—Transfers of Financial Assets
|
July 1, 2011
|
|
|
Amendments to IAS 12
|
Deferred tax: Recovery of Underlying Assets
|
January 1, 2012
|
|
|
(*)
|
Amendments to IFRS 3 (2008) relating to measurement of non-controlling interests and share-based payments, and contingent payments that arose in business combinations that occurred before the effective date of the revised IFRS 3, together with amendments to IAS 27 (2008), are effective for annual periods beginning on or after July 1, 2010.
|
|
Interpretations and amendments to interpretations
|
Effective for annual periods beginning on or after
|
|||
|
IFRIC 19
|
Extinguishing Financial Liabilities with Equity Instruments
|
July 1, 2010
|
||
|
Amendment to IFRIC 14
|
Prepayments of a Minimum Funding Requirement
|
January 1, 2011
|
||
We are currently assessing the impact of the application of these standards, amendments and interpretations. Based on the analyses made, we estimate that their adoption will not have a significant impact on the consolidated financial statements in the initial period of application. However, the changes introduced by IFRS 9 will affect financial instruments and future transactions with financial instruments carried out on or after January 1, 2013.
Critical Accounting Policies and Estimates
The preparation of financial statements in conformity with IFRS requires management to make estimates and assumptions that affect the amounts reflected in the Consolidated Financial Statements and accompanying notes. We base our estimates on historical experience, where applicable, and other assumptions that we believe are reasonable under the circumstances. Actual results may differ from those estimates under different assumptions or conditions.
We consider an accounting estimate to be critical if:
|
|
·
|
it requires us to make assumptions because information was not available at the time or it included matters that were highly uncertain at the time we were making our estimate; and
|
|
|
·
|
changes in the estimate or different estimates that we could have selected may have had a material impact on our financial condition or results of operations.
|
The various policies that are important to the portrayal of our financial condition, results of operations and cash flows include:
|
|
·
|
accounting for long-lived assets, including goodwill;
|
|
|
·
|
deferred taxes;
|
|
|
·
|
provisions; and
|
|
|
·
|
revenue recognition.
|
Accounting for long-lived assets, including goodwill
Property, plant and equipment and intangible assets, other than goodwill, are recorded at acquisition cost. If such assets are acquired in a business combination, the acquisition cost is the estimated fair value of the acquired property, plant and equipment or intangible assets. Property, plant and equipment and intangible assets with definite useful lives are depreciated or amortized on a straight-line basis over their estimated useful lives.
Intangible assets with indefinite useful lives are not amortized, but are, instead, subject to an impairment test on a yearly basis and whenever there is an indication that such assets may be impaired.
Accounting for long-lived assets and intangible assets involves the use of estimates for determining: (a) the fair value at the acquisition date in the case of such assets acquired in a business combination, and (b) the useful lives of the assets over which they are to be depreciated or amortized. We believe that the estimates we make to determine an asset’s useful life are “critical accounting estimates” because they require our management to make estimates about technological evolution and competitive uses of assets.
When an impairment in the carrying amount of an asset occurs, non-scheduled write-downs are made. We perform impairment tests of identifiable intangible and long-lived assets whenever there is reason to believe that the carrying value may exceed the recoverable amount, which is the higher of the asset’s fair value less costs to sell and its value in use. Furthermore, previously recognized impairment losses may be reversed when changes in the estimates used to determine the asset’s recoverable amount indicate that an impairment loss recognized in prior periods no longer exists or may have decreased.
The determination of whether the impairment of long-lived and intangible assets is necessary involves the use of significant estimates and judgment that includes, but is not limited to, the analysis of the cause of potential impairment in value, the timing of such potential impairment and an estimate of the amount of the impairment, which requires the estimation of the future expected cash flows, discount rates and the fair value of the assets.
Specifically, management has to make certain assumptions in respect of uncertain matters, such as growth in revenues, changes in market prices, operating margins, and technology developments and obsolescence, discontinuance of services and other changes in circumstances that indicate the need to perform an impairment test. Management’s estimates about technology and its future development require significant judgment because the timing and nature of technological advances are difficult to predict.
Goodwill arises when the cost of a business combination exceeds the acquirer’s interest in the net fair value of the identifiable assets acquired and liabilities and contingent liabilities assumed. Goodwill is not amortized, but is, instead, subject to an impairment test on a yearly basis and whenever there is an indication that the goodwill may be impaired.
Non-scheduled write-downs of goodwill are made when an impairment in the carrying amount of goodwill occurs. We review, on a regular basis, the performance of our cash-generating units. We compare the carrying amount of the cash-generating unit to which the goodwill has been allocated with its recoverable amount. The determination of the recoverable amount of the cash-generating unit involves extensive use of estimates and
significant management judgment is involved. Methods commonly used by us for valuations include discounted cash flow methods.
A significant change in the facts and circumstances that we relied upon in making our estimates may have a material impact on our operating results and financial condition.
Deferred taxes
Management assesses the recoverability of deferred tax assets on the basis of estimates of our future taxable profit. The recoverability of deferred tax assets ultimately depends on our ability to generate sufficient taxable profit during the periods in which the deferred tax assets are utilized. In making this assessment, our management considers the scheduled reversal of deferred tax liabilities, projected taxable profit and tax planning strategies.
This assessment is carried out on the basis of internal projections, which are updated to reflect our most recent operating trends. In accordance with applicable accounting standards, a deferred tax asset must be recognized for all deductible temporary differences and for the carry-forward of unused tax credits and unused tax losses to the extent that it is probable that taxable profit will be available against which the deductible temporary difference can be utilized. Our current and deferred income taxes are impacted by events and transactions arising in the normal course of business as well as in connection with special and non-recurring items. Assessment of the appropriate amount and classification of income taxes is dependent on several factors, including estimates of the timing and realization of deferred tax assets and the timing of income tax payments. Actual collections and payments may materially differ from these estimates as a result of changes in tax laws as well as unanticipated future transactions impacting our income tax balances.
Provisions
Provisions are recorded when, at the end of the period, we have a present obligation as a result of past events, whose settlement requires an outflow of resources that is considered probable and can be measured reliably. This obligation may be legal or constructive, arising from, but not limited to, regulation, contracts, common practice or public commitments, which have created a valid expectation for third parties that we will assume certain responsibilities. The amount recorded is the best estimation performed by the management in respect of the expenditure that will be required to settle the obligations, considering all the information available at the closing date, including the advice of external experts, such as legal advisors or consultants.
If we are unable to reliably measure the obligation, no provision is recorded and information is then presented in the notes to the Consolidated Financial Statements.
Because of the inherent uncertainties in this estimation, actual expenditures may be different from the originally estimated amount recognized.
Revenue recognition
Connection fees
Revenues from connection fees originated when customers connect to our network are deferred over the average expected length of the customer relationship.
The expected customer relationship period is estimated based on recent historical experience of customer churn rates. Significant changes in our estimations may result in differences in the amount and timing of revenues recognized.
Multiple-element arrangements
Arrangements involving the delivery of bundled products or services are assessed to determine whether it is necessary to separate the arrangement into individual component deliverables, each with its own revenue recognition criteria.
Revenue relating to the bundled contracts is allocated to the different deliverables identified, based on their relative fair values (i.e., the fair value of each individual component deliverables in relation to the total fair value of the bundled deliverables), considering that amounts contingent upon delivery of undelivered items are not allocated to delivered items. Given that the handsets and airtime are price-sensitive and volatile in a competitive marketplace, the determination of fair values in the mobile phone business is quite complex.
Additionally, a significant change in the facts and circumstances upon which we based our fair value estimates may have an impact on the allocation of revenue among the different deliverables identified and, consequently, on future revenues.
Operating Environment
Our results of operations are dependent, to a large extent, on the level of demand for our services in the countries in which we operate. Demand for services in those countries is affected by the performance of their respective economies, including changes in gross domestic product, or GDP, inflation, or CPI, external accounts and unemployment rates.
Operating environment by country
Spain
In 2010, Spanish GDP contracted by 0.1%, compared with a positive average annual growth rate of 3.6% in the period 1998 through 2008 and a negative growth rate of 3.6% in 2009. This slowdown was explained by a contraction of internal demand, though household consumption grew at an annual rate of 1.2% during 2010 recovering from a negative growth rate of 4.3% experienced during 2009 and compared to average growth of 3.6% during the period 1998 through 2008. Investment contracted at an annual rate of 7% during 2010 after a 16% decline in 2009, compared to average annual growth of 5.6% during the period 1998 through 2008. Inflation averaged 1.8% in 2010, compared to -0.3% in 2009 and 4.1% in 2008. Despite the higher average annual inflation rate, prices in 2010 experienced a high degree of volatility through the year, reaching a minimum of 0.8% in February and increasing up to 3% by the end of the year. The current account deficit for 2010 reached 4.5% of GDP, compared to 5.5% of GDP in 2009 and 9.5% of GDP in 2008. The unemployment rate reached 20.3% at the end of the year, higher than the rate of 18.8% in 2009 and 13.9% in 2008. The increase in the unemployment rate was mostly explained by the poor employment performance during 2010 when 238 thousand jobs were lost in Spain, totaling more than 2 million since the beginning of the crisis.
United Kingdom
In 2010, the British economy, measured in terms of GDP, grew by 1.3%, compared with a negative growth rate of 4.9% in 2009 and a contraction of 0.1% in 2008. Fixed capital investment increased 3 %, compared with a contraction of 15.4% in 2009 and a contraction of 5% in 2008. Private consumption grew by 0.8%, after falling at an annual rate of 3.3% in 2009 and growing 0.6% in 2008. The CPI increased by an average annual growth rate of 3.3% in 2010, compared with 2.2% in 2009 and 3.6% in 2008. Unemployment rate reached 7.9% in 2010, compared to average annual rates of 7.6% in December 2009 and 5.7% in 2008.
Germany
In 2010, the German economy grew by 3.6%, after contracting 4.7% in 2009 and growing 1.3% in 2008. The significant recovery in 2010 was due to an expansion in fixed income investment of 6.0% in such year, and the positive contribution of the external sector to GDP growth (exports increased 14.1% while imports grew 12.6%). Because of this, the current account balance declined to 4.2% of GDP in 2009, from 6.6% of GDP in 2008. Inflation averaged 1.1% in 2010, compared to 0.3% in 2009 and 2.6% in 2008. At the end of 2010, inflation stood at 1.7%. During 2010, the unemployment rate stood on average at 7.8%, compared to 8.1% in 2009 and 7.9% in 2008. In 2010, 197,000 jobs were created, compared to the 45,000 jobs lost in 2009 and a positive job creation of 565,000 jobs in 2008.
Czech Republic
The Czech economy grew by 2.4% in 2010, after contracting 4.1% in 2009 and growing 2.5% in 2008. Internal demand in 2010 improved slightly compared to 2009, although investment remains subdued. Household consumption expanded 0.4% in 2010, after contracting 0.1% in 2009 and growing 3.5% in 2008. Inflation, as measured by the CPI, grew 2.3% in December 2010, compared to December 2009, slightly above the Central Bank objective (2%) and well below the 3.6% level reached in 2008 (1% in 2009). The current account had a €5.5 billion deficit for 2010, higher than the €4.4 billion deficit recorded in 2009 (€1 billion deficit in 2008). Net foreign direct investment has recovered significantly, creating almost a €4 billion surplus in 2010. This surplus is higher than the surpluses accounted for the two previous years (€1.4 billion surplus in 2009 and €1.5 billion surplus in 2008). The European debt crisis did not have a negative impact on the Czech crown in 2010, with the average Czech crown to euro exchange rate for 2010 appreciating by 5.6%, compared to 1.7% appreciation in 2009 and 1.5% depreciation in 2008.
Brazil
Brazilian GDP increased more than 7% in 2010, after contracting 0.6% in 2009 and growing 5.2% in 2008. Investment increased more than 18% in 2010, after decreasing 10.3% in 2009 and rising by 13.6% in the previous year. Inflation, as measured by the CPI, increased to 5.9% in 2010 (above the inflation target established by the Central Bank, of 4.5%), compared to 4.3% in 2009 and 5.9% in 2008. Due to the reactivation of economic activity and inflation, the basic interest rate, the SELIC, was increased from 8.75% to 10.75%. The current account deficit reached $47.5 billion in 2010, compared to $24.3 billion in 2009 and $28.2 billion in 2008. This deficit in 2010 was financed by capital inflows, such as foreign direct investments of $48.4 billion and portfolio investments of $67.8 billion. As a consequence, international reserves rose by $50.1 billion in 2010, to a record level of $288.6 billion. The improvement in domestic economic data, along with increased liquidity in the international capital markets, led to a decrease in country risk. The J.P. Morgan Emerging Markets Bond Index Plus (EMBI + Brazil) ended 2010 at 189 basis points, from 197 basis points at the end of 2009 and 428 basis points at the end of 2008. As the risk reduced and capital inflows gained strength, the exchange rate restarted its appreciation trend, as observed since 2004. The Brazilian real appreciated against the U.S. dollar by 4.6% in 2010, reaching an exchange rate of R$1.66/ $1.00 on December 31, 2010, from R$1.74 per $1.00 by the end of 2009 and R$2.34 per $1.00 by the end of 2008.
Mexico
Mexico’s real GDP grew by 5.5% in 2010, after contracting 6.1% in 2009 and growing 1.5% in 2008. Inflation, as measured by the CPI, grew 4.4% in December 2010 compared to December 2009, above the central bank’s target of 3% and outside its tolerance range of 2% to 4%. Inflation in 2010 was higher with respect to 2009 (3.6% growth in December 2009 compared to December 2008) due to higher energy prices and an increase of the VAT rate (as of January 1st 2010 the VAT standard rate was increased from 15% to 16% and from 10% to 11% in the Mexican Frontier Zone). Despite the harsh economic downturn, during 2010 the aggregate demand in Mexico has shown an upward trend. Indeed, exports have increased more than 20% and domestic demand has shown a noticeable and generalized recovery as compared to 2009. The trade balance posted a deficit of $3.1 billion, compared to $4.6 billion in 2009. These external imbalances were well financed by capital inflows and international reserves held by the central bank reached $113.6 billion in 2010 (amounting to 10% of GDP). At December 31, 2010, the exchange rate relative to the U.S. dollar was 12.36 Mexican pesos to the U.S. dollar (compared to the maximum reached in March 2009 of 15.56 Mexican pesos to the U.S. dollar).
Venezuela
The Venezuelan economy experienced negative results for the second consecutive year. In 2010, GDP contracted approximately 1.4%, after contracting 3.3% in 2009. Last year, the worst results were observed in non oil activity, which fell 1.5%, while high inflation explained the negative impact on private consumption, which decreased by 2.3% in 2010, compared to a decrease of 3.2% in 2009 and growth of 7.1% in 2008. In 2010, investment showed a meager growth of 0.2% (decrease of 20.0% in 2009 and growth of 2.5% in 2008), public consumption grew 2.6% (growth of 2.3% in 2009 and 6.7% in 2008), exports fell 12.4% (falls of 12.9% in 2009 and 2.7% in 2008), and imports fell 4.6% (fall of 19.6% in 2009 and growth of 3.8% in 2008). In terms of inflation, the national CPI rose to 27.2% in 2010, 25.1% in 2009 and 30.9% in 2008. Venezuela continues with the highest levels
of inflation in Latin America. The unemployment rate reached 6.5% at the end of 2010, 6.6% at the end of 2009 and 6.1% observed in December 2008, because of the fall in economic activity. The external accounts experienced a positive impact as a result of the recovery of oil prices, with the current account surplus increasing to $14.4 billion in 2010 in comparison with $8.6 billion in 2009 and $37.4 billion in 2008. On the other side, the capital account deficit reached $18.8 billion, compared to deficits of $14.0 billion in 2009 and $24.8 billion in 2008. This performance generated a reduction in the central bank’s stock of international reserves to $29.5 billion at the end of 2010. Finally, the parallel exchange rate was approximately 3 times the official exchange rate for priority goods (2.6 Venezuelan bolivar to 1 U.S. dollar) and 2 times over the official exchange rate for non priority goods (4.3 Venezuelan bolivar to 1 U.S. dollar). Those exchange rates were established at the beginning of 2010, when the Government applied the dual exchange system, devaluing the currency.
Chile
Chilean GDP grew by an estimated 5.2% in 2010, recovering from a 1.7% contraction in 2009 caused principally by the international financial crisis. Recovery was accompanied by a fall in the unemployment rate from a 9.7% average in 2009 to 8.1% in 2010. On February 27, 2010, an earthquake of magnitude 8.8 followed by a tsunami struck the central zone of the country. Capital losses were estimated at $22 billion (13.6% of 2009 GDP) including homes, public schools and hospitals, highways, harbors and other public infrastructure. The Government launched a reconstruction program to be executed in 2010-2014. Inflation, as measured by the CPI, reached 3.0% in 2010, compared to -1.4% in 2009 and 7.1% in 2008. As such, it matched the long term inflation target rate defined by the Central Bank. The Monetary Policy Rate climbed from a minimum of 0.5% in June to 3.25% in December. At the end of 2010, the nominal Chilean peso to U.S. dollar exchange rate was 468.4, an appreciation of 8.4% relative to the end of 2009 (506.4 pesos per U.S. dollar). In 2010, the U.S. dollar value ranged between $468 and $550, driven among others by the uncertainly in the international financial markets, higher copper prices and increasing capital inflows to emerging economies. The trade balance had a surplus of $15.9 billion in 2010 (compared to $14.1 billion in 2009 and $8.5 billion in 2008) mostly explained by a 47% year-on-year increase in copper prices since copper exports account for 55% of total export values. Foreign direct investment net inflows for 2010 reached $6.4 billion, compared to $4.8 billion in 2009 and $7.1 billion in 2008. At the end of 2010, the fiscal deficit amounted to 0.4% of GDP compared to a 4.5% deficit at December 31, 2009 and a surplus of 4.3% at December 31, 2008.
Argentina
Argentina’s GDP grew by 9.2% in 2010 according to official statistics, although private estimates suggest that GDP expanded 8.4% in the period. This data is similar to the average annual growth rates of approximately 8.5% achieved from 2003 through 2008, and well above the 0.9% growth of 2009. The Argentine peso depreciated 4.5% relative to the U.S. dollar, closing at 3.98 Argentine pesos per U.S. dollar at the end of 2010 compared to 3.8 Argentine pesos per U.S. dollar at the end of 2009 and 3.45 Argentine pesos per U.S. dollar at the end of 2008. The official CPI increased 10.9% in 2010 (compared to 7.7% in 2009 and 7.2% in 2008); although private entities estimate that the true increase was 26.4%. The current account balance showed a surplus of $3.6 billion in 2010, which is 67.9% and 46.4% lower compared to 2009 and 2008, respectively. The trade balance contributed significantly to this result since imports increased 44.9%, more than the 23% increase in exports over the same period. Economic conditions also affected unemployment, which decreased to 7.3% at the end of 2010 from 8.4% at the end of 2009 and 7.3% at the end of 2008.
Colombia
After the deceleration in GDP growth in 2008 and entering into a recession in 2009, the Colombian economy in 2010 showed a solid recovery as a result of the good performance of domestic demand components, private consumption and investment. Industry and retail sales showed significant growth over the year. Colombia's GDP grew by 4.3% in 2010. The unemployment rate averaged 11.8% in 2010, compared to 12% in 2009 and 11.3% in 2008. The current account balance at the end of 2010 reflected a current account deficit of $8,944 million, 3.1% of GDP, compared to 2.2% of GDP in 2009 and 2.8% of GDP in 2008. The deficit in 2010 compared to 2009 ($5,141 million, 2.2% of GDP) was mainly financed through higher public and private external debt, and to a lower extent by foreign direct investment inflows. This resulted in a financial account surplus of $11,879 million (4.1% of GDP). The Colombian peso appreciated 6.4% during 2010 (closing the year at 1,914 Colombian pesos to the US dollar)
primarily as a consequence of the following local and external factors: i) maturity of government bonds that were settled using resources denominated in foreign currency; ii) private sector foreign exchange transactions conducted to obtain Colombian pesos for their tax payments; iii) significant foreign direct investment inflows related to mining and oil sectors, and iv) better economic attitude of the Colombian economy compared to other countries reflected in a lower EMBI level and lower volatility registered by the Chicago Board Options Exchange Market Volatility Index (“VIX”). Year-on-year CPI was 3.2% for 2010, compared to 2.0% for 2009 and 7.7% for 2008.
Peru
During 2010, the Peruvian economy, in terms of GDP, grew by 8.8% compared to 0.9% in 2009 and 9.8% in 2008. The acceleration in GDP growth was mainly driven by domestic private demand. However, the contribution of public expenditures to growth was still significant during the first half of 2010. Consumer prices, as measured by the CPI, increased by 2.1% in 2010 (0.1 percentage points over the center –and within the range- of the central bank’s target), compared with 0.3% in 2009 and 6.7% in 2008. The fiscal deficit was 0.6% of GDP, compared to a fiscal deficit of 1.9% in 2009 and surplus of 2.1% in 2008, while net foreign direct investment increased by 37%, compared with a decrease of 16% in 2009 and a gain of 14% in 2008. In the foreign exchange market, the Peruvian nuevo sol appreciated 2.9% against the U.S. dollar in 2010, reaching 2.81 Peruvian nuevo sol per U.S. dollar at the end of the year, compared with an appreciation of 8% in 2009 and a depreciation of 4.8% in 2008. Country risk, measured by the J.P. Morgan Emerging Markets Bond Index (EMBIG Peru), fell 22 basis points to 157 basis points in 2010, due to solid macroeconomic fundamentals, highlighted by sound public finances and financial markets’ dynamism. Long-term sovereign debt is currently investment grade rated by Fitch, Standard and Poor’s and Moody’s rating agencies.
Exchange Rate Fluctuations
We publish our Consolidated Financial Statements in euro. Because a substantial portion of our assets, liabilities, revenues and profit are denominated in currencies other than the euro, we are exposed to fluctuations in the values of these currencies against the euro. Currency fluctuations have had and may continue to have a material impact on our financial condition, results of operations and cash flows.
We estimate that in 2010 variations in currencies decreased our collection and payment and cash balance by approximately €463 million and increased our consolidated revenues by approximately 2.2% including the devaluation in the Venezuelan bolivar. Currency fluctuations can also have a significant impact on our statement of financial position, particularly equity attributable to equity holders of the parent, when translating the financial statements of subsidiaries located outside the euro zone into euro. For example, in 2010 equity attributable to equity holders of the parent increased by €430 million due to the translation of the financial statements of our foreign subsidiaries, principally due to the appreciation of the Brazilian real and the pound sterling relative to the euro, and the effect of the devaluation in Venezuela.
We estimate that in 2009 variations in currencies increased our collection and payment and cash balance by approximately €269 million and decreased our consolidated revenues by approximately 3.1%. Currency fluctuations can also have a significant impact on our statement of financial position, particularly equity attributable to equity holders of the parent, when translating the financial statements of subsidiaries located outside the euro zone into euro. For example, in 2009 equity attributable to equity holders of the parent increased by €2,238 million due to the translation of the financial statements of our foreign subsidiaries, principally due to the appreciation of the Brazilian real and the pound sterling relative to the euro, and the effect of the devaluation in Venezuela.
We estimate that in 2008 variations in currencies decreased our collection and payment and cash balance by approximately €302 million and decreased our consolidated revenues by approximately 3%. Currency fluctuations can also have a significant impact on our statement of financial position, particularly equity attributable to equity holders of the parent, when translating the financial statements of subsidiaries located outside the euro zone into euro. For example, in 2008 equity attributable to equity holders of the parent decreased by €3,708 million due to the translation of the financial statements of our foreign subsidiaries, principally due to the depreciation of the pound sterling and Brazilian real relative to the euro.
The table below sets forth the average exchange rates against the euro of the dollar and the key currencies that impacted our consolidated results of operations for the periods indicated. Positive percentage changes represent a decline in the value of the applicable currency relative to the euro, and negative percentage changes represent increases in the value of the applicable currency relative to the euro.
|
2008(1)
Average
|
2009(1)
Average
|
2010(1)
Average
|
% change 2008 to 2009
Average
|
% change 2009 to 2010
Average
|
||||||||||||||||
|
Pound Sterling
|
0.79 | 0.89 | 0.86 | 12.04 | % | (3.37 | %) | |||||||||||||
|
U.S. Dollar
|
1.46 | 1.39 | 1.32 | (5.00 | )% | (5.04 | %) | |||||||||||||
|
Brazilian Real
|
2.66 | 2.76 | 2.33 | 3.68 | % | (15.58 | %) | |||||||||||||
|
Argentine Peso
|
4.63 | 5.17 | 5.18 | 11.70 | % | 0.19 | % | |||||||||||||
|
Peruvian Nuevo Sol
|
4.29 | 4.18 | 3.74 | (2.56 | )% | (10.53 | %) | |||||||||||||
|
Chilean Peso
|
758.73 | 775.80 | 674.36 | 2.25 | % | (13.08 | %) | |||||||||||||
|
Mexican Peso
|
16.24 | 18.78 | 16.71 | 15.63 | % | (11.02 | %) | |||||||||||||
|
Venezuelan Bolivar fuerte (2)
|
3.15 | 3.10 | 5.75 | (5.00 | )% | 85.48 | % | |||||||||||||
|
Czech Crown
|
24.97 | 26.44 | 25.29 | 5.87 | % | (4.35 | %) | |||||||||||||
|
Colombian Peso
|
2,873.56 | 2,985.07 | 2,509.22 | 3.88 | % | (15.94 | %) | |||||||||||||
|
Guatemalan Quetzal
|
11.07 | 11.33 | 10.66 | 2.37 | % | (5.91 | %) | |||||||||||||
|
|
Source: Central treasury bank of the respective countries.
|
|
|
(1)
|
These exchange rates are used to convert the income statements of our subsidiaries from local currency to euro.
|
|
|
(2)
|
After considering Venezuela a hyperinflationary country, the income statement from operations in Venezuela is to be accounted pursuant to the closing exchange rate of Venezuelan bolivar fuerte to euro.
|
In the comparison below of our results of operations, we have provided certain comparisons at constant exchange rates in order to present an analysis of the development of our results of operations from year-to-year without the effects of currency fluctuations. To make such comparisons, we have converted into euro certain financial items for the relevant year using the prior year’s average exchange rate. We refer to such comparisons as being made on a “constant euro basis” or “excluding foreign exchange rate effects.”
We also make certain comparisons on a local currency basis. To make comparisons on a local currency basis, we compare financial items in the relevant local currency for the periods indicated as recorded in the relevant local currency for such periods.
We describe certain risks relating to exchange rate fluctuations in “Item 3. Key Information—Risk Factors,” and we describe our policy with respect to limiting our exposure to short-term fluctuations in exchange rates under “Item 11. Quantitative and Qualitative Disclosures About Market Risk.”
Regulation
We are subject to regulation in the different markets where we operate, particularly with regard to the prices we can charge for certain of our goods and services in certain jurisdictions as well as our need to comply with certain obligations, which has a significant effect on our profitability. For more information regarding regulation in the markets in which we operate, see “Item 4. Information on the Company—Business Overview—Regulation.”
Group Results of Operations
A summary of our results of operations for 2008, 2009 and 2010 and certain consolidated revenue and expense items as a percentage of revenues for the periods indicated is shown below.
|
Year ended December 31,
|
||||||||||||||||||||||||
|
2008
|
2009
|
2010
|
||||||||||||||||||||||
|
Total
|
Percentage of revenues
|
Total
|
Percentage of revenues
|
Total
|
Percentage of revenues
|
|||||||||||||||||||
|
(in millions of euros, except percentage of revenues)
|
||||||||||||||||||||||||
|
Revenues
|
57,946 | 100.0 | % | 56,731 | 100.0 | % | 60,737 | 100.0 | % | |||||||||||||||
|
Other income
|
1,865 | 3.2 | % | 1,645 | 2.9 | % | 5,869 | 9.7 | % | |||||||||||||||
|
Supplies
|
(17,818 | ) | (30.7 | )% | (16,717 | ) | (29.5 | )% | (17,606 | ) | (29.0 | %) | ||||||||||||
|
Year ended December 31,
|
||||||||||||||||||||||||
|
2008
|
2009
|
2010
|
||||||||||||||||||||||
|
Total
|
Percentage of revenues
|
Total
|
Percentage of revenues
|
Total
|
Percentage of revenues
|
|||||||||||||||||||
|
(in millions of euros, except percentage of revenues)
|
||||||||||||||||||||||||
|
Personnel expenses
|
(6,762 | ) | (11.7 | )% | (6,775 | ) | (11.9 | )% | (8,409 | ) | (13.8 | %) | ||||||||||||
|
Other expenses
|
(12,312 | ) | (21.2 | )% | (12,281 | ) | (21.6 | )% | (14,814 | ) | (24.4 | %) | ||||||||||||
|
Operating income before depreciation and amortization (OIBDA)
(1)
|
22,919 | 39.6 | % | 22,603 | 39.8 | % | 25,777 | 42.4 | % | |||||||||||||||
|
Depreciation and amortization
|
(9,046 | ) | (15.6 | )% | (8,956 | ) | (15.8 | )% | (9,303 | ) | (15.3 | %) | ||||||||||||
|
Operating income
|
13,873 | 23.9 | % | 13,647 | 24.1 | % | 16,474 | 27.1 | % | |||||||||||||||
|
Share of profit (loss) of associates
|
(161 | ) | (0.3 | )% | 47 | 0.1 | % | 76 | 0.1 | % | ||||||||||||||
|
Net financial income (expense)
|
(2,797 | ) | (4.8 | )% | (3,307 | ) | (5.8 | )% | (2,649 | ) | (4.4 | %) | ||||||||||||
|
Corporate income tax
|
(3,089 | ) | (5.3 | )% | (2,450 | ) | (4.3 | )% | (3,829 | ) | (6.3 | %) | ||||||||||||
|
Profit for the year from continuing operations
|
7,826 | 13.5 | % | 7,937 | 14.0 | % | 10,072 | 16.6 | % | |||||||||||||||
|
Income (loss) from discontinued operations
|
— | — | — | — | — | — | ||||||||||||||||||
|
Profit for the year
|
7,826 | 13.5 | % | 7,937 | 14.0 | % | 10,072 | 16.6 | % | |||||||||||||||
|
Non-controlling interests
|
(234 | ) | (0.4 | )% | (161 | ) | (0.3 | )% | 95 | 0.2 | % | |||||||||||||
|
Profit for the year attributable to equity holders of the parent
|
7,592 | 13.1 | % | 7,776 | 13.7 | % | 10,167 | 16.7 | % | |||||||||||||||
|
(1)
|
For a reconciliation of OIBDA to operating income, see “—Operating Results—Presentation of Financial Information—Non-GAAP financial information—Operating income before depreciation and amortization.”
|
Overview
We remain committed to growing our customer base which, measured in terms of total accesses, continued to expand in 2010, by 8.7% to 287.6 million accesses at December 31, 2010 from 264.6 million accesses at December 31, 2009, which was 2.1% higher than the 259.1 million accesses at December 31, 2008. The increase in 2010 was primarily driven by an 8.9% increase in mobile access, a 27.0% increase in broadband accesses and a 12.0% increase in pay TV accesses. Growth in total accesses from 2008 to 2009 is also primarily explained by the strong growth in mobile and broadband accesses. This growth in the customer base, the consolidation in the fourth quarter of 2010 of 100% of Vivo Participaçoes and the greater contribution of the mobile data business in 2010, drove a 7.1% increase in revenue from operations (revenues) in 2010 compared with 2009. Excluding foreign exchange-rate effects and the consideration of Venezuela as a hyperinflationary economy, revenues would have increased by 4.9% in 2010 as compared to 2009.
We believe our diversification is key to achieving this improvement in consolidated revenues. In 2010, Telefónica Latin America and Telefónica Europe accounted for 68% of consolidated revenues, while Telefónica Spain represented less than 31% of our revenues. In all our markets, the competitive environment remained intense and continued to put downward pressure on our tariff structures or resulted in higher commercial expenses to keep pace, which resulted in revenue growth lagging behind access growth. In addition, further downward pressure was placed on our revenues from mobile accesses as a result of regulatory action in the European Union and certain Latin American countries, which resulted in decreased interconnection and roaming rates during the period.
The positive revenues performance, coupled with gains on asset disposals recognized in the year (€4,150 million), drove a 14% increase in OIBDA to €25,777 million in 2010 from €22,603 million in 2009. However, excluding foreign exchange rate effects and the consideration of Venezuela as a hyperinflationary economy, OIBDA would have increased by 13.0% in 2010 compared to 2009. OIBDA was affected by the positive contribution from the revaluation of the previously-held stake in Vivo at the date of acquisition of the 50% in Brasilcel owned by Portugal Telecom (€3,797 million in the third quarter). We recognized non-recurrent restructuring expenses of €1,262 million in 2010, mainly related to personnel reorganization and firm commitments relating to the Telefónica Foundation’s social activities, which negatively impacted OIBDA. Operating income increased by 20.7% to €16,474 million in 2010 from €13,647 million in 2009. Profit for the year attributable to equity holders of the parent increased by 30.7% to €10,167 million in 2010 from €7,776 million in 2009. This performance is mainly due to the following:
|
|
·
|
The positive revenues performance, as described above
.
|
|
|
·
|
The gain on disposal of assets, which amounted to €4,150 million in 2010, mainly reflecting the positive effect of remeasuring the previously held investment in Vivo
Participaçoes
at the date of acquisition of 50% of Brasilcel previously held by Portugal Telecom (€3,797 million in the third quarter of the year) and the sale of Manx Telecom at the end of June, which generated a gain of €61 million
.
|
|
|
·
|
Restructuring expenses recognized in 2010 (€862 million, net of tax and non-controlling interests
).
|
|
|
·
|
The reassessment of the value of recognized tax assets associated with Colombia Telecomunicaciones, S.A. ESP (€450 million, net of non-controlling interests
).
|
We increased our customer base, measured in terms of total accesses, by 2.1% to 264.6 million accesses at December 31, 2009 from 259.1 million accesses at December 31, 2008. This growth from December 31, 2008 to December 31, 2009 was primarily driven by a 3.3% increase in mobile accesses, an 8.2% increase in broadband accesses and a 9.8% increase in pay TV accesses, which more than offset our 5.4% loss of fixed telephony accesses and 28.5% loss of narrowband accesses as these technologies continue to be substituted by customers for mobile and broadband technologies, respectively. The growth in our customer base in terms of accesses from December 31, 2008 to December 31, 2009 under difficult economic circumstances did not, however, result in a corresponding increase in revenues, which decreased 2.1% in 2009 compared to 2008. However, excluding foreign exchange rate effects (i.e., by converting into euro relevant items for 2009 using 2008’s average exchange rates) and the effects of Venezuela being considered a hyperinflationary economy in 2009, revenues would have increased 0.3% in 2009 compared to 2008. In Spain and Europe, the competitive environment remained intense and continued to put downward pressure on our tariff structures, which resulted in revenue growth not keeping pace with access growth. In addition, further downward pressure was placed on our revenues from mobile accesses as a result of regulatory action in the European Union and certain Latin American countries, which resulted in decreased interconnection and roaming rates during the period. This decrease in revenues led to a 1.4% decrease in OIBDA to €22,603 million in 2009 from €22,919 million 2008. Nonetheless, excluding foreign exchange rate effects and excluding the effects of Venezuela being considered a hyperinflationary economy in 2009, OIBDA would have increased 0.5% in 2009 compared to 2008. Operating income decreased 1.6% to €13,647 million in 2009 from €13,873 million in 2008, while profit for the year attributable to equity holders of the parent company increased 2.4% to €7,776 million in 2009 from €7,592 million in 2008 primarily as a result of our share of profit of associates and lower corporate income tax primarily related to the reversal of a tax liability.
Year ended December 31, 2010 compared to year ended December 31, 2009
Revenues
Revenues increased 7.1% to €60,737 million in 2010 compared to €56,731 million in 2009. Excluding foreign exchange rate effects and excluding the effects of Venezuela being considered a hyperinflationary economy in 2010 and 2009, revenues would have increased by 4.9% in 2010 compared to 2009.
By geographic area, Telefónica Latin America contributed 42.9% of our 2010 revenues, which represents an increase of 2.4 percentage points from 2009. Telefónica Spain contributed 30.8% of our 2010 revenues (34.7% in 2009) and Telefónica Europe contributed 25.1% (23.9% in 2009).
Other income
Other income amounted to €5,869 million in 2010 compared to €1,645 million in 2009. In 2010, this income included a €3,797 million capital gain arising from the positive impact of remeasuring the previously held investment in Vivo Participaçoes at the date of acquisition of the 50% stake of Brasilcel held by Portugal Telecom. Other income in 2009 included a €220 million gain on the sale of our stake in Medi Telecom.
Total expenses
Total expenses include supplies, personnel expenses and other expenses (mainly external services and taxes other than corporate income tax). Total expenses do not include depreciation and amortization.
Total expenses rose 14.1% to €40,829 million in 2010 compared to €35,773 million in 2009. This growth was primarily the result of recognizing restructuring costs of €1,262 million in the second half of 2010, derived primarily from the restructuring of the workforces of several companies (€658 million) and firm commitments related to the Telefónica Foundation’s social program (€400 million, €280 million of which was recognized by Telefónica, S.A. and the remainder in Telefónica Latin America).
Excluding foreign exchange rate effects and excluding the effects of Venezuela being considered a hyperinflationary economy in 2010 and 2009,
total expenses would have increased 11.1% in 2010 compared to 2009.
Supplies
. Supplies increased 5.3% to €17,606 million in 2010 compared to €16,717 million in 2009. Excluding foreign exchange rate effects and excluding the effects of Venezuela being considered a hyperinflationary economy in 2010 and 2009, supplies would have increased 3.1% from 2009 to 2010. This increase was primarily due to increased interconnection costs in Telefónica Latinamerica and increased supplies expenses in Telefónica Europe stemming from the inclusion of HanseNet, offsetting decreases in Telefónica Spain attributable to lower interconnection costs.
Personnel expenses.
Personnel expenses increased 24.1% to €8,409 million in 2010 compared to €6,775 million in 2009. Excluding foreign exchange rate effects and excluding the effects of Venezuela being considered a hyperinflationary economy in 2010 and 2009, personnel expenses would have increased 20.5% from 2009 to 2010. This increase was primarily due to restructuring the workforces of several Group companies. The average workforce during 2010 reached 269,047 employees, with a net increase of 13,896 employees compared to 2009, mainly due to the workforce increases within Atento. Excluding employees of Atento, our average number of employees in 2010 would have increased 2% to 128,011 employees compared to 2009.
Other expenses
. Other expenses are mainly comprised of external services, which consist of commercial expenses related to our business (such as commissions to distributors of services, marketing and advertising expenses and customer service related expenses) network maintenance expenses, general administrative expenses and subcontracted services expenses, as well as certain types of taxes. Other expenses also include changes in operating allowances and other operating expenses. Other expenses increased 20.6% to €14,814 million in 2010 from €12,281 million in 2009. Excluding foreign exchange rate effects and excluding the effects of Venezuela being considered a hyperinflationary economy in 2010 and 2009, other expenses would have increased 16.8% in 2010 compared to 2009. This increase was principally driven by increased commercial efforts in the three areas as a result of significant competition and the increase in network management and systems costs at Telefónica Latin America. This item also included firm commitments related to the Telefónica Foundation’s social program (€400 million).
Operating income before depreciation and amortization (OIBDA)
As a result of the foregoing, our OIBDA increased 14.0% to €25,777 million in 2010 compared to €22,603 million in 2009. Excluding foreign exchange rate effects and excluding the effects of Venezuela being considered a hyperinflationary economy in 2010 and 2009, OIBDA would have increased 13.0% from 2009 to 2010.
Of our 2010 OIBDA, Telefónica Spain contributed 33.1% (43.2% in 2009), while Telefónica Latin America and Telefónica Europe contributed 53.5% (40.5% in 2009) and 15.6% (17.3% in 2009), respectively
.
Our OIBDA margin increased to 42.4% in 2010 compared to
39.8% in 2009. For a reconciliation of OIBDA to operating income, see “—Presentation of Financial Information—Non-GAAP financial information—Operating income before depreciation and amortization.”
Depreciation and amortization
Our depreciation and amortization increased 3.9% to €9,303 million in 2010 compared to €8,956 million in 2009. Excluding foreign exchange rate effects and excluding the effects of Venezuela being considered a hyperinflationary economy in 2010 and 2009, depreciation and amortization would have increased 1.6% from 2009 to 2010, principally driven by Telefónica Latin America and Telefónica Europe depreciation and amortization increases. Telefónica Latin America depreciation and amortization in 2010 includes the amortization recognized in
the fourth quarter related to the assets assumed as part of the purchase price allocation of Vivo Participaçoes (€84 million). In 2009, depreciation and amortization for Telefónica Europe included the amortization of the purchase price allocation made following the acquisition of the O2 Group (€635 million) and Telefónica O2 Czech Republic (€89 million).
Operating income
As a result of the foregoing, our operating income increased 20.7% to €16,474 million in 2010 from €13,647 million in 2009. Excluding foreign exchange rate effects and excluding the effects of Venezuela being considered a hyperinflationary economy in 2010 and 2009, operating income would have increased 22.4% from 2009 to 2010.
Share of profit (loss) of associates
Our share of profit of associates in 2010 amounted to €76 million, 61.7% higher than in 2009 due mainly to the improved results from our interest in Telco.
Net financial income (expense)
Net financial expense decreased 20% to €2,649 million in 2010 compared to €3,307 million in 2009. The average cost of net debt of the Group, which we measure as net financial expense divided by our average net debt, was 5.0% in 2010 compared to 7.3% in 2009. The effects derived from the consideration of Venezuela as a hyperinflationary economy as described in “Item 5. Operating and Financial Review and Prospects—A. Operating Results—Significant Factors Affecting the Comparability of our Results of Operations in the Periods Under Review—Classification of Venezuela as a hyperinflationary economy” resulted in a reduction in net financial expense of €521 million in 2010. Excluding such effect, the changes in our performance in 2010 were primary the result of:
|
|
·
|
Changes in accumulated foreign exchange gains and losses at December 31, 2010 from the same period of the prior year, which resulted in lower expenses of €172 million.
|
|
|
·
|
The drop in interest rates over the last year, changes in the present value of the obligations arising from redundancy programs and other financial transactions, which combined to reduce costs by €410 million. The change in the volume of debt led to an increase in finance costs of €254 million. The net impact of these factors was a €156 million savings in costs in 2010.
|
|
|
·
|
The €191 million expense corresponding to the transfer of the value of the investment in Banco Bilbao Vizcaya Argentaria, S.A. (“BBVA”) from equity to financial results. This interest continues to be recognized as an available for sale financial asset.
|
Net financial expense for 2010 (excluding the aforementioned €191 million expense) amounted to €2,458 million, representing 4.9% of average total debt of €49,999 million.
Corporate income tax
Corporate income tax increased to €3,829 million in 2010 compared to €2,450 million in 2009 (an increase of 56.2%), affected by reassessment of the value of recognized tax assets in Colombia in the amount of €864 million. In addition, a tax effect of €321 million was recognized deriving from the remeasurement of the previously held investment in Vivo Participaçoes at the date of acquisition of the 50% stake of Brasilcel held by Portugal Telecom. The increase in corporate income tax was partially offset by tax credits generated in México and Terra Brazil totalling €138 million, which are based on the expected taxable income to be generated by the companies.
Non-controlling interests
Profit for the year attributable to our non-controlling interests amounted to a positive figure of €95 million in 2010 compared to a negative figure of €161 million in 2009, primarily as a result of the non-controlling interests’ share of losses relating to Colombia Telecom, which increased subsequent to the aforementioned reassessment of
the value of recognized tax assets, more than offsetting the non-controlling interests’ share of the profits of Vivo Participaçoes, Telesp, and Telefónica O2 Czech Republic.
Profit for the year attributable to equity holders of the parent company
As a result of the above, our profit for the year attributable to equity holders of the parent company increased 30.7% to €10,167 million in 2010 compared to €7,776 million in 2009.
Results of Operations by Business Area for 2009 and 2010
The table below sets forth the contribution to our results of operations by each of our three principal business areas and other companies for 2009 and 2010. Revenues and related expenses for each of the business areas are presented after elimination of sales to other members of the Telefónica Group belonging to the same business area. See Note 4 to our Consolidated Financial Statements.
|
Year ended December 31,
|
||||||||||||
|
2009
|
2010
|
% Change
|
||||||||||
|
(in millions of euros)
|
||||||||||||
|
Revenues
|
56,731 | 60,737 | 7.1 | % | ||||||||
|
Telefónica Spain
|
19,703 | 18,711 | (5.0 | )% | ||||||||
|
Telefónica Europe
|
13,533 | 15,255 | 12.7 | % | ||||||||
|
Telefónica Latin America
|
22,983 | 26,041 | 13.3 | % | ||||||||
|
Other companies & eliminations
|
512 | 730 | 42.6 | % | ||||||||
|
Other income
|
1,645 | 5,869 | 256.8 | % | ||||||||
|
Telefónica Spain
|
497 | 313 | (37.0 | )% | ||||||||
|
Telefónica Europe
|
234 | 270 | 15.4 | % | ||||||||
|
Telefónica Latin America
|
646 | 4,889 | 656.8 | % | ||||||||
|
Other companies & eliminations
|
268 | 397 | 48.1 | % | ||||||||
|
Expenses(1)
|
(35,773 | ) | (40,829 | ) | 14.1 | % | ||||||
|
Telefónica Spain
|
(10,443 | ) | (10,505 | ) | 0.6 | % | ||||||
|
Telefónica Europe
|
(9,857 | ) | (11,512 | ) | 16.8 | % | ||||||
|
Telefónica Latin America
|
(14,486 | ) | (17,148 | ) | 18.4 | % | ||||||
|
Other companies & eliminations
|
(987 | ) | (1,664 | ) | 68.6 | % | ||||||
|
Depreciation and amortization
|
(8,956 | ) | (9,303 | ) | 3.9 | % | ||||||
|
Telefónica Spain
|
(2,140 | ) | (2,009 | ) | (6.1 | )% | ||||||
|
Telefónica Europe
|
(2,895 | ) | (3,091 | ) | 6.8 | % | ||||||
|
Telefónica Latin America
|
(3,793 | ) | (4,061 | ) | 7.1 | % | ||||||
|
Other companies & eliminations
|
(128 | ) | (142 | ) | 10.9 | % | ||||||
|
Operating income
|
13,647 | 16,474 | 20.7 | % | ||||||||
|
Telefónica Spain
|
7,617 | 6,511 | (14.5 | )% | ||||||||
|
Telefónica Europe
|
1,015 | 923 | (9.1 | )% | ||||||||
|
Telefónica Latin America
|
5,350 | 9,721 | 81.7 | % | ||||||||
|
Other companies & eliminations
|
(335 | ) | (681 | ) | 103.3 | % | ||||||
|
(1)
|
Expenses as used in this table and in the below discussion include supplies expenses, personnel expenses and other expenses. It does not include depreciation and amortization.
|
In the discussion that follows revenues and related expenses for each business included within a particular business area are presented gross of any eliminations due to sales to other businesses in such business area or other members of the Telefónica Group.
Results of Operations by Business Area for 2009 and 2010
Pursuant to management’s efforts to organize and integrate the management and controls of the mobile and fixed businesses in Spain in order to enhance our understanding and monitoring of our operations in this market, including the financial success of our operations, we decided in 2010 to publish our selected consolidated financial
data corresponding to Telefónica Spain’s fixed and mobile business on a combined basis with only revenues broken down at a business level. Such a presentation allows management to analyze the financial performance of Telefónica Spain free from distortions, particularly at the level of operating expenses and investment, which may arise in a segregated presentation. We continue to report all other operating metrics as previously reported.
Telefónica Spain
Revenues
Telefónica Spain’s revenues decreased 5.0% to €18,711 million in 2010 from €19,703 million in 2009.
Revenues from Telefónica Spain’s fixed business decreased 6.3% to €11,397 million in 2010 from €12,167 million in 2009 principally due to a decrease in the revenues of traditional voice service and accesses in an adverse economic context.
|
|
·
|
Revenues from traditional accesses decreased 13.1% to €2,426 million in 2010 compared
to €2,792 million in 2009,
primarily as a result of a reduction in the number of accesses.
|
|
|
·
|
Revenues from traditional voice services decreased 10.9% to €3,548 million in 2010 compared to €3,983 million in 2009. This evolution is mainly due to lower fixed-to-mobile traffic, a decrease of international traffic and an increasing portion of traffic included in national flat tariff plans.
|
|
|
·
|
Revenues from Internet and broadband services decreased 0.9%
to €2,933 million in 2010 compared to 2,960 million in 2009. Retail broadband service revenues decreased 4.3% in 2010 compared to 2009, due to ARPU reductions for promotions carried out. Wholesale broadband service revenues increased 29.0% in 2010 compared to 2009 reflecting the growth in the customer base for unbundled local loops and wholesale ADSL accesses in 2010.
|
|
|
·
|
Revenues from data services grew 4.9% to €1,358 million in 2010 compared to €1,294 million in 2009, driven by increased revenues from leased circuits to mobile operators, mainly Telefónica Móviles España, as a result of the rapid growth in mobile broadband.
|
|
|
·
|
Revenues from information technology services grew 19.0% to €604 million in 2010 compared to €508 million in 2009, boosted by the sale of software licenses (€51 million).
|
Revenues from Telefónica Spain’s mobile business decreased 4.6% to €8,550 million in 2010 compared to €8,965 million in 2009, due primarily to lower voice consumption by customers.
|
|
·
|
Customer revenues decreased 5.3% to €6,226 million in 2010 compared to €6,571 million in 2009 due to lower consumption and reductions in prices in a very competitive environment.
|
|
|
·
|
Interconnection revenues decreased 20.9% to €792 million in 2010 compared to €1,001 million in 2009, due to MTR cuts.
|
|
|
·
|
Roaming-in revenues fell 8.6% to €140 million in 2010 compared to €153 million in 2009 due to the downward trend in roaming consumption and wholesale prices.
|
|
|
·
|
Revenues from handset sales increased 12.6% to €1,280 million in 2010 compared to €1,137 million in 2009, driven by increased sales of smartphones.
|
Expenses
Telefónica Spain’s total expenses increased 0.6% to €10,504 million in 2010 compared to €10,443 million in 2009, including €202 million in restructuring expenses derived primarily from the restructuring of workforces and the recognition of a €107 million TV tax.
|
|
·
|
Supplies decreased 2.5% to €4,185 million in 2010 compared to €4,293 million in 2009, principally due to lower interconnection expenses related to MTR cuts, which offset increased mobile handset expenses.
|
|
|
·
|
Personnel expenses increased 15.3% to €2,658 million in 2010 compared to €2,305 million in 2009. Such increase was due primarily to the revision of estimates made prior to 2009 relating to personnel commitments and, particularly in the fourth quarter of 2010, due to restructuring expenses related to personnel reorganization and the negative impact of a higher-than-estimated Consumer Price Index figures.
|
|
|
·
|
Other expenses decreased 4.8% to €3,661 million in 2010 compared to €3,845 million in 2009. This decrease was the result of efforts by the company to decrease levels of uncollectible balances and occurred despite the recognition in 2010 of a TV tax provision.
|
Operating income before depreciation and amortization (OIBDA)
As a result of the foregoing, Telefónica Spain’s OIBDA decreased 12.7% to €8,520 million in 2010 compared to €9,757 million in 2009. Telefónica Spain’s OIBDA, as a percentage of Telefónica Spain’s revenues, was 45.5% in 2010 compared to 49.5% in 2009.
Depreciation and amortization
Telefónica Spain’s depreciation and amortization decreased 6.1% to €2,009 million in 2010 compared to €2,140 million in 2009 due primarily to capital expenditures efficiencies derived from previous years.
Operating income
As a result of the foregoing, Telefónica Spain’s operating income decreased 14.5% to €6,511 million in 2010 compared to €7,617 million in 2009.
Telefónica Europe
Revenues
Telefónica Europe’s revenues increased 12.7% to €15,255 million in 2010 compared to €13,533 million in 2009, driven by growth in accesses and an increase in the average pound sterling to euro exchange rate. Also driving revenues were the acquisitions of HanseNet and Jajah, which contributed €807 million, although this was partially offset by the reductions in MTRs (which affected both revenues and expenses).
|
|
·
|
Revenues derived from Telefónica O2 UK increased 10.6% to €7,201 million in 2010 compared to €6,512 million in 2009 (an increase of 6.5% in local currency). The increase in local currency revenue was primarily driven by an increase in Telefónica O2 UK’s mobile service revenues associated with smartphones.
|
|
|
·
|
Revenues derived from Telefónica O2 Germany increased 28.9% to €4,826 million in 2010 compared to €3,746 million in 2009. The positive evolution was mainly the result of an increase in customer base and the acquisition of HanseNet, which was adversely impacted by lower MTRs.
|
|
|
·
|
Revenues derived from Telefónica O2 Czech Republic, including Slovakia operations, decreased 2.8% to €2,197 million in 2010 compared to €2,260 million in 2009. Slovakia continued to grow in mobile revenues (50.5%) while Czech revenues from fixed and mobile services decreased (-8.7% in local currency) due to MTR cuts, customers optimizing their expenditures and lower government spending on IT services.
|
|
|
·
|
Revenues derived from Telefónica O2 Ireland decreased 6.3% to €848 million in 2010 compared to €905 million in 2009. The decrease was mainly the result of lower customer spending, market competition in the prepay segment and lower MTRs.
|
Expenses
Telefónica Europe’s total expenses increased 16.8% to €11,512 million in 2010 compared to €9,857 million in 2009. This increase was partially due to operating expenses related to the consolidation of HanseNet and non-recurring restructuring expenses related to personal reorganization in the second half of the year.
|
|
·
|
Supplies increased 7.4% to €6,648 million in 2010 from €6,189 million in 2009, mainly due to the inclusion of HanseNet and the increase of the pound sterling to euro exchange rate over the period, offset by the impact of lower MTRs.
|
|
|
·
|
Personnel expenses increased 24.6% to €1,625 million in 2010 from €1,304 million in 2009,
mainly due to non-recurrent restructuring costs, derived primarily from the restructuring of the workforces at Telefónica O2 Germany and Telefónica O2 UK.
|
|
|
·
|
Other expenses increased 37% to €3,239 million in 2010 from €2,364 million in 2009 mainly due to the acquisition of HanseNet and the strengthening of the pound sterling to euro exchange rate over the period.
|
Operating income before depreciation and amortization (OIBDA)
As a result of the foregoing, Telefónica Europe’s OIBDA increased 2.6% to €4,014 million in 2010 from €3,910 million in 2009. The increase in OIBDA significantly lagged the increase in revenues due primarily to higher cost of sales and commercial costs, and also restructuring expenses registered in 2010.
|
|
·
|
OIBDA in Telefónica O2 UK increased 9% to €1,830 million in 2010 from €1,680 million in 2009 (an increase of 4.9% in local currency) mainly due to service revenues increases (customer base and mobile internet services increased).
|
|
|
·
|
OIBDA in Telefónica O2 Germany increased 2.8% to €944 million in 2010 from €918 million in 2009 mainly due to increases in revenues.
|
|
|
·
|
OIBDA in Telefónica O2 Czech Republic, including Slovakia operations, decreased 9.5% to €953 million in 2010 from €1,053 million in 2009 due to poor revenues performance, which was partially offset by reductions in direct costs (supplies) and in commercial costs.
|
|
|
·
|
OIBDA in Telefónica O2 Ireland decreased 9.0% to € 275 million in 2010 from €302 million in 2009 due to a decline in revenues.
|
Depreciation and amortization
Telefónica Europe’s depreciation and amortization increased 6.7% to €3,091 million in 2010 from €2,895 million in 2009. This is mainly due to the strengthening of the average pound sterling to euro exchange rate as well as the acquisition of HanseNet.
Operating income
As a result of the foregoing, Telefónica Europe’s operating income decreased 9.1% to €923 million in 2010 from €1,015 million in 2009.
Telefónica Latin America
Revenues
Revenues at Telefónica Latin America increased 13.3% to €26,041 million in 2010 from €22,983 million in 2009 (an increase of 9.9% excluding foreign-exchange rate effects and the consideration of Venezuela being considered a hyperinflationary economy). Countries contributing most to this revenue growth, excluding foreign-exchange rate effects and the consideration of Venezuela, were Brazil (45 percentage points) Venezuela (23 percentage points) and Argentina (21 percentage points).
In 2010, Brazil continued to make the largest contribution to Telefónica Latin America’s revenues (43%) followed by Argentina (12%) and Venezuela (9%).
|
|
·
|
Telefónica Latin America revenues from Brazil increased 32.8% to
€
11,119 million in 2010 from
€
8,376 million in 2009 (an increase of 12.1% in local currency), due primarily to
the acquisition of 50% of Vivo
Participaçoes
and the overall positive revenue performance of the mobile businesses, broadband and
data
|
businesses. With respect to Vivo, Telefónica Latin America’s mobile business in Brazil, revenues increased 63.4% to €
4,959 million in 2010 from
€
3,036
million in 2009 (an increase of 37.9% in local currency), driven by growth in the customer base (usage and data) and the consolidation of 100% of Vivo Participaçoes in the fourth quarter of 2010. With respect to Telesp, Telefónica Latin America’
s fixed line business in Brazil, revenues increased 18.7% to
€
6,843 million in 2010 from
€
5,766 million in 2009 (an increase of 0.2% in local currency). This increase was due to the growth of broadband and data business revenues compared to the traditional business revenues. Broadband, pay TV and
data
/IT services revenues continued to rise
as a percentage of
total revenues to 24.8%. Traditional
fixed line
revenues decreased (1.4% in local currency), mainly driven by lower local and long distance traffic that was not compensated by higher traffic revenues coming
from mobile networks.
|
|
·
|
Telefónica Latin America’s revenues from Venezuela, due to the devaluation, decreased 38.6% to €2,318 million in 2010 from €3,773 million in 2009 (an increase of 15% in local currency and excluding the effects of Venezuela being considered a hyperinflationary economy), primarily driven by higher growth in service revenues in 2010 (an increase of 21.3% in local currency and excluding the consideration of Venezuela as a hyperinflationary economy). This growth in local currency was due mainly to the good performance of data revenues, driven by increases in mobile broadband.
|
|
|
·
|
Telefónica Latin America revenues from Argentina increased 17.8% to €3,073 million in 2010 from €2,609 million in 2009 (an increase of 17.9% in local currency) with both fixed and mobile business contributing. Of this, Telefónica Móviles Argentina’s revenues increased 20.4% to €1,979 million in 2010 from €1,643 million in 2009 (an increase of 20.6% in local currency). This increase was primarily driven by an increase of 21.3% in service revenues in 2010 (an increase of 21.4% in local currency). This growth in local currency was mainly due to data revenue growth and increased usage. Revenues in the fixed line business increased 13.3% to €1,187 million in 2010 from €1,047 million in 2009 (an increase of 13.5% in local currency), with 6.3% growth in the traditional fixed line business, 29.2% growth in the Internet TV and content business, and 16.9% growth in the data and IT businesses.
|
|
|
·
|
Telefónica Latin America revenues from Chile increased 20.0% to €2,197 million in 2010 from €1,831 million in 2009 (an increase of 4.3% in local currency) due to the revenue growth in both businesses. With respect to Telefónica Móviles Chile, Telefónica Latin America’s mobile business in Chile, revenues increased 25.4% to €1,266 million in 2010 from €1,010 million in 2009 (an increase of 9.0% in local currency). Service revenues increased 27.9% to €1,175 million in 2010 (an increase of 11.2% in local currency) due to growth in voice and data services revenues. With respect to Telefónica Latin America’s fixed line business in Chile, revenues in 2010 increased 16.3% to €1,038 million from €893 million in 2009 (an increase of 1.1% in local currency). Broadband, pay TV, data and IT businesses growth offset the decrease in revenues from the traditional fixed telephony business.
|
|
|
·
|
Telefónica Latin America’s revenues from Mexico increased 18.0% to €1,832 million in 2010 from €1,552 million in 2009 (an increase of 5.0% in local currency). This growth in local currency was underpinned by service revenues growth of 4.1% in 2010 as a result of a good performance in contract segment revenues, offsetting declines in prepaid segment revenues.
|
|
|
·
|
Telefónica Latin America’s revenues from Peru increased 14.2% to €1,960 million in 2010 from €1,716 million in 2009 (an increase of 2.0% in local currency). With respect to Telefónica Móviles Perú, revenues increased 19.2% to €1,001 million in 2010 from €840 million in 2009 (an increase of 6.4% in local currency), driven primarily by service revenue growth. Service revenues increased 22.8% in 2010 (an increase of 9.7% in local currency) due to the growth of contract revenues associated to a higher postpaid base and the good evolution of data revenues. With respect to Telefónica del Perú, revenues increased 9.0% to €1,097 million in 2010 compared to €1,006 million in 2009 (a decrease of 2.6% in local currency), despite the 6.9% growth in revenues from the Internet, TV and content businesses and the 3.4% increase in data/IT business revenues. These increases were not sufficient to offset the 9.1% decrease in traditional business revenues, stemming from the virtual mobile business, the application of the productivity factor, a reduction in the fixed to mobile tariff and a cut in the fixed network termination charge in 2009.
|
|
|
·
|
Telefónica Latin America’s revenues from Colombia increased 20.5% to €1,529 million in 2010 from 1,269 million euros in 2009 (an increase of 1.3% in local currency). This evolution is the consequence of a highly competitive environment both in mobile and fixed telephony. With respect to Telefónica Móviles Colombia, Telefónica Latin America’s mobile business in Colombia, revenues increased 27.4% to
€
872 million in 2010 from
€685 million in
2009 (an increase of 7.1% in local currency). Service revenues increased 5.7% in 2010 in local currency. With respect to Colombia Telecomunicaciones S.A. ESP, Telefónica Latin America’s fixed line telephony business in Colombia, revenues increased 14.0% to
€
700 million in 2010
from €615 million
in 2009 (a decrease of 4.2 % in local currency) primarily due to the lower revenues from traditional fixed telephony services stemming from lower accesses and a decrease in traffic, which was partially offset by broadband and pay TV revenues.
|
Expenses
Telefónica Latin America’s total expenses increased 18.4% in 2010 to €17,148 million from €14,486 million in 2009 (an increase of 13.1% excluding foreign exchange-rate effects and the effects of Venezuela being considered a hyperinflationary economy).
This increase was primarily attributable to the consolidation of the additional 50% of Vivo and the result of recognizing restructuring costs of €410 million, which include the restructuring of the workforces of several companies (€159 million) and firm commitments related to the Telefónica Foundation’s social program (€120 million)
.
|
|
·
|
Supplies for Telefónica Latin America increased 9.9% to €6,801 million in 2010 from €6,188 million in 2009 (an increase of 6.8% excluding foreign exchange-rate effects and the consideration of Venezuela as a hyperinflationary economy), mainly due to higher interconnection costs and demand for handsets stemming from increased traffic and commercial activity.
|
|
|
·
|
Personnel expenses for Telefónica Latin America increased 34.7% to €2,411 million in 2010 from €1,789 million in 2009 (an increase of 28.8% excluding foreign exchange-rate effects and the effects of Venezuela being considered a hyperinflationary economy), principally due to higher inflation in certain countries and impacts related to restructuring of workforces, mainly in Argentina (€40 million), Brazil (€60 million), Peru (€23 million), Colombia (€10 million) and Chile (€12 million).
|
|
|
·
|
Other expenses for Telefónica Latin America increased 21.9% to €7,936 million in 2010 from €6,508 million in 2009 (an increase of 14.7% excluding foreign-exchange rate effects and the effects of Venezuela being considered a hyperinflationary economy), mainly due to the increase in external services costs stemming from increased commercial activity and the greater focus on the contract segment, resulting in a higher amount of commissions and contact center expenses and the increase in network and systems costs. Also contributing to these expenses are firm commitments related to the Telefónica Foundation’s social program.
|
Operating income before depreciation and amortization (OIBDA)
As a result of the foregoing, Telefónica Latin America’s OIBDA increased 50.7% to €13,782 million in 2010 from €9,143 million in 2009 (an increase of 49.7% excluding foreign exchange-rate effects and the consideration of Venezuela as a hyperinflationary economy). OIBDA is affected by the full consolidation of Vivo Participaçoes and the positive impact of remeasuring the previously held 50% investment in Vivo Participaçoes at its fair market value at the date of acquisition of 50% of the share capital of Brasilcel owned by Portugal Telecom (€3,797 million). By country (excluding foreign exchange-rate effects and the effects of Venezuela being considered a hyperinflationary economy), Brazil contributed most to OIBDA growth (36 percentage points), followed by Chile (27 percentage points) and Venezuela (26 percentage points). In absolute terms, Brazil was the largest contributor to Telefónica Latin America’s OIBDA in 2010, accounting for 29.4% of the total, followed by Venezuela at 7.9%, Argentina at 7.9% and Chile at 7.9%.
Telefónica Latin America’s OIBDA in 2010 as a percentage of Telefónica Latin America’s revenues for the same period was 52.9%, 13.1 percentage points higher than in 2009.
|
|
·
|
Telefónica Latin America’s OIBDA in Brazil increased 29.8% to €4,074 million in 2010 from €3,139 million in 2009 (an increase of 9.6% in local currency), including the consolidation of the additional 50% of Vivo. This growth was due to increased data and outgoing prepaid revenues in the mobile business and higher new business revenues in the fixed business. This growth was also buoyed by cost savings on commercial expenses related to our mobile operations and lower bad debt allowance in connection with our fixed business.
|
|
|
·
|
Telefónica Latin America’s OIBDA in Venezuela decreased 40.2% to €1,087 million in 2010 from €1,818 million in 2009, mainly due to the devaluation of the Venezuelan Bolivar. In local currency and excluding the effects of Venezuela being considered a hyperinflationary economy, OIBDA increased 10.4%, despite measures implemented to manage high inflation rates.
|
|
|
·
|
Telefónica Latin America’s OIBDA in Argentina increased 9.7% to €1,082 million in 2010 from €986 million in 2009 (an increase of 9.8% in local currency), due to strong performances in both mobile revenues (an increase of 20.6% in local currency) and fixed businesses revenues (an increase of 13.5% in local currency). In the fixed business, growth was due primarily to the bundling and the expansion of broadband services, while additional clients fueled the mobile business.
|
|
|
·
|
Telefónica Latin America’s OIBDA in Chile increased 43.2% to €1,092 million in 2010 from €763 million in 2009 (an increase of 24.5% in local currency). Despite the effect of the large earthquake in Chile in the first quarter of the year, revenues grew in the fixed and mobile businesses, driven principally by broadband and mobile services.
|
|
|
·
|
Telefónica Latin America’s OIBDA in Mexico increased 10.5% to €623 million in 2010 from €564 million in 2009 (a drop of 1.7% in local currency), due to enhanced commercial focus on contract net adds and increasing prepaid revenues.
|
|
|
·
|
Telefónica Latin America’s OIBDA in Peru increased 14.0% to €812 million in 2010 from €712 million in 2009 (an increase of 1.8% in local currency) due to overall growth in revenues stemming principally from an enhanced focus on postpaid fees in the mobile business, broadband growth in both the fixed and mobile businesses and increased pay TV and public telephony activities.
|
|
|
·
|
Telefónica Latin America’s OIBDA in Colombia rose 22.1% to €484 million in 2010 from €397 million in 2009 (an improvement of 2.6% in local currency), primarily due to the growth in mobile business revenues (an increase of 7.1% in local currency) which offsetting the slight decrease in fixed business revenues (a decrease of 4.2% in local currency).
|
Depreciation and amortization
Telefónica Latin America’s depreciation and amortization increased 7.1% to €4,061 million in 2010 from €
3,793
million in 2009 (a decrease of 4.0% excluding foreign exchange-rate effects and the effects of Venezuela being considered a hyperinflationary economy). Amortization included €84 million of amortization recognized related to assets assumed in the purchase price allocation of Vivo Participaçoes.
Operating income
As a result of the foregoing, Telefónica Latin America’s operating income increased 81.7% to €9,721 million in 2010 from €5,350 million in 2009 (an increase of 87.0% excluding foreign exchange-rate effects and the effects of Venezuela being considered a hyperinflationary economy).
Atento
Revenues
Atento’s revenues increased by 25.9 % to €1,663 million in 2010 from €1,321 million in 2009. The increase in revenues was primarily driven by an increase in the activity of our customer base. In 2010, revenues were also boosted by a favorable foreign exchange-rate effect.
Expenses
Atento’s expenses increased 26.2 % to €1,475 million in 2010 from €1,169 million in 2009, primarily due to higher personnel expenses and leasing of capacity both on increased activity volumes, and foreign exchange-rate effect.
Operating income before depreciation and amortization
Atento’s OIBDA increased 23.3% to €190 million in 2010 from €154 million in 2009, due to higher business volume.
Operating income
Atento’s operating income increased 19.2 % to €145 million in 2010 from €122 million in 2009.
Year ended December 31, 2009 compared to year ended December 31, 2008
Revenues
Revenues decreased 2.1% to €56,731 million in 2009 compared to €57,946 million in 2008. Excluding foreign exchange rate effects and excluding the effects of Venezuela being considered a hyperinflationary economy in 2009, revenues would have increased 0.3% in 2009 compared to 2008.
By geographic area, Telefónica Latin America contributed the greatest percentage to our revenues in 2009, accounting for 40.5% of the total, which represents an increase of 2.2 percentage points from 2008. Telefónica Spain contributed 34.7% of our 2009 revenues (36.0% in 2008) and Telefónica Europe contributed 23.9% (24.7% in 2008).
Other income
Other income decreased 11.8% to €1,645 million in 2009 compared to €1,865 million in 2008. Excluding foreign exchange rate effects and excluding the effects of Venezuela being considered a hyperinflationary economy in 2009, other income would have decreased 9.7% in 2009 compared to 2008. Other income in 2009 included a €220 million gain on the sale of our stake in Medi Telecom. In 2008, other income included a €143 million gain on the sale of our stake in Sogecable.
Total expenses
Total expenses include supplies, personnel expenses and other expenses (mainly external services and taxes). Total expenses do not include depreciation and amortization.
Our total expenses decreased 3.0% to €35,773 million in 2009 compared to €36,892 million in 2008. Excluding foreign exchange rate effects and excluding the effects of Venezuela being considered a hyperinflationary economy in 2009, total expenses would have decreased 0.4% in 2009 compared to 2008.
Supplies
. Supplies decreased 6.2% to €16,717 million in 2009 compared to €17,818 million in 2008. Excluding foreign exchange rate effects and excluding the effects of Venezuela being considered a hyperinflationary economy in 2009, supplies would have decreased 3.1% from 2008 to 2009. This decrease is primarily due to lower interconnection costs associated with lower fixed-mobile traffic and the reduction of MTRs.
Personnel expenses.
Personnel expenses increased 0.2% to €6,775 million in 2009 compared to €6,762 million in 2008. Excluding foreign exchange rate effects and excluding the effects of Venezuela being considered a hyperinflationary economy in 2009, personnel expenses would have increased 2.7% from 2008 to 2009. This increase was primarily due to increases in our work force and wages over the period. The average workforce during 2009 reached 255,151 employees, with a net increase of 3,376 employees compared to 2008, mainly due to the workforce increases within Atento. Excluding employees of Atento, our average number of employees in 2009 would have increased by 381 employees to 125,266 employees compared to 2008.
Other expenses.
Other expenses are mainly comprised of external services, which consist of commercial expenses related to our business (such as commissions to distributors of services, marketing and advertising expenses and customer service related expenses), network maintenance expenses, general administrative expenses and subcontracted services expenses, as well as certain types of taxes. Other expenses also include changes in operating allowances and other operating expenses. Other expenses decreased 0.2% to €12,281 million in 2009 from €12,312 million in 2008. Excluding foreign exchange rate effects and excluding the effects of Venezuela being considered a hyperinflationary economy in 2009, other expenses would have increased 2.0% in 2009 compared to 2008. This increase was principally driven by higher customer, network and IT management expenses in Telefónica Latin America.
Operating income before depreciation and amortization (OIBDA)
As a result of the foregoing, our OIBDA decreased 1.4% to €22,603 million in 2009 compared to €22,919 million in 2008. Excluding foreign exchange rate effects and excluding the effects of Venezuela being considered a hyperinflationary economy in 2009, OIBDA would have increased 0.5% from 2008 to 2009.
Of our 2009 OIBDA, Telefónica Spain contributed 43.2% (44.9% in 2008), while Telefónica Latin America and Telefónica Europe contributed 40.5% (36.8% in 2008) and 17.3% (18.2% in 2008), respectively.
Our OIBDA margin increased to 39.8% in 2009 compared to 39.6% in 2008. For a reconciliation of OIBDA to operating income, see “—Presentation of Financial Information—Non-GAAP financial information—Operating income before depreciation and amortization”.
Depreciation and amortization
Our depreciation and amortization decreased 1.0% to €8,956 million in 2009 compared to €9,046 million in 2008. Excluding foreign exchange rate effects and excluding the effects of Venezuela being considered a hyperinflationary economy in 2009, depreciation and amortization would have increased 1.3% from 2008 to 2009, principally driven by Telefónica Latin America and Telefónica Europe depreciation and amortization increases. Telefónica Europe depreciation and amortization in 2009 includes the amortization of the purchase price allocation made following the acquisitions of the O2 Group (€635 million in 2009 compared to €689 million in 2008) and Telefónica O2 Czech Republic (€89 million in 2009 compared to €131 million in 2008).
Operating income
As a result of the foregoing, our operating income decreased 1.6% to €13,647 million in 2009 from €13,873 million in 2008. Excluding foreign exchange rate effects and excluding the effects of Venezuela being considered a hyperinflationary economy in 2009, operating income would have remained constant in 2009 compared to 2008.
Share of profit (loss) of associates
Our share of profit (loss) of associates amounted to a gain of €47 million in 2009 compared to a loss of €161 million in 2008, primarily as a result of share of profits we recorded in respect to our interest in Portugal Telecom and lower share of loss we recorded in respect to our interest in Telco. In 2008, the loss in our share of profit (loss) of associates was primarily the result of the net adjustment Telco made to the valuation of its investment in Telecom Italia. To estimate the adjustment to be recorded by the Telefónica Group, we took the value of the estimated synergies that we expected to achieve by improving certain processes in our operations in Europe as a result of certain alliances reached with Telecom Italia. As a result of this revaluation, we recorded a loss of €209 million in 2008, which more than offset the share of profits we recorded in respect of our interest in Portugal Telecom in that year.
Net financial income (expense)
Net financial expense increased 18.2% to €3,307 million in 2009 compared to €2,797 million in 2008. The average cost of net debt of the Group, which we measure as net financial expense divided by our average net debt, was 7.3% in 2009 compared to 5.95% in 2008. The effects derived from the consideration of Venezuela as a hyperinflationary economy as described in “Item 5. Operating and Financial Review and Prospects—A. Operating
Results—Significant Factors Affecting the Comparability of our Results of Operations in the Periods Under Review—Classification of Venezuela as a hyperinflationary economy” resulted in an increase in net financial expense of €630 million in 2009. Excluding such effects in 2009 and the negative exchange differences, our average cost of net debt in 2009 would have been 5.54% and net financial expense would have decreased 4.3% in 2009 compared to 2008 primarily as a result of:
|
|
·
|
A decrease of €298 million in 2009 compared to 2008 due to a decrease in the average interest rates applicable to our outstanding debt (mainly in European currencies) over the period.
|
|
|
·
|
A decrease of €104 million in 2009 compared to 2008 due to a 3.7% decrease in our average debt outstanding over the period.
|
|
|
·
|
A decrease of €85 million in 2009 compared to 2008 as a result of a decrease in the actual value of commitments (principally related to pre-retirement plans).
|
|
|
·
|
Changes in the foreign exchange gains and losses for 2009 with respect to the same period in 2008 yielded a higher cost of about €197 million.
|
Corporate income tax
Corporate income tax decreased to €2,450 million in 2009 compared to €3,089 million in 2008, implying an effective tax rate of 23.6% compared to 28.3% in 2008. This decrease was primarily the result of the reversal of a €591 million tax liability recorded in 2007 with respect to an investigation by the European Commission involving the Kingdom of Spain with respect to the tax treatment of goodwill. In December 2009, the European Commission released its decision regarding the investigation, deeming certain deductions for the amortization of goodwill as state aid. However, this decision (and considering the corporate structure of these investments) did not apply to investments made before December 21, 2007, such as our investments in O2, BellSouth’s Latin American operators, Colombia Telecomunicaciones, ESP and Telefónica O2 Czech Republic.
Non-controlling interests
Our non-controlling interests amounted to a negative figure of €161 million in 2009 compared to a negative figure of €234 million in 2008, primarily as a result of lower profits at Telesp and Telefónica Chile and higher loss at Colombia Telecom, which we account for as non-controlling interests.
Profit for the year attributable to equity holders of the parent company
As a result of the above, our profit for the year attributable to equity holders of the parent company increased 2.4% to €7,776 million in 2009 compared to €7,592 million in 2008.
Results of Operations by Business Area for 2008 and 2009
The table below sets forth the contribution to our results of operations by each of our three principal business areas and other companies for 2008 and 2009. Revenues and related expenses for each of the business areas are presented after elimination of sales to other members of the Telefónica Group belonging to the same business area. See Note 4 to our Consolidated Financial Statements.
|
Year ended December 31,
|
||||||||||||
|
2008
|
2009
|
% Change
|
||||||||||
|
(in millions of euros)
|
||||||||||||
|
Revenues
|
57,946 | 56,731 | (2.1 | )% | ||||||||
|
Telefónica Spain
|
20,838 | 19,703 | (5.4 | )% | ||||||||
|
Telefónica Europe
|
14,309 | 13,533 | (5.4 | )% | ||||||||
|
Telefónica Latin America
|
22,174 | 22,983 | 3.6 | % | ||||||||
|
Other companies & eliminations
|
625 | 512 | (18.1 | )% | ||||||||
|
Year ended December 31,
|
||||||||||||
|
2008
|
2009
|
% Change
|
||||||||||
|
(in millions of euros)
|
||||||||||||
|
Other income
|
1,865 | 1,645 | (11.8 | )% | ||||||||
|
Telefónica Spain
|
348 | 497 | 42.8 | % | ||||||||
|
Telefónica Europe
|
395 | 234 | (40.8 | )% | ||||||||
|
Telefónica Latin America
|
609 | 646 | 6.1 | % | ||||||||
|
Other companies & eliminations
|
513 | 268 | (47.8 | )% | ||||||||
|
Expenses(1)
|
(36,892 | ) | (35,773 | ) | (3.0 | )% | ||||||
|
Telefónica Spain
|
(10,901 | ) | (10,443 | ) | (4.2 | )% | ||||||
|
Telefónica Europe
|
(10,524 | ) | (9,857 | ) | (6.3 | )% | ||||||
|
Telefónica Latin America
|
(14,338 | ) | (14,486 | ) | 1.0 | % | ||||||
|
Other companies & eliminations
|
(1,129 | ) | (987 | ) | (12.6 | )% | ||||||
|
Depreciation and amortization
|
(9,046 | ) | (8,956 | ) | (1.0 | )% | ||||||
|
Telefónica Spain
|
(2,239 | ) | (2,140 | ) | (4.4 | )% | ||||||
|
Telefónica Europe
|
(3,035 | ) | (2,895 | ) | (4.6 | )% | ||||||
|
Telefónica Latin America
|
(3,645 | ) | (3,793 | ) | 4.1 | % | ||||||
|
Other companies & eliminations
|
(127 | ) | (128 | ) | 0.8 | % | ||||||
|
Operating income
|
13,873 | 13,647 | (1.6 | )% | ||||||||
|
Telefónica Spain
|
8,046 | 7,617 | (5.3 | )% | ||||||||
|
Telefónica Europe
|
1,145 | 1,015 | (11.4 | )% | ||||||||
|
Telefónica Latin America
|
4,800 | 5,350 | 11.5 | % | ||||||||
|
Other companies & eliminations
|
(118 | ) | (335 | ) | — | |||||||
|
(1)
|
Expenses as used in this table and in the below discussion include supplies expenses, personnel expenses and other expenses. It does not include depreciation and amortization.
|
In the discussion that follows revenues and related expenses for each business included within a particular business area are presented gross of any eliminations due to sales to other businesses in such business area or other members of the Telefónica Group.
Results of Operations by Business Area for 2008 and 2009
Telefónica Spain
Revenues
Telefónica Spain’s revenues decreased 5.4% to €19,703 million in 2009 from €20,838 million in 2008.
Revenues from Telefónica Spain’s fixed business decreased 3.3% to €12,167 million in 2009 from €12,581 million in 2008 principally due to the decrease in the revenues of traditional voice service and accesses.
|
|
·
|
Revenues from traditional accesses include all revenues from our customers for rental and connection to public switched telephone network (PSTN) lines (for basic telephony service), ISDN lines (for integration of voice, data and video services), corporate services, PUT, additional recharges and advertising in telephone booths. Revenues from traditional accesses decreased 5.2% to €2,792 million in 2009 compared to €2,944 million in 2008, as a result of the reduction in the number of accesses which was partially offset by revenues derived from recognizing receipt of universal service for the period 2006 to 2008 (€223 million).
|
|
|
·
|
Revenues from traditional voice services decreased 10.2% to €3,983 million in 2009 compared to €4,436 million in 2008. This evolution is mainly affected by lower fixed-to-mobile traffic, the decrease of international traffic and the increasing importance of traffic included in national flat tariff plans.
|
|
|
·
|
Revenues from Internet and broadband services decreased 1.9% to €2,960 million in 2009 compared to €3,017 million in 2008. Retail broadband service revenues decreased 1.7% in 2009 compared to 2008, due to a reduction in the average revenue per customer that was not offset by accesses growth. Wholesale broadband service revenues increased 3.3% in 2009 compared to 2008 reflecting growth in the customer base for unbundled local loop in 2009.
|
|
|
·
|
Revenues from data services grew 8.7% to €1,294 million in 2009 from €1,190 million in 2008, driven by increased revenues from leased circuits to mobile operators, mainly Telefónica Móviles España, as a result of the rapid growth in mobile broadband.
|
|
|
·
|
Revenues from information technology services grew 14.7% to €508 million in 2009 from €443 million in 2008.
|
Revenues from Telefónica Spain’s mobile business decreased 7.4% to €8,965 million in 2009 from €9,684 million in 2008, due to lower minutes used by customers and lower prices. Customer revenues decreased 5.4% to €6,571 million in 2009 from €6,943 million in 2008 due to lower usage patterns. Interconnection revenues decreased 19.5% to €1,001 million in 2009 from €1,243 million in 2008, due primarily to regulated interconnection price cuts. Roaming-in revenues fell 22.8% to €153 million in 2009 from €198 million in 2008 due to the downward trend in roaming consumption and wholesale prices. Revenues from handset sales decreased 7.3% to €1,137 million from €1,227 million in 2008.
Expenses
Telefónica Spain’s total expenses decreased 4.2% to €10,443 million in 2009 from €10,901 million in 2008 principally due to lower supplies expenses, as described below.
|
|
·
|
Supplies decreased 6.7% to €4,293 million in 2009 from €4,604 million in 2008, mainly due to lower interconnection expenses.
|
|
|
·
|
Personnel expenses decreased 3.0% to €2,305 million in 2009 from €2,375 million in 2008, principally due to the revision of the estimates of redundancy program provision accounts made in previous years, which resulted in lower expenses of €90 million.
|
|
|
·
|
Other expenses decreased 2.0% to €3,845 million in 2009 from €3,922 million in 2008, principally due to a 3.4% decrease in external expenses to €3,102 million in 2009 from €3,212 million in 2008, as a result of containment in commercial expenses. This decrease was partially offset by an increase in other expenses in 2009 due to expenses related to the provision of universal service (€155 million).
|
In the fixed business, total expenses decreased 3.4% to €6,567 million in 2009 from €6,799 million in 2008 principally due to lower expenses across categories, as described below.
|
|
·
|
Supplies decreased 6.0% to €2,786 million in 2009 from €2,962 million in 2008 mainly due to lower interconnection expenses as a result of lower fixed-to-mobile traffic usage and a reduction in MTRs.
|
|
|
·
|
Personnel expenses decreased 0.9% to €2,052 million in 2009 from €2,071 million in 2008, mainly due to the revision of redundancy program provision accounts made in previous years, which resulted in lower personnel expenses of €58 million. The average number of employees for the fixed business in 2009 was 31,111, a 0.4% reduction in comparison with the average number of employees in 2008.
|
|
|
·
|
Other expenses decreased 2.1% to €1,729 million in 2009 from €1,766 million in 2008, principally due to a 2.7% decrease in external expenses to €1,300 million in 2009 from €1,336 million in 2008. This decrease was partially offset by an increase in expenses related to the provision of universal service.
|
Telefónica Spain’s total expenses related to its mobile business decreased 4.0% to €5,281 million in 2009 from €5,502 million in 2008 principally due to lower supplies expenses, as described below.
|
|
·
|
Supplies decreased 8.9% to €2,430 million in 2009 from €2,667 million in 2008 due to decreases in interconnection and roaming expenses as result of lower traffic and to a reduction in MTRs.
|
|
|
·
|
Personnel expenses decreased 16.3% to €250 million in 2009 from €299 million in 2008, mainly due to the revision of redundancy program provision accounts made in previous years, which resulted in lower expenses of €32 million. The average number of employees for the mobile business in 2009 was 4,199, a 6.0% reduction in comparison with the average number of employees in 2008.
|
|
|
·
|
Other expenses increased 2.5% to €2,601 million in 2009 from €2,537 million in 2008 mainly due to higher customer management expenses and expenses related to the provision of universal service in 2009.
|
Operating income before depreciation and amortization (OIBDA)
As a result of the foregoing, Telefónica Spain’s OIBDA decreased 5.1% to €9,757 million in 2009 from €10,285 million in 2008. Telefónica Spain’s OIBDA, as a percentage of Telefónica Spain’s revenues, was 49.5% in 2009 compared to 49.4% in 2008.
Depreciation and amortization
Telefónica Spain’s depreciation and amortization decreased 4.5% to €2,140 million in 2009 from €2,239 million in 2008, principally due to variations in the useful lives of assets subject to depreciation in 2009 compared to 2008 in line with the periodic revision of the Group’s policies, based on historical experience.
Operating income
As a result of the foregoing, Telefónica Spain’s operating income decreased 5.3% to €7,617 million in 2009 from €8,046 million in 2008.
Telefónica Europe
Revenues
Telefónica Europe’s revenues decreased 5.4% to €13,533 million in 2009 from €14,309 million in 2008. Telefónica Europe’s 2009 revenue were negatively affected by lower MTRs, the adverse economic environment and the decline of the average pound sterling to euro exchange rate.
|
|
·
|
Revenues derived from Telefónica O2 UK decreased to €6,512 million in 2009 from €7,052 million in 2008 (an increase of 3.5% in local currency). The local currency increase in revenue was primarily driven by an increase in Telefónica O2 UK’s customer base and partially offset by a decrease in ARPU.
|
|
|
·
|
Revenues derived from Telefónica O2 Germany increased 4.2% to €3,746 million in 2009 from €3,595 million in 2008. The positive evolution was mainly the result of an increase in the customer base due to new offerings (O2o, My O2 Handy and broadband), but was adversely impacted by lower MTRs.
|
|
|
·
|
Revenues derived from Telefónica O2 Czech Republic, including Slovakia operations, decreased by 12.4% to €2,260 million in 2009 from €2,581 million in 2008 (a decrease of 7.3% in local currency). Slovakia continued to grow mobile revenues while Czech revenues from fixed and mobile services decreased (9.3% and 6.3% in local currency, respectively) due to MTR cuts, customers reducing spending and fixed-to-mobile substitution.
|
|
|
·
|
Revenues derived from Telefónica O2 Ireland decreased 5.5% to €905 million in 2009 compared to €957 million in 2008. The decrease was mainly the result of lower customer spending and lower usage in terms of traffic.
|
Expenses
Telefónica Europe’s total expenses decreased 6.3% to €9,857 million in 2009 from €10,523 million in 2008.
|
|
·
|
Supplies decreased 6.4% to €6,189 million in 2009 from €6,611 million in 2008, mainly due to the decline of the pound sterling to euro exchange rate over the period and lower MTRs.
|
|
|
·
|
Personnel expenses decreased 2.6% to €1,304 million in 2009 from €1,340 million in 2008 despite increased expenses associated with restructuring programs in Telefónica O2 UK and Telefónica O2 Germany. The decline of the pound sterling to euro exchange rate over the period also contributed to the decrease.
|
|
|
·
|
Other expenses decreased 8.1% to €2,364 million in 2009 from €2,573 million in 2008, mainly due to the decrease in external services as a result of cost efficiencies. The decline of the pound sterling to euro exchange rate over the period also contributed to the decrease.
|
Operating income before depreciation and amortization (OIBDA)
As a result of the foregoing, Telefónica Europe’s OIBDA decreased 6.4% to €3,910 million in 2009 from €4,180 million in 2008. OIBDA in 2008 included €174 million as the result of the release in 2008 of provisions made in respect of potential contingencies which were not realized once these risks had dissipated.
|
|
·
|
OIBDA in Telefónica O2 UK decreased 8.7% to €1,680 million in 2009 from €1,839 million in 2008 (an increase of 2.3% in local currency).
|
|
|
·
|
OIBDA in Telefónica O2 Germany increased 19.3% to €918 million in 2009 from €770 million in 2008.
|
|
|
·
|
OIBDA in Telefónica O2 Czech Republic, including Slovakia operations, decreased 9.2% to €1,053 million in 2009 from €1,159 million in 2008 (a decrease of 3.8% in local currency).
|
|
|
·
|
OIBDA in Telefónica O2 Ireland increased 0.3% to € 302 million in 2009 from €301 million in 2008.
|
Depreciation and amortization
Telefónica Europe’s depreciation and amortization decreased 4.6% to €2,895 million in 2009 from €3,035 million in 2008 mainly due to the decline of the average pound sterling to euro exchange rate.
Operating income
As a result of the foregoing, Telefónica Europe’s operating income decreased 11.3% to €1,015 million in 2009 from €1,145 million in 2008. The decrease was the result of the 6.4% decrease in OIBDA which was not offset by the lower decrease (4.6%) in depreciation and amortization.
Telefónica Latin America
Revenues
Revenues at Telefónica Latin America increased 3.7% to €22,983 million in 2009 from €22,174 million in 2008 (an increase of 5.6% excluding foreign exchange rate effects and excluding the effects of Venezuela being considered a hyperinflationary economy in 2009). On a constant euro basis and excluding the effects of Venezuela being considered a hyperinflationary economy in 2009, the countries contributing most to this revenue growth were
Venezuela (2.5 percentage points), Argentina (1.7 percentage points) and
Mexico
(0.7 percentage points).
In 2009, Brazil continued to make the largest contribution to Telefónica Latin America’s revenues (36.4%) followed by Venezuela (16.4%) and Argentina (11.4%).
|
|
·
|
Telefónica Latin America’s revenues from Brazil decreased to €8,376 million in 2009 from €8,606 million in 2008 (an increase of 0.9% in local currency). The local currency increase was primarily due to mobile businesses and broadband and pay TV business growth. With respect to Vivo, Telefónica Latin America’s mobile business in Brazil, revenues increased to €3,036 million in 2009 from €2,932 million in 2008 (an increase of 7.4% in local currency), driven by growth in the customer base, increasing outgoing revenues focused on on-net tariffs, and data business. With respect to Telesp, Telefónica Latin America’s fixed line business in Brazil, revenues decreased to €5,766 million in 2009 from €6,085 million in 2008 (a decrease of 1.8% in local currency). This decrease was due to lower traditional business revenues that were not offset by the growth of new services. Broadband, pay TV and data/IT services revenues increased as a percentage of total revenues (19.2% in 2009 compared to 16.3% in 2008). Traditional fixed line revenues decreased (5.9% in local currency), mainly driven by lower local and long distance traffic that was not compensated by higher interconnection traffic revenues coming primarily from mobile networks. Telesp’s performance was also negatively affected by the decision of ANATEL, the Brazilian regulator, to suspend
|
the commercialization of Speedy, Telesp’s broadband service, from June 22, 2009 to August 27, 2009 as a result of quality problems.
|
|
·
|
Telefónica Latin America’s revenues from Venezuela increased to €3,773 million in 2009 from €2,769 million in 2008 (an increase of 20.4% in local currency and excluding the effects of Venezuela being considered a hyperinflationary economy in 2009), primarily driven by higher growth in service revenues in 2009 (an increase of 24.2% in local currency and excluding the effects of Venezuela being considered a hyperinflationary economy in 2009). This growth in local currency was due mainly to an integrated telecommunication offer (mobile, fixed, pay TV and broadband) and tariff increases.
|
|
|
·
|
Telefónica Latin America’s revenues from Argentina increased to €2,609 million in 2009 from €2,527 million in 2008 (an increase of 15.3% in local currency) with both fixed and mobile businesses contributing. Of this, Telefónica Móviles Argentina’s revenues increased to €1,643 million in 2009 from €1,585 million in 2008 (an increase of 15.8% in local currency). This increase was primarily driven by an increase of 5.7% in service revenues in 2009 (an increase of 18.1% in local currency). This growth in local currency was mainly due to data revenue growth and tariff increases. Revenues in the fixed line business increased to €1,047 million in 2009 from €1,027 million in 2008 (an increase of 13.9% in local currency), with the traditional fixed line business contributing 3.9 percentage points to this growth, the Internet business contributing 6.7 percentage points and data and IT businesses contributing 2.8 percentage points.
|
|
|
·
|
Telefónica Latin America’s revenues from Chile decreased to €1,831 million in 2009 from €1,936 million in 2008 (a decrease of 3.3% in local currency) as a result of the reduction of tariffs as a consequence of a regulatory decree affecting interconnection rates, which went into effect at January 23, 2009 for mobile termination (an average tariff decrease of 44.6%), while on May 7 the decree governing fixed telephony accesses/operator charges was also enacted. This entailed an additional reduction in fixed telephony termination rates. With respect to Telefónica Móviles Chile, Telefónica Latin America’s mobile business in Chile, revenues decreased to €1,010 million in 2009 from €1,051 million in 2008 (a decrease of 1.8% in local currency) largely due to a tariff decree established from January 23, 2009. Service revenues decreased 5.3% in 2009 (a decrease of 3.2% in local currency), because of this tariff decree. With respect to Telefónica Chile, Telefónica Latin America’s fixed line business in Chile, revenues in 2009 decreased to €893 million in 2009 from €974 million in 2008 (a decrease of 6.3% in local currency). Broadband, pay TV, data and IT businesses growth did not offset the decrease in revenues from the traditional fixed telephony business.
|
|
|
·
|
Telefónica Latin America’s revenues from Mexico decreased to €1,552 million in 2009 from €1,631 million in 2008 (an increase of 10.0% in local currency). This growth in local currency was underpinned by service revenues growth of 17.8
% in
2009 as a result of the customer base increase and new tariff plans. This increase in local currency was greater than the 14.7% rate of growth in the customer base over the same period.
|
|
|
·
|
Telefónica Latin America’s revenues from Peru increased to €1,716 million in 2009 from €1,627 million in 2008 (an increase of 3.0% in local currency). Revenue growth was primarily driven by outgoing revenues in the pre-pay mobile segment and broadband services and pay TV and IT services in the fixed line business. With respect to Telefónica Móviles Perú, Telefónica Latin America’s mobile business in Peru, revenues increased to €840 million in 2009 from €773 million in 2008 (an increase of 6.1% in local currency), driven primarily by revenue growth in the pre-pay mobile segment as a result of the increase in accesses and higher consumption. Service revenues increased 5.4% in 2009 (an increase of 3.0% in local currency). With respect to Telefónica del Perú, Telefónica Latin America’s fixed line business in Peru, revenues increased to €1,006 million in 2009 from €977 million in 2008 (an increase of 0.6% in local currency). This increase was primarily due to broadband and pay TV businesses revenues growth (6.2% and 9.2% in local currency, respectively). Also revenues of the public telephony business increased (2.3% in local currency) in 2009 principally due to an increase in usage caused by tariff reductions, especially to fixed lines.
|
|
|
·
|
Telefónica Latin America’s revenues from Colombia decreased
to
€
1,269 million
in 2009 from
€1,490 million in 2008 (a decrease of 11.6% in local currency). This evolution is the consequence of a highly
|
competitive environment both in mobile and fixed telephony. With respect to Telefónica Móviles Colombia, Telefónica Latin America’s mobile business in Colombia, revenues decreased to €
685 million in 2009 from €815 million in 2008 (a decrease of 12.7% in local currency), primarily as the result of the loss of 1.0 million mobile accesses. Service revenues decreased 13.6% in 2009 compared to 2008 (a decrease of 10.3% in local currency). With respect to Colombia Telecom, Telefónica Latin America’s fixed line telephony business in Colombia, revenues decreased to
€
615 million in 2009 from €710 million in 2008 (a decrease of 10.0% in local currency) primarily due to the lower revenues from traditional fixed telephony services as a result of lower accesses and a decrease in traffic, not compensated by increased broadband and pay TV revenues.
|
|
·
|
Telefónica Latin America’s revenues from Central America decreased to €565 million in 2009 from €568 million in 2008 (a decrease of 2.5% on a constant euro basis). This decrease on a constant euro basis was mainly due to a highly competitive environment, that also affected service revenues that decreased 1.4% in constant euro terms.
|
|
|
·
|
Telefónica Latin America’s revenues from Ecuador increased to €337 million in 2009 from €318 million in 2008 (an increase of 0.6% in local currency). Service revenues increased
14.2
% in 2009 (an increase of 9.5% in local currency).
|
Expenses
Telefónica Latin America’s total expenses increased 1.0% in 2009 to €14,486 million from €14,338 million in 2008 (an increase of 3.1% excluding foreign exchange rate effects and excluding the effects of Venezuela being considered a hyperinflationary economy in 2009).
|
|
·
|
Supplies decreased 2.9% to €6,188 million in 2009 from €6,371 million in 2008 (a decrease of 1.4% excluding foreign exchange rate effects and excluding the effects of Venezuela being considered a hyperinflationary economy in 2009), mainly due to a decrease in supplies in Chile, Mexico and Colombia, which offset the increase in Venezuela, as described below.
|
Supplies for Telefónica Latin America in Brazil decreased to €2,440 million in 2009 from €2,479 million in 2008 (an increase of 2.0% in local currency). The local currency increase was principally due to higher interconnection costs.
Supplies for Telefónica Latin America in Venezuela increased to €978 million in 2009 from €770 million in 2008 (an increase of 6.6% in local currency and excluding the effects of Venezuela being considered a hyperinflationary economy in 2009), principally due to higher content providers expenses, equipment costs and expenses associated with value added services such as RIM licenses, TV licenses and mobile SMS premium applications as a result of higher exchange rates.
Supplies for Telefónica Latin America in Argentina decreased to €613 million in 2009 from €650 million in 2008 (an increase of 5.3% in local currency). This increase in local currency was principally due to higher interconnection costs in the fixed line business, as a result of higher traffic and capacity needs, and equipment costs in the mobile business.
Supplies for Telefónica Latin America in Chile decreased to €416 million in 2009 from €503 million in 2008 (a decrease of 15.5% in local currency), principally due to lower mobile interconnection costs caused by the previously described tariff decree.
Supplies for Telefónica Latin America in Mexico decreased to €584 million in 2009 from €716 million in 2008 (a decrease of 5.8% in local currency). This decrease in local currency was primarily driven by lower equipment costs as a consequence of lower commercial activity.
Supplies for Telefónica Latin America in Peru increased to €414 million in 2009 from €413 million in 2008 (a decrease of 2.0% in local currency). This decrease in local currency was primarily driven by a reduction in equipment costs in the mobile business as a consequence of lower commercial activity.
Supplies for Telefónica Latin America in Colombia decreased to €298 million in 2009 from €394 million in 2008 (a decrease of 21.4% in local currency), principally due to, in the mobile business, a lower equipment cost as a consequence of lower commercial activity, and lower interconnection costs in both fixed and mobile businesses.
Supplies for Telefónica Latin America in Central America reached €178 million in 2009.
Supplies for Telefónica Latin America in Ecuador decreased to €101 million in 2009 from €112 million in 2008 (a decrease of 14.6% in local currency), due to lower equipment costs as a consequence of lower commercial activity and to lower interconnection costs.
|
|
·
|
Personnel expenses for Telefónica Latin America increased 3.1% to €1,789 million in 2009 from €1,735 million in 2008, (an increase of 5.8% excluding foreign exchange rate effects and excluding the effects of Venezuela being considered a hyperinflationary economy in 2009), principally due to increases in Venezuela and Argentina as a result of the effects of higher inflation on wages as described below.
|
Personnel expenses for Telefónica Latin America in Brazil decreased to €439 million in 2009 from €513 million in 2008 (a decrease of 11.3% in local currency), primarily as a result of a decrease in the fixed line business average number of employees following the 2008 restructuring program and the revision of contingencies related to employees.
Personnel expenses for Telefónica Latin America in Venezuela increased to €203 million in 2009 from €131 million in 2008 (an increase of 36.8% in local currency and excluding the effects of Venezuela being considered a hyperinflationary economy in 2009). This increase in local currency was principally due to the effects of higher inflation on wages.
Personnel expenses for Telefónica Latin America in Argentina increased to €321 million in 2009 from €303 million in 2008 (an increase of 18.4% in local currency). This increase in local currency was principally due to the effects of higher inflation on wages.
Personnel expenses for Telefónica Latin America in Chile stood at €182 million in 2009, the same as in 2008 (an increase of 1.8% in local currency). This evolution in local currency was primarily driven by the increase of compensation expenses due to the integration of fixed-mobile structures.
Personnel expenses for Telefónica Latin America in Mexico decreased to €82 million in 2009 from €96 million in 2008 (a decrease of 1.3% in local currency) principally due to a lower average number of employees and wage containment.
Personnel expenses for Telefónica Latin America in Peru increased to €171 million in 2009 from €159 million in 2008 (an increase of 4.9% in local currency), mainly due to the increase in the variable remuneration associated with both the fixed and mobile businesses’ financial performance.
Personnel expenses for Telefónica Latin America in Colombia decreased to €115 million in 2009 from €122 million in 2008 (a decreased of 1.5% in local currency), primarily driven by a lower average number of employees at the fixed line business.
Personnel expenses for Telefónica Latin America in Central America reached €41 million in 2009.
Personnel expenses for Telefónica Latin America in Ecuador increased to €30 million in 2009 from €26 million in 2008 (an increase of 8.7% in local currency), principally due to an increase in the average number of employees.
|
|
·
|
Other expenses for Telefónica Latin America increased 4.4% to €6,508 million in 2009 from €6,232 million in 2008 (an increase of 6.9% excluding foreign exchange rate effects and excluding the effects of Venezuela being considered a hyperinflationary economy in 2009), mainly due to Venezuela and to a lesser extent to Brazil, as described below.
|
Other expenses for Telefónica Latin America in Brazil increased to €2,628 million in 2009 from €2,543 million in 2008 (an increase of 7.1% in local currency). This increase in local currency was primarily driven by higher sales and commissions in the mobile business due to commercial activity and higher FISTEL (a regulatory tax linked to net adds of customers) costs due to customer base growth in Vivo. Other expenses also increased in the fixed line business mainly due to higher contact center and maintenance expenses, primarily as a result of the action plan put in place in the second half of the year to deal with network quality problems.
Other expenses for Telefónica Latin America in Venezuela increased to €787 million in 2009 from €553 million in 2008 (an increase of 23.8% in local currency and excluding the effects of Venezuela being considered a hyperinflationary economy in 2009), driven primarily by increased network expenses and higher operational taxes.
Other expenses for Telefónica Latin America in Argentina increased to €715 million in 2009 from €678 million in 2008 (an increase of 17.9% in local currency), principally as a result of higher inflation affecting the prices of external services.
Other expenses for Telefónica Latin America in Chile decreased to €516 million in 2009 from €556 million in 2008 (a decrease of 5.2% in local currency). This decrease in local currency was principally due to cost containment, particularly network maintenance, and lower commissions.
Other expenses for Telefónica Latin America in Mexico decreased to €381 million in 2009 from €430 million in 2008 (an increase of 2.4% in local currency). This increase in local currency was principally due to higher commissions and customer services costs.
Other expenses for Telefónica Latin America in Peru decreased to €459 million in 2009 from €467 million in 2008 (a decrease of 4.1% in local currency). This decrease in local currency was principally due to cost containment.
Other expenses for Telefónica Latin America in Colombia increased to €531 million in 2009 from €515 million in 2008 (an increase of 7.1% in local currency), principally due to higher bad debt provisions in both mobile and fixed businesses.
Other expenses for Telefónica Latin America in Central America reached €126 million in 2009.
Other expenses for Telefónica Latin America in Ecuador increased to €114 million in 2009 from €93 million in 2008 (an increase of 17.1% in local currency), principally due to higher commission costs driven by the increase of top ups.
Operating income before depreciation and amortization (OIBDA)
As a result of the foregoing, Telefónica Latin America’s OIBDA,
increased 8.3%
to €9,143 million in 2009 from €8,445 million in 2008 (an increase of 10.3% excluding foreign exchange rate effects and excluding the effects of Venezuela being considered a hyperinflationary economy in 2009
). By country, (
excluding foreign exchange rate effects and excluding the effects of Venezuela being considered a hyperinflationary economy in 2009
), Venezuela contributed most to OIBDA growth (4.0 percentage points), followed by Mexico (2.7 percentage
points) and
Argentina (2.2
percentage points). In absolute terms, in 2009 Brazil was the largest contributor to Telefónica Latin America’s OIBDA, accounting for 34.3%
of the total, followed by
Venezuela at 20.0%,
Argentina at 10.8% and Mexico at 6.2%.
Telefónica Latin America’s OIBDA in 2009 as a percentage of Telefónica Latin America’s revenues for the same period was
39.8%, 1.7
percentage points higher than in 2008.
|
|
·
|
Telefónica Latin America’s OIBDA in Brazil decreased to €3,139 million in 2009 from €3,359 million in 2008 (a decrease of 3.1% in local currency).
|
|
|
·
|
Telefónica Latin America’s OIBDA in Venezuela increased to €1,818 million in 2009 from €1,328 million in 2008 (an increase of 25.4% in local currency and excluding the effects of Venezuela being considered a hyperinflationary economy in 2009).
|
|
|
·
|
Telefónica Latin America’s OIBDA in Argentina increased to €986 million in 2009 from €919 million in 2008 (an increase of 19.9% in local currency).
|
|
|
·
|
Telefónica Latin America’s OIBDA in Chile increased to €763 million in 2009 from €740 million in 2008 (an increase of 5.5% in local currency).
|
|
|
·
|
Telefónica Latin America’s OIBDA in Mexico increased to €564 million in 2009 from €420 million in 2008 (an increase of 55.2% in local currency).
|
|
|
·
|
Telefónica Latin America’s OIBDA in Peru increased to €712 million in 2009 from €621 million in 2008 (an increase of 12.0% in local currency).
|
|
|
·
|
Telefónica Latin America’s OIBDA in Colombia decreased to €397 million in 2009 from €515 million in 2008 (a
decrease
of 20.0% in local currency).
|
|
|
·
|
Telefónica Latin America’s OIBDA in Central America increased to €241 million in 2009 from €217 million in 2008 (an increase of 9.0% on a constant euro basis).
|
|
|
·
|
Telefónica Latin America’s OIBDA in Ecuador increased to €100 million in 2009 from €92 million in 2008 (an increase of 3.0% in local currency).
|
Depreciation and amortization
Telefónica Latin America’s depreciation and amortization increased 4
.1% to
€
3,793
million in 2009 from €3,645 million in 2008,
(an increase of 5.3%
excluding foreign exchange rate effects
and excluding the effects of Venezuela being considered a hyperinflationary economy in 2009
)
primarily as a result of increases in Venezuela and Brazil.
Operating income
As a result of the foregoing, Telefónica Latin America’s operating income increased 11.5% to €5,350 million in 2009
from €4,800
million in 2008, (an increase of 14.1% excluding foreign exchange rate effects
and excluding the effects of Venezuela being considered a hyperinflationary economy in 2009).
Atento
Revenues
Atento’s revenues increased by 1.6% to €1,321 million in 2009 from €1,301 million in 2008. The increase in revenues was primarily driven by an increase in the activity of its main customers, other members of the Telefónica Group and BBVA, and in the activity of the financial sector in Brazil.
Expenses
Atento’s expenses increased 4.4% to €1,169 million in 2009 from €1,120 million in 2008 primarily due to the increase in structural costs from the leasing of capacity and the increase of personnel expenses in many Latin American countries, where the majority of Atento’s employees are allocated.
Operating income before depreciation and amortization
Atento’s OIBDA decreased 17.4% to €154 million in 2009 from €186 million in 2008, due to margin shrinkage and higher personnel expenses.
Operating income
Atento’s operating income decreased 20.9% to €122 million in 2009 from €154 million in 2008.
Cash Flow Analysis
The table below sets forth consolidated cash flow information for the periods indicated. Positive figures refer to cash inflows and those in parenthesis refer to cash outflows.
|
Year ended December 31,
|
||||||||||||
|
2008
|
2009
|
2010
|
||||||||||
|
IFRS
|
(in millions of euros)
|
|||||||||||
|
Net cash from operating activities
|
16,366 | 16,148 | 16,672 | |||||||||
|
Net cash used in investing activities
|
(9,101 | ) | (9,300 | ) | (15,861 | ) | ||||||
|
Net cash used in financing activities
|
(7,765 | ) | (2,281 | ) | (5,248 | ) | ||||||
Net cash from operating activities
Net cash from operating activities increased 3.3% to €16,672 million in 2010 from €16,148 million in 2009, which in turn represented a decrease of 1.3% from €16,366 million in 2008.
In 2010, we had cash received from customers (€72,867 million) less cash paid to suppliers and employees (€67,358 million) totaling €21,306 million, 0.7% more than the €21,160 million generated in 2009. This slight improvement is due to the growth of consolidated revenues, underpinned by our business diversification and high levels of commercial activity, especially in fixed and mobile broadband, which increased our customer base by 8.7% to 287.6 million accesses at December 31, 2010. This growth is being driven simultaneously by policies to strengthen customer loyalty and the bundling of voice, broadband and television services, which are critical to our strategy, and our commitment to improving quality, all within a highly competitive environment in the markets in which we operate.
In 2010, cash received from customers increased by 8.2% to €72,867 million in 2010 from €67,358 million in 2009. Telefónica Latin America continues to enjoy accelerating growth stemming from its diversification and commercial efforts. Telefónica Europe has seen a sharp rise in revenues, while the businesses in Spain are generating operating cash flow thanks to commercial efforts and cost control. Cash received from customers decreased by 2.5% to €67,358 million in 2009 from €69,060 million in 2008. This decrease was in line with the decline in revenues.
In 2010 cash paid to suppliers and employees increased 11.6% to €51,561 million in 2010 from €46,198 million in 2009. This increase was primarily attributable to a higher supply of handsets in Telefónica Latin America (partially offset by lower mobile termination expenses in Telefónica Spain and Telefónica Europe), and increased commercial efforts in the three regions. Attempts to increase the efficiency of the cost structure contributed positively to the generation of operating cash flow. Compared to 2009, 2010 cash paid to employees has remained consistent with changes in average headcount, which increased by 5.4% in 2010. Cash paid to suppliers and employees in 2009 decreased 4.8% to €46,198 million from €48,500 million in 2008. This reduction was the result of the drive to contain expenses and to increase the efficiency of the cost structure. In addition, cash paid to suppliers and employees in 2009 and 2008 was broadly in line with the evolution of the average headcount.
In 2010 payments for net interest and other finance expenses decreased 0.7% to €2,154 million in 2010 from €2,170 million in 2009. This decrease was primarily attributable to the decline in the average interest rates applicable to our debt during the year, despite the increase in our financial debt during the year. Payments for net interest and other finance expenses decreased by 25.0% to €2,170 million in 2009 from €2,894 million in 2008, due to the downward trends in average interest rates applicable to our debt during the year and the reduction in our financial debt outstanding during the prior periods.
Taxes paid in 2010 fell 11.1% to €2,616 million in 2010 from €2,942 million in 2009. This decrease was primarily attributable to lower tax payments on accounts by Telefónica, S.A. in 2010 (€729 million). Taxes paid in 2009 increased by 108.2% to €2,942 million from €1,413 million in 2008 due to the €1,297 million payment made by Telefónica, S.A. in 2009.
Net cash used in investing activities
Net cash used in investing activities increased 70.5% to €15,861 million in 2010 from €9,300 million in 2009, mainly due to payments on investments in companies, which amounted to €5,744 million, with the main investments being the acquisition of 50% of Brasilcel, for a total of €5,047 million (net of cash and cash equivalents), the acquisition of 22% of the share capital of DTS (€230 million) and the acquisitions in Europe of Jajah and HanseNet for €150 million and €207 million, respectively, net of cash and cash equivalents. Payments on financial investments not included in cash equivalents amounted to €1,599 million in 2010. This includes payments of €638 million for the refinancing in connection with the acquisition of 100% of shares of HanseNet and the financing provided to Telco, for €600 million.
Net cash used in investing activities increased by 2.2% to €9,300 million in 2009 from €9,101 million in 2008, mainly due to the investment of certain short-term cash surpluses in higher yielding financial investments.
Payments on investment in property, plant and equipment and intangible assets increased 17.8% to €8,944 million in 2010 from €7,593 million in 2009. This increase was due to the rise in acquisitions of property, plant and equipment and intangible assets during the period, particularly the purchases of spectrum licenses in Mexico and Germany. Payments on investment in property, plant and equipment and intangible assets decreased 3.8% in 2009 to €7,593 million from €7,889 million in 2008, driven by the decline in acquisitions of property, plant and equipment from 2008 to 2009.
Proceeds on disposals of companies amounted to €552 million in 2010 and primarily relate to divestments in Meditel for €380 million and in Manx Telecom Limited for €157 million (in the latter case, net of cash and cash equivalents). Proceeds on disposals of companies, net of cash and cash equivalents disposed, amounted to €34 million in 2009 mainly due to the sale of Meditel for €20 million. In 2008, this figure amounted to €686 million, primarily due to the divestment of Sogecable for €648 million.
Net short-term financial investments included in cash flows from cash surpluses not included under cash equivalents in 2010 and 2009 amounted to €621 million and €548 million, respectively, while in 2008 divestements totaled €76 million.
Net cash used in financing activities
Net cash used in financing activities in 2010 increased by 130.1% to €5,248 million in 2010 from €2,281 million in 2009, mainly due to the higher dividend distributed by Telefónica, S.A. of €5,872 million (€4,557 million in 2009), the higher cash outflow due to redemption of bonds and debentures upon maturity, totaling €5,482 million (€1,949 million in 2009) and repayments of loans, credit facilities and promissory notes for €7,954 million (€5,494 million in 2009). These increases were partially offset by proceeds on loans, borrowings and promissory notes of €9,189 million in 2010 (€2,330 million in 2009) and proceeds on issue of debentures and bonds of €6,131 million in 2010 (€8,617 million in 2009).
Net cash used in financing activities in 2009 decreased by 70.6% to €2,281 million from €7,765 million in 2008, mainly due to the increase of proceeds from the issuance of debentures and bonds in 2009 for aggregate proceeds of €8,617 million compared to aggregate proceeds of €1,317 million raised in 2008.
Anticipated Uses of Funds
Our principal liquidity and capital resource requirements consist of the following:
|
|
·
|
capital expenditures for existing and new operations;
|
|
|
·
|
acquisitions of new licenses or other operators or companies engaged in complementary or related businesses;
|
|
|
·
|
costs and expenses relating to the operation of our business;
|
|
|
·
|
dividend, other shareholder remuneration, and pre-retirement payments; and
|
|
|
·
|
debt service requirements relating to our existing and future debt.
|
We have announced a capital expenditure target of around €9,000 million for 2011. This target was proposed based on constant 2010 exchange rates and excludes any effects if Venezuela should remain a hyperinflationary economy in 2011. This target also includes full consolidation of Vivo, HanseNet and Tuenti. This target also excludes any spectrum licenses which we may acquire and investments in our Real Estate Efficiency Program in Spain, a multi-year program related to the optimization of our real estate assets and rented properties in Spain, particularly real estate commitments associated with the new Telefónica premises in Barcelona. In 2011, we expect to continue investing mainly in our 3G and broadband networks to meet existing growth opportunities related to broadband, increased network traffic and the offering of new products and services utilizing new or evolving technologies. By region, in Spain we expect to continue investing in broadband networks, mobile broadband and selective roll-out of fiber optics. In Latin America we expect to continue to invest in 3G and broadband (to increase the average speed) and roll out ultra broadband in selective locations. In Europe we expect to invest in 3G. Nevertheless, we expect to continue to make investments in our mobile and fixed networks due to increased usage and the need to offer new services and greater functionality afforded by new or evolving technologies. Our principal capital expenditures are described in “Item 4.Information on the Company.” Our anticipated amounts of capital expenditures and investments in affiliates and the underlying assumptions are subject to risks and uncertainties, and actual capital expenditures and investments in affiliates may be less than or exceed these amounts. See “Cautionary Statement Regarding Forward-Looking Statements.”
We may also use funds to acquire new licenses or other operators or companies engaged in complementary or related businesses.
We also have liquidity requirements related to the costs and expenses relating to the operation of our business, our payment of dividends, shareholder remuneration and pre-retirement payment commitments and financial and real estate investments. In 2010, with respect to these items, we had the following principal cash expenditures: €6,577 million in connection with financial and real estate net investments mainly explained by the acquisition of 50% of the capital stock of Brasilcel owned by Portugal Telecom and to a lesser extent the acquisition of the shares of HanseNet, (see “—Significant Factors Affecting the Comparability of our Results of Operations in the Periods Under Review”), €5,872 million in connection with the payment of dividends on Telefónica S.A. shares, €883 million in connection with acquisition of Telefónica treasury shares and €834 million mainly in connection with commitments under pre-retirement plans.
We also have liquidity requirements related to debt service requirements in connection with our existing and future debt. At December 31, 2010, we had gross financial debt of €61,100 million compared with €56,791 million at December 31, 2009. For the amortization schedule of our consolidated gross financial debt at December 31, 2010 and a further description of financing activity in 2010, see “—Anticipated Sources of Liquidity” below. Our net financial debt increased to €55,593 million at December 31, 2010 compared to €43,551 million at December 31, 2009 principally due to financial investments (see “Item 4.Information on the Company — History and Development of the Company — Financial Investments and Divestitures”), the purchases of additional spectrum licenses and, to a lesser extent, to the foreign exchange rate effect. For a reconciliation of net financial debt to gross financial debt (the sum of current and non-current interest-bearing liabilities), see “—Presentation of Financial Information—Non-GAAP financial information—Net financial debt and net debt.”
For a discussion of our liquidity risk management policy, see Note 16 to our Consolidated Financial Statements.
Anticipated Sources of Liquidity
Cash flows from operations are our primary source of cash funding for existing operations, capital expenditures, interest obligations and principal payments. We also rely on external borrowings, including a variety of short- and medium-term financial instruments, principally bonds and debentures, and borrowings from financial institutions. Cash and cash equivalents are mainly held in euro and euro-denominated instruments. We believe that, in addition to internal generation of funds, our medium-term note program, our euro commercial paper program, our corporate domestic promissory note program and available lines of credit will provide us with substantial flexibility for our future capital requirements as existing debt is retired. As of the date of this Annual Report, our management believes that our working capital is sufficient to meet our present requirements.
The following table shows the amortization schedule of our consolidated gross financial debt at December 31, 2010, as stated in euro using the European Central Bank buying rate for euro on such date. We may have exchange rate financial derivatives as instruments assigned to the underlying debt instruments. In 2010, the average cost of net debt, which we measure as net financial expense divided by our average net debt, was 5.0%. The table below includes the fair value of those derivatives classified as financial liabilities (negative mark-to-market) under IFRS (€323 million classified as a current financial liability and €1,178 million as a non-current financial liability). It does not include: (a) the fair value of derivatives classified as financial assets (positive mark-to-market) under IFRS (€371 million classified as current financial assets and €2,566 million as non-current financial assets) and (b) the deferred payment for the acquisition of Brasilcel for €1,977 million (see “Item 4. Information on the Company – History and Development of the Company – Public Takeover Offers”). For a further description of liquidity risk faced by us, see Note 16 to our Consolidated Financial Statements, and for a description of our financial liabilities, see Note 13 to our Consolidated Financial Statements.
|
AMORTIZATION SCHEDULE FOR THE YEAR ENDED DECEMBER 31,
|
||||||||||||||||||||||||||||
|
2011
|
2012
|
2013
|
2014
|
2015
|
Subsequent
|
Total
|
||||||||||||||||||||||
|
(in millions of euros)
|
||||||||||||||||||||||||||||
|
Non-convertible euro and foreign currency debentures and bonds
|
4,029 | 1,933 | 5,399 | 5,100 | 3,809 | 15,723 | 35,993 | |||||||||||||||||||||
|
Promissory notes and commercial paper
|
1,728 | — | — | — | — | — | 1,728 | |||||||||||||||||||||
|
Other marketable debt securities
|
— | 1,971 | — | — | — | — | 1,971 | |||||||||||||||||||||
|
Loans and other payables (principal and interest accrued)
|
3,664 | 3,932 | 4,567 | 1,110 | 4,390 | 2,244 | 19,907 | |||||||||||||||||||||
|
Derivative financial liabilities
|
323 | 195 | 93 | 109 | 226 | 555 | 1,501 | |||||||||||||||||||||
|
Total (*)
|
9,744 | 8,031 | 10,059 | 6,319 | 8,425 | 18,522 | 61,100 | |||||||||||||||||||||
|
(*)
|
Estimated future interest payments as of December 31, 2010 on our interest-bearing-debt (not included above) are as follows: €2,534 million in 2011, €2,323 million in 2012, €2,199 million in 2013, €1,815 million in 2014, €1,448 million in 2015, and €9,170 million in subsequent years. With respect to floating rate debt, we estimate future interest payments as the forward rates derived from yield curves quoted for the different currencies on December 31, 2010.
|
During 2010, we obtained financing of approximately €15,800 million (excluding financing under short-term commercial paper programs), mainly in connection with pre-financing part of the 2011 debt maturities and financing the acquisition of the 50% capital stock of Brasilcel previously owned by Portugal Telecom.
In 2010, as a part of our refinancing plan to enhance our flexibility, primarily, we issued, through Telefónica Emisiones, S.A.U.: (i) five-year bonds in an aggregate principal amount of €1,400 million, with an annual interest rate of 3.406%, on March 24, 2010; (ii) three-year bonds in an aggregate principal amount of $1,200 million, with an annual interest rate of 2.582%, on April 26, 2010; (iii) five-year bonds in an aggregate principal amount of $900 million, with an annual interest rate of 3.729%, on April 26, 2010; (iv) ten-year bonds in an aggregate principal amount of $1,400 million, with an annual interest rate of 5.134%, on April 26, 2010; (v) seven-year bonds in an aggregate principal amount of €1,000 million, with an annual interest rate of 3.661%, on September 19, 2010; and (vi) 19-year bonds in an aggregate principal amount of £400 million, with an annual interest rate of 5.445%, on October 8, 2010.
In addition, in 2010, certain of our Latin American companies issued bonds with an aggregate principal amount equivalent to approximately €1,900 million, principally in connection with refinancing 2010 maturities, primarily: (a) Telefónica Finanzas México, S.A. de C.V. issued ten-year bonds in an aggregate principal amount of 2,000 million Mexican pesos and four-year bonds in an aggregate principal amount of 4,000 million Mexican pesos on July 19, 2010; and (b) Telefónica Móviles Chile, S.A. issued five-year bonds in an aggregate principal amount of $300 million on November 9, 2010.
On July 28, 2010, Telefónica, S.A. entered into a syndicated facility agreement with several domestic and international financial entities in an aggregate amount of up to €8,000 million. This facility agreement is divided into two tranches: the first is a three-year term loan facility, in an aggregate amount of up to €5,000 million; and the second is a five-year revolving credit facility, in an aggregate amount of up to €3,000 million.
During 2010, we have continued to be active under certain commercial paper programs (domestic and European) (with an outstanding balance of €1,654 million at December 31, 2010).
At December 31, 2010, we had unused committed credit lines of approximately €11,000 million, all of which bear interest at a floating rate based on market indices, principally the Euro Interbank Offered Rate, or EURIBOR and the London Interbank Offered Rate, or LIBOR, 35% of which are scheduled to mature prior to December 31, 2011.
In 2011, through the date of this Annual Report, we issued: (i) six-year bonds in an aggregate principal amount of €1,200 million, with an annual interest rate of 4.750% on February 7, 2011, increasing up to an aggregate principal amount of €1,300 million, on March 21, 2011, (ii) five-year bonds in an aggregate principal amount of $1,250 million, with an annual interest rate of 3.992%, on February 16, 2011, and (iii) ten-year bonds in an aggregate principal amount of $1,500 million, with an annual interest rate of 5.462%, on February 16, 2011.
On March 29, 2011, Atento Inversiones y Teleservicios, S.A.U., and its wholly owned subsidiaries, Atento, N.V. and Atento Teleservicios España, S.A.U., entered into a four-year financing facility agreement with several financial entities in an aggregate amount of up to €235 million.
Our borrowing requirements are not significantly affected by seasonal trends.
Our ability to use external sources of financing will depend in large part on our credit ratings. We believe that we are well-positioned to raise capital in financial markets. However, negative conditions in the financial markets or a downgrade of any of the ratings of our debt by any of Fitch, Moody’s, JCR and/or Standard & Poor’s may increase the cost of our future borrowing or may make it more difficult to access the public debt markets. In connection with the credit rating agencies’ review of our debt ratings, the rating agencies may give considerable weight to general macroeconomic and political conditions, the performance of our businesses in countries where we operate, our financial and shareholder remuneration policy, our acquisition policy, our ability to integrate acquisitions and our ability to refinance debt.
For a discussion of our liquidity and country risk management policy, see Note 16 to our Consolidated Financial Statements.
Intragroup Loans
We lend funds to our operating subsidiaries, directly or through holding companies that head our different lines of business. At December 31, 2010, we had loans outstanding totaling €5,424 million (€5,975 million at December 31, 2009) to companies in the Telefónica Group (including subsidiaries located in Latin American countries). These funds are derived from retained cash flows, loans, bonds and other sources (such as asset disposals).
Telefónica is still firmly committed to technological innovation as a core means to generate sustainable competitive advantages, anticipate market trends and differentiate our products. By introducing new technologies and developing new products and business processes, we seek to become a more effective, efficient and customer-oriented Group.
In this respect, we cannot rely solely on acquired technology to differentiate our products from those of our competitors and improve our market position. It is also important to encourage research and development initiatives in an effort to achieve our desired level of differentiation and foster other innovation activities.
The Group’s R&D policy is designed to:
|
|
·
|
develop new products and services in order to capture market share;
|
|
|
·
|
boost customer loyalty;
|
|
|
·
|
drive revenue growth;
|
|
|
·
|
enhance innovation management;
|
|
|
·
|
improve business practices; and
|
|
|
·
|
increase the quality of our infrastructure and services to improve customer service and reduce costs.
|
Telefónica is developing an open innovation model for the management of technological innovation to boost the dynamism and efficiency of our research and development activities and the development of commercial products and services.
Open innovation initiatives driving this model include the creation of a venture capital fund, collaborative agreements with technology partners and involvement in business collaboration forums. The model also promotes the use of knowledge developed at technology centers, universities and start-ups, and encourages creating value from know-how acquired internally through the active commercialization, where appropriate, of such industrial and intellectual property.
In 2010, technological innovation projects were focused on profitable innovation, process efficiency, creation of new revenue streams, customer satisfaction, consolidation of new markets and technological leadership.
Our technological innovation activities are a key part of Telefónica’s strategy to create value through opportunities presented by new technologies, such as mobile broadband and fiber optics.
In 2010, we undertook to promote greater access to information technology, new services focused on new Internet business models, advanced user interfaces, mobile television and other broadband services. These initiatives, among others, were undertaken based on our objective to quickly identify emerging technologies that could have a relevant impact on our businesses, and to test such technologies in new services, applications and platform prototypes.
A significant part of our R&D activities are carried out by Telefónica Investigación y Desarrollo S.A.U., or Telefónica I+D, a wholly-owned subsidiary, which focuses exclusively on providing solutions to our various lines of business.
Telefónica I+D’s research and development activities in 2010 focused on:
|
|
·
|
Natural peer to peer (“P2P”) communication of the future, using the Internet, Web 2.0 and smartphones.
|
|
|
·
|
Video and multimedia services (combining text, audio, images and video), offering an enhanced user experience on all connected devices.
|
|
|
·
|
Advanced solutions in emerging ITC businesses, such as remote healthcare monitoring and remote patient support or monitoring.
|
|
|
·
|
Machine to machine (“M2M”) service management associated with energy efficiency and mobility.
|
|
|
·
|
Cloud computing that makes use of web resources to publish, commercialize and distribute applications.
|
|
|
·
|
Analysis of how users employ communications technologies to identify service and business model opportunities (marketing campaigns, target marketing and tailor-made contextual services, reduced churn, cross selling).
|
|
|
·
|
Development of networks and services in a new global infrastructure converted to all business lines to reduce operating and maintenance costs, provide greater capacity for mobile data and video content, and shift from an object-based Internet to a people-based Internet.
|
In 2010, 38.2% of Telefónica I+D’s activity was performed for Telefónica in Spain, 27.1% for companies in Latin America, 21.1% for Telefónica, S.A. (primarily the Corporate Innovation Program, including medium to long-term projects between two or more business units), 10.5% for Telefónica Europe and the remaining 3.1% for other customers of Telefónica I+D.
At December 31, 2010, Telefónica I + D had 635 employees. During 2010, over 500 companies and 160 universities were involved in projects performed by Telefónica I+D as part of the aforementioned open innovation model. Many of these collaborative projects were partially financed by public programs designed to promote R&D implemented by various public bodies, such as the European Union, Spanish government and regional governments.
Research and development costs at Telefónica amounted to €797 million, €693 million and €668 million in 2010, 2009 and 2008, respectively; representing 1.3%, 1.2% and 1.2% of consolidated revenue in these three years, respectively. These figures were calculated using OECD guidelines. Using these guidelines and other international standards, there are R&D costs that, due to the length of projects and/or accounting classifications, are not included in their entirety in the consolidated statement of financial position.
Telefónica registered 74 patents in 2010, of which 43 were registered with the Spanish patent office and 31 with patent offices in the European Union, the United States and with other international patent offices.
We are an integrated diversified telecommunications group that offers a wide range of services, mainly in Spain, Europe, and Latin America. Our activity is based upon providing fixed and mobile services, Internet and data, pay TV and value added services, among others. Our operations in 25 countries, managed through regional organizations geared towards certain businesses units, enables us to leverage our strong local positioning, as well as the advantages afforded by our scale, two features that have been reinforced by the opportunities arising from our holdings in and strategic alliances with China Unicom and Telecom Italia.
As a multinational telecommunications company that operates in regulated markets, we are subject to different laws and regulations in each of the jurisdictions in which we provide services. We can expect the regulatory landscape to continue changing in Europe as a consequence of the revised regulations resulting from the implementation of the review of the common regulatory framework currently in place in the European Union. In addition, we may also face pressure from regulatory initiatives in some European countries regarding tariffs, the reform of rights of spectrum use and allocation, issues related to the quality of service, and the regulatory treatment of new broadband infrastructure deployments.
We face intense competition in most of our markets, and we are therefore subject to the effects of actions taken by our competitors. The intensity of the competition may deepen, and could have an impact on tariff structures, consumption, market share and commercial activity, which could result in decreased in current and potential customers, revenues and profitability.
However, we are in a strong competitive position in most of the markets where we operate, enabling us to continue taking advantage of the growth opportunities that arise in these markets, such as by boosting both fixed and mobile broadband services and by furthering the development of services beyond connectivity, information technology services and related businesses. In this respect, we seek to lead the industry by anticipating trends in the new digital environment.
We will continue transforming our operating model to increase our operational efficiency and capture the synergies arising from our integrated approach to businesses, processes and technologies and will maintain a
regional approach to tackle this transformation more efficiently. At the same time, we will remain strongly committed to technological innovation as a key tool for achieving sustainable competitive advantages, anticipating market trends and differentiating our products. We continually seek to become the benchmark for efficiency and customer satisfaction by introducing new technologies and developing new products and business processes.
In Spain, we will continue to intensify our commercial commitment to offering quality services, increasing the effectiveness of our sales channels and further improving the quality and features of our networks to increase customer satisfaction through targeted commercial offerings that are responsive to customers’ needs. In this respect, we will continue to boost innovation to offer the best products and services, drive the mobile and fixed broadband growth and bundling services to provide the best integrated communications solutions on the market. Efficiency will continue to play a very important role in all areas of management, both in commercial and operational areas, including systems, networks and processes.
Furthermore the company is analyzing the adoption of certain measures in order to gain more operational flexibility. Among others, we are considering a series of initiatives such as linking salary revisions to productivity, together with potential outsourcing plans or restructuring programs that could affect a part of our workforce.
In Latin America, our strategy is based on a regional model that captures growth and efficiency of scale without losing sight of the local management of the client. This position was further enhanced in the fourth quarter through our acquisition of the stake held by Portugal Telecom in Brasilcel. This has put us in a much stronger position in one of the principal markets in the region: the Brazilian mobile market. The mobile business will continue to play a fundamental role as an engine of regional growth. That is why we will continue to improve the capacity and coverage of our networks, adapting our distribution channel to enhance the quality of our offer both in voice and data in order to keep and attract high-value customers. With regard to the fixed telephony business, we will encourage the increase of broadband speed and extend the supply of bundled services. Meanwhile, we will further advance efficiency, in operational and commercial terms, and attempt to achieve further synergies by implementing global, regional and local projects.
In Europe, customers will remain at the center of our strategy and management priorities in the region. With the objective of offering our customers the best value, we will boost the mobile and fixed broadband services, adding new products and services. In such a competitive market, we will dedicate our efforts to reinforcing our market position. Another objective in coming years is to improve operating efficiency, pursuant to which we will roll out several local and regional initiatives.
In summary, in the context of intense competition and regulatory pressure on pricing, Telefónica will continue strengthening its business model to make it more efficient and capture the synergies arising from the integrated approach of businesses, processes and technologies, while focusing even more on the client.
We have commitments that could require us to make material payments in the future. These commitments are not included in our consolidated statement of financial position at December 31, 2010 although they are described in the notes to our Consolidated Financial Statements. For additional detail on our off-balance sheet commitments, see Note 21(b) to our Consolidated Financial Statements.
The following table describes our contractual obligations and commitments with definitive payment terms which may require significant cash outlays in the future. The amounts payable (including accrued interest payments) are as of December 31, 2010. For additional information, see our Consolidated Financial Statements included elsewhere herein.
|
Payments Due by Period
|
||||||||||||||||||||
|
Total
|
Less than 1 year
|
1-3 years
|
3-5 years
|
More than 5 Years
|
||||||||||||||||
|
(in millions of euros)
|
||||||||||||||||||||
|
Financial liabilities (1)(2)
|
61,100 | 9,744 | 18,090 | 14,744 | 18,522 | |||||||||||||||
|
Operating lease obligations (3)
|
8,842 | 1,327 | 2,281 | 1,734 | 3,500 | |||||||||||||||
|
Purchase obligations (4)
|
4,413 | 1,752 | 995 | 582 | 1,084 | |||||||||||||||
|
Other liabilities (5)
|
4,627 | 2,736 | 1,891 | — | — | |||||||||||||||
|
Total
|
78,982 | 15,559 | 23,257 | 17,060 | 23,106 | |||||||||||||||
|
(1)
|
Capital (finance) lease obligations are not calculated separately and are instead included as part of our long-term debt obligations.
|
|
(2)
|
This item includes the fair value of those derivatives classified as current financial liabilities (negative mark-to-market) under IFRS (€323 million). Future interest payments as of December 31, 2010 on our interest-bearing-debt (not included above) are as follows: €2,534 million in 2011, €2,323 million in 2012, €2,119 million in 2013, €1,815 million in 2014, €1,448 million in 2015 and €9,170 million in subsequent years. With respect to floating rate debt, we estimate future interest payments as the forward rates derived from yield curves quoted for the different currencies on December 31, 2010. It does not include the fair value of derivatives classified as financial assets (positive mark-to-market) under IFRS (€371 million classified as current financial assets and €2,566 million as non-current financial assets). For a more detailed description of our financial derivative transactions, see “Item 11. Quantitative and Qualitative Disclosures About Market Risk” and Note 16 to our Consolidated Financial Statements. For details of the composition of this item, see “Liquidity and Capital Resources– Anticipated sources of Liquidity”).
|
|
(3)
|
Our operating lease obligations have in some cases extension options conditioned on the applicable law of each country. Accordingly, we have included only those amounts that represent the initial contract period.
|
|
(4)
|
This item includes definitive payments due for agreements to purchase goods (such as network equipment) and services.
|
|
(5)
|
“Other liabilities” include: (a) long-term obligations that require us to make cash payments, excluding financial debt obligations included in the table under “Financial Liabilities” above (b) other provisions and (c) the deferred payment for the acquisition of Brasilcel for €1,977 million (see “Item 4. Information on the Company – History and Development of the Company – Public Takeover Offers”). Because of the nature of the risks covered by “Other liabilities” such as other provisions, it is not possible to determine a reliable schedule of potential payments, if any. For details of the composition of other provisions, see Note 15 to our Consolidated Financial Statements.
|
In addition, at December 31, 2010, we have short and long term employee benefits provisions amounting to €916 million and €2,974 million, respectively.
For details of the composition of, and changes in, our debt, see “—Liquidity and Capital Resources—Anticipated Sources of Liquidity” and Note 13 to our Consolidated Financial Statements.
During 2010, our Board of Directors met 14 times. At April 29, 2011 our Board of Directors had met 5 times during 2011. At April 29, 2011, our directors, their respective positions on our Board and the year they were appointed to such positions were as follows:
|
Name
|
Age
|
First Appointed
|
Current Term Ends
|
|||
|
Chairman
|
||||||
|
Mr. César Alierta Izuel(1)
|
65
|
1997
|
2012
|
|||
|
Vice-chairmen
|
||||||
|
Mr. Isidro Fainé Casas(1)(2)
|
68
|
1994
|
2011
|
|||
|
Mr. Vitalino Manuel Nafría Aznar(3)(4)(5)(6)(7)
|
60
|
2005
|
2011
|
|||
|
Members (
vocales
)
|
||||||
|
Mr. Julio Linares López(1)(8)
|
65
|
2005
|
2011
|
|||
|
Mr. José María Abril Pérez (1)(3)(5)
|
59
|
2007
|
2013
|
|||
|
Mr. José Fernando de Almansa Moreno-Barreda(5)(6)(9)
|
62
|
2003
|
2013
|
|||
|
Mr. Jose María Álvarez –Pallete López
|
47
|
2006
|
2012
|
|||
|
Mr. David Arculus (5)(6)
|
64
|
2006
|
2011
|
|||
|
Ms. Eva Castillo Sanz (6)(9)(11)
|
48
|
2008
|
2013
|
|||
|
Mr. Carlos Colomer Casellas(1)(8)(10)(11)
|
67
|
2001
|
2011
|
|||
|
Mr. Peter Erskine(1)(8)(9)(10)
|
59
|
2006
|
2011
|
|||
|
Mr. Alfonso Ferrari Herrero (1)(4)(5)(6)(7)(9)(10)(11)
|
69
|
2001
|
2011
|
|||
|
Mr. Luiz Fernando Furlán(5)
|
64
|
2008
|
2013
|
|||
|
Mr. Gonzalo Hinojosa Fernández de Angulo (1)(4)(5)(7)(9)(10)(11)
|
65
|
2002
|
2012
|
|||
|
Mr. Pablo Isla Álvarez de Tejera(6)(7)(8)(10)(11)
|
47
|
2002
|
2012
|
|
Mr. Antonio Massanell Lavilla(2)(4)(7)(8)(11)
|
56
|
1995
|
2011
|
|||
|
Mr. Francisco Javier de Paz Mancho (1)(5)(6)(7)
|
52
|
2007
|
2013
|
|
(1)
|
Member of the Executive Commission of the Board of Directors.
|
|
(2)
|
Nominated by Caja de Ahorros y Pensiones de Barcelona (“La Caixa”).
|
|
(3)
|
Nominated by Banco Bilbao Vizcaya Argentaria, S.A. (“BBVA”).
|
|
(4)
|
Member of the Audit and Control Committee of the Board of Directors.
|
|
(5)
|
Member of the International Affairs Committee.
|
|
(6)
|
Member of the Regulation Committee.
|
|
(7)
|
Member of the Human Resources and Corporate Reputation and Responsibility Committee.
|
|
(8)
|
Member of the Innovation Committee.
|
|
(9)
|
Member of the Strategy Committee.
|
|
(10)
|
Member of the Nominating, Compensation and Corporate Governance Committee.
|
|
(11)
|
Member of the Service Quality and Customer Service Committee.
|
Board Committees
At April 29, 2011, the committees of our Board of Directors and members thereof are as follows:
Executive Commission
Our Board of Directors has expressly delegated all of its authority and power to the Executive Commission except as prohibited by Spanish corporate law, under our Articles of Association, or under our Board Regulations. This commission is made up of fewer directors and meets more frequently than our Board of Directors. The members of the Executive Commission are Mr. César Alierta Izuel, Mr. Isidro Fainé Casas, Mr. Julio Linares López, Mr. José María Abril Pérez, Mr. Carlos Colomer Casellas, Mr. Peter Erskine, Mr. Alfonso Ferrari Herrero, Mr. Gonzalo Hinojosa Fernández de Angulo, Mr. Francisco Javier de Paz Mancho and Mr. Ramiro Sánchez de Lerín García-Ovies, as secretary.
Audit and Control Committee
The Audit and Control Committee functions are regulated by our bylaws and our Board Regulations. The Audit and Control Committee has the primary objective of providing support to our Board of Directors in its supervisory and oversight functions, specifically having the following responsibilities:
|
|
·
|
to report, through its chairman, to our general meeting of shareholders on matters raised at the general meeting of shareholders relating to the functions and matters of competence of the committee;
|
|
|
·
|
to propose to our Board of Directors to submit to our general meeting of shareholders the appointment of our auditors referred to in Article 264 of the Spanish Corporation Law, as well as, when appropriate, the terms of their engagement, scope of professional assignment and revocation or non-renewal of their appointment;
|
|
|
·
|
to supervise the internal audit services;
|
|
|
·
|
to supervise the process of gathering financial information and the internal control systems; and
|
|
|
·
|
to maintain the necessary relations with the auditors to receive information on all matters that may put their independence at risk, and any other matters related to the process of auditing our accounts, as well as to receive information and maintain communication with our auditors as required by laws relating to the audit process and with respect to technical regulations on auditing.
|
The Audit and Control Committee meets at least once per quarter and as many times as considered necessary. During 2010, the Audit and Control Committee met 10 times and, as of the date of this Annual Report, had met
4 times in 2011. The members of the Audit and Control Committee are Mr. Gonzalo Hinojosa Fernández de Angulo (chairman), Mr. Antonio Massanell Lavilla, Mr. Alfonso Ferrari Herrero and Mr. Vitalino Manuel Nafría Aznar.
Nominating, Compensation and Corporate Governance Committee
The Nominating, Compensation and Corporate Governance Committee is responsible for, among other things, reporting to our Board of Directors with respect to proposals for the appointment, re-election and removal of directors, members of the Executive Committee and the other committees of our Board of Directors and top members of our management and management of our subsidiaries. In addition, the Nominating, Compensation and Corporate Governance Committee is responsible for proposing to the Board of Directors, within the framework established in the bylaws, the compensation for the directors and reviewing it periodically to ensure that it is in keeping with the tasks performed by them, as provided in Article 35 of the Board Regulations, to propose to the Board of Directors, within the framework established in the bylaws, the extent and amount of the compensation, rights and remuneration of a financial nature, of the Chairman, the executive directors and the senior executive officers of Telefónica, including the basic terms of their contracts, for purposes of contractual implementation thereof and to supervise compliance with Telefónica’s internal rules of conduct and the corporate governance rules thereof in effect from time to time.
The members of the Nominating, Compensation and Corporate Governance Committee are Mr. Alfonso Ferrari Herrero (chairman), Mr. Carlos Colomer Casellas, Mr. Peter Erskine, Mr. Gonzalo Hinojosa Fernández de Angulo and Mr. Pablo Isla Álvarez de Tejera. During 2010, the Nominating, Compensation and Corporate Governance Committee met 8 times, and as of the date of this Annual Report, had met 4 times in 2011.
Human Resources and Corporate Reputation and Responsibility Committee
The Human Resources and Corporate Reputation and Responsibility Committee is responsible for reviewing our personnel policy and making proposals to our Board of Directors regarding our personnel policy, corporate reputation, responsibility and the promotion of our values within the Telefónica Group. The Human Resources and Corporate Reputation and Responsibility Committee met 5 times during 2010 and as of the date of this Annual Report had met 1 in 2011. The members of the Human Resources and Corporate Reputation and Responsibility Committee are Mr. Francisco Javier de Paz Mancho (chairman), Mr. Alfonso Ferrari Herrero, Mr. Gonzalo Hinojosa Fernández de Angulo, Mr. Pablo Isla Álvarez de Tejera, Mr. Antonio Massanell Lavilla and Mr. Vitalino Manuel Nafría Aznar.
Regulation Committee
The Regulation Committee’s main objective is to monitor the main regulatory matters which affect us. Another responsibility of the Regulation Committee is to act as a communication and information channel between our management team and our Board of Directors concerning regulatory matters. The members of the Regulation Committee are Mr. Pablo Isla Álvarez de Tejera (chairman), Mr. José Fernando de Almansa Moreno-Barreda, Mr. David Arculus, Ms. Eva Castillo Sanz, Mr. Alfonso Ferrari Herrero, Mr. Vitalino Manuel Nafría Aznar and Mr. Francisco Javier de Paz Mancho. During 2010, the Regulation Committee met 5 times, and as of the date of this Annual Report, had met 2 times in 2011.
Service Quality and Customer Service Committee
The Service Quality and Customer Service Committee is responsible for monitoring and reviewing the standards of quality of the main services we provide. The Service Quality and Customer Service Committee acts as an information channel between our senior management team and our Board of Directors. The members of the Service Quality and Customer Service Committee are Mr. Antonio Massanell Lavilla (chairman), Ms. Eva Castillo Sanz, Mr. Carlos Colomer Casellas, Mr. Alfonso Ferrari Herrero, Mr. Gonzalo Hinojosa Fernández de Angulo, and Mr. Pablo Isla Álvarez de Tejera. During 2010 the Service Quality and Customer Service Committee met 4 times, and as of the date of this Annual Report, had met once in 2011.
International Affairs Committee
The International Affairs Committee is responsible for analyzing international events and matters that affect the Telefónica Group and reporting these events and possible consequences to our Board of Directors. The International Affairs Committee pays close attention to events taking place in countries where we have operations and which may affect our competitive position, corporate image and financial results. The International Affairs Committee also oversees our non-profit foundations in such countries. The members of the International Affairs Committee are Mr. José Fernando de Almansa Moreno-Barreda (chairman), Mr. José María Abril Pérez, Mr. David Arculus, Mr. Alfonso Ferrari Herrero, Mr. Luiz Fernando Furlán, Mr. Gonzalo Hinojosa Fernández de Ángulo, Mr. Vitalino Manuel Nafría Aznar and Mr. Francisco Javier de Paz Mancho. During 2010, the International Affairs Committee met 4 times, and as of the date of this Annual Report had met once in 2011.
Innovation Committee
The Innovation Committee is responsible for advising and assisting in all matters regarding innovation. Its main object is to examine, analyze and periodically monitor the Group’s innovation projects, provide guidance and help ensure the implementation and development of innovation initiatives across the Group. The members of the Innovation Committee are Mr. Carlos Colomer Casellas (chairman), Mr. Pablo Isla Álvarez de Tejera, Mr. Antonio Massanell Lavilla, Mr. Peter Erskine and Mr. Julio Linares López. During 2010, the Innovation Committee met 11 times, and as of the date of this Annual Report, had met 3 times in 2011.
Strategy Committee
Without prejudice to any other tasks that the Board of Directors may assign thereto, the primary duty of the Strategy Committee is to support the Board of Directors in the analysis and implementation of the global strategy policy of the Telefónica Group. The members of the Strategy Committee are Mr. Peter Erskine (chairman), Mr. José Fernando de Almansa Moreno-Barreda, Ms. Eva Castillo Sanz, Mr. Alfonso Ferrari Herrero and Mr. Gonzalo Hinojosa Fernández de Angulo. The Strategy Committee met 4 times during 2010, and as of the date of this Annual Report, had met 4 times in 2011.
Biographies of Directors
Mr. César Alierta Izuel
serves as our Executive Chairman and Chairman of our Board of Directors. Mr. Alierta began his career in 1970 as general manager of the capital markets division at Banco Urquijo, S.A. in Madrid, where he worked until 1985. Subsequently, he founded and served as chairman of Beta Capital Sociedad de Valores, S.A. which he combined as from 1991 with his post as chairman of the Spanish Financial Analysts’ Association (Instituto
Español de Analistas Financieros)
. Between 1996 and 2000, he was director and chairman of Tabacalera, S.A. At that time Tabacalera, S.A. changed its name into Altadis, S.A. (following its merger with the French Group, Seita-Société Nationale D’Éxplotation Industrielle des Tabacs et Allumettes) and he became director and chairman of Altadis, S.A. He has also been a member of the board of directors of the Madrid Stock Exchange (
Bolsa de Madrid
), Plus Ultra Compañía de Seguros y Reaseguros, S.A. and of Iberia, S.A. On January 1997, Mr. Alierta was appointed as a director of Telefónica and on July 26, 2000, he was appointed as our Executive Chairman. Mr. Alierta is director of Telecom Italia since November 8, 2007 and of China Unicom (Hong Kong) Limited since October 15, 2008, and of International Consolidated Airlines Group (IAG) since September 2010. Mr. Alierta holds a law degree from the University of Zaragoza and an MBA from Columbia University (New York) and is currently a member of the Columbia Business School Board of Overseers, and Chairman of the Social Board of the UNED (National Long Distance Spanish University).
Mr. Isidro Fainé Casas
serves as Vice-Chairman of our Board of Directors. For over 40 years, Mr. Fainé has worked in several financial institutions, including amongst others: Banco Atlántico, S.A., (1964), Banco de Asunción (Paraguay) (1969), Banco Riva y García, S.A. (1973), Banca Jover, S.A. (1974), and Banco Unión, S.A. (1978). Mr. Fainé is currently chairman of Caja de Ahorros y Pensiones de Barcelona (“la Caixa”) of Criteria CaixaCorp, S.A. and of Confederación Española de Cajas de Ahorros; vice-chairman of Abertis Infraestructuras, S.A. and of Sociedad General de Aguas de Barcelona, S.A. (AGBAR); and second vice-chairman of Repsol YPF, S.A. He is also a member of the board of directors of Banco Portugués de Investimento, S.A. (BPI), Grupo Financiero Inbursa and a non-executive director of Bank of East Asia. Mr. Fainé holds a doctorate degree in
economics, a diploma in
Alta Dirección
(Senior Management) from IESE Business School (
Instituto de Estudios Superiores de la Empresa
) and an ISMP in business administration from Harvard University. He is a member of the
Real Academia de Ciencias Económicas y Financieras
.
Mr. Vitalino Manuel Nafría Aznar
serves as Vice-Chairman of our Board of Directors. In 1966 he joined Banco de Vizcaya, S.A. In 1983, Mr. Nafría Aznar was appointed general manager of Induban, S.A. (Banco de Financiación Industrial) in Bilbao. In 1988 he worked as regional manager for Aragón, Navarra y Rioja at Banco Bilbao Vizcaya (BBV). In 1990, he was appointed business manager of BBV. In 1994, he held a senior position at the Territorial Direction in País Vasco. In April 1998, he was appointed director of the board of directors and general manager of BBV in Mexico. In July 2000, he was appointed chief executive officer and director of the board of directors of Grupo Financiero BBVA Bancomer. In December 2001, he was appointed member of the executive committee of BBVA and in January 2003 he became general manager of BBVA America. Since January 2005 he has been the Retail Banking Manager in Spain and Portugal for BBVA. He is now in retirement. Since February 2009, he is chairman of the board of directors of Metrovacesa, S.A. He is also substitute director of Grupo Financiero BBVA Bancomer, S.A. de C.V. and of BBVA Bancomer, S.A.
Mr. Julio Linares López
serves as a director of our Board of Directors and as our Chief Operating Officer since December 19, 2007. In May 1970, he joined our Research and Development Center, where he held several positions until he was appointed head of our Technology Department in 1984. In April 1990, he was appointed General Manager of Telefónica Investigación y Desarrollo, S.A. In December 1994, he became deputy general manager of the Marketing and Services Development department in the commercial area and subsequently, deputy general manager for Corporate Marketing. In July 1997, he was appointed chief executive officer of Telefónica Multimedia S.A. and chairman of Telefónica Cable and Producciones Multitemáticas, S.A. In May 1998 he was appointed General Manager of Strategy and Technology in Telefónica, S.A. In January 2000, he was appointed executive chairman of Telefónica de España, S.A., a position which he held until December 2005, when he was appointed our managing director for Coordination, Business Development and Synergies. He is currently member of the board of directors and of the executive committee of Telecom Italia and member of the Social Council of the Complutense University of Madrid. Mr. Linares holds a degree in telecommunications engineering from the Polytechnic University of Madrid (
Universidad Politécnica de Madrid
).
Mr. José María Abril Pérez
serves as a director of our Board of Directors. From 1975 to 1982 he served as financial manager of Sociedad Anónima de Alimentación (SAAL). Since then, and until he joined the Banco Bilbao Vizcaya Argentaria Group (BBVA), he was financial manager of Sancel-Scott Ibérica, S.A. In 1985 he joined Banco Bilbao, S.A. as managing director of Investment Corporate Banking. From January to April 1993, he was appointed executive coordinator of Banco Español de Crédito, S.A. In 1998, he became general manager of the Industrial Group of BBVA. In 1999, he was appointed member of the executive committee of the BBVA Group. He has also been a member of the board of directors of Repsol, S.A., Iberia, S.A. and Corporación IBV. In 2002 he became managing director of the Wholesale and Investment Banking Division and a member of the executive committee of BBVA, and he is now in early retirement. Until July 2007, he was vice president of Bolsas y Mercados Españoles, S.A. He is currently a member of the board of directors of Advancell, S.A. He holds a degree in economics from the University of Deusto (Bilbao, Spain) and he has been professor at such university for nine years.
Mr. José Fernando de Almansa Moreno-Barreda
serves as a director of our Board of Directors. In December 1974 he joined the Spanish Diplomatic Corps (
Cuerpo Diplomático
) and served from 1976 to 1992 as Secretary of the Spanish Embassy in Brussels, Cultural Counselor of the Spanish Delegation to Mexico, Chief Director for Eastern European Affairs, Director of Atlantic Affairs in the Spanish Foreign Affairs Ministry, Counselor to the Spanish Permanent Representation to NATO in Brussels, Minister-Counselor of the Spanish Embassy in the Soviet Union, General Secretary of the National Commission for the 5th Centennial of the Discovery of the Americas and Deputy General Director for Eastern Europe Affairs in the Spanish Foreign Affairs Ministry. From 1993 to 2002, Mr. Fernando de Almansa was appointed Chief of the Royal Household by His Majesty King Juan Carlos I, and is currently personal advisor to His Majesty the King. He is also a substitute director of Grupo Financiero BBVA Bancomer , S.A. de C.V. and of BBVA Bacomer, S.A.. He holds a law degree from the University of Deusto (Bilbao, Spain).
Mr. José María Álvarez-Pallete López
serves as a director of our Board of Directors and, since July 2006, as Chairman of Telefónica Latin America. He began his career at Arthur Young Auditors in 1987. In 1988, he joined
Benito & Monjardín/Kidder, Peabody & Co., where he held various positions in the research and corporate finance departments. In 1995, he joined Valenciana de Cementos Portland, S.A. (Cemex) as head of the Investor Relations and Studies department. In 1996 he was promoted to chief financial officer of Cemex Group in Spain, and in 1998, to chief administration and financial officer of Cemex in Indonesia, headquartered in Jakarta, and he was appointed member of the Board of Cemex Asia, Ltd. In February 1999 he joined the Telefónica Group as general manager of Finance for Telefónica International, S.A. In September of the same year he was promoted to chief financial officer of Telefónica. In July 2002, he was appointed chairman and chief executive officer of Telefónica Internacional, S.A. Mr. Álvarez-Pallete holds a degree in economics from the Complutense University of Madrid. He also studied economics at the Université Libre de Belgique and holds an International Management Program from the Pan-American Institute of Executive Business Administration (IPADE) and an advance research degree from the Universidad Complutense of Madrid.
Sir David Arculus
serves as a director of our Board of Directors. From 1998 to 2004, he was chairman of Severn Trent Plc. and from 1998 to 2001 he was chairman of IPC Group Ltd. From 2004 to January 2006, he served as chairman of O2, Plc. (now Telefónica Europe, Plc.). Sir David Arculus is currently a member of the board of directors of Pearson, Plc. He is also chairman of Numis, Plc. and of Aldermore Bank, Plc. In 1972 he received an MBA from the London Business School. In 1968, he received his master’s degree in engineering and economics from Oriel College, Oxford, and in 2003 he received a degree
Honoris Causa
from the University of Central England.
Ms. Eva Castillo Sanz
serves as a director of our Board of Directors. Ms. Castillo began her career at the Spanish broker Beta Capital Sociedad de Valores, S.A., where she worked for five years. After that, she worked for another five years for Goldman Sachs International in London in the International Equities department. In 1997 Ms. Castillo joined Merrill Lynch as head of Equity Markets for Spain and Portugal. In 1999, she was promoted to Country Manager for Spain and Portugal and in 2000 she became chief executive officer of Merrill Lynch Capital Markets Spain. After that, Ms. Castillo was appointed chief operating officer for EMEA Equity Markets. In October 2003 she was appointed head of Global Markets & Investment Banking in Spain and Portugal, as well as president of Merrill Lynch Spain. Until December 2009, she headed Global Wealth Management business operations in Europe, the Middle East and Africa, including Merrill Lynch Bank (Suisse) and the International Trust and Wealth Structuring business. She was a member of the Merrill Lynch EMEA Executive Committee, the Global Wealth Management Executive and Operating Committees. Ms. Castillo holds degrees in business, economics and law (ICADE – E3) from the Universidad Pontificia de Comillas of Madrid.
Mr. Carlos Colomer Casellas
serves as a director of our Board of Directors. Mr. Colomer began his career in 1970 as marketing vice-chairman of Henry Colomer, S.A. In 1980, he was appointed chairman and general manager of Henry Colomer, S.A. and Haugron Cientifical, S.A. In 1986, he was also appointed president of Revlon for Europe. In 1989, he became chairman of Revlon International and in 1990, he was appointed executive vice-president and chief operating officer of Revlon Inc. in New York. In 2000, he was appointed chairman and chief executive officer of The Colomer Group. Mr. Colomer is chairman of The Colomer Group. He is also chairman of Ahorro Bursátil, S.A. SICAV and Inversiones Mobiliarias Urquiola, S.A. SICAV. Mr. Colomer has a degree in economics from the University of Barcelona and an MBA from IESE Business School (
Instituto de Estudios Superiores de la Empresa
).
Mr. Peter Erskine
serves as a director of our Board of Directors. He began his career in the field of marketing and trade mark management in Polycell and in Colgate Palmolive. He worked for several years at the Mars Group, serving as vice-chairman for Europe of Mars Electronics. In 1990 he was appointed vice-president of Marketing and Sales of Unitel. From 1993 to 1998, he held a number of senior positions, including director of British Telecom (BT) Mobile and president and chief executive officer of Concert. In 1998 he became managing director of BT Cellnet. Subsequently, in 2001 he became chief executive officer and a director of the board of directors of Telefónica O2 Europe, Plc (now Telefónica Europe, Plc.). In 2006 he became executive chairman of Telefónica O2 Europe, Plc (until December 31, 2007 after which he became a non-executive Director) and from July 2006 until December 2007 he served as general manager of the business unit Telefónica Europe. In 2008, he joined the Telecom Advisory Boards of Apax Partners and MacQuarie European Infrastructure Fund, and become a member of the Strategy Advisory Committee of Henley Management Centre. In January 2009 he joined the Board of Ladbrokes Plc. as a non executive director, becoming chairman in May 2009. Currently, he is also member of the
advisory board of Henley Management Centre. In 1973, he received a degree in psychology from Liverpool University.
Mr. Alfonso Ferrari Herrero
serves as a director of our Board of Directors. From 1968 to 1969 he was assistant to the financial manager of Hidroeléctrica del Cantábrico, S.A. From 1969 to 1985, he worked in Banco Urquijo, S.A. holding several positions as analyst, manager of Industrial Investments and as a representative in several subsidiaries of Banco Urquijo, S.A. in his capacity as member of the board of directors. From 1985 to 1996 he was a member of the board of directors and manager of Corporate Finance of Beta Capital Sociedad de Valores, S.A., of which Mr. Ferrari was a co-founder. From 1996 until 2000 served as chairman and chief operating officer of Beta Capital, S.A. He has a doctorate in industrial engineering from the Industrial Engineers Technical School of the Polytechnic University of Madrid (
Escuela Técnica Superior de Ingenieros Industriales de la
Universidad Politécnica de Madrid
) and holds an MBA from Harvard University.
Mr. Luiz Fernando Furlán
serves as a director of our Board of Directors. Throughout his career he has been a member of the board of directors of several companies in Brazil and abroad such as Sadia, S.A., Embraco, S.A. (Brasmotor Group-Brazil) and Panamco (Pan American Beverages, Inc. – USA). He was also member of the consulting board of IBM in Latin America and of ABN Amro Bank in Brazil, as well as chairman of Brazilian Chicken Exporters Association (ABEF), Brazilian Association of Public Owned Companies (ABRASCA) and of Mercosur European Union Business Forum (MEBF). He also was vice-president of São Paulo Entrepreneurs Association (FIESP). From 2003 to 2007 he was Minister of Development, Industry and Foreign Trade of Brazil. Currently he is co-chairman of the board of directors of Brasil Foods, S.A. and of Amazonas Sustainability Foundation and member of the board of directors of Amil Participações S.A. and of AGCO Corporation, and member of the Advisory/Consultive Board of Panasonic (Japan) and McLarty & Associates (USA). He holds a degree in chemical engineering from the Industrial Engineering Faculty of São Paulo and in business administration from University of Santana (São Paulo), with specialization in financial administration from Fundação Getúlio Vargas (São Paulo).
Mr. Gonzalo Hinojosa Fernández de Angulo
serves as a director of our Board of Directors. He began his career in 1966 in Cortefiel, S.A. and served in several management positions since then. From 1976 to 1985 Mr. Hinojosa was general manager of Cortefiel, S.A. and from 1985 until 2005 he served as chief executive officer of the company, a post which he combined with his appointment as chairman from 1998 until 2006. From 1991 through 2002, he served as a director of Banco Central Hispano Americano, S.A. and as a director of Portland Valderribas, S.A. He has also served as a director of Altadis, S.A. and of Dinamia Capital Privado, S.A., SCR. Mr. Hinojosa has a degree in industrial engineering from the Industrial Engineers Technical School of the Polytechnic University of Madrid (
Escuela Técnica Superior de Ingenieros Industriales de la
Universidad Politécnica de Madrid
).
Mr. Pablo Isla Álvarez de Tejera
serves as a director of our Board of Directors. Mr. Isla began his career in 1989 as Government Attorney (
Abogado del Estado
), and he joined the Body of Government Attorneys that year, in the first position of the candidates, for the Spanish Ministry of Transportation, Tourism and Communications. In 1991 he moved to the General Management of the Legal Services of the Spanish Government (
Dirección General del Servicio Jurídico del Estado
). From 1992 to 1996, Mr. Isla served as general manager of the Legal Services Department of Banco Popular, S.A. In 1996, he was appointed general manager of the National Heritage Department of the Treasury Department of Spain (
Ministerio de Economía y Hacienda
). He also served as General Secretary of Banco Popular Español, S.A. from 1998 to 2000. In July 2000, Mr. Isla was appointed chairman of the board of Grupo Altadis and co-chairman of the company. Since June 2005, Mr. Isla is the deputy chairman and chief executive officer of Inditex, S.A. Mr. Isla has a degree in law from the Universidad Complutense of Madrid.
Mr. Antonio Massanell Lavilla
serves as a director of our Board of Directors. In 1971 he joined the Caja de Ahorros y Pensiones de Barcelona (“la Caixa”), where he held several posts and in 1990, he was appointed assistant manager and secretary of the Steering Committee. In the same year, he was appointed member of the board of directors of Sociedad Española de Medios de Pago, S.A. From 1992 to 1994, Mr. Massanell served as Chairman of the Steering Committee of Sistema 6000 de la
Confederación Española de Cajas de Ahorros
. Mr. Massanell is currently executive deputy general manager of la Caixa and a member of the boards of directors of e-la Caixa, S.A., Boursorama, S.A., Caixa Capital Risc, S.G.E.C.R., S.A., Mediterránea Beach & Golf Community, S.A. and Serveis Informátics “La Caixa,” S.A. He is also chairman of Port Aventura Entertainment, S.A. and Barcelona Digital
Centre Tecnológic (former Fundació Barcelona Digital). Mr. Antonio Massanell Lavilla holds a degree in economics from the University of Barcelona.
Mr. Francisco Javier De Paz Mancho
serves as a director of our Board of Directors. From 1990 to 1993, he was General Secretary of the Spanish Consumers Association (
Unión de Consumidores de España
, UCE). From 1993 to 1996, he served as general manager of Internal Trade of the Spanish Ministry of Tourism and Commerce. From 1994 to 1996, he was chairman of the
Observatory of Trading of the Spanish Ministry of Tourism and Commerce (
Observatorio de la Distribución Comercial del Ministerio de Comercio y Turismo)
; from 1996 to 2004, he was corporate strategy manager of the Panrico Donuts Group. From 1998 to 2004, he served as director of Mutua de Accidentes de Zaragoza (MAZ) and of the Panrico Group. From 2004 to 2006, he was director of Tunel de Cadí, S.A.C. and from 2003 to 2004, he served as chairman of the Patronal Pan y Bollería Marca (COE). From 2004 to 2007, he was chairman of the National Company MERCASA. He has also been a member of the board of directors of Altadis, S.A., and of the Economic and Social Board and its permanent commission. From July 2006, he has been a member of the Executive Committee of the Chambers Board (
Consejo Superior de Cámaras
). Mr. de Paz has a diploma in publicity and information and followed studies in law. He followed a
Programa de Alta Dirección de Empresas
from the IESE Business School (
Instituto de Estudios Superiores de la Empresa, University of Navarra
).
Executive Officers/Management Team
At April 29, 2011, our executive management team was composed of six general managers, in addition to our three executive officers who are also directors on our Board of Directors.
|
Name
|
Position
|
Appointed
|
Age
|
|||
|
Mr. César Alierta Izuel
|
Chairman of the Board of Directors and Chief Executive Officer
|
2000
|
65
|
|||
|
Mr. Julio Linares López
|
Chief Operating Officer
|
2007
|
65
|
|||
|
Mr. José María Álvarez –Pallete López
|
Chairman of Telefónica Latin America
|
2002
|
47
|
|||
|
Mr. Guillermo Ansaldo Lutz
|
Chairman of Telefónica Spain
|
2007
|
49
|
|||
|
Mr. Matthew Key
|
Chairman of Telefónica Europe
|
2007
|
48
|
|||
|
Mr. Santiago Fernández Valbuena
|
General Manager of Strategy, Finance and Development
|
2002
|
53
|
|||
|
Mr. Luis Abril Pérez
|
Technical General Secretary to the Chairman
|
2002
|
63
|
|||
|
Mr. Calixto Ríos Pérez
|
General Manager of Internal Audit
|
2002
|
66
|
|||
|
Mr. Ramiro Sánchez de Lerín García-Ovies
|
General Legal Secretary and Secretary to the Board
|
2003
|
56
|
Biographies of the Executive Officers and Senior Management
We present below the biographies of our executive officers and senior management who do not also serve on our Board of Directors.
Mr. Guillermo Ansaldo Lutz
serves as Chairman of Telefónica Spain since December 2007, and he is also member of the Executive Committee of Telefónica. From 1989 to 2000 he worked for McKinsey & Company holding different positions in Spain and Argentina. In 1995, he was appointed partner of McKinsey & Company in Argentina. From 2000 to 2004 he was the chief executive officer of Telefónica de Argentina, S.A. and since April 2005, he held the position of chief executive officer of Telefónica de España, S.A. He holds a degree in industrial engineering from the Universidad de Buenos Aires and an MBA from The Amos Tuck School of Business Administration, Dartmouth College.
Mr. Matthew Key
serves as Chairman of Telefónica Europe and is a member of the Executive Committee of Telefónica. From 1984 until 1998 he held various positions of responsibility in Arthur Young, the Grand Metropolitan Plc (1988), Coca Cola & Schweppes Beverages Ltd (1993-1995), Kingfisher Plc and finally, from 1998 to 2002, Vodafone Plc. From 2000 to 2002 he worked as non-executive director of Vodafone Egypt. He has served as chairman and non-executive director of Tesco Mobile since 2003. In February 2002, he was appointed chief financial officer of Telefónica O2 UK until December 2004. In January 2005, he was appointed chief executive officer of Telefónica O2 UK. He was appointed chairman and chief executive of Telefónica Europe in January 2008. He holds a “first class” honours degree in economics from Birmingham University.
Mr. Santiago Fernández Valbuena
serves as General Manager of Strategy, Finance and Development and is a member of the Executive Committee of Telefónica. He has served as our chief financial officer since July 2002.
He joined Telefónica Group in 1997 as chief executive officer of Fonditel, Telefónica’s pension assets manager. Previously, he was the managing director of Societé Génerale Equities, and also head of Equities & Research at Beta Capital in Madrid. Mr. Fernández Valbuena served as president of the Research Commission at the Spanish Institute of Financial Analysts. He has held senior teaching positions with the MBA programs of the Manchester Business School and Instituto de Empresa. He holds a degree in economics from the Universidad Complutense of Madrid and he also holds an M.S. and a PhD degree in economics and finance from Northeastern University in the United States.
Mr. Luis Abril Pérez
serves as our Technical General Secretary to the Chairman. Mr. Abril started his professional career as a microeconomics professor in the Universidad Comercial de Deusto, where he went on to head its Finance Department. In 1978, he moved to Banco de Vizcaya, S.A., as treasury director and then worked as head of the president’s technical department. During his work with the Banco Bilbao Vizcaya Group (1988 to 1991), he acted as general director for the Asset Management division. From 1994 to 1999, Mr. Abril acted as general director for Banco Español de Crédito, S.A. (Banesto), and he later acted as general director for communications for Banco Santander Central Hispano, S.A. (1999 to 2001). Mr. Abril holds a degree in economics and a law degree from the Universidad Comercial de Deusto and he also holds an MBA from the North European Management Institute, Oslo, Norway.
Mr. Calixto Ríos Pérez
serves as our General Manager of Internal Audit. In 1973, Mr. Ríos joined Banco Exterior de España, S.A. as the General Manager of Extebank in New York City. Subsequently he was appointed chief executive officer and chief operating officer of Extebandes in Venezuela. Later, Mr. Ríos returned to Madrid as the general manager of International Banking Subsidiaries of Banco Exterior de España, S.A. In 1990, he was appointed chief executive officer responsible for overseeing the construction, management and marketing of the Olympic Village for the Olympic games of Barcelona and a year later was appointed chief financial officer of Tabacalera, S.A. After the merger of Tabacalera with the French company, Seita, he was appointed advisor to the chairman and head of Strategy and Planning. In November 2000, he joined the Telefónica Group as general manager for Institutional Relations, and in July 2002 he was appointed general manager for Internal Auditing and Communications. He holds a degree in economics from the Universidad Complutense of Madrid.
Mr. Ramiro Sánchez de Lerín García-Ovies
serves as our General Secretary and Secretary to our Board of Directors. He is also a member of the Executive Committee He began his career in Arthur Andersen, first working for its audit department and later for its tax department. In 1982, he became a Government Attorney (
Abogado del Estado
) and started working for the local tax authorities in Madrid (
Delegación de Hacienda de Madrid
). Afterwards he was assigned to the State Secretariat for the European Communities and later to the Foreign Affairs Ministry. He has been general secretary and secretary of the Board of Elosúa, S.A., Tabacalera, S.A., Altadis, S.A. and Xfera Móviles, S.A. He has also held teaching positions in Instituto Católico de Administración y Dirección de Empresas (ICADE), Instituto de Empresa and Escuela de Hacienda Pública.
Directors
The compensation of our directors is governed by Article 28 of our bylaws, which states that the aggregate compensation amount that we may pay to all of our directors as remuneration and attendance fees shall be fixed by the shareholders at the general meeting of shareholders, and such amount shall remain unchanged until the shareholders decide to modify it. The Board of Directors shall determine the exact amounts to be paid within such limit and the distribution thereof among the directors. In this respect, on April 11, 2003, our shareholders set the maximum gross annual amount to be paid to the Board of Directors at €6 million. This includes fixed payments and fees for attending meetings of the Board of Directors’ advisory or control committees described above. In addition, the compensation provided for above is in addition to other professional or employment compensation accruing to the directors by reason of any executive or advisory duties that they perform for the Group, other than the supervision and collective decision-making duties inherent in their capacity as directors.
Therefore, the compensation paid to our directors in their capacity as members of the Board of Directors, the Executive Commission and/or any of the advisory and control committees consists of a fixed amount payable monthly plus fees for attending the meetings of the Board’s advisory or control committees. In this respect, it was
also agreed that executive directors would not receive the fixed amounts established for their directorships, but only receive corresponding amounts for discharging their executive duties as stipulated in their respective contracts.
The following table presents the fixed annual amounts paid to directors for membership in the Board of Directors, Executive Commission and any advisory or control committees.
|
Position
|
Board of Directors
|
Executive Commission
|
Advisory or Control Committees
|
|||
|
(in euros)
|
||||||
|
Chairman
|
300,000
|
100,000
|
28,000
|
|||
|
Vice Chairman
|
250,000
|
100,000
|
—
|
|||
|
Board member (
vocal
):
|
||||||
|
Executive
|
—
|
—
|
—
|
|||
|
Proprietary
|
150,000
|
100,000
|
14,000
|
|||
|
Independent
|
150,000
|
100,000
|
14,000
|
|||
|
Other external
|
150,000
|
100,000
|
14,000
|
|||
In addition, each director is paid a fee of €1,250 for attendance at each meeting of an advisory or control committee.
Total compensation paid to our directors for discharging their duties in 2010 amounted to €4,136,167 in fixed compensation and €321,250 in fees for attending advisory or control committee meetings. It should also be noted that the compensation paid to our directors for serving as members on the boards of directors of other Telefónica Group companies amounted to €1,780,898. In addition, the directors who are members of the regional advisory committees, including the Telefónica Corporate University Advisory Council, received additional aggregate compensation of €556,250 in 2010.
The following table presents the breakdown by item of the compensation and benefits paid to Telefónica directors for discharging their duties in 2010:
|
Board Members
|
Board of Directors
|
Executive Commission
|
Other Board
Committees
|
Total
|
||||||||||||||||
|
Fixed payment
|
Attendance fees
|
|||||||||||||||||||
|
(in euros)
|
||||||||||||||||||||
|
Chairman
|
||||||||||||||||||||
|
Mr. César Alierta Izuel
|
300,000 | 100,000 | — | — | 400,000 | |||||||||||||||
|
Vice chairmen
|
||||||||||||||||||||
|
Mr. Isidro Fainé Casas
|
250,000 | 100,000 | — | — | 350,000 | |||||||||||||||
|
Mr. Vitalino Manuel Nafría Aznar
|
250,000 | — | 56,000 | 26,250 | 332,250 | |||||||||||||||
|
Members
|
||||||||||||||||||||
|
Mr. Julio Linares López
|
— | — | — | — | — | |||||||||||||||
|
Mr. José María Abril Pérez
|
150,000 | 100,000 | 14,000 | 3,750 | 267,750 | |||||||||||||||
|
Mr. José Fernando de Almansa Moreno-Barreda
|
150,000 | — | 56,000 | 26,250 | 232,250 | |||||||||||||||
|
Mr. José María Álvarez-Pallete López
|
— | — | — | — | — | |||||||||||||||
|
Mr. David Arculus
|
150,000 | — | 28,000 | 11,250 | 189,250 | |||||||||||||||
|
Ms. Eva Castillo Sanz
|
150,000 | — | 42,000 | 23,750 | 215,750 | |||||||||||||||
|
Mr. Carlos Colomer Casellas
|
150,000 | 100,000 | 56,000 | 23,750 | 329,750 | |||||||||||||||
|
Mr. Peter Erskine
|
150,000 | 100,000 | 56,000 | 36,250 | 342,250 | |||||||||||||||
|
Mr. Alfonso Ferrari Herrero
|
150,000 | 100,000 | 106,167 | 48,750 | 404,917 | |||||||||||||||
|
Mr. Luiz Fernando Furlán
|
150,000 | — | 14,000 | 3,750 | 167,750 | |||||||||||||||
|
Mr. Gonzalo Hinojosa Fernández de Angulo
|
150,000 | 100,000 | 98,000 | 51,250 | 399,250 | |||||||||||||||
|
Mr. Pablo Isla Álvarez de Tejera
|
150,000 | — | 84,000 | 18,750 | 252,750 | |||||||||||||||
|
Mr. Antonio Massanell Lavilla
|
150,000 | — | 70,000 | 31,250 | 251,250 | |||||||||||||||
|
Mr. Francisco Javier de Paz Mancho
|
150,000 | 100,000 | 56,000 | 16,250 | 322,250 | |||||||||||||||
|
Total
|
2,600,000 | 800,000 | 736,167 | 321,250 | 4,457,417 | |||||||||||||||
In addition, the breakdown of the total paid to executive directors Mr. César Alierta Izuel, Mr. Julio Linares López and Mr. José María Álvarez-Pallete López for discharging their executive duties by item is as follows:
|
Item
|
2010
|
|||
|
(in euros)
|
||||
|
Salaries
|
6,356,975 | |||
|
Variable compensation
|
8,186,448 | |||
|
Compensation in kind(1)
|
117,290 | |||
|
Contributions to pension plans
|
25,444 | |||
|
(1)
|
“Compensation in kind” includes life and other insurance premiums (general medical and dental insurance).
|
In addition, under the Pension Plan for Senior Executives, we made total contributions in 2010 on behalf of executive directors of €1,925,387. The Pension Plan for Senior Executives is wholly funded by us. This plan envisages annual defined contributions equivalent to specific percentages of the relevant executives’ fixed remuneration, in accordance with their professional category, and extraordinary contributions in accordance with the circumstances of each such executive as detailed in the plan. See Note 21 to the Consolidated Financial Statements.
Our executive directors also receive compensation under the Performance Share Plan approved at the general shareholders’ meeting of June 21, 2006 and described in more detail below. The maximum number of shares corresponding to the third, fourth and fifth and final phase of the Performance Share Plan will be granted on July 1, 2011 and July 1, 2012 and July 1, 2013 respectively, to each of our executive directors if all the terms established for such delivery are met as follows: for Mr. César Alierta Izuel, 148,818 in the third phase, 173,716 in the fourth phase and 170,897 shares in the fifth phase; for Mr. Julio Linares López, 101,466 in the third phase, 130,287 in the fourth phase and 128,173 shares in the fifth phase; and for Mr. José María Álvarez-Pallete López, 67,644 in the third phase, 78,962 in the fourth phase and 77,680 shares in the fifth phase. With respect to the payout under the second phase of the Performance Share Plan in July 2010, the beneficiaries received, in accordance with the general terms and conditions of the Performance Share Plan, all the shares assigned to them as follows: to Mr. César Alierta Izuel, 116,239 shares; to Mr. Julio Linares López, 57,437 shares; and to Mr. José María Álvarez-Pallete López, 53,204 shares. This maximum payout was made because our total shareholder return, or TSR (as defined in the Performance Share Plan) exceeded that of the relevant comparison group. See Note 21 to the Consolidated Financial Statements.
Furthermore, at the June 23, 2009 General Shareholders’ Meeting of Telefónica, its shareholders approved the “Global Employee Share Plan,” a Telefónica share incentive plan for Group employees worldwide, including executives and executive directors of the company (see plan details provided in Note 20.c to the Consolidated Financial Statements). The three executive board members decided to participate in this plan, contributing the maximum: €100 a month, over 12 months. Therefore, as of the date of these consolidated financial statements, the three executive board members had acquired a total of 78 shares through this plan, whereby they are entitled to receive, free of charge, an equivalent number of shares providing that, among other conditions, they retain the acquired shares during the consolidation period (12 months from the end of the acquisition period).
It should be noted that the non-executive directors do not receive and did not receive in 2010 any compensation in the form of pensions or life insurance, nor do they participate in the share-based payment plans linked to our share price.
In addition, we do not grant and did not grant in 2010 any advances, loans or credits to the directors, or to our top executives, in accordance with the requirements of the Sarbanes-Oxley Act.
Executive Officers and Senior Management
In 2010, our six executive officers (excluding those that are also Directors) were paid a total compensation package of €10,830,531 in the aggregate.
Contributions made on behalf of these six executives under the Pension Plan for Senior Executives mentioned above amounted to an aggregate amount of €926,004 in 2010.
In addition, the maximum number of shares corresponding to the third and fourth phases of the Performance Share Plan, described below, to be delivered to these senior executives as a group, if all the established terms are met, is 306,115 shares for the third phase, 394,779 shares for the fourth phase and 350,485 shares for the fifth phase. Similarly, as explained above, these senior executives received a total of 251,681 shares in 2010 as a result of satisfaction of the TSR requirement for the second phase under the Performance Share Plan.
As of the date of the consolidated financial statements, the six directors forming part of the company’s senior management team had acquired a total of 152 shares under the Global Employee Share Plan.
Finally, executive officer contracts, including those of executive directors, generally include a severance clause entitling such executives to three years of salary plus another year based on the length of service with us. The annual salary on which the indemnity is based is the director’s last fixed salary and the average amount of the last two variable payments received by contract.
Incentive Plans
In each of 2008, 2009 and 2010, the Telefónica Group had the following incentive payment plans linked to the share price of Telefónica, S.A. in effect.
Telefónica, S.A. share plan: “Performance Share Plan”
At our general meeting of shareholders on June 21, 2006, our shareholders approved the introduction of a long-term incentive plan for managers and senior executives of Telefónica, S.A. and other Telefónica Group companies (the “Performance Share Plan”). Under the Performance Share Plan, selected participants who meet the qualifying requirements are given a certain number of our shares as a form of variable compensation.
The Performance Share Plan was initially intended to last seven years. It is divided into five phases, each three years long, beginning on July 1 (the “Start Date”) and ending on June 30 three years later (the “End Date”). At the start of each phase the number of shares to be awarded to Performance Share Plan beneficiaries is determined based on their success in meeting targets set. The shares are delivered, assuming targets are met, at the End Date of each phase. Each phase is independent from the others. The first started on July 1, 2006 (with shares delivered on July 1, 2009, as described above) and the fifth phase began on July 1, 2010 (with any shares earned delivered from July 1, 2013).
Award of the shares is subject to a number of conditions:
|
|
·
|
The beneficiary must continue to work for us throughout the three years of the phase, subject to certain special conditions related to departures.
|
|
|
·
|
The actual number of shares awarded at the end of each phase will depend on success in meeting targets and the maximum number of shares assigned to each executive. Success is measured by comparing Total Share Return (“TSR”), which includes both the share price and dividends on our shares, with the TSRs of a basket of listed telecommunications companies that comprise the comparison group. Each employee who is a member of the plan is assigned at the start of each phase a maximum number of shares. The actual number of shares awarded at the end of the phase is calculated by multiplying this maximum number by a percentage reflecting degree of success at the date in question. This will be 100% if the TSR of Telefónica is equal to or better than that of the third quartile of the comparison group and 30% if Telefónica’s TSR is in line with the average. The percentage rises on a linear basis for all points between these two benchmarks. If the TSR is below average no shares are awarded.
|
The first phase of the Performance Share Plan ended June 30, 2009, with the following maximum number of shares allocated:
|
Phase
|
Number of shares
|
Unit value (euros)
|
End date
|
|
1st phase July 1, 2006
|
6,530,615
|
6.43
|
June 30, 2009
|
As of the expiration of the first phase of the Performance Share Plan in July 2009, a total of 3,309,968 shares (corresponding to a total of 4,533,393 gross shares less a withholding of 1,224,610 shares prior to delivery, at the option of the employee) were delivered to our directors in connection with the first phase. The shares delivered were deducted from our treasury shares in 2009.
All the shares delivered under the first phase of the Performance Share Plan were hedged with a derivative instrument acquired in 2006. The cost of this instrument was €46 million, which in unit terms is €6.43 per share. At June 30, 2009, the bank with which the financial instrument was contracted delivered to us the shares contracted. These were initially accounted for as treasury shares.
The end of the second phase of the Performance Share Plan was on June 30, 2010, which included the following maximum number of shares allocated:
|
Phase
|
Number of shares
|
Unit value (euros)
|
End date
|
|||
|
2nd phase July 1, 2007
|
5,556,234
|
7.70
|
June 30, 2010
|
With the expiration of the second phase of the Performance Share Plan in July 2010 a total of 2,964,437 shares (corresponding to a total of 4,091,071 gross shares less a withholding of 1,132,804 shares prior to delivery, at the option of the employee) were delivered to our directors included in the second phase. The shares delivered were deducted from our treasury shares in 2010.
The maximum number of the shares issuable in each of the three outstanding phases at December 31, 2010 is as follows:
|
Phase
|
Number of shares
|
Unit value (euros)
|
End date
|
|||
|
3rd phase July 1, 2008
|
5,286,980
|
8.39
|
June 30, 2011
|
|||
|
4th phase July 1, 2009
|
6,356,597
|
8.41
|
June 30, 2012
|
|||
|
5th phase July 1, 2010
|
5,025,657
|
9.08
|
June 30, 2013
|
The Performance Share Plan is equity-settled via the delivery of shares to the participants. Accordingly, an expense of €38 million, €43 million and €42 million of employee benefits was recorded in 2008, 2009 and 2010, respectively, was made in equity.
To ensure that we had enough shares to meet our obligations at the end of the third phase initiated in 2008 (the third phase of the Performance Share Plan), we bought an instrument from a financial institution, the terms of which dictate that, at the end of the third phase, we will be delivered a total of 2,500,000 shares, a part of the shares necessary to settle the phase. This instrument is indexed to the success of the plan, i.e. an instrument that mirrors the features of the third phase of the Performance Share Plan. The cost of the financial instrument was €25 million, equivalent to €9.96 per option. See Note 16 to our Consolidated Financial Statements.
For the fourth phase of the Performance Share Plan, we have acquired an instrument from a financial institution with the same features of the fourth phase of the Performance Share Plan, whereby at the end of the phase, we may obtain part of the shares necessary to settle the phase (4,000,000 shares). The cost of the financial instrument was €34 million, equivalent to €8.41 per share. See Note 16 to our Consolidated Financial Statements.
Telefónica, S.A. share option plan targeted at Telefónica Europe employees: “Performance Cash Plan”
In addition to the Performance Share Plan, another plan called the “Performance Cash Plan,” operating under the same conditions as the Performance Share Plan is targeted at employees of Telefónica Europe. This plan entails delivery to Telefónica Europe executives of a specific number of theoretical options in Telefónica, S.A., which are cash-settled at the end of each phase via a payment equivalent to the market value of the shares on settlement date up to a maximum of three times the value of the theoretical options, established for each phase, of the shares at the delivery date.
The value of the theoretical options is established as the average share price in the 30 days immediately prior to the start of each phase, except for the first phase, where the average share price during the 30 days immediately prior to May 11, 2006 (€12.83) was taken as the reference.
The estimated duration of this plan is also seven years, with five phases, each of three years, commencing on July 1 of each year, starting in 2006.
Like the Performance Share Plan, the performance rate for setting payments is measured based on the TSR of Telefónica shares with respect to the comparison group’s TSRs. Payments will be made in line with the following criteria:
|
|
·
|
Below average
|
0%
|
|
|
·
|
Average
|
30%
|
|
·
|
Equal to or higher than the third quartile
|
100%
|
The aggregate number of options assigned to the three phases outstanding at December 31, 2010 was 364,601 (412,869 at December 31, 2009).
The fair value at December 31, 2010 of the options delivered in each phase in force at that time was €16.97 per option. This value is calculated by taking our share price and including the estimated TSR and is updated at each year end.
Telefónica, S.A. global share plan: “Global Employee Share Plan”
On June 23, 2009 our general shareholders’ meeting, our shareholders approved the introduction of a Telefónica, S.A. share incentive plan for all employees of the Telefónica Group worldwide, with certain exceptions (the “Global Employee Share Plan”). Under this Global Employee Share Plan, participants who meet the qualifying requirements are offered the opportunity to acquire Telefónica, S.A. shares, pursuant to which Telefónica assumes the obligation to give participants a certain number of Telefónica, S.A. shares free of charge.
The initial duration of the Global Employee Share Plan is intended to last two years. Employees subscribed to the Global Employee Share Plan can acquire Telefónica, S.A. shares through monthly installments of up to €100 (or the local currency equivalent), up to a maximum of €1,200 over a twelve-month period (the acquisition period). The delivery of shares will occur, where applicable, when the Global Employee Share Plan is consolidated, as of September 1, 2012, subject to a number of conditions:
|
|
·
|
The beneficiary must continue to work for the company throughout the two-year duration of the plan (the consolidation period), subject to certain special conditions related to departures.
|
|
|
·
|
The actual number of shares to be delivered at the end of the consolidation period will depend on the number of shares acquired and retained by each employee. Each employee who is a member of the plan, has remained a Group employee, and has retained the shares acquired for an additional twelve-month period after the acquisition date, will be entitled to receive one free share per share acquired and retained until the end of the consolidation period.
|
The acquisition period began in August 2010, and at December 31, 2010, 41,152 employees had participate in the plan. This plan will be settled via the delivery of shares to employees and accordingly, the offsetting entry to the related personnel expenses of €11 million recognized in 2010 was recorded in equity.
Please see “—Directors and Senior Management” above.
Employees and Labor Relations
The table below sets forth the average number of employees at the dates indicated for the Telefónica Group during 2008, 2009 and 2010 and each of the consolidated companies of the Group which comprise our different lines of business and other consolidated subsidiaries.
|
2008
|
2009
|
2010
|
||||||||||||||||||||||
|
Average
|
Year-end
|
Average
|
Year-end
|
Average
|
Year-end
|
|||||||||||||||||||
|
Telefónica Spain
|
35,708 | 35,562 | 35,318 | 35,338 | 35,313 | 35,379 | ||||||||||||||||||
|
Telefónica Latin America
|
49,990 | 49,849 | 50,709 | 51,606 | 55,164 | 60,909 | ||||||||||||||||||
|
Telefónica Europe
|
28,828 | 28,888 | 28,249 | 27,023 | 26,517 | 25,968 | ||||||||||||||||||
|
Subsidiaries and other companies
|
137,249 | 142,736 | 140,875 | 143,459 | 152,053 | 162,850 | ||||||||||||||||||
|
Total
|
251,775 | 257,035 | 255,151 | 257,426 | 269,047 | 285,106 | ||||||||||||||||||
The number of employees shown in the table above corresponds to the consolidated companies. It is also worth highlighting the large number of employees at the various companies of the Atento Group performing contact center activities included in the total numbers above, with an average of 141,036 in 2010 and 129,885 at December 31, 2009.
Of our total employees at December 31, 2010, approximately 51.5% were women (51.8% at December 31, 2009).
Employee Benefits
We have a pension plan for our employees in Spain. Our contribution corresponds to 4.51% of an employee’s fixed salary (for those employees who joined Telefónica de España S.A.U. before June 30, 1992 the amount is 6.87%). The obligatory minimum employee contribution is 2.21%. This plan is fully funded.
As of December 31, 2010, 51,572 of our employees were members of the pension plan managed by our subsidiary Fonditel Entidad Gestora de Fondos y Pensiones, S.A. (52,912 employees as of December 31, 2009 and 54,819 at December 31, 2008). The total amount contributed in 2010 by the different Telefónica Group companies was €99 million (€97 million and €98 million in 2009 and 2008 respectively).
In addition, in 2006, we approved a Management Benefits Plan (Retirement Plan) for senior executives, wholly funded by us, which complements the current pension plan. This Management Benefits Plan envisages annual defined contributions by Telefónica equivalent to specific percentages of the executives’ fixed remuneration, in accordance with such executive’s professional category, and extraordinary contributions in accordance with the circumstances of each executive, payable in line with the conditions of this plan.
No provision was made for this Management Benefits Plan by us, as its operation has been fully outsourced to an investment fund that is responsible for its operation.
At April 29, 2011, the following members of our Board of Directors beneficially owned directly or indirectly an aggregate of 6,757,174 shares, representing approximately 0.1480% of our capital stock.
|
Name
|
Percentage of Shares Beneficially Owned
|
|
|
Mr. César Alierta Izuel
|
0.0912%
|
|
|
Mr. Isidro Fainé Casas
|
0.0096%
|
|
|
Mr. Vitalino Manuel Nafría Aznar
|
0.0007%
|
|
|
Mr. Julio Linares López
|
0.0068%
|
|
|
Mr. José María Abril Pérez
|
0.0033%
|
|
|
Mr. José Fernando de Almansa Moreno-Barreda
|
0.0004%
|
|
Name
|
Percentage of Shares Beneficially Owned
|
|
|
Mr. Jose María Álvarez-Pallete López
|
0.0055%
|
|
|
Mr. David Arculus
|
0.0002%
|
|
|
Ms. Eva Castillo Sanz
|
0.0018%
|
|
|
Mr. Carlos Colomer Casellas(1)
|
0.0014%
|
|
|
Mr. Peter Erskine
|
0.0015%
|
|
|
Mr. Alfonso Ferrari Herrero
|
0.0129%
|
|
|
Mr. Luiz Fernando Furlán
|
0.0001%
|
|
|
Mr. Gonzalo Hinojosa Fernández de Angulo
|
0.0114%
|
|
|
Mr. Pablo Isla Alvarez de Tejera
|
0.0002%
|
|
|
Mr. Antonio Massanell Lavilla
|
0.0001%
|
|
|
Mr. Francisco Javier de Paz Mancho
|
0.0009%
|
|
(1)
|
On November 22, 2010, Mr. Carlos Colomer Casellas reported to the Securities Markets Commission (CNMV) the sale of 49,053 puts over Telefónica, S.A. shares, with an exercise price of 16.5€ (30,303 puts) and 16€ (18,750 puts) . These puts must be exercised on or before June 30, 2011 and settled in cash.
|
At April 29, 2011, members of our executive management team (excluding members of our Board of Directors listed above) beneficially owned an aggregate of 1,020,288 of our shares, representing approximately 0.0223% of our capital stock.
None of our directors or executive officers beneficially owned shares representing one percent or more of our share capital at April 28, 2011.
None of our directors and executive officers held options in respect of shares representing one percent or more of our share capital at April 28, 2011.
General
At April 29, 2011, we had 4,563,996,485 shares outstanding, each having a nominal value of €1.00 per share. All outstanding shares have the same rights.
At April 29, 2011, according to information provided to us or to the Spanish National Securities Commission, the CNMV, beneficial owners of 3% or more of our voting stock were as follows:
|
Name of Beneficial Owner
|
Number of Shares
|
Percent
|
||
|
Banco Bilbao Vizcaya Argentaria, S.A.(1)
|
286,574,224
|
6.28%
|
||
|
Caja de Ahorros y Pensiones de Barcelona (“la Caixa”)(2)
|
230,469,182
|
5.05%
|
||
|
Blackrock, Inc.(3)
|
177,257,649
|
3.88%
|
|
|
(1)
|
Based on the information provided by Banco Bilbao Vizcaya Argentaria, S.A.’s 2010 as at December 31, 2010 for the 2010 Annual Report on Corporate Governance.
|
|
|
(2)
|
Based on information provided by Caja de Ahorros y Pensiones de Barcelona, “la Caixa” as at December 31, 2010 for the 2010 Annual Report on Corporate Governance. The 5.03% indirect shareholding in Telefónica is owned by Criteria CaixaCorp, S.A.
|
|
(3)
|
According to notification sent to the Spanish National Securities Commission, the CNMV, dated February 4, 2010.
|
To the extent that our shares are represented by account in the book-entry form, we do not keep a shareholder registry and our ownership structure cannot be known precisely. Based on the information available to us there is no individual or corporation that directly or indirectly through one or more intermediaries may exercise any type of control over us. Nevertheless, we have certain shareholders whose holdings are considered material.
At December 31, 2010 approximately 163,944,981 of our shares were held in the form of ADSs by 880 holders of record, including Cede & Co., the nominee of the Depository Trust Company. The number of ADSs outstanding was 54,648,327 at December 31, 2010 (163,944,981 taking into account the ADS-to-Share ratio effective January 21, 2011).
Ownership Limitations
There are no limitations with respect to the ownership of our assets or share capital except those related to assets derived from the application of the reciprocity principle. Article 6 of the General Telecommunications Law, or the GTL, provides for the application of the reciprocity principle under existing international treaties or agreements signed and ratified by Spain. The Spanish government, upon request, may authorize exceptions to the reciprocity principle contained in the GTL.
During 2010 and through the date of this Annual Report, none of our directors and no member of our management team have been involved in any related party transactions with us.
Our Board of Directors’ Regulations grant the Board of Directors the exclusive power to authorize any transactions with major shareholders or with our directors. Prior to authorizing any such transaction, our Board will receive an opinion from the Nominating, Compensation and Corporate Governance Committee addressing the fairness of the transaction to our shareholders and us. Any of our directors that may have an interest in the proposed transaction must abstain from voting on the proposed transaction.
Two of our major shareholders are financial institutions. We have entered into related party transactions with both companies within our ordinary course of business, and always on arm’s length terms. During 2010, the executed transactions were generally loans, capital markets or derivative transactions provided to us by these financial institutions and agreements for us to provide telecommunications and broadband services to such institutions.
Related Party Transactions with Significant Shareholders
The main transactions between Telefónica Group companies and our significant shareholders were the following:
Banco Bilbao Vizcaya Argentaria, S.A. and subsidiaries comprising its consolidated group “BBVA”:
|
|
·
|
Financing transactions arranged under market conditions, with approximately €682 million drawn down at December 31, 2010 (€531 million at December 31, 2009).
|
|
|
·
|
Time deposits under market conditions amounting to €260 million at December 31, 2010 (€878 million at December 31, 2009).
|
|
|
·
|
Derivative transactions arranged at market conditions, for a total nominal amount of approximately €11,197 million at December 31, 2010 (€7,824 million at December 31, 2009).
|
|
|
·
|
Guarantees granted by BBVA under market conditions for approximately €922 million at December 31, 2010 (€237 million at December 31, 2009).
|
|
|
·
|
Dividends and other benefits paid to BBVA in 2010 for €439 million (€287 million in 2009).
|
|
|
·
|
Services, mainly telecommunications and telemarketing, rendered by Telefónica Group companies to the BBVA Group, under market conditions.
|
Caja de Ahorros y Pensiones de Barcelona, “la Caixa,” and subsidiaries comprising the consolidated group:
|
|
·
|
Financing transactions arranged under market conditions, with approximately €305 million drawn down at December 31, 2010 (€643 million at December 31, 2009).
|
|
|
·
|
Time deposits under market conditions amounting to €118 million at December 31, 2010 (€1,293 million at December 31, 2009).
|
|
|
·
|
Derivative transactions entered into under market conditions, for a total nominal amount of approximately €800 million in 2010 (€800 million in 2009).
|
|
|
·
|
Dividends and other benefits paid to La Caixa in 2010 for €298 million (€260 million in 2009).
|
|
|
·
|
Guarantees granted by La Caixa under market conditions for approximately €47 million at December 31, 2010 (€17 million at December 31, 2009).
|
|
|
·
|
The telecommunications services rendered by Telefónica Group companies to La Caixa group companies, under market conditions.
|
Intra-Group Loans
We are the parent company of the Telefónica Group and operate through our subsidiaries and affiliated companies. We coordinate group policies, including financial policy and, in some cases, actual financial management is conducted by us. Most of the transactions we perform with other members of the Telefónica Group relate to financing transactions, including covering their needs for funds and providing interest rate and exchange rate hedges.
At December 31, 2010, as recorded in our parent company accounts, we loaned a total of €5,424 million (€5,975 million at December 31, 2009) to companies of the Telefónica Group while companies of the Telefónica Group and their associates loaned us a total of €50,320 million (€45,280 million at December 31, 2009), of which €10,063 million (€10,767 million at December 31, 2009) was loaned to us by Telefónica Europe, B.V. and €29,424 million (€24,532 million at December 31, 2009) was loaned to us by Telefónica Emisiones S.A.U., our financing subsidiaries devoted to raising funds in the capital markets, and €9,011 million (€8,915 million at December 31, 2009) was loaned to us by Telefónica Finanzas, S.A.U., our subsidiary in charge of financial support for Telefónica Group companies.
With respect to the balances with associated companies, the line item “Non-current financial assets” on the consolidated statement of financial position at December 31, 2010, includes “Loans to Associates” amounting €647 million (€18 million at December 31, 2009).
Not applicable.
Consolidated Financial Statements
Please see Item 18.
Legal Proceedings
Telefónica and its group companies are party to several legal proceedings which are currently in progress in the courts of law and the arbitration bodies of the various countries in which we are present.
Based on the advice of our legal counsel it is reasonable to assume that these legal proceedings will not materially affect our financial position or solvency, regardless of the outcome. We highlight the following unresolved legal proceedings or those underway in 2010:
Contentious proceeding in connection with the merger between Terra Networks, S.A. and Telefónica, S.A.
On September 26, 2006, Telefónica was notified of the claim filed by former shareholders of Terra Networks, S.A. (Campoaguas, S.L., Panabeni, S.L. and others) alleging breach of contract in respect of the terms and
conditions set forth in the prospectus of the initial public offering of shares of Terra Networks, S.A. dated October 29, 1999. This claim was rejected by a ruling issued on September 21, 2009, and the appellants ordered to pay court costs. This ruling was appealed in June, 2010. Telefónica objected to the appeal on January 5, 2011.
Appeal for judicial review of the Spanish Competition Court (TDC) ruling of April 1, 2004
On April 1, 2004, the TDC ruled that Telefónica de España had engaged in unfair trade practices prohibited under Article 6 of Antitrust Law 16/1989, dated July 17, and Article 82 of the EC Treaty, consisting in the abuse of a dominant market position, by conditioning the provision of certain services to the non-existence of predialing arrangements with rival operators and running disloyal advertising campaigns. It imposed a fine of €57 million.
Telefónica de España filed an appeal for judicial review of this decision. On January 31, 2007, the National Appellate Court ruled in favor of the appeal, thereby overturning the TDC’s ruling. The State attorney filed an appeal before the Supreme Court on January 15, 2008, which Telefónica contested in July 2008.
On April 20, 2010, the Supreme Court issued a ruling upholding the decision of the National Appellate Court, overturning the TDC ruling that levied a €57 million fine on Telefónica de España, S.A.U.
Cancellation of the UMTS license granted to Quam GMBH in Germany
In December 2004, the Germany Telecommunications Market Regulator revoked the UMTS license granted in 2000 to Quam GmbH, in which Telefónica has a stake. After obtaining a suspension of the revocation order, on January 16, 2006, Quam GmbH filed a suit against the order with the German courts. This claim sought to overturn the revocation order and, if this failed, to be reimbursed for the total or partial payment of the original amount paid for the license.
This claim was rejected by the Cologne Administrative Court. Quam GmbH has appealed the decision before the Supreme Administrative Court of North Rhine-Westphalia, which also rejected its appeal.
Quam GmbH filed a new appeal before the Federal Supreme court for Administrative Cases
, which court has now allowed Quam to proceed.
Legal grounds for that appeal were submitted by Quam in September 2010.
Appeal against the European Commission ruling of July 4, 2007 against Telefónica de España’s broadband pricing policy
On February 22, 2006, we were sent a statement of objections, initiating disciplinary proceedings for conduct that goes against Article 82 of EC Treaty rules. Subsequently, on July 9, 2007, the European Commission issued a decision, imposing a fine of €152 million on us and Telefónica de España. The ruling charged us with applying a margin squeeze between the prices we charged competitors to provide regional and national wholesale broadband services and our retail broadband prices using ADSL technology from September 2001 to December 2006.
On September 10, 2007, we and Telefónica de España both filed appeals to overturn the decision before the Court of First Instance of the European Community. The Kingdom of Spain also lodged an appeal to overturn the decision. Meanwhile, France Telecom and the Spanish Association of Bank Users (AUSBANC) filed requests to intervene, to which we have submitted our comments.
The ECTA (European Competitive Telecommunications Association) has submitted an application dated November 4, 2010 to intervene in the ruling supporting the EU’s conclusions. Telefónica objected the intervention of ECTA on December 7, 2010.
Appeal against the decision by Agencia Nacional de Telecomunicações (ANATEL) regarding the inclusion of interconnection and network usage revenues in the Fundo de Universalização de Serviços de Telecomunicações (FUST).
Brasilcel (Vivo) Group operators, together with other Brazilian wireless operators, appealed ANATEL’s decision of December 16, 2005, to include interconnection and network usage revenues and expenses in the calculation of the amounts payable into the Fund for Universal Access to Telecommunications Services (
Fundo de
Universalização de Serviços de Telecomunicações
, or FUST for its initials in Portuguese), a fund to pay for the obligations to provide universal service, with retroactive application from 2000. On March 13, 2006, the Brasilia Federal Regional Court granted the injunction requested by the appellants, preventing ANATEL’s decision from being applied. On March 6, 2007, a ruling in favor of the mobile operators was issued, stating that it was not appropriate to include the revenues received from other operators in the taxable income for the FUST calculation and rejecting the retroactive application of ANATEL’s decision. ANATEL filed an appeal to overturn this decision with the Brasilia Regional Federal Court no.1. This appeal is pending resolution.
At the same time, Telesp and Telefónica Empresas, S.A., together with other fixed line operators through ABRAFIX (
Associação Brasileira de Concessionárias de Serviço Telefonico Fixo Comutado
) appealed ANATEL’s decision of December 16, 2005, also obtaining injunctions. On June 21, 2007, Federal Regional Court No. 1 ruled that it was not appropriate to include the interconnection and network usage revenues and expense in FUST taxable income and rejected the retroactive application of ANATEL’s decision. ANATEL filed an appeal to overturn this ruling on April 29, 2008 before Brasilia Federal Regional Court No. 1. This appeal is pending resolution.
Public civil procedure by the São Paulo government against Telesp for alleged repeated malfunctioning in the services provided by Telesp requesting compensation for damages to the customers affected.
In February 3, 2009, the Public Ministry of the State of São Paulo initiated proceedings against Telesp for alleged repeated malfunctioning in the telecommunication services provided by Telesp. The proceedings sought compensation for damages to the customers affected. A general claim was filed by the Public Ministry of the State of São Paulo suggesting an indemnification of 1,000 million Brazilian reais, calculated on the company’s revenue base over the last five years. Telesp’s potential responsibility will only be known in the calculation and enforcement of the award by affected consumers.
This proceeding was suspended via resolution dated November 5, 2009, for a period of 90 days, to assess the proposed agreement being negotiated between the parties. As no agreement was reached, the suspension was lifted and the procedure remains in the courts. A judgment was issued on April 20, 2010, imposing payment of damages suffered by all consumers who proved to be eligible for the award. Telesp filed an appeal on May 5, 2010. The judgment was stayed pending appeal. It is not currently possible to evaluate the amount involved in this lawsuit.
Tax proceedings
For information on legal proceedings related to tax matters, see Note 17 to our Consolidated Financial Statements.
Dividend information and shareholders’ return
Dividend background
The table below sets forth the annual cash dividends declared per share and the year to which such dividends correspond. Generally, the dividend for a given year is paid in two tranches, one in the second-half of the relevant year and the other during the first half of the following year.
|
Year ended December 31,
|
Cash dividends per share
|
|
|
(euro)
|
||
|
2010 (1)
|
1.40
|
|
|
2009
|
1.15
|
|
|
2008
|
1.00
|
|
|
2007
|
0.75
|
|
|
2006
|
0.60
|
|
(1)
|
A cash dividend of €0.65 per share was paid on November 8, 2010, charged against unrestricted reserves. In addition, our Board of Directors has approved the distribution of an interim dividend from 2011 net income, of a gross amount of €0.75 per share, which is to be paid on May 6, 2011.
With this dividend, we have completed our commitment to distribute a dividend of €1.40 per share.
|
Our Board of Directors will submit for approval at our Annual General Shareholders Meeting to be held in May 2011 the distribution of a dividend with a charge to unrestricted reserves and to be paid in the second half of 2011, of a gross amount of €0.77 per share.
Additionally, at our Eighth Investors’ Conference held on April 13 and 14, 2011, we confirmed our target for dividend distributions until 2012 in accordance with terms previously announced (a dividend increase up to €1.60 per share for 2011, and up to a minimum of €1.75 per share for 2012). We also announced a minimum annual shareholder remuneration target of €1.75 per share beyond 2012. The form of such remuneration (dividend, share buy-back or a combination of both) will be determined by us considering various circumstances and investors’ preferences at that time.
Payments of any future dividends will be dependent on our results of operations, liquidity and capital resources and market conditions at the time, all of which may be influenced by a variety of factors. See “Cautionary Statement Regarding Forward-Looking Statements.”
Treasury shares and share buyback program
We held the following Telefónica, S.A. shares as treasury shares at the dates indicated:
|
Number of shares
|
Acquisition price
(euro per share)
|
Trading
price(1)
(euro per share)
|
Market value(2)
(in millions of euros)
|
Percentage of
our capital stock(3)
|
||||||||||||||||
|
Treasury shares at December 31, 2010
|
55,204,942 | 17.01 | 16.97 | 937 | 1.20957 | % | ||||||||||||||
|
Treasury shares at December 31, 2009
|
6,329,530 | 16.81 | 19.52 | 124 | 0.13868 | % | ||||||||||||||
|
Treasury shares at December 31, 2008
|
125,561,011 | 16.68 | 15.85 | 1,990 | 2.66867 | % | ||||||||||||||
|
(1)
|
Closing price of our shares on the Automated Quotation System of the Spanish stock exchange at the indicated dates.
|
|
(2)
|
Market value is calculated as trading price times number of shares held on treasury at the indicated dates.
|
|
(3)
|
Calculated using capital stock at each date.
|
These treasury shares are directly owned by Telefónica, S.A., except for 16,896 shares held by Telefónica Móviles Argentina, S.A.
The following transactions involving treasury shares were carried out in 2009 and 2010:
|
Number of shares
|
||||
|
Treasury shares at December 31, 2010
|
55,204,942 | |||
|
Acquisitions
|
52,650,000 | |||
|
Performance Share Plan
|
(2,964,437 | ) | ||
|
Disposals
|
(810,151 | ) | ||
|
Treasury shares at December 31, 2009
|
6,329,530 | |||
|
Acquisitions
|
65,809,222 | |||
|
Share exchange of Telefónica, S.A. shares for China Unicom shares
|
(40,730,735 | ) | ||
|
Performance Share Plan
|
(3,309,968 | ) | ||
|
Share cancellation
|
(141,000,000 | ) | ||
|
Treasury shares at December 31, 2008
|
125,561,011 | |||
The amount paid to acquire Telefónica, S.A. shares in 2010 was €897 million (€1,005 million in 2009).
At December 31, 2010, we held call options on 160 million Telefónica, S.A. shares. At December 31, 2009, we held call options on 150 million Telefónica, S.A. shares.
General
Our ordinary shares, nominal value €1.00 each, are currently listed on each of the Madrid, Barcelona, Bilbao and Valencia stock exchanges and are quoted through the Automated Quotation System under the symbol “TEF.” They are also listed on various foreign exchanges such as the London, Buenos Aires and Tokyo stock exchanges. Our BDRs are listed on the São Paulo Stock Exchange. Our ADSs are listed on the New York Stock Exchange and the Lima Stock Exchange.
The table below sets forth, for the periods indicated, the reported high and low quoted closing prices, as adjusted for all stock splits, for our shares on the Madrid Stock Exchange, which is the principal Spanish market for our shares, and our ADSs on the New York Stock Exchange:
|
Per Share
(in euros)
|
Per ADS
(in dollars)(1)
|
|||||||||||||||
|
High
|
Low
|
High
|
Low
|
|||||||||||||
|
Year ended December 31, 2006
|
16.400 | 11.920 | 21.64 | 14.78 | ||||||||||||
|
Year ended December 31, 2007
|
23.260 | 15.200 | 34.37 | 20.15 | ||||||||||||
|
Year ended December 31, 2008
|
22.780 | 12.730 | 33.97 | 15.88 | ||||||||||||
|
Year ended December 31, 2009
|
19.750 | 13.690 | 29.69 | 17.24 | ||||||||||||
|
Year ended December 31, 2010
|
19.820 | 14.875 | 28.55 | 17.81 | ||||||||||||
|
Quarter ended March 31, 2009
|
16.420 | 13.690 | 22.70 | 17.24 | ||||||||||||
|
Quarter ended June 30, 2009
|
16.250 | 14.410 | 22.89 | 18.76 | ||||||||||||
|
Quarter ended September 30, 2009
|
19.060 | 15.605 | 28.01 | 21.79 | ||||||||||||
|
Quarter ended December 31, 2009
|
19.750 | 18.480 | 29.69 | 26.88 | ||||||||||||
|
Quarter ended March 31, 2010
|
19.820 | 16.440 | 28.55 | 22.53 | ||||||||||||
|
Quarter ended June 30, 2010
|
18.090 | 14.875 | 24.72 | 17.81 | ||||||||||||
|
Quarter ended September 30, 2010
|
18.410 | 15.090 | 24.91 | 19.05 | ||||||||||||
|
Quarter ended December 31, 2010
|
19.595 | 16.390 | 27.56 | 21.33 | ||||||||||||
|
Quarter ended March 31, 2011
|
18.655 | 16.580 | 25.74 | 21.61 | ||||||||||||
|
Month ended September 30, 2010
|
18.410 | 17.820 | 24.91 | 22.57 | ||||||||||||
|
Month ended October 31, 2010
|
19.470 | 18.045 | 27.35 | 24.74 | ||||||||||||
|
Month ended November 30, 2010
|
19.595 | 16.390 | 27.56 | 21.33 | ||||||||||||
|
Month ended December 31, 2010
|
17.425 | 16.950 | 23.25 | 22.43 | ||||||||||||
|
Month ended January 31, 2011
|
18.550 | 16.580 | 25.48 | 21.61 | ||||||||||||
|
Month ended February 28, 2011
|
18.655 | 17.870 | 25.74 | 24.47 | ||||||||||||
|
Month ended March 31, 2011
|
18.400 | 16.930 | 25.40 | 23.35 | ||||||||||||
|
Month ended April 31, 2011 (through April 26, 2011)
|
18.230 | 17.490 | 26.36 | 25.06 | ||||||||||||
Source: Madrid Stock Exchange Information and Bloomberg.
|
(1)
|
The closing prices prior to January 21, 2011 reflect the adjustment for the ratio change.
|
During 2010, each ADS represented the right to receive three ordinary shares. As of January 21, 2011, the ADS-to-Share Ratio was changed, so that each ADS now represents the right to receive one ordinary share.
On April 26, 2011, the closing price of our shares on the Automated Quotation System of the Spanish stock exchanges was €17.720 per share, equal to $25.774 at the Noon Buying Rate on April 22, 2011 for cable transfers in euro as certified for customs purposes by the Federal Reserve Bank of New York on that date.
Our ADSs are listed on the New York Stock Exchange under the symbol “TEF.” Citibank, N.A. is the Depositary issuing ADSs in form of certificated ADSs (American Depositary Receipts, or ADRs) or uncertificated ADSs pursuant to the deposit agreement dated as of November 13, 1996, as amended as of December 3, 1999 and as further amended as of June 23, 2000 and as of March 9, 2007 among Telefónica, the Depositary and the holders from time to time of ADSs (the “Deposit Agreement”).
At December 31, 2010, approximately 163,944,981 of our shares were held in the form of ADSs by 880 holders of record, including Cede & Co., the nominee of The Depository Trust Company. The number of ADSs outstanding was 54,648,327 at December 31, 2010 (163,944,981 taking into account the ADS-to-Share ratio effective January 21, 2011).
Spanish Securities Market Legislation
The Spanish Securities Markets Act (
Ley del Mercado de Valores
, or the LMV), enacted in 1988 and further amended, regulates the primary and secondary securities markets in Spain by establishing principles for their organization and operation, rules governing the activities of persons and institutions operating in these markets and a system for their supervision. This legislation and the regulation implementing it (mainly, as far as private issuers are concerned, of November 4, in relation to the issuance of securities and its admission to listing in official secondary markets, and Royal Decree 1362/2007, of October 19, concerning the transparency requirements in relation to information about issuers whose securities are admitted to trading on a regulated market):
|
|
·
|
establishes an independent regulatory authority, the CNMV, to supervise the securities markets;
|
|
|
·
|
establishes the rules for surveillance, supervision and sanction provided for the representation of transferable securities by book entries or by certificate;
|
|
|
·
|
establishes a framework for the issuance of securities;
|
|
|
·
|
establishes a framework for trading activities;
|
|
|
·
|
establishes the disclosure obligations of issuers, particularly the obligation to file annual audited financial statements and to make public quarterly financial information;
|
|
|
·
|
establishes the framework for tender offers;
|
|
|
·
|
establishes the code of conduct for all market participants; and
|
|
|
·
|
regulates market abuse infringements.
|
On March 11, 2005 Royal Decree Law 5/2005 was approved, modifying the LMV in order to implement the Directive 2003/71/EC of the European Parliament and of the Council on the prospectus to be published when securities are offered to the public or admitted to trading. The Directive: (i) harmonizes the requirements for the process of approval of the prospectuses in order to grant to the issuer a single passport for such document, valid throughout the European Union; (ii) incorporates the application of the country of origin principle by which the prospectus will be approved by the Member States of the European Union where the issuer has its registered office but it also introduces as a new matter the possibility that in certain circumstances, such as issues with high minimum denominations (€1,000 or more), the issuer may designate the relevant European Union competent authority for prospectus approval.
Subsequently, Royal Decree 1310/2005 partially developed the LMV in relation to the admission to trading of securities in the official secondary markets, the sales or subscription public offers and the prospectus required to those effects.
Royal Decree 1333/2005 developed the LMV in relation to market abuse, implementing Directive 2003/6/EC of the European Parliament and of the Council, relating insider dealing and market manipulation practices (“market abuse”).
On April 12, 2007 Law 6/2007 was approved, modifying the LMV in order to implement the Directive 2004/25/EC of the European Parliament and of the Council relating to public tender offers and the Directive 2004/109/EC relating to the transparency of issuers. Law 6/2007 intends: (i) to encourage an efficient market for corporate control, while protecting the rights of minority shareholders of listed companies and (ii) to enforce transparency in financial markets.
In relation to public tender offers, Law 6/2007 (i) establishes the cases in which a company must launch a takeover bid over the whole share capital of the relevant company; (ii) establishes that takeover bids shall be launched once a specific stake on the share capital of the company has been reached; (iii) adds new obligations for the board of directors of the target companies of the takeover bid in terms of defensive measures against the takeover bid; (iii) regulates the squeeze-out and sell-out procedure when a 90% of the share capital is held following a takeover bid. Royal Decree 1066/2007 completes the regulation currently in place for takeover bids in Spain.
Regarding transparency of issuers whose shares are accepted to trading on an official market, Law 6/2007 (i) modifies the reporting requirements of the periodic financial information of listed companies and issuers of listed securities; (ii) establishes a new disclosure regime for significant shareholders; (iii) adds new information and disclosure requirements for issuers of listed securities; (iv) establishes a civil liability procedure of the issuer and board of directors in connection with the financial information disclosed by issuers of securities; and (v) confers new supervisory powers upon the CNMV with respect to the review of accounting information.
On December 19, 2007 Law 47/2007 was approved, modifying the LMV in order to implement the Directive 2004/39/EC of the European Parliament and of the Council, on Markets in Financial Instruments (MiFID); the Directive 2006/73/EC of the European Parliament and of the Council on organizational requirements and operating conditions regarding the Market in Financial Instruments Directive, and the Directive 2006/49/EC of the European Parliament and of the Council on the capital adequacy of investment firms and credit institutions. Its principal aim is to establish a general legal framework for financial markets in the European Union, in particular with regard to financial services, as well as to ensure appropriate transparency for investors through a regular flow of the relevant information concerning security issuers. Amongst other things, the new regime (i) establishes new multilateral trading facilities for listing shares apart from the stock markets; (ii) reinforces the measures for the protection of investors; (iii) establishes new organizational requirements for investment firms; (iv) implements new supervisory powers for CNMV, establishing cooperation mechanisms amongst national supervisory authorities.
On July 4, 2009, Law 3/2009, regarding structural modifications on Spanish Corporations (
Ley 3/2009, de 3 de abril, sobre modificaciones estructurales de las sociedades mercantiles
) came into force, modifying the maximum threshold established in the Spanish Corporation Act as to the number of treasury shares held by listed companies and their subsidiaries from 5% up to 10% of their total capital outstanding.
Securities Trading in Spain
The Spanish securities market for equity securities consists of four stock exchanges located in Madrid, Bilbao, Barcelona and Valencia and the Automated Quotation System, or
Mercado Continuo
. During 2009, the Automated Quotation System accounted for the majority of the total trading volume of equity securities on the Spanish stock exchanges.
Automated Quotation System
The Automated Quotation System links the four Spanish stock exchanges, providing those securities listed on it with a uniform continuous market that eliminates certain of the differences among the local exchanges. The principal features of the system are the computerized matching of buy and sell orders at the time of entry of the order. Each order is executed as soon as a matching order is entered, but can be modified or canceled until executed. The activity of the market can be continuously monitored by investors and brokers. The Automated Quotation System is operated and regulated by Sociedad de Bolsas, S.A., a corporation owned by the companies that manage the local exchanges. All trades on the Automated Quotation System must be placed through a brokerage firm, an official stock broker or a dealer firm that is a member of a Spanish stock exchange. Beginning January 1, 2000, Spanish banks were allowed to become members of Spanish stock exchange and, therefore, can trade through the Automated Quotation System.
In a pre-opening session held from 8:30 a.m. to 9:00 a.m. each trading day, an opening price is established for each security traded on the Automated Quotation System based on a real-time auction. The regime concerning opening prices was changed by an internal rule issued by the Sociedad de Bolsas. Pursuant to such rule, each stock in the continuous market is assigned a static and a dynamic range within which its price can fluctuate. The price of a stock may rise or fall within its static range (which is published once a month and is calculated according to the
stock’s average historic price volatility) above or below its opening price (which shall be the closing price of the previous session). When the stock trades outside of this range, the trading of the stock is suspended for 5 minutes, during which an auction takes place. After this auction, the price of the stock can once again rise or fall within its static range above or below its last auction price (which will be considered as the new static price before triggering another auction). Furthermore, the price of a stock cannot rise or fall by more than its dynamic price range (which is fixed and published once a month and is calculated according to the stock’s average intra-day volatility), from the last price at which it has traded. If the price variation exceeds the stock’s dynamic range, a five minute auction is triggered. Between 5:30 p.m. and 5:35 p.m. a closing price is established for each security through an auction system similar to the one held for the pre-opening early in the morning.
Trading hours for block trades are also from 9:00 a.m. to 5:30 p.m. Between 5:30 p.m. and 8:00 p.m., certain trades may occur outside the computerized matching system without prior authorization from Sociedad de Bolsas, S.A. at a price within the range of 5% above the higher of the average price and closing price for the day and 5% below the lower of the average price and closing price for the day if there are no outstanding bids or offers, respectively, on the system matching or bettering the terms of the proposed off-system transaction and, if, among other things, the trade involves more than €300,000 and more than 20% of the average daily trading volume of the stock during the preceding three months. These trades must also relate to individual orders from the same person or entity and be reported to the Sociedad de Bolsas, S.A. before 8:00 p.m. At any time trades may take place (with the prior authorization of the Sociedad de Bolsas, S.A.) at any price if:
|
|
·
|
the trade involves more than €1.5 million and more than 40% of the average daily volume of the stock during the preceding three months;
|
|
|
·
|
the transaction derives from a merger or spin-off process, or from the reorganization of a group of companies;
|
|
|
·
|
the transaction is executed for the purposes of settling a litigation or completing a complex group of contracts; or
|
|
|
·
|
Sociedad de Bolsas, S.A. finds other justifiable cause.
|
Information with respect to the computerized trades between 9:00 a.m. and 5:30 p.m. is made public immediately, and information with respect to trades outside the computerized matching system is reported to Sociedad de Bolsas, S.A. by the end of the trading day and published in the
Boletín de Cotización
and in the computer system by the beginning of the next trading day.
Clearance and settlement system
The
Sociedad de Gestión de los Sistemas de Registro
,
Compensación y Liquidación de Valores S.A.U.
, formerly Iberclear, was created by the
Ley 44/2002 de Medidas de Reforma del Sistema Financiero
, enacted on November 22, 2002 to increase the efficiency of the Spanish financial markets. Such law introduced a new article, 44-bis to the LMV which established the framework for the constitution of
Sociedad de Gestión de los Sistemas de Registro, Compensación y Liquidación de Valores S.A.U
.
Iberclear is regulated by the Spanish Securities Act and where appropriate by Royal Decree 505/1987 of April 3, 1987, Royal Decree 166/1992 of February 14, 1992, and by any other related regulation. This company, which is a wholly owned subsidiary of Bolsas y Mercados Españoles, Sociedad Holding de Mercados y Sistemas Financieros, S.A. (
Bolsas y Mercados Españoles
), has the following functions:
|
·
|
bookkeeping of securities represented by means of book entries admitted to trading in the stock markets or in the public debt book entry market;
|
|
·
|
managing the clearance and settlement system for the brokerage transactions in the stock markets and at the public debt book entry market; and
|
|
·
|
providing technical and operational services directly linked to the registry, clearance and settlement of securities, or any other service required by Iberclear to be integrated with any other registry, clearance, and settlement systems.
|
Iberclear will provide the CNMV, the Bank of Spain and the Ministry of Economy with the information that these entities may request regarding the registry clearance and settlement performed within the systems managed by Iberclear.
Transactions carried out on the Spanish stock exchanges are cleared and settled through Iberclear.
Only members of the system are entitled to use Iberclear, and membership is restricted to authorized broker members of the Spanish stock exchanges, the Bank of Spain (when an agreement, approved by the Spanish Ministry of Economy and Finance, is reached with Iberclear) and, with the approval of the CNMV, other brokers not members of the Spanish stock exchanges, banks, savings banks and foreign settlement and clearing systems. The clearance and settlement system and its members are responsible for maintaining records of purchases and sales under the book-entry system. Shares of listed Spanish companies are held in book-entry form. Iberclear, which manages the clearance and settlement system, maintains a registry reflecting the number of shares held by each of its member entities (each, an
entidad participante
) as well as the amount of such shares held on behalf of beneficial owners. Each member entity, in turn, maintains a registry of the owners of such shares. Spanish law considers the legal owner of the shares to be the member entity appearing in the records of Iberclear as holding the relevant shares in its own name or the investor appearing in the records of the member entity as holding the shares.
The settlement of any transactions must be made three business days following the date on which the transaction was carried out.
Obtaining legal title to shares of a company listed on a Spanish stock exchange requires the participation of a Spanish official stockbroker, broker-dealer or other entity authorized under Spanish law to record the transfer of shares. To evidence title to shares, at the owner’s request, the relevant member entity must issue a certificate of ownership. In the event the owner is a member entity, Iberclear is in charge of the issuance of the certificate with respect to the shares held in the member entity’s name.
Brokerage commissions are not regulated. Brokers’ fees, to the extent charged, will apply upon transfer of title of shares from the Depositary to a holder of ADRs in exchange for such ADSs, and upon any later sale of such shares by such holder. Transfers of ADSs do not require the participation of an official stockbroker. The Deposit Agreement provides that holders depositing shares with the Depositary in exchange for ADSs or withdrawing shares in exchange for ADSs will pay the fees of the official stockbroker or other person or entity authorized under Spanish law applicable both to such holder and to the Depositary.
Not applicable.
Please see “—Offer and Listing Details” above.
Not applicable.
Not applicable.
Not applicable.
Not applicable.
The following summary describes certain material considerations concerning our capital stock and briefly describes certain provisions of our bylaws and Spanish law.
Corporate Objectives
Article 4 of Title I of our bylaws sets forth our corporate purposes:
|
|
·
|
The provision and operation of all kinds of public or private telecommunications services and, for such purpose, the design, installation, maintenance, repair, improvement, acquisition, disposition, interconnection, management, administration of, and any other activity not included in the preceding enumeration with respect to, all kinds of telecommunications networks, lines, satellites, equipment, systems and technical infrastructure whether now existing or to be created in the future, including the premises in which any and all of the foregoing items are located;
|
|
|
·
|
the provision and operation of all kinds of services that are ancillary or supplemental to or result from telecommunications services;
|
|
|
·
|
the research and development, promotion and application of all kinds of component principles, equipment and systems directly or indirectly used for telecommunications;
|
|
|
·
|
manufacturing and production activities and, in general, all other forms of industrial activity in connection with telecommunications; and
|
|
|
·
|
acquisition, disposition and, in general, all other forms of commercial activity in connection with telecommunications.
|
Director Qualification
In order to be elected as a director, a person must have held a number of our shares representing a nominal value of no less than €3,000 for at least three years prior to his or her election. These shares may not be transferred so long as such person remains a director. This requirement does not apply to any person who, at the time of his or her appointment, has either a labor or professional relationship with the company or is expressly exempted from such requirement by a vote of at least 85% of the Board of Directors.
Interested Transactions
When a director or persons related to him or her has an interest in a transaction with us or with any of the companies of our Group, such transaction (if unrelated to the ordinary course of our business or if not performed on an arm’s length basis) must be presented to the Nominating, Compensation and Corporate Governance Committee. Such committee shall assess the transaction from the point of view of equal treatment of shareholders and the arm’s length basis of the transaction. The performance of such transactions requires the authorization of our Board of Directors, after the favorable report of the committee. The interested director must refrain from participating in votes that affect such transaction.
Significant Differences in Corporate Governance Practices
Corporate governance guidelines
In Spain, companies with securities listed on a Spanish stock exchange are expected to follow the Conthe Code published in May 2006, which contains corporate governance and shareholder disclosure recommendations. It combines and substitutes the former Spanish Corporate Governance Codes: the Olivencia Code of Good Governance and the Aldama Report. Spanish listed companies are required by law to publish an Annual Report on Corporate Governance and also to publish corporate governance information on their websites. We base our corporate governance procedures on the recommendations of the Conthe Code. As part of our corporate governance procedures, we have adopted regulations for our Board of Directors that govern, among other things, director qualification standards, responsibilities, compensation, access to management information, the Board of Directors’ purpose and each of our Board committee’s purpose and responsibilities. Moreover, we have a Regulation of the General Shareholders’ Meeting that aims to reinforce its transparency, providing shareholders with a framework guaranteeing and facilitating exercise of their rights. The Annual Report on Corporate Governance published by us provides a detailed explanation of our corporate governance procedures and explains the role and duties of our Board of Directors and Board Committees. For a more detailed description regarding our corporate governance practices see “Item 16G. Corporate Governance.”
Description of Our Capital Stock
Description of share capital
At April, 28, 2011, our issued share capital consisted of 4,563,996,485 ordinary registered shares with a nominal value of €1.00 each.
Our shareholders have delegated to the Board of Directors the authority to issue up to 2,460,565,198 new shares. The Board of Directors is authorized to exclude preemptive rights, in whole or in part, pursuant to the applicable provisions of the Spanish Corporation Law. The Board’s authorization to issue new shares expires on June 21, 2011.
Meetings and voting rights
We hold our ordinary general shareholders’ meeting during the first six months of each fiscal year on a date fixed by the Board of Directors. Extraordinary general shareholders’ meetings may be called, from time to time, at the discretion of our Board of Directors or upon the request of shareholders representing 5% of our paid-in share capital. We publish notices of all ordinary and extraordinary general shareholders’ meetings in the Official Gazette of the Commercial Registry, in our web site and in at least one newspaper in Madrid at least one month before the relevant meeting.
Each share of Telefónica, S.A. entitles the holder to one vote. However, only registered holders of shares representing a nominal value of at least €300 (which currently equals at least 300 shares) are entitled to attend a general shareholders’ meeting. Holders of shares representing a nominal value of less than €300 (less than 300 shares), may aggregate their shares by proxy and select a representative that is a shareholder to attend a general shareholders’ meeting or delegate his or her voting rights by proxy to a shareholder who has the right to attend the shareholders’ meeting. However, under our bylaws, no shareholder may vote a number of shares exceeding 10% of our total outstanding voting capital. This restriction will, however, be removed from our bylaws, because, according to the new Spanish Corporation Law, any restriction on voting rights will lose its effect beginning July 1, 2011.
Any share may be voted by proxy. Proxies must be in writing and are valid only for a single meeting.
Only holders of record five days prior to the day on which a general meeting of shareholders is scheduled to be held may attend and vote at the meeting. Under the deposit agreement for our ADSs, our depositary accepts voting instructions from holders of ADSs. The depositary executes such instructions to the extent permitted by law and by the terms governing the shares. The depositary or its nominee, whichever is applicable, will be entitled to vote by proxy the shares represented by the ADSs.
Shareholders representing, in person or by proxy, at least 25% of our subscribed voting capital constitute a quorum for a general meeting of shareholders. If a quorum is not present at the first call, then the meeting can be held on second call. Regardless of the number of shareholders present at the meeting on second call, they are deemed to constitute a quorum.
Shareholders representing, in person or by proxy, at least 50% of our subscribed voting capital constitute a quorum on a first call for shareholders’ meetings at which shareholders will be voting on any of the following actions:
|
|
·
|
issuance of bonds;
|
|
|
·
|
increase or reduction of share capital;
|
|
|
·
|
any other amendment of our bylaws;
|
|
|
·
|
merger, split or spin-off of Telefónica;
|
|
|
·
|
withdrawal or restriction of the right of pre-emptive subscription to new shares, the transfer of the business as a going concern, the transformation of the company, or the removal of a registered office abroad.
|
When a quorum is present on the first call, these special resolutions must be adopted by the affirmative vote of shareholders representing a majority of our present subscribed voting capital.
If a quorum for the meeting is not present after the first call, upon a second call for the meeting, 25% of our subscribed voting capital will constitute a quorum. When shareholders representing less than 50% of the subscribed voting capital are in attendance, these special resolutions must be adopted by a vote of two-thirds of those shareholders present.
Dividends
Shareholders vote on final dividend distributions at the shareholders’ meeting. Distributable profits are equal to:
|
|
·
|
net profits for the year; plus
|
|
|
·
|
profits carried forward from previous years; plus
|
|
|
·
|
distributable reserves; minus
|
|
|
·
|
losses carried forward from previous years; minus
|
|
|
·
|
amounts allocated to reserves as required by law or by our bylaws.
|
The amount of distributable profits is based on our unconsolidated financial statements prepared in accordance with Spanish GAAP, which differ from the Consolidated Financial Statements prepared in accordance with IFRS included elsewhere in this Annual Report.
The Board of Directors can approve interim dividend payments without a prior shareholder vote on the issue. However, under those circumstances, the dividend is limited to distributable net profits of the current year and is subject to certain legal requirements.
Unclaimed dividends revert to us five years from their date of payment.
Registration and transfers
Our shares are in registered book-entry form. Transfers executed through stock exchange systems are implemented pursuant to the stock exchange clearing and settlement procedures carried out by the Spanish clearing institution. Transfers executed outside of stock exchange systems, that is, over the counter, are implemented
pursuant to the general legal regime for book-entry transfer, including registration by the Spanish clearing institution.
There are no restrictions with respect to the transfer of our shares.
Liquidation rights
Under Spanish law, upon our liquidation, the shareholders would be entitled to receive, on a
pro rata
basis, any assets remaining after the payment of our debts and taxes and liquidation expenses.
Material Contracts Related to Our Investment in Telecom Italia
On April 28, 2007, we, together with a group of Italian investors (the “Italian Investors”), made up of Assicurazioni Generali S.p.A. (“Generali”), Sintonia S.A. (“Sintonia”), Intesa Sanpaolo S.p.A. (“Intesa Sanpaolo”) and Mediobanca S.p.A. (“Mediobanca”), entered into a co-investment agreement, or the Co-Investment Agreement, to establish the terms and conditions for our participation in what is now Telco. Through Telco, on October 23, 2007, we and the Italian Investors purchased the entire share capital of Olimpia S.p.A., or Olimpia, which held approximately 18% of the ordinary share capital of Telecom Italia. As of the date of this Annual Report, the Italian Investors hold a total of 53.8% of Telco’s share capital and we hold the remaining 46.2%.
In addition to Telco’s participation in Telecom Italia’s ordinary share capital through its interest in Olimpia, pursuant to the Co-Investment Agreement, on October 25, 2007 Generali and Mediobanca contributed to Telco ordinary shares of Telecom Italia they held on that date. These shares in the aggregate amounted to 5.6% of Telecom Italia’s ordinary share capital and brought Telco’s direct and indirect participation in Telecom Italia’s ordinary share capital to approximately 23.6%.
On April 28, 2007, the Italian Investors also entered into a shareholders’ agreement, or the Shareholders’ Agreement, which establishes, among other things, the principles of corporate governance of Telco and Olimpia, respectively, the principles related to the transfer of Telco’s shares and any Olimpia shares or Telecom Italia shares directly or indirectly owned by Telco and the principles of designation, among the parties, of candidates to be included in a common list for the appointment of directors of Telecom Italia under the voting list mechanism provided for by Telecom Italia’s by-laws.
On November 19, 2007 the parties to the Shareholders’ Agreement amended the Shareholders’ Agreement as well as the bylaws of Telco to include the specific limitations imposed by ANATEL as initially posted on its website on October 23, 2007 and subsequently published on November 5, 2007 as ANATEL’s “Ato” No. 68,276 dated October 31, 2007. We refer to such agreement as the Amendment to the Shareholders’ Agreement.
Pursuant to the Shareholders’ Agreement, we entered into an option agreement, or the Option Agreement, with Telco on November 6, 2007, which provides that, in the event that a decision to dispose, directly or indirectly, in any form or manner (including through measures with equivalent effect, such as mergers and demergers of Telco or Olimpia) or encumber Telecom Italia shares or Olimpia shares or any rights attached thereto, including but not limited to voting rights, is taken by the board of directors of Telco by a simple majority resolution according to the procedure specifically provided for by the Shareholders’ Agreement and we are a dissenting party, then we will have the right, to be exercised within 30 days of such decision being taken, to buy from Telco the Telecom Italia shares or the Olimpia shares, as the case may be, at the same price and conditions offered by the third party offering to acquire such Telecom Italia shares or Olimpia shares.
On December 10, 2007, an agreement was reached to merge Olimpia into Telco, as a result of which Telco’s entire stake in the voting shares of Telecom Italia (23.6%) became a direct stake. In March 2008, Telco acquired 121.5 million additional shares of Telecom Italia, equivalent to 0.9% of its share capital, bringing its total direct interest to 24.5% of Telecom Italia voting shares.
On October 28, 2009 Sintonia requested, pursuant to the Shareholders Agreement, the non-proportional de-merger of Telco, with the withdrawal of its pro rata share of the assets and liabilities of Telco (comprised of
Telecom Italia shares held by Telco representing approximately 2.1% of Telecom Italia’s share capital). The terms of Sintonia’s exit were approved on November 26, 2009, and the transaction closed on December 22, 2009. Upon Sintonia’s exit, Telco’s interest in Telecom Italia was reduced to 22.45% of Telecom Italia’s share capital. At the same time, our stake in Telco increased from 42.3% to 46.2%, thereby allowing us to maintain our indirect interest in Telecom Italia at 10.5% of Telecom Italia’s voting rights (7.2% of the dividend rights).
On October 28, 2009 Telco investors, other than Sintonia, entered into an agreement, or the Renewal Agreement, through which they agreed (i) not to request the non-proportional de-merger of Telco with the withdrawal of their corresponding share of Telecom Italia shares held by Telco at that time (as was previously done by Sintonia) and (ii) to extend and modify the Shareholders Agreement, which we refer to as the “Renewal Agreement,” for an additional term of three years until April 27, 2013 (effective as of April 28, 2010) substantially on the same terms and conditions, except to provide (a) that the right of Telco’s investors to request the non-proportional de-merger of Telco will only be exercisable in the period between October 1, 2012 and October 28, 2012, and (b) for an early withdrawal right period exercisable between April 1, 2011 and April 28, 2011. On the same date and in connection with the Renewal Agreement, separately, we entered into an Amendment Deed to the Call Option Agreement with Telco (i) to extend the term of the Option Agreement to coincide with the expiration date of the Renewal Agreement and (ii) to exempt certain transactions regarding the Telecom Italia shares, namely those related to the exercise of de-merger and early withdrawal rights pursuant to the Renewal Agreement.
On January 11, 2010, Telco arranged a €1,300 million loan with Intesa Sanpaolo, Mediobanca, Société Générale, S.p.A. and Unicredito, S.p.A. maturing on May 31, 2012, part of which is secured with the Telecom Italia shares held by Telco.
The lending banks have granted Telco shareholders, including ourselves, a call option on the Telecom Italia shares that they may be entitled to receive as a result of the potential execution of the pledge.
In line with the commitments assumed by Telco shareholders, on December 22, 2009, the rest of Telco’s financing needs with respect to debt maturities were met with a bridge loan granted by shareholders, including ourselves, Intesa Sanpaolo and Mediobanca for approximately €902 million, and a bank bridge loan granted by Intesa Sanpaolo and Mediobanca for the remaining €398 million.
The financing from the bridge loans described above was cancelled with the proceeds of a bond issuance subscribed by Telco’s shareholders, on a pro rata basis in accordance with their interests in Telco, on February 19, 2010 for an aggregate principal amount of €1,300 million. Our subscription amounted to an aggregate principal amount of €600 million.
Material Contract Related to Our Investment in China Unicom
On September 6, 2009, Telefónica and China Unicom entered into a subscription agreement, or the Subscription Agreement, pursuant to which each party conditionally agreed to invest the equivalent of $1 billion in the other party through the acquisition of shares in the other party. Moreover, both parties entered into a strategic alliance agreement which provides for, among other areas for cooperation, joint procurement of infrastructure and client equipment, common development of mobile service platforms, joint provisions of service to multinational customers, roaming, research and development, sharing of best practices and technical, operational and management know-how, joint development of strategic initiatives in the area of network evolution, joint participation in international alliances and exchanges of senior management.
On October 21, 2009, the mutual share exchange pursuant to the Subscription Agreement was implemented through the subscription by Telefónica Internacional of 693,912,264 newly issued shares of China Unicom and a contribution in kind to China Unicom of 40,730,735 shares of Telefónica.
Following the completion of the transaction, we increased our share of China Unicom’s voting share capital from 5.38% to 8.06% and obtained the right to appoint a member to its board of directors, while China Unicom became owner of approximately 0.87% of our voting share capital at that date. Subsequently, after a capital reduction carried out by China Unicom, we reached a shareholding equivalent to 8.37% of the company’s voting share capital.
Under the Subscription Agreement, we agreed with China Unicom that for a period of one year from completion of the acquisition of the mutual share exchange, we shall not, directly or indirectly, sell, transfer or
dispose of any of the China Unicom shares held, directly or indirectly, by us or any of our subsidiaries (save for the transfer of such shares to any member of the Telefónica group). China Unicom has made an analogous undertaking with respect to its participation in our share capital.
In addition, subject to Telefónica or any of its subsidiaries holding in aggregate, directly or indirectly, not less than 5% of the issued share capital of China Unicom from time to time and to the extent not prohibited under applicable law, the articles of association of China Unicom and the Hong Kong Listing Rules, we shall be entitled to nominate one representative to the Board of Directors of China Unicom.
Finally, with effect from completion, and for so long as the strategic alliance agreement is in effect, China Unicom shall not (i) offer, issue or sell any significant number of its ordinary shares (including those held in treasury by the company itself, if any), or any securities convertible into or other rights to subscribe for or purchase a significant number of China Unicom’s ordinary shares (including those held in treasury by the company itself, if any), to any of our current major competitors or (ii) make any significant investment, directly or indirectly, in any of our current major competitors. We have made similar undertakings.
The strategic alliance agreement between the parties terminates on the third anniversary and automatically renews thereafter for one year terms, subject to either party’s right to terminate on six month’s notice. Also, the strategic alliance agreement may be terminated by China Unicom if we sell our shares in China Unicom causing us to own less than 5% of the issued share capital of China Unicom or by us if China Unicom sells our shares and ceases to own at least 0.5% of our issued share capital. In addition, the strategic alliance agreement is subject to termination in the event either party is in default and automatically terminates on a change in control of China Unicom.
On January 23, 2011, Telefónica and China Unicom entered into an extension to their already existing strategic alliance agreement (the “Enhanced Strategic Alliance Agreement”) in which both companies agreed to strengthen and deepen their strategic cooperation in certain business areas and through which, upon the terms and conditions set out thereof, each party agreed to invest the equivalent of $500 million in ordinary shares of the other party toward the alliance.
Pursuant to the Enhanced Strategic Alliance Agreement, Telefónica will acquire, directly or through any of its subsidiaries, a number of China Unicom shares amounting to $500 million from third parties, within nine months of the date of the agreement. On the other hand, China Unicom will acquire 21,827,499 Telefónica shares to be sold by Telefónica at an agreed value of €17.16 per share (the arithmetic average of the closing price of Telefónica shares as quoted on the Madrid Stock Exchange for the thirty consecutive trading days ending on January 14, 2011), which represents a total price of $500 million.
Since their strategic alliance agreement signed in September 2009, Telefónica and China Unicom have made significant progress in various areas of cooperation. In this respect, we believe that this new agreement will enhance this alliance and deepen cooperation between the two companies in the areas of procurement, mobile service platforms, service to MNCs, wholesale carriers, roaming technology/R&D, international business development, cooperation and sharing of best practices.
To the extent not prohibited under applicable laws and the by-laws of Telefónica, Telefónica irrevocably undertakes under the Enhanced Strategic Alliance Agreement to propose at its next general shareholders’ meeting the appointment of an individual designated by China Unicom as a new director of the Telefónica Board.
This commitment is subject to completion of China Unicom’s acquisition of Telefónica shares and to China Unicom’s holding, on the date of appointment of such nominee director, the requisite aggregate number of Telefónica shares pursuant to the Enhanced Strategic Alliance Agreement and the closing of the Subscription Agreement entered into by Telefónica and China Unicom on September 6, 2009.
Material Contract related to the acquisition of Vivo (PT)
On July 28, 2010, we signed an agreement with Portugal Telecom, for the acquisition by Telef
ó
nica of the 50% of the capital stock of
Brasilcel
owned by Portugal Telecom. Brasilcel owned approximately 60% of the total share capital of Vivo Participa
ç
oes, S.A. (
“Vivo Participa
ç
oes
”
). The acquisition price of such capital stock was
€
7,500 million,
€
4,500 million of which was paid at the closing of the transaction on September 27, 2010 and
€
1,000 million of which was paid on December 30, 2010, with the remaining
€
2,000 million due on October 31, 2011 (though Portugal Telecom may request that this final payment be made on July 29, 2011, in which case such final payment, and correspondingly, the total price of the acquisition, would be reduced by
€
25 million). The agreement also provided for certain other commercial arrangements between Telef
ó
nica and Portugal Telecom which were subsequently rendered inapplicable. Upon closing of the transaction, the respective subscription and shareholders agreements entered into by Telef
ó
nica and Portugal Telecom in 2002 relating to their joint venture in Brazil were terminated.
Exchange Controls and Other Limitations Affecting Security Holders
Ownership limitations
There are no limitations with respect to the ownership of our assets or share capital except those derived from the application of the reciprocity principle as described above.
Trading by us in our own shares or shares of companies under our control
Consistent with applicable Spanish laws and regulations and the authorization of our shareholders, from time to time we or our affiliates engage in transactions involving securities of members of our Group. These transactions may include purchases of shares of group members, forward contracts with respect to these shares and other similar transactions.
At December 31, 2010, we held 55,204,942 shares of treasury stock, representing 1.20957% of our capital stock. At December 31, 2009, we held 6,329,530 shares of treasury stock, representing 0.13868% of our capital stock. As a part of our shareholders’ remuneration policy, we have implemented various share buyback programs since 2003. For further description about our shareholders’ return, see “Item 8. Financial Information—Dividend Information and Share Buyback Programs.”
The Spanish Corporations Law prohibits the purchase by us and our subsidiaries of shares in the secondary market except in the following limited circumstances:
|
|
·
|
the purchase of shares must be authorized by a general meeting of our shareholders and, in the case of a purchase of shares by a subsidiary, also by a general meeting of shareholders of the subsidiary;
|
|
|
·
|
the shares so purchased have no economic or voting rights while held by us and have no voting rights while held by our subsidiaries;
|
|
|
·
|
the purchaser must create reserves equal to the purchase price of any shares that are purchased and, if a subsidiary is the acquirer, the reserve must also be recorded by the parent company; and
|
|
|
·
|
the total number of shares held by us and our subsidiaries may not exceed 10% of our total capital.
|
Any acquisition of our shares exceeding, or that causes us and our subsidiaries’ holdings to exceed, 1% of our voting rights must be reported to the CNMV.
At our annual general shareholders meeting held on June 2, 2010, our shareholders extended their prior authorization to the Board of Directors to acquire our shares for an additional 5 years from the date of such meeting. The authorization also applies to companies under our control. Pursuant to the authorization, the aggregate nominal value of our shares held by us or any of our subsidiaries cannot exceed the limit established by applicable laws (which is, as of the date of this Annual Report, 10% of our outstanding capital).
Other restrictions on acquisitions of shares
A person or group of persons that directly or indirectly exercises beneficial ownership or control of 3% or more of the voting rights, or which increases or decreases the number of shares which it owns or controls to an amount which equals or exceeds 3% 5%, 10%, 15%, 20%, 25%, 30%, 35%, 40%, 45%, 50%, 60%, 70%, 75%, 80% and 90% of such voting rights, must inform us and the CNMV of such ownership.
A person or group of persons that fails to inform any of the above entities after reaching any of the indicated thresholds may incur fines and penalties. A person or group that is a member of our Board of Directors or a member of our Executive Commission
must report any acquisition or transfer of our capital stock, regardless of the amount of shares acquired or transferred.
For reporting requirements concerning acquisitions by us or our affiliates of our shares, see “—Trading by us in our own shares or shares of companies under our control” above.
Dividend and Liquidation Rights
According to Spanish law and our bylaws, dividends may only be paid out of profits or distributable reserves if the value of our net worth is not, and as a result of such distribution would not be, less than our capital stock. Pursuant to Spanish law, we are required to reserve 10% of our fiscal year net income until the amount in our legal reserve reaches 20% of our capital. Our legal reserve is currently at 20%.
Dividends payable by us to non-residents of Spain ordinarily are subject to a Spanish withholding tax. For the tax implications of dividends, see “—Taxation.”
Upon our liquidation, our shareholders would be entitled to receive pro rata any assets remaining after the payment of our debts and taxes and expenses of such liquidation. Any change in the rights of shareholders to receive dividends and payment upon liquidation would require an amendment to our bylaws by resolution adopted by a general meeting of shareholders. If there were more than one class of shares, such amendment would also require the approval of each class of shareholders affected by the amendment.
Preemptive Rights and Increases of Share Capital
Pursuant to the Spanish Corporations Law, shareholders have preemptive rights to subscribe for any new shares and for bonds convertible into shares. Such rights may not be available under special circumstances if waived by a resolution passed at a general meeting of shareholders in accordance with Article 308 of the Spanish Corporations Law, or the Board of Directors, if authorized (Article 506 of the Spanish Corporation Law). Further, such rights, in any event, will not be available in the event of an increase in capital to meet the requirements of a convertible bond issue or a merger in which shares are issued as consideration. Such rights:
|
|
·
|
are transferable;
|
|
|
·
|
may be traded on the Automated Quotation System; and
|
|
|
·
|
may be of value to existing shareholders because new shares may be offered for subscription at prices lower than prevailing market prices.
|
Absent an exemption from registration, shares issuable upon exercise of rights must be registered under the Securities Act of 1933 in order to be offered to holders of ADRs. If we decided not to register the shares, the rights would not be distributed to holders of ADRs. Pursuant to the Deposit Agreement, however, holders of ADRs are entitled to receive their proportionate share of the proceeds, if any, from sale by the Depositary of any rights accruing to holders of ADRs.
The following is a general summary of the material Spanish and U.S. federal income tax consequences to U.S. Holders (as defined below) of the ownership and disposition of shares or ADSs. This summary is based upon Spanish and U.S. tax laws (including the U.S. Internal Revenue Code of 1986, as amended (the “Code”), final, temporary and proposed Treasury regulations, rulings, judicial decisions and administrative pronouncements), and the Convention Between the United States of America and the Kingdom of Spain for the Avoidance of Double Taxation and the Prevention of Fiscal Evasion with Respect to Taxes on Income, signed February 22, 1990, (the “Treaty”), all as of the date hereof and all of which are subject to change or changes in interpretation, possibly with retroactive effect. In addition, the summary is based in part on representations of the Depositary and assumes that each obligation provided for in or otherwise contemplated by the Deposit Agreement or any other related agreements will be performed in accordance with its terms.
As used herein, the term “U.S. Holder” means a beneficial owner of one or more shares or ADSs:
(a) that is, for U.S. federal income tax purposes, one of the following:
|
i.
|
a citizen or resident of the United States,
|
|
ii.
|
a corporation (or other entity taxable as a corporation) created or organized in or under the laws of the United States or any political subdivision thereof, or
|
|
iii.
|
an estate or trust the income of which is subject to U.S. federal income taxation regardless of its source;
|
(b) who is entitled to the benefits of the Treaty;
(c) who holds the shares or ADSs as capital assets for U.S. federal income tax purposes;
(d) who owns, directly, indirectly or by attribution, less than 10% of the share capital or voting stock of Telefónica; and
(e) whose holding is not effectively connected with a permanent establishment in Spain.
This summary does not address all of the tax considerations that may apply to holders that are subject to special tax rules, such as U.S. expatriates, insurance companies, tax-exempt organizations, certain financial institutions, persons subject to the alternative minimum tax, dealers and certain traders in securities, persons holding shares or ADSs as part of a straddle, hedging, conversion or other integrated transaction, persons who acquired their shares or ADSs pursuant to the exercise of employee stock options or otherwise as compensation, partnerships or other entities classified as partnerships for U.S. federal income tax purposes or persons whose functional currency is not the U.S. dollar. Such holders may be subject to U.S. federal income tax consequences different from those set forth below.
If a partnership holds shares or ADSs, the tax treatment of a partner generally will depend upon the status of the partner and the activities of the partnership. A partner in a partnership that holds shares or ADSs is urged to consult its own tax advisor regarding the specific tax consequences of owning and disposing of the shares or ADSs.
For purposes of the Treaty and U.S. federal income tax, U.S. Holders of ADSs will generally be treated as owners of the underlying shares represented by such ADSs. Accordingly, no gain or loss will be recognized if a U.S. Holder exchanges ADSs for the underlying shares represented by those ADSs.
The U.S. Treasury has expressed concerns that parties to whom American depositary receipts are released before shares are delivered to the depositary, or intermediaries in the chain of ownership between holders and the issuer of the security underlying the American depositary receipts, may be taking actions that are inconsistent with the claiming of foreign tax credits by U.S. holders of American depositary receipts. Such actions would also be inconsistent with the claiming of the reduced rate of tax applicable to dividends received by certain non-corporate U.S. Holders. Accordingly, the availability of foreign tax credits to U.S. Holders of ADSs and the reduced tax rate for dividends received by certain non-corporate U.S. Holders of ADSs, each as described below, could be affected by actions taken by such parties or intermediaries.
This discussion assumes that Telefónica is not, and will not become, a passive foreign investment company (“PFIC”), as discussed below under “—U.S. Federal Income Tax Considerations—Passive Foreign Investment Company Rules.”
U.S. Holders of shares or ADSs should consult their own tax advisors concerning the specific Spanish and U.S. federal, state and local tax consequences of the ownership and disposition of shares or ADSs in light of their particular situations as well as any consequences arising under the laws of any other taxing jurisdiction. In particular, U.S. Holders are urged to consult their own tax advisors concerning their eligibility for benefits under the Treaty.
Spanish Tax Considerations
Taxation of dividends
Under Spanish law, dividends paid by Telefónica to U.S. Holders of ordinary shares or ADSs are subject to Spanish Non-Resident Income Tax, withheld at source, currently at an 19% tax rate. For these purposes, upon
distribution of the dividend, Telefónica or its paying agent will withhold an amount equal to the tax due according to the rules set forth above (i.e., applying the general withholding tax rate of 19%).
However, under the Treaty, if you are a U.S. Holder, you are entitled to a reduced withholding tax rate of 15%.
To benefit from the Treaty-reduced rate of 15%, you must provide to Telefónica through its paying agent in Spain, before the tenth day following the end of the month in which the dividends were payable, a certificate from the U.S. Internal Revenue Service (“IRS”) stating that, to the best knowledge of the IRS, such U.S. Holders are residents of the United States within the meaning of the Treaty and entitled to its benefits.
If the certificate referred to in the above paragraph is not provided within said term, you may afterwards obtain a refund of the amount withheld in excess of the rate provided for in the Treaty.
Spanish Refund Procedure
According to Spanish Regulations on Non-Resident Income Tax, approved by Royal Decree 1776/2004 dated July 30, 2004, as amended, a refund for the amount withheld in excess of the Treaty-reduced rate can be obtained from the relevant Spanish tax authorities. To pursue the refund claim, if you are a U.S. Holder, you are required to file:
|
|
·
|
the corresponding Spanish tax form,
|
|
|
·
|
the certificate referred to in the preceding section, and
|
|
|
·
|
evidence of the Spanish Non-Resident Income Tax that was withheld with respect to you.
|
The refund claim must be filed within four years from the date in which the withheld tax was collected by the Spanish tax authorities.
U.S. Holders are urged to consult their own tax advisors regarding refund procedures and any U.S. tax implications thereof.
Additionally, under Spanish law, the first €1,500 of dividends obtained by individuals who are not resident in Spain for tax purposes, and do not operate through a permanent establishment in Spain, will be exempt from taxation in certain circumstances. U.S. Holders should consult their tax advisors to determine whether this exemption is available.
Taxation of capital gains
As of January 1, 2010, the rate applicable to capital gains of non-residents of Spain who are not entitled to the benefit of any applicable treaty for the avoidance of double taxation and who do not operate through a fixed base or a permanent establishment in Spain is 19% under Spanish law.
Under the Treaty, capital gains realized by U.S. Holders arising from the disposition of shares or ADSs will not be taxed in Spain, provided that the seller has not maintained a direct or indirect holding of 25% or more in our capital during the 12 months preceding the disposition of the shares or ADSs. U.S. Holders will be required to establish that they are entitled to the exemption from tax under the Treaty by providing to the relevant Spanish tax authorities a certificate of residence issued by the IRS stating that to the best knowledge of the IRS, such U.S. Holder is a U.S. resident within the meaning of the Treaty.
Spanish wealth tax
Individual U.S. Holders who hold shares or ADSs located in Spain are subject to the Spanish Wealth Tax (
Impuesto sobre el Patrimonio
) (Spanish Law 19/1991), which imposes tax on property located in Spain on the last day of any year. As of January 1, 2008 a 100% tax allowance has been approved by Law 4/2008 dated December 23, 2008, to any resident or non-resident taxpayer.
Inheritance and gift tax
Transfers of shares or ADSs on death and by gift to individuals are subject to Spanish inheritance and gift taxes (
Impuesto sobre Sucesiones y Donaciones
), respectively, if the transferee is a resident of Spain for tax purposes, or if the shares or ADSs are located in Spain at the time of death, regardless of the residence of the heir or beneficiary. The applicable tax rate, after applying relevant personal, family and wealth factors ranges from between 7.65% and 81.6% for individuals. While inheritance and gift taxes are generally state taxes, certain autonomous communities have the right to establish their own tax rates and deductions and to control the management and settlement of such taxes.
Gifts granted to corporations non-resident in Spain are subject to Spanish Non-Resident Income Tax at a 19% tax rate on the fair market value of the shares as a capital gain. If the donee is a United States resident corporation, the exclusions available under the Treaty described in the section “—Taxation of Capital Gains” above will be applicable.
Expenses of Transfer
Transfers of shares or ADSs will be exempt from any transfer tax (
Impuesto sobre Transmisiones Patrimoniales
) or value added tax. Additionally, no stamp tax will be levied on such transfers.
U.S. Federal Income Tax Considerations
Taxation of dividends
Distributions received by a U.S. Holder on shares or ADSs, including the amount of any Spanish taxes withheld, other than certain
pro rata
distributions of shares to all shareholders (including ADS holders), will constitute foreign source dividend income to the extent paid out of Telefónica’s current or accumulated earnings and profits (as determined for U.S. federal income tax purposes). Because Telefónica does not maintain calculations of its earnings and profits under U.S. federal income tax principles, it is expected that distributions generally will be reported to U.S. Holders as dividends. The amount of dividend income paid in euros that a U.S. Holder will be required to include in income will equal the U.S. dollar value of the distributed euros, calculated by reference to the exchange rate in effect on the date the payment is received by the Depositary (in the case of ADSs) or by the U.S. Holder (in the case of shares), regardless of whether the payment is converted into U.S. dollars on the date of receipt. If the dividend is converted to U.S. dollars on the date of receipt, a U.S. Holder will generally not be required to recognize foreign currency gain or loss in respect of the dividend income. A U.S. Holder may have foreign currency gain or loss if the dividend is converted into U.S. dollars after the date of its receipt. Gain or loss that a U.S. Holder realizes on a sale or other disposition of euros will be U.S.-source ordinary income or loss. Corporate U.S. Holders will not be entitled to claim the dividends-received deduction with respect to dividends paid by Telefónica. Subject to applicable limitations and the discussion above regarding concerns expressed by the U.S. Treasury, dividends received by certain non-corporate U.S. Holders in taxable years beginning before January 1, 2013 will be taxable at a maximum rate of 15%. Non-corporate U.S. Holders should consult their own tax advisors to determine whether they are subject to any special rules that limit their ability to be taxed at this favorable rate.
Spanish income taxes withheld from dividends on shares or ADSs at a rate not exceeding the rate provided in the Treaty will be creditable against a U.S. Holder’s U.S. federal income tax liability, subject to applicable restrictions and limitations that may vary depending upon the U.S. Holder’s circumstances and the discussion above regarding concerns expressed by the U.S. Treasury. Spanish taxes withheld in excess of the rate applicable under the Treaty will not be eligible for credit against a U.S. Holder’s federal income tax liability. See “Spanish Tax Considerations—Taxation of dividends” above for a discussion of how to obtain the applicable treaty rate. Instead of claiming a credit, a U.S. Holder may elect to deduct foreign taxes (including the Spanish taxes) in computing its taxable income, subject to generally applicable limitations. An election to deduct foreign taxes (instead of claiming foreign tax credits) applies to all taxes paid or accrued in the taxable year to foreign countries and possessions of the United States. The limitations on foreign taxes eligible for credit are calculated separately with respect to specific classes of income. The rules governing foreign tax credits are complex. Therefore, U.S. Holders should consult their own tax advisors regarding the availability of foreign tax credits in their particular circumstances.
Taxation upon sale or other disposition of shares or ADSs
A U.S. Holder will generally recognize U.S. source capital gain or loss on the sale or other disposition of shares or ADSs. Any such gain or loss will be long-term capital gain or loss if the U.S. Holder has held such shares or ADSs for more than one year. The amount of the U.S. Holder’s gain or loss will be equal to the difference between such U.S. Holder’s tax basis in the shares or ADSs sold or otherwise disposed of and the amount realized on the sale or other disposition, as determined in U.S. dollars.
As discussed under “Spanish Tax Considerations—Taxation of capital gains” above, gain realized by a U.S. Holder on the sale or other disposition of shares or ADSs will be exempt from Spanish tax on capital gains under the Treaty. If a U.S. Holder is eligible for the exemption from Spanish tax on capital gains but does not follow appropriate procedures for obtaining the exemption, such holder will not be entitled to credit the amount of Spanish tax on capital gains paid against its U.S. federal income tax liability. U.S. Holders should consult their own tax advisors regarding the potential Spanish tax consequences of a sale or other disposition of shares or ADSs and the procedures available for an exemption from such tax.
Passive foreign investment company rules
Telefónica believes that it was not a PFIC for U.S. federal income tax purposes for its 2010 taxable year. However, because PFIC status depends upon the composition of a company’s income and assets and the market value of its assets (including, among others, less than 25% owned equity investments) from time to time, there can be no assurance that Telefónica will not be considered a PFIC for any taxable year. If Telefónica were treated as a PFIC for any taxable year during which a U.S. Holder held a share or ADS, certain adverse tax consequences could apply to the U.S. Holder.
If Telefónica were treated as a PFIC for any taxable year during which a U.S. Holder held a share or ADS, gain recognized by a U.S. Holder on a sale or other disposition of such share or ADS would be allocated ratably over the U.S. Holder’s holding period for the share or ADS. The amounts allocated to the taxable year of the sale or other disposition and to any year before Telefónica became a PFIC would be taxed as ordinary income. The amount allocated to each other taxable year would be subject to tax at the highest rate in effect for individuals or corporations, as appropriate, and an interest charge would be imposed on the resulting tax liability. The same treatment would apply to any distribution in respect of shares or ADSs to the extent it exceeds 125% of the average of the annual distributions on shares or ADSs received by the U.S. Holder during the preceding three years or the U.S. Holder’s holding period, whichever is shorter. Certain elections may be available that would result in alternative treatments (such as mark-to-market treatment) of the shares or ADSs.
In addition, if Telefónica were treated as a PFIC in a taxable year in which it pays a dividend or in the prior taxable year, the favorable dividend rate discussed above with respect to dividends paid to certain non-corporate U.S. Holders would not apply.
Information reporting and backup withholding
Payments of dividends and sales proceeds that are made within the United States or through certain U.S.-related financial intermediaries generally are subject to information reporting and backup withholding unless the U.S. Holder is an exempt recipient or, in the case of backup withholding, the U.S. Holder provides a correct taxpayer identification number and certifies that it is not subject to backup withholding. The amount of any backup withholding from a payment to a U.S. Holder will be allowed as a credit against the U.S. Holder’s U.S. federal income tax liability and may entitle such U.S. Holder to a refund, provided that the required information is timely furnished to the IRS.
For taxable years beginning after March 18, 2010, new legislation requires certain U.S. Holders who are individuals to report information relating to stock of a non-U.S. person, subject to certain exceptions (including an exception for stock held in custodial accounts maintained by a U.S. financial institution). U.S. Holders are urged to consult their tax advisers regarding the effect, if any, of this legislation on their ownership and disposition of shares or ADSs.
Not Applicable.
Not Applicable.
Where You Can Find More Information
We file Annual Reports on Form 20-F and furnish periodic reports on Form 6-K to the SEC. You may read and copy any of these reports at the SEC’s public reference room in Washington, D.C. Please call the SEC at 1-800-SEC-0330 for further information on the public reference rooms. Our SEC filings are also available to the public from commercial document retrieval services. Some of our SEC filings are also available at the website maintained by the SEC at “http://www.sec.gov.”
Our ADSs are listed on the New York Stock Exchange under the symbol “TEF.” You may inspect any periodic reports and other information filed with or furnished to the SEC by us at the offices of the New York Stock Exchange, 20 Broad Street, New York, New York 10005.
As a foreign private issuer, we are exempt from the rules under the Exchange Act which prescribe the furnishing and content of proxy statements, and our officers, directors and principal shareholders are exempt from the reporting and “short-swing” profit recovery provisions contained in Section 16 of the Exchange Act.
We are subject to the informational requirements of the Spanish securities commission and the Spanish stock exchanges, and we file reports and other information relating to our business, financial condition and other matters with the Spanish securities commission and the Spanish stock exchanges. You may read such reports, statements and other information, including the annual and biannual financial statements, at the public reference facilities maintained in Madrid and Barcelona. Some of our Spanish securities commission filings are also available at the website maintained by the Spanish securities commission at http://www.cnmv.es.
We have appointed Citibank, N.A. to act as Depositary for the Telefónica ADSs. Citibank will, as provided in the Deposit Agreement, arrange for the mailing of summaries in English of such reports and communications to all record holders of the ADSs of Telefónica. Any record holder of Telefónica ADSs may read such reports and communications or summaries thereof at Citibank’s office located at 388 Greenwich Street, 14th Floor, New York, New York 10013.
Not applicable.
We are exposed to various financial market risks as a result of: (i) our ordinary business activity, (ii) debt incurred to finance our business, (iii) our investments in companies, and (iv) other financial instruments related to the above commitments.
The main market risks affecting us are as follows:
|
|
a)
|
Exchange rate risk
|
Exchange rate risk arises primarily from (i) our international presence, through our investments and businesses in countries that use currencies other than the euro (primarily in Latin America, but also in the United Kingdom and the Czech Republic), and (ii) debt denominated in currencies other than that of the country where the business is conducted or the home country of the company incurring such debt.
|
|
b)
|
Interest rate risk
|
Interest rate risk arises primarily from changes in interest rates affecting (i) financial expenses on floating rate debt (or short-term debt likely to be renewed), due to changes in interest rates and (ii) the value of long-term liabilities at fixed interest rates.
|
|
c)
|
Share price risk
|
Share price risk arises primarily from changes in the value of our equity investments that may be bought, sold or otherwise involved in transactions, from changes in the value of derivatives associated with such investments, from changes in the value of our treasury shares and from equity derivatives.
We are also exposed to liquidity risk if a mismatch arises between our financing needs (including operating and financial expense, investment, debt redemptions and dividend commitments) and our sources of finance (including revenues, divestments, credit lines from financial institutions and capital market transactions). The cost of financing could also be affected by movements in credit spreads (over benchmark rates) demanded by lenders.
Finally, we are exposed to “country risk” (which overlaps with market and liquidity risks). This refers to the possible decline in the value of assets, cash flows generated or cash flows returned to the parent company as a result of political, economic or social instability in the countries where we operate, especially in Latin America.
We seek to actively manage these risks through the use of derivatives (primarily on exchange rates, interest rates and share prices) and by incurring debt in local currencies, where appropriate, with a view to stabilizing cash flows, our income statement and, to a lesser extent, part of the value of our investments. In this way, we attempt to protect our solvency, facilitate financial planning and take advantage of investment opportunities.
We manage our exchange rate risk and interest rate risk in terms of net debt and net financial debt as calculated by us. We believe that these parameters are more appropriate to understanding our debt position. Net debt and net financial debt take into account the impact of our cash balance and cash equivalents including derivatives positions with a positive value linked to liabilities. Neither net debt nor net financial debt as calculated by us should be considered an alternative to gross financial debt (the sum of current and non-current interest-bearing debt) as a measure of our liquidity. For a more detailed description on reconciliation of net debt and net financial debt to gross financial debt, see “Item 5. Operating and Financial Review and Prospects—Presentation of Financial Information—Non-GAAP financial information—Net financial debt and net debt.”
For a more detailed description on quantitative and qualitative disclosures about market risks see Note 16 to our Consolidated Financial Statements.
The Depositary of our ADR program is Citibank, N.A., and the address of its principal executive office is 388 Greenwich Street, 14th Floor, New York, New York 10013.
Our ADSs are listed on the New York Stock Exchange under the symbol “TEF.”
During 2010, each ADS represented the right to receive three ordinary shares of capital stock of €1.00 nominal value each, of Telefónica, S.A. Citibank, in its capacity as Depositary, effected a ratio change on the Telefónica, S.A.´s ADR program so that each ADS now represents the right to receive one ordinary share. The effective date of the ratio change was January 21, 2011. The Depositary issues ADSs in form of certificated ADSs (American Depositary Receipts, or ADRs) or uncertificated ADSs pursuant to the Deposit Agreement.
Under the terms of the Deposit Agreement, as of the date of this Annual Report, an ADS holder may have to pay the following services fees to the Depositary.
|
Category
|
Depositary Actions
|
Associated Fee / By Whom Paid
|
||
|
(a) Depositing or substituting the underlying shares
|
Issuance of ADSs upon the deposit of shares
|
Up to U.S.$5.00 for each 100 ADSs (or portion thereof) evidenced by the new ADSs delivered (charged to person depositing the shares or receiving the ADSs)(1)
|
||
|
(b) Receiving or distributing dividends
|
Distribution of cash dividends or other cash distributions; distribution of share dividends or other free share distributions; distribution of securities other than ADSs or rights to purchase additional ADSs
|
Up to U.S.$5.00 for each 100 ADSs (or portion thereof) held (in the case of cash distributions, deducted from the relevant distribution; in the case of all other distributions, billed to the relevant holder)(2)
|
||
|
(c) Selling or exercising rights
|
Distribution or sale of securities
|
Up to U.S.$5.00 for each 100 ADSs (or portion thereof) held (billed to the relevant holder)
|
||
|
(d) Withdrawing an underlying security
|
Acceptance of ADSs surrendered for withdrawal of deposited securities
|
Up to U.S.$5.00 for each 100 ADSs (or portion thereof) evidenced by the ADSs surrendered (charged to person surrendering or to person to whom withdrawn securities are being delivered)(1)
|
||
|
(e) Transferring, splitting or grouping receipts
|
Transfers
|
Up to U.S.$1.50 per ADS so presented (charged to person presenting certificate for transfer)
|
||
|
(f) General depositary services, particularly those charged on an annual basis
|
Other services performed by the Depositary in administering the ADSs
|
Up to U.S.$5.00 for each 100 ADSs (or portion thereof) held on the applicable record date (billed to person holding ADSs on applicable record date established by the Depositary)(2)
|
||
|
(g) Expenses of the Depositary
|
Certain fees and expenses incurred by the depositary bank and certain taxes and governmental charges in connection with:
·
compliance with foreign exchange control regulations or any law or regulation relating to foreign investment;
·
the Depositary or its custodian’s compliance with applicable law, rule or regulation;
·
stock transfer or other taxes and other governmental charges;
·
cable, telex, facsimile transmission/delivery;
·
expenses of the Depositary in connection with the conversion of foreign currency into U.S. dollars (which are paid out of such foreign currency);
·
any other charge payable by Depositary or its agents.
|
Expenses payable at the sole discretion of the Depositary (billed or deducted from cash distributions to person holding ADSs on applicable record date established by the Depositary)
|
|
(1)
|
In the case of ADSs issued by the Depositary into The Depository Trust Company (“DTC”) or presented to the Depositary via DTC, the ADS issuance and cancellation fees will be payable to the Depositary by DTC Participant(s) receiving the ADSs from the Depositary or the DTC Participant(s) surrendering the ADSs to the Depositary for cancellation, as the case may be, on behalf of the beneficial owner(s) and will be charged by the DTC Participant(s) to the account(s) of the applicable beneficial owner(s) in accordance with the procedures and practices of the DTC participant(s) as in effect at the time.
|
|
(2)
|
For ADSs held through DTC, the Depositary fees for distributions other than cash and the Depositary service fee are charged by the Depositary to the DTC Participants in accordance with the procedures and practices prescribed by DTC from time to time and the DTC Participants in turn charge the amount of such fees to the beneficial owners for whom they hold ADSs.
|
The Depositary has agreed to reimburse or pay on behalf of Telefónica, S.A, certain reasonable expenses related to our ADS program and incurred by us in connection with the program (such as NYSE listing fees, legal and accounting fees incurred with preparation of Form 20-F and ongoing SEC compliance and listing requirements, distribution of proxy materials, investor relations expenses, etc). The Depositary has covered all such expenses incurred by us during 2010 for an amount of $1,658,579. The amounts the Depositary reimbursed or paid are not perforce related to the fees collected by the depositary from ADS holders.
As part of its service to us, the Depositary has agreed to waive fees for the standard costs associated with the administration of our ADS program, associated operating expenses and investor relations advice estimated to total $125,000 for the year ended December 31, 2010.
None.
Not applicable.
Disclosure Controls and Procedures
Our Chief Executive Officer and our Chief Financial Officer, after evaluating the effectiveness of our disclosure controls and procedures (as defined in Rule 13a-15(e) under the Securities Exchange Act of 1934) as of the end of the period covered by this Form 20-F, have concluded that, as of such date, our disclosure controls and procedures were effective.
Management’s Annual Report on Internal Control over Financial Reporting
The management of Telefónica is responsible for establishing and maintaining adequate internal control over financial reporting as defined in Rule 13a–15(f) under the Securities Exchange Act of 1934. Telefónica’s internal control system is designed to provide reasonable assurance as to the reliability of financial reporting and the preparation of the published financial statements under generally accepted accounting principles.
Any internal control system, no matter how well designed, has inherent limitations, including the possibility of human error and the circumvention or overriding of the controls and procedures, which may not prevent or detect misstatements.
Telefónica management assessed the effectiveness of Telefónica’s internal control over financial reporting as of December 31, 2010. In making this assessment, it used the criteria set forth by the Committee of Sponsoring Organizations of the Treadway Commission (COSO) in Internal Control – Integrated Framework. Based on its assessment and those criteria, Telefónica management believes that, at December 31, 2010 Telefónica’s internal control over financial reporting is effective.
Report of the Independent Registered Public Accounting Firm
Telefónica’s independent registered public accounting firm, Ernst & Young S.L., has issued a report on the effectiveness of the company’s internal control over financial reporting. The report is included on page F-1.1.
Changes in Internal Control Over Financial Reporting
There were no changes in our internal control over financial reporting during the period covered by this Annual Report that have materially affected, or are reasonably likely to materially affect, our internal control over financial reporting.
Our Board of Directors has determined that Mr. Antonio Massanell Lavilla meets the requirements of an “audit committee financial expert” as defined by the SEC.
In December 2006, we adopted a code of business conduct and ethics, the Telefónica Business Principles, which apply to all Telefónica Group employees. In March 2008, we decided to modify such Business Principles in
order to gather in them all components of the code of ethics definition in Section 406 of Sarbanes-Oxley Act, and consequently our code of ethics for senior officers was replaced by the Telefónica Business Principles. These Principles were further modified on October 8, 2010 in order to include a new principle of privacy and data protection. A copy of the Telefónica Business Principles is filed as an Exhibit to this Annual Report. For more information, please see “Item 16G. Corporate Governance—Code of Ethics.”
The fees paid to the various member firms of the Ernst & Young international organization in 2009 and 2010, to which Ernst & Young, S.L. (the auditors of the Telefónica Group) belongs, amounted to €24.07 million and €27.71 million, respectively.
The detail of these amounts is as follows:
|
Year ended December 31,
|
||||||||
|
2009
|
2010
|
|||||||
|
(in millions of euros)
|
||||||||
|
Audit services (1)
|
22.62 | 25.75 | ||||||
|
Audit-related services (2)
|
1.40 | 1.92 | ||||||
|
Tax services (3)
|
0.01 | 0.03 | ||||||
|
All other services (4)
|
0.04 | 0.01 | ||||||
|
Total Fees
|
24.07 | 27.71 | ||||||
|
|
(1)
|
Audit services: services included under this heading are mainly the audit of the annual and review of the interim financial statements, work to comply with the requirements of the Sarbanes-Oxley Act (Section 404) and the review of our annual report on Form 20-F.
|
|
|
(2)
|
Audit-related services: services included under this heading are mainly related to the review of the information required by regulatory authorities, agreed financial reporting procedures not requested by legal or regulatory bodies and the review of corporate responsibility reports.
|
|
|
(3)
|
Tax services: services included under this heading are related to the review of tax obligations.
|
|
|
(4)
|
All other services: services included under this heading relate to training.
|
Ernst & Young’s fees include amounts in respect of fully and proportionately consolidated Telefónica Group companies. A total of €1.17 million and €0.04 million corresponding to 50% of the fees of proportionally consolidated companies were included in 2009 and 2010, respectively.
Fees paid to other auditors in 2009 and 2010 amounted to €21.60 million and €28.10 million, respectively.
The details concerning these amounts follow:
|
Year ended December 31,
|
||||||||
|
2009
|
2010
|
|||||||
|
(in millions of euros)
|
||||||||
|
Audit services
|
0.86 | 0.75 | ||||||
|
Audit-related services
|
2.17 | 1.26 | ||||||
|
Tax services
|
3.95 | 7.29 | ||||||
|
All other services
|
14.62 | 18.80 | ||||||
|
Total Fees
|
21.60 | 28.10 | ||||||
Other auditor’s fees includes amounts in respect of fully and proportionately consolidated Telefónica Group companies. In 2009 and 2010, such fees totaled €0.24 million and €0.02 million, respectively, corresponding to the inclusion of 50% of the fees relating to proportionally consolidated companies.
The amounts disclosed above for 2010 included the fees of Ernst & Young and other auditors in respect of 100% of the consolidated Vivo Group, as this was a controlled interest at year end. In 2009, 50% of these fees were included.
The Audit and Control Committee’s Pre-Approval Policies and Procedures
The engagement of any service rendered by our external auditor or any of its affiliates must always have the prior approval of our Audit and Control Committee. Such Committee has developed a Pre-approval Policy regarding the engagement of professional services by our external auditor, in accordance with the Spanish Audit Law and the Sarbanes-Oxley Act. This Policy establishes the obligation to obtain prior approval from our Audit and Control Committee for any service to be rendered by our external auditor to Telefónica or any of its subsidiaries.
This Policy sets forth restrictions on engaging our external auditor for the performance of non-audit services, according to which the engagement of our external auditor for the provision of such services is only permitted when there is no other firm available to provide the needed services at a comparable cost and with a similar level of quality. Moreover, this Policy prohibits the engagement of our external auditor for the provision of certain type of services that would be considered as “prohibited services.”
In addition, the Audit and Control Committee oversees the total amount of fees paid to our external auditor for the provision of non-audit services in order to assure that such fees do not exceed a certain percentage of the total amount of fees paid for the provision of audit services.
Not applicable.
The number of shares of treasury stock at December 31, 2010 amounted to 55,204,942 (6,329,530 at December 31, 2009). These treasury shares are directly owned by Telefónica, S.A., except for 16,896 shares held by Telefónica Móviles Argentina, S.A.
|
Year ended December 31, 2010
|
|||||||||||||
|
Period of Fiscal Year
|
Total Number of Shares Purchased
|
Average Price Paid per Share (euros)
|
Total Number of Shares (or Units) Purchased as Part of Publicly Announced Plans or Programs(1)
|
||||||||||
|
January 1 to January 31
|
5,500,000 | 18.06 | — | ||||||||||
|
February 1 to February 28
|
18,250,000 | 16.83 | — | ||||||||||
|
March 1 to March 31
|
2,250,000 | 17.80 | — | ||||||||||
|
April 1 to April 30
|
9,150,000 | 17.56 | — | ||||||||||
|
May 1 to May 31
|
5,700,000 | 15.60 | — | ||||||||||
|
June 1 to June 30
|
2,250,000 | 15.17 | — | ||||||||||
|
July 1 to July 31
|
1,125,000 | 16.94 | — | ||||||||||
|
August 1 to August 31
|
2,475,000 | 17.37 | — | ||||||||||
|
September 1 to September 30
|
750,000 | 18.05 | 635,808 | ||||||||||
|
October 1 to October 31
|
0 | 0.00 | — | ||||||||||
|
November 1 to November 30
|
3,350,000 | 17.65 | 3,350,000 | ||||||||||
|
December 1 to December 31
|
1,850,000 | 17.23 | 1,850,000 | ||||||||||
|
Total
|
52,650,000 | 15.69 | 5,835,808 | ||||||||||
|
|
(1)
|
A maximum of 5,025,657 shares could be assigned for the fifth phase (Start Date: July 1, 2010) of the Performance Share Plan. In addition, 810,151 shares have been assigned for the Global Employee Share Plan For a more detailed description of our plans or programs, see “Item 8. Financial Information—Dividend Information and Shareholders’ Return”, “Item 11. Quantitative and Qualitative Disclosures About Market Risk—Share Price Risk.” and “Item 6. Directors, Senior Management and Employees—Incentive Plans.”
|
During the years ended December 31, 2009 and 2010 and through the date of this Annual Report, the principal independent accountant engaged to audit our financial statements, Ernst & Young S.L., has not resigned, indicated that it has declined to stand for re-election after the completion of its current audit or been dismissed. For each of
the years ended December 31, 2009 and 2010, Ernst & Young S.L. has not expressed reliance on another accountant or accounting firm in its report on our audited annual accounts for such periods.
Significant Differences in Corporate Governance Practices
Corporate governance guidelines
In Spain, companies with securities listed on a Spanish stock exchange are expected to follow the Conthe Code published in May 2006, which contains corporate governance and shareholder disclosure recommendations. It combines and substitutes the former Spanish Corporate Governance Codes: the Olivencia Code of Good Governance and the Aldama Report. Spanish listed companies are required by law to publish an Annual Report on Corporate Governance and also to publish corporate governance information on their websites. We base our corporate governance procedures on the recommendations of the Conthe Code. As part of our corporate governance procedures, we have adopted regulations for our Board of Directors that govern, among other things, director qualification standards, responsibilities, compensation, access to management information, the Board of Directors’ purpose and each of our Board Committee’s purpose and responsibilities. Moreover, we have a Regulation of the General Shareholders’ Meeting that aims to reinforce its transparency, providing shareholders with a framework guaranteeing and facilitating exercise of their rights. The Annual Report on Corporate Governance published by us provides a detailed explanation of our corporate governance procedures and explains the role and duties of our Board of Directors and Board Committees. Our Annual Report on Corporate Governance is available on our website at www.telefonica.com. None of the information contained on our website is incorporated in this Annual Report.
Committees
We have had an Audit and Control Committee since 1997. Our Audit and Control Committee is composed of four non-executive directors, all of whom are deemed Rule 10A-3 independent by our Board of Directors. The functions, composition and competencies of this Committee are regulated by the Board of Directors’ Regulations and are similar to those required by the New York Stock Exchange. The Audit and Control Committee shall consist of not less than three nor more than five directors appointed by our Board of Directors. All Committee members shall be external directors. When appointing such members, our Board of Directors shall take into account the appointees’ knowledge and experience in matters of accounting, auditing and risk management.
We have had a Nominating, Compensation and Corporate Governance Committee since 1997, which is composed of five external directors. The functions, composition and competencies of this Committee are regulated by the Board of Directors’ Regulations and are very similar to those required by the NYSE. The Nominating, Compensation and Corporate Governance Committee shall consist of not less than three nor more than five directors appointed by the Board of Directors. All members of the Committee must be external directors and the majority thereof must be independent. The Chairman of the Nominating, Compensation and Corporate Governance Committee, who shall in all events be an independent director, shall be appointed from among its members.
Additionally we have a Human Resources and Corporate Reputation and Responsibility Committee, a Regulation Committee, a Service Quality and Customer Service Committee, an International Affairs Committee, an Innovation Committee and a Strategy Committee. The functions, composition and competencies are regulated by the Board of Directors’ Regulations.
Independence of the Board
As of the date of this Annual Report, we have 17 directors, out of which eight have been deemed independent by our Board of Directors attending to the director’s classification contained in the Conthe Corporate Governance Code. A significant majority of our current directors, 14, are non-executive directors. We, in accordance with the Conthe Code, assess the independence of our directors. Among other things, independent directors: (i) shall not be, past employees or executive directors of any of the Group companies, unless three or five years have elapsed
,
respectively, (ii) shall not receive any payment or other form of compensation from us or our group on top of their directors’ fees, unless the amount involved is not significant, (iii) shall not be partners, now or on the past three
years, in the external auditor or in the firm responsible for the audit report, (iv) shall not be executive directors or senior officers of another company where one of our executive directors or senior officers is an external director, (v) shall not have material business dealings with us or any other company in our group, (vi) shall not be spouses, nor partners maintaining an analogous affective relationship, nor close relative of any of our executive directors or senior officers and (vii) shall not stand in any of the situations listed in (i), (v) or (vi) above in relation to a significant shareholder or a shareholder with board representation.
The classification of each director shall be explained by the Board of Directors to the shareholders at the general shareholders’ meeting at which the appointment thereof must be made or ratified. Furthermore, such classification shall be reviewed annually by our Board of Directors after verification by the Nominating, Compensation and Corporate Governance Committee, and reported in the Annual Corporate Governance Report.
Internal Audit Function
We have an Internal Audit Department responsible for internal audit matters and for ensuring the efficiency of the internal audit control process of our different units. This Internal Audit Department reports directly to the Audit and Control Committee, thus supporting the adequate performance of all its functions.
Non-Executive Director Meetings
Pursuant to the NYSE listing standards, non-executive directors of U.S.-listed companies must meet on a regular basis without management present and the company must disclose a method for any interested parties to communicate directly with the non-executive directors. As a group, our non-executive directors do not meet formally without management present. Nevertheless, every committee of the Board of Directors is composed exclusively of non-executive directors (other than the Innovation Committee, which includes Julio Linares, one of our executive directors), thus giving each of these committees, the chance to analyze and discuss any matter related to our management, within its respective area of responsibility.
Whistleblowing
We have procedures in place that allow any employee to anonymously and confidentially report instances of fraud, alterations of financial information or specific risks to Telefónica and its subsidiaries.
Code of Ethics
The NYSE listing standards require U.S. companies to adopt a code of business conduct and ethics for directors, officers and employees, and promptly disclose any waivers of the code for directors or executive officers. In 2004 we adopted, as required by the Sarbanes-Oxley Act, a code of ethics that applied to our principal executive officer, principal financial officer and to our senior financial officers. In December 2006, we adopted a code of business conduct and ethics, the “Telefónica Business Principles,” which apply to all Telefónica Group employees. On March 2008, we decided to modify such Business Principles in order to incorporate within them all components of the code of ethics definition in Section 406 of Sarbanes Oxley Act, and consequently our code of ethics for senior officers was replaced by such Business Principles. These Principles were further modified on October 8, 2010 in order to include a new principle of privacy and data protection.
We also have an Internal Code of Conduct for securities markets issues to prevent insider trading misconduct and to control possible conflicts of interest. In addition, the Regulations of the Board of Directors set out in detail our directors’ main obligations relating to conflicts of interest concerning business opportunities, misappropriation of our assets, confidentiality and non-competition.
We have responded to Item 18 in lieu of responding to this Item.
Please see pages F-1.1 through F-148.
|
Exhibit Number
|
Description
|
|
|
1.1
|
Amended and Restated bylaws (English translation)*
|
|
|
4.1
|
Shareholders’ Agreement dated as of April 28, 2007 among Telefónica S.A., Assicurazioni Generali S.p.A., Sintonia S.A., Intesa Sanpaolo S.p.A., Mediobanca S.p.A.**
|
|
|
4.2
|
Co-investment Agreement dated as of April 28, 2007 among Telefónica S.A., Assicurazioni Generali S.p.A., Sintonia S.A., Intesa Sanpaolo S.p.A., Mediobanca S.p.A.**
|
|
|
4.3
|
Call Option Agreement, dated November 6, 2007, between Telefónica, S.A. and Telco***
|
|
|
4.4
|
Amendment to the Shareholders’ Agreement and Bylaws, dated November 19, 2007 among Telefónica S.A., Generali, Sintonia S.A., Intesa Sanpaolo S.p.A. and Mediobanca S.p.A.***
|
|
|
4.5
|
Renewal Agreement, dated October 28, 2009, by and among Telefónica S.A., Assicurazioni Generali S.p.A. (on its own behalf and on behalf of its subsidiaries Generali Vie S.A., Alleanza Toro S.p.A., INA Assitalia S.p.A., Generali Lebensversicherung A.G.), Intesa Sanpaolo S.p.A. and Mediobanca S.p.A. ****
|
|
|
4.6
|
Amendment Deed to the Call Option, dated October 28, 2009, by and between Telefónica S.A. and Telco S.p.A. ****
|
|
|
4.7
|
Subscription Agreement, dated September 6, 2009 between Telefónica, S.A. and China Unicom (Hong Kong) Limited*****
|
|
|
4.8
|
Enhance Strategic Alliance Agreement dated January 23, 2011 between Telefónica, S.A. and China Unicom (Hong Kong) Limited ******
|
|
|
8.1
|
Subsidiaries of Telefónica (see Note 1 to the Consolidated Financial Statements and Appendix V thereto)
|
|
|
11.1
|
Code of Ethics (“Telefónica Business Principles”)
|
|
|
12.1
|
Certification of César Alierta Izuel, Chief Executive Officer of Telefónica, pursuant to Section 302 of the Sarbanes-Oxley Act of 2002
|
|
|
12.2
|
Certification of Miguel Escrig Meliá, Chief Financial Officer of Telefónica, pursuant to Section 302 of the Sarbanes-Oxley Act of 2002
|
|
|
13.1
|
Certification pursuant to 18 U.S.C. Section 1350, as adopted pursuant to Section 906 of the Sarbanes-Oxley Act of 2002
|
|
*
|
Incorporated by reference to Telefónica’s Annual Report on Form 20-F for the fiscal year ended December 31, 2009
|
|
**
|
Incorporated by reference to Telefónica’s Annual Report on Form 20-F for the fiscal year ended December 31, 2006.
|
|
***
|
Incorporated by reference to Telefónica’s Schedule 13D/A filed on November 26, 2007.
|
|
****
|
Incorporated by reference to Telefónica’s Schedule 13D/A filed on November 23, 2009.
|
|
*****
|
Incorporated by reference to Telefónica’s Schedule 13D/A filed on September 17, 2009.
|
|
******
|
Incorporated by reference to Telefónica’s Schedule 13D filed on February 8, 2011.
|
We agree to furnish to the SEC upon request, copies of the instruments defining the rights of the holders of our long-term debt and of our subsidiaries’ long-term debt.
SIGNATURES
The registrant hereby certifies that it meets all of the requirements for filing on Form 20-F and has duly caused and authorized the undersigned to sign this Annual Report on its behalf.
|
TELEFÓNICA, S.A.
|
|||
|
By:
|
/s/ C
é
sar Alienta Izuel
|
||
|
Name:
|
C
é
sar Alienta Izuel
|
||
|
Title:
|
Chief Executive Officer
|
||
|
TELEFÓNICA, S.A.
|
|||
|
By:
|
/s/ Miguel Escrig Meli
á
|
||
|
Name:
|
Miguel Escrig Meli
á
|
||
|
Title:
|
Chief Financial Officer
|
||
Date: April 29, 2011
TELEFÓNICA, S.A. AND SUBSIDIARIES
COMPOSING THE TELEFÓNICA GROUP
| CONSOLIDATED FINANCIAL STATEMENTS (CONSOLIDATED ANNUAL ACCOUNTS) |
REPORT OF INDEPENDENT REGISTERED PUBLIC ACCOUNTING FIRM
The Board of Directors and Shareholders of
Telefónica, S.A.
We have audited Telefónica, S.A.’s internal control over financial reporting as of December 31, 2010, based on criteria established in Internal Control—Integrated Framework issued by the Committee of Sponsoring Organizations of the Treadway Commission (the COSO criteria). Telefónica, S.A.’s management is responsible for maintaining effective internal control over financial reporting, and for its assessment of the effectiveness of internal control over financial reporting included in the accompanying Annual Report on Internal Control over Financial Reporting. Our responsibility is to express an opinion on Telefónica, S.A.’s internal control over financial reporting based on our audit.
We conducted our audit in accordance with the standards of the Public Company Accounting Oversight Board (United States). Those standards require that we plan and perform the audit to obtain reasonable assurance about whether effective internal control over financial reporting was maintained in all material respects. Our audit included obtaining an understanding of internal control over financial reporting, assessing the risk that a material weakness exists, testing and evaluating the design and operating effectiveness of internal control based on the assessed risk, and performing such other procedures as we considered necessary in the circumstances. We believe that our audit provides a reasonable basis for our opinion.
A company’s internal control over financial reporting is a process designed to provide reasonable assurance regarding the reliability of financial reporting and the preparation of financial statements for external purposes in accordance with generally accepted accounting principles. A company’s internal control over financial reporting includes those policies and procedures that (1) pertain to the maintenance of records that, in reasonable detail, accurately and fairly reflect the transactions and dispositions of the assets of the company; (2) provide reasonable assurance that transactions are recorded as necessary to permit preparation of financial statements in accordance with generally accepted accounting principles, and that receipts and expenditures of the company are being made only in accordance with authorizations of management and directors of the company; and (3) provide reasonable assurance regarding prevention or timely detection of unauthorized acquisition, use, or disposition of the company’s assets that could have a material effect on the financial statements.
Because of its inherent limitations, internal control over financial reporting may not prevent or detect misstatements. Also, projections of any evaluation of effectiveness to future periods are subject to the risk that controls may become inadequate because of changes in conditions, or that the degree of compliance with the policies or procedures may deteriorate.
In our opinion, Telefónica, S.A. maintained, in all material respects, effective internal control over financial reporting as of December 31, 2010, based on the COSO criteria.
We also have audited, in accordance with the standards of the Public Company Accounting Oversight Board (United States), the consolidated statements of financial position of Telefónica, S.A. and subsidiaries as of December 31, 2010 and 2009, and the related consolidated statements of income, comprehensive income, changes in equity, and cash flows for each of the three years in the period ended December 31, 2010 and our report dated April 29, 2011 expressed an unqualified opinion thereon.
Ernst & Young S.L.
/s/ José Luis Perelli Alonso
José Luis Perelli Alonso
Madrid, Spain
April 29, 2011
REPORT OF INDEPENDENT REGISTERED PUBLIC ACCOUNTING FIRM
The Board of Directors and Shareholders of
Telefónica, S.A.
We have audited the accompanying consolidated statements of financial position of Telefónica, S.A. and subsidiaries as of December 31, 2010 and 2009, and the related consolidated statements of income, comprehensive income, changes in equity, and cash flows for each of the three years in the period ended December 31, 2010. These consolidated financial statements are the responsibility of Telefónica, S.A.’s Directors. Our responsibility is to express an opinion on these financial statements based on our audits.
We conducted our audits in accordance with the standards of the Public Company Accounting Oversight Board (United States). Those standards require that we plan and perform the audit to obtain reasonable assurance about whether the financial statements are free of material misstatement. An audit includes examining, on a test basis, evidence supporting the amounts and disclosures in the financial statements. An audit also includes assessing the accounting principles used and significant estimates made by management, as well as evaluating the overall financial statement presentation. We believe that our audits provide a reasonable basis for our opinion.
In our opinion, the financial statements referred to above present fairly, in all material respects, the consolidated financial position of Telefónica, S.A. and subsidiaries as of December 31, 2010 and 2009, and the consolidated results of their operations and their cash flows for each of the three years in the period ended December 31, 2010, in conformity with International Financial Reporting Standards as issued by the International Accounting Standards Board.
We also have audited, in accordance with the standards of the Public Company Accounting Oversight Board (United States), Telefónica S.A.’s internal control over financial reporting as of December 31, 2010, based on criteria established in Internal Control-Integrated Framework issued by the Committee of Sponsoring Organizations of the Treadway Commission and our report dated April 29, 2011 expressed an unqualified opinion thereon.
ERNST & YOUNG, S.L.
/s/ José Luis Perelli Alonso
José Luis Perelli Alonso
Madrid, Spain
April 29, 2011
TELEFÓNICA GROUP
CONSOLIDATED STATEMENT OF FINANCIAL POSITION AT DECEMBER 31
(MILLIONS OF EUROS)
|
ASSETS
|
NOTE
|
2010
|
2009
|
||||||
|
A) NON-CURRENT ASSETS
|
108,721 | 84,311 | |||||||
|
Intangible assets
|
(Note 6)
|
25,026 | 15,846 | ||||||
|
Goodwill
|
(Note 7)
|
29,582 | 19,566 | ||||||
|
Property, plant and equipment
|
(Note 8)
|
35,797 | 31,999 | ||||||
|
Investment properties
|
5 | 5 | |||||||
|
Investments in associates
|
(Note 9)
|
5,212 | 4,936 | ||||||
|
Non-current financial assets
|
(Note 13)
|
7,406 | 5,988 | ||||||
|
Deferred tax assets
|
(Note 17)
|
5,693 | 5,971 | ||||||
|
B) CURRENT ASSETS
|
21,054 | 23,830 | |||||||
|
Inventories
|
1,028 | 934 | |||||||
|
Trade and other receivables
|
(Note 11)
|
12,426 | 10,622 | ||||||
|
Current financial assets
|
(Note 13)
|
1,574 | 1,906 | ||||||
|
Tax receivables
|
(Note 17)
|
1,331 | 1,246 | ||||||
|
Cash and cash equivalents
|
(Note 13)
|
4,220 | 9,113 | ||||||
|
Non-current assets held for sale
|
475 | 9 | |||||||
|
TOTAL ASSETS (A + B)
|
129,775 | 108,141 | |||||||
|
EQUITY AND LIABILITIES
|
NOTE
|
2010 | 2009 | ||||||
|
A) EQUITY
|
31,684 | 24,274 | |||||||
|
Equity attributable to equity holders of the parent
|
24,452 | 21,734 | |||||||
|
Non-controlling interests
|
(Note 12)
|
7,232 | 2,540 | ||||||
|
B) NON-CURRENT LIABILITIES
|
64,599 | 56,931 | |||||||
|
Non-current interest-bearing debt
|
(Note 13)
|
51,356 | 47,607 | ||||||
|
Non-current trade and other payables
|
(Note 14)
|
2,304 | 1,249 | ||||||
|
Deferred tax liabilities
|
(Note 17)
|
6,074 | 3,082 | ||||||
|
Non-current provisions
|
(Note 15)
|
4,865 | 4,993 | ||||||
|
C) CURRENT LIABILITIES
|
33,492 | 26,936 | |||||||
|
Current interest-bearing debt
|
(Note 13)
|
9,744 | 9,184 | ||||||
|
Current trade and other payables
|
(Note 14)
|
19,251 | 14,023 | ||||||
|
Current tax payables
|
(Note 17)
|
2,822 | 2,766 | ||||||
|
Provisions
|
(Note 15)
|
1,675 | 963 | ||||||
|
TOTAL EQUITY AND LIABILITIES (A+B+C)
|
129,775 | 108,141 | |||||||
The accompanying Notes 1 to 24 and Appendices I to VI are an integral part of these consolidated statements of financial position.
TELEFÓNICA GROUP
CONSOLIDATED INCOME STATEMENTS FOR THE YEARS ENDED DECEMBER 31
(MILLIONS OF EUROS)
|
INCOME STATEMENT
|
NOTE
|
2010
|
2009
|
2008
|
|||||||||
|
Revenue from operations
|
(Note 19)
|
60,737 | 56,731 | 57,946 | |||||||||
|
Other income
|
(Note 19)
|
5,869 | 1,645 | 1,865 | |||||||||
|
Supplies
|
(17,606 | ) | (16,717 | ) | (17,818 | ) | |||||||
|
Personnel expenses
|
(8,409 | ) | (6,775 | ) | (6,762 | ) | |||||||
|
Other expenses
|
(Note 19)
|
(14,814 | ) | (12,281 | ) | (12,312 | ) | ||||||
|
Depreciation and amortization
|
(Note 19)
|
(9,303 | ) | (8,956 | ) | (9,046 | ) | ||||||
|
OPERATING INCOME
|
16,474 | 13,647 | 13,873 | ||||||||||
|
Share of profit (loss) of associates
|
(Note 9)
|
76 | 47 | (161 | ) | ||||||||
|
Finance income
|
792 | 814 | 827 | ||||||||||
|
Exchange gains
|
3,508 | 3,085 | 6,189 | ||||||||||
|
Finance costs
|
(3,329 | ) | (3,581 | ) | (3,648 | ) | |||||||
|
Exchange losses
|
(3,620 | ) | (3,625 | ) | (6,165 | ) | |||||||
|
Net financial expense
|
(Note 16)
|
(2,649 | ) | (3,307 | ) | (2,797 | ) | ||||||
|
PROFIT BEFORE TAX FROM CONTINUING OPERATIONS
|
13,901 | 10,387 | 10,915 | ||||||||||
|
Corporate income tax
|
(Note 17)
|
(3,829 | ) | (2,450 | ) | (3,089 | ) | ||||||
|
PROFIT FOR THE YEAR FROM CONTINUING OPERATIONS
|
10,072 | 7,937 | 7,826 | ||||||||||
|
Profit after tax from discontinued operations
|
(Note 18)
|
- | - | - | |||||||||
|
PROFIT FOR THE YEAR
|
10,072 | 7,937 | 7,826 | ||||||||||
|
Non-controlling interests
|
(Note 12)
|
95 | (161 | ) | (234 | ) | |||||||
|
PROFIT FOR THE YEAR ATTRIBUTABLE TO EQUITY HOLDERS OF THE PARENT
|
10,167 | 7,776 | 7,592 | ||||||||||
|
Basic and diluted earnings per share from continuing operations attributable to equity holders of the parent (euros)
|
(Note 19)
|
2.25 | 1.71 | 1.63 | |||||||||
|
Basic and diluted earnings per share attributable to equity holders of the parent (euros)
|
(Note 19)
|
2.25 | 1.71 | 1.63 | |||||||||
The accompanying Notes 1 to 24 and Appendices I to VI are an integral part of these consolidated income statements
|
CONSOLIDATED STATEMENT OF COMPREHENSIVE INCOME
|
Year ended December 31
|
||||||||||
|
(MILLIONS OF EUROS)
|
2010
|
2009
|
2008
|
||||||||
|
Profit for the year
|
10,072 | 7,937 | 7,826 | ||||||||
|
Other comprehensive income
|
|||||||||||
|
(Losses) gains on measurement of available-for-sale investments
|
(61 | ) | 638 | (1,167 | ) | ||||||
|
Reclassification of losses (gains) included in the income statement
|
202 | (4 | ) | (142 | ) | ||||||
|
Income tax impact
|
(57 | ) | (105 | ) | 281 | ||||||
| 84 | 529 | (1,028 | ) | ||||||||
|
(Losses) gains on hedges
|
(291 | ) | (794 | ) | 1,302 | ||||||
|
Reclassification of losses (gains) included in the income statement
|
73 | (77 | ) | 50 | |||||||
|
Income tax impact
|
62 | 262 | (402 | ) | |||||||
| (156 | ) | (609 | ) | 950 | |||||||
|
Translation differences
|
820 | 1,982 | (4,051 | ) | |||||||
|
Actuarial gains (losses) and impact of limit on assets for defined benefit pension plans (Note 15)
|
(94 | ) | (189 | ) | (182 | ) | |||||
|
Income tax impact
|
35 | 53 | 55 | ||||||||
| (59 | ) | (136 | ) | (127 | ) | ||||||
|
Share of (loss) income recognized directly in equity of associates
|
(84 | ) | 233 | (59 | ) | ||||||
|
Income tax impact
|
23 | 2 | (13 | ) | |||||||
| (61 | ) | 235 | (72 | ) | |||||||
|
Total other comprehensive income
|
628 | 2,001 | (4,328 | ) | |||||||
|
Total comprehensive income recognized in the year
|
10,700 | 9,938 | 3,498 | ||||||||
|
Attributable to:
|
|||||||||||
|
Equity holders of the parent
|
10,409 | 9,418 | 3,612 | ||||||||
|
Non-controlling interests
|
291 | 520 | (114 | ) | |||||||
| 10,700 | 9,938 | 3,498 | |||||||||
The accompanying Notes 1 to 24 and Appendices I to VI are an integral part of these consolidated statements of comprehensive income
|
Attributable to equity holders of the parent
|
|||||||||||||||||||||||||||||||||||||||
|
CONSOLIDATED STATEMENT OF CHANGES IN EQUITY (MILLIONS OF EUROS)
|
Share capital
|
Share premium
|
Legal reserve
|
Revaluation reserve
|
Treasury shares
|
Retained earnings
|
Available-for-sale investments
|
Hedges
|
Equity of associates
|
Translation differences
|
Total
|
Non-controlling interests
|
Total equity
|
||||||||||||||||||||||||||
|
Financial position at December 31, 2009
|
4,564 | 460 | 984 | 157 | (527 | ) | 16,685 | (39 | ) | 804 | 19 | (1,373 | ) | 21,734 | 2,540 | 24,274 | |||||||||||||||||||||||
|
Profit for the year
|
- | - | - | - | 10,167 | - | - | - | - | 10,167 | (95 | ) | 10,072 | ||||||||||||||||||||||||||
|
Other comprehensive income (loss)
|
- | - | - | - | - | (55 | ) | 84 | (156 | ) | (61 | ) | 430 | 242 | 386 | 628 | |||||||||||||||||||||||
|
Total comprehensive income
|
- | - | - | - | - | 10,112 | 84 | (156 | ) | (61 | ) | 430 | 10,409 | 291 | 10,700 | ||||||||||||||||||||||||
|
Dividends paid (Note 12)
|
- | - | - | - | - | (5,872 | ) | - | - | - | (5,872 | ) | (440 | ) | (6,312 | ) | |||||||||||||||||||||||
|
Net movement in treasury shares
|
- | - | - | - | (849 | ) | - | - | - | - | - | (849 | ) | - | (849 | ) | |||||||||||||||||||||||
|
Acquisitions and disposals of non-controlling interests and business combinations (Note 5)
|
- | - | - | - | - | - | - | - | - | - | - | 4,307 | 4,307 | ||||||||||||||||||||||||||
|
Other movements
|
- | - | - | (16 | ) | - | (954 | ) | - | - | - | - | (970 | ) | 534 | (436 | ) | ||||||||||||||||||||||
|
Financial position at December 31, 2010
|
4,564 | 460 | 984 | 141 | (1,376 | ) | 19,971 | 45 | 648 | (42 | ) | (943 | ) | 24,452 | 7,232 | 31,684 | |||||||||||||||||||||||
|
Financial position
at December 31, 2008
|
4,705 | 460 | 984 | 172 | (2,179 | ) | 16,069 | (566 | ) | 1,413 | (216 | ) | (3,611 | ) | 17,231 | 2,331 | 19,562 | ||||||||||||||||||||||
|
Profit for the year
|
- | - | - | - | - | 7,776 | - | - | - | - | 7,776 | 161 | 7,937 | ||||||||||||||||||||||||||
|
Other comprehensive income (loss)
|
- | - | - | - | - | (136 | ) | 527 | (609 | ) | 235 | 1,625 | 1,642 | 359 | 2,001 | ||||||||||||||||||||||||
|
Total comprehensive income
|
7,640 | 527 | (609 | ) | 235 | 1,625 | 9,418 | 520 | 9,938 | ||||||||||||||||||||||||||||||
|
Dividends paid (Note 12)
|
- | - | - | - | - | (4,557 | ) | - | - | - | - | (4,557 | ) | (295 | ) | (4,852 | ) | ||||||||||||||||||||||
|
Hyperinflation restatement to 01/01/09 (Note 2)
|
613 | 613 | - | 613 | |||||||||||||||||||||||||||||||||||
|
Net movement in treasury shares
|
- | - | - | - | (656 | ) | - | - | - | - | - | (656 | ) | - | (656 | ) | |||||||||||||||||||||||
|
Acquisitions and disposals of non-controlling interests
|
- | - | - | - | - | - | - | - | - | - | - | (122 | ) | (122 | ) | ||||||||||||||||||||||||
|
Capital reduction (Note 12)
|
(141 | ) | - | - | - | 2,308 | (2,167 | ) | - | - | - | - | - | - | - | ||||||||||||||||||||||||
|
Other movements
|
- | - | - | (15 | ) | - | (300 | ) | - | - | - | - | (315 | ) | 106 | (209 | ) | ||||||||||||||||||||||
|
Financial position
at December 31, 2009
|
4,564 | 460 | 984 | 157 | (527 | ) | 16,685 | (39 | ) | 804 | 19 | (1,373 | ) | 21,734 | 2,540 | 24,274 | |||||||||||||||||||||||
|
Financial position
at December 31, 2007
|
4,773 | 522 | 984 | 180 | (232 | ) | 13,025 | 457 | 463 | (144 | ) | 97 | 20,125 | 2,730 | 22,855 | ||||||||||||||||||||||||
|
Profit for the year
|
- | - | - | - | - | 7,592 | - | - | - | - | 7,592 | 234 | 7,826 | ||||||||||||||||||||||||||
|
Other comprehensive income (loss)
|
- | - | - | - | - | (127 | ) | (1,023 | ) | 950 | (72 | ) | (3,708 | ) | (3,980 | ) | (348 | ) | (4,328 | ) | |||||||||||||||||||
|
Total comprehensive income
|
7,465 | (1,023 | ) | 950 | (72 | ) | (3,708 | ) | 3,612 | (114 | ) | 3,498 | |||||||||||||||||||||||||||
|
Dividends paid (Note 12)
|
- | - | - | - | - | (4,165 | ) | - | - | - | - | (4,165 | ) | (333 | ) | (4,498 | ) | ||||||||||||||||||||||
|
Net movement in treasury shares
|
- | 1,074 | - | - | (3,151 | ) | (232 | ) | - | - | - | - | (2,309 | ) | - | (2,309 | ) | ||||||||||||||||||||||
|
Acquisitions and disposals of non-controlling interests
|
- | - | - | - | - | - | - | - | - | - | - | (42 | ) | (42 | ) | ||||||||||||||||||||||||
|
Capital reduction (Note 12)
|
(68 | ) | (1,136 | - | - | 1,204 | - | - | - | - | - | - | - | - | |||||||||||||||||||||||||
|
Other movements
|
- | - | - | (8 | ) | - | (24 | ) | - | - | - | - | (32 | ) | 90 | 58 | |||||||||||||||||||||||
|
Financial position
at December 31, 2008
|
4,705 | 460 | 984 | 172 | (2,179 | ) | 16,069 | (566 | ) | 1,413 | (216 | ) | (3,611 | ) | 17,231 | 2,331 | 19,562 | ||||||||||||||||||||||
The accompanying Notes 1 to 24 and Appendices I to VI are an integral part of these consolidated statements of changes in equity.
TELEFÓNICA GROUP
CONSOLIDATED STATEMENT OF CASH FLOWS FOR THE YEARS ENDED DECEMBER 31
(MILLIONS OF EUROS)
|
NOTE
|
2010
|
2009
|
2008
|
||||||||||
|
Cash flows from operating activities
|
|||||||||||||
|
Cash received from customers
|
72,867 | 67,358 | 69,060 | ||||||||||
|
Cash paid to suppliers and employees
|
(51,561 | ) | (46,198 | ) | (48,500 | ) | |||||||
|
Dividends received
|
136 | 100 | 113 | ||||||||||
|
Net interest and other financial expenses paid
|
(2,154 | ) | (2,170 | ) | (2,894 | ) | |||||||
|
Taxes paid
|
(2,616 | ) | (2,942 | ) | (1,413 | ) | |||||||
|
Net cash from operating activities
|
(Note 23)
|
16,672 | 16,148 | 16,366 | |||||||||
|
Cash flows from investing activities
|
|||||||||||||
|
Proceeds on disposals of property, plant and equipment and intangible assets
|
315 | 242 | 276 | ||||||||||
|
Payments on investments in property, plant and equipment and intangible assets
|
(8,944 | ) | (7,593 | ) | (7,889 | ) | |||||||
|
Proceeds on disposals of companies, net of cash and cash equivalents disposed
|
552 | 34 | 686 | ||||||||||
|
Payments on investments in companies, net of cash and cash equivalents acquired
|
(5,744 | ) | (48 | ) | (2,178 | ) | |||||||
|
Proceeds on financial investments not included under cash equivalents
|
173 | 6 | 31 | ||||||||||
|
Payments made on financial investments not included under cash equivalents
|
(1,599 | ) | (1,411 | ) | (114 | ) | |||||||
|
Interest (paid) received on cash surpluses not included under cash equivalents
|
(621 | ) | (548 | ) | 76 | ||||||||
|
Government grants received
|
7 | 18 | 11 | ||||||||||
|
Net cash used in investing activities
|
(Note 23)
|
(15,861 | ) | (9,300 | ) | (9,101 | ) | ||||||
|
Cash flows from financing activities
|
|||||||||||||
|
Dividends paid
|
(Note 12)
|
(6,249 | ) | (4,838 | ) | (4,440 | ) | ||||||
|
Transactions with equity holders
|
(883 | ) | (947 | ) | (2,241 | ) | |||||||
|
Proceeds on issue of debentures and bonds
|
(Note 13)
|
6,131 | 8,617 | 1,317 | |||||||||
|
Proceeds on loans, borrowings and promissory notes
|
9,189 | 2,330 | 3,693 | ||||||||||
|
Cancellation of debentures and bonds
|
(Note 13)
|
(5,482 | ) | (1,949 | ) | (1,167 | ) | ||||||
|
Repayments of loans, borrowings and promissory notes
|
(7,954 | ) | (5,494 | ) | (4,927 | ) | |||||||
|
Net cash flow used in financing activities
|
(Note 23)
|
(5,248 | ) | (2,281 | ) | (7,765 | ) | ||||||
|
Effect of foreign exchange rate changes on collections and payments
|
(463 | ) | 269 | (302 | ) | ||||||||
|
Effect of changes in consolidation methods and other non-monetary effects
|
7 | - | 14 | ||||||||||
|
Net increase (decrease) in cash and cash equivalents during the period
|
(4,893 | ) | 4,836 | (788 | ) | ||||||||
|
CASH AND CASH EQUIVALENTS AT JANUARY 1
|
9,113 | 4,277 | 5,065 | ||||||||||
|
CASH AND CASH EQUIVALENTS AT DECEMBER 31
|
(Note 13)
|
4,220 | 9,113 | 4,277 | |||||||||
|
RECONCILIATION OF CASH AND CASH EQUIVALENTS WITH THE STATEMENT OF FINANCIAL POSITION
|
|||||||||||||
|
BALANCE AT JANUARY 1
|
9,113 | 4,277 | 5,065 | ||||||||||
|
Cash on hand and at banks
|
3,830 | 3,236 | 2,820 | ||||||||||
|
Other cash equivalents
|
5,283 | 1,041 | 2,245 | ||||||||||
|
BALANCE AT DECEMBER 31
|
(Note 13)
|
4,220 | 9,113 | 4,277 | |||||||||
|
Cash on hand and at banks
|
3,226 | 3,830 | 3,236 | ||||||||||
|
Other cash equivalents
|
994 | 5,283 | 1,041 | ||||||||||
The accompanying Notes 1 to 24 and Appendices I to VI are an integral part of these consolidated statements of cash flow
TELEFÓNICA, S.A. AND SUBSIDIARIES COMPOSING THE TELEFÓNICA GROUP
NOTES TO THE CONSOLIDATED FINANCIAL STATEMENTS (CONSOLIDATED ANNUAL ACCOUNTS) FOR THE YEAR ENDED DECEMBER 31, 2010
|
(1)
|
BACKGROUND
AND GENERAL INFORMATION
|
Telefónica Group organizational structure
Telefónica, S.A. and its subsidiaries and investees make up an integrated group of companies (the “Telefónica Group” or "the Group”) operating mainly in the telecommunications, media and contact center industries.
The parent company of
this
Group is Telefónica, S.A. (also “Telefónica” or “the Company”), a public limited company incorporated
on April 19, 1924
for an indefinite period. Its registered office is at calle Gran Vía 28, Madrid (Spain).
Appendix V lists the subsidiaries, associates and investees in which the Telefónica Group has direct or indirect holdings, their corporate purpose, country, functional currency, share capital, the Telefónica Group’s effective shareholding and their method of consolidation.
Corporate structure of the Group
Telefónica’s basic corporate purpose, pursuant to Article 4 of its Bylaws, is the provision of all manner of public or private telecommunications services, including ancillary or complementary telecommunications services or related services.
All the business activities that constitute this stated corporate purpose may be performed either in Spain or abroad and wholly or partially by the Company, either through shareholdings or equity interests in other companies or legal entities with an identical or a similar corporate purpose.
The Telefónica Group follows a regional, integrated management model through three business areas defined by the geographical markets in which it operates, and with an integrated view of the wireline and wireless businesses:
|
|
-
|
Telefónica Spain
|
|
|
-
|
Telefónica Latin America
|
|
|
-
|
Telefónica Europe
|
The business activities carried out by most of the Telefónica Group companies are regulated by broad ranging legislation, pursuant to which permits, concessions or licenses must be obtained in certain circumstances to provide the various services.
In addition, certain wireline and wireless telephony services are provided under regulated rate and price systems.
A more detailed segmentation of the activities carried out by the Group is provided in Note 4.
|
(2)
|
BASIS OF PRESENTATION OF THE CONSOLIDATED FINANCIAL STATEMENTS
|
The accompanying consolidated financial statements were prepared from the accounting records of Telefónica, S.A. and of each of the companies comprising the Telefónica Group, whose individuals financial statements were prepared in accordance with the generally accepted accounting principles prevailing in the various countries in which they are located, and for
purposes of these consolidated financial statements are presented in accordance with the International Financial Reporting Standards (IFRS) as issued by the International Accounting Standards Board (IASB), which for the purposes of the Telefónica Group are not different from those issued by the European Union, to give a true and fair view of the consolidated equity and financial position at December 31, 2010, and of the consolidated results of operations, changes in consolidated equity and the consolidated cash flows obtained and used in the year then ended. The figures in these consolidated financial statements are expressed in millions of euros, unless otherwise indicated, and therefore may be rounded. The euro is the Group’s reporting currency.
The accompanying consolidated financial statements for the year ended December 31, 2010 were prepared by the Company’s Board of Directors at its meeting on February 23, 2011 for submission for approval at the General Shareholders’ Meeting, which is expected to occur without modification.
Note 3 contains a description of the most significant accounting policies used to prepare these consolidated financial statements.
For comparative purposes, the accompanying financial statements for 2010 include the consolidated statement of financial position at December 31, 2009 and the consolidated income statement, the consolidated statement of comprehensive income, the consolidated statement of changes in equity and the consolidated statement of cash flows, and the notes thereto for the years ended December 31, 2009 and 2008.
Comparative information and main changes in the consolidation scope
The main changes in the consolidation scope affecting comparability of the consolidated information for 2010 and 2009 (see Appendix I for a more detailed explanation of the changes in consolidation scope in both years and the main transactions in 2008) are as follows:
2010
|
a)
|
Acquisition of 50% of Brasilcel, N.V.
|
On July 28, 2010, Telefónica and Portugal Telecom, SGPS, S.A. (“Portugal Telecom”) signed an agreement for the acquisition by Telefónica, S.A. of 50% of the share capital of Brasilcel, N.V. (“Brasilcel”) owned by Portugal Telecom.
Brasilcel owned, approximately, 60% of Vivo Participaçoes, S.A.
This transaction was completed on September 27, 2010, terminating the joint venture agreements entered into by Telefónica and Portugal Telecom in 2002 (Note 21b).
Vivo Participaçoes, S.A. has been changed from the proportionate to full consolidation method within the scope of consolidation as of the transaction completion date.
Additionally
, in accordance with IFRS 3 (see Note 3.c),
the Group remeasured the previously held 50% investment in Brasilcel, generating a capital gain of 3,797 million euros, recognized under "Other income" in the accompanying consolidated income statement
(Note 19).
The main impacts of this transaction are explained in Note 5.
|
b)
|
Acquisition of HanseNet Telekommunikation GmbH
|
On December 3, 2009, Telefónica’s subsidiary in Germany, Telefónica Deutschland GmbH (“Telefónica Deutschland”), signed an agreement to acquire all of the shares of German company HanseNet Telekommunikation GmbH (“HanseNet”). The transaction
was completed on February 16, 2010, the date on which the Telefónica Group completed the acquisition of 100% of the shares of HanseNet. The amount initially paid out was approximately 913 million euros, which included 638 million euros of refinanced debt, and an acquisition cost in the amount of 275 million euros, which was ultimately reduced by 40 million euros upon completion of the transaction (Note 5).
The company has been included in the Telefónica Group’s consolidation scope under the full consolidation method.
|
c)
|
Reduction of stake in Portugal Telecom
|
In June 2010, the Telefónica Group reduced its ownership interest in Portugal Telecom by 7.98%, resulting in cash inflow of 631 million euros from the sale of the ownership interests. In addition, Telefónica entered into three equity swap contracts on the share trading price of Portugal Telecom shares with a number of financial institutions, subject to net settlement, which grant Telefónica the economic returns. The investment is no longer reflected in the scope of consolidation through the equity method of accounting (Note 9)
.
|
d)
|
Acquisition of DTS Distribuidora de Televisión Digital, S.A.
|
On December 28, 2010, the Telefónica Group completed the acquisition of a 22% stake in DTS Distribuidora de Televisión Digital, S.A., the provider of the pay-TV services offered by the PRISA Group. The acquisition cost amounted to 488 million euros, of which 228 million euros were used to repay the outstanding balance on the subordinated loan between Telefónica de Contenidos, S.A.U. and Sogecable, S.A.
This company has been included within the scope of consolidation through the equity method of accounting (Note 9)
.
|
e)
|
Devaluation of the Venezuelan bolivar
|
Regarding the devaluation of the Venezuelan bolivar on January 8, 2010, the two main factors to consider with respect to the Telefónica Group’s 2010 financial statements are:
|
|
·
|
The decrease in the Telefónica Group’s net assets in Venezuela as a result of the new exchange rate, with a balancing entry in translation differences under equity of the Group, which generated an effect of approximately 1,810 million euros at the date of devaluation.
|
|
|
·
|
The translation of results and cash flows from Venezuela at the new devalued closing exchange rate
.
|
2009
|
a)
|
Classification of Venezuela as a hyperinflationary economy
|
Throughout 2009 and in the early part of 2010, a number of factors arose in the Venezuelan economy that led the Telefónica Group to reconsider the treatment it follows with respect to the translation of the financial statements of investees, as well as the recovery of its financial investments in that country. These factors include the level of inflation reached in 2009 and the cumulative inflation rate over the last three years, the restrictions to the official foreign exchange market and, finally, the devaluation of the bolivar on January 8, 2010.
As a result, in accordance with IFRS, Venezuela was considered a hyperinflationary economy in 2009. The main implications of this were as follows:
|
|
·
|
Adjustment of the historical cost of non-monetary assets and liabilities and the various items of equity of these companies from their date of acquisition or inclusion in the consolidated statement of financial position to the end of the year for the changes in purchasing power of the currency caused by inflation.
|
The cumulative impact of the accounting restatement to adjust for the effects of hyperinflation for years prior to 2009 is shown in translation differences at the beginning of the 2009 financial year.
|
|
·
|
Adjustment of the income statement to reflect the financial loss caused by the impact of inflation in the year on net monetary assets (loss of purchasing power).
|
|
|
·
|
The various components in the income statement and statement of cash flows have been adjusted for the inflation index since their generation, with a balancing entry in financial results and offsetting reconciling item in the statement of cash flows, respectively.
|
|
|
·
|
All components of the financial statements of the Venezuelan companies have been translated at the closing exchange rate.
|
The main effects on the Telefónica Group’s consolidated financial statements for 2009 derived from the above are as follows:
|
Millions of euros
|
|||
|
Revenue
|
267 | ||
|
Net loss
|
(548 | ) | |
|
Translation differences
|
1,224 | ||
|
Impact on equity
|
676 | ||
|
b)
|
Tax amortization of goodwill
|
In December 2007, the European Commission opened an investigation involving the Kingdom of Spain with respect to the potential consideration as state aid of the tax deduction for the tax basis amortization of the goodwill generated on certain foreign investments under the provisions of article 12.5 of the revised Spanish corporate income tax law (“TRLIS”). This investigation led to widespread uncertainties regarding the scope of the European Commission’s decision on the future for, among others, the Telefónica Group.
In this regard, the Company deemed it necessary to recognize a liability as the deduction was applied in the consolidated financial statements until the investigation was concluded.
In December 2009, the text of the European Commission’s decision regarding the investigation was released, which deemed the deduction as state aid. Investments made prior to December 21, 2007 (as is the case for the Telefónica Group’s investments in O2 Group companies, the operators acquired from BellSouth, Colombia Telecomunicaciones, S.A., ESP and Telefónica O2 Czech Republic, a.s.) were not affected by this decision. As a result of this decision, and considering the corporate structure of these investments, the consolidated income statement of the Telefónica Group for the year ended December 31, 2009 reflects a lower income tax expense due to the reversal of this liability in an amount of 591 million euros.
|
c)
|
Share exchange between Telefónica and China Unicom Limited, and signing of strategic alliance agreement
|
On September 6, 2009, Telefónica and the Chinese telecommunications company, China Unicom (Hong Kong) Limited (“China Unicom”) entered into a wide strategic alliance which includes, among others, the areas of:
the joint procurement of infrastructure and client equipment; common development of mobile service platforms; joint provision of services to multinational customers; roaming; research and development; co-operation and sharing of best practices and technical, operational and management know-how; joint development of strategic initiatives in the area of the network evolution and joint participation in international alliances; and exchange of senior management
.
In addition, on the same date, Telefónica and China Unicom executed a mutual share exchange agreement, which was implemented on October 21, 2009 through the subscription by Telefónica, through its wholly owned subsidiary Telefónica Internacional, S.A.U., of 693,912,264 newly issued shares of China Unicom, satisfied by a contribution in kind to China Unicom of 40,730,735 shares of Telefónica, S.A
. (see Note 12).
Following the completion of the transaction, the Telefónica Group increased its share of China Unicom’s voting share capital from 5.38% to 8.06% and obtained the right to appoint a member to its board of directors, while China Unicom became owner of approximately 0.87% of Telefónica’s voting share capital at that date. Subsequently, after the capital reduction carried out by China Unicom, the Telefónica Group reached a shareholding equivalent to 8.37% of the company’s voting share capital.
The investment in China Unicom was included in the consolidation scope through the equity method of accounting.
On January 23, 2011, Telefónica and China Unicom broadened their Strategic Alliance Agreement (see Note 24 Events after the reporting period).
|
(3)
|
ACCOUNTING POLICIES
|
The principal accounting policies used in preparing the accompanying consolidated financial statements are as follows:
|
a)
|
Translation methodology
|
The financial statements of the Group’s foreign subsidiaries were translated to euros at the year-end exchange rates, except for:
|
1.
|
Capital and reserves, which were translated at historical exchange rates.
|
|
2.
|
Income statements, which were translated at the average exchange rates for the year.
|
|
3.
|
Statements of cash flow, which were translated at the average exchange rate for the year.
|
Goodwill and statement of financial position items remeasured to fair value when a stake is acquired in a foreign operation are recognized as assets and liabilities of the company acquired and therefore translated at the closing exchange rate.
The exchange rate differences arising from the application of this method are included in “Translation differences” under “Equity attributable to equity holders of the parent” in the accompanying consolidated statements of financial position, net of the portion of said differences attributable to non-controlling interests, which is shown under “Non-controlling interests.” When the Company loses control of a foreign subsidiary, either through total or partial sale or dilution of its interest, the entire cumulative translation difference since January 1, 2008 (the IFRS transition date) applicable to such operation is recognized in income together with any gain or loss from the loss of control. Transactions in the stock of subsidiaries that do not result in loss of control are recognized within equity, with a reallocation of the related cumulative translation difference. All other transactions resulting in the total or partial sale of the Company´s interest in an entity not controlled by the Company will result in a proportionate recognition of the related cumulative translation difference in income.
The financial statements of Group companies whose functional currency is the currency of a hyperinflationary economy are adjusted for inflation in accordance with the procedure described in the following paragraph prior to their translation to euros. Once restated, all the
items of the financial statements are converted to euros using the closing exchange rate. Amounts shown for prior years for comparative purposes are not modified.
To determine the existence of hyperinflation, the Group assesses the qualitative characteristics of the economic environment of the country, such as the trends in inflation rates over the previous three years. The financial statements of companies whose functional currency is the currency of a hyperinflationary economy are adjusted to reflect the changes in purchasing power of the local currency, such that all items in the statement of financial position not expressed in current terms (non-monetary items) are restated by applying a general price index at the financial statement closing date, and all income and expense, profit and loss are restated monthly by applying appropriate adjustment factors. The difference between initial and adjusted amounts is taken to profit or loss.
In that regard, as indicated in Note 2, Venezuela has been classified as a hyperinflationary economy in 2010 and 2009. The inflation rates used to prepare the restated financial information are those published by the Central Bank of Venezuela. On an annual basis, these rates are 27.18% and 25.06% for 2010 and 2009, respectively.
|
b)
|
Foreign currency transactions
|
Monetary transactions denominated in foreign currencies are translated to euros at the exchange rates prevailing on the transaction date, and are adjusted at year end to the exchange rates then prevailing.
All realized and unrealized exchange gains or losses are taken to the income statement for the year, with the exception of gains or losses arising from specific-purpose financing of investments in foreign investees designated as hedges of foreign currency risk to which these investments are exposed (see Note 3 i), and exchange gains or losses on intra-group loans considered part of the net investment in a foreign operation, which are included under “Other comprehensive income.”
|
c)
|
Goodwill
|
|
-
|
For acquisitions occurring after January 1, 2010, the effective date of Revised IFRS 3,
Business combinations
, goodwill represents the excess of acquisition cost over the fair values of identifiable assets acquired and liabilities assumed at the acquisition date. Cost of acquisition is the sum of the fair value of consideration delivered and the value attributed to existing non-controlling interests. For each business combination, the company determines the value of non-controlling interests at either their fair value or their proportional part of the net identifiable assets acquired. After initial measurement, goodwill is carried at cost, less any accumulated impairment losses. Whenever an equity interest is held in the acquiree prior to the business combination (business combinations achieved in stages), the carrying value of such previously held equity interest is remeasured at its acquisition-date fair value and the resulting gain or loss, if any, is recognized in profit or loss.
|
|
-
|
For acquisitions after January 1, 2004, the IFRS transition date, and prior to January 1, 2010, the effective date of Revised IFRS 3,
Business combinations
, goodwill represents the excess of the acquisition cost over the acquirer’s interest, at the acquisition date, in the fair values of identifiable assets, liabilities and contingent liabilities acquired from a subsidiary or joint venture. After initial measurement, goodwill is carried at cost, less any accumulated impairment losses.
|
|
-
|
In the transition to IFRS, Telefónica availed itself of the exemption allowing it not to restate business combinations taking place before January 1, 2004. As a result, the accompanying consolidated statements of financial position include goodwill net of
|
amortization deducted until December 31, 2003, arising before the IFRS transition date, from the positive consolidation difference between the amounts paid to acquire shares of consolidated subsidiaries, and their carrying amounts plus increases in the fair value of assets and liabilities recognized in equity.
In all cases, goodwill is recognized as an asset denominated in the currency of the company acquired.
Goodwill is tested for impairment annually or more frequently if there are certain events or changes indicating the possibility that the carrying amount may not be fully recoverable.
The potential impairment loss is determined by assessing the recoverable amount of the cash generating unit (or group of cash-generating units) to which the goodwill relates when originated. If this recoverable amount is less than the carrying amount, an irreversible impairment loss is recognized in income (see Note 3 f).
|
d)
|
Intangible assets
|
Intangible assets are stated at acquisition or production cost, less any accumulated amortization or any accumulated impairment losses.
The useful lives of intangible assets are assessed individually to be either finite or indefinite. Intangible assets with finite lives are amortized systematically over the useful economic life and assessed for impairment whenever events or changes indicate that their carrying amount may not be recoverable. Intangible assets with indefinite useful lives are not amortized, but are tested for impairment annually, or more frequently in the event of indications that their carrying amount may not be recoverable (see Note 3 f).
Management reassesses the indefinite useful life classification of these assets on an annual basis.
Amortization methods and schedules are revised annually at year end and, where appropriate, adjusted prospectively.
Research and development costs
Research costs are expensed as incurred. Costs incurred in developing new products to be marketed or used for the Group’s own network, and whose future economic viability is reasonably certain, are capitalized and amortized on a straight-line basis over the period during which the related project is expected to generate economic benefits, starting upon its completion.
Recoverability is considered to be reasonably assured when the Group can demonstrate the technical feasibility of completing the intangible asset, whether it will be available for use or sale, its intention to complete and its ability to use or sell the asset and how the asset will generate future economic benefits.
As long as intangible assets developed internally are not in use, the associated capitalized development costs are tested for impairment annually or more frequently if there are indications that the carrying amount may not be fully recoverable. Costs incurred in connection with projects that are not economically viable are charged to the consolidated income statement for the year in which this circumstance becomes known.
Service concession arrangements and licenses
These arrangements relate to the acquisition cost of the licenses granted to the Telefónica Group by various public authorities to provide telecommunications services and to the value assigned to licenses held by certain companies at the time they were included in the Telefónica Group.
These concessions are amortized on a straight-line basis over the duration of related licenses from the moment commercial exploitation commences.
Customer base
This primarily represents the allocation of acquisition costs attributable to customers acquired in business combinations, as well as the acquisition value of this type of assets in a third-party acquisition entailing consideration. Amortization is on a straight-line basis over the estimated period of the customer relationship.
Software
Software is stated at cost and amortized on a straight-line basis over its useful life, generally estimated to be between three and five years.
|
e)
|
Property, plant and equipment
|
Property, plant and equipment is stated at cost less any accumulated depreciation and any accumulated impairment in value. Land is not depreciated.
Cost includes external and internal costs comprising warehouse materials used, direct labor used in installation work and the allocable portion of the indirect costs required for the related investment. The latter two items are recorded as revenues under “Other income - Own work capitalized.” Cost includes, where appropriate, the initial estimate of decommissioning, retirement and site reconditioning costs when the Group is under obligation to incur such costs due to the use of the asset.
Interest and other financial expenses incurred and directly attributable to the acquisition or construction of qualifying assets are capitalized. Qualifying assets at the Telefónica Group are those assets that require a period of at least 18 months to bring the assets to their intended use or sale.
The costs of expansion, modernization or improvement leading to increased productivity, capacity or efficiency or to a lengthening of the useful lives of assets are capitalized when recognition requirements are met.
Upkeep and maintenance expenses are expensed as incurred.
The Telefónica Group assesses the need to write down, if appropriate, the carrying amount of each item of property, plant and equipment to its recoverable amount, whenever there are indications that the assets’ carrying amount exceeds the higher of its fair value less costs to sell or its value in use. The impairment provision is not maintained if the factors giving rise to the impairment disappear (see Note 3 f).
The Group’s subsidiaries depreciate their property, plant and equipment, net of their residual values, once they are in full working condition using the straight-line method based on the assets’ estimated useful lives, calculated in accordance with technical studies which are revised periodically based on technological advances and the rate of dismantling, as follows:
|
Years of estimated
|
|
|
useful life
|
|
|
Buildings
|
25 – 40
|
|
Plant and machinery
|
10 – 15
|
|
Telephone installations, networks and subscriber equipment
|
5 – 20
|
|
Furniture, tools and other items
|
2 – 10
|
Assets’ estimated residual values and methods and depreciation periods are reviewed, and adjusted if appropriate, prospectively at each financial year end.
|
f)
|
Impairment of non-current assets
|
Non-current assets, including property, plant and equipment, goodwill and intangible assets are evaluated at each reporting date for indications of impairment losses. Wherever such indications exist, or in the case of assets which are subject to an annual impairment test, recoverable amount is estimated. An asset’s recoverable amount is the higher of fair value less costs to sell and value in use. In assessing value in use, the estimated future cash flows deriving from the use of the asset or its cash generating unit, as applicable, are discounted to their present value using a pre-tax discount rate that reflects current market assessments of the time value of money and the risks specific to the asset. When the carrying amount of an asset exceeds its recoverable amount, the asset is considered to be impaired. In this case, the carrying amount is written down to recoverable amount and the resulting loss is taken to the income statement. Future depreciation or amortization charges are adjusted for the asset’s new carrying amount over its remaining useful life. Each asset is assessed individually for impairment, unless the asset does not generate cash inflows that are largely independent of those from other assets (or cash generating units).
The Group bases the calculation of impairment on the business plans of the various cash generating units to which the assets are allocated. These business plans generally cover a period of three to five years. For periods subsequent to the term of the strategic plan, an expected constant or decreasing growth rate is applied to the projections based on these plans. The growth rates used in 2010 and 2009 are as follows:
|
Rates
|
2010
|
2009
|
|
Businesses in Spain
|
0.91%-1.10%
|
0.88%-0.94%
|
|
Businesses in Latin America
|
1.66%-2.56%
|
1.21%-3.25%
|
|
Businesses in Europe
|
1.28%-1.46%
|
1.00%-2.00%
|
The main variables used by management to determine recoverable amounts are ARPU (average revenues per user), customer acquisition and retention costs, share of net adds in accesses, market shares, investments in non-current assets, growth rates and discount rates.
Discount rates are adjusted for country and specific business risks. The following ranges of rates were used in 2010 and 2009:
|
Rates
|
2010
|
2009
|
|
Businesses in Spain
|
7.8%-8.6%
|
6.8%-7.3%
|
|
Businesses in Latin America
|
7.2%-17.3%
|
8.6%-19.4%
|
|
Businesses in Europe
|
6.3%-10.9%
|
6.3%-8.5%
|
When there are new events or changes in circumstances that indicate that a previously recognized impairment loss no longer exists or has been decreased, a new estimate of the asset’s recoverable amount is made. A previously recognized impairment loss is reversed only if there has been a change in the estimates used to determine the asset’s recoverable amount since the last impairment loss was recognized. If that is the case, the carrying amount of the asset is increased to its recoverable amount. The reversal is limited to the net carrying amount that would have been determined had no impairment loss been recognized for the asset in prior years. Such reversal is recognized in profit or loss and the depreciation charge is adjusted in future periods to allocate the asset’s revised carrying amount. Impairment losses relating to goodwill cannot be reversed in future periods.
|
g)
|
Lease payments
|
The determination of whether an arrangement is, or contains a lease is based on the substance of the agreement and requires an assessment of whether the fulfillment of the arrangement is
dependent on the use of a specific asset and the agreement conveys a right to the Telefónica Group to the use of the asset.
Leases where the lessor does not transfer substantially all the risks and benefits of ownership of the asset are classified as operating leases. Operating lease payments are recognized as an expense in the income statement on a straight-line basis over the lease term.
Leases are classified as finance leases when the terms of the lease transfer substantially all the risks and rewards incidental to ownership of the leased item to the Group. These are classified at the inception of the lease, in accordance with its nature and the associated liability, at the lower of the present value of the minimum lease payments or the fair value of the leased property. Lease payments are apportioned between the finance costs and reduction of the principal of lease liability so as to achieve a constant rate of interest on the remaining balance of the liability. Finance costs are reflected in the income statement over the lease term.
|
h)
|
Investments in associates
|
The Telefónica Group’s investments in companies over which it exercises significant influence but does not control or jointly control with third parties are accounted for using the equity method. The Group evaluates whether it exercises significant influence not only on the basis of its percentage ownership but also on the existence of qualitative factors such representation on the board of directors of the investee, its participation in decision-making processes, interchange of managerial personnel and access to technical information.
The carrying amount of investments in associates includes related goodwill and the consolidated income statement reflects the share of profit or loss from operations of the associate. If the associate recognizes any gains or losses directly in equity, the Group also recognizes the corresponding portion of these gains or losses directly in its own equity.
The Group assesses the existence of indicators of impairment of the investment in each associate at each reporting date in order to recognize any required valuation adjustments. To do so, the recoverable value of the investment as a whole is determined as described in Note 3f.
|
i)
|
Financial assets and liabilities
|
|
|
Financial investments
|
All normal purchases and sales of financial assets are recognized in the statement of financial position on the trade date, i.e. the date that the Company commits to purchase or sell the asset. The Telefónica Group classifies its financial instruments into four categories for initial recognition purposes: financial assets at fair value through profit or loss, loans and receivables, held-to-maturity investments and available-for-sale financial assets. When appropriate, the Company re-evaluates the designation at each financial year end.
Financial assets held for trading, i.e., investments made with the aim of realizing short-term returns as a result of price changes, are included in the category
financial assets at fair value through profit or loss
and presented as current assets. Derivatives are classified as held for trading unless they are designated as effective hedging instruments. The Group also classifies certain financial instruments under this category when doing so eliminates or mitigates measurement or recognition inconsistencies that could arise from the application of other criteria for measuring assets and liabilities or for recognizing gains and losses on different bases. Also in this category are financial assets for which an investment and disposal strategy has been designed based on their fair value. Financial instruments included in this category are recorded at fair value and are remeasured at subsequent reporting dates at fair value, with any realized or unrealized gains or losses recognized in the income statement.
Financial assets with fixed maturities that the Group has the positive intention and ability – legal and financial – to hold until maturity are classified as
held-to-maturity
and presented as “
Current assets
” or “
Non-current assets
,” depending on the time left until settlement. Financial assets falling into this category are measured at amortized cost using the effective interest rate method. Gains and losses are recognized in the income statement when the investments are settlement or impaired, as well as through the amortization process.
Financial assets which the Group intends to hold for an unspecified period of time and could be sold at any time to meet specific liquidity requirements or in response to interest-rate movements are classified as
available-for-sale
. These investments are recorded under “Non-current assets,” unless it is probable and feasible that they will be sold within 12 months. Financial assets in this category are measured at fair value. Gains or losses arising from changes in fair value are recognized in equity at each financial year end until the investment is derecognized or determined to be impaired, at which time the cumulative gain or loss previously reported in equity is recognized in profit or loss. Dividends from
available-for-sale
investments are recognized in the income statement when the Group has the right to receive the dividend. Fair value is determined in accordance with the following criteria:
|
1.
|
Listed securities on active markets:
|
Fair value is considered to be quoted market prices or other valuation references available at the closing date.
|
2.
|
Unlisted securities:
|
Fair value is determined using valuation techniques such as discounted cash flow analysis, option valuation models, or by reference to arm’s length market transactions. When fair value cannot be reliably determined, these investments are carried at cost.
Loans and receivables
include financial assets with fixed or determinable payments that are not quoted in an active market and do not fall into any of the previous categories. These assets are carried at amortized cost using the effective interest rate method. Gains and losses are recognized in the income statement when the loans and receivables are derecognized or impaired, as well as through the amortization process. Trade receivables are recognized at the original invoice amount. A valuation adjustment is recorded when there is objective evidence of customer collection risk. The amount of the valuation adjustment is calculated as the difference between the carrying amount of the doubtful trade receivables and their recoverable amount. As a general rule, current trade receivables are not discounted.
The Group assesses at each reporting date whether a financial asset is impaired. If there is objective evidence that an impairment loss on a financial asset carried at amortized cost has been incurred, the amount of the loss is measured as the difference between the asset’s carrying amount and the present value of estimated future cash flows (excluding future expected credit losses that have not been incurred) discounted at the financial asset’s original effective interest rate.
For equity instruments included in
available-for-sale
financial assets, the Company assesses individually for each security whether there is any objective evidence that an asset is impaired as a result of one or more events indicating that the carrying amount of the security will not be recovered. If there is objective evidence that an
available-for-sale
financial instrument is impaired, the cumulative loss recognized in equity, measured as the difference between the acquisition cost (net of any principal payments and amortization made) and the fair value at that date, less any impairment loss on that investment previously recognized in the income statement.
Financial assets are only fully or partially derecognized when:
|
1.
|
The rights to receive cash flows from the asset have expired.
|
|
2.
|
An obligation to pay the cash flows received from the asset to a third party has been assumed.
|
|
3.
|
The rights to receive cash flows from the asset have been transferred to a third party and all the risks and rewards of the asset have been substantially transferred.
|
Cash and cash equivalents
Cash and cash equivalents comprise cash on hand and at banks, demand deposits and other highly liquid investments with an original maturity of three months or less. These items are stated at historical cost, which does not differ significantly from realizable value.
For the purpose of the consolidated statement of cash flows, cash and cash equivalents are shown net of any outstanding bank overdrafts.
Preferred stock
Preferred shares are classified as a liability or equity instrument depending on the issuance terms. A preferred share issue is considered equity only when the issuer is not obliged to give cash or another financial instrument in the form of either principle repayment or dividend payment, whereas it is recorded as a financial liability on the statement of financial position whenever the Telefónica Group does not have the right to avoid cash payments.
Issues and interest-bearing debt
These debts are recognized initially at the fair value of the consideration received less directly attributable transaction costs. After initial recognition, these financial liabilities are measured at amortized cost using the effective interest rate method. Any difference between the cash received (net of transaction costs) and the repayment value is recognized in the income statement over the life of the debt. Interest-bearing debt is considered non-current when its maturity is over 12 months or the Telefónica Group has full discretion to defer settlement for at least another 12 months from the reporting date.
Financial liabilities are derecognized when the obligation under the liability is discharged, cancelled or expires. Where an existing financial liability is replaced by another from the same lender under substantially different terms, such an exchange is treated as a derecognition of the original liability and the recognition of a new liability, and the difference between the respective carrying amounts is recognized in the income statement.
Derivative financial instruments and hedge accounting
Derivative financial instruments are initially recognized at fair value, normally equivalent to cost. Their carrying amounts are subsequently remeasured at fair value. Derivatives are carried as assets when the fair value is positive and as liabilities when the fair value is negative. They are classified as current or non-current depending on whether they fall due within less than or after one year, respectively. Derivatives that meet all the criteria for consideration as long-term hedging instruments are recorded as non-current assets or liabilities, depending on their positive or negative values.
The accounting treatment of any gain or loss resulting from changes in the fair value of a derivative depends on whether the derivative in question meets all the criteria for hedge accounting and, if appropriate, on the nature of the hedge.
The Group designates certain derivatives as:
|
1.
|
Fair value hedges, when hedging the exposure to changes in the fair value of a recognized asset or liability; or
|
|
2.
|
Cash flow hedges, when hedging exposure to variability in cash flows that is either attributable to a particular risk associated with a recognized asset or liability or a forecast transaction; or
|
|
3.
|
Hedges of a
net investment in a foreign operation
.
|
A hedge of the foreign currency risk in a firm commitment is accounted for as either a fair value or a cash flow hedge.
Changes in fair value of derivatives that qualify as fair value hedges are recognized in the income statement, together with changes in the fair value of the hedged asset or liability attributable to the risk being hedged.
Changes in the fair value of derivatives that qualify and have been assigned to hedge cash flows, which are highly effective, are recognized in equity. The portion considered ineffective is taken directly to the income statement. Fair value changes from hedges that relate to firm commitments or forecast transactions that result in the recognition of non-financial assets or liabilities are included in the initial measurement of those assets or liabilities. Otherwise, changes in fair value previously recognized in equity are recognized in the income statement in the period in which the hedged transaction affects profit or loss.
An instrument designed to hedge foreign currency exposure from a net investment in a foreign operation is accounted for in a similar manner to cash flow hedges.
The application of the Company’s corporate risk-management policies could result in financial risk-hedging transactions that make economic sense, yet do not comply with the criteria and effectiveness tests required by accounting policies to be treated as hedges. Alternatively, the Group may opt not to apply hedge accounting criteria in certain instances. In these cases, gains or losses resulting from changes in the fair value of derivatives are taken directly to the income statement. Transactions used to reduce the exchange rate risk relating to the income contributed by foreign subsidiaries are not treated as hedging transactions.
From inception, the Group formally documents the hedging relationship between the derivative and the hedged item, as well as the associated risk management objectives and strategies. The documentation includes identification of the hedge instrument, the hedged item or transaction and the nature of the risk being hedged. In addition, it states how it will assess the hedging instrument’s effectiveness in offsetting the exposure to changes in the hedged item’s fair value or cash flows attributable to the hedged risk. Hedge effectiveness is assessed, prospectively and retrospectively, both at the inception of the hedge relationship and on a systematic basis throughout the life of the hedge.
Hedge accounting is discontinued whenever the hedging instrument expires or is sold, terminated or settled, the hedge no longer meets the criteria for hedge accounting or the Company revokes the designation. In these instances, gains or losses accumulated in equity are not taken to the income statement until the forecast transaction or commitment affects profit or loss. However, if the hedged transaction is no longer expected to occur, the cumulative gains or losses recognized directly in equity are taken immediately to the income statement.
The fair value of the derivative portfolio includes estimates based on calculations using observable market data, as well as specific pricing and risk-management tools commonly used by financial entities.
|
j)
|
Inventories
|
Materials stored for use in investment projects and inventories for consumption and replacement are valued at the lower of weighted average cost and net realizable value.
When the cash flows associated with the purchase of inventory are effectively hedged, the corresponding gains and losses accumulated in equity become part of the cost of the inventories acquired.
Obsolete, defective or slow-moving inventories have been written down to estimated net realizable value. The recoverable amount of inventory is calculated based on inventory age and turnover.
|
k)
|
Treasury share
instruments
|
Treasury shares are stated at cost and deducted from equity. Any gain or loss obtained on the purchase, sale, issue or cancellation of treasury shares is recognized directly in equity.
Call options on treasury shares to be settled through physical delivery of a fixed number of shares at a fixed price are considered treasury share instruments. They are valued at the amount of premium paid and are presented as a reduction of equity.
If the call options are exercised upon maturity, the amount previously recognized is reclassified as treasury shares together with the price paid. If the options are not exercised upon maturity, the amount is recognized directly in equity.
|
l)
|
Provisions
|
Pensions and other employee obligations
Provisions required to cover the accrued liability for defined-benefit pension plans are determined using “the projected unit credit” actuarial valuation method. The calculation is based on demographic and financial assumptions for each country considering the macroeconomic environment. The discount rates are determined based on market yield curves. Plan assets are measured at fair value. Actuarial gains and losses on post-employment defined-benefit plans are recognized immediately in equity.
For defined-contribution pension plans, the obligations are limited to the payment of the contributions, which are taken to the income statement as accrued.
Provisions for post-employment benefits (e.g. early retirement or other) are calculated individually based on the terms agreed with the employees. In some cases, these may require actuarial valuations based on both demographic and financial assumptions.
Other provisions
Provisions are recognized when the Group has a present obligation (legal or constructive), as a result of a past event, it is probable that an outflow of resources embodying economic benefits will be required to settle the obligation and a reliable estimate can be made of the amount of the obligation. When the Group expects some or all of a provision to be reimbursed, for example under an insurance contract, the reimbursement is recognized as a separate asset, but only when the reimbursement is virtually certain. The expense relating to any provision is presented in the income statement net of any reimbursement. If the effect of the time value of money is material, provisions are discounted, and the corresponding increase in the provision due to the passage of time is recognized as a finance cost.
|
m)
|
Share-based payments
|
The Group has compensation systems linked to the market value of its shares, providing employees share options. Compensation plans are cash-settled in certain cases, while equity-settled in others.
For cash-settled share-based transactions, the total cost of the rights granted is recognized as an expense in the income statement over the vesting period with recognition of a corresponding liability (“Performance period”). The total cost of the options is measured initially at fair value at the grant date using statistical techniques, taking into account the terms and conditions established in each share option plan. At each subsequent reporting date, the Group reviews its estimate of fair value and the number of options it expects to be settled, remeasuring the liability, with any changes in fair value recognized in the income statement.
For equity-settled share option plans, fair value at the grant date is measured by applying statistical techniques or using benchmark securities. The cost is recognized, together with a corresponding increase in equity, over the vesting period. At each subsequent reporting date, the Company reviews its estimate of the number of options it expects to vest, with a corresponding adjustment to equity.
|
n)
|
Corporate income
tax
|
This heading in the accompanying consolidated income statement includes all the expenses and credits arising from the corporate income tax levied on the Spanish Group companies and similar taxes applicable to the Group’s foreign operations.
The income tax expense of each year includes both current and deferred taxes, where applicable.
Current tax assets and liabilities for the current and prior periods are measured at the amount expected to be recovered from or paid to the taxation authorities. The tax rates and tax laws used to compute the amount are those that are enacted or substantively enacted by the reporting date.
Deferred taxes are calculated based on a statement of financial position analysis of the temporary differences generated as a result of the difference between the tax bases of assets and liabilities and their respective carrying amounts.
The main temporary differences arise due to discrepancies between the tax bases and carrying amounts of plant, property and equipment, intangible assets, and non-deductible provisions, as well as differences in the fair value and tax bases of net assets acquired from a subsidiary, associate or joint venture.
Furthermore, deferred taxes arise from unused tax credits and tax loss carryforwards.
The Group determines deferred tax assets and liabilities by applying the tax rates that will be effective when the corresponding asset is received or the liability is settled, based on tax rates and tax laws that are enacted (or substantively enacted) at the reporting date.
Deferred income tax assets and liabilities are not discounted to present value and are classified as non-current, irrespective of the date of their reversal.
The carrying amount of deferred income tax assets is reviewed at each reporting date and reduced to the extent that it is no longer probable that sufficient taxable profit will be available to allow all or part of the deferred income tax asset to be utilized. Unrecognized deferred income tax assets are reassessed at each reporting date and are recognized to the extent that it has become probable that future taxable profit will allow the deferred tax asset to be recovered.
Deferred tax liabilities on investments in subsidiaries, branches, associates and joint ventures are not recognized if the parent company is in a position to control the timing of the reversal and if the reversal is unlikely to take place in the foreseeable future.
Deferred income tax relating to items directly recognized in equity is recognized in equity. Deferred tax assets and liabilities arising from the initial recognition of the purchase price
allocation of business combinations impact the amount of goodwill. However, subsequent changes in tax assets acquired in a business combination are recognized as an adjustment to profit or loss.
Deferred tax assets and liabilities are offset if a legally enforceable right exists to set off current tax assets against current tax liabilities and the deferred taxes relate to the same taxable entity and the same taxation authority.
|
o)
|
Revenue
and expenses
|
Revenue and expenses are recognized on the income statement based on an accruals basis; i.e. when the goods or services represented by them take place, regardless of when actual payment or collection occurs.
The Telefónica Group principally obtains revenues from providing the following telecommunications services: traffic, connection fees, regular (normally monthly) network usage fees, interconnection, network and equipment leasing, handset sales and other services such as pay-TV and value-added services (e.g. text or data messaging) and maintenance. Products and services may be sold separately or in promotional packages (bundled).
Revenues from calls carried on Telefónica’s networks (traffic) entail an initial call establishment fee plus a variable call rate, based on call length, distance and type of service. Both wireline and wireless traffic is recognized as revenue as service is provided. For prepaid calls, the amount of unused traffic generates a deferred revenue recognized in “Trade and other payables” on the statement of financial position. Prepaid cards generally expire within 12 months and any deferred revenue from prepaid traffic is taken directly to the income statement when the card expires as the Group has no obligation to provide service after this date.
Revenue from traffic sales and services at a fixed rate over a specified period of time (flat rate) are recognized on a straight-line basis over the period of time covered by the rate paid by the customer.
Connection fees arising when customers connect to the Group’s network are deferred and taken to the income statement throughout the average estimated customer relationship period, which varies by type of service. All related costs, except those related to network enlargement expenses, administrative expenses and overhead, are recognized in the income statement as incurred.
Installment fees are taken to the income statement on a straight-line basis over the related period. Equipment leases and other services are taken to profit or loss as they are consumed.
Interconnection fees from wireline-wireless and wireless-wireline calls and other customer services are recognized in the period in which the calls are made.
Revenues from handset and equipment sales are recognized once the sale is considered complete, i.e., generally when delivered to the end customer.
In the wireless telephony business there are loyalty campaigns whereby customers obtain points for the telephone traffic they generate. The amount assigned to points awarded is recognized as deferred income until the points are exchanged and recognized as sales or services according to the product or service chosen by the customer. This exchange can be for discounts on the purchase of handsets, traffic or other types of services depending on the number of points earned and the type of contract involved. The accompanying consolidated statements of financial position include the related deferred revenue, based on an estimate of the value of the points accumulated at year end, under “Trade and other payables.”
Bundle packages, which include different elements, are sold in the wireline, wireless and internet businesses. They are assessed to determine whether it is necessary to separate the
separately identifiable elements and apply the corresponding revenue recognition policy to each element. Total package revenue is allocated among the identified elements based on their respective fair values (i.e. the fair value of each element relative to the total fair value of the package).
As connection or initial activation fees, or upfront non-refundable fees, cannot be separately identifiable as elements in these types of packages, any revenues received from customer for these items are allocated to the remaining elements. However, amounts contingent upon delivery of undelivered elements are not allocated to delivered elements.
All expenses related to mixed promotional packages are taken to the income statement as incurred.
|
p)
|
Use of estimates, assumptions and judgments
|
The key assumptions concerning the future and other relevant sources of uncertainty in estimates at the reporting date that could have a significant impact on the consolidated financial statements within the next financial year are discussed below.
A significant change in the facts and circumstances on which these estimates and related judgments are based could have a material impact on the Group’s results and financial position.
Property, plant and equipment, intangible assets and goodwill
The accounting treatment of investments in property, plant and equipment and intangible assets entails the use of estimates to determine the useful life for depreciation and amortization purposes and to assess fair value at their acquisition dates for assets acquired in business combinations.
Determining useful life requires making estimates in connection with future technological developments and alternative uses for assets. There is a significant element of judgment involved in making technological development assumptions, since the timing and scope of future technological advances are difficult to predict.
When an item of property, plant and equipment or an intangible asset is considered to be impaired, the impairment loss is recognized in the income statement for the period. The decision to recognize an impairment loss involves estimates of the timing and amount of the impairment, as well as analysis of the reasons for the potential loss. Furthermore, additional factors, such as technological obsolescence, the suspension of certain services and other circumstantial changes are taken into account.
The Telefónica Group evaluates its cash-generating units’ performance regularly to identify potential goodwill impairments. Determining the recoverable amount of the cash-generating units to which goodwill is allocated also entails the use of assumptions and estimates and requires a significant element of judgment.
Deferred income taxes
The Group assesses the recoverability of deferred tax assets based on estimates of future earnings. The ability to recover these taxes depends ultimately on the Group’s ability to generate taxable earnings over the period for which the deferred tax assets remain deductible. This analysis is based on the estimated schedule for reversing deferred tax liabilities, as well as estimates of taxable earnings, which are sourced from internal projections and are continuously updated to reflect the latest trends.
The recognition of tax assets and liabilities depends on a series of factors, including estimates as to the timing and realization of deferred tax assets and the projected tax payment schedule.
Actual Group company income tax receipts and payments could differ from the estimates made by the Group as a result of changes in tax legislation or unforeseen transactions that could affect tax balances.
Provisions
Provisions are recognized when the Group has a present obligation as a result of a past event, it is probable that an outflow of resources will be required to settle the obligation and a reliable estimate can be made of the amount of the obligation. This obligation may be legal or constructive, deriving from inter alia regulations, contracts, normal practices or public commitments that lead third parties to reasonably expect that the Group will assume certain responsibilities. The amount of the provision is determined based on the best estimate of the outflow of resources required to settle the obligation, bearing in mind all available information at the statement of financial position date, including the opinions of independent experts such as legal counsel or consultants.
Given the uncertainties inherent in the estimates used to determine the amount of provisions, actual outflows of resources may differ from the amounts recognized originally on the basis of the estimates.
Revenue recognition
Connection fees
Connection fees, generated when customers connect to the Group’s network, are deferred and recognized as revenue over the average estimated customer relationship period.
The estimate of the average estimated customer relationship period is based on the recent history of customer churn. Potential changes in estimates could lead to changes in both the amount and timing of the future recognition of revenues.
Bundled offers
Bundled offers that combine different elements are assessed to determine whether it is necessary to separate the different identifiable components and apply the corresponding revenue recognition policy to each element. Total package revenue is allocated among the identified elements based on their respective fair values.
Determining fair values for each identified element requires estimates that are complex due to the nature of the business.
A change in estimates of fair values could affect the apportionment of revenue among the elements and, as a result, the date of recognition of revenues.
|
q)
|
Consolidation methods
|
The consolidation methods applied are as follows:
|
-
|
Full consolidation method for companies over which the Company controls either by exercising effective control or by virtue of agreements with the other shareholders.
|
|
-
|
Proportionate consolidation method for companies which are jointly controlled with third parties (joint ventures). Similar items are grouped together such that the corresponding proportion of these companies’ overall assets, liabilities, expenses and revenues and cash flows are integrated on a line by line basis into the consolidated financial statements.
|
|
-
|
Equity method for companies in which there is significant influence, but not control or joint control with third parties.
|
In certain circumstances, some of the Group’s investees may require a qualified majority to adopt certain resolutions. This, together with other factors, is taken into account when selecting the consolidation method.
All material accounts and transactions between the consolidated companies were eliminated on consolidation. The returns generated on transactions involving capitalizable goods or services by subsidiaries with other Telefónica Group companies were eliminated on consolidation.
The financial statements of the consolidated companies have the same financial year end as the parent company’s individual financial statements and are prepared using the same accounting policies. In the case of Group companies whose accounting and valuation methods differed from those of the Telefónica Group, adjustments were made on consolidation in order to present the consolidated financial statements on a uniform basis.
The consolidated income statement and consolidated statement of cash flows include the revenues and expenses and cash flows of companies that are no longer in the Group up to the date on which the related holding was sold or the company was liquidated, and those of the new companies included in the Group from the date on which the holding was acquired or the company was incorporated through year end.
Revenue and expenses associated with discontinued operations are presented in a separate line on the consolidated income statement. Discontinued operations are those with identifiable operations and cash flows (for both operating and management purposes) and that represent a line of business or geographic unit which has been disposed of or is available for sale.
The share of non-controlling interests in the equity and results of the fully consolidated subsidiaries is presented under "Non-controlling interests" on the consolidated statement of financial position and income statement, respectively.
|
r)
|
Acquisitions and disposals of
non-controlling
interests
|
Changes in investments in subsidiaries without loss of control:
Prior to January 1, 2010, the effective date of IAS 27 (Amended)
Consolidated and separate financial statements
, the Telefónica Group treated increases in equity investments of companies already controlled by the Group via purchases of non-controlling interests by recognizing any difference between the acquisition price and the carrying amount of the minority interest’s participation as goodwill. In transactions involving the sale of investments in subsidiaries in which the Group retained control, the Telefónica Group derecognized the carrying amount of the shareholding sold, including any related goodwill. The difference between this amount and the sale price was recognized as a gain or loss in the consolidated income statement.
Effective January 1, 2010, any increase or decrease in the percentage of ownership interests in subsidiaries that does not result in a loss of control is accounted for as a transaction with owners in their capacity as owners, which means that as of the aforementioned date, these transactions do not give rise to goodwill or generate profit or loss; any difference between the carrying amount of the non-controlling interests and the fair value of the consideration received or paid, as applicable, is recognized in equity.
Commitments to acquire non-controlling interests (put options):
Put options granted to non-controlling interests of subsidiaries are measured at the exercise price and classified as a financial liability, with a deduction from non-controlling interests on the consolidated statement of financial position at each reporting date. Prior to January 1,
2010, the effective date of IAS 27 (Amended)
Consolidated and separate financial statements
, where the exercise price exceeded the balance of non-controlling interests, the difference was recognized as an increase in the goodwill of the subsidiary. At each reporting date, the difference was adjusted based on the exercise price of the options and the carrying amount of non-controlling interests. As of January 1, 2010, the effect of this adjustment is recognized in equity in line with the treatment of transactions with owners described in the previous paragraphs.
|
s)
|
New IFRS and interpretations of the IFRS Interpretations Committee (IFRIC)
|
The accounting policies applied in the preparation of the financial statements for the year ended December 31, 2010 are consistent with those used in the preparation of the Group’s consolidated annual financial statements for the year ended December 31, 2009, except for the adoption of new standards, amendments to standards and interpretations published by the International Accounting Standards Board (IASB) and the IFRS Interpretations Committee (IFRIC), and adopted by the European Union, effective as of January 1, 2010, noted below:
|
|
-
|
Revised IFRS 3,
Business Combinations
|
The revised version of IFRS 3 introduces significant changes in the accounting for business combinations. The main impacts are as follows:
|
|
§
|
To allow a choice on a transaction-by-transaction basis for the measurement of non-controlling interests either at fair value or at the non-controlling interests’ share of the fair value of the identifiable net assets of the acquiree.
|
|
|
§
|
To change the recognition and subsequent accounting requirements for contingent consideration. Under the revised standard, contingent consideration is measured at fair value at the acquisition date; subsequent adjustments to the consideration are recognized against goodwill only to the extent that they arise from better information about the fair value at the acquisition date, and they occur within the "measurement period" (a maximum of 12 months from the acquisition date). All subsequent adjustments are recognized in profit or loss.
|
|
|
§
|
To require that acquisition-related costs be accounted for separately from the business combination, generally leading to those costs being recognized as an expense in profit or loss as incurred, whereas previously they were accounted for as part of the cost of the acquisition.
|
|
|
§
|
To require that in a business combination achieved in stages, the acquirer remeasure its previously held equity interest in the acquiree at its acquisition-date fair value and recognize the resulting gain or loss, if any, in profit or loss.
|
|
|
§
|
To require that in business combinations in which the acquisition date is prior to January 1, 2010, the acquirer recognizes changes in acquired deferred tax benefits of the acquiree as an adjustment to profit and loss.
|
Its adoption has affected the accounting for business combination transactions that occurred in the current period (Note 5).
|
|
-
|
Amendment to IAS 27
, Consolidated and Separate Financial Statements
|
IAS 27 (Amended) requires that a change in the ownership interest of a subsidiary without loss of control be accounted for as a transaction with owners in their capacity as owners. Therefore, such transactions will no longer give rise to goodwill, nor will they
give rise to a gain or loss. Furthermore, the amendment changes the accounting for the loss of control of a subsidiary, meaning that any retained interest in the former subsidiary is remeasured at its fair value at the date control is lost, with any resulting gain or loss recognized in profit or loss.
The changes to IAS 27 (Amended) affect transactions with non-controlling interests and future transactions that result in the loss of control of subsidiaries on or after January 1, 2010.
|
|
-
|
Improvements to IFRS (April 2009)
|
This text introduces a number of improvements to IFRS in force primarily to eliminate inconsistencies and clarifying the wording of some of these standards. These improvements have not had a significant impact on the financial position or performance of the Telefónica Group.
|
|
-
|
Amendment to IFRS 2,
Share-based Payment – Group Cash-settled Share-based Payment Transactions
|
The standard has been amended to clarify the accounting for group cash-settled share-based payment transactions.
The amendment also supersedes IFRIC 8 and IFRIC 11
. The adoption of this amendment did not have a significant impact on the financial position or performance of the Group.
|
|
-
|
Amendment of IAS 39,
Financial Instruments: Recognition and Measurement - Eligible hedged items
|
The amendment clarifies two issues relating to hedge accounting: designation of inflation as a hedged risk in a hedging relationship, and designation of call options as hedging instruments to hedge financial or non-financial items.
The adoption of this amendment did not have a significant impact on the financial position or performance of the Group.
|
|
-
|
IFRIC 17,
Distributions of non-cash assets to owners
|
This interpretation provides guidance on accounting for dividends in kind, by clarifying when to recognize the dividend payable, the measurement requirements for this kind of dividend and how to account for the differences between the carrying amount of the assets distributed and the carrying amount of the payment obligation that can arise when the dividend in kind is settled. The application of this interpretation has not had a significant impact on the financial position or performance of the Group
.
New standards
and IFRIC
interpretations issued but
not in effect as of December 31, 2010
At the date of preparation of the accompanying consolidated financial statements, the following IFRS, amendments and IFRIC interpretations had been published, but their application was not mandatory:
|
Standards and amendments
|
Mandatory application: annual periods beginning on or after
|
||
|
IFRS 9
|
Financial Instruments
|
January 1, 2013
|
|
|
Revised IAS 24
|
Related Party Disclosures
|
January 1, 2011
|
|
|
Amendments to IAS 32
|
Classification of rights issues
|
February 1, 2010
|
|
|
Improvements to IFRS (May 2010)
|
January 1, 2011 (*)
|
||
|
Amendments to IFRS 7
|
Disclosures about transfers of financial assets
|
July 1, 2011
|
|
|
Amendments to IAS 12
|
Deferred tax: Recovery of underlying assets
|
January 1, 2012
|
|
| (*) The changes to IFRS 3 (2008) regarding the measurement of non-controlling interests and share-based payments, as well as the changes to IAS 27 (2008) and the amendment to IFRS 3 (2008) regarding contingent consideration arising in business combinations acquired prior to the effective date of the revised standards are effective for annual periods beginning on or after July 1, 2010. | |||
|
Interpretations
|
Mandatory application: annual periods beginning on or after
|
||
|
IFRIC 19
|
Extinguishing financial liabilities with equity instruments
|
July 1, 2010 | |
|
Amendments to IFRIC 14
|
Prepayment of minimum funding requirements
|
January 1, 2011
|
|
The Group is currently assessing the impact of the application of these standards, amendments and interpretations.
Based on the analyses made to date, the Group estimates that their adoption will not have a significant impact on the consolidated financial statements in the initial period of application. However, the changes introduced by IFRS 9 will affect financial assets and future transactions with financial assets carried out on or after January 1, 2013.
|
(4)
|
SEGMENT INFORMATION
|
Combining the wireline and wireless telephony services underscores the need to manage the business by region in order to offer customers the best integrated solutions and support wireless-wireline convergence.
To implement this management model, the Group has three large business areas: Telefónica Spain, Telefónica Europe and Telefónica Latin America, with each overseeing the integrated business. This forms the basis of the segment reporting in these consolidated financial statements.
Telefónica Spain oversees the wireline and wireless telephony, broadband, internet, data, broadband TV, value added services operations and their development in Spain.
Telefónica Latin America oversees the same operations in Latin America.
Telefónica Europe oversees the wireline, wireless, broadband, value added services and data operations in the UK, Germany, Ireland, the Czech Republic and the Slovak Republic.
The Telefónica Group is also involved in the media and contact center businesses through investments in Telefónica de Contenidos and Atento, included under “Other and eliminations” together with the consolidation adjustments and the remaining Group companies.
The segment reporting takes into account the impact of the purchase price allocation (PPA) to assets acquired and the liabilities assumed from the companies included in each segment. The assets and liabilities presented in each segment are those managed by the heads of each segment, irrespective of their legal structure.
Telef
ó
nica uses operating income before depreciation and amortization (OIBDA) to track the performance of the business and to establish operating and strategic targets. OIBDA is calculated by excluding depreciation and amortization from operating income to eliminate the impact of investments in fixed assets that cannot be directly controlled by management in the short term. Therefore, it is considered to be more important for investors as it provides a gauge of segment operating performance and profitability using the same measures utilized by management. This metric also allows for comparisons with other companies in the telecommunications sector without consideration of their asset structure.
OIBDA is a commonly reported measure and is widely used among analysts, investors and other interested parties in the telecommunications industry, although not a measure explicitly defined in IFRS, and therefore, may not be comparable to similar indicators used by other companies. OIBDA should not be considered as an alternative to operating income as a measurement of our operating results or as an alternative to cash flows from operating activities as a measurement of our liquidity.
The Group manages its borrowing activities and tax implications centrally. Therefore, it does not disclose the related assets, liabilities, revenue and expenses breakdown by reportable segments.
In order to present the information by region, revenue and expenses arising from intra-group invoicing for the use of the trademark and management services have been eliminated from the operating results of each Group region, while centrally-managed projects have been incorporated at a regional level. These adjustments have no impact on the Group's consolidated results.
Inter-segment transactions are carried out at market prices.
Key information for these segments is as follows:
|
2010
|
|||||||||||||||||||
|
Millions of euros
|
Telefónica Spain
|
Telefónica Latin America
|
Telefónica Europe
|
Other and eliminations
|
Total
Group
|
||||||||||||||
|
Revenue from operations
|
18,711 | 26,041 | 15,255 | 730 | 60,737 | ||||||||||||||
|
External sales
|
18,301 | 25,828 | 15,198 | 1,410 | 60,737 | ||||||||||||||
|
Inter-segment sales
|
410 | 213 | 57 | (680 | ) | - | |||||||||||||
|
Other operating income and expenses
|
(10,191 | ) | (12,259 | ) | (11,241 | ) | (1,269 | ) | (34,960 | ) | |||||||||
| OIBDA | 8,520 | 13,782 | 4,014 | (539 | ) | 25,777 | |||||||||||||
|
Depreciation and amortization
|
(2,009 | ) | (4,061 | ) | (3,091 | ) | (142 | ) | (9,303 | ) | |||||||||
|
OPERATING INCOME
|
6,511 | 9,721 | 923 | (681 | ) | 16,474 | |||||||||||||
|
CAPITAL EXPENDITURE
|
2,021 | 5,535 | 3,072 | 216 | 10,844 | ||||||||||||||
|
INVESTMENTS IN ASSOCIATES
|
1 | 71 | - | 5,140 | 5,212 | ||||||||||||||
|
FIXED ASSETS
|
14,179 | 46,045 | 28,742 | 1,439 | 90,405 | ||||||||||||||
|
TOTAL ALLOCATED ASSETS
|
23,291 | 65,731 | 35,164 | 5,589 | 129,775 | ||||||||||||||
|
TOTAL ALLOCATED LIABILITIES
|
11,021 | 29,375 | 9,855 | 47,840 | 98,091 | ||||||||||||||
|
2009
|
|||||||||||||||||||
|
Millions of euros
|
Telefónica Spain
|
Telefónica Latin America
|
Telefónica Europe
|
Other and eliminations
|
Total
Group
|
||||||||||||||
|
Revenue from operations
|
19,703 | 22,983 | 13,533 | 512 | 56,731 | ||||||||||||||
|
External sales
|
19,354 | 22,786 | 13,468 | 1,123 | 56,731 | ||||||||||||||
|
Inter-segment sales
|
349 | 197 | 65 | (611 | ) | - | |||||||||||||
|
Other operating income and expenses
|
(9,946 | ) | (13,840 | ) | (9,623 | ) | (719 | ) | (34,128 | ) | |||||||||
| OIBDA | 9,757 | 9,143 | 3,910 | (207 | ) | 22,603 | |||||||||||||
|
Depreciation and amortization
|
(2,140 | ) | (3,793 | ) | (2,895 | ) | (128 | ) | (8,956 | ) | |||||||||
|
OPERATING INCOME
|
7,617 | 5,350 | 1,015 | (335 | ) | 13,647 | |||||||||||||
|
CAPITAL EXPENDITURE
|
1,863 | 3,450 | 1,728 | 216 | 7,257 | ||||||||||||||
|
INVESTMENTS IN ASSOCIATES
|
3 | 152 | - | 4,781 | 4,936 | ||||||||||||||
|
FIXED ASSETS
|
14,082 | 25,016 | 26,962 | 1,351 | 67,411 | ||||||||||||||
|
TOTAL ALLOCATED ASSETS
|
26,156 | 42,377 | 32,097 | 7,511 | 108,141 | ||||||||||||||
|
TOTAL ALLOCATED LIABILITIES
|
13,363 | 22,862 | 6,435 | 41,207 | 83,867 | ||||||||||||||
|
2008
|
|||||||||||||||||||
|
Millions of euros
|
Telefónica Spain
|
Telefónica Latin America
|
Telefónica Europe
|
Other and eliminations
|
Total
Group
|
||||||||||||||
|
Revenue from operations
|
20,838 | 22,174 | 14,309 | 625 | 57,946 | ||||||||||||||
|
External sales
|
20,518 | 21,974 | 14,253 | 1,201 | 57,946 | ||||||||||||||
|
Inter-segment sales
|
320 | 200 | 56 | (576 | ) | - | |||||||||||||
|
Other operating income and expenses
|
(10,553 | ) | (13,729 | ) | (10,129 | ) | (616 | ) | (35,027 | ) | |||||||||
| OIBDA | 10,285 | 8,445 | 4,180 | 9 | 22,919 | ||||||||||||||
|
Depreciation and amortization
|
(2,239 | ) | (3,645 | ) | (3,035 | ) | (127 | ) | (9,046 | ) | |||||||||
|
OPERATING INCOME
|
8,046 | 4,800 | 1,145 | (118 | ) | 13,873 | |||||||||||||
|
CAPITAL EXPENDITURE
|
2,208 | 4,035 | 2,072 | 86 | 8,401 | ||||||||||||||
|
INVESTMENTS IN ASSOCIATES
|
99 | 107 | - | 2,571 | 2,777 | ||||||||||||||
|
FIXED ASSETS
|
14,372 | 21,959 | 27,265 | 1,193 | 64,789 | ||||||||||||||
|
TOTAL ALLOCATED ASSETS
|
32,273 | 37,942 | 32,726 | (3,045 | ) | 99,896 | |||||||||||||
|
TOTAL ALLOCATED LIABILITIES
|
20,754 | 21,998 | 6,420 | 31,162 | 80,334 | ||||||||||||||
The composition of segment revenue from operations, detailed by the main countries in which the Group operates, is as follows:
|
MILLIONS OF EUROS
|
||||||||||||||||||||||||||||||||||||||||||||||||
|
2010
|
2009
|
2008
|
||||||||||||||||||||||||||||||||||||||||||||||
|
Country
|
Wireline
|
Wireless
|
Other and eliminations
|
Total
|
Wireline
|
Wireless
|
Other and eliminations
|
Total
|
Wireline
|
Wireless
|
Other and eliminations
|
Total
|
||||||||||||||||||||||||||||||||||||
|
Spain
|
11,397 | 8,550 | (1,236 | ) | 18,711 | 12,167 | 8,965 | (1,429 | ) | 19,703 | 12,581 | 9,684 | (1,427 | ) | 20,838 | |||||||||||||||||||||||||||||||||
|
Latin America
|
26,041 | 22,983 | 22,174 | |||||||||||||||||||||||||||||||||||||||||||||
|
Brazil
|
6,843 | 4,959 | (683 | ) | 11,119 | 5,766 | 3,036 | (426 | ) | 8,376 | 6,085 | 2,932 | (411 | ) | 8,606 | |||||||||||||||||||||||||||||||||
|
Argentina
|
1,187 | 1,979 | (93 | ) | 3,073 | 1,047 | 1,643 | (81 | ) | 2,609 | 1,027 | 1,585 | (85 | ) | 2,527 | |||||||||||||||||||||||||||||||||
|
Chile
|
1,038 | 1,266 | (107 | ) | 2,197 | 893 | 1,010 | (72 | ) | 1,831 | 974 | 1,051 | (89 | ) | 1,936 | |||||||||||||||||||||||||||||||||
|
Peru
|
1,097 | 1,001 | (138 | ) | 1,960 | 1,006 | 840 | (130 | ) | 1,716 | 977 | 773 | (123 | ) | 1,627 | |||||||||||||||||||||||||||||||||
|
Colombia
|
700 | 872 | (43 | ) | 1,529 | 615 | 685 | (31 | ) | 1,269 | 710 | 815 | (35 | ) | 1,490 | |||||||||||||||||||||||||||||||||
|
Mexico
|
N/A | 1,832 | - | 1,832 | N/A | 1,552 | - | 1,552 | N/A | 1,631 | - | 1,631 | ||||||||||||||||||||||||||||||||||||
|
Venezuela
|
N/A | 2,318 | - | 2,318 | N/A | 3,773 | - | 3,773 | N/A | 2,769 | - | 2,769 | ||||||||||||||||||||||||||||||||||||
|
Remaining operators and inter-segment eliminations
|
2,013 | 1,857 | 1,588 | |||||||||||||||||||||||||||||||||||||||||||||
|
Europe
|
15,255 | 13,533 | 14,309 | |||||||||||||||||||||||||||||||||||||||||||||
|
UK
|
134 | 7,067 | - | 7,201 | 70 | 6,442 | - | 6,512 | 33 | 7,019 | - | 7,052 | ||||||||||||||||||||||||||||||||||||
|
Germany
|
1,412 | 3,414 | - | 4,826 | 558 | 3,188 | - | 3,746 | 496 | 3,099 | - | 3,595 | ||||||||||||||||||||||||||||||||||||
|
Czech Republic
|
960 | 1,237 | - | 2,197 | 1,015 | 1,248 | (3 | ) | 2,260 | 1,183 | 1,388 | 10 | 2,581 | |||||||||||||||||||||||||||||||||||
|
Ireland
|
4 | 844 | - | 848 | 1 | 904 | - | 905 | N/A | 957 | - | 957 | ||||||||||||||||||||||||||||||||||||
|
Remaining operators and inter-segment eliminations
|
183 | 110 | 124 | |||||||||||||||||||||||||||||||||||||||||||||
|
Other and inter-segment eliminations
|
730 | 512 | 625 | |||||||||||||||||||||||||||||||||||||||||||||
|
Total Group
|
60,737 | 56,731 | 57,946 | |||||||||||||||||||||||||||||||||||||||||||||
|
(5)
|
BUSINESS COMBINATIONS AND ACQUISITIONS OF NON-CONTROLLING INTERESTS
|
Business combinations
2010
Acquisition of Brasilcel
As described in Note 2, on July 28, 2010, Telefónica and Portugal Telecom signed an agreement for the acquisition by Telefónica of 50% of the capital stock of Brasilcel (company then jointly owned by Telefónica and Portugal Telecom, which owned shares representing, approximately, 60% of the capital stock of Brazilian company Vivo Participações, S.A.). The acquisition price for the aforementioned capital stock of Brasilcel was 7,500 million euros, of which 4,500 million euros was paid at the closing of the transaction on September 27, 2010, 1,000 million euros on December 30, 2010, and the remaining 2,000 million euros deferred until October 31, 2011 (although Portugal Telecom may request for this last payment to be made on July 29, 2011, in
which case the price of the acquisition and the closing payment would be reduced by 25 million euros).
Furthermore, the aforementioned agreement established that Portugal Telecom waived its right to the declared dividend payable by Brasilcel of approximately 49 million euros.
Once the acquisition was consummated on September 27, 2010, in accordance with currently effective IFRS with respect to a business combination achieved in stages (see Note 3.c), the Telefónica Group remeasured the previously held 50% investment in Brasilcel, N.V. The difference between the carrying value of the investment at the date of acquisition and its fair value, equivalent to approximately 80% of the price paid to Portugal Telecom for 50% of Brasilcel, N.V., gave rise to a capital gain of 3,797 million euros. The remeasurement considered, among other factors, that the previously held 50% investment in Brasilcel, N.V., coupled with the additional percentage interest acquired, provides the Telefónica Group sole control of the Vivo Participaçoes group. The aforementioned capital gain is recognized under “Other income” in the accompanying consolidated income statement
On December 21, 2010, the merger between Telefónica and Brasilcel was registered in the Madrid Mercantile Register, with the Company becoming a direct shareholder of the Brazilian consolidated group Vivo, with approximately 60% of its capital stock.
Pursuant to Brazilian legislation, on October 26, 2010, Telefónica announced a tender offer for the acquisition of voting shares of Vivo Participaçoes, S.A. held by non-controlling interests, representing approximately 3.8% of its capital stock, for an amount equivalent to 80% of the price agreed in the Portugal Telecom acquisition previously described and subject to regulatory approval. This offer was approved by the Brazilian market regulator (C.V.M.) on February 11, 2011
(see Note 24).
Similarly, and in accordance with IFRS 3 (2008), the Group opted to record at fair value the non-controlling interests of Vivo Participaçoes, S.A. corresponding to non-voting shares, determining such fair value based on a discounted cash flows valuation determined in accordance with the company's business plans.
In 2010, Telefónica proceeded to recognize and value the identifiable assets acquired and liabilities assumed at the date of acquisition.
These values were determined using various measurement methods for each type of asset and/or liability based on the best available information. The advice of experts has also been considered in addition to the various other considerations made in determining these fair values.
The methods and assumptions used to measure these fair values are as follows:
Licenses
The fair value of the licenses has been determined through the use of the Multi-period Excess Earnings Method (MEEM), which is based on a discounted cash flows analysis of the estimated future economic benefits attributable to the licenses, net of the elimination of charges related to contributing assets involved in the generation of such cash flows and excluding cash flows attributable to the customer base.
This method assumes that intangible assets rarely generate income on their own. Thus, cash flows attributable to the licenses are those remaining after the return on investment of all of the contributing assets required to generate the projected cash flows.
Customer base
The customer base has been measured using the MEEM, which is based on a discounted cash flow analysis of the estimated future economic benefits attributable to the customer base, net of the elimination of charges involved in its generation. An analysis of the average length of customer relationships, using the retirement rate method, was performed in order to estimate the remaining useful life of the customer base.
The objective of the analysis of useful lives is to estimate a survival curve that predicts future customer churn of our current customer base. The so-called “Iowa curves” were considered to approximate the survival curve of customers.
Trademark
The fair value of the trademark was calculated using the “relief-from-royalty” method. This method establishes that an asset's value is calculated by capitalizing the royalties saved by holding the intellectual property. In other words the trademark owner generates a gain in holding the intangible asset rather than paying royalties for its use. The royalties saving was calculated by applying a market royalty rate (expressed as a percentage of revenues) to future revenues expected to be generated from the sale of products and services associated with the intangible asset. A market royalty rate is the rate, normally expressed as a percentage of net revenues, that a knowledgeable, interested owner would charge a knowledgeable, interested user for the use of an asset in an arm's length transaction.
The provisional carrying amounts, fair values, goodwill and purchase consideration cost of the identifiable assets acquired and liabilities assumed in this transaction were the following:
| Millions of euros (provisional data) |
Brasilcel, N.V.
|
||||||
|
Carrying amount
|
Fair value
|
||||||
|
Intangible assets
|
3,466 | 8,401 | |||||
|
Goodwill
|
932 | N/A | |||||
|
Property, plant and equipment
|
2,586 | 2,586 | |||||
|
Other non-current assets
|
1,921 | 1,953 | |||||
|
Other current assets
|
3,101 | 3,101 | |||||
|
Financial liabilities
|
(1,913 | ) | (1,913 | ) | |||
|
Deferred tax liabilities
|
(828 | ) | (2,506 | ) | |||
|
Other liabilities and current liabilities
|
(3,046 | ) | (3,203 | ) | |||
|
Value of net assets
|
6,219 | 8,419 | |||||
|
Purchase consideration cost
|
18,408 | ||||||
|
Goodwill (Note 7)
|
- | 9,989 | |||||
At the date of authorization for issue of these consolidated financial statements, the Group is finalizing the process of purchase price allocation and calculating the complete fair value of the identifiable assets acquired and liabilities assumed in the transaction. The conclusion of this process is pending the completion of the analysis of trends in the Brazilian wireline and wireless markets and its consideration with respect to the operations the Group is defining in these
markets, which is expected to be carried out within a maximum of twelve months from the date of acquisition.
The impact of this acquisition on cash and cash equivalents is as follows
:
|
Millions of euros
|
|
|
Cash and cash equivalents of the company acquired
|
401
|
|
Cash paid in the acquisition less declared dividend
|
5,448
|
|
Total net cash outflow
|
5,047
|
Of the amount of consideration agreed in the acquisition of Brasilcel (Vivo), 5,500 million euros was paid in 2010, while the remainder will be paid in 2011.
Had the acquisition occurred on January 1, 2010, the Telefónica Group's revenue from operations and operating income excluding the impact of the related depreciation would have been approximately 2,400 million and 890 million euros higher, respectively.
Similarly, the contributions of the 50% investment in Brasilcel to revenue from operations and operating income excluding the impact of the related depreciation since the date of its acquisition to December 31, 2010 were 875 million and 360 million euros, respectively.
Acquisition of HanseNet Telekommunikation GmbH (HanseNet)
On December 3, 2009, Telefónica’s subsidiary in Germany, Telefónica Deutschland GmbH (“Telefónica Deutschland”), signed an agreement to acquire all of the shares of German company HanseNet Telekommunikation GmbH (“HanseNet”). The purchase and sale was subject to compliance with a series of conditions, including approval of the transaction by the pertinent competition authorities, which was obtained on January 29, 2010.
The transaction was completed on February 16, 2010, and having complied with the terms established in the agreement, the Telefónica Group completed the acquisition of 100% of the shares of HanseNet.
The initial amount paid was approximately 913 million euros, which included 638 million euros of refinanced debt, leaving an acquisition cost of 275 million euros, which was finally reduced by 40 million euros at completion of the transaction.
Upon the acquisition of this shareholding, the purchase price was allocated to the identifiable assets acquired and the liabilities assumed using generally accepted valuation methods for each type of asset and/or liability, based on the best available information.
The complete carrying amounts, fair values, goodwill and purchase consideration cost of the identifiable assets acquired and the liabilities assumed in this transaction at the date control was obtained are as follows:
| Millions of euros |
HanseNet
|
||||||
|
Carrying amount
|
Fair value
|
||||||
|
Intangible assets
|
277 | 309 | |||||
|
Goodwill
|
461 | N/A | |||||
|
Property, plant and equipment
|
514 | 531 | |||||
|
Other assets
|
191 | 235 | |||||
|
Financial liabilities
|
(657 | ) | (665 | ) | |||
|
Deferred tax liabilities
|
- | (101 | ) | ||||
|
Other liabilities and current liabilities
|
(303 | ) | (356 | ) | |||
|
Value of net assets
|
483 | (47 | ) | ||||
|
Purchase Consideration cost
|
- | 235 | |||||
|
Goodwill (Note 7)
|
- | 282 | |||||
In addition, the impact of this acquisition on cash and cash equivalents was as follows:
|
Millions of euros
|
|
|
Cash and cash equivalents of the company acquired
|
28
|
|
Cash paid in the acquisition
|
235
|
|
Total net cash outflow
|
207
|
The contributions to the Telefónica Group’s revenue from operations and operating income excluding the impact of the related depreciation from the consolidation of HanseNet in 2010 amounted to 786 million and 77 million euros, respectively.
2009
No significant business combinations were carried out in 2009 that had been completed as of December 31, 2009.
Acquisitions of non-controlling interests
There were no significant acquisitions of non-controlling interests in 2010 and 2009. The detail of transactions carried out in the year is provided in Appendix I.
|
(6)
|
INTANGIBLE ASSETS
|
The composition of and movements in net intangible assets in 2010 and 2009 are as follows:
| Millions of euros | ||||||||||||||||||||||||||||||||||||
|
Balance at
12-31-09
|
Additions
|
Amortization
|
Disposals
|
Transfers
and other
|
Translation
differences and hyperinflation adjustments
|
Inclusion of
Companies
|
Exclusion of companies
|
Balance at
12-31-10
|
||||||||||||||||||||||||||||
|
Development costs
|
162 | 104 | (55 | ) | - | (18 | ) | 2 | 11 | - | 206 | |||||||||||||||||||||||||
|
Service concession arrangements and licenses
|
8,842 | 1,237 | (836 | ) | - | 61 | 623 | 4,639 | - | 14,566 | ||||||||||||||||||||||||||
|
Software
|
2,948 | 945 | (1,381 | ) | - | 558 | 134 | 322 | - | 3,526 | ||||||||||||||||||||||||||
|
Customer base
|
2,681 | - | (563 | ) | - | (141 | ) | 134 | 1,032 | - | 3,143 | |||||||||||||||||||||||||
|
Other intangible assets
|
1,139 | 41 | (309 | ) | (18 | ) | 166 | 50 | 1,103 | - | 2,172 | |||||||||||||||||||||||||
|
Prepayments on intangible assets
|
74 | 1,638 | - | - | (324 | ) | 5 | 20 | - | 1,413 | ||||||||||||||||||||||||||
|
Net intangible assets
|
15,846 | 3,965 | (3,144 | ) | (18 | ) | 302 | 948 | 7,127 | - | 25,026 | |||||||||||||||||||||||||
|
Millions of euros
|
||||||||||||||||||||||||||||||||||||
|
Balance at
12-31-08
|
Additions
|
Amortization
|
Disposals
|
Transfers
and other
|
Translation
differences
and
hyperinflation
adjustments
|
Inclusion of
companies
|
Exclusion of
companies
|
Balance at
12-31-09
|
||||||||||||||||||||||||||||
|
Development costs
|
175 | 84 | (81 | ) | (2 | ) | (14 | ) | - | - | - | 162 | ||||||||||||||||||||||||
|
Service concession arrangements and licenses
|
8,697 | 10 | (786 | ) | - | (8 | ) | 929 | - | - | 8,842 | |||||||||||||||||||||||||
|
Software
|
2,394 | 964 | (1,312 | ) | - | 772 | 130 | - | - | 2,948 | ||||||||||||||||||||||||||
|
Customer base
|
3,046 | - | (512 | ) | - | 24 | 123 | - | - | 2,681 | ||||||||||||||||||||||||||
|
Other intangible assets
|
1,229 | 81 | (170 | ) | (1 | ) | (51 | ) | 51 | - | - | 1,139 | ||||||||||||||||||||||||
|
Prepayments on intangible assets
|
380 | 166 | - | - | (479 | ) | 7 | - | - | 74 | ||||||||||||||||||||||||||
|
Net intangible assets
|
15,921 | 1,305 | (2,861 | ) | (3 | ) | 244 | 1,240 | - | - | 15,846 | |||||||||||||||||||||||||
The gross cost, accumulated amortization and impairment losses of intangible assets at December 31, 2010 and 2009 are as follows:
|
Balance at December 31, 2010
|
||||||||||||||||
|
Gross cost
|
Accumulated
amortization
|
Impairment
losses
|
Net intangible assets | |||||||||||||
|
Millions of euros
|
||||||||||||||||
|
Development costs
|
1,229 | (1,023 | ) | - | 206 | |||||||||||
|
Service concession arrangements and licenses
|
20,438 | (5,872 | ) | - | 14,566 | |||||||||||
|
Software
|
13,724 | (10,172 | ) | (26 | ) | 3,526 | ||||||||||
|
Customer base
|
6,481 | (3,338 | ) | - | 3,143 | |||||||||||
|
Other intangible assets
|
3,445 | (1,269 | ) | (4 | ) | 2,172 | ||||||||||
|
Prepayments on intangible assets
|
1,413 | - | - | 1,413 | ||||||||||||
|
Net intangible assets
|
46,730 | (21,674 | ) | (30 | ) | 25,026 | ||||||||||
|
Balance at December 31, 2009
|
||||||||||||||||
|
Gross
cost
|
Accumulated
amortization
|
Impairment
losses
|
Net intangible assets | |||||||||||||
|
Millions of euros
|
||||||||||||||||
|
Development costs
|
1,613 | (1,451 | ) | - | 162 | |||||||||||
|
Service concession arrangements and licenses
|
14,074 | (5,232 | ) | - | 8,842 | |||||||||||
|
Software
|
11,175 | (8,226 | ) | (1 | ) | 2,948 | ||||||||||
|
Customer base
|
5,476 | (2,795 | ) | - | 2,681 | |||||||||||
|
Other intangible assets
|
2,143 | (973 | ) | (31 | ) | 1,139 | ||||||||||
|
Prepayments on intangible assets
|
74 | - | - | 74 | ||||||||||||
|
Net intangible assets
|
34,555 | (18,677 | ) | (32 | ) | 15,846 | ||||||||||
“
Inclusion of companies
”
primarily consists of the incorporation into the Group of all of the assets of HanseNet, as well as the 50% interest in Vivo Participaçoes, S.A. and the impact of the purchase price allocation process to the assets of Vivo Participaçoes, S.A. (Note 5).
“Additions” of service concession arrangements and licenses in 2010 include the acquisition of the spectrum license in Mexico for 1,237 million euros in 2010, for the 1850-1910/1930-1990 MHz and 1710-1770/2110-2170 MHZ frequencies. Telefónica México acquired eight additional blocks of radioelectric spectrum, equivalent to 140 MHz in the 1900 MHz auction and 60 MHz in the 1700 MHz auction. Payment of these licenses will be made in the next twenty years (Note 14).
Furthermore, in 2010 an advanced payment of 1,379 million euros has been made for the license for spectrum use in Germany, which is recognized as "Additions" of prepayments on intangible assets.
Details of the principal concessions and licenses with which the Group operates are provided in Appendix VI.
“Additions” for 2010 and 2009 also include investments in software.
At December 31, 2010 and 2009, the Company carried intangible assets with indefinite useful lives of 108 and 111 million euros, respectively, related primarily to permanent licenses to operate wireless telecommunications services in Argentina.
Intangible assets are also subject to impairment tests whenever there are indications of a potential loss in value and, in any event, at the end of each year for intangible assets with indefinite useful lives. There was no significant impairment recognized in the consolidated financial statements for 2010 and 2009 as a result of these impairment tests.
“Other intangible assets” includes the amounts allocated to trademarks acquired in business combinations, of 2,339 million euros and 1,477 million euros at December 31, 2010 and 2009 (1,586 million euros and 901 million euros net of the related accumulated amortization).
“Translation differences and hyperinflation adjustments” reflects the impact of exchange rate movements on opening balances, as well as the impact of the monetary adjustments due to hyperinflation in Venezuela. The effect of exchange rates on movements in the year is included in the column corresponding to such movement.
|
(7)
|
GOODWILL
|
The movement in this heading assigned to each Group segment was the following:
|
Millions of euros
|
||||||||||||||||||||||||
|
2010
|
Balance at
12-31-2009
|
Acquisitions
|
Disposals
|
Transfers
|
Translation
differences
and
hyperinflation
adjustments
|
Balance at
12-31-2010
|
||||||||||||||||||
|
Telefónica Spain
|
3,238 | 42 | - | - | - | 3,280 | ||||||||||||||||||
|
Telefónica Latin America
|
6,320 | 9,201 | - | (350 | ) | 501 | 15,672 | |||||||||||||||||
|
Telefónica Europe
|
9,810 | 397 | (37 | ) | - | 251 | 10,421 | |||||||||||||||||
|
Other
|
198 | - | - | - | 11 | 209 | ||||||||||||||||||
|
Total
|
19,566 | 9,640 | (37 | ) | (350 | ) | 763 | 29,582 | ||||||||||||||||
|
Millions of euros
|
||||||||||||||||||||
|
2009
|
Balance at
12-31-2008
|
Acquisitions
|
Disposals
|
Translation
differences and
hyperinflation
adjustments
|
Balance at
12-31-2009
|
|||||||||||||||
|
Telefónica Spain
|
3,238 | - | - | - | 3,238 | |||||||||||||||
|
Telefónica Latin America
|
5,450 | 23 | (209 | ) | 1,056 | 6,320 | ||||||||||||||
|
Telefónica Europe
|
9,452 | - | - | 358 | 9,810 | |||||||||||||||
|
Other
|
183 | 7 | - | 8 | 198 | |||||||||||||||
|
Total
|
18,323 | 30 | (209 | ) | 1,422 | 19,566 | ||||||||||||||
Goodwill generated in the acquisition of foreign companies is treated as an asset denominated in the currency of the company acquired, and is therefore subject to exchange rate differences, which are included under “Translation differences.”
The impairment tests carried out did not identify the need to recognize any material write-downs to goodwill at the 2010 and 2009 year ends as the recoverable amount, in all cases based on value in use, was higher than carrying amount.
In addition, sensitivity analyses were performed on changes reasonably expected to occur in the primary valuation variables, and the recoverable amount remained above the net carrying amount.
2010
“Additions” in 2010 include the goodwill of Vivo Participaçoes, S.A. in the amount of 9,989 million euros which, net of the goodwill from the previously held investment, results in an addition to this line item of 9,200 million euros.
Similarly, the acquisitions of HanseNet and Jajah led to increases in goodwill of 282 million and 115 million euros, respectively, while the acquisition of Tuenti Technologies, S.L. led to an addition in goodwill of 42 million euros.
Disposals in 2010 comprise the divestment of Manx.
Fluctuations in exchange rates in the various countries in which the Group operates, combined with the hyperinflationary adjustment in Venezuela has led to an increase in goodwill of 763 million euros.
2009
The primary disposals in 2009 correspond to the measurement of the purchase commitment for non-controlling interests of Colombia Telecomunicaciones, S.A. ESP for 90 million euros (see Note 21) and the impact of the corporate restructuring carried out at the VIVO Group.
In addition, the favorable evolution of exchange rates applied to goodwill led to an increase in this line item of 709 million euros in 2009, and the impact of recognizing Venezuela as a hyperinflationary economy (see Note 2) led to an increase in goodwill of 713 million euros.
|
(8)
|
PROPERTY, PLANT AND EQUIPMENT
|
The composition and movement of the items comprising net “Property, plant and equipment” in 2010 and 2009 were the following:
|
Millions of euros
|
||||||||||||||||||||||||||||||||||||
|
Balance at
12-31-09
|
Additions | Depreciation | Disposals |
Transfers
and
other
|
Translation
differences and
hyperinflation
adjustment
|
Inclusion of
companies
|
Exclusion of
companies
|
Balance at
12-31-10
|
||||||||||||||||||||||||||||
|
Land and buildings
|
6,092 | 61 | (538 | ) | (40 | ) | 180 | 332 | 87 | (22 | ) | 6,152 | ||||||||||||||||||||||||
|
Plant and machinery
|
21,391 | 1,447 | (4,869 | ) | (57 | ) | 3,750 | 1,198 | 1,390 | (44 | ) | 24,206 | ||||||||||||||||||||||||
|
Furniture, tools and other items
|
1,660 | 448 | (752 | ) | - | 339 | 77 | 178 | (3 | ) | 1,947 | |||||||||||||||||||||||||
|
Total PP&E in service
|
29,143 | 1,956 | (6,159 | ) | (97 | ) | 4,269 | 1,607 | 1,655 | (69 | ) | 32,305 | ||||||||||||||||||||||||
|
PP&E in progress
|
2,619 | 4,781 | - | (3 | ) | (4,370 | ) | 139 | 100 | (7 | ) | 3,259 | ||||||||||||||||||||||||
|
Advance payments on PP&E
|
10 | 3 | - | - | (5 | ) | - | - | - | 8 | ||||||||||||||||||||||||||
|
Installation materials
|
227 | 139 | - | (16 | ) | (143 | ) | 18 | - | - | 225 | |||||||||||||||||||||||||
|
Net PP&E
|
31,999 | 6,879 | (6,159 | ) | (116 | ) | (249 | ) | 1,764 | 1,755 | (76 | ) | 35,797 | |||||||||||||||||||||||
|
Millions of euros
|
||||||||||||||||||||||||||||||||||||
|
Balance at
12-31-08
|
Additions | Depreciation | Disposals | Transfers and other | Translation differences and hyperinflation adjustments |
Inclusion of
companies
|
Exclusion of
companies
|
Balance at
12-31-09
|
||||||||||||||||||||||||||||
|
Land and buildings
|
7,031 | 34 | (454 | ) | (19 | ) | (852 | ) | 352 | - | - | 6,092 | ||||||||||||||||||||||||
|
Plant and machinery
|
19,250 | 1,356 | (4,980 | ) | (100 | ) | 4,607 | 1,254 | 4 | - | 21,391 | |||||||||||||||||||||||||
|
Furniture, tools and other items
|
1,546 | 285 | (661 | ) | (6 | ) | 362 | 134 | - | - | 1,660 | |||||||||||||||||||||||||
|
Total PP&E in service
|
27,827 | 1,675 | (6,095 | ) | (125 | ) | 4,117 | 1,740 | 4 | - | 29,143 | |||||||||||||||||||||||||
|
PP&E in progress
|
2,485 | 3,973 | - | (4 | ) | (3,937 | ) | 102 | - | - | 2,619 | |||||||||||||||||||||||||
|
Advance payments on PP&E
|
6 | 6 | - | - | (2 | ) | - | - | - | 10 | ||||||||||||||||||||||||||
|
Installation materials
|
227 | 298 | - | (3 | ) | (297 | ) | 2 | - | - | 227 | |||||||||||||||||||||||||
|
Net PP&E
|
30,545 | 5,952 | (6,095 | ) | (132 | ) | (119 | ) | 1,844 | 4 | - | 31,999 | ||||||||||||||||||||||||
The gross cost, accumulated depreciation and impairment losses of property, plant and equipment at December 31, 2010 and 2009 are as follows:
|
Balance at December 31, 2010
|
||||||||||||||||
|
Gross cost
|
Accumulated
depreciation
|
Impairment
losses
|
Net PP&E | |||||||||||||
|
Land and buildings
|
12,372 | (6,216 | ) | (4 | ) | 6,152 | ||||||||||
|
Plant and machinery
|
100,496 | (76,266 | ) | (24 | ) | 24,206 | ||||||||||
|
Furniture, tools and other items
|
7,406 | (5,367 | ) | (92 | ) | 1,947 | ||||||||||
|
Total PP&E in service
|
120,274 | (87,849 | ) | (120 | ) | 32,305 | ||||||||||
|
PP&E in progress
|
3,259 | - | - | 3,259 | ||||||||||||
|
Advance payments on PP&E
|
8 | - | - | 8 | ||||||||||||
|
Installation materials
|
256 | - | (31 | ) | 225 | |||||||||||
|
Net PP&E
|
123,797 | (87,849 | ) | (151 | ) | 35,797 | ||||||||||
|
Balance at December 31, 2009
|
||||||||||||||||
|
Gross cost
|
Accumulated
depreciation
|
Impairment
losses
|
Net PP&E | |||||||||||||
|
Land and buildings
|
11,560 | (5,456 | ) | (12 | ) | 6,092 | ||||||||||
|
Plant and machinery
|
87,017 | (65,548 | ) | (78 | ) | 21,391 | ||||||||||
|
Furniture, tools and other items
|
6,184 | (4,534 | ) | 10 | 1,660 | |||||||||||
|
Total PP&E in service
|
104,761 | (75,538 | ) | (80 | ) | 29,143 | ||||||||||
|
PP&E in progress
|
2,619 | - | - | 2,619 | ||||||||||||
|
Advance payments on PP&E
|
10 | - | - | 10 | ||||||||||||
|
Installation materials
|
260 | - | (33 | ) | 227 | |||||||||||
|
Net PP&E
|
107,650 | (75,538 | ) | (113 | ) | 31,999 | ||||||||||
“Inclusion of companies" primarily consists of the consolidation of the interest in HanseNet, as well as the additional 50% Vivo Participaçoes, S.A. (see Note 5).
“Additions” for 2010, totaling 6,879 million euros, reflect the Group’s investment efforts made during the year.
“Additions” in Telefónica Spain amount to 1,500 million euros in 2010, compared to
1,276 million euros in
2009. Significant investments in the wireline business include those in broadband, with a localized roll-out of fiber optics, Imagenio and data services for large corporate customers, as well as the maintenance of the traditional business.
Investment in the wireless business was primarily focused on the deployment of third generation technologies (3G).
Telefónica Latin America’s investments in 2010 and 2009 amounted to 3,948 million euros and 3,187 million euros, respectively.
Investment in 2010 centered on driving wireline technologies, namely the transformation of the wireline business, especially in Telesp, while the wireless business continues to expand coverage and capacity of 3G and GSM networks.
Investment in Telefónica Europe in 2010 and 2009 amounted to 1,254 million euros and 1,356 million euros, respectively.
Investments in 2010 have been focused on improving capacity and coverage of the mobile networks in the United Kingdom, including the recent refarming of 900MHz, as well as greater investments in the ADSL business in Germany and the Czech Republic.
“Translation differences and hyperinflaction adjustments” reflects the impact of exchange rate movements on opening balances as well as the impact of the monetary adjustments due to hyperinflation in Venezuela. The effect of exchange rates on movements in the year is included in the column corresponding to such movement.
Telefónica Group companies have purchased insurance policies to reasonably cover the possible risks to which their property, plant and equipment used in operations are subject, with suitable limits and coverage. In addition, as part of its commercial activities and network roll-out, the Group maintains several property acquisition commitments. The timing of scheduled payments in this regard is disclosed in Note 19.
Property, plant and equipment deriving from finance leases amounted to 787 million euros at December 31, 2010 (691 million euros at December 31, 2009). The most significant finance leases are disclosed in Note 22.
The net amounts of “Property, plant and equipment” temporarily out of service at December 31, 2010 and 2009 were not significant.
|
(9)
|
ASSOCIATES AND JOINT VENTURES
|
Associates
The breakdown of amounts recognized in the consolidated statements of financial position and consolidated income statements related to associates is as follows:
|
Millions of euros
|
||||||||
|
Description
|
12-31-2010 | 12-31-2009 | ||||||
|
Investments in associates
|
5,212 | 4,936 | ||||||
|
Long-term loans to associates (Note 13)
|
604 | 3 | ||||||
|
Short-term loans to associates
|
43 | 15 | ||||||
|
Receivables from associates for current operations (Note 11)
|
84 | 262 | ||||||
|
Loans granted by associates (Note 14)
|
147 | 174 | ||||||
|
Payables to associates for current operations (Note 14)
|
46 | 113 | ||||||
|
Revenue from operations with associates
|
518 | 583 | ||||||
|
Work performed by associates and other operating expenses
|
906 | 904 | ||||||
|
Share of profit of associates
|
76 | 47 | ||||||
Transactions performed through Brasilcel group companies are shown at 50% until September 27, 2010.
The breakdown of the main associates and key financial highlights for the last 12-month periods available at the time of preparation of these consolidated financial statements are as follows:
|
December 31, 2010
|
Millions of euros
|
|||||||||||||||||||||||||||
|
COMPANY
|
% holding
|
Total
assets
|
Total
liabilities
|
Operating
income
|
Profit for
the year
|
Carrying
amount
|
Market
value
|
|||||||||||||||||||||
|
Telco, S.p.A. (Italy) (*)
|
46.18 | % | 6,554 | 3,356 | - | 63 | 2,055 | N/A | ||||||||||||||||||||
|
DTS Distribuidora de Televisión Digital, S.A. (Spain)
|
22.00 | % | 1,497 | 497 | 1,085 | 169 | 488 | N/A | ||||||||||||||||||||
|
China Unicom (Hong Kong) Limited
|
8.37 | % | 47,494 | 24,238 | 18,604 | 388 | 2,499 | 2,112 | ||||||||||||||||||||
|
Hispasat, S.A. (Spain)
|
13.23 | % | 945 | 448 | 179 | 72 | 65 | N/A | ||||||||||||||||||||
|
Other
|
105 | |||||||||||||||||||||||||||
|
TOTAL
|
5,212 | |||||||||||||||||||||||||||
|
December 31, 2009
|
Millions of euros
|
|||||||||||||||||||||||||||
|
COMPANY
|
% holding
|
Total
assets
|
Total
liabilities
|
Operating
income
|
Profit for
the year
|
Carrying
amount
|
Market
value
|
|||||||||||||||||||||
|
Telco, S.p.A. (Italy) (*)
|
46.18 | % | 7,111 | 3,703 | - | (39 | ) | 2,026 | N/A | |||||||||||||||||||
|
Portugal Telecom, S.G.P.S., S.A. (Portugal)
|
9.86 | % | 14,948 | 12,965 | 6,674 | 516 | 458 | 764 | ||||||||||||||||||||
|
China Unicom (Hong Kong) Limited
|
8.37 | % | 37,397 | 16,203 | 21,490 | 3,687 | 2,301 | 1,815 | ||||||||||||||||||||
|
Hispasat, S.A. (Spain)
|
13.23 | % | 841 | 383 | 151 | 71 | 56 | N/A | ||||||||||||||||||||
|
Other
|
95 | |||||||||||||||||||||||||||
|
TOTAL
|
4,936 | |||||||||||||||||||||||||||
(*) Through this company, Telefónica effectively has an indirect stake in Telecom Italia S.p.A.’s voting shares at December 31, 2010 of approximately 10.47% (10.49% at December 31, 2009), representing 7.20% (7.21% at December 31, 2009) of the dividend rights.
The detail of the movement in investments in associates in 2010 and 2009 was the following:
|
Investments in associates
|
Millions of euros
|
|||
|
Balance at 12/31/08
|
2,777 | |||
|
Acquisitions
|
772 | |||
|
Disposals
|
(114 | ) | ||
|
Translation differences
|
103 | |||
|
Income
|
47 | |||
|
Dividends
|
(58 | ) | ||
|
Transfers and other
|
1,409 | |||
|
Balance at 12/31/09
|
4,936 | |||
|
Acquisitions
|
489 | |||
|
Disposals
|
(473 | ) | ||
|
Translation differences
|
321 | |||
|
Income
|
76 | |||
|
Dividends
|
(97 | ) | ||
|
Transfers and other
|
(40 | ) | ||
|
Balance at 12/31/10
|
5,212 | |||
Changes at December 31, 2010 and 2009 reflect the amounts from transactions detailed in the changes to the consolidation scope (see Appendix I and Note 2). The figure for 2010 includes the disposal of 472 million euros due to the de-consolidation of Portugal Telecom, as well as the addition of 488 million euros for the 22% stake in DTS Distribuidora de Televisión Digital, S.A. Translation differences mainly corresponds to the equity investment in China Unicom, which varied by approximately 259 million euros due to exchange-rate fluctuations.
Additions in 2009 reflected the inclusion in the consolidation scope of the equity investment in China Unicom Limited for 2,301 million euros. Of this amount, 1,467 million euros were transferred from “Non-current financial assets – Equity investments” (see Note 13) following the acquisition of an additional 2.68% of this company.
Disposals in 2009 included the sale by Telefónica Móviles España, S.A.U., a wholly owned subsidiary of Telefónica, S.A., of its 32.18% stake in Moroccan operator Medi Telecom, S.A., along with outstanding loans to shareholders, for a total amount of 400 million euros. The net gain from this transaction before tax amounted to 220 million euros (see Note 19).
Joint ventures
On December 27, 2002, Telefónica Móviles, S.A. and PT Movéis Servicios de Telecomunicaçoes, S.G.P.S., S.A. (PT Movéis) set up a 50/50 joint venture, Brasilcel, via the contribution of 100% of the groups’ direct and indirect shares in Brazilian cellular operators.
This company was
integrated
in the consolidated financial statements of the Telefónica Group using proportionate consolidation.
As disclosed in Note 2, on September 27, 2010 these joint venture agreements
were terminated, thereby having no impact since such date.
The contributions of Brasilcel to the Telefónica Group’s 2009 and 2008 consolidated statements of financial position and 2010, 2009 and 2008 consolidated income statements are as follows:
|
Millions of euros
|
||||||||||||
|
2010
|
2009
|
2008
|
||||||||||
|
Current assets
|
- | 1,170 | 1,234 | |||||||||
|
Non-current assets
|
- | 5,617 | 4,616 | |||||||||
|
Current liabilities
|
- | 1,170 | 1,351 | |||||||||
|
Non-current liabilities
|
- | 1,505 | 1,212 | |||||||||
|
Operating revenue
|
2,583 | (*) | 2,743 | 2,662 | ||||||||
|
Operating expenses
|
1,896 | (*) | 2,046 | 2,063 | ||||||||
(*) For the period from January 1, 2010 to September 27, 2010
|
(10)
|
RELATED PARTIES
|
Significant shareholders
The main transactions between Telefónica Group companies and significant shareholders of the Company are described below. All of these transactions were carried out at market prices.
Banco Bilbao Vizcaya Argentaria, S.A. (BBVA) and subsidiaries comprising the consolidated group:
|
·
|
Financing transactions arranged under market conditions, with approximately 682 million euros drawn down at December 31, 2010 (531 million euros at December 31, 2009).
|
|
·
|
Time deposits amounting to 260 million euros at December 31, 2010 (878 million euros at December 31, 2000).
|
|
·
|
Derivative transactions contracted under market conditions, for a total nominal amount of approximately 11,197 million euros at December 31, 2010 (7,824 million euros at December 31, 2009).
|
|
·
|
Guarantees granted by BBVA for approximately 922 million euros at December 31, 2010 (237 million euros at December 31, 2009).
|
|
·
|
Dividends and other benefits paid to BBVA in 2010 for 439 million euros (287 million euros in 2009).
|
|
·
|
Services, mainly telecommunications and telemarketing, rendered by Telefónica Group companies to the BBVA Group, under market conditions.
|
Caja de Ahorros y Pensiones de Barcelona (“la Caixa”), and subsidiaries comprising the consolidated group:
|
·
|
Financing transactions arranged under market conditions, with approximately 305 million euros drawn down at December 31, 2010 (643 million euros at December 31, 2009).
|
|
·
|
Time deposits amounting to 118 million euros at December 31, 2010 (1,293 million euros at December 31, 2009).
|
|
·
|
Derivative transactions arranged under market conditions, for a total nominal amount of approximately 800 million euros in 2010 and 2009.
|
|
·
|
Dividends and other benefits paid to la Caixa in 2010 for 298 million euros (260 million euros in 2009).
|
|
·
|
Guarantees granted for 47 million euros at December 31, 2010 (17 million euros in 2009).
|
|
·
|
Telecommunications services rendered by Telefónica Group companies to la Caixa group companies under market conditions.
|
Associates and joint ventures
The most significant balances and transactions with associates and joint ventures and their contributions to the consolidated statement of financial position and income statement are detailed in Note 9.
Directors and senior executives
During the financial year to which these accompanying annual consolidated financial statements refer, the directors and senior executives did not perform any transactions with Telefónica or any Telefónica Group company other than those in the Group’s normal trading activity and business.
Compensation and other benefits paid to members of the Board of Directors and senior executives, as well as the detail of the equity interests and positions or duties held by the directors in companies engaging in an activity that is identical, similar or complementary to that of the Company are detailed in Note 21 of these consolidated financial statements.
|
(11)
|
TRADE AND OTHER RECEIVABLES
|
The breakdown of this consolidated statement of financial position heading at December 31, 2010 and 2009 is as follows:
|
Balance at
|
Balance at
|
|||||||
|
Millions of euros
|
12-31-10 | 12-31-09 | ||||||
|
Trade receivables
|
13,002 | 10,877 | ||||||
|
Receivables from associates (Note 9)
|
84 | 262 | ||||||
|
Other receivables
|
1,182 | 1,103 | ||||||
|
Allowance for uncollectibles
|
(3,098 | ) | (2,589 | ) | ||||
|
Short-term prepayments
|
1,256 | 969 | ||||||
|
Total
|
12,426 | 10,622 | ||||||
Public-sector net trade receivables in the countries in which the Group operates at December 31, 2010 and 2009 amounted to 696 million and 666 million euros, respectively.
The breakdown of trade receivables at December 31, 2010 and 2009 is as follows:
|
Millions of euros
|
12-31-2010 | 12-31-2009 | ||||||
|
Trade receivables billed
|
9,420 | 7,544 | ||||||
|
Trade receivables unbilled
|
3,582 | 3,333 | ||||||
|
Total
|
13,002 | 10,877 |
The movement in impairment losses in 2010 and 2009 is as follows:
|
Millions of
euros
|
||||
|
Impairment losses at December 31, 2008
|
2,196 | |||
|
Allowances
|
1,209 | |||
|
Retirements/amount applied
|
(970 | ) | ||
|
Translation differences
|
154 | |||
|
Impairment losses at December 31, 2009
|
2,589 | |||
|
Allowances
|
1,123 | |||
|
Retirements/amount applied
|
(940 | ) | ||
|
Inclusion of companies
|
133 | |||
|
Exclusion of companies
|
(1 | ) | ||
|
Translation differences
|
194 | |||
|
Impairment losses at December 31, 2010
|
3,098 | |||
The balance of trade receivables billed net of impairment losses at December 31, 2010 amounted to 6,361 million euros (4,955 million euros at December 31, 2009), of which 3,852 million euros were not yet due (2,981 million euros at December 31, 2009).
Of the amounts due, only net amounts of 260 million euros and 204 million euros are over 360 days at December 31, 2010 and 2009, respectively. They are mainly with the public sector.
|
(12)
|
EQUITY
|
|
a)
|
Share capital and share premium
|
At December 31, 2010, Telefónica, S.A.’s share capital amounted to 4,563,996,485 euros and consisted of 4,563,996,485 fully paid ordinary shares of a single series, per value of 1 euro, all recorded by the book-entry system and traded on the Spanish electronic trading system (“Continuous Market”), where they form part of the Ibex 35 Index, on the four Spanish Stock Exchanges (Madrid, Barcelona, Valencia and Bilbao) and listed on the New York, London, Tokyo, Buenos Aires, Sao Paulo and Lima Stock Exchanges.
With respect to authorizations given regarding share capital, on June 21, 2006, authorization was given at the Annual Shareholders’ Meeting of Telefónica, S.A. for the Board of Directors, at its discretion and in accordance with the Company’s needs, to increase the Company’s capital, at one or several times, within a maximum period of five years from that date, under the terms of Article 153.1 b) of the former Spanish Corporation Law (Article 297.1.b) of the current Corporate Enterprises Act)) up to a maximum increase of 2,460 million euros, equivalent to half of Telefónica, S.A.’s share capital at that date, by issuing and placing new ordinary shares, be they ordinary or of any other type permitted by the Law, with a fixed or variable premium, with or without pre-emptive subscription rights and, in all cases, in exchange for cash, and expressly considering the possibility that the new shares may not be fully subscribed in accordance with the terms of Article 161.1 of the former Spanish Corporation Law (Article 311.1 of the current Corporate Enterprises Act). The Board of Directors was also empowered to exclude, partially or fully, pre-emptive subscription rights under the terms of Article 159.2 of the former Spanish Corporation Law (article 506 of the current Corporate Enterprises Act) and related provisions.
In addition, at the June 2, 2010 Shareholders’ Meeting, authorization was given for the Board of Directors to issue fixed-income securities and preferred shares at one or several times within a maximum period of five years from that date. These securities may be in the form of debentures, bonds, promissory notes or any other kind of fixed-income security, plain or, in the case of debentures and bonds, convertible into shares of Telefónica, S.A. and/or exchangeable for shares of Telefónica, S.A., of any of the Group companies or of any other company. They may also be preferred shares. The total maximum amount of the securities issued agreed under this authorization is 25,000 million euros or the equivalent in another currency. For promissory notes, the outstanding balance of promissory notes issued under this authorization will be calculated for purposes of the aforementioned limit. As at December 31, 2010, the Board of Directors had exercised these powers, approving a program for the issuance of corporate promissory notes in 2011.
In addition, on June 2, 2010, shareholders voted to authorize the acquisition by the Board of Directors of treasury shares, up to the limits and pursuant to the terms and conditions established at the Shareholders’ Meeting, within a maximum period of five years from that date. However, it specified that in no circumstances could the par value of the shares acquired, added to that of the treasury shares already held by Telefónica, S.A. and by any of its controlled subsidiaries, exceed the maximum legal percentage at any time (currently 10% of Telefónica, S.A.’s share capital).
Finally, on December 28, 2009, the deed of capital reduction formalizing the implementation by
Telefónica, S.A.’s
Board of Directors of the resolution adopted by the Shareholders’ Meeting on June 23, 2009, was executed. Capital was reduced through the cancellation of treasury shares previously acquired by
Telefónica, S.A.
as authorized by the Shareholders’ Meeting.
As a result, 141,000,000 Telefónica, S.A. treasury shares were cancelled and the Company’s share capital was reduced by a nominal amount of 141,000,000 euros. Article 5 of the Corporate Bylaws relating to the amount of share capital was amended accordingly to show 4,563,996,485 euros.
At the same time, a reserve was established for cancelled shares as described in the
“Other reserves”
section of this Note.
The cancelled shares were delisted on December 30, 2009.
Proposed distribution of profit attributable to equity holders of the parent
Telefónica generated 4,130 million euros of profit in 2010.
Accordingly, the Company’s Board of Directors will submit the following proposed distribution of 2010 profit for approval at the Shareholders’ Meeting:
|
Millions
of euros
|
||||
|
Total distributable profit
|
4,130 | |||
|
Interim dividend (paid in May 2010)
|
2,938 | |||
|
Goodwill reserve
|
2 | |||
|
Voluntary reserves
|
1,190 | |||
|
Total
|
4,130 | |||
|
b)
|
Dividends
|
Dividends paid in 2010
At its meeting of April 28, 2010, the Company’s Board of Directors resolved to pay an interim dividend against 2010 profit of a fixed gross 0.65 euros per outstanding share carrying dividend rights.
This dividend was paid in full on May 11, 2010, and the total amount paid was 2,938 million euros.
In addition, approval was given at the General Shareholders’ Meeting on June 2, 2010 to pay a gross 0.65 euros dividend per outstanding share with a charge to unrestricted reserves. This dividend was paid in full on November 8, 2010, and the total amount paid was 2,934 million euros.
In accordance with Article 277 of the Corporate Entreprises Act, the following table presents the mandatory statement of accounts prepared to comfirm the existence of sufficient liquidity to pay the dividend at the date of its approval.
|
Liquidity statement at April 28, 2010
|
Millions of euros
|
|||
|
Profit generated from January 1 through March 31, 2010
|
5,029 | |||
|
Mandatory appropriation to reserves
|
- | |||
|
Distributable income
|
5,029 | |||
|
Proposed interim dividend (maximum amount)
|
2,967 | |||
|
Cash position at April 28, 2010
|
||||
|
Funds available for distribution
|
||||
|
Cash and cash equivalents
|
4,271 | |||
|
Unused credit facilities
|
5,889 | |||
|
Proposed interim dividend (maximum amount)
|
(2,967 | ) | ||
|
Difference
|
7,193 | |||
The Telefónica Group manages its liquidity risks (see Note 16) in order to have cash available for the following year.
Dividends paid in 2009
At its meeting held on June 23, 2009, the Company’s Board of Directors resolved to pay a dividend charged to unrestricted reserves for a fixed gross amount of 0.50 euros per outstanding share carrying dividend rights. This dividend was paid in full on November 11, 2009, and the total amount paid was 2,280 million euros.
In addition, in May 2009 an interim dividend against 2009 profit of a gross 0.50 euros per share was paid, entailing a total payment of 2,277 million euros.
Dividends paid in 2008
At its meeting held on April 22, 2008, the Company’s Board of Directors agreed to pay an additional dividend charged against 2007 profit of a gross 0.40 euros per share. A total of 1,869 million euros was paid in May 2008.
In addition, in November 2008 an interim dividend against 2008 profit of a gross 0.50 euros per share was paid, entailing a total payment of 2,296 million euros.
|
c)
|
Reserves
|
Legal reserve
According to the text of the Corporate Enterprises Act, companies must transfer 10% of profit for the year to a legal reserve until this reserve reaches at least 20% of share capital.
The legal reserve can be used to increase capital by the amount exceeding 10% of the increased share capital amount.
Except for this purpose, until the legal reserve exceeds the limit of 20% of share capital, it can only be used to offset losses, if there are no other reserves available. At December 31, 2010, the Company had duly set aside this reserve.
Revaluation reserves
The balance of “Revaluation reserves” arose as a result of the revaluation made pursuant to Royal Decree-Law 7/1996 dated June 7.
The revaluation reserve may be used, free of tax, to offset any losses incurred in the future and to increase capital.
From January 1, 2007, it may be allocated to unrestricted reserves, provided that the capital gain has been realized.
The capital gain will be deemed to have been realized in respect of the portion on which the depreciation has been recorded for accounting purposes or when the revalued assets have been transferred or derecognized.
In this respect, an amount of 16 million euros in 2010 (15 million euros in 2009 and 8 million euros in 2008) corresponding to revaluation reserves subsequently considered unrestricted has been reclassified to “Retained earnings.”
Retained earnings
These reserves include undistributed profits of companies comprising the consolidated Group less interim dividends paid against profit for the year, actuarial gains and losses, and the impact of the asset ceiling on defined-benefit plans
.
|
d)
|
Translation differences
|
The translation differences relate mainly to the effect of exchange rate fluctuations on the net assets of the companies located abroad after the elimination of intra-group balances and transactions.
They also include exchange rate differences resulting from intra-group monetary items considered part of the net investment in a foreign subsidiary, and the impact of the restatement of financial statements of companies in hyperinflationary economies (see Note 3.b).
The Group took an exemption that allows all translation differences generated up to the IFRS transition date to be reset to zero, with the impact on prior years recognized as retained earnings.
The breakdown of the accumulated contribution of translation differences at December 31 is as follows:
|
Millions of euros
|
2010
|
2009
|
2008
|
|||||||||
|
Telefónica Latin America
|
1,208 | 1,052 | (834 | ) | ||||||||
|
Telefónica Europe
|
(2,363 | ) | (2,524 | ) | (2,793 | ) | ||||||
|
Other adjustments and intra-group eliminations
|
212 | 99 | 16 | |||||||||
|
Total Telefónica Group
|
(943 | ) | (1,373 | ) | (3,611 | ) | ||||||
|
e)
|
Treasury shares
|
At December 31, 2010, 2009 and 2008, Telefónica Group companies held the following shares in the Telefónica, S.A. parent company:
|
Number of
shares
|
Euros per share
|
Market value
Millions of euros
|
%
|
|||||||||||||||||
|
Acquisition
price
|
Trading
price
|
|||||||||||||||||||
|
Treasury shares at 12/31/10
|
55,204,942 | 17.01 | 16.97 | 937 | 1.20957 | % | ||||||||||||||
|
Treasury shares at 12/31/09
|
6,329,530 | 16.81 | 19.52 | 124 | 0.13868 | % | ||||||||||||||
|
Treasury shares at 12/31/08
|
125,561,011 | 16.68 | 15.85 | 1,990 | 2.66867 | % | ||||||||||||||
Telefónica S.A. owns the treasury shares, except for 16,896 shares held by Telefónica Móviles Argentina, S.A.
In 2010, 2009 and 2008 the following transactions involving treasury shares were carried out:
|
Number of shares
|
||||
|
Treasury shares at 12
/
31
/07
|
64,471,368 | |||
|
Acquisitions
|
129,658,402 | |||
|
Disposals
|
(68,759 | ) | ||
|
Share cancellation
|
(68,500,000 | ) | ||
|
Treasury shares at 12
/
31
/08
|
125,561,011 | |||
|
Acquisitions
|
65,809,222 | |||
|
Exchange of Telefónica, S.A. shares for China Unicom shares
|
(40,730,735 | ) | ||
|
Employee share option plan
|
(3,309,968 | ) | ||
|
Share cancellation
|
(141,000,000 | ) | ||
|
Treasury shares at 12
/
31
/09
|
6,329,530 | |||
|
Acquisitions
|
52,650,000 | |||
|
Disposals
|
(810,151 | ) | ||
|
Employee share option plan (Note 20.a)
|
(2,964,437 | ) | ||
|
Treasury shares at 12/31/10
|
55,204,942 | |||
The amount paid to acquire treasury shares in 2010 was 897 million euros (1,005 million euros and 2,225 million euros in 2009 and 2008, respectively).
At December 31, 2010 and 2009, the Group held call options on 160 million and 150 million treasury shares, respectively, and at December 31, 2008, put options on 6 million treasury shares.
The Company also holds a derivative financial instrument on 25.64 million Telefónica shares, subject to net settlement.
|
f)
|
Non-controlling interests
|
“Non-controlling interests” represents the share of non-controlling interests in the equity and income or loss for the year of fully consolidated Group companies.
The movements in this heading of the 2010, 2009 and 2008 consolidated statement of financial position are as follows:
|
Millions of euros
|
Balance at
12
/
31
/
09
|
Capital
contributions
and inclusion
of companies
|
Profit/(loss)
for the year
|
Change in
translation
differences
|
Acquisitions of
non-controlling
interests and
exclusion of
companies
|
Dividends
paid
|
Other
movements
|
Balance
at
12/
31
/
10
|
||||||||||||||||||||||||
|
Telefónica O2 Czech Republic, a.s.
|
1,044 | - | 88 | 57 | - | (156 | ) | - | 1,033 | |||||||||||||||||||||||
|
Telefónica Chile, S.A.
|
22 | - | 3 | 3 | - | (1 | ) | (4 | ) | 23 | ||||||||||||||||||||||
|
Telesp Participaçoes, S.A.
|
542 | - | 131 | 69 | - | (105 | ) | (7 | ) | 630 | ||||||||||||||||||||||
|
Brasilcel (Holdings)
|
885 | 4,304 | 224 | 258 | - | (171 | ) | 6 | 5,506 | |||||||||||||||||||||||
|
Fonditel Entidad Gestora de Fondos
de Pensiones, S.A.
|
23 | - | 2 | - | - | (3 | ) | - | 22 | |||||||||||||||||||||||
|
Iberbanda, S.A.
|
6 | - | (4 | ) | - | - | - | - | 2 | |||||||||||||||||||||||
|
Colombia Telecomunicaciones,
S.A., ESP
|
- | - | (540 | ) | - | - | - | 540 | - | |||||||||||||||||||||||
|
Other
|
18 | 6 | 1 | 3 | (3 | ) | (4 | ) | (5 | ) | 16 | |||||||||||||||||||||
|
Total
|
2,540 | 4,310 | (95 | ) | 390 | (3 | ) | (440 | ) | 530 | 7,232 | |||||||||||||||||||||
|
Millions of euros
|
Balance at
12/31/08
|
Capital
contributions
and inclusion of
companies
|
Profit/(loss)
for the year
|
Change in
translation
differences
|
Acquisitions of
non-controlling
interests and
exclusion of
companies
|
Dividends
paid
|
Other
movements
|
Balance at
12/31/09
|
||||||||||||||||||||||||
|
Telefónica O2 Czech Republic, a.s.
|
1,095 | - | 114 | 21 | - | (186 | ) | - | 1,044 | |||||||||||||||||||||||
|
Telefónica Chile, S.A.
|
23 | 1 | 1 | 6 | (8 | ) | (1 | ) | - | 22 | ||||||||||||||||||||||
|
Telesp Participaçoes, S.A.
|
385 | - | 101 | 118 | - | (64 | ) | 2 | 542 | |||||||||||||||||||||||
|
Brasilcel (Holdings)
|
774 | - | 46 | 214 | (108 | ) | (41 | ) | - | 885 | ||||||||||||||||||||||
|
Fonditel Entidad Gestora de Fondos
de Pensiones, S.A.
|
20 | - | 3 | - | - | - | - | 23 | ||||||||||||||||||||||||
|
Iberbanda, S.A.
|
9 | - | (3 | ) | - | - | - | - | 6 | |||||||||||||||||||||||
|
Colombia Telecomunicaciones,
S.A., ESP
|
- | - | (104 | ) | - | - | - | 104 | - | |||||||||||||||||||||||
|
Other
|
25 | - | 3 | (2 | ) | (7 | ) | (3 | ) | 2 | 18 | |||||||||||||||||||||
|
Total
|
2,331 | 1 | 161 | 357 | (123 | ) | (295 | ) | 108 | 2,540 | ||||||||||||||||||||||
|
Millions of euros
|
Balance at
12/
31
/
07
|
Capital
contributions
and inclusion of
companies
|
Profit/(loss)
for the year
|
Change in
translation
differences
|
Acquisitions of
non-controlling
interests and
exclusion of
companies
|
Dividends
paid
|
Other
movements
|
Balance at
12
/
31
/
08
|
||||||||||||||||||||||||
|
Telefónica O2 Czech Republic, a.s.
|
1,192 | - | 112 | (12 | ) | - | (197 | ) | - | 1,095 | ||||||||||||||||||||||
|
Telefónica Chile, S.A.
|
473 | - | 25 | (72 | ) | (397 | ) | (7 | ) | 1 | 23 | |||||||||||||||||||||
|
Telesp Participaçoes, S.A.
|
464 | - | 127 | (93 | ) | - | (113 | ) | - | 385 | ||||||||||||||||||||||
|
Brasilcel (Holdings)
|
545 | 348 | 61 | (163 | ) | - | (12 | ) | (5 | ) | 774 | |||||||||||||||||||||
|
Fonditel Entidad Gestora de Fondos
de Pensiones, S.A.
|
19 | - | 4 | - | - | (2 | ) | (1 | ) | 20 | ||||||||||||||||||||||
|
Iberbanda, S.A.
|
11 | 8 | (10 | ) | - | - | - | - | 9 | |||||||||||||||||||||||
|
Colombia Telecomunicaciones,
S.A., ESP
|
- | - | (89 | ) | - | - | - | 89 | - | |||||||||||||||||||||||
|
Other
|
26 | - | 4 | (3 | ) | (1 | ) | (2 | ) | 1 | 25 | |||||||||||||||||||||
|
Total
|
2,730 | 356 | 234 | (343 | ) | (398 | ) | (333 | ) | 85 | 2,331 | |||||||||||||||||||||
2010
As disclosed in Note 5, the Group availed itself of the option to measure the non-controlling interests of Vivo Participaçoes, S.A. at fair value at the date of acquisition
(see Note 3.c)
in the amount of 5,290 million euros, which has resulted in an increase in non-controlling interests of 4,304 million euros, net of the amount of the previously existing non-controlling interests.
Similarly, the activity in 2010 reflects the allocation to non-controlling interests of the losses incurred by Colombia Telecomunicaciones, S.A., ESP, as described in Note 17, in the amount of 414 million euros.
“Other movements” includes the impact of the agreement signed with the holders of non-controlling interests in Colombia Telecomunicaciones, S.A., ESP (see Notes 21.b and 3.r)
Also noteworthy was the impact of the dividends paid during the year by Brasilcel, N.V., Telefónica O2 Czech Republic, a.s. and Telesp Participaçoes, S.A.
2009
The reorganization of Brasilcel Group companies in 2009 following the acquisition of the Telemig Group in 2008 decreased the balance of “Non-controlling interests” by 108 million euros.
Also noteworthy was the impact of the dividends paid during the year by Telefónica O2 Czech Republic, a.s. and Telesp Participaçoes, S.A.
2008
The main variation in 2008 relates to the acquisition of Telefónica Chile, S.A.’s non-controlling interests, which decreased the balance of “Non-controlling interests” by 397 million euros, and to the acquisition of the Telemig Group companies, which increased the balance by 335 million euros.
Also noteworthy in 2008 was the movement caused by the dividends paid by Telefónica O2 Czech Republic, a.s. and Telesp Participaçoes, S.A.
|
(13)
|
FINANCIAL ASSETS AND LIABILITIES
|
1.- Financial assets
The breakdown of financial assets of the Telefónica Group at December 31, 2010 and 2009 is as follows:
| December 31, 2010 | ||||||||||||||||||||||||||||||||||||||||||||
|
Fair value through
profit or loss
|
Measurement hierarchy
|
|||||||||||||||||||||||||||||||||||||||||||
|
Millions of euros
|
Held for
trading
|
Fair value
option
|
Available-
for-sale
|
Hedges
|
Level 1
(Quoted
prices)
|
Level 2 (Other
directly
observable
market
inputs)
|
Level 3
(Inputs not
based on
observable
market data)
|
Amortized
cost
|
Held-to-
maturity
investments
|
Total
carrying
amount
|
Total fair
value
|
|||||||||||||||||||||||||||||||||
|
Non-current financial assets
|
948 | 211 | 1,194 | 1,630 | 1,321 | 2,660 | 2 | 3,423 | - | 7,406 | 7,325 | |||||||||||||||||||||||||||||||||
|
Investments
|
- | - | 597 | - | 482 | 113 | 2 | - | - | 597 | 597 | |||||||||||||||||||||||||||||||||
|
Long-term credits
|
12 | 211 | 597 | - | 816 | 4 | - | 2,118 | - | 2,938 | 2,838 | |||||||||||||||||||||||||||||||||
|
Deposits and guarantees
|
- | - | - | - | - | - | - | 1,680 | - | 1,680 | 1,324 | |||||||||||||||||||||||||||||||||
|
Derivative instruments
|
936 | - | - | 1,630 | 23 | 2,543 | - | - | - | 2,566 | 2,566 | |||||||||||||||||||||||||||||||||
|
Impairment losses
|
- | - | - | - | - | - | - | (375 | ) | - | (375 | ) | - | |||||||||||||||||||||||||||||||
|
Current financial assets
|
272 | 160 | 309 | 201 | 554 | 363 | 25 | 4,604 | 248 | 5,794 | 5,794 | |||||||||||||||||||||||||||||||||
|
Financial investments
|
272 | 160 | 309 | 201 | 554 | 363 | 25 | 384 | 248 | 1,574 | 1,574 | |||||||||||||||||||||||||||||||||
|
Cash and cash equivalents
|
- | - | - | - | - | - | - | 4,220 | - | 4,220 | 4,220 | |||||||||||||||||||||||||||||||||
|
Total financial assets
|
1,220 | 371 | 1,503 | 1,831 | 1,875 | 3,023 | 27 | 8,027 | 248 | 13,200 | 13,119 | |||||||||||||||||||||||||||||||||
| December 31, 2009 | ||||||||||||||||||||||||||||||||||||||||
|
Fair value
through profit or
loss
|
Measurement hierarchy
|
|||||||||||||||||||||||||||||||||||||||
|
Millions of euros
|
Held for
trading
|
Fair value
option
|
Available-
for-sale
|
Hedges
|
Level 1
(Quoted
prices)
|
Level 2 (Other
directly
observable
market inputs)
|
Level 3 (Inputs
not based on
observable
market data)
|
Amortized
cost
|
Total
carrying
amount
|
Total fair
value
|
||||||||||||||||||||||||||||||
|
Non-current financial assets
|
930 | 233 | 1,248 | 1,572 | 1,508 | 2,475 | - | 2,005 | 5,988 | 5,988 | ||||||||||||||||||||||||||||||
|
Investments
|
- | - | 654 | - | 570 | 84 | - | - | 654 | 654 | ||||||||||||||||||||||||||||||
|
Long-term credits
|
91 | 233 | 594 | - | 918 | - | - | 1,022 | 1,940 | 1,940 | ||||||||||||||||||||||||||||||
|
Deposits and guarantees
|
- | - | - | - | - | - | - | 1,496 | 1,496 | 983 | ||||||||||||||||||||||||||||||
|
Derivative instruments
|
839 | - | - | 1,572 | 20 | 2,391 | - | - | 2,411 | 2,411 | ||||||||||||||||||||||||||||||
|
Impairment losses
|
- | - | - | - | - | - | - | (513 | ) | (513 | ) | - | ||||||||||||||||||||||||||||
|
Current financial assets
|
859 | 134 | 237 | 59 | 769 | 520 | - | 9,730 | 11,019 | 11,019 | ||||||||||||||||||||||||||||||
|
Financial investments
|
859 | 134 | 237 | 59 | 769 | 520 | - | 617 | 1,906 | 1,906 | ||||||||||||||||||||||||||||||
|
Cash and cash equivalents
|
- | - | - | - | - | - | - | 9,113 | 9,113 | 9,113 | ||||||||||||||||||||||||||||||
|
Total financial assets
|
1,789 | 367 | 1,485 | 1,631 | 2,277 | 2,995 | - | 11,735 | 17,007 | 17,007 | ||||||||||||||||||||||||||||||
The calculation of the fair values of the Telefónica Group’s debt instruments required an estimate, for each currency and subsidiary, of a credit spread curve using the prices of the Group’s bonds and credit derivatives.
Derivatives are measured using the valuation techniques and models normally used in the market, based on money-market curves and volatility prices available in the market.
|
a)
|
Non-current financial assets
|
The movement in items composing “Non-current financial assets” and the related impairment losses at December 31, 2010 and 2009 are as follows:
|
Millions of euros
|
||||||||||||||||||||||||||||
|
Investments
|
Long-term
credits
|
Derivative
financial
assets
|
Deposits and
guarantees
|
Long-term
prepayments
|
Impairment
losses
|
Total
|
||||||||||||||||||||||
|
Balance at 12/31/08
|
1,584 | 1,602 | 3,590 | 905 | 92 | (397 | ) | 7,376 | ||||||||||||||||||||
|
Acquisitions
|
3 | 921 | - | 842 | 35 | (114 | ) | 1,687 | ||||||||||||||||||||
|
Disposals
|
(33 | ) | (503 | ) | (1,118 | ) | (364 | ) | (26 | ) | - | (2,044 | ) | |||||||||||||||
|
Inclusion of companies
|
- | - | - | - | - | - | - | |||||||||||||||||||||
|
Translation differences
|
9 | 90 | (38 | ) | 146 | 6 | (2 | ) | 211 | |||||||||||||||||||
|
Fair value adjustments
|
565 | (53 | ) | (5 | ) | - | - | - | 507 | |||||||||||||||||||
|
Transfers
|
(1,474 | ) | (221 | ) | (18 | ) | (33 | ) | (3 | ) | - | (1,749 | ) | |||||||||||||||
|
Balance at 12/31/09
|
654 | 1,836 | 2,411 | 1,496 | 104 | (513 | ) | 5,988 | ||||||||||||||||||||
|
Acquisitions
|
51 | 1,385 | 62 | 339 | 80 | (79 | ) | 1,838 | ||||||||||||||||||||
|
Disposals
|
(1 | ) | (719 | ) | (389 | ) | (112 | ) | (29 | ) | 243 | (1,007 | ) | |||||||||||||||
|
Inclusion of companies
|
8 | 198 | 34 | 203 | 7 | (7 | ) | 443 | ||||||||||||||||||||
|
Translation differences
|
13 | 92 | 16 | (186 | ) | 7 | 39 | (19 | ) | |||||||||||||||||||
|
Fair value adjustments
|
(128 | ) | 60 | 444 | 34 | - | - | 410 | ||||||||||||||||||||
|
Transfers
|
- | (81 | ) | (12 | ) | (94 | ) | (2 | ) | (58 | ) | (247 | ) | |||||||||||||||
|
Balance at 12/31/10
|
597 | 2,771 | 2,566 | 1,680 | 167 | (375 | ) | 7,406 | ||||||||||||||||||||
“Investments” includes the fair value of investments in companies where Telefónica does not exercise significant control and for which there is no specific disposal plan for the short term (see Note 3.i).
Among these is the Telefónica Group's shareholding in Banco Bilbao Vizcaya Argentaria, S.A. (BBVA) held since 2000 of 418 million euros (468 million euros at December 31, 2009), representing 0.98% of its share capital. In 2010, the Telefónica Group transferred 191 million euros of the value of the holding in BBVA, up to its fair value, from equity to net financial expense.
In 2009, the Telefónica Group’s stake in China Unicom was transferred to “Investments in associates” following the share exchange described in Note 2. The amount transferred was 1,467 million euros.
Given the poor situation of financial markets, at year-end the Group assessed the securities in its portfolio of listed available-for-sale assets individually for impairment. The analysis did not uncover the need to recognize any additional impairment losses.
“Long-term credits” includes mainly the investment of the net level premium reserves of the Group’s insurance companies, primarily in fixed-income securities, amounting to 931 million euros and 1,023 million euros at December 31, 2010 and 2009, respectively. It also includes the long-term loans to associates described in Note 9, especially the financing extended to Telco, S.p.A., totaling 600 million euros at December 31, 2010.
“Derivative financial assets” includes the fair value of economic hedges of assets or liabilities in the consolidated statement of financial position whose maturity is 12 months or greater, as part of the Group’s financial risk-hedging strategy (see Note 16).
“Deposits and guarantees” consists mainly of balances to cover guarantees and stood at 1,680 million euros at December 31, 2010 (1,496 million euros at December 31, 2009). These deposits will decrease as the respective obligations they guarantee are reduced.
|
b)
|
Current financial assets
|
This heading in the accompanying consolidated statement of financial position at December 31, 2010 and 2009 includes mainly the following items:
|
-
|
Investments in financial instruments recognized at fair value to cover commitments undertaken by the Group’s insurance companies, amounting to 160 million euros at December 31, 2010 (140 million euros at December 31, 2009). The maturity schedule for these financial assets is established on the basis of payment projections for the commitments.
|
|
-
|
Derivative financial assets with a short-term maturity or not used to hedge non-current items in the consolidated statement of financial position, which amounted to 371 million euros (537 million euros in 2009). The variation in the balance between the two years was due to exchange- and interest-rate fluctuations (see Note 16).
|
|
-
|
Short-term deposits and guarantees amounting to 196 million euros at December 31, 2010 (470 million euros at December 31, 2009).
|
|
-
|
Current investments of cash surpluses which, given their characteristics, have not been classified as “Cash and cash equivalents.”
|
Current financial assets that are highly liquid and have maturities of three months or less from the date contracted are recorded under “Cash and cash equivalents” on the accompanying consolidated statement of financial position.
2.- Financial liabilities
The composition of this heading at December 31, 2010 and 2009 is as follows:
|
Millions of euros
|
Balance at
12/31/10
|
Balance at
12/31/09
|
||||||
|
Issues
|
39,692 | 35,843 | ||||||
|
Interest-bearing debt
|
21,408 | 20,948 | ||||||
|
Total
|
61,100 | 56,791 | ||||||
|
Total non-current
|
51,356 | 47,607 | ||||||
|
Total current
|
9,744 | 9,184 | ||||||
The maturity profile of these financial liabilities at December 31, 2010 is as follows:
|
Maturity
|
||||||||||||||||||||||||||||
|
(Millions of euros)
|
2011
|
2012
|
2013
|
2014
|
2015
|
Subsequent years
|
Total
|
|||||||||||||||||||||
|
Debentures and bonds
|
4,029 | 1,933 | 5,399 | 5,100 | 3,809 | 15,723 | 35,993 | |||||||||||||||||||||
|
Promissory notes & commercial paper
|
1,728 | - | - | - | - | - | 1,728 | |||||||||||||||||||||
|
Other marketable debt securities
|
- | 1,971 | - | - | - | - | 1,971 | |||||||||||||||||||||
|
Loans and other payables
|
3,664 | 3,932 | 4,567 | 1,110 | 4,390 | 2,244 | 19,907 | |||||||||||||||||||||
|
Derivative financial liabilities
|
323 | 195 | 93 | 109 | 226 | 555 | 1,501 | |||||||||||||||||||||
|
TOTAL
|
9,744 | 8,031 | 10,059 | 6,319 | 8,425 | 18,522 | 61,100 | |||||||||||||||||||||
|
·
|
The estimate of future interest that would accrue on these financial liabilities held by the Group at December 31, 2010 is as follows: 2,534 million euros in 2011, 2,323 million euros in 2012, 2,119 million euros in 2013, 1,815 million euros in 2014, 1,448 million euros in 2015 and 9,170 million euros in years after 2015. For variable rate financing, the Group mainly estimates future interest using the forward curve of the various currencies at December 31, 2010.
|
|
·
|
The amounts shown in this table take into account the fair value of derivatives classified as financial liabilities (i.e., those with a negative fair value) and exclude the fair value of derivatives classified as current financial assets, in the amount of 371 million euros, and those classified as non-current, in the amount of 2,566 million euros (i.e., those with a positive fair value).
|
|
·
|
In addition, the amount does not take into account the deferred payment for the acquisition of Brasilcel, N.V. for 1,977 million euros (see Note 5).
|
The composition of these financial liabilities, by category, at December 31, 2010 and 2009 is as follows:
| December 31, 2010 | ||||||||||||||||||||||||||||||||||||
|
Fair value through profit or loss
|
Measurement hierarchy
|
|||||||||||||||||||||||||||||||||||
|
Millions of euros
|
Held
for
trading
|
Fair value
option
|
Hedges
|
Level 1
(Quoted
prices)
|
Level 2 (Other
directly
observable
market inputs)
|
Level 3 (Inputs not
based on observable
market data)
|
Liabilities
at
amortized
cost
|
Total
carrying
amount
|
Total fair
value
|
|||||||||||||||||||||||||||
|
Issues
|
- | - | - | - | - | - | 39,692 | 39,692 | 39.127 | |||||||||||||||||||||||||||
|
Interest-bearing debt
|
695 | - | 806 | 210 | 1,291 | - | 19,907 | 21,408 | 19,777 | |||||||||||||||||||||||||||
|
Total financial liabilities
|
695 | - | 806 | 210 | 1,291 | - | 59,599 | 61,100 | 58,904 | |||||||||||||||||||||||||||
| December 31, 2009 | ||||||||||||||||||||||||||||||||||||
|
Fair value through profit or loss
|
Measurement hierarchy
|
|||||||||||||||||||||||||||||||||||
|
Millions of euros
|
Held for
trading
|
Fair value
option
|
Hedges
|
Level 1
(Quoted
prices)
|
Level 2 (Other
directly
observable
market inputs)
|
Level 3 (Inputs
not based on
observable
market data)
|
Liabilities
at
amortized
cost
|
Total
carrying
amount
|
Total fair
value
|
|||||||||||||||||||||||||||
|
Issues
|
- | - | - | - | - | - | 35,843 | 35,843 | 37.890 | |||||||||||||||||||||||||||
|
Interest-bearing debt
|
705 | - | 2.285 | 147 | 2,843 | - | 17,958 | 20,948 | 20,840 | |||||||||||||||||||||||||||
|
Total financial liabilities
|
705 | - | 2.285 | 147 | 2,843 | - | 53,801 | 56,791 | 58,730 | |||||||||||||||||||||||||||
Some of the financing arranged by various Telefónica Group companies is subject to compliance with certain financial covenants. All the covenants were being complied with at the date of these consolidated financial statements.
|
a)
|
Issues
|
The movement in issues of debentures, bonds and other marketable debt securities in 2010 and 2009 is as follows:
|
Millions of euros
|
Domestic
currency
issues
|
Foreign
currency
issues
|
Short-term
promissory
notes
and commercial
paper
|
Other
non-current
marketable
debt
securities
|
Total
|
|||||||||||||||
|
Balance at 12
/
31
/08
|
13,631 | 12,799 | 1,595 | 2,054 | 30,079 | |||||||||||||||
|
New issues
|
5,750 | 2,855 | 105 | - | 8,710 | |||||||||||||||
|
Redemptions, conversions and exchanges
|
(1,152 | ) | (802 | ) | (909 | ) | - | (2,863 | ) | |||||||||||
|
Changes in consolidation scope
|
- | - | - | - | - | |||||||||||||||
|
Revaluation and other movements
|
(654 | ) | 535 | 82 | (46 | ) | (83 | ) | ||||||||||||
|
Balance at 12
/
31
/09
|
17,575 | 15,387 | 873 | 2,008 | 35,843 | |||||||||||||||
|
New issues
|
2,392 | 3,879 | 1,102 | - | 7,373 | |||||||||||||||
|
Redemptions, conversions and exchanges
|
(1,269 | ) | (3,634 | ) | (311 | ) | - | (5,214 | ) | |||||||||||
|
Changes in consolidation scope
|
- | 317 | - | - | 317 | |||||||||||||||
|
Revaluation and other movements
|
96 | 1,250 | 64 | (37 | ) | 1,373 | ||||||||||||||
|
Balance at 12/31/10
|
18,794 | 17,199 | 1,728 | 1,971 | 39,692 | |||||||||||||||
Bonds and other marketable debt securities
Telefónica, S.A. has a full and unconditional guarantee on issues made by Telefónica Emisiones, S.A.U., Telefónica Finanzas México, S.A. de C.V and Telefónica Europe, B.V., all of which are, directly or indirectly, wholly owned subsidiaries of Telefónica, S.A.
Appendix II presents the characteristics of all outstanding debentures and bond issues at year-end 2010 and 2009, as well as the significant issues made in each year.
Promissory notes & commercial paper
At December 31, 2010, Telefónica Europe, B.V., had a program for issuance of commercial paper, guaranted by Telefónica, S.A., for an amount of up to 2,000 million euros. The outstanding balance of commercial paper issued under this program at December 31, 2010 was 1,613 million euros, carrying an average interest rate of 0.82% (551 million euros at an average rate of 1.17% at December 31, 2009).
On December 13, 2010, Telefónica Móviles, S.A. (Peru) registered a commercial paper program for an equivalent of up to 150 million US dollars. At December 31, 2010, there was no outstanding balance under this program.
On December 20, 2010, Telefónica de Perú, S.A.A. registered a commercial paper program for an equivalent of up to 150 million US dollars. At December 31, 2010, there was no outstanding balance under this program.
Other marketable debt securities
This heading consists mainly of preferred shares issued by Telefónica Finance USA, LLC, with a redemption value of 2,000 million euros. These shares were issued in 2002 and have the following features:
|
·
|
Interest rate up to December 30, 2012 of 3-month Euribor, and maximum and minimum effective annual rates of 7% and 4.25%, respectively, and from then 3-month Euribor plus a 4% spread.
|
|
·
|
Interest is paid every three calendar months provided the Telefónica Group generates consolidated net income.
|
|
b)
|
Interest-bearing debt
|
The detail of “Interest-bearing debt” is as follows:
|
Balance at 12
/
31
/
10
|
Balance at 12
/
31
/
09
|
|||||||||||||||||||||||
|
Millions of euros
|
Current
|
Non-current
|
Total
|
Current
|
Non-current
|
Total
|
||||||||||||||||||
|
Loans and other payables
|
3,664 | 16,243 | 19,907 | 1,789 | 16,169 | 17,958 | ||||||||||||||||||
|
Derivative financial liabilities (Note 16)
|
323 | 1,178 | 1,501 | 1,432 | 1,558 | 2,990 | ||||||||||||||||||
|
Total
|
3,987 | 17,421 | 21,408 | 3,221 | 17,727 | 20,948 | ||||||||||||||||||
The average interest rate on outstanding loans and other payables at December 31, 2010 was 2.56% (3.58% in 2009). This percentage does not include the impact of hedges arranged by the Group.
The main financing transactions included under “Interest-bearing debt” outstanding at December 31, 2010 and 2009 and their nominal amounts are provided in Appendix IV.
Interest-bearing debt arranged in 2010 and 2009 mainly includes the following:
|
·
|
On February 12, 2010, Telefónica, S.A. entered into a long-term line of credit facility for an aggregate amount of 472 million US dollars at a fixed rate with the guaranty of the Swedish Export Credits Guarantee Board (EKN) for equipment and networks purchases from a supplier in this country. This credit facility is divided into three tranches: a tranche of 232 million US dollars maturing on November 30, 2018, another of 164 million US dollars maturing on April 30, 2019, and a third of 76 million US dollars maturing on November 30, 2019. At December 31, 2010, there was no outstanding principal amount drawn under this credit facility.
|
|
·
|
On July 28, 2010, Telefónica, S.A. entered into a syndicated facility agreement (“Facility Agreement”) with several domestic and international financial entities in an aggregate amount of up to 8,000 million euros. The Facility Agreement is divided into two tranches: the first, a three-year loan facility in an aggregate amount of up to 5,000 million euros and the second, a five-year revolving credit facility, in an aggregate amount of up to 3,000 million euros. At December 31, 2010, the outstanding principal amount of this credit facility was 6,000 million euros.
|
The main repayments or maturities of bank interest-bearing debt in 2010 and 2009 are as follows:
|
·
|
During 2010, Telefónica, S.A. made several voluntary early repayments under its 6,000 million euros credit facility dated June 28, 2005 in an aggregate amount of 5,700 million euros and the limit amount was reduced to 650 million euros. At December 31, 2010, the outstanding principal amount was 300 million euros.
|
|
·
|
On July 6, 2009, the syndicated loan facility arranged by Telefónica, S.A. with a group of banks on July 6, 2004, for 3,000 million euros, matured as scheduled.
|
At December 31, 2010 the Telefónica Group had total undrawn credit lines from various sources amounting approximately 11,000 million euros (exceeding the 7,200 million euros available at December 31, 2009).
Loans by currency
The breakdown of loans by currency at December 31, 2010 and 2009, along with the equivalent value of foreign-currency loans in euros, are as follows:
|
Outstanding balance (in millions)
|
||||||||||||||||
|
Currency
|
Euros
|
|||||||||||||||
|
Currency
|
12
/
31
/
10
|
12
/
31
/
09
|
12
/
31
/
10
|
12
/
31
/
09
|
||||||||||||
|
Euros
|
11,778 | 10,835 | 11,778 | 10,835 | ||||||||||||
|
US dollars
|
2,580 | 2,498 | 1,931 | 1,734 | ||||||||||||
|
Brazilian reais
|
3,633 | 3,114 | 1,632 | 1,242 | ||||||||||||
|
Argentine pesos
|
1,080 | 603 | 203 | 110 | ||||||||||||
|
Colombian pesos
|
8,176,727 | 7,675,200 | 3,197 | 2,610 | ||||||||||||
|
Yen
|
16,882 | 17,258 | 155 | 130 | ||||||||||||
|
Chilean peso
|
54,886 | 151,943 | 88 | 208 | ||||||||||||
|
New soles
|
948 | 1,120 | 253 | 269 | ||||||||||||
|
Pounds sterling
|
557 | 708 | 648 | 798 | ||||||||||||
|
Czech crown
|
131 | 301 | 5 | 11 | ||||||||||||
|
Other currencies
|
17 | 11 | ||||||||||||||
|
Total Group
|
N/A | N/A | 19,907 | 17,958 | ||||||||||||
|
(14)
|
TRADE AND OTHER PAYABLES
|
The composition of “Trade and other payables” is as follows:
|
12/
31
/10
|
12/
31
/09
|
|||||||||||||||
|
Millions of euros
|
Non-
current
|
Current
|
Non-
c
urrent
|
Current
|
||||||||||||
|
Trade payables
|
- | 9,038 | - | 6,963 | ||||||||||||
|
Advances received on orders
|
- | 83 | - | 115 | ||||||||||||
|
Other payables
|
1,761 | 8,162 | 752 | 5,130 | ||||||||||||
|
Deferred income
|
543 | 1,775 | 497 | 1,528 | ||||||||||||
|
Payable to associates (Note 9)
|
- | 193 | - | 287 | ||||||||||||
|
Total
|
2,304 | 19,251 | 1,249 | 14,023 | ||||||||||||
“Deferred income” principally includes the amount of connection fees not yet recognized in the income statement, customer loyalty programs, and advance payments received on prepay contracts.
Non-current “Other payables” mainly comprises the deferred portion of the payment for acquiring the license for spectrum use in Mexico, in the amount of 1,039 million euros (see Note 6).
The detail of current “Other payables” at December 31, 2010 and 2009 is as follows:
|
Millions of euros
|
Balance at
12/
31
/
10
|
Balance at
12/
31
/
09
|
||||||
|
Dividends payable by Group companies
|
199 | 157 | ||||||
|
Payables to suppliers of property, plant and equipment, current
|
4,455 | 3,598 | ||||||
|
Accrued employee benefits
|
780 | 695 | ||||||
|
Deferred payment for Brasilcel, N.V. (Note 5)
|
1,977 | - | ||||||
|
Other non-financial non-trade payables
|
751 | 680 | ||||||
|
Total
|
8,162 | 5,130 | ||||||
Information on deferred payments to suppliers of Spanish companies (Third additional provision, "Information requirement" of Law 15/2010 of July 5
th
).
In order to comply with Law 15/2010, the Telefónica Group’s Spanish companies have adapted their internal processes and settled 82 million euros during the first days of 2011, corresponding to the amounts pending to be adapted at the end of the year.
|
(15)
|
PROVISIONS
|
The amounts of provisions in 2010 and 2009 are as follows:
|
12/
31
/10
|
12/
31
/09
|
|||||||||||||||||||||||
|
Millions of euros
|
Current
|
Non-current
|
Total
|
Current
|
Non-current
|
Total
|
||||||||||||||||||
|
Employee benefits:
|
916 | 2,974 | 3,890 | 667 | 3,594 | 4,261 | ||||||||||||||||||
|
- Termination plans
|
898 | 1,858 | 2,756 | 652 | 2,418 | 3,070 | ||||||||||||||||||
|
- Post-employment defined benefit plans
|
- | 829 | 829 | - | 911 | 911 | ||||||||||||||||||
|
- Other benefits
|
18 | 287 | 305 | 15 | 265 | 280 | ||||||||||||||||||
|
Other provisions
|
759 | 1,891 | 2,650 | 296 | 1,399 | 1,695 | ||||||||||||||||||
|
Total
|
1,675 | 4,865 | 6,540 | 963 | 4,993 | 5,956 | ||||||||||||||||||
Employee benefits
|
a)
|
Termination plans
|
In the last few years, the Telefónica Group has carried out early retirement plans in order to adapt its cost structure to the prevailing environment in the markets where it operates, making certain strategic decisions relating to its size and organization.
In this respect, on July 29, 2003, the Ministry of Labor and Social Affairs approved a labor force reduction plan for Telefónica de España through various voluntary, universal and non-discriminatory programs, which were announced on July 30, 2003. The plan concluded on December 31, 2007, with 13,870 employees taking part for a total cost of 3,916 million euros. Provisions recorded for this plan at December 31, 2010 and 2009 amounted to 1,825 and 2,283 million euros, respectively.
Furthermore, the Group had recorded provisions totaling 931 million euros (787 million euros at December 31, 2009) for other planned adjustments to the workforce and plans prior to 2003.
The companies bound by these commitments calculated provisions required at 2010 and 2009 year-end using actuarial assumptions pursuant to current legislation, including the PERM/F-2000 C mortality tables and a variable interest rate based on market yield curves.
The movement in provisions for post-employment plans in 2010 and 2009 is as follows:
|
Millions of euros
|
Total
|
|||
|
Provisions for post-employment plans at
12/
31
/08
|
3,774 | |||
|
Additions
|
109 | |||
|
Retirements/amount applied
|
(1,021 | ) | ||
|
Transfers
|
59 | |||
|
Translation differences and accretion
|
149 | |||
|
Provisions for post-employment plans at
12/
31
/09
|
3,070 | |||
|
Additions
|
406 | |||
|
Retirements/amount applied
|
(813 | ) | ||
|
Transfers
|
(3 | ) | ||
|
Translation differences and accretion
|
96 | |||
|
Provisions for post-employment plans at 12
/
31
/10
|
2,756 | |||
|
b)
|
Post-employment defined benefit plans
|
The Group has a number of defined-benefit plans in the countries where it operates. The following tables present the main data of these plans:
|
12/
31/
10
|
Spain
|
Europe
|
Latin America
|
|||||||||||||||||||||||||
|
Millions of euros
|
ITP
|
Survival
|
UK
|
Germany
|
Brazil
|
Other
|
Total
|
|||||||||||||||||||||
|
Obligation
|
424 | 208 | 918 | 57 | 272 | 13 | 1,892 | |||||||||||||||||||||
|
Assets
|
- | - | (838 | ) | (63 | ) | (250 | ) | (5 | ) | (1,156 | ) | ||||||||||||||||
|
Net provision before asset ceiling
|
424 | 208 | 80 | (6 | ) | 22 | 8 | 736 | ||||||||||||||||||||
|
Asset ceiling
|
- | - | - | 9 | 71 | - | 80 | |||||||||||||||||||||
|
Net provision
|
424 | 208 | 80 | 3 | 106 | 8 | 829 | |||||||||||||||||||||
|
Net assets
|
- | - | - | - | 13 | - | 13 | |||||||||||||||||||||
|
12/31/09
|
Spain
|
Europe
|
Latin America
|
|||||||||||||||||||||||||
|
Millions of euros
|
ITP
|
Survival
|
UK
|
Germany
|
Brazil
|
Other
|
Total
|
|||||||||||||||||||||
|
Obligation
|
451 | 191 | 922 | 37 | 159 | 11 | 1,771 | |||||||||||||||||||||
|
Assets
|
- | - | (744 | ) | (58 | ) | (116 | ) | - | (918 | ) | |||||||||||||||||
|
Net provision before asset ceiling
|
451 | 191 | 178 | (21 | ) | 43 | 11 | 853 | ||||||||||||||||||||
|
Asset ceiling
|
- | - | - | 15 | 12 | - | 27 | |||||||||||||||||||||
|
Net provision
|
451 | 191 | 178 | - | 80 | 11 | 911 | |||||||||||||||||||||
|
Net assets
|
- | - | - | 6 | 25 | - | 31 | |||||||||||||||||||||
The movement in the present value of obligations in 2010 and 2009 is as follows:
|
Spain
|
Europe
|
Latin America
|
||||||||||||||||||||||||||
|
Millions of euros
|
ITP
|
Survival
|
UK
|
Germany
|
Brazil
|
Other
|
Total
|
|||||||||||||||||||||
|
Present value of obligation at 12/31/08
|
485 | 188 | 587 | 33 | 104 | 12 | 1,409 | |||||||||||||||||||||
|
Translation differences
|
- | - | 42 | - | 38 | (4 | ) | 76 | ||||||||||||||||||||
|
Current service cost
|
- | 7 | 22 | 2 | 1 | 2 | 34 | |||||||||||||||||||||
|
Interest cost
|
16 | 7 | 42 | 2 | 12 | 1 | 80 | |||||||||||||||||||||
|
Actuarial losses and gains
|
3 | (4 | ) | 241 | - | 11 | - | 251 | ||||||||||||||||||||
|
Benefits paid
|
(53 | ) | (7 | ) | (18 | ) | - | (7 | ) | - | (85 | ) | ||||||||||||||||
|
Plan curtailments
|
- | - | 6 | - | - | - | 6 | |||||||||||||||||||||
|
Present value of obligation at 12/31/09
|
451 | 191 | 922 | 37 | 159 | 11 | 1,771 | |||||||||||||||||||||
|
Translation differences
|
- | - | 31 | - | 26 | - | 57 | |||||||||||||||||||||
|
Current service cost
|
- | 8 | 29 | 2 | 4 | - | 43 | |||||||||||||||||||||
|
Past service costs
|
- | - | (35 | ) | - | - | - | (35 | ) | |||||||||||||||||||
|
Interest cost
|
15 | 7 | 55 | 2 | 23 | 1 | 103 | |||||||||||||||||||||
|
Actuarial losses and gains
|
8 | 9 | - | 16 | 2 | 1 | 36 | |||||||||||||||||||||
|
Benefits paid
|
(50 | ) | (7 | ) | (14 | ) | - | (11 | ) | - | (82 | ) | ||||||||||||||||
|
Plan curtailments
|
- | - | 1 | - | - | - | 1 | |||||||||||||||||||||
|
Inclusion of companies
|
- | - | - | - | 69 | - | 69 | |||||||||||||||||||||
|
Exclusion of companies
|
- | - | (71 | ) | - | - | - | (71 | ) | |||||||||||||||||||
|
Present value of obligation at 12/31/10
|
424 | 208 | 918 | 57 | 272 | 13 | 1,892 | |||||||||||||||||||||
Movements in the fair value of plan assets in 2010 and 2009 are as follows:
|
Europe
|
Latin America
|
|||||||||||||||||||
|
Millions of euros
|
UK
|
Germany
|
Brazil
|
Other
|
Total
|
|||||||||||||||
|
Fair value of plan assets at
12/
31/08
|
579 | 51 | 78 | - | 708 | |||||||||||||||
|
Translation differences
|
42 | - | 29 | (3 | ) | 68 | ||||||||||||||
|
Expected return on plan assets
|
43 | 2 | 7 | 3 | 55 | |||||||||||||||
|
Actuarial losses and gains
|
59 | (2 | ) | 5 | - | 62 | ||||||||||||||
|
Company contributions
|
36 | 7 | 2 | - | 45 | |||||||||||||||
|
Employee contributions
|
1 | - | - | - | 1 | |||||||||||||||
|
Benefits paid
|
(16 | ) | - | (5 | ) | - | (21 | ) | ||||||||||||
|
Fair value of plan assets at
12/
31/09
|
744 | 58 | 116 | - | 918 | |||||||||||||||
|
Translation differences
|
23 | - | 25 | 1 | 49 | |||||||||||||||
|
Expected return on plan assets
|
54 | 2 | 23 | 1 | 80 | |||||||||||||||
|
Actuarial losses and gains
|
(4 | ) | (5 | ) | 4 | - | (5 | ) | ||||||||||||
|
Company contributions
|
76 | 8 | 4 | 3 | 91 | |||||||||||||||
|
Employee contributions
|
1 | - | - | - | 1 | |||||||||||||||
|
Benefits paid
|
(14 | ) | - | (11 | ) | - | (25 | ) | ||||||||||||
|
Inclusion of companies
|
- | - | 89 | - | 89 | |||||||||||||||
|
Exclusion of companies
|
(42 | ) | - | - | - | (42 | ) | |||||||||||||
|
Fair value of plan assets at 12/31/10
|
838 | 63 | 250 | 5 | 1,156 | |||||||||||||||
The amounts of actuarial gains and losses of these plans recognized directly in equity in accordance with the asset ceilings of these plans in 2010, 2009 and 2008, before non-controlling interests and before the related tax effect, are as follows:
|
Millions of euros
|
2010
|
2009
|
2008
|
|||||||||
|
Spain
|
(17 | ) | 1 | (61 | ) | |||||||
|
Europe
|
(6 | ) | (184 | ) | (85 | ) | ||||||
|
Latin America
|
(71 | ) | (6 | ) | (36 | ) | ||||||
|
Total
|
(94 | ) | (189 | ) | (182 | ) | ||||||
The Group’s principal defined-benefit plans are:
|
a)
|
Plans in Spain:
|
|
a.
|
ITP: Telefónica Spain reached an agreement with its employees whereby it recognized supplementary pension payments for employees who had retired as of June 30, 1992, equal to the difference between the pension payable by the social security system and that which would be paid to them by ITP (Institución Telefónica de Previsión). Once the aforementioned supplementary pension payments had been quantified, they became fixed, lifelong and non-updateable and sixty percent (60%) of the payments are transferable to the surviving spouse, recognized as such as of June 30, 1992, and to underage children.
|
The amount for this provision totaled 424 million euros at December 31, 2010 (451 million euros at December 31, 2009).
|
b.
|
Survival: serving employees who did not join the defined pension plan are still entitled to receive survivorship benefits at the age of 65.
|
The amount for this provision totaled 208 million euros at December 31, 2010 (191 million euros at December 31, 2009).
These plans do not have associated assets which qualify as “plan assets” under IAS 19.
The main actuarial assumptions used in valuing these plans are as follows:
|
Survival
|
ITP
|
|||||||||||||||
|
12/
31
/
10
|
12/
31
/
09
|
12/
31
/
10
|
12/31/09
|
|||||||||||||
|
Discount rate
|
0.682%-3.417% | 0.382%-3.903% | 0.682%-3.417% | 0.382%-3.903% | ||||||||||||
|
Expected rate of salary increase
|
2.50% | 2.50% | - | - | ||||||||||||
|
Mortality tables
|
PERM/F-2000C
Combined with OM77
|
PERM/F-2000C
Combined with OM77
|
92% PERM 2000C/100%
PERF 2000 C
|
92% PERM 2000C/100%
PERF 2000 C
|
||||||||||||
|
b)
|
Plans in the rest of Europe:
|
The various O2 Group companies consolidated within the Telefónica Group have defined-benefit post-employment plans, covered by qualifying assets.
The number of beneficiaries of these plans at December 31, 2010 and 2009 is as follows:
|
Employees
|
2010
|
2009
|
||||||
|
UK
|
4,617 | 4,629 | ||||||
|
Germany
|
5,839 | 5,594 | ||||||
The main actuarial assumptions used in valuing these plans are as follows:
|
12/
31
/
10
|
12/
31
/
09
|
|||||||||||||||
|
UK
|
Germany
|
UK
|
Germany
|
|||||||||||||
|
Nominal rate of salary increase
|
4.5 | % | 1 | % | 4.6 | % | 3.80 | % | ||||||||
|
Nominal rate of pension payment increase
|
3.5 | % | 2.0%-4.0 | % | 3.6 | % | 1.0%-4.0 | % | ||||||||
|
Discount rate
|
5.6 | % | 6.1 | % | 5.8 | % | 6.1 | % | ||||||||
|
Expected inflation
|
3.5 | % | 2.0%-4.0 | % | 3.6 | % | 1.0%-4.0 | % | ||||||||
|
Expected return on plan assets
|
||||||||||||||||
|
- Shares
|
7.5 | % | N/A | 8.0 | % | N/A | ||||||||||
|
- UK government bonds
|
- | N/A | 4.4 | % | N/A | |||||||||||
|
- Other bonds
|
5.2 | % | N/A | 5.3 | % | N/A | ||||||||||
|
- Rest of assets
|
4.2 | % | 4.10%-4.25 | % | 4.4% -8.8 | % | 4.25%-4.30 | % | ||||||||
|
Mortality tables
|
Pna00mcfl0.5
|
Prf. Klaus
Heubeck
(RT 2005 G)
|
Pa00mcfl0.5
|
Prf. Klaus
Heubeck
(RT 2005 G)
|
||||||||||||
|
c)
|
Plans in Latin America:
|
The subsidiary Telecomunicações de São Paulo, S.A. and its subsidiaries and companies of the Vivo Participaçoes, S.A. group had various pension plan, medical insurance and life insurance obligations with employees.
The main actuarial assumptions used in valuing these plans are as follows:
|
12/31/10
|
12/31/09
|
|||||||
|
Discount rate
|
10.25 | % | 9.8 | % | ||||
|
Nominal rate of salary increase
|
6.54% - 7.20 | % | 6.14% - 6.79 | % | ||||
|
Expected inflation
|
5.00 | % | 4.6 | % | ||||
|
Cost of health insurance
|
8.15 | % | 7.74 | % | ||||
|
Expected return on plan assets
|
10.70% - 11.60 | % | 9.83% - 14.94 | % | ||||
|
Mortality tables
|
AT 2000 M/F
|
AT 83
|
||||||
In addition, Telecomunicações de São Paulo, along with the other companies resulting from the privatisation of Telebrás (Telecomunicações Brasileiras, S.A.) in 1998, adhered to PBS-A, a non-contribution defined benefit plan managed by Fundação Sistel de Seguridade Social, whose beneficiaries are employees that retired prior to January 31, 2000. At December 31, 2010, net plan assets amounted to 579 million Brazilian reales (260 million euros). This plan does not have an impact on the consolidated statement of financial position, given that recovery of the assets is not foreseeable.
The valuations used to determine the value of obligations and plan assets, where appropriate, were performed as of December 31, 2010 by external and internal actuaries. The projected unit credit method was used in all cases.
|
d)
|
Other benefits
|
This heading mainly includes the amount recorded by Telefónica Spain related to the accrued portion of long-service bonuses to be awarded to employees after 25 years’ service, amounting to 196 million euros.
Other provisions
The movement in “Other provisions” in 2010 and 2009 is as follows:
|
Millions
of euros
|
||||
|
Other provisions at December 31, 2008
|
1,734 | |||
|
Additions
|
381 | |||
|
Retirements/amount applied
|
(571 | ) | ||
|
Transfers
|
(29 | ) | ||
|
Translation differences
|
180 | |||
|
Other provisions at December 31, 2009
|
1,695 | |||
|
Additions
|
733 | |||
|
Retirements/amount applied
|
(315 | ) | ||
|
Transfers
|
112 | |||
|
Inclusion of companies
|
341 | |||
|
Translation differences
|
84 | |||
|
Other provisions at December 31, 2010
|
2,650 | |||
“Other provisions” includes the amount recorded in 2007 in relation to the 179 million euro fine imposed on Telefónica de España, S.A.U. by the EC anti-trust authorities.
Also included are the provisions for dismantling of assets recognized by Group companies in the amount of 405 million euros in 2010 (270 million euros in 2009).
Finally, “Other Provisions” in 2010 and 2009 also includes the provisions recorded (or used) by the Group companies to cover the risks inherent in the realization of certain assets, the contingencies arising from their respective business activities and the risks arising from commitments and litigation acquired in other transactions, recognized as indicated in Note 3.l.
Given the nature of the risks covered by these provisions, it is not possible to determine a reliable schedule of potential payments, if any.
|
(16)
|
DERIVATIVE FINANCIAL INSTRUMENTS AND RISK MANAGEMENT POLICIES
|
The Telefónica Group is exposed to various financial market risks as a result of: (i) its ordinary business activity, (ii) debt incurred to finance its business, (iii) its investments in companies, and (iv) other financial instruments related to the above commitments.
The main market risks affecting Group companies are as follows:
|
1.
|
Exchange rate risk
|
Exchange rate risk arises primarily from (i) Telefónica’s international presence, through its investments and businesses in countries that use currencies other than the euro (primarily in Latin America, but also in the United Kingdom and the Czech Republic), and (ii) debt denominated in currencies other than that of the country where the business is conducted or the home country of the company incurring such debt.
|
2.
|
Interest rate risk
|
Interest rate risk arises primarily from changes in interest rates affecting (i) financial expenses on floating rate debt (or short-term debt likely to be renewed), due to changes in interest rates and (ii) the value of long-term liabilities at fixed interest rates.
|
3.
|
Share price risk
|
Share price risk arises primarily from changes in the value of the equity investments that may be bought, sold or otherwise involved in transactions, from changes in the value of derivatives associated with such investments, from changes in the value of treasury shares and from equity derivatives.
The Telefónica Group is also exposed to liquidity risk if a mismatch arises between its financing needs (including operating and financial expense, investment, debt redemptions and dividend commitments) and its sources of finance (including revenues, divestments, credit lines from financial institutions and capital market transactions). The cost of finance could also be affected by movements in the credit spreads (over benchmark rates) demanded by lenders.
Finally, the Telefónica Group is exposed to “country risk” (which overlaps with market and liquidity risks). This refers to the possible decline in the value of assets, cash flows generated or cash flows returned to the parent company as a result of political, economic or social instability in the countries where the Telefónica Group operates, especially in Latin America.
The Telefónica Group actively manages these risks through the use of derivatives (primarily on exchange rates, interest rates and share prices) and by incurring debt in local currencies, where appropriate, with a view to stabilizing cash flows, the income statement and investments. In this way, it attempts to protect the Telefónica Group’s solvency, facilitate financial planning and take advantage of investment opportunities.
The Telefónica Group manages its exchange rate risk and interest rate risk in terms of net debt and net financial debt as calculated by them. The Telefónica Group believes that these parameters are more appropriate to understanding its debt position. Net debt and net financial debt take into account the impact of the Group’s cash balance and cash equivalents including derivatives positions with a positive value linked to liabilities. Neither net debt nor net financial debt as calculated by the Telefónica Group should be considered an alternative to gross financial debt (the sum of current and non-current interest-bearing debt) as a measure of liquidity.
Exchange rate risk
The fundamental objective of the exchange rate risk management policy is that, in event of depreciation in foreign currencies relative to the euro, any potential losses in the value of the cash flows generated by the businesses in such currencies, caused by depreciation in exchange rates of a foreign currency relative to the euro, are offset (to some extent) by savings from the reduction in the euro value of debt denominated in such currencies. The degree of exchange rate hedging employed varies depending on the type of investment.
At December 31, 2010, net debt in Latin American currencies was equivalent to approximately 8,463 million euros. However, the Latin American currencies in which this debt is denominated is not distributed in proportion to the cash flows generated in each currency. The future effectiveness of the strategy described above as a hedge of exchange rate risks therefore depends on which currencies depreciate relative to euro.
The Telefónica Group aims to protect itself against declines in Latin American currencies relative to the euro affecting asset values through the use of dollar-denominated debt, incurred either in Spain (where such debt is associated with an investment as long as it is considered to be an effective hedge) or in the country itself, where the market for local currency financing or hedges may be inadequate or non-existent. At December 31, 2010, the Telefónica Group’s net debt denominated in dollars was equivalent to 1,518 million euros, of which 1,126 million euros was related to assets in Latin America and the remaining 392 million euros was related to its investment in China Unicom.
At December 31, 2010, pound sterling-denominated net debt was approximately 2.4 times the value of 2010 operating income excluding the impact of the related depreciation from the “Telefónica Europe” business unit in the United Kingdom. The Telefónica Group’s aim is to maintain the same proportion of pound sterling-denominated net debt to operating income excluding the impact of the related depreciation as the Telefónica Group’s net debt to operating income excluding the impact of the related depreciation ratio, on a consolidated basis, to reduce its sensitivity to changes in the pound sterling to euro exchange rate. Pound sterling-denominated net debt at December 31, 2010, was equivalent to 4,025 million euros, higher than the 3,799 million euros at December 31, 2009.
To protect the investment in the Czech Republic, the Telefónica Group has net debt denominated in Czech crowns, which at December 31, 2010 was equivalent to 1,568 million euros, almost 36% of the original cost of the investment (compared to 59% of the initial cost of the investment in 2009), a decrease from approximately 2,513 million euros at December 31, 2009. The coverage percentage has been reduced in order to incorporate the management criterion adopted for the pound sterling. Consequently, the ratio of net debt in Czech crowns to operating income excluding the impact of the related depreciation is 1.6 in consolidated terms and 2.3 in proportional terms, currently very close to the net debt to operating income excluding the impact of the related depreciation ratio for the Telefónica Group in 2010.
The Telefónica Group also manages exchange rate risk by seeking to minimize the negative impact of any remaining exchange rate exposure on the income statement, regardless of whether there are open positions. Such open position exposure can arise for any of three reasons: (i) a thin market for local derivatives or difficulty in sourcing local currency finance which makes it impossible to arrange a low-cost hedge (as in Argentina and Venezuela), (ii) financing through intra-group loans, where the accounting treatment of exchange rate risk is different from that for financing through capital contributions, and (iii) as the result of a deliberate policy decision, to avoid the high cost of hedges that are not warranted by expectations or high risk of depreciation.
In 2010, exchange rate management resulted in negative exchange rate differences totaling 112 million euros, compared to 540 million euros in negative differences in 2009.
The following table illustrates the sensitivity of the income statement and equity to changes in exchange rates, where: (i) to calculate the impact on the income statement, the exchange rate position affecting the income statement at the end of 2010 was considered constant during 2011; (ii) to calculate the impact on equity, only monetary items have been considered, namely debt and derivatives such as hedges of net investment and loans to subsidiaries associated with the investment, whose composition is considered constant in 2011 and identical to that existing at the end of 2010. In both cases, Latin American currencies are assumed to depreciate against the US dollar, and the rest of the currencies against the euro by 10%.
|
Millions of euros
Currency
|
Change
|
Impact on the consolidated income statement
|
Impact on consolidated equity
|
|
All currencies vs EUR
|
10%
|
105
|
67
|
|
USD vs EUR
|
10%
|
1
|
206
|
|
European currencies vs EUR
|
10%
|
-
|
(417)
|
|
Latin American currencies vs USD
|
10%
|
104
|
278
|
|
All currencies vs EUR
|
(10)%
|
(105)
|
(67)
|
|
USD vs EUR
|
(10)%
|
(1)
|
(206)
|
|
European currencies vs EUR
|
(10)%
|
-
|
417
|
|
Latin American currencies vs USD
|
(10)%
|
(104)
|
(278)
|
The Group’s monetary position in Venezuela at December 31, 2010 is a net creditor position of 401 million Venezuela bolivars (equivalent to approximately 70 million euros). This leads to a higher financial expense in the amount of 109 million euros.
Interest rate risk
The Telefónica Group’s financial expenses are exposed to changes in interest rates. In 2010, the rates applied to the largest amount of short-term debt were mainly based on the Euribor, the Czech crown Pribor, the Brazilian SELIC, the US dollar Libor and the Colombian UVR. In nominal terms, at December 31, 2010, 64.9% of the Telefónica Group’s net debt (or 70.0% of long-term net debt) was at rates fixed for a period longer than one year, compared to 52.6% of net debt (50% of long-term net debt) in 2009. Of the remaining 35.1% (net debt at floating or fixed rates maturing in less than one year), the interest rate on 18 percentage points was set for a period of more than one year (7% of long-term net debt), compared to 24 percentage points on debt at floating or fixed rates maturing in less than one year (10.7% of long-term net debt) at December 31, 2009. This decrease in 2010 from 2009 is due to our decision to cancel or not renew an amount equivalent to 491 million euros of caps and floors in euros, US dollars and pounds sterling, following the policy implemented in 2009 in anticipation of a fall in interest rates.
In addition, early retirement liabilities were discounted to present value over the year, using the curve on the swap rate markets. The decrease in interest rates has increased the market value of these liabilities. However, this increase was nearly completely offset by the increase in the value of the hedges on these positions.
Net financial expenses decreased 20% to 2,649 million euros in 2010, from 3,307 million euros in 2009, mainly due to the impact of Venezuela. Stripping out exchange-rate effects, net financial expense for 2010 totaled 2,537 million euros, an 8% decrease from the 2,767 million euros recorded in 2009.
To illustrate the sensitivity of financial expenses to variability in short-term interest rates, a 100 basis points increase in interest rates in all currencies in which there are financial positions at December 31, 2010 has been assumed, and a 100 basis points decrease in interest rates in all currencies except the dollar and the pound sterling, to avoid negative rates. The constant position equivalent to that prevailing at the end of 2010 has also been assumed.
To illustrate the sensitivity of equity to variability in interest rates, a 100 basis points increase in interest rates in all currencies and in all curve periods where Telefónica has a financial position at December 31, 2010, and a 100 basis points decrease in all currencies and in all periods, have been assumed. In addition, only positions with cash flow hedges have been considered, given that they are the only positions where the change in fair value due to interest rate movements is recorded in equity.
In both cases, only transactions with external counterparties have been considered.
|
Millions of euros
Change in basis points (bp) (*)
|
Impact on consolidated income statement
|
Impact on consolidated equity
|
|
+100bp
|
(222)
|
575
|
|
-100bp
|
209
|
(626)
|
|
(*) Impact on results of 100 bp change in interest rates in all currencies, except the pound sterling and the dollar.
|
||
Share price risk
The Telefónica Group is exposed to changes in the value of equity investments that may be bought, sold or otherwise involved in transactions, from changes in the value of derivatives associated with such investments, from treasury shares and from equity derivatives.
According to the Telefónica, S.A. share option plan,
Performance Share Plan
(PSP) -(see Note 20)- the shares to be delivered to employees under such plan may be either the parent company treasury shares, acquired by them or any of its Group companies; or newly-issued shares. The possibility of delivering shares to employees in the future, in accordance with relative total shareholders’ return, implies a risk since there could be an obligation to hand over a maximum number of shares at the end of each phase, whose acquisition (in the event of acquisition in the market) in the future could imply a higher cash outflow than required on the start date of each phase if the share price is above the corresponding price on the phase start date. In the event that new shares are issued for delivery to the beneficiaries of the plan, there would be a dilutive effect for ordinary shareholders as a result of the higher number of shares delivered under such plan outstanding.
To reduce the risk to the company associated with variations in share price under this plan, Telefónica has acquired derivatives that replicate the risk profile of some of the shares deliverable under the plan as explained in Note 20.
During 2010, an incentive plan for Group employees to purchase Telefónica shares, approved at the Ordinary General Shareholders’ Meeting of 2009, was initiated. The cost of this plan will not exceed 50 million euros, as agreed in the aforementioned Ordinary General Shareholders’ Meeting (see Note 20 for further details).
In addition, the Group may use part of the 55,188,046 treasury shares of Telefónica, S.A. held at December 31, 2010 to cover shares deliverable under the PSP. The net asset value of the treasury shares could increase or decrease depending on variations in Telefónica, S.A.’s share price.
Liquidity risk
The Telefónica Group seeks to match the schedule for its debt maturity payments to its capacity to generate cash flows to meet these maturities, while allowing for some flexibility. In practice, this has been translated into two key principles:
|
1.
|
The Telefónica Group’s average maturity of net financial debt is intended to stay above 6 years, or be restored above that threshold in a reasonable period of time if it eventually falls below it. This principle is considered as a guideline when managing debt and access to credit markets, but not a rigid requirement. When calculating the average maturity for the net financial debt and part of the undrawn credit lines can be considered as offsetting the shorter debt maturities, and extension options on some financing facilities may be considered as exercised, for calculation purposes.
|
|
2.
|
The Telefónica Group must be able to pay all commitments over the next 12 months without accessing new borrowing or accessing the capital markets (although drawing upon firm credit lines arranged with banks), assuming budget projections are met.
|
As of December 31, 2010, the average maturity of its 55,593 million euros of net financial debt was 5.72 years.
At December 31, 2010, gross financial debt scheduled maturities in 2011 amounted to approximately 11,350 million euros (including the net position of derivative financial instruments, as well as the amount of deferred payment for the acquisition of Brasilcel, for a present value of 1,977 million euros (Note 2)), which is lower than the amount of funds available, calculated as the sum of: a) current financial assets and cash at December 31, 2010 (5,423 million euros excluding derivative financial instruments), b) annual cash generation projected for 2011; and c) undrawn credit lines arranged with banks whose original maturity is over one year (an aggregate of more than 7,142 million euros at December 31, 2010), providing flexibility to the Telefónica Group with regard to accessing capital or credit markets in the next 12 months. For a further description of the Telefónica Group’s liquidity and capital resources in 2010, see Note 13.2 Financial Liabilities and Appendix III.
Country risk
The Telefónica Group managed or mitigated country risk by pursuing two lines of action (in addition to its normal business practices):
|
1.
|
Partly matching assets to liabilities (those not guaranteed by the parent company) in the Telefónica Group’s Latin American companies such that any potential asset impairment would be accompanied by a reduction in liabilities; and,
|
|
2.
|
Repatriating funds generated in Latin America that are not required for the pursuit of new, profitable business development opportunities in the region.
|
Regarding the first point, at December 31, 2010, the Telefónica Group’s Latin American companies had net financial debt not guaranteed by the parent company of 6,834 million euros, which represents 13% of consolidated net financial debt.
Regarding the repatriation of funds to Spain, it has received 3,279 million euros from the Group’s Latin America companies in 2010, of which 1,282 million euros was from dividends, 722 million euros from intra-group loans (payments of interest and repayments of principal), 1,231 million euros from financial investments, and 44 million euros from capital reductions. These amounts were equally offset by additional amounts invested in its Latin American companies, mainly in Chile (869 million euros) and in Mexico (269 million euros). As a result of the foregoing, net funds repatriated to Spain from the Group’s Latin America companies amounted to the equivalent of 2,125 million euros in 2010.
In this regard, it is worth noting that since February 2003, Venezuela has had an exchange control mechanism in place, managed as indicated above by the Currency Administration Commission
(CADIVI). The body has issued a number of regulations (“providencias”) governing the modalities of currency sales in Venezuela at official exchange rates. Foreign companies which are duly registered as foreign investors are entitled to request approval to acquire currencies at the official exchange rate by the CADIVI, in line with regulation number 029, article 2, section c) "Remittance of earnings, profits, income, interest and dividends from international investment." Telcel, a Telefónica Group subsidiary in Venezuela, obtained the aforementioned requested approval on 295 million Venezuelan bolivars in 2006, 473 million Venezuelan bolivars in 2007 and 785 million Venezuelan bolivars in 2008. At December 31, 2010, payment of the dividends approved by the company in the amount of 1,152 million Venezuelan bolivars is pending approval.
Credit risk
The Telefónica Group trades in derivatives with creditworthy counterparties. Therefore, Telefónica, S.A. trades with credit entities whose “senior debt” ratings are of at least “A”. In Spain, where most of the Group’s derivatives portfolio is held, there are netting agreements with financial institutions, with debtor or creditor positions offset in case of bankruptcy, limiting the risk to the net position. For other subsidiaries, particularly those in Latin America, assuming a stable sovereign rating provides a ceiling which is below “A,” trades are with local financial entities whose rating by local standards is considered to be of high creditworthiness.
Meanwhile, with credit risk arising from cash and cash equivalents, the Telefónica Group places its cash surpluses in high quality and highly liquid money-market assets. These placements are regulated by a general framework, revised annually based on the conditions of the market and countries where the Group operates. The general framework sets: (i) the maximum amounts to be invested by counterparty based on its rating (long-term debt rating); (ii) the maximum tenor of the investment; and (iii) the instruments in which the surpluses may be invested. For Telefónica, S.A., the company which places the bulk of the Group’s surpluses, the maximum placement in 2010 was limited to 180 days and the creditworthiness of the counterparties used, measured by their debt ratings, remained above “A-” and/or “A3” by S&P and Moody’s, respectively.
The Telefónica Group considers managing commercial credit risk as crucial to meeting its business and customer base growth targets in a manner that is consistent with its risk-management policy.
Therefore, Telefónica’s commercial credit risk-management approach is based on continuous monitoring of the risk assumed and the resources necessary to manage the Group's various units, in order to optimize the risk-reward ratio in its operations. Particular attention is given to those clients that could cause a material impact on the Group's financial statements for which, depending on the segment and type of relation, hedging instruments or collateral may be required to mitigate exposure to credit risk.
All Group companies adopt policies, procedures, authorization guidelines, and homogeneous management practices, in consideration of the particularities of each market and best international practices, and incorporating this commercial credit risk management model into the Group's decision making processes, both from a strategic and day to day operating perspective.
The Telefónica Group’s maximum exposure to credit risk is initially represented by the carrying amounts of the assets (see Notes 11 and 13) and the guarantees given by the Telefónica Group.
Several Telefónica Group companies provide operating guarantees granted by external counterparties, which are offered during their normal commercial activity, in bids for licenses, permits and concessions, and spectrum acquisitions. At December 31, 2010, these guarantees amounted to approximately 2,062 million euros (see Note 21.d).
Furthermore, in relation to the public offering announced in order to acquire the ordinary shares in Vivo Participaçoes, S.A. that are not held by Brasilcel, described in Note 5, Telefónica has provided the guarantees normally required in this type of transaction, totaling an amount of 818 million euros at December 31, 2010.
Capital management
Telefónica’s corporate finance department, which is in charge of Telefónica’s capital management, takes into consideration several factors when determining Telefónica’s capital structure, with the aim of ensuring sustainability of the business and maximizing the value to shareholders.
Telefónica monitors its cost of capital with a goal of optimizing its capital structure. In order to do this, Telefónica monitors the financial markets and updates to standard industry approaches for calculating weighted average cost of capital, or WACC. Telefónica also uses a leverage ratio not exceeding the 2.5x operating income excluding the impact of the related depreciation limit in the medium term (excluding items of a non-recurring or exceptional nature), enabling to obtain and maintain the desired credit rating over the medium term, and with which the Telefónica Group can match the potential cash flow generation with the alternative uses that could arise at all times.
These general principles are refined by other considerations and the application of specific variables, such as country risk in the broadest sense, or the volatility in cash flow generation, when determining the Telefónica Group’s financial structure.
Derivatives policy
During 2010, the Group continued to use derivative financial instruments to limit interest and exchange rate risk on otherwise unhedged positions, and to adapt its debt structure to market conditions.
At December 31, 2010, the nominal value of outstanding derivatives with external counterparties amounted to 140,272 million euros equivalent, a 6.6% increase from December 31, 2009 (131,614 million euros equivalent). This figure is inflated by the use in some cases of several levels of derivatives applied to the nominal value of a single underlying liability. For example, a foreign currency loan can be hedged into floating rate, and then each interest rate period can be fixed using a fixed rate hedge, or FRA (forward rate agreement). Even using such techniques to reduce the position, it is still necessary to take extreme care in the use of derivatives to avoid potential problems arising through error or a failure to understand the real position and its associated risks.
The Telefónica Group’s derivatives policy emphasizes the following points:
|
1)
|
Derivatives based on a clearly identified underlying.
|
Acceptable underlyings include profits, revenues and cash flows in either a company’s functional currency or another currency. These flows can be contractual (debt and interest payments, settlement of foreign currency payables, etc.), reasonably certain or foreseeable (investment program, future debt issues, commercial paper programs, etc.). The acceptability of an underlying asset in the above cases does not depend on whether it complies with accounting rules requirements for hedge accounting, as is required in the case of certain intra-group transactions, for instance. Parent company investments in subsidiaries with functional currencies other than the euro also qualify as acceptable underlying assets.
Economic hedges, which are hedges with a designated underlying asset and which in certain circumstances offset fluctuations in the underlying asset value, do not always meet the requirements and effectiveness tests laid down by accounting standards for treatment as hedges. The decision to maintain positions that cease to qualify as effective or fail to meet other requirements will depend on the marginal impact on the income statement and how far this might compromise the goal of a stable income statement. In any event, the variations are recognized in the income statement.
|
2)
|
Matching of the underlying to one side of the derivative.
|
This matching basically applies to foreign currency debt and derivatives hedging foreign currency payments by Telefónica Group subsidiaries. The aim is to eliminate the risk arising from changes in foreign currency interest rates. Nonetheless, even when the aim is to achieve
perfect hedging for all cash flows, the lack of liquidity in certain markets, especially in Latin American currencies, has meant that historically there have been mismatches between the terms of the hedges and those of the debts they are meant to hedge. The Telefónica Group intends to reduce these mismatches, provided that doing so does not involve disproportionate costs. In this regard, if adjustment does prove too costly, the financial timing of the underlying asset in foreign currency will be modified in order to minimize interest rate risk in foreign currency.
In certain cases, the timing of the underlying as defined for derivative purposes may not be exactly the same as the timing of the contractual underlying.
|
3)
|
Matching the company contracting the derivative and the company that owns the underlying.
|
Generally, the aim is to ensure that the hedging derivative and the hedged asset or liability belong to the same company. Sometimes, however, the holding companies (Telefónica, S.A. and Telefónica Internacional, S.A.) have arranged hedges on behalf of a subsidiary that owns the underlying asset. The main reasons for separating the hedge and the underlying asset were possible differences in the legal validity of local and international hedges (as a result of unforeseen legal changes) and the different credit ratings of the counterparties (of the Telefónica Group companies as well as those of the banks).
|
4)
|
Ability to measure the derivative’s fair value using the valuation systems available to the Telefónica Group.
|
The Telefónica Group uses a number of tools to measure and manage risks in derivatives and debt. The main ones are Kondor+, licensed by Reuters, which is widely used by financial institutions, and MBRM specialist financial calculator libraries.
|
5)
|
Sale of options only when there is an underlying exposure.
|
The Telefónica Group considers the sale of options when: i) there is an underlying exposure (on the consolidated statement of financial position or associated with a highly probable cash outflow) that would offset the potential loss for the year if the counterparty exercised the option, or ii) the option is part of a structure in which another derivative offsets any loss. The sale of options is also permitted in option structures where, at the moment they are taken out, the net premium is either positive or zero.
For instance, it would be possible to sell short-term options on interest rate swaps that entitle the counterparty to receive a certain fixed interest rate, below the level prevailing at the time the option was sold. This would mean that if rates fell and the counterparty exercised its option, the Group would swap part of its debt from floating rate to a lower fixed rate, having received a premium.
|
6)
|
Hedge accounting
|
The main risks that may qualify for hedge accounting are as follows:
|
·
|
Variations in market interest rates (either money-market rates, credit spreads or both) that affect the value of the underlying asset or the measurement of the cash flows;
|
|
·
|
Variations in exchange rates that change the value of the underlying asset in the company’s functional currency and affect the measurement of the cash flow in the functional currency;
|
|
·
|
Variations in the volatility of any financial variable, asset or liability that affect either the valuation or the measurement of cash flows on debt or investments with embedded options, whether or not these options are separable; and
|
|
·
|
Variations in the valuation of any financial asset, particularly shares of companies included in the portfolio of “Available-for-sale financial assets”.
|
Regarding the underlying:
|
·
|
Hedges can cover all or part of the value of the underlying;
|
|
·
|
The risk to be hedged can be for the whole period of the transaction or for only part of the period; and
|
|
·
|
The underlying may be a highly probable future transaction, or a contractual underlying (loan, foreign currency payment, investment, financial asset, etc.) or a combination of both that defines an underlying with a longer term.
|
This may on occasion mean that the hedging instruments have longer terms than the related contractual underlying. This happens when the Group enters into long-term swaps, caps or collars to protect ourselves against interest rate rises that may raise the financial expense of its promissory notes, commercial paper and some floating rate loans which mature earlier than their hedges. These floating rate financing programs are highly likely to be renewed and Telefónica commits to this by defining the underlying asset in a more general way as a floating rate financing program whose term coincides with the maturity of the hedge.
Hedges can be of three types:
|
·
|
Fair value hedges.
|
|
·
|
Cash flow hedges. Such hedges can be set at any value of the risk to be hedged (interest rates, exchange rates, etc.) or for a defined range (interest rates between 2% and 4%, above 4%, etc.). In this last case, the hedging instrument used is options and only the intrinsic value of the option is recognized as an effective hedge. Changes in the time value of options are recognized in the income statement. To prevent excessive swings in the income statement from changes in time value, the hedging ratio (amount of options for hedging relative to the amount of options not treated as hedges) is assigned dynamically, as permitted by the standard.
|
|
·
|
Hedges of net investment in consolidated foreign subsidiaries. Generally such hedges are arranged by the parent company and the other Telefónica’s holding companies. Wherever possible, these hedges are implemented through real debt in foreign currency. Often, however, this is not always possible as many Latin American currencies are non-convertible, making it impossible for non-resident companies to issue local currency debt
.
It may also be that the debt market in the currency concerned is too thin to accommodate the required hedge (for example, the Czech crown and pounds sterling), or that an acquisition is made in cash with no need for market financing
.
In these circumstances derivatives, either forwards or cross-currency swaps are used to hedge the net investment
.
|
Hedges can comprise a combination of different derivatives.
Management of accounting hedges is not static, and the hedging relationship may change before maturity. Hedging relationships may change to allow appropriate management that serves the Group’s stated principles of stabilizing cash flows, stabilizing net financial income/expense and protecting share capital. The designation of hedges may therefore be cancelled, before maturity, because of a change in the underlying, a change in perceived risk on the underlying or a change in market view
.
Derivatives included in these hedges may be reassigned to new hedges where they meet the effectiveness test and the new hedge is well documented
.
To gauge the efficiency of transactions defined as accounting hedges, the Group analyzes the extent to which the changes in the fair value or in the cash flows attributable to the hedged item would offset the changes in fair value or cash flows attributable to the hedged risk using a linear regression model
.
The main guiding principles for risk management are laid down by Telefónica’s Finance Department and implemented by company chief financial officer (who is responsible for balancing the interests of each company and those of the Telefónica Group)
.
The Corporate Finance Department may allow exceptions to this policy where these can be justified, normally when the market is too thin for the volume of transactions required or on clearly
limited and small risks
.
New companies joining the Telefónica Group as a result of mergers or acquisitions may also need time to adapt
.
The breakdown of the financial results recognized in 2010, 2009 and 2008 is as follows:
|
(Millions of euros)
|
2010
|
2009
|
2008
|
|||||||||
|
Interest income
|
454 | 528 | 589 | |||||||||
|
Dividends received
|
40 | 45 | 67 | |||||||||
|
Other financial income
|
266 | 151 | 217 | |||||||||
|
Interest expenses
|
(2,514 | ) | (3,036 | ) | (3,333 | ) | ||||||
|
Ineffective portion of cash flow hedges
|
(16 | ) | (17 | ) | (71 | ) | ||||||
|
Accretion of provisions and other liabilities
|
(145 | ) | (254 | ) | (453 | ) | ||||||
|
Changes in fair value of financial assets at fair value through profit or loss
|
25 | 124 | 341 | |||||||||
|
Changes in fair value of financial liabilities at fair value through profit or loss
|
(39 | ) | (132 | ) | (115 | ) | ||||||
|
Transfer from equity to profit and loss from cash flow hedges
|
(73 | ) | 77 | (50 | ) | |||||||
|
Transfer from equity to profit and loss from available-for-sale assets
|
(202 | ) | 4 | 142 | ||||||||
|
(Gain)/loss on fair value hedges
|
168 | (427 | ) | 912 | ||||||||
|
Loss/(gain) on adjustment to items hedged by fair value hedges
|
(211 | ) | 439 | (883 | ) | |||||||
|
Other expenses
|
(290 | ) | (269 | ) | (184 | ) | ||||||
|
Net finance costs excluding foreign exchange differences
|
(2,537 | ) | (2,767 | ) | (2,821 | ) | ||||||
The breakdown of Telefónica’s derivatives at December 31, 2010, their fair value at year-end and the expected maturity schedule are as set forth in the table below:
|
Millions of euros
|
Fair value: at
12
/
31
/
10 (**)
|
Maturity (notional amount) (*)
|
||||||||||||||||||||||
|
Derivatives
|
2011
|
2012
|
2013
|
Subsequent
years
|
Total
|
|||||||||||||||||||
|
Interest rate hedges
|
(355 | ) | (5,850 | ) | 60 | (2,083 | ) | 7,202 | (671 | ) | ||||||||||||||
|
Cash flow hedges
|
266 | (3,504 | ) | 556 | (438 | ) | 8,487 | 5,101 | ||||||||||||||||
|
Fair value hedges
|
(621 | ) | (2,346 | ) | (496 | ) | (1,645 | ) | (1,285 | ) | (5,772 | ) | ||||||||||||
|
Exchange rate hedges
|
(405 | ) | 1,329 | 113 | 579 | 4,323 | 6,344 | |||||||||||||||||
|
Cash flow hedges
|
(404 | ) | 1,206 | 113 | 579 | 4,323 | 6,221 | |||||||||||||||||
|
Fair value hedges
|
(1 | ) | 123 | - | - | - | 123 | |||||||||||||||||
|
Interest and exchange rate hedges
|
(31 | ) | 253 | 272 | 1,162 | 2,595 | 4,282 | |||||||||||||||||
|
Cash flow hedges
|
(87 | ) | 191 | 246 | 1,148 | 2,252 | 3,837 | |||||||||||||||||
|
Fair value hedges
|
56 | 62 | 26 | 14 | 343 | 445 | ||||||||||||||||||
|
Hedge of net investment in foreign operations
|
(234 | ) | (2,221 | ) | (118 | ) | (160 | ) | (1,030 | ) | (3,529 | ) | ||||||||||||
|
Derivatives not designated as hedges
|
(411 | ) | 4,839 | 318 | (289 | ) | (428 | ) | 4,440 | |||||||||||||||
|
Interest rate
|
(245 | ) | 4,231 | 426 | (427 | ) | (1,316 | ) | 2,914 | |||||||||||||||
|
Exchange rate
|
(168 | ) | 528 | (107 | ) | 138 | 888 | 1,447 | ||||||||||||||||
|
Interest and exchange rate
|
2 | 80 | (1 | ) | - | - | 79 | |||||||||||||||||
|
(*) For hedges, the positive amount is in terms of fixed “payment.”
|
||||||||
|
For foreign currency hedges, a positive amount means payment in functional vs. foreign currency.
|
||||||||
|
(**) Positive amounts indicate payables.
|
||||||||
The breakdown of Telefónica’s derivatives at December 31, 2009, their fair value at year-end and the expected maturity schedule are as set forth in the table below:
|
Millions of euros
|
Fair value: at
12/31/09 (**)
|
Maturity (notional amount) (*)
|
||||||||||||||||||||||
|
Derivatives
|
2010
|
2011
|
2012
|
Subsequent
years
|
Total
|
|||||||||||||||||||
|
Interest rate hedges
|
(282 | ) | 3,044 | (103 | ) | 163 | (2,520 | ) | 584 | |||||||||||||||
|
Cash flow hedges
|
147 | 1,769 | 1,143 | 659 | 3,024 | 6,595 | ||||||||||||||||||
|
Fair value hedges
|
(429 | ) | 1,275 | (1,246 | ) | (496 | ) | (5,544 | ) | (6,011 | ) | |||||||||||||
|
Exchange rate
hedges
|
1,055 | 1,792 | 788 | 112 | 4,900 | 7,592 | ||||||||||||||||||
|
Cash flow hedges
|
1,055 | 1,797 | 788 | 112 | 4,900 | 7,597 | ||||||||||||||||||
|
Fair value hedges
|
- | (5 | ) | - | - | - | (5 | ) | ||||||||||||||||
|
Interest and exchange rate hedges
|
157 | 14 | (419 | ) | (314 | ) | (281 | ) | (1,000 | ) | ||||||||||||||
|
Cash flow hedges
|
152 | 51 | (426 | ) | (171 | ) | (360 | ) | (906 | ) | ||||||||||||||
|
Fair value hedges
|
5 | (37 | ) | 7 | (143 | ) | 79 | (94 | ) | |||||||||||||||
|
Hedge of net
investment
in foreign operations
|
(276 | ) | (2,555 | ) | (958 | ) | (113 | ) | (868 | ) | (4,494 | ) | ||||||||||||
|
Derivatives not designated as hedges
|
(612 | ) | 6,110 | 341 | 388 | (744 | ) | 6,095 | ||||||||||||||||
|
Interest rate
|
(299 | ) | 5,532 | 413 | 483 | (1,770 | ) | 4,658 | ||||||||||||||||
|
Exchange rate
|
(270 | ) | 738 | (9 | ) | (28 | ) | 1,026 | 1,727 | |||||||||||||||
|
Interest and exchange rate
|
(43 | ) | (160 | ) | (63 | ) | (67 | ) | - | (290 | ) | |||||||||||||
The Company also has debt assigned to the investment of 944 million US dollars, 2,643 million pounds sterling and 302 million Czech crowns (data in equivalent euros).
|
(*) For hedges, the positive amount is in terms of fixed “payment.”
|
|
For foreign currency hedges, a positive amount means payment in functional vs. foreign currency.
|
|
(**) Positive amounts indicate payables.
|
A list of derivative products entered into at December 31, 2010 and 2009 is provided in Appendix III.
|
(17)
|
INCOME TAX MATTERS
|
Consolidated tax group
Pursuant to a Ministerial Order dated December 27, 1989, since 1990 Telefónica, S.A. has filed consolidated tax returns for certain Group companies. The consolidated tax group comprised 46 companies in 2010 (40 in 2009).
Deferred taxes
The movements in deferred taxes in 2010 and 2009 are as follows:
|
Millions of euros
|
||||||||
|
Deferred tax assets
|
Deferred tax liabilities
|
|||||||
|
Balance at December 31, 2009
|
5,971 | 3,082 | ||||||
|
Additions
|
1,221 | 586 | ||||||
|
Disposals
|
(2,270 | ) | (421 | ) | ||||
|
Transfers
|
(16 | ) | 365 | |||||
|
Translation differences and hyperinflation adjustments
|
207 | 312 | ||||||
|
Company movements and others
|
580 | 2,150 | ||||||
|
Balance at December 31, 2010
|
5,693 | 6,074 | ||||||
|
Millions of euros
|
||||||||
|
Deferred tax assets
|
Deferred tax liabilities
|
|||||||
|
Balance at December 31, 2008
|
6,980 | 3,576 | ||||||
|
Additions
|
771 | 188 | ||||||
|
Disposals
|
(811 | ) | (955 | ) | ||||
|
Transfers
|
(864 | ) | (51 | ) | ||||
|
Net international movements
|
(106 | ) | 324 | |||||
|
Company movements and others
|
1 | - | ||||||
|
Balance at December 31, 2009
|
5,971 | 3,082 | ||||||
Expected realization of deferred tax assets and liabilities
In the majority of cases, realization of the Group’s deferred tax assets and liabilities depends on the future activities carried out by its different companies, tax regulations in the different countries in which these companies operate, and on strategic decisions affecting the companies. In this regard, the expected realization is based on a series of assumptions that may be altered as the corresponding situations continue to develop. Under the assumptions made, the estimated realization of deferred tax assets and liabilities recognized in the statement of financial position at December 31, 2010 is as follows:
|
12/31/2010
|
Total
|
Less than 1 year
|
More than 1 year
|
|||||||||
|
Deferred tax assets
|
5,693 | 1,837 | 3,856 | |||||||||
|
Deferred tax liabilities
|
6,074 | 382 | 5,692 | |||||||||
Tax credits for loss carryforwards
The available tax loss carryforwards in Spain at December 31, 2010 at the main Group companies amounted to 4,063 million euros (3,643 million euros for companies belonging to the Tax Group)
The consolidated statement of financial position at December 31, 2010 includes a 526 million euro deferred tax asset corresponding to 1,753 million euros of recognized tax loss carryforwards in Spain
The 2002 tax return included a negative adjustment of 2,137 million euros from Telefónica Móviles, S.A. (now Telefónica, S.A.) arising through the transfer of certain holdings of Group companies acquired in previous years, which was challenged by the Spanish tax authorities. The challenging of this adjustment in the tax audit has not affected the consolidated financial statements as in accordance with past rulings by the tax authorities, which differed from the interpretation put forward by the Company, the Company decided then not to recognize it.
In relation to the sale by Terra Networks, S.A. (now Telefónica, S.A.) of its stake in Lycos Inc. in 2004, the Company began procedures to recognize a higher tax loss of up to 7,418 million euros because of measuring as acquisition value for tax purposes, the market value of Lycos Inc. shares received, rather than their carrying amount, in conformity with Article 159 of the Spanish Corporation Law. No effect on the consolidated financial statements has been considered until the Company receives a definitive ruling on this procedure.
The O2 Germany group has tax credits and deductible temporary differences incurred in prior years amounting to 8,432 million euros, of which 427 million euros have been recognized as deferred tax assets in line with the prospects of generating future taxable earnings. These losses were generated by O2 Germany and the rest of the German subsidiaries of the Telefónica Group prior to the acquisition of the O2 Group. These tax credits do not expire.
Unused tax credits recognized in the consolidated statement of financial position at the Latin American subsidiaries at December 31, 2010 amounted to 685 million euros.
Deductions
The Group has recognized an amount of 73 million euros of unused tax credits, generated primarily from export activity, in the consolidated statement of financial position at December 31, 2010.
Temporary differences
Temporary differences are generated as a result of the difference between tax bases of the assets and liabilities and their respective carrying amounts. Deductible temporary differences, tax deductions and credits and tax loss carryforwards give rise to deferred tax assets on the consolidated statement of financial position, whereas taxable temporary differences in tax bases give rise to deferred tax liabilities on the consolidated statement of financial position. The sources of deferred tax assets and liabilities from temporary differences recognized at December 31, 2010 and 2009 are as follows:
|
Millions of euros
|
||||||||||||||||
|
2010
|
2009
|
|||||||||||||||
|
Deferred tax
|
Deferred tax
|
Deferred tax
|
Deferred tax
|
|||||||||||||
|
assets
|
liabilities
|
assets
|
liabilities
|
|||||||||||||
|
Property, plant and equipment
|
273 | 467 | 922 | 395 | ||||||||||||
|
Intangible assets
|
265 | 4,522 | 225 | 2,084 | ||||||||||||
|
Personnel commitments
|
956 | - | 1,088 | 3 | ||||||||||||
|
Provisions
|
1,172 | 81 | 769 | 30 | ||||||||||||
|
Investments in subsidiaries, associates and joint ventures
|
443 | 532 | 626 | 147 | ||||||||||||
|
Other
|
873 | 472 | 702 | 423 | ||||||||||||
|
Total
|
3,982 | 6,074 | 4,332 | 3,082 | ||||||||||||
The net movements of assets and liabilities resulting from temporary differences recognized directly in equity in 2010 and 2009 amounts to 63 million euros and 212 million euros, respectively, as shown in the consolidated statement of comprehensive income.
Tax payables and receivables
Current tax payables and receivables at December 31, 2010 and 2009 are as follows:
|
Millions of euros
|
||||||||
|
Balance at
|
Balance at
|
|||||||
|
12
/
31
/
10
|
12
/
31
/
09
|
|||||||
|
Taxes payable:
|
||||||||
|
Tax withholdings
|
124 | 118 | ||||||
|
Indirect taxes
|
1,164 | 897 | ||||||
|
Social security
|
228 | 178 | ||||||
|
Current income taxes payable
|
695 | 872 | ||||||
|
Other
|
611 | 701 | ||||||
|
Total
|
2,822 | 2,766 | ||||||
|
Millions of euros
|
||||||||
|
Balance at
|
Balance at
|
|||||||
|
12
/
31
/
10
|
12
/
31
/
09
|
|||||||
|
Tax receivables:
|
||||||||
|
Indirect tax
|
775 | 662 | ||||||
|
Current income taxes receivable
|
338 | 377 | ||||||
|
Other
|
218 | 207 | ||||||
|
Total
|
1,331 | 1,246 | ||||||
Reconciliation of book profit before taxes to taxable income
The reconciliation between accounting profit and the income tax expense for 2010, 2009 and 2008 is as follows:
|
Millions of euros
|
||||||||||||
|
2010
|
2009
|
2008
|
||||||||||
|
Accounting profit before tax
|
13,901 | 10,387 | 10,915 | |||||||||
|
Tax expense at prevailing statutory rate (30%)
|
4,170 | 3,116 | 3,275 | |||||||||
|
Effect of statutory rate in other countries
|
(52 | ) | (20 | ) | (99 | ) | ||||||
|
Variation in tax expense from new taxes
|
10 | (15 | ) | 12 | ||||||||
|
Permanent differences
|
(69 | ) | (402 | ) | 243 | |||||||
|
Changes in deferred tax charge due to changes in tax rate
|
(21 | ) | - | - | ||||||||
|
Capitalization of tax deduction and tax relief
|
(112 | ) | (143 | ) | (175 | ) | ||||||
|
Use of loss carryforwards
|
(134 | ) | (5 | ) | (106 | ) | ||||||
|
Increase / (Decrease) in tax expense arising from temporary differences
|
(42 | ) | (82 | ) | (2 | ) | ||||||
|
Other
|
79 | 1 | (59 | ) | ||||||||
|
Income tax expense
|
3,829 | 2,450 | 3,089 | |||||||||
|
Breakdown of current/deferred tax expense
|
||||||||||||
|
Current tax expense
|
2,455 | 3,848 | 3,371 | |||||||||
|
Deferred tax benefit
|
1,374 | (1,398 | ) | (282 | ) | |||||||
|
Total income tax expense
|
3,829 | 2,450 | 3,089 | |||||||||
The permanent differences
arise mainly
from events that produce taxable income not recognized in the consolidated income statement, as well as impacts recognized in profit before tax that do not generate taxable profit.
Noteworthy in this respect is the portion of the capital gain obtained from the remeasurement of the previously held investment in Brasilcel (see Note 2), as it relates to temporary differences on investments in subsidiaries (
see Note 3.n).
In addition, permanent differences for 2010 include
the recognition of tax credits in Mexico and Terra Brasil, in the amounts of 75 million euros and 63 million euros, respectively, based on the estimates of taxable income of each of the companies according to the updated business plan.
In addition, a review of recognized tax assets was carried out at the end of the reporting period. As a result, it was determined that the 864 million euros of tax assets recognized at Colombia Telecomunicaciones, S.A. should be derecognized since the company’s revised business plans do not ensure that there will be sufficient taxable profit to allow the deferred tax asset to be utilized.
As described in Note 2, in December 2009, the European Commission released its decision regarding the investigation involving the Kingdom of Spain on the potential consideration of the deduction for tax amortization of the financial goodwill arising on certain foreign shareholding acquisitions as government aid under the provisions of article 12.5 of the revised Spanish Income Tax Law (“TRLIS”), deeming the deduction to be state aid. This decision does not affect investments made before December 21, 2007. As a result of this decision, income tax in the Telefónica Group’s consolidated income statement for the year ended December 31, 2009 was 591 million euros lower due to the reversal of this liability, included in “Permanent differences” for 2009 in the preceding table.
On September 25, 2002, tax inspections commenced at several companies included in tax group 24/90, of which Telefónica is the parent company for the years from 1998 to 2000.
The tax assessments related to this review, which included settlement agreements and imposed fines on Telefónica, were signed by the company in disagreement in October 2004 and July 2005. The total amount of these assessments was 140 million euros.
In April 2007, Telefónica filed an administrative appeal before the National Court of Justice. The company also requested that the execution of the settlements and penalties appealed be suspended by providing the appropriate guarantees.
On February 22, 2010, Telefónica received the notification of the ruling by the National Court of Justice dated February 4, 2010, in which it partially accepted the Company’s allegations.
On May 18, 2010, the National Court of Justice accepted Telefónica, S.A.'s appeal and ruled on April 5, 2010 to refer the case to the Supreme Court. On June 4, 2010, the tax authorities filed an appeal before the Supreme Court against one of the rulings of the National Court of Justice partially accepting Telefónica’s allegations. In January 2011, Telefónica submitted a brief of opposition against that appeal.
In addition, a new tax inspection commenced in June 2006 and concluded in July 2008.
With respect to the tax group's income tax and in addition to the above with respect to tax amounts considered by Telefónica Móviles, S.A.U. in 2002 (in an amount of 2,137 million euros), the inspection proposed additional adjustments to the tax amounts of approximately 346 million euros. Telefónica the filed an administrative appeal before the Central Administrative Economic Court, which on September 10, 2009 ruled against the interests of the Company.
On November 16, 2009, Telefónica filed an administrative appeal before the National Court of Justice against the resolution of September 10, 2009. Telefónica, S.A. filed the claim in April 2010.
In June 2010, new inspections of various companies in the 24/90 tax group, of which Telefónica, S.A. is the parent, were initiated. The taxes subject to review were corporate income tax for the years 2005 to 2007, VAT, tax withholdings and payments on account in respect of personal income tax, tax on investment income, property tax and nonresident income tax for the years 2006 to 2007.
Meanwhile, after the related inspections, tax assessments were raised by the State Treasury of Sao Paulo against Telecomunicações de São Paulo, S.A. -Telesp (“Telesp
”)
in relation to the Merchandise Circulation Tax (ICMS) -similar to the VAT levied on telecommunications services- for different periods between 2001 and 2007. The aggregate amount of the assessments, updated to take into account interest, fines and other items, is approximately 587 million euros.
Currently, the majority of the appeals filed are in the contentious or judicial stage.
On February 11, 2011, Telefónica del Perú, S.A.A. was notified of the decision of the tax court concluding the administrative instance in the matter regarding income tax for 2000 and 2001 and the respective payments on account, noted by the tax authorities in 2005. The company decided to appeal the decisions at the judicial level, petitioning the courts to overturn the decision, considering that it based on insufficient legal grounds.
The years open for review by the tax inspection authorities for the main applicable taxes vary from one consolidated company to another, based on each country’s tax legislation, taking into account their respective statute-of-limitations periods.
In Spain, as a result of the tax audit
completed in 2008, the main companies of the
tax group
are open to inspection for all years from 2005.
In the other countries in which the Telefónica Group has a significant presence, the years open for inspection by the relevant authorities are generally as follows:
|
·
|
The last seven years in Argentina
|
|
·
|
The last five years in Brazil, Mexico, Móviles Colombia and the Netherlands.
|
|
·
|
The last four years in Venezuela, Nicaragua and Peru.
|
|
·
|
The last three years in Chile, Ecuador, El Salvador, the United States and Panama.
|
|
·
|
The last two years in Uruguay.
|
|
·
|
In Europe, the main companies within the O2 Group have open to inspection the last two years in the United Kingdom, the last seven years in Germany, and the last three years in the Czech Republic.
|
The tax audit of the open years is not expected to give rise to additional material liabilities for the Group.
|
(18)
|
DISCONTINUED OPERATIONS
|
None of the Group’s principal operations were discontinued in 2010, 2009 or 2008.
|
(19)
|
REVENUE
AND EXPENSES
|
Revenue from operations:
The breakdown of “Revenue from operations” is as follows:
|
Millions of euros
|
2010
|
2009
|
2008
|
|||||||||
|
Rendering of services
|
56,434 | 52,498 | 53,751 | |||||||||
|
Net sales
|
4,303 | 4,233 | 4,195 | |||||||||
|
Total
|
60,737 | 56,731 | 57,946 | |||||||||
Other income
The breakdown of “Other income” is as follows:
|
Millions of euros
|
||||||||||||
|
2010
|
2009
|
2008
|
||||||||||
|
Ancillary income
|
882 | 584 | 702 | |||||||||
|
Own work capitalized
|
737 | 720 | 736 | |||||||||
|
Government grants
|
66 | 54 | 59 | |||||||||
|
Gain on disposal of assets
|
4,184 | 287 | 368 | |||||||||
|
Total
|
5,869 | 1,645 | 1,865 | |||||||||
The gain on disposal of assets in 2010 includes the capital gain recognized in accordance with IFRS 3 resulting from the remeasurement of the previously held interest in Brasilcel, as described in Note 5, in the amount of 3,797 million euros. It also includes gains on the sale of certain non-
strategic Group assets and the sale of Manx, for 260 million euros and 61 million euros, respectively.
The gain on disposal of assets for 2009 primarily included gains of 220 million euros on the sale of Medi Telecom, S.A., while the 2008 amount mainly related to the 143 million euros in income generated on the divestment of Sogecable, S.A.
Also included are gains on the disposal of properties in line with the Telefónica Group’s real estate efficiency plan via the selective sale of properties in Spain and the Czech Republic, which amounted to 3, 47 and 104 million euros in 2010, 2009 and 2008, respectively.
Other expenses
The breakdown of “Other expenses” in 2010, 2009 and 2008 is as follows:
|
Millions of euros
|
2010
|
2009
|
2008
|
|||||||||
|
Leases
|
1,083 | 1,068 | 914 | |||||||||
|
Advertising
|
1,419 | 1,123 | 1,626 | |||||||||
|
Other external services
|
9,726 | 7,729 | 7,539 | |||||||||
|
Taxes other than income tax
|
1,279 | 1,203 | 1,147 | |||||||||
|
Other operating expenses
|
453 | 203 | 250 | |||||||||
|
Change in trade provisions
|
853 | 874 | 748 | |||||||||
|
Losses on disposal of fixed assets and changes in provisions for fixed assets
|
1 | 81 | 88 | |||||||||
|
Total
|
14,814 | 12,281 | 12,312 | |||||||||
In 2010, the Group approved firm commitments in connection with the Telefónica Foundation’s social welfare projects, to provide it with adequate financing to enable it to carry out its forecast short and medium-term plans, in the amount of 400 million euros.
Estimated schedule
The estimated payment schedule for the next few years on operating leases, purchase and contractual commitments is as follows:
|
12/31/10
(Millions of euros)
|
Total
|
Less than 1 year
|
1 to 3 years
|
3 to 5 years
|
Over 5 years
|
|||||||||||||||
|
Operating leases
|
8,842 | 1,327 | 2,281 | 1,734 | 3,500 | |||||||||||||||
|
Purchase and contractual commitments
|
4,413 | 1,752 | 995 | 582 | 1,084 | |||||||||||||||
The main finance lease transactions are described in Note 22.
Headcount and employee benefits
a) Number of employees
The table below presents the breakdown of the Telefónica Group’s average number of employees in 2010, 2009 and 2008, together with total headcount at December 31 each year. The employees shown for each subgroup include the Telefónica Group companies with similar activities in accordance with segment reporting.
|
2010
|
2009
|
2008
|
||||||||||||||||||||||
|
Average
|
Year-end
|
Average
|
Year-end
|
Average
|
Year-end
|
|||||||||||||||||||
|
Telefónica Spain
|
35,313 | 35,379 | 35,318 | 35,338 | 35,708 | 35,562 | ||||||||||||||||||
|
Telefónica Latin America
|
55,164 | 60,909 | 50,709 | 51,606 | 49,990 | 49,849 | ||||||||||||||||||
|
Telefónica Europe
|
26,517 | 25,968 | 28,249 | 27,023 | 28,828 | 28,888 | ||||||||||||||||||
|
Subsidiaries and other companies
|
152,053 | 162,850 | 140,875 | 143,459 | 137,249 | 142,736 | ||||||||||||||||||
|
Total
|
269,047 | 285,106 | 255,151 | 257,426 | 251,775 | 257,035 | ||||||||||||||||||
The number of employees shown in the table above corresponds to the consolidated companies. It is worth highlighting the large number of employees at the various companies of the Atento Group performing contact center activities, whose average and year-end headcount for 2010 were 141,036 and 151,896, respectively.
Of the final headcount at December 31, 2010, approximately 51.5% are women (51.8% and 50.8% at December 31, 2009 and December 31, 2008, respectively).
In 2010, the Group reduced its workforce as part of the integration of its businesses, entailing provisions of 670 million euros in the different companies comprising the Group, including the provision made in Germany for the integration of T. O2 Germany and HanseNet in an amount of 202 million euros.
b) Employee benefits
The Telefónica Group has arranged a defined-contribution pension plan for its employees in Spain. Under this plan, the company makes contributions of 4.51% of the regular base salary (6.87% for employees of Telefónica de España, S.A.U. whose hiring date was prior to June 30, 1992). This is in addition to a 2.21% compulsory contribution by each participant. This plan is entirely externalized in outside funds.
At December 31, 2010, a total of 51,572 Group employees were covered by the pension plans managed by the subsidiary Fonditel Entidad Gestora de Fondos de Pensiones, S.A. (52,912 and 54,819 at December 31, 2009 and 2008, respectively). The contributions made by the various companies in 2010 amounted to 99 million euros (97 million euros and 98 million euros in 2009 and 2008, respectively).
Furthermore, in 2006, the Group approved a Pension Plan for Senior Executives, wholly funded by the company, which complements the previous plan. This plan envisages annual defined contributions equivalent to specific percentages of the executives’ fixed remuneration, in accordance with their professional category, and extraordinary contributions in accordance with the circumstances of each executive, payable in line with the conditions of said Plan. No provision was made for this plan as it has been fully externalized.
Depreciation and amortization
The breakdown of “Depreciation and amortization” on the consolidated income statement is as follows:
|
Millions of euros
|
2010
|
2009
|
2008
|
|||||||||
|
Depreciation of property, plant and equipment
|
6,159 | 6,095 | 6,303 | |||||||||
|
Amortization of intangible assets
|
3,144 | 2,861 | 2,743 | |||||||||
|
Total
|
9,303 | 8,956 | 9,046 | |||||||||
Earnings per share
Basic earnings per share amounts are calculated by dividing net profit for the year attributable to ordinary equity holders of the parent by the weighted average number of ordinary shares outstanding during the year.
Diluted earnings per share amounts are calculated by dividing net profit for the year attributable to ordinary equity holders of the parent (adjusted for any dilutive effects inherent in converting potential ordinary shares issued) by the weighted average number of ordinary shares outstanding during the year plus the weighted average number of ordinary shares that would be issued on the conversion of all the dilutive potential ordinary shares into ordinary shares.
Both basic and diluted earnings per share attributable to equity holders of the parent are calculated based on the following data:
|
Millions of euros
|
||||||||||||
|
2010
|
2009
|
2008
|
||||||||||
|
Profit attributable to ordinary equity holders of the parent from continuing operations
|
10,167 | 7,776 | 7,592 | |||||||||
|
Profit attributable to ordinary equity holders of the parent from discontinued operations
|
- | - | - | |||||||||
|
Total profit attributable to equity holders of the parent for basic earnings
|
10,167 | 7,776 | 7,592 | |||||||||
|
Adjustment for dilutive effects of the conversion of potential ordinary shares
|
- | - | - | |||||||||
|
Total profit attributable to equity holders of the parent for diluted earnings
|
10,167 | 7,776 | 7,592 | |||||||||
|
Thousands
|
||||||||||||
|
Number of shares
|
2010
|
2009
|
2008
|
|||||||||
|
Weighted average number of ordinary shares (excluding treasury shares) for basic earnings per share
|
4,522,228 | 4,552,656 | 4,645,852 | |||||||||
|
Telefónica, S.A. “Performance Share Plan” share option plan
|
6,017 | 7,908 | 5,182 | |||||||||
|
Weighted average number of ordinary shares (excluding treasury shares) outstanding for diluted earnings per share
|
4,528,245 | 4,560,564 | 4,651,034 | |||||||||
The denominators used in the calculation of both basic and diluted earnings per share have been adjusted to reflect any transactions that changed the number of shares outstanding without a corresponding change in equity as if they had taken place at the start of the first period under consideration.
There have been no transactions involving existing or potential ordinary shares between the end of the year and the date of preparation of the consolidated financial statements.
Basic and diluted earnings per share attributable to equity holders of the parent broken down by continuing and discontinued operations are as follows:
|
Continuing operations
|
Discontinued operations
|
Total
|
||||||||||||||||||||||||||||||||||
|
Figures in euros
|
2010
|
2009
|
2008
|
2010
|
2009
|
2008
|
2010
|
2009
|
2008
|
|||||||||||||||||||||||||||
|
Basic earnings per share
|
2.25 | 1.71 | 1.63 | - | - | - | 2.25 | 1.71 | 1.63 | |||||||||||||||||||||||||||
|
Diluted earnings per share
|
2.25 | 1.71 | 1.63 | - | - | - | 2.25 | 1.71 | 1.63 | |||||||||||||||||||||||||||
|
(20)
|
SHARE-BASED PAYMENT PLANS
|
At year-end 2010, 2009 and 2008, the Telefónica Group had the following shared-based payment plans linked to the share price of Telefónica, S.A. The main plans in force at the end of 2010 are as follows:
|
a)
|
Telefónica, S.A. share plan: “Performance Share Plan”
|
At the General Shareholders’ Meeting of Telefónica, S.A. on June 21, 2006, its shareholders approved the introduction of a long-term incentive plan for managers and senior executives of Telefónica, S.A. and other Telefónica Group companies. Under this plan, selected participants who met the qualifying requirements were given a certain number of Telefónica, S.A. shares as a form of variable compensation.
The plan was initially intended to last seven years. It is divided into five phases, each three years long, beginning on July 1 (the “Start Date”) and ending on June 30 three years later (the “End Date”). At the start of each phase the number of shares to be awarded to Plan beneficiaries is determined based on their success in meeting targets set. The shares are delivered, assuming targets are met, at the End Date of each phase. Each phase is independent from the others. The first started on July 1, 2006 (with shares delivered on July 1, 2009) and the fifth phase begins on July 1, 2010 (with any shares to be delivered from July 1, 2013).
Award of the shares is subject to a number of conditions:
|
-
|
The
beneficiary must continue to work for the company throughout the three years of the phase, subject to certain special conditions related to departures.
|
|
-
|
The actual number of shares awarded at the end of each phase will depend on success in meeting targets and the maximum number of shares assigned to each executive. Success is measured by comparing the Total Shareholder Return (“TSR”), which includes both share price and dividends offered by Telefónica shares, with the TSRs offered by a basket of listed telecoms companies that comprise the comparison group. Each employee who is a member of the plan is assigned at the start of each phase a maximum number of shares. The actual number of shares awarded at the end of the phase is calculated by multiplying this maximum number by a percentage reflecting their success at the date in question. This will be 100% if the TSR of Telefónica is equal to or better than that of the third quartile of the Comparison Group and 30% if Telefónica's TSR is in line with the average. The percentage rises linearly for all points between these two benchmarks. If the TSR is below average no shares are awarded.
|
June 30, 2009 marked the end of the first phase of this plan, which entailed the following maximum number of shares allocated:
|
No. of shares
|
Unit value
|
End date
|
|||||||
|
1
st
phase July 1, 2006
|
6,530,615 | 6.43 |
June 30, 2009
|
||||||
With the maturity of the plan, in July 2009 a total of 3,309,968 shares (corresponding to a total of 4,533,393 gross shares less a withholding of 1,224,610 shares prior to delivery at the option of the
employee) were delivered to Telefónica Group directors included in the first phase. The shares delivered were deduced from the Company’s treasury shares in 2009.
All the shares included in the first phase of the plan were hedged with a derivative instrument acquired in 2006. The cost of this instrument was 46 million euros, which in unit terms is 6.43 euros per share. At June 30, 2009, the bank with which the financial instrument was entered into delivered the contracted shares to Telefónica, S.A. These were accounted for as treasury shares.
The second phase of the plan matured on June 30, 2010, with the maximum number of shares allocated as follows:
|
No. of shares
|
Unit value
|
End date
|
|||||||
|
2
nd
phase July 1, 2007
|
5,556,234 | 7.70 |
June 30, 2010
|
||||||
With the maturity of the second phase of the plan, in July 2010 a total of 2,964,437 shares (corresponding to a total of 4,091,071 gross shares less a withholding of 1,132,804 shares prior to delivery, at the option of the employee) were delivered to Telefónica Group directors included in the second phase. The shares delivered were deduced from the Company’s treasury shares in 2010.
The maximum number of the shares issuable in each of the three outstanding phases at December 31, 2010 is as follows:
|
Phase
|
No. of shares
|
Unit value
|
End date
|
||||||
|
3rd phase July 1, 2008
|
5,286,980 | 8.39 |
June 30, 2011
|
||||||
|
4th phase July 1, 2009
|
6,356,597 | 8.41 |
June 30, 2012
|
||||||
|
5th phase July 1, 2010
|
5,025,657 | 9.08 |
June 30, 2013
|
||||||
This plan is equity-settled via the delivery of shares to the participants. Accordingly, a balancing entry for the 42, 43 and 38 million euros of employee benefits expenses recorded in 2010, 2009 and 2008, respectively, was made in equity.
For the sole purpose of ensuring the shares necessary at the end of the phase begun in 2008 (the third phase of the plan), Telefónica, S.A. purchased an instrument from a financial institution that will deliver to Telefónica, at the end of the phase, a total of 2,500,000 shares, part of the shares necessary to settle the phase. This instrument is indexed to the success of the plan; i.e. the instrument has the features as the plan. The cost of the financial instrument was 25 million euros, equivalent to 9.96 euros per option (see Note 16).
For the fourth phase of the Plan, Telefónica, S.A. acquired an instrument from a financial institution with the same features of the plan, whereby at the end of the phase, Telefónica will obtain part of the shares necessary to settle the phase (4,000,000 shares). The cost of the financial instrument was 34 million euros, equivalent to 8.41 euros per option (see Note 16).
|
b)
|
Telefónica, S.A. share option plan targeted at Telefónica Europe: “Performance Cash Plan”
|
In addition to the Performance Share Plan, another plan called the Performance Cash Plan, operating under the same conditions as the Performance Share Plan is targeted at Telefónica Europe. This plan entails delivery to this segment’s executives of a specific number of theoretical options in Telefónica, S.A. which, in the event, would be cash-settled at the end of
each phase via a payment equivalent to the market value of the shares on settlement date up to a maximum of three times the notional value of the shares at the delivery date.
The value of theoretical options is established as the average share price in the 30 days immediately prior to the start of each phase, except for the first phase, where the average share price during the 30 days immediately prior to May 11, 2006 (12.83 euros) was taken as the reference.
The estimated duration of this plan is also 7 years, with 5 phases, each of 3 years, commencing on July 1 of each year, starting in 2006.
Like the Telefónica, S.A. Performance Share Plan, the performance rate for setting payments is measured based on the TSR on Telefónica shares with respect to the comparison group’s TSRs, in line with the following criteria:
|
·
|
Below average: 0%
|
|
·
|
Average: 30%
|
|
·
|
Equal to or higher than the third quartile: 100%
|
The number of options assigned at December 31, 2010 was 364,601 (412,869 at December 31, 2009).
The fair value at December 31, 2010 of the options delivered in each phase in force at that time was 16.97 euros per option.
This value is calculated by taking the Telefónica share price and including the estimated TSR and is updated at each year end.
|
c)
|
Telefónica, S.A. global share plan: “Global Employee Share Plan”
|
At the June 23, 2009 General Shareholders’ Meeting of Telefónica, S.A. , the shareholders approved the introduction of a Telefónica, S.A. share incentive plan for all employees of the Telefónica Group worldwide, with certain exceptions. Under this plan, participants that meet the qualifying requirements are offered the possibility of acquiring Telefónica, S.A. shares, with this company assuming the obligation of giving participants a certain number of Telefónica, S.A. shares free of charge.
The initial duration of the plan is intended to be two years. Employees subscribed to the plan can acquire Telefónica, S.A. shares through monthly installments of up to 100 euros (or the local currency equivalent), up to a maximum of 1,200 euros over a twelve-month period of (acquisition period).
The delivery of shares will occur, where applicable, when the plan is consolidated, as of September 1, 2012, subject to a number of conditions:
|
-
|
The beneficiary must continue to work for the company throughout the two-year duration of the plan (consolidation period), subject to certain special conditions related to departures.
|
|
-
|
The actual number of shares to be delivered at the end of the consolidation period will depend on the number of shares acquired and retained by each employee. Each employee who is a member of the plan, has remained a Group employee, and has retained the shares acquired for an additional twelve-month period after the acquisition date, will be entitled to receive one free share per share acquired and retained at the end of the consolidation period.
|
The acquisition period began in August 2010, and at December 31, 2010, 41,152 employees had adhered to the plan. This plan will be settled via the delivery of shares to employees; accordingly, the offsetting entry to the related personnel expenses of 11 million euros recognized in 2010 was recorded in equity.
|
(21)
|
OTHER INFORMATION
|
|
a)
|
Litigation and arbitration
|
Telefónica and its group companies are party to several lawsuits or proceedings that are currently in progress in the law courts and administrative and arbitration bodies of the various countries in which the Telefónica Group is present.
Considering the reports of the Company’s legal advisors regarding these proceedings, it is reasonable to assume that this litigation or cases will not materially affect the financial position or solvency of Telefónica Group, regardless of the outcome.
Among unresolved cases or those underway in 2010 (see Note 17 for details of tax-related cases), the following are of special note:
|
1.
|
Contentious proceedings in connection with the merger between Terra Networks, S.A. and Telefónica
|
On September 26, 2006, Telefónica was notified of the claim filed by former shareholders of Terra Networks, S.A. (Campoaguas, S.L., Panabeni, S.L. and others) alleging breach of contract in respect of the terms and conditions set forth in the Prospectus of the Initial Public Offering of shares of Terra Networks, S.A. dated October 29, 1999. This claim was rejected via a ruling issued on September 21, 2009, and the appellants were charged for the court costs.
This ruling was appealed on December 4, 2009.
On June 16, 2010, Telefónica was notified of the written appeal filed by the appellants.
Telefónica rejected this appeal, which the Court accepted as filed on January 5, 2011.
|
2.
|
Appeal for judicial review of the Spanish Competition Court (TDC) ruling of April 1, 2004
|
On April 1, 2004, the TDC ruled that Telefónica de España had engaged in unfair trade practices prohibited under Article 6 of Antitrust Law 16/1989, dated July 17, and Article 82 of the EC Treaty, consisting in the abuse of a dominant market position, by conditioning the provision of certain services to the non-existence of predialing arrangements with rival operators and running disloyal advertising campaigns. It imposed a fine of 57 million euros.
Telefónica de España filed an appeal for judicial review of this decision. On January 31, 2007, the National Appellate Court ruled in favor of the appeal, thereby overturning the TDC’s ruling. The State attorney filed an appeal to overturn the Supreme Court ruling on January 15, 2008, which Telefónica contested in July of 2008.
On April 20, 2010, the Supreme Court issued a ruling upholding the decision of the National Appellate Court overturning the TDC’s ruling, depriving of effect the 57 million euro fine imposed on Telefónica de España and ending the review.
|
3.
|
Cancellation of the UMTS license granted to Quam GMBH in Germany
|
In December 2004, the German Telecommunications Market Regulator revoked the UMTS license granted in 2000 to Quam GmbH, in which Telefónica has a stake. After obtaining a
suspension of the revocation order, on January 16, 2006, Quam GmbH filed a suit against the order with the German courts. This claim sought two objectives: 1) to overturn the revocation order issued by the German Telecommunications Market Regulator, and 2) if this failed, to be reimbursed for the total or partial payment of the original amount paid for the license; i.e. 8,400 million euros.
This claim was rejected by the Cologne Administrative Court. Quam GmbH appealed the decision before the Supreme Administrative Court of North Rhine-Westphalia, which also rejected its appeal.
Lastly, Quam GmbH filed a new appeal, at third instance, before the Federal Supreme Court for Administrative Cases
. This appeal was accepted in June 2010. In September 2010, the Court received the legal grounds for the appeal.
A decision is currently pending in the matter.
|
4.
|
Appeal against the European Commission ruling of July 4, 2007 against Telefónica de España’s broadband pricing policy
|
On July 9, 2007, Telefónica was notified of the decision issued by the European Commission (“EC”) imposing a fine of approximately 152 million euros for breach of the former article 82 of EC Treaty rules by charging unfair prices between whole and retail broadband access services. The ruling charged Telefónica with applying a margin squeeze between the prices it charged competitors to provide regional and national wholesale broadband services and its retail broadband prices using ADSL technology between September 2001 and December 2006.
On September 10, 2007, Telefónica and Telefónica de España filed an appeal to overturn the decision before the General Court of the European Union. The Kingdom of Spain, as an interested party, also lodged an appeal to overturn the decision. Meanwhile, France Telecom and the Spanish Association of Bank Services Users (AUSBANC) filed requests to intervene, which the General Court admitted. On November 4, 2010, the European Competitive Telecommunications Association filed a request to intervene in support of the conclusions of the EC.
|
5.
|
Claim against the decision by Agencia Nacional de Telecomunicações (ANATEL) regarding the inclusion of interconnection and network usage revenues in the Fundo de Universalização de Serviços de Telecomunicações (FUST)
|
Vivo Group operators, together with other wireless operators, appealed ANATEL’s decision of December 16, 2005, to include interconnection and network usage revenues and expenses in the calculation of the amounts payable into the Fund for Universal Access to Telecommunications Services (
Fundo de Universalização de Serviços de Telecomunicações
or FUST for its initials in Portuguese) –a fund to pay for the obligations to provide universal service- with retroactive application from 2000. On March 13, 2006, the Brasilia Federal Regional Court granted the injunction requested by the appellants, preventing ANATEL’s decision from being applied.
On March 6, 2007, a ruling in favor of the wireless operators was issued, stating that it was not appropriate to include the revenues received from other operators in the taxable income for the FUST’s calculation and rejecting the retroactive application of ANATEL’s decision. ANATEL filed an appeal to overturn this decision with Brasilia Regional Federal Court no. 1. This appeal is pending resolution.
At the same time, Telesp and Telefónica Empresas, S.A., together with other wireline operators through ABRAFIX (
Associação Brasileira de Concessionárias de Serviço Telefonico Fixo Comutado
) appealed ANATEL’s decision of December 16, 2005, also obtaining injunctions. On June 21, 2007, Federal Regional Court no. 1 ruled that it was not appropriate to include the interconnection and network usage revenues and expense in the FUST’s taxable income and
rejected the retroactive application of ANATEL’s decision. ANATEL filed an appeal to overturn this ruling on April 29, 2008 before Brasilia Federal Regional Court no. 1.
|
6.
|
Public civil procedure by the Sao Paulo government against Telesp for alleged reiterated malfunctioning in the services provided by Telesp and compensation for damages to the customers affected
|
This proceeding was filed by the Public Ministry of the State of Sao Paulo for alleged reiterated malfunctioning in the services provided by Telesp, seeking compensation for damages to the customers affected
.
A general claim is filed by the Public Ministry of the State of Sao Paulo, for 1,000 million Brazilian reais (approximately 449 million euros at the December 31, 2010 exchange rate), calculated on the company’s revenue base over the last five years.
In April 2010, a ruling in first instance convicting the Telefónica Group was issued. On May 5, 2010, Telesp filed an appeal before the Sao Paolo Court of Justice, suspending the effect of the ruling.
|
b)
|
Commitments
|
Agreements with Portugal Telecom (Brazil)
In accordance with the agreement signed on July 28, 2010 between Telefónica and Portugal Telecom described in Note 5 for the acquisition by Telefónica of shares representing 50% of the capital stock of Brasilcel, Telefónica still has to make the third and final payment in the amount of 2,000 million euros, due on October 31, 2011.
Regarding the final payment, Portugal Telecom may request that this final payment is made early, on July 29, 2011, in which case the acquisition cost (and, accordingly, the amount of the final payment) would be reduced by approximately 25 million euros.
In addition, and within the scope of the same transaction, on October 26, 2010, Telefónica announced a tender offer for the voting shares of Vivo not held by Brasilcel and which represent, approximately, 3.8% of Vivo’s outstanding share capital, subject to regulatory approval.
The maximum amount of the offer amounted to approximately 800 million euros, assuming a 100% acceptance of the offer.
The tender offer was approved by the Brazilian market regulator on February 11, 2011 (see Note 24).
On December 27, 2010, Vivo Participaçoes and Telecomunicaçoes de Sao Paulo (“Telesp”) announced the start of a potential merger of the shares of Vivo into the share capital of Telesp through a share swap, to be carried out in 2011. The aim of the proposal is to simplify Vivo's and Telesp’s shareholder and organizational structure, while bolstering the Telefónica Group’s competitive position in the Brazilian market
Telefónica Internacional, S.A.U. as strategic partner of Colombia Telecomunicaciones, S.A. ESP
Pursuant to the terms of the Framework Investment Agreement signed on April 18, 2006 between Telefónica Internacional, S.A.U., the Colombian government and Colombia Telecomunicaciones, S.A. ESP, shareholders of Colombia Telecomunicaciones, S.A. ESP may offer, from April 28, 2006, at any time and in a single package, all the shares they hold in Colombia Telecomunicaciones, S.A. ESP to Telefónica Internacional, S.A.U., who shall be obliged to acquire them, directly or via one of its subsidiaries.
The sale/purchase price of each share will be determined based on the per share valuation of each share offered for sale by an independent investment bank designated by agreement between the two parties.
Guarantees provided for Ipse 2000 (Italy)
The Telefónica Group had provided guarantees for the Italian company Ipse 2000 S.p.A. (holder of a UMTS license in Italy and in which the Company has a stake through Solivella B.V.) to ensure the amounts payable to the Italian government in connection with the grant of the license.
In November 2010, the last of the 10 monthly payments scheduled was paid. Therefore, the guarantee expired on that day. Pending is the release letter to be issued by the Italian government.
The contingencies arising from the litigation and commitments described above were evaluated (see Note 3.1) when the consolidated financial statements for the year ended December 31, 2010 were prepared. The provisions recorded in respect of the commitments taken as a whole are not material.
|
c)
|
Environmental matters
|
Through its investees and in line with its environmental policy, the Telefónica Group has undertaken various environmental-management initiatives and projects. In 2010 and 2009 these initiatives and projects resulted in expenditure and investment for insignificant amounts, which were recognized in the consolidated income statement and consolidated statement of financial position, respectively.
The Group has launched various projects with a view to reducing the environmental impact of its existing installations, with project costs being added to the cost of the installation to which the project relates.
In addition, in line with its commitment to the environment, the Group announced the creation of a Climate Change Office to provide a framework for strategic and RD&I projects in the quest for energy efficient solutions.
This initiative entails the launch and implementation of solutions in each area that contributes to optimizing the company's processes (operations, suppliers, employees, customers and society).
|
•
|
In the area of operations, the main objective is to develop and implement projects that will allow for more efficient networks and systems by reducing and optimizing energy consumption.
|
|
•
|
In the area of suppliers, active efforts are underway to include energy efficiency criteria in the purchasing process for all product lines in the Telefónica Group’s value chain.
|
|
•
|
In the area of employees, the aim is to foster among the Company’s employees a culture of respect and awareness regarding the environment and energy saving.
|
|
•
|
In the area of customers, work is being carried out to better leverage ICTs (information and communication technologies) and increase energy efficiency with the objective of reducing carbon emissions.
|
|
•
|
And finally, in the area of society, the objective is to promote change in citizens’ behavior through actions by the Telefónica Group.
|
The Group has also rolled out internal control mechanisms sufficient to pre-empt any environmental liabilities that may arise in future, which are assessed at regular intervals either by Telefónica staff or renowned third-party institutions. No significant risks have been identified in these assessments.
|
d)
|
Auditors’ fees
|
The fees paid to the various member firms of the Ernst & Young international organization, to which Ernst & Young, S.L. (the auditors of the Telefónica Group) belongs, amounted to 27.71 million euros and 24.07 million euros in 2010 and 2009, respectively.
The detail of these amounts is as follows:
|
Millions of euros
|
||||||||
|
2010
|
2009
|
|||||||
|
Audit services (1)
|
25.75 | 22.62 | ||||||
|
Audit-related services (2)
|
1.92 | 1.40 | ||||||
|
Tax services (3)
|
0.03 | 0.01 | ||||||
|
All other services (4)
|
0.01 | 0.04 | ||||||
|
TOTAL
|
27.71 | 24.07 | ||||||
|
(1)
|
Audit services: services included under this heading are mainly the audit of the annual and reviews of interim financial statements, work to comply with the requirements of the Sarbanes-Oxley Act (Section 404) and the review of the 20-F report to be filed with the US Securities and Exchange Commission (SEC).
|
|
(2)
|
Audit-related services: This heading mainly includes services related to the review of the information required by regulatory authorities, agreed financial reporting procedures not requested by legal or regulatory bodies and the review of corporate responsibility reports.
|
|
(3)
|
Tax services: the services included under this heading relate to the review of tax obligations.
|
|
(4)
|
All other services: the services included under this heading relate to training.
|
Ernst & Young’s fees include amounts in respect of fully and proportionately consolidated Telefónica Group companies. A total of 0.04 million euros and 1.17 million euros, respectively, corresponding to 50% of the fees by proportionally consolidated companies, were included in 2010 and 2009, respectively.
Fees paid to other auditors in 2010 and 2009 amounted to 28.10 million euros and 21.60 million euros, respectively, as follows:
|
Millions of euros
|
||||||||
|
2010
|
2009
|
|||||||
|
Audit services
|
0.75 | 0.86 | ||||||
|
Audit-related services
|
1.26 | 2.17 | ||||||
|
Tax services
|
7.29 | 3.95 | ||||||
|
All other services
|
18.80 | 14.62 | ||||||
|
TOTAL
|
28.10 | 21.60 | ||||||
Other auditors’ fees include amounts in respect of fully and proportionately consolidated Telefónica Group companies. In 2010 and 2009, a total of 0.02 million euros and 0.24 million
euros, respectively, corresponding to 50% of the fees by proportionately consolidated companies, were included.
The amounts disclosed above for 2010 included the fees of Ernst & Young and other auditors in respect of 100% of the consolidated Vivo Group, as this was a controlled interest at year end. In 2009, 50% of these fees were included.
|
e)
|
Trade and other guarantees
|
The Company is required to issue trade guarantees and deposits for concession and spectrum tender bids (see Note 16) and in the ordinary course of its business. No significant additional liabilities in the accompanying consolidated financial statements are expected to arise from guarantees and deposits issued.
|
f)
|
Directors’ and Senior executives’ compensation and other benefits
|
The compensation of Telefónica, S.A.’s Directors is governed by Article 28 of the Bylaws, which states that the compensation amount that the Company may pay to all of its Directors as remuneration and attendance fees shall be fixed by the shareholders at the General Shareholders’ Meeting, which amount shall remain unchanged until and unless the shareholders decide to modify it. The Board of Directors shall determine the exact amount to be paid within such limit and the distribution thereof among the Directors. In this respect, on April 11, 2003, shareholders set the maximum gross annual amount to be paid to the Board of Directors at 6 million euros. This includes a fixed payment and fees for attending meetings of the Board of Director’s advisory or control Committees. In addition, the compensation provided for in the preceding paragraphs, deriving from membership on the Board of Directors, shall be compatible with other professional or employment compensation accruing to the Directors by reason of any executive or advisory duties that they perform for the Company, other than the supervision and collective decision-making duties inherent in their capacity as Directors.
Therefore, the compensation paid to Telefónica Directors in their capacity as members of the Board of Directors, the Executive Commission and/or the advisory and control Committees consists of a fixed amount payable monthly plus fees for attending the meetings of the Board’s advisory or control Committees. In this respect, it was also agreed that executive Board members, other than the Chairman would not receive the fixed amounts established for their directorships, but only receive the corresponding amounts for discharging their executive duties as stipulated in their respective contracts.
The following table presents the fixed amounts established for membership to the Telefónica Board of Directors, Executive Commission and the advisory or control Committees:
|
(Euros)
Position
|
Board of
Directors
|
Executive
Commission
|
Advisory or
Control
Committees
|
|||||||||
|
Chairman
|
300,000 | 100,000 | 28,000 | |||||||||
|
Vice Chairman
|
250,000 | 100,000 | - | |||||||||
|
Board member:
Executive
Proprietary
Independent
Other external
|
-
150,000
150,000
150,000
|
-
100,000
100,000
100,000
|
-
14,000
14,000
14,000
|
|||||||||
In addition, the amounts paid for attendance at each of the Advisory or Control Committee meetings is 1,250 euros.
Total compensation paid to Telefónica’s Directors for discharging their duties in 2010 amounted to 4,136,167 euros in fixed compensation and 321,250 euros in fees for attending the Board’s Advisory or Control Committees meetings. It should also be noted that the compensation paid to Company Directors sitting on the Boards of other Telefónica Group companies amounted to 1,780,898 euros. In addition, the Company Directors who are members of the regional advisory Committees, including the Telefónica Corporate University Advisory Council, received a total of 556,250 euros in 2010.
The following table presents the breakdown by item of the compensation and benefits paid to Telefónica’s Directors for discharging their duties in 2010:
|
(Euros)
Board Members
|
Board of
Directors
|
Executive
Commission
|
Other Board
Committees
|
TOTAL
|
||||||||||||||||
|
Fixed
payment
|
Attendance
fees
|
|||||||||||||||||||
|
Chairman
|
||||||||||||||||||||
|
Mr. César Alierta Izuel
|
300,000 | 100,000 | - | - | 400,000 | |||||||||||||||
|
Vice chairmen
|
||||||||||||||||||||
|
Mr. Isidro Fainé Casas
|
250,000 | 100,000 | - | - | 350,000 | |||||||||||||||
|
Mr. Vitalino Manuel Nafría Aznar
|
250,000 | - | 56,000 | 26,250 | 332,250 | |||||||||||||||
|
Members
|
||||||||||||||||||||
|
Mr. Julio Linares López
|
- | - | - | - | - | |||||||||||||||
|
Mr. José María Abril Pérez
|
150,000 | 100,000 | 14,000 | 3,750 | 267,750 | |||||||||||||||
|
Mr. José Fernando de Almansa Moreno-Barreda
|
150,000 | - | 56,000 | 26,250 | 232,250 | |||||||||||||||
|
Mr. José María Álvarez-Pallete López
|
- | - | - | - | - | |||||||||||||||
|
Mr. David Arculus
|
150,000 | - | 28,000 | 11,250 | 189,250 | |||||||||||||||
|
Ms.
Eva Castillo Sanz
|
150,000 | - | 42,000 | 23,750 | 215,750 | |||||||||||||||
|
Mr. Carlos Colomer Casellas
|
150,000 | 100,000 | 56,000 | 23,750 | 329,750 | |||||||||||||||
|
Mr. Peter Erskine
|
150,000 | 100,000 | 56,000 | 36,250 | 342,250 | |||||||||||||||
|
Mr. Alfonso Ferrari Herrero
|
150,000 | 100,000 | 106,167 | 48,750 | 404,917 | |||||||||||||||
|
Mr. Luiz Fernando Furlán
|
150,000 | - | 14,000 | 3,750 | 167,750 | |||||||||||||||
|
Mr. Gonzalo Hinojosa Fernández de Angulo
|
150,000 | 100,000 | 98,000 | 51,250 | 399,250 | |||||||||||||||
|
Mr. Pablo Isla Álvarez de Tejera
|
150,000 | - | 84,000 | 18,750 | 252,750 | |||||||||||||||
|
Mr. Antonio Massanell Lavilla
|
150,000 | - | 70,000 | 31,250 | 251,250 | |||||||||||||||
|
Mr. Francisco Javier de Paz Mancho
|
150,000 | 100,000 | 56,000 | 16,250 | 322,250 | |||||||||||||||
|
TOTAL
|
2,600,000 | 800,000 | 736,167 | 321,250 | 4,457,417 | |||||||||||||||
In addition, the breakdown of the total paid to executive Directors Mr. César Alierta Izuel, Mr. Julio Linares López and Mr. José María Álvarez-Pallete López for discharging their executive duties by item is as follows:
|
ITEMS
|
2010
(euros)
|
|||
|
Salaries
|
6,356,975 | |||
|
Variable compensation
|
8,186,448 | |||
|
Compensation in kind
(1)
|
117,290 | |||
|
Contributions to pension plans
|
25,444 | |||
(1) “Compensation in kind” includes life and other insurance premiums (general medical and dental insurance).
In addition, with respect to the Pension Plan for Senior Executives (see Note 19), the total amount of contributions made by the Telefónica Group in 2010 in respect of executive Directors was 1,925,387 euros.
In relation to the “Performance Share Plan” approved at the General Shareholders’ Meeting of June 21, 2006 (see Note 19), the maximum number of shares corresponding to the third, fourth, and fifth and final phases of the Plan will be given (on July 1, 2011, July 1, 2012 and July 1, 2013) to each of Telefónica’s executive Directors if all the terms established for such delivery are met, is as follows: Mr. César Alierta Izuel (148,818 shares in the third phase, 173,716 shares in the fourth phase, and 170,897 shares in the fifth phase); Mr. Julio Linares López (101,466 shares in the third phase, 130,287 shares in the fourth phase and 128,173 shares in the fifth phase); Mr. José María Álvarez-Pallete López (67,644 shares in the third phase, 78,962 shares in the fourth phase and 77,680 shares in the fifth phase).
Similarly
,
with respect to the execution of the second phase of the Plan in July 2010, since the Total Shareholder Return (TSR) of Telefónica was higher in this phase than the TSRs of companies representing 75% of the market cap of the comparison group, the beneficiaries received, in accordance with the general terms and conditions of the Plan, all the shares assigned to them as follows: Mr. César Alierta Izuel, 116,239 shares; Mr. Julio Linares López, 57,437 shares; Mr. José María Álvarez-Pallete López, 53,204 shares.
Furthermore, at the General Shareholders’ Meeting of Telefónica of June 23, 2009, its shareholders approved the introduction of the “Global Employee Share Plan,” a Telefónica share incentive plan for Group employees worldwide, including executives and executive Directors of the Company (see plan details provided in Note 20.c).
The three executive Directors decided to participate in this plan, contributing the maximum, i.e. 100 euros a month, over 12 months. Therefore, at the date of preparing these consolidated financial statements, the three executive Directors had acquired a total of 78 shares through this plan, whereby they are entitled to receive, free of charge, an equivalent number of shares providing that, among other conditions, they retain the acquired shares during the consolidation period (12 months from the end of the acquisition period).
It should be noted that the external Directors do not receive and did not receive in 2010 any compensation in the form of pensions or life insurance, nor do they participate in the share-based payment plans linked to Telefónica’s share price.
In addition, the Company does not grant and did not grant in 2010 any advances, loans or credits to the Directors, or to its top executives, thus complying with the requirements of the Sarbanes-Oxley Act passed in the U.S., which is applicable to Telefónica, S.A. as a listed company in that market.
Meanwhile, the six senior executives
1
of the Company, excluding those that are also Directors, received a total for all items in 2010 of 10,830,531 euros. In addition, the contributions by the Telefónica Group in 2010 with respect to the Pension Plan described in Note 19 for these senior executives amounted to 926,004 euros.
Furthermore, the maximum number of shares corresponding to the third, fourth and fifth phases of the “Performance Share Plan” assigned to the Company’s senior executives for each of the periods is:
306,115 shares for the third phase, 394,779 shares for the fourth phase and 350,485 shares for the fifth phase.
Similarly, as explained above, these senior executives received a total of 251,681 shares in the second phase of the Plan.
Lastly, at the date of preparation of these consolidated financial statements, the six senior executives had acquired a total of 152 shares under the aforementioned share incentive plan (Global Employee Share Plan).
|
g)
|
Equity interests and positions held or duties performed in companies engaging in an activity that is identical, similar or complementary to that of the Company
|
Pursuant to Article 229 of the Corporate Entreprises Act, approved by Royal Legislative Decree 1/2010 of July 2, details are given below, both for members of the Board of Directors of Telefónica, S.A., and for persons related thereto as set out in Article 231 of the Spanish Corporation Law, of (i) the direct and indirect equity interests held, and (ii) the positions or duties carried out, both of the foregoing in respect to companies whose activity is identical, similar or complementary to the corporate purpose of Telefónica, S.A.
|
Name
|
Activity
performed
|
Society
|
Position or functions
|
Stake
%
2
|
|
Mr. Isidro Fainé Casas
|
Telecommunications
|
Abertis Infraestructuras, S.A.
|
Vice Chairman
|
< 0.01%
|
|
Mr. David Arculus
|
Telecommunications
|
British Sky Broadcasting Group, Plc.
|
--
|
< 0.01%
|
|
Telecommunications
|
BT Group, Plc.
|
--
|
< 0.01%
|
In addition, for information purposes, details are provided below on the positions held or duties performed by the Directors of Telefónica, S.A. in those companies, of the Telefónica Group, or of any company in which Telefónica, S.A. or any of its Group companies holds a significant interest whereby it justifies their appointment as Directors of those companies whose activity is identical, similar or complementary to the corporate purpose of such company.
|
1
|
In this context, senior executive are taken as being those individuals who, in fact or in law, perform senior management duties, reporting directly to the Board of Directors or executive Committees or the CEOs thereof, including in all cases the Manager of Internal Audit.
|
|
2
|
In cases where the shareholding is less than 0.01% of share capital,
“
<0.01%
”
is noted.
|
|
Name
|
Society
|
Position or functions
|
|
Mr. César Alierta Izuel
|
Telecom Italia, S.p.A.
|
Director
|
|
China Unicom (Hong Kong) Limited
|
Director
|
|
|
Mr. Julio Linares López
|
Telefónica de España, S.A.U.
|
Director
|
|
Telefónica Europe, Plc.
|
Director
|
|
|
Telefónica Móviles España, S.A.U.
|
Director
|
|
|
Telecom Italia, S.p.A.
|
Director
|
|
|
Mr. Alfonso Ferrari Herrero
|
Telefónica Chile, S.A.
|
Acting Director
|
|
Telefónica del Perú, S.A.A.
|
Director
|
|
|
Telefónica Internacional, S.A.U.
|
Director
|
|
|
Mr. David Arculus
|
Telefónica Europe, Plc.
|
Director
|
|
Mr. Francisco Javier de Paz Mancho
|
Atento Inversiones y Teleservicios, S.A.U.
|
Non-executive Chairman
|
|
Telecomunicaçoes de Sao Paulo, S.A.
|
Director
|
|
|
Telefónica de Argentina, S.A.
|
Director
|
|
|
Telefónica Internacional, S.A.U.
|
Director
|
|
|
Mr. José Fernando de Almansa Moreno-Barreda
|
Telecomunicaçoes de Sao Paulo, S.A.
|
Director
|
|
Telefónica de Argentina, S.A.
|
Director
|
|
|
Telefónica del Perú, S.A.A.
|
Director
|
|
|
Telefónica Internacional, S.A.U.
|
Director
|
|
|
Telefónica Móviles México, S.A. de C.V.
|
Director
|
|
|
Mr. José María Álvarez-Pallete López
|
Colombia Telecomunicaciones, S.A. ESP
|
Director
|
|
Telecomunicaçoes de Sao Paulo, S.A.
|
Director/Vice Chairman
|
|
|
Telefónica Chile, S.A.
|
Acting Director
|
|
|
Telefónica DataCorp, S.A.U.
|
Director
|
|
|
Telefónica de Argentina, S.A.
|
Acting Director
|
|
|
Telefónica del Perú, S.A.A.
|
Director
|
|
|
Telefónica Internacional, S.A.U.
|
Executive Chairman
|
|
|
Telefónica Larga Distancia de Puerto Rico, Inc.
|
Director
|
|
|
Telefónica Móviles Colombia, S.A.
|
Acting Director
|
|
|
Telefónica Móviles México, S.A. de C.V.
|
Director/Vice Chairman
|
|
|
Mr. Luiz Fernando Furlán
|
Telecomunicaçoes de Sao Paulo, S.A.
|
Director
|
|
Telefónica Internacional, S.A.U.
|
Director
|
|
|
Ms. María Eva Castillo Sanz
|
Telefónica Internacional, S.A.U.
|
Director
|
|
Telefónica O2 Czech Republic, a.s.
|
First Vice Chairman of Supervisory Board
|
|
|
Mr. Peter Erskine
|
Telefónica Europe, Plc.
|
Director
|
|
(
22)
|
FINANCE LEASES
|
The principal finance leases at the Telefónica Group are as follows:
|
a)
|
Future minimum lease payment commitments in relation to finance leases at O2 Group companies.
|
|
Millions of euros
|
Present value
|
Revaluation
|
Pending
payment
|
|||||||||
|
Within one year
|
38 | 1 | 39 | |||||||||
|
From one to five years
|
196 | 28 | 224 | |||||||||
|
Total
|
234 | 29 | 263 | |||||||||
These commitments arise from plant and equipment lease agreements. Between March 30, 1991 and April 9, 2001, finance lease agreements were signed between O2 UK and a number of US leasing trusts. A part of the radio and switch equipment of its GSM network is subject to the terms of said agreements. The agreements have a term of 16 years and an early purchase option after the first 12 years.
At December 31, 2010 and 2009, net assets under this lease amounting to 201 and 208 million euros, respectively, were recognized under property, plant and equipment.
|
b)
|
Finance lease agreement at Colombia Telecomunicaciones, S.A., ESP.
|
Similarly, via its subsidiary Colombia Telecomunicaciones, S.A., ESP, the Group has a finance lease agreement with PARAPAT, the consortium which owns the telecommunications assets and manages the pension funds for the entities which were predecessors to Colombia Telecomunicaciones, S.A., E.S.P., and which regulate the operation of assets, goods and rights relating with the provision of telecommunications services by the company, in exchange for financial consideration.
This agreement includes the transfer of these assets and rights to Colombia Telecomunicaciones, S.A., ESP once the last installment of the consideration has been paid in line with the payment schedule over a period of 17 years from 2006:
|
Present value
|
Revaluation
|
Installments
pending
payment
|
||||||||||
|
2011
|
111 | 96 | 207 | |||||||||
|
2012
|
147 | 161 | 308 | |||||||||
|
2013
|
142 | 193 | 335 | |||||||||
|
2014
|
136 | 227 | 363 | |||||||||
|
2015
|
131 | 264 | 395 | |||||||||
|
Subsequent years
|
795 | 3,118 | 3,913 | |||||||||
|
Total
|
1,462 | 4,059 | 5,521 | |||||||||
The net amount of property, plant and equipment recorded under the terms of this lease was 470 million euros at December 31, 2010 (483 million euros at December 31, 2009).
|
(23)
|
CASH FLOW ANALYSIS
|
Net cash from operating activities
Net cash flow from operating activities increased 3.24%, from 16,148 million euros in 2009 to 16,672 million euros in 2010.
In 2010, the Telefónica Group obtained operating cash flow (operating revenue less payments to suppliers for expenses and employee benefits expenses) totaling 21,306 million euros, 0.69% more than the 21,160 million euros generated in 2009.
This improvement is due to the robust growth of consolidated revenues, which continue to accelerate in all regions, underpinned by significant business diversification and the high level of commercial activity, especially in wireline and wireless broadband. This growth is being driven simultaneously by policies to strengthen customer loyalty and the bundling of voice, broadband and television services, which are critical to the Group's strategy, and the commitment to improving quality, all within a highly competitive environment in the markets in which the Group operates.
Customer collections increased by 8.18% to 72,867 million euros in 2010 (from 67,358 million euros in 2009). Telefónica Latin America continues to enjoy accelerating growth from the advantages afforded by diversification and the commercial effort. Telefónica Europe has seen a sharp rise in revenues, while the businesses in Spain are generating operating cash flow thanks to a considerable and effective commercial effort and cost control.
Accumulated cash payments to suppliers and employees amounted to 51,561 million euros at December 2010, up 11.61% compared to the 46,198 million euros recorded at the end of 2009. This increase was due to a higher supply of terminals in Telefónica Latin America, partially offset by lower wireless termination expenses in Telefónica Spain and Telefónica Europe, and the commercial effort in the three regions. Maximizing the efficiency of the cost structure contributed positively to the generation of operating cash flow.
As compared to 2009, 2010 cash payments to employees have followed the trend resulting from costs associated to the evolution of average headcount.
In 2009, net cash flow from operating activities decreased 1.33% from 16,366 million euros in 2008.
Customer collections decreased by 2.46% to 67,358 million euros in 2009 (from 69,060 million euros in 2008), in line with the performance of revenues from operations in the year.
Cash payments to suppliers and employees accumulated at December 2009 decreased by 4.75% to 46,198 million euros, from 48,500 million euros in 2008. This reduction was the result of cost containment amid efforts to maximize the efficiency of the cost structure. Employee benefits expense rose in 2009 in line with the increase of costs associated to the higher average headcount in the year. In 2009 the Telefónica Group’s operating cash flow was 2.92% higher than the 20,560 million euros recorded in 2008. This increase was due to the strong diversification of the business and the capacity to operate in changing environments, with efficient cost and investment management. Strong commercial efforts helped drive growth in accesses across all operating businesses and regions, helping generate operating cash flow.
Cash flows arising from payments of interest and other finance costs in 2010 fell 0.74% to 2,154 million euros, in line with the reduction in interest rates during the year and despite the rise in financial debt during the year. In 2009, this item amounted to 2,170 million euros, down 25.02% compared to 2008 (2,894 million euros), primarily due to the downward trends in interest rates and the reduction in financial debt during prior periods.
Tax payments amounted to 2,616 million euros in 2010, down 11.1% compared to 2009 (2,942 million euros), primarily due to lower tax payments on account by Telefónica, S.A. during the year (729 million euros). In 2009, this amounted to 1,297 million euros. In 2009, tax payments increased by 1,529 million euros (1,413 million euros in 2008), up 108.21%, mainly due to payments on account of 2009.
Net cash used in investing activities
Net cash used in investing activities increased by 70.5% in 2010, to 15,861 million euros from 9,300 million euros in 2009.
During the year, payments on investments in companies amounted to 5,744 million euros, with the main investments being the acquisition of 50% of Brasilcel, for which a total of 5,047 million euros has been paid to date (net of cash and cash equivalents), the acquisition of 22% of the share capital of
DTS, Distribuidora de Televisión Digital S.A. (230 million euros) and the acquisitions in Europe of Jajah Inc. and the German company
HanseNet Telekommunikation GmbH (“HanseNet”)
for 150 million euros and 207 million euros, respectively, net of cash and cash equivalents.
Payments on financial investments not included in cash equivalents amounted to 1,599 million euros in 2010. This includes payments of 638 million euros for the refinancing entailed in the acquisition of 100% of shares of HanseNet and the financing provided to Telco, S.p.A., for 600 million euros at December 31, 2010.
Collections on divestments in companies in 2010 (552 million euros) primarily relate to divestments in Meditel for 380 million euros and in Manx Telecom Limited for 157 million euros (the latter, net of cash and cash equivalents).
Net cash used in investing activities increased by 2.2% in 2009, to 9,300 million euros from 9,101 million euros in 2008. Payments on investments in companies (net of cash and cash equivalents acquired) decreased 97.8%, from 2,178 million euros at December 31, 2008 to 48 million euros at December 31, 2009. The main investments were the acquisition of shares from non-controlling shareholders of the Telefónica Argentina Group, for 22 million euros, which entailed the acquisition of an additional 1.8% stake and the payment of Telefónica Chile, S.A.’s second takeover for 18 million euros. Payments for investments in 2008 include the acquisition of Telemig by Brasilcel for 347 million euros, the purchase of shares in China Netcom and China Unicom for 688 million euros and 424 million euros, respectively, and the acquisition of 51.8% of Telefónica Chile, S.A. from non-controlling shareholders, for 640 million euros. During this period, payments from financial investments not included in cash equivalents amounted to 1,411 million euros, compared to 114 million euros in 2008. This increase was due to investments in deposits and other long-term financial instruments.
In 2009, collections on divestments in companies amounted to 34 million euros. The main transaction in this respect was the sale of Meditelcom for 20 million euros. In 2008, this figure amounted to 686 million euros, primarily due to the divestment of Sogecable, for 648 million euros.
Payments on investments in property, plant and equipment and intangible assets totaled 8,944 million euros at December 2010, 17.8% higher than the prior year (7,593 million euros). This increase is due to the rise in acquisitions of property, plant and equipment and intangible assets during the period, especially the purchases of spectrum licenses in Mexico and Germany. Payments for investment in property, plant and equipment and intangible assets in 2009 totaled 7,593 million euros, 3.75% less than the prior year (7,889 million euros). This decrease was in line with the plan to decrease acquisitions of property, plant and equipment from 2008 to 2009.
In the period, net short-term financial investments included in cash flows from cash surpluses not included under cash equivalents amounted to 621 million euros. In 2009, net investments amounted to 548 million euros, while in 2008 divestments totaled 76 million euros.
Net cash flow used in financing activities
In 2010, net cash used in financing activities was 130% higher than in 2009 (2,281 million euros), totaling 5,248 million euros, primarily due to the higher dividend distributed by Telefónica, S.A. for 5,872 million euros (4,557 million euros in 2009), the higher cash outflow due to redemption of bonds and debentures upon maturity, totaling 5,482 million euros (1,949 million euros in 2009) and repayments of loans, credit facilities and promissory notes for 7,954 million euros (5,494 million euros in 2009).
Net cash used in financing activities in 2009 totaled 2,281 million euros, 71% less than the 7,765 million euros of 2008, primarily due to the cash inflows of 8,617 million euros from the issuance of debentures and bonds (1,317 million euros in 2008).
|
(24)
|
EVENTS AFTER THE REPORTING PERIOD
|
The following events regarding the Telefónica Group took place between December 31, 2010 and the date of authorization for issue of the accompanying consolidated financial statements:
Financing
On February 7, 2011, Telefónica Emisiones, S.A.U. issued 1,200 million euros of bonds maturing on February 7, 2017 and guaranteed by Telefónica, S.A. as part of its European medium term notes program ("EMTN") registered with the Financial Services Authority (FSA) in London on June 23, 2010.
On February 16, 2011, Telefónica Emisiones, S.A.U. issued notes in an aggregate principal amount of 2,750 million US dollars under its issuance program registered with the United States Securities and Exchange Commission (the “SEC”) on May 8, 2009. The notes are guaranteed by Telefónica, S.A. This issue entails two tranches: the first for 1,250 million US dollars maturing on February 16, 2016 and the second for 1,500 million US dollars maturing on February 16, 2021.
Extension of the strategic partnership agreement with China Unicom
Expanding on the existing strategic alliance agreement, on January 23, 2011, Telefónica and China Unicom (Hong Kong) Limited (“China Unicom”) signed an extension to their Strategic Alliance Agreement, in which both companies agreed to strengthen and deepen their strategic cooperation in certain business areas, and committed to investing the equivalent of 500 million US dollars in ordinary shares of the other party.
Telefónica will acquire through its subsidiary Telefónica Internacional, S.A.U. a number of China Unicom shares amounting to 500 million US dollars from third parties, within nine months from the agreement date.
Following the completion of the transaction, Telefónica will hold, through its subsidiary Telefónica Internacional, S.A.U., approximately 9.7% of China Unicom’s voting share capital,
based on the share price in the moment of formalization of mentioned agreement of January 23, 2011, while China Unicom will own approximately 1.37% of Telefónica’s voting share capital.
In recognition of China Unicom's stake in Telefónica, the latter commits to proposing the appointment of a board member named by China Unicom in the next General Shareholders' Meeting, in accordance with prevailing legislation and the Company's Bylaws.
China Unicom completed the acquisition of Telefónica shares on January 28, 2011, giving it ownership of 1.37% of the Company’s capital.
Approval of the tender offer for shares of Vivo Participaçoes
On February 11, 2011, the Brazilian market regulator (C.V.M.) approved the tender offer made by Telefónica, S.A. to holders of voting shares of Vivo Participaçoes, S.A. (see Note 5).
On March 25, 2011, the Board of Directors of each of our controlled subsidiaries, Vivo Participações and Telecomunicações de São Paulo, S.A.—Telesp (“Telesp”), respectively, approved the terms and conditions of a restructuring whereby all shares of Vivo Participações that Telesp does not own will merge into Telesp in exchange for Telesp shares, converting Vivo Participações into a wholly-owned subsidiary of Telesp (the “Restructuring”). [The Restructuring was approved by shareholders of Vivo Participações at an Extraordinary General Shareholders’ Meeting held on April 27, 2011 and by shareholders of Telesp at an Extraordinary General Shareholders’ Meeting held on April 27, 2011.]
On March 30, 2011, Telefónica announced that the Brazilian market regulator (C.V.M) approved, on October 5, 2010, and confirmed, on March 3, 2011, the termination of the BDRs Program in Brazil and the subsequent delisting of Telefónica shares from the São Paulo stock exchange. The termination and delisting process started on March 30, 2011 and it is expected to conclude in the second half of 2011.
Possible divestiture of Atento
On February 24, 2011, Telefónica announced that it is considering a possible divestiture of its subsidiary, Atento Inversiones y Teleservicios, S.A.U., contemplating, among other alternatives, a potential public offering of shares of that company.
APPENDIX I: CHANGES IN THE CONSOLIDATION SCOPE
The following changes took place in the consolidation scope in 2010:
Telefónica Spain
In April 2010, Teleinformática y Comunicaciones, S.A. (Telyco) sold its subsidiary Telyco Marruecos, S.A. This company, which had been fully consolidated in the Telefónica Group, was removed from the consolidation scope.
In August 2010, Telefónica Móviles España, S.A.U., a wholly owned subsidiary of Telefónica, acquired approximately 91.2% of the Spanish company Tuenti Technologies, S.L.
Following a subsequent rights offering, the Telefónica Group increased its stake in the company’s share capital to 91.38%. This company is included in the consolidated financial statements of the Telefónica Group using the full consolidation method.
Telefónica Latin America
On June 30, 2010, the Telefónica Chile group embarked on a corporate restructuring. The restructuring was executed through the acquisition by Inversiones Telefónica Móviles Holding Limitada of all assets of fixed line telephony in Chile through its acquisition of Telefónica Internacional Chile, Ltda.
The acquisition was funded internally through an 869 million euro loan
from Telfin Ireland Limited (Irish company of the Group that carries out intragroup financing transactions).
On September 27, 2010, Telefónica acquired 50% of the shares of Brasilcel (a Dutch company that owns shares representing, approximately, 60% of the share capital stock of Brazilian company Vivo Participações, S.A.) owned by Portugal Telecom, having made a first payment, as agreed, of 4,500 million euros. The Brasilcel Group, which was previously proportionately consolidated in the Telefónica Group, has been fully consolidated since September 2010 (100% of all assets and liabilities of the Brazilian group are consolidated). Subsequently, in December 2010, a cross-border merger was completed whereby the Dutch company was taken over by Telefónica, S.A.
Telefónica Europe
In January 2010, the Telefónica Group, through its wholly owned subsidiary Telefónica Europe Plc, acquired 100% of the shares of Jajah Inc. for 145 million euros. This company has been included in the Telefónica Group’s consolidation scope using the full consolidation method.
On December 3, 2009, the Telefónica Group’s subsidiary in Germany, Telefónica Deutschland GmbH (“Telefónica Deutschland”), signed an agreement to acquire all of the shares of German company HanseNet Telekommunikation GmbH (“HanseNet”). The transaction was completed on February 16, 2010, the date on which the Telefónica Group completed the acquisition of 100% of the shares of HanseNet. The amount initially paid out was approximately 913 million euros, which included 638 million euros of refinanced debt, leaving an acquisition cost of 275 million euros, which was finally reduced by 40 million euros on completion of the transaction. This company has been included in the Telefónica Group’s consolidation scope using the full consolidation method.
In June 2010, British company Manx Telecom Limited was sold for approximately 164 million euros. The sale generated a gain of 61 million euros. This company, which had been fully consolidated in the Telefónica Group, was removed from the consolidation scope.
Other companies
In April 2010, Chilean company Telefónica Factoring Chile, S.A., which is 50% owned by the Telefónica Group, was incorporated. This company is included in the consolidation scope through the equity method of accounting.
In February 2010, Irish company Telfin Ireland Limited was incorporated, with an initial share capital of approximately 919 million euros, fully subscribed by its sole shareholder Telefónica, S.A. This company has been included in the Telefónica Group’s consolidation scope using the full consolidation method.
In June 2010, the Telefónica Group reduced its ownership interest in Portugal Telecom by 7.98%. In addition, Telefónica has entered into three equity swap contracts for Portugal Telecom shares with a number of financial institutions, all subject to net settlement, which grant Telefónica the equivalent total return of the investment. The investment, reflected in the consolidation scope through the equity method of accounting, was removed from the consolidation scope on June 30, 2010.
In December 2010, Telefónica, S.A., through subsidiary Telefónica de Contenidos, S.A.U., completed the acquisition of 22% of the capital stock of DTS, Distribuidora de Televisión Digital S.A. for approximately 488 million euros, 228 million euros of which was settled by cancelling the subordinated loan between Telefónica de Contenidos, S.A.U. (as creditor) and Sogecable, S.A. (currently Prisa Televisión, S.A.U., as debtor). This company is included in the consolidation scope using the equity method of accounting
Changes to the 2009 consolidation scope are described in the following sections.
Telefónica Europe
BT Cellnet Ltd and SPT Telecom Finance, B.V. were liquidated. Both fully consolidated companies were excluded from the scope of consolidation of the Telefónica Group.
In December, German company Telefónica Global Services, GmbH, a wholly owned subsidiary of the Telefónica Group, established German company Telefónica Global Roaming, GmbH, with initial capital of 25 thousand euros. The company was fully consolidated in the Telefónica Group.
Telefónica Latin America
Pursuant to Chilean law, on December 1, 2008, Telefónica, S.A., through subsidiary Inversiones Telefónica Internacional Holding, Ltda., launched a second tender offer (“second offer”) for all the shares of Compañía de Telecomunicaciones de Chile, S.A. (CTC) Telefónica did not already hold (representing 3.25% of CTC’s capital).
Upon completion of the second offer, Telefónica’s indirect stake in CTC’s share capital increased from 97.89% to 96.75% at the date the CNMV was notified on January 9, 2009. This Chilean company is still fully consolidated in the Telefónica Group
In order to restructure the Brazilian Vivo Group, on July 27, 2009 Telemig Celular, S.A. was taken over by Telemig Celular Participaçoes, S.A., which in turn was taken over by Vivo Participaçoes, S.A. Subsequent to this operation, the first two companies that had been fully consolidated were excluded from the Telefónica Group. The Telefónica Group still consolidates Vivo Participaçoes, S.A. using proportionate consolidation.
As part of the aforementioned restructuring, on November 19, 2009 Tagilo Participaçoes, Ltda., Sudestecel Participaçoes, Ltda., Avista Participaçoes, Ltda. and Vivo Brasil Comunicações Ltda.
were taken over by Portelcom Participaçoes, S.A. All these companies have been excluded from the scope of consolidation of the Telefónica Group in which they had been previously proportionately consolidated.
On December 3, 2009, following approval by the Comisión Nacional de Valores de la República Argentina, the Argentine securities regulatory, Telefónica, S.A. acquired shares representing 1.8% of the share capital of Telefónica de Argentina, S.A. held by minority shareholders for a price of approximately 23 million euros. This acquisition gave the Telefónica Group 100% stake in this Argentinean company. This company is still fully consolidated in the consolidated financial statements of the Telefónica Group.
On October 21, 2009, Telefónica, S.A. and China Unicom (Hong Kong) Limited (“China Unicom”) completed the mutual share exchange agreement through which Telefónica, through Telefónica Internacional, S.A.U., subscribed for 693,912,264 newly issued shares of China Unicom, satisfied by the contribution in kind to China Unicom of 40,730,735 Telefónica shares. This involved an investment of approximately 1,000 million US dollars in ordinary shares in the other party. Subsequent to this acquisition, the Telefónica Group has increased its stake in voting capital from 5.38% to 8.06%.
On November 5, 2009, an agreement was reached to repurchase shares from one of the major shareholders of China Unicom, SK Telecom Co., Ltd. ("SKT”). Subsequent to this acquisition and the redemption of these shares, considering the share capital of China Unicom, Telefónica held 8.37% of China Unicom's share capital. The Telefónica Group accounts for this investment using the equity method.
Other companies
In February 2009, Telefónica International Wholesale Services II, S.L. was incorporated with an initial capital of 3,006 euros, fully subscribed and paid up by Telefónica, S.A. The company has been incorporated into the Telefónica Group's financial statements.
In 2009, Telefónica International Wholesale Services II, S.L. incorporated the European companies TIWS Hungary, TIWS Sweden and TIWS Latvia, subscribing and paying up 100% of their respective share capital. All of these companies were included in the Telefónica Group’s consolidation scope using the full consolidation method.
Spanish company Telefónica Remesas, S.A. was incorporated by Telefónica Telecomunicaciones Públicas, S.A., a wholly owned Telefónica Group subsidiary, with initial capital of 0.3 million euros, fully subscribed and paid. The company was included in the Telefónica Group’s consolidation scope using the full consolidation method.
Telefónica Móviles España, S.A., a 100% owned subsidiary of Telefónica, S.A., sold its 32.18% stake in Moroccan company Medi Telecom, S.A. (Méditel) and the company’s outstanding loans, for 400 million euros to the rest of Méditel’s local partners. This company, which in the prior year was accounted for by the Telefónica Group using the equity method, was removed from the consolidation scope.
The Spanish company Atento Teleservicios España, S.A.U., a solely owned subsidiary of the Telefónica Group, was taken over in 2009 by the Dutch company Atento EMEA, B.V. This fully consolidated company was excluded from the scope of consolidation.
Subsequent to Sintonia, S.A. selling its stake in Telco, S.p.A. (Telco), an Italian company that held a 22.45% stake in the telecommunications operator Telecom Italia, S.p.A., Telefónica, S.A. increased its stake in Telco from 42.3% to 46.18%, retaining the effective stake in Telecom Italia,
S.p.A. through this company of 10.36% of its voting share capital. This company is still included in the consolidated financial statements of the Telefónica Group under the equity method.
In November, Telefónica Servicios Audiovisuales, S.A., a whole owned subsidiary of the Telefónica Group, acquired 100% of Spanish company Gloway Broadcast Services, S.L. (“Gloway”) for approximately 6 million euros. The company was fully consolidated in the financial statements of the Telefónica Group.
The main changes in consolidation scope in 2008 were as follows:
Telefónica Spain
In June 2008, Spanish company Iberbanda, S.A. raised and then decreased capital to offset losses. In the move, Telefónica de España, S.A.U. subscribed more shares than corresponded to its shareholding, thereby raising its stake in the company from 51% to 58.94%. This company is still fully consolidated.
Telefónica Latin America
On September 17, 2008, Telefónica launched a tender offer through its Inversiones Telefónica Internacional Holding, Ltda. subsidiary to acquire all the outstanding shares of Compañía de Telecomunicaciones de Chile, S.A. (“CTC”) that Telefónica did not control directly or indirectly. This amounted to 55.1% of CTC’s share capital. This included all CTC shares listed on the Santiago de Chile and New York Stock Exchanges (represented by American Depositary Shares). The offer was structured as a purchase of shares in cash, initially at a price of 1,000 Chilean pesos for class A shares and 900 Chilean pesos for class B shares. On October 11, 2008, the offer price was increased to 1,100 Chilean pesos for class A shares and 990 Chilean pesos for class B shares.
Upon completion of the acceptance period, a total of 496,341,699 shares were tendered, representing 94.11% of the targeted shares, which at that time entailed a total investment of approximately 640 million euros.
After settlement of the transaction, Telefónica’s indirect ownership in CTC’s share capital increased from 44.9% to 96.75%. This Chilean company was still included in the Telefónica Group’s consolidation scope using the full consolidation method.
Subsequently, pursuant to the obligations in Chilean law, on December 1, 2008, Telefónica, through subsidiary Inversiones Telefónica Internacional Holding, Ltda., presented a second tender offer to acquire all the outstanding shares of CTC that it did not own, directly or indirectly, after settlement of the first offer (representing 3.25% of CTC’s capital), on the same economic terms as the initial bid. This offer expired on January 9, 2009.
In August 2008, Telefónica del Perú, S.A.A. acquired 71.29% of Peruvian company Star Global Com, S.A.C. for 8 million US dollars. The company was included in the Telefónica Group’s consolidation scope using the full consolidation method.
On April 3, 2008, in accordance with the terms of a sale and purchase agreement entered into on August 2, 2007, after the pertinent administration authorizations were obtained, Vivo Participaçoes, S.A. (“VIVO”) completed the acquisition of 53.90% of the voting stock (ON) and 4.27% of the preferred stock (PN) of Telemig Celular Participaçoes, S.A., the controlling shareholder of Telemig Celular, S.A., a mobile telephony operator in the State of Minas Gerais (Brazil). According to the terms of the sale and purchase agreement, the total purchase price was 1,163 million reais (approximately 429 million euros). VIVO also acquired the right held by the
seller to subscribe in the future for paid up shares in Telemig Celular Participaçoes, S.A. for a price of approximately 70 million Brazilian reais (26 million euros).
Moreover, on April 8, 2008, VIVO, through its subsidiary Tele Centro Oeste IP, S.A., launched a voluntary tender offer for shares representing up to one third of the free float represented by the preferred stock in Telemig Celular Participaçoes, S.A. and in its subsidiary Telemig Celular, S.A. at a price of 63.90 and 654.72 Brazilian reais, respectively. Once the offer concluded, on May 15, 2008, having reached a level of acceptance of close to 100%, TCO IP, S.A. acquired 31.9% and 6% of the preferred shares of Telemig Celular Participaçoes, S.A. and Telemig Celular, S.A., respectively. Furthermore, in accordance with Brazilian Corporations law, TCO IP, S.A. submitted a mandatory tender offer on July 15 for all the voting stock in Telemig Celular Participaçoes, S.A. and Telemig Celular, S.A. at a price per share equivalent to 80% of the purchase price of the voting stock of these companies.
On December 19, 2008, approval was given by shareholders of Telemig Celular Participaçoes, S.A., Telemig Celular, S.A. and Vivo Participaçoes, S.A. (Vivo) in their respective extraordinary meetings to reorganize the Vivo Group, whereby TCO IP, S.A. was spun off. Its assets were subsequently integrated under Telemig Celular, S.A. and Telemig Celular Participaçoes, S.A., making Vivo a shareholder in both Brazilian companies, with direct and indirect stakes at December 31, 2008 amounting to 90.65% and 58.9%, respectively. Both companies were included in the Telefónica Group’s consolidation scope using proportionate consolidation.
On June 16, 2006, Telefónica de Argentina, S.A. signed a contract to acquire the shares of Telefónica Data Argentina, S.A. (787,697 shares, representing 97.89% of its share capital) held by Telefónica Data Corp, S.A.U., a wholly owned subsidiary of Telefónica.
After extending the deadline for the sale, on January 28, 2008, Telefónica Data Corp, S.A.U. assumed the obligation to acquire all the shares of Telefónica Data Argentina, S.A. it did not already own (14,948 shares at a price of 224.30 Argentine pesos, representing 1.8578% of share capital). This acquisition was carried out on November 17, 2008.
As a result, Telefónica DataCorp, S.A.U. became owner of 802,645 shares, representing 100% of Telefónica Data Argentina, S.A. It subsequently transferred these shares to Telefónica de Argentina, S.A. in various stages, which ended on December 11, 2008.
Other companies
In November 2008, Telefónica del Perú, S.A.A. sold a total of 4,496,984 shares representing approximately 30% of the share capital of Teleatento del Perú, S.A.C. to Dutch company Atento, N.V. (1,124,246 shares), Chilean company Atento Chile (2,323,442 shares) and to shareholders of Teleatento del Perú, S.A.C. itself (1,049,296 shares), for approximately 103 million new soles. Following this transaction, the Telefónica Group holds 100% of the Peruvian company’s share capital. This company was still fully consolidated.
In October 2008, Atento Holding Inversiones y Teleservicios, S.A. (Atento HIT) set up Dutch company Atento EMEA, B.V., with start-up capital of approximately 21 thousand euros. This capital was provided via the spin-off of the wholly owned subsidiary Atento HIT, Atento, N.V. The companies it owned in Europe and Morocco then belonged to the new company Atento EMEA, while those located in Latin America and Italy were still controlled by Atento, N.V. Both the newly created Atento EMEA, B.V. and the existing Atento, N.V. were fully consolidated in the Telefónica Group. In addition, on March 4, 2008, Atento HIT acquired 100% of the shares of Telemarketing Prague, a.s.
In January 2008, Turmed, S.L. and the Telefónica Group, through its wholly owned Terra Networks Asociadas, S.L. subsidiary, sold their 100% stakes in Viajar.com Viajes, S.L.U. and Terra Business Travel, S.A., respectively, to the Spanish company Red Universal de Marketing y Bookings On Line, S.A. (RUMBO). The Telefónica Group accounted for this company using the equity method until February 2008 and then proportionately from March. Subsequently, on October 28, 2008, RUMBO, Viajar.com Viajes, S.L.U. and Terra Business Travel, S.A. were merged, with RUMBO absorbing Viajar.com Viajes, S.L.U. and Terra Business Travel, S.A., which were extinguished.
Terra Lycos Holding, B.V. and Telefónica U.S.A. Advisors Inc. were liquidated.
In March 2008, Telco S.p.A., in which Telefónica holds a stake of 42.3%, acquired 121.5 million shares at a price of 1.23 euros per share in the Italian company Telecom Italia (equivalent to 0.9% of its share capital), bringing its total direct interest to 24.5% of the voting rights and 16.9% of the dividend rights. The transaction implied a payment of 149.8 million euros.
As a result, the Telefónica Group indirectly held 10.4% of Telecom Italia’s voting rights and 7.1% of its dividend rights. Telco S.p.A. was included in the Telefónica Group's consolidated financial statements by the equity method.
After a capital hike by Colombian company Telefónica Móviles Colombia, S.A., which Telefónica, S.A. fully subscribed, Telefónica, S.A.’s stake in the company increased to 49.42%, while the shareholding of Colombian company Olympic, Ltd., a 99.99% subsidiary of the Telefónica Group, decreased to 50.58%. The Telefónica Group still consolidated the Colombian operator using the full consolidation method.
In December 2008, Portugal Telecom, S.G.P.S., S.A. (PT) bought back and cancelled 46,082,677 own shares in line with its share buyback program. This raised the Telefónica Group’s direct and indirect ownership interest to 10.48%. In accordance with article 20 of the Portuguese stock market code, Telefónica sold 4,264,394 shares of PT, thereby lowering its stake to 10%. This company was still included in the consolidation scope using the equity method.
In December 2008, Telefactoring Colombia, S.A. was incorporated, with start-up capital amounting to 4 billion Colombian pesos, fully subscribed and paid in. Telefónica subscribed and paid 1,620 million Colombian pesos, equivalent to a 40.5% stake. This company had yet to commence operations and was not included in the consolidation scope at the end of 2008.
APPENDIX II:
DEBENTURES AND BONDS
The list and main features of outstanding debentures and bonds at December 31, 2010 are as follows (in millions of euros):
|
Telefónica and its instrumental companies
|
Maturity (nominal)
|
|||||||||
|
Debentures and bonds
|
Currency
|
% Interest rate
|
Final rate
|
2011
|
2012
|
2013
|
2014
|
2015
|
Subsequent
years
|
Total
|
|
CAIXA 07/21/29 ZERO COUPON
|
EUR
|
6.39%
|
6.386%
|
-
|
-
|
-
|
-
|
-
|
61
|
61
|
|
ABN 15Y BOND
|
EUR
|
1.0225xGBSW10Y
|
3.994%
|
-
|
-
|
-
|
-
|
50
|
-
|
50
|
|
Telefónica, S.A.
|
-
|
-
|
-
|
-
|
50
|
61
|
111
|
|||
|
T. EUROPE BV SEP_00 GLOBAL D
|
USD
|
8.250%
|
8.250%
|
-
|
-
|
-
|
-
|
-
|
935
|
935
|
|
TEBV FEB_03 EMTN FIXED TRANCHE A
|
EUR
|
5.125%
|
5.125%
|
-
|
-
|
1,500
|
-
|
-
|
-
|
1,500
|
|
TEBV FEB_03 EMTN FIXED TRANCHE B
|
EUR
|
5.875%
|
5.875%
|
-
|
-
|
-
|
-
|
-
|
500
|
500
|
|
T.EUROPE BV JULY A 2007
|
JPY
|
2.110%
|
2.110%
|
-
|
138
|
-
|
-
|
-
|
138
|
|
|
T.EUROPE BV JULY B 2007
|
JPY
|
1 x JPYL6M + 0.40000%
|
0.843%
|
-
|
138
|
-
|
-
|
-
|
138
|
|
|
Telefónica Europe, B.V.
|
-
|
276
|
1,500
|
-
|
-
|
1,435
|
3,211
|
|||
|
EMTN O2 EUR (I)
|
EUR
|
4.375%
|
4.375%
|
-
|
-
|
-
|
-
|
-
|
1,750
|
1,750
|
|
EMTN O2 EURO (II)
|
EUR
|
3.750%
|
3.750%
|
2,250
|
-
|
-
|
-
|
-
|
-
|
2,250
|
|
EMTN O2 GBP (I)
|
GBP
|
5.375%
|
5.375%
|
-
|
-
|
-
|
-
|
-
|
871
|
871
|
|
EMTN O2 GBP (II)
|
GBP
|
5.375%
|
5.375%
|
-
|
-
|
-
|
-
|
-
|
581
|
581
|
|
TELEF.
EMISIONES JUN
06 TRANCHE B
|
USD
|
5.984%
|
5.984%
|
748
|
-
|
-
|
-
|
-
|
-
|
748
|
|
TELEF.
EMISIONES JUN
06 TRANCHE C
|
USD
|
6.421%
|
6.421%
|
-
|
-
|
-
|
-
|
-
|
935
|
935
|
|
TELEF.
EMISIONES JUN
06 TRANCHE D
|
USD
|
7.045%
|
7.045%
|
-
|
-
|
-
|
-
|
-
|
1,497
|
1,497
|
|
TELEF.
EMISIONES SEPTEMBER 06
|
EUR
|
4.393%
|
4.393%
|
-
|
500
|
-
|
-
|
-
|
-
|
500
|
|
TELEF.
EMISIONES DECEMBER 06
|
GBP
|
5.888%
|
5.888%
|
-
|
-
|
-
|
581
|
-
|
-
|
581
|
|
TELEF.
EMISIONES FEBRUARY 07
|
EUR
|
4.674%
|
4.674%
|
-
|
-
|
-
|
1,500
|
-
|
-
|
1,500
|
|
TELEF.
EMISIONES JUNE B 07
|
CZK
|
4.351%
|
4.351%
|
-
|
120
|
-
|
-
|
-
|
-
|
120
|
|
TELEF.
EMISIONES JUNE C 07
|
CZK
|
4.623%
|
4.623%
|
-
|
-
|
-
|
104
|
-
|
-
|
104
|
|
TELEF.
EMISIONES JULY A 07
|
USD
|
5.855%
|
5.855%
|
-
|
-
|
561
|
-
|
-
|
-
|
561
|
|
TELEF.
EMISIONES JULY C 07
|
USD
|
6.221%
|
6.221%
|
-
|
-
|
-
|
-
|
-
|
524
|
524
|
|
TELEF.
EMISIONES JUNE 08
|
EUR
|
5.580%
|
5.580%
|
-
|
-
|
1,250
|
-
|
-
|
-
|
1,250
|
|
TELEF.
EMISIONES FEBRUARY 09
|
EUR
|
5.431%
|
5.431%
|
-
|
-
|
-
|
2,000
|
-
|
-
|
2,000
|
|
TELEF.
EMISIONES APRIL 2016
|
EUR
|
5.496%
|
5.496%
|
-
|
-
|
-
|
-
|
1,000
|
1,000
|
|
|
TELEF.
EMISIONES APRIL 2016
|
EUR
|
5.496%
|
5.496%
|
-
|
-
|
-
|
-
|
-
|
500
|
500
|
|
TELEF.
EMISIONES JULY 6, 2015
|
USD
|
4.949%
|
4.949%
|
-
|
-
|
-
|
-
|
935
|
935
|
|
|
TELEF.
EMISIONES JULY 15, 2019
|
USD
|
5.877%
|
5.877%
|
-
|
-
|
-
|
-
|
-
|
748
|
748
|
|
TELEF.
EMISIONES JUNE 2015
|
EUR
|
1 x EURIBOR3M + 1.825%
|
2.853%
|
-
|
-
|
-
|
-
|
400
|
-
|
400
|
|
TELEF.
EMISIONES JULY B 07
|
USD
|
1 x USDL3M + 0.33000%
|
0.616%
|
-
|
-
|
636
|
-
|
-
|
-
|
636
|
|
TELEF.
EMISIONES JANUARY 06 A
|
EUR
|
1 x EURIBOR6M + 0.83000%
|
2.070%
|
-
|
-
|
-
|
-
|
55
|
55
|
|
|
TELEF.
EMISIONES JANUARY 06 B
|
EUR
|
1 x EURIBOR3M + 0.70%
|
1.757%
|
-
|
-
|
-
|
-
|
24
|
24
|
|
|
TELEF.
EMISIONES NOVEMBER 11, 2019
|
EUR
|
4.693%
|
4.693%
|
-
|
-
|
-
|
-
|
1,750
|
1,750
|
|
|
EMTN GBP 12/09/2022 650 GBP
|
GBP
|
5.289%
|
5.289%
|
-
|
-
|
-
|
-
|
755
|
755
|
|
|
TELEF.
EMISIONES DECEMBER 09
|
EUR
|
1 x EURIBOR3M + 0.70%
|
1.722%
|
-
|
-
|
-
|
100
|
-
|
-
|
100
|
|
TELEF.
EMISIONES MARCH 10
|
EUR
|
3.406%
|
3.406%
|
-
|
-
|
-
|
1,400
|
1,400
|
||
|
TELEF.
EMISIONES APRIL 1, 2010
|
USD
|
2.582%
|
2.582%
|
-
|
898
|
-
|
-
|
-
|
898
|
|
|
TELEF.
EMISIONES APRIL 2, 2010
|
USD
|
3.729%
|
3.729%
|
-
|
-
|
-
|
674
|
-
|
674
|
|
|
TELEF.
EMISIONES APRIL 3, 2010
|
USD
|
5.134%
|
5.134%
|
-
|
-
|
-
|
-
|
1,048
|
1,048
|
|
|
TELEF.
EMISIONES SEPTEMBER 10
|
EUR
|
3.661%
|
3.661%
|
-
|
-
|
-
|
-
|
-
|
1,000
|
1,000
|
|
EMTN GBP 10/08/2029 400 GBP
|
GBP
|
5.445%
|
5.445%
|
-
|
-
|
-
|
-
|
-
|
465
|
465
|
|
Telefónica Emisiones, S.A.U.
|
2,998
|
620
|
3,345
|
4,285
|
3,409
|
13,503
|
28,160
|
|||
|
Total Telefónica, S.A. and instrumental companies
|
2,998
|
896
|
4,845
|
4,285
|
3,459
|
14,999
|
31,482
|
|||
|
Foreign operators
|
Maturity (nominal)
|
||||||||
|
Debentures and bonds
|
Currency
|
% Interest rate
|
2011
|
2012
|
2013
|
2014
|
2015
|
Subsequent years
|
Total
|
|
Marketable debentures
|
USD
|
8.850%
|
87
|
-
|
-
|
-
|
-
|
-
|
87
|
|
Telefónica Argentina, S.A.
|
87
|
-
|
-
|
-
|
-
|
-
|
87
|
||
|
Series F
|
UFC
|
6.00%
|
2
|
3
|
3
|
2
|
2
|
1
|
13
|
|
Series L
|
UFC
|
3.75%
|
-
|
103
|
-
|
-
|
-
|
-
|
103
|
|
Series N
|
UFC
|
3.50%
|
-
|
-
|
-
|
172
|
-
|
-
|
172
|
|
Series M
|
CLP
|
6.05%
|
-
|
-
|
-
|
33
|
-
|
-
|
33
|
|
Telefónica Chile, S.A.
|
2
|
106
|
3
|
207
|
2
|
1
|
321
|
||
|
Bond A
|
CLP
|
5.60%
|
-
|
-
|
-
|
51
|
-
|
-
|
51
|
|
USD bond
|
USD
|
2.875%
|
-
|
-
|
-
|
-
|
225
|
-
|
225
|
|
Telefónica Móviles Chile, S.A.
|
-
|
-
|
-
|
51
|
225
|
-
|
276
|
||
|
Series C
|
USD
|
8.50%
|
2
|
3
|
2
|
-
|
-
|
-
|
7
|
|
Series A
|
USD
|
7.75%
|
1
|
-
|
-
|
-
|
-
|
-
|
1
|
|
Series B
|
USD
|
8.00%
|
1
|
1
|
-
|
-
|
-
|
-
|
2
|
|
Commercial paper
|
USD
|
3.75%
|
4
|
-
|
-
|
-
|
-
|
-
|
4
|
|
Commercial paper
|
USD
|
3.80%
|
11
|
-
|
-
|
-
|
-
|
-
|
11
|
|
Otecel, S.A.
|
19
|
4
|
2
|
-
|
-
|
-
|
25
|
||
|
CB TELEFÓNICA FINANZAS MEXICO B
|
MXN
|
9.25%
|
-
|
212
|
-
|
-
|
-
|
-
|
212
|
|
T FINANZAS MEX EMISIÓN 0710 FIJ
|
MXN
|
8.07%
|
-
|
-
|
-
|
-
|
-
|
121
|
121
|
|
T. FINANZAS MEX EMISION 0710 VAR
|
MXN
|
TIIE28 + 55bps
|
-
|
-
|
-
|
242
|
-
|
-
|
242
|
|
Telefónica Finanzas México, S.A.
|
-
|
212
|
-
|
242
|
-
|
121
|
575
|
||
|
T. Peru 4th Program (4th Series A)
|
PEN
|
6.625%
|
-
|
22
|
-
|
-
|
-
|
-
|
22
|
|
T. Peru 4th Program (9th Series A)
|
PEN
|
6.9375%
|
15
|
-
|
-
|
-
|
-
|
-
|
15
|
|
T. Peru 4th Program (9th Series B)
|
PEN
|
6.375%
|
24
|
-
|
-
|
-
|
-
|
-
|
24
|
|
T. Peru 4th Program (10th Series A)
|
PEN
|
7.875%
|
-
|
8
|
-
|
-
|
-
|
-
|
8
|
|
T. Peru 4th Program (10th Series B)
|
PEN
|
6.4375%
|
-
|
14
|
-
|
-
|
-
|
-
|
14
|
|
T. Peru 4th Program (12th Series A)
|
PEN
|
VAC + 3.6875%
|
-
|
-
|
-
|
-
|
-
|
16
|
16
|
|
T. Peru 4th Program (14th Series B)
|
PEN
|
5.9380%
|
9
|
-
|
-
|
-
|
-
|
-
|
9
|
|
T. Peru 4th Program (14th Series C)
|
PEN
|
5.750%
|
12
|
-
|
-
|
-
|
-
|
-
|
12
|
|
T. Peru 4th Program (16th Series A)
|
PEN
|
6.000%
|
-
|
27
|
-
|
-
|
-
|
-
|
27
|
|
T. Peru 4th Program (16th Series B)
|
PEN
|
6.250%
|
-
|
-
|
8
|
-
|
-
|
-
|
8
|
|
T. Peru 4th Program (19th Series A)
|
PEN
|
VAC + 3.6250%
|
-
|
-
|
-
|
-
|
-
|
16
|
16
|
|
T. Peru 4th Program (19th Series B)
|
PEN
|
VAC + 2.8750%
|
-
|
-
|
-
|
-
|
-
|
13
|
13
|
|
T. Peru 4th Program (19th Series C)
|
PEN
|
VAC + 3.1875%
|
-
|
-
|
-
|
-
|
-
|
5
|
5
|
|
T. Peru 4th Program (36th Series A)
|
PEN
|
VAC + 3.6875%
|
-
|
-
|
-
|
-
|
-
|
40
|
40
|
|
T. Peru 4th Program (36th Series B)
|
PEN
|
VAC + 3.3750%
|
-
|
-
|
-
|
-
|
-
|
13
|
13
|
|
T. Peru 4th Program (37th Series A)
|
PEN
|
VAC + 3.1250%
|
-
|
-
|
-
|
-
|
-
|
13
|
13
|
|
T. Peru 4th Program (40th Series A)
|
PEN
|
5.875%
|
8
|
-
|
-
|
-
|
-
|
-
|
8
|
|
T. Peru 4th Program (40th Series B)
|
PEN
|
4.875%
|
4
|
-
|
-
|
-
|
-
|
-
|
4
|
|
T. Peru 4th Program (41st Series A)
|
PEN
|
7.9375%
|
-
|
4
|
-
|
-
|
-
|
-
|
4
|
|
T. Peru 4th Program (42nd Series A)
|
PEN
|
7.3750%
|
-
|
-
|
7
|
-
|
-
|
-
|
7
|
|
T. Peru 4th Program (42nd Series B)
|
PEN
|
5.3125%
|
-
|
-
|
5
|
-
|
-
|
-
|
5
|
|
T. Peru 4th Program (42nd Series C)
|
PEN
|
6.0625%
|
-
|
-
|
4
|
-
|
-
|
-
|
4
|
|
T. Peru 4th Program (45th Series A)
|
USD
|
6.685%
|
-
|
-
|
-
|
-
|
-
|
16
|
16
|
|
T. Peru 5th Program (1st Series A)
|
PEN
|
3.50%
|
8
|
-
|
-
|
-
|
-
|
-
|
8
|
|
Foreign operators
|
Maturity (nominal)
|
||||||||
|
Debentures and bonds
|
Currency
|
% Interest rate
|
2011
|
2012
|
2013
|
2014
|
2015
|
Subsequent years
|
Total
|
|
T. Peru 5th Program (1st Series B)
|
PEN
|
3.50%
|
7
|
-
|
-
|
-
|
-
|
-
|
7
|
|
T. Peru 5th Program (3rd Series A)
|
PEN
|
4.38%
|
-
|
8
|
-
|
-
|
-
|
-
|
8
|
|
T. Peru 5th Program (5th Series A)
|
PEN
|
6.1875%
|
-
|
-
|
6
|
-
|
-
|
-
|
6
|
|
T. Peru 5th Program (25th Series A)
|
PEN
|
4.3125%
|
-
|
5
|
-
|
-
|
-
|
-
|
5
|
|
T. Peru 5th Program (25th Series B)
|
PEN
|
4.3125%
|
-
|
3
|
-
|
-
|
-
|
-
|
3
|
|
T. Peru 5th Program (25th Series B)
|
PEN
|
7.50%
|
-
|
-
|
-
|
-
|
-
|
6
|
6
|
|
T. Peru 5th Program (33rd Series A)
|
PEN
|
6.8125%
|
-
|
-
|
-
|
-
|
-
|
16
|
16
|
|
T. Peru 5th Program (22nd Series A)
|
PEN
|
VAC + 3.5000%
|
-
|
-
|
-
|
-
|
-
|
16
|
16
|
|
T. Peru Senior Notes
|
PEN
|
8.000%
|
-
|
-
|
33
|
67
|
67
|
34
|
201
|
|
Telefónica del Perú, S.A.
|
87
|
91
|
63
|
67
|
67
|
204
|
579
|
||
|
T.M. Peru 1st Program (2nd Series A)
|
PEN
|
7.0625%
|
14
|
-
|
-
|
-
|
-
|
-
|
14
|
|
T.M. Peru 1st Program (2nd Series B)
|
PEN
|
7.5625%
|
7
|
-
|
-
|
-
|
-
|
-
|
7
|
|
T.M. Peru 1st Program (2nd Series C)
|
PEN
|
7.5625%
|
12
|
-
|
-
|
-
|
-
|
-
|
12
|
|
T.M. Peru 2nd Program (3rd Series A)
|
PEN
|
7.4375%
|
-
|
-
|
10
|
-
|
-
|
-
|
10
|
|
T.M. Peru 1st Program (3rd Series B)
|
PEN
|
7.6875%
|
-
|
-
|
5
|
-
|
-
|
-
|
5
|
|
T.M. Peru 1st Program (16th Series A)
|
PEN
|
8.1875%
|
-
|
-
|
6
|
-
|
-
|
-
|
6
|
|
T.M. Peru 1st Program (18th Series A)
|
PEN
|
6.3125%
|
-
|
-
|
-
|
11
|
-
|
-
|
11
|
|
T.M. Peru 1st Program (3rd Series B)
|
PEN
|
6.3750%
|
-
|
-
|
-
|
17
|
-
|
-
|
17
|
|
T. Peru 2nd Program (3rd Series A)
|
PEN
|
5.750%
|
-
|
-
|
7
|
-
|
-
|
-
|
7
|
|
T. Peru 2nd Program (9th Series A)
|
PEN
|
6.8125%
|
-
|
-
|
-
|
-
|
-
|
16
|
16
|
|
T. Peru 2nd Program (9th Series B)
|
PEN
|
6.3750%
|
-
|
-
|
-
|
-
|
-
|
13
|
13
|
|
T. Peru 2nd Program (11th Series A)
|
PEN
|
7.750%
|
-
|
-
|
-
|
-
|
-
|
19
|
19
|
|
Telefónica Móviles, S.A. (Peru)
|
33
|
-
|
28
|
28
|
-
|
48
|
137
|
||
|
Nonconvertible bonds
|
BRL
|
1.20 x CDI
|
90
|
-
|
-
|
-
|
-
|
-
|
90
|
|
Nonconvertible bonds
|
BRL
|
1.06 x CDI
|
-
|
153
|
-
|
-
|
-
|
-
|
153
|
|
Nonconvertible bonds
|
BRL
|
1.08 x CDI
|
-
|
44
|
-
|
-
|
-
|
-
|
44
|
|
Nonconvertible bonds
|
BRL
|
1.12 x CDI
|
-
|
-
|
287
|
-
|
-
|
-
|
287
|
|
Nonconvertible bonds
|
BRL
|
IPCA + 7%
|
-
|
-
|
-
|
32
|
-
|
-
|
32
|
|
Convertible bonds (Telemig)
|
BRL
|
IPCA + 0.5%
|
-
|
-
|
-
|
-
|
-
|
25
|
25
|
|
Vivo Participações, S.A.
|
90
|
197
|
287
|
32
|
-
|
25
|
631
|
||
|
O2 pounds sterling issue
|
GBP
|
7.625%
|
-
|
436
|
-
|
-
|
-
|
-
|
436
|
|
MMO2, Plc
|
-
|
436
|
-
|
-
|
-
|
-
|
436
|
||
|
Total Issues Other Operators
|
318
|
1,046
|
383
|
627
|
294
|
399
|
3,067
|
||
|
TOTAL OUTSTANDING DEBENTURES AND BONDS
|
3,316
|
1,942
|
5,228
|
4,912
|
3,753
|
15,398
|
34,549
|
||
The list and main features of outstanding debentures and bonds at December 31, 2009 were as follows (in millions of euros):
|
Telefónica and
its instrumental companies
|
Maturity (nominal)
|
|||||||||
|
Debentures and bonds
|
Currency
|
% Interest rate
|
Final rate
|
2010
|
2011
|
2012
|
2013
|
2014
|
Subsequent
|
Total
|
|
CAIXA 07/21/29 ZERO COUPON
|
EUR
|
6.39%
|
6.390%
|
-
|
-
|
-
|
-
|
-
|
57
|
57
|
|
ABN 15Y BOND
|
EUR
|
1.0225*GBSW10Y
|
3.80%
|
-
|
-
|
-
|
-
|
-
|
50
|
50
|
|
TELEFÓNICA FEBRUARY 90 F ZERO - 12.60%
|
EUR
|
12.6%
|
12.600%
|
4
|
-
|
-
|
-
|
-
|
-
|
4
|
|
TELEFÓNICA FEBRUARY 90 F ZERO
|
EUR
|
12.82%
|
12.820%
|
15
|
-
|
-
|
-
|
-
|
-
|
15
|
|
Telefónica, S.A.
|
19
|
-
|
-
|
-
|
-
|
107
|
126
|
|||
|
T. EUROPE BV SEP_00 GLOBAL C
|
USD
|
7.75%
|
7.750%
|
1,735
|
-
|
-
|
-
|
-
|
-
|
1,735
|
|
T. EUROPE BV SEP_00 GLOBAL D
|
USD
|
8.25%
|
8.250%
|
-
|
-
|
-
|
-
|
-
|
868
|
868
|
|
TEBV FEB_03 EMTN FIXED TRANCHE A
|
EUR
|
5.125%
|
5.125%
|
-
|
-
|
-
|
1,500
|
-
|
-
|
1,500
|
|
TEBV FEB_03 EMTN FIXED TRANCHE B
|
EUR
|
5.875%
|
5.875%
|
-
|
-
|
-
|
-
|
-
|
500
|
500
|
|
T.EUROPE BV JULY A 2007
|
JPY
|
2.11%
|
2.110%
|
-
|
-
|
113
|
-
|
-
|
-
|
113
|
|
T.EUROPE BV JULY B 2007
|
JPY
|
1 x JPYL6M + 0.40000%
|
1.060%
|
-
|
-
|
113
|
-
|
-
|
-
|
113
|
|
Telefónica Europe B.V.
|
1,735
|
-
|
226
|
1,500
|
-
|
1,368
|
4,829
|
|||
|
EMTN O2 EURO (I)
|
EUR
|
4.375%
|
4.375%
|
-
|
-
|
-
|
-
|
-
|
1,750
|
1,750
|
|
EMTN O2 EURO (II)
|
EUR
|
3.75%
|
3.750%
|
-
|
2,250
|
-
|
-
|
-
|
-
|
2,250
|
|
EMTN O2 GBP (I)
|
GBP
|
5.375%
|
5.375%
|
-
|
-
|
-
|
-
|
-
|
844
|
844
|
|
EMTN O2 GBP (II)
|
GBP
|
5.375%
|
5.375%
|
-
|
-
|
-
|
-
|
-
|
563
|
563
|
|
TELEF EMISIONES JUN 06 TRANCHE B
|
USD
|
5.984%
|
5.984%
|
-
|
694
|
-
|
-
|
-
|
-
|
694
|
|
TELEF EMISIONES JUN 06 TRANCHE C
|
USD
|
6.421%
|
6.421%
|
-
|
-
|
-
|
-
|
-
|
868
|
868
|
|
TELEF EMISIONES JUN 06 TRANCHE D
|
USD
|
7.045%
|
7.045%
|
-
|
-
|
-
|
-
|
-
|
1,388
|
1,388
|
|
TELEF EMISIONES JULY 06
|
EUR
|
1 x EURIBOR3M + 0.35000%
|
1.083%
|
1,250
|
-
|
-
|
-
|
-
|
-
|
1,250
|
|
TELEF EMISIONES SEPTEMBER 06
|
EUR
|
4.393%
|
4.393%
|
-
|
-
|
500
|
-
|
-
|
-
|
500
|
|
TELEF EMISIONES DECEMBER 06
|
GBP
|
5.888%
|
5.888%
|
-
|
-
|
-
|
-
|
563
|
-
|
563
|
|
TELEF EMISIONES JANUARY 06 A
|
EUR
|
1 x EURIBOR6M + 0.83000%
|
1.822%
|
-
|
-
|
-
|
-
|
-
|
55
|
55
|
|
TELEF EMISIONES JANUARY 06 B
|
EUR
|
1 x EURIBOR3M + 0.70000%
|
1.422%
|
-
|
-
|
-
|
-
|
-
|
24
|
24
|
|
TELEF EMISIONES FEBRUARY 07
|
EUR
|
4.674%
|
4.674%
|
-
|
-
|
-
|
-
|
1,500
|
-
|
1,500
|
|
TELEF EMISIONES JUNE A 07
|
CZK
|
1 x CZKPRIB_3M + 0.16000%
|
1.710%
|
91
|
-
|
-
|
-
|
-
|
-
|
91
|
|
TELEF EMISIONES JUNE B 07
|
CZK
|
4.351%
|
4.351%
|
-
|
-
|
113
|
-
|
-
|
-
|
113
|
|
TELEF EMISIONES JUNE C 07
|
CZK
|
4.623%
|
4.623%
|
-
|
-
|
-
|
-
|
98
|
-
|
98
|
|
TELEF EMISIONES JULY A 07
|
USD
|
5.855%
|
5.855%
|
-
|
-
|
-
|
521
|
-
|
-
|
521
|
|
TELEF EMISIONES JULY B 07
|
USD
|
1 x USDL3M + 0.33000%
|
0.609%
|
-
|
-
|
-
|
590
|
-
|
-
|
590
|
|
TELEF EMISIONES JULY C 07
|
USD
|
6.221%
|
6.221%
|
-
|
-
|
-
|
-
|
-
|
486
|
486
|
|
TELEF EMISIONES JUNE 08
|
EUR
|
5.58%
|
5.580%
|
-
|
-
|
-
|
1,250
|
-
|
-
|
1,250
|
|
TELEF EMISIONES FEBRUARY 09
|
EUR
|
5.431%
|
5.431%
|
-
|
-
|
-
|
-
|
2,000
|
-
|
2,000
|
|
TELEF EMISIONES APRIL 2016
|
EUR
|
5.4960%
|
5.496%
|
-
|
-
|
-
|
-
|
-
|
1,000
|
1,000
|
|
TELEF EMISIONES JUNE 2015
|
EUR
|
1 x EURIBOR3M + 1.825%
|
2.544%
|
-
|
-
|
-
|
-
|
-
|
400
|
400
|
|
TELEF EMISIONES APRIL 1, 2016
|
EUR
|
5.496%
|
5.496%
|
-
|
-
|
-
|
-
|
-
|
500
|
500
|
|
TELEF EMISIONES JULY 6, 2015
|
USD
|
4.949%
|
4.949%
|
-
|
-
|
-
|
-
|
-
|
868
|
868
|
|
TELEF EMISIONES JULY 15, 2019
|
USD
|
5.877%
|
5.877%
|
-
|
-
|
-
|
-
|
-
|
694
|
694
|
|
TELEF EMISIONES NOVEMBER 11, 2019
|
EUR
|
4.693%
|
4.693%
|
-
|
-
|
-
|
-
|
-
|
1,750
|
1,750
|
|
EMTN GBP 12/09/2022 650 GBP
|
GBP
|
5.289%
|
5.289%
|
-
|
-
|
-
|
-
|
-
|
732
|
732
|
|
TELEF EMISIONES DECEMBER 09
|
EUR
|
1 x EURIBOR3M + 0.70%
|
1.409%
|
-
|
-
|
-
|
-
|
100
|
-
|
100
|
|
Telefónica Emisiones S.A.U.
|
1,341
|
2,944
|
613
|
2,361
|
4,261
|
11,922
|
23,442
|
|||
|
Total Telefónica, S.A. and
its instrumental companies
|
3,095
|
2,944
|
839
|
3,861
|
4,261
|
13,397
|
28,397
|
|||
|
Foreign operators
|
|
Maturity
|
|||||||
|
Debentures and bonds
|
Currency
|
% Interest rate
|
2010
|
2011
|
2012
|
2013
|
2014
|
Subsequent years
|
Total
|
|
Marketable debentures
|
USD
|
9%
|
101
|
-
|
-
|
-
|
-
|
-
|
101
|
|
Marketable debentures
|
USD
|
8.85%
|
-
|
80
|
-
|
-
|
-
|
-
|
80
|
|
Telefónica Argentina, S.A.
|
101
|
80
|
-
|
-
|
-
|
-
|
181
|
||
|
Series F
|
UF
|
6.00%
|
2
|
2
|
2
|
2
|
2
|
3
|
13
|
|
Series L
|
UF
|
3.75%
|
-
|
-
|
86
|
-
|
-
|
-
|
86
|
|
Series M
|
CLP
|
6.05%
|
-
|
-
|
-
|
-
|
28
|
-
|
28
|
|
Series N
|
UF
|
3.50%
|
-
|
-
|
-
|
-
|
143
|
-
|
143
|
|
Telefónica de Chile, S.A.
|
2
|
2
|
88
|
2
|
173
|
3
|
270
|
||
|
Series A
|
CLP
|
5.60%
|
-
|
-
|
-
|
-
|
44
|
-
|
44
|
|
Telefónica Móviles Chile, S.A.
|
-
|
-
|
-
|
-
|
44
|
-
|
44
|
||
|
Series A
|
USD
|
7.75%
|
3
|
2
|
-
|
-
|
-
|
-
|
5
|
|
Series B
|
USD
|
8.00%
|
2
|
2
|
2
|
-
|
-
|
-
|
6
|
|
Series C
|
USD
|
8.50%
|
3
|
3
|
3
|
3
|
-
|
-
|
12
|
|
Otecel, S.A.
|
8
|
7
|
5
|
3
|
-
|
-
|
23
|
||
|
Peso bonds, Series A
|
MXN
|
CETES91 + 0.61%
|
425
|
-
|
-
|
-
|
-
|
-
|
425
|
|
Peso bonds, Series B
|
MXN
|
9.250%
|
-
|
-
|
186
|
-
|
-
|
-
|
186
|
|
Telefónica Finanzas México, S.A.
|
425
|
-
|
186
|
-
|
-
|
-
|
611
|
||
|
O2 pounds sterling issue
|
GBP
|
7.625%
|
-
|
-
|
422
|
-
|
-
|
-
|
422
|
|
MMO2, Plc.
|
-
|
-
|
422
|
-
|
-
|
-
|
422
|
||
|
T. Peru 3rd Program (1st Series)
|
PEN
|
VAC + 5.00%
|
12
|
-
|
-
|
-
|
-
|
-
|
12
|
|
T. Peru 4th Program (10th Series A)
|
PEN
|
7.8750%
|
-
|
-
|
7
|
-
|
-
|
-
|
7
|
|
T. Peru 4th Program (10th Series B)
|
PEN
|
6.4375%
|
-
|
-
|
12
|
-
|
-
|
-
|
12
|
|
T. Peru 4th Program (12th Series A)
|
PEN
|
VAC + 3.6875%
|
-
|
-
|
-
|
-
|
-
|
15
|
15
|
|
T. Peru 4th Program (14th Series A)
|
PEN
|
6.3750%
|
12
|
-
|
-
|
-
|
-
|
-
|
12
|
|
T. Peru 4th Program (14th Series B)
|
PEN
|
5.9375%
|
-
|
8
|
-
|
-
|
-
|
-
|
8
|
|
T. Peru 4th Program (14th Series C)
|
PEN
|
5.7500%
|
-
|
11
|
-
|
-
|
-
|
-
|
11
|
|
T. Peru 4th Program (16th Series A)
|
PEN
|
6.0000%
|
-
|
-
|
24
|
-
|
-
|
-
|
24
|
|
T. Peru 4th Program (16th Series B)
|
PEN
|
6.2500%
|
-
|
-
|
-
|
7
|
-
|
-
|
7
|
|
T. Peru 4th Program (19th Series A)
|
PEN
|
VAC + 3.6250%
|
-
|
-
|
-
|
-
|
-
|
15
|
15
|
|
T. Peru 4th Program (19th Series B)
|
PEN
|
VAC + 2.8750%
|
-
|
-
|
-
|
-
|
-
|
12
|
12
|
|
T. Peru 4th Program (19th Series C)
|
PEN
|
VAC + 3.1875%
|
-
|
-
|
-
|
-
|
-
|
5
|
5
|
|
T. Peru 4th Program (36th Series A)
|
PEN
|
VAC + 3.6875%
|
-
|
-
|
-
|
-
|
-
|
38
|
38
|
|
T. Peru 4th Program (36th Series B)
|
PEN
|
VAC + 3.3750%
|
-
|
-
|
-
|
-
|
-
|
13
|
13
|
|
T. Peru 4th Program (37th Series A)
|
PEN
|
VAC + 3.1250%
|
-
|
-
|
-
|
-
|
-
|
12
|
12
|
|
T. Peru 4th Program (4th Series A)
|
PEN
|
6.6250%
|
-
|
-
|
19
|
-
|
-
|
-
|
19
|
|
T. Peru 4th Program (40th Series A)
|
PEN
|
5.8750%
|
-
|
7
|
-
|
-
|
-
|
-
|
7
|
|
T. Peru 4th Program (40th Series B)
|
PEN
|
4.8750%
|
-
|
4
|
-
|
-
|
-
|
-
|
4
|
|
T. Peru 4th Program (41st Series A)
|
PEN
|
7.9375%
|
-
|
-
|
4
|
-
|
-
|
-
|
4
|
|
T. Peru 4th Program (42nd Series A)
|
PEN
|
7.3750%
|
-
|
-
|
-
|
6
|
-
|
-
|
6
|
|
T. Peru 4th Program (42nd Series B)
|
PEN
|
5.3125%
|
-
|
-
|
-
|
5
|
-
|
-
|
5
|
|
T. Peru 4th Program (42nd Series C)
|
PEN
|
6.0625%
|
-
|
-
|
-
|
3
|
-
|
-
|
3
|
|
T. Peru 4th Program (45th Series A)
|
USD
|
6.6875%
|
-
|
-
|
-
|
-
|
-
|
15
|
15
|
|
T. Peru 4th Program (7th Series C)
|
PEN
|
5.5625%
|
4
|
-
|
-
|
-
|
-
|
-
|
4
|
|
T. Peru 4th Program (8th Series A)
|
PEN
|
7.3750%
|
7
|
-
|
-
|
-
|
-
|
-
|
7
|
|
T. Peru 4th Program (8th Series B)
|
PEN
|
6.2500%
|
13
|
-
|
-
|
-
|
-
|
-
|
13
|
|
T. Peru 4th Program (9th Series A)
|
PEN
|
6.9375%
|
-
|
14
|
-
|
-
|
-
|
-
|
14
|
|
Foreign operators
|
|
Maturity
|
|||||||
|
Debentures and bonds
|
Currency
|
% Interest rate
|
2010
|
2011
|
2012
|
2013
|
2014
|
Subsequent years
|
Total
|
|
T. Peru 4th Program (9th Series B)
|
PEN
|
6.3750%
|
-
|
21
|
-
|
-
|
-
|
-
|
21
|
|
T. Peru 5th Program (1st Series A)
|
PEN
|
3.5000%
|
-
|
7
|
-
|
-
|
-
|
-
|
7
|
|
T. Peru 5th Program (1st Series B)
|
PEN
|
3.5000%
|
-
|
6
|
-
|
-
|
-
|
-
|
6
|
|
T. Peru 5th Program (22nd Series A)
|
PEN
|
VAC + 3.5000%
|
-
|
-
|
-
|
-
|
-
|
14
|
14
|
|
T. Peru 5th Program (3rd Series A)
|
PEN
|
4.3750%
|
-
|
-
|
7
|
-
|
-
|
-
|
7
|
|
T. Peru 5th Program (5th Series A)
|
PEN
|
6.1875%
|
-
|
-
|
-
|
5
|
-
|
-
|
5
|
|
T. Peru Senior Notes
|
PEN
|
8.0000%
|
-
|
-
|
-
|
30
|
60
|
91
|
181
|
|
Telefónica del Perú, S.A.A.
|
48
|
78
|
73
|
56
|
60
|
230
|
545
|
||
|
T.M. Peru 1st Program (16th Series A)
|
PEN
|
8.1875%
|
-
|
-
|
-
|
6
|
-
|
-
|
6
|
|
T.M. Peru 1st Program (18th Series A)
|
PEN
|
6.3125%
|
-
|
-
|
-
|
-
|
10
|
-
|
10
|
|
T.M. Peru 1st Program (3rd Series B)
|
PEN
|
6.3750%
|
-
|
-
|
-
|
-
|
15
|
-
|
15
|
|
T.M. Peru 1st Program (2nd Series A)
|
PEN
|
7.0625%
|
-
|
12
|
-
|
-
|
-
|
-
|
12
|
|
T.M. Peru 1st Program (2nd Series B)
|
PEN
|
7.5625%
|
-
|
6
|
-
|
-
|
-
|
-
|
6
|
|
T.M. Peru 1st Program (2nd Series C)
|
PEN
|
7.5625%
|
-
|
11
|
-
|
-
|
-
|
-
|
11
|
|
T.M. Peru 2nd Program (3rd Series A)
|
PEN
|
7.4375%
|
-
|
-
|
-
|
8
|
-
|
-
|
8
|
|
T.M. Peru 1st Program (3rd Series B)
|
PEN
|
7.6875%
|
-
|
-
|
-
|
5
|
-
|
-
|
5
|
|
T.M. Peru 1st Program (8th Series A)
|
PEN
|
6.4375%
|
11
|
-
|
-
|
-
|
-
|
-
|
11
|
|
Telefónica Móviles, S.A. (Peru)
|
11
|
29
|
-
|
19
|
25
|
-
|
84
|
||
|
Nonconvertible bonds
|
BRL
|
104.2% CDI
|
159
|
-
|
-
|
-
|
-
|
-
|
159
|
|
Nonconvertible bonds
|
BRL
|
1.20 x CDI
|
-
|
40
|
-
|
-
|
-
|
-
|
40
|
|
Nonconvertible bonds
|
BRL
|
1.1355 x CDI
|
42
|
-
|
-
|
-
|
-
|
-
|
42
|
|
Nonconvertible bonds
|
BRL
|
1.08 x CDI
|
-
|
-
|
20
|
-
|
-
|
-
|
20
|
|
Nonconvertible bonds
|
BRL
|
1.12 x CDI
|
-
|
-
|
-
|
128
|
-
|
-
|
128
|
|
Nonconvertible bonds
|
BRL
|
CPI-A + 7%
|
-
|
-
|
-
|
-
|
14
|
-
|
14
|
|
Convertible bonds (Telemig)
|
BRL
|
CPI-A + 0.5%
|
-
|
-
|
-
|
-
|
-
|
10
|
10
|
|
Vivo Participações, S.A.
|
201
|
40
|
20
|
128
|
14
|
10
|
413
|
||
|
Nonconvertible bonds
|
BRL
|
1 x CDI + 0.35000%
|
598
|
-
|
-
|
-
|
-
|
-
|
598
|
|
Telesp, S.A.
|
598
|
-
|
-
|
-
|
-
|
-
|
598
|
||
|
Total issues other operators
|
1,394
|
236
|
794
|
208
|
316
|
243
|
3,191
|
||
|
TOTAL OUTSTANDING DEBENTURES AND BONDS
|
4,489
|
3,180
|
1,633
|
4,069
|
4,577
|
13,640
|
31,588
|
||
The main debentures and bonds issued by the Group in 2010 are as follows:
|
Item
|
Date
|
Maturity
|
Nominal value
|
Currency of issuance
|
Interest rate
|
|
|
(millions)
)
|
(millions of euros) (1)
|
|||||
|
EMTN bonds
|
03-24-10
|
03-24-15
|
1,400
|
1,400
|
EUR
|
3.406%
|
|
09-19-10
|
09-18-17
|
1,000
|
1,000
|
EUR
|
3.661%
|
|
|
10-08-10
|
10-08-29
|
400
|
465
|
GBP
|
5.445%
|
|
|
SEC bond
|
04-26-10
|
04-26-13
|
1,200
|
898
|
USD
|
2.582%
|
|
04-26-10
|
04-27-15
|
900
|
674
|
USD
|
3.729%
|
|
|
04-26-10
|
04-27-20
|
1,400
|
1,048
|
USD
|
5.134%
|
|
|
Telefónica Emisiones, S.A.U.
|
||||||
|
SEC bond
|
11-09-10
|
11-09-15
|
300
|
225
|
USD
|
2.875%
|
|
Telefónica Móviles Chile, S.A.
|
||||||
|
Stock certificate
|
07-19-10
|
07-06-20
|
2,000
|
121
|
MXN
|
8.07%
|
|
07-19-10
|
07-14-14
|
4,000
|
242
|
MXN
|
TIIE28 + 55 bps
|
|
|
Telefónica Finanzas México, S.A. de CV.
|
||||||
|
Bond
|
04-23-10
|
04-23-12
|
20
|
5
|
PEN
|
4.313%
|
|
04-29-10
|
04-29-12
|
12
|
3
|
PEN
|
4.313%
|
|
|
06-18-10
|
06-18-16
|
23
|
6
|
PEN
|
7.5%
|
|
|
08-20-10
|
08-23-17
|
60
|
16
|
PEN
|
6.813%
|
|
|
Telefónica del Perú, S.A.A.
|
||||||
|
Bond
|
06-09-10
|
06-09-13
|
26
|
7
|
PEN
|
5.75%
|
|
06-09-10
|
06-09-17
|
70
|
19
|
PEN
|
7.75%
|
|
|
09-09-10
|
09-10-16
|
60
|
16
|
PEN
|
6.8125%
|
|
|
10-14-10
|
10-15-16
|
50
|
13
|
PEN
|
6.375%
|
|
|
Telefónica Móviles, S.A. (Perú)
|
||||||
|
11-19-10
|
11-13-11
|
20
|
15
|
USD
|
3.75%
|
|
|
Otecel, S.A.
|
||||||
|
(1) Exchange rate at December 31, 2010
|
||||||
The main debentures and bonds issued by the Group in 2009 are as follows:
|
Item
|
Date
|
Maturity
|
Nominal value
|
Currency of issuance
|
Interest rate
|
|
|
(millions)
|
(millions of euros) (1)
|
|||||
|
EMTN bonds
|
02-03-09
|
02/03/2014
|
2,000
|
2,000
|
EUR
|
5.431%
|
|
04-01-09
|
04/01/2016
|
1,000
|
1,000
|
EUR
|
5.496%
|
|
|
06-03-09
|
04/01/2016
|
500
|
500
|
EUR
|
5.496%
|
|
|
06-02-09
|
06/02/2015
|
400
|
400
|
EUR
|
3-month Euribor + 1.825%
|
|
|
11-10-09
|
11/11/2019
|
1,750
|
1,750
|
EUR
|
4.693%
|
|
|
12-10-09
|
12/09/2022
|
650
|
732
|
GBP
|
5.289%
|
|
|
12-23-09
|
12/23/2014
|
100
|
100
|
EUR
|
3-month Euribor + 0.70%
|
|
|
SEC bond
|
07-06-09
|
07/15/2019
|
1,000
|
694
|
USD
|
5.877%
|
|
07-06-09
|
01/15/2015
|
1,250
|
868
|
USD
|
4.949%
|
|
|
Telefónica Emisiones, S.A.U.
|
||||||
|
Debentures
|
01-16-09
|
01/11/2010
|
105
|
42
|
BRL
|
113.55% CDI
|
|
10-15-09
|
10/15/2019
|
49
|
20
|
BRL
|
108% CDI (until 15.10.12 (2))
|
|
|
10-15-09
|
10/15/2019
|
320
|
128
|
BRL
|
112% CDI (until 10/15/13 (2))
|
|
|
10-15-09
|
10/15/2019
|
36
|
14
|
BRL
|
HCPI + 7% (until 10/15/14 (2))
|
|
|
Vivo Participações, S.A.
|
||||||
|
Bonds
|
04-15-09
|
04/01/2014
|
5
|
143
|
UFC
|
3.50%
|
|
04-22-09
|
04/01/2014
|
20,500
|
28
|
CLP
|
6.05%
|
|
|
08-05-09
|
07/15/2014
|
32,000
|
44
|
CLP
|
5.60%
|
|
|
CTC Chile
|
||||||
|
Bonds
|
02-12-09
|
02/12/2012
|
16,675
|
4
|
PEN
|
7.9375%
|
|
03-27-09
|
03/27/2013
|
25
|
6
|
PEN
|
7.3750%
|
|
|
06-08-09
|
06/08/2013
|
14.3
|
3
|
PEN
|
6.0625%
|
|
|
06-08-09
|
06/08/2011
|
15.7
|
4
|
PEN
|
4.8750%
|
|
|
05-19-09
|
05/19/2011
|
30
|
7
|
PEN
|
5.8750%
|
|
|
05-19-09
|
05/19/2016
|
20.5
|
5
|
PEN
|
5.3125%
|
|
|
04-22-09
|
04/22/2013
|
22
|
15
|
USD
|
6.6875%
|
|
|
06-16-09
|
06/17/2013
|
21
|
5
|
PEN
|
6.1875%
|
|
|
10-20-09
|
10/20/2011
|
25
|
6
|
PEN
|
3.5%
|
|
|
10-20-09
|
10/20/2012
|
30
|
7
|
PEN
|
4.375%
|
|
|
10-07-09
|
10/07/2021
|
60
|
14
|
PEN
|
VAC + 3.5%
|
|
|
09-14-09
|
09/14/2011
|
30
|
7
|
PEN
|
3.50%
|
|
|
Telefónica de Perú, S.A.A.
|
||||||
|
Bonds
|
01-23-09
|
01/23/2013
|
23
|
6
|
PEN
|
8.1875%
|
|
09-22-09
|
09/23/2014
|
40
|
10
|
PEN
|
6.3125%
|
|
|
10-05-09
|
10/06/2014
|
62
|
15
|
PEN
|
6.375%
|
|
|
Telefónica Móviles, S.A. (Peru)
|
||||||
|
Securities
|
04-01-09 / 06-29-09
|
03/22/2011
|
15
|
7
|
USD
|
7.75%
|
|
04-01-09 / 06-10-09
|
03/16/2012
|
9
|
6
|
USD
|
8.00%
|
|
|
04-01-09
|
03/11/2013
|
20
|
14
|
USD
|
8.50%
|
|
|
Otecel, S.A.
|
||||||
|
(1) Exchange rate at December 31, 2009
|
|||||
|
(2) Date of renegotiation of certain conditions
|
|||||
APPENDIX III: FINANCIAL INSTRUMENTS
The detail of the type of financial instruments arranged by the Group (notional amount) by currency and interest rates at December 31, 2010 is as follows:
|
Fair value
|
||||||||||
|
Millions of Euros
|
2011
|
2012
|
2013
|
2014
|
2015
|
Subsequent
|
Total
|
Underlying debt
|
Associated derivatives
|
TOTAL
|
|
EURO
|
6,343
|
3,777
|
7,548
|
3,677
|
6,933
|
11,336
|
39,614
|
34,588
|
6,151
|
40,739
|
|
Floating rate
|
796
|
1,855
|
6,862
|
1,195
|
2,529
|
(5,177)
|
8,060
|
8,575
|
(784)
|
7,791
|
|
Spread - Ref Euribor
|
0.12%
|
0.59%
|
0.22%
|
0.04%
|
1.16%
|
11.70%
|
(6.81%)
|
|||
|
Fixed rate
|
5,547
|
(228)
|
(14)
|
2,482
|
4,404
|
15,263
|
27,454
|
21,870
|
6,648
|
28,518
|
|
Interest rate
|
(0.46%)
|
3.69%
|
(157%)
|
4.78%
|
3.24%
|
25.17%
|
14.86%
|
|||
|
Rate cap
|
-
|
2,150
|
700
|
-
|
-
|
1,250
|
4,100
|
4,143
|
287
|
4,430
|
|
OTHER EUROPEAN CURRENCIES
|
(469)
|
1,324
|
170
|
919
|
164
|
3,377
|
5,485
|
3,882
|
1,589
|
5,471
|
|
Instruments in CZK
|
646
|
242
|
164
|
338
|
164
|
-
|
1,554
|
45
|
1,527
|
1,572
|
|
Floating rate
|
-
|
116
|
164
|
-
|
164
|
-
|
444
|
-
|
446
|
446
|
|
Spread
|
-
|
(0.00%)
|
(0.09%)
|
-
|
(0.02%)
|
-
|
(0.04%)
|
|||
|
Fixed rate
|
646
|
126
|
-
|
338
|
-
|
-
|
1,110
|
45
|
1,081
|
1,126
|
|
Interest rate
|
1.81%
|
4.17%
|
-
|
3.84%
|
-
|
-
|
2.69%
|
|||
|
Rate cap
|
-
|
-
|
-
|
-
|
-
|
-
|
-
|
-
|
-
|
-
|
|
Instruments in GBP
|
(1,115)
|
1,082
|
6
|
581
|
-
|
3,377
|
3,931
|
3,837
|
62
|
3,899
|
|
Floating rate
|
-
|
238
|
-
|
581
|
-
|
1,340
|
2,159
|
101
|
1,818
|
1,919
|
|
Spread
|
-
|
0.27%
|
-
|
-
|
-
|
-
|
0.03%
|
|||
|
Fixed rate
|
(1,115)
|
437
|
6
|
-
|
-
|
1,921
|
1,249
|
3,210
|
(1,874)
|
1,336
|
|
Interest rate
|
(1.99%)
|
7.57%
|
6.44%
|
-
|
-
|
17.33%
|
31.12%
|
|||
|
Rate cap
|
-
|
407
|
-
|
-
|
-
|
116
|
523
|
526
|
118
|
644
|
|
AMERICA
|
(1,035)
|
1,639
|
1,982
|
1,317
|
830
|
5,006
|
9,739
|
17,237
|
(8,700)
|
8,537
|
|
Instruments in USD
|
(257)
|
10
|
650
|
36
|
27
|
1,270
|
1,736
|
12,880
|
(11,715)
|
1,165
|
|
Floating rate
|
(153)
|
93
|
480
|
68
|
(73)
|
(86)
|
329
|
1,950
|
(1,787)
|
163
|
|
Spread
|
1.84%
|
0.80%
|
0.69%
|
0.76%
|
(0.56%)
|
0.53%
|
0.53%
|
|||
|
Fixed rate
|
(114)
|
(93)
|
160
|
(42)
|
90
|
1,344
|
1,345
|
10,867
|
(9,931)
|
936
|
|
Interest rate
|
(23.54%)
|
3.93%
|
7.83%
|
1.05%
|
27.27%
|
(86.84%)
|
(82.40%)
|
|||
|
Rate cap
|
10
|
10
|
10
|
10
|
10
|
12
|
62
|
63
|
3
|
66
|
|
Instruments in UYU
|
(48)
|
-
|
-
|
-
|
-
|
-
|
(48)
|
2
|
-
|
2
|
|
Floating rate
|
-
|
-
|
-
|
-
|
-
|
-
|
-
|
|||
|
Spread
|
-
|
-
|
-
|
-
|
-
|
-
|
-
|
|||
|
Fixed rate
|
(48)
|
-
|
-
|
-
|
-
|
-
|
(48)
|
2
|
-
|
2
|
|
Interest rate
|
3.40%
|
-
|
-
|
-
|
-
|
-
|
3.40%
|
-
|
-
|
|
|
Rate cap
|
-
|
-
|
-
|
-
|
-
|
-
|
-
|
-
|
-
|
-
|
|
Instruments in ARS
|
399
|
-
|
-
|
-
|
-
|
15
|
414
|
139
|
252
|
391
|
|
Floating rate
|
-
|
-
|
-
|
-
|
-
|
-
|
-
|
-
|
-
|
-
|
|
Spread
|
-
|
-
|
-
|
-
|
-
|
-
|
-
|
|||
|
Fixed rate
|
399
|
-
|
-
|
-
|
-
|
15
|
414
|
139
|
252
|
391
|
|
Interest rate
|
13.29%
|
-
|
-
|
-
|
-
|
-
|
12.77%
|
|||
|
Rate cap
|
-
|
-
|
-
|
-
|
-
|
-
|
-
|
-
|
-
|
-
|
|
Instruments in BRL
|
(1,127)
|
662
|
856
|
406
|
299
|
125
|
1,221
|
582
|
674
|
1,256
|
|
Floating rate
|
(1,608)
|
336
|
460
|
203
|
234
|
34
|
(341)
|
(636)
|
388
|
(248)
|
|
Spread
|
(0.90%)
|
3.89%
|
3.28%
|
5.57%
|
1.26%
|
-
|
(16.67%)
|
|||
|
Fixed rate
|
481
|
326
|
396
|
203
|
65
|
91
|
1,562
|
1,218
|
286
|
1,504
|
|
Interest rate
|
7.53%
|
7.60%
|
4.61%
|
7.58%
|
7.77%
|
27.24%
|
7.98%
|
|||
|
Rate cap
|
-
|
-
|
-
|
-
|
-
|
-
|
-
|
-
|
-
|
-
|
|
Instruments in CLP
|
(64)
|
225
|
110
|
312
|
283
|
-
|
866
|
(129)
|
795
|
666
|
|
Floating rate
|
(56)
|
85
|
24
|
33
|
283
|
-
|
369
|
87
|
689
|
776
|
|
Spread
|
(2.53%)
|
1.63%
|
1.48%
|
-
|
0.98%
|
-
|
1.60%
|
|||
|
Fixed rate
|
(8)
|
140
|
86
|
279
|
-
|
-
|
497
|
(216)
|
106
|
(110)
|
|
Interest rate
|
(24.06%)
|
3.86%
|
3.66%
|
-
|
-
|
-
|
5.47%
|
|||
|
Rate cap
|
-
|
-
|
-
|
-
|
-
|
-
|
-
|
-
|
-
|
-
|
|
Instruments in UFC
|
3
|
2
|
2
|
2
|
2
|
2
|
13
|
197
|
121
|
318
|
|
Floating rate
|
-
|
-
|
-
|
-
|
-
|
-
|
-
|
-
|
-
|
-
|
|
Spread
|
-
|
-
|
-
|
-
|
-
|
-
|
-
|
|||
|
Fixed rate
|
3
|
2
|
2
|
2
|
2
|
2
|
13
|
197
|
121
|
318
|
|
Interest rate
|
40.94%
|
7.45%
|
6.00%
|
5.43%
|
6.00%
|
6.00%
|
13.62%
|
|||
|
Rate cap
|
-
|
-
|
-
|
-
|
-
|
-
|
-
|
-
|
-
|
-
|
|
Instruments in PEN
|
60
|
152
|
144
|
124
|
77
|
360
|
917
|
1,130
|
125
|
1,255
|
|
Floating rate
|
-
|
-
|
-
|
-
|
-
|
-
|
-
|
-
|
-
|
-
|
|
Spread
|
-
|
-
|
-
|
-
|
-
|
-
|
-
|
|||
|
Fixed rate
|
60
|
152
|
144
|
124
|
77
|
360
|
917
|
1,130
|
125
|
1,255
|
|
Interest rate
|
18.68%
|
6.23%
|
6.73%
|
6.58%
|
7.95%
|
31.05%
|
17.06%
|
|||
|
Rate cap
|
-
|
-
|
-
|
-
|
-
|
-
|
-
|
-
|
-
|
-
|
|
Instruments in COP
|
551
|
322
|
154
|
135
|
26
|
5
|
1,193
|
561
|
715
|
1,276
|
|
Floating rate
|
147
|
124
|
129
|
110
|
26
|
5
|
541
|
584
|
-
|
584
|
|
Fair value
|
||||||||||
|
Millions of Euros
|
2011
|
2012
|
2013
|
2014
|
2015
|
Subsequent
|
Total
|
Underlying debt
|
Associated derivatives
|
TOTAL
|
|
Spread
|
2.22%
|
3.10%
|
3.11%
|
3.14%
|
3.00%
|
3.00%
|
2.86%
|
|||
|
Fixed rate
|
404
|
198
|
25
|
25
|
-
|
-
|
652
|
(23)
|
715
|
692
|
|
Interest rate
|
2.42%
|
8.43%
|
7.09%
|
7.09%
|
-
|
-
|
4.60%
|
|||
|
Rate cap
|
-
|
-
|
-
|
-
|
-
|
-
|
-
|
-
|
-
|
-
|
|
Instruments in UVR
|
7
|
-
|
-
|
-
|
52
|
2,523
|
2,582
|
2,582
|
-
|
2,582
|
|
Floating rate
|
-
|
-
|
-
|
-
|
-
|
-
|
-
|
-
|
-
|
-
|
|
Spread
|
-
|
-
|
-
|
-
|
-
|
-
|
-
|
|||
|
Fixed rate
|
7
|
-
|
-
|
-
|
52
|
2,523
|
2,582
|
2,582
|
-
|
2,582
|
|
Interest rate
|
12.38%
|
-
|
-
|
-
|
12.38%
|
74.28%
|
72.88%
|
|||
|
Rate cap
|
-
|
-
|
-
|
-
|
-
|
-
|
-
|
-
|
-
|
-
|
|
Instruments in VEB
|
(1,082)
|
-
|
-
|
-
|
-
|
-
|
(1,082)
|
(1,084)
|
-
|
(1,084)
|
|
Floating rate
|
-
|
-
|
-
|
-
|
-
|
-
|
-
|
-
|
-
|
-
|
|
Spread
|
-
|
-
|
-
|
-
|
-
|
-
|
-
|
|||
|
Fixed rate
|
(1,082)
|
-
|
-
|
-
|
-
|
-
|
(1,082)
|
(1,084)
|
-
|
(1,084)
|
|
Interest rate
|
1.66%
|
-
|
-
|
-
|
-
|
-
|
1.66%
|
-
|
-
|
|
|
Rate cap
|
-
|
-
|
-
|
-
|
-
|
-
|
-
|
-
|
-
|
-
|
|
Instruments in UDI
|
45
|
48
|
60
|
54
|
58
|
492
|
757
|
-
|
(246)
|
(246)
|
|
Floating rate
|
45
|
48
|
60
|
54
|
58
|
492
|
757
|
-
|
(246)
|
(246)
|
|
Spread
|
3.56%
|
3.52%
|
3.12%
|
3.09%
|
3.09%
|
2.98%
|
3,07%
|
|||
|
Fixed rate
|
-
|
-
|
-
|
-
|
-
|
-
|
-
|
-
|
-
|
-
|
|
Interest rate
|
-
|
-
|
-
|
-
|
-
|
-
|
-
|
-
|
-
|
|
|
Rate cap
|
-
|
-
|
-
|
-
|
-
|
-
|
-
|
-
|
-
|
-
|
|
Instruments in MXN
|
484
|
218
|
6
|
248
|
6
|
214
|
1,176
|
377
|
579
|
956
|
|
Floating rate
|
(70)
|
-
|
-
|
242
|
-
|
87
|
259
|
17
|
-
|
17
|
|
Spread
|
0.45%
|
-
|
-
|
0.55%
|
-
|
0.46%
|
0.55%
|
|||
|
Fixed rate
|
554
|
218
|
6
|
6
|
6
|
127
|
917
|
360
|
579
|
939
|
|
Interest rate
|
3.57%
|
9.10%
|
4.00%
|
4.00%
|
4.00%
|
5.16%
|
5.11%
|
|||
|
Rate cap
|
-
|
-
|
-
|
-
|
-
|
-
|
-
|
-
|
-
|
-
|
|
Instruments in GTQ
|
(6)
|
-
|
-
|
-
|
-
|
-
|
(6)
|
-
|
-
|
-
|
|
Floating rate
|
(6)
|
-
|
-
|
-
|
-
|
-
|
(6)
|
-
|
-
|
-
|
|
Spread
|
-
|
-
|
-
|
-
|
-
|
-
|
-
|
|||
|
Fixed rate
|
-
|
-
|
-
|
-
|
-
|
-
|
-
|
-
|
-
|
-
|
|
Interest rate
|
-
|
-
|
-
|
-
|
-
|
-
|
-
|
|||
|
Rate cap
|
-
|
-
|
-
|
-
|
-
|
-
|
-
|
-
|
-
|
|
|
ASIA
|
(1)
|
-
|
-
|
-
|
-
|
-
|
(1)
|
295
|
(301)
|
(6)
|
|
Instruments in JPY
|
(1)
|
-
|
-
|
-
|
-
|
-
|
(1)
|
295
|
(301)
|
(6)
|
|
Floating rate
|
-
|
-
|
-
|
-
|
-
|
-
|
-
|
138
|
(138)
|
-
|
|
Spread
|
-
|
-
|
-
|
-
|
-
|
-
|
-
|
|||
|
Fixed rate
|
(1)
|
-
|
-
|
-
|
-
|
-
|
(1)
|
157
|
(163)
|
(6)
|
|
Interest rate
|
(0.04%)
|
-
|
-
|
-
|
-
|
-
|
(0.04%)
|
|||
|
Rate cap
|
-
|
-
|
-
|
-
|
-
|
-
|
-
|
-
|
-
|
-
|
|
TOTAL:
|
4,838
|
6,740
|
9,700
|
5,913
|
7,927
|
19,719
|
54,837
|
56,002
|
(1,261)
|
54,741
|
|
Floating rate
|
(905)
|
2,895
|
8,179
|
2,486
|
3,221
|
(3,305)
|
12,571
|
10,816
|
386
|
11,202
|
|
Fixed rate
|
5,733
|
1,278
|
811
|
3,417
|
4,696
|
21,646
|
37,581
|
40,454
|
(2,055)
|
38,399
|
|
Rate cap
|
10
|
2,567
|
710
|
10
|
10
|
1,378
|
4,685
|
4,732
|
408
|
5,140
|
|
Currency options
|
(175)
|
|||||||||
|
Other
|
931
|
|||||||||
The table below is an extract of the previous table that shows the sensitivity to interest rates originated by the Group’s position on interest rate swaps categorized into instruments entered into for trading purposes and instruments entered into for purposes other than trading purposes at December 31, 2010:
|
INTEREST RATE SWAPS
|
||||||||
|
Maturity
|
||||||||
|
2011
|
2012
|
2013
|
2014
|
2015
|
Subsequent
|
TOTAL
|
Fair value
|
|
|
Millions of euros
|
||||||||
|
TRADING PURPOSES
|
(88)
|
|||||||
|
EUR
|
-
|
-
|
-
|
-
|
-
|
-
|
-
|
3
|
|
Fixed to fixed
|
-
|
-
|
-
|
(35)
|
(20)
|
-
|
(55)
|
(50)
|
|
Receiving leg
|
-
|
-
|
-
|
-
|
-
|
-
|
-
|
|
|
Average interest rate
|
-
|
-
|
-
|
35
|
20
|
-
|
55
|
53
|
|
Paying leg
|
-
|
-
|
-
|
1.12%
|
1.63%
|
-
|
1.31%
|
|
|
Average spread
|
-
|
-
|
-
|
-
|
-
|
-
|
-
|
(308)
|
|
Fixed to floating
|
(1,685)
|
(420)
|
(1,250)
|
(1,255)
|
(575)
|
(2,359)
|
(7,544)
|
(6,141)
|
|
Receiving leg
|
4.62%
|
4.25%
|
3.46%
|
2.50%
|
3.57%
|
3.37%
|
3.59%
|
|
|
Average interest rate
|
1,685
|
420
|
1,250
|
1,255
|
575
|
2,359
|
7,544
|
5,833
|
|
Paying leg
|
0.00%
|
0.00%
|
0.95%
|
1.56%
|
0.77%
|
2.45%
|
1.24%
|
|
|
Average spread
|
-
|
-
|
-
|
-
|
-
|
-
|
-
|
218
|
|
Floating to fixed
|
(5,327)
|
(175)
|
(710)
|
(1,000)
|
-
|
(2,185)
|
(9,397)
|
(8,812)
|
|
Receiving leg
|
0.00%
|
0.00%
|
2.00%
|
0.00%
|
-
|
0.00%
|
0.15%
|
|
|
Average spread
|
5,327
|
175
|
710
|
1,000
|
-
|
2,185
|
9,397
|
9,030
|
|
Paying leg
|
1.03%
|
2.17%
|
2.35%
|
3.43%
|
-
|
3.32%
|
1.94%
|
|
|
Average interest rate
|
-
|
-
|
-
|
-
|
-
|
-
|
-
|
(1)
|
|
Floating to floating
|
-
|
-
|
-
|
-
|
(50)
|
-
|
(50)
|
(52)
|
|
Receiving leg
|
-
|
-
|
-
|
-
|
-
|
-
|
-
|
|
|
Average interest rate
|
-
|
-
|
-
|
-
|
50
|
-
|
50
|
51
|
|
Paying leg
|
-
|
-
|
-
|
-
|
-
|
-
|
-
|
|
|
Average spread
|
-
|
-
|
-
|
-
|
-
|
-
|
-
|
6
|
|
USD
|
-
|
-
|
-
|
-
|
-
|
-
|
-
|
(13)
|
|
Fixed to floating
|
(68)
|
-
|
-
|
-
|
(37)
|
(322)
|
(427)
|
(440)
|
|
Receiving leg
|
3.08%
|
-
|
-
|
-
|
0.00%
|
3.26%
|
2.95%
|
|
|
Average interest rate
|
68
|
-
|
-
|
-
|
37
|
322
|
427
|
427
|
|
Paying leg
|
-
|
-
|
-
|
-
|
1.04%
|
-
|
0.09%
|
|
|
Average spread
|
-
|
-
|
-
|
-
|
-
|
-
|
-
|
19
|
|
Floating to fixed
|
(206)
|
(67)
|
(449)
|
-
|
(102)
|
(876)
|
(1,700)
|
(633)
|
|
Receiving leg
|
0.35%
|
3.99%
|
3.61%
|
-
|
-
|
-
|
1.15%
|
|
|
Average spread
|
206
|
67
|
449
|
-
|
102
|
876
|
1,700
|
652
|
|
Paying leg
|
0.50%
|
-
|
-
|
-
|
2.52%
|
3.54%
|
2.03%
|
-
|
|
NON TRADING PURPOSES
|
||||||||
|
EUR
|
-
|
-
|
-
|
-
|
-
|
-
|
-
|
(784)
|
|
Fixed to floating
|
-
|
-
|
-
|
-
|
-
|
-
|
-
|
(661)
|
|
Receiving leg
|
(2,039)
|
(504)
|
(1,654)
|
(3,055)
|
(1,005)
|
(3,318)
|
(11,575)
|
(12,218)
|
|
Average interest rate
|
3.23%
|
3.50%
|
3.77%
|
4.69%
|
3.33%
|
3.47%
|
3.78%
|
|
|
Paying leg
|
2,039
|
504
|
1,654
|
3,055
|
1,005
|
3,318
|
11,575
|
11,557
|
|
Average spread
|
0.80%
|
0.01%
|
0.05%
|
0.03%
|
0.01%
|
0.00%
|
0.16%
|
|
|
Floating to fixed
|
-
|
-
|
-
|
-
|
-
|
-
|
-
|
(123)
|
|
Receiving leg
|
(11,699)
|
(556)
|
(550)
|
(2,230)
|
(5,412)
|
(11,832)
|
(32,279)
|
(15,695)
|
|
Average spread
|
0.19%
|
-
|
-
|
3.48%
|
2.35%
|
-
|
0.70%
|
|
|
Paying leg
|
11,699
|
556
|
550
|
2,230
|
5,412
|
11,832
|
32,279
|
15,572
|
|
Average interest rate
|
2.64%
|
2.82%
|
3.74%
|
-
|
1.09%
|
3.72%
|
3.01%
|
-
|
|
USD
|
-
|
-
|
-
|
-
|
-
|
-
|
-
|
(880)
|
|
Fixed to floating
|
-
|
-
|
-
|
-
|
-
|
-
|
-
|
(928)
|
|
Receiving leg
|
(776)
|
(42)
|
(1,501)
|
(42)
|
(1,875)
|
(4,891)
|
(9,127)
|
(9,539)
|
|
Average interest rate
|
-
|
3.90%
|
-
|
5.52%
|
-
|
4.84%
|
2.64%
|
|
|
Paying leg
|
776
|
42
|
1,501
|
42
|
1,875
|
4,891
|
9,127
|
8,611
|
|
Average spread
|
-
|
-
|
-
|
-
|
-
|
|||
|
Floating to fixed
|
-
|
-
|
-
|
-
|
-
|
-
|
-
|
48
|
|
Receiving leg
|
(28)
|
(28)
|
(664)
|
(28)
|
(28)
|
(28)
|
(804)
|
(802)
|
|
Average spread
|
-
|
-
|
-
|
-
|
-
|
-
|
-
|
|
|
Paying leg
|
28
|
28
|
664
|
28
|
28
|
28
|
804
|
850
|
|
Average interest rate
|
4.34%
|
4.34%
|
4.34%
|
3.35%
|
4.34%
|
4.34%
|
4.31%
|
-
|
|
MXN
|
-
|
-
|
-
|
-
|
-
|
-
|
-
|
(1)
|
|
Floating to fixed
|
-
|
-
|
-
|
-
|
-
|
-
|
-
|
(1)
|
|
Receiving leg
|
(85)
|
-
|
-
|
-
|
-
|
(121)
|
(206)
|
(69)
|
|
Average spread
|
0.61%
|
0.25%
|
-
|
|||||
|
Paying leg
|
85
|
-
|
-
|
-
|
-
|
121
|
206
|
68
|
|
Average interest rate
|
8.16%
|
3.37%
|
-
|
|||||
|
GBP
|
-
|
-
|
-
|
-
|
-
|
-
|
-
|
2
|
|
Fixed to floating
|
-
|
-
|
-
|
-
|
-
|
-
|
-
|
(64)
|
|
Receiving leg
|
-
|
-
|
-
|
(581)
|
-
|
(1,220)
|
(1,801)
|
(1,867)
|
|
Average interest rate
|
5.25%
|
-
|
3.92%
|
2.66%
|
-
|
|||
|
Paying leg
|
-
|
-
|
-
|
581
|
-
|
1,220
|
1,801
|
1,803
|
|
Average spread
|
-
|
1.64%
|
1.11%
|
-
|
||||
|
Floating to fixed
|
-
|
-
|
-
|
-
|
-
|
-
|
-
|
66
|
|
Receiving leg
|
(628)
|
-
|
-
|
-
|
-
|
(470)
|
(1,098)
|
(1,099)
|
|
Average spread
|
-
|
-
|
-
|
-
|
||||
|
Paying leg
|
628
|
-
|
-
|
-
|
-
|
470
|
1,098
|
1,165
|
|
Average interest rate
|
5.12%
|
4.96%
|
2.13%
|
-
|
||||
|
JPY
|
-
|
-
|
-
|
-
|
-
|
-
|
-
|
(4)
|
|
Fixed to floating
|
-
|
-
|
-
|
-
|
-
|
-
|
-
|
(4)
|
|
Receiving leg
|
-
|
-
|
(138)
|
-
|
-
|
-
|
(138)
|
(142)
|
|
Average interest rate
|
1.68%
|
1.68%
|
-
|
|||||
|
Paying leg
|
-
|
-
|
138
|
-
|
-
|
-
|
138
|
138
|
|
Average spread
|
-
|
-
|
-
|
-
|
||||
|
CLP
|
-
|
-
|
-
|
-
|
-
|
-
|
-
|
(35)
|
|
Fixed to floating
|
-
|
-
|
-
|
-
|
-
|
-
|
-
|
1
|
|
Receiving leg
|
-
|
-
|
(24)
|
(33)
|
-
|
-
|
(57)
|
(56)
|
|
Average interest rate
|
4.12%
|
4.51%
|
-
|
2.39%
|
-
|
|||
|
Paying leg
|
-
|
-
|
24
|
33
|
-
|
-
|
57
|
57
|
|
Average spread
|
-
|
-
|
-
|
-
|
||||
|
Floating to fixed
|
-
|
-
|
-
|
-
|
-
|
-
|
-
|
(36)
|
|
Receiving leg
|
(297)
|
(60)
|
(110)
|
-
|
-
|
-
|
(467)
|
(355)
|
|
Average spread
|
1.55%
|
-
|
-
|
-
|
0.98%
|
-
|
||
|
Paying leg
|
297
|
60
|
110
|
-
|
-
|
-
|
467
|
319
|
|
Average interest rate
|
-
|
1.82%
|
3.74%
|
1.11%
|
-
|
Foreign exchange and interest rate options, by maturity, at December 31, 2010 are as follows:
|
CURRENCY OPTIONS
|
||||||
|
MATURITIES
|
||||||
|
2011
|
2012
|
2013
|
2014
|
2015
|
Subsequent
|
|
|
Put USD / Call EUR
|
||||||
|
Notional amount of options bought
|
217
|
-
|
154
|
-
|
186
|
1,609
|
|
Strike
|
1.59%
|
-
|
1.49%
|
-
|
1.54%
|
1.38%
|
|
Notional amount of options sold
|
195
|
-
|
-
|
-
|
-
|
831
|
|
Strike
|
1.49%
|
-
|
-
|
-
|
-
|
1.20%
|
|
INTEREST RATE OPTIONS
|
|||||
|
MATURITIES
|
|||||
|
Figures in euros
|
2011
|
2012
|
2013
|
2014
|
Subsequent
|
|
Collars
|
|||||
|
Notional amount of options bought
|
-
|
1,406,622,132
|
-
|
-
|
2,179,179,407
|
|
Strike Cap
|
-
|
4.718%
|
-
|
-
|
4.63%
|
|
Strike Floor
|
-
|
3.204%
|
-
|
-
|
3.48%
|
|
Caps
|
|||||
|
Notional amount of options bought
|
-
|
4,430,888,760
|
-
|
-
|
-
|
|
Strike
|
-
|
4.031%
|
-
|
-
|
-
|
|
Notional amount of options sold
|
-
|
5,837,510,892
|
-
|
-
|
2,179,179,407
|
|
Strike
|
-
|
3.669%
|
-
|
-
|
5.032%
|
|
Floors
|
|||||
|
Notional amount of options bought
|
-
|
1,706,622,132
|
-
|
-
|
2,121,333,140
|
|
Strike
|
-
|
0.764%
|
-
|
-
|
0.786%
|
|
Notional amount of options sold
|
-
|
700,000,000
|
-
|
-
|
-
|
|
Strike
|
-
|
2.147%
|
-
|
-
|
-
|
Cash flows receivable or payable on derivative financial instruments settled via the swap of nominals, by currency of collection/payment, along with contractual maturities are as follows:
|
Millions of euros
|
2011
|
2012
|
2013
|
2014
|
2015
|
Subsequent
|
Total
|
|
|
Currency swaps
|
||||||||
|
Receive
|
ARS
|
-
|
-
|
-
|
-
|
-
|
-
|
-
|
|
Pay
|
ARS
|
(54)
|
-
|
-
|
-
|
-
|
-
|
(54)
|
|
Receive
|
BRL
|
75
|
-
|
-
|
-
|
-
|
-
|
75
|
|
Pay
|
BRL
|
(202)
|
(73)
|
(5)
|
(84)
|
(199)
|
-
|
(563)
|
|
Receive
|
CLP
|
204
|
95
|
110
|
-
|
284
|
-
|
693
|
|
Pay
|
CLP
|
(408)
|
(271)
|
(221)
|
(228)
|
(565)
|
-
|
(1,693)
|
|
Receive
|
COP
|
-
|
-
|
-
|
-
|
-
|
-
|
-
|
|
Pay
|
COP
|
(198)
|
(198)
|
(25)
|
(25)
|
-
|
-
|
(446)
|
|
Receive
|
CZK
|
-
|
-
|
-
|
-
|
-
|
-
|
-
|
|
Pay
|
CZK
|
(117)
|
(117)
|
(164)
|
(235)
|
(164)
|
-
|
(797)
|
|
Receive
|
EUR
|
978
|
323
|
160
|
281
|
163
|
588
|
2,493
|
|
Pay
|
EUR
|
(870)
|
(485)
|
(2,928)
|
(41)
|
(3,145)
|
(8,286)
|
(15,755)
|
|
Receive
|
GBP
|
-
|
-
|
-
|
-
|
-
|
-
|
-
|
|
Pay
|
GBP
|
(628)
|
-
|
-
|
-
|
-
|
(470)
|
(1,098)
|
|
Receive
|
JPY
|
18
|
552
|
-
|
-
|
-
|
138
|
708
|
|
Pay
|
JPY
|
-
|
-
|
-
|
-
|
-
|
-
|
-
|
|
Receive
|
MAD
|
-
|
89
|
-
|
-
|
-
|
-
|
89
|
|
Pay
|
MAD
|
-
|
(89)
|
-
|
-
|
-
|
-
|
(89)
|
|
Receive
|
MXN
|
-
|
-
|
-
|
-
|
-
|
-
|
-
|
|
Pay
|
MXN
|
(12)
|
(12)
|
(12)
|
(12)
|
(12)
|
(182)
|
(242)
|
|
Receive
|
PEN
|
-
|
-
|
-
|
-
|
-
|
-
|
-
|
|
Pay
|
PEN
|
(17)
|
(28)
|
(19)
|
(14)
|
(14)
|
(54)
|
(146)
|
|
Receive
|
UFC
|
41
|
206
|
-
|
171
|
-
|
-
|
418
|
|
Pay
|
UFC
|
(133)
|
(103)
|
-
|
-
|
-
|
-
|
(236)
|
|
Receive
|
USD
|
1,526
|
225
|
3,224
|
151
|
4,007
|
8,104
|
17,237
|
|
Pay
|
USD
|
(185)
|
-
|
(112)
|
-
|
(268)
|
-
|
(565)
|
|
Receive
|
UDI
|
12
|
12
|
12
|
12
|
12
|
186
|
246
|
|
Pay
|
UDI
|
-
|
-
|
-
|
-
|
-
|
-
|
-
|
|
TOTAL
|
30
|
126
|
20
|
(24)
|
99
|
24
|
275
|
|
|
Forwards
|
||||||||
|
Receive
|
ARS
|
-
|
-
|
-
|
-
|
-
|
-
|
-
|
|
Pay
|
ARS
|
(229)
|
-
|
-
|
-
|
-
|
-
|
(229)
|
|
Receive
|
BRL
|
-
|
-
|
-
|
-
|
-
|
-
|
-
|
|
Pay
|
BRL
|
(156)
|
-
|
-
|
-
|
-
|
-
|
(156)
|
|
Receive
|
CLP
|
129
|
-
|
-
|
-
|
-
|
-
|
129
|
|
Pay
|
CLP
|
(129)
|
-
|
-
|
-
|
-
|
-
|
(129)
|
|
Receive
|
COP
|
65
|
-
|
-
|
-
|
-
|
-
|
65
|
|
Pay
|
COP
|
(295)
|
-
|
-
|
-
|
-
|
-
|
(295)
|
|
Receive
|
CZK
|
-
|
-
|
-
|
-
|
-
|
-
|
-
|
|
Pay
|
CZK
|
(718)
|
-
|
-
|
-
|
-
|
-
|
(718)
|
|
Receive
|
EUR
|
3,357
|
-
|
-
|
-
|
-
|
-
|
3,357
|
|
Pay
|
EUR
|
(3,055)
|
(32)
|
(18)
|
-
|
-
|
-
|
(3,105)
|
|
Receive
|
GBP
|
2,257
|
8
|
-
|
-
|
-
|
-
|
2,265
|
|
Pay
|
GBP
|
(1,031)
|
-
|
-
|
-
|
-
|
-
|
(1,031)
|
|
Receive
|
MXN
|
286
|
-
|
-
|
-
|
-
|
-
|
286
|
|
Pay
|
MXN
|
(746)
|
-
|
-
|
-
|
-
|
-
|
(746)
|
|
Receive
|
PEN
|
42
|
2
|
-
|
-
|
-
|
-
|
44
|
|
Pay
|
PEN
|
(12)
|
-
|
-
|
-
|
-
|
-
|
(12)
|
|
Receive
|
UFC
|
-
|
-
|
-
|
-
|
-
|
-
|
-
|
|
Pay
|
UFC
|
(11)
|
-
|
-
|
-
|
-
|
-
|
(11)
|
|
Receive
|
USD
|
2,351
|
26
|
21
|
-
|
-
|
-
|
2,398
|
|
Pay
|
USD
|
(2,107)
|
(2)
|
-
|
-
|
-
|
-
|
(2,109)
|
|
TOTAL
|
(2)
|
2
|
3
|
-
|
-
|
-
|
3
|
|
The detail of the type of financial instruments arranged by the Group (notional amount) by currency and interest rates at December 31, 2009 was as follows:
|
Fair value
|
||||||||||
|
Millions of Euros
|
2010
|
2011
|
2012
|
2013
|
2014
|
Subsequent
|
Total
|
Underlying debt
|
Associated derivatives
|
TOTAL
|
|
EURO
|
(1,933)
|
8,517
|
3,998
|
3,917
|
3,336
|
11,493
|
29,328
|
24,400
|
5,234
|
29,634
|
|
Floating rate
|
(6,551)
|
5,197
|
515
|
3,879
|
2,514
|
(42)
|
5,512
|
9,421
|
(3,865)
|
5,556
|
|
Spread - Ref Euribor
|
(0.14%)
|
0.25%
|
1.49%
|
0.05%
|
0.03%
|
(11.71%)
|
(10.03%)
|
|||
|
Fixed rate
|
4,618
|
3,320
|
133
|
38
|
822
|
10,285
|
19,216
|
10,347
|
9,109
|
19,456
|
|
Interest rate
|
4.47%
|
1.88%
|
(4.63%)
|
67.24%
|
10.33%
|
27.37%
|
106.66%
|
-
|
-
|
|
|
Rate cap
|
-
|
-
|
3,350
|
-
|
-
|
1,250
|
4,600
|
4,632
|
(10)
|
4,622
|
|
OTHER EUROPEAN CURRENCIES
|
60
|
805
|
1,271
|
172
|
883
|
2,581
|
5,772
|
4,263
|
1,875
|
6,138
|
|
Instruments in CZK
|
1,855
|
123
|
224
|
-
|
320
|
(14)
|
2,508
|
321
|
2,212
|
2,533
|
|
Floating rate
|
283
|
-
|
111
|
-
|
-
|
-
|
394
|
91
|
304
|
395
|
|
Spread
|
0.07%
|
-
|
(0.00%)
|
-
|
-
|
-
|
0.07%
|
|||
|
Fixed rate
|
1,572
|
123
|
113
|
-
|
320
|
(14)
|
2,114
|
230
|
1,908
|
2,138
|
|
Interest rate
|
2.03%
|
3.43%
|
4.35%
|
-
|
3.84%
|
3.84%
|
17.49%
|
-
|
-
|
|
|
Rate cap
|
-
|
-
|
-
|
-
|
-
|
-
|
-
|
-
|
-
|
-
|
|
Fair value
|
||||||||||
|
Millions of Euros
|
2010
|
2011
|
2012
|
2013
|
2014
|
Subsequent
|
Total
|
Underlying debt
|
Associated derivatives
|
TOTAL
|
|
Instruments in GBP
|
(1,795)
|
682
|
1,047
|
172
|
563
|
2,595
|
3,264
|
3,942
|
(337)
|
3,605
|
|
Floating rate
|
-
|
55
|
231
|
166
|
563
|
619
|
1,634
|
320
|
1,420
|
1,740
|
|
Spread
|
-
|
(0.50%)
|
0.27%
|
0.27%
|
-
|
-
|
0.04%
|
|||
|
Fixed rate
|
(1,795)
|
627
|
422
|
6
|
-
|
1,863
|
1,123
|
3,111
|
(1,757)
|
1,354
|
|
Interest rate
|
0.88%
|
5.12%
|
7.63%
|
6.44%
|
-
|
15.71%
|
35.78%
|
-
|
-
|
|
|
Rate cap
|
-
|
-
|
394
|
-
|
-
|
113
|
507
|
511
|
-
|
511
|
|
AMERICA
|
(1,136)
|
1,349
|
1,089
|
1,344
|
830
|
4,138
|
7,614
|
13,663
|
(6,802)
|
6,861
|
|
Instruments in USD
|
(200)
|
87
|
45
|
629
|
56
|
1,325
|
1,942
|
11,208
|
(9,622)
|
1,586
|
|
Floating rate
|
291
|
(152)
|
90
|
436
|
19
|
21
|
705
|
1,560
|
(1,094)
|
466
|
|
Spread
|
0.19%
|
1.98%
|
0.82%
|
0.61%
|
0.35%
|
0.70%
|
4.66%
|
|||
|
Fixed rate
|
(501)
|
229
|
(55)
|
183
|
27
|
1,285
|
1,168
|
9,580
|
(8,528)
|
1,052
|
|
Interest rate
|
(0.60%)
|
9.48%
|
4.06%
|
3.53%
|
3.80%
|
23.38%
|
43.65%
|
-
|
-
|
|
|
Rate cap
|
10
|
10
|
10
|
10
|
10
|
19
|
69
|
68
|
-
|
68
|
|
Instruments in UYU
|
(12)
|
2
|
-
|
-
|
-
|
-
|
(10)
|
1
|
-
|
1
|
|
Floating rate
|
-
|
-
|
-
|
-
|
-
|
-
|
-
|
-
|
-
|
-
|
|
Spread
|
-
|
-
|
-
|
-
|
-
|
-
|
-
|
|||
|
Fixed rate
|
(12)
|
2
|
-
|
-
|
-
|
-
|
(10)
|
1
|
-
|
1
|
|
Interest rate
|
1.15%
|
3.75%
|
-
|
-
|
-
|
-
|
4.90%
|
-
|
-
|
|
|
Rate cap
|
-
|
-
|
-
|
-
|
-
|
-
|
-
|
-
|
-
|
-
|
|
Instruments in ARS
|
216
|
143
|
-
|
-
|
-
|
-
|
359
|
(120)
|
461
|
341
|
|
Floating rate
|
-
|
-
|
-
|
-
|
-
|
-
|
-
|
-
|
-
|
-
|
|
Spread
|
-
|
-
|
-
|
-
|
-
|
-
|
-
|
|||
|
Fixed rate
|
216
|
143
|
-
|
-
|
-
|
-
|
359
|
(120)
|
461
|
341
|
|
Interest rate
|
12.18%
|
14.68%
|
-
|
-
|
-
|
-
|
26.86%
|
-
|
-
|
|
|
Rate cap
|
-
|
-
|
-
|
-
|
-
|
-
|
-
|
-
|
-
|
-
|
|
Instruments in BRL
|
(113)
|
331
|
309
|
400
|
243
|
291
|
1,461
|
972
|
448
|
1,420
|
|
Floating rate
|
(233)
|
245
|
217
|
340
|
219
|
168
|
956
|
753
|
176
|
929
|
|
Spread
|
(4.10%)
|
3.03%
|
3.37%
|
2.16%
|
3.10%
|
1.60%
|
9.16%
|
|||
|
Fixed rate
|
120
|
86
|
92
|
60
|
24
|
123
|
505
|
219
|
272
|
491
|
|
Interest rate
|
11.63%
|
9.59%
|
9.74%
|
5.29%
|
9.93%
|
19.16%
|
65.34%
|
-
|
-
|
|
|
Rate cap
|
-
|
-
|
-
|
-
|
-
|
-
|
-
|
-
|
-
|
-
|
|
Instruments in CLP
|
74
|
206
|
192
|
95
|
267
|
-
|
834
|
(34)
|
830
|
796
|
|
Floating rate
|
209
|
110
|
73
|
21
|
28
|
-
|
441
|
105
|
353
|
458
|
|
Spread
|
0.60%
|
1.10%
|
1.63%
|
1.48%
|
-
|
-
|
4.81%
|
|||
|
Fixed rate
|
(135)
|
96
|
119
|
74
|
239
|
-
|
393
|
(139)
|
477
|
338
|
|
Interest rate
|
0.16%
|
1.81%
|
3.86%
|
3.66%
|
5.97%
|
-
|
15.46%
|
-
|
-
|
|
|
Rate cap
|
-
|
-
|
-
|
-
|
-
|
-
|
-
|
-
|
-
|
-
|
|
Instruments in UFC
|
(77)
|
80
|
2
|
2
|
2
|
3
|
12
|
(296)
|
(264)
|
(560)
|
|
Floating rate
|
-
|
-
|
-
|
-
|
-
|
-
|
-
|
-
|
(103)
|
(103)
|
|
Spread
|
-
|
-
|
-
|
-
|
-
|
-
|
-
|
|||
|
Fixed rate
|
(77)
|
80
|
2
|
2
|
2
|
3
|
12
|
(296)
|
(161)
|
(457)
|
|
Interest rate
|
1.23%
|
4.43%
|
7.45%
|
6.00%
|
5.43%
|
12.00%
|
36.54%
|
-
|
-
|
|
|
Rate cap
|
-
|
-
|
-
|
-
|
-
|
-
|
-
|
-
|
-
|
-
|
|
Instruments in PEN
|
84
|
246
|
102
|
89
|
103
|
315
|
939
|
827
|
143
|
970
|
|
Floating rate
|
-
|
-
|
-
|
-
|
-
|
-
|
-
|
-
|
-
|
-
|
|
Spread
|
-
|
-
|
-
|
-
|
-
|
-
|
-
|
|||
|
Fixed rate
|
84
|
246
|
102
|
89
|
103
|
315
|
939
|
827
|
143
|
970
|
|
Interest rate
|
11.43%
|
5.23%
|
6.56%
|
7.25%
|
7.61%
|
36.07%
|
74.15%
|
-
|
-
|
|
|
Rate cap
|
-
|
-
|
-
|
-
|
-
|
-
|
-
|
-
|
-
|
-
|
|
Instruments in COP
|
200
|
254
|
253
|
129
|
159
|
-
|
995
|
563
|
670
|
1,233
|
|
Floating rate
|
9
|
59
|
81
|
108
|
138
|
-
|
395
|
409
|
-
|
409
|
|
Spread
|
3.19%
|
2.74%
|
2.86%
|
2.96%
|
3.28%
|
-
|
15.03%
|
|||
|
Fixed rate
|
191
|
195
|
172
|
21
|
21
|
-
|
600
|
154
|
670
|
824
|
|
Interest rate
|
7.85%
|
8.27%
|
8.43%
|
7.09%
|
7.09%
|
-
|
38.73%
|
-
|
-
|
|
|
Rate cap
|
-
|
-
|
-
|
-
|
-
|
-
|
-
|
-
|
-
|
-
|
|
Instruments in UVR
|
-
|
-
|
-
|
-
|
-
|
2,175
|
2,175
|
2,175
|
-
|
2,175
|
|
Floating rate
|
-
|
-
|
-
|
-
|
-
|
-
|
-
|
-
|
-
|
-
|
|
Spread
|
-
|
-
|
-
|
-
|
-
|
-
|
-
|
|||
|
Fixed rate
|
-
|
-
|
-
|
-
|
-
|
2,175
|
2,175
|
2,175
|
-
|
2,175
|
|
Interest rate
|
-
|
-
|
-
|
-
|
-
|
23.01%
|
23.01%
|
-
|
-
|
|
|
Rate cap
|
-
|
-
|
-
|
-
|
-
|
-
|
-
|
-
|
-
|
-
|
|
Instruments in VEB
|
(2,264)
|
-
|
-
|
-
|
-
|
-
|
(2,264)
|
(2,263)
|
-
|
(2,263)
|
|
Floating rate
|
-
|
-
|
-
|
-
|
-
|
-
|
-
|
-
|
-
|
-
|
|
Spread
|
-
|
-
|
-
|
-
|
-
|
-
|
-
|
|||
|
Fixed rate
|
(2,264)
|
-
|
-
|
-
|
-
|
-
|
(2,264)
|
(2,263)
|
-
|
(2,263)
|
|
Interest rate
|
0.98%
|
-
|
-
|
-
|
-
|
-
|
0.98%
|
-
|
-
|
|
|
Rate cap
|
-
|
-
|
-
|
-
|
-
|
-
|
-
|
-
|
-
|
-
|
|
Instruments in MXN
|
959
|
-
|
186
|
-
|
-
|
29
|
1,174
|
633
|
532
|
1,165
|
|
Floating rate
|
263
|
-
|
-
|
-
|
-
|
-
|
263
|
421
|
3
|
424
|
|
Spread
|
0.61%
|
-
|
-
|
-
|
-
|
-
|
0.61%
|
|
Fair value
|
||||||||||
|
Millions of Euros
|
2010
|
2011
|
2012
|
2013
|
2014
|
Subsequent
|
Total
|
Underlying debt
|
Associated derivatives
|
TOTAL
|
|
Fixed rate
|
696
|
-
|
186
|
-
|
-
|
29
|
911
|
212
|
529
|
741
|
|
Interest rate
|
5.74%
|
-
|
9.25%
|
-
|
-
|
12.52%
|
27.51%
|
-
|
-
|
|
|
Rate cap
|
||||||||||
|
Instruments in GTQ
|
(3)
|
-
|
-
|
-
|
-
|
-
|
(3)
|
(3)
|
-
|
(3)
|
|
Floating rate
|
(3)
|
-
|
-
|
-
|
-
|
-
|
(3)
|
(3)
|
-
|
(3)
|
|
Spread
|
0.01%
|
-
|
-
|
-
|
-
|
-
|
0.01%
|
|||
|
Fixed rate
|
-
|
-
|
-
|
-
|
-
|
-
|
-
|
-
|
-
|
-
|
|
Interest rate
|
-
|
-
|
-
|
-
|
-
|
-
|
-
|
-
|
-
|
-
|
|
Rate cap
|
-
|
-
|
-
|
-
|
-
|
-
|
-
|
-
|
-
|
|
|
ASIA
|
-
|
-
|
-
|
-
|
-
|
-
|
-
|
207
|
(250)
|
(43)
|
|
Instruments in JPY
|
-
|
-
|
-
|
-
|
-
|
-
|
-
|
207
|
(250)
|
(43)
|
|
Floating rate
|
-
|
-
|
-
|
-
|
-
|
-
|
-
|
113
|
(113)
|
-
|
|
Spread
|
-
|
-
|
-
|
-
|
-
|
-
|
-
|
|||
|
Fixed rate
|
-
|
-
|
-
|
-
|
-
|
-
|
-
|
94
|
(137)
|
(43)
|
|
Interest rate
|
-
|
-
|
-
|
-
|
-
|
-
|
-
|
-
|
-
|
|
|
Rate cap
|
-
|
-
|
-
|
-
|
-
|
-
|
-
|
-
|
-
|
-
|
|
AFRICA
|
-
|
-
|
88
|
-
|
-
|
-
|
88
|
-
|
84
|
84
|
|
Instruments in MAD
|
-
|
-
|
88
|
-
|
-
|
-
|
88
|
-
|
84
|
84
|
|
Floating rate
|
-
|
-
|
-
|
-
|
-
|
-
|
-
|
-
|
-
|
-
|
|
Spread
|
-
|
-
|
-
|
-
|
-
|
-
|
-
|
|||
|
Fixed rate
|
-
|
-
|
88
|
-
|
-
|
-
|
88
|
-
|
84
|
84
|
|
Interest rate
|
-
|
-
|
4.54%
|
-
|
-
|
-
|
4.54%
|
-
|
-
|
|
|
Rate cap
|
-
|
-
|
-
|
-
|
-
|
-
|
-
|
-
|
-
|
-
|
|
TOTAL
|
(3,009)
|
10,671
|
6,446
|
5,433
|
5,049
|
18,212
|
42,802
|
42,533
|
141
|
42,674
|
|
Floating rate
|
(5,732)
|
5,514
|
1,318
|
4,950
|
3,481
|
766
|
10,297
|
13,190
|
(2,919)
|
10,271
|
|
Fixed rate
|
2,713
|
5,147
|
1,374
|
473
|
1,558
|
16,064
|
27,329
|
24,132
|
3,070
|
27,202
|
|
Rate cap
|
10
|
10
|
3,754
|
10
|
10
|
1,382
|
5,176
|
5,211
|
(10)
|
5,201
|
|
Currency options
|
(99)
|
|||||||||
|
Other
|
848
|
|||||||||
The table below is an extract of the previous table that shows the sensitivity to interest rates originated by the Group’s position on interest rate swaps categorized into instruments entered into for trading purposes and instruments entered into for purposes other than trading purposes at December 31, 2009.
|
INTEREST RATE SWAPS
|
||||||||
|
Maturity
|
||||||||
|
Millions of euros
|
2010
|
2011
|
2012
|
2013
|
2014
|
Subsequent
|
TOTAL
|
Fair value
|
|
TRADING PURPOSES
|
||||||||
|
EUR
|
(214)
|
|||||||
|
Fixed to floating
|
-
|
-
|
-
|
-
|
-
|
-
|
-
|
(389)
|
|
Receiving leg
|
(790)
|
(1,685)
|
(420)
|
(1,250)
|
(1,065)
|
(1,736)
|
(6,946)
|
(5,823)
|
|
Average interest rate
|
3.23%
|
3.50%
|
3.77%
|
4.69%
|
3.33%
|
3.47%
|
3.67%
|
|
|
Paying leg
|
790
|
1,685
|
420
|
1,250
|
1,065
|
1,736
|
6,946
|
5,434
|
|
Average spread
|
0.80%
|
0.01%
|
0.05%
|
0.03%
|
0.01%
|
0.00%
|
0.11%
|
|
|
Floating to fixed
|
-
|
-
|
-
|
-
|
-
|
-
|
-
|
575
|
|
Receiving leg
|
(8,742)
|
(935)
|
(231)
|
(710)
|
(950)
|
(2,195)
|
(13,763)
|
(11,185)
|
|
Average spread
|
0.10%
|
-
|
-
|
-
|
-
|
-
|
0.07%
|
-
|
|
Paying leg
|
8,742
|
935
|
231
|
710
|
950
|
2,195
|
13,763
|
11,760
|
|
Average interest rate
|
1.31%
|
1.57%
|
2.18%
|
2.18%
|
3.52%
|
3.27%
|
1.84%
|
-
|
|
USD
|
-
|
-
|
-
|
-
|
-
|
-
|
-
|
(37)
|
|
Fixed to floating
|
-
|
-
|
-
|
-
|
-
|
-
|
-
|
(28)
|
|
Receiving leg
|
(594)
|
(63)
|
-
|
-
|
-
|
(229)
|
(886)
|
(914)
|
|
Average interest rate
|
0
|
3.08%
|
3.74%
|
4.43%
|
-
|
|||
|
Paying leg
|
594
|
63
|
-
|
-
|
-
|
229
|
886
|
886
|
|
Average spread
|
-
|
-
|
-
|
-
|
-
|
|||
|
Floating to fixed
|
-
|
-
|
-
|
-
|
-
|
-
|
-
|
(9)
|
|
Receiving leg
|
(486)
|
(191)
|
(451)
|
(416)
|
-
|
(635)
|
(2,179)
|
(473)
|
|
Average spread
|
0.20%
|
0.35%
|
3.99%
|
3.61%
|
-
|
1.59%
|
-
|
|
|
Paying leg
|
486
|
191
|
451
|
416
|
-
|
635
|
2,179
|
464
|
|
Average interest rate
|
2.62%
|
0.50%
|
-
|
-
|
3.68%
|
1.70%
|
-
|
|
|
MXN
|
-
|
-
|
-
|
-
|
-
|
-
|
-
|
-
|
|
Floating to fixed
|
-
|
-
|
-
|
-
|
-
|
-
|
-
|
-
|
|
Receiving leg
|
(1)
|
-
|
-
|
-
|
-
|
-
|
(1)
|
(1)
|
|
Average spread
|
(0.54%)
|
(0.54%)
|
||||||
|
Paying leg
|
1
|
-
|
-
|
-
|
-
|
-
|
1
|
1
|
|
Average interest rate
|
8.43%
|
8.43%
|
||||||
|
NON TRADING PURPOSES
|
||||||||
|
EUR
|
-
|
-
|
-
|
-
|
-
|
-
|
-
|
(274)
|
|
Fixed to floating
|
-
|
-
|
-
|
-
|
-
|
-
|
-
|
(669)
|
|
Receiving leg
|
(5,088)
|
(2,039)
|
(504)
|
(1,654)
|
(3,055)
|
(3,313)
|
(15,653)
|
(13,806)
|
|
Average interest rate
|
3.23%
|
3.50%
|
3.77%
|
4.69%
|
3.33%
|
3.47%
|
3.51%
|
-
|
|
Paying leg
|
5,088
|
2,039
|
504
|
1,654
|
3,055
|
3,313
|
15,653
|
13,137
|
|
Average spread
|
0.80%
|
0.01%
|
0.05%
|
0.03%
|
0.01%
|
0.00%
|
0.27%
|
-
|
|
Floating to fixed
|
-
|
-
|
-
|
-
|
-
|
-
|
-
|
395
|
|
Receiving leg
|
(5,312)
|
(3,949)
|
(500)
|
(550)
|
(730)
|
(7,503)
|
(18,544)
|
(14,842)
|
|
Average spread
|
0.19%
|
-
|
-
|
3.48%
|
2.35%
|
-
|
0.25%
|
-
|
|
Paying leg
|
5,312
|
3,949
|
500
|
550
|
730
|
7,503
|
18,544
|
15,237
|
|
Average interest rate
|
2.64%
|
2.82%
|
3.74%
|
-
|
1.09%
|
3.72%
|
3.01%
|
-
|
|
CZK
|
-
|
-
|
-
|
-
|
-
|
-
|
-
|
5
|
|
Floating to fixed
|
-
|
-
|
-
|
-
|
-
|
-
|
-
|
5
|
|
Receiving leg
|
(430)
|
-
|
-
|
-
|
-
|
-
|
(430)
|
(430)
|
|
Average spread
|
0.01%
|
0.01%
|
-
|
|||||
|
Paying leg
|
430
|
-
|
-
|
-
|
-
|
-
|
430
|
435
|
|
Average interest rate
|
3.35%
|
3.35%
|
-
|
|||||
|
USD
|
-
|
-
|
-
|
-
|
-
|
-
|
-
|
(547)
|
|
Fixed to floating
|
-
|
-
|
-
|
-
|
-
|
-
|
-
|
(583)
|
|
Receiving leg
|
-
|
(694)
|
-
|
(521)
|
-
|
(4,304)
|
(5,519)
|
(6,103)
|
|
Average interest rate
|
3.90%
|
5.52%
|
4.84%
|
4.79%
|
-
|
|||
|
Paying leg
|
-
|
694
|
-
|
521
|
-
|
4,304
|
5,519
|
5,520
|
|
Average spread
|
-
|
-
|
-
|
-
|
-
|
|||
|
Floating to fixed
|
-
|
-
|
-
|
-
|
-
|
-
|
-
|
36
|
|
Receiving leg
|
(26)
|
(26)
|
(26)
|
(616)
|
(26)
|
(51)
|
(771)
|
(769)
|
|
Average spread
|
-
|
-
|
-
|
-
|
-
|
-
|
-
|
-
|
|
Paying leg
|
26
|
26
|
26
|
616
|
26
|
51
|
771
|
805
|
|
Average interest rate
|
4.34%
|
4.34%
|
4.34%
|
3.35%
|
4.34%
|
4.34%
|
3.55%
|
-
|
|
-
|
-
|
-
|
-
|
-
|
-
|
|||
|
BRL
|
-
|
-
|
-
|
-
|
-
|
-
|
-
|
-
|
|
Floating to floating
|
-
|
-
|
-
|
-
|
-
|
-
|
-
|
-
|
|
Receiving leg
|
(598)
|
-
|
-
|
-
|
-
|
-
|
(598)
|
(483)
|
|
Average spread
|
0.35%
|
0.35%
|
-
|
|||||
|
Paying leg
|
598
|
-
|
-
|
-
|
-
|
-
|
598
|
483
|
|
Average spread
|
-
|
-
|
-
|
|||||
|
MXN
|
-
|
-
|
-
|
-
|
-
|
-
|
-
|
3
|
|
Floating to fixed
|
-
|
-
|
-
|
-
|
-
|
-
|
-
|
3
|
|
Receiving leg
|
(159)
|
-
|
-
|
-
|
-
|
-
|
(159)
|
(166)
|
|
Average spread
|
0.61%
|
0.61%
|
-
|
|||||
|
Paying leg
|
159
|
-
|
-
|
-
|
-
|
-
|
159
|
169
|
|
Average interest rate
|
8.16%
|
8.16%
|
-
|
|||||
|
GBP
|
-
|
-
|
-
|
-
|
-
|
-
|
-
|
22
|
|
Fixed to floating
|
-
|
-
|
-
|
-
|
-
|
-
|
-
|
216
|
|
Receiving leg
|
-
|
-
|
-
|
-
|
(563)
|
(732)
|
(1,295)
|
(1,341)
|
|
Average interest rate
|
5.25%
|
3.92%
|
4.50%
|
-
|
||||
|
Paying leg
|
-
|
-
|
-
|
-
|
563
|
732
|
1,295
|
1,557
|
|
Average spread
|
-
|
1.64%
|
0.92%
|
-
|
||||
|
Floating to fixed
|
-
|
-
|
-
|
-
|
-
|
-
|
-
|
(194)
|
|
Receiving leg
|
-
|
(609)
|
-
|
-
|
-
|
(455)
|
(1,064)
|
(1,065)
|
|
Average spread
|
-
|
-
|
-
|
-
|
||||
|
Paying leg
|
-
|
609
|
-
|
-
|
-
|
455
|
1,064
|
871
|
|
Average interest rate
|
5.12%
|
4.96%
|
5.05%
|
-
|
||||
|
JPY
|
-
|
-
|
-
|
-
|
-
|
-
|
-
|
(4)
|
|
Fixed to floating
|
-
|
-
|
-
|
-
|
-
|
-
|
-
|
(4)
|
|
Receiving leg
|
-
|
-
|
(113)
|
-
|
-
|
-
|
(113)
|
(117)
|
|
Average interest rate
|
1.68%
|
1.68%
|
-
|
|||||
|
Paying leg
|
-
|
-
|
113
|
-
|
-
|
-
|
113
|
113
|
|
Average spread
|
-
|
-
|
-
|
-
|
||||
|
CLP
|
-
|
-
|
-
|
-
|
-
|
-
|
-
|
-
|
|
Fixed to floating
|
-
|
-
|
-
|
-
|
-
|
-
|
-
|
1
|
|
Receiving leg
|
-
|
-
|
-
|
(21)
|
(28)
|
-
|
(49)
|
(48)
|
|
Average interest rate
|
4.12%
|
4.51%
|
4.34%
|
-
|
||||
|
Paying leg
|
-
|
-
|
-
|
21
|
28
|
-
|
49
|
49
|
|
Average spread
|
-
|
-
|
-
|
-
|
||||
|
Floating to fixed
|
-
|
-
|
-
|
-
|
-
|
-
|
-
|
(1)
|
|
Receiving leg
|
(82)
|
(96)
|
(51)
|
(95)
|
-
|
-
|
(324)
|
(147)
|
|
Average spread
|
1.55%
|
-
|
-
|
-
|
0.39%
|
-
|
||
|
Paying leg
|
82
|
96
|
51
|
95
|
-
|
-
|
324
|
146
|
|
Average interest rate
|
-
|
1.82%
|
3.74%
|
3.76%
|
2.23%
|
-
|
Foreign exchange and interest rate options, by maturity, at December 31, 2009 were as follows:
|
CURRENCY OPTIONS
|
|||||
|
MATURITIES
|
|||||
|
Figures in euros
|
2010
|
2011
|
2012
|
2013
|
Subsequent
|
|
Put USD / Call EUR
|
|||||
|
Notional amount of options bought
|
-
|
201,305,012
|
-
|
70,803,832
|
1,664,931,279
|
|
Strike
|
-
|
1.59%
|
-
|
1.50%
|
1.75%
|
|
Notional amount of options sold
|
-
|
195,129,693
|
-
|
-
|
831,255,453
|
|
Strike
|
-
|
1.49%
|
-
|
-
|
1.20%
|
|
INTEREST RATE OPTIONS
|
|||||
|
MATURITIES
|
|||||
|
Figures in euros
|
2010
|
2011
|
2012
|
2013
|
Subsequent
|
|
Collars
|
|||||
|
Notional amount of options bought
|
-
|
-
|
1,119,299,628
|
-
|
2,161,986,806
|
|
Strike Cap
|
-
|
-
|
4.746%
|
-
|
4.77%
|
|
Strike Floor
|
-
|
-
|
3.409%
|
-
|
3.48%
|
|
Caps
|
|||||
|
Notional amount of options bought
|
-
|
-
|
3,412,999,662
|
-
|
-
|
|
Strike
|
-
|
-
|
4.205%
|
-
|
-
|
|
Notional amount of options sold
|
-
|
-
|
6,032,299,291
|
-
|
2,161,986,806
|
|
Strike
|
-
|
-
|
5.399%
|
-
|
5.003%
|
|
Floors
|
|||||
|
Notional amount of options bought
|
-
|
-
|
2,619,299,628
|
-
|
2,094,499,493
|
|
Strike
|
-
|
-
|
2.844%
|
-
|
0.802%
|
|
Notional amount of options sold
|
363,096,573
|
-
|
700,000,000
|
-
|
-
|
|
Strike
|
4.382%
|
-
|
2.147%
|
-
|
-
|
Cash flows receivable or payable on derivative financial instruments settled via the swap of nominals, by currency of collection/payment, along with contractual maturities at December 31, 2009 were as follows:
|
Millions of euros
|
2010
|
2011
|
2012
|
2013
|
2014
|
Subsequent
|
Total
|
|
|
Currency swaps
|
||||||||
|
Receive
|
ARS
|
-
|
-
|
-
|
-
|
-
|
-
|
-
|
|
Pay
|
ARS
|
(130)
|
(52)
|
-
|
-
|
-
|
-
|
(182)
|
|
Receive
|
BRL
|
-
|
-
|
-
|
-
|
-
|
-
|
-
|
|
Pay
|
BRL
|
(51)
|
(64)
|
(65)
|
(4)
|
(38)
|
(88)
|
(310)
|
|
Receive
|
CLP
|
96
|
175
|
82
|
95
|
-
|
-
|
448
|
|
Pay
|
CLP
|
(191)
|
(349)
|
(232)
|
(189)
|
(195)
|
-
|
(1,156)
|
|
Receive
|
COP
|
-
|
-
|
-
|
-
|
-
|
-
|
-
|
|
Pay
|
COP
|
(86)
|
(172)
|
(172)
|
(21)
|
(21)
|
-
|
(472)
|
|
Receive
|
CZK
|
-
|
-
|
-
|
-
|
-
|
-
|
-
|
|
Pay
|
CZK
|
(622)
|
(111)
|
(111)
|
-
|
(222)
|
-
|
(1,066)
|
|
Receive
|
EUR
|
1,714
|
958
|
323
|
-
|
280
|
588
|
3.863
|
|
Pay
|
EUR
|
(3,619)
|
(785)
|
(356)
|
(1,118)
|
-
|
(7,872)
|
(13,750)
|
|
Receive
|
GBP
|
873
|
-
|
-
|
-
|
-
|
-
|
873
|
|
Pay
|
GBP
|
(873)
|
(609)
|
-
|
-
|
-
|
(455)
|
(1,937)
|
|
Receive
|
JPY
|
8
|
9
|
451
|
-
|
-
|
113
|
581
|
|
Pay
|
JPY
|
-
|
-
|
-
|
-
|
-
|
-
|
-
|
|
Receive
|
MAD
|
-
|
-
|
-
|
-
|
-
|
-
|
-
|
|
Pay
|
MAD
|
-
|
-
|
(88)
|
-
|
-
|
-
|
(88)
|
|
Receive
|
MXN
|
-
|
-
|
-
|
-
|
-
|
-
|
-
|
|
Pay
|
MXN
|
(2)
|
-
|
-
|
-
|
-
|
-
|
(2)
|
|
Receive
|
PEN
|
-
|
-
|
-
|
-
|
-
|
-
|
-
|
|
Pay
|
PEN
|
(7)
|
(15)
|
(16)
|
(16)
|
(13)
|
(60)
|
(127)
|
|
Receive
|
UFC
|
204
|
34
|
172
|
-
|
143
|
-
|
553
|
|
Pay
|
UFC
|
(102)
|
(111)
|
(86)
|
-
|
-
|
-
|
(299)
|
|
Receive
|
USD
|
1,959
|
1,297
|
160
|
1,286
|
67
|
7,283
|
12,052
|
|
Pay
|
USD
|
(7)
|
(156)
|
-
|
(104)
|
-
|
-
|
(267)
|
|
TOTAL:
|
(836)
|
49
|
62
|
(71)
|
1
|
(491)
|
(1,286)
|
|
|
Forwards
|
||||||||
|
Receive
|
ARS
|
42
|
-
|
-
|
-
|
-
|
-
|
42
|
|
Pay
|
ARS
|
(340)
|
-
|
-
|
-
|
-
|
-
|
(340)
|
|
Receive
|
BRL
|
-
|
-
|
-
|
-
|
-
|
-
|
-
|
|
Pay
|
BRL
|
(159)
|
-
|
-
|
-
|
-
|
-
|
(159)
|
|
Receive
|
CLP
|
142
|
-
|
-
|
-
|
-
|
-
|
142
|
|
Pay
|
CLP
|
(244)
|
(1)
|
-
|
-
|
-
|
-
|
(245)
|
|
Receive
|
COP
|
22
|
-
|
-
|
-
|
-
|
-
|
22
|
|
Pay
|
COP
|
(191)
|
-
|
-
|
-
|
-
|
-
|
(191)
|
|
Receive
|
CZK
|
-
|
-
|
-
|
-
|
-
|
14
|
14
|
|
Pay
|
CZK
|
(1,145)
|
-
|
-
|
-
|
-
|
-
|
(1,145)
|
|
Receive
|
EUR
|
3,262
|
-
|
-
|
-
|
-
|
-
|
3,262
|
|
Pay
|
EUR
|
(2,985)
|
(3)
|
(23)
|
(19)
|
-
|
(14)
|
(3,044)
|
|
Receive
|
GBP
|
2,488
|
-
|
-
|
-
|
-
|
-
|
2,488
|
|
Pay
|
GBP
|
(544)
|
-
|
-
|
-
|
-
|
-
|
(544)
|
|
Receive
|
MXN
|
-
|
-
|
-
|
-
|
-
|
-
|
-
|
|
Pay
|
MXN
|
(530)
|
-
|
-
|
-
|
-
|
-
|
(530)
|
|
Receive
|
PEN
|
25
|
-
|
-
|
-
|
-
|
-
|
25
|
|
Pay
|
PEN
|
(27)
|
-
|
-
|
-
|
-
|
-
|
(27)
|
|
Receive
|
UFC
|
140
|
-
|
-
|
-
|
-
|
-
|
140
|
|
Pay
|
UFC
|
(142)
|
-
|
-
|
-
|
-
|
-
|
(142)
|
|
Receive
|
USD
|
2,112
|
4
|
24
|
20
|
-
|
-
|
2,160
|
|
Pay
|
USD
|
(1,897)
|
-
|
-
|
-
|
-
|
-
|
(1,897)
|
|
TOTAL
|
29
|
-
|
1
|
1
|
-
|
-
|
31
|
|
APPENDIX IV: INTEREST-BEARING DEBT
The main financing transactions included under this heading outstanding at December 31, 2010 and 2009 and their nominal amounts are as follows:
|
Descriptive name summary
|
Contractual limit amount
|
Currency
|
Outstanding principal balance (million of euros)
|
Arrangement date
|
Maturity date
|
|
|
(millions)
|
31/12/2010
|
31/12/2009
|
||||
|
Telefónica, S.A. and its instrumental companies
|
||||||
|
Telefónica, S.A. 2005 syndicated facility
|
650
|
EUR
|
300
|
6,000
|
06/28/2005
|
06/28/2011(1)
|
|
Telfisa EIB bilateral facility
|
300
|
EUR
|
300
|
300
|
12/12/2006
|
12/12/2011
|
|
Telefónica Europe, B.V. 2006 syndicated facility
|
4,200
|
GBP
|
2,945
|
3,091
|
||
|
Tranche D
|
2,100
|
GBP
|
2,459
|
2,357
|
12/07/2006
|
12/14/2012
|
|
Tranche E
|
2,100
|
GBP
|
486
|
734
|
12/07/2006
|
12/14/2013
|
|
Telefónica, S.A. 2010 syndicated facility
|
8,000
|
EUR
|
6,000
|
-
|
||
|
Tranche A
|
5,000
|
EUR
|
3,000
|
-
|
07/28/2010
|
07/28/2013
|
|
Tranche B
|
3,000
|
EUR
|
3,000
|
-
|
07/28/2010
|
07/28/2015
|
|
Bilateral loan
|
160
|
EUR
|
160
|
-
|
12/22/2010
|
12/22/2015
|
|
TELFISA EIB bilateral
|
100
|
EUR
|
100
|
100
|
01/31/2007
|
01/31/2015
|
|
TELFISA EIB bilateral
|
375
|
EUR
|
375
|
375
|
01/31/2008
|
01/30/2015
|
|
TELFISA EIB bilateral
|
221
|
USD
|
165
|
179
|
09/15/2004
|
09/15/2016
|
|
Cajas Telefónica, S.A. 2006 Saving Bank’s syndicated facility
|
700
|
EUR
|
700
|
700
|
04/21/2006
|
04/21/2017
|
|
Telefónica Europe, B.V. bilateral
|
15,000
|
JPY
|
138
|
113
|
08/16/2007
|
07/27/2037
|
|
Other operators
|
||||||
|
Telefónica Chile 2005 syndicated facility
|
150
|
USD
|
112
|
104
|
10/28/2005
|
06/21/2011
|
|
Móviles Chile 2006 syndicated facility
|
180
|
USD
|
134
|
125
|
12/29/2005
|
01/05/2011
|
|
Cesky financing
|
115
|
EUR
|
115
|
115
|
07/30/1997
|
07/30/2012
|
|
Telefónica Chile 2008 syndicated facility
|
150
|
USD
|
112
|
104
|
06/09/2008
|
05/13/2013
|
|
Vivo bilateral
|
1,132
|
BRL
|
509
|
575
|
07/13/2007
|
08/15/2014
|
|
Colombia Telecomunicaciones loan
|
310,000
|
COP
|
121
|
105
|
12/28/2009
|
12/28/2014
|
|
Vivo EIB bilateral
|
265
|
USD
|
203
|
184
|
02/29/2008
|
03/02/2015
|
|
Telesp bilateral
|
1,808
|
BRL
|
812
|
792
|
10/23/1997
|
05/15/2015
|
|
Vivo bilateral
|
378
|
BRL
|
170
|
157
|
10/30/2008
|
10/30/2016
|
|
Móviles Colombia IDB financing
|
491
|
USD
|
367
|
417
|
||
|
Tranche A
|
111
|
USD
|
83
|
87
|
12/20/2007
|
11/15/2014
|
|
Tranche B
|
380
|
USD
|
284
|
330
|
12/20/2007
|
11/15/2012
|
|
Others
|
6,069
|
4,422
|
||||
|
Total
|
19,907
|
17,958
|
||||
(1)
On February 13, 2009, the “
Forward Start Facility
” contract signed, which can be extended by 217 million euros to 2012 and by 217 million euros to 2013
APPENDIX V: MAIN COMPANIES COMPRISING THE TELEFÓNICA GROUP
The table below lists the main companies comprising the Telefónica Group at December 31, 2010 and the main investments consolidated using the equity method.
Included for each company are the company name, corporate purpose, country, functional currency, share capital (in million of functional currency units), the Telefónica Group's effective shareholding and the company or companies through which the Group holds a stake.
|
Name and corporate purpose
|
Country
|
Currency
|
Capital
|
%
Telefónica
Group
|
Holding company
|
|
Parent company:
|
|||||
|
Telefónica, S.A.
|
Spain
|
EUR
|
4,564
|
||
|
Telefónica Spain
|
|||||
|
Telefónica de España, S.A.U.
Telecommunications service provider
|
Spain
|
EUR
|
1,024
|
100%
|
Telefónica, S.A. (100%)
|
|
Telefónica Móviles España, S.A.U.
Wireless communications services provider
|
Spain
|
EUR
|
423
|
100%
|
Telefónica, S.A. (100%)
|
|
Telefónica Serv. de Informática y Com. de España, S.A.U.
Telecommunications systems, networks and infrastructure engineering
|
Spain
|
EUR
|
6
|
100%
|
Telefónica de España, S.A.U. (100%)
|
|
Telefónica Soluciones Sectoriales, S.A.U.
Consulting services for ICT companies
|
Spain
|
EUR
|
14
|
100%
|
Telefónica de España, S.A.U. (100%)
|
|
Interdomain, S.A.U.
Internet resources operator
|
Spain
|
EUR
|
-
|
100%
|
Telefónica Soluciones Sectoriales, S.A. (100%)
|
|
Teleinformática y Comunicaciones, S.A.U. (TELYCO)
Promotion, marketing and distribution of telephone and telematic equipment and services
|
Spain
|
EUR
|
8
|
100%
|
Telefónica de España, S.A.U. (100%)
|
|
Telefónica Telecomunicaciones Públicas, S.A.U.
Installation of public telephones
|
Spain
|
EUR
|
1
|
100%
|
Telefónica de España, S.A.U. (100%)
|
|
Telefónica Remesas, S.A.
Remittance management
|
Spain
|
EUR
|
-
|
100%
|
Telefónica Telecomunicaciones Públicas, S.A.U. (100%)
|
|
Telefónica Cable, S.A.U.
Cable telecommunication services provider
|
Spain
|
EUR
|
3
|
100%
|
Telefónica de España, S.A.U. (100%)
|
|
Tuenti Technologies, S.L.
Private social platform
|
Spain
|
EUR
|
-
|
91.38%
|
Telefónica Móviles España, S.A.U. (91.38%)
|
|
Iberbanda, S.A.
Broadband telecommunications operator
|
Spain
|
EUR
|
2
|
58.94%
|
Telefónica de España, S.A.U. (58,94%)
|
|
Telefónica Salud, S.A.
Management and operation of telecommunications and public television services
|
Spain
|
EUR
|
-
|
51.00%
|
Telefónica Telecomunicaciones Públicas, S.A.U. (51.00%)
|
|
Telefónica Latin America
|
|||||
|
Telefónica Internacional, S.A.U.
Investment in the telecommunications industry abroad
|
Spain
|
EUR
|
2,839
|
100%
|
Telefónica, S.A. (100%)
|
|
Name and corporate purpose
|
Country
|
Currency
|
Capital
|
%
Telefónica
Group
|
Holding company
|
|
Telefónica International Holding, B.V.
Holding company
|
Netherlands
|
EUR
|
-
|
100%
|
Telefónica Internacional, S.A.U. (100%)
|
|
Latin American Cellular Holdings, B.V.
Holding company
|
Netherlands
|
EUR
|
-
|
100%
|
Telefónica, S.A. (100%)
|
|
Telefónica Datacorp, S.A.U.
Telecommunications service provider and operator
|
Spain
|
EUR
|
700
|
100%
|
Telefónica, S.A. (100%)
|
|
Telecomunicaçoes de Sao Paulo, S.A. - TELESP
Wireline telephony operator in Sao Paulo
|
Brazil
|
BRL
|
6,575
|
87.95%
|
Telefónica Internacional, S.A.U. (65.30%)
Sao Paulo Telecomunicaçoes Participaçoes, Ltda. (22.65%)
|
|
Vivo Participaçoes, S.A.
Holding company and mobile services operator
|
Brazil
|
BRL
|
8,780
|
59.42%
|
Telefónica, S.A. (35.89%)
Telefónica Brasil Sul Celular Participaçoes, Ltda. (4.37%)
Portelcom Participaçoes, S.A. (19.16%)
|
|
Vivo, S.A.
Wireless services operator
|
Brazil
|
BRL
|
6,218
|
100%
|
Vivo Participaçoes, S.A. (100%)
|
|
Compañía Internacional de Telecomunicaciones, S.A.
Holding company
|
Argentina
|
ARS
|
562
|
100%
|
Telefónica Holding de Argentina, S.A. (50.00%)
Telefónica Móviles Argentina, S.A. (39.40%)
Telefónica International Holding, B.V. (10.60%)
|
|
Telefónica de Argentina, S.A.
Telecommunications service provider
|
Argentina
|
ARS
|
698
|
100%
|
Compañía Internacional de Telecomunicaciones, S.A. (51.49%)
Telefónica Internacional, S.A.U. (16.20%)
Telefónica Móviles Argentina, S.A. (29.56%)
Telefónica International Holding, B.V. (0.95%)
Telefónica, S.A. (1.80%)
|
|
Telefónica Móviles Argentina Holding, S.A.
Holding company
|
Argentina
|
ARS
|
1,198
|
100%
|
Telefónica, S.A. (100%)
|
|
Telcel, C.A.
Wireless operator
|
Venezuela
|
VEF
|
944
|
100%
|
Latin America Cellular Holdings, B.V. (97.21%)
Telefónica, S.A. (0.08%)
Comtel Comunicaciones Telefónicas, S.A. (2.71%)
|
|
Telefónica Móviles Chile, S.A.
Wireless communications services operator
|
Chile
|
CLP
|
1,628,654
|
100%
|
TEM Inversiones Chile Ltda. (100%)
|
|
Telefónica Chile, S.A.
Local, long distance and international telephony services provider
|
Chile
|
CLP
|
578,078
|
97.89%
|
Inversiones Telefónica Internacional Holding Ltda. (53.00%)
Telefónica Internacional de Chile, S.A. (44.89%)
|
|
Name and corporate purpose
|
Country
|
Currency
|
Capital
|
%
Telefónica
Group
|
Holding company
|
|
Telefónica del Perú, S.A.A.
Local, domestic and international long distance telephone service provider
|
Peru
|
PEN
|
2,962
|
98.34%
|
Telefónica Internacional, S.A.U. (49.90%)
Latin America Cellular Holdings, B.V. (48.28%)
Telefónica, S.A. (0.16%)
|
|
Telefónica Móviles Perú, S.A.C.
Wireless communications services provider
|
Peru
|
PEN
|
602
|
99.99%
|
Telefónica del Perú, S.A.A. (99.99%)
|
|
Colombia Telecomunicaciones, S.A. ESP
Communications services operator
|
Columbia
|
COP
|
909,929
|
52.03%
|
Telefónica Internacional, S.A.U. (52.03%)
|
|
Telefónica Móviles Colombia, S.A.
Wireless operator
|
Columbia
|
COP
|
-
|
100.00%
|
Olympic, Ltda. (50.58%)
Telefónica, S.A. (49.42%)
|
|
Telefónica Móviles México, S.A. de C.V.
Holding company
|
Mexico
|
MXN
|
50,702
|
100%
|
Telefónica Internacional, S.A.U. (100%)
|
|
Pegaso Comunicaciones y Sistemas, S.A. de C.V.
Wireless telephone and communications services
|
Mexico
|
MXN
|
27,173
|
100%
|
Telefónica Móviles México, S.A. de C.V.
(100%)
|
|
Telefónica Móviles del Uruguay, S.A.
Wireless communications and services operator
|
Uruguay
|
UYU
|
255
|
100%
|
Latin America Cellular Holdings, B.V. (68.00%)
Telefónica, S.A. (32.00%)
|
|
Telefónica Larga Distancia de Puerto Rico, Inc.
Telecommunications service operator
|
Puerto Rico
|
USD
|
-
|
100%
|
Telefónica Internacional Holding, B.V. (100%)
|
|
Telefónica Móviles Panamá, S.A.
Wireless telephony services
|
Panama
|
USD
|
24
|
100%
|
Telefónica, S.A. (56.31%)
Panamá Cellular Holdings, B.V. (43.69%)
|
|
Telefónica Móviles El Salvador, S.A. de C.V.
Provision of wireless and international long distance communications services
|
El Salvador
|
USD
|
42
|
99.08%
|
Telefónica El Salvador Holding, S.A. de C.V. (99.08%)
|
|
Telefónica Móviles Guatemala, S.A.
Wireless, wireline and radio paging communications services provider
|
Guatemala
|
GTQ
|
1,420
|
99.98%
|
TCG Holdings, S.A. (65.99%)
Telefónica, S.A. (13.60%)
Guatemala Cellular Holdings, B.V. (13.12%)
Panamá Cellular Holdings, B.V. (7.27%)
|
|
Telefonía Celular de Nicaragua, S.A.
Wireless telephony services
|
Nicaragua
|
NIO
|
247
|
100%
|
Latin America Cellular Holdings, B.V. (100%)
|
|
Otecel, S.A.
Wireless communications services provider
|
Ecuador
|
USD
|
166
|
100%
|
Ecuador Cellular Holdings, B.V. (100%)
|
|
Telefónica International Wholesale Services, S.L.
International services provider
|
Spain
|
EUR
|
230
|
100%
|
Telefónica, S.A. (100%)
|
|
Telefónica International Wholesale Services II, S.L.
International services provider
|
Spain
|
EUR
|
-
|
100%
|
Telefónica, S.A. (100%)
|
|
Telefónica International Wholesale Services America, S.A.
Provision of high bandwidth communications services
|
Uruguay
|
UYU
|
14,563
|
100%
|
Telefónica, S.A. (80.56%)
Telefónica International Wholesale Services, S.L. (19.44%)
|
|
Name and corporate purpose
|
Country
|
Currency
|
Capital
|
%
Telefónica
Group
|
Holding company
|
|
Telefónica International Wholesale Services France, S.A.S.
Provision of high bandwidth communications services
|
France
|
EUR
|
-
|
100%
|
Telefónica International Wholesale Services II, S.L. (100%)
|
|
Telefónica International Wholesale Services Argentina, S.A.
Provision of high bandwidth communications services
|
Argentina
|
ARS
|
164
|
100%
|
T. International Wholesale Services America, S.A. (97.64%)
Telefónica International Wholesale Services, S.L. (2.36%)
|
|
Telefónica International Wholesale Services Brasil Participaçoes, Ltd
Provision of high bandwidth communications services
|
Brazil
|
BRL
|
166
|
99.99%
|
Telefónica International Wholesale América, S.A. (99.99%)
|
|
Telefónica International Wholesale Services Perú, S.A.C.
Provision of high bandwidth communications services
|
Peru
|
USD
|
70
|
99.99%
|
T. International Wholesale Services America, S.A. (100%)
|
|
Telefónica International Wholesale Services USA, Inc.
Provision of high bandwidth communications services
|
US
|
USD
|
36
|
100%
|
T. International Wholesale Services America, S.A. (100%)
|
|
Telefónica International Wholesale Services Puerto Rico, Inc.
Provision of high bandwidth communications services
|
Puerto Rico
|
USD
|
24
|
100%
|
T. International Wholesale Services America, S.A. (100%)
|
|
Telefónica International Wholesale Services Ecuador, S.A
Provision of high bandwidth communications services
|
Ecuador
|
USD
|
6
|
100%
|
T. International Wholesale Services America, S.A. (99%)
Telefónica International Wholesale Services Perú, S.A.C. (1%)
|
|
Terra Networks Brasil, S.A.
ISP and portal
|
Brazil
|
BRL
|
1,036
|
100%
|
Sao Paulo Telecomunicaçoes Participaçoes, Ltda. (100%)
|
|
Terra Networks Mexico, S.A. de C.V.
ISP, portal and real-time financial information services
|
Mexico
|
MXN
|
45
|
99.99%
|
Terra Networks Mexico Holding, S.A. de C.V. (99.99%)
|
|
Terra Networks Perú, S.A.
ISP and portal
|
Peru
|
PEN
|
10
|
99.99%
|
Telefónica Internacional, S.A.U. (99.99%)
|
|
Terra Networks Argentina, S.A.
ISP and portal
|
Argentina
|
ARS
|
7
|
100%
|
Telefónica Internacional, S.A.U. (99.92%)
Telefónica International Holding, B.V. (0.08%)
|
|
Terra Networks Guatemala, S.A.
ISP and portal
|
Guatemala
|
GTQ
|
154
|
99.99%
|
Telefónica Internacional, S.A.U. (99.99%)
|
|
Telefónica China, B.V.
Holding company
|
Netherlands
|
EUR
|
18
|
100%
|
Telefónica Internacional, S.A.U. (100%)
|
|
Telefónica Europe
|
|||||
|
Telefónica Europe plc
Holding company
|
UK
|
GBP
|
9
|
100%
|
Telefónica, S.A. (100%)
|
|
MmO2 plc
Holding company
|
UK
|
GBP
|
20
|
99.99%
|
Telefónica Europe plc (99.99%)
|
|
O2 Holdings Ltd.
Holding company
|
UK
|
EUR
|
12
|
100%
|
MmO2 plc (100%)
|
|
Telefónica O2 UK Ltd.
Wireless communications services operator
|
UK
|
GBP
|
10
|
100%
|
O2 Networks Ltd. (80.00%)
O2 Cedar Ltd. (20.00%)
|
|
Name and corporate purpose
|
Country
|
Currency
|
Capital
|
%
Telefónica
Group
|
Holding company
|
|
The Link Stores Ltd.
Telecommunications equipment retailer
|
UK
|
GBP
|
-
|
100%
|
Telefónica O2 UK Ltd. (100%)
|
|
Be Un Limited (Be)
Internet services provider
|
UK
|
GBP
|
10
|
100%
|
Telefónica O2 UK Ltd. (100%)
|
|
Tesco Mobile Ltd. (*)
Wireless telephony services
|
UK
|
GBP
|
-
|
50.00%
|
O2 Communication Ltd. (50.00%)
|
|
O2 (Europe) Ltd.
Holding company
|
UK
|
EUR
|
1,239
|
100%
|
Telefónica, S.A. (100%)
|
|
Telefónica O2 Germany GmbH & Co. OHG
Wireless communications services operator
|
Germany
|
EUR
|
51
|
100%
|
Telefónica O2 Germany Verwaltungs GmBh (99.99%)
Telefónica O2 Germany Management GmBh (0.01%)
|
|
Tchibo Mobilfunk GmbH & Co. KG (*)
Telecommunications equipment retailer
|
Germany
|
EUR
|
-
|
50.00%
|
Telefónica O2 Germany GmbH & Co. OHG (50.00%)
|
|
Telefónica O2 Ireland Ltd.
Wireless communications services operator
|
Ireland
|
EUR
|
98
|
100%
|
O2 Netherland Holdings B.V. (99%)
Kilmaine, Ltd. (1%)
|
|
Jajah Inc.
IP telephony platform
|
US
|
USD
|
-
|
100%
|
Telefónica Europe plc (100%)
|
|
HanseNet Telekommunication GmbH
Telecommunications operator
|
Germany
|
EUR
|
92
|
100%
|
Telefónica O2 Germany GmbH & Co. OHG (100%)
|
|
Telefónica O2 Czech Republic, a.s.
Telecommunications service provider
|
Czech Republic
|
CZK
|
32,209
|
69.41%
|
Telefónica, S.A. (69.41%)
|
|
Telefónica O2 Slovakia, s.r.o.
Wireless telephony, internet and data transmission services
|
Slovak Republic
|
EUR
|
240
|
69.41%
|
Telefónica O2 Czech Republic, a.s. (100%)
|
|
Other companies
|
|||||
|
Telefónica de Contenidos, S.A.U.
Organization and operation of multimedia service-related businesses
|
Spain
|
EUR
|
1,865
|
100%
|
Telefónica, S.A. (100%)
|
|
Atlántida Comunicaciones, S.A.
Media
|
Argentina
|
ARS
|
22
|
100%
|
Telefónica Media Argentina S.A. (93.02%)
Telefónica Holding de Argentina, S.A. (6.98%)
|
|
Televisión Federal S.A.- TELEFE
Provision and operation TV and radio broadcasting services
|
Argentina
|
ARS
|
135
|
100%
|
Atlántida Comunicaciones S.A. (79.02%)
Enfisur S.A. (20.98%)
|
|
Telefónica Servicios Audiovisuales, S.A.U.
Provision of all type of audiovisual telecommunications services
|
Spain
|
EUR
|
6
|
100%
|
Telefónica de Contenidos, S.A.U. (100%)
|
|
Gloway Broadcast Services, S.L.
DSNG-based transmission and operation services
|
Spain
|
EUR
|
-
|
100%
|
Telefónica Servicios Audiovisuales, S.A.U. (100%)
|
|
Telefónica On The Spot Services, S.A.U.
Provision of telemarketing services
|
Spain
|
EUR
|
1
|
100%
|
Telefónica de Contenidos, S.A.U. (100%)
|
|
Name and corporate purpose
|
Country
|
Currency
|
Capital
|
%
Telefónica
Group
|
Holding company
|
|
Atento Inversiones y Teleservicios, S.A.U.
Telecommunications service provider
|
Spain
|
EUR
|
24
|
100%
|
Telefónica, S.A. (100%)
|
|
Telemarketing Prague, a.s.
Telecommunications service provider
|
Czech Republic
|
CZK
|
1
|
100%
|
Atento Inversiones y Teleservicios, S.A. (100%)
|
|
Atento Teleservicios España, S.A.U.
Provision of all type of telemarketing services
|
Spain
|
EUR
|
1
|
100%
|
Atento Inversiones y Teleservicios, S.A. (100%)
|
|
Atento Impulsa, S.L.U.
Provision of all type of telemarketing services
|
Spain
|
EUR
|
-
|
100%
|
Atento Teleservicios España, S.A. (100%)
|
|
Atento N.V.
Telecommunications service provider
|
Netherlands
|
EUR
|
-
|
100%
|
Atento Inversiones y Teleservicios, S.A. (100%)
|
|
Atento Brasil, S.A.
Telecommunications services provider
|
Brazil
|
BRL
|
152
|
100%
|
Atento N.V. (100%)
|
|
Atento Argentina, S.A.
Telecommunications services provider
|
Argentina
|
ARS
|
3
|
100%
|
Atento Holding Chile, S.A. (97.99%)
Atento N.V. (2.01%)
|
|
Teleatento del Perú, S.A.C.
Telecommunications services provider
|
Peru
|
PEN
|
14
|
100%
|
Atento N.V. (83.33%)
Atento Holding Chile, S.A. (16.67%)
|
|
Atento Colombia, S.A.
Provision of call-center services
|
Columbia
|
COP
|
2,997
|
100%
|
Atento N.V. (94.98%)
Atento Mexicana, S.A. De C.V. (5.00%)
Atento Venezuela, S.A. (0.01%)
Atento Brasil, S.A. (0.00%)
Teleatento del Perú, S.A.C. (0.00%)
|
|
Atento Mexicana, S.A. de C.V.
Provision of call-center services
|
Mexico
|
MXN
|
47
|
100%
|
Atento N.V. (100%)
|
|
Teleatento del Perú, S.A.C.
Provision of call-center services
|
Peru
|
PEN
|
14
|
100%
|
Atento N.V. (83.33%)
Atento Holding Chile, S.A. (16.67%)
|
|
Atento Chile, S.A.
Telecommunications services provider
|
Chile
|
CLP
|
11,128
|
100%
|
Atento Holding Chile, S.A. (71.16%)
Telefónica Chile, S.A.(27.44%)
Telefónica Empresas Chile, S.A. (0.96%)
Telefónica Larga Distancia, S.A. (0.44%)
|
|
Atento Centroamérica, S.A.
Provision of call-center services
|
Guatemala
|
GTQ
|
55
|
100%
|
Atento N.V. (99.99%)
Atento El Salvador, S.A. de C.V. (0.01%)
|
|
Telfin Ireland Ltd.
Intragroup financing
|
Ireland
|
EUR
|
-
|
100%
|
Telefónica, S.A. (100%)
|
|
Telefónica Global Services, GmbH
Purchasing services
|
Germany
|
EUR
|
-
|
100%
|
Telefónica O2 Germany GmbH & Co. OHG (100%)
|
|
Name and corporate purpose
|
Country
|
Currency
|
Capital
|
%
Telefónica
Group
|
Holding company
|
|
Telefónica Global Roaming, GmbH
Optimization of network traffic
|
Germany
|
EUR
|
-
|
100%
|
Telefónica Global Services, GmbH (100%)
|
|
Telefónica Global Technology, S.A.U.
Management and operation of information systems
|
Spain
|
EUR
|
6
|
100%
|
Telefónica, S.A. (100%)
|
|
Terra Networks Asociadas, S.L.
Holding company
|
Spain
|
EUR
|
7
|
100%
|
Telefónica, S.A. (100%)
|
|
Red Universal de Marketing y Bookings Online, S.A. (RUMBO) (*)
Online travel agency
|
Spain
|
EUR
|
1
|
50.00%
|
Terra Networks Asociadas, S.L. (50.00%)
|
|
Telefónica Learning Services, S.L.
Vertical e-learning portal
|
Spain
|
EUR
|
1
|
100%
|
Terra Networks Asociadas, S.L. (100%)
|
|
Telefónica Ingeniería de Seguridad, S.A.U.
Security services and systems
|
Spain
|
EUR
|
1
|
100%
|
Telefónica, S.A. (100%)
|
|
Telefónica Engenharia de Segurança
Security services and systems
|
Brazil
|
BRL
|
21
|
99.99%
|
Telefónica Ingeniería de Seguridad, S.A. (99.99%)
|
|
Telefónica Capital, S.A.U.
Finance company
|
Spain
|
EUR
|
7
|
100%
|
Telefónica, S.A. (100%)
|
|
Lotca Servicios Integrales, S.L.
Aircraft ownership and operation
|
Spain
|
EUR
|
17
|
100%
|
Telefónica, S.A. (100%)
|
|
Fonditel Pensiones, Entidad Gestora de Fondos de Pensiones, S.A.
Administration of pension funds
|
Spain
|
EUR
|
16
|
70.00%
|
Telefónica Capital, S.A. (70.00%)
|
|
Fonditel Gestión, Soc. Gestora de Instituciones de Inversión Colectiva, S.A.
Administration and representation of collective investment schemes
|
Spain
|
EUR
|
2
|
100%
|
Telefónica Capital, S.A. (100%)
|
|
Telefónica Investigación y Desarrollo, S.A.U.
Telecommunications research activities and projects
|
Spain
|
EUR
|
6
|
100%
|
Telefónica, S.A. (100%)
|
|
Telefónica Investigación y Desarrollo de México, S.A. de C.V.
Telecommunications research activities and projects
|
Mexico
|
MXN
|
-
|
100%
|
Telefónica Investigación y Desarrollo, S.A. (100%)
|
|
Casiopea Reaseguradora, S.A.
Reinsurance
|
Luxembourg
|
EUR
|
4
|
100%
|
Telefónica, S.A. (100%)
|
|
Pléyade Peninsular, Correduría de Seguros y Reaseguros del Grupo Telefónica, S.A.
Distribution, promotion or preparation of insurance contracts
|
Spain
|
EUR
|
-
|
100%
|
Casiopea Reaseguradora, S.A. (83.33%)
Telefónica, S.A. (16.67%)
|
|
Altaïr Assurances, S.A.
Direct insurance transactions
|
Luxembourg
|
EUR
|
6
|
100%
|
Casiopea Reaseguradora, S.A. (95.00%)
Seguros de Vida y Pensiones Antares, S.A. (5.00%)
|
|
Seguros de Vida y Pensiones Antares, S.A.
Life insurance, pensions and health insurance
|
Spain
|
EUR
|
51
|
100%
|
Telefónica, S.A. (89.99%)
Casiopea Reaseguradora, S.A. (10.01%)
|
|
Name and corporate purpose
|
Country
|
Currency
|
Capital
|
%
Telefónica
Group
|
Holding company
|
|
Telefónica Finanzas, S.A.U. (TELFISA)
Integrated cash management, consulting and financial support for Group companies
|
Spain
|
EUR
|
3
|
100%
|
Telefónica, S.A. (100%)
|
|
Fisatel Mexico, S.A. de C.V.
Integrated cash management, consulting and financial support for Group companies
|
Mexico
|
MXN
|
5
|
100%
|
Telefónica, S.A. (100%)
|
|
Telfisa Global, B.V.
Integrated cash management, consulting and financial support for Group companies
|
Netherlands
|
EUR
|
-
|
100%
|
Telefónica, S.A. (100%)
|
|
Telefónica Europe, B.V.
Fund raising in capital markets
|
Netherlands
|
EUR
|
-
|
100%
|
Telefónica, S.A. (100%)
|
|
Telefónica Finance USA, L.L.C. (**)
Financial intermediation
|
US
|
EUR
|
2,000
|
0.01%
|
Telefónica Europe, B.V. (0.01%)
|
|
Telefónica Emisiones, S.A.U.
Financial debt instrument issuer
|
Spain
|
EUR
|
-
|
100%
|
Telefónica, S.A. (100%)
|
|
Spiral Investments, B.V.
Holding company
|
Netherlands
|
EUR
|
39
|
100%
|
Telefónica Móviles España, S.A.U. (100%)
|
|
Solivella Investment, B.V.
Holding company
|
Netherlands
|
EUR
|
881
|
100%
|
Telefónica Móviles España, S.A.U. (100%)
|
|
Aliança Atlântica Holding B.V.
Holding company
|
Netherlands
|
EUR
|
40
|
93.99%
|
Telefónica, S.A. (50.00%)
Telecomunicaçoes de Sao Paulo, S.A. - TELESP (43.99%)
|
|
Telefónica Gestión de Servicios Compartidos España, S.A.
Management and administrative services rendered
|
Spain
|
EUR
|
8
|
100%
|
Telefónica, S.A. (100%)
|
|
Telefónica Gestión de Servicios Compartidos, S.A.C.
Management and administrative services rendered
|
Argentina
|
ARS
|
-
|
99.99%
|
T. Gestión de Servicios Compartidos España, S.A. (95.00%)
Telefónica, S.A. (4.99%)
|
|
Telefónica Gestión de Servicios Compartidos, S.A.
Management and administrative services rendered
|
Chile
|
CLP
|
1,019
|
97.89%
|
Telefónica Chile, S.A.(97.89%)
|
|
Telefónica Gestión de Servicios Compartidos, S.A.
Management and administrative services rendered
|
Peru
|
PEN
|
1
|
100%
|
T. Gestión de Servicios Compartidos España, S.A. (99.99%)
Telefónica del Perú, S.A.A. (0.01%)
|
|
Cobros Serviços de Gestao, Ltda.
Management and administrative services rendered
|
Brazil
|
BRL
|
-
|
99.33%
|
T. Gestión de Servicios Compartidos España, S.A. (99.33%)
|
|
Tempotel, Empresa de Trabajo Temporal, S.A.
Temporary employment agency
|
Spain
|
EUR
|
-
|
100%
|
T. Gestión de Servicios Compartidos España, S.A. (100%)
|
|
Telefonica Serviços Empresariais do BRASIL, Ltda.
Management and administrative services rendered
|
Brazil
|
BRL
|
12
|
99.99%
|
T. Gestión de Servicios Compartidos España, S.A. (99.99%)
|
|
Telefónica Gestión de Servicios Compartidos México, S.A. de C.V.
Management and administrative services rendered
|
Mexico
|
MXN
|
50
|
100%
|
T. Gestión de Servicios Compartidos España, S.A. (100%)
|
|
Name and corporate purpose
|
Country
|
Currency
|
Capital
|
%
Telefónica
Group
|
Holding company
|
|
Telefónica Servicios Integrales de Distribución, S.A.U.
Distribution services provider
|
Spain
|
EUR
|
2
|
100%
|
T. Gestión de Servicios Compartidos España, S.A. (100%)
|
|
Telefónica Compras Electrónicas, S.L.
Development and provision of information society services
|
Spain
|
EUR
|
-
|
100%
|
T. Gestión de Servicios Compartidos España, S.A. (100%)
|
|
Companies accounted for using the equity method
|
|||||
|
Telefónica Factoring Mexico, S.A. de C.V. SOFOM ENR
Factoring services provider
|
Mexico
|
MXN
|
33
|
50.00%
|
Telefónica, S.A. (40.5%)
Telefónica Factoring España, S.A.
(9.50%)
|
|
Telefónica Factoring España, S.A.
Factoring services provider
|
Spain
|
EUR
|
5
|
50.00%
|
Telefónica, S.A. (50.00%)
|
|
Telefónica Factoring do Brasil, Ltd.
Factoring services provider
|
Brazil
|
BRL
|
5
|
50.00%
|
Telefónica, S.A. (40.00%)
Telefónica Factoring España, S.A. (10.00%)
|
|
Telco, S.p.A.
Holding company
|
Italy
|
EUR
|
3,287
|
46.18%
|
Telefónica, S.A. (46.18%)
|
|
Jubii Europe, N.V.
Internet portal
|
Netherlands
|
EUR
|
3
|
32.10%
|
LE Holding Corporation (32.10%)
|
|
DTS Distribuidora de Televisión Digital, S.A.
Broadcasting, satellite TV signal transmission and linkage services
|
Spain
|
EUR
|
126
|
22.00%
|
Telefónica de Contenidos, S.A.U. (22%)
|
|
Hispasat, S.A.
Operation of a satellite telecommunications system
|
Spain
|
EUR
|
122
|
13.23%
|
Telefónica de Contenidos, S.A.U. (13.23%)
|
|
China Unicom (Hong Kong) Limited
Telecommunications service operator
|
China
|
RMB
|
2,310
|
8.37%
|
Telefónica Internacional, S.A.U. (8.37%)
|
(*) Consolidated using proportionate consolidation.
(**) Fully consolidated with 100% of voting rights
Through these consolidated financial statements, O2 (Germany) GmbH & Co. OHG, complies with the provisions of Art. 264b HGB [“Handelsgesetzbuch”: Germany code of commerce], and is exempt in accordance with the stipulations of Art. 264b HGB.
APPENDIX VI: MAIN CONCESSIONS AND LICENSES HELD BY THE TELEFÓNICA GROUP
In order to provide network services, the Group must obtain general authorizations, concessions or licenses from the national regulatory authorities of the countries in which the Group operates. Procedures for obtaining licenses are also applicable to radio frequency permits for the Group’s mobile operators. The duration of a license or of the rights to use spectrum depend on the legal framework applicable in the country in question.
The main service licenses, concessions and authorizations held by the Group at December 31, 2010 are described below.
Spain
In accordance with the European Union regulatory framework, companies wishing to operate a telecommunications network or provide electronic communication services must notify the Spanish telecommunications market regulator (Comisión del Mercado de Telecomunicaciones, CMT) prior to commencing such activities. Every three years, operators must notify the CMT of their intention to continue these activities.
Concessions for the use of spectrum are auctioned through a competitive, non-discriminatory procedure. Telefónica Móviles España holds rights to provide mobile services in certain spectrum bands. The main concessions are as follows:
|
Technology
|
Duration
|
End date
|
Renewal period
|
|
GSM 900
|
5 years
|
February 3, 2015
|
--
|
|
E-GSM 900
|
15 years
|
June 6, 2020
|
5 years
|
|
DCS-1800
|
25 years
|
July 24, 2023
|
5 years
|
|
UMTS
|
20 years
|
April 18, 2020
|
10 years
|
In 2010, Telefónica Móviles España obtained the renewal of the GSM 900 concession until February 3, 2015.
United Kingdom
Telefónica O2 UK has provided GSM services since July 1994. In January 2011 this license was modified to enable the UMTS roll-out in the 900 MHz (2 x 17.4 MHz) and 1800MHz (2 x 5.8 MHz) frequency bands. This license is for an indefinite period. In April 2000, Telefónica O2 UK obtained a UMTS license expiring on December 13, 2021 (2 x 10 MHz + 5 MHz).
Germany
Telefónica O2 Germany obtained a GSM license for the 1800 MHz frequency band in October 1998, as well as a separate license for the 900 MHz band in February 2007 (GSM900 2 x 5 MHz and GSM 1800: 2 x 17.4 MHz). The GSM licenses expire on December 31, 2016.
These licenses are for a set period of time, although they may be renewed. The regulatory agency has not yet issued a decision in this respect.
In August 2000, Telefónica O2 Germany obtained a UMTS license expiring on December 31, 2020 (2 x 9.9 MHz).
In May 2010, after a spectrum auction procedure, Telefónica O2 Germany acquired 10 MHz in the 800 MHz band (Digital Dividend), 20 MHz in the 2.6 GHz band (paired), 10 MHz in the 2.6 GHz band (unpaired), 5 MHz in the 2.0 GHz band (paired), and 20 MHz in the 2.0 GHz band (unpaired). These licenses expire in 2025. The assigned frequencies may be used for any technology.
Czech Republic
Telefónica O2 Czech Republic provides electronic mobile communications services in the 900 MHz and 1800 MHz bands, under the GSM standard, in accordance with CTO licenses valid until February 7, 2016; in the 2100 MHz band under the UMTS standard, valid until January 1, 2022; and in the 450 MHz band for CDMA 2000, valid until February 7, 2011.
Slovakia
On September 7, 2006, Telefónica O2 Slovakia secured a license for supplying electronic communications services through the public network using the GSM and UMTS mobile network standards. The license was granted for twenty years and expires in September 2026.
Ireland
Since March 1997, Telefónica O2 Ireland has been providing GSM services under a license granted in May 1996. The GSM900 license is for a 15-year period (GSM900: 2 x 7.2 MHz). In 2000, the company obtained another GSM 1800 license (2 x 14.4 MHz), also for 15 years. In October 2002, the company secured a 20-year UMTS license (2 x 15 MHz + 5 MHz).
Brazil
In Brazil, concessions are awarded for providing services under the public system and authorizations are granted for providing private system services. The only service provided under both systems is the Commuted Fixed Telephony Service (CFTS). All other services are private.
The main differences between the systems relate to the obligations which operators have to fulfil. Public services concessionaires, such as Telesp, are required to expand the network (universal service obligations) and ensure continuity in service undertakings. These obligations are not imposed on operators that provide services under the private system.
In the state of São Paulo, Telesp provides local and long-distance CFTS under the public system. In the remaining states of Brazil, Telesp provides local and long-distance CFTS, and broadband services, all under the private system.
In 2005, Telesp’s concession agreements for local and long-distance services were extended for an additional 20-year period.
Telesp’s authorization for local and long-distance services under the private system was granted for an unlimited period of time.
Telesp also holds an authorization to provide broadband data services under the private system in the state of São Paulo.
Licenses for personal mobile services carry the right to provide mobile services for an unlimited period of time. However, the use of spectrum is restricted in accordance with the specific license conditions. All Telefónica’s Brazilian mobile operators are integrated in Vivo, except for Vivo Participaçoes (In March 2010 ANATEL authorised the integration of Telemig Celular into Vivo Participaçoes). These operators hold the following licenses:
|
·
|
Vivo-Rio Grande do Sul (“A” band) until 2022 (renewed in 2006);
|
|
·
|
Vivo-Rio de Janeiro (“A” band) until 2020 (renewed in 2005);
|
|
·
|
Vivo-Espírito Santo (“A” band) until 2023 (renewed in 2008);
|
|
·
|
Vivo-Bahia (“A” band) and Vivo-Sergipe (“A” band) until 2023 (renewed in 2008)
;
|
|
·
|
Vivo-São Paulo (“A” band) until 2023 or 2024, for the cities of Ribeirão Preto and Guatapará (renewed in 2008)
;
|
|
·
|
Vivo-Paraná/Santa Catarina (“B” band) until 2013
;
|
|
·
|
Vivo-Distrito Federal (“A” band) until 2021 (renewed in 2006)
;
|
|
·
|
Vivo-Acre (“A” band), Vivo-Rondônia (“A” band), Vivo-Mato Grosso (“A” band) and Vivo-Mato Grosso do Sul (“A” band) until 2024 (renewed in 2008)
|
|
·
|
Vivo-Goiás/Tocantins (“A” band) until 2023 (renewed in 2008)
|
|
·
|
Vivo-Amazonas/Roraima/Amapá/Pará/Maranhão (“B” band) until 2013
|
|
·
|
Vivo Participaçoes(Minas Gerais) (“A” band) until 2023 (renewed in 2007);
|
|
·
|
Vivo Participaçoes (for the cities in which CTBC Telecom operates in the state of Minas Gerais) (“E” band) until 2020;
|
License renewals for “A” and “B” bands must be requested 30 months in advance of the expiry date. Spectrum rights may be renewed only once, for a 15-year period. After this period, the license must be renegotiated.
License renewals for the “E” band must be requested between 36 and 48 months in advance of the expiry date. Spectrum rights may be renewed only once, for a 15-year period. After this period, the license must be renegotiated.
In December 2007, ANATEL auctioned off fifteen new licenses in the 1900 MHz band (“L” band). Vivo acquired 13 spectrum licenses in this band.
|
·
|
Vivo-Rio Grande do Sul (“L” band) until 2022 (renewed in 2006) or 2022 for cities in the Pelotas metropolitan area;
|
|
·
|
Vivo-Rio de Janeiro (“L” band) until 2020 (renewed in 2005);
|
|
·
|
Vivo-Espírito Santo (“L” band) until 2023 (renewed in 2008);
|
|
·
|
Vivo-Bahia (“L” band) and Vivo-Sergipe (“L” band) until 2023 (renewed in 2008);
|
|
·
|
Vivo-São Paulo (“L” band) until 2023 or 2024, for the cities of Ribeirão Preto and Guatapará (renewed in 2008) or 2022 for the cities where CTBC Telecom operates in the state of São Paulo;
|
|
·
|
Vivo-Paraná (excluding the cities of Londrina and Tamarana)/Santa Catarina (“L” band) until 2013;
|
|
·
|
Vivo-Federal District (“L” band) until 2021 (renewed in 2006);
|
|
·
|
Vivo-Acre (“L” band), Vivo-Rondônia (“L” band), Vivo-Mato Grosso (“L” band) and Vivo-Mato Grosso do Sul (“L” band) until 2024 (renewed in 2008) or 2022 for the city of Paranaíba in Mato Grosso do Sul; and
|
|
·
|
Vivo-Goiás/Tocantins (“L” band) until 2023 (renewed in 2008) or 2022 for the cities where CTBC Telecom operates in the state of Goiás, and
V
ivo-Alagoas/Ceará/Paraíba/Piauí/Pernambuco/Rio Grande do Norte (“L” band) until 2022.
|
License renewals for the “L” band must be requested between 36 and 48 months in advance of the expiry date. Spectrum rights may be renewed only once, for a 15-year period. After this period, the license must be renegotiated.
In April 2008, ANATEL auctioned off 36 new licenses in the 1900-2100 MHz bands (3G licenses). Vivo obtained seven spectrum licenses in the “J” band, and Vivo Participaçoes secured two licenses:
|
·
|
Vivo-Rio Grande do Sul (including cities in the Pelotas metropolitan area) (“J” band) until 2023;
|
|
·
|
Vivo-Rio de Janeiro (“J” band) until 2023;
|
|
·
|
Vivo-Espírito Santo (“J” band) until 2023;
|
|
·
|
Vivo-Bahia (“J” band) and Vivo-Sergipe (“J” band) until 2023;
|
|
·
|
Vivo-São Paulo (including the cities of Ribeirão Preto and Guatapará and the cities where CTBC Telecom operates in the state of São Paulo) (“J” band) until 2023;
|
|
·
|
Vivo-Paraná (including the cities of Londrina and Tamarana)/Santa Catarina (“J” band) until 2023;
|
|
·
|
Vivo-Federal District (“J” band) until 2023;
|
|
·
|
Vivo-Acre (“J” band), Vivo-Rondônia (“J” band), Vivo-Mato Grosso (“J” band) and Vivo-Mato Grosso do Sul (including the city of Paranaíba) (“J” band) until 2023;
|
|
·
|
Vivo-Goiás (including the cities where CTBC Telecom operates in the state of Goiás)/Tocantins (“J” band) until 2023;
|
|
·
|
Vivo-Alagoas/Ceará/Paraíba/Piauí/Pernambuco/Rio Grande do Norte (“J” band) until 2023;
|
|
·
|
Vivo-Amazonas/Roraima/Amapá/Pará/Maranhão (“J” band) until 2023; and
|
|
·
|
Vivo Participaçoes (including the cities where CTBC Telecom operates in the state of Minas Gerais) (“J” band) until 2023.
|
License renewals for the “J” band must be requested between 36 and 48 months in advance of the expiry date. Spectrum rights may be renewed only once, for a 15-year period. After this period, the license must be renegotiated.
In December 2010, ANATEL auctioned off 169 licenses in the 900 MHz and 1,800 MHz bands of which Vivo secured 23 licenses (14 licenses in 1800 MHz band “D”, “E”, “M” and extension bands and 9 licenses in the 900 MHz extension bands). These licenses are valid for a 15-year period.
|
·
|
“
M
”
Band (1800 MHz) in the Federal District and the states of Paraná, Santa Catarina, Rio Grande do Sul, Goiás, Tocantins, Mato Grosso do Sul, Mato Grosso, Rondônia and Acre;
|
|
·
|
Extension of the 1800 MHz band in the State of São Paulo;
|
|
·
|
“D
”
Band (1800 MHz) in the cities of Pelotas, Morro Redondo, Capão do Leão and Turuçu in the state of Rio Grande do Sul;
|
|
·
|
“
E
”
Band (1800 MHz) in the states of Alagoas, Ceará, Paraíba, Piauí, Pernambuco and Rio Grande do Norte;
|
|
·
|
Extension of the 900 MHz band in the State of Rio do Janeiro;
|
|
·
|
Extension of the 900 MHz band in the State of Espírito Santo;
|
|
·
|
Extension of the 900 MHz band in the States of Goiás, Tocantins, Mato Grosso do Sul, Mato Grosso, Rondônia and Acre and the Federal District, with the exception of the cities of Paranaíba in the state of Mato Grosso do Sul and the cities of Buriti Alegre, Cachoeira Dourada, Inaciolândia, Itumbiara, Paranaiguara and São Simão, in the state of Goiás;
|
|
·
|
Extension of the 900 MHz band in the State of Rio Grande do Sul, with the exception of the cities of Pelotas, Morro Redondo, Capão do Leão and Turuçu;
|
|
·
|
Extension of the 900 MHz band in the cities of registry area number 43 in the state of Paraná with the exception of the cities of Londrina and Tamarana;
|
|
·
|
Extension of the 900 MHz band in the States of Paraná and Santa Catarina with the exception of the cities of registry area number 43 in the state of Paraná and the cities of Londrina and Tamarana;
|
|
·
|
Extension of the 900 MHz band in the state of Bahía;
|
|
·
|
Extension of the 900 MHz band in the state of Sergipe;
|
|
·
|
Extension of the 900 MHz band in the states of Amazonas, Amapá, Maranhão Pará and Roraima;
|
|
·
|
Extension of the 1800 MHz band in the state of São Paulo, with the exception of the cities in the metropolitan area of São Paulo and the cities where CTBC Telecom operates in the state of São Paulo;
|
|
·
|
Extension of the 1,800 MHz band in the States of Amazonas, Amapá, Maranhão Pará and Roraima;
|
|
·
|
Extension of the 1800 MHz band in the city of Paranaíba in the state of Mato Grosso do Sul;
|
|
·
|
Extension of the 1800 MHz band in the cities of Buriti Alegre, Cachoeira Dourada, Inaciolândia, Itumbiara, Paranaiguara and São Simão, in the state of Goiás;
|
|
·
|
Another extension of the 1800 MHz band in the cities of Buriti Alegre, Cachoeira Dourada, Inaciolândia, Itumbiara, Paranaiguara and São Simão, in the state of Goiás;
|
|
·
|
Extension of the 1800 MHz band in the states of Rio do Janeiro, Espírito Santo, Bahía and Sergipe;
|
|
·
|
Extension of the 1,800 MHz band in the states of Amazonas, Amapá, Maranhão Pará and Roraima;
|
|
·
|
Extension of the 1,800 MHz band in the states of Alagoas, Ceará, Paraíba, Piauí, Pernambuco and Rio Grande do Norte;
|
|
·
|
Extension of the 1800 MHz band in the city of Paranaíba in the state of Mato Grosso do Sul, and the cities of Buriti Alegre, Cachoeira Dourada, Inaciolândia, Itumbiara, Paranaiguara and São Simão, in the state of Goiás;
|
|
·
|
Extension of the 1800 MHz band in the cities of Londrina and Tamarana in the state of Paraná;
|
Mexico
Authorizations to provide mobile telephone services in Mexico (mobile and personal communications services, PCS, in the 800 MHz and 1,900 MHz bands, respectively) are granted through concessions.
Telefónica Móviles México and its subsidiaries and investees hold 40 licenses for providing telecommunications services.
Concessions in the “A” band (800 MHz) mobile telephone services were initially granted in 1990 and were renewed in May 2010 for a 15-year period. In addition, at the same time a concession
was granted for the installation, operation and development of a public telecommunications network for the same length as the aforementioned concessions.
The subsidiary Pegaso Comunicaciones y Sistemas, S.A. de C.V. holds a concession for providing public telecommunications services, granted in 1998, and nine licenses for providing personal communications services (PCS) in the 1,900 MHz band, until 2018. These licenses are renewable for an additional 20-year period. Renewal has been requested for all licenses.
In April 2005, Telefónica México obtained four additional licenses in the same 1,900 MHz band, for providing personal communications services (PCS) for a twenty-year period, with possible renewal for an additional twenty-year period.
In addition, further new concessions have been awarded during 2010: eight spectrum concessions in the1,900 MHz band for providing personal communications services (PCS) and for a greater bandwidth in regions 1,2,3,4,5,6,7 and 9, for a period of twenty years; and six new concessions in band 1.7 – 2.1 GHz to provide AWS services in regions 2,3,4,5,6,7 and 9, for a period of twenty years.
In January 2011, GTM obtained a concession for the installation of a public telecommunications network to supply services of Pay-TV and data-transmission by satellite, for a period of thirty years, renewable.
Venezuela
Telcel holds a mobile telephone concession for operating and offering mobile services in the 800 MHz band, with national coverage. This concession was granted in 1991 and expires on May 31, 2011. The concession is renewable for up to 20 years, at the discretion of CONATEL.
Telcel also holds a private network services concession granted in 1993 and renewed in 2007, until December 15, 2025. This concession allows Telcel to provide private point-to-point and point-to-multipoint telecommunications services for companies.
In 2001, Telcel secured a concession for offering nationwide wireless fixed access services using wireless technology in the subscriber loop.
In 2000, Telcel received a general authorization for offering local, national long-distance and international long-distance telephony services and for operating telecommunications networks, for a 25-year period to December 15, 2025. In 2007, the remaining services provided by Telcel were incorporated into this license, namely mobile, private networks, Internet access and transport services. On the same date, the company secured a concession for operating in the 1,900 MHz band for a 15-year period until November 2022, renewable for a 10-year period.
Chile
Telefónica Chile holds the following telecommunications services licenses:
|
·
|
Local public telephony services.
Telefónica Chile holds a renewable license for local telephony services in all regions of Chile, for a 50-year period. This license was awarded in 1982, except for the X and XI regions, which were incorporated into the license in
|
1995. In addition, Telefónica Chile holds other nationwide renewable licenses for local telephone services, exclusively targeting rural areas. It also holds a renewable nationwide license for public data transmission services for a period of 30 years from July 1995 and another four renewable licenses for public data transmission services for a period of 30 years from June 2008. Telefónica Chile also has a renewable nationwide license for public VOIP services, for a period of 30 years from August 2010.
|
·
|
Multicarrier long distance licenses
. Through its subsidiary Telefónica Larga Distancia, Telefónica Chile holds renewable licenses for a 30-year period as from November 1989, to install and operate a national fibre optics network, a national base station network and other transmission equipment, and to provide national and international long-distance services, including voice, data and image transmission throughout Chile. In addition, the company holds renewable nationwide public data transmission services licenses for a thirty-year period as from June 1993. Telefónica also holds indefinite licenses for providing national and international long-distance services through central switches and nationwide cable and fibre optic networks.
|
|
·
|
Public data transmission services
. Since March 1987, Telefónica Empresas holds a license for an indefinite period for providing public nationwide data transmission services.
|
|
·
|
Public mobile telephony service licenses. Since November 1989, Telefónica Móviles Chile has held licenses for an indefinite period for providing public mobile telephony services throughout Chile in the 800 MHz band. In addition, the company holds three licenses for providing nationwide mobile telecommunications services in the 1900 MHz band. These concessions may be renewed for successive 30-year periods from November 2002, at the request of the license holder.
|
|
·
|
Limited television license
. Telefónica Multimedia holds a license to establish, operate and use part of the 2.6 GHz band spectrum in Santiago de Chile for intermediate telecommunications services, authorizing the frequencies used for communicating voice, data and images, for a thirty-year period as from May 2008. The company also has a limited license to provide television services in the 2.6 GHz band. Since December 2005, the company holds a 10-year renewable license for providing limited satellite television services. In addition, since January 2006, it has a limited license for providing nationwide television services in the largest cities, except in region III, in Telefónica Chile’s xDSL broadband network, for an indefinite period. Furthermore, in March 2007 the company was awarded a limited license for providing television services through the DSL broadband network in the Santiago de Chile metropolitan area, for an indefinite period.
|
Argentina
Telefónica de Argentina holds licenses, all of which have been granted for an unlimited period, allowing it to provide fixed telephony services, international telecommunications services, local services in the northern and southern regions; long-distance, international telecommunications services and data transmission in the northern region; and Internet and international data transmission access services.
Telefónica Móviles de Argentina’s licenses for providing mobile services include PCS licenses and the corresponding authorizations for using spectrum in different regions, as well as licenses for trunk services or closed groups of users, in different cities.
These licenses do not expire, although they may be cancelled by SECOM in the event of failure to comply with the license terms.
Colombia
In March 1994, the company was awarded concessions for providing mobile services in the eastern region, along the Caribbean coast and in the western region, for a 10-year period, renewed for another 10 years to March 2014. Prior to that year, Telefónica Móviles Colombia may waive the concessions, renew the spectrum use permit for a ten-year period, and subsequently negotiate an extension. If Telefónica Móviles Colombia continues to hold its current concessions until 2014, in that year it must seek registration as a telecommunications operator and request permission to use spectrum.
In addition, Telefónica Móviles Colombia holds nationwide carrier service concessions granted in June 1998 and November 1998 (initially for ten years, renewed for an additional 10 years). In 2008, these concessions were rolled over into a convergent permit to provide carrier services for an additional 10 years (which may be extended for a further ten years). As in the preceding case, Telefónica Móviles Colombia may waive these licenses and seek registration as an operator under the general authorization system set out by law.
With respect to fixed telephone services, the law establishes an indefinite permit for all operators to operate as local exchange carriers, nationwide. Colombia Telecomunicaciones must register as a telecommunications operator with the CRC. This registration also covers general authorization for providing telecommunications services, such as long-distance carrier services, added-value services, national carrier services and mobile services, among others.
Peru
Telefónica del Perú provides fixed telecommunications services based on 20-year concessions granted by the Transport and Communications Ministry. These concessions may be partially or fully renewed at the request of Telefónica del Perú. Total renewals are for an additional 20 years, while partial renewals are for periods of up to five years. To date, three partial renewals extending the concession period to 2027 have been approved.
Telefónica Móviles Perú holds a concession for providing mobile services in the 850 MHz sub-band A and in the 1900 MHz sub-band (Telefónica Móviles Perú can also provide fixed wireless services in these bands) for a 20-year period, renewable, upon request, for identical periods. In February 2002, the company was awarded 20-year concessions for providing national and international long-distance carrier services. In addition, the company holds a 20-year concession for offering fixed mobile telephone services in the 450 MHz and 900 MHz bands. Both concessions were granted in March 2008. Telefónica also holds concessions for local carrier services, expiring between 2016 and 2022. Concessions for national and international carrier services expire in 2019. In addition, in August 1999 the company secured a 20-year concession for nationwide-coverage local fixed telephone services. These concessions may be renewed for an additional 20-year period.
Ecuador
Otecel renewed the mobile telephony services concession under which it provides advanced mobile services, including 3G services. The concession expires in November 2023 and may be renewed for an additional 15-year period.
In addition, Otecel holds a fixed and mobile carrier services concession expiring in 2017. This concession may be renewed for an additional 15-year period. The different licenses for providing added-value mobile services and Internet access services expire in 2011 and may be renewed for an additional 10-year period.
Costa Rica
On January 7, 2011 the Costa Rican Regulator (SUTEL) awarded Telefónica one of the three mobile licenses applied for, subject to the technical, financial and legal requirements laid down in the bidding documents. The concession awarded comprises two blocks of 5.3 MHz frequencies in the 850 MHz band and two blocks of 15 MHz and 10 MHz in the 1,800 MHz and 2,100 MHz band respectively.
Other countries in Latin America
|
Country
|
License/Concession
|
Type of services
|
Spectrum
|
Band
|
Expiry
|
|||||
|
El Salvador
|
Concession
|
Telecommunication services (1)
|
25 MHz/800 MHz
|
Band B
|
2018(2)
|
|||||
|
Concession
|
Telecommunication services (1)
|
30 MHz/1900 MHz
|
Band C
|
2021
|
||||||
|
Guatemala
|
Concession
|
Telecommunication services (1)
|
80 MHz/1900 MHz
|
Bands B,C, E and F
|
2014(3)
|
|||||
|
Concession
|
Telecommunication services (1)
|
2014(3)
|
||||||||
|
Concession
|
Telecommunication services (1)
|
2014(3)
|
||||||||
|
Nicaragua
|
Concession
|
Mobile telecommunication services
|
25 MHz/800 MHz
|
Band A
|
2023(4)
|
|||||
|
Concession
|
Mobile telecommunication services
|
Additional spectrum 60 MHz /1900
|
Bands B, D, E and F
|
2023(4)
|
||||||
|
Panama
|
Concession
|
GSM/UMTS
|
25 MHz /800
10MHz
/1900 MHz
|
Band A
Band F
|
2016(5)
|
|||||
|
Uruguay
|
License
|
Mobile telephony
|
25 MHz/800 MHz
|
2022-2024(6)
|
|
(1)
|
In accordance with the Telecommunications Law all of these concessions were granted to provide any type of telecommunication services.
|
|
(2)
|
Concessions for the use of spectrum are granted for a period of 20 years and may be renewed for additional 20 year periods once the procedures established by the Telecommunications Law are fulfilled.
|
|
(3)
|
These concessions are granted for a period of 15 years and may be renewed for successive 15 year periods at the holder’s request. In order to renew a concession the holder must prove to the regulatory agency that the spectrum has actually been used during the prior 15 year period. These concessions expire in 2014.
|
|
(4)
|
Telefonía Celular de Nicaragua, S.A. ("TCN") obtained a concession in 1992 for a period of 10 years to use the 25 MHz spectrum in band A of 800 MHz in order to provide mobile
telecommunication services.
This concession was renewed for a period of 10 years from August 2013 until July 2023. The regulatory agency awarded TCN additional spectrum of 65 MHz in bands B, D, E and F of 1900. The concession may be renewed for an additional 10 year periods via negotiation with TELCOR two years in advance of the expiry of the current concession, subject to compliance by the operator with certain conditions.
|
|
(5)
|
The concession is valid for 20 years and expires in 2016. It is renewable for an additional period in accordance with the concession contract. The Government of Panama granted the right to use 10MHz (5+5) in the 1900 MHz band until 2016, which can be renewed for a further period.
|
|
(6)
|
The expiry date depends upon the spectrum band awarded: 800 MHz band (12.5 MHz + 12.5 MHz) – 20 years from July 2004; 1900 MHz band (5 MHz + 5 MHz) – 20 years from December 2002; and 1900 MHz band (5 MHz + 5 MHz) – 20 years from July 2004.
|
F-148
TABLE OF CONTENTS
Part IItem 1. Identity Of Directors, Senior Management and AdvisorsItem 2. Offer Statistics and Expected TimetableItem 3. Key InformationItem 4. Information on The CompanyItem 4A. Unresolved Staff CommentsItem 5. Operating and Financial Review and ProspectsItem 6. Directors, Senior Management and EmployeesItem 7. Major Shareholders and Related Party TransactionsItem 8. Financial InformationItem 9. The Offering and ListingItem 10. Additional InformationItem 11. Quantitative and Qualitative Disclosures About Market RiskItem 12. Description Of Securities Other Than Equity SecuritiesPart IIItem 13. Defaults, Dividend Arrearages and DelinquenciesItem 14. Material Modifications To The Rights Of Security Holders and Use Of ProceedsItem 15. Controls and ProceduresItem 16. [reserved]Item 16A. Audit Committee Financial ExpertItem 16B. Code Of EthicsItem 16C. Principal Accountant Fees and ServicesItem 16D. Exemptions From The Listing Standards For Audit CommitteesItem 16E. Purchases Of Equity Securities By The Issuer and Affiliated PurchasersItem 16F. Change in Registrant S Certifying AccountantItem 16G. Corporate GovernancePart III Item 17. Financial Statements We Have Responded To Item 18 in Lieu Of Responding To This ItemPart IIIItem 17. Financial StatementsItem 18. Financial StatementsItem 19. ExhibitsItem Date Maturity Nominal Value Currency Of Issuance Interest Rate